Attached files
| file | filename |
|---|---|
| EX-32 - EXHIBIT 32 - SunOpta Inc. | exhibit32.htm |
| EX-31.2 - EXHIBIT 31.2 - SunOpta Inc. | exhibit31-2.htm |
| EX-31.1 - EXHIBIT 31.1 - SunOpta Inc. | exhibit31-1.htm |
| EX-23.1 - EXHIBIT 23.1 - SunOpta Inc. | exhibit23-1.htm |
| EX-21 - EXHIBIT 21 - SunOpta Inc. | exhibit21.htm |
UNITED STATES
SECURITIES AND EXCHANGE COMMISSION
Washington, D.C.
20549
FORM 10-K
[X] ANNUAL REPORT PURSUANT TO SECTION 13 OR 15(d) OF THE SECURITIES EXCHANGE ACT OF 1934
For the fiscal year ended December 31, 2016
[ ] TRANSITION REPORT PURSUANT TO SECTION 13 OR 15(d) OF THE SECURITIES EXCHANGE ACT OF 1934
For the transition period from_____ to_____
Commission File No. 001-34198
SUNOPTA INC.
(Exact Name
of Registrant as Specified in Its Charter)
| CANADA | Not Applicable |
| (Jurisdiction of Incorporation) | (I.R.S. Employer Identification No.) |
2233 Argentia Drive, Suite 401
Mississauga,
Ontario L5N 2X7, Canada
(Address of Principal Executive Offices)
(905) 821-9669
(Registrant's telephone number, including
area code)
Securities registered pursuant to Section 12(b) of the Act:
| Title of each class | Name of each exchange on which registered |
| Common Shares, no par value | The NASDAQ Stock Market, Toronto Stock Exchange |
Securities registered pursuant Section to 12(g) of the Act: None
Indicate by check mark if the registrant is a well-known seasoned issuer, as defined in Rule 405 of the Securities Act. Yes [ ] No [X]
Indicate by check mark if the registrant is not required to file reports pursuant to Section 13 or Section 15(d) of the Act. Yes [ ] No [X]
Indicate by check mark whether the registrant (1) has filed all reports required to be filed by Section 13 or 15(d) of the Securities Exchange Act of 1934 during the preceding 12 months (or for such shorter period that the registrant was required to file such reports) and (2) has been subject to such filing requirements for the past 90 days. Yes [X] No [ ]
Indicate by check mark whether the registrant has submitted electronically and posted on its corporate Web site, if any, every Interactive Data File required to be submitted and posted pursuant to Rule 405 of Regulation S-T during the preceding 12 months (or for such shorter period that the registrant was required to submit and post such files). Yes [X] No [ ]
Indicate by check mark if disclosure of delinquent filers pursuant to Item 405 of Regulation S-K is not contained herein, and will not be contained, to the best of the registrant’s knowledge, in definitive proxy or information statements incorporated by reference in Part III of this Form 10-K or any amendment to this Form 10-K. [ ]
Indicate by check mark whether the registrant is a large accelerated filer, an accelerated filer, a non-accelerated filer, or a smaller reporting company. See definitions of “large accelerated filer,” “accelerated filer” and “smaller reporting company” in Rule 12b-2 of the Exchange Act. (Check one):
| Large accelerated filer [ ] | Accelerated filer [X] | Non-accelerated filer [ ] | Smaller reporting company [ ] |
Indicate by check mark whether the registrant is a shell company (as defined in Rule 12b-2 of the Exchange Act). Yes [ ] No [X]
Aggregate market value of the common equity held by non-affiliates of the registrant, computed using the closing price as reported on the NASDAQ Global Select Market for the registrant’s common shares on July 2, 2016, the last business day of the registrant’s most recently completed second fiscal quarter, was approximately $360 million. The registrant’s common shares trade on the NASDAQ Global Select Market under the symbol STKL and on the Toronto Stock Exchange under the symbol SOY.
The number of shares of the registrant’s common stock outstanding as of February 24, 2017 was 85,974,201.
Documents Incorporated by Reference: Portions of the SunOpta Inc. Definitive Proxy Statement for the 2017 Annual Meeting of Shareholders are incorporated by reference into Part III of this Annual Report on Form 10-K.
| SUNOPTA INC. | December 31, 2016 10-K |
SUNOPTA INC.
FORM 10-K
For the year
ended December 31, 2016
TABLE OF CONTENTS
| Basis of Presentation | 2 | |
| Forward-Looking Statements | 2 | |
| PART I | ||
| Item 1 | Business | 5 |
| Item 1A | Risk Factors | 20 |
| Item 1B | Unresolved Staff Comments | 34 |
| Item 2 | Properties | 35 |
| Item 3 | Legal Proceedings | 36 |
| Item 4 | Mine Safety Disclosures | 36 |
| PART II | ||
| Item 5 | Market for Registrant’s Common Equity, Related Stockholder Matters and Issuer Purchases of Equity Securities | 37 |
| Item 6 | Selected Financial Data | 39 |
| Item 7 | Management’s Discussion and Analysis of Financial Condition and Results of Operations | 40 |
| Item 7A | Quantitative and Qualitative Disclosures About Market Risk | 69 |
| Item 8 | Financial Statements and Supplementary Data | 70 |
| Item 9 | Changes in and Disagreements With Accountants on Accounting and Financial Disclosure | 70 |
| Item 9A | Controls and Procedures | 71 |
| Item 9B | Other Information | 72 |
| PART III | ||
| Item 10 | Directors, Executive Officers and Corporate Governance | 73 |
| Item 11 | Executive Compensation | 73 |
| Item 12 | Security Ownership of Certain Beneficial Owners and Management and Related Stockholder Matters | 73 |
| Item 13 | Certain Relationships and Related Transactions, and Director Independence | 73 |
| Item 14 | Principal Accounting Fees and Services | 73 |
| PART IV | ||
| Item 15 | Exhibits, Financial Statement Schedules | 73 |
| SUNOPTA INC. | 1 | December 31, 2016 10-K |
Basis of Presentation
Except where the context otherwise requires, all references in this Annual Report on Form 10-K for the fiscal year ended December 31, 2016 (“Form 10-K”) to “SunOpta”, the “Company”, “we”, “us”, “our” or similar words and phrases are to SunOpta Inc. and its subsidiaries, taken together.
In this report, all currency amounts are expressed in United States (“U.S.”) dollars (“$”) unless otherwise stated. All tabular dollar amounts are expressed in thousands of U.S. dollars, except per share data, unless otherwise stated. Amounts expressed in Canadian dollars are preceded by the symbol “C$”. Amounts expressed in euros are preceded by the symbol “€”. The following table sets forth, for the periods indicated, the rate of exchange for the Canadian dollar and euro, expressed in U.S. dollars, based on Bank of Canada exchange rates. These rates are provided solely for convenience, and do not necessarily reflect the rates used by us in the preparation of our financial statements.
| Canadian Dollar | Euro | |||||
| Year | Closing | Average | Closing | Average | ||
| 2016 | 0.7448 | 0.7548 | 1.0553 | 1.1066 | ||
| 2015 | 0.7225 | 0.7820 | 1.0859 | 1.1091 | ||
| 2014 | 0.8502 | 0.9044 | 1.2004 | 1.3263 | ||
Forward-Looking Statements
This Form 10-K contains forward-looking statements which are based on our current expectations and assumptions and involve a number of risks and uncertainties. Generally, forward-looking statements do not relate strictly to historical or current facts and are typically accompanied by words such as “anticipate”, “estimate”, “intend”, “project”, “potential”, “continue”, “believe”, “expect”, “could”, “would”, “should”, “might”, “plan”, “will”, “may”, “predict”, the negatives of such terms, and words and phrases of similar impact and include, but are not limited to references to future financial and operating results, plans, objectives, expectations and intentions; our ability to implement the four pillars and achieve the objectives of our strategic Value Creation Plan, including realizing our targeted earnings before income taxes, depreciation and amortization (“EBITDA”), annualized EBITDA enhancements, working capital efficiencies, and the amount of EBITDA improvement expected to be generated from the closure of our San Bernardino, California facility; estimated losses and related insurance recoveries associated with the recall of certain roasted sunflower kernel products; the expected benefits of business acquisitions and other transactions, such as cost savings, operating synergies and growth potential; possible operational consolidation; rationalization of assets and operations; business strategies; plant and production capacities; revenue generation potential; anticipated construction costs; competitive strengths; goals; capital expenditure plans; business and operational growth and expansion plans; anticipated operating margins and operating income targets; gains or losses associated with business transactions; cost reductions; rationalization and improved efficiency initiatives; proposed new product offerings; future growth of our business and global markets for our products; and other statements that are not historical facts. These forward-looking statements are made pursuant to the safe harbor provisions of the Private Securities Litigation Reform Act of 1995, including Section 27A of the Securities Act of 1933, as amended, and Section 21E of the Securities Exchange Act of 1934, as amended. These forward-looking statements are based on certain assumptions, expectations and analyses we make in light of our experience and our interpretation of current conditions, historical trends and expected future developments, as well as other factors that we believe are appropriate in the circumstances.
Whether actual results and developments will agree with and meet our expectations and predictions is subject to many risks and uncertainties. Accordingly, there are or will be important factors that could cause our actual results to differ materially from our expectations and predictions. We believe these factors include, but are not limited to, the following:
-
failure or inability to complete our ongoing operational review and implement value creation strategies in a timely manner;
-
conflicts of interest between our significant investors and our other stakeholders;
-
product liability suits, recalls and threatened market withdrawals that may arise or be brought against us;
-
food safety concerns and instances of food-borne illnesses that could harm our business;
-
litigation and regulatory enforcement concerning marketing and labeling of food products;
-
significant food and health regulations to which we are subject;
| SUNOPTA INC. | 2 | December 31, 2016 10-K |
ability to obtain additional capital as required to maintain current growth rates;
impairment charges in goodwill or other intangible assets;
the highly competitive industry in which we operate;
that our customers may choose not to buy products from us;
loss of one or more key customers;
changes and difficulty in predicting consumer preferences for natural and organic food products;
the effective management of our supply chain;
volatility in the prices of raw materials and energy;
the availability of organic and non-genetically modified ingredients;
unfavorable growing and operating conditions due to adverse weather conditions;
an interruption at one or more of our manufacturing facilities;
technology failures that could disrupt our operations and negatively impact our business;
the loss of service of our key management;
labor shortages or increased labor costs;
technological innovation by our competitors;
ability to protect our intellectual property and proprietary rights;
changes in laws or regulations governing foreign trade or taxation;
agricultural policies that influence our operations;
substantial environmental regulation and policies to which we are subject;
the enactment of climate change laws;
fluctuations in exchange rates, interest rates and the prices of certain commodities;
exposure to our international operations;
increased vulnerability to economic downturns and adverse industry conditions due to our level of indebtedness;
restrictions under the terms of our debt and equity instruments on how we may operate our business;
our ability to renew our revolving asset-based credit facility (the “Global Credit Facility”) when it becomes due on February 10, 2021;
ability to meet the financial covenants under the Global Credit Facility or to obtain necessary waivers from our lenders;
ability to effectively manage our growth and integrate acquired companies;
ability to achieve the estimated benefits or synergies to be realized from business acquisitions;
| SUNOPTA INC. | 3 | December 31, 2016 10-K |
exposure to unknown liabilities arising from business acquisitions;
unexpected disruptions on our business resulting from business acquisitions;
ability to successfully consummate possible future divestitures of businesses;
volatility of our operating results and share price;
that we do not currently intend to, and are restricted in our ability to, pay any cash dividends on our common shares in the foreseeable future;
dilution in the value of our common shares through the exchange of convertible preferred stock, exercise of stock options, participation in our employee stock purchase plan and issuance of additional securities; and
impact of the publication of industry analyst research or reports about our business on the value of our common shares.
All forward-looking statements made herein are qualified by these cautionary statements, and our actual results or the developments we anticipate may not be realized. We do not undertake any obligation to update our forward-looking statements after the date of this report for any reason, even if new information becomes available or other events occur in the future, except as may be required under applicable securities laws. The foregoing factors should not be construed as exhaustive and should be read in conjunction with the other cautionary statements that are included in this report. For a more detailed discussion of the principal factors that could cause actual results to be materially different, you should read our risk factors in Item 1A, Risk Factors, included elsewhere in this report.
| SUNOPTA INC. | 4 | December 31, 2016 10-K |
PART I
Item 1. Business
INTRODUCTION
SunOpta, a corporation organized under the laws of Canada in 1973, is a leading global company operating businesses focused on a healthy products portfolio that promotes sustainable well-being. We are focused on sourcing non-genetically modified (“non-GMO”) and organic ingredients, and manufacturing healthy food and beverage products. We operate an integrated “field-to-table” business model leveraging our global ingredient sourcing platform to process and market non-GMO and organic ingredients for retailers, food manufacturers and foodservice operators. We manufacture packaged products focused on the high growth healthy beverages, healthy fruit and healthy snacks categories for our retail, foodservice and branded food customers. We believe we are a North American market leader in non-dairy organic aseptic beverages, premium refrigerated private label orange juice, individually quick frozen (“IQF”) organic fruit, healthy premium fruit snacks, and the global sourcing and supply of non-GMO and organic raw materials and ingredients. Our scalable global sourcing platform makes us one of the leading suppliers of non-GMO and organic raw materials and ingredients in the food industry, and provides us leading insights into emerging food and beverage trends. Our product portfolio is strategically aligned with the fast-growing consumer demand for high quality, healthy non-GMO and organic food and beverage products.
Our vertically integrated business model makes us a preferred partner to our retail (e.g., grocery, mass, club, natural and specialty chains), foodservice and branded food customers. We deliver a diverse, innovative portfolio of high quality, food and beverage products supported by our global sourcing platform, scalable operating footprint, manufacturing expertise and commitment to innovation. This platform enables us to consistently supply our customers with a broad range of non-GMO and organic ingredients as well as high quality healthy food and beverage products that cater to the evolving demands of today’s consumers. As a leading supplier of non-GMO and organic ingredients to the food industry, we leverage our insights into emerging consumer tastes and preferences to develop innovative new food and beverage products.
Our Product Portfolio
Our diverse consumer products portfolio utilizes non-GMO and organic raw materials and ingredients that are sourced primarily by our vertically integrated global ingredients capabilities, and consists of three main commercial platforms:
-
Healthy Beverages – We offer a full line of aseptic beverages, including non-dairy beverages (e.g., soy, almond, coconut, rice and others), nutritional beverages, dairy beverages, broths and teas. We also offer refrigerated premium juices, shelf-stable juices and functional waters. We believe we are the leading North American provider of non-dairy organic aseptic beverages and premium refrigerated private label organic orange juice.
-
Healthy Fruit – We offer IQF fruit for retail (e.g., strawberries, blueberries, mango, pineapple, blends and other berries and fruit), IQF and bulk frozen fruit for foodservice (e.g., purées, fruit cups and smoothies), and custom fruit preparations for industrial use. We believe we are the leading North American provider of private label non-GMO and organic IQF fruit.
-
Healthy Snacks – We offer fruit snacks (including bars, twists, ropes and bite-sized varieties), roasted snacks, nutritional bars, and re-sealable pouch products (e.g., baby food, puddings, sauces and other healthy snacks). We believe we are a leading North American provider of premium healthy fruit snacks.
Our global ingredients platform is focused on the procurement and sale of non-GMO and organic grains and seeds (including ancient grains and seeds), fruits, vegetables, sweeteners, coffees, nuts and other products as ingredients in both raw material and processed ingredient forms. In addition to supplying our own healthy food and beverage product portfolio, we are a leading supplier of raw materials and processed ingredients to a number of global food manufacturers and foodservice operators. Our vertically integrated model allows us to leverage our scalable and diverse supply of high quality non-GMO and organic ingredients, adding value to a product at multiple stages of the supply chain and delivering comprehensive non-GMO and organic food ingredients and packaged goods solutions to our customers’ evolving demands. This model allows us to provide our global ingredients customers with high quality healthy food and beverage products.
Using our vertically integrated business model, we process non-GMO and organic food ingredients into consumer packaged products, primarily healthy beverages, healthy fruit and healthy snacks. Our food ingredients are converted from raw materials, and our raw materials are sourced from approximately 5,000 suppliers encompassing approximately 10,000 growers in over 65 countries. Our employees and assets, which include 24 processing and packaging facilities, are principally located in North America and Europe with smaller sourcing and processing operations in Africa and China. Our operations and capabilities provide the flexibility to modify our product portfolio to adapt to the changing consumer needs for non-GMO and organic food and beverage products. As a general principle, we do not own or operate our own farms, retail stores, or extensively market our own consumer brands.
| SUNOPTA INC. | 5 | December 31, 2016 10-K |
Our commitment and proactive approach to new product development and innovation drives our ability to introduce new higher margin food and beverage products to the market. In June 2015, we expanded our research and development platform by opening an advanced innovation center in Edina, Minnesota. This facility supports our dedicated team of food scientists, engineers and technicians, expands our product development capabilities, increases our speed to market and enables us to proactively engage customers in creating and developing new products. Our innovation platform supports our leadership position in non-GMO and organic food and strengthens our relationships with our retail, foodservice and contract manufacturing customers.
Value Creation Plan
On June 27, 2016, we announced that we had engaged external financial and legal
advisors to review our operating plan and to evaluate a range of strategic and
financial actions that we could undertake to maximize shareholder value. The
strategic review arose out of discussions with our largest shareholders, some of
which had advocated that we examine value maximization strategies. We also
announced that we had engaged a global executive search firm to assist in
identifying candidates who could add additional operating, industry and capital
markets experience and expertise to our Board of Directors (the “Board”). The
strategic review was concluded on October 7, 2016 with our announcement of a
strategic partnership with Oaktree Capital Management L.P., a private equity
investor (together with its affiliates, “Oaktree”).
We are conducting, with the assistance of Oaktree, a thorough review of our
operations, management and governance, with the objective of maximizing our
ability to deliver long-term value to our shareholders. Through this review,
management and the Board have developed a Value Creation Plan built on four
pillars: portfolio optimization, operational excellence, go-to-market
effectiveness and process sustainability. The statements we make below about the
expected results of the Value Creation Plan, including expected improvements in
earnings, earnings before income taxes, depreciation and amortization (“EBITDA”),
working capital efficiencies, and expected cash flows, are forward-looking
statements. EBITDA is a non-GAAP measure that management uses when assessing the
performance of our operations and our ability to generate cash flows to fund our
cash requirements, including debt service and capital expenditures.
We are currently targeting implementation of $30 million of productivity-driven
annualized EBITDA enhancements and $20 million of working capital efficiencies,
to be implemented over the coming 12 to 18 months. In the near-term, these
benefits are expected to be offset by structural investments we are making in
the areas of quality, sales, marketing, operations and engineering resources.
Additionally, during 2017 we anticipate incurring non-structural third-party
consulting support, severance, and recruiting costs. The plan also calls for
increased investment in capital upgrades at several manufacturing facilities to
enhance food safety and manufacturing efficiencies. Over time, we expect these
investments to yield additional improvement in EBITDA beyond the $30 million of
initial productivity-driven savings. Recent progress on each of the four pillars
of the Value Creation Plan is highlighted below.
Portfolio Optimization
The focus of the portfolio optimization pillar is to simplify the business,
investing where structural advantages exist, while exiting businesses or product
lines where we are not effectively positioned. During the fourth quarter of
2016, we announced the closing of our San Bernardino, California, juice
facility, which is expected to be $4 million accretive to EBITDA in 2017.
Following that initial announcement, we continued to evaluate our portfolio
which resulted in the following additional actions:
-
Closure of our soy extraction (ingredient) facility in Heuvelton, New York, transferring production to our Alexandria, Minnesota facility.
-
Exited certain varieties of specialty soy and sunflower, as well as frozen edamame.
-
Exited a non-core vegetable brokerage operation.
-
Launched a global organic ingredients portfolio strategy review, which is identifying incremental large ingredient categories for further investment. The incremental growth opportunities include new geographies, new products and new processing capabilities.
During the fourth quarter of 2016, we recognized non-cash impairment charges of $1.2 million associated with the Heuvelton facility closure, and $3.4 million of inventory and other reserves to reflect the exit of non-core business lines. We intend to continue to proactively manage our business portfolio to identify opportunities to drive EBITDA growth.
| SUNOPTA INC. | 6 | December 31, 2016 10-K |
Operational Excellence
The focus of the operational excellence pillar is to ensure food quality and safety, coupled with improved operational performance and efficiency. These efforts are expected to generate productivity improvements in manufacturing, procurement and logistics. With the assistance of third-party consulting support, we have identified a number of broad-based savings opportunities to be implemented and realized over 2017 and 2018. Recent activities include:
-
Launched network-wide upgrades to worker safety and food quality programs, with the goal of becoming the leader in safety and quality across the healthy food industry.
-
Launched a productivity enhancement program that is systematically evaluating all manufacturing facilities, supply chain, and procurement processes to identify productivity cost savings. As a result of these efforts, we are targeting $30 million in annualized EBITDA improvements to be implemented over the next 12 to 18 months.
-
Rolled out the “SunOpta Plant Management System”, which consists of a standardized set of operating processes, key performance indicators, and continuous improvement methodologies that will provide improved consistency and productivity performance across the manufacturing network.
-
Launched a working capital optimization program that is targeting $20 million of cash flow enhancements.
Go-to-Market Effectiveness
The focus of the go-to-market effectiveness pillar is to optimize customer and product mix in existing sales channels, and identify and penetrate new high-potential sales channels. We expect efforts under this pillar to improve revenue growth and profitability over time. Early in 2017, we re-aligned our go-to-market approach, hiring key talent to lead foodservice and retail sales, as well as adding new marketing resources. We also launched a sales force effectiveness program that has already started to generate results. Recent highlights include:
-
Hired a new Senior Vice President of Foodservice Sales and a Senior Vice President of Beverages and Snacks.
-
Secured new business wins in Healthy Beverage, Healthy Fruit and Global Ingredients.
-
Selectively adjusted pricing to enhance margins.
Process Sustainability
The focus of process sustainability is to ensure we have the infrastructure, systems and skills to sustain the business improvements and value captured from the Value Creation Plan. In February 2017, we executed an organizational redesign focused on streamlining and simplifying the business, investing in systems and processes to ensure each function has the tools in place to achieve our goals. Recent initiatives include:
-
Developed a plan to increase capital engineering, plant engineering, and process engineering capabilities that is targeted to enhance food safety, product flow and productivity performance.
-
Created a centralized Consumer Products supply chain team to manage sales and operations planning (“S&OP”), warehousing and distribution.
-
Launched a comprehensive S&OP program to improve supply/demand planning, which is expected to reduce inventory while improving customer service.
-
Initiated a program to push centralized cost accounting resources into manufacturing facilities to improve the accuracy of manufacturing-related financial data.
| SUNOPTA INC. | 7 | December 31, 2016 10-K |
Governance and Management Transitions
Chief Executive Officer
Effective February 6, 2017, David Colo was appointed President and Chief Executive Officer (“CEO”) of SunOpta. In conjunction with this appointment, Mr. Colo also became a member of the Board. Mr. Colo joined SunOpta from Diamond Foods, Inc. where he served as Executive Vice-President, Chief Operating Officer. Mr. Colo has 30 years of leadership experience in general management, operations and supply chain management. As Executive Vice-President, Chief Operating Officer for Diamond Foods, Mr. Colo had direct responsibility for marketing, innovation, research and development, operations, supply chain, procurement, quality, food safety, grower services and contract manufacturing.
On November 11, 2016, Hendrik Jacobs resigned from his positions as President, CEO, and director. Director Katrina Houde served as interim CEO prior to the appointment of Mr. Colo. Ms. Houde will continue her position on the Board following Mr. Colo’s appointment.
Board of Directors
On October 7, 2016, we increased the size of the Board to nine directors and appointed two Oaktree-nominated independent directors, Dean Hollis and Al Bolles, Ph.D., to the Board. Mr. Hollis is Chairman of the Board of AdvancePierre Foods and the former President and Chief Operating Officer of the Consumer Foods Division of ConAgra Foods and former Chairman of Boulder Brands. Mr. Bolles most recently served as Executive Vice President, Chief Technology & Operations Officer of ConAgra Foods. Also on October 7, 2016, Brendan Springstubb was appointed to the Board to replace Douglas Greene who resigned as a director. Mr. Springstubb is a Principal at Engaged Capital LLC (“Engaged”), one of our largest shareholders.
On October 9, 2016, Alan Murray stepped down from the Board and was replaced as Chair of the Board by Mr. Hollis.
On January 19, 2017, Gregg Tanner was appointed to the Board to fill the vacancy created by the resignation of director Jay Amato. Most recently, Mr. Tanner served as CEO and director for Dean Foods Company from October 2012 to December 2016.
Business Development
Issuance of Series A Preferred Stock
On October 7, 2016, Oaktree invested $85.0 million in cumulative, non-participating Series A Preferred Stock (the “Preferred Stock”) of our wholly-owned subsidiary, SunOpta Foods Inc. (“SunOpta Foods”). The shares of Preferred Stock are exchangeable into common shares of SunOpta Inc. in accordance with certain terms and conditions. Net proceeds from the issuance of the Preferred Stock were used to repay $79.0 million of outstanding debt.
In connection with the Preferred Stock offering, we issued 11.3 million Special Shares, Series 1 (the “Special Voting Shares”) of the Company to Oaktree, which entitle Oaktree to one vote per Special Voting Share on all matters submitted to a vote of our common shareholders. As of the date of issuance, the Special Voting Shares represented an 11.7% voting interest in the Company.
Rationalization of Soy and Juice Operations
On December 27, 2016, the Board approved closure of our soy facility in Heuvelton, New York. We determined that our ingredients processing facility in Alexandria, Minnesota, could absorb the production volume from the Heuvelton facility, while continuing to meet the needs of our customers.
On November 8, 2016, the Board approved the closure of our San Bernardino, California juice facility, after determining that it would be more beneficial to transfer our juice production from the facility to contract manufacturers with whom we have ongoing relationships, rather than make further capital investments in support of the bottling or extraction areas of the facility. These capital investments would have been necessary to satisfy packaging format changes demanded by the facility’s largest customer and to address shortfalls in contracting sufficient supply of raw citrus fruit for the upcoming season to allow for effective and efficient use of the facility’s extraction capabilities.
| SUNOPTA INC. | 8 | December 31, 2016 10-K |
Sale of Opta Minerals
On February 11, 2016, Opta Minerals Inc. (“Opta Minerals”) entered into a definitive acquisition agreement, pursuant to which an affiliate of Speyside Equity Fund I LP (“Speyside”) agreed to acquire substantially all of the issued and outstanding shares of Opta Minerals. The acquisition of Opta Minerals by Speyside was completed on April 6, 2016, following a vote of the shareholders of Opta Minerals in favor of the transaction on March 31, 2016.
Upon closing of the transaction, we received aggregate gross proceeds of $4.8 million (C$6.2 million). The sale of our equity interest in Opta Minerals was consistent with our objective of divesting our non-core assets in order to become a pure-play healthy and organic foods company. We have no significant continuing involvement with Opta Minerals.
Five-Year Global Revolving Asset-Based Credit Facility
On February 11, 2016, we entered into a five-year credit agreement for a senior secured asset-based revolving credit facility (the “Global Credit Facility”) in the maximum aggregate principal amount of $350 million, subject to borrowing base capacity. The Global Credit Facility supports the working capital and general corporate needs of our global operations, in addition to funding strategic initiatives. Subject to meeting certain conditions, we may request to increase the total lending commitments under the Global Credit Facility to a maximum aggregate principal amount not to exceed $450 million.
Sunrise Holdings (Delaware), Inc.
On October 9, 2015, we completed the acquisition of 100% of the issued and outstanding common shares of Sunrise Holdings (Delaware), Inc. (“Sunrise”), pursuant to a Purchase and Sale Agreement dated July 30, 2015 (the “Sunrise Acquisition”), for total consideration of $472.7 million in cash. Sunrise is a processor of conventional and organic IQF fruit in the U.S. The acquisition of Sunrise aligned with our strategic focus on healthy and organic foods. Sunrise has been included in the Consumer Products operating segment since the date of acquisition.
In January 2016, we initiated the consolidation of our frozen fruit processing facilities following the Sunrise Acquisition. Consequently, we transferred all production volume from our Buena Park, California facility into Sunrise’s facilities located in Kansas and California.
ACQUISITION HISTORY
SunOpta has been built through business acquisitions and significant internal growth. The following is a summary listing of business operations that we have acquired and retained since the inception of SunOpta. This summary does not include acquisitions that were subsequently divested.
| Date of Acquisition | Business Operations Acquired | Reportable Segment |
| August 3, 1999 | Sunrich Inc. | Global Ingredients |
| August 15, 2000 | Certain assets of Hoffman Aseptic | Consumer Products |
| September 18, 2000 | Northern Food and Dairy, Inc. | Consumer Products/ Global Ingredients |
| March 14, 2001 | First Light Foods Inc. | Consumer Products |
| May 8, 2003 | Kettle Valley Dried Fruit Ltd. | Consumer Products |
| November 1, 2003 | SIGCO Sun Products, Inc. | Global Ingredients |
| December 1, 2003 | Sonne Labs, Inc. | Global Ingredients |
| September 13, 2004 | 51% of the outstanding shares of Organic Ingredients, Inc. (remaining 49% of the outstanding shares were acquired on April 5, 2005) | Consumer Products |
| June 2, 2005 | Earthwise Processors, LLC | Global Ingredients |
| June 20, 2005 | Cleugh’s Frozen Foods, Inc. | Consumer Products |
| July 13, 2005 | Pacific Fruit Processors, Inc. | Consumer Products |
| November 7, 2006 | Hess Food Group LLC | Consumer Products |
| April 2, 2008 | The Organic Corporation | Global Ingredients |
| November 8, 2010 | Dahlgren & Company, Inc. | Global Ingredients |
| SUNOPTA INC. | 9 | December 31, 2016 10-K |
| Date of Acquisition | Business Operations Acquired | Reportable Segment |
| December 14, 2010 | Assets of Edner of Nevada, Inc. | Consumer Products |
| August 5, 2011 | Assets of Lorton’s Fresh Squeezed Juices, Inc. | Consumer Products |
| December 31, 2012 | Organic Land Corporation OOD | Global Ingredients |
| March 2, 2015 | Citrusource, LLC | Consumer Products |
| August 11, 2015 | Assets of Niagara Natural Fruit Snack Company Inc. | Consumer Products |
| October 9, 2015 | Sunrise Holdings (Delaware), Inc. | Consumer Products |
SEGMENT INFORMATION
The composition of our reportable segments is as follows:
-
Global Ingredients aggregates our North American-based Raw Material Sourcing and Supply and European-based International Sourcing and Supply operating segments focused on the procurement and sale of specialty and organic grains and seeds, raw material ingredients, value-added grain- and cocoa-based ingredients, and organic commodities.
-
Consumer Products consists of three main commercial platforms: Healthy Beverages, Healthy Fruit and Healthy Snacks. Healthy Beverages includes aseptic packaged products including non-dairy and dairy beverages, broths and teas; refrigerated premium juices; and shelf-stable juices and functional waters. Healthy Fruit includes IQF fruits for retail; IQF and bulk frozen fruit for foodservice; and custom fruit preparations for industrial use. Healthy Snacks includes fruit snacks; nutritional and protein bars; and resealable pouch products.
In addition, Corporate Services provides a variety of management, financial, legal, information technology, treasury and administration services to each of our operating segments from our headquarters in Mississauga, Ontario and our administrative office in Edina, Minnesota.
Financial information for each reportable segment describing revenues from external customers, a measure of profit or loss, and total assets for the last three fiscal years, as well as financial information about geographic areas for the last three fiscal years, is presented in note 22 of the Consolidated Financial Statements.
Global Ingredients
Operations and Product offerings—Global Ingredients
Global Ingredients aggregates our North American and international raw material sourcing and supply operating segments focused on the procurement, processing and sale of specialty and organic grains, seeds, fruits, grain- and cocoa-based ingredients, and other commodities, which are used primarily in applications serving the natural and organic food industry. Its operations are centered in Amsterdam, the Netherlands; Edina, Minnesota; and Scotts Valley, California.
Global Ingredients sources products from approximately 65 countries around the world, which include:
-
Organic fruit- and vegetable-based raw materials and ingredients, sweeteners, cocoa, coffees, ancient grains, nuts, seeds and pulses and other organic food products.
-
Identity preserved (“IP”), non-GMO and organic seeds and grains including soy, corn and sunflower for food applications, with control maintained at every stage of production, from seed selection and growing through storage, processing and transportation.
-
Seed- and grain-based animal feed and pet food products that originate from select organic and non-GMO soy, corn, sunflower and other commodities.
Global Ingredients also engages in processing and contract manufacturing services that include:
-
Seed and grain conditioning services for soy, corn and sunflower.
-
Grain milling for corn, with various granulations and batch sizing.
| SUNOPTA INC. | 10 | December 31, 2016 10-K |
Coffee and sesame seed processing.
Dry and oil roasting and packaging, including in-shell sunflower and sunflower kernels, corn, soy- and legume- based snacks.
Liquid (concentrates and oil) and dried format seed, grain and cocoa based ingredients utilizing non-GMO and organic soy, corn, sunflower, rice, and cocoa.
Specialty organic functional ingredients, including maltodextrins, tack blends, flavor enhancing products, including snack coatings, cheese powders and flavor systems.
Competition—Global Ingredients
Food ingredients are considered unique niche items often sourced, developed or processed for specific customers or industry segments. Global Ingredients competes with large seed, grain, raw material and specialty ingredient suppliers for customers and competes with other companies active on the international commercial seed, grain and raw material procurement market for supply. Its non-GMO and organic specialty products compete in the smaller niche commercial non-GMO and organic seed, grain and raw material markets. Key to competing in these markets is access to transportation, supply and relationships with producers. Competitors include major food companies with food ingredient divisions, other food ingredient and sourcing companies, and consumer food companies that also engage in the development and sale of food ingredients. Many of these competitors have financial and technical resources, as well as production and marketing capabilities that are greater than our own.
The international organic food industry is very competitive due primarily to the limited worldwide supply of organic raw materials. Global Ingredients competes with worldwide brokers, traders and food processors for the limited supply of organic raw material ingredients. In many cases, it will enter into exclusive arrangements with growers and/or processors of key strategic commodities to control the reliability of its supply chain.
Distribution, Marketing, and Sales—Global Ingredients
As a leading provider of IP, non-GMO and organic, grains, seeds, grain- and cocoa-based ingredients, and other raw materials, Global Ingredients has well established sales and marketing capabilities, including technically oriented sales teams strategically located close to specific geographic sourcing and/or sales regions. Its specialty grains, seeds and other raw materials and ingredients are sold to food manufacturers and producers worldwide, including some of the largest U.S. consumer-packaged food companies. In addition, in our estimation, it maintains one of the largest organic raw material ingredient sourcing and supply networks in the world, working closely to develop and manage global organic supply and link these supplies with diverse customer needs. It also provides procurement and ingredient processing support to the Consumer Products operating segment.
Suppliers—Global Ingredients
Global Ingredients has an extensive established IP, organic soy, corn and sunflower grower network in North America, with many relationships existing for over 25 years. It also has a network of growers in Europe, South America, Africa and Asia. Because weather conditions and other factors can limit the availability of raw materials in a specific geography, it continues to focus on expanding production and sourcing capabilities to other parts of the world to ensure supply in years when local production is below normal levels. By diversifying supply, it also has the ability to divert available product based on market demand and customer requirements in order to maximize return.
Organic raw material ingredient suppliers include growers, processors and traders of organic fruit- and vegetable-based ingredients, sweeteners and other food products. The diversity of our supplier base helps to ensure continual supply by providing contra-seasonal solutions to mitigate crop and quality risks. Organic food suppliers are required to meet stringent organic certification requirements equivalent to the U.S. Department of Agriculture (“USDA”) National Organic Program, European Union (“EU”) standards, or others.
| SUNOPTA INC. | 11 | December 31, 2016 10-K |
Consumer Products
Operations and Product Offerings—Consumer Products
Consumer Products provides healthy and organic food products that are primarily consumer-packaged to retailers, foodservice distributors and major global food manufacturers with a variety of branded and private label products. Consumer Products’ packaged food products are categorized into the following three main commercial platforms:
-
Healthy Beverages
-
Aseptic beverages including soy, almond, rice, coconut, sunflower and other non-dairy and alternative beverages, as well as adjacent categories such as organic dairy and nutritional beverages, including milk, broths and teas. Specializing in aseptic product offerings, Consumer Products produces a variety of pack sizes, including multi-serve and single-serve formats, all shelf stable with long shelf lives.
-
Organic and conventional beverage products, including shelf stable and refrigerated juices; specialty beverages; vitamin and electrolyte waters; and energy drinks. Consumer Products partners with third-party fillers to provide extended shelf life refrigerated packaging formats to its customers.
-
Our Healthy Beverage platform operates from an east to west network of three facilities, as well as co- manufacturing relationships that allow us to minimize distribution costs for our customers, maintain redundant back-up plans, and offer reliable, year-round programs.
Healthy Fruit
-
IQF natural and organic frozen fruits and vegetables, including strawberries, blueberries, raspberries, peppers, broccoli, blends and many other items. Consumer Products produces a variety of packaging formats, including tubs, stand-up pouches, cups and polybags to address the needs of its retail and foodservice customers.
-
Specialty fruit toppings and bases, which are custom formulated to provide unique flavor and texture profiles for a wide range of specialized applications. Applications include fruit bases for yogurts, ice creams, cheeses, smoothies, shakes, frozen desserts, bakery fillings, health bars, various beverages, dressings, marinades, dips and sauces, and fruit toppings for foodservice applications.
-
Our Healthy Fruit platform operates from five facilities that extend from central Mexico through to California, as well as a production facility in Kansas. Strategically our north to south footprint on the west coast allows us to maximize access to supply of fruit over the course of the full growing season, while our operation in the Midwest serves as a lower-cost launching pad to deliver product to the east coast.
Healthy Snacks
-
Organic and conventional re-sealable pouch products, in a variety of pack sizes and shapes, containing a variety of products including baby food, puddings, sauces, and healthy fruit-, vegetable- and protein-based snacks serving the adult nutrition category.
-
Nutritious snacks including natural and organic fruit-based snacks in bar, twist, rope and bite size shapes, with the ability to add a variety of ingredients; and baked and extruded nutrition (i.e., protein, energy and meal replacement) bars using a wide variety of ingredients including grains, proteins and other ingredients.
-
Our Healthy Snack platform operates from an east to west network of four facilities, as well as co- manufacturing relationships. In the case of fruit snacks, we maintain bi-coastal production which helps to minimize delivery costs to our customers.
Competition—Consumer Products
Consumer Products’ healthy beverage and health snacks offerings compete with major food manufacturing companies, as well as a number of other regional manufacturers. Its healthy fruit offerings face competition from both branded and private label fruit providers. It faces competition when securing seed, grain, fruit, vegetable and dairy raw materials; however, due to the location of its processing facilities, it is able to source these raw materials from a number of growing regions and suppliers. Integrated sourcing through Global Ingredients, which supplies a number of core raw materials, combined with in-house processing and packaging capabilities, provides Consumer Products with a low-cost advantage over many of its competitors.
| SUNOPTA INC. | 12 | December 31, 2016 10-K |
Distribution, Marketing and Sales—Consumer Products
Consumer Products supplies the private-label retail market, including large retailers and club stores, branded food companies, food manufacturers, foodservice distributors, quick service and casual dining restaurants located principally in North America. In addition, it markets branded food products under SunOpta-controlled brands, including Sunrich® Naturals, Pure Nature™ and Nature’s Finest™. Consumer Products generally conducts its business with customers on the basis of purchase orders and price quotations, without other formal agreements related to minimum or maximum supplies or pricing.
Costco Wholesale (“Costco”) accounted for approximately 19% of revenues from our Consumer Products segment and approximately 11% of our consolidated revenues for the year ended December 31, 2016. Costco intends to move its private label non-dairy aseptic beverage business to another supplier commencing in the second quarter of 2017. This business represented approximately 4% of the revenues from our Consumer Products segment and approximately 3% of our consolidated revenues for the year ended December 31, 2016. Other than Costco, no customers accounted for more than 10% of revenues from our Consumer Products segment for the year ended December 31, 2016.
Suppliers—Consumer Products
Consumer Products’ raw materials are subject to the availability of seed, grain, fruit, vegetable and dairy supply, which is based on conditions that are beyond our control. Seeds and grains are sourced through Global Ingredients’ established grower network. Fresh and frozen fruits, berries, and vegetables are sourced directly from a large number of suppliers throughout the U.S., Mexico and globally, or through Global Ingredients. We believe our scale and location close to growing areas makes Consumer Products’ an attractive customer for fruit growers. Organic dairy ingredients are sourced from independent distributors.
Consumer Products also relies on its packaging suppliers to ensure delivery of often unique, portable, and convenient consumer packaging formats. In our aseptic packaging facilities we specialize in the use of Tetra Pak equipment in a variety of pack sizes and also offer a variety of opening types and extended shelf life (“ESL”) options. Consumer Products also partners with third party fillers to provide ESL and refrigerated packaging formats to its customers.
Corporate Services
Our corporate headquarters is located in Mississauga, Ontario. In addition, centralized information technology, human resources, operations, research and development, legal and financial shared services groups are located in Edina, Minnesota. Employees of Corporate Services provide support services across the organization including management, finance, legal, operations, business development, information technology, research and development, human resources and administrative functions.
REGULATION
We are subject to a wide range of governmental regulations and policies in various countries and regions where we operate, including the U.S., Canada, Mexico, the Netherlands, throughout the rest of the EU, China and Ethiopia. These laws, regulations and policies are implemented, as applicable in each jurisdiction, on the national, federal, state, provincial and local levels. For example, we are affected by laws and regulations related to: seed, fertilizer and pesticides; the purchasing, harvesting, transportation and warehousing of grain and other products; the processing, packaging and sale of food, including wholesale operations; and product labeling and marketing, food safety and food defense. We are also affected by government-sponsored price supports, acreage set aside programs and a number of environmental regulations.
U.S. Regulations
We are required to comply with the regulations and policies promulgated by the Environmental Protection Agency (“EPA”) and corresponding state agencies, as well as the USDA, the Grain Inspection, Packers and Stockyard Administration, the Food and Drug Administration (“FDA”), the Federal Trade Commission (“FTC”), Occupational Safety and Health Administration (“OSHA”) and the Commodities and Futures Trading Commission.
| SUNOPTA INC. | 13 | December 31, 2016 10-K |
USDA National Organic Program and Similar Regulations
We are involved in the sourcing, manufacturing, supplying, processing, marketing, selling and distribution of organic seed and food products and, as such, are subject to certain organic quality assurance standards. In 1990, Congress passed the Organic Foods Production Act mandating that the USDA develop national standards for organically produced agricultural products to assure consumers that those products marketed as organic meet consistent, uniform standards. The Organic Foods Production Act established the National Organic Program, a marketing program housed within the Agricultural Marketing Service of the USDA.
In December 2000, after considering recommendations from the National Organic Standards Board, as well as private, state, and foreign organic certification programs, USDA adopted regulations with respect to a national organic production, handling, labeling and certification program contained within 7 CFR 205. The regulations became fully effective in October 2002. These regulations, among other things, set forth the minimum standards producers must meet, and have reviewed by an accredited USDA-certifying agent, in order to label their products “100% organic”, “organic”, or “made with organic ingredients” and display the USDA organic seal. The regulations impose strict standards on the production of organic food products and limit the use of non-organic or synthetic materials in the production of organic foods. Generally, organic food products are produced using:
-
agricultural management practices intended to promote and enhance ecosystem health;
-
no genetically engineered seeds or crops, sewage sludge, long-lasting pesticides, herbicides or fungicides; and
-
food processing practices intended to protect the integrity of the organic product and disallow irradiation, genetically modified organisms or synthetic preservatives.
After becoming certified, organic operations must retain records concerning the production, harvesting, and handling of agricultural products that are to be sold as organic for a period of five years. Any organic operation found to be in violation of the USDA organic regulations is subject to enforcement actions, which can include financial penalties or suspension or revocation of their organic certificate.
Additionally, our organic products may be subject to various state regulations. Many states have adopted their own organic programs making the state agency responsible for enforcing USDA regulations for organic operations. However, state organic programs may also add more restrictive requirements due to specific environmental conditions or the necessity of production and handling practices in the state. Applicable regulatory agencies in the U.S. include the USDA, which monitors and ensures the integrity of both the organic process and agricultural grain business, and the FDA and Department of Homeland Security (“DHS”), which oversee the safety, security and efficacy of the food supply in the U.S.
We currently manufacture and distribute a number of organic products that are subject to the standards set forth in the Organic Foods Production Act and the regulations adopted thereunder by the National Organic Standards Board. We believe that we are in material compliance with the organic regulations applicable to our business and we are continuously strengthening our testing and verification processes.
Food-Related Regulations
As a manufacturer and distributor of food products, we are also subject to a number of federal, state and local food-related regulations, including, but not limited to, the Federal Food, Drug and Cosmetic Act of 1938 (the “FDCA”) and regulations promulgated thereunder by the FDA. This comprehensive regulatory framework governs the manufacture (including composition and ingredients), labeling, packaging and safety of food in the U.S. The FDA:
-
regulates manufacturing practices for foods through its current good manufacturing practices regulations;
-
specifies the standards of identity for certain foods, including many of the products we sell; and
-
prescribes the format and content of certain information required to appear on food product labels.
| SUNOPTA INC. | 14 | December 31, 2016 10-K |
Some of the key food safety and food labeling regulations in the U.S. include, but are not limited to, the following:
| 1. |
Food Safety Regulations |
The FDA Food Safety Modernization Act (“FSMA”), signed into law on January 4, 2011, enables FDA to better protect public health by strengthening the food safety system. The law provides FDA with new enforcement authorities and tools designed to achieve higher rates of compliance with prevention- and risk-based food safety standards and to better respond to and contain problems when they do occur.
The FDA has now finalized its rules necessary to implement FSMA including: (1) Preventive Controls for Human Food, (2) Preventive Controls for Food for Animals, (3) Standards for the Growing, Harvesting, Packing, and Holding of Produce for Human Consumption, (4) Foreign Supplier Verification Programs for Importers of Food for Humans and Animals, (5) Sanitary Transportation of Human and Animal Food, (6) Mitigation Strategies to Protect Food Against Intentional Adulteration, and (7) Accredited Third-Party Certification. The compliance dates for these rules are as follows:
| Rules | Date Final Rule Published | Compliance Date |
| Preventive Controls for Human Food | 9/17/2015 | 9/19/2016 |
| Preventive Controls for Food for Animals (Subpart B) | 9/17/2015 | 9/19/2016 |
| Preventive Controls for Food for Animals (Subpart C) | 9/17/2015 | 9/18/2017 |
| Produce Safety | 11/27/2015 | 1/26/2018 |
| Foreign Supplier Verification Program | 11/27/2015 | 5/27/2017 (or later) |
| Sanitary Transport | 4/6/2016 | 4/6/2017 |
| Food Defense | 5/27/2016 | 7/26/2019 |
| Third Party Certifications | 11/27/2015 | Requirements go into effect after FDA publishes Model Accreditation Standards |
Many of the rules, particularly those relating to good manufacturing practices and preventive controls relating to food for human consumption, sanitary transport, and foreign supplier verification and import safety, apply to us as we manufacture, process, pack, hold and transport food for human consumption. We also work with foreign suppliers who provide us with raw materials. In the case of preventive controls for human food, we are already required to comply with the final rule. The rule contains certain key requirements as follows:
| a. |
Food Safety Plan |
Covered facilities must establish and implement a written food safety system that includes an analysis of hazards and risk-based preventive controls. The hazard analysis must consider known or reasonably foreseeable biological, chemical, and physical hazards. The preventive control measures are required to ensure that hazards requiring a preventive control will be minimized or prevented. They include process, food allergen, and sanitation controls, as well as supply-chain controls and a recall plan. In addition to establishing preventive controls, we must continuously ensure that the controls are effective through monitoring and verification activities. If a control fails, prompt corrective actions must be taken to identify a problem with preventive control implementation, to reduce the likelihood the problem will recur, evaluate affected food for safety, and prevent it from entering commerce. All corrective actions must be documented in writing.
| b. |
Supply Chain Management |
The final rule mandates that a manufacturing facility have a risk-based supply chain program for those raw materials and other ingredients that have an identified hazard requiring a supply-chain applied control. Accordingly, we are responsible for ensuring that foods are received only from approved suppliers, or on a temporary basis from unapproved suppliers whose materials are subject to verification activities before being accepted for use.
| c. |
Current Good Manufacturing Practices |
The final rule updated and clarified current good manufacturing practices (“CGMPs”). Specifically, some of the previously nonbinding regulatory provisions, such as education and training, are now binding. Management is required to ensure that all employees who manufacture, process, pack or hold food are qualified and properly educated to perform their assigned duties.
Now that this rule has become final, we are in the process of developing regulatory compliance programs to ensure that all requirements of the rules applicable to us are met by the effective date.
| SUNOPTA INC. | 15 | December 31, 2016 10-K |
In addition, we are subject to the Public Health Security and Bioterrorism Preparedness and Response Act of 2002 (the “Bioterrorism Act”) and regulations issued thereunder. The Bioterrorism Act authorizes the FDA to take the regulatory action necessary to protect the nation’s food supply against the threat of intentional or accidental contamination. The major components of the Bioterrorism Act include registration of food facilities with the FDA; prior notice of virtually all imported food shipments under FDA authority; recordkeeping requirements for food facilities; FDA authority to administratively detain food; FDA authority to institute debarment of food importers for various violations related to food importation; and creation of a clear way to re-import previously refused foods if certain criteria are met.
We believe that we are in material compliance with the current regulations promulgated to implement FSMA that are applicable to our business. By way of example, we reviewed and updated our CGMP and recall policies; implemented change control, corporate supplier approval, allergen management, and environmental monitoring programs; completed food safety plans for our covered facilities; and engaged third party consultants to assist our internal resources with onsite food safety plan reviews at our facilities and to conduct on-site audits in order to strengthen our food safety system. We are continuing to develop internal compliance policies and practices for those rules that have future compliance dates in order to ensure compliance by the required deadlines.
Lastly, we are subject to numerous other federal, state and local regulations involving such matters as the licensing and registration of manufacturing facilities, enforcement by government health agencies of standards for our products, inspection of our facilities and regulation of our trade practices in connection with the sale of food products.
| 2. |
Food Labeling Regulations |
The Company is subject to certain requirements relating to food labeling under the FDCA and corresponding FDA regulations as well as the Fair Packaging and Labeling Act enacted in 1967 and corresponding FTC regulations. Although the FTC, FDA, and USDA share jurisdiction over claims made by manufacturers of food products, the FDA retains primary jurisdiction over the labeling of food products whereas the FTC regulates advertising.
The FDA and FTC require that all food products be labeled to disclose the net contents, the identity of commodity, nutrition information, and the name and place of business of the product’s manufacturer, packer, or distributor in order to prevent consumer deception. Both agencies also require that any claim on the product be truthful and not misleading.
On May 20, 2016, the FDA announced a new Nutrition Facts label for packaged foods to reflect new scientific information, including the link between diet and chronic diseases such as obesity and heart disease. The FDA’s Final Rules regarding the Revision of the Nutrition and Supplement Facts Labels and Serving Sizes require manufacturers to, among other things:
-
increase the type size for “calories”, “servings per container”, and the “serving size” declaration, and bolding the number of calories and the “Serving size” declaration to highlight this information;
-
declare the actual amount, in addition to percent Daily Value of vitamin D, calcium, iron and potassium;
-
include “added sugars”, in grams and as percent Daily Value, on the label;
-
display serving sizes on labels based on amounts of foods and beverages that people are actually eating, not what they should be eating
Manufacturers will need to use the new label by July 26, 2018. We believe that we will be in material compliance with these new food labeling regulations where applicable to our business by the compliance date.
Other state and local statutes and regulations may impose additional food labeling requirements. For instance, the California Safe Drinking Water and Toxic Enforcement Act of 1986 (commonly referred to as “Proposition 65”) requires, with a few exceptions, that a specific warning appear on any consumer product sold in California that contains a substance, above certain levels, listed by that state as having been found to cause cancer or birth defects. This law exposes all food and beverage producers to the possibility of having to provide warnings on their products.
| SUNOPTA INC. | 16 | December 31, 2016 10-K |
FDA Generally Regarded as Safe Regulations
Food ingredients can be classified into four groups including: food additives; color additives; prior sanctioned substances, and Generally Regarded as Safe (“GRAS”) substances. In particular, a food additive is a substance, “the intended use of which results or may reasonably be expected to result, directly or indirectly, either in their becoming a component of food or otherwise affecting the characteristics of food.” Food additives require premarket approval under the 1958 Food Additive Amendments to the FDCA as administered by FDA. However, in enacting those amendments, Congress recognized that many substances intentionally used in a manner whereby they are added to food would not require a formal premarket review by FDA to assure their safety, either because their safety had been established by a long history of use in food or by virtue of the nature of the substances, their customary or projected conditions of use, and the information generally available to scientists about the substances. Congress thus excluded from the definition of “food additive” substances that are generally recognized, among qualified experts, as having been adequately shown through scientific procedures to be safe under the conditions of their intended use, or GRAS.
Companies may establish GRAS status through “self-affirmation” whereby the producer determines on its own that the ingredient is GRAS, normally with the assistance of a panel of qualified experts. The producer may also voluntarily submit a “GRAS Notification” to the FDA that includes the products description, conditions of use, and the basis for GRAS determination, among other information. The FDA response to a GRAS notice, typically issued within 180 days, is not an approval and the product may be marketed while the FDA is reviewing the information.
A food ingredient is eligible for GRAS classification based on the “views of experts qualified by scientific training and experience to evaluate the safety” of the product. The expert’s views are either based on scientific procedures or through experience based on common use of the material prior to 1958. If based on scientific procedures they must use the same quantity and quality of scientific evidence as would be required for the FDA to issue a premarket approval of the sale of a food additive. If a food ingredient is not entitled to GRAS status, premarket approval must be sought through the filing of a Food Additive Petition.
A number of our products are being marketed pursuant to GRAS self-affirmation. We believe that a majority of products for which we have commercial rights are GRAS. However, such status cannot be determined until actual formulations and uses are finalized. Thereafter, we decide whether self-affirmation procedures and a GRAS notification will be appropriate. For those components that do not qualify for GRAS, we may be required to file a Food Additive Petition. In the event that a petition is required, we may elect to sell or license our rights to manufacture, market, and distribute the component to another party.
Environmental Regulations
The Company is also subject to various U.S. federal, state and local environmental regulations. Some of the key environmental regulations in the U.S. include, but are not limited to, the following:
-
Air quality regulations – air quality is regulated by the EPA and certain city/state air pollution control groups. Emission reports are filed annually.
-
Waste treatment/disposal regulations – solid waste is either disposed of by a third-party or, in some cases, we have a permit to haul and apply the sludge to land. Agreements exist with local city sewer districts to treat waste at specified levels of Biological Oxygen Demand (“BOD”), Total Suspended Solids (“TSS”) and other constituents. This can require weekly/monthly reporting as well as annual inspection.
-
Sewer regulations – we have agreements with the local city sewer districts to treat waste at specified limits of BOD and TSS. This requires weekly/monthly reporting as well as annual inspection.
-
Hazardous chemicals regulations – Various reports are filed with local city/state emergency response agencies to identify potential hazardous chemicals being used in our facilities.
-
Storm water – all facilities are inspected annually and must comply with an approved storm water plan to protect water supplies.
| SUNOPTA INC. | 17 | December 31, 2016 10-K |
Employee Safety Regulations
We are subject to certain safety regulations, including OSHA regulations. These regulations require us to comply with certain manufacturing safety standards to protect our employees from accidents. We believe that we are in material compliance with all employee safety regulations applicable to our business.
Canadian and Other Non-U.S. Regulations
Outside of the U.S., regulations concerning the sale or characterization of food ingredients vary substantially from country to country, and we take appropriate steps to comply with such regulations.
In Canada, the sale of food is currently regulated under various federal and provincial laws, principally the federal Food and Drugs Act (“FADA”), Canada Agricultural Products Act (“CAPA”), and the Canadian Environmental Protection Act, 1999 (“CEPA”), along with their supporting regulations. Some of the key Canadian regulatory instruments include but are not limited to the following:
-
Food and Drug Regulations (under the FADA) – food and drugs are subject to specific regulatory requirements, including composition (such as food additives, fortification, and food standards), packaging, labeling, advertising and marketing, and licensing requirements. New requirements regarding nutrition and ingredient labelling and food colour were introduced on December 14, 2016. To the extent the new labelling requirements apply to products manufactured and sold by the Company, we will have a five-year transitional period to adopt them. Amendments dealing with food colour specifications and the removal of synthetic colour certification requirements came into effect immediately.
-
Organic Products Regulations, 2009 (“OPR”) (under the CAPA) – the OPR require mandatory certification to the revised national organic standard for agricultural products that are to be represented as organic in international and inter- provincial trade, or that bear the federal organic agricultural product legend (or federal logo). Except for certain exceptions and conditions, a U.S.-Canada Organic Equivalence Arrangement is currently in place whereby agricultural products produced and processed in conformity with the USDA National Organic Program are considered to be equivalent to the requirements of the OPR.
-
Canada Consumer Product Safety Act (“CCPSA”) – the CCPSA provides oversight and regulation of consumer products with respect to manufacturers, importers, and retailers. It includes, without limitation, the ability to require product recalls, mandatory incident reporting, document retention requirements, increased fines and penalties, and packaging and labeling requirements. While the CCPSA does not apply to food, it does apply to its packaging with respect to safety. It is possible that there will be amendments introduced to the FADA, to capture the essence of the regulatory oversight found in the CCPSA. We have no way of anticipating if and when that may occur.
-
Consumer Packaging and Labeling Act (“CPLA”) – the CPLA and its supporting regulations outline requirements for packaging and labeling of products, including food products. The CPLA sets out labeling requirements relating to the description of the product, net quantity and dealer information, as well as packaging standards. The CPLA also includes a prohibition against false or misleading labeling.
-
Canada Food Inspection Agency Act (“CFIAA”) – the CFIAA grants power to the Canadian Food Inspection Agency (the “CFIA”), which is tasked with the administration and enforcement of certain Canadian food legislation. Under the CFIAA, the CFIA has the power to recall certain products if the Minister believes that such product poses a risk to the public, animal or plant health.
-
Processed Products Regulations (“PPR”) (under the CAPA) – the PPR regulates the grading, packing and marking of processed products that are produced in Canada for inter-provincial or export trade or imported into Canada. Under the PPR, processed food products are those that are prepared to assure preservation of the food product in transport, distribution and storage. The PPR establishes requirements with respect to the content, preparation, packing and marking of processed food products.
In January, 2017, the Government of Canada published the second version of its proposed Safe Food for Canadians Regulations (“SFCR”) under the authority of the Safe Food for Canadians Act (“SFCA”). Publication of the SFCR was accompanied by a 90-day public consultation period. If and when they become effective, the SFCR will consolidate 13 existing Canadian regulations and the food labelling provisions of the CPLA, and thereby establish a comprehensive set of regulations which govern all food sectors subject to CFIAA oversight, including federally registered sectors and food that is destined for import, export or interprovincial trade. Principal elements of the SCFR which are likely to impact the Company include licensing requirements for the import, export and interprovincial trade of food, traceability requirements, reporting requirements and timelines, preventative controls, an export certificate request process, prescribed container sizes and weights for certain products, labelling regulations and standards of identity and expansion of organic certification to service providers and additional products. The licensing requirements will be immediate for sectors such as meat, eggs and other previously federally registered sectors and up to three years for other sectors.
| SUNOPTA INC. | 18 | December 31, 2016 10-K |
We are subject to Dutch and European Commission (“EC”) regulations and policies. Our European subsidiary, The Organic Corporation (“TOC”), is involved in the sourcing, supplying, processing, marketing, selling and distribution of organic food products and, as such, is subject to standards for production, labeling and inspection of organic products contained in EC Regulation 2092/91 (and its subsequent amendments). TOC is certified by Skal, the inspection body for the production of organic products in the Netherlands. Products certified as organic by an EU-recognized inspection body, such as Skal, can be marketed within the entire EU. In addition, under the terms of an equivalency arrangement between the U.S. and the EU, organic operations certified to the USDA organic or EU organic standards may be labeled and sold as organic in both the U.S. and EU.
TOC is also affected by general food legislation both at EU and Dutch level relating to product safety and hygiene, among others. TOC is Hazard Analysis and Critical Control Point certified in the Netherlands and manages a fully computerized system that manages the traceability of each product. In addition, TOC also considers and abides by EU and local legislation with regard to packaging and packaging waste. TOC is also subject to the regulations and policies of the countries outside of the EU in which it operates, including China and Ethiopia.
Following the Sunrise Acquisition, we operate a processing facility in Mexico and are subject to Mexican regulations, including regulations regarding processing, packaging and sales of food products, labor relations and profit-sharing with employees.
RESEARCH AND DEVELOPMENT
Research and development and new product, process and packaging innovation are key priorities of our Company and initiatives are focused on continuous improvement of our existing product portfolios and continuing efforts to improve production process to reduce costs and improve efficiencies, as well as the development of innovative new products. Innovation is a key pillar for us and a necessity in the natural and organic foods categories. We believe our commitment and proactive approach to new product development and innovation is important to our ability to introduce new higher-margin food and beverage products to the market.
In June 2015, we expanded our research and development platform by opening an advanced innovation center in Edina, Minnesota. This facility supports our dedicated team of food scientists, engineers and technicians, expands our product development capabilities, increases our speed to market and enables us to proactively engage customers in creating and developing new products. We believe our innovation platform supports our leadership position in non-GMO and organic food and strengthens our relationships with our retail, foodservice and contract manufacturing customers.
Our product development team includes highly trained and experienced food scientists and technologists that are dedicated to both the development of unique new product offerings plus addressing product development opportunities for our customers including new and custom formulations, innovations in packaging formats, and new production processes and applications. Applications and technical support provided to our customers include all aspects of product development from concept to commercial launch, as well as ongoing manufacturing and processing support.
We continue to develop new products to maximize the capabilities of our aseptic packaging facilities, including the development of non-dairy based beverages that address the growing consumer demand for beverages that satisfy allergy concerns and provide a unique nutritional profile, as well as teas, organic dairy and nutritional beverages. In addition, we continue to develop new fruit-based beverages, fruit- and grain-based snacks, nutrition bars and fruit-based re-sealable pouch products, as well as innovative fruit ingredient systems for the dairy, foodservice and beverage industries. We are also continually looking to develop new value-added products for our customers that leverage our global sourcing platform.
INTELLECTUAL PROPERTY
The nature of a number of our products and processes requires that we create and maintain patents, trade secrets and trademarks. Our policy is to protect our technology, brands and trade names by, among other things, filing patent applications for technology relating to the development of our business in the U.S. and in selected foreign jurisdictions, registering trademarks in the U.S., Canada and selected foreign jurisdictions where we sell products, and maintenance of confidentiality agreements with outside parties and employees.
| SUNOPTA INC. | 19 | December 31, 2016 10-K |
Our success will depend, in part, on our ability to protect our products, trade names and technology under U.S. and international patent laws and other intellectual property laws. We believe that we own or have sufficient rights to use all of the proprietary technology, information and trademarks necessary to manufacture and market our products; however, there is always a risk that patent applications relating to our products or technologies will not result in patents being issued, or, if issued, will be later challenged by a third party, or that current or additional patents will not afford protection against competitors with similar technology.
We also rely on trade secrets and proprietary know-how and confidentiality agreements to protect certain technologies and processes. Even with these steps taken, our outside partners and contract manufacturers could gain access to our proprietary technology and confidential information. All employees are required to adhere to internal policies, which are intended to further protect our technologies, processes and trade secrets.
PROPERTIES
We operate 24 processing facilities in 8 U.S. states, as well as Canada, Mexico, the Netherlands, Bulgaria, and Ethiopia. In addition, we also own and lease a number of office and distribution locations in the U.S., Canada, Mexico, the Netherlands, Ethiopia, France and China, and lease and utilize public warehouses to satisfy our storage needs. We also lease farmland that we sublease to fruit growers. For more details see Item 2. Properties, elsewhere in this report.
ENVIRONMENTAL HAZARDS
We believe that, with respect to both our operations and real property, we are in material compliance with environmental laws at all of our locations.
EMPLOYEES
As at December 31, 2016, we had a total of approximately 2,000 full-time employees (January 2, 2016 – 2,100, which included 270 employed at Opta Minerals). We also employ up to 2,000 seasonal employees in the U.S. and Mexico during peak fruit seasons each year. We consider our relations with our employees to be good and have not experienced any work stoppages, slowdowns or other serious labor problems that have materially impeded our business operations.
AVAILABLE INFORMATION
Our annual reports on Form 10-K, quarterly reports on Form 10-Q, current reports on Form 8-K, and amendments to those reports filed or furnished pursuant to Section 13(a) or 15(d) of the Securities Exchange Act of 1934 (the “Exchange Act”), are available free of charge on our website at www.sunopta.com as soon as reasonably practicable after we file such information electronically with, or furnish it to, the U.S. Securities and Exchange Commission (the “SEC”) and applicable Canadian Securities Administrators (the “CSA”).
Item 1A. Risk Factors
Our business, operations and financial condition are subject to various risks and uncertainties, including those described below and elsewhere in this report. We believe the most significant of these risks and uncertainties are described below, any of which could adversely affect our business, financial condition and results of operations and could cause actual results to differ materially from the results contemplated by the forward-looking statements contained in this report. In such case, the trading price of our common stock could decline, and you may lose all or part of your investment. There may be additional risks and uncertainties not presently known to us or that we currently consider immaterial. Consequently, you should not consider the following to be a complete discussion of all possible risks or uncertainties applicable to our business. These risk factors should be read in conjunction with the other information in this report and in the other documents that we file from time to time with the SEC and the CSA.
Risks Related to Our Ongoing Operational Review and Significant Investors
We are conducting a thorough review of the Company’s operations, management and governance. Both the process of conducting this review and its outcome and implementation could pose a number of risks that could have an adverse impact on our business, financial condition or results of operations
We are conducting a thorough review of our operations, management and governance in partnership with representatives of Oaktree. Among other things, the Board has committed to a further review of governance and leadership with a particular focus on continuing to add independent directors with significant expertise in the food industry and continuing to ensure that we have the management resources to implement our strategy and the action items that emerge from our operational review. We are also implementing a number of operational actions to improve our profitability and streamline our operations for long-term success. These actions may include rationalization or consolidation of certain of our operations or facilities, reinvestment in certain of our operations or facilities, investments in personnel, processes and tools, as well as other cost saving initiatives. These actions could consume capital resources and could also give rise to impairment and other restructuring charges that would be both cash and non-cash in nature, and these charges could be material.
| SUNOPTA INC. | 20 | December 31, 2016 10-K |
We have not yet finalized our review, but you should be aware that we may decide to take actions with a material impact on our operations, strategy, governance, management and future prospects. In 2016, we announced the closures of our San Bernardino, California juice facility and Heuvelton, New York soy extraction facility, resulting in the write-down of related assets amounting to $11.5 million. Certain actions that we take may lead to additional write-downs of assets and/or charges in future periods. In addition, we cannot predict whether the actions we take will achieve our goals of improving our profitability and financial performance and delivering long-term value to our shareholders. Our ongoing review could expose us to a number of other risks, including the following:
-
distraction of management;
-
difficulties in hiring, retaining and motivating key personnel as a result of uncertainty generated by the review and the implementation of any resulting recommendations;
-
difficulties in maintaining relationships or arrangements with customers, suppliers and other third parties; and
-
increases in general and administrative expenses associated with the need to retain and compensate business and recruiting consultants and other advisors.
Further, we do not intend to discuss or disclose further developments during this review process unless and until the Board has approved a specific action. Accordingly, speculation regarding any developments related to the review of our operations, management and governance and perceived uncertainties related to our future could cause our stock price or the price of our debt to fluctuate significantly.
The occurrence of any one or more of the above risks could have an adverse impact on our business, financial results, liquidity and financial condition.
Our significant investors may have interests that conflict with those of our debtholders and other stakeholders
Under the agreements executed in connection with our strategic partnership with Oaktree, Oaktree initially may acquire common stock of SunOpta Inc. representing up to 19.99% of SunOpta Inc.’s outstanding common stock. This percentage may be increased to 27% under certain circumstances, subject to shareholder approval.
Oaktree has nominated two members of the Board and is entitled to designate two nominees for election to the Board so long as it beneficially owns or controls at least 11.1% of SunOpta Inc.’s common stock on an as-exchanged basis. If Oaktree beneficially owns or controls less than 11.1% but more than 5% of SunOpta Inc.’s common stock on an as-exchanged basis, it will be entitled to designate one nominee. In addition, Engaged Capital has nominated one member of our Board.
Oaktree is participating in our ongoing review of our operations, management and governance. Oaktree’s objectives and perspectives during this review may not always be aligned with those of other stakeholders, including our debtholders and smaller shareholders.
The interests of Oaktree and Engaged Capital, as well as their affiliates, may differ from the interests of our other stakeholders in material respects. For example, our large investors and their affiliates may have an interest in directly or indirectly pursuing acquisitions, divestitures, financings or other transactions that, in their judgment, could enhance their other equity investments, even though such transactions might involve risks to us, including risks to our liquidity and financial condition. Our large investors and their affiliates are in the business of making or advising on investments in companies, including businesses that may directly or indirectly compete with certain portions of our business. They may also pursue acquisition opportunities that may be complementary to our business, and, as a result, those acquisition opportunities may not be available to us.
| SUNOPTA INC. | 21 | December 31, 2016 10-K |
A concentration of ownership within our large investors could potentially be disadvantageous to, or conflict with, interests of our debtholders or smaller shareholders. In addition, if any significant shareholder were to sell or otherwise transfer all or a large percentage of its holdings, we could find it difficult to raise capital, if needed, through the sale of additional equity securities.
Risks Related to Our Business
Product liability suits, recalls and threatened market withdrawals, could have a material adverse effect on our business
Many of our products are susceptible to harmful bacteria, and the sale of food products for human consumption involves the risk of injury or illness to consumers. Such injuries may result from inadvertent mislabeling, tampering by unauthorized third parties, faulty packaging materials, product contamination, or spoilage. Under certain circumstances, we or our customers may be required to recall or withdraw products, which may lead to a material and adverse effect on our business, financial condition or result of operations. Our customers may also voluntarily recall or withdraw a product we manufactured or packaged, even without consulting us, which could increase our potential liability and costs and result in lost sales. A product recall or withdrawal could result in significant losses due to the costs of the recall, the destruction of product inventory, and lost sales due to the unavailability of product for a period of time. In addition, we could be forced to temporarily close one or more production facilities. Even if a situation does not necessitate a recall or market withdrawal, product liability claims might be asserted against us. If a product recall or withdrawal were to lead to a decline in sales of a similar or related product sold by a customer or other third party, that party could also initiate litigation against us. While we are subject to governmental inspection and regulations and believe our facilities and those of our co-packers comply in all material respects with all applicable laws and regulations, if the consumption of any of our products causes, or is alleged to have caused, a health-related illness in the future, we may become subject to claims or lawsuits relating to such matters. Even if a product liability claim is unsuccessful or is not fully pursued, the negative publicity surrounding any assertion that our products caused illness or physical harm could adversely affect our reputation with existing and potential customers and consumers and our corporate and brand image.
For example, on July 29, 2016, one of our wholly-owned subsidiaries agreed to pay $5.0 million in cash and up to $4.0 million in rebates to one of our customers to settle litigation filed by the customer in connection with a voluntary recall of certain pouch products manufactured at our subsidiary’s Allentown, Pennsylvania facility.
On May 3, 2016, we announced a voluntary recall of certain sunflower kernel products produced at our Crookston, Minnesota facility that have the potential to be contaminated with Listeria monocytogenes bacteria, and a number of our customers initiated recalls of their products that contain the affected sunflower kernels as an ingredient or component. While we have recognized estimated losses of $40.0 million related to this recall, we may need to revise our estimates to be materially larger as we continue to work with our customers to substantiate the claims received to date and any additional claims that may be received. We may also incur costs that are significantly greater than our previous estimates. These revisions of our estimated losses and costs may occur at any time as we continue this process.
Additionally, these losses do not reflect costs associated with the interruption of production at the Crookston facility for the period from April 21, 2016 to the time regular production resumed on or about May 15, 2016, subject to a positive release protocol, or the costs to put into place corrective and preventive actions at our roasting facilities. Our remediation efforts are ongoing, and we expect to continue to incur related costs, which may be material. Further, we are currently unable to estimate the full impact that this recall may have on our future sales of sunflower products or on our ongoing relationships with our customers. The recall may cause us to lose future revenues from, or relationships with, one or more material customers, and the impact of the recall could affect our customers’ willingness to continue to purchase other unrelated products from us or could hinder our ability to grow our business with those customers. We may not be able to determine the full extent of the losses related to the recall for some time and certain factors impacting these losses, such as our customers’ processes for developing their claims, the timing of submission of any such claims and the terms of our customers’ insurance policies and related coverage, are beyond our control.
Moreover, claims or liabilities of this sort might not be covered by our insurance or by any rights of indemnity or contribution that we may have against others. Although we maintain product liability insurance, we may incur claims or liabilities for which we are not insured or that exceed the amount of our insurance coverage. A product liability judgment against us or a further product recall could have a material and adverse effect on our business, financial condition or results of operations.
| SUNOPTA INC. | 22 | December 31, 2016 10-K |
Food safety concerns and instances of food-borne illnesses caused by third parties could harm our business
Our internal processes and training may not be fully effective in preventing contamination of food products that could lead to food-borne illnesses. We rely on third-party suppliers and distributors, which increases the risk that food-borne illness incidents (such as e. coli, salmonella or listeria) could occur outside of our control and at multiple locations. If consumers lose confidence in the safety and quality of our products or organic products generally, even in the absence of a recall or a product liability case, our business, financial condition or results of operations could be materially and adversely affected. Instances of food-borne illnesses, whether real or perceived, and whether or not traceable to our operations or a result of our actions or omissions, could cause negative publicity about us or the products we serve, which could adversely affect sales. Food safety concerns and instances of food-borne illnesses and injuries caused by contaminated products sold by third parties could cause customers to shift their preferences, even if no food-borne illnesses or injuries are traced to our products. As a result, our sales may decline. Loss of customers as a result of these health concerns or negative publicity could harm our business.
Litigation and regulatory enforcement concerning marketing and labeling of food products could adversely affect our business and reputation
The marketing and labeling of any food product in recent years has brought increased risk that consumers will bring class action lawsuits and that the FTC and/or state attorneys general will bring legal action concerning the truth and accuracy of the marketing and labeling of the product. Examples of causes of action that may be asserted in a consumer class action lawsuit include fraud, unfair trade practices, and breach of state consumer protection statutes (such as Proposition 65 in California). The FTC and/or state attorneys general may bring legal action that seeks removal of a product from the marketplace, and impose fines and penalties. Even when not merited, class claims, action by the FTC or state attorneys general enforcement actions can be expensive to defend and adversely affect our reputation with existing and potential customers and consumers and our corporate and brand image, which could have a material and adverse effect on our business, financial condition or results of operations.
We are subject to significant food and health regulations
We are affected by a wide range of governmental regulations in Canada, the U.S., Mexico and several countries in Europe, among others. These laws and regulations are implemented at the national level (including, among others, federal laws and regulation in Canada and the U.S.) and by local subdivisions (including, among others, state laws in the U.S. and provincial laws in Canada). We are also subject to regulations of the EU and the regulatory authority of regulatory agencies in several different countries. Examples of regulatory agencies influencing our operations include: the USDA, the FDA, the DHS, the EPA, the CFIA, and Skal, among others.
Examples of laws and regulations that affect us include laws and regulations applicable to:
-
the use of seed, fertilizer and pesticides;
-
the purchasing, harvesting, transportation and warehousing of seeds, grain and other products;
-
the processing and sale of food, including wholesale operations; and
-
the product labeling and marketing of food and food products, food safety and food defense.
These laws and regulations affect various aspects of our business. For example, as described in more detail under “Item 1. Business—Regulation” of this report, certain food ingredient products manufactured by SunOpta are regulated under the FDCA, as administered by the FDA. Under the FDCA, pre-marketing approval by the FDA is required for the sale of a food ingredient which is a food additive unless the substance is GRAS, under the conditions of its intended use by qualified experts in food safety. We believe that most food ingredients for which we have commercial rights are GRAS. However, this status cannot be determined until actual formulations and uses are finalized. As a result, we may be adversely impacted if the FDA determines that our food ingredient products do not meet the criteria for GRAS.
In addition, certain USDA regulations set forth the minimum standards producers must meet in order to have their products labeled as “certified organic”, and we currently manufacture a number of organic products that are covered by these regulations. While we believe our products and our supply chain are in compliance with these regulations, changes to food regulations may increase our costs to remain in compliance. We could lose our “organic” certification if a facility becomes contaminated with non-organic materials or if we do not use raw materials that are certified organic. The loss of our “organic” certifications could materially and adversely affect our business, financial condition or results of operations.
| SUNOPTA INC. | 23 | December 31, 2016 10-K |
Our business is subject to the Perishable Agricultural Commodities Act (“PACA”). PACA regulates fair trade standards in the fresh produce industry and governs our purchases of fresh produce and sales of frozen produce. We source fresh produce under licenses issued by the USDA, as required by PACA. Our failure to comply with the PACA requirements could, among other things, result in civil penalties, suspension or revocation of our licenses to sell produce and in certain cases, criminal prosecution, which could have a material and adverse effect on our business, financial condition or results of operations.
Changes in any government laws and regulations applicable to our operations could increase our compliance costs, negatively affect our ability to sell certain products or otherwise adversely affect our results of operations. In addition, while we believe we are in material compliance with all laws and regulations applicable to our operations, we cannot assure you that we have been, or will at all times be, in compliance with all food production and health requirements, or that we will not incur material costs or liabilities in connection with these requirements. Our failure to comply with any laws, regulations or policies applicable to our business could result in fines, lawsuits, enforcement actions, penalties or loss in the ability to sell certain products, any of which could materially and adversely affect our business, financial condition or results of operations.
We may require additional capital to maintain current growth rates, which may not be available on favorable terms or at all
We have grown via a combination of internal growth and acquisitions requiring available financial resources. Our ability to raise capital, through equity or debt financing, is directly related to our ability to both continue to grow and improve returns from our operations. Debt or equity financing may not be available to us on favorable terms or at all. In addition, any future equity financing would dilute our current shareholders and may result in a decrease in our share price if we are unable to realize adequate returns. We will not be able to maintain our growth rate and/or acquire complementary businesses within the natural and organic food industries without continued access to capital resources.
Impairment charges in goodwill or other intangible assets could adversely impact our financial condition and results of operations
As a result of business acquisitions, a significant portion of our total assets is comprised of intangible assets and goodwill. We are required to perform impairment tests of our goodwill and other intangible assets annually, or at any time when events occur that could affect the value of these assets. We may engage in additional acquisitions, which could result in our recognition of additional intangible assets and goodwill. If the financial performance of the acquired businesses is not as strong as we anticipate, we could be required to record significant impairments to intangible assets and/or goodwill, which could materially and adversely impact our business, financial condition and results of operations.
We operate in a highly competitive industry
We operate businesses in highly competitive product and geographic markets in the U.S., Canada, Europe and various other international markets. We compete with various U.S. and international commercial grain procurement marketers, major companies with food ingredient divisions, other food ingredient companies, trading companies, and consumer-packaged food companies that also engage in the development and sale of food ingredients and other food companies involved in natural and organic foods. These competitors may have financial resources and staff larger than ours and may be able to benefit from economies of scale, pricing advantages and greater resources to launch new products that compete with our offerings. We have little control over and cannot otherwise affect these competitive factors. If we are unable to effectively respond to these competitive factors or if the competition in any of our product markets results in price reductions or decreased demand for our products, our business, financial condition or results of operations may be materially and adversely affected.
Our customers generally are not obligated to continue purchasing products from us
Many of our customers buy from us under purchase orders, and we generally do not have long-term agreements with or commitments from these customers for the purchase of products. We cannot provide assurance that our customers will maintain or increase their sales volumes or orders for the products supplied by us or that we will be able to maintain or add to our existing customer base. Decreases in our customers’ sales volumes or orders for products supplied by us may have a material adverse effect on our business, financial condition or results of operations.
Loss of a key customer could materially reduce revenues and earnings
Our relationships with our key customers are critical to the success of our business and our results of operations. One of our customers accounted for approximately 11% of revenues for the year ended December 31, 2016. We do not expect to receive the same level of revenue from this customer in 2017, which could adversely affect our total revenues for the year. The loss or cancellation of business with any of our other larger customers could materially and adversely affect our business, financial condition or results of operations.
| SUNOPTA INC. | 24 | December 31, 2016 10-K |
Consumer preferences for natural and organic food products are difficult to predict and may change
Our success depends, in part, on our ability and our customers’ ability to offer products that anticipate the tastes and dietary habits of consumers and appeal to their preferences on a timely and affordable basis. A significant shift in consumer demand away from our products or products that utilize our integrated foods platform, or our failure to maintain our current market position, could reduce our sales and harm our business. Consumer trends change based on a number of possible factors, including nutritional values, a change in consumer preferences or general economic conditions. Additionally, there is a growing focus among some consumers to buy local food products in an attempt to reduce the carbon footprint associated with transporting food products from longer distances, which could result in a decrease in the demand for food products and ingredients that we import from other countries or transport from remote processing locations or growing regions. Further, failures by us or our competitors to deliver quality products could erode consumer trust in the organic certification of foods. These changes could lead to, among other things, reduced demand and price decreases, which could have a material and adverse effect on our business, financial condition or results of operations.
If we do not manage our supply chain effectively, our operating results may be adversely affected
Our supply chain is complex. We rely on suppliers for our raw materials and for the manufacturing, processing, packaging and distribution of many of our products. The inability of any of these suppliers to deliver or perform for us in a timely or cost-effective manner could cause our operating costs to rise and our margins to fall. Many of our products are perishable and require timely processing and transportation to our customers. Additionally, many of our products can only be stored for a limited amount of time before they spoil and cannot be sold. We must continuously monitor our inventory and product mix against forecasted demand or risk having inadequate supplies to meet consumer demand as well as having too much inventory that may reach its expiration date. If we are unable to manage our supply chain efficiently and ensure that our products are available to meet consumer demand, our operating costs could increase and our margins could fall, which could have a material and adverse effect on our business, financial condition or results of operations.
Some of our operations are subject to seasonal supply fluctuations. For example, we purchase strawberries and other fruit from farmers during the peak California growing season, which occurs during the first two quarters of the year. As a result, our costs may be higher during these periods. We may not be successful in counteracting or smoothing out the effects of seasonality, and we expect that certain parts of our operations will continue to remain subject to significant seasonality.
Part of our supply source also depends in part on a seasonal temporary workforce comprised primarily of migrant workers. Changes in immigration laws or policies that discourage migration to the U.S. and political or other events (such as war, terrorism or health emergencies) that make it more difficult for individuals to immigrate to or migrate throughout the U.S. could adversely affect the migrant worker population and reduce the workforce available for farms and production facilities in the U.S. Additionally, increased competition from other industries for migrant workers could increase our costs and adversely affect our business, financial condition or results of operations.
Volatility in the prices of raw materials and energy could increase our cost of sales and reduce our gross margins
Raw materials represent a significant portion of our cost of sales. Our cost to purchase services and materials, such as grains, fruits and other commodities, processing aids, and natural gas, can fluctuate depending on many factors, including weather patterns, economic and political conditions and pricing volatility. In addition, we must compete for limited supplies of these raw materials and services with competitors having greater resources than us. If our cost of materials and services increases due to any of the above factors, we may not be able to pass along the increased costs to our customers.
We enter into a number of exchange-traded commodity futures and options contracts to partially hedge our exposure to price fluctuations on transactions to the extent considered practicable for minimizing risk from market price fluctuations. Futures contracts used for hedging purposes are purchased and sold through regulated commodity exchanges. Our inventories, however, may not be completely hedged, due in part to our assessment of exposure from expected price fluctuations and an inability to hedge a number of raw materials.
Exchange purchase and sales contracts may expose us to risks that a counterparty to a transaction is unable to fulfill its contractual obligation. We may be unable to hedge 100% of the price risk of each transaction due to timing and availability of hedge contracts and third party credit risk. In addition, we have a risk of loss from hedge activity if a grower does not deliver the commodity as scheduled. We also monitor the prices of natural gas and from time to time lock in a percentage of our natural gas needs based on current prices and expected trends.
| SUNOPTA INC. | 25 | December 31, 2016 10-K |
An increase in our cost of sales resulting from an increase in the price of raw materials and energy could have a material and adverse effect on our business, financial condition or results of operations.
| SUNOPTA INC. | 26 | December 31, 2016 10-K |
Our future results of operations may be adversely affected by the availability of organic and non-GMO ingredients
Our ability to ensure a continuing supply of organic and non-GMO ingredients at competitive prices depends on many factors beyond our control, such as the number and size of farms that grow organic and non-GMO crops, climate conditions, changes in national and world economic conditions, currency fluctuations and forecasting adequate need of seasonal ingredients.
The organic and non-GMO ingredients that we use in the production of our products (including, among others, fruits, vegetables, nuts and grains) are vulnerable to adverse weather conditions and natural disasters, such as floods, droughts, water scarcity, temperature extremes, frosts, earthquakes and pestilences. Natural disasters and adverse weather conditions (including the potential effects of climate change) can lower crop yields and reduce crop size and crop quality, which in turn could reduce our supplies of organic or non-GMO ingredients or increase the prices of organic or non-GMO ingredients. If our supplies of organic or non-GMO ingredients are reduced, we may not be able to find enough supplemental supply sources on favorable terms, if at all, which could impact our ability to supply product to our customers and adversely affect our business, financial condition and results of operations.
Adverse weather conditions and natural disasters could impose costs on our business
Our various food products, from seeds and grains to ingredients, fruits, vegetables and other inputs, are vulnerable to adverse weather conditions and natural disasters, including windstorms, hurricanes, floods, droughts, fires, temperature extremes and earthquakes, some of which are common but difficult to predict, as well as crop disease and infestation. Severe weather conditions may occur with higher frequency or may be less predictable in the future due to the effects of climate change. Unfavorable growing conditions could reduce both crop size and crop quality. In extreme cases, entire harvests may be lost in some geographic areas. Adverse weather conditions or natural disasters may adversely affect our supply of one or more food products or prevent or impair our ability to ship products as planned. These factors can increase costs, decrease our sales volumes and revenues and lead to additional charges to earnings, which may have a material adverse effect on our business, financial condition and results of operations.
A significant portion of our fruit supply is sourced from California, which continued to experience severe drought conditions for the fifth consecutive year in 2016 due to extremely low levels of rainfall. Such conditions have resulted in lost crops as well as increased water costs for growers in California. In particular, we depend on growers in California for strawberries. In January 2014, a drought state of emergency was declared in California and, among other actions, legislation was passed requiring monitoring of groundwater pumping, which limits the amount of groundwater for which farmers can drill. Strawberry growers are largely dependent on well water, and diminishing groundwater resources could lead to a reduced strawberry supply. In April 2015, statewide mandatory water conservation measures were imposed in California, including increased water use reporting by agricultural water users, enhancing the state’s ability to enforce against diversions and unreasonable use of water in an effort to curtail wasteful water practices in agricultural fields. Although the drought conditions in California significantly improved in late 2016 and early 2017, the mandatory water conservation measures remain in place. While farms have been largely exempted from the strict water conservation measures imposed statewide, which have mostly targeted urban water use, a worsening of drought conditions could lead to more restrictive measures aimed at the agricultural industry. Recurring drought conditions and existing and future water conservation laws could negatively impact the agricultural industry in California and have a material adverse effect on our business, financial condition or results of operations.
An interruption at one or more of our manufacturing facilities could negatively affect our business, and our business continuity plan may prove inadequate
We own or lease, manage and operate a number of manufacturing, processing, packaging, storage and office facilities. We could be rendered unable to accept and fulfill customer orders as a result of disasters, epidemics, business interruptions or other similar events. Some of our inventory and manufacturing facilities are located in areas that are susceptible to harsh weather, and the production of certain of our products is concentrated in a few geographic areas. In addition, we store chemicals used in the equipment for quick freezing of fruit or used for cooling processes during ingredient processing, and our storage of these chemicals could lead to risk of leaks, explosions or other events. Although we have a business continuity plan, we cannot provide assurance that our business continuity plan will address all of the issues we may encounter in the event of a disaster or other unanticipated issue. Our business interruption insurance may not adequately compensate us for losses that may occur from any of the foregoing. In the event that a natural disaster, or other catastrophic event were to destroy any part of any of our facilities or interrupt our operations for any extended period of time, or if harsh weather or epidemics prevent us from delivering products in a timely manner, our business, financial condition and results of operations could be materially and adversely affected. In addition, if we fail to maintain our labor force at one or more of our facilities, we could experience delays in production or delivery of our products, which could also have a material adverse effect on our business, financial condition and results of operations.
| SUNOPTA INC. | 27 | December 31, 2016 10-K |
Technology failures could disrupt our operations and negatively impact our business
In the normal course of business, we rely on information technology systems to process, transmit, and store electronic information. For example, our production and distribution facilities and inventory management utilize information technology to increase efficiencies and limit costs. Information technology systems are also integral to the reporting of our results of operations. Furthermore, a significant portion of the communications between, and storage of personal data of, our personnel, customers, consumers and suppliers depends on information technology. Our information technology systems may be vulnerable to a variety of interruptions, as a result of updating our enterprise platform or due to events beyond our control, including, but not limited to, natural disasters, terrorist attacks, telecommunications failures, computer viruses, hackers, and other security issues. These events could compromise our confidential information, impede or interrupt our business operations, and may result in other negative consequences, including remediation costs, loss of revenue, litigation and reputational damage. Furthermore, if a breach or other breakdown results in disclosure of confidential or personal information, we may suffer reputational, competitive and/or business harm. To date, we have not experienced a material breach of cyber security. While we have implemented administrative and technical controls and taken other preventive actions to reduce the risk of cyber incidents and protect our information technology, they may be insufficient to prevent physical and electronic break-ins, cyber-attacks or other security breaches to our computer systems, which could have a material adverse effect on our business, financial condition or results of operations.
If we lose the services of our key management, our business could suffer
Our prospects depend to a significant extent on the continued service of our key executives, and our continued growth depends on our ability to identify, recruit and retain key management personnel. We are also dependent on our ability to continue to attract, retain and motivate our personnel. We do not typically carry key person life insurance on our executive officers. If we lose the services of our key management or fail to identify, recruit and retain key personnel, our business, financial condition or results of operations may be materially and adversely impacted.
If we face labor shortages or increased labor costs, our results of operations and our growth could be adversely affected
Labor is a significant component of the cost of operating our business. Our ability to meet our labor needs while controlling labor costs is subject to external factors, such as employment levels, prevailing wage rates, minimum wage legislation, changing demographics, health and other insurance costs and governmental labor and employment requirements. In the event of increasing wage rates, if we fail to increase our wages competitively, the quality of our workforce could decline, while increasing our wages could cause our earnings to decrease. If we face labor shortages or increased labor costs because of increased competition for employees from our competitors and other industries, higher employee-turnover rates, unionization of farm workers or increases in the federal- or state-mandated minimum wage, change in exempt and non-exempt status, or other employee benefits costs (including costs associated with health insurance coverage or workers’ compensation insurance), our operating expenses could increase and our business, financial condition and results of operations could be materially and adversely affected.
Technological innovation by our competitors could make our food products less competitive
Our competitors include major food ingredient and consumer-packaged food companies that also engage in the development and sale of food and food ingredients. Many of these companies are engaged in the development of food ingredients and other packaged food products and frequently introduce new products into the market. Existing products or products under development by our competitors could prove to be more effective or less costly than our products, which could have a material adverse effect on the competitiveness of our products and our business.
We rely on protection of our intellectual property and proprietary rights
Our success depends in part on our ability to protect our intellectual property rights. We rely primarily on patent, copyright, trademark and trade secret laws to protect our proprietary technologies. Our policy is to protect our technology by, among other things, filing patent applications for technology relating to the development of our business in the U.S. and in selected foreign jurisdictions.
Our trademarks and brand names are registered in the U.S., Canada and other jurisdictions. We intend to keep these filings current and seek protection for new trademarks to the extent consistent with business needs. We also rely on trade secrets and proprietary know-how and confidentiality agreements to protect certain of the technologies and processes that we use.
| SUNOPTA INC. | 28 | December 31, 2016 10-K |
The failure of any patents, trademarks, trade secrets or other intellectual property rights to provide protection to our technologies would make it easier for our competitors to offer similar products, which could result in lower sales or gross margins.
Changes in laws or regulations governing foreign trade or taxation could adversely affect our business
Changes in governmental laws or regulations affecting foreign trade or taxation, or the introduction of new laws or regulations, may have a direct or indirect effect on our business or those of our customers or suppliers. Such changes could increase the costs of doing business for the Company, our customers, or suppliers, or restrict our actions, causing our results of operations to be adversely affected.
On January 20, 2017, Donald J. Trump was inaugurated as the President of the United States. President Trump has expressed an intention to change existing trade agreements, such as the North American Free Trade Agreement (“NAFTA”). Any changes to NAFTA could impact our Mexican and Canadian operations. President Trump has also indicated an intention to request that Congress make significant changes to U.S. tax laws. Changes in U.S. political, regulatory and economic conditions or laws and policies governing U.S. tax laws and foreign trade with countries where we or our customers operate, in particular Canada, Mexico and Europe, could adversely affect our operating results and our business.
Our operations are influenced by agricultural policies
We are affected by governmental agricultural policies such as price supports and acreage set aside programs and these types of policies may affect our business. The production levels, markets and prices of the grains and other raw products that we use in our business are materially affected by government programs, which include acreage control and price support programs of the USDA. Revisions in these and other comparable programs, in the U.S. and elsewhere, could have a material and adverse effect on our business, financial condition or results of our operations.
We are subject to substantial environmental regulation and policies
We are, and expect to continue to be, subject to substantial federal, state, provincial and local environmental regulation. Some of the key environmental regulations to which we are subject include air quality regulations of the EPA and certain city/state/provincial air pollution control groups, waste treatment/disposal regulations, sewer regulations under agreements with local city sewer districts, regulations governing hazardous substances, storm water regulations and bioterrorism regulations. For a more detailed summary of the environmental regulations and policies to which we are subject, see “Item 1. Business—Regulation” of this report. Our business also requires that we have certain permits from various state, provincial and local authorities related to air quality, storm water discharge, solid waste, land spreading and hazardous waste.
In the event that our safety procedures for handling and disposing of potentially hazardous materials in certain of our businesses were to fail, we could be held liable for any damages that result, and any such liability could exceed our resources. We may be required to incur significant costs to comply with environmental laws and regulations in the future. In addition, changes to environmental regulations may require us to modify our existing plant and processing facilities and could significantly increase the cost of those operations.
The foregoing environmental regulations, as well as others common to the industries in which we participate, can present delays and costs that can adversely affect business development and growth. If we fail to comply with applicable laws and regulations, we may be subject to civil remedies, including fines, injunctions, recalls or seizures, as well as potential criminal sanctions, which could have a material adverse effect on our business, financial condition and results of operations. In addition, any changes to current regulations may impact the development, manufacturing and marketing of our products, and may have a negative impact on our future results.
Climate change laws could have an impact on our financial condition and results of operations
Legislative and regulatory authorities in the U.S., Canada and internationally will likely continue to consider numerous measures related to climate change and greenhouse gas emissions. In order to produce, manufacture and distribute our products, we and our suppliers use fuels, electricity and various other inputs that result in the release of greenhouse gas emissions. Concerns about the environmental impacts of greenhouse gas emissions and global climate change may result in environmental taxes, charges, regulatory schemes, assessments or penalties, which could restrict or negatively impact our operations, as well as those of our suppliers, who would likely pass all or a portion of their costs along to us. We may not be able to pass any resulting cost increases along to our customers. Any enactment of laws or passage of regulations regarding greenhouse gas emissions or other climate change laws by the U.S., Canada or any other international jurisdiction where we conduct business could materially and adversely affect our business, financial condition and results of operations.
| SUNOPTA INC. | 29 | December 31, 2016 10-K |
Fluctuations in exchange rates, interest rates and commodity prices could adversely affect our business, financial condition, results of operations or liquidity
We are exposed to foreign exchange rate fluctuations as our non-U.S.-based operations are translated into U.S. dollars for financial reporting purposes and we also sell product in currencies that are different from the currency used to purchase materials, or process finished goods. We are exposed to changes in interest rates as a significant portion of our debt bears interest at variable rates. We are exposed to price fluctuations on a number of commodities as we hold inventory and enter into transactions to buy and sell products in a number of markets. Additional qualitative and quantitative disclosures about these risks can be found in “Item 7A. Quantitative and Qualitative Disclosures About Market Risk” of this report. As a result of these exposures, fluctuations in exchange rates, interest rates and certain commodities could adversely affect our business, financial condition, results of operations or liquidity.
Our international operations expose us to additional risks
We source our products from numerous suppliers and growers from around the world. Outside of the U.S. and Canada, we have processing, packaging and warehousing facilities in Mexico, Europe, Africa and Asia. Our international operations and customers expose us to certain risks inherent in doing business abroad, including:
-
exposure to local economic conditions, expropriation and nationalization, foreign exchange rate fluctuations and currency controls;
-
withholding and other taxes on remittances and other payments by subsidiaries;
-
investment restrictions or requirements;
-
export and import restrictions;
-
compliance with anti-corruption and anti-bribery laws, including the U.S. Foreign Corrupt Practices Act;
-
compliance with export controls and economic sanctions laws;
-
increases in working capital requirements related to long supply chains; and
-
disruptions in our supply chain from unforeseen events, such as natural disasters, terrorism and political and civil unrest.
For example, we have significant operations in Mexico, including a facility in the State of Michoacán, near areas where there have been incidents of unrest, which may heighten the risks of our international operations described above.
As we continue to expand our business globally, we may have difficulty anticipating and effectively managing these and other risks that our international operations may face, which may adversely impact our business, financial condition and results of operations. In addition, any acquisition of businesses with operations outside of the U.S. and Canada may exacerbate this risk.
A significant portion of our assets and certain of our executive officers and directors are located outside of the U.S.; it may be difficult to effect service of process and enforce legal judgments upon us and certain of our executive officers and directors
A significant portion of our assets and certain of our executive officers and directors are located outside of the U.S. As a result, it may be difficult to effect service of process within the U.S. and enforce judgment of a U.S. court obtained against us or our executive officers and directors. Particularly, our stakeholders may not be able to:
-
effect service of process within the U.S. on us or certain of our executive officers and directors;
-
enforce judgments obtained in U.S. courts against us or certain of our executive officers and directors based upon the civil liability provisions of the U.S. federal securities laws;
| SUNOPTA INC. | 30 | December 31, 2016 10-K |
enforce, in a court outside of the U.S., judgments of U.S. courts based on the civil liability provisions of the U.S. federal securities laws; or
bring an original action in a court outside of the U.S. to enforce liabilities against us or any of our executive officers and directors based upon the U.S. federal securities laws.
Risks Related to Our Indebtedness
Our level of indebtedness could adversely affect our financial condition and prevent us from fulfilling our debt obligations
Our level of indebtedness could adversely affect our business, financial condition or results of operations, including, without limitation, impairing our ability to obtain additional financing for working capital, capital expenditures, debt service requirements or other general corporate purposes. In addition, we will have to use a substantial portion of our cash flow to pay principal, premium (if any) and interest on our indebtedness which will reduce the funds available to us for other purposes. If we do not generate sufficient cash flows to satisfy our debt service obligations, we may have to undertake alternative financing plans, such as refinancing or restructuring our debt, selling assets, reducing or delaying capital investments or seeking to raise additional capital. Our level of indebtedness will also make us more vulnerable to economic downturns and adverse industry conditions, and may compromise our ability to capitalize on business opportunities and to react to competitive pressures as compared to our competitors.
Our debt and equity agreements restrict how we may operate our business, and our business may be materially and adversely affected if these restrictions prevent us from implementing our business plan
The agreements governing our debt and preferred equity instruments contain restrictive covenants that limit the discretion of our management with respect to certain business matters. These covenants place restrictions on, among other things, our ability to obtain additional debt financing, to create other liens, to complete a merger, amalgamation or consolidation, to make certain distributions or make certain payments, investments and guarantees and to sell or otherwise dispose of certain assets. These restrictions may hinder our ability to execute on our growth strategy or prevent us from implementing parts of our business plan.
Our business may be materially and adversely affected if we are unable to renew the Global Credit Facility
The Global Credit Facility matures on February 10, 2021. We may not be able to renew this facility to the same level or size, or on terms as favorable as at present. A reduced facility may impact our ability to finance our business, requiring us to scale back our operations and our use of working capital. Alternatively, obtaining credit on less favorable terms would have a direct impact on our profitability and operating flexibility.
Our business could be materially and adversely affected if we are unable to meet the financial covenants of the Global Credit Facility
Our ability to comply with the financial covenants under the Global Credit Facility agreement will depend on the success of our businesses, our operating results, and our ability to achieve our financial forecasts. Various risks uncertainties and events beyond our control could affect our ability to comply with the financial covenants and terms of the Global Credit Facility agreement. Failure to comply with our financial covenants and other terms could result in an event of default and the acceleration of amounts owing under this agreement, unless we were able to negotiate a waiver. The lenders could condition any such waiver on an amendment to the agreement on terms (including, but not limited to, the payment of consent fees) that may be unfavorable to us. If we are unable to negotiate a covenant waiver or replace or refinance the Global Credit Facility agreement on favorable terms or at all, our business, financial condition or results of operations will be materially and adversely impacted.
Risks Related to Business Acquisitions and Divestures
We may not be able to effectively manage our growth and integrate acquired companies
From time to time we may pursue acquisition opportunities that are consistent with our overall growth strategy. In 2015, we completed the Sunrise Acquisition, which was the largest acquisition in the history of our company. Our ability to effectively integrate Sunrise, as well as other past or future business acquisitions, including our ability to realize potentially available marketing opportunities and cost savings in a timely and efficient manner will have a direct impact on our future results. We may encounter problems in connection with the integration of any new businesses, such as challenges relating to the following:
| SUNOPTA INC. | 31 | December 31, 2016 10-K |
-
integration of an acquired company’s products into our product mix;
-
the amount of cost savings that may be realized as a result of our integration of an acquired product or business;
-
unanticipated quality and production issues with acquired products;
-
adverse effects on business relationships with suppliers and customers;
-
diversion of management attention;
-
integrating acquired operations that have management teams and company cultures that differ from our own;
-
difficulty with personnel and loss of key employees;
-
implementation of an integrated enterprise-wide accounting and information system and consolidation of back office accounting;
-
compatibility of financial control and information systems;
-
exchange rate risk with respect to acquisitions outside the U.S.;
-
potential for patent and trademark claims or other litigation against or involving the acquired company;
-
integration of businesses that operate in new geographic areas, including difficulties in identifying and gaining access to customers in new markets; and
-
in the case of foreign acquisitions, uncertainty regarding foreign laws and regulations and difficulty integrating operations and systems as a result of cultural, systems and operational differences.
If we experience any of these problems in the integration of acquisitions, they could have a material and adverse effect on our business, financial condition or results of operations.
We may not have accurately estimated the benefits or synergies to be realized from business acquisitions
Our expected benefits and synergies from acquired businesses may not be realized if our cash flow estimates associated with the assets of those businesses are materially inaccurate or if we fail to identify operating problems or liabilities prior to acquisition. We perform inspections of the assets to be acquired, which we believe to be generally consistent with industry practices. However, the accuracy of our assessments of the assets and our estimates are inherently uncertain. There could also be environmental or other problems that were not discovered in the course of our due diligence and inspections. If problems or risks are identified after the closing of an acquisition, there may be limited recourse against the former owners.
Business acquisitions may expose us to unknown liabilities
We will be subject to all of the liabilities of acquired businesses, including legal and administrative proceedings. If there are unknown liabilities or other obligations, including contingent liabilities, our business could be materially affected. Moreover, to the extent there is indemnification against losses and liabilities in these businesses acquisition agreements, the amount of indemnification available could be limited and may not be sufficient to cover the actual losses we may suffer.
Business acquisitions could result in unexpected disruptions of our business
In response to an acquisition, the acquired business’s customers may cease or reduce their business with the acquired business or some of our customers may cease or reduce their business with us, which could negatively affect our combined operations. Similarly, current or prospective employees of us or of the acquired businesses may experience uncertainty about their future roles with the combined entity. This may adversely affect our ability to attract and retain key management, marketing and technical personnel. In addition, the diversion of the attention of our respective management teams away from day-to-day operations during the pendency of the business acquisition could have an adverse effect on our financial condition and operating results.
| SUNOPTA INC. | 32 | December 31, 2016 10-K |
The possible future divestiture of businesses could impact our profitability
We may, from time to time, divest businesses that are no longer a strategic fit or no longer meet our growth or profitability targets. Our profitability may be impacted by gains or losses on the sales of such businesses, or lost operating income or cash flows from such businesses. Additionally, we may be required to record asset impairment or restructuring charges related to divested businesses, or indemnify buyers for liabilities, which may reduce our profitability and cash flows. We may also not be able to negotiate such divestitures on terms acceptable to us. Such potential divestitures will require management resources and may divert management’s attention from our day-to-day operations. If we are not successful in divesting such businesses, our business could be harmed.
Risks Related to Ownership of our Common Shares
Our operating results and share price are subject to significant volatility
Our net sales and operating results may vary significantly from period to period due to:
-
changes in our customers and/or their demand;
-
changes in our operating expenses;
-
management’s ability to execute our business strategies focused on improved operating earnings;
-
organizational and personnel changes;
-
interruption in operations at our facilities;
-
product recalls or market withdrawals;
-
legal and administrative cases (whether civil, such as environmental or product related, or criminal), settlements, judgments and investigations;
-
foreign currency fluctuations;
-
supply shortages or commodity price fluctuations; and
-
general economic conditions.
In addition, our share price may be highly volatile compared to larger public companies. Certain announcements could have a significant effect on our share price, including announcements regarding:
-
fluctuations in financial performance from period to period;
-
mergers, acquisitions and/or divestitures, either by us or key competitors;
-
changes in key personnel;
-
strategic partnerships or arrangements;
-
litigation and governmental inquiries;
-
changes in governmental regulation and policy;
-
patents or proprietary rights;
| SUNOPTA INC. | 33 | December 31, 2016 10-K |
-
changes in consumer preferences and demand;
-
new financings; and
-
general market conditions.
Higher volatility increases the chance of larger than normal price swings which reduces predictability in the price of our common shares and could impair investment decisions. In addition, price and volume trading volatility in the stock markets can have a substantial effect on our share price, frequently for reasons other than our operating performance. These broad market fluctuations could adversely affect the market price of our common shares.
In the past, following periods of volatility in the overall market and the market price of a company’s securities, securities class action litigation has often been instituted against these companies. Such litigation, if instituted against us, could result in substantial costs and a diversion of our management’s attention and resources.
Our debt instruments restrict, and our future debt instruments may restrict, our ability to pay dividends to our shareholders, and we do not currently intend to pay any cash dividends on our common shares in the foreseeable future; therefore, our shareholders may not be able to receive a return on their common shares until their shares are sold
We have never paid or declared any cash dividends on our common shares. We do not anticipate paying any cash dividends on our common shares in the foreseeable future because, among other reasons, we currently intend to retain any future earnings to finance the growth of our business. In addition, the covenants included in our debt instruments, and the covenants to be included in our future debt instruments may restrict our ability to receive cash from our subsidiaries and pay dividends on our common shares. The future payment of dividends will be dependent on factors such as these covenant restrictions, cash on hand, or achieving and maintaining profitability, the financial requirements to fund growth, our general financial condition and other factors the Board may consider appropriate in the circumstances. Until we pay dividends, which we may never do, our shareholders will not receive a return on their common shares until their shares are sold.
The future issuance of additional common shares in connection with the exchange of convertible preferred stock, exercise of stock options, participation in our employee stock purchase plan and issuance of additional securities could dilute the value of our common shares
We have unlimited common shares authorized but unissued. Our articles of amalgamation authorize us to issue these common shares, and we may also issue options, rights, warrants and appreciation rights relating to common shares for consideration and on terms and conditions established by the Board in its sole discretion.
The exchange of convertible preferred stock, exercise of stock-based awards, participation in our employee stock purchase plan, and issuance of additional securities in connection with acquisitions or otherwise could result in dilution in the value of our common shares and the voting power represented thereby. Furthermore, to the extent common shares are issued pursuant to the exchange of convertible preferred stock, exercise of stock-based awards, participation in our employee stock purchase plan and issuance of additional securities, our share price may decrease due to the additional amount of common shares available in the market. The subsequent sales of these shares could encourage short sales by our shareholders and others, which could place further downward pressure on our share price. Moreover, the holders of our stock options may hedge their positions in our common shares by short selling our common shares, which could further adversely affect our stock price.
If securities or industry research analysts do not publish or cease publishing research or reports about our business or if they issue unfavorable commentary or downgrade our common shares, our share price and trading volume could decline
The trading market for our common shares relies in part on the research and reports that securities and industry research analysts publish about us, our industry, our competitors and our business. We do not have any control over these analysts. Our share price and trading volumes could decline if one or more securities or industry analysts downgrade our common shares, issue unfavorable commentary about us, our industry or our business, cease to cover our Company or fail to regularly publish reports about us, our industry or our business.
Item 1B. Unresolved Staff Comments
None.
| SUNOPTA INC. | 34 | December 31, 2016 10-K |
Item 2. Properties
The following table lists the location, description, ownership and segment of our principal properties:
| Location | Facility Description | Owned/ Leased | Lease Expiry Date |
| Mississauga, Ontario(1) | Corporate head office | Leased | June 2021 |
| Edina, Minnesota(1) | Corporate administrative office and Consumer Products head office | Leased | September 2022 |
| Hope, Minnesota(2) | Grain processing and Raw Material Sourcing and Supply head office | Owned | |
| Breckenridge, Minnesota(2) | Grain processing and distribution | Owned | |
| Moorhead, Minnesota(2) | Grain processing and distribution | Owned | |
| Crookston, Minnesota(2) | Grain processing, warehouse and distribution | Owned | |
| Grace City, North Dakota(2) | Grain processing, warehouse and distribution | Owned | |
| Wahpeton, North Dakota(2) | Grain processing, warehouse and distribution | Owned | |
| Wahpeton, North Dakota(2) | Grain storage | Owned | |
| Blooming Prairie, Minnesota(2) | Grain storage | Owned | |
| Ellendale, Minnesota(2) | Grain storage | Owned | |
| Scotts Valley, California(2),(3) | Sales and administrative office | Leased | February 2021 |
| Amsterdam, The Netherlands(2) | Sales and International Sourcing and Supply head office | Leased | October 2022 |
| Middenmeer, The Netherlands(2) | Cocoa processing | Leased | December 2017 |
| Cavaillon, France(2) | Sales office | Leased | July 2022 |
| Dalian, China(2) | Storage | Leased | November 2024 |
| Dalian, China(2) | Sales office | Leased | December 2024 |
| Addis Ababa, Ethiopia(2) | Coffee processing and warehouse | Leased | March 2018 |
| Humera, Ethiopia(2) | Grain processing, warehouse and storage | Leased | May 2017 |
| Silistra, Bulgaria(2) | Grain processing | Owned | |
| Varna, Bulgaria(2) | Sales and administrative office | Leased | July 2019 |
| Heuvelton, New York(2)(4) | Ingredient processing | Owned | |
| Cresco, Iowa(2) | Grain milling | Owned | |
| South Gate, California(3) | Fruit ingredient processing, warehouse and distribution | Leased | June 2020 |
| Alexandria, Minnesota(3) | Aseptic processing and packaging | Owned | |
| Alexandria, Minnesota(3) | Ingredient processing | Owned | |
| Alexandria, Minnesota(3) | Storage | Owned | |
| Modesto, California(3) | Aseptic processing and packaging | Leased | May 2019 |
| San Bernardino, California(3)(5) | Beverage processing, warehouse and distribution | Leased | February 2020 |
| Allentown, Pennsylvania(3) | Resealable pouch and aseptic beverage processing, packaging and distribution | Leased | April 2027 |
| Allentown, Pennsylvania(3) | Warehouse | Leased | November 2025 |
| Omak, Washington(3) | Fruit snack processing, warehouse and distribution | Leased | May 2017 |
| Carson City, Nevada(3) | Nutrition bar processing, warehouse and distribution | Leased | December 2020 |
| St. David’s, Ontario(3) | Fruit snack processing, warehouse and distribution | Leased | December 2020 |
| Edwardsville, Kansas(3) | Frozen fruit processing, warehouse and distribution | Owned | |
| Oxnard, California(3) | Frozen fruit processing, warehouse and distribution | Owned | |
| Oxnard, California(3) | Frozen fruit processing, warehouse and distribution | Leased | September 2017 |
| Santa Maria, California(3) | Frozen fruit processing, warehouse and distribution | Leased | December 2017 |
| Placentia, California(3) | Sales and administration office | Leased | January 2019 |
| Jacona, Mexico(3) | Frozen fruit processing, warehouse and distribution | Owned |
| (1) |
Included in Corporate Services. | |
| (2) |
Included in Global Ingredients. | |
| (3) |
Included in Consumer Products. | |
| (4) |
Heuvelton, New York, facility was closed on January 10, 2017. | |
| (5) |
San Bernardino, California, facility was closed on December 28, 2016. |
| SUNOPTA INC. | 35 | December 31, 2016 10-K |
Executive Offices
Our executive head office is located at 2233 Argentia Drive, Suite 401, Mississauga, Ontario.
Item 3. Legal Proceedings
Employment Matter
In April 2013, a class-action complaint, in the case titled De Jesus, et al. v. Frozsun, Inc. d/b/a Frozsun Foods, alleging various wage and hour violations was filed against Sunrise Growers, Inc. (then named Frozsun, Inc.) in California Superior Court, Santa Barbara County seeking damages, equitable relief and reasonable attorneys’ fees. This case includes claims for failure to pay all hours worked, failure to pay overtime wages, meal and rest period violations, waiting-time penalties, improper wage statements and unfair business practices. The putative class includes approximately 8,500 to 9,000 non-exempt hourly employees from Sunrise’s production facilities in Santa Maria and Oxnard, California. The parties are currently engaged in pre-class certification discovery. The Company is unable to estimate any potential liabilities relating to this proceeding, and any such liabilities could be material.
From time to time, we are involved in litigation incident to the ordinary conduct of our business. For a discussion of certain legal proceedings, see note 21 of the consolidated financial statements included elsewhere in this report.
Item 4. Mine Safety Disclosures
Not Applicable.
| SUNOPTA INC. | 36 | December 31, 2016 10-K |
PART II
Item 5. Market for Registrant’s Common Equity, Related Stockholder Matters and Issuer Purchases Equity Securities
Our common shares trade in U.S. dollars on The NASDAQ Global Select Market under the symbol “STKL”, and in Canadian dollars on the TSX under the symbol “SOY”.
The following table indicates the high and low sales prices for our common shares for each quarterly period during the past two fiscal years on the NASDAQ and TSX. The prices shown are representative inter-dealer prices, do not include retail mark-ups, markdowns or commissions and do not necessarily reflect actual transactions.
| NASDAQ | TSX | |||||||||||
| High | Low | High | Low | |||||||||
| $ | $ | C$ | C$ | |||||||||
| Fiscal 2016 | ||||||||||||
| First quarter | 6.77 | 4.12 | 9.88 | 5.38 | ||||||||
| Second quarter | 5.69 | 3.16 | 7.18 | 4.14 | ||||||||
| Third quarter | 7.17 | 4.22 | 9.39 | 5.47 | ||||||||
| Fourth quarter | 7.70 | 5.73 | 10.09 | 7.58 | ||||||||
| Fiscal 2015 | ||||||||||||
| First quarter | 12.04 | 9.34 | 15.05 | 11.67 | ||||||||
| Second quarter | 11.61 | 9.69 | 14.25 | 11.78 | ||||||||
| Third quarter | 11.39 | 4.50 | 14.91 | 5.98 | ||||||||
| Fourth quarter | 7.40 | 4.61 | 9.88 | 6.04 | ||||||||
As at December 31, 2016, we had approximately 450 shareholders of record. We have never paid cash dividends on our common stock and do not anticipate paying dividends in the foreseeable future. Our future dividend policy will depend on our earnings, capital requirements and financial condition, requirements of the financial agreements to which we are then a party and other factors considered relevant by our board of directors. Additionally, the terms of our existing debt instruments include covenants that restrict our ability to pay dividends to shareholders. The receipt of cash dividends by U.S. shareholders from a Canadian corporation, such as we are, may be subject to Canadian withholding tax.
Equity Compensation Plan Information
The following table provides information as at December 31, 2016 with respect to our common shares that may be issued under existing equity compensation plans.
| Number of | |||||||||
| Securities to be | Weighted- | Number of Securities | |||||||
| Issued Upon | Average Exercise | Remaining Available for | |||||||
| Exercise of | Price of | Future Issuance Under | |||||||
| Outstanding | Outstanding | Equity Compensation | |||||||
| Options, | Options, | Plans (Excluding | |||||||
| Warrants, and | Warrants and | Securities Reflected in | |||||||
| Rights | Rights | Column (a)) | |||||||
| Plan Category | (a) | (b) | (c) | ||||||
|
Equity compensation plans approved by security holders: |
|||||||||
|
Stock incentive plans |
4,579,850 | $ | 7.12 | 1,554,218 | |||||
|
Employee share purchase plan |
N/A | N/A | 1,173,960 | ||||||
|
Total |
4,579,850 | $ | 7.12 | 2,728,178 |
| SUNOPTA INC. | 37 | December 31, 2016 10-K |
Shareholder Return Performance Graph
This performance graph shall not be deemed “filed” for purposes of Section 18 of f the Exchange Act or incorporated by reference into any filing of SunOpta under the Securities Act of 1933, as amended, or the Exchange Act, except as shall be expressly set forth by specific reference in such filing.
The following graph compares the five-year cumulative shareholder return on our common shares to the cumulative total return of the S&P/TSX Composite and the NASDAQ Industrial Indices for the period which commenced December 31, 2011.
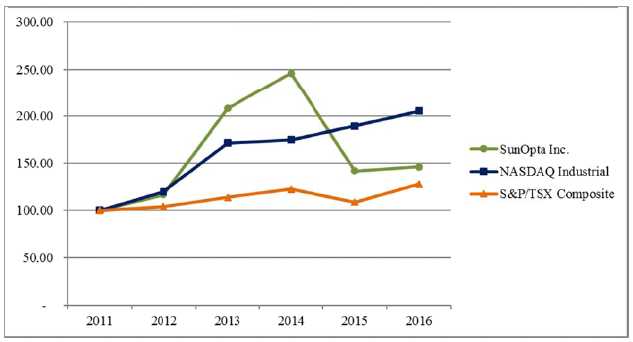
| 2011 | 2012 | 2013 | 2014 | 2015 | 2016 | |||||||||||||
| SunOpta Inc. | 100.00 | 116.80 | 207.68 | 245.85 | 141.91 | 146.27 | ||||||||||||
| Nasdaq Industrial Index | 100.00 | 119.70 | 171.35 | 174.76 | 189.15 | 205.00 | ||||||||||||
| S&P/TSX Composite Index | 100.00 | 104.00 | 113.94 | 122.39 | 108.82 | 127.88 |
Assumes that $100.00 was ivested in our common shares and in each idex on December 31, 2011.
| SUNOPTA INC. | 38 | December 31, 2016 10-K |
Item 6. Selected Financial Data
The following information has been derived from financial statements prepared in accordance with accounting principles generally accepted in the United States of America (“U.S. GAAP”). The information set forth below is not necessarily indicative of results of future operations, and should be read in conjunction with the consolidated financial statements and related notes thereto prepared in accordance with U.S. GAAP contained in Item 8 of this report, as well as the discussion in Item 7, “Management’s Discussion and Analysis of Financial Condition and Results of Operations”.
| 2016 | 2015(1) | 2014 | 2013(2) | 2012 | |||||||||||
| $ | $ | $ | $ | $ | |||||||||||
|
Revenues |
1,346,731 | 1,145,134 | 1,102,745 | 998,660 | 916,892 | ||||||||||
|
Earnings (loss) from continuing operations attributable to SunOpta Inc. |
(50,618)(3) | (2,996 | ) | 19,295(4) | (8,396) (5) | 17,118 | |||||||||
|
Basic earnings (loss) per share from continuing operations |
(0.61 | ) | (0.04 | ) | 0.29 | (0.13 | ) | 0.26 | |||||||
|
Diluted earnings (loss) per share from continuing operations |
(0.61 | ) | (0.04 | ) | 0.28 | (0.13 | ) | 0.26 | |||||||
|
Total assets |
1,129,558 | 1,219,203 | 640,950 | 705,935 | 707,310 | ||||||||||
|
Bank indebtedness |
201,494 | 159,773 | 78,454 | 126,274 | 120,312 | ||||||||||
|
Long-term debt (including current portion) |
231,087 | 322,995 | 4,581 | 6,139 | 7,066 | ||||||||||
|
Long-term liabilities (including current portion) |
20,854 | 23,052 | 1,086 | 3,205 | 5,457 |
| (1) |
Includes the results of operations of Sunrise Holdings (Delaware), Inc. (acquired October 9, 2015), Niagara Natural Fruit Snack Company Inc. (acquired August 11, 2015) and Citrusource, LLC (acquired March 2, 2015) from the respective dates of acquisition. |
| (2) |
Includes the results of operations of Organic Land Corporation OOD (acquired December 31, 2012) from the date of acquisition. |
| (3) |
Includes a charge for the impairment of goodwill associated with the sunflower reporting unit of $17.5 million, as well as a charge of $13.3 million for the impairment of long-lived assets associated with the closure of facilities located in San Bernardino and Buena Park, California and Heuvelton, New York. |
| (4) |
Includes a charge for the impairment of investment of $8.4 million, as well as a gain on disposal on assets of $1.3 million. |
| (5) |
Includes a charge for the impairment of investment of $21.5 million. |
| SUNOPTA INC. | 39 | December 31, 2016 10-K |
Item 7. Management’s Discussion and Analysis of Financial Condition and Results of Operations
Forward-Looking Financial Information
This Management’s Discussion and Analysis of Financial Condition and Results of Operations (“MD&A”) section provides analysis of our operations and financial position for the fiscal year ended December 31, 2016 and includes information available to March 2, 2017, unless otherwise indicated herein. It is supplementary information and should be read in conjunction with the consolidated financial statements included elsewhere in this report.
Certain statements contained in this MD&A may constitute forward-looking statements as defined under securities laws. Forward-looking statements may relate to our future outlook and anticipated events or results and may include statements regarding our future financial position, business strategy, budgets, litigation, projected costs, capital expenditures, financial results, taxes, plans and objectives. In some cases, forward-looking statements can be identified by terms such as “anticipate”, “estimate”, “intend”, “project”, “potential”, “continue”, “believe”, “expect”, “could”, “would”, “should”, “might”, “plan”, “will”, “may”, “predict”, or other similar expressions concerning matters that are not historical facts. To the extent any forward-looking statements contain future-oriented financial information or financial outlooks, such information is being provided to enable a reader to assess our financial condition, material changes in our financial condition, our results of operations, and our liquidity and capital resources. Readers are cautioned that this information may not be appropriate for any other purpose, including investment decisions.
Forward-looking statements contained in this MD&A are based on certain factors and assumptions regarding expected growth, results of operations, performance, and business prospects and opportunities. While we consider these assumptions to be reasonable, based on information currently available, they may prove to be incorrect. Forward-looking statements are also subject to certain factors, including risks and uncertainties that could cause actual results to differ materially from what we currently expect. These factors are more fully described in the “Risk Factors” section at Item 1A of this Form 10-K.
Forward-looking statements contained in this commentary are based on our current estimates, expectations and projections, which we believe are reasonable as of the current date. You should not place undue importance on forward-looking statements and should not rely upon this information as of any other date. Other than as required under securities laws, we do not undertake to update any forward-looking information at any particular time.
Unless otherwise noted herein, all currency amounts in this MD&A are expressed in U.S. dollars. All tabular dollar amounts are expressed in thousands of U.S. dollars, except per share amounts.
Overview
The composition of our reportable segments is as follows:
-
Global Ingredients aggregates our North American-based Raw Material Sourcing and Supply and European-based International Sourcing and Supply operating segments focused on the procurement and sale of specialty and organic grains and seeds, raw material ingredients, value-added grain- and cocoa-based ingredients, and organic commodities.
-
Consumer Products consists of three main commercial platforms: Healthy Beverages, Healthy Fruit and Healthy Snacks. Healthy Beverages includes aseptic packaged products including non-dairy and dairy beverages, broths and teas; refrigerated premium juices; and shelf-stable juices and functional waters. Healthy Fruit includes individually quick frozen (“IQF”) fruits for retail; IQF and bulk frozen fruit for foodservice; and custom fruit preparations for industrial use. Healthy Snacks includes fruit snacks; nutritional and protein bars; and resealable pouch products.
For a more detailed description of our operating groups and their businesses, please see the “Business” section at Item 1 of this Form 10-K.
Fiscal Year
We operate on a fiscal calendar that results in a given fiscal year consisting of a 52- or 53-week period ending on the Saturday closest to December 31. Fiscal years 2016 and 2015 were each 52-week periods ending on December 31, 2016 and January 2, 2016, respectively, whereas fiscal year 2014 was a 53-week period ending on January 3, 2015. Except as otherwise noted in this MD&A, the impact of the additional week on our results of operations for fiscal year 2014 was insignificant relative to the fiscal years 2016 or 2015.
| SUNOPTA INC. | 40 | December 31, 2016 10-K |
Recent Developments
Strategic Review
On June 27, 2016, we announced that we had engaged external financial and legal advisors to review our operating plan and to evaluate a range of strategic and financial actions that we could undertake to maximize shareholder value. The strategic review arose out of discussions with our largest shareholders, some of which had advocated that we examine value maximization strategies. We also announced that we had engaged a global executive search firm to assist in identifying candidates who could add additional operating, industry and capital markets experience and expertise to our Board of Directors (the “Board”). The strategic review was concluded on October 7, 2016 with our announcement of a strategic partnership with Oaktree Capital Management L.P., a private equity investor (together with its affiliates, “Oaktree”).
On October 7, 2016, Oaktree invested $85.0 million in cumulative, non-participating Series A Preferred Stock (the “Preferred Stock”) of our wholly-owned subsidiary, SunOpta Foods Inc. (“SunOpta Foods”). The shares of Preferred Stock are exchangeable into common shares of SunOpta Inc. in accordance with certain terms and conditions. Net proceeds from the issuance of the Preferred Stock were used to repay $79.0 million of borrowings made under our second lien loan agreement.
Value Creation Plan
We are conducting, with the assistance of Oaktree, a thorough
review of our operations, management and governance, with the objective of
maximizing our ability to deliver long-term value to our shareholders. Through
this review, management and the Board have developed a Value Creation Plan built
on four pillars: portfolio optimization, operational excellence, go-to-market
effectiveness and process sustainability. The statements we make below about the
expected results of the Value Creation Plan, including expected improvements in
earnings, earnings before income taxes, depreciation and amortization (“EBITDA”),
working capital efficiencies, and expected cash flows, are forward-looking
statements. See “Forward-Looking Statements” above. EBITDA is a non-GAAP measure
that management uses when assessing the performance of our operations and our
ability to generate cash flows to fund our cash requirements, including debt
service and capital expenditures.
We are currently targeting implementation of $30 million of productivity-driven
annualized EBITDA enhancements and $20 million of working capital efficiencies,
to be implemented over the coming 12 to 18 months. In the near-term, these
benefits are expected to be offset by structural investments we are making in
the areas of quality, sales, marketing, operations and engineering resources.
Additionally, during 2017 we anticipate incurring non-structural third-party
consulting support, severance, and recruiting costs. The plan also calls for
increased investment in capital upgrades at several manufacturing facilities to
enhance food safety and manufacturing efficiencies. Over time, we expect these
investments to yield additional improvement in EBITDA beyond the $30 million of
initial productivity-driven savings. Recent progress on each of the four pillars
of the Value Creation Plan is highlighted below.
Portfolio Optimization
The focus of the portfolio optimization pillar is to simplify the
business, investing where structural advantages exist, while exiting businesses
or product lines where we are not effectively positioned. During the fourth
quarter of 2016, we announced the closing of our San Bernardino, California,
juice facility, which is expected to be $4 million accretive to EBITDA in 2017.
Following that initial announcement, we continued to evaluate our portfolio
which resulted in the following additional actions:
| SUNOPTA INC. | 41 | December 31, 2016 10-K |
-
Closure of our soy extraction (ingredient) facility in Heuvelton, New York, transferring production to our Alexandria, Minnesota facility.
-
Exited certain varieties of specialty soy and sunflower, as well as frozen edamame.
-
Exited a non-core vegetable brokerage operation.
-
Launched a global organic ingredients portfolio strategy review, which is identifying incremental large ingredient categories for further investment. The incremental growth opportunities include new geographies, new products and new processing capabilities.
During the fourth quarter of 2016, we recognized non-cash
impairment charges of $1.2 million associated with the Heuvelton facility
closure, and $3.4 million of inventory and other reserves to reflect the exit of
non-core business lines. We intend to continue to proactively manage our
business portfolio to identify opportunities to drive EBITDA growth.
Operational Excellence
The focus of the operational excellence pillar is to ensure food quality and
safety, coupled with improved operational performance and efficiency. These
efforts are expected to generate productivity improvements in manufacturing,
procurement and logistics. With the assistance of third-party consulting
support, we have identified a number of broad-based savings opportunities to be
implemented and realized over 2017 and 2018. Recent activities include:
-
Launched network-wide upgrades to worker safety and food quality programs, with the goal of becoming the leader in safety and quality across the healthy food industry.
-
Launched a productivity enhancement program that is systematically evaluating all manufacturing facilities, supply chain, and procurement processes to identify productivity cost savings. As a result of these efforts, we are targeting $30 million in annualized EBITDA improvements to be implemented over the next 12 to 18 months.
-
Rolled out the “SunOpta Plant Management System”, which consists of a standardized set of operating processes, key performance indicators, and continuous improvement methodologies that will provide improved consistency and productivity performance across the manufacturing network.
-
Launched a working capital optimization program that is targeting $20 million of cash flow enhancements.
Go-to-Market Effectiveness
The focus of the go-to-market effectiveness pillar is to optimize customer and
product mix in existing sales channels, and identify and penetrate new
high-potential sales channels. We expect efforts under this pillar to improve
revenue growth and profitability over time. Early in 2017, we re-aligned our
go-to-market approach, hiring key talent to lead foodservice and retail sales,
as well as adding new marketing resources. We also launched a sales force
effectiveness program that has already started to generate results. Recent
highlights include:
-
Hired a new Senior Vice President of Foodservice Sales and a Senior Vice President of Beverages and Snacks.
-
Secured new business wins in Healthy Beverage, Healthy Fruit and Global Ingredients.
-
Selectively adjusted pricing to enhance margins.
Process Sustainability
The focus of process sustainability is to ensure we have the infrastructure,
systems and skills to sustain the business improvements and value captured from
the Value Creation Plan. In February 2017, we executed an organizational
redesign focused on streamlining and simplifying the business, investing in
systems and processes to ensure each function has the tools in place to achieve
our goals. Recent initiatives include:
-
Developed a plan to increase capital engineering, plant engineering, and process engineering capabilities that is targeted to enhance food safety, product flow and productivity performance.
-
Created a centralized Consumer Products supply chain team to manage sales and operations planning (“S&OP”), warehousing and distribution.
-
Launched a comprehensive S&OP program to improve supply/demand planning, which is expected to reduce inventory while improving customer service.
-
Initiated a program to push centralized cost accounting resources into manufacturing facilities to improve the accuracy of manufacturing-related financial data.
| SUNOPTA INC. | 42 | December 31, 2016 10-K |
Governance and Management Transitions
Effective February 6, 2017, David Colo was appointed President and Chief Executive Officer (“CEO”) of SunOpta. In conjunction with this appointment, Mr. Colo also became a member of the Board. On November 11, 2016, Hendrik Jacobs resigned from his positions as President, CEO, and director. Director Katrina Houde served as interim CEO prior to the appointment of Mr. Colo. Ms. Houde will continue her position on the Board following Mr. Colo’s appointment.
On October 7, 2016, we increased the size of the Board to nine directors and appointed two Oaktree-nominated independent directors, Dean Hollis and Al Bolles, Ph.D., to the Board. Also on October 7, 2016, Brendan Springstubb was appointed to the Board to replace Douglas Greene who resigned as a director. Mr. Springstubb is a Principal at Engaged Capital LLC, one of our largest shareholders. On October 9, 2016, Alan Murray stepped down from the Board and was replaced as Chair of the Board by Mr. Hollis.
On January 19, 2017, Gregg Tanner was appointed to the Board to fill the vacancy created by the resignation of director Jay Amato.
Rationalization of Soy and Juice Operations
On December 27, 2016, the Board approved the closure of our soy extraction facility in Heuvelton, New York. We determined that our ingredients processing facility in Alexandria, Minnesota, could absorb the production volume from the Heuvelton facility, while continuing to meet the needs of our customers. Based on the location and use of Heuvelton facility, we recorded an impairment loss of $1.2 million in the fourth quarter of 2016, to write down the carrying value of the associated long-lived assets to a nominal salvage value. The closure of the Heuvelton facility occurred on January 10, 2017.
In addition, one of our customers intends to move its private label soy- and rice-based aseptic beverage business to another supplier commencing in the second quarter of 2017. This business represented approximately 4% of the revenues from our Consumers Products segment and approximately 3% of our consolidated revenues for the year ended December 31, 2016.
On November 8, 2016, the Board approved the closure of our San Bernardino, California juice facility, after determining that it would be more beneficial to transfer our juice production from the facility to contract manufacturers with whom we have ongoing relationships, rather than make further capital investments in support of the bottling or extraction areas of the facility. These capital investments would have been necessary to satisfy packaging format changes demanded by the facility’s largest customer and to address shortfalls in contracting sufficient supply of raw citrus fruit for the upcoming season to allow for effective and efficient use of the facility’s extraction capabilities. In the third quarter of 2016, we recorded an impairment loss of $10.3 million to write down the carrying value of the long-lived assets associated with the facility. The closure of the San Bernardino facility occurred on December 28, 2016. On February 28, 2017, we incurred approximately $3.0 million of additional costs related to the early termination of equipment leases associated with the facility, which will be recognized in other expense in the first quarter of 2017.
Recall of Certain Roasted Sunflower Kernel Products
During the second quarter of 2016, we announced a voluntary recall of certain roasted sunflower kernel products produced at our Crookston, Minnesota facility due to potential contamination with Listeria monocytogenes bacteria. During the fourth quarter and last three quarters of 2016, we recognized estimated losses of $12.0 million and $40.0 million, respectively, related to this recall. Our estimates are provisional and were determined based on an assessment of the information available up to the date of filing of this report, including a review of customer claims received as of that date and consideration of the extent of potential additional claims that have yet to be received. We have general liability and product recall insurance policies with aggregate limits of $47.0 million under which we are expecting to recover recall-related costs, less applicable deductibles. For the fourth quarter and last three quarters of 2016, we recorded estimated insurance recoveries of $12.0 million and $39.4 million for the losses recognized to-date related to the recall. However, we may not recover amounts equal to the amount of the losses that have been or may be recognized if those losses exceed the coverage available or are excluded under the insurance policies.
As a result of the recall, we have experienced the loss of a number of customers, some of which we believe we can regain once remediation efforts are completed at our sunflower roasting facilities. In addition, we are implementing a series of new food safety and quality processes at these facilities that will require significant capital investment and will have an ongoing impact on the productivity of our roasting operations. Based on an assessment of the effect on future cash flows of lower anticipated sales demand and higher expected production and capital costs, we determined that the impact of the recall on the fair value of our sunflower reporting unit reflected an impairment of the associated goodwill, resulting in a $17.5 million charge recorded in the fourth quarter of 2016. Our assessment, however, determined that the carrying values of the property, plant and equipment and intangible assets of the sunflower reporting unit were recoverable as at December 31, 2016.
| SUNOPTA INC. | 43 | December 31, 2016 10-K |
For more information regarding the recall, see note 4 to the consolidated financial statements in Item 15 of this Form 10-K.
Settlement of Plum Dispute
On July 29, 2016, we entered into a Mutual Release and Settlement Agreement (the “Settlement Agreement”) with Plum, PBC (“Plum”), Campbell Soup Company (“Campbell”), and various other parties. The Settlement Agreement resolved the disputed issues among the parties in connection with the litigation filed by Plum against our wholly-owned subsidiary, SunOpta Global Organic Ingredients, Inc. (“SGOI”), which arose out of a voluntary recall by Plum of certain products manufactured at our Allentown, Pennsylvania facility in 2013 (see Part I, Item 3 “Legal Proceedings” and note 21 to the consolidated financial statements in Item 15 of this Form 10-K).
Pursuant to the terms of the Settlement Agreement, we paid Campbell $5.0 million in cash and will provide Campbell with rebates of up to $4.0 million over a four-year period in connection with Plum’s purchases of pouch products and Campbell’s purchases of aseptic broth products pursuant to manufacturing and supply agreements between the parties and their affiliates. In order for Campbell to obtain the full $4.0 million in rebates, Plum and Campbell must order certain minimum quantities of pouch products and aseptic broth products within each of the designated twelve-month periods over the four-year rebate period. In connection with the Settlement Agreement, we recorded a charge of $9.0 million in the second quarter of 2016, as we believe there is reasonable assurance that the minimum order quantities will be achieved.
Sale of Opta Minerals
On February 11, 2016, Opta Minerals entered into a definitive acquisition agreement, pursuant to which an affiliate of Speyside Equity Fund I LP (“Speyside”) agreed to acquire substantially all of the issued and outstanding shares of Opta Minerals. The acquisition of Opta Minerals by Speyside was completed on April 6, 2016, following a vote of the shareholders of Opta Minerals in favor of the transaction on March 31, 2016.
Upon closing of the transaction, we received aggregate gross proceeds of $4.8 million (C$6.2 million), of which $3.2 million (C$4.2 million) was received in cash, with the remainder received in the form of a $1.5 million (C$2.0 million) subordinated promissory note bearing interest at 2.0% per annum that will mature on October 6, 2018. We incurred direct costs related to the sale of Opta Minerals of $0.8 million. The sale of our equity interest in Opta Minerals was consistent with our objective of divesting our non-core assets in order to become a pure-play healthy and organic foods company. We have no significant continuing involvement with Opta Minerals.
In the fourth quarter of 2015, we recognized a loss on classification of Opta Minerals as a discontinued operation held for sale of $10.5 million, or $7.7 million net of non-controlling interest, to write down the carrying value of Opta Minerals’ net assets to fair value less cost to sell based on estimated net proceeds on sale of approximately $4.5 million as at January 2, 2016. In the first quarter of 2016, we recognized a $0.6 million gain on classification as held for sale which reflected a $1.1 million decline in the carrying value of Opta Minerals’ net assets, partially offset by a $0.5 million reduction in the estimated net proceeds on sale. We have not recognized the results of operations or cash flows of Opta Minerals for the period from April 1, 2016 to the closing of the transaction on April 6, 2016, as these amounts were insignificant to our consolidated results of operations and cash flows. For more information regarding the sale of Opta Minerals, see note 3 to the consolidated financial statements in Item 15 of this Form 10-K.
Five-Year Global Revolving Asset-Based Credit Facility
On February 11, 2016, we entered into a five-year credit agreement for a senior secured asset-based revolving credit facility in the maximum aggregate principal amount of $350 million, subject to borrowing base capacity (the “Global Credit Facility”), as described below under “Liquidity and Capital Resources”.
Acquisition of Sunrise Holdings (Delaware), Inc.
On October 9, 2015, we completed the acquisition of 100% of the issued and outstanding common shares of Sunrise Holding (Delaware), Inc. (“Sunrise”), pursuant to a Purchase and Sale Agreement dated July 30, 2015 (the “Sunrise Acquisition”), for total consideration of $472.7 million in cash. Sunrise is a processor of conventional and organic individually quick frozen fruit in the U.S. The acquisition of Sunrise is aligned with our strategic focus on healthy and organic foods. Sunrise has been included in the Consumer Products operating segment since the date of acquisition. For more information regarding the Sunrise Acquisition, see note 2 to the consolidated financial statements in Item 15 of this Form 10-K.
| SUNOPTA INC. | 44 | December 31, 2016 10-K |
In January 2016, we initiated the consolidation of our frozen fruit processing facilities following the Sunrise Acquisition. Consequently, we transferred all production volume from our Buena Park, California facility into Sunrise’s facilities located in Kansas and California. In 2016, we recognized severance and rationalization costs of $2.4 million related to closure of the Buena Park facility and associated corporate office located in Cerritos, California.
Acquisition of Niagara Natural Fruit Snack Company Inc.
On August 11, 2015, we acquired the net operating assets of Niagara Natural Fruit Snack Company Inc. (“Niagara Natural”), a manufacturer of all-natural fruit snacks. Niagara Natural’s operations are located in the Niagara Region of Ontario. The transaction included a cash purchase price of $6.5 million, subject to certain post-closing adjustments, plus contingent consideration of up to approximately $2.8 million based on specific performance targets. The fair value of the contingent consideration obligation was determined to be $2.3 million as at the acquisition date. Niagara Natural is a strong strategic fit within our core consumer products strategy and has been included in the Consumer Products operating segment since the date of acquisition. For more information regarding the acquisition of Niagara Natural, see note 2 to the consolidated financial statements in Item 15 of this Form 10-K.
On May 5, 2016, we entered an agreement with the owners of Niagara Natural to settle the contingent consideration obligation in exchange for a one-time cash payment of $0.6 million. In the second quarter of 2016, we recognized a gain of $1.7 million in connection with this settlement, based on the difference between the fair value of the contingent consideration obligation of $2.3 million as at April 2, 2016 and the cash payment.
Acquisition of Citrusource, LLC
On March 2, 2015, we acquired Citrusource, LLC (“Citrusource”), a producer of premium not-from-concentrate private label organic and conventional orange juice and citrus products in the U.S. We paid $13.3 million in cash at closing and we may pay additional consideration based on the incremental growth in Citrusource’s base business. The fair value of the total consideration transferred to acquire Citrusource was $31.7 million as at the acquisition date. The acquisition of Citrusource aligned with our strategy of growing our value-added consumer products portfolio. Citrusource has been included in the Consumer Products operating segment since the date of acquisition. For more information regarding the acquisition of Citrusource, see note 2 to the consolidated financial statements in Item 15 of this Form 10-K.
Sale of Fiber and Starch Business
On December 22, 2014, we completed the sale of our fiber and starch business (the “Fiber Business”) for $37.5 million, subject to certain closing adjustments. The Fiber Business included five facilities located in Louisville, Kentucky, Cedar Rapids, Iowa, Cambridge, Minnesota, Fosston, Minnesota, and Galesburg, Illinois, and was formerly part of the former Value Added Ingredients operating segment. We continue to operate both our integrated grain- and fruit-based ingredient businesses, which were not part of the sale, and which previously formed the remainder of the former Value Added Ingredients operating segment. For more information regarding the sale of the Fiber Business, see note 3 to the consolidated financial statements in Item 15 of this Form 10-K.
Critical Accounting Estimates
The preparation of financial statements in conformity with U.S. GAAP requires management to make certain estimates and assumptions that affect the reported amounts of assets and liabilities, related revenues and expenses, and disclosure of gain and loss contingencies at the date of the financial statements. The estimates and assumptions made require us to exercise our judgment and are based on historical experience and various other factors that we believe to be reasonable under the circumstances. We continually evaluate the information that forms the basis of our estimates and assumptions as our business and the business environment generally changes. The use of estimates is pervasive throughout our financial statements. The following are the accounting estimates which we believe to be most significant to our business.
Revenue Recognition
We recognize revenue at the time of delivery of the product and when all of the following have occurred: a sales agreement is in place; price is fixed or determinable; and collection is reasonably assured. Consideration given to customers such as value incentives, rebates, early payment discounts and other discounts are recorded as reductions to revenues at the time of sale.
| SUNOPTA INC. | 45 | December 31, 2016 10-K |
Accounts Receivable
Our accounts receivable primarily includes amounts due from our customers. The carrying value of each account is carefully monitored with a view to assessing the likelihood of collection. An allowance for doubtful accounts is provided for as an estimate of losses that could result from customers defaulting on their obligation to us. In assessing the amount of reserve required, a number of factors are considered including the age of the account, the credit-worthiness of the customer, payment terms, the customer’s historical payment history and general economic conditions. Because the amount of the reserve is an estimate, the actual amount collected could differ from the carrying value of the amount receivable. Note 6 of the consolidated financial statements in Item 15 of this Form 10-K provides an analysis of the changes in the allowance for doubtful accounts.
Inventory
Inventory is our largest current asset and consists primarily of raw materials and finished goods held for sale. Inventories are valued at the lower of cost, measured on a weighted-average cost basis, or estimated net realizable value except for certain grain inventories that are carried at market value. In order to determine the value of inventory at the balance sheet date, we evaluate a number of factors to determine the adequacy of provisions for inventory. These factors include the age of inventory, the amount of inventory held by type, future demand for products, and the expected future selling price we expect to realize by selling the inventory. Our estimates are judgmental in nature and are made at a point in time, using available information, expected business plans, and expected market conditions. As a result, the actual amount received on sale could differ from our estimated value of inventory. We perform a review of our inventory by reporting unit and product line on a quarterly basis. Note 7 of the consolidated financial statements in Item 15 of this Form 10-K provides an analysis of the movements in the inventory reserve.
Intangible Assets
We evaluate amortizable intangible assets acquired through business combinations for impairment if events or changes in circumstances indicate that the carrying amounts of these assets may not be recoverable. Our evaluation is based on an assessment of potential indicators of impairment, such as an adverse change in the business climate that could affect the value of an asset, such as the loss of a significant customer; current or forecasted operating or cash flow losses that demonstrate continuing losses associated with the use of an asset, such as the introduction of a competing product that results in a significant loss of market share; and a current expectation that, more likely than not, an intangible asset will be disposed of before the end of its previously estimated useful life, such as a plan to exit a product line or business in the near term.
Impairment exists when the carrying amount of an amortizable intangible asset is not recoverable through undiscounted future cash flows and its carrying value exceeds its estimated fair value. A discounted cash flow analysis is typically used to determine fair value using estimates and assumptions that market participants would apply. Some of the estimates and assumptions inherent in a discounted cash flow model include the amount and timing of the projected future cash flows, and the discount rate used to reflect the risks inherent in the future cash flows. A change in any of these estimates and assumptions could produce a different fair value, which could have a material impact on our results of operations. In addition, an intangible asset's expected useful life can increase estimation risk, as longer-lived assets necessarily require longer-term cash flow forecasts, which for some of our long-lived assets can be in excess of 20 years. In connection with an impairment evaluation, we also reassess the remaining useful life of the intangible asset and modify it, as appropriate.
Goodwill
Goodwill represents the excess of the purchase price of acquired businesses over the estimated fair value of the identifiable net assets acquired. Goodwill is not amortized but is tested at least annually for impairment at the reporting unit level. Reporting units are operating segments or components of operating segments for which discrete financial information is available. To evaluate goodwill, the fair value of each reporting unit is compared to its carrying value. Where the carrying value is greater than the fair value, the implied fair value of the reporting unit goodwill is determined by allocating the fair value of the reporting unit to all the assets and liabilities of the reporting unit with any remainder being allocated to goodwill. The implied fair value of the reporting unit goodwill is then compared to the carrying value of that goodwill to determine whether an impairment loss exists. Any impairment loss is recognized in earnings.
| SUNOPTA INC. | 46 | December 31, 2016 10-K |
We typically measure the fair value of each reporting unit using a discounted cash flow analysis (income approach). Because the business is assumed to continue in perpetuity, the discounted cash flows include a terminal value. Cash flows to perpetuity are forecasted based on projected revenue growth and our planned business strategies in future periods. Examples of planned strategies would include a plant or line expansion at an existing facility; a reduction of working capital at a specific location; and price increases or cost reductions within a reporting unit. The discount rate is based on a reporting unit’s targeted weighted-average cost of capital, which is not necessarily the same as our weighted-average cost of capital. These assumptions are subject to change and are impacted by our ability to achieve our forecasts and by economic conditions that may impact future results and result in projections not being attained. Each year we re-evaluate the assumptions used to reflect changes in the business environment.
We perform our annual quantitative test for goodwill impairment in the fourth quarter of each fiscal year. Based on the results of the quantitative test performed for the year ended December 31, 2016, we recognized a goodwill impairment charge of $17.5 million, which reflected the negative impact on future cash flows of the recall of certain roasted sunflower kernel products (as described above under “Recent Developments – Recall of Certain Sunflower Kernel Products”). Our quantitative test for 2016 indicated that a hypothetical 10% decrease in the fair value of each of our other reporting units would not have triggered additional impairment testing. Based on the results of the quantitative tests performed for the years ended January 2, 2016 and January 3, 2015, we determined that none of the goodwill associated with any of our reporting units was impaired in either of those fiscal years.
Acquisitions
Business acquisitions are accounted for by the acquisition method of accounting. Under this method, the purchase price is allocated to the assets acquired and the liabilities assumed based on the fair value at the time of the acquisition. Any excess purchase price over the fair value of identifiable assets acquired and liabilities assumed is recorded as goodwill. We believe the fair values assigned to the assets acquired and liabilities assumed are based on reasonable assumptions; however, these assumptions may be incomplete or inaccurate, and unanticipated events and circumstances may occur.
The assumptions and estimates with respect to determining the fair value of customer relationship intangible assets acquired are among the most significant in our acquisition accounting and generally require the most judgment. Key variables in determining the fair value of customer relationships are the estimated customer attrition rate and the percentage of revenue growth attributable to existing customers. Changes to either or both of these variables could have a significant impact on the customer relationships intangible assets’ values, and changes to the estimated customer attrition rate could have a significant impact on the estimated useful lives of these assets. The expected customer attrition rate assumed in the estimate of fair value for the customer relationships intangible assets is generally supported by an analysis of historical attrition of the acquired business’s customers and consideration of its amortization policy of previously acquired customer relationships, amortization policies adopted for acquired customer relationships by other companies in similar transactions, and the contractual terms between the acquired business and its customers. The percentage of revenue growth attributable to existing customers assumed in the estimate of fair value for the customer relationships intangible assets is typically supported by an analysis of the acquired business’s historical and forecasted revenue growth rates by customer. Changes in any of the assumptions or estimates used in determining the fair value of the customer relationship intangible assets could have a significant impact on the amounts assigned to goodwill in the purchase price allocation. Future net earnings can be affected as a result of changes in these estimates resulting in an increase or decrease in amortization expense, or impairment of the intangible assets and/or goodwill. Note 2 of the consolidated financial statements in Item 15 of this Form 10-K provide information with respect to businesses acquired and note 9 outlines annual amortization expense relating to these intangibles.
Some acquisitions involve contingent consideration to be potentially paid based on the achievement of specified future financial targets by the acquired business. Acquisition-related contingent consideration is initially recognized as a liability at estimated fair value and re-measured each reporting period with changes in the estimated fair value recognized in earnings. These estimates of fair value involve uncertainties as they include assumptions about the likelihood of achieving the specified financial targets, projections of future financial performance, and assumed discount rates. A change in any of these assumptions could produce a different fair value, which could impact the amounts assigned to assets and liabilities in the purchase price allocation, or the amounts recognized in earnings to reflect subsequent changes in the carrying value of the liability. Note 5 of the consolidated financial statements in Item 15 of this Form 10-K includes disclosures regarding the estimated fair value of contingent consideration.
Contingencies
We make estimates for payments that are contingent on the outcome of uncertain future events. These contingencies include accrued but unpaid bonuses; tax-related matters; and claims or litigation. In establishing our estimates, we consider historical experience with similar contingencies and the progress of each contingency, as well as the recommendations of internal and external advisors and legal counsel. We re-evaluate all contingencies as additional information becomes available; however, given the inherent uncertainties, the ultimate amount paid could differ from our estimates.
| SUNOPTA INC. | 47 | December 31, 2016 10-K |
In particular, as discussed above under “Recent Developments – Recall of Certain Roasted Sunflower Kernel Products”, we have recognized estimated losses of $40.0 million related to this recall as at December 31, 2016. These estimates are provisional and were determined based on an assessment of the information available up to the date of filing of this report, including a review of customer claims received as of that date and consideration of the extent of potential additional claims that have yet to be received. We may need to revise these estimates to be materially larger as we continue to work with our customers to substantiate the claims received to date and any additional claims that may be received.
Income Taxes
We are liable for income taxes in the U.S., Canada, and other jurisdictions where we operate. Our effective tax rate differs from the statutory tax rate and will vary from year to year primarily as a result of numerous permanent differences, investment and other tax credits, the provision for income taxes at different rates in foreign and other provincial jurisdictions, enacted statutory tax rate increases or reductions in the year, the benefit of cross-jurisdictional financing structures, changes due to foreign exchange, changes in valuation allowance based on our recoverability assessments of deferred tax assets, and favorable or unfavorable resolution of various tax examinations.
In making an estimate of our income tax liability, we first assess which items of income and expense are taxable in a particular jurisdiction. This process involves a determination of the amount of taxes currently payable as well as the assessment of the effect of temporary timing differences resulting from different treatment of items for accounting and tax purposes. These differences in the timing of the recognition of income or the deductibility of expenses result in deferred income tax balances that are recorded as assets or liabilities as the case may be on our balance sheet. We also estimate the amount of valuation allowance to maintain relating to loss carry forwards and other balances that can be used to reduce future taxes payable. This judgment is based on forecasted results in the jurisdiction and certain tax planning strategies and as a result actual results may differ from forecasts. We assess the likelihood of the ultimate realization of these tax assets by looking at the relative size of the tax assets in relation to the profitability of the businesses and the jurisdiction to which they can be applied, the number of years based on management’s estimate it will take to use the tax assets and any other special circumstances. If different judgments had been used, our income tax liability could have been different from the amount recorded. In addition, the taxing authorities of those jurisdictions upon audit may not agree with our assessment. Note 17 of the consolidated financial statements in Item 15 of this Form 10-K provides an analysis of the changes in the valuation allowance and the components of our deferred tax assets.
While we believe we have adequately provided for all tax positions, amounts asserted by taxing authorities could differ from our accrued position. Accordingly, additional provisions on federal, provincial, state and foreign tax-related matters could be recorded in the future as revised estimates are made or the underlying matters are settled or otherwise resolved.
Stock-Based Compensation
We maintain a stock incentive plan under which stock options and other stock-based awards may be granted to selected employees and directors. For grants of stock options, we are required to estimate a number of inputs at each grant date, such as the estimated life of the option, future stock price volatility, and the forfeiture rate used in the Black-Scholes option-pricing model to determine a fair value for the options granted to employees or non-employee directors. We determine the expected life of a stock option using the simplified method, as we changed the vesting period of our stock option grants from five years to three years in 2016, and the contractual term of our stock option grants from six years to 10 years in 2012 and, as a result, we do not believe historical exercise data provides a reasonable basis upon which to estimate expected life. Future stock price volatility is based on historical volatility of our common shares over the expected life of the stock option. Once determined at the grant date, the fair value of the stock option award is recorded over the vesting period of the options granted. Refer to note 14 of the consolidated financial statements in Item 15 of this Form 10-K for disclosure of the inputs used to determine the fair value of stock-based compensation.
| SUNOPTA INC. | 48 | December 31, 2016 10-K |
Consolidated Results of Operations for Fiscal Years 2016 and 2015
| December 31, | January 2, | |||||||||||
| 2016 | 2016 | Change | Change | |||||||||
| $ | $ | $ | % | |||||||||
|
Revenues |
||||||||||||
|
Global Ingredients |
574,295 | 610,890 | (36,595 | ) | -6.0% | |||||||
|
Consumer Products |
772,436 | 534,244 | 238,192 | 44.6% | ||||||||
|
Total revenues |
1,346,731 | 1,145,134 | 201,597 | 17.6% | ||||||||
|
|
||||||||||||
|
Gross Profit |
||||||||||||
|
Global Ingredients |
64,374 | 66,461 | (2,087 | ) | -3.1% | |||||||
|
Consumer Products |
61,578 | 43,901 | 17,677 | 40.3% | ||||||||
|
Total gross profit |
125,952 | 110,362 | 15,590 | 14.1% | ||||||||
|
|
||||||||||||
|
Segment operating income (loss)(1) |
||||||||||||
|
Global Ingredients |
26,787 | 28,184 | (1,397 | ) | -5.0% | |||||||
|
Consumer Products |
1,206 | 3,208 | (2,002 | ) | -62.4% | |||||||
|
Corporate Services |
(13,247 | ) | (10,094 | ) | (3,153 | ) | -30.8% | |||||
|
Total segment operating income |
14,746 | 21,298 | (6,552 | ) | -30.8% | |||||||
|
|
||||||||||||
|
Other expense, net |
28,292 | 12,151 | 16,141 | 132.8% | ||||||||
|
Goodwill impairment |
17,540 | - | 17,540 | - | ||||||||
|
Earnings (loss) from continuing operations before the following |
||||||||||||
|
|
(31,086 | ) | 9,147 | (40,233 | ) | -439.8% | ||||||
|
Interest expense, net |
43,275 | 15,669 | 27,606 | 176.2% | ||||||||
|
Recovery of income taxes |
(23,797 | ) | (3,390 | ) | (20,407 | ) | -602.0% | |||||
|
Loss from continuing operations |
(50,564 | ) | (3,132 | ) | (47,432 | ) | -1514.4% | |||||
|
Earnings (loss) attributable to non-controlling interests |
54 | (136 | ) | 190 | 139.7% | |||||||
|
Loss from discontinued operations attributable to SunOpta Inc. |
(570 | ) | (19,475 | ) | 18,905 | 97.1% | ||||||
|
Loss attributable to SunOpta Inc.(2) |
(51,188 | ) | (22,471 | ) | (28,717 | ) | -127.8% |
| (1) |
When assessing the financial performance of our operating segments, we use an internal measure of operating income that excludes other income/expense items and goodwill impairments determined in accordance with U.S. GAAP. This measure is the basis on which management, including the CEO, assesses the underlying performance of our operating segments. |
|
We believe that disclosing this non-GAAP measure assists investors in comparing financial performance across reporting periods on a consistent basis by excluding items that are not indicative of our core operating performance. However, the non-GAAP measure of operating income should not be considered in isolation or as a substitute for performance measures calculated in accordance with U.S. GAAP. The following table presents a reconciliation of “segment operating income (loss)” to “earnings (loss) from continuing operations before the following”, which we consider to be the most directly comparable U.S. GAAP financial measure. |
| Global | Consumer | Corporate | |||||||||||
| Ingredients | Products | Services | Consolidated | ||||||||||
| $ | $ | $ | $ | ||||||||||
|
December 31, 2016 |
|||||||||||||
|
Segment operating income (loss) |
26,787 | 1,206 | (13,247 | ) | 14,746 | ||||||||
|
Other expense, net |
(1,753 | ) | (25,705 | ) | (834 | ) | (28,292 | ) | |||||
|
Goodwill impairment |
(17,540 | ) | - | - | (17,540 | ) | |||||||
|
Earnings (loss) from continuing operations before the following |
7,494 | (24,499 | ) | (14,081 | ) | (31,086 | ) | ||||||
|
|
|||||||||||||
|
January 2, 2016 |
|||||||||||||
|
Segment operating income (loss) |
28,184 | 3,208 | (10,094 | ) | 21,298 | ||||||||
|
Other expense, net |
(1,317 | ) | (939 | ) | (9,895 | ) | (12,151 | ) | |||||
|
Earnings (loss) from continuing operations before the following |
26,867 | 2,269 | (19,989 | ) | 9,147 |
| SUNOPTA INC. | 49 | December 31, 2016 10-K |
We believe that investors’ understanding of our financial performance is enhanced by disclosing the specific items that we exclude from segment operating income. However, any measure of operating income excluding any or all of these items is not, and should not be viewed as, a substitute for operating income prepared under U.S. GAAP. These items are presented solely to allow investors to more fully understand how we assess financial performance.
| (2) |
When assessing our financial performance, we use an internal measure of earnings from continuing operations, net of non-controlling interests, determined in accordance with U.S. GAAP that includes dividends and accretion on convertible preferred stock and excludes specific items recognized in other income/expense, impairment losses on goodwill, long-lived assets and investments, other unusual items that are identified and evaluated on an individual basis, which due to their nature or size, we would not expect to occur as part of our normal business on a regular basis. We believe that the identification of these excluded items enhances an analysis of our financial performance of our core business when comparing those operating results between periods, as we do not consider these items to be reflective of normal core business operations. The following table presents a reconciliation of “adjusted earnings” from “loss from continuing operations”, which we consider to be the most directly comparable U.S. GAAP financial measure. |
|
|
Per Diluted Share | ||||||
|
|
$ | $ | |||||
|
December 31, 2016 |
|||||||
|
Loss from continuing operations |
(50,564 | ) | |||||
|
Less: earnings attributable to non-controlling interests |
(54 | ) | |||||
|
Less: dividends and accretion of Series A Preferred Stock |
(1,812 | ) | |||||
|
Loss from continuing operations available to common shareholders |
(52,430 | ) | (0.61 | ) | |||
|
|
|||||||
|
Adjusted for: |
|||||||
|
Costs related to business acquisitions(a) |
27,802 | ||||||
|
Goodwill impairment(b) |
17,540 | ||||||
|
Asset impairments related to facility closures(c) |
11,522 | ||||||
|
Legal settlement and litigation-related legal fees(d) |
10,850 | ||||||
|
Product withdrawal and recall costs(e) |
5,693 | ||||||
|
Costs related to strategic review and Value Creation Plan(f) |
4,041 | ||||||
|
Severance and rationalization costs(g) |
3,679 | ||||||
|
Inventory reserves and liquidation sales to de-risk positions(h) |
3,428 | ||||||
|
Plant start-up costs(i) |
1,565 | ||||||
|
Write-off of debt issuance costs(j) |
215 | ||||||
|
Other(k) |
726 | ||||||
|
Gain on settlement of contingent consideration(l) |
(1,715 | ) | |||||
|
Net income tax effect on adjusted earnings(m) |
(25,825 | ) | |||||
|
Change in unrecognized tax benefits(n) |
(1,268 | ) | |||||
|
Adjusted earnings |
5,823 | 0.07 | |||||
|
|
|||||||
|
January 2, 2016 |
|||||||
|
Loss from continuing operations |
(3,132 | ) | |||||
|
Add: loss attributable to non-controlling interests |
136 | ||||||
|
Loss from continuing operations available to common shareholders |
(2,996 | ) | (0.04 | ) | |||
|
|
|||||||
|
Adjusted for: |
|||||||
|
Costs related to business acquisitions(o) |
17,192 | ||||||
|
Plant expansion and start-up costs(p) |
4,081 | ||||||
|
Inventory reserves and liquidation sales to de-risk positions(q) |
2,367 | ||||||
|
Downtime, spoilage, and other costs due to equipment failure(r) |
2,219 | ||||||
|
Demurrage, detention and other related expenses(s) |
2,038 | ||||||
|
Litigation-related legal fees(d) |
1,709 | ||||||
|
Reversal of stock-based compensation expense(t) |
(579 | ) | |||||
|
Other(u) |
4,384 | ||||||
|
Net income tax effect of preceding adjustments(m) |
(10,598 | ) | |||||
|
Change in unrecognized tax benefits(n) |
(855 | ) | |||||
|
Adjusted earnings |
18,962 | 0.26 | |||||
| (a) |
Reflects costs related to business combinations, including an acquisition accounting adjustment related to Sunrise’s inventory sold during the year of $15.0 million, which is recorded in cost of goods sold; the non-cash amortization of debt issuance costs incurred in connection with the financing related to the Sunrise Acquisition of $7.8 million, as well as $2.6 million of additional debt issuance costs expensed, which are recorded in interest expense; and $2.4 million of integration costs related to the closure and consolidation of our frozen fruit processing facilities following the Sunrise Acquisition, which are recorded in cost of goods sold and other expense. |
| SUNOPTA INC. | 50 | December 31, 2016 10-K |
| (b) |
Reflects an impairment charge to write off the goodwill associated with the sunflower reporting unit (as described above under “Recent Developments – Recall of Certain Sunflower Kernel Products”). | |
| (c) |
Reflects an impairment of long-lived assets associated with the closure of the Heuvelton soy extraction facility and the San Bernardino juice facility (as described above under “Recent Developments – Rationalization of Soy and Juice Operations”). | |
| (d) |
Reflects the charge recorded in connection with the settlement of the Plum dispute (as described above under “Recent Developments – Settlement of Plum Dispute”), which is recorded in other expense. Also includes $1.6 million (2015 - $1.7 million) of litigation-related legal costs mainly associated with the Plum dispute, which are recorded in SG&A expenses. | |
| (e) |
Reflects voluntary product withdrawal or recall costs of $5.7 million, net of expected insurance recoveries, related to the withdrawal of certain consumer-packaged products for quality-related issues and the recall of certain sunflower kernel products (as described above under “Recent Developments – Recall of Certain Sunflower Kernel Products”), of which $1.2 million is recorded in cost of goods sold and $2.8 million is recorded in other expense. Also includes a $1.7 million adjustment for the estimated lost margin caused by the sunflower recall, which reflects a shortfall in revenues against anticipated volumes of approximately $9.8 million, less associated cost of goods sold of approximately $8.1 million. | |
| (f) |
Reflects legal and other professional advisory costs associated with the strategic review and execution of the Value Creation Plan, which are recorded in SG&A expenses. | |
| (g) |
Reflects contractual severance benefits of $1.5 million and previously unrecognized stock-based compensation of $0.2 million recognized in connection with the departure of Mr. Jacobs as President and CEO. Also includes employee severance costs of $1.6 million incurred in connection with certain facility closures and workforce rationalization initiatives and employee retention costs of $0.3 million, which are recorded in other expense. | |
| (h) |
Reflects aging reserves and low margin sales to reduce inventory exposures mainly related to certain grain varieties that we are exiting, which are recorded in cost of goods sold. | |
| (i) |
Plant start-up costs relate to the ramp-up of production at the Allentown facility following the completion of the addition of aseptic beverage processing and filling capabilities in the fourth quarter of 2015, which are recorded in cost of goods sold. These start-up costs reflect the negative gross profit reported by the facility as the facility ramped up to break-even production levels. | |
| (j) |
Reflects the write-off to interest expense of $0.2 million of remaining unamortized debt issuance costs related to our North American credit facilities, which were replaced by the Global Credit Facility. | |
| (k) |
Other includes fair value adjustments related to contingent consideration arrangements and gain/loss on sale of assets, which are recorded in other expense. | |
| (l) |
Reflects the gain on settlement of the contingent consideration obligation related to Niagara Natural (as described above under “Recent Development – Niagara Natural), which is recorded in other income. | |
| (m) |
Reflects the tax effect of the preceding adjustments to earnings and reflects an overall estimated annual effective tax rate of approximately 30% on adjusted earnings before tax. | |
| (n) |
Reflects the realization of previously unrecognized tax benefits, due to the expiration of the statute of limitations. | |
| (o) |
Reflects costs related to business combinations, including an acquisition accounting adjustment related to Sunrise’s inventory sold subsequent to the acquisition date of $4.0 million, which was recorded in cost of goods sold; acquisition- and integration-related costs incurred in connection with the Sunrise Acquisition of $7.8 million, which were recorded in other expense; and the non-cash amortization of debt issuance costs incurred in connection with the financing related to the Sunrise Acquisition of $6.4 million, as well as $2.0 million of loan commitment fees associated with bridge financing for the Sunrise Acquisition that was not utilized, which were recorded in interest expense. | |
| (p) |
Reflects costs related to the retrofit of the San Bernardino juice facility and expansion of the Allentown facility to add aseptic beverage processing and filling capabilities, which were recorded in cost of goods sold. | |
| (q) |
Reflects inventory reserves and low margin sales incurred to reduce inventory exposures in certain organic raw materials, which were recorded in cost of goods sold. | |
| (r) |
Reflects downtime and spoilage caused by equipment failures at the Allentown pouch facility, which were recorded in cost of goods sold. | |
| (s) |
Reflects additional logistics costs stemming from capacity constraints on imports and exports within the Global Ingredients segment, which were recorded in cost of goods sold. | |
| (t) |
Reflects the reversal to SG&A expenses of previously recognized stock-based compensation related to performance share units granted to certain employees as the performance conditions were not achieved. | |
| (u) |
Other includes severance and costs of $2.1 million for a former CEO; fair value adjustments related to contingent consideration arrangements; and gain/loss on disposal of assets, which were recorded in other expense. |
We believe that investors’ understanding of our financial performance is enhanced by disclosing the specific items that we exclude from earnings/loss attributable to SunOpta Inc. to compute adjusted earnings. However, adjusted earnings is not, and should not be viewed as, a substitute for earnings prepared under U.S. GAAP. Adjusted earnings is presented solely to allow investors to more fully understand how we assess our financial performance.
| (3) |
In order to evaluate our results of operations, we use certain non-GAAP measures that we believe enhance an investor's ability to derive meaningful year-over-year comparisons and trends from our results of operations. In particular, we evaluate our revenues on a basis that excludes the effects of fluctuations in commodity pricing and foreign exchange rates, as well as the impacts of recent business acquisitions and product rationalizations. In addition, we exclude specific items from our reported results that due to their nature or size, we do not expect to occur as part of our normal business on a regular basis. These items are identified above under footnote (2), and in the discussion of our results of operations below. These non-GAAP measures are presented solely to allow investors to more fully assess our results of operations and should not considered in isolation of, or as substitutes for an analysis of our results as reported under U.S. GAAP. |
Revenues for the year ended December 31, 2016 increased by 17.6% to $1,346.7 million from $1,145.1 million for the year ended January 2, 2016. Excluding the impact on revenues for the year ended December 31, 2016 of business acquisitions and associated product rationalizations (an increase in revenues of approximately $231.0 million), changes in commodity-related pricing and foreign exchange rates (a decrease in revenues of approximately $28.0 million), estimated impact of the recall of certain sunflower kernel products based on shortfall against anticipated volumes (a decrease in revenues of approximately $10.0 million), and estimated impact on west coast pouch operations as a result of a fire at a third-party facility (a decrease in revenues of approximately $5.0 million), revenues increased 1.0% in 2016, compared with 2015. This increase in revenues on an adjusted basis reflected higher demand for organic ingredients and growth in aseptic beverage volumes with the added output from the Allentown facility and new product launches. These positive factors were mostly offset by lower volumes of specialty raw materials driven by a reduction in contracted acres and lower retail market demand for frozen fruit in the fourth quarter of the 2016.
| SUNOPTA INC. | 51 | December 31, 2016 10-K |
For the fourth quarter of 2016, revenues decreased by 6.0% to $297.5 million from $316.4 million for the fourth quarter of 2015. Excluding the impact on revenues for the fourth quarter of 2016 of changes in commodity-related pricing and foreign exchange rates (a decrease in revenues of approximately $9.0 million), estimated impact of the recall of certain sunflower kernel products based on shortfall against anticipated volumes (a decrease in revenues of approximately $3.0 million), estimated impact on west coast pouch operations as a result of a fire at a third-party facility (a decrease in revenues of approximately $3.0 million), and business acquisitions and associated product rationalizations (a decrease in revenues of approximately $1.0 million), revenues in the fourth quarter of 2016 decreased by 0.9%, compared with the fourth quarter of 2015. This decrease in revenues on an adjusted basis reflected lower volumes of specialty raw materials driven by a reduction in contracted acres, as well as a sharp decline in retail market demand for frozen fruit products. In addition, sales of aseptic beverage products and specialty bars were flat relative to the prior year due to customer turnover and the ramp-up of new product offerings.
Gross profit increased $15.6 million, or 14.1%, to $126.0 million for the year ended December 31, 2016, compared with $110.4 million for the year ended January 2, 2016. As a percentage of revenues, gross profit for the year ended December 31, 2016 was 9.4% compared to 9.6% for the year ended January 2, 2016, a decrease of 0.2% . The gross profit percentage for 2016 would have been approximately 10.9%, excluding the impact of an acquisition accounting adjustment related to Sunrise’s inventory sold in 2016 ($15.0 million), aging reserves and low margin sales to reduce inventory exposures mainly on specialty grain varieties we are exiting ($3.4 million), lost margin caused by the recall of certain sunflower kernel products ($1.7 million), start-up costs related to the ramp-up of production at the Allentown aseptic beverage facility ($1.6 million), and an inventory reserve for certain consumer-packaged products due to quality-related issues ($1.2 million). For 2015, the gross profit percentage would also have been approximately 10.9%, excluding the impact of costs related to the retrofit of the San Bernardino juice facility and expansion of the Allentown facility to add aseptic beverage production capabilities ($4.1 million), an acquisition accounting adjustment related to the Sunrise’s inventory sold subsequent to the acquisition date ($4.0 million), aging reserves and low margin sales to reduce inventory exposures on certain organic raw materials ($2.4 million), downtime and spoilage caused by equipment failures at the Allentown pouch facility ($2.2 million), and demurrage, detention and other related expenses ($2.0 million). Excluding these items, the year-over-year gross profit percentage on an adjusted basis reflected increased efficiency and lower costs at our aseptic beverage operations and improved pricing spreads on organic ingredients. These positive factors were offset by increased raw material costs for frozen strawberries that could not be passed on immediately to customers, as well as production inefficiencies within our frozen fruit operations in the first half of 2016 caused by a late harvest and the resultant shortage of strawberries. In addition, we experienced lower pricing spreads on specialty corn and soy and reduced throughput in our sunflower roasting operations with the implementation of new food safety and quality processes.
For the fourth quarter of 2016, gross profit decreased $8.2 million, or 32.4%, to $17.0 million, compared with $25.2 million for the fourth quarter of 2015. As a percentage of revenues, gross profit for the fourth quarter of 2016 was 5.7% compared to 8.0% for the fourth quarter of 2015, a decrease of 2.3% . The gross profit percentage for the fourth quarter of 2016 would have been approximately 7.9%, excluding the impact of costs related to aging reserves and low margin sales to reduce inventory exposures mainly on specialty grain varieties we are exiting ($3.4 million), the acquisition accounting adjustment related to Sunrise’s inventory sold in the fourth quarter of 2016 ($1.6 million), an inventory reserve for certain consumer-packaged products due to quality-related issues ($1.2 million), and lost margin caused by the recall of certain sunflower kernel products ($0.7 million). For the fourth quarter of 2015, the gross profit percentage would have been 11.3%, excluding the impact of costs related to the acquisition accounting adjustment related to the Sunrise’s inventory sold subsequent to the acquisition date ($4.0 million), aging reserves and low margin sales to reduce inventory exposures on certain organic raw materials ($2.4 million), downtime and spoilage caused by equipment failures at the Allentown pouch facility ($2.2 million), the retrofit of the San Bernardino juice facility and expansion of the Allentown aseptic beverage facility ($1.9 million), and demurrage, detention and other related expenses ($0.2 million). Excluding these items, the gross profit percentage decreased 3.4% on an adjusted basis in fourth quarter of 2016, compared with the fourth quarter of 2015, which was driven mainly by lower production volumes across our consumer products platforms, as well as the reduced throughput in our sunflower roasting operations. In particular, frozen fruit production was impacted by the decline in retail market demand in the fourth quarter of 2016, which also resulted in higher storage costs due to higher inventory carry over. These negative factors were partially offset by improved pricing spreads on organic ingredients.
Total segment operating income for the year ended December 31, 2016 decreased by $6.6 million, or 30.8%, to $14.7 million, compared with $21.3 million for the year ended January 2, 2016. As a percentage of revenues, segment operating income was 1.1% for the year ended December 31, 2016, compared with 1.9% for the year ended January 2, 2016. The decrease in segment operating income mainly reflected increases in SG&A expenses and intangible asset amortization, which more than offset the higher overall gross profit as described above. The $12.9 million increase in SG&A expenses, mainly reflected incremental expenses from acquired businesses and external advisory costs associated with the strategic review and Value Creation Plan ($4.0 million), as well as higher litigation-related legal costs mainly related to the Plum dispute ($1.9 million). As a percentage of revenues, SG&A expenses were 7.3% in 2016, compared with 7.5% in 2015, a decrease of 0.2% . Excluding the impact of costs related to the strategic review, Value Creation Plan and Plum dispute, SG&A expenses on an adjusted basis as a percentage of revenues would have been approximately 6.8% in 2016, compared with approximately 7.4% in 2015, which reflected efficiencies gained following the Sunrise Acquisition. The year-over-year increase in intangible asset amortization of $6.3 million reflected the incremental amortization of identified intangible assets of acquired businesses. Also contributing to the decrease in segment operating income was a foreign exchange loss of $1.2 million in 2016, compared with a foreign exchange gain of $1.6 million in 2015, mainly reflecting the negative impact of a strengthening of the U.S. dollar relative to the peso on our Mexican frozen fruit operations in 2016, compared with the positive impact of a strengthening of the U.S. dollar relative to the euro in 2015.
| SUNOPTA INC. | 52 | December 31, 2016 10-K |
For the fourth quarter of 2016, total segment operating loss increased by $8.2 million to $10.0 million, compared with $1.7 million for the fourth quarter of 2015. The increase in the segment operating loss reflected lower overall gross profit as described above, as well as a $1.3 million increase in SG&A expenses, mainly reflecting external advisory costs associated with the strategic review and Value Creation Plan of $3.6 million, partially offset by lower compensation and other administrative costs. As a percentage of revenues, SG&A expenses were 8.8% in the fourth quarter of 2016, or approximately 7.4% excluding the impact of costs related to the strategic review and Value Creation Plan, compared with 7.8% in the fourth quarter of 2015. Partially offsetting the increase in segment operating loss was a $1.2 million increase in foreign exchange gains mainly due to the relative strengthening of the U.S. dollar against the euro in the fourth quarter of 2016, compared with the corresponding period of 2015.
Further details on revenue, gross profit and segment operating income variances are provided below under “Segmented Operations Information”.
Other expense for the year ended December 31, 2016 of $28.3 million included charges related to the impairment of long-lived assets mainly associated with the closure of the San Bernardino juice facility and the Heuvelton soy facility ($11.5 million), settlement of the Plum dispute ($9.0 million), severance and rationalization costs related to the departure of Mr. Jacobs as President and CEO, certain facility closures, workforce rationalization initiatives and employee retention costs ($3.7 million), costs related to the withdrawal of certain consumer-packaged products and the recall of certain sunflower kernel products ($2.8 million), and the consolidation of our frozen fruit processing facilities following the Sunrise Acquisition ($2.2 million). These charges were partially offset by the $1.7 million gain on settlement of the contingent consideration obligation related to the acquisition of Niagara Natural. Other expense for the year ended January 2, 2016 of $12.2 million included business development costs of $7.8 million, primarily reflecting acquisition- and integration-related costs incurred in connection with the Sunrise Acquisition; as well as severance and other rationalization costs of $2.9 million mainly related to a former CEO.
In the fourth quarter of 2016, we recognized a non-cash goodwill impairment charge of $17.5 million related to our sunflower operations (as described above under “Recent Developments - Recall of Certain Roasted Sunflower Kernel Products”).
The increase in interest expense of $27.6 million to $43.3 million for the year ended December 31, 2016, compared with $15.7 million for the year ended January 2, 2016, primarily reflected increased costs associated with borrowings to finance the Sunrise Acquisition. Interest expense for 2016 included $9.1 million of non-cash amortization of debt issuance costs and $2.4 million of other costs incurred in connection with proposed alternative financing arrangements. Interest expense for 2015 included $3.4 million of non-cash amortization of debt issuance costs and the write-off of $2.0 million of loan commitment fees associated with bridge financing for the Sunrise Acquisition that was not utilized. For 2017, we estimate our cash interest costs will be in the range of $29 million to $32 million.
We recognized a recovery of income tax of $23.8 million for the year ended December 31, 2016 (including the realization of $1.3 million of previously unrecognized tax benefits), compared with a recovery of income tax of $3.4 million for the year ended January 2, 2016. Excluding the impact of the change in unrecognized tax benefits, the effective tax rate for 2016 was 39.6% of the loss before income taxes (excluding the non-deductible goodwill impairment loss), compared with 52.0% of loss before income taxes for 2015. The effective tax rates reflected the impact of changes in the jurisdictional mix of earnings, mainly as the result of pre-tax losses in the U.S. in 2016 and 2015, which reflected the effect of higher cash interest and debt issuance costs related to the financing of the Sunrise Acquisition, costs related to business acquisitions, including the acquisition accounting adjustments to Sunrise inventory sold. In addition, for 2016, pre-tax losses in the U.S. reflected the impairment of assets related to facility closures, and the impact of other discrete items including costs associated with the Plum legal settlement and Value Creation Plan, as well as product withdrawal and recall costs.
| SUNOPTA INC. | 53 | December 31, 2016 10-K |
Loss from continuing operations, net of non-controlling interests, for the year ended December 31, 2016 was $50.6 million, compared with a loss of $3.0 million for the year ended January 2, 2016, an increase of $47.6 million. Diluted loss per share from continuing operations was $0.61 for the year ended December 31, 2016, compared with diluted loss per share from continuing operations of $0.04 for the year ended January 2, 2016.
Loss from discontinued operations of $0.6 million for the year ended December 31, 2016 reflected the loss from operations of Opta Minerals of $2.0 million, which included an asset impairment charge of $1.2 million, partially offset by a $0.6 million gain on classification as held for sale, net of recovery of income taxes and non-controlling interest of $0.9 million. Loss from discontinued operations of $19.5 million for the year ended January 2, 2016 primarily reflected the results of Opta Minerals, including an asset impairment charge of $12.4 million and loss on classification as held for sale of $10.5 million, net of non-controlling interest of $8.8 million.
On a consolidated basis, we realized a loss of $51.2 million (diluted loss per share of $0.62) for the year ended December 31, 2016, compared with a loss of $22.5 million (diluted loss per share of $0.31) for the year ended January 2, 2016.
For the year ended December 31, 2016, adjusted earnings were $5.8 million, or $0.07 per diluted share, compared with adjusted earnings of $19.0 million, or $0.26 per diluted share for the year ended January 2, 2016. Adjusted earnings is a non-GAAP financial measure. See footnote (2) to the table above for a reconciliation of “adjusted earnings” from “loss from continuing operations”, which we consider to be the most directly comparable U.S. GAAP financial measure.
Segmented Operations Information
| Global Ingredients | December 31, 2016 | January 2, 2016 | Change | % Change | ||||||||
| Revenue | 574,295 | 610,890 | (36,595 | ) | -6.0% | |||||||
| Gross Profit | 64,374 | 66,461 | (2,087 | ) | -3.1% | |||||||
| Gross Profit % | 11.2% | 10.9% | 0.3% | |||||||||
| Operating Income | 26,787 | 28,184 | (1,397 | ) | -5.0% | |||||||
| Operating Income % | 4.7% | 4.6% | 0.1% |
Global Ingredients contributed $574.3 million in revenues for the year ended December 31, 2016, compared to $610.9 million for the year ended January 2, 2016, a decrease of $36.6 million or 6.0% . Excluding the estimated impact on revenues of the recall of certain sunflower kernel products and the impact of changes including foreign exchange rates and commodity-related pricing, Global Ingredients revenues decreased approximately 0.2% . The table below explains the decrease in revenue:
| Global Ingredients Revenue Changes | |
| Revenues for the year ended January 2, 2016 | $610,890 |
|
Lower volumes of specialty corn and soy driven by a reduction of contracted acres, as well as decreased volumes of organic feed, roasted and other ingredient products |
(36,551) |
|
Lower sunflower volumes attributed to downtime due to the impact of the recall of roasted kernels in the second quarter of 2016, and lower throughput after restarting our roasting operations, combined with lower export volumes of in-shell sunflower due primarily to a strong U.S. dollar |
(17,301) |
|
Decreased pricing of specialty corn, soy, sunflower and organic feed |
(14,651) |
|
Decreased pricing for organic seeds and nuts, coffee, oils, sugar and quinoa |
(13,458) |
|
Higher sales volumes of internationally sourced organic ingredients including cocoa, fruit and vegetables, coffee, and seeds and nuts |
45,366 |
| Revenues for the year ended December 31, 2016 | $574,295 |
| SUNOPTA INC. | 54 | December 31, 2016 10-K |
Gross profit in Global Ingredients decreased by $2.1 million to $64.4 million for the year ended December 31, 2016 compared to $66.5 million for the year ended January 2, 2016, and the gross profit percentage increased by 0.3% to 11.2% . The increase in gross profit as a percentage of revenue was primarily due to a favorable sales mix driven by higher margin international organic raw materials and improved mix in domestic raw materials as a result of a decline in acres contracted of low margin seed and grain varieties, mark-to-market gains on commodity futures contracts, and improved transloading operating efficiencies from the prior year, partially offset by the impact of the sunflower recall on operations and lower pricing spreads on non-GMO soy, corn and organic feed. The table below explains the decrease in gross profit:
| Global Ingredients Gross Profit Changes | |
| Gross profit for the year ended January 2, 2016 | $66,461 |
|
Margin loss from downtime associated with the sunflower roasted kernel recall, and as reduced throughput following the restart of our roasting operations at our Crookston facility as well as lower export volumes of in-shell sunflower due primarily to a strong U.S. dollar |
(4,201) |
|
Lower pricing spread on specialty corn and soy, as well as inventory reserves and low margin sales recorded against certain grain varieties that we are exiting, partially offset by improved recoveries over the prior year related to transloading costs in the third quarter of 2015 |
(2,881) |
|
Favorable margin impact of mark-to-market gains related to commodity futures contracts |
2,707 |
|
Favorable impact on gross margins due to improved pricing spreads on internationally sourced organic ingredients, partially offset by reduced yield and other operational inefficiencies at our European sunflower operations |
2,288 |
| Gross profit for the year ended December 31, 2016 | $64,374 |
Operating income in Global Ingredients decreased by $1.4 million, or 5.0%, to $26.8 million for the year ended December 31, 2016, compared to $28.2 million for the year ended January 2, 2016. The table below explains the decrease in operating income:
| Global Ingredients Operating Income Changes | |
| Operating income for the year ended January 2, 2016 | $28,184 |
|
Decrease in gross profit, as explained above |
(2,087) |
|
Decreased foreign exchange gains on forward derivative contracts |
(2,590) |
|
Decrease in corporate cost allocations |
2,573 |
|
Decrease in SG&A expenses, primarily due to professional fees, other SG&A costs and lower compensation costs |
707 |
| Operating income for the year ended December 31, 2016 | $26,787 |
Looking forward, we believe Global Ingredients is well positioned in growing non-GMO and organic food categories. We intend to focus our efforts on (i) growing our organic sourcing and supply capabilities, making certified organic ingredients a larger proportion of our overall sales; (ii) leveraging our international sourcing and supply capabilities internally, and forward and backward integrating where opportunities exist; and (iii) initiating a global desk coordination program between our North American and International sourcing and supply operations to capitalize on global opportunities and drive incremental sales volume. The statements in this paragraph are forward-looking statements. See “Forward-Looking Statements” above. Increased supply pressure in the commodity-based markets in which we operate, increased competition, volume decreases or loss of customers, unexpected delays in our expansion or desk coordination plans, or our inability to secure quality inputs or achieve our product mix or cost reduction goals, along with the other factors described above under “Forward-Looking Statements”, could adversely impact our ability to meet these forward-looking expectations.
| SUNOPTA INC. | 55 | December 31, 2016 10-K |
| Consumer Products | December 31, 2016 | January 2, 2016 | Change | % Change | ||||||||
| Revenue | 772,436 | 534,244 | 238,192 | 44.6% | ||||||||
| Gross Profit | 61,578 | 43,901 | 17,677 | 40.3% | ||||||||
| Gross Profit % | 8.0% | 8.2% | -0.2% | |||||||||
| Operating Income | 1,206 | 3,208 | (2,002 | ) | -62.4% | |||||||
| Operating Income % | 0.2% | 0.6% | -0.4% |
Consumer Products contributed $772.4 million in revenues for the year ended December 31, 2016, compared to $534.2 million for the year ended January 2, 2016, an increase of $238.2 million or 44.6% . Excluding the impact of business acquisitions and associated product rationalizations, as well as the estimated impact on west coast pouch operations as a result of a fire at a third-party facility, Consumer Products revenues increased 1.6% . The table below explains the increase in revenue:
| Consumer Products Revenue Changes | |
| Revenues for the year ended January 2, 2016 | $534,244 |
|
Acquired revenues as a result of the acquisition of Sunrise, partially offset by the impact of customer transition following the closure of the Buena Park processing facility in the first quarter of 2016, as well as lower volumes in the foodservice and retail customer markets in the latter half of the year |
209,397 |
|
Higher sales of aseptic beverages including retail almond beverages and non-dairy into the foodservice channel, along with stronger sales of shelf-stable juice as a result of new product innovation |
28,682 |
|
Acquired revenues as a result of the acquisition of Niagara Natural and increased volumes of resealable pouch offerings as a result of new business contracted, partially offset by lower volumes of specialty bars |
4,303 |
|
Impact on revenues from closure of west coast pouch operations as a result of a fire at a third-party facility in the third quarter |
(4,190) |
| Revenues for the year ended December 31, 2016 | $772,436 |
Gross profit in Consumer Products increased by $17.7 million to $61.6 million for the year ended December 31, 2016 compared to $43.9 million for the year ended January 2, 2016, and the gross profit percentage decreased by 0.2% to 8.0% . For the year ended December 31, 2016, gross profit as a percentage of revenue was impacted by a $15.0 million acquisition accounting adjustment related to Sunrise inventory sold, as well as costs associated with expansion activities at the Allentown aseptic beverage facility ($1.6 million) and an inventory reserve for certain consumer-packaged products due to quality-related issues ($1.2 million). Excluding these costs, the gross profit percentage in Consumer Products would have been 10.3% for the year ended December 31, 2016. The increase in gross profit percentage on an adjusted basis reflected the higher margin profile of 2015 business acquisitions, and increased facility utilization and operating costs within the beverage operations, partially offset by higher costs within healthy fruit operations due to a delayed 2016 fruit harvest that led to increased labor costs and higher raw material prices that were not immediately built into customer pricing. The table below explains the increase in gross profit:
| SUNOPTA INC. | 56 | December 31, 2016 10-K |
| Consumer Products Gross Profit Changes | |
| Gross profit for the year ended January 2, 2016 | $43,901 |
|
Margin impact of the Sunrise Acquisition and improved pricing for frozen fruit offerings and for fruit bases and toppings |
26,551 |
|
Increased contribution from sales of aseptic and non-aseptic private label beverages, driven by increased production volumes and higher facility utilization |
4,763 |
|
Margin impact from acquisition accounting adjustment related to Sunrise inventory sold |
(11,000) |
|
Lower volumes of fruit snacks and specialty bars, partially offset by increased volumes of resealable pouch offerings from our east coast pouch facility as a result of new business contracted |
(2,637) |
| Gross profit for the year ended December 31, 2016 | $61,578 |
Operating income in Consumer Products decreased by $2.0 million, or 62.4% to $1.2 million for the year ended December 31, 2016, compared to $3.2 million for the year ended January 2, 2016. The table below explains the decrease in operating income:
| Consumer Products Operating Income Changes | |
| Operating income for the year ended January 2, 2016 | $3,208 |
|
Increase in gross profit, as explained above |
17,677 |
|
Increased SG&A costs due primarily to the acquisitions of Sunrise and Niagara Natural, and increased foreign exchange losses on international operations, partially offset by lower compensation costs |
(14,418) |
|
Increase in corporate cost allocations |
(5,261) |
| Operating income for the year ended December 31, 2016 | $1,206 |
Looking forward we believe our Consumer Products segment remains well-positioned in markets with attractive growth potential. We intend to focus our efforts on (i) investing in new sales and marketing resources creating greater channel specific focus on retail and foodservice to bolster our pipeline of opportunities to drive incremental sales volume; (ii) investing in our facilities to enhance quality, safety, and manufacturing efficiency to drive both incremental sales and cost reduction; (iii) initiating procurement and supply chain cost reduction initiatives focused on leveraging our buying power and creating increased network efficiency in our planning and logistics efforts; and (iv) leveraging our innovation capabilities to bring new value-added packaged products and processes to market and to increase our capacity utilization across the Consumer Products segment. The statements in this paragraph are forward-looking statements. See “Forward-Looking Statements” above. Unfavorable shifts in consumer preferences, increased competition, availability of raw material supply, volume decreases or loss of customers, unexpected delays in our expansion and integration plans, inefficiencies in our manufacturing processes, lack of consumer product acceptance, or our inability to successfully implement the particular goals and strategies indicated above, along with the other factors described above under “Forward-Looking Statements”, could have an adverse impact on these forward-looking expectations.
| Corporate Services | December 31, 2016 | January 2, 2016 | Change | % Change | ||||||||
| Operating Loss | (13,247 | ) | (10,094 | ) | (3,153 | ) | -31.2% |
Operating loss at Corporate Services increased by $3.2 million to $13.2 million for the year ended December 31, 2016, from a loss of $10.1 million for the year ended January 2, 2016. The table below explains the increase in operating loss:
| SUNOPTA INC. | 57 | December 31, 2016 10-K |
| Corporate Services Operating Loss Changes | |
| Operating loss for the year ended January 2, 2016 | $(10,094) |
|
Increased costs associated with strategic review and Value Creation Plan |
(3,788) |
|
Higher compensation-related costs due to increased headcount, stock-based compensation and health benefits |
(1,856) |
|
Increased information technology consulting, professional fees and costs associated with litigation now resolved, partially offset by lower foreign exchange losses |
(197) |
|
Increase in corporate cost allocations, due in part to an increasing centralization of services |
2,688 |
| Operating loss for the year ended December 31, 2016 | $(13,247) |
Management fees mainly consist of salaries of corporate personnel who perform back office functions for operating segments, as well as costs related to the enterprise resource management system. These expenses are allocated to the operating segments based on (1) specific identification of allocable costs that represent a service provided to each segment and (2) a proportionate distribution of costs based on a weighting of factors such as revenue contribution and number of people employed within each segment. The 2016 management fee allocations reflect the additional revenues and head count added as a result of the acquisitions of Sunrise, Citrusource, and Niagara Natural. These acquisitions added approximately $350.0 million in annualized revenues all to the Consumer Products segment.
| SUNOPTA INC. | 58 | December 31, 2016 10-K |
Consolidated Results of Operations for Fiscal Years 2015 and 2014
| January 2, | January 3, | |||||||||||
| 2016 | 2015 | Change | Change | |||||||||
| $ | $ | $ | % | |||||||||
|
Revenues |
||||||||||||
|
Global Ingredients |
610,890 | 619,066 | (8,176 | ) | -1.3% | |||||||
|
Consumer Products |
534,244 | 483,679 | 50,565 | 10.5% | ||||||||
|
Total revenues |
1,145,134 | 1,102,745 | 42,389 | 3.8% | ||||||||
|
|
||||||||||||
|
Gross Profit |
||||||||||||
|
Global Ingredients |
66,461 | 63,591 | 2,870 | 4.5% | ||||||||
|
Consumer Products |
43,901 | 58,514 | (14,613 | ) | -25.0% | |||||||
|
Total gross profit |
110,362 | 122,105 | (11,743 | ) | -9.6% | |||||||
|
|
||||||||||||
|
Segment operating income (loss)(1) |
||||||||||||
|
Global Ingredients |
28,184 | 26,274 | 1,910 | 7.3% | ||||||||
|
Consumer Products |
3,208 | 27,872 | (24,664 | ) | -88.5% | |||||||
|
Corporate Services |
(10,094 | ) | (12,449 | ) | 2,355 | 18.9% | ||||||
|
Total segment operating income |
21,298 | 41,697 | (20,399 | ) | -48.9% | |||||||
|
|
||||||||||||
|
Other expense (income), net |
12,151 | (2,220 | ) | 14,371 | 647.3% | |||||||
|
Earnings from continuing operations before the following |
9,147 | 43,917 | (34,770 | ) | -79.2% | |||||||
|
Interest expense, net |
15,669 | 3,943 | 11,726 | 297.4% | ||||||||
|
Impairment loss on investment |
- | 8,441 | (8,441 | ) | -100.0% | |||||||
|
Provision for (recovery of) income taxes |
(3,390 | ) | 12,043 | (15,433 | ) | -128.1% | ||||||
|
Earnings (loss) from continuing operations |
(3,132 | ) | 19,490 | (22,622 | ) | -116.1% | ||||||
|
Earnings (loss) attributable to non-controlling interests |
(136 | ) | 195 | (331 | ) | -169.7% | ||||||
|
Loss from discontinued operations attributable to SunOpta Inc. |
(19,475 | ) | (6,194 | ) | (13,281 | ) | -214.4% | |||||
|
|
||||||||||||
|
Earnings (loss) attributable to SunOpta Inc.(2) |
(22,471 | ) | 13,101 | (35,572 | ) | -271.5% |
| (1) |
The following table presents a reconciliation of “segment operating income (loss)” to “earnings from continuing operations before the following”, which we consider to be the most directly comparable U.S. GAAP financial measure (refer to footnote (1) to the “Consolidated Results of Operations for Fiscal Years 2016 and 2015” table regarding the use of non-GAAP measures). |
| Global | Consumer | Corporate | ||||||||||
| Ingredients | Products | Services | Consolidated | |||||||||
| $ | $ | $ | $ | |||||||||
|
January 2, 2016 |
||||||||||||
|
Segment operating income (loss) |
28,184 | 3,208 | (10,094 | ) | 21,298 | |||||||
|
Other expense, net |
(1,317 | ) | (939 | ) | (9,895 | ) | (12,151 | ) | ||||
|
Earnings (loss) from continuing operations before the following |
26,867 | 2,269 | (19,989 | ) | 9,147 | |||||||
|
|
||||||||||||
|
January 3, 2015 |
||||||||||||
|
Segment operating income (loss) |
26,274 | 27,872 | (12,449 | ) | 41,697 | |||||||
|
Other income (expense), net |
1,052 | 1,294 | (126 | ) | 2,220 | |||||||
|
Earnings (loss) from continuing operations before the following |
27,326 | 29,166 | (12,575 | ) | 43,917 |
| (2) |
The following table presents a reconciliation of “adjusted earnings” from “earnings/loss from continuing operations”, which we consider to be the most directly comparable U.S. GAAP financial measure (refer to footnote (2) to the “Consolidated Results of Operations for Fiscal Years 2016 and 2015” table regarding the use of non-GAAP measures). |
| SUNOPTA INC. | 59 | December 31, 2016 10-K |
| Per Diluted Share | ||||||
| $ | $ | |||||
|
January 2, 2016 |
||||||
|
Loss from continuing operations |
(3,132 | ) | ||||
|
Add: loss attributable to non-controlling interests |
136 | |||||
|
Loss from continuing operations available to common shareholders |
(2,996 | ) | (0.04 | ) | ||
|
|
||||||
|
Adjusted for: |
||||||
|
Costs related to business acquisitions(a) |
17,192 | |||||
|
Plant expansion and start-up costs(b) |
4,081 | |||||
|
Inventory reserves and liquidation sales to de-risk positions(c) |
2,367 | |||||
|
Downtime, spoilage, and other costs due to equipment failure(d) |
2,219 | |||||
|
Demurrage, detention and other related expenses(e) |
2,038 | |||||
|
Litigation-related legal fees(f) |
1,709 | |||||
|
Reversal of stock-based compensation expense(g) |
(579 | ) | ||||
|
Other(h) |
4,384 | |||||
|
Net income tax effect of preceding adjustments(i) |
(10,598 | ) | ||||
|
Change in unrecognized tax benefits(j) |
(855 | ) | ||||
|
Adjusted earnings |
18,962 | 0.26 | ||||
|
|
||||||
|
January 3, 2015 |
||||||
|
Earnings from continuing operations |
19,490 | 0.19 | ||||
|
Less: earnings attributable to non-controlling interests |
(195 | ) | (0.09 | ) | ||
|
Earnings from continuing operations available to common shareholders |
19,295 | 0.28 | ||||
|
|
||||||
|
Adjusted for: |
||||||
|
Impairment loss on investment(k) |
8,441 | |||||
|
Other(l) |
(2,220 | ) | ||||
|
Net income tax effect of preceding adjustments(i) |
901 | |||||
|
Adjusted earnings |
26,417 | 0.38 | ||||
| (a) |
Reflects costs related to business combinations, including an acquisition accounting adjustment related to Sunrise’s inventory sold subsequent to the acquisition date of $4.0 million, which was recorded in cost of goods sold; acquisition- and integration-related costs incurred in connection with the Sunrise Acquisition of $7.8 million, which was recorded in other expense; and the non-cash amortization of debt issuance costs incurred in connection with the financing related to the Sunrise Acquisition of $6.4 million, as well as $2.0 million of loan commitment fees associated with bridge financing for the Sunrise Acquisition that was not utilized, which were recorded in interest expense. | |
| (b) |
Reflects costs related to the retrofit of the San Bernardino juice facility and expansion of the Allentown facility to add aseptic beverage processing and filling capabilities, which were recorded in cost of goods sold. | |
| (c) |
Reflects inventory reserves and low margin sales incurred to reduce inventory exposures in certain organic raw materials, which were recorded in cost of goods sold. | |
| (d) |
Reflects downtime and spoilage caused by equipment failures at the Allentown pouch facility, which were recorded in cost of goods sold. | |
| (e) |
Reflects additional logistics costs stemming from capacity constraints on imports and exports within the Global Ingredients segment, which were recorded in cost of goods sold. | |
| (f) |
Reflects litigation-related legal costs mainly associated with the Plum dispute, which are recorded in SG&A expenses. | |
| (g) |
Reflects the reversal to SG&A expenses of previously recognized stock-based compensation related to performance share units granted to certain employees as the performance conditions were not achieved. | |
| (h) |
Other includes severance costs of $2.1 million for a former CEO; fair value adjustments related to contingent consideration arrangements; and gain/loss on disposal of assets, which were recorded in other expense. | |
| (i) |
To tax effect the preceding adjustments to earnings and to reflect an overall estimated annual effective tax rate of approximately 30% on adjusted earnings before tax. | |
| (j) |
Reflects the realization of previously unrecognized tax benefits, due to the expiration of the statute of limitations. | |
| (k) |
Reflects an impairment loss recognized on our non-core investment in Enchi Corporation, (“Enchi”), which was recorded in impairment loss on investment. | |
| (l) |
Other includes a net gain of $1.4 million on the disposal of certain of our sunflower facilities, partially offset by severance costs for affected employees, and a gain of $1.4 million on the settlement of a contingent consideration arrangement. |
We believe that investors’ understanding of our financial performance is enhanced by disclosing the specific items that we exclude from earnings/loss attributable to SunOpta Inc. to compute adjusted earnings. However, adjusted earnings is not, and should not be viewed as, a substitute for earnings prepared under U.S. GAAP. Adjusted earnings is presented solely to allow investors to more fully understand how we assess our financial performance.
| (3) |
In order to evaluate our results of operations, we use certain non-GAAP measures that we believe enhance an investor's ability to derive meaningful year-over-year comparisons and trends from our results of operations. In particular, we evaluate our revenues on a basis that excludes the effects of fluctuations in commodity pricing and foreign exchange rates, as well as the impacts of recent business acquisitions and product rationalizations. In addition, we exclude specific items from our reported results that due to their nature or size, we do not expect to occur as part of our normal business on a regular basis. These items are identified above under footnote (2), and in the discussion of our results of operations below. These non-GAAP measures are presented solely to allow investors to more fully assess our results of operations and should not considered in isolation of, or as substitutes for an analysis of our results as reported under U.S. GAAP. |
| SUNOPTA INC. | 60 | December 31, 2016 10-K |
Revenues for the year ended January 2, 2016 increased by 3.8% to $1,145.1 million from $1,102.7 million for the year ended January 3, 2015. Excluding the impact on revenues of business acquisitions, product rationalizations and other changes (a net increase in revenues of approximately $57.0 million), changes in foreign exchange rates and commodity-related pricing (decreases in revenues of approximately $32.0 million and $7.0 million, respectively), and the impact of the additional week of sales in fiscal 2014 (a decrease in revenues of approximately $21.0 million), revenues increased 4.1% in 2015, compared with 2014. Revenues for the fourth quarter of 2015 were $316.4 million, an increase of $65.8 million, or 26.3%, compared with revenues of $250.6 million for the fourth quarter of 2014. Excluding the impact on revenues for the fourth quarter of 2015 of business acquisitions, product rationalizations and other changes (an increase in revenues of approximately $56.0 million), changes in foreign exchange rates (a decrease in revenues of approximately $6.0 million), and changes in commodity-related pricing (an increase in revenues of approximately $2.0 million), revenues in the fourth quarter of 2015 increased by 5.5%, compared with the fourth quarter of 2014. The increases in revenue on an adjusted basis for the full year and fourth quarter of 2015, compared with the corresponding periods of 2014, reflected stronger demand for organic ingredients in the U.S. and Europe, offset by lower sunflower and grain-based ingredient volumes and lower volumes for consumer-based aseptic beverage and frozen food retail products.
Gross profit decreased $11.7 million, or 9.6%, to $110.4 million for the year ended January 2, 2016, compared with $122.1 million for the year ended January 3, 2015. As a percentage of revenues, gross profit for the year ended January 2, 2016 was 9.6% compared to 11.1% for the year ended January 3, 2015, a decrease of 1.4% . The gross profit percentage for 2015 would have been approximately 10.9%, excluding the impact of costs related to the retrofit of the San Bernardino juice facility and expansion of the Allentown facility to add aseptic beverage production capabilities ($4.1 million), acquisition accounting adjustment related to the Sunrise’s inventory sold subsequent to the acquisition date ($4.0 million), aging reserves and low margin sales to reduce inventory exposures on certain organic raw materials ($2.4 million), downtime and spoilage caused by equipment failures at the Allentown pouch facility ($2.2 million), and demurrage, detention and other related expenses ($2.0 million). The 0.2% decline in gross profit percentage year-over-year on an adjusted basis mainly reflected lower capacity utilization and a higher cost base within consumer-based product categories due to recent expansion activities, partially offset by improved performance in our rationalized sunflower operations and increased margin contribution from higher volumes of organic ingredients.
Total segment operating income for the year ended January 2, 2016 decreased by $20.4 million, or 48.9%, to $21.3 million, compared with $41.7 million for the year ended January 3, 2015. As a percentage of revenue, segment operating income was 1.9% for the year ended January 2, 2016, compared with 3.8% for the year ended January 3, 2015. The decrease in segment operating income reflected lower overall gross profit as described above and a $5.4 million increase in SG&A expenses, reflecting incremental expenses from acquired businesses and higher litigation-related legal costs mainly related to the Plum dispute. Those factors were partially offset by lower employee short-term and long-term incentives tied to operating performance, controlled discretionary spending, and the favorable impact of a stronger U.S. dollar on SG&A expenses denominated in Canadian dollars and euros. As a percentage of revenues, SG&A expenses were 7.5% in 2015 and, excluding the impact of higher litigation costs of $2.0 million, and lower stock-based compensation expense of $0.6 million, SG&A expenses would have been approximately 7.4% on an adjusted basis, which is in-line with our intention of maintaining SG&A below 8% of revenues.
Intangible asset amortization increased $2.9 million year-over-year in 2015, related to the identified intangible assets of acquired businesses.
We recognized foreign exchange gains of $1.6 million and $2.0 million for the year ended January 2, 2016 and January 3, 2015, respectively, mainly related to the positive impact of a strengthening of the U.S. dollar relative to the euro on open foreign exchange contracts within our international sourcing and supply operations.
Further details on revenue, gross profit and segment operating income variances are provided below under “Segmented Operations Information”.
Other expense for the year ended January 2, 2016 of $12.2 million included business development costs of $7.8 million, primarily reflecting acquisition- and integration-related costs incurred in connection with the Sunrise Acquisition, as well as severance and other rationalization costs of $2.9 million mainly related to a former CEO. Other income for the year ended January 3, 2015 of $2.2 million included a net gain on sale of assets of $1.4 million primarily related to the disposal of certain of our sunflower production and storage facilities in order to reduce the cost structure and improve the production capacity utilization within our North American sunflower operations, partially offset by severance costs for employees affected by the closure and sale of the sunflower facilities, and a gain of $1.4 million on the settlement of a contingent consideration arrangement.
| SUNOPTA INC. | 61 | December 31, 2016 10-K |
The increase in interest expense of $11.7 million to $15.7 million for the year ended January 2, 2016, compared with $3.9 million for the year ended January 3, 2015, primarily reflected increased costs associated with borrowings to finance the Sunrise Acquisition, which included $3.4 million of non-cash amortization of debt issuance costs and the write-off of $2.0 million of loan commitment fees associated with bridge financing for the Sunrise Acquisition that was not utilized.
In 2014, we recognized an impairment loss of $8.4 million related to our non-core investment in Enchi, a developer of advanced bioconversion products for the renewable fuels industry.
The recovery of income tax for the year ended January 2, 2016 was $3.4 million, or 52.0% of loss before taxes, compared with a provision for income taxes $12.0 million, or 30.1% of earnings before taxes, for the year ended January 3, 2015 (excluding the non-deductible impairment loss on investment in 2014, for which the related deferred tax asset is considered more likely than not to be unrealized). The increase in the effective tax rate in 2015, compared with 2014, reflected the impact of pre-tax losses in the U.S., due to a combination of acquisition-related costs primarily related to the Sunrise Acquisition and lower pre-tax earnings within our U.S.-based consumer products operations, which more than offset taxable income in our European and Canadian operations.
Loss from continuing operations, net of non-controlling interests, for the year ended January 2, 2016 was $3.0 million, compared with earnings of $19.3 million for the year ended January 3, 2015, a decrease of $22.3 million. Diluted loss per share from continuing operations was $0.04 for the year ended January 2, 2016, compared with diluted earnings per share from continuing operations of $0.28 for the year ended January 3, 2015.
Loss from discontinued operations of $19.5 million for the year ended January 2, 2016 primarily reflected the results of Opta Minerals, including an asset impairment charge of $12.4 million and loss on classification as held for sale of $10.5 million, net of non-controlling interest of $8.8 million. Loss from discontinued operations of $8.1 million for the year ended January 3, 2015 primarily reflected the results of Opta Minerals, including asset impairment and plant closure costs of $4.2 million and a goodwill impairment loss of $11.0 million, net of non-controlling interest of $5.2 million. In addition, we recognized a gain on the sale of the Fiber Business, net of income taxes, of $1.9 million in the fourth quarter of 2014.
On a consolidated basis, we realized a loss of $22.5 million (diluted loss per share of $0.31) for the year ended January 2, 2016, compared with earnings of $13.1 million (diluted earnings per share of $0.19) for the year ended January 3, 2015.
For the year ended January 2, 2016, adjusted earnings were $17.9 million or $0.25 per diluted share, compared with adjusted earnings of $26.4 million or $0.38 per diluted share for the year ended January 3, 2015. Adjusted earnings is a non-GAAP financial measure. See footnote (2) to the table above for a reconciliation of “adjusted earnings” from “earnings/loss from continuing operations”, which we consider to be the most directly comparable U.S. GAAP financial measure.
Segmented Operations Information
| Global Ingredients | January 2, 2016 | January 3, 2015 | Change | % Change | ||||||||
| Revenue | 610,890 | 619,066 | (8,176 | ) | -1.3% | |||||||
| Gross Profit | 66,461 | 63,591 | 2,870 | 4.5% | ||||||||
| Gross Profit % | 10.9% | 10.3% | 0.6% | |||||||||
| Operating Income | 28,184 | 26,274 | 1,910 | 7.3% | ||||||||
| Operating Income % | 4.6% | 4.2% | 0.4% |
Global Ingredients contributed $610.9 million in revenues for the year ended January 2, 2016, compared to $619.1 million for the year ended January 3, 2015, a decrease of $8.2 million or 1.3% . Excluding the impact of changes including foreign exchange rates, commodity-related pricing and the additional week of sales in the first quarter of 2014, Global Ingredients’ revenues increased approximately 8.8% . The table below explains the decrease in revenue:
| SUNOPTA INC. | 62 | December 31, 2016 10-K |
| Global Ingredients Revenue Changes | |
| Revenues for the year ended January 3, 2015 | $619,066 |
|
Unfavorable foreign exchange impact on euro denominated sales due to the stronger U.S. dollar |
(31,897) |
|
Lower volumes of sunflower and grain ingredient products, partially offset by higher volumes for non-GMO corn and soy |
(31,038) |
|
Impact on revenues of the additional week in fiscal 2014 |
(11,673) |
|
Decreased pricing of non-GMO corn, soy, organic feed and sunflower, partially offset by increased pricing of organic feed and agronomy products |
(10,792) |
|
Higher international sales volumes of organic fruits and vegetables, seeds, nuts, cocoa, and oils, partially offset by lower volumes of sugar, sweeteners, and organic feed |
44,884 |
|
Higher U.S. domestic sales volumes on oils, organic fruits and vegetables, and nuts, offset partially by lower pricing for organic oranges, chia seeds, sugar, rice and cocoa |
32,340 |
| Revenues for the year ended January 2, 2016 | $610,890 |
Gross profit in Global Ingredients increased by $2.9 million to $66.5 million for the year ended January 2, 2016 compared to $63.6 million for the year ended January 3, 2015, and the gross profit percentage increased by 0.6% to 10.9% . The increase in gross profit as a percentage of revenue was primarily due to favorable sales mix of organic raw materials and improved sunflower processing yields, partially offset by lower pricing spreads on non-GMO and specialty soy and corn. The table below explains the increase in gross profit:
| Global Ingredients Gross Profit Changes | |
| Gross profit for the year ended January 3, 2015 | $63,591 |
|
Margin impact of increased volumes and favorable product mix of organic raw ingredients, as well as improved plant efficiencies at our cocoa processing facility |
10,220 |
|
Improved sunflower processing yields and operating efficiencies offset by lower volumes |
1,051 |
|
Demurrage, detention and other related costs resulting from transloading capacity constraints experienced primarily in the third quarter as well as costs associated with inventory reserves and liquidation sales made to decrease inventory exposures in certain organic commodities |
(4,405) |
|
Unfavorable impact on gross margins due to weaker euro relative to U.S. dollar, as well as mark to market losses related to commodity futures contracts for cocoa and other commodities |
(3,352) |
|
Margin impact of lower pricing spread on non-GMO soy and grain ingredients, partially offset by higher prices on grain snacks |
(644) |
| Gross profit for the year ended January 2, 2016 | $66,461 |
Operating income in Global Ingredients increased by $1.9 million, or 7.3%, to $28.2 million for the year ended January 2, 2016, compared to $26.3 million for the year ended January 3, 2015. The table below explains the increase in operating income:
| SUNOPTA INC. | 63 | December 31, 2016 10-K |
| Global Ingredients Operating Income Changes | |
| Operating income for the year ended January 3, 2015 | $26,274 |
|
Increase in gross profit, as explained above |
2,870 |
|
Favorable impact on expenses due to the stronger U.S. dollar relative to the euro |
2,176 |
|
Increased foreign exchange gains on forward derivative contracts and decreased SG&A expenses due to lower discretionary spending and lower short-term incentive accruals |
402 |
|
Increase in corporate cost allocations, due in part to centralization of services |
(3,538) |
| Operating income for the year ended January 2, 2016 | $28,184 |
| Consumer Products | January 2, 2016 | January 3, 2015 | Change | % Change | ||||||||
| Revenue | 534,244 | 483,679 | 50,565 | 10.5% | ||||||||
| Gross Profit | 43,901 | 58,514 | (14,613 | ) | -25.0% | |||||||
| Gross Profit % | 8.2% | 12.1% | -3.9% | |||||||||
| Operating Income | 3,208 | 27,872 | (24,664 | ) | -88.5% | |||||||
| Operating Income % | 0.6% | 5.8% | -5.2% |
Consumer Products contributed $534.2 million in revenues for the year ended January 2, 2016, compared to $483.7 million for the year ended January 3, 2015, an increase of $50.6 million or 10.5% . Excluding the impact of changes including accretive acquisitions in the year, and the additional week of sales in the first quarter of 2014, Consumer Products revenues decreased approximately 1.5% . The table below explains the increase in revenue:
| Consumer Products Revenue Changes | |
| Revenues for the year ended January 3, 2015 | $483,679 |
|
Incremental revenues as a result of the Sunrise Acquisition on October 9, 2015 |
52,848 |
|
Incremental revenues as a result of the acquisitions of Citrusource on March 2, 2015, and Niagara Natural on August 12, 2015 |
30,797 |
|
Lower volumes of aseptic beverages due to a change in mix and lower sales to the retail channel, in particular almond-based beverage sales, as well as lower volumes of contract manufactured shelf stable and refrigerated fruit-based beverages, partially offset by increased sales of coconut based aseptic non-dairy into the food service channel |
(15,141) |
|
Impact on revenues of additional week in fiscal 2014 |
(9,608) |
|
Decreased volumes of private label retail frozen food offerings, partially offset by increased revenues of fruit toppings and bases |
(4,592) |
|
Decreased volumes of protein based snacks and fruit snacks, partially offset by increased sales of re-sealable pouch products |
(3,739) |
| Revenues for the year ended January 2, 2016 | $534,244 |
Gross profit in Consumer Products decreased by $14.6 million to $43.9 million for the year ended January 2, 2016 compared to $58.5 million for the year ended January 3, 2015, and the gross profit percentage decreased by 3.9% to 8.2% . The decrease in gross profit as a percentage of revenue was due to lower production volumes leading to lower plant efficiency, as well as increased costs associated with the retrofit of our premium juice facility and expansion activities at our Allentown facility. The table below explains the decrease in gross profit:
| SUNOPTA INC. | 64 | December 31, 2016 10-K |
| Consumer Products Gross Profit Changes | |
| Gross profit for the year ended January 3, 2015 | $58,514 |
|
Decreased contribution from sales of aseptic and non-aseptic private label beverages, as fixed costs have increased from capacity expansion projects, leading to decreased operational efficiencies in advance of volume build |
(8,648) |
|
Increased raw material costs and delayed price increases which were not fully implemented until the second half of 2015, as well as lower volumes for frozen food offerings as well as fruit bases and toppings |
(6,948) |
|
Costs associated with the expansion of the Allentown facility for aseptic beverage production and costs associated with ramp-up activities at our premium juice facility in anticipation of increased extraction and bottling volume |
(4,081) |
|
Costs associated with equipment failures and other mechanical issues at the Allentown pouch and Alexandria, Minnesota, aseptic beverage facilities in the fourth quarter which led to downtime, yield loss, spoilage, and price concessions to customers |
(2,219) |
|
Incremental margin as a result of the Sunrise acquisition, including the effect of acquisition accounting adjustments related to the fair value of inventory sold subsequent to the acquisition date |
4,737 |
|
Incremental margin as a result of Citrusource acquisition, partially offset by increased costs associated with the retrofit of our premium juice facility |
2,109 |
|
Higher volumes of fruit-based snacks, incremental margin from the acquisition of Niagara Natural, partially offset by decreased contribution from sales of protein-based snacks, as well as lower plant efficiencies due to decreased production volumes |
437 |
| Gross profit for the year ended January 2, 2016 | $43,901 |
Operating income in Consumer Products decreased by $24.7 million, or 88.5%, to $3.2 million for the year ended January 2, 2016, compared to $27.9 million for the year ended January 3, 2015. The table below explains the decrease in operating income:
| Consumer Products Operating Income Changes | |
| Operating income for the year ended January 3, 2015 | $27,872 |
|
Decrease in gross profit, as explained above |
(14,613) |
|
Increase in corporate cost allocations, due in part to centralization of services |
(6,939) |
|
Increase in SG&A costs associated with the acquisitions of Sunrise, Niagara Natural and Citrusource including amortization of intangible assets |
(5,260) |
|
Lower compensation costs and professional fees driven by the benefit of centralization of services and lower short-term incentive accruals |
2,148 |
| Operating income for the year ended January 2, 2016 | $3,208 |
| Corporate Services | January 2, 2016 | January 3, 2015 | Change | % Change | ||||||||
| Operating Loss | (10,094 | ) | (12,449 | ) | 2,355 | 18.9% |
Operating loss at Corporate Services decreased by $2.4 million to $10.1 million for the year ended January 2, 2016, from a loss of $12.4 million for the year ended January 3, 2015. The table below explains the decrease in operating loss:
| SUNOPTA INC. | 65 | December 31, 2016 10-K |
| Corporate Services Operating Loss Changes | |
| Operating loss for the year ended January 3, 2015 | $(12,449) |
|
Increase in corporate cost allocations, due in part to the centralization of services |
10,477 |
|
Higher compensation-related costs due to increased headcount, health and workers compensation benefits, partially offset by lower short-term incentives |
(3,410) |
|
Increased information technology consulting, professional fees and other general office spending, partially offset by favorable impact on expenses due to the stronger U.S. dollar relative to the Canadian dollar |
(2,503) |
|
Increased professional fees associated with ongoing litigation |
(1,959) |
|
Increase in foreign exchange losses |
(250) |
| Operating loss for the year ended January 2, 2016 | $(10,094) |
Liquidity and Capital Resources
We have the following sources from which we can fund our operating cash requirements:
-
Existing cash and cash equivalents;
-
Available operating lines of credit;
-
Cash flows generated from operating activities, including working capital reduction efforts;
-
Cash flows generated from the exercise, if any, of stock options during the year;
-
Potential additional long-term financing, including the offer and sale of debt and/or equity securities; and
-
Potential sales of non-core divisions, or assets.
On February 11, 2016, we entered into a five-year, $350.0 million Global Credit Facility, which replaced our previous North American credit facilities, which were comprised of a $165.0 million facility and a C$10.0 million facility, that were set to expire January 27, 2017, and our €92.5 million multipurpose European credit facilities that were due on demand with no set maturity date. The Global Credit Facility will be used to support the working capital and general corporate needs of our global operations, in addition to funding future strategic initiatives. In addition, subject to customary borrowing conditions and the agreement of any such lenders to provide such increased commitments, we may request to increase the total lending commitments under this facility to a maximum aggregate principal amount not to exceed $450.0 million. The applicable margin in the Global Credit Facility ranges from 1.25% to 1.75% for loans bearing interest based on LIBOR and from 0.25% to 0.75% for loans bearing interest based on the prime rate and, in each case, is set quarterly based on average borrowing availability for the preceding fiscal quarter. As at December 31, 2016, we had outstanding borrowings of $199.3 million and approximately $100.0 million of available borrowing capacity under the Global Credit Facility. For more information on the Global Credit Facility, see note 11 to the consolidated financial statements in Item 15 of this Form 10-K.
On October 9, 2015, SunOpta Foods and certain of our other subsidiaries entered into the Second Lien Loan Agreement with a group of lenders, pursuant to which we borrowed an aggregate principal amount of $330.0 million of term loans (the “Initial Loans”). The net proceeds of the Second Lien Loan Agreement were used to partially fund the Sunrise Acquisition. As at October 1, 2016, we had repaid $20.0 million of the outstanding principal of the Initial Loans. On October 7, 2016, we used the net proceeds from the issuance of the Preferred Stock to repay an additional $79.0 million principal amount of the Initial Loans. The remaining $231.0 million aggregate principal amount of Initial Loans matured on October 9, 2016 and automatically converted into a like principal amount of term loans (such converted loans, the “Term Loans”), with a maturity date of October 9, 2022. The Term Loans bore interest at 9.5% per annum. On October 20, 2016, all of the outstanding Term Loans were exchanged for a corresponding amount of 9.5% Senior Secured Second Lien Notes due October 9, 2022 (the “Notes”) issued by SunOpta Foods. For more information on the Notes, see note 11 to the consolidated financial statements in Item 15 of this Form 10-K. The Second Lien Loan Agreement was terminated in connection with the issuance of the Notes.
| SUNOPTA INC. | 66 | December 31, 2016 10-K |
We have an effective registration statement on file with the U.S. Securities and Exchange Commission, pursuant to which we may offer up to $200.0 million of debt, equity and other securities. We also have a prospectus on file with Canadian securities regulators covering the offer and sale of up to $200.0 million of debt, equity and other securities. On September 30, 2015, we issued 16.7 million of our common shares for gross proceeds of $100.0 million under the U.S. registration statement and the Canadian prospectus. The net proceeds from this issuance were used to partially fund the Sunrise Acquisition. The remaining amount of $100.0 million available under U.S. registration statement and the Canadian prospectus could be used by us for a public offering of debt, equity or other securities to raise additional capital. Our ability to conduct any such future offerings will be subject to market conditions. The U.S. registration statement will expire in August 2017.
In order to finance significant acquisitions, if any, that may arise in the future, we may need additional sources of cash that we could attempt to obtain through a combination of additional bank or subordinated financing, a private or public offering of debt or equity securities, or the issuance of common stock as consideration in an acquisition. There can be no assurance that these types of financing would be available at all or, if so, on terms that are acceptable to us.
In the event that we require additional liquidity due to market conditions, unexpected actions by our lenders, changes to our growth strategy, or other factors, our ability to obtain any additional financing on favourable terms, if at all, could be limited.
Cash Flows
Fiscal 2016 Compared to Fiscal 2015
Net cash and cash equivalents related to continuing operations decreased $1.0 million to $1.3 million as at December 31, 2016, compared with $2.3 million at January 2, 2016, which primarily reflected the following uses of cash:
-
repayment of borrowings of $320.0 million under the Second Lien Loan Agreement;
-
capital expenditures of $22.6 million, mainly related to the automation of frozen fruit processing and to food safety and quality initiatives in connection with the Value Creation Plan; and
-
payment of $13.0 million of debt issuance costs related to the Notes and Global Credit Facility.
These uses of cash were mostly offset by the following sources of cash:
-
gross proceeds of $231.0 million on the issuance of the Notes;
-
net proceeds of $79.0 million on the issuance of the Preferred Stock; and
-
net borrowings of $44.3 million under our line of credit facilities.
Cash provided by operating activities of continuing operations was $0.7 million for the year ended December 31, 2016, compared with $26.4 million for the year ended January 2, 2016, a decrease in cash provided of $25.7 million, which reflected lower year-over-year operating performance in the fourth quarter of 2016, resulting in reduced inventory turnover, partially offset by the receipt of income tax refunds during 2016 related to 2015.
Cash used in investing activities of continuing operations was $21.6 million for the year ended December 31, 2016, compared with $521.6 million for the year ended January 2, 2016, a decrease in cash used of $500.0 million, which mainly reflected total cash paid of $490.7 million in connection with the Sunrise Acquisition, as well as upfront payments for Niagara Natural and Citrusource in 2015. In addition, capital expenditures declined year-over-year by $8.6 million, reflecting higher spending in 2015 related to a retrofit of the San Bernardino juice facility and the expansion of the Allentown aseptic beverage facility. Cash provided by investing activities of discontinued operations in 2016 reflected cash proceeds from the sale of Opta Minerals of $3.2 million, net of cash sold.
Cash provided by financing activities of continuing operations was $16.8 million for the year ended December 31, 2016, compared with cash provided of $490.0 million for the year ended January 2, 2016, a decrease in cash provided of $473.2 million, which mainly reflected debt and equity issuances in connection with the Sunrise Acquisition in 2015 for proceeds of $408.1 million in the aggregate, net of issuance costs. In addition, net borrowings under our line of credit facilities decreased $41.7 million in 2016, compared with 2015, reflecting borrowings of $79.2 million to finance a portion of the Sunrise Acquisition and upfront payments for Niagara Natural and Citrusource in 2015, partially offset by the payment of $13.0 million of debt issuance costs incurred in connection with the Notes and Global Credit Facility, and repayment of $10.0 million of borrowings under the Second Lien Loan Agreement and in 2016. In addition, we repaid the remaining $310.0 million outstanding under the Second Lien Loan Agreement with gross proceeds of $231.0 million from the issuance of the Notes and net proceeds of $79.0 million from the issuance of the Preferred Stock. In 2016, we also repaid in full outstanding borrowings of $192.7 million under our North American and European credit facilities with new borrowings under the Global Credit Facility.
| SUNOPTA INC. | 67 | December 31, 2016 10-K |
Fiscal 2015 Compared to Fiscal 2014
Net cash and cash equivalents related to continuing operations decreased $5.5 million to $2.3 million as at January 2, 2016, compared with $7.8 million at January 3, 2015, which primarily reflected the following uses of cash:
-
cash paid in connection with business acquisitions of $490.7 million in the aggregate;
-
capital expenditures of $31.2 million, which included $11.5 million of maintenance capital expenditures, as well as strategic spending related to the retrofit of the San Bernardino juice facility and expansion of the Allentown facility;
-
financing costs incurred primarily in connection with the Second Lien Loan Agreement of $16.0 million; and
-
repayments of long-term debt of $11.0 million, primarily related to the repayment of $10.0 million of borrowings under the Second Lien Loan Agreement.
These uses of cash were mostly offset by the following sources of cash:
-
borrowings of $330.0 million under the Second Lien Loan Agreement in connection with the Sunrise Acquisition;
-
net proceeds from the issuance of common shares of $94.1 million in connection with the Sunrise Acquisition;
-
net borrowings under our credit facilities of $86.0 million, mainly in connection with business acquisitions;
-
cash provided by continuing operating activities of $26.4 million; and
-
proceeds from the exercise of stock options and warrants of $7.8 million in the aggregate.
Cash provided by operating activities of continuing operations was $26.4 million for the year ended January 2, 2016, compared with $17.5 million for the year ended January 3, 2015, an increase of $8.9 million, reflecting strong working capital cash inflows and incremental cash flows from acquired businesses, partially offset by a decline in the year-over-year operating performance within our existing consumer products operations. Cash provided by operating activities of discontinued operations of $4.8 million and $7.3 million in 2015 and 2014, respectively, reflected the operations of Opta Minerals and the Fiber Business.
Cash used in investing activities of continuing operations increased by $509.9 million to $521.6 million for the year ended January 2, 2016, compared with $11.7 million for the year ended January 3, 2015, mainly due to the total cash paid of $490.7 million in connection with the Sunrise Acquisition, as well as the upfront payments for Niagara Natural and Citrusource. In addition, capital expenditures increased $13.5 million year-over-year, primarily reflecting the addition of aseptic processing and packaging capabilities at the Allentown facility. In 2014, we received cash proceeds of $5.8 million from the sale of the sunflower facilities. Cash provided by investing activities of discontinued operations of $34.5 million in 2014 primarily reflected the net proceeds from the sale of the Fiber Business of $36.9 million.
Cash provided by financing activities of continuing operations was $490.0 million for the year ended January 2, 2016, compared with cash used of $39.4 million for the year ended January 3, 2015, an increase in cash provided of $529.4 million, which mainly reflected the debt and equity issuances in connection with the Sunrise Acquisition for proceeds of $408.1 million in the aggregate, net of issuance costs. In addition, borrowings under our credit facilities increased $126.9 million year-over-year, including $59.2 million to finance a portion of the Sunrise Acquisition and $20.0 million to fund the Niagara Natural and Citrusource upfront payments. In addition, the year-over-year increase in credit facility borrowings reflected the higher capital spending in 2015, compared with 2014; repayment of $10.0 million of borrowings under the Second Lien Loan Agreement; and proceeds from the sale of the Fiber Business in 2014, which did not similarly occur in 2015, partially offset by increased operating cash flows and higher proceeds from the exercise of options and warrants in 2015, compared with 2014.
| SUNOPTA INC. | 68 | December 31, 2016 10-K |
Off – Balance Sheet Arrangements
There are currently no off-balance sheet arrangements that have or are reasonably likely to have a current or future material effect on our financial condition.
Contractual Obligations
The table below sets out our contractual obligations as at December 31, 2016:
|
|
|
|
|
|
Payments due by Period |
| |||||||||
|
|
|
Total |
|
|
2017 |
|
|
2018-2019 |
|
|
2020-2021 |
|
|
Thereafter |
|
|
|
$ |
|
$ |
|
$ |
|
$ |
|
$ |
| |||||
|
Bank indebtedness |
|
201,494 |
|
|
201,494 |
|
|
- |
|
|
- |
|
|
- |
|
|
Long-term debt |
|
239,922 |
|
|
2,079 |
|
|
4,731 |
|
|
946 |
|
|
232,166 |
|
|
Interest on bank indebtedness and long-term debt(1) |
|
138,652 |
|
|
27,811 |
|
|
44,475 |
|
|
44,222 |
|
|
22,144 |
|
|
Purchase commitments |
|
218,690 |
|
|
218,690 |
|
|
- |
|
|
- |
|
|
- |
|
|
Operating leases |
|
107,143 |
|
|
26,959 |
|
|
43,817 |
|
|
23,890 |
|
|
12,477 |
|
|
Long-term liabilities |
|
21,137 |
|
|
5,500 |
|
|
15,637 |
|
|
- |
|
|
- |
|
|
Commodity and foreign exchange contracts |
|
(421) |
|
|
(429) |
|
|
8 |
|
|
- |
|
|
- |
|
|
|
|
926,617 |
|
|
482,104 |
|
|
108,668 |
|
|
69,058 |
|
|
266,787 |
|
| (1) |
Interest on bank indebtedness is calculated based on scheduled repayments over the periods as indicated, using existing interest rates at December 31, 2016, as disclosed in note 11 to the consolidated financial statements included in Item 15 of this Form 10-K. |
The preceding table excludes a liability for uncertain tax benefits totalling $0.5 million, as we cannot currently make a reliable estimate of the period in which the liability will be payable, if ever.
Item 7A. Quantitative and Qualitative Disclosures About Market Risk
Interest rate risk
Variable and fixed rate borrowings carry different types of interest rate risk. Variable rate debt gives less predictability to earnings and cash flows as interest rates change, while the fair value of fixed rate debt is affected by changes in interest rates. As at December 31, 2016, we had $201.5 million and $239.9 million principal amount of variable and fixed rate debt, respectively, with weighted-average interest rates of 2.7% and 9.3%, respectively. A 100 basis-point change in interest rates would have an after-tax effect of $1.2 million on our earnings and cash flows, based on current outstanding borrowings and effective interest rates on our variable rate debt. While our variable-rate debt may impact earnings and cash flows as interest rates change, it is not subject to changes in fair value.
As at December 31, 2016, most of our fixed rate debt was comprised of the Notes. If interest rates were to increase or decrease by 100 basis-points, the fair value of the Notes was would increase or decrease by approximately $10.0 million.
Foreign currency risk
All of our U.S. subsidiaries use the U.S. dollar as their functional currency, and the U.S. dollar is also our reporting currency. In addition, the functional currency of our Canadian and Mexican operations is the U.S. dollar. The functional currency of our operations located in Europe are principally the euro. For these operations, gains (losses) on translation of net assets to U.S. dollars on consolidation are recorded in accumulated other comprehensive income within shareholders’ equity. We are exposed to foreign exchange rate fluctuations as the financial results of our European subsidiaries are translated into U.S. dollars on consolidation. A 10% change in the exchange rates for the euro would affect the carrying value of our net assets by approximately $5.7 million, with a corresponding impact to accumulated other comprehensive income.
| SUNOPTA INC. | 69 | December 31, 2016 10-K |
The euro depreciated against the U.S. dollar during 2016, with closing rates moving from $1.0859 at January 2, 2016 to $1.0553 at December 31, 2016. The Canadian dollar appreciated relative to the U.S. dollar in 2016, with closing rates moving from $0.7225 at January 2, 2016 to $0.7448 at December 31, 2016 for each U.S. dollar.
Our operations based in the U.S. have limited exposure to other currencies since almost all sales and purchases are made in U.S. dollars. The European operations are exposed to various currencies as they purchase product from a wide variety of countries in several currencies and primarily sell into the European market. It is our intention to hold excess funds in the currency in which the funds are likely to be used, which will from time to time potentially expose us to exchange rate fluctuations when converted into U.S. dollars. In addition, we enter into forward foreign exchange contracts to reduce exposure to fluctuations in foreign currency exchange rates. Open forward foreign exchange contracts were marked-to-market at December 31, 2016, resulting in a gain of $1.0 million (January 2, 2016 - loss of $0.7 million), which is included in foreign exchange on the consolidated statements of operations.
Commodity risk
We enter into exchange-traded commodity futures and options contracts to hedge its exposure to price fluctuations on grain and certain other commodity transactions to the extent considered practicable for minimizing risk from market price fluctuations. Futures contracts used for hedging purposes are purchased and sold through regulated commodity exchanges. Inventories, however, may not be completely hedged, due in part to our assessment of our exposure from expected price fluctuations. Exchange purchase and sales contracts may expose us to risk in the event that the counterparty to a transaction is unable to fulfill its contractual obligation. We manage our risk by entering into purchase contracts with pre-approved growers.
We have a risk of loss from hedging activities if a grower does not deliver as scheduled. Sales contracts are entered into with organizations of acceptable creditworthiness, as internally evaluated. All futures transactions are marked to market. Gains and losses on futures transactions related to grain inventories are included in cost of goods sold. As at December 31, 2016, we owned 354,699 (January 2, 2016 – 216,180) bushels of corn with a weighted-average price of $3.17 (January 2, 2016 – $3.39) and 569,943 (January 2, 2016 – 399,985) bushels of soybeans with a weighted-average price of $10.74 (January 2, 2016 – $9.93) . As at December 31, 2016, we had a net short position on corn of 10,937 (January 2, 2016 – net short position of 12,357) bushels and a net short position on soybeans of 43,866 (January 2, 2016 – net short position of 30,760). An increase or decrease in commodity prices of either soy or corn of 10% would not result in a material change in the carrying value of these commodities.
In addition, we enter into forward contracts to hedge our cocoa and coffee positions in an effort to minimize price fluctuations. As at December 31, 2016, we had net open forward contracts to sell 142 lots of cocoa (January 2, 2016 – 144 lots) and 21 lots of coffee (January 2, 2016 – 13 lots). A 10% change in the commodity price of cocoa and coffee would impact the fair value of these derivative instruments by $0.2 million (January 2, 2016 – $0.4 million) and $0.1 million (January 2, 2016 – $0.1 million), respectively.
Item 8. Financial Statements and Supplementary Data
The consolidated financial statements required by this item are set forth immediately following the signature page to this Form 10-K beginning on page F-1 and are incorporated herein by reference.
Item 9. Changes in and Disagreements With Accountants on Accounting and Financial Disclosure
None.
| SUNOPTA INC. | 70 | December 31, 2016 10-K |
Item 9A - Controls and Procedures
Evaluation of Disclosure Controls and Procedures
Our management has established disclosure controls and procedures designed to ensure that information required to be disclosed by the Company in the reports that it files or submits under the Securities Exchange Act of 1934, as amended (the “Exchange Act”) is recorded, processed, summarized and reported within time periods specified in the Securities and Exchange Commission’s rules and forms. Such disclosure controls and procedures include, without limitation, controls and procedures designed to ensure that information required to be disclosed by the Company in the reports that it files or submits under the Exchange Act is accumulated and communicated to its management to allow timely decisions regarding required disclosure.
Under the supervision and with the participation of our management, including our Chief Executive Officer and Chief Financial Officer, we conducted an evaluation of our disclosure controls and procedures (as such term is defined under Rule 13a-15(e) promulgated under the Exchange Act) as of the end of the period covered by this annual report. Based on this evaluation, our Chief Executive Officer and our Chief Financial Officer concluded that our disclosure controls and procedures were effective as of December 31, 2016.
Management’s Annual Report on Internal Control Over Financial Reporting
Our management is responsible for establishing and maintaining adequate internal control over financial reporting, as defined in Rule 13a-15(f) under the Exchange Act.
Our internal control framework and processes are designed to provide reasonable assurance to management and our board of directors regarding the reliability of financial reporting and the preparation of our consolidated financial statements in accordance with accounting principles generally accepted in the United States of America.
Because of its inherent limitations, internal control over financial reporting may not prevent or detect misstatements. Projections of any evaluation of effectiveness to future periods are subject to the risk that controls may become inadequate because of changes in conditions, or that the degree of compliance with the policies or procedures may deteriorate.
Management assessed the effectiveness of our internal control over financial reporting as of December 31, 2016. In making this assessment, management used the criteria set forth by the Committee on Sponsoring Organizations of the Treadway Commission in Internal Control—Integrated Framework (2013).
Based on its assessment, our management concluded that our internal control over financial reporting was effective as of December 31, 2016, based on those criteria.
The effectiveness of our internal control over financial reporting as of December 31, 2016 has been audited by Deloitte LLP, Independent Registered Public Accounting Firm that also audited our consolidated financial statements for the year ended December 31, 2016, as stated in their reports which appear herein.
Changes in Internal Control Over Financial Reporting
There were no changes in our internal control over financial reporting during the quarter ended December 31, 2016 that materially affected, or are reasonably likely to materially affect, our internal control over financial reporting.
| SUNOPTA INC. | 71 | December 31, 2016 10-K |
Report of Independent Registered Public Accounting Firm
To the Board of Directors and Shareholders of SunOpta Inc.:
We have audited the internal control over financial reporting of SunOpta Inc. and subsidiaries (the “Company”) as of December 31, 2016, based on criteria established in Internal Control—Integrated Framework (2013) issued by the Committee of Sponsoring Organizations of the Treadway Commission. The Company’s management is responsible for maintaining effective internal control over financial reporting and for its assessment of the effectiveness of internal control over financial reporting, included in the accompanying “Management’s Annual Report on Internal Control Over Financial Reporting”. Our responsibility is to express an opinion on the Company’s internal control over financial reporting based on our audit.
We conducted our audit in accordance with the standards of the Public Company Accounting Oversight Board (United States). Those standards require that we plan and perform the audit to obtain reasonable assurance about whether effective internal control over financial reporting was maintained in all material respects. Our audit included obtaining an understanding of internal control over financial reporting, assessing the risk that a material weakness exists, testing and evaluating the design and operating effectiveness of internal control based on the assessed risk, and performing such other procedures as we considered necessary in the circumstances. We believe that our audit provides a reasonable basis for our opinion.
A company’s internal control over financial reporting is a process designed by, or under the supervision of, the company’s principal executive and principal financial officers, or persons performing similar functions, and effected by the company's board of directors, management, and other personnel to provide reasonable assurance regarding the reliability of financial reporting and the preparation of financial statements for external purposes in accordance with generally accepted accounting principles. A company’s internal control over financial reporting includes those policies and procedures that (1) pertain to the maintenance of records that, in reasonable detail, accurately and fairly reflect the transactions and dispositions of the assets of the company; (2) provide reasonable assurance that transactions are recorded as necessary to permit preparation of financial statements in accordance with generally accepted accounting principles, and that receipts and expenditures of the company are being made only in accordance with authorizations of management and directors of the company; and (3) provide reasonable assurance regarding prevention or timely detection of unauthorized acquisition, use, or disposition of the company's assets that could have a material effect on the financial statements.
Because of the inherent limitations of internal control over financial reporting, including the possibility of collusion or improper management override of controls, material misstatements due to error or fraud may not be prevented or detected on a timely basis. Also, projections of any evaluation of the effectiveness of the internal control over financial reporting to future periods are subject to the risk that the controls may become inadequate because of changes in conditions, or that the degree of compliance with the policies or procedures may deteriorate.
In our opinion, the Company maintained, in all material respects, effective internal control over financial reporting as of December 31, 2016, based on the criteria established in Internal Control—Integrated Framework (2013) issued by the Committee of Sponsoring Organizations of the Treadway Commission.
We have also audited, in accordance with the standards of the Public Company Accounting Oversight Board (United States), the consolidated financial statements as at and for the year ended December 31, 2016 of the Company and our report dated March 2, 2017 expressed an unqualified opinion on those financial statements.
| /s/ Deloitte LLP |
| Chartered Professional Accountants |
| Licensed Public Accountants |
| Toronto, Canada |
| March 2, 2017 |
Item 9B. Other Information
None.
| SUNOPTA INC. | 72 | December 31, 2016 10-K |
PART III
Item 10. Directors, Executive Officers and Corporate Governance
The information required under this item is incorporated herein by reference to our Definitive Proxy Statement for the Annual Meeting of Shareholders to be filed with the Securities and Exchange Commission not later than 120 days after December 31, 2016 (the “2017 Proxy Statement”).
Item 11. Executive Compensation
The information required under this item is incorporated herein by reference from the 2017 Proxy Statement.
Item 12. Security Ownership of Certain Beneficial Owners and Management and Related Stockholder Matters
The information required under this item is incorporated herein by reference from the 2017 Proxy Statement.
Item 13. Certain Relationships and Related Transactions, and Director Independence
The information required under this item is incorporated herein by reference from the 2017 Proxy Statement.
Item 14. Principal Accounting Fees and Services
The information required under this item is incorporated herein by reference from the 2017 Proxy Statement.
PART IV
Item 15. Exhibits and Financial Statement Schedules
The following documents are being filed as part of this annual report.
| 1. |
Financial Statements. See “Index to Consolidated Financial Statements” set forth on page F1. |
| 2. |
Financial Statement Schedules. All schedules for which provision is made in the applicable accounting requirements of the Securities and Exchange Commission are not required or the required information has been included within the financial statements or the notes thereto. |
| 3. |
Exhibits. The list of exhibits in the Exhibit Index included in this annual report is incorporated herein by reference. |
EXHIBIT INDEX
| Exhibits | Description | |
| 2.1+ |
Asset Purchase Agreement, dated August 11, 2015, among SunOpta Inc., Niagara Natural Fruit Snack Company Inc., John Boot and Guy Armstrong (incorporated by reference to Exhibit 2.1 to the Company’s Current Report on Form 8-K filed on August 17, 2015). | |
|
| ||
| 3.1 |
Amalgamation of Stake Technology Ltd. and 3754481 Canada Ltd. (formerly George F. Pettinos (Canada) Limited) (incorporated by reference to Exhibit 3.1 to the Company’s Annual Report on Form 10-KSB for the year ended December 31, 2000). | |
|
| ||
| 3.2 |
Certificate of Amendment, dated October 31, 2003, to change the Company’s name from Stake Technology Ltd. to SunOpta Inc. (incorporated by reference to Exhibit 3i(b) to the Company’s Annual Report on Form 10-K for the year ended December 31, 2003). |
| SUNOPTA INC. | 73 | December 31, 2016 10-K |
| Exhibits | Description | |
| 3.3 |
Articles of Amalgamation of SunOpta Inc. and Sunrich Valley Inc., Integrated Drying Systems Inc., Kettle Valley Dried Fruits Ltd., Pro Organics Marketing Inc., Pro Organics Marketing (East) Inc., 4157648 Canada Inc. and 4198000 Canada Ltd., dated January 1, 2004 (incorporated by reference to Exhibit 3i(c) to the Company’s Annual Report on Form 10-K for the year ended December 31, 2003). | |
| 3.4 |
Articles of Amalgamation of SunOpta Inc. and 6319734 Canada Inc., 4157656 Canada Inc. Kofman-Barenholtz Foods Limited, dated January 1, 2005 (incorporated by reference to Exhibit 3i(d) to the Company’s Annual Report on Form 10-K for the year ended December 31, 2004). | |
| 3.5 |
Articles of Amalgamation of SunOpta Inc. and 4307623 Canada Inc., dated January 1, 2006 (incorporated by reference to Exhibit 3i(e) to the Company’s Annual Report on Form 10-K for the year ended December 31, 2005). | |
| 3.6 |
Articles of Amalgamation of SunOpta Inc., 4208862 SunOpta Food Ingredients Canada Ltd., 4406150 Canada Inc. and 4406168 Canada Inc., dated January 1, 2007 (incorporated by reference to Exhibit 3i(f) to the Company’s Annual Report on Form 10-K for the year ended December 31, 2007). | |
| 3.7 |
Articles of Amalgamation of SunOpta Inc. and 4460596 Canada Inc., dated January 1, 2008 (incorporated by reference to Exhibit 3i(g) to the Company’s Annual Report on Form 10-K for the year ended December 31, 2007). | |
| 3.8 |
Amended and Restated By-law No. 14, dated May 27, 2010 (incorporated by reference to Exhibit 4.4 to the Company’s Registration Statement on Form S-3 filed on July 3, 2014). | |
| 3.9 |
Certificate of Amendment, dated July 10, 2013, to authorize the directors to fix the number of directors to be elected by the shareholders and to appoint one or more directors (incorporated by reference to Exhibit 4.3 to the Company’s Registration Statement on Form S-3 filed on July 3, 2014). | |
| 3.10 |
By-Law Number 15 of SunOpta Inc. (incorporated by reference to Exhibit 3.1 to the Company’s Current Report on Form 8-K filed on November 13, 2015). | |
| 4.1 |
Form of Certificate representing Common Shares, no par value (incorporated by reference to Exhibit 4.9 to the Company’s Registration Statement on Form S-8 filed on September 2, 2011). | |
| 4.2 |
Shareholder Rights Plan Agreement, dated November 10, 2015, between SunOpta Inc. and American Stock Transfer & Trust Company LLC, as rights agent (incorporated by reference to Exhibit 4.1 to the Company’s Current Report on Form 8-K filed on November 13, 2015). | |
| 4.3 |
Amended and Restated Shareholder Rights Plan Agreement, dated November 10, 2015, amended and restated as of April 18, 2016, between SunOpta Inc. and American Stock Transfer & Trust Company LLC, as rights agent (incorporated by reference to Exhibit 4.1 to the Company’s Current Report on Form 8-K filed on April 20, 2016). | |
| 4.4 |
Amended and Restated Certificate of Incorporation of SunOpta Foods Inc., setting forth the terms of its Series A Preferred Stock, which is exchangeable for Common Shares of SunOpta Inc. (incorporated by reference to Exhibit 4.1 to the Company’s Current Report on Form 8-K filed on October 12, 2016). | |
| 4.5 |
Articles of Amendment of SunOpta Inc., setting forth the terms of its Special Shares, Series 1 (incorporated by reference to Exhibit 4.2 to the Company’s Current Report on Form 8-K filed on October 12, 2016). |
| SUNOPTA INC. | 74 | December 31, 2016 10-K |
| Exhibits | Description | |
| 4.6 |
Indenture, dated as of October 20, 2016, among SunOpta Foods, the guarantors named therein and U.S. Bank National Association, as trustee and notes collateral agent (incorporated by reference to Exhibit 4.1 to the Company’s Current Report on Form 8-K filed on October 26, 2016). | |
| 4.7 |
Form of 9.5% Senior Secured Second Lien Notes due 2022 (incorporated by reference to Exhibit 4.2 to the Company’s Current Report on Form 8-K filed on October 26, 2016). | |
| 4.8 |
Second Lien U.S. Security Agreement, dated as of October 20, 2016, among the grantors referred therein and the Notes Collateral Agent (incorporated by reference to Exhibit 4.3 to the Company’s Current Report on Form 8-K filed on October 26, 2016). | |
| 4.9 |
Second Lien Canadian Security Agreement, dated as of October 20, 2016, among the grantors referred therein and the Notes Collateral Agent (incorporated by reference to Exhibit 4.4 to the Company’s Current Report on Form 8-K filed on October 26, 2016). | |
| 4.10 |
Amended and Restated Intercreditor Agreement, dated as of October 20, 2016, among Bank of America, N.A. as first lien collateral agent, the Notes Collateral Agent and the grantors referred therein (incorporated by reference to Exhibit 4.5 to the Company’s Current Report on Form 8-K filed on October 26, 2016). | |
| 10.1† |
Employee Stock Purchase Plan amended March 4, 2013 (incorporated by reference to Exhibit 10.1 to the Company’s Annual Report on Form 10-K for the year ended December 29, 2012). | |
| 10.2† |
Retiring Allowance Agreement, dated March 8, 2011, between the Company and Jeremy Kendall which terminates and supercedes the Employment Agreement dated October 1, 2001 between the Company and Mr. Jeremy Kendall, as amended (incorporated by reference to Exhibit 10.3 to the Company’s Annual Report on Form 10-K for the year ended December 31, 2010). | |
| 10.3† |
SunOpta Inc. 2002 Stock Option Plan, Amended and Restated May 2011 (incorporated by reference to Exhibit 10.1 to the Company’s Current Report on Form 8-K filed on May 24, 2011). | |
| 10.4† |
Letter Agreement, dated October 10, 2011, by and between SunOpta Inc. and Robert McKeracher (incorporated by reference to Exhibit 10.1 to the Company’s Quarterly Report on Form 10-Q for the quarter ended October 1, 2011). | |
| 10.5† |
Amendment to Employment Agreement, dated May 6, 2012, between SunOpta Inc. and Steven R. Bromley (incorporated by reference to Exhibit 10.1 to the Company’s Current Report on Form 8-K filed on May 11, 2012). | |
| 10.6† |
Retirement and Consulting Agreement, dated January 10, 2014, between SunOpta Grains and Foods, Inc. and Allan G. Routh (incorporated by reference to Exhibit 10.1 to the Company’s Current Report on Form 8-K filed on January 13, 2014). | |
| 10.7 |
Stock Deferral Plan for Non-Employee Directors dated August 12, 2014 (incorporated by reference to Exhibit 10.1 to the Company’s Quarterly Report on Form 10-Q for the quarter ended July 5, 2014). | |
| 10.8† |
Letter Agreement re Terms of Employment, dated October 10, 2011, by and between SunOpta Inc. and John Ruelle (incorporated by reference to Exhibit 10.13 to the Company’s Annual Report on Form 10-K for the year ended January 3, 2015). | |
| 10.9† |
Letter Agreement re Amendment of Terms of Employment, dated April 5, 2013, by and between SunOpta Inc. and John Ruelle (incorporated by reference to Exhibit 10.14 to the Company’s Annual Report on Form 10-K for the year ended January 3, 2015). |
| SUNOPTA INC. | 75 | December 31, 2016 10-K |
| Exhibits |
Description | |
| 10.10† |
Letter Agreement re Amendment of Terms of Employment, dated December 30, 2014, by and between SunOpta Inc. and John Ruelle (incorporated by reference to Exhibit 10.15 to the Company’s Annual Report on Form 10-K for the year ended January 3, 2015). | |
| 10.11† |
Employment Agreement, dated April 2012, by and between The Organic Corporation B.V. and G.J.M. Versteegh (incorporated by reference to Exhibit 10.16 to the Company’s Annual Report on Form 10-K for the year ended January 3, 2015). | |
| 10.12† |
Employment Agreement, dated July 6, 2015, between SunOpta Inc. and Hendrik Jacobs (incorporated by reference to Exhibit 10.1 to the Company’s Current Report on Form 8-K filed on July 7, 2015). | |
| 10.13† |
Separation Agreement, dated July 6, 2015, between SunOpta Inc. and Steven Bromley (incorporated by reference to Exhibit 10.2 to the Company’s Current Report on Form 8-K filed on July 7, 2015). | |
| 10.14 |
Commitment Letter dated July 30, 2015, among SunOpta Inc., SunOpta Foods Inc., Bank of Montreal and BMO Capital Corp. (incorporated by reference to Exhibit 10.1 to the Company’s Current Report on Form 8-K filed on August 3, 2015). | |
| 10.15+ |
Second Lien Loan Agreement, dated October 9, 2015, among SunOpta Inc., as Holdings, SunOpta Foods Inc., as the Borrower, Certain Subsidiaries of SunOpta Inc., as Subsidiary Guarantors and Loan Parties, the Several Lenders from Time to Time Parties Hereto, Bank of Montreal, as Administrative Agent and Collateral Agent, BMO Capital Markets Corp. and Co†peratieve Centrale Raiffeisen-Boerenleenbank B.A., “Rabobank Nederland”, New York Branch, as Joint Lead Arrangers and Joint Bookrunners (incorporated by reference to Exhibit 10.5 to the Company’s Quarterly Report on Form 10-Q for the quarter ended October 3, 2015). | |
| 10.16+ |
Credit Agreement, dated as of February 11, 2016, among SunOpta Inc., SunOpta Foods Inc., The Organic Corporation B.V., the other borrowers and guarantors party thereto, the lenders party thereto, Bank of America, N.A., as U.S. Administrative Agent, Bank of America, N.A. (acting through its Canada Branch), as Canadian Administrative Agent, Bank of America, N.A. (acting through its London Branch), as Dutch Administrative Agent, and Bank of America, N.A., as Collateral Agent (incorporated by reference to Exhibit 10.1 to the Company’s Current Report on Form 8-K filed on February 17, 2016). | |
| 10.17 |
Support Agreement dated February 12, 2016, among SunOpta Inc., Wedge Acquisition Inc. and Wedge Acquisition Holdings Inc. (incorporated by reference to Exhibit 10.1 to the Company’s Current Report on Form 8-K filed on February 18, 2016). | |
| 10.18 |
Second Amending Agreement, dated October 9, 2015, amending the Seventh Amended and Restated Credit Agreement, among SunOpta Inc. and SunOpta Foods, as Borrowers, Each of the Financial Institutions and Other Entities from Time to Time Parties Thereto, as Lenders, Certain Affiliates of the Borrowers, as Obligors, and Bank of Montreal, as Agent (incorporated by reference to Exhibit 10.19 to the Company’s Annual Report on Form 10-K for the year ended January 2, 2016). | |
| 10.19† |
Employment Agreement, dated July 6, 2015, between SunOpta Inc. and Edward Haft (incorporated by reference to Exhibit 10.20 to the Company’s Annual Report on Form 10-K for the year ended January 2, 2016). | |
| 10.20† |
Amended 2013 Stock Incentive Plan (incorporated by reference to Exhibit C to the Company’s Definitive Proxy Statement on Schedule 14A filed on March 31, 2016). |
| SUNOPTA INC. | 76 | December 31, 2016 10-K |
| Exhibits |
Description | |
| 10.21† |
Form of Incentive Stock Option Award Agreement under Amended 2013 Stock Incentive Plan (incorporated by reference to Exhibit 10.2 to the Company’s Quarterly Report on Form 10-Q for the quarter ended July 2, 2016). | |
| 10.22† |
Form of Restricted Stock Unit Award Agreement (Non-Employee Directors) under Amended 2013 Stock Incentive Plan (incorporated by reference to Exhibit 10.3 to the Company’s Quarterly Report on Form 10-Q for the quarter ended July 2, 2016). | |
| 10.23† |
Form of 2016 Performance Share Unit Award Agreement under 2013 Amended Stock Incentive Plan (incorporated by reference to Exhibit 10.4 to the Company’s Quarterly Report on Form 10-Q for the quarter ended July 2, 2016). | |
| 10.24† |
Employment Agreement, dated March 17, 2013, by and between SunOpta Inc. and Michelle Coleman (incorporated by reference to Exhibit 10.5 to the Company’s Quarterly Report on Form 10-Q for the quarter ended October 1, 2016). | |
| 10.25† |
Employment Agreement, dated August 18, 2016, by and between SunOpta Inc. and Jill E. Barnett (incorporated by reference to Exhibit 10.6 to the Company’s Quarterly Report on Form 10-Q for the quarter ended October 1, 2016). | |
| 10.26† |
Employment Agreement, dated August 18, 2016, by and between SunOpta Inc. and James P. Gratzek (incorporated by reference to Exhibit 10.7 to the Company’s Quarterly Report on Form 10-Q for the quarter ended October 1, 2016). | |
| 10.27† |
Employment Agreement Amendment, dated August 18, 2016, by and between SunOpta Inc. and Edward Haft (incorporated by reference to Exhibit 10.8 to the Company’s Quarterly Report on Form 10-Q for the quarter ended October 1, 2016). | |
| 10.28† |
Employment Agreement Amendment, dated August 19, 2016, by and between The Organic Corporation B.V. and G.J.M. Versteegh (incorporated by reference to Exhibit 10.9 to the Company’s Quarterly Report on Form 10-Q for the quarter ended October 1, 2016). | |
| 10.29† |
Separation Agreement, dated August 22, 2016, by and between SunOpta Inc. and Daniel Turney (incorporated by reference to Exhibit 10.10 to the Company’s Quarterly Report on Form 10-Q for the quarter ended October 1, 2016). | |
| 10.30 |
First Amendment, dated as of October 7, 2016, to the Credit Agreement, dated as of February 11, 2016, among SunOpta Inc., SunOpta Foods Inc., The Organic Corporation B.V., each of the other borrowers and guarantors party thereto from time to time, the lenders party thereto from time to time, Bank of America, N.A., as U.S. Administrative Agent, Bank of America, N.A. (acting through its Canada Branch), as Canadian Administrative Agent, Bank of America, N.A. (acting through its London Branch), as Dutch Administrative Agent under the Dutch, and Bank of America, N.A, as Collateral Agent (incorporated by reference to Exhibit 10.11 to the Company’s Quarterly Report on Form 10-Q for the quarter ended October 1, 2016). | |
| 10.31 |
First Amendment, dated as of October 7, 2016, to the Second Lien Loan Agreement, dated as of October 9, 2015, among SunOpta Inc., SunOpta Foods Inc., certain subsidiaries of SunOpta Inc., the several banks and other financial institutions or entities from time to time party thereto, and Bank of Montreal, as Administrative Agent and Collateral Agent (incorporated by reference to Exhibit 10.12 to the Company’s Quarterly Report on Form 10-Q for the quarter ended October 1, 2016). |
| SUNOPTA INC. | 77 | December 31, 2016 10-K |
| Exhibits |
Description | |
| 10.32 |
Subscription Agreement, dated October 7, 2016, between SunOpta Inc., SunOpta Foods Inc. and Oaktree Organics, L.P. and Oaktree Huntington Investment Fund II, L.P. (incorporated by reference to Exhibit 10.1 to the Company’s Current Report on Form 8-K filed on October 12, 2016). | |
| 10.33 |
Investor Rights Agreement, dated October 7, 2016, between SunOpta Inc., SunOpta Foods Inc. and Oaktree Organics, L.P. and Oaktree Huntington Investment Fund II, L.P. (incorporated by reference to Exhibit 10.2 to the Company’s Current Report on Form 8-K filed on October 12, 2016). | |
| 10.34 |
Exchange and Support Agreement, dated October 7, 2016, between SunOpta Inc., SunOpta Foods Inc., Oaktree Organics, L.P. and Oaktree Huntington Investment Fund II, L.P. and any person that becomes a Holder of Preferred Stock, from time to time (incorporated by reference to Exhibit 10.3 to the Company’s Current Report on Form 8-K filed on October 12, 2016). | |
| 10.35 |
Voting Trust Agreement, dated October 7, 2016, between SunOpta Inc., SunOpta Foods Inc., the trustee named therein, Oaktree Organics, L.P. and Oaktree Huntington Investment Fund II, L.P. and any other Holder of Preferred Stock, from time to time (incorporated by reference to Exhibit 10.4 to the Company’s Current Report on Form 8-K filed on October 12, 2016). | |
| 10.36† |
Letter Agreement, dated November 8, 2016, between Hendrik Jacobs and SunOpta Inc. (incorporated by reference to Exhibit 10.1 to the Company’s Current Report on Form 8-K filed on November 15, 2016). | |
|
| ||
| 10.37† |
Letter Agreement, dated November 8, 2016, between Robert McKeracher and SunOpta Inc. (incorporated by reference to Exhibit 10.2 to the Company’s Current Report on Form 8-K filed on November 15, 2016). | |
| 10.38† |
Letter Agreement, dated November 8, 2016, between John Ruelle and SunOpta Inc. (incorporated by reference to Exhibit 10.3 to the Company’s Current Report on Form 8-K filed on November 15, 2016). | |
| 10.39† |
Letter Agreement, dated November 8, 2016, between Gerard Versteegh and SunOpta Inc. (incorporated by reference to Exhibit 10.4 to the Company’s Current Report on Form 8-K filed on November 15, 2016). | |
| 10.40† |
Employment Agreement, effective February 6, 2017, between SunOpta Inc. and David J. Colo (incorporated by reference to Exhibit 10.1 to the Company’s Current Report on Form 8-K filed on February 7, 2017). | |
| 10.41† |
Restricted Stock Award Agreement, dated effective February 6, 2017, between SunOpta Inc. and David J. Colo (incorporated by reference to Exhibit 10.1 to the Company’s Current Report on Form 8-K filed on February 7, 2017). | |
| 10.42† |
Stock Option Award Agreement, dated effective February 6, 2017, between SunOpta Inc. and David J. Colo (incorporated by reference to Exhibit 10.1 to the Company’s Current Report on Form 8-K filed on February 7, 2017). | |
| 10.43† |
Performance Share Unit Award Agreement, dated effective February 6, 2017, between SunOpta Inc. and David J. Colo (incorporated by reference to Exhibit 10.1 to the Company’s Current Report on Form 8-K filed on February 7, 2017). | |
| 21* | ||
| 23.1* |
Consent of Deloitte LLP, Independent Registered Public Accounting Firm. |
| SUNOPTA INC. | 78 | December 31, 2016 10-K |
| Exhibits | Description | |
| 31.1* | ||
|
| ||
| 31.2* | ||
|
| ||
| 32* | ||
|
| ||
| 101.INS* | ||
|
| ||
| 101.SCH* | ||
|
| ||
| 101.CAL* | ||
|
| ||
| 101.DEF* | ||
|
| ||
| 101.LAB* | ||
|
| ||
| 101.PRE* |
| + | Exhibits and schedules to this exhibit have been omitted pursuant to Item 601(b)(2) of Regulation S-K. SunOpta will furnish copies of the omitted exhibits and schedules to the Securities and Exchange Commission upon its request. |
| † | Indicates management contract or compensatory plan or arrangement. |
| * | Filed herewith. |
| SUNOPTA INC. | 79 | December 31, 2016 10-K |
SIGNATURES
Pursuant to the requirements of Section 13 or 15(d) of the Securities Exchange Act of 1934, the registrant has duly caused this report to be signed on its behalf by the undersigned, thereunto duly authorized.
| SUNOPTA INC. |
| /s/ Robert McKeracher |
| Robert McKeracher |
| Vice President and Chief Financial Officer |
| Date: March 2, 2017 |
Pursuant to the requirements of the Securities Exchange Act of 1934, this report has been signed below by the following persons on behalf of the registrant and in the capacities and on the dates indicated.
| Signature | Title | Date |
| /s/ David Colo David Colo |
President, Chief Executive Officer and Director
(Principal Executive Officer) |
March 2, 2017 |
| /s/ Robert McKeracher Robert McKeracher |
Vice President and Chief Financial Officer
(Principal Financial and Accounting Officer) |
March 2, 2017 |
| /s/ Dean Hollis Dean Hollis |
Chair of the Board and Director |
March 2, 2017 |
| /s/ Margaret Shan Atkins Margaret Shan Atkins |
Director | March 2, 2017 |
| /s/ Al Bolles Al Bolles |
Director | March 2, 2017 |
| /s/ Michael Detlefsen Michael Detlefsen |
Director | March 2, 2017 |
| /s/ Katrina Houde Katrina Houde |
Director | March 2, 2017 |
| /s/ Brendan Springstubb Brendan Springstubb |
Director | March 2, 2017 |
| /s/ Gregg Tanner Gregg Tanner |
Director | March 2, 2017 |
| SUNOPTA INC. | 80 | December 31, 2016 10-K |
SunOpta Inc.
Index to Consolidated Financial Statements
| Page | |
| Report of Independent Registered Public Accounting Firm | F2 |
| Consolidated Statements of Operations For the years ended December 31, 2016, January 2, 2016 and January 3, 2015 | F3 |
| Consolidated Statements of Comprehensive Earnings (Loss) For the years ended December 31, 2016, January 2, 2016 and January 3, 2015 | F4 |
| Consolidated Balance Sheets As at December 31, 2016 and January 2, 2016 | F5 |
| Consolidated Statements of Shareholders’ Equity As at and for the years ended December 31, 2016, January 2, 2016 and January 3, 2015 | F6 |
| Consolidated Statements of Cash Flows For the years ended December 31, 2016, January 2, 2016 and January 3, 2015 | F7 |
| Notes to Consolidated Financial Statements For the years ended December 31, 2016, January 2, 2016 and January 3, 2015 | F9 |
| SUNOPTA INC. | -F1- | December 31, 2016 10-K |
Report of Independent Registered Public Accounting Firm
To the Board of Directors and Shareholders of SunOpta Inc.:
We have audited the accompanying consolidated balance sheets of SunOpta Inc. and subsidiaries (the “Company”) as at December 31, 2016 and January 2, 2016, and the related consolidated statements of operations, comprehensive earnings (loss), shareholders’ equity, and cash flows for each of the years in the three year period ended December 31, 2016. These financial statements are the responsibility of the Company's management. Our responsibility is to express an opinion on these financial statements based on our audits.
We conducted our audits in accordance with the standards of the Public Company Accounting Oversight Board (United States). Those standards require that we plan and perform the audit to obtain reasonable assurance about whether the financial statements are free of material misstatement. An audit includes examining, on a test basis, evidence supporting the amounts and disclosures in the financial statements. An audit also includes assessing the accounting principles used and significant estimates made by management, as well as evaluating the overall financial statement presentation. We believe that our audits provide a reasonable basis for our opinion.
In our opinion, such consolidated financial statements present fairly, in all material respects, the financial position of SunOpta Inc. and subsidiaries as at December 31, 2016 and January 2, 2016, and the results of their operations and their cash flows for each of the years in the three year period ended December 31, 2016, in conformity with accounting principles generally accepted in the United States of America.
We have also audited, in accordance with the standards of the Public Company Accounting Oversight Board (United States), the Company’s internal control over financial reporting as of December 31, 2016, based on the criteria established in Internal Control—Integrated Framework (2013) issued by the Committee of Sponsoring Organizations of the Treadway Commission and our report dated March 2, 2017 expressed an unqualified opinion on the Company’s internal control over financial reporting.
/s/ Deloitte LLP
Chartered Professional Accountants
Licensed Public
Accountants
Toronto, Canada
March 2, 2017
| SUNOPTA INC. | -F2- | December 31, 2016 10-K |
SunOpta Inc.
Consolidated Statements of
Operations
For the years ended December 31, 2016, January 2, 2016 and
January 3, 2015
(All dollar amounts expressed in thousands of U.S. dollars,
except per share amounts)
| December 31, 2016 | January 2, 2016 | January 3, 2015 | |||||||
| $ | $ | $ | |||||||
|
Revenues |
1,346,731 | 1,145,134 | 1,102,745 | ||||||
|
|
|||||||||
|
Cost of goods sold |
1,220,779 | 1,034,772 | 980,640 | ||||||
|
|
|||||||||
|
Gross profit |
125,952 | 110,362 | 122,105 | ||||||
|
|
|||||||||
|
Selling, general and administrative expenses |
98,681 | 85,754 | 80,365 | ||||||
|
Intangible asset amortization |
11,282 | 4,951 | 2,036 | ||||||
|
Other expense (income), net (note 15) |
28,292 | 12,151 | (2,220 | ) | |||||
|
Goodwill impairment (note 9) |
17,540 | - | - | ||||||
|
Foreign exchange loss (gain) |
1,243 | (1,641 | ) | (1,993 | ) | ||||
|
|
|||||||||
|
Earnings (loss) from continuing operations before the following |
(31,086 | ) | 9,147 | 43,917 | |||||
|
|
|||||||||
|
Interest expense, net (note 11) |
43,275 | 15,669 | 3,943 | ||||||
|
Impairment loss on investment (note 16) |
- | - | 8,441 | ||||||
|
|
|||||||||
|
Earnings (loss) from continuing operations before income taxes |
(74,361 | ) | (6,522 | ) | 31,533 | ||||
|
|
|||||||||
|
Provision for (recovery of) income taxes (note 17) |
(23,797 | ) | (3,390 | ) | 12,043 | ||||
|
|
|||||||||
|
Earnings (loss) from continuing operations |
(50,564 | ) | (3,132 | ) | 19,490 | ||||
|
|
|||||||||
|
Discontinued operations (note 3) |
|||||||||
|
Loss from discontinued operations |
(1,993 | ) | (17,377 | ) | (15,993 | ) | |||
|
Gain (loss) on classification as held for sale |
560 | (10,515 | ) | - | |||||
|
Gain on sale of discontinued operation |
- | - | 2,888 | ||||||
|
Recovery of (provision for) income taxes |
599 | (402 | ) | 2,000 | |||||
|
Loss from discontinued operations attributable to non-controlling interests |
264 | 8,819 | 4,911 | ||||||
|
Loss from discontinued operations attributable to SunOpta Inc. |
(570 | ) | (19,475 | ) | (6,194 | ) | |||
|
Earnings (loss) |
(51,134 | ) | (22,607 | ) | 13,296 | ||||
|
|
|||||||||
|
Earnings (loss) attributable to non-controlling interests |
54 | (136 | ) | 195 | |||||
|
|
|||||||||
|
Earnings (loss) attributable to SunOpta Inc. |
(51,188 | ) | (22,471 | ) | 13,101 | ||||
|
|
|||||||||
|
Earnings (loss) per share – basic (note 18) |
|||||||||
|
-from continuing operations |
(0.61 | ) | (0.04 | ) | 0.29 | ||||
|
-from discontinued operations |
(0.01 | ) | (0.27 | ) | (0.09 | ) | |||
| (0.62 | ) | (0.31 | ) | 0.20 | |||||
|
Earnings (loss) per share – diluted (note 18) |
|||||||||
|
-from continuing operations |
(0.61 | ) | (0.04 | ) | 0.28 | ||||
|
-from discontinued operations |
(0.01 | ) | (0.27 | ) | (0.09 | ) | |||
| (0.62 | ) | (0.31 | ) | 0.19 |
(See accompanying notes to consolidated financial statements)
| SUNOPTA INC. | -F3- | December 31, 2016 10-K |
SunOpta Inc.
Consolidated Statements of
Comprehensive Earnings (Loss)
For the years ended December 31, 2016, January
2, 2016 and January 3, 2015
(All dollar amounts expressed in thousands of
U.S. dollars)
| December 31, 2016 | January 2, 2016 | January 3, 2015 | |||||||
| $ | $ | $ | |||||||
|
Earnings (loss) from continuing operations |
(50,564 | ) | (3,132 | ) | 19,490 | ||||
|
Loss from discontinued operations attributable to SunOpta Inc. |
(570 | ) | (19,475 | ) | (6,194 | ) | |||
|
Earnings (loss) |
(51,134 | ) | (22,607 | ) | 13,296 | ||||
|
|
|||||||||
|
Change in fair value of interest rate swaps, net of income taxes |
- | (129 | ) | 20 | |||||
|
Reclassification adjustment for loss included in earnings |
- | 339 | - | ||||||
|
Unrealized gain on interest rate swap, net |
- | 210 | 20 | ||||||
|
|
|||||||||
|
Currency translation adjustment |
(2,042 | ) | (5,155 | ) | (5,148 | ) | |||
|
|
|||||||||
|
Other comprehensive loss, net of income taxes |
(2,042 | ) | (4,945 | ) | (5,128 | ) | |||
|
|
|||||||||
|
Comprehensive earnings (loss) |
(53,176 | ) | (27,552 | ) | 8,168 | ||||
|
|
|||||||||
|
Comprehensive loss attributable to non-controlling interests |
(355 | ) | (9,565 | ) | (4,669 | ) | |||
|
|
|||||||||
|
Comprehensive earnings (loss) attributable to SunOpta Inc. |
(52,821 | ) | (17,987 | ) | 12,837 |
(See accompanying notes to consolidated financial statements)
| SUNOPTA INC. | -F4- | December 31, 2016 10-K |
SunOpta Inc.
Consolidated Balance Sheets
As at
December 31, 2016 and January 2, 2016
(All dollar amounts expressed in
thousands of U.S. dollars)
| December 31, 2016 | January 2, 2016 | |||||
| $ | $ | |||||
|
ASSETS |
||||||
|
Current assets |
||||||
|
Cash and cash equivalents |
1,251 | 2,274 | ||||
|
Accounts receivable (note 6) |
157,369 | 117,412 | ||||
|
Inventories (note 7) |
368,482 | 371,223 | ||||
|
Prepaid expenses and other current assets |
19,794 | 20,088 | ||||
|
Current income taxes recoverable |
2,801 | 21,728 | ||||
|
Current assets held for sale (note 3) |
- | 64,330 | ||||
|
Total current assets |
549,697 | 597,055 | ||||
|
|
||||||
|
Property, plant and equipment (note 8) |
162,239 | 176,513 | ||||
|
Goodwill (note 9) |
223,611 | 241,690 | ||||
|
Intangible assets (note 9) |
183,524 | 195,008 | ||||
|
Deferred income taxes (note 17) |
1,045 | 958 | ||||
|
Other assets |
9,442 | 7,979 | ||||
|
|
||||||
|
Total assets |
1,129,558 | 1,219,203 | ||||
|
|
||||||
|
LIABILITIES |
||||||
|
Current liabilities |
||||||
|
Bank indebtedness (note 11) |
201,494 | 159,773 | ||||
|
Accounts payable and accrued liabilities (note 10) |
173,745 | 151,831 | ||||
|
Customer and other deposits |
2,543 | 5,322 | ||||
|
Income taxes payable |
5,661 | 1,720 | ||||
|
Other current liabilities |
1,016 | 1,521 | ||||
|
Current portion of long-term debt (note 11) |
2,079 | 1,773 | ||||
|
Current portion of long-term liabilities |
5,500 | 5,243 | ||||
|
Current liabilities held for sale (note 3) |
- | 52,486 | ||||
|
Total current liabilities |
392,038 | 379,669 | ||||
|
|
||||||
|
Long-term debt (note 11) |
229,008 | 321,222 | ||||
|
Long-term liabilities |
15,354 | 17,809 | ||||
|
Deferred income taxes (note 17) |
44,561 | 74,324 | ||||
|
Total liabilities |
680,961 | 793,024 | ||||
|
|
||||||
|
Series A Preferred Stock (note 12) |
79,184 | - | ||||
|
|
||||||
|
EQUITY |
||||||
|
SunOpta Inc. shareholders’ equity |
||||||
|
Common shares, no par value, unlimited shares authorized, 85,743,958 shares issued (January 2, 2016 - 85,417,849) (note 13) |
300,426 | 297,987 | ||||
|
Additional paid-in capital |
25,522 | 22,327 | ||||
|
Retained earnings |
53,838 | 106,838 | ||||
|
Accumulated other comprehensive loss |
(13,104 | ) | (6,113 | ) | ||
| 366,682 | 421,039 | |||||
|
Non-controlling interests |
2,731 | 5,140 | ||||
|
Total equity |
369,413 | 426,179 | ||||
|
Total equity and liabilities |
1,129,558 | 1,219,203 | ||||
|
Commitments and contingencies (note 21) |
(See accompanying notes to consolidated financial statements)
| SUNOPTA INC. | -F5- | December 31, 2016 10-K |
SunOpta Inc.
Consolidated Statements of
Shareholders’ Equity
As at and for the years ended December 31, 2016,
January 2, 2016 and January 3, 2015
(All dollar amounts expressed in
thousands of U.S. dollars)
| Accumulated | |||||||||||||||||||||
| Additional | other com- | Non- | |||||||||||||||||||
| paid-in | Retained | prehensive | controlling | ||||||||||||||||||
| Common shares | capital | earnings | income (loss) | interests | Total | ||||||||||||||||
| 000s | $ | $ | $ | $ | $ | $ | |||||||||||||||
|
Balance at December 28, 2013 |
66,528 | 186,376 | 19,323 | 116,208 | 3,397 | 17,308 | 342,612 | ||||||||||||||
|
|
|||||||||||||||||||||
|
Employee share purchase plan |
52 | 627 | - | - | - | - | 627 | ||||||||||||||
|
Stock incentive plan |
494 | 3,665 | (1,234 | ) | - | - | - | 2,431 | |||||||||||||
|
Stock-based compensation |
- | - | 4,401 | - | - | - | 4,401 | ||||||||||||||
|
Earnings from continuing operations |
- | - | - | 19,295 | - | 195 | 19,490 | ||||||||||||||
|
Loss from discontinued operations, net of income taxes |
- | - | - | (6,194 | ) | - | (4,911 | ) | (11,105 | ) | |||||||||||
|
Currency translation adjustment |
- | - | - | - | (5,188 | ) | 40 | (5,148 | ) | ||||||||||||
|
Change in fair value of interest rate swaps, net of income taxes |
- | - | - | - | 13 | 7 | 20 | ||||||||||||||
|
|
|||||||||||||||||||||
|
Balance at January 3, 2015 |
67,074 | 190,668 | 22,490 | 129,309 | (1,778 | ) | 12,639 | 353,328 | |||||||||||||
|
|
|||||||||||||||||||||
|
Issuance of common shares, net |
16,670 | 95,654 | - | - | - | - | 95,654 | ||||||||||||||
|
Employee share purchase plan |
55 | 590 | - | - | - | - | 590 | ||||||||||||||
|
Stock incentive plan |
769 | 5,033 | (1,739 | ) | - | - | - | 3,294 | |||||||||||||
|
Warrants |
850 | 6,042 | (2,163 | ) | - | - | - | 3,879 | |||||||||||||
|
Stock-based compensation |
- | - | 4,757 | - | - | - | 4,757 | ||||||||||||||
|
Loss from continuing operations |
- | - | - | (2,996 | ) | - | (136 | ) | (3,132 | ) | |||||||||||
|
Loss from discontinued operations, net of income taxes |
- | - | - | (19,475 | ) | - | (8,819 | ) | (28,294 | ) | |||||||||||
|
Currency translation adjustment |
- | - | - | - | (4,474 | ) | (681 | ) | (5,155 | ) | |||||||||||
|
Change in fair value of interest rate swaps, net of income taxes |
- | - | - | - | 139 | 71 | 210 | ||||||||||||||
|
Non-controlling interest from acquisition of business |
- | - | - | - | - | 1,781 | 1,781 | ||||||||||||||
|
Acquisition of non-controlling interest |
- | - | (1,018 | ) | - | - | 285 | (733 | ) | ||||||||||||
|
|
|||||||||||||||||||||
|
Balance at January 2, 2016 |
85,418 | 297,987 | 22,327 | 106,838 | (6,113 | ) | 5,140 | 426,179 | |||||||||||||
|
|
|||||||||||||||||||||
|
Employee share purchase plan |
83 | 391 | - | - | - | - | 391 | ||||||||||||||
|
Stock incentive plan |
243 | 2,048 | (953 | ) | - | - | - | 1,095 | |||||||||||||
|
Stock-based compensation |
- | - | 4,148 | - | - | - | 4,148 | ||||||||||||||
|
Dividends and accretion on Series A Preferred Stock (note 12) |
- | - | - | (1,812 | ) | - | - | (1,812 | ) | ||||||||||||
|
Loss from continuing operations |
- | - | - | (50,618 | ) | - | 54 | (50,564 | ) | ||||||||||||
|
Loss from discontinued operations, net of income taxes (note 3) |
- | - | - | (570 | ) | - | (264 | ) | (834 | ) | |||||||||||
|
Disposition of discontinued operation (note 3) |
- | - | - | - | (5,094 | ) | (2,054 | ) | (7,148 | ) | |||||||||||
|
Currency translation adjustment |
- | - | - | - | (1,897 | ) | (145 | ) | (2,042 | ) | |||||||||||
|
|
|||||||||||||||||||||
|
Balance at December 31, 2016 |
85,744 | 300,426 | 25,522 | 53,838 | (13,104 | ) | 2,731 | 369,413 | |||||||||||||
(See accompanying notes to consolidated financial statements)
| SUNOPTA INC. | -F6- | December 31, 2016 10-K |
SunOpta Inc.
Consolidated Statements of Cash Flows
For the years ended December 31, 2016, January 2, 2016 and January 3, 2015
(All dollar amounts expressed in thousands of U.S. dollars)
| December 31, 2016 | January 2, 2016 | January 3, 2015 | |||||||
| $ | $ | $ | |||||||
|
CASH PROVIDED BY (USED IN) |
|||||||||
|
Operating activities |
|||||||||
|
Earnings (loss) |
(51,134 | ) | (22,607 | ) | 13,296 | ||||
|
Loss from discontinued operations attributable to SunOpta Inc. |
(570 | ) | (19,475 | ) | (6,194 | ) | |||
|
Earnings (loss) from continuing operations |
(50,564 | ) | (3,132 | ) | 19,490 | ||||
|
|
|||||||||
|
Items not affecting cash: |
|||||||||
|
Depreciation and amortization |
34,150 | 21,007 | 15,641 | ||||||
|
Acquisition accounting adjustment on inventory sold (note 2) |
15,000 | 4,000 | - | ||||||
|
Amortization and write-off of debt issuance costs (note 11) |
11,301 | 5,895 | 375 | ||||||
|
Deferred income taxes |
(29,850 | ) | (4,038 | ) | (3,489 | ) | |||
|
Stock-based compensation |
4,148 | 4,366 | 3,906 | ||||||
|
Unrealized loss (gain) on derivative instruments (note 5) |
(547 | ) | 143 | 176 | |||||
|
Fair value of contingent consideration (note 15) |
(1,158 | ) | 884 | (1,373 | ) | ||||
|
Impairment of long-lived assets (note 15) |
13,257 | - | - | ||||||
|
Goodwill impairment (note 9) |
17,540 | - | - | ||||||
|
Impairment loss on investment (note 16) |
- | - | 8,441 | ||||||
|
Loss (gain) on disposal of assets (note 15) |
145 | 251 | (1,386 | ) | |||||
|
Other |
190 | 739 | 27 | ||||||
|
Changes in non-cash working capital, net of businesses acquired (note 19) |
(12,891 | ) | (3,685 | ) | (24,318 | ) | |||
|
Net cash flows from operating activities - continuing operations |
721 | 26,430 | 17,490 | ||||||
|
Net cash flows from operating activities - discontinued operations |
758 | 4,814 | 7,325 | ||||||
| 1,479 | 31,244 | 24,815 | |||||||
|
Investing activities |
|||||||||
|
|
|||||||||
|
Purchases of property, plant and equipment |
(22,560 | ) | (31,186 | ) | (17,671 | ) | |||
|
Acquisition of businesses, net of cash acquired (note 2) |
- | (490,715 | ) | - | |||||
|
Proceeds from sale of assets |
254 | 1,138 | 5,833 | ||||||
|
Other |
700 | (822 | ) | 188 | |||||
|
Net cash flows from investing activities - continuing operations |
(21,606 | ) | (521,585 | ) | (11,650 | ) | |||
|
Net cash flows from investing activities - discontinued operations |
1,754 | (1,235 | ) | 34,538 | |||||
|
|
(19,852 | ) | (522,820 | ) | 22,888 | ||||
|
Financing activities |
|||||||||
|
Increase (decrease) under line of credit facilities (note 11) |
236,976 | 85,968 | (40,953 | ) | |||||
|
Repayment of line of credit facilities (note 11) |
(192,677 | ) | - | - | |||||
|
Borrowings under long-term debt (note 11) |
231,430 | 330,135 | - | ||||||
|
Repayment of long-term debt (note 11) |
(322,004 | ) | (11,018 | ) | (910 | ) | |||
|
Issuance of Series A Preferred Stock, net (note 12) |
78,963 | - | - | ||||||
|
Payment of debt issuance costs |
(13,017 | ) | (15,966 | ) | (34 | ) | |||
|
Payment of contingent consideration (notes 1 and 5) |
(4,554 | ) | (204 | ) | (800 | ) | |||
|
Proceeds from the exercise of stock options and employee share purchases |
1,486 | 3,884 | 3,058 | ||||||
|
Proceeds from the issuance of common shares, net |
- | 94,080 | - | ||||||
|
Proceeds from the exercise of warrants |
- | 3,879 | - | ||||||
|
Other |
168 | (781 | ) | 244 | |||||
|
Net cash flows from financing activities - continuing operations |
16,771 | 489,977 | (39,395 | ) | |||||
|
Net cash flows from financing activities - discontinued operations |
(1,180 | ) | (4,304 | ) | (7,066 | ) | |||
|
|
15,591 | 485,673 | (46,461 | ) | |||||
|
|
|||||||||
|
Foreign exchange gain (loss) on cash held in a foreign currency |
52 | (54 | ) | 159 | |||||
|
|
|||||||||
|
Increase (decrease) in cash and cash equivalents during the year |
(2,730 | ) | (5,957 | ) | 1,401 | ||||
|
|
|||||||||
|
Discontinued operations cash activity included above: |
|||||||||
|
Add: Balance included at beginning of year |
1,707 | 2,170 | 4,084 | ||||||
|
Less: Balance included at end of year |
- | (1,707 | ) | (2,170 | ) | ||||
|
Cash and cash equivalents - beginning of the year |
2,274 | 7,768 | 4,453 | ||||||
|
Cash and cash equivalents - end of the year |
1,251 | 2,274 | 7,768 |
| SUNOPTA INC. | -F7- | December 31, 2016 10-K |
SunOpta Inc.
Consolidated Statements of Cash Flows
(continued)
For the years ended December 31, 2016, January 2, 2016 and
January 3, 2015
(All dollar amounts expressed in thousands of U.S. dollars)
| December 31, 2016 | January 2, 2016 | January 3, 2015 | |||||||
| $ | $ | $ | |||||||
|
Non-cash investing and financing activities |
|||||||||
|
Accrued cash dividends on Class A Preferred Stock (note 12) |
(1,590 | ) | - | - | |||||
|
Proceeds on disposition of discontinued operation, note receivable (note 3) |
1,537 | - | - | ||||||
|
Acquisition of business, working capital adjustment (note 2) |
- | 82 | - | ||||||
|
Acquisition of business, settlement of pre-existing relationship (note 2) |
- | (749 | ) | - | |||||
|
Acquisition of business, contingent consideration at fair value (note 2) |
- | (20,330 | ) | - |
(See accompanying notes to consolidated financial statements)
| SUNOPTA INC. | -F8- | December 31, 2016 10-K |
| SunOpta Inc. |
| Notes to Consolidated Financial Statements |
| For the years ended December 31, 2016, January 2, 2016 and January 3, 2015 |
| (All tabular amounts expressed in thousands of U.S. dollars, except per share amounts) |
| 1. |
Description of Business and Significant Accounting Policies |
SunOpta Inc. (the “Company” or “SunOpta”) was incorporated under the laws of Canada on November 13, 1973. The Company operates businesses focused on a healthy products portfolio that promotes sustainable well-being. The Company’s two reportable segments, Global Ingredients and Consumer Products, operate in the natural, organic and specialty food sectors and utilize an integrated business model to bring cost-effective and quality products to market.
Basis of Presentation
These consolidated financial statements have been prepared by the Company in United States (“U.S.”) dollars and in accordance with accounting principles generally accepted in the United States of America (“U.S. GAAP”). The consolidated financial statements include the accounts of the Company and those of its wholly-owned and majority-owned subsidiaries. All intercompany accounts and transactions have been eliminated on consolidation.
Comparative Balances
The Company has reclassified contingent consideration payments of $0.2 million and $0.8 million for the years ended January 2, 2016 and January 3, 2015, respectively, from investing activities to financing activities on the consolidated statements of cash flows to conform with the presentation adopted by the Company in the current fiscal year in accordance with Accounting Standard Update (“ASU”) 2016-15, as described below under “Recent Accounting Pronouncements”.
Fiscal Year
The fiscal year of the Company consists of a 52- or 53-week period ending on the Saturday closest to December 31. Fiscal years 2016 and 2015 were each 52-week periods ending on December 31, 2016 and January 2, 2016, respectively, whereas fiscal year 2014 was a 53-week period ending on January 3, 2015. Fiscal year 2017 will be a 52-week period ending on December 30, 2017, with quarterly periods ending on April 1, July 1 and September 30, 2017.
Use of Estimates
The preparation of financial statements in conformity with U.S. GAAP requires management to make certain estimates and assumptions that affect the reported amounts in the consolidated financial statements and accompanying notes. Areas involving significant estimates and assumptions include: allocation of the purchase price of acquired businesses; inventory valuation reserves; income tax liabilities and assets, and related valuation allowances; provisions for loss contingencies related to claims and litigation; fair value of contingent consideration liabilities; useful lives of property, plant and equipment and intangible assets; expected future cash flows used in evaluating long-lived assets for impairment; fair value of investments; and reporting unit fair values in testing goodwill for impairment. The estimates and assumptions made require judgment on the part of management and are based on the Company’s historical experience and various other factors that are believed to be reasonable in the circumstances. Management continually evaluates the information that forms the basis of its estimates and assumptions as the business of the Company and the general business environment changes.
Business Acquisitions
Acquired businesses are accounted for using the acquisition method of accounting, which requires that assets acquired and liabilities assumed be recorded at fair value, with limited exceptions. Any excess of the purchase price over the fair value of the net assets acquired is recorded as goodwill. Acquisition-related transaction costs are accounted for as an expense in the period in which the costs are incurred. Contingent consideration is measured at fair value and recognized as part of the consideration transferred in exchange for the acquired businesses. Contingent consideration liabilities are remeasured to fair value at each reporting date with the changes in fair value recognized in other expense/income on the consolidated statements of operations.
| SUNOPTA INC. | -F9- | December 31, 2016 10-K |
| SunOpta Inc. |
| Notes to Consolidated Financial Statements |
| For the years ended December 31, 2016, January 2, 2016 and January 3, 2015 |
| (All tabular amounts expressed in thousands of U.S. dollars, except per share amounts) |
Financial Instruments
The Company’s financial instruments recognized in the consolidated balance sheets and included in working capital consist of cash and cash equivalents, accounts receivable, derivative instruments, accounts payable and accrued liabilities, and customer and other deposits. Cash and cash equivalents, inventories carried at market and derivative instruments are measured at fair value each reporting period. The fair values of the remaining financial instruments approximate their carrying values due to their short-term maturities.
The Company’s financial instruments exposed to credit risk include cash equivalents and accounts receivable. The Company places its cash and cash equivalents with institutions of high creditworthiness. The Company’s trade accounts receivable are not subject to a high concentration of credit risk. The Company routinely assesses the financial strength of its customers and believes that its accounts receivable credit risk exposure is limited. The Company maintains an allowance for losses based on the expected collectability of the accounts receivable.
Fair Value Measurements
The Company has various financial assets and liabilities that are measured at fair value on a recurring basis, including certain inventories and derivatives, as well as contingent consideration. The Company also applies the provisions of fair value measurement to various non-recurring measurements for financial and non-financial assets and liabilities measured at fair value on a non-recurring basis.
Fair value is defined as the price that would be received to sell an asset or paid to transfer a liability in an orderly transaction between market participants at the measurement date (i.e., an exit price). Fair value measurements are estimated based on inputs categorized as follows:
-
Level 1 inputs include quoted prices (unadjusted) for identical assets or liabilities in active markets that are observable.
-
Level 2 inputs include quoted prices for similar assets or liabilities in active markets; quoted prices for identical or similar assets or liabilities in markets that are not active; inputs other than quoted prices that are observable for the asset or liability; and inputs that are derived principally from or corroborated by observable market data by correlation or other means.
-
Level 3 includes unobservable inputs that reflect the Company’s own assumptions about what factors market participants would use in pricing the asset or liability.
When measuring fair value, the Company maximizes the use of observable inputs and minimizes the use of unobservable inputs.
Foreign Currency Translation
The assets and liabilities of the Company’s operations having a functional currency other than the U.S. dollar are translated into U.S. dollars at the exchange rate prevailing at the balance sheet date, and at the average rate for the reporting period for revenue and expense items. The cumulative currency translation adjustment is recorded as a component of accumulated other comprehensive income in shareholders’ equity. Foreign currency gains and losses related to the remeasurement of the Company’s Mexican operation into its U.S. dollar functional currency are recognized in earnings.
Exchange gains and losses on transactions occurring in a currency other than an operation’s functional currency are recognized in earnings.
Cash and Cash Equivalents
Cash and cash equivalents consist of cash and short-term deposits with an original maturity of 90 days or less.
| SUNOPTA INC. | -F10- | December 31, 2016 10-K |
| SunOpta Inc. |
| Notes to Consolidated Financial Statements |
| For the years ended December 31, 2016, January 2, 2016 and January 3, 2015 |
| (All tabular amounts expressed in thousands of U.S. dollars, except per share amounts) |
Accounts Receivable
Accounts receivable includes trade receivables that are recorded at the invoiced amount and do not bear interest. The allowance for doubtful accounts is an estimate of the amount of probable credit losses in existing accounts receivable. Account balances are charged off against the allowance when the Company determines the receivable will not be recovered. As at December 31, 2016 and January 2, 2016, no customer’s balance represented 10% or more of the Company’s consolidated trade receivables balance.
Inventories
Inventories (excluding commodity grains) are valued at the lower of cost and market. Cost is principally determined on a weighted-average cost basis. Shipping and handling costs are included in cost of goods sold on the consolidated statements of operations.
Inventories of commodity grains, which include amounts acquired under deferred pricing contracts traded on the Chicago Board of Trade (“CBoT”), are valued at market. Grain inventory quantities at year-end are multiplied by the quoted price on the CBoT to reflect the market value of the inventory. This market value is then adjusted for a basis factor that represents differences in local markets, and broker and dealer quotes to arrive at market. Changes in CBoT prices or the basis factor are included in cost of goods sold on the consolidated statements of operations.
SunOpta economically hedges its commodity grain positions to protect gains and minimize losses due to market fluctuations. Futures contracts and purchase and sale contracts are adjusted to market price and resulting gains and losses from these transactions are included in cost of goods sold. As the Company has a risk of loss from hedge activity if the grower does not deliver the grain as scheduled, these transactions do not qualify as hedges under U.S. GAAP and, therefore, changes in market value are recorded in cost of goods sold on the consolidated statements of operations.
Property, Plant and Equipment
Property, plant and equipment are stated at cost, less accumulated depreciation. Depreciation is provided using the straight-line basis at rates reflecting the estimated useful lives of the assets.
|
Buildings |
20 - 40 years |
|
Machinery and equipment |
5 - 20 years |
|
Enterprise software |
3 - 5 years |
|
Office furniture and equipment |
3 - 7 years |
|
Vehicles |
3 - 7 years |
Goodwill
Goodwill represents the excess in a business combination of the purchase price over the estimated fair value of the identifiable net assets acquired. Goodwill is not amortized but is instead tested for impairment at least annually, or whenever events or circumstances change between the annual impairment tests that would indicate the carrying amount of goodwill may be impaired. The Company performs its annual test for goodwill impairment in the fourth quarter of each fiscal year. The Company performs a quantitative test for goodwill impairment by comparing the carrying amount of each reporting unit to its estimated fair value (Step 1). If the carrying amount exceeds the reporting unit’s fair value, there is a potential impairment of goodwill. Any impairment of goodwill is measured by comparing the implied fair value of goodwill with its carrying amount (Step 2). The implied fair value of goodwill is determined by deducting the fair value of all the assets and liabilities of the reporting unit from the reporting unit’s fair value as determined in Step 1.
Intangible Assets
The Company’s finite-lived intangible assets consist of customer and other relationships, patents and trademarks, and other intangible assets. These intangible assets are amortized on a straight-line basis over their estimated useful lives as follows:
| SUNOPTA INC. | -F11- | December 31, 2016 10-K |
| SunOpta Inc. |
| Notes to Consolidated Financial Statements |
| For the years ended December 31, 2016, January 2, 2016 and January 3, 2015 |
| (All tabular amounts expressed in thousands of U.S. dollars, except per share amounts) |
|
Customer and other relationships |
10 - 25 years |
|
Patents and trademarks |
15 years |
|
Other |
5 - 15 years |
Impairment of Long-Lived Assets
The Company reviews its long-lived assets for impairment whenever events or changes in circumstances indicate that the carrying amounts of the assets may not be recoverable through undiscounted future cash flows. If impairment exists based on expected future undiscounted cash flows, a loss is recognized in earnings. The amount of the impairment loss is the excess of the carrying amount of the impaired asset over the fair value of the asset, typically determined using a discounted cash flow analysis (income approach).
Derivative Instruments
The Company is exposed to fluctuations in commodity prices and foreign currency exchange. The Company utilizes certain derivative financial instruments to enhance its ability to manage these risks, including exchange-traded commodity futures, commodity forward purchase and sale contracts and forward foreign exchange contracts. Derivative instruments are entered into for periods consistent with related underlying exposures and do not constitute positions independent of those exposures. The Company does not enter into contracts for speculative purposes.
All derivative instruments are recognized on the consolidated balance sheets at fair value. Changes in the fair value of derivative instruments are recorded in earnings or other comprehensive earnings, based on whether the instrument is designated as part of a hedge transaction. Gains or losses on derivative instruments reported in accumulated other comprehensive income are reclassified to earnings in the period in which earnings are affected by the underlying hedged item. The ineffective portion of all hedges is recognized in earnings in the current period. As at December 31, 2016, the Company utilized the following derivative instruments to manage commodity and foreign currency risks:
-
Exchange-traded commodity futures contracts to economically hedge its exposure to price fluctuations on grain and cocoa transactions to the extent considered practicable for minimizing risk from market price fluctuations. Futures contracts used for economical hedging purposes are purchased and sold through regulated commodity exchanges in the U.S. However, inventories may not be completely hedged, due in part to the Company’s assessment of its exposure from expected price fluctuations. Forward purchase and sale contracts may expose the Company to risk in the event that a counterparty to a transaction is unable to fulfill its contractual obligation or if a grower does not deliver grain as scheduled. The Company manages its risk by entering into purchase contracts with pre-approved growers and sale contracts are entered into with organizations of acceptable creditworthiness, as internally evaluated. All futures and forward purchase and sale contracts are marked-to-market. Gains and losses on these transactions are included in cost of goods sold on the consolidated statements of operations.
-
Forward foreign exchange contracts to minimize exchange rate fluctuations relating to foreign currency denominated purchase and sale contracts and accounts payable and receivable. Forward foreign exchange contracts designated as hedges are marked-to-market with the effective portion of the gain or loss recognized in other comprehensive earnings and subsequently recognized in earnings in the same period the hedged item affects earnings. Gains and losses on forward exchange contracts not specifically designated as hedging instruments are included in foreign exchange gain/loss on the consolidated statements of operations.
Debt Issuance Costs
Costs incurred in connection with obtaining debt financing are deferred and amortized over the term of the financing arrangement using the effective interest method. Costs incurred to secure revolving lines of credit are recorded in other long-term assets. All other debt issuance costs are recorded as a direct deduction from the related debt liability.
| SUNOPTA INC. | -F12- | December 31, 2016 10-K |
| SunOpta Inc. |
| Notes to Consolidated Financial Statements |
| For the years ended December 31, 2016, January 2, 2016 and January 3, 2015 |
| (All tabular amounts expressed in thousands of U.S. dollars, except per share amounts) |
Customer and Other Deposits
Customer and other deposits include prepayments by customers for merchandise inventory to be purchased at a future date.
Income Taxes
The Company follows the asset and liability method of accounting for income taxes whereby deferred income tax assets are recognized for deductible temporary differences and operating loss carry-forwards, and deferred income tax liabilities are recognized for taxable temporary differences. Temporary differences are the differences between the amounts of assets and liabilities recorded for income tax and financial reporting purposes.
Deferred income tax assets are recognized only to the extent that management determines that it is more likely than not that the deferred income tax assets will be realized. Deferred income tax assets and liabilities are adjusted for the effects of changes in tax laws and rates on the date of enactment. The income tax expense or benefit is the income tax payable or recoverable for the year plus or minus the change in deferred income tax assets and liabilities during the year.
The Company is subject to ongoing tax exposures, examinations and assessments in various jurisdictions. Accordingly, the Company may incur additional income tax expense based upon the outcomes of such matters. In addition, when applicable, the Company adjusts income tax expense to reflect the Company’s ongoing assessments of such matters, which requires judgment and can materially increase or decrease its effective rate as well as impact operating results. The evaluation of tax positions taken or expected to be taken in a tax return is a two-step process, whereby (1) the Company determines whether it is more likely than not that the tax positions will be sustained based on the technical merits of the position, and (2) for those tax positions that meet the more-likely-than-not recognition threshold, the Company recognizes the largest amount of tax benefit that has a greater than 50% likelihood of being realized upon ultimate settlement with the related tax authority.
Stock Incentive Plan
The Company maintains a stock incentive plan under which stock options and other stock-based awards may be granted to selected employees and directors. The Company measures stock-based awards at fair value as of the date of grant. Compensation expense is recognized on a straight-line basis over vesting period of the entire stock-based award based on the estimated number of awards that are expected to vest. When exercised, stock-based awards are settled through the issuance of common shares and are therefore treated as equity awards.
Revenue Recognition
Revenue is realized or realizable and earned when persuasive evidence of an arrangement exists, delivery has occurred, the price to the customer is fixed or determinable, and collection is reasonably assured. Revenue is recognized when title and possession of the product has transferred to the customer. Possession is transferred to the customer at the time of shipment from the Company’s facility or at the time of delivery to a specified destination depending on the contractual terms of the sale. Consideration given to customers such as value incentives, rebates, early payment discounts and other discounts are recorded as reductions to revenues at the time of sale. These reductions are estimated based on contractual sales terms with customers and historical payment experience.
Earnings Per Share
Basic earnings per share is computed by dividing earnings available to common shareholders by the weighted-average number of common shares outstanding during the year. Earnings available to common shareholders is computed by deducting dividends and accretion on convertible preferred stock from earnings attributable to SunOpta Inc. The potential diluted effect of stock options and other stock-based awards is computed using the treasury stock method whereby the weighted-average number of common shares used in the basic earnings per share calculation is increased to include the number of additional common shares that would have been outstanding if the potential dilutive common shares had been issued at the beginning of the year. The potential dilutive effect of convertible preferred stock is computed using the if-converted method whereby dividends and accretion on the convertible preferred stock are added back to the numerator, and the common shares resulting from the assumed conversion of the convertible preferred stock are included in the denominator of the diluted earnings per share calculation.
| SUNOPTA INC. | -F13- | December 31, 2016 10-K |
| SunOpta Inc. |
| Notes to Consolidated Financial Statements |
| For the years ended December 31, 2016, January 2, 2016 and January 3, 2015 |
| (All tabular amounts expressed in thousands of U.S. dollars, except per share amounts) |
Contingencies
In the normal course of business, the Company is subject to loss contingencies, such as accrued but unpaid bonuses; tax-related matters; and claims or litigation. Accruals for loss contingencies are recorded when the Company determines that it is both probable that a liability has been incurred and the amount of loss can be reasonably estimated. If the estimate of the amount of the loss is a range and some amount within the range appears to be a better estimate than any other amount within the range, that amount is accrued as a liability. If no amount within the range is a better estimate than any other amount, the minimum amount of the range is accrued as a liability.
The Company recognizes an asset for insurance recoveries when a loss event has occurred and recovery is considered probable, to the extent that the potential recovery does not exceed the loss recognized.
Recent Accounting Pronouncements
In February 2017, the Financial Accounting Standards Board (“FASB”) issued ASU 2017-04, “Intangibles – Goodwill and Other (Topic 350): Simplifying the Test for Goodwill Impairment”, which simplifies the accounting for goodwill impairment by eliminating the requirement to calculate the implied fair value of goodwill (that is, Step 2 of the current goodwill impairment test) to measure a goodwill impairment charge. Instead, companies will record an impairment charge based on the excess of a reporting unit’s carrying amount over its fair value (that is, measure the charge based on Step 1 of the current goodwill impairment model). The guidance is effective on a prospective basis for interim and annual goodwill impairment testing dates after January 1, 2020; however, early adoption is permitted for testing dates after January 1, 2017. The Company is currently assessing the impact that this standard will have on its consolidated financial statements.
In August 2016, the FASB issued ASU 2016-15, “Classification of Certain Cash Receipts and Cash Payments”, which clarifies how entities should classify certain cash receipts and cash payments on the statement of cash flow, including contingent consideration payments made after a business combination. As permitted, the Company elected to early adopt the guidance as at December 31, 2016 on a retrospective basis. Accordingly, the Company has classified contingent consideration payments of $4.6 million, $0.2 million and $0.8 million for the years ended December 31, 2016, January 2, 2016 and January 3, 2015, respectively, as financing activities on the consolidated statements of cash flows. Prior to the adoption of ASU 2016-15, contingent consideration payments were presented by the Company as investing activities on the consolidated statements of cash flows.
In June 2016, the FASB issued ASU 2016-13, “Measurement of Credit Losses on Financial Instruments”, which requires measurement and recognition of expected versus incurred credit losses for most financial assets. ASU 2016-13 is effective for interim and annual periods beginning after December 15, 2019. The Company is currently assessing the impact that this standard will have on its consolidated financial statements.
In March 2016, the FASB issued ASU 2016-09, “Compensation – Stock Compensation (Topic 718): Improvements to Employee Share-Based Payment Accounting”, which is intended to simplify the accounting for share-based payment transactions, including income tax consequences, the classification of awards as either equity or liabilities, and the classification on the statement of cash flows. Under the new guidance, companies will record excess tax benefits and tax deficiencies as income tax expense or benefit in the income statement rather than in additional paid-in capital. In addition, the guidance permits companies to elect to recognize forfeitures of share-based payments as they occur, rather than estimating the number of awards expected to be forfeited as is currently required. This guidance is effective for annual and interim periods beginning after December 15, 2016. The Company has adopted ASU 2016-09 effective January 1, 2017, and has elected upon adoption to recognize forfeitures of stock-based awards as they occur versus estimating at the time of grant. This election will be applied on modified retrospective basis, with the cumulative effect of the transition recognized as adjustment to retained earnings as at January 1, 2017. The adoption of other amendments to the accounting for share-based payments upon the adoption of ASU 2016-09 are not expected to result in a significant cumulative effect adjustment to retained earnings as at January 1, 2017. Commencing January 1, 2017, the Company will recognize excess tax benefits and deficiencies in the provision for income taxes on its consolidated statements of operations and as an operating activity on the consolidated statements of cash flows.
| SUNOPTA INC. | -F14- | December 31, 2016 10-K |
| SunOpta Inc. |
| Notes to Consolidated Financial Statements |
| For the years ended December 31, 2016, January 2, 2016 and January 3, 2015 |
| (All tabular amounts expressed in thousands of U.S. dollars, except per share amounts) |
In February 2016, the FASB issued ASU 2016-02, “Leases”, a comprehensive new standard that amends various aspects of existing accounting guidance for leases, including the recognition of a right of use asset and a lease liability for leases with a duration of greater than one year. The guidance is effective for fiscal years beginning after December 15, 2018, including interim periods within those fiscal years. Early adoption is permitted. The Company is currently assessing the impact that this standard will have on its consolidated financial statements; however, the Company anticipates that upon adoption of the standard it will recognize additional assets and corresponding liabilities related to leases on its balance sheet.
In January 2016, the FASB issued ASU 2016-01, “Financial Instruments - Overall (Subtopic 825-10): Recognition and Measurement of Financial Assets and Financial Liabilities”. ASU 2016-01 will require equity investments (except those accounted for under the equity method of accounting, or those that result in consolidation of the investee) to be measured at fair value with changes in fair value recognized in net income. The guidance provides a new measurement alternative for equity investments that do not have readily determinable fair values and do not qualify for the net asset practical expedient. Under this alternative, these investments can be measured at cost, less any impairment, plus or minus changes resulting from observable price changes in orderly transactions for the identical or a similar investment with the same issuer. Additionally, ASU 2016-01 also changes certain disclosure requirements and other aspects of current U.S. GAAP. ASU 2016-01 is effective for interim and annual reporting periods beginning on or after December 15, 2017. The Company is currently assessing the impact that this standard will have on its consolidated financial statements.
In May 2014, the FASB issued ASU 2014-09, “Revenue from Contracts with Customers”, which will supersede existing revenue recognition guidance under U.S. GAAP. Under the new standard, a company will recognize revenue when it transfers promised goods or services to customers in an amount that reflects the consideration to which the company expects to be entitled in exchange for those goods or services. ASU 2014-09 defines a five-step process to achieve this principle and, in doing so, it is possible more judgment and estimates may be required within the revenue recognition process than required under existing U.S. GAAP, including identifying performance obligations in the contract, estimating the amount of variable consideration to include in the transaction price and allocating the transaction price to each separate performance obligation. In August 2015, the FASB issued ASU 2015-14, which defers by one year the effective date of ASU 2014-09. During 2016, the FASB issued ASU 2016-08, ASU 2016-10, 2016-11, 2016-12, and 2016-20 all of which clarify certain implementation guidance within ASU 2014-09. ASU 2014-09, as amended, will be effective for annual and interim periods beginning on or after December 15, 2017, and is to be applied on either a full retrospective or modified retrospective basis. Early adoption is permitted only as of annual and interim reporting periods beginning on or after December 15, 2016; however, the Company has elected not to early adopt the standard.
The Company currently expects to adopt the standard using the modified retrospective approach; however, that expectation is subject to change once the Company completes its evaluation and quantification of the impact of the guidance. With the assistance of a third party, the Company has begun a preliminary assessment of ASU 2014-09 and has started to analyze its significant customer relationships to determine the effects of the new guidance. Once this analysis is completed, the Company will work towards establishing policies, updating its processes, and implementing necessary changes to be able to comply with the new requirements.
The Company is continuing to assess the impact that the adoption of ASU 2014-09 will have on its consolidated financial statements. In particular, the Company is assessing under the new guidance whether its existing contracts with customers to produce private label consumer products would permit the Company to recognize revenue over time versus at a point in time, based on whether a given product has an alternative use or not and whether there is an enforceable right to payment under the contract for product produced to date. The Company has not completed its assessment or determined whether a change to recognizing revenue over time, if required, would have a significant impact on the Company’s reported revenues and earnings.
| SUNOPTA INC. | -F15- | December 31, 2016 10-K |
| SunOpta Inc. |
| Notes to Consolidated Financial Statements |
| For the years ended December 31, 2016, January 2, 2016 and January 3, 2015 |
| (All tabular amounts expressed in thousands of U.S. dollars, except per share amounts) |
| 2. |
Business Acquisitions |
Sunrise Holdings (Delaware), Inc.
On October 9, 2015, the Company completed the acquisition of 100% of the issued and outstanding common shares of Sunrise Holdings (Delaware), Inc. (“Sunrise”), pursuant to a Purchase and Sale Agreement dated July 30, 2015 (the “Sunrise Acquisition”). Sunrise is a processor of conventional and organic individually quick frozen (“IQF”) fruit in the U.S. and Mexico. The acquisition of Sunrise has been accounted for as a business combination under the acquisition method of accounting. The results of Sunrise have been included in the Company’s consolidated financial statements since the date of acquisition and are reported in the Consumer Products operating segment. The acquisition of Sunrise is aligned with the Company’s strategic focus on healthy and organic foods.
Total consideration for the Sunrise Acquisition was $472.7 million in cash paid at the acquisition date, which included the repayment of all outstanding obligations under Sunrise’s senior credit facility in the amount of $171.5 million. In addition, the total consideration included $23.0 million paid by the Company to the holders of Sunrise stock options. As all outstanding Sunrise stock options vested upon the consummation of the Sunrise Acquisition, pursuant to the terms of Sunrise’s pre-existing stock option agreements, the cash consideration paid to the option holders was attributed to services prior to the Sunrise Acquisition and included as a component of the purchase price. The total consideration also included $20.9 million paid by the Company to settle acquisition-related transaction costs incurred by Sunrise in connection with the Sunrise Acquisition. As none of these costs were incurred by Sunrise on behalf of the Company, the cash consideration paid to settle these costs was included as a component of the purchase price.
The following table summarizes the fair values of the assets acquired and liabilities assumed as at the acquisition date:
| $ | |||
|
Cash and cash equivalents |
1,728 | ||
|
Accounts receivable(1) |
26,090 | ||
|
Inventories(2) |
124,829 | ||
|
Income taxes recoverable |
12,025 | ||
|
Other current assets |
3,982 | ||
|
Property, plant and equipment(3) |
46,068 | ||
|
Intangible assets(4) |
170,000 | ||
|
Accounts payable and accrued liabilities |
(24,169 | ) | |
|
Long-term debt, including current portion |
(7,620 | ) | |
|
Deferred income taxes, net |
(75,193 | ) | |
|
Net identifiable assets acquired |
277,740 | ||
|
Goodwill(5) |
196,709 | ||
|
Non-controlling interest(6) |
(1,781 | ) | |
|
Net assets acquired |
472,668 |
| (1) |
The gross amount of accounts receivable acquired was $26.2 million, of which the Company expected $0.2 million to be uncollectible. |
| (2) |
Includes an estimated fair value adjustment to inventory of $19.0 million, of which $15.0 million and $4.0 million was recognized in costs of goods sold for inventory sold during 2016 and in the fourth quarter of 2015, respectively. |
| (3) |
Includes an estimated fair value adjustment to property, plant and equipment of $3.7 million. |
| (4) |
The identified intangible assets relate to customer relationships in existence at the acquisition date between Sunrise and major U.S. retail and foodservice customers. The customer relationships intangible assets will be amortized over an estimated weighted-average useful life of approximately 23 years. The estimated fair value of the intangible asset was determined using a discounted cash flow analysis (income approach), which applied a risk-adjusted discount rate of approximately 12.0% . |
| SUNOPTA INC. | -F16- | December 31, 2016 10-K |
| SunOpta Inc. |
| Notes to Consolidated Financial Statements |
| For the years ended December 31, 2016, January 2, 2016 and January 3, 2015 |
| (All tabular amounts expressed in thousands of U.S. dollars, except per share amounts) |
| (5) |
Goodwill is calculated as the difference between the acquisition-date fair values of the total consideration and the net assets acquired. The total amount of goodwill has been assigned to the Consumer Products operating segment and is not expected to be deductible for tax purposes. The goodwill recognized is attributable to: (i) cost savings, operating synergies, and other benefits expected to result from combining the operations of Sunrise with those of the Company; (ii) the value of longer-term growth prospects in the private label frozen fruit market; (iii) the value of acquiring the current capabilities and low-cost position of the existing Sunrise business (i.e., the higher rate of return on the assembled net assets versus acquiring all of the net assets separately); and (iv) the value of Sunrise’s assembled workforce. |
| (6) |
Represents the estimated fair value of the non-controlling interest in Sunrise’s 75%-owned Mexican subsidiary. |
Niagara Natural Fruit Snack Company Inc.
On August 11, 2015, the Company acquired the net operating assets of Niagara Natural Fruit Snack Company Inc. (“Niagara Natural”). Niagara Natural is a manufacturer of all-natural fruit snacks located in the Niagara Region of Ontario. The acquisition of the net operating assets of Niagara Natural has been accounted for as a business combination under the acquisition method of accounting. The results of Niagara Natural have been included in the Company’s consolidated financial statements since the date of acquisition and are reported in the Consumer Products operating segment.
The following table summarizes the fair value of the consideration transferred as at the acquisition date:
| Provisional | |||||||||
| Amounts | Final Amounts | ||||||||
| Recognized as at | Measurement | Recognized as at | |||||||
| the Acquisition | Period | the Acquisition | |||||||
| Date | Adjustment(1 | ) | Date | ||||||
| $ | $ | $ | |||||||
|
Cash |
6,475 | - | 6,475 | ||||||
|
Preliminary working capital adjustment |
237 | (292 | ) | (55 | ) | ||||
|
Contingent consideration(2) |
2,330 | - | 2,330 | ||||||
|
Total consideration transferred |
9,042 | (292 | ) | 8,750 |
| (1) |
The measurement period adjustment reflects the final determination of net working capital as at the acquisition date. This adjustment did not have a significant impact on the Company’s consolidated results of operations. |
| (2) |
The Company agreed to pay the owners of Niagara Natural an additional amount of up to approximately $2.8 million over a period of two years subject to adjustment based on certain performance targets. The fair value of the contingent consideration was determined to be $2.3 million as of the acquisition date. On May 5, 2016, the Company and the owners of Niagara Natural entered into an agreement to settle the contingent consideration obligation in exchange for a one-time cash payment of $0.6 million. In the second quarter of 2016, the Company recognized a gain of $1.7 million in connection with this settlement, based on the difference between the fair value of the contingent consideration obligation and the cash payment, which is recorded in other expense on the consolidated statement of operations for the year ended December 31, 2016. |
| SUNOPTA INC. | -F17- | December 31, 2016 10-K |
| SunOpta Inc. |
| Notes to Consolidated Financial Statements |
| For the years ended December 31, 2016, January 2, 2016 and January 3, 2015 |
| (All tabular amounts expressed in thousands of U.S. dollars, except per share amounts) |
The following table summarizes the fair values of the assets acquired and liabilities assumed as at the acquisition date:
| Provisional | |||||||||
| Amounts | Final Amounts | ||||||||
| Recognized as at | Measurement | Recognized as at | |||||||
| the Acquisition | Period | the Acquisition | |||||||
| Date | Adjustment(1 | ) | Date | ||||||
| $ | $ | $ | |||||||
|
Current assets |
2,220 | (292 | ) | 1,928 | |||||
|
Machinery and equipment |
3,414 | - | 3,414 | ||||||
|
Intangible assets(2) |
2,459 | - | 2,459 | ||||||
|
Current liabilities |
(687 | ) | - | (687 | ) | ||||
|
Net identifiable assets acquired |
7,406 | (292 | ) | 7,114 | |||||
|
Goodwill(3) |
1,636 | - | 1,636 | ||||||
|
Net assets acquired |
9,042 | (292 | ) | 8,750 |
| (1) |
The measurement period adjustment reflects the final determination of net working capital as at the acquisition date. |
| (2) |
Intangible assets comprise customer relationships and non-competition arrangements, which will be amortized over an estimated weighted-average useful life of approximately 19 years. |
| (3) |
The total amount of goodwill has been assigned to the Consumer Products operating segment. |
Citrusource, LLC
On March 2, 2015, the Company acquired 100% of the issued and outstanding units of Citrusource, LLC (“Citrusource”), a producer of premium not-from-concentrate private label organic and conventional orange juice and citrus products in the U.S. The acquisition of Citrusource has been accounted for as a business combination under the acquisition method of accounting. The results of Citrusource have been included in the Company’s consolidated financial statements since the date of acquisition and are reported in the Consumer Products operating segment. The acquisition of Citrusource aligned with the Company’s strategy of growing its value-added consumer products portfolio and leveraging its integrated operating platform.
The following table summarizes the fair value of the consideration transferred as at the acquisition date:
| $ | |||
|
Cash |
13,300 | ||
|
Working capital adjustment |
(319 | ) | |
|
Settlement of pre-existing relationship |
749 | ||
|
Contingent consideration(1) |
18,000 | ||
|
Total consideration transferred |
31,730 |
| (1) |
The contingent consideration arrangement with the former unitholders of Citrusource comprises two components: (i) deferred consideration calculated based on a seven-times multiple of the incremental growth in Citrusource’s earnings before interest, taxes, depreciation and amortization (“EBITDA”) in fiscal year 2015 versus EBITDA for fiscal year 2014; and (ii) an earn-out calculated based on 25% of the incremental growth in the sum of Citrusource’s EBITDA and the EBITDA of the Company’s San Bernardino, California, juice facility (the “Combined EBITDA”) in each of fiscal years 2016, 2017 and 2018 versus the Combined EBITDA for fiscal year 2015. There are no upper limits to the amount of each of the components. The fair value measurement of the contingent consideration arrangement was determined to be approximately $18.0 million as at the acquisition date, based on a probability-weighted present value analysis, of which approximately $15.0 million was related to the deferred consideration and approximately $3.0 million is related to the earn-out. The deferred consideration is payable in four equal annual installments commencing in 2016. In the second quarter of 2016, the Company paid the first installment in the amount of $3.9 million. Of the remaining deferred consideration obligation, approximately $4.0 million is included in current portion of long-term liabilities and approximately $7.0 million is included in long-term liabilities on the consolidated balance sheets as at December 31, 2016. The earn-out obligation is also included in long-term liabilities on the consolidated balance sheet as at December 31, 2016. The fair value of the contingent consideration arrangement is based on significant level 3 unobservable inputs, including the following factors: (i) estimated range of EBITDA values in each of the earn-out periods; and (ii) the probability-weighting applied to each of the EBITDA values within the estimated range for each earn-out period. The resultant probability-weighted EBITDA values for each earn-out period were discounted at a credit risk-adjusted discount rate of approximately 3.5% . |
| SUNOPTA INC. | -F18- | December 31, 2016 10-K |
| SunOpta Inc. |
| Notes to Consolidated Financial Statements |
| For the years ended December 31, 2016, January 2, 2016 and January 3, 2015 |
| (All tabular amounts expressed in thousands of U.S. dollars, except per share amounts) |
The terms of the earn-out component of the contingent consideration arrangement will be amended by the Company and former unitholders of Citrusource as a consequence of the closure of the San Bernardino juice facility (see note 15). The fair value of the amended earn-out is expected to be commensurate with the fair value measured as at December 31, 2016.
The following table summarizes the fair values of the assets acquired and liabilities assumed as at the acquisition date:
| $ | |||
|
Accounts receivable |
2,351 | ||
|
Inventories |
1,745 | ||
|
Machinery and equipment |
164 | ||
|
Customer relationships intangible asset(1) |
14,000 | ||
|
Accounts payable and accrued liabilities |
(1,666 | ) | |
|
Net identifiable assets acquired |
16,594 | ||
|
Goodwill(2) |
15,136 | ||
|
Net assets acquired |
31,730 |
| (1) |
The customer relationships intangible asset was recognized based on contracts in existence at the acquisition date between Citrusource and major U.S. retail customers. This intangible asset will be amortized over an estimated useful life of approximately 12 years. |
| (2) |
Goodwill is calculated as the difference between the acquisition-date fair values of the consideration transferred and net assets acquired. The total amount of goodwill has been assigned to the Consumer Products operating segment and is expected to be fully deductible for tax purposes. The goodwill recognized is attributable to: (i) operating synergies expected to result from combining the operations of Citrusource with those of the Company; and (ii) opportunities to leverage the business experience of Citrusource’s management team to grow the Company’s existing citrus beverage program. |
| 3. |
Discontinued Operations |
Opta Minerals Inc.
On February 11, 2016, Opta Minerals entered into a definitive acquisition agreement, pursuant to which Speyside Equity Fund I LP (“Speyside”) agreed to acquire substantially all of the issued and outstanding shares of Opta Minerals, of which the Company owned approximately 66%. The acquisition agreement was approved by Opta Minerals’ Boards of Directors, which recommended that Opta Minerals’ shareholders approve the transaction. Also on February 11, 2016, the Company entered into a support agreement pursuant to which it irrevocably agreed to vote all of its Opta Minerals’ shares in favor of the transaction. The acquisition of Opta Minerals by Speyside was completed on April 6, 2016, following a vote of the shareholders of Opta Minerals in favor of the transaction on March 31, 2016.
| SUNOPTA INC. | -F19- | December 31, 2016 10-K |
| SunOpta Inc. |
| Notes to Consolidated Financial Statements |
| For the years ended December 31, 2016, January 2, 2016 and January 3, 2015 |
| (All tabular amounts expressed in thousands of U.S. dollars, except per share amounts) |
Upon closing of the transaction, the Company received aggregate gross proceeds of $4.8 million (C$6.2 million), of which $3.2 million (C$4.2 million) was received in cash, and $1.5 million (C$2.0 million) was received in the form of a subordinated promissory note bearing interest at 2.0% per annum that will mature on October 6, 2018. In the first quarter of 2016, the Company recognized direct costs related to the sale of Opta Minerals of $0.8 million. The sale of Company’s equity interest in Opta Minerals was consistent with its objective of divesting its non-core assets in order to become a pure-play healthy and organic foods company. The Company has no significant continuing involvement with Opta Minerals.
In the fourth quarter of 2015, the Company recognized a loss on the classification of Opta Minerals as a discontinued operation held for sale of $10.5 million, or $7.7 million net of non-controlling interest, to write down the carrying value of Opta Minerals’ net assets to fair value less cost to sell based on estimated net proceeds on sale of approximately $4.5 million as at January 2, 2016. In the first quarter of 2016, the Company recognized a $0.6 million gain on classification as held for sale, which reflected a $1.1 million decline in the carrying value of Opta Mineral’s net assets, partially offset by a $0.5 million reduction in the estimated net proceeds on sale. The Company has not recognized the results of operations or cash flows of Opta Minerals for the period from April 1, 2016 to the closing of the transaction on April 6, 2016, as these amounts were insignificant to the Company’s consolidated results of operations and cash flows.
As at January 2, 2016, the net assets and liabilities of Opta Minerals were reported as held for sale on the consolidated balance sheet. The following table reconciles the major classes of assets and liabilities of Opta Minerals to the amounts reported as held for sale:
| $ | |||
|
Cash and cash equivalents |
1,707 | ||
|
Accounts receivable |
14,676 | ||
|
Inventories |
25,869 | ||
|
Property, plant and equipment |
16,019 | ||
|
Intangible assets |
13,194 | ||
|
Other assets |
3,380 | ||
|
Loss recognized on classification as held for sale |
(10,515 | ) | |
|
Total assets held for sale |
64,330 | ||
|
|
|||
|
Bank indebtedness |
12,107 | ||
|
Accounts payable and accrued liabilities |
9,634 | ||
|
Long-term debt |
25,858 | ||
|
Other liabilities |
4,887 | ||
|
Total liabilities held for sale |
52,486 |
Fiber and Starch Business
On December 22, 2014, the Company completed the sale of its fiber and starch business (the “Fiber Business”) for $37.5 million, subject to certain closing adjustments. The Fiber Business included five facilities located in Louisville, Kentucky, Cedar Rapids, Iowa, Cambridge, Minnesota, Fosston, Minnesota, and Galesburg, Illinois. The Fiber Business was formerly part of the former Value Added Ingredients operating segment. The Company continues to operate both its integrated grain- and fruit-based ingredient businesses, which were not part of the sale, and which previously formed the remainder of the former Value Added Ingredients operating segment.
| SUNOPTA INC. | -F20- | December 31, 2016 10-K |
| SunOpta Inc. |
| Notes to Consolidated Financial Statements |
| For the years ended December 31, 2016, January 2, 2016 and January 3, 2015 |
| (All tabular amounts expressed in thousands of U.S. dollars, except per share amounts) |
For the year ended January 3, 2015, the Company recognized the following gain on sale of the Fiber Business in discontinued operations:
| $ | |||
|
Cash consideration |
37,500 | ||
|
Transaction and related costs |
(637 | ) | |
|
Net proceeds |
36,863 | ||
|
|
|||
|
Current assets |
12,139 | ||
|
Property, plant and equipment |
13,045 | ||
|
Goodwill |
12,030 | ||
|
Current liabilities |
(3,239 | ) | |
|
Net assets sold |
33,975 | ||
|
|
|||
|
Pre-tax gain on sale |
2,888 | ||
|
Provision for income taxes |
(990 | ) | |
|
Gain on sale of discontinued operations, net of income taxes |
1,898 |
Major Components of Operating Results Reported in Discontinued Operations
The following table reconciles the major components of the results of discontinued operations to the amounts reported in the consolidated statements of operations:
| December 31, | |||||||||
| 2016 | (1) | January 2, 2016 | January 3, 2015 | ||||||
| $ | $ | $ | |||||||
|
Revenues |
24,896 | 113,805 | 180,793 | ||||||
|
Cost of goods sold(2) |
(22,133 | ) | (99,256 | ) | (154,629 | ) | |||
|
Selling, general and administrative expenses |
(3,024 | ) | (11,170 | ) | (19,108 | ) | |||
|
Intangible asset amortization |
- | (1,987 | ) | (2,236 | ) | ||||
|
Goodwill impairment |
- | - | (10,975 | ) | |||||
|
Other expense, net(3) |
(794 | ) | (15,097 | ) | (4,801 | ) | |||
|
Foreign exchange gain (loss) |
(454 | ) | 717 | (1,216 | ) | ||||
|
Interest expense |
(484 | ) | (4,389 | ) | (3,821 | ) | |||
|
Loss before income taxes |
(1,993 | ) | (17,377 | ) | (15,993 | ) | |||
|
Gain (loss) on classification as held for sale before income taxes |
560 | (10,515 | ) | - | |||||
|
Gain on sale before income taxes |
- | - | 2,888 | ||||||
|
Total pre-tax loss from discontinued operations |
(1,433 | ) | (27,892 | ) | (13,105 | ) | |||
|
Recovery of (provision for) income taxes |
599 | (402 | ) | 2,000 | |||||
|
Loss from discontinued operations |
(834 | ) | (28,294 | ) | (11,105 | ) | |||
|
Loss from discontinued operations attributable to non-controlling interest |
264 | 8,819 | 4,911 | ||||||
|
Loss from discontinued operations attributable to SunOpta Inc. |
(570 | ) | (19,475 | ) | (6,194 | ) |
| (1) |
For the year ended December 31, 2016, no depreciation or amortization was recorded on Opta Minerals’ long-lived assets as these assets were classified as held for sale. |
| (2) |
For the year ended December 31, 2016, cost of goods sold includes a charge related to the write-down of inventory of Opta Minerals of $0.8 million. |
| (3) |
For the years ended December 31, 2016, January 2, 2016 and January 3, 2015, other expense, net includes charges related to the impairment of long-lived assets of Opta Minerals of $0.4 million, $12.4 million and $3.8 million, respectively. |
| SUNOPTA INC. | -F21- | December 31, 2016 10-K |
| SunOpta Inc. |
| Notes to Consolidated Financial Statements |
| For the years ended December 31, 2016, January 2, 2016 and January 3, 2015 |
| (All tabular amounts expressed in thousands of U.S. dollars, except per share amounts) |
| 4. |
Product Recall |
During the second quarter of 2016, the Company announced a voluntary recall of certain roasted sunflower kernel products produced at its Crookston, Minnesota facility due to potential contamination with Listeria monocytogenes bacteria. The affected sunflower products originated from the Crookston facility between May 31, 2015 and April 21, 2016. For the year ended December 31, 2016, the Company recognized estimated losses of $40.0 million related to this recall, reflecting the estimated cost of the affected sunflower kernel products expected to be returned to or replaced by the Company and the estimated cost to reimburse customers for costs incurred by them related to the recall of their retail products that contain the affected sunflower kernels as an ingredient or component. However, these losses do not reflect costs associated with the interruption of production at the Crookston facility for the period from April 21, 2016 to the time regular production resumed on or about May 15, 2016, subject to a positive release protocol, or the costs to put into place corrective and preventive actions at the Company’s roasting facilities. The Company’s remediation efforts are ongoing, and it expects to continue to incur related costs, which may be material.
The Company’s estimates of the losses related to the recall are provisional and were determined based on an assessment of the information available up to the date of filing of this report, including a review of customer claims received as of that date and consideration of the extent of potential additional claims that have yet to be received. The Company’s estimates reflect the amount of losses that it determined as at December 31, 2016 to be both probable and reasonably estimable. The Company may need to revise its estimates in subsequent periods as the Company continues to work with its customers and insurance providers to substantiate the claims received to date and any additional claims that may be received. These revisions may occur at any time and may be material.
Based on an assessment of the effect on future cash flows of lower anticipated sales demand and higher expected production and capital costs as a result of the recall, the Company determined that the impact of the recall on the fair value of the sunflower reporting unit reflected an impairment of the associated goodwill, resulting in a $17.5 million charge recorded in the fourth quarter of 2016 (see note 9). The Company’s assessment, however, determined that the carrying values of the property, plant and equipment and intangible assets of the sunflower reporting unit were recoverable as at December 31, 2016.
The Company has general liability and product recall insurance policies with aggregate limits of $47.0 million under which it is expecting to recover recall-related costs, less applicable deductibles. The Company recognizes expected insurance recoveries in the period in which the recoveries are determined to be probable of realization. Accordingly, for the year ended December 31, 2016, the Company recorded estimated insurance recoveries of $39.4 million for the losses recognized to-date related to the recall. However, the Company may not recover amounts equal to the amount of the losses that have been or may be recognized if those losses exceed the coverage available or are excluded under the insurance policies, in which case these excess or excluded losses would be paid by the Company and recognized as a charge to future earnings.
As at December 31, 2016, $39.8 million of the estimated recall-related costs were unsettled and were recorded in accounts payable and accrued liabilities on the consolidated balance sheet (see note 10). These costs were offset by the corresponding estimated insurance recoveries of $37.4 million included in accounts receivable on the consolidated balance sheet as at December 31, 2016 (see note 6), which is net of a $2.0 million advance the Company received from its insurance providers prior to December 31, 2016. Subsequent to December 31, 2016, the Company settled an individual customer claim for an amount of $6.5 million, which settlement was fully funded under the Company’s general liability and product recall insurance policies.
| SUNOPTA INC. | -F22- | December 31, 2016 10-K |
| SunOpta Inc. |
| Notes to Consolidated Financial Statements |
| For the years ended December 31, 2016, January 2, 2016 and January 3, 2015 |
| (All tabular amounts expressed in thousands of U.S. dollars, except per share amounts) |
| 5. |
Derivative Financial Instruments and Fair Value Measurements |
The following table presents for each of the fair value hierarchies, the assets and liabilities that are measured at fair value on a recurring basis as at December 31, 2016 and January 2, 2016:
| December 31, 2016 | |||||||||||||||
| Fair value | |||||||||||||||
| asset (liability) | Level 1 | Level 2 | Level 3 | ||||||||||||
| $ | $ | $ | $ | ||||||||||||
|
(a) |
Commodity futures and forward contracts(1) | ||||||||||||||
|
|
Unrealized short-term derivative asset | 787 | 43 | 744 | - | ||||||||||
|
|
Unrealized short-term derivative liability | (916 | ) | - | (916 | ) | - | ||||||||
|
|
Unrealized long-term derivative liability | (8 | ) | - | (8 | ) | - | ||||||||
|
(b) |
Inventories carried at market(2) | 8,231 | - | 8,231 | - | ||||||||||
|
(c) |
Forward foreign currency contracts(3) | 1,345 | - | 1,345 | - | ||||||||||
|
(d) |
Contingent consideration(4) | (15,279 | ) | - | - | (15,279 | ) | ||||||||
|
(e) |
Embedded derivative(5) | 2,944 | - | - | 2,944 | ||||||||||
| January 2, 2016 | |||||||||||||||
| Fair value | |||||||||||||||
| asset (liability) | Level 1 | Level 2 | Level 3 | ||||||||||||
| $ | $ | $ | $ | ||||||||||||
|
(a) |
Commodity futures and forward contracts(1) | ||||||||||||||
|
|
Unrealized short-term derivative asset | 748 | - | 748 | - | ||||||||||
|
|
Unrealized long-term derivative asset | 21 | - | 21 | - | ||||||||||
|
|
Unrealized short-term derivative liability | (1,417 | ) | (10 | ) | (1,407 | ) | - | |||||||
|
|
Unrealized long-term derivative liability | (36 | ) | - | (36 | ) | - | ||||||||
|
(b) |
Inventories carried at market(2) | 5,945 | - | 5,945 | - | ||||||||||
|
(c) |
Forward foreign currency contracts(3) | 311 | - | 311 | - | ||||||||||
|
(d) |
Contingent consideration(4) | (21,010 | ) | - | - | (21,010 | ) | ||||||||
|
(e) |
Embedded derivative(5) | 3,409 | - | - | 3,409 |
| (1) |
Unrealized short-term derivative asset is included in prepaid expenses and other current assets, unrealized long-term derivative asset is included in other assets, unrealized short-term derivative liability is included in other current liabilities and unrealized long-term derivative liability is included in long-term liabilities on the consolidated balance sheets. | |
| (2) |
Inventories carried at market are included in inventories on the consolidated balance sheets. | |
| (3) |
The forward foreign currency contracts are included in accounts receivable or accounts payable and accrued liabilities on the consolidated balance sheets. | |
| (4) |
Contingent consideration obligations are included in long-term liabilities (including the current portion thereof) on the consolidated balance sheets. | |
| (5) |
The embedded derivative is included in other assets (long-term) on the consolidated balance sheets. |
| (a) |
Commodity futures and forward contracts |
The Company’s derivative contracts that are measured at fair value include exchange-traded commodity futures and forward commodity purchase and sale contracts. Exchange-traded futures are valued based on unadjusted quotes for identical assets priced in active markets and are classified as level 1. Fair values for forward commodity purchase and sale contracts are estimated based on exchange-quoted prices adjusted for differences in local markets. Local market adjustments use observable inputs or market transactions for similar assets or liabilities, and, as a result, are classified as level 2. Based on historical experience with the Company’s suppliers and customers, the Company’s own credit risk, and the Company’s knowledge of current market conditions, the Company does not view non-performance risk to be a significant input to fair value for the majority of its forward commodity purchase and sale contracts.
| SUNOPTA INC. | -F23- | December 31, 2016 10-K |
| SunOpta Inc. |
| Notes to Consolidated Financial Statements |
| For the years ended December 31, 2016, January 2, 2016 and January 3, 2015 |
| (All tabular amounts expressed in thousands of U.S. dollars, except per share amounts) |
These exchange-traded commodity futures and forward commodity purchase and sale contracts are used as part of the Company’s risk management strategy, and represent economic hedges to limit risk related to fluctuations in the price of certain commodity grains, as well as the prices of cocoa and coffee. These derivative instruments are not designated as hedges for accounting purposes. Gains and losses on changes in fair value of these derivative instruments are included in cost of goods sold on the consolidated statement of operations. For the year ended December 31, 2016, the Company recognized a gain of $0.5 million (January 2, 2016 – loss of $0.1 million; January 3, 2015 – loss of $0.2 million) related to changes in the fair value of these derivatives.
As at December 31, 2016, the notional amounts of open commodity futures and forward purchase and sale contracts were as follows (in thousands of bushels):
| Number of bushels purchased (sold) | ||||||
| Corn | Soybeans | |||||
|
Forward commodity purchase contracts |
312 | 526 | ||||
|
Forward commodity sale contracts |
(317 | ) | (1,095 | ) | ||
|
Commodity futures contracts |
(360 | ) | (45 | ) | ||
In addition, as at December 31, 2016, the Company had open forward contracts to sell 142 lots of cocoa and 21 lots of coffee.
| (b) |
Inventories carried at market |
Grains inventory carried at fair value is determined using quoted market prices from the CBoT. Estimated fair market values for grains inventory quantities at period end are valued using the quoted price on the CBoT adjusted for differences in local markets, and broker or dealer quotes. These assets are placed in level 2 of the fair value hierarchy, as there are observable quoted prices for similar assets in active markets. Gains and losses on commodity grains inventory are included in cost of goods sold on the consolidated statements of operations. As at December 31, 2016, the Company had 354,699 bushels of commodity corn and 569,943 bushels of commodity soybeans in inventories carried at market.
| (c) |
Foreign forward currency contracts |
As part of its risk management strategy, the Company enters into forward foreign exchange contracts to reduce its exposure to fluctuations in foreign currency exchange rates. For any open forward foreign exchange contracts at period end, the contract rate is compared to the forward rate, and a gain or loss is recorded. These contracts are placed in level 2 of the fair value hierarchy, as the inputs used in making the fair value determination are derived from and are corroborated by observable market data. While these forward foreign exchange contracts typically represent economic hedges that are not designated as hedging instruments, certain of these contracts may be designated as hedges. As at December 31, 2016 the Company had open forward foreign exchange contracts with a notional value of €35.4 million ($38.8 million). Gains and losses on changes in the fair value of these derivative instruments are included in foreign exchange loss or gain on the consolidated statement of operations. For the year ended December 31, 2016, the Company recognized a gain of $1.0 million (January 2, 2016 – loss of $0.7 million; January 3, 2015 – gain of $1.4 million) related to changes in the fair value of these derivatives.
| (d) |
Contingent consideration |
The fair value measurement of contingent consideration arising from business acquisitions is determined using unobservable (level 3) inputs. These inputs include: (i) the estimated amount and timing of the projected cash flows on which the contingency is based; and (ii) the risk-adjusted discount rate used to present value those cash flows.
| SUNOPTA INC. | -F24- | December 31, 2016 10-K |
| SunOpta Inc. |
| Notes to Consolidated Financial Statements |
| For the years ended December 31, 2016, January 2, 2016 and January 3, 2015 |
| (All tabular amounts expressed in thousands of U.S. dollars, except per share amounts) |
The following table presents a reconciliation of contingent consideration obligations for the years ended December 31, 2016 and January 2, 2016:
| December 31, 2016 | January 2, 2016 | |||||
| $ | $ | |||||
|
Balance, beginning of year |
(21,010 | ) | - | |||
| Issuances(1) | - | (20,330 | ) | |||
| Fair value adjustment(2) | 1,158 | (884 | ) | |||
| Payments(3) | 4,554 | 204 | ||||
| Foreign exchange | 19 | - | ||||
|
Balance, end of year |
(15,279 | ) | (21,010 | ) |
| (1) |
For the year ended January 2, 2016, reflects the fair value of the Citrusource and Niagara Natural contingent consideration arrangements as measured at the respective acquisition dates (see note 2). | |
| (2) |
For the year ended December 31, 2016, reflects the gain on settlement of the contingent consideration obligation related to the acquisition of Niagara Natural (see note 2) and an adjustment to the contractual amount owing to a former shareholder of, as well as the accretion for the time value of money related to the Citrusource and Niagara Natural obligations. For the year ended January 2, 2016, reflects accretion for the time value of money related to the Citrusource and Niagara Natural obligations. In addition, includes contractual amount owing to former shareholders of Organic Land Corporation OOD (“OLC”), which was acquired by the Company on December 31, 2012, for their share of a government subsidy obtained in 2015. Fair value adjustments are included in other income/expense (see note 15). | |
| (3) |
For the year ended December 31, 2016, reflects the first installment payment of deferred consideration to the former unitholders of Citrusource and cash settlement of the contingent consideration obligation related to the acquisition of Niagara Natural (see note 2). For the year ended January 2, 2016, reflects payment to one of the former shareholders of OLC. |
| (e) |
Embedded derivative |
On August 5, 2011 and August 29, 2014, the Company invested $0.5 million and $0.9 million, respectively, in convertible subordinated notes issued by Enchi Corporation (“Enchi”), a developer of advanced bioconversion products for the renewable fuels industry, of which $0.2 million principal amount remained outstanding as at January 2, 2016. The Company’s investment in subordinated convertible notes of Enchi includes the value of an accelerated payment option embedded in the notes, which may result in a maximum payout to the Company of $5.1 million. Due to a lack of level 1 or level 2 observable market quotes for the notes, the Company used a discounted cash flow analysis (income approach) to estimate the original fair value of the embedded derivative based on unobservable level 3 inputs. The Company assesses changes in the fair value of the embedded derivative based on the performance of actual cash flows derived from certain royalty rights owned by Enchi, which are expected to be the primary source of funds available to settle the embedded derivative, relative to the financial forecasts used in the valuation analysis. On April 15, 2016, the Company received a distribution from Enchi of $0.7 million, which was applied to repay the remaining $0.2 million principal amount of the convertible subordinated notes, with the balance of $0.5 million applied against the carrying value of the embedded derivative. As at December 31, 2016 and January 2, 2016, the Company determined that the fair value of the embedded derivative was $2.9 million and $3.4 million, respectively, based on expectations related to the remaining royalty rights.
| SUNOPTA INC. | -F25- | December 31, 2016 10-K |
| SunOpta Inc. |
| Notes to Consolidated Financial Statements |
| For the years ended December 31, 2016, January 2, 2016 and January 3, 2015 |
| (All tabular amounts expressed in thousands of U.S. dollars, except per share amounts) |
| 6. |
Accounts Receivable |
| December 31, 2016 | January 2, 2016 | |||||
| $ | $ | |||||
|
Trade receivables |
122,916 | 119,904 | ||||
|
Recall-related insurance recoveries (see note 4) |
37,400 | - | ||||
|
Allowance for doubtful accounts |
(2,947 | ) | (2,492 | ) | ||
| 157,369 | 117,412 |
The change in the allowance for doubtful accounts provision for the years ended December 31, 2016 and January 2, 2016 is comprised as follows:
| December 31, 2016 | January 2, 2016 | |||||
| $ | $ | |||||
|
Balance, beginning of year |
2,492 | 1,230 | ||||
|
Net additions to provision |
1,013 | 2,008 | ||||
|
Reserves from acquired businesses |
- | 226 | ||||
|
Accounts receivable written off, net of recoveries |
(536 | ) | (947 | ) | ||
|
Effects of foreign exchange rate differences |
(22 | ) | (25 | ) | ||
|
Balance, end of year |
2,947 | 2,492 |
| 7. |
Inventories |
| December 31, 2016 | January 2, 2016 | |||||
| $ | $ | |||||
|
Raw materials and work-in-process |
266,072 | 276,434 | ||||
|
Finished goods |
101,585 | 87,215 | ||||
|
Company-owned grain |
15,027 | 14,348 | ||||
|
Inventory reserve |
(14,202 | ) | (6,774 | ) | ||
| 368,482 | 371,223 |
The change in the inventory reserve for the years ended December 31, 2016 and January 2, 2016 is comprised as follows:
| December 31, 2016 | January 2, 2016 | |||||
| $ | $ | |||||
|
Balance, beginning of year |
6,774 | 6,144 | ||||
|
Additions to reserve during the year |
14,029 | 7,186 | ||||
|
Reserves applied and inventories written off during the year |
(6,532 | ) | (6,461 | ) | ||
|
Effect of foreign exchange rate differences |
(69 | ) | (95 | ) | ||
|
Balance, end of year |
14,202 | 6,774 |
| SUNOPTA INC. | -F26- | December 31, 2016 10-K |
| SunOpta Inc. |
| Notes to Consolidated Financial Statements |
| For the years ended December 31, 2016, January 2, 2016 and January 3, 2015 |
| (All tabular amounts expressed in thousands of U.S. dollars, except per share amounts) |
| 8. |
Property, Plant and Equipment |
The major components of property, plant and equipment as at December 31, 2016 and January 2, 2016 were as follows:
| December 31, 2016 | |||||||||
| Accumulated | |||||||||
| Cost | depreciation | Net book value | |||||||
| $ | $ | $ | |||||||
|
Land |
7,165 | - | 7,165 | ||||||
|
Buildings |
68,014 | 19,432 | 48,582 | ||||||
|
Machinery and equipment |
168,120 | 73,914 | 94,206 | ||||||
|
Enterprise software |
10,845 | 4,179 | 6,666 | ||||||
|
Office furniture and equipment |
10,191 | 5,930 | 4,261 | ||||||
|
Vehicles |
3,515 | 2,156 | 1,359 | ||||||
| 267,850 | 105,611 | 162,239 |
| January 2, 2016 | |||||||||
| Accumulated | |||||||||
| Cost | depreciation | Net book value | |||||||
| $ | $ | $ | |||||||
|
Land |
7,249 | - | 7,249 | ||||||
|
Buildings |
72,031 | 17,078 | 54,953 | ||||||
|
Machinery and equipment |
167,556 | 65,413 | 102,143 | ||||||
|
Enterprise software |
8,084 | 2,225 | 5,859 | ||||||
|
Office furniture and equipment |
10,427 | 5,603 | 4,824 | ||||||
|
Vehicles |
3,316 | 1,831 | 1,485 | ||||||
| 268,663 | 92,150 | 176,513 |
As at December 31, 2016, property, plant and equipment included construction in process assets of $13.7 million (January 2, 2016 – $12.1 million), which were not being depreciated as they had not yet reached the stage of commercial viability. In addition, as at December 31, 2016, machinery and equipment included equipment under capital leases with a cost of $11.9 million (January 2, 2016 – $12.2 million) and a net book value of $10.7 million (January 2, 2016 – $10.5 million), as well as $6.1 million (January 2, 2016 – $5.1 million) of spare parts inventory.
Total depreciation expense included in cost of goods sold and selling, general and administrative expense on the consolidated statements of operations related to property, plant and equipment for the year ended December 31, 2016 was $22.9 million (January 2, 2016 – $16.1 million; January 3, 2015 – $13.6 million).
| SUNOPTA INC. | -F27- | December 31, 2016 10-K |
| SunOpta Inc. |
| Notes to Consolidated Financial Statements |
| For the years ended December 31, 2016, January 2, 2016 and January 3, 2015 |
| (All tabular amounts expressed in thousands of U.S. dollars, except per share amounts) |
| 9. |
Goodwill and Intangible Assets |
| December 31, 2016 | January 2, 2016 | |||||
| $ | $ | |||||
|
Goodwill |
223,611 | 241,690 | ||||
|
Intangible assets with a finite life at cost, less accumulated amortization of $30,989 (January 2, 2016 - $20,156) |
183,524 | 195,008 |
The following is a summary of changes in goodwill:
| Global Ingredients | Consumer Products | Total | |||||||
| $ | $ | $ | |||||||
|
Balance at January 3, 2015 |
26,721 | 2,361 | 29,082 | ||||||
|
Acquisitions (see note 2) |
- | 213,481 | 213,481 | ||||||
|
Foreign exchange |
(731 | ) | (142 | ) | (873 | ) | |||
|
Balance at January 2, 2016 |
25,990 | 215,700 | 241,690 | ||||||
|
Goodwill impairment(1) |
(17,540 | ) | - | (17,540 | ) | ||||
|
Foreign exchange |
(195 | ) | (344 | ) | (539 | ) | |||
|
Balance at December 31, 2016 |
8,255 | 215,356 | 223,611 |
| (1) |
Based on the results of the annual quantitative test for goodwill impairment performed for the year ended December 31, 2016, the Company determined that the carrying value of the goodwill associated with its sunflower reporting unit exceeded its implied fair value, reflecting the negative impact on future cash flows related to the recall of certain roasted sunflower kernel products in 2016 (see note 4). As a result, the Company recognized a goodwill impairment charge of $17.5 million in the fourth quarter of 2016. Fair value was determined using a discounted cash flow analysis (income approach). |
|
Based on the results of the quantitative tests performed for the years ended January 2, 2016 and January 3, 2015, the Company determined that none of the goodwill associated with any of its reporting units was impaired in either of those fiscal years. |
The major components of intangible assets as at December 31, 2016 and January 2, 2016 were as follows:
| December 31, 2016 | |||||||||
| Accumulated | |||||||||
| Cost | amortization | Net book value | |||||||
| $ | $ | $ | |||||||
|
Customer relationships |
212,172 | 28,914 | 183,258 | ||||||
|
Patents, trademarks and other |
2,341 | 2,075 | 266 | ||||||
| 214,513 | 30,989 | 183,524 |
| January 2, 2016 | |||||||||
| Accumulated | |||||||||
| Cost | amortization | Net book value | |||||||
| $ | $ | $ | |||||||
|
Customer relationships |
212,810 | 18,177 | 194,633 | ||||||
|
Patents, trademarks and other |
2,354 | 1,979 | 375 | ||||||
| 215,164 | 20,156 | 195,008 |
| SUNOPTA INC. | -F28- | December 31, 2016 10-K |
| SunOpta Inc. |
| Notes to Consolidated Financial Statements |
| For the years ended December 31, 2016, January 2, 2016 and January 3, 2015 |
| (All tabular amounts expressed in thousands of U.S. dollars, except per share amounts) |
The following is a summary of changes in intangible assets:
| Customer | Patents, trademarks | ||||||||
| relationships | and other | Total | |||||||
| $ | $ | $ | |||||||
|
Balance at January 3, 2015 |
13,504 | 251 | 13,755 | ||||||
|
Acquisitions (see note 2) |
186,251 | 208 | 186,459 | ||||||
|
Amortization |
(4,867 | ) | (84 | ) | (4,951 | ) | |||
|
Foreign exchange |
(255 | ) | - | (255 | ) | ||||
|
Balance at January 2, 2016 |
194,633 | 375 | 195,008 | ||||||
|
Amortization |
(11,166 | ) | (116 | ) | (11,282 | ) | |||
|
Foreign exchange |
(209 | ) | 7 | (202 | ) | ||||
|
Balance at December 31, 2016 |
183,258 | 266 | 183,524 |
The Company estimates that the aggregate future amortization expense associated with finite-life intangible assets in each of the next five fiscal years and thereafter will be as follows:
| $ | |||
|
2017 |
11,401 | ||
|
2018 |
11,322 | ||
|
2019 |
11,033 | ||
|
2020 |
10,515 | ||
|
2021 |
10,345 | ||
|
Thereafter |
128,908 | ||
| 183,524 |
| 10. |
Accounts Payable and Accrued Liabilities |
| December 31, 2016 | January 2, 2016 | |||||
| $ | $ | |||||
|
Accounts payable |
89,034 | 110,847 | ||||
|
Accrued recall-related costs (see note 4) |
39,750 | - | ||||
|
Accrued grain liabilities |
15,254 | 17,122 | ||||
|
Payroll and commissions |
14,262 | 12,302 | ||||
|
Dividends payable on Series A Preferred Stock (see note 12) |
1,590 | - | ||||
|
Other accruals |
13,855 | 11,560 | ||||
| 173,745 | 151,831 |
| SUNOPTA INC. | -F29- | December 31, 2016 10-K |
| SunOpta Inc. |
| Notes to Consolidated Financial Statements |
| For the years ended December 31, 2016, January 2, 2016 and January 3, 2015 |
| (All tabular amounts expressed in thousands of U.S. dollars, except per share amounts) |
| 11. |
Bank Indebtedness and Long-Term Debt |
| December 31, 2016 | January 2, 2016 | |||||
| $ | $ | |||||
|
Bank indebtedness: |
||||||
|
Global Credit Facility(1) |
199,281 | - | ||||
|
North American credit facilities(1) |
- | 70,563 | ||||
|
European credit facilities(1) |
- | 87,419 | ||||
|
Bulgarian credit facility(2) |
2,213 | 1,791 | ||||
| 201,494 | 159,773 | |||||
|
Long-term debt: |
||||||
|
Senior Secured Second Lien Notes, net of unamortized debt issuance costs of $8,835(3) |
222,163 | - | ||||
|
Second Lien Loans, net of unamortized debt issuance costs of nil (January 2, 2016 - $7,757)(3) |
- | 312,243 | ||||
|
Capital lease obligations(4) |
7,454 | 9,245 | ||||
|
Other |
1,470 | 1,507 | ||||
|
|
231,087 | 322,995 | ||||
|
Less: current portion |
2,079 | 1,773 | ||||
| 229,008 | 321,222 |
| (1) |
Global Credit Facility |
On February 11, 2016, the Company entered into a five-year credit agreement for a senior secured asset-based revolving credit facility with a syndicate of banks in the maximum aggregate principal amount of $350.0 million, subject to borrowing base capacity (the “Global Credit Facility”). The Global Credit Facility replaced the Company’s previous North American credit facilities that were set to expire January 27, 2017, and its European credit facilities that were due on demand with no set maturity date. The Global Credit Facility is used to support the working capital and general corporate needs of the Company’s global operations, in addition to funding future strategic initiatives. The Global Credit Facility also includes borrowing capacity available for letters of credit and provides for borrowings on same-day notice, including in the form of swingline loans. Subject to customary borrowing conditions and the agreement of any such lenders to provide such increased commitments, the Company may request to increase the total lending commitments under the Global Credit Facility to a maximum aggregate principal amount not to exceed $450.0 million. Outstanding principal amounts under the Global Credit Facility are repayable in full on the maturity date of February 10, 2021.
Individual borrowings under the Global Credit Facility have terms of six months or less and bear interest based on various reference rates, including prime rate and LIBOR plus an applicable margin. The applicable margin in the Global Credit Facility ranges from 1.25% to 1.75% for loans bearing interest based on LIBOR and from 0.25% to 0.75% for loans bearing interest based on the prime rate and, in each case, is set quarterly based on average borrowing availability for the preceding fiscal quarter. The initial margin for the Global Credit Facility was 0.50% with respect to prime rate borrowings and 1.50% with respect to LIBOR borrowings. As at December 31, 2016, the weighted-average interest rate on the facilities was 2.74% . The obligations under the Global Credit Facility are guaranteed by substantially all of the Company’s subsidiaries and, subject to certain exceptions, such obligations are secured by first priority liens on substantially all of the assets of the Company.
The Global Credit Facility contains a number of covenants that, among other things, restrict, subject to certain exceptions, the Company’s ability to create liens on assets; sell assets and enter into sale and leaseback transactions; pay dividends, prepay junior lien and unsecured indebtedness and make other restricted payments; incur additional indebtedness and make guarantees; make investments, loans or advances, including acquisitions; and engage in mergers or consolidations.
| SUNOPTA INC. | -F30- | December 31, 2016 10-K |
| SunOpta Inc. |
| Notes to Consolidated Financial Statements |
| For the years ended December 31, 2016, January 2, 2016 and January 3, 2015 |
| (All tabular amounts expressed in thousands of U.S. dollars, except per share amounts) |
| (2) |
Bulgarian credit facility |
On April 19, 2016, a subsidiary of The Organic Corporation (“TOC”), a wholly-owned subsidiary of the Company, amended its revolving credit facility agreement dated May 22, 2013, to provide up to €4.5 million to cover the working capital needs of TOC’s Bulgarian operations. The facility is secured by the accounts receivable and inventories of the Bulgarian operations and is fully guaranteed by TOC. Interest accrues under the facility based on EURIBOR plus a margin of 2.75%, and borrowings under the facility are repayable in full on April 30, 2017. As at December 31, 2016, the weighted-average interest rate on the Bulgarian credit facility was 2.75% .
| (3) |
Second Lien Borrowings |
On October 9, 2015, SunOpta Foods Inc. (“SunOpta Foods”), a wholly-owned subsidiary of the Company, the Company and certain subsidiaries of the Company, as guarantors (together with the Company, the “Guarantors”), entered into a second lien loan agreement (the “Second Lien Loan Agreement”) with a group of lenders, pursuant to which the Company borrowed an aggregate principal amount of $330.0 million of term loans. In connection with the Second Lien Loan Agreement, the Company incurred $10.8 million of debt issuance costs, which were recorded as a reduction against the principal amount of the borrowings and amortized over the one-year term of the Initial Loans (as defined below). The net proceeds of the Second Lien Loan Agreement were used to partially fund the Sunrise Acquisition (see note 2). The Second Lien Loan Agreement was guaranteed by the Company and the Company’s subsidiaries that guarantee the Global Credit Facility, subject to certain exceptions, and was secured on a second-priority basis by security interests on all of SunOpta Foods’ and Guarantors’ assets that secured the Global Credit Facility, subject to certain exceptions and permitted liens.
Interest on the term loans made under the Second Lien Loan Agreement on October 9, 2015 (the “Initial Loans”) was determined by reference to LIBOR (subject to a 1.0% per annum floor) plus an applicable margin of 6.0% per annum. The applicable margin increased by 0.50% at the end of each three-month period after October 9, 2015 and before October 9, 2016. In each case, the Initial Loans carried a maximum interest rate of 9.5% per annum. Giving effect to the amortization of the debt issuance costs, the effective interest rate on the Initial Loans was approximately 11.2% per annum.
The Initial Loans could be repaid at par at any time prior to October 9, 2016. As at October 1, 2016, and January 2, 2016, the Company had repaid $20.0 million and $10.0 million principal amount, respectively, of the Initial Loans.
On October 7, 2016, SunOpta Foods issued an aggregate of 85,000 shares of Series A Preferred Stock (the “Preferred Stock”) for consideration in the amount of $85.0 million (see note 12). The Company used the net proceeds from the issuance of the Preferred Stock to repay an additional $79.0 million principal amount of the Initial Loans. The remaining $231.0 million aggregate principal amount of Initial Loans matured on October 9, 2016 and automatically converted into a like principal amount of term loans (such converted loans, the “Term Loans”), with a maturity date of October 9, 2022. The Term Loans bore interest at a rate of 9.5% per annum.
On October 20, 2016, all of the outstanding Term Loans were exchanged for a corresponding amount of 9.5% Senior Secured Second Lien Notes due 2022 (the “Notes”) issued by SunOpta Foods. The Second Lien Loan Agreement was terminated in connection with the issuance of the Notes. The Company incurred $9.1 million of debt issuance costs related to the Notes, which are recorded as a reduction against the principal amount of the Notes and are being amortized over the six-year term of the Notes.
Interest on the Notes is payable semi-annually in arrears on April 15 and October 15 at a rate of 9.5% per annum, commencing on April 15, 2017. The Notes will mature on October 9, 2022.
At any time prior to October 9, 2018, SunOpta Foods may redeem some or all of the Notes at any time and from time to time at a “make-whole” redemption price set forth in the indenture governing the Notes. On or after October 9, 2018, SunOpta Foods may redeem the Notes, in whole or in part, at any time at the redemption prices equal to 107.125% through October 8, 2019, 104.750% from October 9, 2019 through October 8, 2020, 102.375% from October 9, 2020 through October 8, 2021 and at par thereafter, plus accrued and unpaid interest, if any, to but excluding the date of redemption. In addition, prior to October 9, 2018, SunOpta Foods may, on one or more occasions, redeem up to 35% of the aggregate principal amount of the Notes with the proceeds of certain equity offerings at a redemption price equal to 109.500% of the principal amount of the Notes redeemed, plus accrued and unpaid interest, if any, to but excluding the date of redemption. At any time prior to October 9, 2018, SunOpta Foods may also redeem, during each twelve-month period beginning on October 20, 2016, up to 10% of the aggregate principal amount of the Notes at a price equal to 103% of the aggregate principal amount of the Notes being redeemed, plus accrued and unpaid interest, if any, to but excluding the date of redemption. In the event of a change of control, SunOpta Foods will be required to make an offer to repurchase the Notes at 101% of their principal amount, plus accrued and unpaid interest, if any, to the date of purchase.
| SUNOPTA INC. | -F31- | December 31, 2016 10-K |
| SunOpta Inc. |
| Notes to Consolidated Financial Statements |
| For the years ended December 31, 2016, January 2, 2016 and January 3, 2015 |
| (All tabular amounts expressed in thousands of U.S. dollars, except per share amounts) |
The Notes are secured by second-priority liens on substantially all of the assets that secure the credit facilities provided under the Global Credit Facility, subject to certain exceptions and permitted liens. The Notes are senior secured obligations and rank equally in right of payment with SunOpta Foods’ existing and future senior debt and senior in right of payment to any future subordinated debt. The Notes are effectively subordinated to debt under the Global Credit Facility and any future indebtedness secured on a first priority basis. The Notes are initially guaranteed on a senior secured second-priority basis by the Company and each of its subsidiaries (other than SunOpta Foods) that guarantees indebtedness under the Global Credit Facility, subject to certain exceptions.
The Notes are subject to covenants that, among other things, limit the Company’s ability to (i) incur additional debt or issue preferred stock; (ii) pay dividends and make certain types of investments and other restricted payments; (iii) create liens; (iv) enter into transactions with affiliates; (v) sell assets; and (vi) create restrictions on the ability of restricted subsidiaries to pay dividends, make loans or advances or transfer assets to the Company, SunOpta Foods or any Guarantor. The indenture provides for customary events of default (subject in certain cases to customary grace and cure periods), which include nonpayment, breach of covenants in the indenture, certain payment defaults or acceleration of other indebtedness, a failure to pay certain judgments and certain events of bankruptcy and insolvency. If an event of default occurs and is continuing, the trustee or holders of at least 25% in principal amount of the outstanding Notes may declare the principal of and accrued and unpaid interest on, if any, all the Notes to be due and payable.
| (4) |
Capital lease obligations |
The Company leases certain equipment under capital lease agreements. The cost and accumulated depreciation of assets under capital lease are included in machinery and equipment.
Principal repayments of long-term debt are as follows:
| $ | |||
|
2017 |
2,079 | ||
|
2018 |
1,770 | ||
|
2019 |
2,961 | ||
|
2020 |
637 | ||
|
2021 |
309 | ||
|
Thereafter |
232,166 | ||
|
Total gross repayments |
239,922 | ||
|
Unamortized debt issuance costs |
(8,835 | ) | |
|
|
231,087 |
The components of interest expense, net are as follows:
| SUNOPTA INC. | -F32- | December 31, 2016 10-K |
| SunOpta Inc. |
| Notes to Consolidated Financial Statements |
| For the years ended December 31, 2016, January 2, 2016 and January 3, 2015 |
| (All tabular amounts expressed in thousands of U.S. dollars, except per share amounts) |
| December 31, 2016 | January 2, 2016 | January 3, 2015 | |||||||
| $ | $ | $ | |||||||
|
Interest expense |
32,090 | 9,853 | 3,717 | ||||||
|
Amortization of debt issuance costs |
11,301 | 5,895 | 375 | ||||||
|
Interest income |
(116 | ) | (79 | ) | (149 | ) | |||
|
Interest expense, net |
43,275 | 15,669 | 3,943 |
| 12. |
Series A Preferred Stock |
On October 7, 2016 (the “Closing Date”), the Company and SunOpta Foods entered into a subscription agreement (the “Subscription Agreement”) with Oaktree Organics, L.P. and Oaktree Huntington Investment Fund II, L.P. (collectively, the “Investors”). Pursuant to the Subscription Agreement, SunOpta Foods issued an aggregate of 85,000 shares of Preferred Stock to the Investors for consideration in the amount of $85.0 million. In connection with the issuance of the Preferred Stock, the Company incurred direct and incremental expenses of $6.0 million, which reduced the carrying value of the Preferred Stock. At any time on or after the fifth anniversary of the Closing Date, SunOpta Foods may redeem all of the Preferred Stock for an amount, per share of Preferred Stock, equal to the value of the liquidation preference at such time. The carrying value of the Preferred Stock is being accreted to the redemption amount of $85.0 million through charges to retained earnings over the period preceding the fifth anniversary of the Closing Date, which accretion amounted to $0.2 million for the period ended December 31, 2016.
The proceeds from the issuance of the Preferred Stock, net of issuance costs were used to repay $79.0 million principal amount of Initial Loans outstanding under the Second Lien Loan Agreement (see note 11).
In connection with the Subscription Agreement, the Company agreed to, among other things (i) ensure SunOpta Foods has sufficient funds to pay its obligations under the terms of the Preferred Stock and (ii) grant each holder of Preferred Stock (the “Holder”) the right to exchange the Preferred Stock for shares of common stock of the Company (the “Common Shares”). The Preferred Stock is non-participating with the Common Shares in dividends and undistributed earnings of the Company.
The Preferred Stock has a stated value and initial liquidation preference of $1,000 per share. Cumulative preferred dividends accrue daily on the Preferred Stock at an annualized rate of 8.0% prior to October 5, 2025 and 12.5% thereafter, in each case of the liquidation preference (subject to an increase of 1.0% per quarter, up to a maximum rate of 5.0% per quarter on the occurrence of certain events of non-compliance). Prior to October 5, 2025, SunOpta Foods may pay dividends in cash or elect, in lieu of paying cash, to add the amount that would have been paid to the liquidation preference. After October 4, 2025, the failure to pay dividends in cash will be an event of non-compliance. The Preferred Stock ranks senior to the shares of common stock of SunOpta Foods with respect to dividend rights and rights on the distribution of assets on any liquidation, winding up or dissolution of the Company or SunOpta Foods. As at December 31, 2016, the Company had accrued unpaid dividends of $1.6 million, which were recorded in accounts payable and accrued liabilities on the consolidated balance sheet.
At any time, the Holders may exchange their shares of Preferred Stock, in whole or in part, into the number of Common Shares equal to, per share of Preferred Stock, the quotient of the liquidation preference divided by $7.50 (such price, the “Exchange Price” and such quotient, the “Exchange Rate”). As at December 31, 2016, the aggregate shares of Preferred Stock outstanding were exchangeable into 11,333,333 Common Shares. The Exchange Price is subject to certain anti-dilution adjustments, including a weighted-average adjustment for issuances of Common Shares below the Exchange Price, provided that the Exchange Price may not be lower than $7.00 (subject to adjustment in certain circumstances). SunOpta Foods may cause the Holders to exchange all of the Preferred Stock into a number of Common Shares based on the applicable Exchange Price if (i) fewer than 10% of the shares of Preferred Stock issued on the Closing Date remain outstanding or (ii) on or after the third anniversary of the Closing Date, the average volume-weighted average price of the Common Shares during the then preceding 20 trading day period is greater than 200% of the Exchange Price. Prior to the receipt of applicable approval by the holders of Common Shares, shares of Preferred Stock are not exchangeable into more than 19.99% of the number of Common Shares outstanding immediately after giving effect to such exchange.
Upon certain events involving a change of control of the Company, SunOpta Foods must use reasonable efforts to provide the Holders with the option to exchange shares of the Preferred Stock for a security in the surviving or successor entity that has the same rights, preferences and privileges as the Preferred Stock as adjusted for the change of control. SunOpta Foods will also offer to redeem the Preferred Stock at an amount per share equal to the greater of (i) the liquidation preference plus an amount equal to the value of incremental dividends that would have accrued through to the fifth anniversary of the Closing Date and (ii) the amount payable per Common Share in such change of control multiplied by the Exchange Rate.
| SUNOPTA INC. | -F33- | December 31, 2016 10-K |
| SunOpta Inc. |
| Notes to Consolidated Financial Statements |
| For the years ended December 31, 2016, January 2, 2016 and January 3, 2015 |
| (All tabular amounts expressed in thousands of U.S. dollars, except per share amounts) |
In connection with the Subscription Agreement, the Company issued 11,333,333 Special Shares, Series 1 (the “Special Voting Shares”) to the Investors, which entitle the Investors to one vote per Special Voting Share on all matters submitted to a vote of the holders of Common Shares, together as a single class, subject to certain exceptions. As of the Closing Date, the Special Voting Shares represented an 11.7% voting interest in the Company. Additional Special Voting Shares will be issued, or existing Special Voting Shares will be redeemed, as necessary to ensure that the aggregate number of Special Voting Shares outstanding is equal to the number of shares of Preferred Stock outstanding from time to time multiplied by the Exchange Rate in effect at such time. The Special Voting Shares are not transferable and the voting rights associated with the Special Voting Shares will terminate upon the transfer of the Preferred Stock to a third party, other than a controlled affiliate of the Investors. The Investors are entitled to designate up to two nominees for election to the Board of Directors of the Company (the “Board”) and have the right to designate one individual to attend meetings of the Board as a non-voting observer, subject to the Investors maintaining certain levels of beneficial ownership of Common Shares on an as-exchanged basis. For so long as the Investors beneficially own or control at least 50% of the Preferred Stock issued on the Closing Date, including any corresponding Common Shares into which such Preferred Stock are exchanged, the Investors will be entitled to (i) participation rights with respect to future equity offerings of the Company; and (ii) governance rights, including the right to approve certain actions proposed to be taken by the Company and its subsidiaries.
| 13. |
Common Shares |
The Company is authorized to issue an unlimited number of Common Shares without par value and an unlimited number of special shares without par value.
On September 30, 2015, the Company completed a registered offering of 16,670,000 of Common Shares at a price of $6.00 per share, for aggregate gross proceeds of $100.0 million. Underwriting and other issuance costs of $4.4 million incurred in connection with the issuance of these new Common Shares were recorded as a reduction to the gross proceeds from the offering, net of income taxes of $1.6 million. The net proceeds from the offering were used by the Company to fund a portion of the purchase price of the Sunrise Acquisition (see note 2).
| 14. |
Stock-Based Compensation |
Stock Incentive Plan
On May 28, 2013, the Company’s shareholders approved the 2013 Stock Incentive Plan (the “2013 Plan”), which permits the grant of a variety of stock-based awards, including stock options, restricted stock units (“RSUs”) and performance share units (“PSUs”) to selected employees and directors of the Company. As at December 31, 2016, 1,554,218 securities remained available for issuance under the 2013 Plan.
For the years ended December 31, 2016, January 2, 2016 and January 3, 2015, total stock-based compensation expense amounted to $4.1 million, $4.4 million and $3.9 million, respectively.
Stock Options
Stock options granted during the year ended December 31, 2016, vest ratably on each of the first through third anniversaries of the grant date and expire on the tenth anniversary of the grant date. Stock options granted during the year ended January 2, 2016, vest ratably on each of the first through fifth anniversaries of the grant date and expire on the tenth anniversary of the grant date. Options granted prior to January 1, 2012 generally vest ratably on each of the first through fifth anniversaries from the date of grant and expire on the sixth anniversary of the grant date. Stock options granted by the Company contain an exercise price that is equal to the closing market price of the shares on the day prior to the grant date. Any consideration paid by employees or directors on exercise of stock options or purchase of stock is credited to capital stock.
| SUNOPTA INC. | -F34- | December 31, 2016 10-K |
| SunOpta Inc. |
| Notes to Consolidated Financial Statements |
| For the years ended December 31, 2016, January 2, 2016 and January 3, 2015 |
| (All tabular amounts expressed in thousands of U.S. dollars, except per share amounts) |
Details of stock option activity for the year ended December 31, 2016 are as follows:
| Weighted- | ||||||||||||
| average | ||||||||||||
| Weighted- | remaining | |||||||||||
| average | contractual | Aggregate | ||||||||||
| Options | exercise price | term (years) | intrinsic value | |||||||||
|
Outstanding at beginning of year |
3,482,392 | $ | 7.42 | |||||||||
|
Granted |
1,535,441 | 4.25 | ||||||||||
|
Exercised |
(125,300 | ) | 4.70 | |||||||||
|
Forfeited or expired |
(312,683 | ) | 6.92 | |||||||||
|
Outstanding at end of year |
4,579,850 | $ | 6.47 | 7.3 | $ | 6,107 | ||||||
|
Exercisable at end of year |
1,736,174 | $ | 7.12 | 5.3 | $ | 1,131 |
The weighted-average grant-date fair values of all stock options granted in the years ended December 31, 2016, January 2, 2016 and January 3, 2015, were $1.86, $4.37 and $6.93, respectively. The weighted-average assumptions used in the Black-Scholes option pricing model to determine the fair value of the options granted in those years were as follows:
| December 31, 2016 | January 2, 2016 | January 3, 2015 | |||||||
|
Dividend yield(1) |
0% | 0% | 0% | ||||||
|
Expected volatility(2) |
41.7% | 50.1% | 61.3% | ||||||
|
Risk-free interest rate(3) |
1.6% | 1.9% | 2.2% | ||||||
|
Expected life of options (years)(4) |
6.0 | 6.5 | 6.5 |
| (1) |
Determined based on expected annual dividend yield at the time of grant. | |
| (2) |
Determined based on historical volatility of the Company’s Common Shares over the expected life of the option. | |
| (3) |
Determined based on the yield on U.S. Treasury zero-coupon issues with maturity dates equal to the expected life of the option. | |
| (4) |
Determined using simplified method, as the Company changed the vesting period of its stock option grants from five years to three years in 2016, and the contractual term of its stock option grants from six years to 10 years commencing in 2012 and, as a result, historical exercise data may not provide a reasonable basis upon which to estimate expected life. |
The fair value of the options is based on estimates of the number of options that management expects to vest, which is estimated to be 85% of the granted amounts.
Details of stock options outstanding as at December 31, 2016 are as follows:
| Vested | Weighted- | Total | Weighted- | |||||||||||||||
| Exercise price range | outstanding | average price | outstanding | average price | ||||||||||||||
|
Expiry date |
Low | High | options | (vested) | options | (total) | ||||||||||||
|
2017 |
$ | 4.99 | $ | 7.72 | 466,750 | $ | 7.10 | 487,750 | $ | 7.02 | ||||||||
|
2022 |
5.14 | 5.73 | 643,700 | 5.55 | 843,400 | 5.55 | ||||||||||||
|
2023 |
7.09 | 8.23 | 402,150 | 7.48 | 705,250 | 7.47 | ||||||||||||
|
2024 |
9.70 | 13.86 | 136,100 | 11.59 | 346,503 | 11.63 | ||||||||||||
|
2025 |
5.26 | 11.55 | 87,474 | 10.15 | 692,368 | 8.35 | ||||||||||||
|
2026 |
3.27 | 6.65 | - | - | 1,504,579 | 4.27 | ||||||||||||
| 1,736,174 | $ | 7.12 | 4,579,850 | $ | 6.47 | |||||||||||||
The Company realized a cash tax benefit of $0.0 million (January 2, 2016 – $0.3 million; January 3, 2015 – $0.3 million) relating to options granted in prior years and exercised in the current year. Total compensation costs related to non-vested stock option awards not yet recognized as an expense was $5.6 million as at December 31, 2016, which will be amortized over a weighted-average remaining vesting period of 1.2 years.
| SUNOPTA INC. | -F35- | December 31, 2016 10-K |
| SunOpta Inc. |
| Notes to Consolidated Financial Statements |
| For the years ended December 31, 2016, January 2, 2016 and January 3, 2015 |
| (All tabular amounts expressed in thousands of U.S. dollars, except per share amounts) |
Restricted Stock Units and Performance Share Units
For the year ended December 31, 2016, the Company granted 135,985 RSUs and 250,345 PSUs to certain employees and directors of the Company. Each vested RSU and PSU will be settled through the issuance of common shares of the Company and are therefore treated as equity awards.
RSUs vest ratably on each of the first through third anniversaries of the grant date. The weighted average grant date fair values of all RSUs granted for the year ended December 31, 2016 was estimated to be $3.87 (January 2, 2016 – $10.07) based on the fair market value of a share of the Company’s common stock on the dates of grant. The grant-date fair value is recognized on a straight-line basis over the three-year vesting period based on the number of RSUs expected to vest.
The following table summarizes non-vested RSU activity during the year ended December 31, 2016:
| Weighted- | ||||||
| average grant- | ||||||
| RSUs | date fair value | |||||
|
Non-vested at beginning of year |
104,556 | $ | 10.63 | |||
|
Granted |
135,985 | 3.87 | ||||
|
Vested |
(50,323 | ) | 9.36 | |||
|
Forfeited or expired |
(14,358 | ) | 10.79 | |||
|
Non-vested at end of year |
175,860 | $ | 6.10 |
PSUs vest three years following the grant date. The number of PSUs that ultimately vest (up to a specified maximum) will be determined based on performance relative to predetermined performance measures of the Company. If the Company’s performance is below a specified performance level, no PSUs will vest. The weighted average grant date fair values of all PSUs granted for the year ended December 31, 2016 was estimated to be $3.27 (January 2, 2016 – $10.15) based on the fair market value of a share of the Company’s common stock on the dates of grant. Each reporting period, the number of PSUs that are expected to vest is re-determined and the grant-date fair value of these PSUs is amortized on a straight-line basis over the remaining vesting period less amounts previously recognized.
The following table summarizes non-vested PSU activity during the year ended December 31, 2016:
| Weighted- | ||||||
| average grant- | ||||||
| PSUs | date fair value | |||||
|
Non-vested at beginning of year |
231,448 | $ | 10.60 | |||
|
Granted |
250,345 | 3.27 | ||||
|
Forfeited or expired |
(27,368 | ) | 7.31 | |||
|
Non-vested at end of year |
454,425 | $ | 6.75 |
Total compensation costs related to non-vested RSU and PSU awards not yet recognized as an expense was $0.7 million and $0.7 million, respectively, as at December 31, 2016, which will be amortized over weighted-average remaining vesting periods of 1.5 years and 1.5 years, respectively.
| SUNOPTA INC. | -F36- | December 31, 2016 10-K |
| SunOpta Inc. |
| Notes to Consolidated Financial Statements |
| For the years ended December 31, 2016, January 2, 2016 and January 3, 2015 |
| (All tabular amounts expressed in thousands of U.S. dollars, except per share amounts) |
CEO Succession
Effective November 11, 2016, Hendrik Jacobs stepped down as the Company’s President and Chief Executive Officer (“CEO”). Under the terms of his separation agreement dated November 8, 2016, Mr. Jacobs’s outstanding stock options will continue to vest for a period of two years after November 11, 2016, and vested options may be exercised until May 11, 2019. Any stock options unexercised as of that date will expire. In addition, under the terms of his separation agreement, all PSUs granted to Mr. Jacobs were forfeited and cancelled as of November 11, 2016. As of November 11, 2016, the Company recognized incremental stock-based compensation expense of $0.2 million in other expense on the consolidated statement of operations related to the continued vesting of Mr. Jacobs’s unvested stock options, less the reversal of the previously recognized compensation cost related to Mr. Jacobs’s forfeited PSUs.
Effective October 1, 2015, Steven Bromley resigned as the Company’s CEO and was succeeded by Mr. Jacobs. Mr. Bromley served as Vice-Chair of the Company’s board of directors from October 1, 2015 until his resignation from the Company on December 31, 2015. Under the terms of his separation agreement dated July 6, 2015, Mr. Bromley retains his outstanding stock options and PSUs as of December 31, 2015 for a period of up to three years following that date, and those stock options and PSUs will continue to vest during that three-year period. Any stock options unexercised at the end of the three-year period will expire. As of July 6, 2015, the Company recognized incremental stock-based compensation expense of $0.9 million in other expense on the consolidated statement of operations to reflect an increase in the fair value of Mr. Bromley’s vested and unvested stock options and PSUs as a result of a modification to the terms of those awards to allow their continued vesting.
Employee Share Purchase Plan
The Company maintains an employee share purchase plan whereby employees can purchase common shares through payroll deductions. In the year ended December 31, 2016, the Company’s employees purchased 82,841 common shares (January 2, 2016 – 55,024; January 3, 2015 – 51,946) for total proceeds of $0.4 million (January 2, 2016 – $0.4 million; January 3, 2015 – $0.5 million). As at December 31, 2016, 1,173,960 common shares are remaining to be granted under this plan.
Warrants
On January 29, 2015, the Company received proceeds of $0.8 million on the exercise of warrants issued by the Company on February 5, 2010 to purchase 250,000 common shares at an exercise price of $3.25 per share, and, on June 4, 2015, the Company received proceeds of $3.1 million on the exercise of warrants issued by the Company on June 11, 2010 to purchase 600,000 common shares at an exercise price of $5.11 per share. These warrants had been issued by the Company in exchange for external advisory services. As at December 31, 2016 and January 2, 2016, the Company had no remaining issued and outstanding warrants.
| SUNOPTA INC. | -F37- | December 31, 2016 10-K |
| SunOpta Inc. |
| Notes to Consolidated Financial Statements |
| For the years ended December 31, 2016, January 2, 2016 and January 3, 2015 |
| (All tabular amounts expressed in thousands of U.S. dollars, except per share amounts) |
| 15. |
Other Expense (Income), Net |
The components of other expense (income) are as follows:
| December 31, 2016 | January 2, 2016 | January 3, 2015 | |||||||
| $ | $ | $ | |||||||
|
Impairment of long-lived assets(1) |
13,257 | - | - | ||||||
|
Legal settlement(2) |
9,000 | - | - | ||||||
|
Severance and rationalization costs(3) |
4,186 | 2,936 | 312 | ||||||
|
Product withdrawal and recall costs(4) |
2,838 | - | - | ||||||
|
Business development costs(5) |
233 | 7,767 | 261 | ||||||
|
Loss (gain) on sale of assets |
145 | 251 | (1,386 | ) | |||||
|
Increase (decrease) in fair value of contingent consideration(6) |
(1,158 | ) | 884 | (1,373 | ) | ||||
|
Other |
(209 | ) | 313 | (34 | ) | ||||
| 28,292 | 12,151 | (2,220 | ) |
| (1) |
Impairment of long-lived assets |
On December 27, 2016, the Board approved the closure of the Company’s soy extraction facility located in Heuvelton, New York. The Company determined that its ingredients processing facility in Alexandria, Minnesota could absorb the production volume from the Heuvelton facility, while continuing to meet the needs of its customers. Based on the location and use of the Heuvelton facility, the Company recorded an impairment loss of $1.2 million in the fourth quarter of 2016, to write down the carrying value of the associated long-lived assets to a nominal salvage value. The closure of the Heuvelton facility occurred on January 10, 2017. The facility is included in the Consumer Products operating segment.
On November 8, 2016, the Board approved the closure of the Company’s juice facility located in San Bernardino, California, following a review and evaluation of commercial and operational developments that impacted the facility. In particular, the Company identified a need for significant investment in new packaging and processing capabilities in order to satisfy packaging format changes demanded by the facility’s largest customer. In addition, the Company was unsuccessful in contracting sufficient supply of raw citrus fruit for the upcoming season to allow for effective and efficient use of the facility’s extraction capabilities. This supply chain challenge is expected to continue for the foreseeable future, and while the Company has secured sufficient supply of extracted juice to meet its production requirements, the Company determined that it would be more beneficial to transfer its juice production from the facility to contract manufacturers with whom the Company has ongoing relationships. Accordingly, the Company decided not to make further capital investments in support of the bottling or extraction areas of the facility. As a result, the Company determined that the carrying value of the long-lived assets of $10.9 million was not recoverable and that the assets were impaired. In the third quarter of 2016, the Company recorded an impairment loss of $10.3 million to write down the carrying value of these assets to their estimated fair value. Fair value was determined based on market prices for comparable assets, which represent level 2 inputs. The closure of the San Bernardino facility occurred on December 28, 2016. On February 28, 2017, the Company incurred approximately $3.0 million of additional costs related to the early termination of equipment leases associated with the facility, which will be recognized in other expense in the first quarter of 2017. This facility is included in the Consumer Products operating segment.
| SUNOPTA INC. | -F38- | December 31, 2016 10-K |
| SunOpta Inc. |
| Notes to Consolidated Financial Statements |
| For the years ended December 31, 2016, January 2, 2016 and January 3, 2015 |
| (All tabular amounts expressed in thousands of U.S. dollars, except per share amounts) |
In the first quarter of 2016, the Company recorded an impairment loss of $1.7 million related to the write-off of leasehold improvements at its Buena Park, California frozen fruit processing facility, following the transfer of all production volume from this facility into Sunrise’s facilities located in Kansas and California. The Buena Park facility is included in the Consumer Products operating segment.
| (2) |
Legal settlement |
In 2016, the Company recorded a charge of $9.0 million in connection with the settlement of a complaint filed by Plum, PBC (“Plum”) that arose out of a voluntary recall by Plum of certain resealable pouch products manufactured at the Company’s Allentown, Pennsylvania facility in 2013 (see note 21). In 2013, the Company had previously recorded a $5.2 million provision for the expected loss associated with this recall, which reflected at that time the amount due to the Company for product sold to Plum that was subject to the recall, as well as the carrying value of recalled product still in inventory at the Company. The previously recorded provision did not include any potential amounts payable in connection with the settlement of litigation relating to the voluntary recall.
| (3) |
Severance and rationalization costs |
For the year ended December 31, 2016, severance and rationalization costs included contractual severance benefits of $1.5 million and previously unrecognized stock-based compensation expense of $0.2 million recognized in connection with the departure of Mr. Jacobs as President and CEO effective November 11, 2016, as well as costs for employees affected by the closures of the Company’s Heuvelton, San Bernardino and Buena Park facilities (see (1) above).
For the year ended January 2, 2016, employee severance costs included contractual severance benefits of $1.2 million and previously unrecognized stock-based compensation expense of $0.9 million recognized in connection with the departure of Mr. Bromley as CEO effective October 1, 2015.
| (4) |
Product withdrawal and recall costs |
For the year ended December 31, 2016, the Company recognized costs of $1.9 million related to the voluntary withdrawal of certain consumer-packaged products due to quality-related issues, as well as $0.9 million in connection with the recall of certain roasted sunflower kernel products (see note 4).
| (5) |
Business development costs |
For the year ended January 2, 2016, business development costs included transaction costs incurred in connection with the acquisitions of Sunrise, Niagara Natural and Citrusource (see note 2).
| (6) |
Fair value of contingent consideration |
For the year ended December 31, 2016, the decrease in the fair value of contingent consideration reflects the gain on settlement of the Niagara Natural obligation. For the year ended January 2, 2016, the increase in fair value reflects the accretion for the time value of money related to the Citrusource and Niagara Natural obligations, as well as the contractual amount owing to former shareholders of OLC. For the year ended January 3, 2015, the decrease in fair value reflects the settlement of the earn-out related to the acquisition of Edner of Nevada, Inc., which was acquired by the Company in December 2010.
| 16. |
Impairment Loss on Investment |
On October 31, 2014, Enchi completed the sale of its yeast business in exchange for cash and certain royalty rights based on future sales of the yeast products by the purchaser. As a consequence of this sale, the Company estimated that its investment in equity securities of Enchi was fully impaired and that the impairment was other-than-temporary. As a result, the Company recorded an impairment loss on investment of $11.9 million on the statement of operations in 2014, to write off the remaining carrying value of its equity investment. The Company also estimated that the fair value of its $1.4 million investment in convertible subordinated notes of Enchi was $4.8 million, including the value ascribed to the accelerated payment option embedded in the notes (see note 5). As a result, the Company recognized a gain on its investment in debt securities of Enchi of $3.4 million in 2014, which was recorded as a net amount against the impairment loss on investment on the statement of operations.
| SUNOPTA INC. | -F39- | December 31, 2016 10-K |
| SunOpta Inc. |
| Notes to Consolidated Financial Statements |
| For the years ended December 31, 2016, January 2, 2016 and January 3, 2015 |
| (All tabular amounts expressed in thousands of U.S. dollars, except per share amounts) |
| 17. |
Income Taxes |
The provision for (recovery of) income taxes differs from the amount that would have resulted from applying the combined Canadian federal and provincial statutory income tax rate to earnings (loss) from continuing operations before income taxes due to the following:
| December 31, 2016 | January 2, 2016 | January 3, 2015 | |||||||
| $ | $ | $ | |||||||
|
Earnings (loss) from continuing operations before income taxes |
(74,361 | ) | (6,522 | ) | 31,533 | ||||
|
Canadian statutory rate |
26.5% | 26.5% | 26.5% | ||||||
|
Income tax provision (recovery) at statutory rate |
(19,706 | ) | (1,728 | ) | 8,356 | ||||
|
Foreign tax rate differential |
(11,329 | ) | (3,097 | ) | 3,570 | ||||
|
Change in unrecognized tax benefits |
(1,268 | ) | (855 | ) | (335 | ) | |||
|
Change in valuation allowance |
(267 | ) | 4,015 | 1,082 | |||||
|
Goodwill impairment loss |
6,841 | - | - | ||||||
|
Impact of other non-deductible expenses |
1,238 | 1,190 | - | ||||||
|
Impact of changes in enacted tax rates |
90 | (208 | ) | (161 | ) | ||||
|
Impact of non-deductible acquisition expenses |
- | 910 | - | ||||||
|
Impairment loss on investment |
- | (4,029 | ) | 1,122 | |||||
|
Benefits of losses and credits not previously recognized |
- | - | (621 | ) | |||||
|
U.S. domestic manufacturing deduction |
- | - | (906 | ) | |||||
|
Other |
604 | 412 | (64 | ) | |||||
|
Provision for (recovery of) income taxes |
(23,797 | ) | (3,390 | ) | 12,043 |
The components of earnings (loss) from continuing operations before income taxes are shown below:
| December 31, 2016 | January 2, 2016 | January 3, 2015 | |||||||
| $ | $ | $ | |||||||
|
Canada |
9,811 | 6,038 | (4,400 | ) | |||||
|
U.S. |
(93,941 | ) | (20,028 | ) | 31,469 | ||||
|
Other |
9,769 | 7,468 | 4,464 | ||||||
| (74,361 | ) | (6,522 | ) | 31,533 |
The components of the provision for (recovery of) income taxes are shown below:
| December 31, 2016 | January 2, 2016 | January 3, 2015 | |||||||
| $ | $ | $ | |||||||
|
Current income tax provision (recovery): |
|||||||||
|
Canada |
3,560 | - | - | ||||||
|
U.S. |
(1,293 | ) | (1,982 | ) | 14,626 | ||||
|
Other |
3,664 | 2,300 | 1,064 | ||||||
|
|
5,931 | 318 | 15,690 | ||||||
|
Deferred income tax provision (recovery): |
|||||||||
|
Canada |
(12 | ) | 2,484 | 2,741 | |||||
|
U.S. |
(29,463 | ) | (5,971 | ) | (6,397 | ) | |||
|
Other |
(253 | ) | (221 | ) | 9 | ||||
|
|
(29,728 | ) | (3,708 | ) | (3,647 | ) | |||
|
Provision for (recovery of) income taxes |
(23,797 | ) | (3,390 | ) | 12,043 |
| SUNOPTA INC. | -F40- | December 31, 2016 10-K |
| SunOpta Inc. |
| Notes to Consolidated Financial Statements |
| For the years ended December 31, 2016, January 2, 2016 and January 3, 2015 |
| (All tabular amounts expressed in thousands of U.S. dollars, except per share amounts) |
Deferred income taxes of the Company are comprised of the following:
| December 31, 2016 | January 2, 2016 | |||||
| $ | $ | |||||
|
Differences in property, plant and equipment and intangible assets |
(87,833 | ) | (91,368 | ) | ||
|
Capital and non-capital losses |
31,494 | 22,077 | ||||
|
Tax benefit of scientific research expenditures |
1,199 | (170 | ) | |||
|
Tax benefit of costs incurred during share issuances |
944 | 1,259 | ||||
|
Inventory basis differences |
5,761 | (1,712 | ) | |||
|
Accrued interest |
3,356 | - | ||||
|
Other accrued reserves |
10,653 | 5,895 | ||||
|
|
(34,426 | ) | (64,019 | ) | ||
|
Less: valuation allowance |
9,090 | 9,347 | ||||
|
Net deferred income tax liability |
(43,516 | ) | (73,366 | ) |
The components of the deferred income tax asset (liability) are shown below:
| December 31, 2016 | January 2, 2016 | |||||
| $ | $ | |||||
|
Canada |
1,045 | 958 | ||||
|
U.S. |
(43,668 | ) | (73,244 | ) | ||
|
Other |
(893 | ) | (1,080 | ) | ||
| (43,516 | ) | (73,366 | ) |
The components of the deferred income tax valuation allowance are as follows:
| December 31, 2016 | January 2, 2016 | |||||
| $ | $ | |||||
|
Balance, beginning of year |
9,347 | 5,332 | ||||
|
Increase in valuation allowance |
(267 | ) | 4,015 | |||
|
Foreign exchange |
10 | - | ||||
|
Balance, end of year |
9,090 | 9,347 |
The Company has approximately $0.0 million and $0.4 million (January 2, 2016 – $0.1 million and $0.3 million) in Canadian and U.S. federal scientific research investment tax credits and $0.8 million (January 2, 2016 – $0.7 million) in U.S. State research and development tax credits, which will expire in varying amounts up to 2029.
The Company has U.S. federal non-capital loss carry-forwards of approximately $51.3 million as at December 31, 2016 (January 2, 2016 – $29.7 million). The Company also has state loss carry-forwards of approximately $64.2 million as at December 31, 2016 (January 2, 2016 – $10.2 million). The amounts are available to reduce future federal and provincial/state income taxes. Non-capital loss carry-forwards attributable to the U.S. expire in varying amounts over the next 20 years.
| SUNOPTA INC. | -F41- | December 31, 2016 10-K |
| SunOpta Inc. |
| Notes to Consolidated Financial Statements |
| For the years ended December 31, 2016, January 2, 2016 and January 3, 2015 |
| (All tabular amounts expressed in thousands of U.S. dollars, except per share amounts) |
The Company has Canadian capital losses of approximately $29.7 million as at December 31, 2016 (January 2, 2016 – $0.1 million) for which a full valuation allowance exists. These amounts are available to reduce future capital gains and do not expire.
The Company records net deferred tax assets to the extent it believes these assets will more likely than not be realized. In making such determinations, the Company considers all available positive and negative evidence, including future reversals of existing temporary differences, projected future taxable income, tax planning strategies and recent financial operations. Based on this evaluation, a valuation allowance of $9.1 million (January 2, 2016 – $9.3 million) has been recorded against certain assets to reduce the net benefit recorded in the consolidated financial statements.
Undistributed earnings of the Company’s non-Canadian affiliates and associated companies are considered to be indefinitely reinvested; accordingly, no provision for deferred taxes has been provided thereon.
The Company believes it has adequately examined its tax positions taken or expected to be taken in a tax return; however, amounts asserted by taxing authorities could differ from the Company’s positions. Accordingly, additional provisions on federal, provincial, state and foreign tax-related matters could be recorded in the future as revised estimates are made or the underlying matters are settled or otherwise resolved. A reconciliation of the beginning and ending amount of unrecognized tax benefits (excluding interest and penalties) is presented below:
| December 31, 2016 | January 2, 2016 | |||||
| $ | $ | |||||
|
Balance, beginning of year |
1,720 | 2,575 | ||||
|
Reductions in tax positions of prior years |
(1,268 | ) | (855 | ) | ||
|
Balance, end of year |
452 | 1,720 |
The Company’s unrecognized tax benefits largely include a possible reduction to prior year losses for U.S. exposures relating to the deductibility of certain interest amount accrued. The Company estimates that the remaining $0.5 million of the above unrecognized tax benefits will be realized during the next 12 months. Consistent with its historical financial reporting, the Company has classified interest and penalties related to income tax liabilities, when applicable, as part of interest expense in its consolidated statements of operations, and with the related liability on the consolidated balance sheets. All of the unrecognized tax benefits could impact the Company’s effective tax rate if recognized.
The number of years with open tax audits varies depending on the tax jurisdiction. The Company’s major taxing jurisdictions include Canada (including Ontario) the U.S. (including multiple states), and the Netherlands. The Company’s 2009 through 2015 tax years (and any tax year for which available non-capital loss carry-forwards were generated up to the amount of non-capital loss carry-forward) remain subject to examination by the Internal Revenue Service for U.S. federal tax purposes, and the 2009 through 2015 tax years remain subject to examination by the appropriate governmental agencies for Canadian federal tax purposes. There are other ongoing audits in various other jurisdictions that are not considered material to the Company’s consolidated financial statements.
| SUNOPTA INC. | -F42- | December 31, 2016 10-K |
| SunOpta Inc. |
| Notes to Consolidated Financial Statements |
| For the years ended December 31, 2016, January 2, 2016 and January 3, 2015 |
| (All tabular amounts expressed in thousands of U.S. dollars, except per share amounts) |
| 18. |
Earnings (Loss) Per Share |
Basic and diluted earnings (loss) per share were calculated as follows (shares in thousands):
| December 31, | |||||||||
| 2016 | January 2, 2016 | January 3, 2015 | |||||||
|
Numerator for basic earnings (loss) per share: |
|||||||||
|
Earnings (loss) from continuing operations, less amounts attributable to non-controlling interests |
$ | (50,618 | ) | $ | (2,996 | ) | $ | 19,295 | |
|
Less: dividends and accretion on Series A Preferred Stock |
(1,812 | ) | - | - | |||||
|
Earnings (loss) from continuing operations available to common shareholders |
(52,430 | ) | (2,996 | ) | 19,295 | ||||
|
Loss from discontinued operations attributable to SunOpta Inc. |
(570 | ) | (19,475 | ) | (6,194 | ) | |||
|
Earnings (loss) available to common shareholders |
$ | (53,000 | ) | $ | (22,471 | ) | $ | 13,101 | |
|
Denominator for basic earnings (loss) per share: |
|||||||||
|
Basic weighted-average number of shares outstanding |
85,569 | 72,408 | 66,835 | ||||||
|
Basic earnings (loss) per share: |
|||||||||
|
- from continuing operations |
$ | (0.61 | ) | $ | (0.04 | ) | $ | 0.29 | |
|
- from discontinued operations |
(0.01 | ) | (0.27 | ) | (0.09 | ) | |||
| $ | (0.62 | ) | $ | (0.31 | ) | $ | 0.20 | ||
|
Numerator for diluted earnings (loss) per share: |
|||||||||
|
Earnings (loss) from continuing operations, less amounts attributable to non-controlling interests |
$ | (50,618 | ) | $ | (2,996 | ) | $ | 19,295 | |
|
Less: dividends and accretion on Series A Preferred Stock (1) |
(1,812 | ) | - | - | |||||
|
Earnings (loss) from continuing operations available to common shareholders |
(52,430 | ) | (2,996 | ) | 19,295 | ||||
|
Loss from discontinued operations attributable to SunOpta Inc. |
(570 | ) | (19,475 | ) | (6,194 | ) | |||
|
Earnings (loss) available to common shareholders |
$ | (53,000 | ) | $ | (22,471 | ) | $ | 13,101 | |
|
Denominator for diluted earnings (loss) per share: |
|||||||||
|
Basic weighted-average number of shares outstanding |
85,569 | 72,408 | 66,835 | ||||||
|
Dilutive effect of the following: |
|||||||||
|
Series A Preferred Stock (1) |
- | - | - | ||||||
|
Stock options and warrants (2) |
- | - | 1,535 | ||||||
|
Diluted weighted-average number of shares outstanding |
85,569 | 72,408 | 68,370 | ||||||
|
Diluted earnings (loss) per share: |
|||||||||
|
- from continuing operations |
$ | (0.61 | ) | $ | (0.04 | ) | $ | 0.28 | |
|
- from discontinued operations |
(0.01 | ) | (0.27 | ) | (0.09 | ) | |||
| $ | (0.62 | ) | $ | (0.31 | ) | $ | 0.19 |
| (1) |
For the year ended December 31, 2016, it was more dilutive to assume the Preferred Stock was not converted into Common Shares and, therefore, the numerator of the diluted loss per share calculation was not adjusted to add back the dividends and accretion on the Preferred Stock and the denominator was not adjusted to include 2,670,320 Common Shares issuable on an if-converted basis. |
| SUNOPTA INC. | -F43- | December 31, 2016 10-K |
| SunOpta Inc. |
| Notes to Consolidated Financial Statements |
| For the years ended December 31, 2016, January 2, 2016 and January 3, 2015 |
| (All tabular amounts expressed in thousands of U.S. dollars, except per share amounts) |
| (2) |
For the years ended December 31, 2016 and January 2, 2016, stock options to purchase 66,166 and 54,316 Common Shares, respectively, were excluded from the calculation of diluted loss per share due to their anti-dilutive effect of reducing the loss per share. In addition, for the years ended December 31, 2016, January 2, 2016 and January 3, 2015, options to purchase 2,321,448, 856,492 and 63,000 Common Shares were anti-dilutive because the exercise prices of these options were greater than the average market price. |
| 19. |
Supplemental Cash Flow Information |
| December 31, 2016 | January 2, 2016 | January 3, 2015 | |||||||
| $ | $ | $ | |||||||
|
Changes in non-cash working capital, net of businesses acquired: |
|||||||||
|
Accounts receivable |
(39,857 | ) | 17,404 | (17,881 | ) | ||||
|
Inventories |
(16,107 | ) | (25,732 | ) | (10,380 | ) | |||
|
Income tax recoverable |
22,868 | (9,782 | ) | 3,735 | |||||
|
Prepaid expenses and other current assets |
(242 | ) | (2,044 | ) | (2,152 | ) | |||
|
Accounts payable and accrued liabilities |
23,221 | 15,242 | 1,842 | ||||||
|
Customer and other deposits |
(2,774 | ) | 1,227 | 518 | |||||
| (12,891 | ) | (3,685 | ) | (24,318 | ) | ||||
|
Cash paid for: |
|||||||||
|
Interest |
28,651 | 10,496 | 3,725 | ||||||
|
Income taxes |
1,781 | 10,526 | 12,351 |
| 20. |
Related Party Transactions |
The following table summarizes transactions between the Company and related parties:
| December 31, 2016 | January 2, 2016 | January 3, 2015 | |||||||
| $ | $ | $ | |||||||
|
Sales of agronomy products(1) |
488 | 906 | 276 | ||||||
|
Purchases of fruits, grains and seeds(2) |
14,867 | 2,340 | 1,106 | ||||||
|
Sales of coffee beans(3) |
1,896 | 1,395 | 1,274 | ||||||
|
Rent paid(4) |
976 | 1,002 | 396 |
| (1) |
Represents sales of agronomy products to employees and a former director at market prices, which are included in revenues on the consolidated statements of operations. |
| (2) |
Represents purchases of raw fruit and fruit processing services at market prices from non-controlling shareholders of Sunrise’s Mexican subsidiary, as well as purchases of grains and seeds at market prices from employees and a former director, which are included in cost of goods sold on the consolidated statements of operations. |
| (3) |
Represents the sale of coffee beans at market prices from TOC to a company that is owned by the non-controlling shareholder of Trabocca B.V., a less-than-wholly-owned subsidiary of TOC. These sales are included in revenues on the consolidated statement of operations. |
| (4) |
Represents rental payments at market rates for the lease of production, warehouse and/or office facilities from former owners or shareholders of acquired businesses who remain employed by the Company. These payments are included in cost of goods sold or selling, general and administrative expenses on the consolidated statements of operations. |
| SUNOPTA INC. | -F44- | December 31, 2016 10-K |
| SunOpta Inc. |
| Notes to Consolidated Financial Statements |
| For the years ended December 31, 2016, January 2, 2016 and January 3, 2015 |
| (All tabular amounts expressed in thousands of U.S. dollars, except per share amounts) |
| 21. |
Commitments and contingencies |
Plum Dispute
Plum, a Delaware public benefit corporation and a subsidiary of Campbell Soup Company (“Campbell”), and SunOpta Global Organic Ingredients, Inc., a wholly-owned subsidiary of the Company (“SGOI”), are parties to a manufacturing and packaging agreement dated September 21, 2011 (the “Plum Manufacturing Agreement”). Pursuant to the Plum Manufacturing Agreement, SGOI agreed to manufacture and package certain food items for Plum at SGOI’s Allentown, Pennsylvania facility in accordance with Plum’s specifications regarding, among other things, product ingredients and packaging, manufacturing processes, and quality control standards. On November 8, 2013, Plum initiated a voluntary recall of certain products manufactured by SGOI at its Allentown facility. On February 3, 2015, Plum filed a complaint against SGOI in the Lehigh County Court of Common Pleas in Allentown, Pennsylvania. On April 13, 2015, Plum filed an amended complaint adding packaging manufacturer and supplier Cheer Pack North America (“Cheer Pack”) as a Defendant. SGOI asserted counterclaims against Plum, crossclaims against Cheer Pack and third-party claims against Gualapack S.p.A (“Gualapack”), Hosokawa Yoko, Co. (“Hosokawa”), Secure HY Packaging Co., Ltd. (“SHY”) and CDF Corporation (“CDF”). Cheer Pack asserted cross-claims against SGOI. Plum alleged it initiated the recall in response to consumer complaints of bloated packaging and premature spoilage of certain products, which could lead to gastrointestinal symptoms and discomfort if consumed. Plum alleged that the spoilage of its products resulted from a post-processing issue at SGOI’s Allentown facility. Plum sought unspecified damages equal to the direct costs of the recall and handling of undistributed product, incidental and consequential damages, lost profits and attorneys’ fees.
On July 29, 2016, SGOI entered into a Mutual Release and Settlement Agreement (the “Settlement Agreement”) with Plum, Campbell, Cheer Pack, Gualapack, Hosokawa, CDF and SHY. The Settlement Agreement resolved the disputed issues among the parties in connection with the litigation filed by Plum against SGOI, as described above. Pursuant to the terms of the Settlement Agreement, the Company paid Campbell $5.0 million in cash and will provide Campbell with rebates of up to $4.0 million over a four-year period in connection with Plum’s purchases of pouch products and Campbell’s purchases of aseptic broth products pursuant to manufacturing and supply agreements, as amended, between the parties and their affiliates. In order for Campbell to obtain the full $4.0 million in rebates, Plum and Campbell must order certain minimum quantities of pouch products and aseptic broth products within each of the designated twelve-month periods over the four-year rebate period. In connection with the Settlement Agreement, the Company recorded a charge of $9.0 million in 2016 (see note 15), as the Company believes there is reasonable assurance that the minimum order quantities will be achieved.
Employment Matter
On April 19, 2013, a class-action complaint, in the case titled De Jesus, et al. v. Frozsun, Inc. d/b/a Frozsun Foods, was filed against Sunrise Growers, Inc. (then named Frozsun, Inc.) in California Superior Court, Santa Barbara County seeking damages, equitable relief and reasonable attorneys’ fees for alleged wage and hour violations. This case includes claims for failure to pay all hours worked, failure to pay overtime wages, meal and rest period violations, waiting-time penalties, improper wage statements and unfair business practices. The putative class includes approximately 8,500 to 9,000 non-exempt hourly employees from Sunrise’s production facilities in Santa Maria and Oxnard, California. The parties are currently engaged in pre-class certification discovery. The Company is unable to estimate any potential liabilities relating to this proceeding, and any such liabilities could be material.
Other Claims
In addition, various claims and potential claims arising in the normal course of business are pending against the Company. It is the opinion of management that these claims or potential claims are without merit and the amount of potential liability, if any, to the Company is not determinable. Management believes the final determination of these claims or potential claims will not materially affect the financial position or results of the Company.
Environmental Laws
The Company believes that, with respect to both its operations and real property, it is in material compliance with current environmental laws. Based on known existing conditions and the Company’s experience in complying with emerging environmental issues, the Company is of the view that future costs relating to environmental compliance will not have a material adverse effect on its consolidated financial position, but there can be no assurance that unforeseen changes in the laws or enforcement policies of relevant governmental bodies, the discovery of changed conditions on the Company’s real property or in its operations, or changes in the use of such properties and any related site restoration requirements, will not result in the incurrence of significant costs.
| SUNOPTA INC. | -F45- | December 31, 2016 10-K |
| SunOpta Inc. |
| Notes to Consolidated Financial Statements |
| For the years ended December 31, 2016, January 2, 2016 and January 3, 2015 |
| (All tabular amounts expressed in thousands of U.S. dollars, except per share amounts) |
Grain Held for Others
As at December 31, 2016, the Company held grain for the benefit of others in the amount of $0.5 million (January 2, 2016 – $1.7 million). The Company is liable for any deficiencies of grade or shortage of quantity that may arise in connection with such grain.
Letters of Credit
The Company has outstanding letters of credit at December 31, 2016 totaling $4.3 million (January 2, 2016 – $4.2 million).
Real Property Lease Commitments
The Company has entered into various leasing arrangements, which have fixed monthly rents that are adjusted annually each year for inflation.
Minimum commitments under operating leases, principally for processing facilities, warehouse and distribution facilities, and equipment for the next five fiscal years and thereafter are as follows:
| $ | |||
|
2017 |
26,959 | ||
|
2018 |
23,834 | ||
|
2019 |
19,983 | ||
|
2020 |
16,187 | ||
|
2021 |
7,703 | ||
|
Thereafter |
12,477 | ||
| 107,143 |
In the years ended December 31, 2016, January 2, 2016 and January 3, 2015, net minimum rents, including contingent rents and sublease rental income, were $27.9 million, $21.6 million and $15.0 million, respectively.
| 22. |
Segmented Information |
The composition of the Company’s reportable segments is as follows:
-
Global Ingredients aggregates our North American-based Raw Material Sourcing and Supply and European-based International Sourcing and Supply operating segments focused on the procurement and sale of specialty and organic grains and seeds, raw material ingredients, value-added grain- and cocoa-based ingredients, and organic commodities.
-
Consumer Products consists of three main commercial platforms: Healthy Beverages, Healthy Fruit and Healthy Snacks. Healthy Beverages includes aseptic packaged products including non-dairy and dairy beverages, broths and teas; refrigerated premium juices; and shelf-stable juices and functional waters. Healthy Fruit includes IQF fruits for retail; IQF and bulk frozen fruit for foodservice; and custom fruit preparations for industrial use. Healthy Snacks includes fruit snacks; nutritional and protein bars; and resealable pouch products.
| SUNOPTA INC. | -F46- | December 31, 2016 10-K |
| SunOpta Inc. |
| Notes to Consolidated Financial Statements |
| For the years ended December 31, 2016, January 2, 2016 and January 3, 2015 |
| (All tabular amounts expressed in thousands of U.S. dollars, except per share amounts) |
In addition, Corporate Services provides a variety of management, financial, information technology, treasury and administration services to each of the SunOpta Foods operating segments from the Company’s headquarters in Mississauga, Ontario and administrative office in Edina, Minnesota.
When reviewing the operating results of the Company’s operating segments, management uses segment revenues from external customers and segment operating income to assess performance and allocate resources. Segment operating income excludes other income/expense items and goodwill impairment losses. In addition, interest expense and income amounts, and provisions for income taxes are not allocated to the operating segments.
Segment Revenues and Operating Income
Reportable segment operating results for the years ended December 31, 2016, January 2, 2016 and January 3, 2015 were as follows:
| December 31, 2016 | |||||||||
| Global | Consumer | ||||||||
| Ingredients | Products | Consolidated | |||||||
| $ | $ | $ | |||||||
|
Segment revenues from external customers |
574,295 | 772,436 | 1,346,731 | ||||||
|
Segment operating income |
26,787 | 1,206 | 27,993 | ||||||
|
Corporate Services |
(13,247 | ) | |||||||
|
Other expense, net (see note 15) |
(28,292 | ) | |||||||
|
Goodwill impairment (see note 9) |
(17,540 | ) | |||||||
|
Interest expense, net |
(43,275 | ) | |||||||
|
Loss from continuing operations before income taxes |
(74,361 | ) | |||||||
| January 2, 2016 | |||||||||
| Global | Consumer | ||||||||
| Ingredients | Products | Consolidated | |||||||
| $ | $ | $ | |||||||
|
Segment revenues from external customers |
610,890 | 534,244 | 1,145,134 | ||||||
|
Segment operating income |
28,184 | 3,208 | 31,392 | ||||||
|
Corporate Services |
(10,094 | ) | |||||||
|
Other expense, net (see note 15) |
(12,151 | ) | |||||||
|
Interest expense, net |
(15,669 | ) | |||||||
|
Loss from continuing operations before income taxes |
(6,522 | ) |
| January 3, 2015 | |||||||||
| Global | Consumer | ||||||||
| Ingredients | Products | Consolidated | |||||||
| $ | $ | $ | |||||||
|
Segment revenues from external customers |
619,066 | 483,679 | 1,102,745 | ||||||
|
Segment operating income |
26,274 | 27,872 | 54,146 | ||||||
|
Corporate Services |
(12,449 | ) | |||||||
|
Other income, net (see note 15) |
2,220 | ||||||||
|
Interest expense, net |
(3,943 | ) | |||||||
|
Impairment loss on investment (see note 16) |
(8,441 | ) | |||||||
|
Earnings from continuing operations before income taxes |
31,533 |
| SUNOPTA INC. | -F47- | December 31, 2016 10-K |
| SunOpta Inc. |
| Notes to Consolidated Financial Statements |
| For the years ended December 31, 2016, January 2, 2016 and January 3, 2015 |
| (All tabular amounts expressed in thousands of U.S. dollars, except per share amounts) |
Segment Assets
Total assets and goodwill by reportable segment as at December 31, 2016 and January 2, 2016 were as follows:
| December 31, 2016 | January 2, 2016 | |||||
| $ | $ | |||||
|
Segment assets: |
||||||
|
Global Ingredients |
304,149 | 321,962 | ||||
|
Consumer Products |
776,405 | 812,796 | ||||
|
Total segment assets |
1,080,554 | 1,134,758 | ||||
|
Corporate Services |
49,004 | 20,115 | ||||
|
Assets held for sale |
- | 64,330 | ||||
|
Total assets |
1,129,558 | 1,219,203 | ||||
|
Segment goodwill: |
||||||
|
Global Ingredients |
8,255 | 25,990 | ||||
|
Consumer Products |
215,356 | 215,700 | ||||
|
Total segment goodwill |
223,611 | 241,690 |
Segment Capital Expenditures, Depreciation and Amortization
Capital expenditures, depreciation and amortization by reportable segment for the years ended December 31, 2016, January 2, 2016 and January 3, 2015 were as follows:
| December 31, 2016 | January 2, 2016 | January 3, 2015 | |||||||
| $ | $ | $ | |||||||
|
Segment capital expenditures: |
|||||||||
|
Global Ingredients |
4,767 | 5,872 | 6,140 | ||||||
|
Consumer Products |
14,586 | 21,529 | 8,209 | ||||||
|
Total segment capital expenditures |
19,353 | 27,401 | 14,349 | ||||||
|
Corporate Services |
3,207 | 3,785 | 3,322 | ||||||
|
Total capital expenditures |
22,560 | 31,186 | 17,671 | ||||||
|
Segment depreciation and amortization: |
|||||||||
|
Global Ingredients |
6,406 | 6,352 | 6,668 | ||||||
|
Consumer Products |
25,532 | 12,814 | 7,562 | ||||||
|
Total segment depreciation and amortization |
31,938 | 19,166 | 14,230 | ||||||
|
Corporate Services |
2,212 | 1,841 | 1,411 | ||||||
|
Total depreciation and amortization |
34,150 | 21,007 | 15,641 |
| SUNOPTA INC. | -F48- | December 31, 2016 10-K |
| SunOpta Inc. |
| Notes to Consolidated Financial Statements |
| For the years ended December 31, 2016, January 2, 2016 and January 3, 2015 |
| (All tabular amounts expressed in thousands of U.S. dollars, except per share amounts) |
Geographic Information
The Company’s assets, operations and employees are principally located in the U.S., Canada, Europe, Mexico and Ethiopia. Revenues from external customers are attributed to countries based on the location of the customer. Revenues from external customers by geographic area for the years ended December 31, 2016, January 2, 2016 and January 3, 2015 were as follows:
| December 31, 2016 | January 2, 2016 | January 3, 2015 | |||||||
| $ | $ | $ | |||||||
|
Revenues from external customers: |
|||||||||
|
U.S. |
1,084,199 | 893,637 | 855,967 | ||||||
|
Canada |
30,959 | 33,291 | 32,910 | ||||||
|
Europe and other |
231,573 | 218,206 | 213,868 | ||||||
|
Total revenues from external customers |
1,346,731 | 1,145,134 | 1,102,745 |
Long-lived assets consist of property, plant and equipment, net of accumulated depreciation, which are attributed to countries based on the physical location of the assets. Long-lived assets by geographic area as at December 31, 2016 and January 2, 2016 were as follows:
| December 31, 2016 | January 2, 2016 | |||||
| $ | $ | |||||
|
Long-lived assets: |
||||||
|
U.S. |
133,335 | 146,457 | ||||
|
Canada |
3,346 | 3,664 | ||||
|
Europe and other |
25,558 | 26,392 | ||||
|
Total long-lived assets |
162,239 | 176,513 |
Major Customers
For the year ended December 31, 2016, Costco accounted for approximately 11% of consolidated revenues. Revenues from Costco are included in the Consumer Products operating segment. The Company did not have any customers that exceeded 10% of total revenues for the years ended January 2, 2016 and January 3, 2015.
| SUNOPTA INC. | -F49- | December 31, 2016 10-K |
Supplemental financial information (unaudited)
Summarized below is the Consolidated Statement of Operations for the quarters ended December 31, 2016, October 1, 2016, July 2, 2016 and April 2, 2016, as well as the fiscal 2015 quarterly comparatives.
| Quarter ended | ||||||
| December 31, 2016 | January 2, 2016 | |||||
| $ | $ | |||||
|
Revenues |
297,539 | 316,378 | ||||
|
Cost of goods sold |
280,496 | 291,148 | ||||
|
Gross profit |
17,043 | 25,230 | ||||
|
|
||||||
|
Selling, general and administrative expenses |
26,005 | 24,723 | ||||
|
Intangible asset amortization |
2,810 | 2,846 | ||||
|
Other expense, net(1) |
5,569 | 7,758 | ||||
|
Goodwill impairment(2) |
17,540 | - | ||||
|
Foreign exchange gain |
(1,817 | ) | (595 | ) | ||
|
|
||||||
|
Loss from continuing operations before the following |
(33,064 | ) | (9,502 | ) | ||
|
|
||||||
|
Interest expense, net |
8,527 | 12,498 | ||||
|
|
||||||
|
Loss from continuing operations before income taxes |
(41,591 | ) | (22,000 | ) | ||
|
|
||||||
|
Recovery of income taxes |
(8,165 | ) | (8,228 | ) | ||
|
|
||||||
|
Loss from continuing operations |
(33,426 | ) | (13,772 | ) | ||
|
|
||||||
|
Loss from discontinued operations, net of income taxes and non- controlling interest |
- | (16,516 | ) | |||
|
|
||||||
|
Loss |
(33,426 | ) | (30,288 | ) | ||
|
|
||||||
|
Earnings (loss) attributable to non-controlling interests |
50 | (220 | ) | |||
|
|
||||||
|
Loss attributable to SunOpta Inc. |
(33,476 | ) | (30,068 | ) | ||
|
Loss per share - basic |
||||||
|
-from continuing operations |
(0.41 | ) | (0.16 | ) | ||
|
-from discontinued operations |
- | (0.19 | ) | |||
| (0.41 | ) | (0.35 | ) | |||
|
Loss per share - diluted |
||||||
|
-from continuing operations |
(0.41 | ) | (0.16 | ) | ||
|
-from discontinued operations |
- | (0.19 | ) | |||
| (0.4 | 1) | (0.35 | ) |
| (1) |
Fourth quarter of 2016 includes the impairment of long-lived assets of $1.2 million associated with closure of the Heuvelton, New York facility (see note 15 to the consolidated financial statements). |
| (2) |
Fourth quarter of 2016 reflects the impairment of goodwill associated with the sunflower reporting unit (see note 9 to the consolidated financial statements). |
| SUNOPTA INC. | -F50- | December 31, 2016 10-K |
Supplemental financial information (unaudited) continued
| Quarter ended | ||||||
| October 1, 2016 | October 3, 2015 | |||||
| $ | $ | |||||
|
Revenues |
348,732 | 277,213 | ||||
|
Cost of goods sold |
307,702 | 250,904 | ||||
|
Gross profit |
41,030 | 26,309 | ||||
|
|
||||||
|
Selling, general and administrative expenses |
23,915 | 21,020 | ||||
|
Intangible asset amortization |
2,826 | 786 | ||||
|
Other expense, net(1) |
10,312 | 3,652 | ||||
|
Foreign exchange loss |
1,068 | 404 | ||||
|
|
||||||
|
Earnings from continuing operations before the following |
2,909 | 447 | ||||
|
|
||||||
|
Interest expense, net |
12,178 | 1,103 | ||||
|
|
||||||
|
Loss from continuing operations before income taxes |
(9,269 | ) | (656 | ) | ||
|
|
||||||
|
Recovery of income taxes |
(5,411 | ) | (568 | ) | ||
|
|
||||||
|
Loss from continuing operations |
(3,858 | ) | (88 | ) | ||
|
|
||||||
|
Earnings from discontinued operations, net of income taxes and non-controlling interest |
- | 508 | ||||
|
|
||||||
|
Earnings (loss) |
(3,858 | ) | 420 | |||
|
|
||||||
|
Earnings (loss) attributable to non-controlling interests |
(503 | ) | 106 | |||
|
|
||||||
|
Earnings (loss) attributable to SunOpta Inc. |
(3,355 | ) | 314 | |||
|
|
||||||
|
Earnings (loss) per share - basic |
||||||
|
-from continuing operations |
(0.04 | ) | - | |||
|
-from discontinued operations |
- | 0.01 | ||||
| (0.04 | ) | - | ||||
|
Earnings (loss) per share - diluted |
||||||
|
-from continuing operations |
(0.04 | ) | - | |||
|
-from discontinued operations |
- | 0.01 | ||||
| (0.04 | ) | - |
| (1) |
Third quarter of 2016 includes the impairment of long-lived assets of $10.3 million associated with closure of the San Bernardino, California facility (see note 15 to the consolidated financial statements). |
| SUNOPTA INC. | -F51- | December 31, 2016 10-K |
Supplemental financial information (unaudited) continued
| Quarter ended | ||||||
| July 2, 2016 | July 4, 2015 | |||||
| $ | $ | |||||
|
Revenues |
348,146 | 277,594 | ||||
|
Cost of goods sold |
312,168 | 247,941 | ||||
|
Gross profit |
35,978 | 29,653 | ||||
|
|
||||||
|
Selling, general and administrative expenses |
24,489 | 19,314 | ||||
|
Intangible asset amortization |
2,824 | 694 | ||||
|
Other expense, net |
8,433 | 637 | ||||
|
Foreign exchange loss (gain) |
(180 | ) | 653 | |||
|
|
||||||
|
Earnings from continuing operations before the following |
412 | 8,355 | ||||
|
|
||||||
|
Interest expense, net |
11,548 | 1,141 | ||||
|
|
||||||
|
Earnings (loss) from continuing operations before income taxes |
(11,136 | ) | 7,214 | |||
|
|
||||||
|
Provision for (recovery of) income taxes |
(7,135 | ) | 2,385 | |||
|
|
||||||
|
Earnings (loss) from continuing operations |
(4,001 | ) | 4,829 | |||
|
|
||||||
|
Loss from discontinued operations, net of income taxes and non- controlling interest |
- | (2,747 | ) | |||
|
|
||||||
|
Earnings (loss) |
(4,001 | ) | 2,082 | |||
|
|
||||||
|
Earnings attributable to non-controlling interests |
123 | 33 | ||||
|
|
||||||
|
Earnings (loss) attributable to SunOpta Inc. |
(4,124 | ) | 2,049 | |||
|
|
||||||
|
Earnings (loss) per share - basic |
||||||
|
-from continuing operations |
(0.05 | ) | 0.07 | |||
|
-from discontinued operations |
- | (0.04 | ) | |||
| (0.05 | ) | 0.03 | ||||
|
Earnings (loss) per share - diluted |
||||||
|
-from continuing operations |
(0.05 | ) | 0.07 | |||
|
-from discontinued operations |
- | (0.04 | ) | |||
| (0.05 | ) | 0.03 |
| SUNOPTA INC. | -F52- | December 31, 2016 10-K |
Supplemental financial information (unaudited) continued
| Quarter ended | ||||||
| April 2, 2016 | (1) | April 4, 2015 | ||||
| $ | $ | |||||
|
Revenues |
352,314 | 273,949 | ||||
|
Cost of goods sold |
320,413 | 244,779 | ||||
|
Gross profit |
31,901 | 29,170 | ||||
|
|
||||||
|
Selling, general and administrative expenses |
24,272 | 20,697 | ||||
|
Intangible asset amortization |
2,822 | 625 | ||||
|
Other expense, net(1) |
3,978 | 104 | ||||
|
Foreign exchange loss (gain) |
2,172 | (2,103 | ) | |||
|
|
||||||
|
Earnings (loss) from continuing operations before the following |
(1,343 | ) | 9,847 | |||
|
|
||||||
|
Interest expense, net |
11,022 | 927 | ||||
|
|
||||||
|
Earnings (loss) from continuing operations before income taxes |
(12,365 | ) | 8,920 | |||
|
|
||||||
|
Provision for (recovery of) income taxes |
(3,086 | ) | 3,021 | |||
|
|
||||||
|
Earnings (loss) from continuing operations |
(9,279 | ) | 5,899 | |||
|
|
||||||
|
Loss from discontinued operations, net of income taxes and non- controlling interest |
(570 | ) | (720 | ) | ||
|
|
||||||
|
Earnings (loss) |
(9,849 | ) | 5,179 | |||
|
|
||||||
|
Earnings (loss) attributable to non-controlling interests |
384 | (55 | ) | |||
|
|
||||||
|
Earnings (loss) attributable to SunOpta Inc. |
(10,233 | ) | 5,234 | |||
|
|
||||||
|
Earnings (loss) per share - basic |
||||||
|
-from continuing operations |
(0.11 | ) | 0.09 | |||
|
-from discontinued operations |
(0.01 | ) | (0.01 | ) | ||
| (0.12 | ) | 0.08 | ||||
|
Earnings (loss) per share - diluted |
||||||
|
-from continuing operations |
(0.11 | ) | 0.09 | |||
|
-from discontinued operations |
(0.01 | ) | (0.01 | ) | ||
| (0.12 | ) | 0.08 |
| (1) |
First quarter of 2016 includes the impairment of long-lived assets of $1.7 million associated with closure of the Buena Park, California facility (see note 15 to the consolidated financial statements). |
| SUNOPTA INC. | -F53- | December 31, 2016 10-K |