Attached files
| file | filename |
|---|---|
| 8-K - FORM 8-K - SCHULMAN A INC | c09461e8vk.htm |
Exhibit 99.1

| December 9, 2010 2010 Annual Meeting |

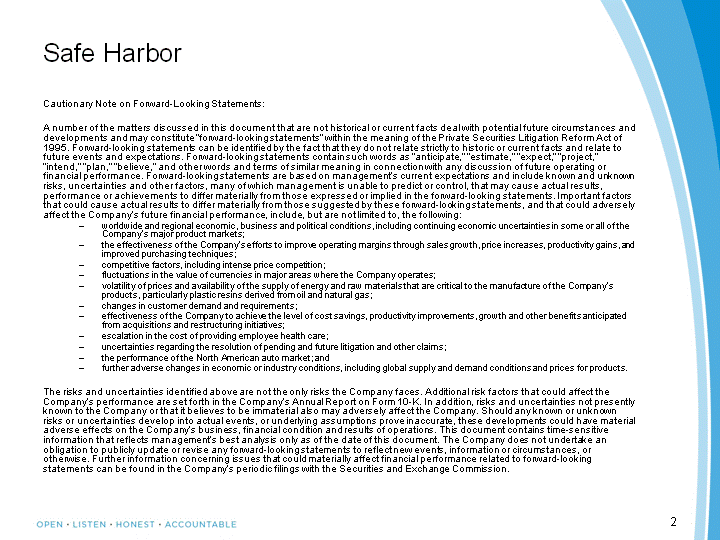
| 2 Safe Harbor Cautionary Note on Forward-Looking Statements: A number of the matters discussed in this document that are not historical or current facts deal with potential future circumstances and developments and may constitute "forward-looking statements" within the meaning of the Private Securities Litigation Reform Act of 1995. Forward-looking statements can be identified by the fact that they do not relate strictly to historic or current facts and relate to future events and expectations. Forward-looking statements contain such words as "anticipate," "estimate," "expect," "project," "intend," "plan," "believe," and other words and terms of similar meaning in connection with any discussion of future operating or financial performance. Forward-looking statements are based on management's current expectations and include known and unknown risks, uncertainties and other factors, many of which management is unable to predict or control, that may cause actual results, performance or achievements to differ materially from those expressed or implied in the forward-looking statements. Important factors that could cause actual results to differ materially from those suggested by these forward-looking statements, and that could adversely affect the Company's future financial performance, include, but are not limited to, the following: worldwide and regional economic, business and political conditions, including continuing economic uncertainties in some or all of the Company's major product markets; the effectiveness of the Company's efforts to improve operating margins through sales growth, price increases, productivity gains, and improved purchasing techniques; competitive factors, including intense price competition; fluctuations in the value of currencies in major areas where the Company operates; volatility of prices and availability of the supply of energy and raw materials that are critical to the manufacture of the Company's products, particularly plastic resins derived from oil and natural gas; changes in customer demand and requirements; effectiveness of the Company to achieve the level of cost savings, productivity improvements, growth and other benefits anticipated from acquisitions and restructuring initiatives; escalation in the cost of providing employee health care; uncertainties regarding the resolution of pending and future litigation and other claims; the performance of the North American auto market; and further adverse changes in economic or industry conditions, including global supply and demand conditions and prices for products. The risks and uncertainties identified above are not the only risks the Company faces. Additional risk factors that could affect the Company's performance are set forth in the Company's Annual Report on Form 10-K. In addition, risks and uncertainties not presently known to the Company or that it believes to be immaterial also may adversely affect the Company. Should any known or unknown risks or uncertainties develop into actual events, or underlying assumptions prove inaccurate, these developments could have material adverse effects on the Company's business, financial condition and results of operations. This document contains time-sensitive information that reflects management's best analysis only as of the date of this document. The Company does not undertake an obligation to publicly update or revise any forward-looking statements to reflect new events, information or circumstances, or otherwise. Further information concerning issues that could materially affect financial performance related to forward-looking statements can be found in the Company's periodic filings with the Securities and Exchange Commission. |

| 3 Use of Non-GAAP Financial Measures This presentation includes the use of both GAAP (generally accepted accounting principles) and non-GAAP financial measures. The non- GAAP financial measures include net income excluding unusual items. The Company's chief operating decision makers use these financial measures to monitor and evaluate the ongoing performance of the Company and each business unit and to allocate resources. In addition, net income excluding unusual items is a component of A. Schulman's annual employee incentive plans. A reconciliation of non-GAAP financial measures with GAAP financial measures is attached to this presentation at the end. |

| 4 A. Schulman Milestones FY 2010 Restored profitability in U.S. operations Successfully completed McCann and ICO acquisitions Expanded our presence and capacity in Asia/Pacific markets Bolstered our positions in the U.S. Masterbatch market Continued realignment of our European footprint Further strengthened our management team Gustavo Perez named GM and COO of the Americas Derek Bristow named GM and COO of Asia/Pacific Refined company's guiding principles (Open, Honest, Listen & Accountable) and rolled out to global associates FY 2011 Acquired Brazil-based Mash Product innovation continues - winner of four Society of Plastics Engineers' European Automotive Awards |

| 5 A. Schulman's Strategy Support Distribution Use our distribution channels to leverage our Masterbatch, Specialty Powders and Engineered Plastics lines of business Leverage centralized purchasing power to improve availability and cost of base resins Capture new sources of polymers from the low price feedstock countries Be the #1 Niche Player Globally Engineered Plastics Lever our successful German model Reduce North American auto capacity and focus on most profitable lines of business Continue development of sustainable "Green" products Be the #1 Global Manufacturer Masterbatch Favored consolidator in highly fragmented market Judicious acquisitions to speed entry into underserved markets and geographic extension Focus on new, higher-margin products/applications Be the #1 Global Manufacturer Specialty Powders In North America, maintain a balanced position between low-cost and technology leadership with focused R&D In Europe and Asia, further our technology leadership in high-value compounds Judicious acquisitions to speed entry into underserved markets and geographic extension |

| 6 Four Key Profit Drivers Slow and Steady Volume Improvement Continuous Improvements New Products Purchasing Savings/Smart Pricing Gradual market recoveries over time Organic growth Geographic growth Continued leverage of global volume base Seek opportunities for alternate sourcing from Middle East and Asia Align pricing strategies with purchasing strategies Optimize footprint SG&A leverage Realize synergies from ICO, McCann and Mash acquisitions Limit growth of SG&A, especially in developed markets Admin optimization Create higher-margin product portfolio Support volume but primary focus on increased profitability ACQUISITIONS WILL ALSO PLAY KEY ROLE IN FUTURE GROWTH! |

| 7 Actions taken before & during recession have improved net income while protecting liquidity - which remains strong - while volume is still down FY2007 FY2008 FY2009 FY2010 Net Income Excluding non-operating 24.469 37.229 16.507 48.2 FY2007 FY2008 FY2009 FY2010 Net Debt 82.8 16.1 -124 31.9 FY2007 FY2008 FY2009 FY2010 Net Income Excluding non-operating 1856.167 1784.08 1309.848 1587.737 #s in millions & excluding unusual items |

| 8 Financial Highlights Reported net income for FY 2010 was: $43.9 million or $1.58 per diluted share vs. ($2.8) million or ($0.11) per diluted share FY 2009 Excluding certain one-time charges and acquisition-related items*, net income for FY 2010 was: $48.2 million or $1.72 per diluted share vs. $16.4 million or $0.64 per diluted share in FY 2009 Cash was $123 million at 8/31/10; net debt position of $31.9 million; more than $234 million of untapped credit lines Days of working capital were 61 as of Aug '10; excluding ICO, the WC days were at 59 compared with 60 as of Aug '09 * Please see the end of this presentation for the reconciliations of GAAP versus non-GAAP financial measures. |

| 9 Questions? |

| 10 Non-GAAP to GAAP Reconciliation FY 2010 FY 2010 FY 2010 |

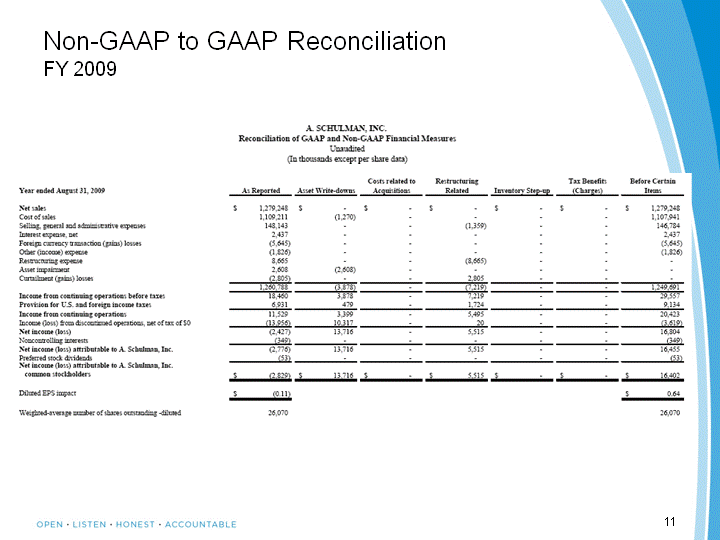
| 11 Non-GAAP to GAAP Reconciliation FY 2009 |
