Attached files
| file | filename |
|---|---|
| 8-K - 8-K - VIVUS INC | a10-13137_18k.htm |
| EX-99.1 - EX-99.1 - VIVUS INC | a10-13137_1ex99d1.htm |
| EX-99.2 - EX-99.2 - VIVUS INC | a10-13137_1ex99d2.htm |
| EX-99.3 - EX-99.3 - VIVUS INC | a10-13137_1ex99d3.htm |
| EX-99.4 - EX-99.4 - VIVUS INC | a10-13137_1ex99d4.htm |
Exhibit 99.5
Below is a graphical representation of the poster entitled “Effects of Low-Dose, Controlled-Release Phentermine/Topiramate on Weight, Glycemic Markers, and Progression to Type 2 Diabetes Mellitus”:
Below is a reproduction of the contents of the poster entitled “Effects of Low-Dose, Controlled-Release Phentermine/Topiramate on Weight, Glycemic Markers, and Progression to Type 2 Diabetes Mellitus”:
Authors: Donna H. Ryan, MD(a); Kishore M. Gadde MD(b); Leland Wilson(c); Barbara Troupin, MD(c)
(a)Pennington Biomedical Research Center, Baton Rouge, Louisiana, United States of America; (b)Duke University Medical Center, Durham, North Carolina, United States of America; (c)VIVUS, Inc., Mountain View, California, United States of America
· Introduction
· Obesity is an escalating epidemic in the United States that is associated with comorbidities such as cardiovascular disease and type 2 diabetes (T2DM), as well as increased mortality.(1)-(4)
· Development of T2DM is closely linked with obesity; the incidence of T2DM is increasing rapidly, mirroring the obesity epidemic.(5)
· With weight gain, progression from normoglycemia to impaired glucose tolerance/impaired fasting glucose (IGT/IFG) to T2DM is a frequent occurrence in the absence of intervention in at-risk populations; however, weight loss has been shown to decrease insulin resistance and/or improve insulin sensitivity.(5)
· Phentermine (PHEN) and topiramate (TPM) are 2 pharmacologic agents with demonstrated weight-loss properties. PHEN is currently approved in the United States for short-term weight loss (recommended dose is 37.5 mg/day) as an adjunct to lifestyle modifications. TPM is indicated for treatment of seizures (recommended dose: 400 mg/day) and prevention of migraines (recommended dose: 100 mg/day).(6),(7)
· A previous extended-release formulation of TPM at doses titrated up to 175 mg/day (range 50 mg/day to 175 mg/day) demonstrated weight loss in clinical trials, although side effects were significant and prevented further development of that formulation as monotherapy(8),(9) Therefore, a combination of low-dose, controlled-release (CR) PHEN/TPM for once-daily oral dosing was developed to maximize weight loss and comorbid benefits, while minimizing adverse events.
· Objectives
· To examine weight loss in a pooled population of obese/overweight subjects from the EQUIP and CONQUER clinical trials.
· To evaluate glycemic and insulinemic markers in normoglycemic, prediabetic, and diabetic subjects from the EQUIP and CONQUER clinical trials and determine effects of weight loss on progression to T2DM.
· Methods
· 2 clinical studies are included in this evaluation:
· CONQUER: double-blind, placebo-controlled Phase 3 trial of 2487 overweight/obese adult subjects (BMI >27 kg/m2 and <45 kg/m2) with >2 weight-related comorbidities randomly assigned to placebo, PHEN 7.5 mg/TPM CR 46 mg (7.5/46), or PHEN 15 mg/TPM CR 92 mg (15/92) for 56 weeks. All subjects received lifestyle and exercise guidance. Subjects who were diabetic at baseline were either antidiabetic drug-naïve or on metformin only for their diabetes.
· EQUIP: double-blind, placebo-controlled Phase 3 trial of 1267 obese subjects (BMI >35 kg/m2), excluding subjects with T2DM, randomly assigned to placebo, PHEN 3.75 mg/TPM CR 23 mg (3.75/23), or 15/92 for 56 weeks.
· A pooled analysis of CONQUER and EQUIP was conducted in order to determine the effects of PHEN/TPM CR over a broad range of subjects stratified by glycemic status. The rationale for this integrated analysis includes similarity of subjects and consistency in PHEN/TPM CR doses across trials.
· Assessments
· A primary efficacy endpoint for both Phase 3 studies was percent weight loss at Week 56 with last observation carried forward (LOCF) for the intent-to-treat (ITT) set and for completers, with the corresponding treatment comparisons. For EQUIP, fasting glucose (FG) at Week 56 is also presented. For CONQUER, fasting insulin (FI) and FG levels at Week 56 in all subjects as well as FG in subjects with T2DM are reported.
· Statistical methods: Analysis of the first primary efficacy variable, percent weight loss at endpoint, was performed using an analysis of covariance (ANCOVA) model with treatment, study, and gender as fixed effects and baseline weight as a covariate. Data are presented at Week 56 with LOCF. The ITT and study completer sets were the primary analysis populations for efficacy presentations.
· Results
· Baseline characteristics of the pooled 1-year cohort are presented in Table 1. Subjects were mostly female (74%), age <65 years (93.3%), and overweight or obese (60.5% BMI >30 kg/m2 and <40 kg/m2; 34.7% BMI >40 kg/m2).
Table 1. Baseline Characteristics of Pooled Analysis of EQUIP and CONQUER: ITT Set - 1 Year Cohort
|
|
|
Placebo |
|
PHEN/TPM |
|
PHEN/TPM |
|
PHEN/TPM |
|
|
Age (years) |
|
|
|
|
|
|
|
|
|
|
Mean (SD) |
|
48.5 (11.43) |
|
43.0 (11.05) |
|
51.1 (10.38) |
|
48.0 (11.97) |
|
|
Age, n (%) |
|
|
|
|
|
|
|
|
|
|
<65 years |
|
1382 (93.6) |
|
230 (98.3) |
|
442 (90.6) |
|
1376 (93.0) |
|
|
Gender, n (%) |
|
|
|
|
|
|
|
|
|
|
Female |
|
1102 (74.6) |
|
194 (82.9) |
|
341 (69.9) |
|
1094 (74.0) |
|
|
Weight (kg) |
|
|
|
|
|
|
|
|
|
|
Mean (SD) |
|
107.5 (20.18) |
|
118.6 (21.94) |
|
102.8 (18.19) |
|
107.1 (19.62) |
|
|
Waist circumference (cm) |
|
|
|
|
|
|
|
|
|
|
Mean (SD) |
|
115.8 (13.26) |
|
121.5 (15.15) |
|
112.7 (12.42) |
|
115.5 (13.51) |
|
|
Body mass index (kg/m2) |
|
|
|
|
|
|
|
|
|
|
Mean (SD) |
|
38.5 (5.73) |
|
42.5 (6.54) |
|
36.3 (4.41) |
|
38.4 (5.67) |
|
|
Body mass index category n (%) |
|
|
|
|
|
|
|
|
|
|
>30 and <40 kg/m2 |
|
904 (61.2) |
|
91 (38.9) |
|
344 (70.5) |
|
887 (60.0) |
|
|
>40 kg/m(2) |
|
502 (34.0) |
|
143 (61.1) |
|
111 (22.7) |
|
521 (35.2) |
|
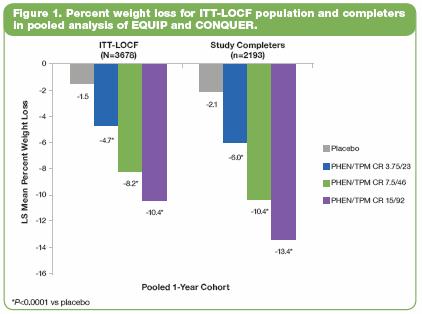
· In the ITT-LOCF population, leastsquares (LS) mean weight loss at 56 weeks for the placebo, 3.75/23, 7.5/46, and 15/92 groups was 1.5%, 4.7%, 8.2%, and 10.4%, respectively (P<0.0001 vs placebo). In the 2193 subjects who completed 56 weeks of treatment, LS mean weight loss was 2.1%, 6.0%, 10.4%, and 13.4%, respectively (P<0.0001 vs placebo) (Figure 1).
· In EQUIP, the 3.75/23 and 15/92 groups demonstrated superior weight loss vs placebo at all time points (P<0.0001). Treatment with 15/92 was statistically superior to 3.75/23 for change in weight (P<0.0001).
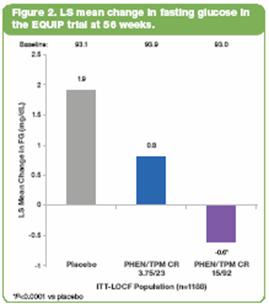
· In EQUIP, subjects with T2DM (by history or FG >126 mg/dL at baseline) were excluded. In the ITT-LOCF population (Figure 2), there was a significantly greater decrease in FG in the 15/92-treated subjects vs placebo (P<0.0001). Subjects in this study with baseline FG in the upper quartile (n=261) had a baseline mean FG ranging from 105.0-105.6 mg/dL across treatment groups, which is within the prediabetes range of 100-125 mg/dL. Within this subpopulation, LS mean change in FG was -3.5 mg/dL, -9.3 mg/dL, and -6.2 mg/dL in the placebo, 3.75/23, and 15/92 groups, respectively (P<0.05 vs placebo).
· In CONQUER, which included 388 (15.8%) subjects with T2DM at baseline, oral glucose tolerance testing at 56 weeks demonstrated significant reductions in insulin and glucose levels with PHEN/TPM CR treatment vs placebo (P<0.0005). After 56 weeks of treatment, the whole-body insulin sensitivity index was increased by approximately 60% across the entire population (Table 2).
Table 2. Whole-body Insulin Sensitivity Index – Change From Baseline to Week 56 in CONQUER Subjects (ITT-LOCF)
|
|
|
Baseline Mean |
|
LS Mean Change |
|
P value vs |
|
|
Placebo |
|
3.54 |
|
0.50 |
|
— |
|
|
PHEN/TPM CR
7.5/46 |
|
3.36 |
|
1.71 |
|
<0.0001 |
|
|
PHEN/TPM CR
15/92 |
|
3.65 |
|
1.98 |
|
<0.0001 |
|
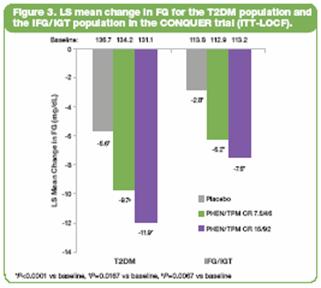
· In CONQUER, in the T2DM subpopulation, LS mean changes in FG (mg/dL) were -5.6, -9.7, -11.9 for placebo, 7.5/46, and 15/92, respectively (P=NS vs placebo). Subjects with IFG/IGT (n=1635 [66.8%]) showed significant improvements in FG vs placebo (P<0.005) (Figure 3).
· In the CONQUER trial, 47 new cases of T2DM were documented as adverse events: 27 (2.7%), 9 (1.8%), and 11 (1.1%) for placebo, 7.5/46, and 15/92, respectively.
· PHEN/TPM CR was generally well tolerated. Constipation, dry mouth, paresthesia, and dysgeusia were the most commonly reported treatment-emergent adverse events; these events were dose related and were seen consistently in EQUIP, CONQUER, and in the pooled one-year data.
· Conclusions
· These results demonstrate that treatment with PHEN/TPM CR consistently leads to significant weight loss and clinically meaningful improvements in glycemic parameters.
· In these pooled analyses, weight loss led to improvements in glycemic markers, which indicate improvements in glycemic regulation and insulin sensitivity.
· The lower number of new T2DM diagnoses with PHEN/TPM CR treatment vs placebo suggests that there may be a benefit of weight loss with PHEN/TPM CR in addition to standard of care that may alter the course of the disease and delay in progression to T2DM.
These trials are registered at ClinicalTrials.gov, number NCT00554216 (EQUIP) and number NCT00553787 (CONQUER).
References: (1) Reaven GM. Importance of identifying the overweight patient who will benefit the most by losing weight. Ann Intern Med. 2003;138:420-423. (2) Flegal KM, Carroll MD, Ogden CL, Johnson CL. Prevalence and trends in obesity among US adults, 1999-2000. JAMA. 2002;288:1723-1727. (3) Haslam DW, James WP. Obesity. Lancet. 2005;366:1197-1209. (4) Adams KF, Schatzkin A, Harris TB, et al. Overweight, obesity, and mortality in a large prospective cohort of persons 50 to 71 years old. N Engl J Med. 2006;355:763-778. (5) American Diabetes Association. Standards of medical care in diabetes—2006. Diabetes Care. 2006;29(suppl 1):S4-S42. (6) Adipex-P [package insert]. Sellersville, PA: Teva Pharmaceuticals USA; 2005. (7) Topamax [package insert]. Titusville, NJ: Ortho-McNeil-Janssen Pharmaceuticals, Inc.; 2009. (8) Rosenstock J, Hollander P, Gadde KM, Sun X, Strauss R, Leung A. for the OBD-205 Study Group. A randomized, double-blind, placebo-controlled, multicenter study to assess the efficacy and safety of topiramate controlled release in the treatment of obese type 2 diabetic patients. Diabetes Care. 2007;30:1480-1486. (9) Stenlöf K, Rössner S, Vercruysse F, Kumar A, Fitchet M, Sjöström L. for the OBDM-003 Study Group. Topiramate in the treatment of obese subjects with drug-naive type 2 diabetes. Diabetes Obes Metab. 2007;9:360-368.
Acknowledgements: We would like to acknowledge and thank the CONQUER and EQUIP investigators and study coordinators, the Medpace team (study CRO), The Lockwood Group (for poster development assistance), and VIVUS internal contributors.