Attached files
| file | filename |
|---|---|
| EX-32.2 - EX-32.2 - Granite Falls Energy, LLC | a10-11933_1ex32d2.htm |
| EX-10.1 - EX-10.1 - Granite Falls Energy, LLC | a10-11933_1ex10d1.htm |
| EX-31.2 - EX-31.2 - Granite Falls Energy, LLC | a10-11933_1ex31d2.htm |
| EX-32.1 - EX-32.1 - Granite Falls Energy, LLC | a10-11933_1ex32d1.htm |
| EX-31.1 - EX-31.1 - Granite Falls Energy, LLC | a10-11933_1ex31d1.htm |
| EX-10.2 - EX-10.2 - Granite Falls Energy, LLC | a10-11933_1ex10d2.htm |
UNITED
STATES
SECURITIES AND EXCHANGE COMMISSION
Washington, D.C. 20549
FORM 10-Q
o Quarterly report under Section 13 or 15(d) of the Securities Exchange Act of 1934.
For the fiscal quarter ended April 30, 2010
o Transition report under Section 13 or 15(d) of the Exchange Act of 1934.
Commission file number 00051277
GRANITE FALLS ENERGY, LLC
(Name of small business issuer in its charter)
|
Minnesota |
|
41-1997390 |
|
(State or other jurisdiction of |
|
(I.R.S. Employer Identification No.) |
|
15045 Highway 23 SE |
|
|
|
Granite Falls, MN |
|
56241-0216 |
|
(Address of principal executive offices) |
|
(Zip Code) |
320-564-3100
(Issuer’s
telephone number)
Indicate by check mark whether the registrant (1) filed all reports required to be filed by Section 13 or 15(d) of the Securities Exchange Act of 1934 during the preceding 12 months (or for such shorter period that the registrant was required to file such reports), and (2) has been subject to such filing requirements for the past 90 days. x Yes o No
Indicate by check mark whether the registrant has submitted electronically and posted on its corporate Web site, if any, every Interactive Data File required to be submitted and posted pursuant to Rule 405 of Regulation S-T (§232.405 of this chapter) during the preceding 12 months (or for such shorter period that the registrant was required to submit and post such files). o Yes o No
Indicate by check mark whether the registrant is a large accelerated filer, an accelerated filer, a non-accelerated filer, or a smaller reporting company. See the definitions of “large accelerated filer,” “accelerated filer” and “smaller reporting company” in Rule 12b-2 of the Exchange Act.
|
Large accelerated filer o |
|
Accelerated filer o |
|
|
|
|
|
Non-accelerated filer x |
|
Smaller reporting company o |
|
(Do not check if a smaller reporting company) |
|
|
Indicate by check mark whether the registrant is a shell company (as defined in Rule 12b-2 of the Exchange Act). o Yes x No
Indicate the number of shares outstanding of each of the issuer’s classes of common stock, as of the latest practicable date: As of June 1, 2010 there were 30,656 membership units outstanding.
PART I - FINANCIAL INFORMATION
GRANITE FALLS ENERGY, LLC
Condensed Balance Sheets
|
|
|
April 30, |
|
October 31, |
|
||
|
|
|
2010 |
|
2009 |
|
||
|
|
|
(unaudited) |
|
|
|
||
|
ASSETS |
|
|
|
|
|
||
|
|
|
|
|
|
|
||
|
Current Assets |
|
|
|
|
|
||
|
Cash |
|
$ |
8,541,953 |
|
$ |
5,716,506 |
|
|
Restricted cash |
|
628,853 |
|
1,110,673 |
|
||
|
Accounts receivable - primarily related party |
|
1,755,501 |
|
3,340,018 |
|
||
|
Inventory |
|
3,726,579 |
|
2,851,640 |
|
||
|
Derivative instruments |
|
55,586 |
|
816,812 |
|
||
|
Prepaid expenses and other current assets |
|
246,649 |
|
179,622 |
|
||
|
Total current assets |
|
14,955,121 |
|
14,015,271 |
|
||
|
|
|
|
|
|
|
||
|
Property, Plant and Equipment |
|
|
|
|
|
||
|
Land and improvements |
|
3,490,107 |
|
3,490,107 |
|
||
|
Railroad improvements |
|
4,127,738 |
|
4,127,738 |
|
||
|
Process equipment and tanks |
|
59,892,184 |
|
59,585,019 |
|
||
|
Administration building |
|
279,734 |
|
279,734 |
|
||
|
Office equipment |
|
135,912 |
|
135,912 |
|
||
|
Rolling stock |
|
558,633 |
|
558,633 |
|
||
|
Construction in progress |
|
25,793 |
|
237,828 |
|
||
|
|
|
68,510,101 |
|
68,414,971 |
|
||
|
Less accumulated depreciation |
|
29,414,579 |
|
25,989,953 |
|
||
|
Net property, plant and equipment |
|
39,095,522 |
|
42,425,018 |
|
||
|
|
|
|
|
|
|
||
|
Other Assets |
|
|
|
|
|
||
|
Deferred financing costs, net of amortization |
|
21,152 |
|
32,894 |
|
||
|
|
|
|
|
|
|
||
|
Total Assets |
|
$ |
54,071,795 |
|
$ |
56,473,183 |
|
|
|
|
|
|
|
|
||
|
LIABILITIES AND MEMBERS’ EQUITY |
|
|
|
|
|
||
|
|
|
|
|
|
|
||
|
Current Liabilities |
|
|
|
|
|
||
|
Current portion of long-term debt |
|
$ |
66,594 |
|
$ |
74,961 |
|
|
Accounts payable |
|
1,364,586 |
|
1,529,688 |
|
||
|
Corn payable to FCE - related party |
|
1,113,278 |
|
1,565,042 |
|
||
|
Derivative instruments |
|
— |
|
455,376 |
|
||
|
Accrued liabilities |
|
527,270 |
|
379,010 |
|
||
|
Total current liabilities |
|
3,071,728 |
|
4,004,077 |
|
||
|
|
|
|
|
|
|
||
|
Long-Term Debt, less current portion |
|
274,074 |
|
370,136 |
|
||
|
|
|
|
|
|
|
||
|
Commitments and Contingencies |
|
|
|
|
|
||
|
|
|
|
|
|
|
||
|
Members’ Equity, 30,656 units authorized, issued, and outstanding |
|
50,725,993 |
|
52,098,970 |
|
||
|
|
|
|
|
|
|
||
|
Total Liabilities and Members’ Equity |
|
$ |
54,071,795 |
|
$ |
56,473,183 |
|
Notes to the Unaudited Condensed Financial Statements are an integral part of this Statement.
GRANITE FALLS ENERGY, LLC
Condensed Statements of Operations
|
|
|
Three Months |
|
Three Months |
|
||
|
|
|
Ended |
|
Ended |
|
||
|
|
|
April 30, |
|
April 30, |
|
||
|
|
|
2010 |
|
2009 |
|
||
|
|
|
(Unaudited) |
|
(Unaudited) |
|
||
|
|
|
|
|
|
|
||
|
Revenues |
|
$ |
22,237,999 |
|
$ |
21,529,863 |
|
|
|
|
|
|
|
|
||
|
Cost of Goods Sold - primarily related party |
|
20,507,901 |
|
22,089,595 |
|
||
|
|
|
|
|
|
|
||
|
Gross Profit (Loss) |
|
1,730,098 |
|
(559,732 |
) |
||
|
|
|
|
|
|
|
||
|
Operating Expenses |
|
462,770 |
|
518,509 |
|
||
|
|
|
|
|
|
|
||
|
Operating Income (Loss) |
|
1,267,328 |
|
(1,078,241 |
) |
||
|
|
|
|
|
|
|
||
|
Other Income (Expense) |
|
|
|
|
|
||
|
Other income, net |
|
4,454 |
|
31,339 |
|
||
|
Interest income |
|
27,978 |
|
2,468 |
|
||
|
Interest expense |
|
(1,513 |
) |
(26,809 |
) |
||
|
Total other income, net |
|
30,919 |
|
6,998 |
|
||
|
|
|
|
|
|
|
||
|
Net Income (Loss) |
|
$ |
1,298,247 |
|
$ |
(1,071,243 |
) |
|
|
|
|
|
|
|
||
|
Weighted Average Units Outstanding - Basic and Diluted |
|
30,656 |
|
30,656 |
|
||
|
|
|
|
|
|
|
||
|
Net Income (Loss) Per Unit - Basic and Diluted |
|
$ |
42.35 |
|
$ |
(34.94 |
) |
|
|
|
|
|
|
|
||
|
Distributions Per Unit |
|
$ |
— |
|
$ |
— |
|
Notes to the Unaudited Condensed Financial Statements are an integral part of this Statement.
GRANITE FALLS ENERGY, LLC
Condensed Statements of Operations
|
|
|
Six Months |
|
Six Months |
|
||
|
|
|
Ended |
|
Ended |
|
||
|
|
|
April 30, |
|
April 30, |
|
||
|
|
|
2010 |
|
2009 |
|
||
|
|
|
(Unaudited) |
|
(Unaudited) |
|
||
|
|
|
|
|
|
|
||
|
Revenues |
|
$ |
45,662,561 |
|
$ |
42,312,605 |
|
|
|
|
|
|
|
|
||
|
Cost of Goods Sold - primarily related party |
|
41,585,523 |
|
43,161,411 |
|
||
|
|
|
|
|
|
|
||
|
Gross Profit (Loss) |
|
4,077,038 |
|
(848,806 |
) |
||
|
|
|
|
|
|
|
||
|
Operating Expenses |
|
971,712 |
|
1,039,484 |
|
||
|
|
|
|
|
|
|
||
|
Operating Income (Loss) |
|
3,105,326 |
|
(1,888,290 |
) |
||
|
|
|
|
|
|
|
||
|
Other Income (Expense): |
|
|
|
|
|
||
|
Other income (expense), net |
|
86,408 |
|
(631,503 |
) |
||
|
Interest income |
|
42,271 |
|
5,706 |
|
||
|
Interest expense |
|
(8,582 |
) |
(63,642 |
) |
||
|
Total other income (expense), net |
|
120,097 |
|
(689,439 |
) |
||
|
|
|
|
|
|
|
||
|
Net Income (Loss) |
|
$ |
3,225,423 |
|
$ |
(2,577,729 |
) |
|
|
|
|
|
|
|
||
|
Weighted Average Units Outstanding - Basic and Diluted |
|
30,656 |
|
30,907 |
|
||
|
|
|
|
|
|
|
||
|
Net Income (Loss) Per Unit - Basic and Diluted |
|
$ |
105.21 |
|
$ |
(83.40 |
) |
|
|
|
|
|
|
|
||
|
Distributions Per Unit |
|
$ |
150.00 |
|
$ |
— |
|
Notes to Unaudited Condensed Financial Statements are an integral part of this Statement.
GRANITE FALLS ENERGY, LLC
Condensed Statements of Cash Flows
|
|
|
Six Months |
|
Six Months |
|
||
|
|
|
Ended |
|
Ended |
|
||
|
|
|
April 30, |
|
April 30, |
|
||
|
|
|
2010 |
|
2009 |
|
||
|
|
|
(unaudited) |
|
(unaudited) |
|
||
|
Cash Flows from Operating Activities: |
|
|
|
|
|
||
|
Net income (loss) |
|
$ |
3,225,423 |
|
$ |
(2,577,729 |
) |
|
Adjustments to reconcile net income (loss) to net cash provided by operations: |
|
|
|
|
|
||
|
Depreciation and amortization |
|
3,436,368 |
|
3,158,106 |
|
||
|
Change in fair value of derivative instruments |
|
331,588 |
|
128,451 |
|
||
|
Changes in assets and liabilities: |
|
|
|
|
|
||
|
Restricted cash |
|
481,820 |
|
(418,487 |
) |
||
|
Derivative instruments |
|
(25,738 |
) |
525,418 |
|
||
|
Accounts receivable |
|
1,584,517 |
|
865,043 |
|
||
|
Inventory |
|
(874,939 |
) |
140,838 |
|
||
|
Prepaid expenses and other current assets |
|
(67,027 |
) |
(146,130 |
) |
||
|
Accounts payable |
|
(616,866 |
) |
1,000,017 |
|
||
|
Due to broker |
|
— |
|
(238,581 |
) |
||
|
Accrued liabilities |
|
148,260 |
|
(1,344,199 |
) |
||
|
Net Cash Provided by Operating Activities |
|
7,623,406 |
|
1,092,747 |
|
||
|
|
|
|
|
|
|
||
|
Cash Flows from Investing Activities: |
|
|
|
|
|
||
|
Capital expenditures |
|
(91,905 |
) |
(81,071 |
) |
||
|
Construction in process |
|
(3,225 |
) |
(101,351 |
) |
||
|
Net Cash Used in Investing Activities |
|
(95,130 |
) |
(182,422 |
) |
||
|
|
|
|
|
|
|
||
|
Cash Flows from Financing Activities: |
|
|
|
|
|
||
|
Payments on revolving line of credit, net |
|
— |
|
(470,500 |
) |
||
|
Payments on long-term debt |
|
(104,429 |
) |
(36,739 |
) |
||
|
Member distributions paid |
|
(4,598,400 |
) |
— |
|
||
|
Net Cash Used in Financing Activities |
|
(4,702,829 |
) |
(507,239 |
) |
||
|
|
|
|
|
|
|
||
|
Net Increase in Cash |
|
2,825,447 |
|
403,086 |
|
||
|
|
|
|
|
|
|
||
|
Cash — Beginning of Period |
|
5,716,506 |
|
37,773 |
|
||
|
|
|
|
|
|
|
||
|
Cash — End of Period |
|
$ |
8,541,953 |
|
$ |
440,859 |
|
|
|
|
|
|
|
|
||
|
Supplemental Cash Flow Information |
|
|
|
|
|
||
|
|
|
|
|
|
|
||
|
Cash paid during the period for: |
|
|
|
|
|
||
|
Interest expense |
|
$ |
8,587 |
|
$ |
52,833 |
|
|
|
|
|
|
|
|
||
|
Supplemental Disclosure of Noncash Investing, Operating and Financing Activities |
|
|
|
|
|
||
|
|
|
|
|
|
|
||
|
Accounts receivable offset by repurchase of membership units |
|
$ |
— |
|
$ |
500,000 |
|
|
Transfer of construction in process to fixed assets |
|
$ |
215,260 |
|
$ |
— |
|
Notes to the Unaudited Condensed Financial Statements are an integral part of this Statement.
GRANITE FALLS ENERGY, LLC
Notes to Unaudited Condensed Financial Statements
April 30, 2010
1. SUMMARY OF SIGNIFICANT ACCOUNTING POLICIES
Basis of Presentation
The accompanying condensed balance sheet as of October 31, 2009 is derived from audited financial statements. The unaudited interim condensed financial statements of Granite Falls Energy, LLC (the “Company”) reflect all adjustments consisting only of normal recurring adjustments that are, in the opinion of management, necessary for a fair presentation of financial position and results of operations and cash flows. The results for the three and six month periods ended April 30, 2010 are not necessarily indicative of the results that may be expected for a full fiscal year. Certain information and note disclosures normally included in annual financial statements prepared in accordance with accounting principles generally accepted in the United States of America (“GAAP”) are condensed or omitted pursuant to the rules and regulations of the Securities and Exchange Commission (“SEC”), although the Company believes that the disclosures made are adequate to make the information not misleading. These condensed financial statements should be read in conjunction with the Company’s audited financial statements and notes thereto included in its annual report for the year ended October 31, 2009 filed on Form 10-K with the SEC.
Nature of Business
Granite Falls Energy, LLC (“GFE” or the “Company”) is a Minnesota limited liability company currently producing fuel-grade ethanol, distillers grains, and crude corn oil near Granite Falls, Minnesota and sells these products throughout the continental United States. GFE’s plant has an approximate annual production capacity of 50 million gallons.
Accounting Estimates
Management uses estimates and assumptions in preparing these condensed financial statements in accordance with generally accepted accounting principles in the United States of America. Those estimates and assumptions affect the reported amounts of assets and liabilities, the disclosure of contingent assets and liabilities, and the reported revenues and expenses. The Company uses estimates and assumptions in accounting for the following significant matters, among others: economic lives of property, plant, and equipment, realizability of accounts receivable, valuation of derivatives and inventory, and analysis of long-lived assets impairment. Actual results may differ from previously estimated amounts, and such differences may be material to our condensed financial statements. The Company periodically reviews estimates and assumptions, and the effects of revisions are reflected in the period in which the revision is made.
Revenue Recognition
The Company generally sells ethanol and related products pursuant to marketing agreements. Revenues from the production of ethanol and the related products are recorded when the customer has taken title and assumed the risks and rewards of ownership, prices are fixed or determinable, and collectability is reasonably assured. Title is generally assumed by the buyer at the Company’s shipping point.
In accordance with the Company’s agreements for the marketing and sale of ethanol and related products, marketing fees and commissions due to the marketers are deducted from the gross sales as earned. These fees and commissions are recorded net of revenues as they do not provide an identifiable benefit that is sufficiently separable from the sale of ethanol and related products. Ethanol marketing fees and commissions totaled approximately $207,000 and $177,000 for the three month periods ended April 30, 2010 and 2009, respectively. Ethanol marketing fees and commissions totaled approximately $386,000, and $326,000 for the six month periods ended April 30, 2010 and 2009, respectively. Distillers grain marketing fees and commissions totaled approximately $36,000 and $30,000 for the three month periods ended April 30, 2010 and 2009, respectively. Distillers grain marketing fees and commissions totaled approximately $78,000 and $70,000 for the six month periods ended April 30, 2010 and 2009, respectively.
GRANITE FALLS ENERGY, LLC
Notes to Unaudited Condensed Financial Statements
April 30, 2010
Derivative Instruments
From time to time the Company enters into derivative transactions to hedge its exposures to commodity price fluctuations. The Company is required to record these derivatives in the balance sheet at fair value.
In order for a derivative to qualify as a hedge, specific criteria must be met and appropriate documentation maintained. Gains and losses from derivatives that do not qualify as hedges, or are undesignated, must be recognized immediately in earnings. If the derivative does qualify as a hedge, depending on the nature of the hedge, changes in the fair value of the derivative will be either offset against the change in fair value of the hedged assets, liabilities, or firm commitments through earnings or recognized in other comprehensive income until the hedged item is recognized in earnings. Changes in the fair value of undesignated derivatives are recorded in the statement of operations.
Additionally, the Company is required to evaluate its contracts to determine whether the contracts are derivatives. Certain contracts that literally meet the definition of a derivative may be exempted as “normal purchases or normal sales.” Normal purchases and normal sales are contracts that provide for the purchase or sale of something other than a financial instrument or derivative instrument that will be delivered in quantities expected to be used or sold over a reasonable period in the normal course of business. Contracts that meet the requirements of normal purchases or sales are documented as normal and exempted from accounting and reporting requirements, and therefore, are not marked to market in our financial statements.
2. RISKS AND UNCERTAINTIES
The Company has certain risks and uncertainties that it experiences during volatile market conditions. These volatilities can have a severe impact on operations. The Company’s revenues are derived from the sale and distribution of ethanol, distillers grains, and corn oil to customers primarily located in the U.S. Corn for the production process is supplied to our plant primarily from local agricultural producers and from purchases on the open market. For the three month period ended April 30, 2010, ethanol sales averaged 85% of total revenues and corn costs averaged 65% of cost of goods sold.
The Company’s operating and financial performance is largely driven by the prices at which they sell ethanol and the net expense of corn. The price of ethanol is influenced by factors such as supply and demand, the weather, government policies and programs, and unleaded gasoline prices and the petroleum markets as a whole. Excess ethanol supply in the market, in particular, puts downward pressure on the price of ethanol. Our largest cost of production is corn. The cost of corn is generally impacted by factors such as supply and demand, the weather, government policies and programs, and our risk management program used to protect against the price volatility of these commodities.
The Company has a revenue concentration in that its revenue is generated from the sales of just three products, ethanol, distillers grains, and corn oil.
3. INVENTORY
Inventories consist of the following:
|
|
|
April 30, |
|
October 31, |
|
||
|
Raw materials |
|
$ |
1,506,833 |
|
$ |
1,123,979 |
|
|
Spare parts |
|
502,837 |
|
495,104 |
|
||
|
Work in process |
|
537,920 |
|
542,312 |
|
||
|
Finished goods |
|
1,178,989 |
|
690,245 |
|
||
|
Totals |
|
$ |
3,726,579 |
|
$ |
2,851,640 |
|
GRANITE FALLS ENERGY, LLC
Notes to Unaudited Condensed Financial Statements
April 30, 2010
The Company performs a lower of cost or market analysis on inventory to determine if the market values of certain inventories are less than their carrying value, which is attributable primarily to decreases in market prices of corn and ethanol.
4. DERIVATIVE INSTRUMENTS
In order to reduce the risk caused by market fluctuations, the Company occasionally hedges its anticipated corn, natural gas, and denaturant purchases and ethanol sales by entering into options and futures contracts. These contracts are used with the intention to fix the purchase price of anticipated requirements of corn, natural gas, and denaturant in the Company’s ethanol production activities and the related sales price of ethanol. The fair value of these contracts is based on quoted prices in active exchange-traded or over-the-counter markets. Although the Company believes its commodity derivative positions are economic hedges, none have been formally designated as a hedge for accounting purposes and derivative positions are recorded on the balance sheet at their fair market value, with changes in fair value recognized in current period earnings or losses. Gains and losses from ethanol related derivative instruments, including unrealized changes in the fair value of these positions, are included in the results of operations and are classified as a component of revenue. Gains and losses from corn, natural gas, and denaturant derivative instruments, including unrealized changes in the fair value of these positions, are included in the results of operations and are classified as a component of costs of goods sold.
As of April 30, 2010, the total notional amount of the Company’s outstanding corn derivative instruments was approximately 90,000 bushels that were entered into to hedge forecasted corn purchases through July 2010. As of April 30, 2010, the total notional amount of the Company’s outstanding natural gas derivative instruments was approximately 26,000 million British thermal units (MMBTU) that were entered into to hedge forecasted natural gas purchases through May 2010. There may be offsetting positions that are not shown on a net basis that could lower the notional amount of positions outstanding as disclosed above.
The following tables provide details regarding the Company’s derivative instruments at April 30, 2010, none of which are designated as hedging instruments
|
|
|
Balance Sheet |
|
Assets |
|
Liabilities |
|
||
|
|
|
|
|
|
|
|
|
||
|
Corn contracts |
|
Derivative instruments |
|
$ |
12,150 |
|
$ |
— |
|
|
Natural gas contracts |
|
Derivative instruments |
|
43,436 |
|
— |
|
||
|
|
|
|
|
|
|
|
|
||
|
Totals |
|
|
|
$ |
55,586 |
|
$ |
— |
|
In addition, as of April 30, 2010 the Company maintains approximately $28,853 of restricted cash related to margin requirements for the Company’s derivative instrument positions.
The following tables provide details regarding the Company’s derivative instruments at October 31, 2009, none of which are designated as hedging instruments
|
|
|
Balance Sheet |
|
Assets |
|
Liabilities |
|
||
|
|
|
|
|
|
|
|
|
||
|
Ethanol contracts |
|
Derivative instruments |
|
$ |
— |
|
$ |
(386,160 |
) |
|
Corn contracts |
|
Derivative instruments |
|
743,250 |
|
— |
|
||
|
Natural gas contracts |
|
Derivative instruments |
|
— |
|
(69,270 |
) |
||
|
Denaturant contracts |
|
Derivative instruments |
|
73,562 |
|
— |
|
||
|
|
|
|
|
|
|
|
|
||
|
Totals |
|
|
|
$ |
816,812 |
|
$ |
(455,376 |
) |
GRANITE FALLS ENERGY, LLC
Notes to Unaudited Condensed Financial Statements
April 30, 2010
In addition, as of October 31, 2009 the Company maintains approximately $510,673 of restricted cash related to margin requirements for the Company’s derivative instrument positions.
The following tables provide details regarding the gains and (losses) from Company’s derivative instruments in statements of operations, none of which are designated as hedging instruments:
|
|
|
Statement of |
|
Three-Months Ended April 30, |
|
||||
|
|
|
Operations location |
|
2010 |
|
2009 |
|
||
|
|
|
|
|
|
|
|
|
||
|
Ethanol contracts |
|
Revenue |
|
$ |
10,408 |
|
$ |
— |
|
|
Corn contracts |
|
Cost of Goods Sold |
|
40,173 |
|
(3,921 |
) |
||
|
Natural gas contracts |
|
Cost of Goods Sold |
|
(68,337 |
) |
(167,727 |
) |
||
|
Denaturant contracts |
|
Cost of Goods Sold |
|
54,417 |
|
20,847 |
|
||
|
|
|
|
|
|
|
|
|
||
|
Total gain (loss) |
|
|
|
$ |
36,661 |
|
$ |
(147,801 |
) |
|
|
|
Statement of |
|
Six-Months Ended April 30, |
|
||||
|
|
|
Operations location |
|
2010 |
|
2009 |
|
||
|
|
|
|
|
|
|
|
|
||
|
Ethanol contracts |
|
Revenue |
|
$ |
(103,132 |
) |
$ |
119,248 |
|
|
Corn contracts |
|
Cost of Goods Sold |
|
(179,254 |
) |
(108,463 |
) |
||
|
Natural gas contracts |
|
Cost of Goods Sold |
|
(113,710 |
) |
(160,083 |
) |
||
|
Denaturant contracts |
|
Cost of Goods Sold |
|
64,508 |
|
20,847 |
|
||
|
|
|
|
|
|
|
|
|
||
|
Total gain (loss) |
|
|
|
$ |
(331,588 |
) |
$ |
(128,451 |
) |
5. REVOLVING LINE OF CREDIT
The Company has a Loan Agreement with a bank. Under the Loan Agreement, the Company has a revolving line of credit with a maximum of $6,000,000 available and is secured by substantially all of the Company’s assets. The interest rate on the revolving line of credit is at 0.25 percentage points above the prime rate as reported by the Wall Street Journal, with a minimum rate of 5.0%. The interest rate on the revolving line of credit at April 30, 2010 was 5.0%, the minimum rate under the terms of the agreement. At April 30, 2010 and October 31, 2009, the Company had no outstanding balance on this line of credit. The Company is required to maintain a savings account balance with the Bank totaling 10% of the maximum amount available on the line of credit to serve as collateral on this line of credit. At April 30, 2010 and October 31, 2009, this amount totaled $600,000, and is included in restricted cash.
The Company also has letters of credit totaling $413,853 with the bank as part of a credit requirement of Northern Natural Gas.
6. LONG-TERM DEBT
Long-term debt consists of the following:
|
|
|
April 30, 2010 |
|
October 31, 2009 |
|
||
|
Economic Development Authority (“EDA”) Loans: |
|
|
|
|
|
||
|
City of Granite Fall / MIF |
|
$ |
262,769 |
|
$ |
292,956 |
|
|
Western Minnesota RLF |
|
— |
|
71,423 |
|
||
|
Chippewa County |
|
77,899 |
|
80,718 |
|
||
|
Total EDA Loan |
|
340,668 |
|
445,097 |
|
||
|
Less: Current Maturities |
|
(66,594 |
) |
(74,961 |
) |
||
|
Total Long-Term Debt |
|
$ |
274,074 |
|
$ |
370,136 |
|
GRANITE FALLS ENERGY, LLC
Notes to Unaudited Condensed Financial Statements
April 30, 2010
The estimated maturities of long term debt at April 30, 2010 are as follows:
|
2010 |
|
$ |
66,594 |
|
|
2011 |
|
67,379 |
|
|
|
2012 |
|
68,175 |
|
|
|
2013 |
|
68,983 |
|
|
|
2014 |
|
22,262 |
|
|
|
Thereafter |
|
47,275 |
|
|
|
Total |
|
$ |
340,668 |
|
EDA Loans:
On February 1, 2006, the Company signed a Loan Agreement with the City of Granite Falls, MN (“EDA Loan Agreement”) for amounts to be borrowed from several state and regional economic development authorities. The original amounts are as follows:
|
City of Granite Falls / Minnesota Investment Fund (“MIF”): |
|
|
|
Original Amount: |
|
$500,000 |
|
Interest Rate: |
|
1.00% |
|
Principal and Interest Payments: |
|
Quarterly |
|
Maturity Date: |
|
June 15, 2014 |
|
|
|
|
|
Western Minnesota Revolving Loan Fund (“RLF”): |
|
|
|
Original Amount: |
|
$100,000 |
|
Interest Rate: |
|
5.00% |
|
Principal and Interest Payments: |
|
Semi-Annual |
|
Original Maturity Date: |
|
June 15, 2016 |
|
|
|
|
|
Chippewa County: |
|
|
|
Original Amount: |
|
$100,000 |
|
Interest Rate: |
|
3.00% |
|
Principal and Interest Payments: |
|
Semi-Annual |
|
Maturity Date: |
|
June 15, 2021 |
Amounts borrowed under the EDA Loan Agreements are secured by a second mortgage on all of the assets of the Company. On March 24, 2010, the RLF loan was paid in full and there were no prepayment penalties assessed.
8. MEMBERS’ EQUITY
The Company has one class of membership units. The units have no par value and have identical rights, obligations and privileges. Income and losses are allocated to all members based upon their respective percentage of units held. As of April 30, 2010 and October 31, 2009, the Company had 30,656 membership units issued and outstanding.
In November 2009, the Company declared a cash distribution of $150 per unit or $4,598,400 for unit holders of record as of November 19, 2009. The distribution was paid on December 16, 2009.
GRANITE FALLS ENERGY, LLC
Notes to Unaudited Condensed Financial Statements
April 30, 2010
9. FAIR VALUE
Various inputs are considered when determining the value financial instruments. The inputs or methodologies used for valuing securities are not necessarily an indication of the risk associated with investing in these securities. These inputs are summarized in the three broad levels listed below.
· Level 1 inputs are quoted prices in active markets for identical assets or liabilities as of the reporting date. Active markets are those in which transactions for the asset or liability occur with sufficient frequency and volume to provide pricing information on an ongoing basis.
· Level 2 inputs include the following:
· Quoted prices in active markets for similar assets or liabilities.
· Quoted prices in markets that are not active for identical or similar assets or liabilities.
· Inputs other than quoted prices that are observable for the asset or liability.
· Inputs that are derived primarily from or corroborated by observable market data by correlation or other means.
· Level 3 inputs are unobservable inputs for the asset or liability.
The following table provides information on those assets and liabilities measured at fair value on a recurring basis.
|
|
|
|
|
|
|
Fair Value Measurement Using |
|
|||||||||
|
|
|
Carrying Amount |
|
Fair Value |
|
Quoted |
|
Significant |
|
Significant |
|
|||||
|
Financial Assets: |
|
|
|
|
|
|
|
|
|
|
|
|||||
|
Derivative Instruments |
|
$ |
55,586 |
|
$ |
55,586 |
|
$ |
55,586 |
|
$ |
— |
|
$ |
— |
|
The fair value of the derivative instruments are based on quoted market prices in an active market.
|
|
|
|
|
|
|
Fair Value Measurement Using |
|
|||||||||
|
|
|
Carrying Amount |
|
Fair Value |
|
Quoted |
|
Significant |
|
Significant |
|
|||||
|
Financial Assets: |
|
|
|
|
|
|
|
|
|
|
|
|||||
|
Derivative Instruments |
|
$ |
816,812 |
|
$ |
816,812 |
|
$ |
816,812 |
|
$ |
— |
|
$ |
— |
|
|
|
|
|
|
|
|
|
|
|
|
|
|
|||||
|
Financial Liabilities: |
|
|
|
|
|
|
|
|
|
|
|
|||||
|
Derivative Instruments |
|
$ |
(455,376 |
) |
$ |
(455,376 |
) |
$ |
(455,376 |
) |
$ |
— |
|
$ |
— |
|
The fair value of the derivative instruments are based on quoted market prices in an active market.
GRANITE FALLS ENERGY, LLC
Notes to Unaudited Condensed Financial Statements
April 30, 2010
10. COMMITMENTS AND CONTINGENCIES
Construction Management and Operations Management Agreement
On August 1, 2008, the Company and Glacial Lakes Energy, LLC (“GLE”) executed a settlement agreement and mutual release related to the dispute with GLE over the termination of the Operating and Management Agreement. The Company has agreed to pay GLE a contingent amount of 2% of net income of the Company, as defined per the agreement, for each of the fiscal years ending October 31, 2008 and 2009 and 1.5% of net income of the Company, as defined per the agreement, for the fiscal year ending October 31, 2010. As of April 30, 2010 and October 31, 2009, the Company accrued approximately $49,000 and $14,000, respectively, for the contingent amounts due under this agreement.
11. LEGAL PROCEEDINGS
From time to time in the ordinary course of business, the Company may be named as a defendant in legal proceedings related to various issues, including without limitation, workers’ compensation claims, tort claims, or contractual disputes. We are not currently a party to any material pending legal proceedings and we are not currently aware of any such proceedings being contemplated.
Item 2. Management’s Discussion and Analysis of Financial Condition and Results of Operations.
We prepared the following discussion and analysis to help you better understand our financial condition, changes in our financial condition, and results of operations for the three and six month period ended April 30, 2010, compared to the same period of the prior fiscal year. This discussion should be read in conjunction with the condensed financial statements and notes and the information contained in the Company’s Annual Report on Form 10-K for the fiscal year ended October 31, 2009.
Disclosure Regarding Forward-Looking Statements
This report contains historical information, as well as forward-looking statements. These forward-looking statements include any statements that involve known and unknown risks and relate to future events and our expectations regarding future performance or conditions. Words such as “may,” “will,” “should,” “expect,” “plan,” “anticipate,” “believe,” “estimate,” “future,” “intend,” “could,” “hope,” “predict,” “target,” “potential,” or “continue” or the negative of these terms or other similar expressions are intended to identify forward-looking statements, but are not the exclusive means of identifying such statements. These forward-looking statements, and others we make from time to time, are subject to a number of risks and uncertainties. Many factors could cause actual results to differ materially from those projected in forward-looking statements. While it is impossible to identify all such factors, factors that could cause actual results to differ materially from those estimated by us include, but are not limited to:
· Changes in the availability and price of corn and natural gas;
· Changes in our business strategy, capital improvements or development plans;
· Our ability to profitably operate the ethanol plant and maintain a positive spread between the selling price of our products and our raw materials costs;
· Results of our hedging transactions and other risk management strategies;
· Decreases in the market prices of ethanol and distillers grains;
· Ethanol supply exceeding demand; and corresponding ethanol price reductions;
· Changes in the environmental regulations that apply to our plant operations and changes in our ability to comply with such regulations;
· Changes in the availability of credit and our ability to generate sufficient liquidity to fund our operations, debt service requirements and capital expenditures;
· Changes in plant production capacity or technical difficulties in operating the plant;
· Changes in general economic conditions or the occurrence of certain events causing an economic impact in the agriculture, oil or automobile industries;
· Lack of transport, storage and blending infrastructure preventing ethanol from reaching high demand markets;
· Changes in federal and/or state laws (including the elimination of any federal and/or state ethanol tax incentives);
· Changes and advances in ethanol production technology;
· Effects of mergers, consolidations or contractions in the ethanol industry;
· Competition from alternative fuel additives;
· The development of infrastructure related to the sale and distribution of ethanol;
· Our inelastic demand for corn, as it is the only available feedstock for our plant;
· Our ability to retain key employees and maintain labor relations; and
· Volatile commodity and financial markets.
The cautionary statements referred to in this section also should be considered in connection with any subsequent written or oral forward-looking statements that may be issued by us or persons acting on our behalf. We do not undertake any duty to update forward-looking statements after the date they are made or to conform forward-looking statements to actual results or to changes in circumstances or expectations. Furthermore, we cannot guarantee future results, events, levels of activity, performance, or achievements. We caution you not to put undue reliance on any forward-looking statements, which speak only as of the date of this report. You should read this report and the documents that we reference in this report and have filed as exhibits, completely and with the understanding that our actual future results may be materially different from what we currently expect. We qualify all of our forward-looking
statements by these cautionary statements.
Overview
Granite Falls Energy, LLC (“Granite Falls” or the “Company”) is a Minnesota limited liability company currently producing fuel-grade ethanol, distillers grains, and crude corn oil for sale. Our plant has an approximate annual production capacity of 50 million gallons, and our environmental permits allow us to produce ethanol at a rate of 49.9 million gallons of undenatured ethanol on a twelve month rolling sum basis.
Our operating results are largely driven by the prices at which we sell our ethanol, distillers grains, and crude corn oil as well as the other costs related to production. The price of ethanol has historically fluctuated with the price of petroleum-based products such as unleaded gasoline, heating oil and crude oil. The price of distillers grains has historically been influenced by the price of corn as a substitute livestock feed. We expect these price relationships to continue for the foreseeable future, although recent volatility in the commodities markets makes historical price relationships less reliable. Our largest costs of production are corn, natural gas, depreciation and manufacturing chemicals. The cost of corn is largely impacted by geopolitical supply and demand factors and the outcome of our risk management strategies. Prices for natural gas, manufacturing chemicals and denaturant are tied directly to the overall energy sector, crude oil and unleaded gasoline.
As of the date of this report, we have 35 full time employees. Ten of these employees are involved primarily in management and administration. The remaining employees are involved primarily in plant operations. We do not currently anticipate any significant change in the number of employees at our plant.
There have been a number of recent developments in legislation that impacts the ethanol industry. One such development concerns the federal Renewable Fuels Standard (“RFS”). The ethanol industry is benefited by the RFS which requires that a certain amount of renewable fuels must be used in the United States each year. In February 2010, the EPA issued new regulations governing the RFS. These new regulations have been called RFS2. The most controversial part of RFS2 involves what is commonly referred to as the lifecycle analysis of greenhouse gas emissions. Specifically, the EPA adopted rules to determine which renewable fuels provided sufficient reductions in greenhouse gases, compared to conventional gasoline, to qualify under the RFS program. RFS2 establishes a tiered approach, where regular renewable fuels are required to accomplish a 20% greenhouse gas reduction compared to gasoline, advanced biofuels and biomass-based biodiesel must accomplish a 50% reduction in greenhouse gases, and cellulosic biofuels must accomplish a 60% reduction in greenhouse gases. Any fuels that fail to meet this standard cannot be used by fuel blenders to satisfy their obligations under the RFS program. The scientific method of calculating these greenhouse gas reductions has been a contentious issue. Many in the ethanol industry were concerned that corn based ethanol would not meet the 20% greenhouse gas reduction requirement based on certain parts of the environmental impact model that many in the ethanol industry believed was scientifically suspect. However, RFS2 as adopted by the EPA provides that corn-based ethanol from modern ethanol production processes does meet the definition of a renewable fuel under the RFS program. Further, certain provisions of RFS2 as adopted may disproportionately benefit ethanol produced from sugarcane. This could make sugarcane based ethanol, which is primarily produced in Brazil, more competitive in the United States ethanol market. If this were to occur, it could reduce demand for the ethanol that we produce.
In addition to RFS2 which included greenhouse gas reduction requirements, in 2009, California passed a Low Carbon Fuels Standard (“LCFS”). The California LCFS requires that renewable fuels used in California must accomplish certain reductions in greenhouse gases which is measured using a lifecycle analysis, similar to RFS2. Management believes that this lifecycle analysis is based on unsound scientific principles that unfairly disadvantages corn based ethanol. Management believes that these new regulations will preclude corn based ethanol from being used in California. California represents a significant ethanol demand market. If ethanol producers are unable to supply ethanol to California, it could significantly reduce demand for the ethanol produce. Currently, several lawsuits have been filed challenging the California LCFS.
Ethanol production in the United States is benefited by various tax incentives. The most significant of these tax incentives is the federal Volumetric Ethanol Excise Tax Credit (“VEETC”). VEETC provides a volumetric ethanol excise tax credit of 45 cents per gallon of ethanol blended with gasoline. VEETC is scheduled to expire on
December 31, 2010. If this tax credit is not renewed, it likely would have a negative impact on the price of ethanol and demand for ethanol in the marketplace. On December 31, 2009, the biodiesel blenders’ tax credit was allowed to expire. Recently, Congress passed legislation to reinstate the biodiesel credit until December 31, 2010. However, the bills passed by the House and Senate must be reconciled and the final bill must be signed by the President before the biodiesel blenders’ tax credit will be reinstated. If the VEETC that benefits the ethanol industry is allowed to expire, it could negatively impact demand for ethanol and may harm our financial condition.
The Small Ethanol Producer Tax Credit (“SEPTC”) is another tax incentive allowing small ethanol producers a 10 cent per gallon federal income tax credit on up to 15 million gallons of production, annually. The credit, which is capped at $1.5 million per year per producer, is only available to ethanol producers with an annual production capacity of no more than 60 million gallons per year. The SEPTC expires December 31, 2010, along with the VEETC. In March 2010 a bill called the Renewable Fuels Reinvestment Act of 2010 was introduced to the United States House of Representatives to extend the SEPTC and VEETC for 5 years.
Another federal policy in jeopardy is the secondary tariff on imported ethanol. This is a 54 cent per gallon tariff on ethanol imports from certain countries. This tariff was designed to offset the blender’s credit (“VEETC”) that is applied to ethanol regardless of its country of origin. The secondary tariff on imported ethanol is scheduled to expire in January 2011. However, the proposed Renewable Fuels Reinvestment Act of 2010 contains provisions extending the 54 cent per gallon tariff for five years. If this tariff is allowed to expire, imported ethanol could have a significant negative impact on ethanol prices and our profitability.
Results of Operations for the Three Months Ended April 30, 2010 and 2009
The following table shows the results of our operations and the approximate percentage of revenues, costs of goods sold, operating expenses and other items to total revenues in our unaudited statements of operations for the three months ended April 30, 2010 and 2009:
|
|
|
Three
Months |
|
Three
Months |
|
||||||
|
Statement of Operations Data |
|
Amount |
|
Percent |
|
Amount |
|
Percent |
|
||
|
Revenues |
|
$ |
22,237,999 |
|
100.0 |
% |
$ |
21,529,863 |
|
100.0 |
% |
|
|
|
|
|
|
|
|
|
|
|
||
|
Cost of Goods Sold |
|
20,507,901 |
|
92.2 |
% |
22,089,595 |
|
102.6 |
% |
||
|
|
|
|
|
|
|
|
|
|
|
||
|
Gross Profit (Loss) |
|
1,730,098 |
|
7.8 |
% |
(559,732 |
) |
(2.6 |
)% |
||
|
|
|
|
|
|
|
|
|
|
|
||
|
Operating Expenses |
|
462,770 |
|
2.1 |
% |
518,509 |
|
2.4 |
% |
||
|
|
|
|
|
|
|
|
|
|
|
||
|
Operating Income (Loss) |
|
1,267,328 |
|
5.7 |
% |
(1,078,241 |
) |
(5.0 |
)% |
||
|
|
|
|
|
|
|
|
|
|
|
||
|
Other Income, net |
|
30,919 |
|
0.1 |
% |
6,998 |
|
0.0003 |
% |
||
|
|
|
|
|
|
|
|
|
|
|
||
|
Net Income (Loss) |
|
$ |
1,298,247 |
|
5.8 |
% |
$ |
(1,506,486 |
) |
(5.0 |
)% |
Revenues
Our revenues from operations come from three primary sources: sales of fuel ethanol, sales of distillers grains and sales of corn oil.
The following table shows the sources of our revenue for the three months ended April 30, 2010.
|
Revenue Sources |
|
Amount |
|
Percentage of |
|
|
|
|
|
|
|
|
|
|
|
Ethanol sales |
|
$ |
18,996,914 |
|
85.4 |
% |
|
Distillers grains sales |
|
2,885,295 |
|
13.0 |
|
|
|
Corn oil sales |
|
345,382 |
|
1.5 |
|
|
|
Ethanol derivative activity gains (losses) |
|
10,408 |
|
0.1 |
|
|
|
Total Revenues |
|
$ |
22,237,999 |
|
100.0 |
% |
The following table shows the sources of our revenue for the three months ended April 30, 2009:
|
Revenue Sources |
|
Amount |
|
Percentage of |
|
|
|
|
|
|
|
|
|
|
|
Ethanol sales |
|
$ |
17,473,968 |
|
81.1 |
% |
|
Distillers grains sales |
|
3,812,328 |
|
17.7 |
|
|
|
Corn oil sales |
|
243,567 |
|
1.2 |
|
|
|
Ethanol derivative activity gains (losses) |
|
— |
|
— |
|
|
|
Total Revenues |
|
$ |
21,529,863 |
|
100.0 |
% |
The following table shows additional data regarding production and price levels for our primary inputs and products for the three months ended April 30, 2010 and 2009:
|
Additional Data |
|
Three
Months |
|
Three
Months |
|
||
|
Ethanol sold (gallons) |
|
12,237,427 |
|
12,082,537 |
|
||
|
Dried distillers grains sold (tons) |
|
29,684 |
|
29,934 |
|
||
|
Modified distillers grains sold (tons) |
|
798 |
|
4,787 |
|
||
|
Corn oil sold (pounds) |
|
1,435,160 |
|
1,436,920 |
|
||
|
Ethanol average price per gallon (net of hedging activity) |
|
$ |
1.55 |
|
$ |
1.44 |
|
|
Dried distillers grains average price per ton |
|
$ |
96.04 |
|
$ |
117.14 |
|
|
Modified distillers grains average price per ton |
|
$ |
42.90 |
|
$ |
64.15 |
|
|
Corn oil average price per pound |
|
$ |
0.24 |
|
$ |
0.17 |
|
|
Corn costs per bushel (net of hedging activity) |
|
$ |
3.28 |
|
$ |
3.48 |
|
Revenues.
In the three month period ended April 30, 2010, ethanol sales comprised approximately 85.4% of our revenues and distillers grains sales comprised approximately 13.0% percent of our revenues, while corn oil sales comprised approximately 1.6% of our revenues. For the three month period ended April 30, 2009, ethanol sales comprised approximately 81.1% of our revenue, and distillers grains sales comprised approximately 17.7% of our revenue, without including ethanol derivatives, while corn oil sales comprised approximately 1.2% of our revenues.
Management believes that distillers grains represent a smaller proportion of our revenues during the three months ended April 30, 2010 compared to the same period of 2009 as a result of lower distillers grains prices we received during our second fiscal quarter of 2010 compared to the same period of 2009 as a result of continued distress in the livestock markets and an abundant supply of feed products.
The average ethanol sales price we received for the three month period ended April 30, 2010 was approximately 7.6% higher than our average ethanol sales price for the comparable 2009 period. Management anticipates that the price of ethanol may remain steady or increase during the third quarter of our 2010 fiscal year as a result of slowly improving worldwide economics and the expectation of increased domestic gasoline consumption as we move into the summer driving season.
Management also anticipates that our results of operations for our 2010 fiscal year will continue to be affected by volatility in the commodity markets. If plant operating margins remain low for an extended period of time, management anticipates that this could significantly impact our liquidity, especially if our raw material costs increase. Management believes the industry will need to continue to grow demand and further develop an ethanol distribution system to facilitate additional blending of ethanol and gasoline to offset the increased supply brought to the marketplace by additional production. Going forward, we are optimistic that ethanol demand will continue to grow and ethanol distribution will continue to expand as a result of the positive blend economics that are currently available to the gasoline refiners and blenders.
The price we received for our dried distillers grains decreased during the three month period ended April 30, 2010 compared to the same period of 2009. We anticipate that the market price of our dried distillers grains will continue to be volatile as a result of changes in the price of corn and competing animal feed substitutes such as soybean meal as well as volatility in distillers grains supplies related to changes in ethanol production. Economic distress in the livestock industry has resulted in decreased demand for animal feed, including distillers grains, which may result in a weaker distillers grain market during our third quarter of the 2010 fiscal year.
For the quarter ended April 30, 2010 we independently marketed our corn oil as a biodiesel feedstock and as a supplement for animal feed. Corn oil sales accounted for approximately 1.6% of our revenues during our quarter ended April 30, 2010. On April 29, 2010, we executed a Corn Oil Marketing Agreement with Renewable Products Marketing Group, Inc. (“RPMG”). Pursuant to the agreement, RPMG will market all of the corn oil we expect to produce. The initial term of the agreement is for one year. The agreement automatically renews for additional one year terms unless either party gives 180 days notice that the agreement will not be renewed. We have the option to cancel the agreement within 90 days of the effective date. We agreed to pay RPMG a commission based on each pound of our corn oil that is sold by RPMG.
In June 2010 we signed an amendment to our Distillers Grain Marketing Agreement with CHS. Prior to signing the amendment, we independently marketed a portion of our distillers grains to local markets. On June 1, 2010 CHS began marketing all our distillers grains except for certain distillers grains that are sold through Montevideo Intermodal. We expect that under the new agreement CHS will be marketing approximately 95% of our distillers grains on a regular basis, and the balance will be sold though Montevideo Intermodal.
We occasionally engage in hedging activities with respect to our ethanol sales. We recognize the gains or losses that result from the changes in the value of these derivative instruments in revenues as the changes occur. As ethanol prices fluctuate, the value of our derivative instruments are impacted, which affects our financial performance. We anticipate continued volatility in our revenues due to the timing of the changes in value of the derivative instruments relative to the price and volume of the ethanol being hedged.
Cost of Sales
Our costs of goods sold as a percentage of revenues were approximately 92.2% for the three month period ended April 30, 2010 compared to approximately 102.6% for the same period of 2009. Our two largest costs of production are corn (65.2% of cost of goods sold for our three months ended April 30, 2010) and natural gas (9.7% of cost of goods sold for our three months ended April 30, 2010). Our cost of goods sold decreased to $20,508,000 for the three months ended April 30, 2010 from $22,090,000 in the three months ended April 30, 2009. Our per bushel corn costs decreased by approximately 5.8% for the three months ended April 30, 2010 as compared to the same period for our 2009 fiscal year. Our decreased cost of corn was the primary factor driving down our costs of goods sold.
For the three month period ended April 30, 2010, we experienced a decrease of approximately 4.0% per MMBtu in natural gas costs compared to the same period of 2009. We attribute this significant decrease in natural gas costs to the excess supply in the natural gas market. We expect the market price for natural gas to remain low in the near term as we continue to endure the worldwide economic slowdown and the resulting decreased energy demand.
We occasionally engage in hedging activities with respect to corn, natural gas or denaturant. We recognize the gains or losses that result from the changes in the value of our derivative instruments in cost of goods sold as the changes
occur. As corn, natural gas and denaturant prices fluctuate, the value of our derivative instruments are impacted, which affects our financial performance. We anticipate continued volatility in our cost of goods sold due to the timing of the changes in value of the derivative instruments relative to the cost and use of the commodity being hedged.
Operating Expense
Our operating expenses as a percentage of revenues were lower for the three month period ended April 30, 2010 than they were for the same period ended April 30, 2009. These percentages were approximately 2.1% and 2.4% for the three months ended April 30, 2010 and 2009, respectively. This decrease in operating expenses is primarily due to increased operating efficiencies and a concerted effort by management and staff to lower our operating expenses. We expect that going forward our operating expenses will remain relatively steady.
Operating Income (Loss)
Our income from operations for the three months ended April 30, 2010 was approximately 5.8% of our revenues compared to a loss of approximately 5.0% of our revenues for the three months ended April 30, 2009. For the three months ended April 30, 2010, we reported operating income of approximately $1,267,000 and for the three months ended April 30, 2009, we had an operating loss of approximately $1,078,000. This significant increase in our operating income is primarily due lower corn prices and higher ethanol prices.
Other Income (Expense)
We had total other income (net) for the three months ended April 30, 2010 of approximately $31,000 compared to other expense (net) of approximately $7,000 for the three months ended April 30, 2009. Our other expense (net) for our 2009 fiscal quarter ended April 30, 2009 was higher as a result our interest expense for that period.
Interest Expense and Interest Income
Interest expense for the three months ended April 30, 2010, was less that one tenth of one percent of our revenue and totaled approximately $1,500, compared to approximately $26,800 interest expense for the three months ended April 30, 2009. The interest expense incurred during the three months ended April 30, 2010 is attributable to our low interest loans obtained through state and regional economic development authorities. This decrease in interest expense is due to a decrease in the outstanding balance we carried on our revolving line of credit at Minnwest Bank during part of our second quarter ended April 30, 2010 compared to the same period in 2009. As of April 30, 2010, we had no outstanding balance on this line of credit.
Results of Operations for the Six Months Ended April 30, 2010 and 2009
The following table shows the results of our operations and the approximate percentage of revenues, costs of sales, operating expenses and other items to total revenues in our unaudited statements of operations for the six months ended April 30, 2010 and 2009:
|
|
|
Six Months |
|
Six Months |
|
||||||
|
Statement of Operations Data |
|
Amount |
|
Percent |
|
Amount |
|
Percent |
|
||
|
Revenues |
|
$ |
45,662,561 |
|
100.0 |
% |
$ |
42,312,605 |
|
100.0 |
% |
|
|
|
|
|
|
|
|
|
|
|
||
|
Cost of Goods Sold |
|
41,585,523 |
|
91.1 |
% |
43,161,411 |
|
102.0 |
% |
||
|
|
|
|
|
|
|
|
|
|
|
||
|
Gross Profit (Loss) |
|
4,077,037 |
|
8.9 |
% |
(848,806 |
) |
(2.0 |
)% |
||
|
|
|
|
|
|
|
|
|
|
|
||
|
Operating Expenses |
|
971,712 |
|
2.1 |
% |
1,039,484 |
|
2.5 |
% |
||
|
|
|
|
|
|
|
|
|
|
|
||
|
Operating Income (Loss) |
|
3,105,326 |
|
6.8 |
% |
(1,888,290 |
) |
(4.5 |
)% |
||
|
|
|
|
|
|
|
|
|
|
|
||
|
Other Income (Expense), net |
|
120,097 |
|
0.3 |
% |
(689,439 |
) |
(1.6 |
)% |
||
|
|
|
|
|
|
|
|
|
|
|
||
|
Net Income (Loss) |
|
$ |
3,225,423 |
|
7.1 |
% |
$ |
(2,577,729 |
) |
(6.0 |
)% |
Revenues
Our revenues from operations come from two primary sources: sales of fuel ethanol and sales of distillers grains. We also had revenue from the sale of corn oil.
The following table shows the sources of our revenue for the six months ended April 30, 2010.
|
Revenue Sources |
|
Amount |
|
Percentage of |
|
|
|
|
|
|
|
|
|
|
|
Ethanol Sales |
|
$ |
39,177,800 |
|
85.8 |
% |
|
Distillers Grains Sales |
|
5,858,956 |
|
12.8 |
|
|
|
Corn Oil Sales |
|
728,936 |
|
1.6 |
|
|
|
Ethanol Derivative Activity Gains/ (Losses) |
|
(103,131 |
) |
(0.2 |
) |
|
|
Total Revenues |
|
$ |
45,662,561 |
|
100.0 |
% |
The following table shows the sources of our revenue for the six months ended April 30, 2009:
|
Revenue Sources |
|
Amount |
|
Percentage of |
|
|
|
|
|
|
|
|
|
|
|
Ethanol Sales |
|
$ |
34,238,833 |
|
81.0 |
% |
|
Distillers Grains Sales |
|
7,492,845 |
|
17.7 |
|
|
|
Corn Oil Sales |
|
461,678 |
|
1.0 |
|
|
|
Ethanol Derivative Activity Gains/ (Losses) |
|
119,249 |
|
0.3 |
|
|
|
Total Revenues |
|
$ |
43,312,605 |
|
100.0 |
% |
The following table shows additional data regarding production and price levels for our primary inputs and products for the six months ended April 30, 2010 and 2009:
|
Additional Data |
|
Six Months |
|
Six Months |
|
||
|
Ethanol sold (gallons) |
|
23,957,522 |
|
23,880,583 |
|
||
|
Dried distillers grains sold (tons) |
|
61,506 |
|
61,498 |
|
||
|
Modified distillers grains sold (tons) |
|
2,198 |
|
8,747 |
|
||
|
Corn oil sold (pounds) |
|
3,059,040 |
|
2,882,360 |
|
||
|
Ethanol average price per gallon (net of hedging activity) |
|
$ |
1.63 |
|
$ |
1.44 |
|
|
Dried distillers grains average price per ton |
|
$ |
93.51 |
|
$ |
112.68 |
|
|
Modified distillers grains average price per ton |
|
$ |
48.89 |
|
$ |
64.39 |
|
|
Corn oil average price per pound |
|
$ |
0.24 |
|
$ |
0.16 |
|
|
Corn costs per bushel (net of hedging activity) |
|
$ |
3.46 |
|
$ |
3.38 |
|
Revenues
In the six month period ended April 30, 2010, ethanol sales comprised approximately 85.8% of our revenues and
distillers grains sales comprised approximately 12.8% percent of our revenues, while corn oil sales comprised approximately 1.6% of our revenues. For the six month period ended April 30, 2009, ethanol sales comprised approximately 81.0% of our revenue, without accounting for ethanol hedging, and distillers grains sales comprised approximately 17.7% of our revenue, while corn oil sales comprised approximately 1.0% of our revenues.
Our revenues were higher for our first half of fiscal year 2010 compared to the same period of 2009 primarily as a result of higher ethanol prices. These higher ethanol prices, combined with lower distillers grains prices, caused ethanol sales to be larger percentage of our revenues.
The average ethanol sales price we received for the six month period ended April 30, 2010 was approximately 13.2% higher than our average ethanol sales price for the comparable 2009 period. Management attributes this increase in ethanol prices to strong ethanol price levels during our second fiscal quarter. Management anticipates the price of ethanol may increase during the second half of our 2010 fiscal year as a result of an increase in fuel demand as we move into the summer driving season which seems to be positively affecting the market prices of crude oil and gasoline.
The price we received for our dried distillers grains decreased by approximately 17% during the six month period ended April 30, 2010 compared to the same period of 2009. Management attributes this decrease in the price of our dried distillers grains to an excess supply of competitively priced livestock feeds, including distillers grains and soybean meal. We anticipate that the market price of distillers grains will continue to be volatile as a result of changes in the price of corn and competing animal feed substitutes such as soybean meal as well as volatility in distillers grains supplies related to changes in ethanol production.
Cost of Sales
Our costs of goods sold as a percentage of revenues were approximately 91% for the six month period ended April 30, 2010 compared to 102% for the same period of 2009. Our two largest costs of production are corn (69.6% of cost of goods sold for our six months ended April 30, 2010) and natural gas (10.0% of cost of goods sold for our six months ended April 30, 2010). Our cost of goods sold decreased by approximately $1,576,000 in the six months ended April 30, 2010, compared to the six months ended April 30, 2009, while our revenue for the same period increased by approximately $3,350,000. This decrease in the cost of goods sold is primarily a result of fairly steady corn prices combined with a decrease in our natural gas costs.
Operating Expense
Our operating expenses as a percentage of revenues were slightly lower for the six month period ended April 30, 2010 than they were for the same period ended April 30, 2009. These percentages were 2.1% and 2.5% for the six months ended April 30, 2010 and 2009, respectively. This decrease in operating expenses is primarily due to increased operating efficiencies and a concerted effort by our management and staff to lower our operating expenses. We expect that going forward our operating expenses will remain relatively steady.
Operating Income (Loss)
Our income from operations for the six months ended April 30, 2010 was approximately 6.8% of our revenues compared to a loss of approximately 4.5% of our revenues for the six months ended April 30, 2009. This increase in our profitability is primarily due to a decrease in the price of ethanol and the corresponding decline in our operating margins.
Other Income and Other Expense
Other income for the six months ended April 30, 2010, was approximately 0.3% of our revenue and totaled approximately $120,000. Other expense for the six months ended April 30, 2009 was approximately 1.6% of our revenue and totaled approximately $689,000. Our other expense for six months ended April 30, 2009 is high as a result of us paying $780,000 to Aventine Renewable Energy, Inc. as a termination fee we incurred in connection with our ethanol marketing agreement during our quarter ended January 31, 2009.
Interest Expense
Interest expense for the six months ended April 30, 2010, was approximately $8,600. Interest expense for the six months ended April 30, 2009 was approximately $63,600. This reduction in interest expense is due primarily to a reduction in our outstanding debt.
Changes in Financial Condition for the Six Months Ended April 30, 2010
The following table highlights the changes in our financial condition for the three months ended April 30, 2010 from our previous fiscal year ended October 31, 2009:
|
|
|
April 30, 2010 |
|
October 31, 2009 |
|
||
|
Current Assets |
|
$ |
14,955,121 |
|
$ |
14,015,271 |
|
|
Current Liabilities |
|
$ |
3,071,728 |
|
$ |
4,004,077 |
|
|
Long-Term Debt |
|
$ |
274,074 |
|
$ |
370,136 |
|
|
Members’ Equity |
|
$ |
50,725,993 |
|
$ |
52,098,970 |
|
Total assets were approximately $54,072,000 at April 30, 2010 compared to approximately $56,473,000 at October 31, 2009. This decrease in total assets is primarily a result of a cash distribution in the amount of approximately $4,600,000 paid out to members in December 2009.
Current assets totaled approximately $14,955,000 at April 30, 2010, a slight increase from approximately $14,015,000 at October 31, 2009. The change resulted primarily due to an increase in cash from the Company generating approximately $7,600,000 in cash from operating activities that was offset by a $4,600,000 dividend.
Total current liabilities decreased and totaled approximately $3,072,000 at April 30, 2010 and $4,004,000 at October 31, 2009. Long-term debt decreased slightly from approximately $370,000 at October 31, 2009 to approximately $274,000 at April 30, 2010 as we continue to pay down our EDA loans. In March 2010 we paid off our loan from the Western Minnesota Revolving Loan Fund in the amount of $67,000.
Plant Operations
Management anticipates our plant will continue to operate at our currently permitted capacity of 49.9 million gallons per year. In June 2009, we submitted an application package to the Minnesota Pollution Control Agency (“MPCA”) to allow the facility to operate at a production rate of 70 million gallons per year of undenatured ethanol. Our application to increase the plant’s permitted production capacity is currently pending with the MPCA. We expect to have sufficient cash generated by continuing operations, current lines of credit and cash reserves to cover our usual operating costs, which consist primarily of our corn supply, our natural gas supply, staffing expense, office expense, audit and legal compliance, working capital costs and debt service obligations.
Trends and Uncertainties Impacting the Ethanol and Distillers Grains Industries and Our Future Revenues
Our revenues primarily consist of sales of the ethanol and distillers grains we produce; however, we also realize revenue from the sale of corn oil we separate from our distillers syrup. Management anticipates stronger ethanol demand and higher ethanol prices as a result of slowly improving worldwide economic conditions. The ethanol industry needs to continue to expand the market for distillers grains in order to maintain current distillers grains prices. In addition, previous economic distress in the livestock industry has resulted in decreased livestock numbers and reduced demand for animal feed, including all types of distillers grains, which may contribute to a weaker distillers grain market during the second half of the 2010 fiscal year. The following charts show the general price information released by The Jacobsen Publishing Company for ethanol and distillers grains through April 2010.
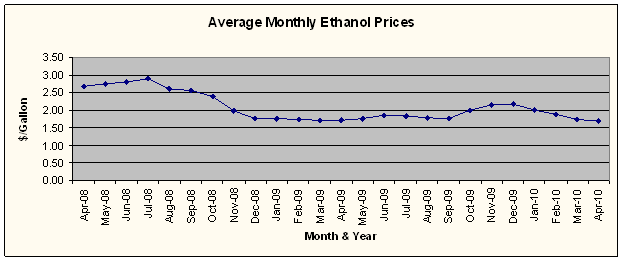
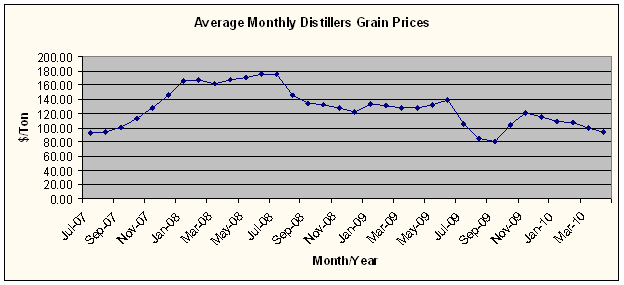
According to the Renewable Fuels Association (“RFA”), as of April 27, 2010, there were 201 ethanol plants nationwide with the capacity to produce approximately 13.5 billion gallons of ethanol annually. The RFA estimates that plants with an annual production capacity of approximately 12.8 billion gallons are currently operating and that approximately 5.1% of the nameplate production capacity is not currently operational. Management believes the production capacity of the ethanol industry is greater than ethanol demand which may continue to depress ethanol prices. This overcapacity issue may be exacerbated by increased production from plants that had previously slowed their rate of production or idled altogether due to poor operating margins.
Currently, ethanol is primarily blended with conventional gasoline for use in standard (non-flex fuel) vehicles to create a blend which is 10% ethanol and 90% conventional gasoline. Estimates indicate that approximately 135 billion gallons of gasoline are sold in the United States each year. However, gasoline demand may be shrinking in the United States as a result of the global economic slowdown. Assuming that all gasoline in the United States is blended at a rate of 10% ethanol and 90% gasoline, the maximum demand for ethanol is 13.5 billion gallons. This is commonly referred to as the “blending wall”, which represents a limit where more ethanol cannot be blended into the national gasoline pool. This is a theoretical limit since it is believed it would not be possible to blend ethanol into every gallon of gasoline that is used in the United States and it discounts higher percentage blends of ethanol such as E85 used in flex fuel vehicles. Many believe that the ethanol industry reached this blending wall in 2009. In addition, the Renewable Fuels Standard (“RFS”) requires the use of 36 billion gallons of renewable fuels being used each year by 2022. The
Energy Independence and Security Act of 2007 also requires the increased use of “advanced” biofuels, which are alternative biofuels produced without using corn starch such as cellulosic ethanol and biomass-based diesel, with a minimum of 21 billion gallons of the mandated 36 billion gallons of renewable fuel required to come from advanced biofuels by 2022, leaving a maximum of 15 billion gallons to come from corn based production facilities such as ours.
In order to meet the RFS and expand demand for ethanol, higher blends of ethanol must be utilized in conventional automobiles. Such higher blends of ethanol have recently become a contentious issue. Automobile manufacturers and environmental groups have fought against higher ethanol blends. Currently, state and federal regulations prohibit the use of higher ethanol blends in conventional automobiles and vehicle manufacturers have indicated that using higher blends of ethanol in conventional automobiles would void the manufacturer’s warranty. Without increases in the allowable percentage blends of ethanol, demand for ethanol may not continue to increase. An ethanol industry interest group has requested that the Administrator of the United Stated Environmental Protection Agency approve a waiver of the 10% limit on ethanol blending and increase the limit on the amount of ethanol in our nation’s gasoline supply to 15%. The EPA must grant or deny this waiver at some point in 2010. If the waiver is granted and current blend economics persist, we expect ethanol demand to increase. The ethanol industry must continue to expand demand for ethanol in order to support the market price of ethanol.
Trends and Uncertainties Impacting the Corn and Natural Gas Markets and Our Future Cost of Goods Sold
Our costs of our goods sold consist primarily of costs relating to the corn and natural gas supplies necessary to produce ethanol and distillers grains for sale. We grind approximately 1,450,000 bushels of corn each month. For the quarter ended April 30, 2010, our average cost of corn, net of hedging activity, was approximately $3.28 per bushel, which is approximately $0.20 lower than our cost of corn for the same period ended April 30, 2009.
Corn prices could increase during our 2010 fiscal year should we experience unfavorable weather conditions which affect expected corn yields for the fall of 2010. In addition, if demand for corn increases significantly as a result of improved global economic conditions or from increased ethanol production in the United States due to the implementation of a 15% ethanol blend, we could experience increased corn prices. Further, concern remains regarding the quality of the corn that was harvested in 2009. Poor quality corn contains less starch, which may reduce the amount of ethanol that can be produced per bushel of corn and could negatively impact distiller’s grains prices.
Natural gas is also an important input commodity to our manufacturing process. Our natural gas usage is approximately 115,000 million British thermal units (mmBTU) per month. We continue to work to find ways to limit our natural gas price risk through efficient usage practices, research of new technologies, and pricing and hedging strategies. We use a marketing firm and an energy consultant for our natural gas procurement and will work with them on an ongoing basis to mitigate our exposure to volatile gas prices.
Management anticipates that natural gas prices will be relatively stable in the next several months with the regular seasonal reductions in natural gas premium prices following the winter months. However, should we experience more robust economic recovery, it could increase demand for energy which could lead to increases in natural gas prices. Further, should we experience any natural gas supply disruptions, including disruptions from hurricane activity, we may experience significant increases in natural gas prices.
Compliance with Environmental Laws
We are subject to extensive air, water and other environmental regulations and we have been required to obtain a number of environmental permits to construct and operate the plant. As such, any changes that are made to the plant or its operations must be reviewed to determine if amended permits need to be obtained in order to implement these changes. We received amended permits in September 2008 to allow production to increase from 45 million gallons per year of undenatured ethanol to 49.9 million gallons.
The National Pollutant Discharge Elimination System/State Disposal System (NPDES/SDS) permit, which regulates the water treatment, water disposal and stormwater systems at the facility, requires renewal every five
years. We submitted a renewal application to the MPCA in October 2008. We are allowed to continue operations under our current permit requirements until the MPCA renews the water discharge permit.
In June 2009, we submitted an application package to the MPCA to allow the facility to operate at a production rate of 70 million gallons per year of undenatured ethanol. This application included the possibilities of exploring/expanding our alternatives with respect to the increase of production or optimization of operations. The renewal application for the NPDES/SDS permit was incorporated into this package for MPCA consideration.
The application submittal required numerous documents covering all aspects of the facility including: Environmental Assessment Worksheet (“EAW”), air modeling, Air Permit, NPDES/SDS permit, Aboveground Storage Tank (“AST”) permit, Construction Stormwater permit, and various other support documentation. Currently, we are working with the MPCA to answer questions and provide further information to the MPCA regarding this application. Our application to increase the plant’s permitted production capacity is currently pending with the MPCA.
The majority of the work being performed on the application involves the air modeling and water discharge from the facility. Air modeling is a process of determining the impact the facility has on the surrounding area, community and in the region itself. The area of concern is the particles smaller than 2.5 microns (clay dust), called fugitive emissions. We are evaluating operational considerations for decreasing the effect of fugitive emissions.
The other area of discussion is the NPDES/SDS permit. The MPCA and EPA have regulations regarding the quantity and quality of the water being discharged from the site into area water sources. These regulations are designed to protect and improve the waters of the state. We continue to evaluate options to modify operations to meet these regulations. The water discharge issue is a challenging task that will require a long term plan to meet these current regulations.
Contracting Activity
Farmers Cooperative Elevator Company supplies our corn. Eco-Energy, LLC markets our ethanol, and CHS, Inc. markets our distillers grains. Each of these contracts is critical to our success and we are very dependent on each of these companies. Accordingly, the financial stability of these partners is critical to the successful operation of our business.
For the quarter ended April 30, 2010 we independently marketed our corn oil as a biodiesel feedstock and as a supplement for animal feed. Corn oil sales accounted for approximately 1.6% of our revenues during our quarter ended April 30, 2010. On April 29, 2010, we executed a Corn Oil Marketing Agreement with Renewable Products Marketing Group, Inc. (RPMG). Pursuant to the agreement, RPMG will market all of the corn oil we expect to produce. The initial term of the agreement is for one year. The agreement automatically renews for additional one year terms unless either party gives 180 days notice that the agreement will not be renewed. We have the option to cancel the agreement within 90 days of the effective date. We agreed to pay RPMG a commission based on each pound of our corn oil that is sold by RPMG.
In June 2010 we signed an amendment to our Distillers Grain Marketing Agreement with CHS. Prior to signing the amendment, we independently marketed a portion of our distillers grains to local markets. On June 1, 2010 CHS began marketing all our distillers grains except for certain distillers grains that are sold through Montevideo Intermodal. We expect that under the new agreement CHS will be marketing approximately 95% of our distillers grains on a regular basis, and the balance will be sold though Montevideo Intermodal.
We independently market a small portion of our ethanol production as E-85 to local retailers and all of the corn oil we produce is presently sold on the spot market.
Commodity Price Risk Protection
We seek to minimize the risks from fluctuations in the prices of corn, ethanol and natural gas through the use of derivative instruments. In practice, as markets move, we actively manage our risk and adjust hedging strategies as
appropriate. We do not use hedge accounting which would match the gain or loss on our hedge positions to the specific commodity contracts being hedged. Instead, we are using fair value accounting for our hedge positions, which means that as the current market price of our hedge positions changes, the gains and losses are immediately recognized in our cost of goods sold. The immediate recognition of hedging gains and losses under fair value accounting can cause net income to be volatile from quarter to quarter due to the timing of the change in value of the derivative instruments relative to the cost and use of the commodity being hedged.
As of April 30, 2010, the fair values of our derivative instruments are reflected as net assets in the amount of $55,586. As of October 31, 2009, we recorded a net asset for our derivative instruments in the amount of $361,436. There are several variables that could affect the extent to which our derivative instruments are impacted by fluctuations in the price of corn, ethanol, denaturant or natural gas. However, it is likely that commodity cash prices will have the greatest impact on the derivative instruments with delivery dates nearest the current cash price. As we move forward, additional protection may be necessary. As the prices of these hedged commodities move in reaction to market trends and information, our statement of operations will be affected depending on the impact such market movements have on the value of our derivative instruments. Depending on market movements, crop prospects and weather, these price protection positions may cause immediate adverse effects, but are expected to produce long-term positive growth for Granite Falls.
As of April 30, 2010, we had entered into derivative instruments to hedge 90,000 bushels of our future corn purchases through July 2010 for the purpose of minimizing risk from future market price fluctuations. We have used various option contracts as vehicles for these hedges.
As of April 30, 2010, we had price protection in place for approximately 44% of our natural gas needs through September 2010. As we move forward, we may determine that additional price protection for natural gas purchases is necessary to reduce our susceptibility to price increases. However, we may not be able to secure natural gas for prices less than current market price and we may not recover high costs of production resulting from high natural gas prices, which may raise our costs of production and reduce our net income.
The derivative accounts are reported at fair value as designated by our broker. We have categorized the cash flows related to the hedging activities in the same category as the item being hedged. We expect substantially all of our hedge positions outstanding as of April 30, 2010 to be realized and recognized by July 2010.
Critical Accounting Estimates
Management uses estimates and assumptions in preparing our financial statements in accordance with generally accepted accounting principles. These estimates and assumptions affect the reported amounts of assets and liabilities, the disclosure of contingent assets and liabilities, and the reported revenues and expenses.
Liquidity and Capital Resources
The following table shows cash flows for the six months ended April 30, 2010 and 2009:
|
|
|
2010 |
|
2009 |
|
||
|
Net cash provided by operating activities |
|
$ |
7,623,406 |
|
$ |
1,092,747 |
|
|
Net cash used in investing activities |
|
$ |
(95,130 |
) |
$ |
(182,422 |
) |
|
Net cash used in financing activities |
|
$ |
(4,702,829 |
) |
$ |
(507,239 |
) |
|
Net increase (decrease) in cash |
|
$ |
2,825,447 |
|
$ |
403,086 |
|
Operating Cash Flows. Cash provided by operating activities was approximately $7,623,000 for the six months ended April 30, 2010, which was an increase from approximately $1,093,000 provided by operating activities for the six months ended April 30, 2009. Contributing to this increase in cash provided by our operating activities is our increased profitability during our six months ended April 30, 2010. Currently, our capital needs are being adequately met through cash flows from our operating activities and our currently available credit facilities.
Investing Cash Flows. Cash used in investing activities was approximately $95,000 for the six months ended April 30, 2010, compared to $182,400 for the six months ended April 30, 2009.
Financing Cash Flows. Cash used in financing activities was approximately $4,703,000 for the six months ended April 30, 2010, compared to $507,000 for six months ended April 30, 2009. In the six month period ended April 30, 2010, cash was used to pay a distribution to our members totaling approximately $4,600,000 and to decrease the principal balance on the Company’s EDA loans.
Indebtedness
Short-Term Debt Sources
The Company has a Loan Agreement with Minnwest Bank M.V. of Marshall, MN (the “Bank”). Under the Loan Agreement, the Company has a revolving line of credit with a maximum of $6,000,000 available which is secured by substantially all of our assets. The Company has outstanding letters of credit in the amount of approximately $415,000. These letters of credit reduce the amount available under the revolving line of credit to approximately $5,585,000. The interest rate on the revolving line of credit is at 0.25 percentage points above the prime rate as reported by the Wall Street Journal, with a minimum rate of 5.0%. At April 30, 2010, the Company had no outstanding balance on this line of credit
Long-Term Debt Sources
We have paid off our term loans with FNBO and received a release of FNBO’s security interest in all of our tangible and intangible property, real and personal, which had served as collateral for our term loans.
Below is a summary of our remaining long term loans payable:
Note payable to City of Granite Falls/Minnesota Investment Fund, bearing interest of 1.0% due in quarterly installments of $15,807, payable in full on June 15, 2014, secured by a second mortgage on all assets. The outstanding balance at April 30, 2010 was $262,769.
Our note payable to City of Granite Falls/Western Minnesota Revolving Loan Fund, bearing interest of 5.0%, was paid in full as of March 2010.
Note payable to City of Granite Falls/Chippewa County, bearing interest of 3.0% due in semi-annual installments of $4,030, payable in full on June 15, 2021, secured by a second mortgage on all assets. The outstanding balance at April 30, 2010 was $77,899.
Off-Balance Sheet Arrangements
We do not have any off-balance sheet arrangements.
Item 3. Quantitative and Qualitative Disclosures About Market Risk.
We are exposed to the impact of market fluctuations associated with interest rates and commodity prices as discussed below. We have no exposure to foreign currency risk as all of our business is conducted in U.S. Dollars. We use derivative financial instruments as part of an overall strategy to manage market risk. We use cash, futures and option contracts to hedge changes to the commodity prices of corn, ethanol and natural gas. We do not enter into these derivative financial instruments for trading or speculative purposes, nor do we designate these contracts as hedges for accounting purposes pursuant to the requirements of Generally Accepted Accounting Principles (“GAAP”).
Interest Rate Risk
We are generally exposed to market risk from changes in interest rates. Exposure to interest rate risk results primarily from our revolving line of credit and letters of credit with Minnwest Bank. As of April 30, 2010, we did not have an outstanding balance on this revolving line of credit. The specifics of these credit facilities are discussed in
greater detail in “Item 2 — Management’s Discussion and Analysis of Financial Condition and Results of Operations — Short-Term Debt Sources.”
Commodity Price Risk
We seek to minimize the risks from fluctuations in the prices of raw material inputs, such as corn and natural gas, and finished products, such as ethanol and distillers grains, through the use of hedging instruments. In practice, as markets move, we actively manage our risk and adjust hedging strategies as appropriate. Although we believe our hedge positions accomplish an economic hedge against our future purchases and sales, management has chosen not to use hedge accounting, which would match the gain or loss on our hedge positions to the specific commodity purchase being hedged. We are using fair value accounting for our hedge positions, which means as the current market price of our hedge positions changes, the realized or unrealized gains and losses are immediately recognized in our cost of goods sold or as an offset to revenues. The immediate recognition of hedging gains and losses under fair value accounting can cause net income to be volatile from quarter to quarter due to the timing of the change in value of the derivative instruments relative to the cost and use of the commodity being hedged.
As corn prices move in reaction to market trends and information, our income statement will be affected depending on the impact such market movements have on the value of our derivative instruments. Depending on market movements, crop prospects and weather, these price protection positions may cause immediate adverse effects, but are expected to produce long-term positive growth for us.
A sensitivity analysis has been prepared to estimate our exposure to ethanol, corn and natural gas price risk. Market risk related to these factors is estimated as the potential change in income resulting from a hypothetical 10% adverse change in the fair value of our corn and natural gas prices and average ethanol price as of April 30, 2010, net of the forward and future contracts used to hedge our market risk for corn and natural gas usage requirements. The volumes are based on our expected use and sale of these commodities for a one year period from April 30, 2010. The results of this analysis, which may differ from actual results, are as follows:
|
|
|
Estimated Volume |
|
Unit of Measure |
|
Hypothetical |
|
Approximate |
|
|
|
Natural Gas |
|
1,130,000 |
|
MMBTU |
|
10 |
% |
$ |
540,000 |
|
|
Ethanol |
|
51,000,000 |
|
Gallons |
|
10 |
% |
$ |
8,160,000 |
|
|
Corn |
|
17,857,000 |
|
Bushels |
|
10 |
% |
$ |
6,608,000 |
|
Captive Insurance Program
We participate in a captive reinsurance company (“Captive”). The Captive reinsures losses related to workman’s compensation, commercial property and general liability. Premiums are accrued by a charge to income for the period to which the premium relates and is remitted by our insurer to the captive reinsurer. The Captive reinsures losses in excess of a predetermined amount. The Captive insurer has estimated and collected a premium amount in excess of expected losses but less than the aggregate loss limits reinsured by the Captive. We have contributed limited capital surplus to the Captive that is available to fund losses should the actual losses sustained exceed premium funding. So long as the Captive is fully-funded through premiums and capital contributions to the aggregate loss limits reinsured, and the fronting insurers are financially strong, we can not be assessed over the amount of our current contributions.
Item 4T. Controls and Procedures.
We maintain disclosure controls and procedures that are designed to ensure that information required to be disclosed in the reports that we file or submit pursuant to the Securities Exchange Act of 1934 (the “Exchange Act”) is recorded, processed, summarized and reported within the time periods specified in the Securities and Exchange Commission’s rules and forms, and that such information is accumulated and communicated to our management, including our Chief Executive Officer and Chief Financial Officer, as appropriate, to allow for timely decisions regarding required disclosures.
Our management, including our Chief Executive Officer and General Manager (the principal executive officer), Tracey Olson, along with our Chief Financial Officer (the principal financial officer), Stacie Schuler, have reviewed and evaluated the effectiveness of our disclosure controls and procedures as of April 30, 2010. Based upon this review and evaluation, these officers have concluded that our disclosure controls and procedures are effective to ensure that information required to be disclosed in the reports that we file or submit under the Exchange Act is recorded, processed, summarized and reported within the time periods required by the forms and rules of the Securities and Exchange Commission; and to ensure that the information required to be disclosed by an issuer in the reports that it files or submits under the Exchange Act is accumulated and communicated to our management including our principal executive and principal financial officers, or persons performing similar functions, as appropriate to allow timely decisions regarding required disclosure.
Changes in Internal Control over Financial Reporting
Our management, including our principal executive officer and principal financial officer, have reviewed and evaluated any changes in our internal control over financial reporting that occurred during the quarter ended April 30, 2010 and there has been no change that has materially affected or is reasonably likely to materially affect our internal control over financial reporting.
None.
The following risk factors are provided due to material changes from the risk factors previously disclosed in our annual report on Form 10-K. The risk factors set forth below should be read in conjunction with the risk factors section and the Management’s Discussion and Analysis section for the fiscal year ended October 31, 2009, included in our annual report on Form 10-K.
The California Low Carbon Fuel Standard may decrease demand for corn based ethanol which could negatively impact our profitability. Recently, California passed a Low Carbon Fuels Standard (LCFS). The California LCFS requires that renewable fuels used in California must accomplish certain reductions in greenhouse gases which are measured using a lifecycle analysis. Management believes that these new regulations could preclude corn based ethanol produced in the Midwest from being used in California. California represents a significant ethanol demand market. If we are unable to supply ethanol to California, it could significantly reduce demand for the ethanol we produce. Any decrease in ethanol demand could negatively impact ethanol prices which could reduce our revenues and negatively impact our ability to profitably operate the ethanol plant.
If the Federal Volumetric Ethanol Excise Tax Credit (“VEETC”) expires on December 31, 2010, it could negatively impact our profitability. The ethanol industry is benefited by VEETC which is a federal excise tax credit of 4.5 cents per gallon of ethanol blended with gasoline at a rate of at least 10%. This excise tax credit is set to expire on December 31, 2010. We believe that VEETC positively impacts the price of ethanol. On December 31, 2009, the portion of VEETC that benefits the biodiesel industry was allowed to expire. This resulted in the biodiesel industry ceasing to produce biodiesel because the price of biodiesel without the tax credit was uncompetitive with the cost of petroleum based diesel. If the portion of VEETC that benefits ethanol is allowed to expire, it could negatively impact the price we receive for our ethanol and could negatively impact our profitability.
If the Small Ethanol Producer Tax Credit (“SEPTC”) expires on December 31, 2010, it could negatively impact our profitability. The Small Ethanol Producer Tax Credit (“SEPTC”) is a tax incentive allowing small ethanol producers a 10 cent per gallon federal income tax credit on up to 15 million gallons of production. Our investor directly benefit from the SEPTC. If the SEPTC is allowed to expire on December 31, 2010, along with the VEETC, it would negatively impact our investors.
If the secondary tariff on imported ethanol is allowed to expire in January 2011, we could see an increase in ethanol produced in foreign countries being marked in the Untied States which could negatively impact our profitability. The secondary tariff on imported ethanol is a 54 cent per gallon tariff on ethanol imports from certain foreign countries. The secondary tariff on imported ethanol is scheduled to expire in January 2011. If this tariff is allowed to expire, an influx of imported ethanol on the domestic ethanol market could have a significant negative impact on ethanol prices and our profitability.
Item 2. Unregistered Sales of Equity Securities and Use of Proceeds.
None.
Item 3. Defaults Upon Senior Securities.
None.
Item 4. [Removed and Reserved]
None.
The following exhibits are included herein:
|
Exhibit No. |
|
Description |
|
10.1 |
|
Corn Oil Marketing Agreement between the registrant and Renewable Products Marketing Group, LLC dated April 29, 2010. + |
|
|
|
|
|
10.2 |
|
Amendment to Distiller’s Grain Marketing Agreement between the registrant and CHS, Inc. dated June 7, 2010. |
|
|
|
|
|
31.1 |
|
Certificate Pursuant to 17 CFR 240.15d-14(a). |
|
|
|
|
|
31.2 |
|
Certificate Pursuant to 17 CFR 240.15d-14(a). |
|
|
|
|
|
32.1 |
|
Certificate Pursuant to 18 U.S.C. § 1350. |
|
|
|
|
|
32.2 |
|
Certificate Pursuant to 18 U.S.C. § 1350. |
(+) Confidential Treatment Requested.
In accordance with the requirements of the Exchange Act of 1934, the registrant has duly caused this report to be signed on its behalf by the undersigned thereunto duly authorized.
|
|
|
GRANITE FALLS ENERGY, LLC |
|
|
|
|
|
June 14, 2010 |
|
/s/ Tracey L. Olson |
|
|
|
Tracey L. Olson |
|
|
|
Chief Executive Officer |
|
|
|
|
|
June 14, 2010 |
|
/s/ Stacie Schuler |
|
|
|
Stacie Schuler |
|
|
|
Chief Financial Officer |