Attached files
| file | filename |
|---|---|
| EX-32.2 - EX-32.2 - Granite Falls Energy, LLC | c749-20161031ex322652dee.htm |
| EX-32.1 - EX-32.1 - Granite Falls Energy, LLC | c749-20161031ex321a2667f.htm |
| EX-31.2 - EX-31.2 - Granite Falls Energy, LLC | c749-20161031ex31263b6a9.htm |
| EX-31.1 - EX-31.1 - Granite Falls Energy, LLC | c749-20161031ex3115e8e32.htm |
UNITED STATES
SECURITIES AND EXCHANGE COMMISSION
Washington, D.C. 20549
FORM 10-K
☒Annual report pursuant to Section 13 or 15(d) of the Securities Exchange Act of 1934.
For the fiscal year ended October 31, 2016
OR
☐Transition report pursuant to Section 13 or 15(d) of the Securities Exchange Act of 1934.
For the transition period from to .
COMMISSION FILE NUMBER 000-51277
GRANITE FALLS ENERGY, LLC
(Exact name of registrant as specified in its charter)
|
Minnesota |
|
41-1997390 |
|
(State or other jurisdiction of |
|
(I.R.S. Employer Identification No.) |
|
incorporation or organization) |
|
|
15045 Highway 23 SE, Granite Falls, MN 56241-0216
(Address of principal executive offices)
(320) 564-3100
(Registrant’s telephone number, including area code)
Securities registered pursuant to Section 12(b) of the Act: None
Securities registered pursuant to Section 12(g) of the Act: Membership Units
Indicate by check mark if the registrant is a well-known seasoned issuer, as defined in Rule 405 of the Securities Act.
☐ Yes ☒ No
Indicated by check mark if the registrant is not required to file reports pursuant to Section 13 or Section 15(d) of the Act.
☐ Yes ☒ No
Indicate by check mark whether the registrant (1) has filed all reports required to be filed by Section 13 or 15(d) of the Securities Exchange Act of 1934 during the preceding 12 months (or for such shorter period that the registrant was required to file such reports), and (2) has been subject to such filing requirements for the past 90 days.
☒ Yes ☐ No
Indicate by check mark whether the registrant has submitted electronically and posted on its corporate Web site, if any, every Interactive Data File required to be submitted and posted pursuant to Rule 405 of Regulation S-T (§232.405 of this chapter) during the preceding 12 months (or for such shorter period that the registrant was required to submit and post such files).
☒ Yes ☐ No
Indicate by check mark if disclosure of delinquent filers pursuant to Item 405 of Regulation S-K (§229.405 of this chapter) is not contained herein, and will not be contained, to the best of registrant’s knowledge, in definitive proxy information statements incorporated by reference in Part III of this Form 10-K or any amendment to this Form 10-K. ☒
Indicate by check mark whether the registrant is a large accelerated filer, an accelerated filer, a non-accelerated filer, or a smaller reporting company. See the definitions of “large accelerated filer,” “accelerated filer” and “smaller reporting company” in Rule 12b-2 of the Exchange Act:
|
Large Accelerated Filer ☐ |
Accelerated Filer ☐ |
|
Non-Accelerated Filer ☒ |
Smaller Reporting Company ☐ |
Indicate by check mark whether the registrant is a shell company (as defined in Rule 12b-2 of the Exchange Act).
☐ Yes ☒ No
The aggregate market value of the 20,094 membership units held by non-affiliates of the registrant (computed by reference to the most recent offering price of membership units) was $20,094,000 as of April 30, 2016. The membership units are not listed on an exchange or otherwise publicly traded. Additionally, the membership units are subject to significant restrictions on transfer under the registrant’s operating and member control agreement. The value of the membership units for this purpose has been based solely upon the initial offering price of the membership units. In determining this value, the registrant has assumed that all of its governors, chief executive officer, chief financial officer and beneficial owners of 5% or more of its outstanding membership units are affiliates, but this assumption shall not apply to or be conclusive for any other purpose.
As of January 30, 2017, there were 30,606 membership units outstanding.
DOCUMENTS INCORPORATED BY REFERENCE
The registrant has incorporated by reference into Part III of this Annual Report on Form 10-K portions of its definitive proxy statement to be filed with the Securities and Exchange Commission within 120 days after the close of the fiscal year covered by this Annual Report (October 31, 2016). This proxy statement is referred to in this report as the 2017 Proxy Statement.
INDEX
2
CAUTION REGARDING FORWARD LOOKING STATEMENTS
This annual report contains historical information, as well as forward-looking statements regarding our business, financial condition, results of operations, performance and prospects. All statements that are not historical or current facts are forward-looking statements and are made pursuant to the safe harbor provisions of the Private Securities Litigation Reform Act of 1995. Forward-looking statements involve known and unknown risks and relate to future events, our future financial performance, or our expected future operations and actions. In some cases, you can identify forward-looking statements by terminology such as “may,” “will,” “should,” “expect,” “plan,” “anticipate,” “believe,” “estimate,” “future,” “intend,” “could,” “hope,” “predict,” “target,” “potential,” or “continue” or the negative of these terms or other similar expressions. These forward-looking statements are only our predictions based on current information and involve numerous assumptions, risks and uncertainties, including, but not limited to the following:
|
· |
Fluctuations in the prices of grain, utilities and ethanol, which are affected by various factors including weather, production levels, supply, demand, and availability of production inputs; |
|
· |
Changes in the availability and price of corn and natural gas; |
|
· |
Changes in general economic conditions or the occurrence of certain events causing an economic impact in the agriculture, oil or automobile industries; |
|
· |
Fluctuations in the price of crude oil and gasoline; |
|
· |
Ethanol may trade at a premium to gasoline at times, causing a disincentive for discretionary blending of ethanol beyond the requirements of the federal Renewable Fuel Standard (“RFS”) and resulting in a negative impact on ethanol prices and demand; |
|
· |
Changes in federal and/or state laws and environmental regulations including elimination, waiver or reduction of the Renewable Fuels Standard, may have an adverse effect on our business; |
|
· |
Any impairment of the transportation, storage and blending infrastructure that prevents ethanol from reaching markets; |
|
· |
Any effect on prices of distillers’ grains resulting from actions in international markets, particularly anti-dumping and countervailing duties investigations by the Chinese government into U.S. distillers’ grains exported to China; |
|
· |
Changes in our business strategy, capital improvements or development plans; |
|
· |
The effect of our risk mitigation strategies and hedging activities on our financial performance and cash flows; |
|
· |
Alternative fuel additives may be developed that are superior to, or cheaper than ethanol; |
|
· |
Changes or advances in plant production capacity or technical difficulties in operating our plants; |
|
· |
Our ability to profitably operate our ethanol plants and maintain positive margins and generate free cash flow, which may impact our ability to meet current obligations, invest in our business, service our debt and satisfy the financial covenants contained in our credit agreement with our lender; |
|
· |
Changes in interest rates or the lack of credit availability; |
|
· |
Our ability to make distributions in light of financial covenants in our credit facility; |
|
· |
Our ability to retain key employees and maintain labor relations; |
|
· |
The supply of ethanol rail cars in the market has fluctuated in recent years and may affect our ability to obtain new tanker cars or negotiate new leases at a reasonable fee when our current leases expire; |
|
· |
Any delays in shipping our products by rail and corresponding decreases in our sales or production as a result of shipping delay and ethanol storage constraints; |
|
· |
Our units are subject to a number of transfer restrictions, no public market exists for our units, and we do not expect one to develop. |
Our actual results or actions may differ materially from these forward-looking statements for many reasons, including the reasons described in Part I, Item 1A. “Risk Factors” of this Form 10-K. We undertake no duty to update these forward-looking statements, even though our situation may change in the future. We cannot guarantee future results, levels of activity, performance or achievements. We caution you not to put undue reliance on any forward-looking statements, which speak only as of the date of this report. You should read this report and the documents that we reference in this report and have filed as exhibits, completely and with the understanding that our actual future results may be materially different from what we currently expect. We qualify all of our forward-looking statements with these cautionary statements. Unless otherwise stated, references in this report to particular years or quarters refer to our fiscal years ended October 31 and the associated quarters of those fiscal years.
3
INDUSTRY AND MARKET DATA
Much of the information in this report regarding the ethanol industry, including government regulation relevant to the industry, the market for our products and competition is from information published by the Renewable Fuels Association (“RFA”), a national trade association for the U.S. ethanol industry, as well as other publicly available information from governmental agencies or publications. Although we believe these sources are reliable, we have not independently verified the information.
AVAILABLE INFORMATION
Our principal executive offices are located at 15045 Highway 23 SE, Granite Falls, Minnesota 56241, and our telephone number is 320-564-3100. We make available free of charge on or through our Internet website, www.granitefallsenergy.com, all of our reports and all amendments to those reports as soon as reasonably practicable after such material is electronically filed with, or furnished to, the Securities and Exchange Commission (SEC). The Securities and Exchange Commission also maintains an Internet site (http://www.sec.gov) through which the public can access our reports. We will provide electronic or paper copies of these documents free of charge upon request.
When we use the terms “Granite Falls Energy” or “GFE” or similar words in this Annual Report on Form 10-K, unless the context otherwise requires, we are referring to Granite Falls Energy, LLC and our operations at our ethanol production facility located in Granite Falls, Minnesota. When we use the terms “Heron Lake BioEnergy”, “Heron Lake”, or “HLBE” or similar words, unless the context otherwise requires, we are referring to Heron Lake BioEnergy, LLC and its wholly owned subsidiary, HLBE Pipeline Company, LLC, through which HLBE holds a controlling interest in Agrinatural Gas, LLC. When we use the terms the “Company”, “we”, “us”, “our” or similar words in this Annual Report on Form 10-K, unless the context otherwise requires, we are referring to Granite Falls Energy, LLC and our consolidated wholly- and majority owned subsidiaries.
Overview
Granite Falls Energy, LLC is a Minnesota limited liability company formed on December 29, 2000 for the purpose of constructing, owning and operating a fuel-grade ethanol plant located in Granite Falls, Minnesota.
In July 2013, we acquired a controlling interest in Heron Lake BioEnergy, LLC (“Heron Lake BioEnergy” or “HLBE”), which owns an ethanol plant located near Heron Lake, Minnesota. As of October 31, 2016, we control approximately 50.6% of HLBE’s outstanding membership units through our wholly owned subsidiary, Project Viking, L.L.C. As a result of our majority ownership, we have the right to appoint five (5) of the nine (9) governors to HLBE’s board of governors under its member control agreement.
Subsequent to our fiscal year end, we subscribed to purchase 1,500 capital units of Ring-neck Energy & Feed, LLC (“Ring-neck”) at a price of $5,000 per unit for a total of $7,500,000. If Ring-neck accepts our subscription, our investment is sufficient to secure the Company the right to appoint one director to the board of directors of Ring-neck. Details regarding our subscription for investment in Ring-neck are provided below in the section below titled “Investments.”
Our business consists primarily of the production and sale of ethanol and its co-products (wet, modified wet and dried distillers’ grains, corn oil and corn syrup) locally, and throughout the continental U.S. However, as markets allow, our products can be, and have been, sold in the export markets. Our revenues from operations come from three primary sources: sales of fuel ethanol, sales of distillers’ grains and sales of corn oil at GFE’s ethanol plant and HLBE’s ethanol plant.
4
Our Facilities
Our business consists primarily of producing ethanol and its related co-products, including wet, modified and dried distillers’ grains, as well as corn oil. Our ethanol production operations are carried out at our ethanol plant located in Granite Falls, Minnesota and at the ethanol plant operated by HLBE located near Heron Lake, Minnesota.
The GFE plant has an annual production capacity of approximately 62 million gallons of denatured ethanol, but is currently permitted to produce up to 70 million gallons of undenatured ethanol on a twelve month rolling sum basis. The HLBE plant has an approximate annual production capacity of approximately 64 million gallons of denatured ethanol, but is currently permitted to produce up to approximately 72.3 million gallons of undenatured fuel-grade ethanol on a twelve-month rolling sum basis. We intend to continue working toward increasing production at both the GFE and HLBE plants to take advantage of the additional production allowed pursuant to our permits as long as we believe it is profitable to do so.
At the GFE plant, we constructed an additional grain bin, which expands the GFE plant’s grain storage by approximately 750,000 bushels. The grain storage expansion project commenced in August 2015 and was completed during the third fiscal quarter of 2016.
At the HLBE plant, HLBE replaced its existing regenerative thermal oxidizer (“RTO”). HLBE completed installation of a new regenerative thermal oxidizer (“RTO”) and emissions testing during the third fiscal quarter of 2016. With installation complete, management expects the new RTO will improve emissions control and allow HLBE to continue to maintain regulatory compliance under our its air permit. In connection with HLBE’s RTO replacement project, HLBE has filed an application for a major amendment of its air emissions permit with the Minnesota Pollution Control Agency (“MPCA”) to allow for the replacement under its current permit. For additional information regarding HLBE’s major amendment to its air permit, see the section below titled “Compliance with Environmental Laws and Other Regulatory Matters.”
GFE’s corn storage expansion project and HLBE’s RTO replacement project were funded from current earnings from operations. In addition, we anticipate continuing to conduct routine maintenance and repair activities at the GFE and HLBE ethanol plants. We anticipate using cash we generate from our operations and, as needed, our credit facilities to finance these plant upgrade projects.
HLBE also owns a controlling 73% interest in Agrinatural Gas, LLC (“Agrinatural”), through its wholly owned subsidiary, HLBE Pipeline Company, LLC. The remaining 27% non-controlling interest is owned by Rural Energy Solutions, LLC (“RES”). Agrinatural is a natural gas pipeline company that was formed to construct, own, and operate the natural gas pipeline that provides natural gas to HLBE’s ethanol production facility and other customers through a connection with the natural gas pipeline facilities of Northern Border Pipeline Company in Cottonwood County, Minnesota. Agrinatural owns approximately 187 miles of natural gas pipeline and provides natural gas to HLBE’s ethanol plant and other commercial, agricultural and residential customers through a connection with the natural gas pipeline facilities of Northern Border Pipeline Company. Agrinatural’s revenues are generated through natural gas distribution fees and sales.
Operating Segments
Accounting Standards Codification (“ASC”) 280, “Segment Reporting,” establishes the standards for reporting information about segments in financial statements. Operating segments are defined as components of an enterprise for which separate financial information is available that is evaluated regularly by the chief operating decision maker in deciding how to allocate resources and in assessing performance. Therefore, in applying the criteria set forth in ASC 280, the Company determined that based on the nature of the products and production process and the expected financial results, the Company’s operations at GFE’s ethanol plant and HLBE’s plant, including the production and sale of ethanol and its co-products, are aggregated into one reporting segment.
5
Additionally, we also realize relatively immaterial revenue from natural gas pipeline operations at Agrinatural, HLBE’s majority owned subsidiary. Before and after accounting for intercompany eliminations, these revenues from Agrinatural’s represent less than less than 1% of our consolidated revenues and have little to no impact on the overall performance of the Company. Therefore, our management does not separately review Agrinatural’s revenues, cost of sales or other operating performance information. Rather, management reviews Agrinatural’s natural gas pipeline financial data on a consolidated basis with our ethanol production operating segment. Additionally, management believes that the presentation of separate operating performance information for Agrinatural’s natural gas pipeline operations would not provide meaningful information to a reader of the Company’s financial statements and would not achieve the basic principles and objectives of ASC 280.
We currently do not have or anticipate we will have any other lines of business or other significant sources of revenue other than the sale of ethanol and its co-products, which include distillers’ grains and non-edible corn oil.
Financial Information
Please refer to “ITEM 7 - MANAGEMENT’S DISCU.S.SION AND ANALYSIS OF FINANCIAL CONDITION AND RESULTS OF OPERATIONS” for information about our revenue, profit and loss measurements, and total assets and liabilities and “ITEM 8 - FINANCIAL STATEMENTS AND SUPPLEMENTARY DATA” for our consolidated financial statements and supplementary data.
Principal Products
The principal products from ethanol production at GFE’s plant and HLBE’s plant, and from which we derive nearly all our revenue, are fuel-grade ethanol, distillers’ grains, and non-edible corn oil. In addition, HLBE’s plant also has miscellaneous other revenue generated by sales of corn syrup, a by-product of the ethanol production process, and revenues from Agrinatural’s natural gas pipeline operations. We did not introduce any new products or services as part of our ethanol production segment during our fiscal year ended October 31, 2016.
The table below shows the approximate percentage of our total revenue which is attributable to each of our principal products for each of the last three fiscal years.
|
|
|
Fiscal Year 2016 |
|
Fiscal Year 2015 |
|
Fiscal Year 2014 |
|||
|
Ethanol |
|
79.3 |
% |
|
78.0 |
% |
|
80.1 |
% |
|
Distillers' Grains |
|
15.8 |
% |
|
18.7 |
% |
|
17.1 |
% |
|
Corn Oil |
|
4.1 |
% |
|
2.7 |
% |
|
2.3 |
% |
|
Misc. Other Revenue* |
|
0.8 |
% |
|
0.6 |
% |
|
0.5 |
% |
*Includes incidental sales of corn syrup at HLBE’s plant and revenues from natural gas pipeline operations at Agrinatural, net of intercompany eliminations for distribution fees paid by HLBE to Agrinatural for natural gas transportation services.
Ethanol
Ethanol is a type of alcohol produced in the U.S. principally from corn. Ethanol is ethyl alcohol, a fuel component made primarily from corn in the U.S. but can also be produced from various other grains. Ethanol is primarily used as:
|
· |
an octane enhancer in fuels; |
|
· |
an oxygenated fuel additive that can reduce ozone and carbon monoxide vehicle emissions; |
|
· |
a non-petroleum-based gasoline substitute; and |
|
· |
as a renewable fuel to displace consumption of imported oil. |
Ethanol produced in the U.S. is primarily used for blending with unleaded gasoline and other fuel products as an octane enhancer or fuel additive. Ethanol is most commonly sold as E10 (10% ethanol and 90% gasoline), which is the blend of ethanol approved by the U.S. Environmental Protection Agency (“EPA”) for use in all American automobiles. Increasingly, ethanol is also available as E85, a higher percentage ethanol blend (85% ethanol and 15% gasoline) approved by the EPA for use in flexible fuel vehicles.
6
Distillers’ Grains
The principal co-product of the ethanol production process is distillers’ grains, a high protein and high-energy animal feed ingredient primarily marketed to the dairy and beef industries. Dry mill ethanol processing creates three primary forms of distillers’ grains: wet distillers’ grains, modified wet distillers’ grains, and dried distillers’ grains with solubles. Most of the distillers’ grains that we sell are in the form of dried distillers’ grains and modified/wet distillers’ grains. Modified/wet distillers’ grains are processed corn mash that has been dried to approximately 50% moisture and has a shelf life of approximately 7 days. Modified/wet distillers’ grains are often sold to nearby markets. Dried distillers’ grains with solubles are corn mash that has been dried to approximately 10% to 12% moisture. It has an almost indefinite shelf life and may be sold and shipped to any market and fed to almost all types of livestock.
Corn Oil
We also extract non-edible crude corn oil during the thin stillage evaporation process immediately prior to production of distillers’ grains. The corn oil that we produce is not food grade corn oil and therefore cannot be used for human consumption. Corn oil is used primarily as a biodiesel feedstock and as a supplement for animal feed.
Corn Syrup
Generally, GFE returns the de-oiled corn syrup into the production process adding it to the modified, or dry distillers’ grains during the drying process. However, HLBE occasionally sells excess corn syrup in liquid syrup form to livestock feeders. Excess syrup results from a plant upset, or when the amount of syrup produced during evaporation process exceeds our distillers’ grains’ dryer capacity. Corn syrup is used primarily as a feed additive to moisten dry feed stuffs such as hay.
Principal Product Markets
As described below in “Distribution of Principal Products”, we market and distribute all of GFE’s and HLBE’s ethanol, distillers’ grains, and corn oil through professional third party marketers. Our marketers make all decisions with regard to where our products are marketed and we have little control over the marketing decisions they make.
Our ethanol, distillers’ grains and corn oil are primarily sold in the domestic market; however, as markets allow, our products can be, and have been, sold in the export markets. We expect our ethanol and distillers’ grains marketers to explore all markets for our products, including export markets. We believe that there is some potential for increased international sales of our products. Nevertheless, due to high transportation costs, and the fact that we are not located near a major international shipping port, we expect a majority of our products to continue to be marketed and sold domestically.
Ethanol Markets
The markets in which our ethanol is sold will depend primarily upon the efforts of Eco-Energy, Inc. (“Eco-Energy”), which buys and markets our ethanol. There are local, regional, national, and international markets for ethanol. The principal markets for our ethanol are petroleum terminals in the continental U.S. The principal purchasers of ethanol are generally wholesale gasoline distributors or blenders.
We believe that local markets will be limited and must typically be evaluated on a case-by-case basis. Although local markets may be the easiest to service, they may be oversold because of the number of ethanol producers near our plants, which may depress the price of ethanol in those markets.
Typically, a regional market is one that is outside of the local market, yet within the neighboring states. Some regional markets include large cities that are subject to anti-smog measures in either carbon monoxide or ozone non-attainment areas, or that have implemented oxygenated gasoline programs, such as Chicago, St. Louis, Denver, and Minneapolis. We consider our primary regional market to be large cities within a 450-mile radius of our ethanol plants. In the national ethanol market, the highest demand by volume is primarily in the southern U.S. and the east and west coast regions.
7
We expect a majority of our ethanol to continue to be marketed and sold domestically. However, as domestic production of ethanol continues to expand, we anticipate increased international sales. Ethanol export demand tends to fluctuate due to the relative strength of the U.S. dollar compared to foreign currencies and monetary and political policies in other nations. As a result, ethanol export demand is more unpredictable than domestic demand and tends to fluctuate throughout the year. During our 2016 fiscal year, exports of ethanol produced in the U.S. increased with Canada as the leading importer, followed by China, Brazil, India, South Korea, the Philippines, Peru and Mexico. For instance, a strong U.S. Dollar is an example of a force that may negatively impact ethanol exports from the U.S.
We transport our ethanol primarily by rail. In addition to rail, we service certain regional markets by truck from time to time. We believe that regional pricing tends to follow national pricing less the freight difference.
Distillers’ Grains Markets
We sell distillers’ grains as animal feed for beef and dairy cattle, poultry, and hogs. Most of the distillers’ grains that we sell are in the form of dried distillers’ grains. Currently, the U.S. ethanol industry exports a significant amount of dried distillers’ grains, which may increase more as worldwide acceptance grows. During our 2016 fiscal year, the largest importers of U.S. distillers’ grains were China, Mexico, South Korea, Vietnam and Canada.
Exports of distillers’ grains weakened towards the end of our fiscal year due to the strength of the U.S. dollar and weak economic conditions in China and Europe. However, the largest impact on distillers’ grains exports resulted from the Chinese anti-dumping and countervailing duty investigation related to distillers’ grains imported into China from the U.S. China is the world’s largest buyer and importer of distillers’ grains, importing nearly all of its needs from U.S. exporters. The investigation was commenced in response to claims made by Chinese producers that U.S. distillers’ grains were being sold at below normal prices, thereby damaging China’s domestic industry. On January 10, 2017, the Chinese Ministry of Commerce announced its final ruling imposing anti-dumping duties and anti-subsidy tariffs, which were significantly higher than the anti-dumping duties and anti-subsidy tariffs imposed in its preliminary rulings in September 2016. The final Chinese anti-dumping duties will range from 42.2% to 53.7%, up from the 33.8% duty imposed in its September 2016 preliminary ruling, and the final anti-subsidy tariffs imposed will range from 11.2% to 12%, up from 10% to 10.7% in the preliminary ruling. We cannot estimate the exact effect these final duties will have on the overall domestic distillers’ grains market. However, market prices for U.S. distillers’ grains began to drop in September 2016 in response to the penalties imposed in the Chinese September 2016 preliminary ruling. Consequently, we expect further declines in distillers’ grains demand from Chinese buyers as they switch to alternative lower cost protein sources. Reduced export demand from China will likely put additional downward pressure on the domestic distillers’ grains market resulting in lower U.S. prices unless alternative export markets develop or domestic demand increases.
We also sell modified wet distillers’ grains, which typically have a shelf life of a maximum of seven days. This provides for a much smaller, more local market and makes the timing of its sale critical. Further, because of its moisture content, the modified wet distillers’ grains are heavier and more difficult to handle. The customer must be close enough to justify the additional handling and shipping costs. As a result, modified wet distillers’ grains are principally sold only to local feedlots and livestock operations.
Various factors affect the price of distillers’ grain, including, among others, the price of corn, soybean meal and other alternative feed products, the performance or value of distillers’ grains in a particular feed market, and the supply and demand within the market. Like other commodities, the price of distillers’ grains can fluctuate significantly.
Corn Oil Markets
Our corn oil is primarily sold to diesel manufacturers and, to a lesser extent, feed lot and poultry markets. We generally transport our corn oil by truck to users located primarily in the upper Midwest.
8
Distribution of Principal Products
GFE’s ethanol plant is located near Granite Falls, Minnesota, in Chippewa County. It is served by the TC&W Railway which provides connection to the Canadian Pacific and Burlington Northern Santa Fe Railroads. The completion of our rail loop during our 2012 fiscal year enables us to load unit trains. Our site is in close proximity to major highways that connect to major population centers such as Minneapolis, Minnesota; Chicago, Illinois; and Detroit, Michigan.
HLBE’s ethanol plant is located near Heron Lake, Minnesota. It is served by the Union Pacific Railroad. HLBE’s site is also in close proximity to major highways that connect to major population centers such as Minneapolis, Minnesota; Chicago, Illinois; and Detroit, Michigan.
Ethanol Distribution
Eco-Energy is the ethanol marketer for both the GFE plant and HLBE plant. Pursuant to our marketing agreements, Eco-Energy purchases and markets the entire ethanol output of GFE’s and HLBE’s ethanol plants. and to arrange for the transportation of ethanol. Under GFE’s ethanol marketing agreement, GFE is responsible for securing all of the rail cars necessary for the transport of ethanol by rail except for 43 rail cars leased to GFE by Eco-Energy. Under HLBE’s ethanol marketing agreement, Eco-Energy arranges for the transportation of HLBE’s ethanol. GFE and HLBE pay Eco-Energy a marketing fee per gallon of ethanol sold, as well as a fixed lease fee for rail cars leased from Eco-Energy.
Our agreements with Eco-Energy were set to expire on December 31, 2016. However, during the third quarter of 2016, GFE and HLBE entered into amendments of their marketing agreements with Eco-Enegy extending the terms of the marketing agreements to December 31, 2019, with automatic renewals for additional three terms of three year periods unless terminated by either party by providing written notice to the other party at least 90 days prior to the end of the then current term. Additionally, the amendments provide for certain negotiated changes to the marketing fees payable to Eco-Energy by GFE and HLBE and the timing of payments by Eco-Energy to GFE and HLBE for the ethanol Eco-Energy purchases from our plants. The changes to the marketing fee and timing of payments by Eco-Energy were negotiated based on prevailing market-rate conditions for comparable ethanol marketing services.
Distillers’ Grains Distribution
Since February 1, 2011, RPMG, Inc. (“RPMG”) has served as the distillers’ grains marketer for our Granite Falls plant. Pursuant to this agreement, RPMG markets all the distillers’ grains produced at our Granite Falls plant. The contract commenced on February 1, 2011, with an initial term of one year, but continues in effect until terminated by either party.
Since November 1, 2013, Gavilon Ingredients, LLC (“Gavilon”) serves as the distillers’ grains marketer for HLBE. Under this agreement, Gavilon purchases all of the distillers’ grains produced at our Heron Lake ethanol plant in exchange for a service fee. The contract commenced on November 1, 2013 with an initial term of six months, and will continue to remain in effect until terminated by either party at its unqualified option, by providing written notice of not less than 60 days to the other party.
Corn Oil Distribution
RPMG is also our corn oil marketer for both the GFE plant and the HLBE plant. Currently, RPMG markets our corn oil, which is used primarily as a biodiesel feedstock and as a supplement for animal feed. We pay RPMG a commission based on each pound of corn oil sold by RPMG under these marketing agreements.
HLBE independently markets and sells the excess corn syrup occasionally produced from the distillation process at the Heron Lake plant to local livestock feeders.
9
Dependence on One or a Few Major Customers
As discussed above, we have exclusive ethanol marketing agreements with Eco-Energy. Additionally, we have agreements with RPMG and Gavilon to market all of the distillers’ grains produced at GFE’s plant and HLBE’s plant, respectively and with RPMG to market all of the corn oil produced at our plants. We rely on Eco-Energy, RPMG and Gavilon for the sale and distribution of all of our products; therefore, we are highly dependent on Eco-Energy, RPMG and Gavilon for the successful marketing of our products. Any loss of these companies as our marketing agents for our ethanol, distillers’ grains, or corn oil could have a negative impact on our revenues.
Seasonality of Ethanol Sales
We experience some seasonality of demand for our ethanol. Since ethanol is predominantly blended with conventional gasoline for use in automobiles, ethanol demand tends to shift in relation to gasoline demand. As a result, we experience some seasonality of demand for ethanol in the summer months related to increased driving. In addition, we experience some increased ethanol demand during holiday seasons related to increased gasoline demand.
Pricing of Corn and Ethanol
We expect that ethanol sales will represent our primary revenue source and corn will represent our primary component of cost of goods sold. Therefore, changes in the price at which we can sell the ethanol we produce and the price at which we buy corn for our ethanol plants present significant operational risks inherent in our business. Trends in ethanol prices and corn prices are subject to a number of factors and are difficult to predict.
The price and availability of corn is subject to significant fluctuations depending upon a number of factors that affect commodity prices in general, including crop conditions, yields, domestic and global stocks, weather, federal policy and foreign trade. With the volatility of the weather and commodity markets, we cannot predict the future price of corn. Historically, ethanol prices have tended to correlate with corn prices, wholesale gasoline prices, with demand for and the price of ethanol increasing as supplies of petroleum decreased or appeared to be threatened, crude oil prices increased and wholesale gasoline prices increased. However, the prices of both ethanol and corn do not always follow historical trends.
Generally, higher corn prices will produce lower profit margins and, therefore, negatively affect our financial performance. If a period of high corn prices were to be sustained for some time, such pricing may reduce our ability to operate profitably because of the higher cost of operating our plants. Because the market price of ethanol is not directly related to corn prices, we, like most ethanol producers, are not able to compensate for increases in the cost of corn through adjustments in our prices for our ethanol although we do see increases in the prices of our distillers’ grain during times of higher corn prices. Given that ethanol sales comprise a majority of our revenues, our inability to adjust our ethanol prices can result in a negative impact on our profitability during periods of high corn prices.
Ethanol prices stayed low during fiscal year 2016, partially in response to lower corn and oil prices, and the large supply of corn and oil. High U.S. ethanol production levels that outpaced strong domestic consumption and export demand also impacted ethanol prices during fiscal year 2016. The increase in ethanol production resulted from the domestic producers responding to the consistently low corn prices during fiscal year 2016. Additionally, management believes ethanol demand and prices were negatively impacted throughout our 2016 fiscal year by the EPA’s draft proposal to reduce the amount of renewable fuels which are required to be used in the United States pursuant to the RFS. In the past, many fuel blenders used ethanol because of the difference in price between gasoline and ethanol. This voluntary use of ethanol in excess of the requirements in the RFS has decreased due to the fact that the spread between the price of ethanol and gasoline is smaller.
Sources and Availability of Raw Materials
The primary raw materials used in the production of ethanol at our plants are corn and natural gas. Our plants also require significant and uninterrupted amounts of electricity and water.
10
Corn
Ethanol production requires substantial amounts of corn. The cost of corn represented approximately 73.7%, 73.6%, and 80.8% of our cost of sales for the years ended October 31, 2016, 2015, and 2014, respectively. At GFE’s current production rate of approximately 62 millon gallons of undenatured ethanol per year, the GFE plant requires approximately 21.5 million bushels of corn per year. The HLBE ethanol plant requires approximately 22.1 million bushels of corn per year to operate at is current production rate of approximately 64 million gallons of undenatured ethanol per year.
The grain supply for our Granite Falls plant is obtained from Farmers Cooperative Elevator Company (“FCE”), our exclusive grain procurement agent. Our members are not obligated to deliver corn to our Granite Falls plant. We will be forced to seek alternative corn suppliers if FCE cannot meet our needs. The term of our agreement with FCE expires in November 2017.
Typically, HLBE purchases its corn directly from grain elevators, farmers, and local dealers within approximately 80 miles of Heron Lake, Minnesota. HLBE generally purchases corn through spot cash, fixed-price forward, basis only, and futures only contracts. HLBE’s fixed-price forward contracts specify the amount of corn, the price and the time period over which the corn is to be delivered. These forward contracts are at fixed prices indexed to Chicago Board of Trade (“CBOT”) prices. HLBE’s corn requirements can be contracted in advance under fixed-price forward contracts or options. The parameters of these contracts are based on the local supply and demand situation and the seasonality of the price. For delayed pricing contracts, producers will deliver corn to HLBE, but the pricing for that corn and the related payment will occur at a later date. HLBE may also purchase a portion of its corn on a spot basis. For its spot purchases, HLBE posts daily corn bids so that corn producers can sell to HLBE on a spot basis.
In addition, both plants’ facilities have sufficient corn storage capacity, with the capability to store approximately 8 days of corn supply at HLBE and with the completion of our grain storage expansion project, approximately 18 days of corn supply at the GFE plant.
We compete with ethanol producers in close proximity for the supplies of corn we will require to operate our plants. There are 8 ethanol plants within an approximate 50 mile radius of HLBE’s plant and 5 ethanol plants within an approximate 50 mile radius of the GFE plant. The existence of other ethanol plants, particularly those in close proximity to our plants, increase the demand for corn and may result in higher costs for supplies of corn. We also compete with other users of corn, including ethanol producers regionally and nationally, producers of food and food ingredients for human consumption (such as high fructose corn syrup, starches, and sweeteners), producers of animal feed and industrial users.
Since corn is the primary raw material we use to produce our products, the availability and cost of corn can have a significant impact on the profitability of our operations. Corn prices were lower during our 2016 fiscal year as a result of several consecutive years of favorable corn crops which has increased the amount of corn available to us. As a result of these favorable corn crops, we have not had difficulty securing the corn we need to operate our ethanol plants at prices that have allowed us to operate profitably. If we experience a drought or other unfavorable weather condition during our 2017 fiscal year, the price we pay for corn and the availability of corn near our plants could be negatively impacted. If we experience a localized shortage of corn, we may be forced to purchase corn from producers who are farther away from our ethanol plants which can increase our transportation costs.
Utilities
Natural Gas
Natural gas is a significant input to our manufacturing process. The cost of natural gas represented approximately 5.1%, 6.7%, and 7.3% of our cost of sales for the years ended October 31, 2016, 2015, and 2014, respectively.
11
We do not anticipate any problems securing the natural gas we require to continue to operate our plants at capacity during our 2017 fiscal year or beyond. At GFE’s plant, we pay Center Point Energy/Minnegasco a per unit fee to move the natural gas through the pipeline, and we have guaranteed to move a minimum of 1,500,000 mmBTU annually through December 31, 2025, which is the ending date of the agreement. GFE also has an agreement with U.S. Energy Services, Inc. On our behalf, U.S. Energy Services procures contracts with various natural gas vendors to supply the natural gas necessary to operate the GFE plant. We determined that sourcing our natural gas from a variety of vendors is more cost-efficient than using an exclusive supplier.
HLBE has a facilities agreement with Northern Border Pipeline Company, which allows HLBE to access to an existing interstate natural gas pipeline located approximately 16 miles north from its plant. HLBE has entered into a firm natural gas transportation agreement with its majority owned subsidiary, Agrinatural. Under the terms of the firm natural gas transportation agreement, Agrinatural will provide natural gas to the HLBE plant with a specified price per MMBTU for an initial term of 10 years, with two automatic renewal options for five years periods. On July 1, 2014, HLBE entered into an amendment of this agreement pursuant to which it agreed on an early exercise of one of the two automatic five-year term renewals thereby extending the term of the firm natural gas transportation agreement to October 31, 2021. HLBE also has a base agreement for the sale and purchase of natural gas with Constellation NewEnergy—Gas Division, LLC (“Constellation”). HLBE buys all of its natural gas from Constellation and this agreement runs through March 31, 2019.
The prices for and availability of natural gas are subject to volatile market conditions. These market conditions often are affected by factors beyond our control such as higher prices as a result of colder than average weather conditions or natural disasters, overall economic conditions and foreign and domestic governmental regulations and relations. Significant disruptions in the supply of natural gas could impair our ability to manufacture ethanol and more significantly, dried distillers’ grains for our customers. Furthermore, increases in natural gas prices or changes in our natural gas costs relative to natural gas costs paid by competitors may adversely affect our results of operations and financial condition.
Electricity
Our plants require a continuous supply of electricity. We have agreements in place to supply electricity to our plants. We do not anticipate any problems securing the electricity that we require to continue to operate our plants at capacity during our 2017 fiscal year or beyond.
Water
We do not anticipate any problems securing the water that we require to continue to operate our plants at capacity during our 2017 fiscal year or beyond. GFE obtains the water necessary to operate its from the Minnesota River with an adjustable gravity-flow intake system.
HLBE obtains its water pursuant to an industrial water supply agreement with the City of Heron Lake and Jackson County, Minnesota.
Risk Management and Hedging
The profitability of our operations is highly dependent on the impact of market fluctuations associated with commodity prices. We use various derivative instruments as part of an overall strategy to manage market risk and to reduce the risk that our ethanol production will become unprofitable when market prices among our principal commodities and products do not correlate.
12
In order to mitigate our commodity and product price risks, we enter into hedging transactions, including forward corn, ethanol, distillers grain and natural gas contracts, in an attempt to partially offset the effects of price volatility for corn and ethanol. However, we are not always presented with an opportunity to lock in a favorable margin and our plants’ profitability may be negatively impacted during periods of high grain prices. We also enter into over-the-counter and exchange-traded futures, swaps and option contracts for corn, ethanol and distillers’ grains, designed to limit our exposure to increases in the price of corn and manage ethanol price fluctuations. Although we believe that our hedging strategies can reduce the risk of price fluctuations, the financial statement impact of these activities depends upon, among other things, the prices involved and our ability to physically receive or deliver the commodities involved. Our hedging activities could cause net income to be volatile from quarter to quarter due to the timing of the change in value of the derivative instruments relative to the cost and use of the commodity being hedged. As corn and ethanol prices move in reaction to market trends and information, our income statement will be affected depending on the impact such market movements have on the value of our derivative instruments.
Hedging arrangements expose us to the risk of financial loss in situations where the counterparty to the hedging contract defaults or, in the case of exchange-traded contracts, where there is a change in the expected differential between the price of the commodity underlying the hedging agreement and the actual prices paid or received by us for the physical commodity bought or sold. There are also situations where the hedging transactions themselves may result in losses, as when a position is purchased in a declining market or a position is sold in a rising market. Hedging losses may be offset by a decreased cash price for corn and natural gas and an increased cash price for ethanol and distillers’ grains.
We have established a risk management committee which assists the board and our risk management manager to, among other things, establish appropriate policies and strategies for hedging and enterprise risk. We continually monitor and manage our commodity risk exposure and our hedging transactions as part of our overall risk management policy. As a result, we may vary the amount of hedging or other risk mitigation strategies we undertake, and we may choose not to engage in hedging transactions. Our ability to hedge is always subject to our liquidity and available capital.
Process Improvement
We are continually working to develop new methods of operating the ethanol plants more efficiently. We continue to conduct process improvement activities in order to realize these efficiency improvements.
Patents, Trademarks, Licenses, Franchises and Concessions
We do not currently hold any patents, trademarks, franchises, or concessions. We were granted a license by ICM, Inc. (“ICM”) to use certain ethanol production technology necessary to operate our ethanol plants. The cost of the license granted by ICM was included in the amount we paid to Fagen, Inc. to design and build our ethanol plants.
Competition
Ethanol Competition
Domestic Competition
We sell our ethanol in a highly competitive market. Ethanol is a commodity product where competition in the industry is predominantly based on price. On a national scale, we are in direct competition with numerous ethanol producers. According to the RFA, as of December 1, 2016, there are approximately 213 biorefineries with a total nameplate capacity of approximately 15.8 billion gallons of ethanol per year, with an additional 237 million gallons of production under construction. However, the RFA estimates that approximately 3% of the ethanol production capacity in the U.S. was not operating as of December 1, 2016.
13
The largest ethanol producers include: Abengoa Bioenergy Corp.; Archer Daniels Midland Company; Flint Hills Resources, LP; Green Plains, Inc.; POET, LLC and Valero Renewable Fuels, each of which are capable of producing significantly more ethanol than we produce. These producers and other large producers are, among other things, capable of producing a significantly greater amount of ethanol or have multiple ethanol plants that may help them achieve certain benefits that we could not achieve with our ethanol plants. This could put us at a competitive disadvantage to other ethanol producers.
The following table identifies the top five largest ethanol producers in the U.S. along with their production capacities.
|
|
|
Nameplate Capacity |
|
|
Company |
|
(mmgy) |
|
|
Archer Daniels Midland |
|
1,716 |
|
|
POET Biorefining |
|
1,629 |
|
|
Green Plains, Inc. |
|
1,461 |
|
|
Valero Renewable Fuels |
|
1,400 |
|
|
Flint Hills Resources LP |
|
820 |
|
Updated: December 1, 2016, Renewable Fuels Association
While management believes we are a lower cost producer of ethanol, some of these producers are, among other things, capable of producing a significantly greater amount of ethanol or own or manage more ethanol than we do which that may help them achieve certain benefits that we could not achieve with our ethanol plants. Larger ethanol producers may have an advantage over us from economies of scale and stronger negotiating positions with purchasers. Large producers own multiple ethanol plants and may have flexibility to run certain facilities while shutting or slowing down production at their other facilities. This added flexibility may allow these producers to compete more effectively, especially during periods when operating margins are unfavorable in the ethanol industry. Some large producers own ethanol plants in geographically diverse areas of the U.S. and as result, may be able to more effectively spread the risk they encounter related to feedstock prices. Some of our competitors are owned subsidiaries of larger oil companies, such as Valero Renewable Fuels and Flint Hills Resources. Because their parent oil companies are required to blend a certain amount of ethanol each year, these competitors may be able to operate their ethanol production facilities at times when it is unprofitable for us to operate our ethanol plants. Further, new products or methods of ethanol production developed by larger and better-financed competitors could provide them competitive advantages over us and harm our business.
Local Competition
A majority of the U.S. ethanol plants, and therefore, the greatest number of gallons of ethanol production capacity, are concentrated in the corn-producing states of Iowa, Nebraska, Illinois, Indiana, Minnesota, South Dakota, Ohio, Wisconsin, Kansas, and North Dakota. According to the RFA, as of December 1, 2016, Minnesota is one of the top producers of ethanol in the U.S. with 21 ethanol plants producing an aggregate of approximately 1.5 billion gallons of ethanol per year. Therefore, we face increased regional and local competition because of the location of our ethanol plants.
Eco-Energy markets out ethanol primarily on a regional and national basis. We compete with other ethanol producers both for markets in Minnesota and markets in other states. We believe that we are able to reach the best available markets through the use of our experienced marketer and by the rail delivery methods we use. We believe that we can compete favorably with other ethanol producers due to our proximity to ample grain, natural gas, electricity and water supplies at favorable prices.
14
International Competition
In addition to intense competition with domestic producers of ethanol, we have faced increased competition from ethanol produced in foreign countries. Depending on feedstock prices, ethanol imported from foreign countries may be less expensive than domestically-produced ethanol. However, foreign demand, transportation costs and infrastructure constraints may temper the market impact on the U.S. Ethanol imports have been lower in recent years and ethanol exports have been higher. However, if demand for imported ethanol were to increase again, demand for domestic ethanol may be reduced, which could lead to lower domestic prices and lower operating margins. Large international companies with much greater resources than ours have developed, or are developing, increased foreign ethanol production capacities. Many international suppliers produce ethanol primarily from inputs other than corn, such as sugar cane, and have cost structures that may be substantially lower than U.S. based ethanol producers including us. Many of these international suppliers are companies with much greater resources than us with greater production capacities.
Alternative Fuels and Other Fuel Additives Competition
New products or methods of ethanol production developed by larger and better-financed competitors could provide them competitive advantages over us and harm our business. We anticipate increased competition from renewable fuels that do not use corn as the feedstock. Many of the current ethanol production incentives are designed to encourage the production of renewable fuels using raw materials other than corn. One type of ethanol production feedstock that is being explored is cellulose. Cellulose is found in wood chips, corn stalks and rice straw, amongst other common plants. Several companies and researchers have commenced pilot projects to study the feasibility of commercially producing cellulosic ethanol. Additionally, a few companies have begun construction or completed commercial scale cellulosic ethanol plants. If this technology can be profitably employed on a commercial scale, it could potentially lead to ethanol that is less expensive to produce than corn based ethanol. Cellulosic ethanol may also capture more government subsidies and assistance than corn based ethanol. This could decrease demand for our product or result in competitive disadvantages for our ethanol production process.
In addition to competing with ethanol producers, we also compete with producers of other gasoline oxygenates. Many gasoline oxygenates are produced by other companies, including oil companies. The major oil companies have significantly greater resources than we have to develop alternative products and to influence legislation and public perception of ethanol. Historically, as a gasoline oxygenate, ethanol primarily competed with two gasoline oxygenates, both of which are ether-based: MTBE (methyl tertiary butyl ether) and ETBE (ethyl tertiary butyl ether). While ethanol has displaced these two gasoline oxygenates, the development of ethers intended for use as oxygenates is continuing and we will compete with producers of any future ethers used as oxygenates.
A number of automotive, industrial and power generation manufacturers are developing alternative fuels and clean power systems using fuel cells, plug-in hybrids, electric cars or clean burning gaseous fuels. Electric car technology has recently grown in popularity, especially in urban areas. While there are currently a limited number of vehicle recharging stations, there has been increased focus on developing these recharging stations to make electric car technology more feasible and widely available in the future. Additional competition from these other sources of alternative energy, particularly in the automobile market, could reduce the demand for ethanol, which would negatively impact our profitability.
Distillers’ Grains Competition
The amount of distillers’ grains produced annually in North America has increased significantly as the number of ethanol plants increased. We compete with other producers of distillers’ grains products both locally and nationally, with more intense competition for sales of distillers’ grains among ethanol producers in close proximity to our ethanol plants. These competitors may be more likely to sell to the same markets that we target for our distillers’ grains.
15
Distillers’ grains are primarily used as an animal feed, competing with other feed formulations using corn and soybean meal. As a result, we believe that distillers’ grains prices are positively impacted by increases in corn and soybean prices. In recent years the U.S. ethanol industry has increased exports of distillers’ grains which management believes has positively impacted demand and prices for distillers’ grains in the U.S. However, with the recent imposition of Chinese import duties on U.S. distillers’ grains, distillers’ grains exports have been negatively impacted, increasing the domestic supply of distillers’ grains. Increased domestic supply has had a corresponding negative impact on distillers’ grains prices and has decreased the price of distillers’ grains as compared to a comparable volume of corn. In the event these distillers’ grains exports continue to decrease, it could result in increased competition among ethanol producers for sales of distillers’ grains and could negatively impact distillers’ grains prices in the U.S.
Corn Oil Competition
We compete with many ethanol producers for the sale of corn oil. Many ethanol producers have installed the equipment necessary to separate corn oil from the distillers’ grains they produce which has increased competition for corn oil sales and has resulted in lower market corn oil prices.
Government Ethanol Supports
The ethanol industry is dependent on several economic incentives to produce ethanol, the most significant of which is the federal Renewable Fuels Standard (the “RFS”"). The RFS is a national program that does not require that any renewable fuels be used in any particular area or state, allowing refiners to use renewable fuel blends in those areas where it is most cost-effective. The RFS has been, and we expect will continue to be, a significant factor impacting ethanol usage.
Under the RFS, the EPA is supposed to pass an annual rule that establishes the number of gallons of different types of renewable fuels that must be used in the United States by refineries, blenders, distributors and importers which is called the renewable volume obligations (“RVOs”). The EPA has the authority to waive the mandates in whole or in part if one of two conditions is met: 1) there is inadequate domestic renewable fuel supply, or 2) implementation of the mandate requirement severely harms the economy or environment of a state, region or the United States.
The RFS statutory RVO for corn-based ethanol is 14.4 billion gallons in 2014, 15 billion gallons in 2015 and 15 billion gallons in 2016 and each year thereafter through 2022. However, in the EPA’s November 2015 final rule, the RFS RVOs for corn-based ethanol for 2014, 2015 and 2016 were reduced from the statutorily mandated levels. On May 18, 2016, the EPA released a proposed rule to set the RVO for 2017. The EPA proposed to set the total RVO at 18.8 billion gallons of which 14.8 billion gallons could be met by corn-based ethanol, a moderate increase over the 2016 volume but still below the statutory level. On November 23, 2016, the EPA announced the final rule for 2017 RVOs, which is set at 15.0 billion gallons for corn-based ethanol. This rule is set at 100% of the original conventional biofuel requirement of 15.0 billion gallons, and is considered a favorable outcome by the industry.
The following chart illustrates the potential United States ethanol demand based on the schedule of minimum usage established by the RFS program through the year 2022 (in billions of gallons):
|
|
|
|
|
|
|
|
|
|
|
Maximum Amount of Corn-based |
|
|
|
|
|
Total Renewable Fuel |
|
Cellulosic Ethanol |
|
Advanced |
|
Ethanol That Can Be Used to |
|
Year |
|
RVO Source |
|
RVO |
|
Minimum Requirement |
|
Biofuel |
|
Satisfy Total Renewable Fuel RVO |
|
2016 |
|
RFS Statute |
|
22.25 |
|
4.25 |
|
7.25 |
|
15.00 |
|
|
|
EPA Final Rule |
|
18.11 |
|
0.23 |
|
3.61 |
|
14.50 |
|
2017 |
|
RFS Statute |
|
24.00 |
|
5.5 |
|
9.00 |
|
15.00 |
|
|
|
EPA Final Rule |
|
19.28 |
|
0.31 |
|
4.28 |
|
15.00 |
|
2018 |
|
RFS Statute |
|
26.00 |
|
7.00 |
|
11.00 |
|
15.00 |
|
2019 |
|
RFS Statute |
|
28.00 |
|
8.50 |
|
13.00 |
|
15.00 |
|
2020 |
|
RFS Statute |
|
30.00 |
|
10.50 |
|
15.00 |
|
15.00 |
|
2021 |
|
RFS Statute |
|
33.00 |
|
13.50 |
|
18.00 |
|
15.00 |
|
2022 |
|
RFS Statute |
|
36.00 |
|
16.00 |
|
21.00 |
|
15.00 |
16
Current ethanol production capacity exceeds the EPA's 2016 and 2017 RVO standard which can be satisfied by corn based ethanol. Beyond the federal mandates, there are limited markets for ethanol. Further, opponents of ethanol such as large oil companies will likely continue their efforts to repeal or reduce the RFS through lawsuits or lobbying of Congress. If such efforts are successful in further reducing or repealing the blending requirements of the RFS, a significant decrease in ethanol demand may result and could have a material adverse effect on our results of operations, cash flows and financial condition, unless additional demand from exports or discretionary or E85 blending develops.
Many in the ethanol industry believe that it will be difficult to meet the RFS RVOs in future years without an increase in the percentage of ethanol that can be blended with gasoline for use in standard (non-flex fuel) vehicles. Most ethanol that is used in the United States is sold in a blend called E10. E10 is a blend of 10% ethanol and 90% gasoline. E10 is approved for use in all standard vehicles. Estimates indicate that gasoline demand in the United States is approximately 140 billion gallons per year. Assuming that all gasoline in the United States is blended at a rate of 10% ethanol and 90% gasoline, the maximum demand for ethanol is 14.0 billion gallons per year. This is commonly referred to as the “blend wall,” which represents a theoretical limit where more ethanol cannot be blended into the national gasoline pool. This is a theoretical limit because it is believed that it would not be possible to blend ethanol into every gallon of gasoline that is being used in the United States and it discounts the possibility of additional ethanol used in higher percentage blends such as E15 and E85. These higher percentage blends may lead to additional ethanol demand if they become more widely available and accepted by the market.
There is growing availability of E85 for use in flexible fuel vehicles, however it is limited due to lacking infrastructure. In addition, the industry has been working to introduce E15 to the retail market since the EPA approved its use vehicles model year 2001 and newer. However, wide spread adoption of E15 is hampered by regulatory and infrastructure hurdles in many states, as well as consumer acceptance. Additionally, sales of E15 may be limited because: (i) it is not approved for use in all vehicles; (ii) the EPA requires a label that management believes may discourage consumers from using E15; and (iii) retailers may choose not to sell E15 due to concerns regarding liability. In addition, different gasoline blendstocks may be required at certain times of the year in order to use E15 due to federal regulations related to fuel evaporative emissions. This may prevent E15 from being used during certain times of the year in various states. As a result, management believes that E15 may not have an immediate impact on ethanol demand in the U.S.
Compliance with Environmental Laws and Other Regulatory Matters
Our business subjects us to various federal, state, and local environmental laws and regulations, including: those relating to discharges into the air, water, and ground; the generation, storage, handling, use, transportation, and disposal of hazardous materials; and the health and safety of our employees. These laws and regulations require us to obtain and comply with numerous permits to construct and operate our ethanol plants, including water, air, and other environmental permits. The costs associated with obtaining these permits and meeting the conditions of these permits have increased our costs of construction and production. Additionally, compliance with environmental laws and permit conditions in the future could require expensive pollution control equipment or operational changes to limit actual or potential impacts to the environment, as well as significant management time and expense. A violation of these laws, regulations or permit conditions can result in substantial fines, natural resource damage, criminal sanctions, permit revocations, and/or plant shutdown, any of which could have a material adverse effect on our operations. Although violations and environmental non-compliance still remain a possibility following our conversion from coal to natural gas combustion, the exposure to the company has been greatly reduced.
In connection with HLBE’s RTO replacement project, HLBE filed an application for a major amendment of its air emissions permit with the Minnesota Pollution Control Agency (“MPCA”) to allow for the replacement under its current permit. However, HLBE entered into a compliance agreement with the MPCA on April 27, 2016 to allow HLBE to proceed with replacement of its RTO prior to receiving approval of its major amendment application due to backlog in the permit approval process. The compliance agreement requires that HLBE operate the new RTO in compliance with its existing air emissions permit and complete certain green initiatives at the facility, including constructing a butterfly and bee garden at HLBE plant site, installing LED lighting throughout HLBE facility, and installing variable frequency drives on its evaporator pumps. As of the end of our 2016 fiscal year, HLBE had completed construction of the butterfly and bee garden, installation of LED lighting throughout the facility and installation of the variable frequency drives.
17
In the fiscal year ended October 31, 2016, we incurred costs and expenses of approximately $117,000 and $337,000 complying with environmental laws, including the cost of pursuing permit amendments, for our Granite Falls plant and Heron Lake plants, respectively. Although we have been successful in obtaining all of the permits currently required, any retroactive change in environmental regulations, either at the federal or state level, could require us to obtain additional or new permits or spend considerable resources in complying with such regulations.
The RFS was revised by the EPA in July 2010 to adopt rules to determine which renewable fuels provided sufficient reductions in greenhouse gases, compared to conventional gasoline, to qualify under the RFS program. This approach establishes a tiered approach, where regular renewable fuels are required to accomplish a 20% greenhouse gas reduction compared to gasoline, advanced biofuels and biomass-based biodiesel must accomplish a 50% reduction in greenhouse gases, and cellulosic biofuels must accomplish a 60% reduction in greenhouse gases. Any fuels that fail to meet this standard cannot be used by fuel blenders to satisfy their obligations under the RFS program. As adopted by the EPA, the revised regulations provide that corn-based ethanol plants utilizing corn starch that commenced construction prior to December 2007 were grandfathered in and do meet the definition of a renewable fuel under the RFS program. However, the grandfathered production was limited to such plants then-permitted production capacity. As a result, the GFE and HLBE plants were grandfathered at their then permitted capacity and allowed to generate Renewable Identification Numbers (“RINs”) for compliance with the RFS.
However, to generate RINs that qualify for compliance with the RFS program for any increased production above the grandfathered gallons, the GFE and HLBE plants must meet a threshold of a 20% reduction in greenhouse gas, or GHG, emissions from a 2005 baseline measurement to produce ethanol eligible for the RFS mandate. In September 2014, the EPA announced a new expedited petition process, referred to as the “efficient producer” petition, for existing corn starch and grain sorghum ethanol producers to gain pathway approval and qualify to generate RINs for production volumes above those grandfathered under the RFS. On January 13, 2015 and March 30, 2015, HLBE and GFE, respectively, submitted efficient producer petitions to the EPA. The EPA awarded efficient producer pathway approval to HLBE and GFE on March 12, 2015 and May 13, 2015, respectively. In the approval determinations, the EPA’s analysis indicated that HLBE achieved at least a 20.1% reduction and GFE achieved a 26.0% reduction in GHG emissions for their non-grandfathered volumes compared to the baseline lifecycle GHG emissions.
Pursuant to the award approval, HLBE and GFE are only authorized to generate RINs for each plant’s non-grandfathered volumes if each plant can demonstrate that all ethanol produced at the plant during an averaging period (defined as the prior 365 days or the number of days since the date EPA efficient producer pathway approval) meets the 20% GHG reduction requirement. To make these demonstrations, HLBE and GFE must develop compliance plans and keep certain records as specified in the approvals. Additionally, the EPA approvals require that HLBE and GFE register with the EPA as a renewable fuel producer for the non-grandfathered volumes.
As of the date of this report, the engineering study, compliance plan, and registration requirements for each plant have been submitted and approval. Although we believe GFE and HLBE will be able to maintain continuous compliance with the 20% reduction in GHG emissions requirement, there is no guarantee that we will do so. If GFE or HLBE do not maintain continuous compliance with the 20% reduction in GHG emissions requirement, we will not be able issue RINs for the non-grandfathered volumes of ethanol produced at the plants. As a result, we may be forced to rely on exports sales for these non-grandfathered volumes ethanol, which could adversely affect our operating margins, which, in turn could adversely affect our results of operations, cash flows and financial condition.
The California Air Resources Board, or CARB, has adopted a Low Carbon Fuel Standard, or LCFS, requiring a 10% reduction in average carbon intensity of gasoline and diesel transportation fuels from 2010 to 2020. After a series of rulings that temporarily prevented CARB from enforcing these regulations, the federal appellate court reversed the federal district court finding the LCFS constitutional and remanding the case back to federal district court to determine whether the LCFS imposes a burden on interstate commerce that is excessive in light of the local benefits. On June 30, 2014, the United States Supreme Court declined to hear the appeal of the federal appellate court ruling and CARB recently re-adopted the LCFS with some slight modifications. The LCFS could have a negative impact on demand for corn-based ethanol and result in decreased ethanol prices affecting our ability to operate profitably.
18
In February 2013, an anti-dumping tariff was imposed as a regulation by the Council of the European Union ethanol produced in the United States and exported to Europe. The Company does not export any ethanol to Europe at this time. However, continuation of this duty or imposition of tariffs by other countries or regions could reduce United States exports to Europe, and possibly other export markets. A reduction of exports to Europe could have an adverse effect on domestic ethanol prices, as the available supply of ethanol for the domestic market would increase.
Employees
We compete with ethanol producers in close proximity for the personnel we will require to operate our plants. The existence and development of other ethanol plants will increase competition for qualified managers, engineers, operators and other personnel. We also compete for personnel with businesses other than ethanol producers and with businesses located within the Granite Falls and Heron Lake, Minnesota communities.
As of the date of this report, we have 83 full time employees at our two consolidated ethanol plants, of which 42 are employed at the GFE plant and 41 are employed at the HLBE plant. Of our total employees, 15 are involved primarily in management and administration with 8 employees at the GFE plant and 7 at the HLBE plant. The remaining employees are involved primarily in plant operations. We do not currently anticipate any significant change in the number of employees at our plants.
On July 31, 2013, GFE entered into a management services agreement with HLBE. Pursuant to the management services agreement, GFE provides its chief executive officer, chief financial officer, and commodity risk manager to act in those positions as part-time officers and managers of HLBE. Each person providing management services to HLBE under the management services agreement is subject to oversight by the HLBE board of governors. However, GFE’s chief executive officer is solely responsible for hiring and firing persons providing management services under the management services agreement.
The initial term of the Management Services Agreement expired on July 30, 2016. However, the management services agreement automatically renewed for an additional one-year term and will continue to automatically renew for successive one-year terms until either party gives the other party written notice of termination prior to expiration of the then current term. The management services agreement may also be terminated by either party for cause under certain circumstances.
GFE is responsible for and agreed to directly pay salary, wages, and/or benefits to the persons providing management services under the management services agreement. Under the terms of the management services agreement, HLBE pays GFE 50% of the total salary, bonuses and other expenses and costs (including all benefits and tax contributions) incurred by GFE for the three management positions, paid on an estimated monthly basis with a “true-up” following the close of our fiscal year.
Financial Information about Geographic Areas
All of our operations are domiciled in the U.S. All of the products sold to our customers for fiscal years 2016, 2015, and 2014 were produced in the U.S. and all of our long-lived assets are domiciled in the U.S. We have engaged third-party professional marketers who decide where our products are marketed and we have no control over the marketing decisions made by our third-party professional marketers. These third-party marketers may decide to sell our products in countries other than the U.S. However, we anticipate that our products will primarily be sold in the U.S.
Investments
Subsequent to our fiscal year end, on November 1, 2016, we subscribed to purchase 1,500 capital units of Ring-neck Energy & Feed, LLC (“Ring-neck”) at a price of $5,000 per unit for a total of $7,500,000. We paid a down payment of $750,000 in connection with our subscription, and signed a promissory note for $6,750,000 for the remaining balance of the subscription. If Ring-neck accepts our subscription, we will be required to pay Ring-neck the entire amount due under the promissory note within 20 days of receiving notice from Ring-neck that it is due. If we fail to pay the entire amount due, we will be charged 12% interest per year, and Ring-neck may seek legal action to force us to pay. If Ring-neck does not meet certain conditions of its offering or rejects our subscription, we expect that our promissory note will be cancelled and our down payment will be refunded to us.
19
Ring-neck is a South Dakota limited liability company that intends to build an 80 million gallon per year ethanol manufacturing plant in outside of Onida, South Dakota in Sully County. If Ring-neck accepts our subscription, our investment is sufficient to secure the Company the right to appoint one director to the board of directors of Ring-neck. The units we expect to acquire in Ring-neck will be subject to restrictions on transfer, therefore, this should not be considered a liquid investment. If our subscription is accepted, it may take a significant amount of time before we realize a return on our investment, if we realize a return on the investment at all.
Ring-neck is offering the sale of its units pursuant to a private placement memorandum. Additionally, because Ring-neck is not conducting a federally-registered offering, we do not expect that information about Ring-neck will be available via the SEC’s EDGAR filing system. Therefore, it may be difficult for our investors to obtain information about Ring-neck.
In connection with our subscription, we entered into a credit facility with Fagen Energy, LLC (“Fagen Energy”), which allows the Company to borrow up to $7.5 million of variable-rate, amortizing non-recourse debt using the Ring-neck investment as collateral. Fagen Energy is an affiliate of Fagen, Inc., the design-builder for the our plants and a member of GFE. Details of the Fagen Energy credit facility are provided below in the section below entitled “PART II - ITEM 7. MANAGEMENT’S DISCUSSION AND ANALYSIS OF FINANCIAL CONDITION AND RESULTS OF OPERATIONS - Credit Arrangments”.
You should carefully read and consider the risks and uncertainties below and the other information contained in this report. The risks and uncertainties described below are not the only ones we may face. The following risks, together with additional risks and uncertainties not currently known to us or that we currently deem immaterial could impair our financial condition and results of operation. If any of the following risks actually occur, our results of operations, cash flows and the value of our units could be negatively impacted.
Risks Relating to Our Business
Our business is not significantly diversified, and we may not be able to adapt to changing market conditions or endure any decline in the ethanol industry.
Our success depends on our ability to efficiently produce and sell ethanol, and, to a lesser extent, distillers’ grains and corn oil. We do not have any other lines of business or other sources of revenue if we are unable to operate our ethanol plants and manufacture ethanol and its related co-products. Further, all of our investments are in companies involved in the ethanol industry. Our majority owned subsidiary, HLBE, operates a natural gas pipeline through Agrinatural, its majority owned subsidiary. Before and after accounting for intercompany eliminations, revenues from Agrinatural’s represent less than less than 1% of our consolidated revenues. Therefore, Agrinatural does not produce significant revenue to rely upon if we are unable to produce and sell ethanol and its co-products, or if the market for those products decline. As result, if economic or political factors adversely affect the market for ethanol and its co-products, we have no other line of business to fall back on. Our lack of diversification means that we may not be able to adapt to changing market conditions, changes in regulation, increased competition or any significant decline in the ethanol industry. Our business would also be significantly harmed if the ethanol plants could not operate at full capacity for any extended period of time.
Our profitability depends upon purchasing corn at lower prices and selling ethanol at higher prices and because the difference between ethanol and corn prices can vary significantly, our financial results may also fluctuate significantly.
The results of our ethanol production business are highly impacted by commodity prices. The substantial majority of our revenues are derived from the sale of ethanol. Our results of operations and financial condition are significantly affected by the cost and supply of corn and natural gas as our gross profit relating to the sale of ethanol is principally dependent on the difference between the price we receive for the ethanol we produce and the cost of corn and natural gas that we must purchase. Changes in the price and supply of corn and natural gas are subject to and determined by market forces over which we have no control, such as weather, domestic and global demand, shortages, export prices, and various governmental policies in the U.S. and around the world.
20
As a result of price volatility for these commodities, our operating results may fluctuate substantially. Increases in corn or natural gas prices or decreases in ethanol, distillers’ grains and corn oil prices may make it unprofitable to operate our plants. No assurance can be given that we will be able to purchase corn and natural gas at, or near, current prices and that we will be able to sell ethanol, distillers’ grains and corn oil at, or near, current prices. Consequently, our results of operations and financial position may be adversely affected by increases in the price of corn or natural gas or decreases in the price of ethanol, distillers’ grains and corn oil.
We seek to minimize the risks from fluctuations in the prices of corn and natural gas through the use of hedging instruments. However, these hedging transactions also involve risks to our business. If we were to experience relatively higher corn and natural gas costs compared to the selling prices of our products for an extended period of time, the value of our units may be reduced.
Sustained negative operating margins may require some ethanol producers to temporarily limit or cease production.
Our ability and the ability of other ethanol producers to operate profitably is largely determined by the spread between the price paid for corn and the price received for ethanol. If this spread is narrow or is negative for a sustained period, some ethanol producers may elect to temporarily limit or cease production until their possibility for profitability returns. Although we currently have no plans to limit or cease ethanol production, we may be required to do so if we experience a period of sustained negative operating margins. In such an event, we would still incur certain fixed costs, which would impact our financial performance.
Declining oil prices and resultant lower gas prices may materially affect ethanol pricing and demand.
Ethanol has historically traded at a discount to gasoline. When ethanol trades at a discount to gasoline it encourages discretionary blending, thereby increasing the demand for ethanol beyond required blending rates. Conversely, when ethanol trades at a premium to gasoline, there is a disincentive for discretionary blending and ethanol demand is negatively impacted. With the recent decline in oil and gas prices, ethanol is currently trading at an approximately equivalent price to gasoline resulting in a disincentive for discretionary blending of ethanol beyond the required blend rate. Consequently, ethanol demand has reduced and ethanol prices have been negatively impacted. If the current trend continues for a significant period of time, it could hurt our ability to manage our profit margin, which could result in a material adverse effect on our business, results of operations and financial condition.
If the supply of ethanol exceeds the demand for ethanol, the price we receive for our ethanol and distillers’ grains may decrease.
Domestic ethanol production capacity has increased substantially over the past decade. However, demand for ethanol may not increase as quickly as expected or to a level that exceeds supply, or at all. Excess ethanol production capacity may result from decreases in the demand for ethanol or increased domestic production or imported supply. There are many factors affecting demand for ethanol, including regulatory developments and reduced gasoline consumption as a result of increased prices for gasoline or crude oil. Higher gasoline prices could cause businesses and consumers to reduce driving or acquire vehicles with more favorable gasoline mileage, or higher prices could spur technological advances, such as the commercialization of engines utilizing hydrogen fuel-cells, which could supplant gasoline-powered engines. There are a number of governmental initiatives designed to reduce gasoline consumption, including tax credits for hybrid vehicles and consumer education programs.
Because ethanol production produces distillers’ grains as a co-product, increased ethanol production will also lead to increased production of distillers’ grains. An increase in the supply of distillers’ grains, without corresponding increases in demand, could lead to lower prices or an inability to sell our distillers’ grains production.
We anticipate the price of ethanol will continue to be volatile in fiscal year 2017 as a result of the net effect of changes in the price of gasoline and corn and increased ethanol supply offset by increased ethanol demand. The U.S. benefited from additional exports of ethanol during our 2016 fiscal year. Management believes these additional exports of ethanol were due to lower market ethanol prices in the United States and increased global demand for ethanol. However, these ethanol exports may not continue to occur during our 2017 fiscal year. If we experience excess ethanol supply, either due to increased ethanol production, lower worldwide demand or lower gasoline demand, it could negatively impact the price of ethanol and distillers’ grains which could hurt our ability to profitably operate our ethanol plants.
21
The price of distillers’ grains is affected by the price of other commodity products, such as soybeans, and decreases in the price of these commodities could decrease the price of distillers’ grains.
Distillers’ grains compete with other protein-based animal feed products. The price of distillers’ grains may decrease when the price of competing feed products decrease. The prices of competing animal feed products are based in part on the prices of the commodities from which they are derived. Downward pressure on commodity prices, such as soybeans, will generally cause the price of competing animal feed products to decline, resulting in downward pressure on the price of distillers’ grains. The price of distillers’ grains is not tied to production costs. However, decreases in the price of distillers’ grains would result in less revenue from the sale of distillers’ grains and could result in lower profit margins.
Historically, sales prices for distillers’ grains have been correlated with prices of corn. However, there have been occasions when the price increase for this co-product has lagged behind increases in corn prices. In addition, our distillers’ grains co-product competes with products made from other feedstocks, the cost of which may not have risen as corn prices have risen. Consequently, the price we may receive for distillers’ grains may not rise as corn prices rise, thereby lowering our cost recovery percentage relative to corn.
The prices of ethanol and distillers’ grains may decline as a result of trade barriers imposed by foreign countries with respect to ethanol and distillers’ grains originating in the U.S. and negatively affect our profitability.
An increasing amount of our industry's products are being exported. The United States ethanol industry was supported during our 2016 fiscal year with exports of ethanol which increased demand for our ethanol. Management believes these additional exports of ethanol were due to lower market ethanol prices in the United States and increased global demand for ethanol. However, these ethanol exports may not continue. If producers and exporters of ethanol and distillers' grains are subjected to trade barriers when selling products to foreign customers, there may be a reduction in the price of these products in the United States. Declines in the price we receive for our products will lead to decreased revenues and may result in our inability to operate our ethanol plants profitably.
In 2013, the European Union imposed a tariff on ethanol which is produced in the United States and exported to Europe as a result of its anti-dumping investigation. While U.S. producers continue to experience some ethanol exports to Europe, as a result of this tariff, if ethanol prices increase, these exports to the European Union may cease. Further, ethanol exports could potentially be higher without the European Union tariff. In addition, other importers of United States ethanol could reduce their imports which could negatively impact ethanol prices in the United States and could result in an imbalance between ethanol supply and ethanol demand. Any decrease in ethanol prices or demand may negatively impact our ability to profitably operate our ethanol plants.
China, the largest buyer of distillers' grains in the world, announced in June 2014 that it would stop issuing import permits for United States distillers' grains due to the presence of a genetically modified trait was not approved by China for import. As a result, Chinese imports of distillers' grains for the second half of 2014 were halted and a drop in distillers' grains prices followed. Following the resolution of these issues in December 2014, a new registration requirement for Chinese importers of distillers’ grains began on September 1, 2015. If United States producers can not satisfy import requirements imposed by countries importing distillers' grains, export demand could be significantly reduced as a result. If export demand of distillers' grains is significantly reduced as a result, the price of distillers' grains in the United States would likely continue to decline which would have a negative effect on our revenue and could impact our ability to profitably operate which could in turn reduce the value of our units.
Distillers’ grains demand and prices may be negatively impacted by the Chinese anti-dumping duty.
Historically, China was the world's largest buyer of distillers’ grains produced in the United States. In January 2016, China’s Ministry of Commerce initiated an anti-dumping investigation into U.S. produced dried distillers’ grains exported to China. On September 23, 2016, the Chinese instituted a preliminary anti-dumping duty of 33.8% in response to this investigation and an anti-subsidy tariff on September 30, 2016 of approximately 10%. Further, on January 10, 2017, the Chinese Ministry of Commerce announced its final penalties, which were significantly higher than those imposed int preliminary ruling, with the final anti-dumping duties rang from 42.2% to 53.7%, and the final anti-subsidy tariff will range from 11.2% to 12%.
22
We cannot estimate the exact effect these final duties will have on the overall domestic distillers’ grains market. However, market prices for U.S. distillers’ grains began to drop in September 2016 in response to the penalties imposed in the Chinese September 2016 preliminary ruling. Consequently, we expect further declines in distillers’ grains demand from Chinese buyers as they switch to alternative lower cost protein sources. While we expect China to continue to import some distillers’ grains, we do not anticipate that the imports will be at the same level as previous years which could continue to negatively impact market distillers’ grains demand and prices. This potential reduction in demand along with lower domestic corn prices could negatively impact our ability to profitably operate our ethanol plants.
We face intense competition that may result in reductions in the price we receive for our ethanol, increases in the prices we pay for our corn, or lower gross profits.
Competition in the ethanol industry is intense. We face formidable competition in every aspect of our business from both larger and smaller producers of ethanol and distillers’ grains. Some larger producers of ethanol, such as Archer Daniels Midland Company, Cargill, Inc., Valero Energy Corporation, have substantially greater financial, operational, procurement, marketing, distribution and technical resources than we have. We may not be able to compete with these larger entities. These larger ethanol producers may be able to affect the ethanol market in ways that are not beneficial to us which could affect our financial performance.
Additionally, smaller competitors, such as farmer-owned cooperatives and independent companies owned by farmers and investors, have business advantages, such as the ability to more favorably procure corn by operating smaller plants that may not affect the local price of corn as much as larger-scale plants like ours or requiring their farmer-owners to sell them corn as a requirement of ownership. Because Minnesota is one of the top producers of ethanol in the U.S., we face increased competition because of the location of our ethanol plants.
Until recently, oil companies, petrochemical refiners and gasoline retailers have not been engaged in ethanol production to a large extent. These companies, however, form the primary distribution networks for marketing ethanol through blended gasoline. During the past few years, several large oil companies have begun to penetrate the ethanol production market. If these companies increase their ethanol plant ownership or other oil companies seek to engage in direct ethanol production, such as Valero Renewable Fuels and Flint Hills Resources which are subsidiaries of larger oil companies, there may be a decrease in the demand for ethanol from smaller independent ethanol producers like us which could result in an adverse effect on our operations, cash flows and financial condition.
We also face increasing competition from international ethanol suppliers. Most international ethanol producers have cost structures that can be substantially lower than ours and therefore can sell their ethanol for substantially less than we can. While ethanol imported to the U.S. was subject to an ad valorem tax and a per gallon surcharge that helped mitigate the effects of international competition for U.S. ethanol producers, the tax and per gallon surcharge expired on December 31, 2011. Because the tax and surcharge on imported ethanol was not extended beyond December 31, 2011, we are facing increased competition from imported ethanol and foreign producers of ethanol. In addition, ethanol imports from certain countries are exempted from these tariffs under the Caribbean Basin Initiative to spur economic development in Central America and the Caribbean.
Competing ethanol producers may introduce competitive pricing pressures that may adversely affect our sales levels and margins or our ability to procure corn at favorable prices. As a result, we cannot assure you that we will be able to compete successfully with existing or new competitors.
We engage in hedging transactions which involve risks that could harm our business.
We are exposed to market risk from changes in commodity prices. Exposure to commodity price risk results from our dependence on corn and natural gas in the ethanol production process. We seek to minimize the risks from fluctuations in the prices of corn, natural gas and ethanol through the use of hedging instruments. The effectiveness of our hedging strategies is dependent on the price of corn, natural gas and ethanol and our ability to sell sufficient products to use all of the corn and natural gas for which we have futures contracts. Our hedging activities may not successfully reduce the risk caused by price fluctuation which may leave us vulnerable to high corn and natural gas prices, as well as low ethanol prices.
23
Operational difficulties at our plants could negatively impact our sales volumes and could cause us to incur substantial losses.
We have experienced operational difficulties at our plants in the past that have resulted in scheduled and unscheduled downtime or reductions in the number of gallons of ethanol we produce. Some of the difficulties we have experienced relate to production problems, repairs required to our plants’ equipment and equipment maintenance, the installation of new equipment and related testing, and our efforts to improve and test our air emissions. Our revenues are driven in large part by the number of gallons of ethanol and the number of tons of distillers’ grains we produce. If our ethanol plants do not efficiently produce our products in high volumes, our business, results of operations, and financial condition may be materially adversely affected.
Our operations are also subject to operational hazards inherent in our industry and to manufacturing in general, such as equipment failures, fires, explosions, abnormal pressures, blowouts, pipeline ruptures, transportation accidents and natural disasters. Some of these operational hazards may cause personal injury or loss of life, severe damage to or destruction of property and equipment or environmental damage, and may result in suspension of operations and the imposition of civil or criminal penalties. The occurrence of any of these operational hazards may materially adversely affect our business, results of operations and financial condition. Further, our insurance may not be adequate to fully cover the potential operational hazards described above or we may not be able to renew this insurance on commercially reasonable terms or at all.
Our operations and financial performance could be adversely affected by infrastructure disruptions and lack of adequate transportation and storage infrastructure in certain areas.
We ship our ethanol to our customers primarily by the railroad adjacent to our plant sites. We also have the potential to receive inbound corn via the railroad. Our customers require appropriate transportation and storage capacity to take delivery of the products we produce. Without the appropriate flow of natural gas to our plants, we may not be able to run at desired production levels or at all. Therefore, our business is dependent on the continuing availability of rail, highway and related infrastructure. Any disruptions in this infrastructure network, whether caused by labor difficulties, earthquakes, storms, other natural disasters, human error or malfeasance or other reasons, could have a material adverse effect on our business. We rely upon third-parties to maintain the rail lines from our plants to the national rail network, and any failure on their part to maintain the lines could impede our delivery of products, impose additional costs on us and could have a material adverse effect on our business, results of operations and financial condition.
In addition, lack of this infrastructure prevents the use of ethanol in certain areas where there might otherwise be demand and results in excess ethanol supply in areas with more established ethanol infrastructure, depressing ethanol prices in those areas. In order for the ethanol industry to grow and expand into additional markets and for our ethanol to be sold in these new markets, there must be substantial development of infrastructure including:
|
· |
additional rail capacity; |
|
· |
additional storage facilities for ethanol; |
|
· |
increases in truck fleets capable of transporting ethanol within localized markets; |
|
· |
expansion of refining and blending facilities to handle ethanol; and |
|
· |
growth in service stations equipped to handle ethanol fuels. |
The substantial investments that will be required for these infrastructure changes and expansions may not be made on a timely basis, if at all, and decisions regarding these infrastructure improvements are outside of our control. Significant delay or failure to improve the infrastructure that facilitates the distribution could curtail more widespread ethanol demand or reduce prices for our products in certain areas, which would have a material adverse effect on our business, results of operations or financial condition.
24
Rail logistical problems may result in delays in shipments of our products which could negatively impact our financial performance.
There has been an increase in rail traffic congestion throughout the U.S. primarily due to the increase in cargo trains carrying shale oil. From time to time, periodic high demand and unusually adverse weather conditions may cause rail congestion resulting in rail delays and rail logistical problems. Although we have not been materially affected by prior rail congestion period, future periods of congestion may affect our ability to operate our plants at full capacity due to ethanol storage capacity constraints, which in turn could have a negative effect on our financial performance.
We depend on our management and key employees, and the loss of these relationships could negatively impact our ability to operate profitably.
Our success depends in part on our ability to attract and retain competent personnel. For our ethanol plants, we must hire qualified managers, operations personnel, accounting staff and others, which can be challenging in a rural community. Further, our current employees may decide to end their employment with us. Competition for employees in the ethanol industry is intense, and we may not be able to attract and retain qualified personnel.
We are highly dependent on our management team to operate our ethanol plants. We may not be able to replace these individuals should they decide to cease their employment with us, or if they become unavailable for any other reason. Any loss of these officers and key employees may prevent us from operating the ethanol plants profitably and could decrease the value of our units.
Technology in our industry evolves rapidly, potentially causing our plants to become obsolete, and we must continue to enhance the technology of our plants or our business may suffer.
We expect that technological advances in the processes and procedures for processing ethanol will continue to occur. It is possible that those advances could make the processes and procedures that we utilize at our ethanol plants less efficient or obsolete. These advances could also allow our competitors to produce ethanol at a lower cost than we are able. If we are unable to adopt or incorporate technological advances, our ethanol production methods and processes could be less efficient than those of our competitors, which could cause our ethanol plants to become uncompetitive.
Ethanol production methods are continually advancing. Most ethanol produced in the U.S. is currently produced from corn and other raw grains, such as milo or sorghum - especially in the Midwest. The current trend in ethanol production research is to develop an efficient method of producing ethanol from cellulose-based biomass such as agricultural waste, forest residue and municipal solid waste. This trend is driven by the fact that cellulose-based biomass is generally cheaper than corn and producing ethanol from cellulose-based biomass would create opportunities to produce ethanol in areas that are unable to grow corn. Another trend in ethanol production research is to produce ethanol through a chemical or thermal process, rather than a fermentation process, thereby significantly increasing the ethanol yield per pound of feedstock. Although current technology does not allow these production methods to be financially competitive, new technologies may develop that would allow these methods to become viable means of ethanol production in the future. If we are unable to adopt or incorporate these advances into our operations, our cost of producing ethanol could be significantly higher than those of our competitors, which could make our ethanol plants obsolete. Modifying our plants to use the new inputs and technologies would likely require material investment.
Competition from the advancement of alternative fuels may lessen the demand for ethanol.
Alternative fuels, gasoline oxygenates and ethanol production methods are continually under development. A number of automotive, industrial and power generation manufacturers are developing alternative clean power systems using fuel cells, plug-in hybrids or clean burning gaseous fuels. Like ethanol, these emerging technologies offer an option to address worldwide energy costs, the long-term availability of petroleum reserves and environmental concerns. If these alternative technologies continue to expand and gain broad acceptance and become readily available to consumers for motor vehicle use, we may not be able to compete effectively. This additional competition could reduce the demand for ethanol, resulting in lower ethanol prices that might adversely affect our results of operations and financial condition.
25
Our sales will decline, and our business will be materially harmed if our third party marketers do not effectively market or sell the ethanol, distillers’ grains and corn oil we produce or if there is a significant reduction or delay in orders from our marketers.
We have entered into agreements with a third parties to market our supply of ethanol, distillers’ grains and corn oil. Our marketers are independent businesses that we do not control. We cannot be certain that our marketers will market or sell our ethanol, distillers’ grains and corn oil effectively. Our agreements with our marketers do not contain requirements that a certain percentage of sales are of our products, nor do the agreements restrict the marketer’s ability to choose alternative sources for ethanol, distillers’ grains or corn oil.
Our success in achieving revenue from the sale of ethanol, distillers’ grains and corn oil will depend upon the continued viability and financial stability of our marketers. Our marketers may choose to devote their efforts to other producers or reduce or fail to devote the necessary resources to provide effective sales and marketing support of our products. We believe that our financial success will continue to depend in large part upon the success of our marketers in operating their businesses.
If our marketers breach their contracts or do not have the ability, for financial or other reasons, to market all of the ethanol we produce or to market the co-products produced at our plants, we may not have any readily available alternative means to sell our products. Our lack of a sales force and reliance on these third parties to sell and market most of our products may place us at a competitive disadvantage. Our failure to sell all of our ethanol and co-products may result in lower revenues and reduced profitability.
We are exposed to credit risk resulting from non-payment by significant customers.
We have a concentration of credit risk because GFE sells all of the ethanol, distillers’ grains, and corn oil produced to two customers and HLBE sells all of its ethanol, distillers’ grains, and corn oil produced to three customers. Although we typically receive payments timely and within the terms of our marketing agreements with these customers, we continually monitor this credit risk exposure. These customers accounted for approximately 97%, 99% and 99% of GFE’s revenue for the years ended October 31, 2016, 2015, and 2014, respectively and approximately 97% and 89% of GFE’s outstanding accounts receivable balance at October 31, 2016 and 2015, respectively. At HLBE, these customers accounted for approximately 94%, 97% and 96% of HLBE’s revenue for the years ended October 31, 2016, 2015, and 2014, respectively and approximately 95% and 97% of HLBE’s outstanding accounts receivable balance at October 31, 2016 and 2015, respectively. The inability of a third party to pay our accounts receivable may cause us to experience losses and may adversely affect our liquidity and our ability to make our payments when due.
Consumer resistance to the use of ethanol based on the belief that ethanol is expensive, adds to air pollution, harms engines and/or takes more energy to produce than it contributes may affect the demand for ethanol.
Certain individuals believe that the use of ethanol will have a negative impact on gasoline prices at the pump. Some also believe that ethanol adds to air pollution and harms car and truck engines. Still other consumers believe that the process of producing ethanol actually uses more fossil energy, such as oil and natural gas, than the amount of energy that is produced. These consumer beliefs could potentially be wide-spread and may be increasing as a result of recent efforts to increase the allowable percentage of ethanol that may be blended for use in conventional automobiles. If consumers choose not to buy ethanol based on these beliefs, it would affect the demand for the ethanol we produce which could negatively affect our profitability and financial condition.
26
Risks Related to Regulation and Governmental Action
Our failure to comply with existing or future regulatory requirements could have a material adverse effect on our business, financial condition and results of operations.
We are subject to various federal, state and local environmental laws and regulations, including those relating to the discharge of materials into the air, water and ground. Certain aspects of our operations require environmental permits and controls to prevent and reduce air and water pollution, and these permits are subject to modification, renewal and revocation by issuing authorities including the Minnesota Pollution Control Agency. We could incur substantial costs, including cleanup costs, fines and civil or criminal sanctions and third-party claims for property damage and personal injury as a result of violations of or liabilities under environmental laws or non-compliance with environmental permits. We could also incur substantial costs and experience increased operating expenses as a result of operational changes to comply with environmental laws, regulations and permits. We have previously incurred substantial costs relating to our air emissions permit and expect additional costs relating to this permit in the future.
In connection with HLBE’s RTO replacement project, it has filed an application for a major amendment of its air emissions permit with the MPCA to allow for the replacement under its current permit. However, due to backlog in the permit approval process, on April 27, 2016, HLBE entered into a compliance agreement with the MPCA. Under the compliance agreement, the MPCA allowed HLBE to proceed with replacement of its RTO prior to receiving approval of its major amendment application provided HLBE operates the new RTO in compliance with its existing air emissions permit and completes certain green initiatives at the facility, which its completed before the end of fiscal year 2016. Although HLBE doesnt anticipate significant changes to its air permit, the MPCA’s approval of its major amendment application could impose additional compliance requirements on HLBE, which could be significant.
Further, environmental laws and regulations are subject to substantial change. We cannot predict what material impact, if any, these changes in laws or regulations might have on our business. Future changes in regulations or enforcement policies could impose more stringent requirements on us, compliance with which could require additional capital expenditures, increase our operating costs or otherwise adversely affect our business. These changes may also relax requirements that could prove beneficial to our competitors and thus adversely affect our business. In addition, regulations of the EPA and the MPCA depend heavily on administrative interpretations. We cannot assure you that future interpretations made by regulatory authorities, with possible retroactive effect, will not adversely affect our business, financial condition and results of operations. Failure to comply with existing or future regulatory requirements could have a material adverse effect on our business, financial condition and results of operations.
Because federal and state regulation heavily influence the supply of and demand for ethanol, changes in government regulation that adversely affect demand or supply will have a material adverse effect on our business.
Various federal and state laws, regulations and programs impact the supply of and demand for ethanol. We believe the most important of these is the RFS, which sets minimum national volume standards for use of cellulosic, biomass-based diesel and total advanced renewable fuels. The RFS helps support a market for ethanol that might disappear without this incentive. In the case of the RFS, while it creates a demand for ethanol, the existence of specific categories of renewable fuels also creates a demand for these types of renewable fuels and will likely provide an incentive for companies to further develop these products to capitalize on that demand. In these circumstances, the RFS may also reduce demand for ethanol in favor of the renewable fuels for which specific categories exist.
By statute, the RFS requires that 16.55 billion gallons be sold or dispensed in 2013, increasing to 36.0 billion gallons by 2022, but caps the amount of corn-based ethanol that can be used to meet the renewable fuels blending requirements at 15.0 billion gallons for 2015 and thereafter. On November 23, 2016, the EPA announced final RVO requirements for the RFS for calendar year 2017. The corn-based biofuel requirement of 15.0 billion gallons is an increase from the 14.8 billion gallons in the rule proposed in May 2016. This final rule achieves the statutory requirement level as originally set by Congress when the RFS was enacted. However, opponents of ethanol such as large oil companies will likely continue their efforts to repeal or reduce the RFS through lawsuits or lobbying of Congress. Successful reduction or repeal of the blending requirements of the RFS could result in a significant decrease in ethanol demand. Moreover, current ethanol production capacity exceeds the 2017 RVO standard which can be satisfied by corn-based ethanol. Reduction of blending requirements could reduce the demand for and price of ethanol. If demand for ethanol decreases, it could materially adversely affect our business, results of operations and financial condition.
27
The EPA imposed E10 “blend wall” if not overcome will have an adverse effect on demand for ethanol.
We believe that the E10 “blend wall” is one of the most critical governmental policies currently facing the ethanol industry. The “blend wall” issue arises because of several conflicting requirements. First, the renewable fuels standards dictate a continuing increase in the amount of ethanol blended into the national gasoline supply. Second, the EPA mandates a limit of 10% ethanol inclusion in non-flex fuel vehicles, and the E85 vehicle marketplace is struggling to grow due to lacking infrastructure. The EPA policy of 10% and the RFS increasing blend rate are at odds, which is sometimes referred to as the “blend wall.” While the issue is being considered by the EPA, there have been no regulatory changes that would reconcile the conflicting requirements. In 2011, the EPA allowed the use of E15, gasoline which is blended at a rate of 15% ethanol and 85% gasoline, in vehicles manufactured in the model year 2001 and later. Management believes that many gasoline retailers will refuse to provide E15 due to the fact that not all standard vehicles will be allowed to use E15 and due to the labeling requirements the EPA may impose. As a result, the approval of E15 may not significantly increase demand for ethanol.
The California Low Carbon Fuel Standard may decrease demand for corn based ethanol which could negatively impact our profitability.
California passed a Low Carbon Fuels Standard (“LCFS”) which requires that renewable fuels used in California must accomplish certain reductions in greenhouse gases which reductions are measured using a lifecycle analysis. Management believes that these regulations could preclude corn based ethanol produced in the Midwest from being used in California. California represents a significant ethanol demand market. If the ethanol industry is unable to supply corn based ethanol to California, it could significantly reduce demand for the ethanol we produce. This could result in a reduction of our revenues and negatively impact our ability to profitably operate the ethanol plant.
Meeting the requirements of evolving environmental, health and safety laws and regulations, and in particular those related to climate change, could adversely affect our financial performance.
When the EPA released its final regulations on RFS, these regulations grandfathered our plants at their current production capacity for the generation of RINs for compliance with RFS. Any expansion of our plants beyond the grandfathered volumes must meet a threshold of a 20% reduction in GHG emissions from a 2005 baseline measurement for the ethanol to be eligible to generate RINS for compliance with the RFS mandate.
In 2015, our plants were awarded “efficient producer” status under the pathway petition program for the non-grandfathered volumes of ethanol produced at our plants. Pursuant to the award approval, HLBE and GFE are only authorized to generate RINs for each plant’s non-grandfathered volumes if each plant can demonstrate that all ethanol produced at the plant during an averaging period (defined as the prior 365 days or the number of days since the date EPA efficient producer pathway approval) meets the 20% GHG reduction requirement.
Although we believe GFE and HLBE will be able to maintain continuous compliance with the 20% reduction in GHG emissions requirement as presently operated, there is no guarantee that we will not have to install carbon dioxide mitigation equipment or take other steps unknown to us at this time in order to comply with the efficient producer requirements or other future law or regulation. Continued compliance with the efficient producer GHG reduction requirements or compliance with future law or regulation of carbon dioxide, could be costly and may prevent us from operating our plants as profitably, which may have an adverse impact on our operations, cash flows and financial position.
28
If we fail to comply with the 20% reduction in GHG emissions requirement, we will not be able to generate RINs for our non-grandfathered volumes of ethanol, which could adversely affect our operating margins.
We expect that nearly all of the anticipated demand for our ethanol production will be by customers obligated to comply with the RFS. The EPA's approval of our efficient producer petitions requires that the plant demonstrates continuous compliance with the 20% reduction in GHG emissions for all volumes of ethanol produced, not just non-grandfathered volumes of ethanol. If we cannot show continuous compliance with the requirement for all volumes of ethanol, we will not be able issue RINs for the non-grandfathered volumes of ethanol produced. If our ethanol production does not meet the requirements for RIN generation as administered by the EPA, we may be required to sell those gallons of ethanol without RINs at lower prices in the domestic market to compensate for the lack of RINs or sell these gallons of ethanol in the export market where RINs are not required, which could adversely affect our results of operations, cash flows and financial condition.
Risks Related to the Units
There is no public market for our units and no public market is expected to develop.
There is no established public trading market for our units, and we do not expect one to develop in the foreseeable future. We have established through FNC Ag Stock, LLC, a Unit Trading Bulletin Board, a private online matching service, in order to facilitate trading among our members. The Unit Trading Bulletin Board has been designed to comply with federal tax laws and IRS regulations establishing a “qualified matching service,” as well as state and federal securities laws. The Unit Trading Bulletin Board does not automatically affect matches between potential sellers and buyers and it is the sole responsibility of sellers and buyers to contact each other to make a determination as to whether an agreement to transfer units may be reached. There are detailed timelines that must be followed under the Unit Trading Bulletin Board Rules and Procedures with respect to offers and sales of membership units. All transactions must comply with the Unit Trading Bulletin Board Rules, our member control agreement, and are subject to approval by our board of governors. As a result, units held by our members may not be easily resold and members may be required to hold their units indefinitely. Even if members are able to resell our units, the price may be less than the members’ investment in the units or may otherwise be unattractive to the member.
There are significant restrictions on the transfer of our units.
To protect our status as a partnership for tax purposes and to assure that no public trading market in our units develops, our units are subject to significant restrictions on transfer and transfers are subject to approval by our board of governors. All transfers of units must comply with the transfer provisions of our member control agreement and the unit transfer policy adopted by our board of governors. Our board of governors will not approve transfers which could cause us to lose our tax status or violate federal or state securities laws. As a result of the provisions of our member control agreement, members may not be able to transfer their units and may be required to assume the risks of the investment for an indefinite period of time.
There is no assurance that we will be able to make distributions to our unit holders, which means that holders could receive little or no return on their investment.
Distributions of our net cash flow may be made at the sole discretion of our board of governors, subject to the provisions of the Minnesota Limited Liability Company Act, our member control agreement and restrictions imposed by lender under our credit facilities. Our credit facilities currently limit our ability to make distributions to our members. If our financial performance and loan covenants permit, we expect to make cash distributions at times and in amounts that will permit our members to make income tax payments, along with distributions in excess of these amounts. However, our board may elect to retain cash for operating purposes, debt retirement, plant improvements or expansion. Although we have made distributions in the past, there is no guarantee that we will be in a financial position to pay distributions in the future, that the terms of our credit facility will allow us to make distributions to our members, or that distributions, if any, will be at times or in amounts to permit our members to make income tax payments. Consequently, members may receive little or no return on their investment in the units.
29
Risks Related to Tax Issues in a Limited Liability Company
EACH UNIT HOLDER SHOULD CONSULT THE INVESTOR’S OWN TAX ADVISOR WITH RESPECT TO THE FEDERAL AND STATE TAX CONSEQUENCES OF AN INVESTMENT IN GRANITE FALLS ENERGY, LLC AND ITS IMPACT ON THE INVESTOR’S TAX REPORTING OBLIGATIONS AND LIABILITY.
If we are not taxed as a partnership, we will pay taxes on all of our net income and you will be taxed on any earnings we distribute, and this will reduce the amount of cash available for distributions to holders of our units.
We consider Granite Falls Energy, LLC to be a partnership for federal income tax purposes. This means that we will not pay any federal income tax, and our members will pay tax on their share of our net income. If we are unable to maintain our partnership tax treatment or qualify for partnership taxation for whatever reason, then we may be taxed as a corporation. We cannot assure you that we will be able to maintain our partnership tax classification. For example, there might be changes in the law or our company that would cause us to be reclassified as a corporation. As a corporation, we would be taxed on our taxable income at rates of up to 35% for federal income tax purposes. Further, distributions would be treated as ordinary dividend income to our unit holders to the extent of our earnings and profits. These distributions would not be deductible by us, thus resulting in double taxation of our earnings and profits. This would also reduce the amount of cash we may have available for distributions.
Your tax liability from your allocated share of our taxable income may exceed any cash distributions you receive, which means that you may have to satisfy this tax liability with your personal funds.
As a partnership for federal income tax purposes, all of our profits and losses “pass-through” to our unit holders. You must pay tax on your allocated share of our taxable income every year. You may incur tax liabilities from allocations of taxable income for a particular year or in the aggregate that exceed any cash distributions you receive in that year or in the aggregate. This may occur because of various factors, including but not limited to, accounting methodology, the specific tax rates you face, and payment obligations and other debt covenants that restrict our ability to pay cash distributions. If this occurs, you may have to pay income tax on your allocated share of our taxable income with your own personal funds.
You may not be able to fully deduct your share of our losses or your interest expense.
It is likely that your interest in us will be treated as a “passive activity” for federal income tax purposes. In the case of unit holders who are individuals or personal services corporations, this means that a unit holder’s share of any loss incurred by us will be deductible only against the holder’s income or gains from other passive activities, e.g., S corporations and partnerships that conduct a business in which the holder is not a material participant. Some closely held C corporations have more favorable passive loss limitations. Passive activity losses that are disallowed in any taxable year are suspended and may be carried forward and used as an offset against passive activity income in future years. Upon disposition of a taxpayer’s entire interest in a passive activity to an unrelated person in a taxable transaction, suspended losses with respect to that activity may then be deducted.
Interest paid on any borrowings incurred to purchase units may not be deductible in whole or in part because the interest must be aggregated with other items of income and loss that the unit holder has independently experienced from passive activities and subjected to limitations on passive activity losses.
Deductibility of capital losses that we incur and pass through to you or that you incur upon disposition of units may be limited. Capital losses are deductible only to the extent of capital gains plus, in the case of non-corporate taxpayers, the excess may be used to offset up to $3,000 of ordinary income. If a non-corporate taxpayer cannot fully utilize a capital loss because of this limitation, the unused loss may be carried forward and used in future years subject to the same limitations in the future years.
30
You may be subject to federal alternative minimum tax
Individual taxpayers are subject to an “alternative minimum tax” if that tax exceeds the individual’s regular income tax. For alternative minimum tax purposes, an individual’s adjusted gross income is increased by items of tax preference. We may generate such preference items. Accordingly, preference items from our operations together with other preference items you may have may cause or increase an alternative minimum tax to a unit holder. You are encouraged and expected to consult with your individual tax advisor to analyze and determine the effect on your individual tax situation of the alternative minimum taxable income you may be allocated, particularly in the early years of our operations.
Preparation of your tax returns may be complicated and expensive.
The tax treatment of limited liability companies and the rules regarding partnership allocations are complex. We will file a partnership income tax return and will furnish each unit holder with a Schedule K-1 that sets forth our determination of that unit holder’s allocable share of income, gains, losses and deductions. In addition to U.S. federal income taxes, unit holders will likely be subject to other taxes, such as state and local taxes, that are imposed by various jurisdictions. It is the responsibility of each unit holder to file all applicable federal, state and local tax returns and pay all applicable taxes. You may wish to engage a tax professional to assist you in preparing your tax returns and this could be costly to you.
Any audit of our tax returns resulting in adjustments could result in additional tax liability to you.
The IRS may audit our tax returns and may disagree with the positions that we take on our returns or any Schedule K-1. If any of the information on our partnership tax return or a Schedule K-1 is successfully challenged by the IRS, the character and amount of items of income, gains, losses, deductions or credits in a manner allocable to some or all our unit holders may change in a manner that adversely affects those unit holders. This could result in adjustments on unit holders’ tax returns and in additional tax liabilities, penalties and interest to you. An audit of our tax returns could lead to separate audits of your personal tax returns, especially if adjustments are required.
ITEM 1B.UNRESOLVED STAFF COMMENTS
None.
Our Granite Falls ethanol plant is located approximately three miles east of Granite Falls, Minnesota in Chippewa County at the junction of Highways 212 and 23. The plant’s address is 15045 Highway 23 SE, Granite Falls, Minnesota. The ethanol plant sits on approximately 216 acres. This site includes an administrative building which serves as our headquarters. The site also includes corn, ethanol, and distillers’ grains handling facilities. All of our tangible and intangible property, real and personal, serves as the collateral for our credit facilities with United FCS, PCA.
HLBE’s ethanol plant is sited on approximately 216 acres of land located near Heron Lake, Minnesota. The site includes corn, coal, ethanol, and distillers’ grains storage and handling facilities. Located on these 216 acres is an administration building that serves as HLBE’s headquarters. The plant’s address is 91246 390th Avenue, Heron Lake, Minnesota 56137-3175. All of HLBE’s real property is subject to mortgages in favor of AgStar as security for loan obligations.
HLBE’s majority owned subsidiary, Agrinatural, property consists of 187 miles of distribution main pipelines and service pipelines, together with the associated easement and land rights, a town border station, meters and regulators, office and other equipment and construction in process. All of Agrinatural’s real property and assets are subject to mortgages in favor of HLBE as security for loan obligations owed to HLBE.
HLBE’s and Agrinatural’s credit facilities are discussed in more detail under “ITEM 7. MANAGEMENT’S DISCU.S.SION AND ANALYSIS OF FINANCIAL CONDITION AND RESULTS OF OPERATIONS - Credit Arrangements”.
31
From time to time in the ordinary course of business, Granite Falls Energy, LLC or its subsidiaries may be named as a defendant in legal proceedings related to various issues, including workers’ compensation claims, tort claims, or contractual disputes. We are not currently involved in any material legal proceedings.
ITEM 4.MINE SAFETY DISCLOSURES
None.
ITEM 5. MARKET FOR REGISTRANT’S COMMON EQUITY, RELATED STOCKHOLDER MATTERS AND ISSUER PURCHASES OF EQUITY SECURITIES.
Market Information
There is no public trading market for our units. However, GFE has established an online unit trading bulletin board (“QMS”) through FNC Ag Stock, LLC, in order to facilitate trading in our units. The QMS has been designed to comply with federal tax laws and IRS regulations establishing a “qualified matching service,” as well as state and federal securities laws. The QMS consists of an electronic bulletin board that provides a list of interested buyers with a list of interested sellers, along with their non-firm price quotes. The QMS does not automatically affect matches between potential sellers and buyers and it is the sole responsibility of sellers and buyers to contact each other to make a determination as to whether an agreement to transfer units may be reached. We do not become involved in any purchase or sale negotiations arising from the QMS and have no role in effecting the transactions beyond approval, as required under our member control agreement, and the issuance of new certificates. We do not give advice regarding the merits or shortcomings of any particular transaction. We do not receive, transfer or hold funds or securities as an incident of operating the QMS. We do not receive any compensation for creating or maintaining the QMS. In advertising the QMS, we do not characterize Granite Falls Energy as being a broker or dealer or an exchange. We do not use the QMS to offer to buy or sell securities other than in compliance with securities laws, including any applicable registration requirements.
There are detailed timelines that must be followed under the QMS rules and procedures with respect to offers and sales of membership units. All transactions must comply with the QMS rules and procedures, our member control agreement, and are subject to approval by our board of governors.
So long as we remain a publicly reporting company, information about the Company will be publicly available through the SEC’s filing system. However, if at any time we cease to be a publicly reporting company, we anticipate continuing to make information about the Company publicly available on our website in order to continue operating the QMS.
The following table contains historical information by fiscal quarter for the past two fiscal years regarding the actual unit transactions that were completed by our unit-holders during the periods specified. We believe this most accurately represents the current trading value of the Company’s units. The information was compiled by reviewing the completed unit transfers that occurred on our qualified matching service bulletin board during the quarters indicated.
|
Fiscal Quarter |
|
Low Per Unit Price |
|
High Per Unit Price |
|
Total Units Traded |
||
|
2015 1st |
|
$ |
3,375 |
|
$ |
4,060 |
|
38 |
|
2015 2nd |
|
$ |
3,250 |
|
$ |
3,400 |
|
6 |
|
2015 3rd |
|
$ |
2,500 |
|
$ |
3,000 |
|
147 |
|
2015 4th |
|
$ |
— |
|
$ |
— |
|
— |
|
2016 1st |
|
$ |
3,500 |
|
$ |
3,601 |
|
30 |
|
2016 2nd |
|
$ |
— |
|
$ |
— |
|
— |
|
2016 3rd |
|
$ |
2,500 |
|
$ |
3,475 |
|
47 |
|
2016 4th |
|
$ |
2,500 |
|
$ |
2,575 |
|
59 |
32
As a limited liability company, we are required to restrict the transfers of our membership units in order to preserve our partnership tax status. Our membership units may not be traded on any established securities market or readily traded on a secondary market (or the substantial equivalent thereof). All transfers are subject to a determination that the transfer will not cause Granite Falls Energy to be deemed a publicly traded partnership.
Issuer Repurchases of Equity Securities
We did not make any repurchases of our units during fiscal year 2016.
Holders of Record
As of January 30, 2017, there were approximately 979 holders of record of our membership units.
As of October 31, 2016 and January 30, 2017, there were no outstanding options or warrants to purchase, or securities convertible for or into, our units.
Distributions
Granite Falls Energy
Distributions by GFE to its unit holders are in proportion to the number of units held by each unit holder. A unit holder’s distribution is determined by multiplying the number of units by distribution per unit declared. GFE’s board of governors has complete discretion over the timing and amount of distributions to our unit holders. However, GFE’s credit facility with United FCS, PCA provides that we may not declare any distributions other than, for each fiscal year, one or more distributions up to an aggregate of 100% of the net profit (determined according to GAAP) for such fiscal year; provided that the we are and will remain in compliance with all of the covenants, terms and conditions of the credit facility. If our financial performance and loan covenants permit, we expect to make future cash distributions at times and in amounts that will permit our members to make income tax payments, along with distributions in excess of these amounts. Cash distributions are not assured, however, and in the future, we may not be in a position to make distributions. Under Minnesota law, we cannot make a distribution to a member if, after the distribution, we would not be able to pay our debts as they become due or our liabilities, excluding liabilities to our members on account of their capital contributions, would exceed our assets.
Below is a table representing the cash distributions declared or paid to the members of Granite Falls Energy during the fiscal years ended October 31, 2016, 2015, and 2014, and subsequent to our fiscal year ended October 31, 2016. Based on the covenants discussed above, all of the below distributions were approved by our lender prior to distribution.
|
|
|
|
|
|
Distribution |
|
Distributed to GFE |
|
|
|
Date Declared to GFE Members of Record: |
|
Total Distribution |
|
Per Unit |
|
Members on: |
|
||
|
December 22, 2016 |
|
$ |
11,171,190 |
|
$ |
365 |
|
January 2017 |
|
|
December 17, 2015 |
|
$ |
9,640,886 |
|
$ |
315 |
|
January 25, 2016 |
|
|
December 18, 2014 |
|
$ |
32,136,300 |
|
$ |
1,050 |
|
January 19, 2015 |
|
|
December 19, 2013 |
|
$ |
5,509,080 |
|
$ |
180 |
|
December 31, 2013 |
|
Heron Lake BioEnergy
Distributions by HLBE to its unit holders are in proportion to the number of units held by each unit holder. A unit holder's distribution is determined by multiplying the number of units by distribution per unit declared. HLBE’s board of governors has complete discretion over the timing and amount of distributions to its unit holders. Distributions are restricted by certain loan covenants in its credit facility with AgStar. Additionally, under Minnesota law, HLBE cannot make a distribution to a member if, after the distribution, its would not be able to pay its debts as they become due or its liabilities, excluding liabilities to its members on account of their capital contributions, would exceed its assets.
33
Below is a table representing the cash distributions declared or paid to HLBE’s members, as well as GFE’s share of the same, during the fiscal years ended October 31, 2016, 2015, and 2014. As of October 31, 2016 and January 30, 2017, GFE owns 39,420,949 Class A membership units and 15,000,000 Class B units of HLBE, or approximately 50.6% of the outstanding membership units of HLBE. Based on the covenants discussed above, all of the below distributions were approved by HLBE’s lender prior to distribution.
|
|
|
|
|
|
Distribution |
|
Distributed to HLBE |
|
Total Distribution |
||
|
Date Declared to HLBE Members of Record: |
|
Total Distribution |
|
Per Unit |
|
Members on: |
|
to GFE: |
|||
|
December 17, 2015 |
|
$ |
3,896,605 |
|
$ |
0.05 |
|
January 25, 2016 |
|
$ |
1,971,047 |
|
December 18, 2014 |
|
$ |
9,351,853 |
|
$ |
0.12 |
|
January 19, 2015 |
|
$ |
4,730,514 |
Unregistered Sales of Equity Securities
The Company had no unregistered sales of securities during fiscal year 2016.
Securities Authorized for Issuance Under Equity Compensation Plans
As of the date of this annual report, we had no “equity compensation plans” (including individual equity compensation arrangements) under which any of our equity securities are authorized for issuance.
Performance Graph
The following graph shows a comparison of cumulative total member return since October 31, 2011, calculated on a dividend reinvested basis, for the Company, the NASDAQ Composite Index (the “NASDAQ”) and an index of other companies that have the same SIC code as the Company (the “SIC Code Index”). The graph assumes $100 was invested in each of the Company’s units, the NASDAQ, and the Industry Index on October 31, 2011. Data points on the graph are annual. Note that historic stock price performance is not necessarily indicative of future unit price performance.
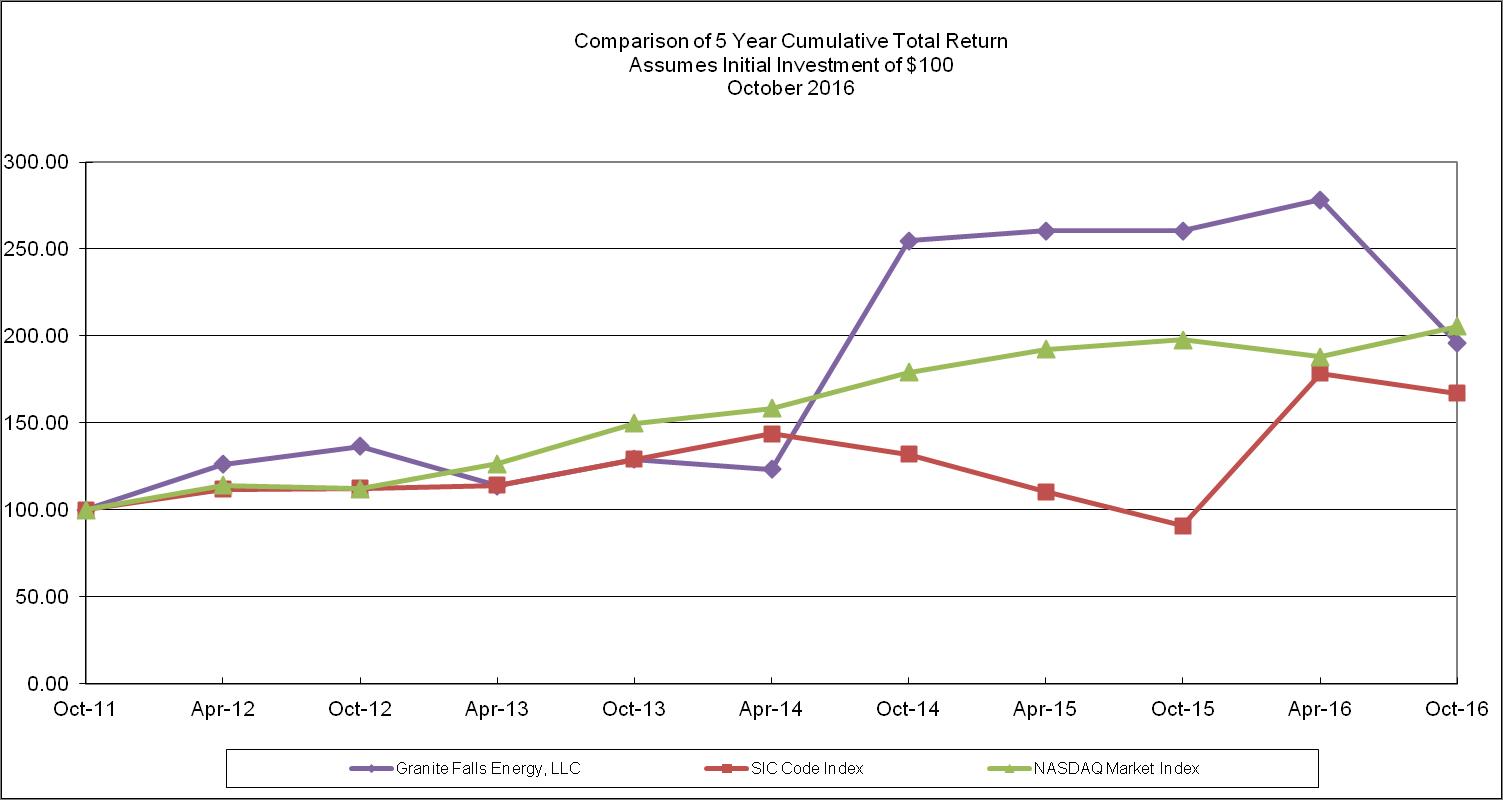
Pursuant to the rules and regulations of the Securities and Exchange Commission, the performance graph and the information set forth therein shall not be deemed to be filed for purposes of Section 18 of the Securities Exchange Act of 1934, and shall not be deemed to be incorporated by reference in any filing under the Securities Act of 1933, as amended, or the Exchange Act, except as shall be expressly set forth by specific reference in such a filing.
34
ITEM 6. SELECTED FINANCIAL DATA
The following table presents selected consolidated financial and operating data as of the dates and for the periods indicated. Due to the acquisition of a majority ownership of HLBE on July 31, 2013 (through the acquisition of Project Viking), the following information includes consolidated financial and operating data for the fiscal years 2016, 2015, 2014, and the fourth quarter of fiscal year 2013 of HLBE. The selected consolidated balance sheet financial data as of October 31, 2016 and 2015 and the selected consolidated statement of operations data and other financial data for each of the years in the three-year period ended October 31, 2016 have been derived from the audited consolidated financial statements included elsewhere in this Form 10-K. The selected consolidated balance sheet financial data as of October 31, 2014, 2013 and 2012 and the selected consolidated statement of operations data and other financial data for the years ended October 31, 2013 and 2012 have been derived from our audited consolidated financial statements that are not included in this Form 10-K. The consolidated financial statements consolidate the operating results and financial position of GFE and its wholly owned subsidiary, Project Viking, which owns 50.6% of HLBE at October 31, 2016. The remaining approximately 49.4% ownership of HLBE is included in the consolidated financial statements as a non-controlling interest. This selected consolidated financial data should be read in conjunction with “ITEM 7 - MANAGEMENT’S DISCUSSION AND ANALYSIS OF FINANCIAL CONDITION AND RESULTS OF OPERATIONS” and the consolidated financial statements and the accompanying notes included elsewhere in this Annual Report on Form 10-K. Among other things, those financial statements include more detailed information regarding the basis of presentation for the following consolidated financial data (amounts in thousands, except per unit data and unless context otherwise requires).
|
Statement of Operations Data for the |
|
|
|
|
|
|
|
|
|
|
|
|
|
|
|
|
|
fiscal year ended October 31, |
|
2016 |
|
2015 |
|
2014 |
|
2013 |
|
2012 |
|
|||||
|
Revenues |
|
$ |
215,526 |
|
$ |
231,255 |
|
$ |
300,955 |
|
$ |
224,101 |
|
$ |
175,162 |
|
|
Cost of Goods Sold |
|
|
198,627 |
|
|
208,654 |
|
|
237,434 |
|
|
210,078 |
|
|
172,708 |
|
|
Gross Profit |
|
|
16,899 |
|
|
22,601 |
|
|
63,521 |
|
|
14,023 |
|
|
2,454 |
|
|
Operating Expenses |
|
|
5,326 |
|
|
5,176 |
|
|
5,151 |
|
|
2,989 |
|
|
2,450 |
|
|
Operating Income |
|
|
11,573 |
|
|
17,425 |
|
|
58,370 |
|
|
11,034 |
|
|
4 |
|
|
Other Income (Expense) |
|
|
(345) |
|
|
(478) |
|
|
720 |
|
|
(476) |
|
|
156 |
|
|
Net Income |
|
|
11,228 |
|
|
16,947 |
|
|
59,090 |
|
|
10,558 |
|
|
160 |
|
|
Net Income Attributable to Non-controlling Interest |
|
|
(2,505) |
|
|
(3,360) |
|
|
(10,317) |
|
|
(527) |
|
|
— |
|
|
Net Income Attributable to Granite Falls Energy, LLC |
|
$ |
8,723 |
|
$ |
13,587 |
|
$ |
48,773 |
|
$ |
10,031 |
|
$ |
160 |
|
|
Amounts Attributable to Granite Falls Energy, LLC |
|
|
|
|
|
|
|
|
|
|
|
|
|
|
|
|
|
Weighted Average Units Outstanding - Basic and Diluted |
|
|
30,606 |
|
|
30,606 |
|
|
30,606 |
|
|
30,606 |
|
|
30,656 |
|
|
Net Income Per Unit - Basic and Diluted |
|
$ |
285.00 |
|
$ |
443.92 |
|
$ |
1,593.61 |
|
$ |
327.78 |
|
$ |
5.25 |
|
|
Distributions Per Unit |
|
$ |
315.00 |
|
$ |
1,050.00 |
|
$ |
180.00 |
|
$ |
— |
|
$ |
— |
|
|
Balance Sheet Data at October 31, |
|
2016 |
|
2015 |
|
2014 |
|
2013 |
|
2012 |
|
|||||
|
Current Assets |
|
$ |
40,349 |
|
$ |
35,513 |
|
$ |
49,402 |
|
$ |
21,470 |
|
$ |
20,715 |
|
|
Property and Equipment, net |
|
|
78,968 |
|
|
84,304 |
|
|
88,028 |
|
|
88,809 |
|
|
40,418 |
|
|
Goodwill |
|
|
1,372 |
|
|
1,372 |
|
|
1,372 |
|
|
1,372 |
|
|
— |
|
|
Other Assets |
|
|
781 |
|
|
821 |
|
|
860 |
|
|
1,022 |
|
|
— |
|
|
Total Assets |
|
$ |
121,470 |
|
$ |
122,011 |
|
$ |
139,662 |
|
$ |
112,673 |
|
$ |
61,133 |
|
|
|
|
|
|
|
|
|
|
|
|
|
|
|
|
|
|
|
|
Current Liabilities |
|
|
14,337 |
|
|
9,139 |
|
|
11,580 |
|
|
11,323 |
|
|
6,003 |
|
|
Long-Term Debt, less current portion |
|
|
1,393 |
|
|
6,712 |
|
|
2,112 |
|
|
32,982 |
|
|
5,275 |
|
|
Members' Equity Attributable to Granite Falls Energy, LLC |
|
|
83,685 |
|
|
84,603 |
|
|
103,152 |
|
|
59,887 |
|
|
49,855 |
|
|
Non-controlling interest |
|
|
22,056 |
|
|
21,557 |
|
|
22,818 |
|
|
8,481 |
|
|
— |
|
|
Total Members' Equity |
|
|
105,741 |
|
|
106,160 |
|
|
125,970 |
|
|
68,368 |
|
|
49,855 |
|
|
Total Liabilities and Members' Equity |
|
$ |
121,471 |
|
$ |
122,011 |
|
$ |
139,662 |
|
$ |
112,673 |
|
$ |
55,858 |
|
35
ITEM 7.MANAGEMENT’S DISCUSSION AND ANALYSIS OF FINANCIAL CONDITION AND RESULTS OF OPERATIONS.
General
We prepared the following discussion and analysis to help readers better understand our financial condition, changes in our financial condition, and results of operations for the fiscal year ended October 31, 2016. This discussion should be read in conjunction with the consolidated financial statements included herewith and notes to the consolidated financial statements thereto and the risk factors contained herein.
Overview
Our business consists primarily of the production and sale of ethanol and its co-products (wet, modified wet and dried distillers’ grains, corn oil and corn syrup) locally, and throughout the continental U.S. Our production operations are carried out at GFE’s plant located in Granite Falls, Minnesota and HLBE’s ethanol plant near Heron Lake, Minnesota.
The GFE plant has an annual production capacity of 62 million gallons of denatured ethanol, but is currently permitted to produce up to 70 million gallons of undenatured ethanol on a twelve month rolling sum basis. The HLBE plant has an approximate annual production capacity of 64 million gallons of denatured ethanol, but is currently permitted production capacity to produce approximately 72 million gallons of undenatured ethanol on a twelve-month rolling sum basis. We intend to continue working toward increasing production to take advantage of the additional production allowed pursuant to our permits as long as we believe it is profitable to do so.
HLBE also owns a controlling 73% interest in Agrinatural, which is a natural gas distribution and sales company located in Heron Lake, Minnesota that owns approximately 187 miles of natural gas pipeline and provides natural gas to HLBE’s ethanol plant and other commercial, agricultural and residential customers through a connection with the natural gas pipeline facilities of Northern Border Pipeline Company. Agrinatural's revenues are generated through natural gas distribution fees and sales.
Reportable Operating Segments
Our revenues from operations come from three primary sources: sales of fuel ethanol, sales of distillers' grains and sales of corn oil at GFE's ethanol plant and HLBE's ethanol plant. Operating segments are defined as components of an enterprise for which separate financial information is available that is evaluated regularly by the chief operating decision maker in deciding how to allocate resources and in assessing performance. Therefore, based on the criteria set forth in ASC 280 we have determined that based on the nature of the products and production process and the expected financial results, the Company’s operations at its ethanol plant and HLBE's plant, including the production and sale of ethanol and its co-products, are aggregated into one reporting segment.
Additionally, we also realize relatively immaterial revenue from natural gas pipeline operations at Agrinatural, HLBE's majority owned subsidiary. The intercompany transactions between HLBE and Agrinatural resulting from the firm natural gas transportation agreement between the two companies are eliminated in consolidation. After intercompany eliminations, revenues from Agrinatural represent less than less than 1% of our consolidated revenues and have little to no impact on the overall performance of the Company. Therefore, our management does not separately review Agrinatural's operating performance information. Rather, management reviews Agrinatural's natural gas pipeline financial data on a consolidated basis with our ethanol production operations segment. Additionally, management believes that the presentation of separate operating performance information for Agrinatural's natural gas pipeline operations would not provide meaningful information to a reader of the Company’s audited consolidated financial statements.
We currently do not have or anticipate that we will have any other lines of business or other significant sources of revenue other than the sale of ethanol and its co-products, which include distillers' grains and non-edible corn oil.
36
Plan of Operations Through October 31, 2017
Over the next year we will continue our focus on operational improvements at our plants. These operational improvements include exploring methods to improve ethanol yield per bushel and increasing production output at our plants, continued emphasis on safety and environmental regulation, reducing our operating costs, and optimizing our margin opportunities through prudent risk-management policies.
We expect to have sufficient cash generated by continuing operations and availability on our credit facilities to fund our operations at our plants. However, should we experience unfavorable operating conditions in the ethanol industry that prevent us from profitably operating our plants, we may need to seek additional funding.
At the GFE plant, we constructed an additional grain bin, which expands the GFE plant’s grain storage by approximately 750,000 bushels. The grain storage expansion project was commenced in August 2015 and was completed during the fiscal year ended October 31, 2016.
At the HLBE plant, the existing regenerative thermal oxidizer (“RTO”) was replaced with installation and emissions testing of the new RTO completed emissions testing during third fiscal quarter of 2016.
Both GFE’s corn storage expansion project and HLBE’s RTO replacement project were funded from current earnings from operations. In addition, we anticipate continuing to conduct routine maintenance and repair activities at the GFE and HLBE ethanol plants. We anticipate using cash we generate from our operations and, as needed, our credit facilities to finance these plant upgrade projects.
Trends and Uncertainties Impacting Our Operations
The principal factors affecting our results of operations and financial conditions are the market prices for corn, ethanol, distillers’ grains and natural gas, as well as governmental programs designed to create incentives for the use of corn-based ethanol. Other factors that may affect our future results of operation include those risks and factors discussed in this report at “PART I - Item 1. Business” and “PART I - Item 1A. Risk Factors”.
Our operations are highly dependent on commodity prices, especially prices for corn, ethanol, distillers’ grains and natural gas. As a result, our operating results can fluctuate substantially due to volatility in these commodity markets. The price and availability of corn is subject to significant fluctuations depending upon a number of factors that affect commodity prices in general, including crop conditions, yields, domestic and global stocks, weather, federal policy and foreign trade. Natural gas prices are influenced by severe weather in the summer and winter and hurricanes in the spring, summer and fall. Other factors include North American exploration and production, and the amount of natural gas in underground storage during injection and withdrawal seasons. Ethanol prices are sensitive to world crude oil supply and demand, domestic gasoline supply and demand, the price of crude oil, gasoline and corn, the price of substitute fuels and octane enhancers, refining capacity and utilization, government regulation and incentives and consumer demand for alternative fuels. Distillers’ grains prices are impacted by livestock numbers on feed, prices for feed alternatives and supply, which is associated with ethanol plant production.
We expect our ethanol plants to produce approximately 2.8 gallons of denatured ethanol for each bushel of grain processed in the production cycle. Because the market price of ethanol is not always directly related to corn, at times ethanol prices may lag price movements in corn prices and corn-ethanol price spread (the difference between the price per gallon of ethanol and the price per bushel of grain divided by 2.8) may be tightly compressed or negative. If the corn-ethanol spread is compressed or negative for sustained period, it is possible that our operating margins will decline or become negative and our ethanol plants may not generate adequate cash flow for operations. In such cases, we may reduce or cease production at our ethanol plants in order to minimize our variable costs and optimize cash flow.
37
The crush spread realized in fiscal year 2016 has continued to be negatively impacted by lower energy pricing and over supply of ethanol. High industry production levels outpaced strong domestic consumption and export demand experienced during the last two quarters of our 2016 fiscal year. In addition, because ethanol prices are typically directionally consistent with changes in corn and energy prices, lower corn, crude oil and gasoline prices throughout the fiscal year had a negative affect on ethanol prices. Corn prices were favorably impacted throughout the year from the consecutive strong U.S. corn harvests in 2016, 2015 and 2014. Additionally, management believes ethanol prices were negatively impacted throughout our 2016 fiscal year by the EPA’s draft proposal to reduce the amount of renewable fuels which are required to be used in the United States pursuant to the RFS. In the past, many fuel blenders used ethanol because of the difference in price between gasoline and ethanol. This voluntary use of ethanol in excess of the requirements in the RFS has decreased due to the fact that the spread between the price of ethanol and gasoline is smaller.
Historically, sales prices for distillers’ grains have correlated with prices of corn. However, there have been occasions when distillers’ grains prices have not been directly correlated to changes in corn prices. Consequently, the price we may receive for distillers’ grains may not rise as corn prices rise, thereby lowering our cost recovery percentage relative to corn. In addition, distillers’ grains compete with other protein-based animal feed products. The prices of competing animal feed products are based in part on the prices of the commodities from which these products are derived. Downward pressure on commodity prices, such as soybeans and corn, will generally cause the price of competing animal feed products to decline.
Given the inherent volatility in ethanol, distillers’ grains, non-food grade corn oil, grain and natural gas prices, we cannot predict the likelihood that the spread between ethanol, distillers’ grains, non-food grade corn oil and grain prices in future periods will be consistent compared to historical periods.
Results of Operations for the Fiscal Years Ended October 31, 2016 and 2015
The following table shows the results of our operations and the percentage of revenues, costs of goods sold, operating expenses and other items to total revenues in our audited consolidated statements of operations for the fiscal years ended October 31, 2016 and 2015 (amounts in thousands):
|
|
Fiscal Year EndedOctober 31, |
|||||||||||
|
|
|
2016 |
|
2015 |
||||||||
|
Income Statement Data |
|
Amount |
|
% |
|
Amount |
|
% |
||||
|
Revenue |
|
$ |
215,526 |
|
100.0 |
% |
|
$ |
231,255 |
|
100.0 |
% |
|
Cost of Goods Sold |
|
|
198,627 |
|
92.2 |
% |
|
|
208,654 |
|
90.2 |
% |
|
Gross Profit |
|
|
16,899 |
|
7.8 |
% |
|
|
22,601 |
|
9.8 |
% |
|
Operating Expenses |
|
|
5,326 |
|
2.5 |
% |
|
|
5,176 |
|
2.2 |
% |
|
Operating Income |
|
|
11,573 |
|
5.4 |
% |
|
|
17,425 |
|
7.6 |
% |
|
Other Expense, net |
|
|
(345) |
|
(0.2) |
% |
|
|
(478) |
|
(0.2) |
% |
|
Net Income |
|
|
11,228 |
|
5.2 |
% |
|
|
16,947 |
|
7.4 |
% |
|
Less: Net Income Attributable to Non-controlling Interest |
|
|
2,505 |
|
1.2 |
% |
|
|
3,360 |
|
1.5 |
% |
|
Net Income Attributable to Granite Falls Energy, LLC |
|
$ |
8,723 |
|
4.0 |
% |
|
$ |
13,587 |
|
5.9 |
% |
Revenues
Our revenues from operations come from three primary sources: sales of fuel ethanol, sales of distillers’ grains and sales of corn oil. Our remaining consolidated revenues are attributable to miscellaneous other revenue from incidental sales of corn syrup at HLBE’s plant and revenues generated from natural gas pipeline operations at Agrinatural, of which HLBE owns a 73% controlling interest.
38
The following table shows the sources of our consolidated revenue and the approximate percentage of revenues from those sources to total revenues in our audited consolidated statements of operations for the fiscal year ended October 31, 2016 (amounts in thousands):
|
|
|
Fiscal Year Ended October 31, 2016 |
||||
|
Revenue Sources |
|
Sales Revenue |
|
% of Total Revenues |
||
|
Ethanol sales |
|
$ |
170,960 |
|
79.3 |
% |
|
Distillers' grains sales |
|
|
33,988 |
|
15.8 |
% |
|
Corn oil sales |
|
|
8,932 |
|
4.1 |
% |
|
Miscellaneous other |
|
|
1,646 |
|
0.8 |
% |
|
Total Revenues |
|
$ |
215,526 |
|
100.0 |
% |
The following table shows the sources of our consolidated revenue and the approximate percentage of revenues from those sources to total revenues in our audited consolidated statements of operations for the fiscal year ended October 31, 2015 (amounts in thousands):
|
|
|
Fiscal Year Ended October 31, 2015 |
||||
|
Revenue Sources |
|
Sales Revenue |
|
% of Total Revenues |
||
|
Ethanol sales |
|
$ |
180,472 |
|
78.0 |
% |
|
Distillers' grains sales |
|
|
43,181 |
|
18.7 |
% |
|
Corn oil sales |
|
|
6,131 |
|
2.7 |
% |
|
Miscellaneous other |
|
|
1,471 |
|
0.6 |
% |
|
Total Revenues |
|
$ |
231,255 |
|
100.0 |
% |
Our total consolidated revenues decreased by approximately 6.8% for the fiscal year ended October 31, 2016, as compared to the fiscal year 2015, primarily due to decreases in the average price realized for our ethanol and distillers’ grains which were partially mitigated by increases in total volumes sold of our ethanol and corn oil. The following table reflects quantities of our three primary products sold and the average net prices received for the fiscal years ended October 31, 2016 and 2015 (quanties in thousands):
|
|
|
Year Ended October 31, 2016 |
|
Year Ended October 31, 2015 |
||||||
|
Product |
|
Quantity Sold |
|
Avg. Net Price |
|
Quantity Sold |
|
Avg. Net Price |
||
|
Ethanol (gallons) |
|
125,533 |
|
$ |
1.36 |
|
122,992 |
|
$ |
1.47 |
|
Distillers' grains (tons) |
|
300 |
|
$ |
113.35 |
|
314 |
|
$ |
137.33 |
|
Corn oil (pounds) |
|
34,238 |
|
$ |
0.26 |
|
23,396 |
|
$ |
0.26 |
Ethanol
Total revenues from sales of ethanol decreased by approximately 5.3% for fiscal year 2016 compared to the fiscal year 2015 due primarily to an approximately 7.2% decline in the average price per gallon we received for our ethanol which was partially mitigated by approximately 2.1% increase in the volumes sold from period to period. We produced and sold more ethanol gallons during fiscal year 2016 as compared to fiscal year 2015 primarily due to the timing of ethanol shipments and increases in ethanol production at the GFE and HLBE plants. Ethanol production was higher at our plants compared to prior year due to capital improvements we are making at our plants designed to increase ethanol production.
Management attributes the decrease in ethanol prices to continuing lower corn and gasoline prices, which impacts the market price of ethanol. In addition, management believes the uncertainty related to EPA proposed reductions in the RFS volume obligations during 2016 also impacted ethanol demand, negatively impacting ethanol prices especially during the first half of our 2016 fiscal year. Over the summer months, ethanol prices were bouyed somewhat by an increase in domestic demand for ethanol due to lower gasoline prices and stronger export demand, particularly from Asia, which management attributes to lower domestic ethanol prices and increased worldwide ethanol demand. However, domestic ethanol production increased in response to the uptick in demand, which increased domestic stocks of ethanol putting downward pressure on domestic ethanol prices. Additionally, declining corn prices in fall 2016, due to the large 2016 crop, put further downward pressure on ethanol prices. The net effect of these factors was a decrease in the average price realized for our ethanol for fiscal year 2016 as compared to the fiscal year 2015.
39
Management anticipates that ethanol prices will continue to change in relation to changes in corn and energy prices. Continued low prices or further declines in the crude oil and wholesale gasoline markets could have a negative impact on the market price of ethanol and our profitability particularly if domestic ethanol stocks remain high. Ethanol exports have provided support for ethanol prices, especially as domestic ethanol stocks have grown. However, a decrease in U.S. ethanol exports due to the premium on the price of ethanol as compared to unleaded gasoline, the strength of the U.S. dollar and/or other factors could contribute to higher ethanol stocks. If domestic ethanol stocks grow, further decreases in domestic ethanol prices may result unless additional demand from domestic discretionary blending or other foreign markets develop.
In November 2016, the EPA issued its final renewable volume obligations for 2017, revising the levels proposed in its May 2016 draft rule to match the statutory renewable volume obligations under the RFS. Management anticipates that ethanol prices will remain steady during our 2017 fiscal year as a result of the 2017 renewable volume obligations number matching the RFS statutory RVOs.
We occasionally engage in hedging activities with respect to our ethanol sales. We recognize the gains or losses that result from the changes in the value of these derivative instruments in revenues as the changes occur. As ethanol prices fluctuate, the value of our derivative instruments are impacted, which affects our financial performance. These ethanol derivative instruments resulted in a loss of approximately $159,000 during the fiscal year ended October 31, 2016, which decreased our revenue. In comparison, during the fiscal year ended October 31, 2015, we had no gains or losses on our ethanol derivative instruments.
Distillers’ Grains
Total revenues from sales of distillers’ grains decreased approximately 21.3% for fiscal year 2016 compared to fiscal year 2015. The decline in distillers' grains revenues is primarily attributable to an approximately 17.5% decrease in the average price per ton we received for our distillers’ grains from period to period. The effect of the decrease in average distillers’ grains price was compounded by an approximately 4.5% decrease in the tons of distillers’ grains sold during fiscal year 2016 compared to fiscal year 2015. We sold less total tons of distillers’ grains during our 2016 fiscal year compared to the same period of 2015 due to increased efficiencies of converting corn into ethanol which leads to less production of co-products such as distillers’ grains. We also increased the amount of corn oil we were extracting from our distillers’ grains during our 2016 fiscal year which reduced the total tons of distillers’ grains we had available for sale. Management anticipates relatively stable distillers’ grains production during our 2017 fiscal year as we anticipate a comparable amount of ethanol production during our 2017 fiscal year.
Management attributes the decline in the market price of distillers’ grains primarily to increased supplies of corn and soybeans resulting in lower market grain prices and reduced domestic demand during fiscal year 2016 as compared to fiscal year 2015. Since distillers’ grains are primarily used as a feed substitute for corn and soybean meal, when corn and soybean supplies increase, the prices of these competing products decrease, negatively impacts distillers’ grains demand and prices. For the last half, distillers’ grains traded at discount compared to a comparable amount of corn. Management anticipates distillers’ grains will continue to trade at a significant discount compared to the price of corn due to anticipated strong corn supplies and relatively stable demand. However, domestic prices for distillers’ grains could decrease if end-users switch to lower priced alternatives reducing the domestic demand for distillers’ grains.
Additionally, export demand for distillers’ grains was reduced in fiscal year 2016 compared to fiscal year 2015, particularly in the last quarter of 2016. Weaker export demand in fiscal year 2016 is largely attributable to imports of dried distillers’ grains by China, historically the world’s largest buyer of domestic distillers’ grains. In January 2016, China opened anti-dumping and countervailing duty investigations into distillers’ grains produced in the U.S. On September 23, 2016, the Chinese government instituted preliminary anti-dumping and anti-subsidy duties on all distillers’ grains produced in the United States and exported to China. On January 10, 2017, the Chinese Ministry of Commerce announced its final ruling, significantly increasing the anti-dumping and anti-subsidy duties imposed in September 2016. Since this trade dispute commenced in January 2016, distillers’ grains exports to China have been diminished, falling significantly since the September announcement of the imposition of trade duties. While we expect China to continue to import some distillers’ grains, we do not anticipate that imports will be at the same level as previous years. Further decrease in export demand for distillers’ grains from China could continue to negatively impact market distillers’ grains demand and prices unless additional demand can be created from other foreign markets or domestically.
40
Corn Oil
Total revenues from sales of corn oil increased by approximately 45.7% for fiscal year 2016 compared to the fiscal year 2015. This increase is attributable to an approximately 46.3% increase in pounds sold during fiscal year 2016 compared to fiscal year 2015 as the average price we received per pound of corn oil sold from period to period was relatively unchanged, decreasing approximately 0.4%.
During much of fiscal year 2016, corn oil prices were impacted by consistent oversupply and lower corn and soybean oil prices, products that typically compete with corn oil. Corn oil is used primarily as animal feed, for certain industrial uses and for biodiesel production. Management anticipates continued lower corn oil prices due to higher corn oil supplies. Biodiesel production has benefited from the passage of the biodiesel blenders' tax credit in recent years which management believes has positively impacted corn oil demand. However, the biodiesel blenders' tax credit expired on December 31, 2016 which could negatively impact corn oil demand and prices during our 2017 fiscal year if not retroactively renewed. Management anticipates lower corn oil prices unless additional demand can be created.
Cost of Goods Sold
Our cost of goods sold decreased by approximately 4.8% for the fiscal year ended October 31, 2016, as compared to the fiscal year ended October 31, 2015. Our cost of goods sold as a percentage of revenues increased slightly to approximately 92.2% for the fiscal year ended October 31, 2016, as compared to approximately 90.2% for the 2015 fiscal year due to the narrowing of the margin between the price of ethanol and the price of corn. Approximately 90% of our total costs of goods sold is attributable to ethanol production. As a result, the cost of goods sold per gallon of ethanol produced for the fiscal year ended October 31, 2016 was approximately $1.41 per gallon of ethanol sold compared to approximately $1.51 per gallon of ethanol produced for the fiscal year ended October 31, 2015.
The following table shows the costs of corn and natural gas (our two largest single components of costs of goods sold), as well as all other components of cost of goods sold, which includes processing ingredients, electricity, and wages, salaries and benefits of production personnel, and the approximate percentage of costs of those components to total costs of goods sold in our audited consolidated statements of operations for the fiscal year ended October 31, 2016 (amounts in thousands):
|
|
|
Year Ended October 31, 2016 |
||||
|
|
|
Cost |
|
% of Cost of Goods Sold |
||
|
Corn costs |
|
$ |
147,084 |
|
74.1 |
% |
|
Natural gas costs |
|
|
10,227 |
|
5.1 |
% |
|
All other components of costs of goods sold |
|
|
41,316 |
|
20.8 |
% |
|
Total Cost of Goods Sold |
|
$ |
198,627 |
|
100.0 |
% |
The following table shows the costs of corn, natural gas and all other components of cost of goods sold and the approximate percentage of costs of those components to total costs of goods sold in our audited consolidated statements of operations for the fiscal year ended October 31, 2015 (amounts in thousands):
|
|
|
Year Ended October 31, 2015 |
||||
|
|
|
Cost |
|
% of Cost of Goods Sold |
||
|
Corn costs |
|
$ |
153,379 |
|
73.5 |
% |
|
Natural gas costs |
|
|
13,994 |
|
6.7 |
% |
|
All other components of costs of goods sold |
|
|
41,281 |
|
19.8 |
% |
|
Total Cost of Goods Sold |
|
$ |
208,654 |
|
100.0 |
% |
Corn Costs
Our cost of goods sold related to corn decreased approximately 4.6% less for our 2016 fiscal year compared to our 2015 fiscal year, due primarily to decrease of 4.9% in the average price per bushel paid for corn from period to period, despite a 0.9% increase in the number of bushels of corn processed. The corn-ethanol price spread (the difference between the price per gallon of ethanol and the price per bushel of grain divided by 2.8) for our 2016 fiscal year was approximately $0.03 narrower than the corn-ethanol price spread we experienced for same period of 2015.
41
The decrease in our cost per bushel of corn was primarily related to lower market corn prices due to increased market corn supplies by the strong corn harvest in the fall of 2015, resulting in a sufficient local supply of corn to the market and relatively lower corn demand. Corn prices have remained steady moving into fiscal year 2017 due to the large corn crop harvested in the fall of 2016. Management anticipates that corn supplies will remain favorable during our 2017 fiscal year which should result in relatively stable corn prices. These lower corn prices could impact the amount of corn which is planted during 2017 which could result in higher corn prices later in our 2017 fiscal year. However, since other commodity prices are lower, the lower corn prices may not significantly impact farmer planting decisions.
For our fiscal years ended October 31, 2016 and 2015, our plants processed approximately 43.4 million and 43.0 million bushels of corn, respectively. We were able to improve our corn conversion efficiency slightly during our 2016 fiscal year compared to 2015 which allowed us to produce more ethanol per bushel of corn. Management anticipates consistent corn consumption during our 2017 fiscal year compared to our 2016 fiscal year provided that we can maintain positive operating margins that allow us to continue to operate the ethanol plants at capacity.
From time to time we enter into forward purchase contracts for our corn purchases. At October 31, 2016, GFE had forward corn purchase contracts for approximately 5.2 million bushels, comprised of long corn positions on 3.3 million bushels, and short corn positions on 1.9 million bushels, for various delivery periods through August 2017. Comparatively at October 31, 2015, we had forward corn purchase contracts for approximately 2.6 million bushels for various delivery periods through December 2016, comprised of approximately 740,000 and 1.9 million bushels held by GFE and HLBE, respectively.
Our corn derivative positions resulted in gains of approximately $708,000 and $304,000 for the fiscal years ended October 31, 2016 and 2015, respectively, which decreased cost of goods sold. We recognize the gains or losses that result from the changes in the value of our derivative instruments from corn in cost of goods sold as the changes occur. As corn prices fluctuate, the value of our derivative instruments are impacted, which affects our financial performance. We anticipate continued volatility in our cost of goods sold due to the timing of the changes in value of the derivative instruments relative to the cost and use of the commodity being hedged.
Natural Gas Costs
For our 2016 fiscal year, we experienced a decrease of approximately 26.9% in our overall natural gas costs compared to our 2015 fiscal year. The decrease in natural gas costs was primarily due lower natural gas prices due to ample supply. Management anticipates that natural gas prices will hold steady and may even decrease slightly throughout our 2017 fiscal year. However, if we experience an exceptionally cold and long winter during our 2017 fiscal year, management anticipates that we may experience increases in natural gas prices. Our natural gas consumption during fiscal year 2016 was slightly higher compared to fiscal year 2015 due to increased production at our plants.
From time to time we enter into forward purchase contracts for our natural gas purchases. Our natural gas derivative positions resulted in a gain of approximately $33,000 for the fiscal year ended October 31, 2016, which decreased cost of goods sold. Comparatively, we had no gain or loss on natural gas derivative instruments during the fiscal year ended October 31, 2015. We recognize the gains or losses that result from the changes in the value of our derivative instruments from natural gas in cost of goods sold as the changes occur.
Operating Expense
Operating expenses include wages, salaries and benefits of administrative employees at the plants, insurance, professional fees and similar costs. Operating expenses as a percentage of revenues rose slightly to 2.5% of revenues for our fiscal year ended October 31, 2016 compared to 2.2% of revenues for our fiscal year ended October 31, 2015. This increase is due primarily to decreased revenues in fiscal year 2016. Our efforts to optimize efficiencies and maximize production may result in a decrease in our operating expenses on a per gallon basis. However, because these expenses generally do not vary with the level of production at the plants, we expect our operating expenses to remain steady into and throughout our 2017 fiscal year.
42
Operating Income
For our fiscal year ended October 31, 2016, we reported operating income of approximately $11.6 million and for our fiscal year ended October 31, 2015, we had operating income of approximately $17.4 million. This decrease resulted largely from decreased prices for our ethanol and its co-products and the narrowing of our net operating margin
Other Expense, Net
We had total other expense, net for our fiscal year ended October 31, 2016 of approximately $345,000 compared to total other expense, net of approximately $478,000 for our fiscal year ended October 31, 2015. This decrease in other expenses is primarily due to a decrease in interest expense during our fiscal year ended October 31, 2016, compared to the same period of 2015 due to decreased borrowings on HLBE credit facilities. We also had an increase of approximately $62,000 in miscellaneous income for fiscal year 2016 as compared to fiscal year 2015.
Results of Operations for the Fiscal Years Ended October 31, 2015 and 2014
The following table shows the results of our operations and the percentage of revenues, cost of goods sold, operating expenses and other items to total revenues in our audited consolidated statements of operations for the fiscal years ended October 31, 2015 and 2014 (amounts in thousands):
|
|
|
Fiscal Year EndedOctober 31, |
||||||||||
|
|
|
2015 |
|
2014 |
||||||||
|
Income Statement Data |
|
Amount |
|
% |
|
Amount |
|
% |
||||
|
Revenue |
|
$ |
231,255 |
|
100.0 |
% |
|
$ |
300,955 |
|
100.0 |
% |
|
Cost of Goods Sold |
|
|
208,654 |
|
90.2 |
% |
|
|
237,434 |
|
78.9 |
% |
|
Gross Profit |
|
|
22,601 |
|
9.8 |
% |
|
|
63,521 |
|
21.1 |
% |
|
Operating Expenses |
|
|
5,176 |
|
2.2 |
% |
|
|
5,151 |
|
1.7 |
% |
|
Operating Income |
|
|
17,425 |
|
7.6 |
% |
|
|
58,370 |
|
19.4 |
% |
|
Other Income (Expense), net |
|
|
(478) |
|
0.2 |
% |
|
|
720 |
|
0.2 |
% |
|
Net Income |
|
|
16,947 |
|
7.4 |
% |
|
|
59,090 |
|
19.6 |
% |
|
Less: Net Income Attributable to Non-controlling Interest |
|
|
3,360 |
|
1.5 |
% |
|
|
10,317 |
|
3.4 |
% |
|
Net Income Attributable to Granite Falls Energy, LLC |
|
$ |
13,587 |
|
5.9 |
% |
|
$ |
48,773 |
|
16.2 |
% |
Revenues
For the fiscal years ended October 31, 2015 and 2014, our revenues came from sales of our three primary products: ethanol, distillers’ grains and corn oil. We also had miscellaneous other revenues attributable to incidental sales of corn syrup and Agrinatural revenues (net of eliminations). The following table shows the sources of our consolidated revenue and the approximate percentage of revenues from those sources to total revenues in our audited consolidated statements of operations for the fiscal year ended October 31, 2015 (amounts in thousands):
|
|
|
Fiscal Year Ended October 31, 2015 |
||||
|
Revenue Sources |
|
Sales Revenue |
|
% of Total Revenues |
||
|
Ethanol sales |
|
$ |
180,472 |
|
78.0 |
% |
|
Distillers' grains sales |
|
|
43,181 |
|
18.7 |
% |
|
Corn oil sales |
|
|
6,131 |
|
2.7 |
% |
|
Miscellaneous other |
|
|
1,471 |
|
0.6 |
% |
|
Total Revenues |
|
$ |
231,255 |
|
100.0 |
% |
43
The following table shows the sources of our consolidated revenue and the approximate percentage of revenues from those sources to total revenues in our audited consolidated statements of operations for the fiscal year ended October 31, 2014 (amounts in thousands):
|
|
|
Fiscal Year Ended October 31, 2014 |
||||
|
Revenue Sources |
|
Sales Revenue |
|
% of Total Revenues |
||
|
Ethanol sales |
|
$ |
241,095 |
|
80.1 |
% |
|
Distillers' grains sales |
|
|
51,412 |
|
17.1 |
% |
|
Corn oil sales |
|
|
6,947 |
|
2.3 |
% |
|
Miscellaneous other |
|
|
1,501 |
|
0.5 |
% |
|
Total Revenues |
|
$ |
300,955 |
|
100.0 |
% |
Our total consolidated revenue decreased 23.2% for our 2015 fiscal year compared to our 2014 fiscal year. Management attributes this decrease in revenues due primarily to decreases in the average prices received for our ethanol and distillers’ grains as the total volumes of ethanol and tons of distillers’ grains sold remained relatively steady from period to period.
The following table reflects quantities of our three primary products sold and the average net prices received for fiscal years ended October 31, 2015 and 2014 (amounts in thousands):
|
|
|
Year Ended October 31, 2015 |
|
Year Ended October 31, 2014 |
||||||
|
Product |
|
Quantity Sold |
|
Avg. Net Price |
|
Quantity Sold |
|
Avg. Net Price |
||
|
Ethanol (gallons) |
|
122,992 |
|
$ |
1.47 |
|
120,727 |
|
$ |
2.00 |
|
Distillers' grains (tons) |
|
314 |
|
$ |
137.33 |
|
313 |
|
$ |
164.08 |
|
Corn oil (pounds) |
|
23,396 |
|
|
0.26 |
|
22,087 |
|
|
0.31 |
Ethanol
Total revenues from sales of ethanol decreased by approximately 25.1% for fiscal year 2015 compared to fiscal year 2014, due primarily to an approximately 26.5% decrease in the average price per gallon we received. The effect of this price decrease was offset by a slight increase of 1.9% in quantity sold in our 2015 fiscal year compared to our 2014 fiscal year. Management attributes the drop in ethanol prices to continuing lower corn and gasoline prices, which impacted the market price of ethanol. In addition, management believes the uncertainty related to EPA proposed reductions in the RFS volume obligations during 2015 also impacted ethanol demand, negatively impacting ethanol prices. In comparison, we experienced unusually high ethanol prices during much of fiscal year 2014 due to rail logistics issues that plagued much of the ethanol industry during much of 2014, restricting the supply of ethanol in the market and resulting in higher ethanol prices.
In late May 2015, the EPA proposed reducing the amount of corn-based ethanol which was required to be used in 2015 to levels which were below the 2014 statutory requirement. On November 30, 2015, the EPA issued its final renewable volume obligations for corn-based ethanol for 2014 through 2016. The final RVO’s for corn-based ethanol blending exceeded the RVO reductions proposed in May 2015, but remained below the original statutory blending requirements set by the RFS. Management believes this uncertainty during much of 2015 caused fuel blenders to reduce ethanol demand which negatively impacted ethanol prices.
We had no gain or loss on ethanol derivative instruments during the fiscal years ended October 31, 2015 and 2014.
Distillers’ Grains
Total sales of distillers' grains during our 2015 fiscal year were 16.0% less compared to distillers' grains sales during our 2014 fiscal year. The decline in distillers' grains revenues is primarily attributable to a decrease in the price we received for our distillers' grains in our 2015 fiscal year, which was approximately 16.8% lower than the price we received during our 2014 fiscal year. The aggregate tons sold across both plants was relatively stable from period to period, with only an approximately 0.3% increase in tons sold during fiscal year 2015 compared to fiscal year 2014. Management believes these lower distillers' grains prices are a result of low corn and soybean prices coupled with increased supplies of corn and soybeans during much of our 2015 fiscal year.
44
Distillers’ grains prices were also negatively impacted during our 2014 and 2015 fiscal years as a result of Chinese trade actions which impacted both corn and distillers’ grains. In June 2014, China stopped issuing permits for the import of distillers’ dried grains from the U.S. due to the presence of a unapproved genetically modified organism (“GMO”) corn trait in some distillers’ grains shipments. The GMO trait has been approved in the U.S. and a number of other countries but was not in China. In December 2014, these trade issues were resolved and China lifted the ban imposed in June 2014. Following the Chinese announcement, Chinese import buyers resumed purchases of U.S. distillers’ grains and domestic distillers’ grains prices rebounded but diminished again towards the end of fiscal year 2015 due to the availability of corn following the 2015 corn harvest and weaker Chinese markets.
Corn Oil
The average price we received per pound of corn oil sold during our 2015 fiscal year was approximately 16.1% less than the average price received during our 2014 fiscal year. Corn oil prices in fiscal year 2015 were impacted by oversupply and lower soybean oil prices, which resulted in biodiesel producers using more soybean oil to produce biodiesel instead of corn oil. Offsetting this price decrease, our aggregate volume of corn oil sold increased approximately 5.9% during our 2015 fiscal year relative to our 2014 fiscal year due to increased extraction efficiencies at the HLBE plant. The net effect of the price decrease and increase in volume sold resulted in a 11.7% decrease in corn oil revenue from fiscal year 2014 to fiscal year 2015.
Cost of Goods Sold
Our cost of goods sold decreased by approximately 12.1% for fiscal year 2015, as compared to fiscal year 2014. However, as a percentage of revenues, our cost of goods sold increased to approximately 90.2% for fiscal year 2015, as compared to approximately 78.9% for fiscal year 2014 due to the narrowing of the margin between the price of ethanol and the price of corn. The cost of goods sold per gallon of ethanol produced for fiscal year 2015 was approximately $1.51 per gallon of ethanol sold compared to approximately $1.79 per gallon of ethanol produced for fiscal year 2014.
The following table shows the costs of corn and natural gas (our two largest single components of costs of goods sold), as well as all other components of cost of goods sold, which includes processing ingredients, electricity, and wages, salaries and benefits of production personnel, and the approximate percentage of costs of those components to total costs of goods sold in our audited consolidated statements of operations for the fiscal year ended October 31, 2015 (amounts in thousands):
|
|
|
Year Ended October 31, 2015 |
||||
|
|
|
Cost |
|
% of Cost of Goods Sold |
||
|
Corn costs |
|
$ |
153,379 |
|
73.5 |
% |
|
Natural gas costs |
|
|
13,994 |
|
6.7 |
% |
|
All other components of costs of goods sold |
|
|
41,281 |
|
19.8 |
% |
|
Total Cost of Goods Sold |
|
$ |
208,654 |
|
100.0 |
% |
The following table shows the costs of corn, natural gas, and all other components of cost of goods sold and the approximate percentage of costs of those components to total costs of goods sold in our audited condensed consolidated statements of operations for the fiscal year ended October 31, 2014 (amounts in thousands):
|
|
|
Year Ended October 31, 2014 |
||||
|
|
|
Cost |
|
% of Cost of Goods Sold |
||
|
Corn costs |
|
$ |
168,654 |
|
71.0 |
% |
|
Natural gas costs |
|
|
22,213 |
|
9.4 |
% |
|
All other components of costs of goods sold |
|
|
46,567 |
|
19.6 |
% |
|
Total Cost of Goods Sold |
|
$ |
237,434 |
|
100.0 |
% |
A significant decrease in natural gas costs, as well as decreases in corn costs, resulted in the decline in cost of goods sold for our fiscal year ended October 31, 2015, as compared to the fiscal year 2014.
45
Corn Costs
We experienced a decrease of approximately 9.0% in our aggregate corn costs for our 2015 fiscal year compared to our 2014 fiscal year. This was the net result of an approximately 13.1% decrease in our average per bushel cost, offset by an approximately 3.4% increase in the quantity of bushels we purchased. The decrease in corn prices was primarily driven by the strong corn harvest in the fall of 2013 and 2014 resulting in a significant increase in the supply of corn available to the market.
Our corn derivative positions resulted in gains of approximately $304,000 and $1.1 million for the fiscal years ended October 31, 2015 and 2014, respectively, which decreased cost of goods sold.
Natural Gas Costs
For our 2015 fiscal year, we experienced a decrease of approximately 39.4% in our overall natural gas costs compared to our 2014 fiscal year due to plentiful supply in fiscal year 2015, which resulted in lower prices for fiscal year 2015 compared to the higher prices we experienced during the first and second quarters of fiscal year 2014 due to lingering supply shortages from the harsh winter in 2014.
We had no gain or loss on natural gas derivative instruments during the fiscal years ended October 31, 2015 and 2014.
Operating Expense
Operating expenses as a percentage of revenues were relatively steady, increasing from 1.7% of revenues for our fiscal year ended October 31, 2014 to 2.2% of revenues for our fiscal year ended October 31, 2015.
Operating Income
Our income from operations for our fiscal year ended October 31, 2015 was 7.6% of our revenues compared to 19.4% of our revenues for our fiscal year ended October 31, 2014. For our fiscal year ended October 31, 2015, we reported operating income of approximately $17.4 million and for our fiscal year ended October 31, 2014, we had operating income of approximately$58.4 million. This decrease resulted largely from decreased prices for our ethanol and its co-products and the narrowing of our net operating margin.
Other Income (Expense), Net
We had total other expense of approximately $478,000 for our fiscal year ended October 31, 2015, compared to total other income of approximately $720,000 for our fiscal year ended October 31, 2014. This decrease resulted largely from a gain of approximately $953,000 that was recorded in 2014 related to the settlement of a debt premium associated with the HLBE AgStar credit facility. No such gain was recorded during fiscal year 2015.
Changes in Financial Condition at October 31, 2016 and 2015
The following table highlights the changes in our financial condition at October 31, 2016 compared to October 31, 2015 (amounts in thousands):
|
|
|
October 31, 2016 |
|
October 31, 2015 |
|
||
|
Current Assets |
|
$ |
40,349 |
|
$ |
35,513 |
|
|
Total Assets |
|
$ |
121,470 |
|
$ |
122,011 |
|
|
Current Liabilities |
|
$ |
14,337 |
|
$ |
9,140 |
|
|
Long-Term Debt, less currrent portion |
|
$ |
1,394 |
|
$ |
6,712 |
|
|
Members' Equity attributable to Granite Falls Energy, LLC |
|
$ |
83,685 |
|
$ |
84,603 |
|
|
Non-controlling Interest |
|
$ |
22,056 |
|
$ |
21,557 |
|
Total assets decreased by approximately $540,000 at October 31, 2016 compared to October 31, 2015. This decrease is primarily due to a decrease of $5.3 million in property and equipment which was partially offset by an increase in total current assets of approximately $4.8 million at October 31, 2016 compared to October 31, 2015.
46
The approximately 13.6% increase in current assets is due primarily to an increase of approximately $6.1 million in inventory at October 31, 2016 as compared to October 31, 2015. Inventory increased as a result of having more corn and ethanol on hand at October 31, 2016. Offsetting this increase, was a 31.2% decrease in our accounts receivable. Our accounts receivable decreased due to primarily to the timing of shipments.
Property and equipment, less accumulated depreciation, was approximately $5.3 million less at October 31, 2016 compared to October 31, 2015 due to accumulated depreciation and fewer capital expenditures for construction in progress during the 2016 period at both plants and pipeline construction activities at Agrinatural.
Total current liabilities increased by approximately $5.2 million at October 31, 2016 compared to October 31, 2015. This increase was mainly due to an increases of approximately $3.9 million in corn payable to FCE, $982,000 in accounts payable and $343,000 in accrued expenses at October 31, 2016 compared to October 31, 2015. The increase in our accounts payable is due primarily to a increase in accounts payable at HLBE which was due to the timing of inventory receipts and trade creditor payments which increased the amount of HLBE’s accounts payable at October 31, 2016. Offsetting the decrease in checks drawn in excess of bank balance, accounts payable and corn payable was an increase in commodity derivative instruments of approximately $1.7 million at October 31, 2016 as compared to October 31, 2015. The increase in corn payable to FCE is due primarily to having more corn on hand at October 31, 2016.
Long-term debt totaled approximately $1.4 million at October 31, 2016, which is approximately $5.3 million less than our long-term debt at October 31, 2015. The decrease is mostly due to principal repayment on HLBE’s long-term debt. Comparatively, at October 31, 2015, borrowings were higher under HLBE’s AgStar credit facilities to finance a portion of distributions made to HLBE unit holders in January 2015 and to fund the additional $3.5 million loan HLBE made to Agrinatural in fiscal year 2015.
Members’ equity attributable to Granite Falls Energy, LLC at October 31, 2016 decreased by approximately $918,000 compared to October 31, 2015. The approximately 1.1% decrease was related to the distribution to our members of approximately $9.6 million during January 2016, offset by net income attributable to Granite Falls Energy, LLC of approximately $8.7 million for the fiscal year ended October 31, 2016.
Noncontrolling interest totaled approximately $22.1 million at October 31, 2016. This is directly related to recognition of the approximately 49.4% noncontrolling interest in HLBE at October 31, 2016.
Liquidity and Capital Resources
Our principal sources of liquidity consist of cash provided by operations, cash on hand, and available borrowings under our credit facility with United FCS and AgStar. Our principal uses of cash are to purchase raw materials necessary to operate the ethanol plants and capital expenditures to maintain and upgrade our plants, and to make distribution payments to our members. GFE’s grain storage expansion project and HLBE’s RTO replacement projects were funded from current earnings from operations.
We do not currently anticipate any significant purchases of property and equipment that would require us to secure additional capital in the next twelve months. For our 2017 fiscal year, we anticipate completion several smaller capital projects and maintain current plant infrastructure. We expect to have sufficient cash generated by continuing operations and current lines of credit to fund our operations and complete our capital expenditures during our 2017 fiscal year and beyond.
Management continues to evaluate conditions in the ethanol industry and explore opportunities to improve the efficiency and profitability of our operations which may require additional capital to supplement cash generated from operations and our current lines of credit.
47
Year Ended Compared October 31, 2016 to Year Ended October 31, 2015
The following table summarizes our sources and uses of cash and equivalents from our audited consolidated statements of cash flows for the fiscal years ended October 31, 2016 and 2015 (amounts in thousands):
|
|
|
2016 |
|
2015 |
|
||
|
Net cash provided by operating activities |
|
$ |
22,792 |
|
$ |
24,961 |
|
|
Net cash used in investing activities |
|
$ |
(4,727) |
|
$ |
(8,824) |
|
|
Net cash used in financing activities |
|
$ |
(16,964) |
|
$ |
(30,649) |
|
|
Net increase (decrease) in cash |
|
$ |
1,101 |
|
$ |
(14,512) |
|
Operating Cash Flows
During the fiscal year ended October 31, 2016, net cash provided by operating activities decreased by approximately $2.2 million compared to the fiscal year ended October 31, 2015. This decrease from period to period was due primarily to an approximately $5.7 million decrease in net income, offset by a net increase of approximately $2.5 million of various working capital items. Net income decreased for fiscal year 2016 by approximately 33.7% compared to fiscal year 2015, due to the lower average sales prices we received for our principal products.
Investing Cash Flows
Cash used in investing activities was approximately $4.1 million less for fiscal year 2016, compared to fiscal year 2015. This decrease was due primarily to reduced payments for capital expenditures during fiscal year 2016. During fiscal year 2016, we used cash at the GFE plant for our grain bin storage expansion and at HLBE plant for our RTO replacement project. Comparatively, during fiscal year 2015, we used cash at the HLBE plant to purchase a condenser and sieve beads to remediate the system pressure fluctuations, upgrade corn oil separation equipment, and make a down payment on the RTO replacement equipment. Additionally, during fiscal year 2015, we used cash at the GFE plant to for our grain bin storage expansion and rail loop projects.
Financing Cash Flows
Cash used in financing activities was approximately $13.7 million less for fiscal year 2016 compared to fiscal year 2015. For fiscal year 2016, we used cash to make payments of approximately $9.6 million in distributions to our unit holders, $2.0 million to non-controlling interests, and payments of approximately $15.2 million on HLBE’s long-term debt, which were offset by approximately $9.8 million in proceeds from HLBE’s long-term debt and approximately $30,000 from checks in excess of bank balance. In comparison, for fiscal year 2015, we had proceeds of approximately $13.4 million in proceeds from HLBE’s long-term debt and approximately $1.8 million provided by checks drawn in excess of bank balance and made payments of approximately $9.2 million on HLBE’s long-term debt, $32.1 million in distributions to our unit holders, and approximately $4.6 million to non-controlling interests.
Year Ended October 31, 2015 Compared to Year Ended October 31, 2014
The following table summarizes our sources and uses of cash and equivalents from our audited consolidated statements of cash flows for the fiscal years ended October 31, 2015 and 2014 (amounts in thousands):
|
|
|
2015 |
|
2014 |
||
|
Net cash provided by operating activities |
|
$ |
24,961 |
|
$ |
65,892 |
|
Net cash used in investing activities |
|
$ |
(8,824) |
|
$ |
(5,708) |
|
Net cash used in financing activities |
|
$ |
(30,649) |
|
$ |
(24,134) |
|
Net increase (decrease) in cash |
|
$ |
(14,512) |
|
$ |
26,050 |
Operating Cash Flows
Cash provided by operating activities was approximately $40.9 million less for the fiscal year ended October 31, 2015, compared to the fiscal year ended October 31, 2014. This difference is primarily due a decrease in our net income of approximately $42.1 million during fiscal year 2015.
48
Investing Cash Flows
Cash used in investing activities increased by approximately $3.1 million for the fiscal year ended October 31, 2015, compared to the fiscal year ended October 31, 2014. This increase is due primarily to an approximately $3.0 million increase in capital expenditures for the fiscal year ended October 31, 2015. During the fiscal year ended October 31, 2015, we used cash at the HLBE plant to purchase a condenser and sieve beads to remediate the system pressure fluctuations HLBE experienced during the first fiscal quarter and make a down payment on the RTO replacement equipment. During the fiscal year ended October 31, 2015, we used cash at the GFE plant for our grain bin storage expansion and rail loop projects. During the same period of 2014, we used cash of approximately $5.8 million primarily for payments for pipeline construction in progress at Agrinatural, which was offset by approximately $80,000 of proceeds from the sales of equipment during fiscal 2014.
Financing Cash Flows
Cash used in financing activities was approximately $30.6 million for the fiscal year ended October 31, 2015, consisting primarily of payments of approximately $32.1 million in distributions to members and $4.6 million in distributions by HLBE to its unit holders other than GFE. These payments were partially offset by approximately $4.3 million in net proceeds from long term debt and approximately $1.8 million in checks in excess of bank balance. During the same period of 2014, we made payments of $5.5 million in distributions to members, $28.4 million on our long term debt, net and $207,000 on HLBE’s subordinated convertible notes.
Credit Arrangements
Granite Falls Energy
Credit Arrangements with United FCS
We have a credit facility with United FCS consisting of a long-term revolving term loan. Our credit facility with United FCS is secured by substantially all our assets. There are no savings account balance collateral requirements as part of this credit facility. CoBank serves as administrative agent for this credit facility.
Under GFE’s long-term revolving term loan, GFE could initially borrow, repay, and re-borrow up to $18.0 million. However, the aggregate principal commitment available for borrowing under this facility reduces by $2.0 million every six months, beginning September 1, 2014, with the final reduction on March 1, 2018. The outstanding balance on the revolving term loan totaled approximately $0 at October 31, 2016 and October 31, 2015. Therefore, the aggregate principal amount available for borrowing under this revolving term loan facility at October 31, 2016 and October 31, 2015 was $10.0 million and $12.0 million, respectively.
GFE's credit facility with United FCS is subject to numerous financial and non-financial covenants that limit distributions and debt and require minimum working capital, minimum local net worth, and debt service coverage ratio, including the following:
|
· |
GFE must maintain working capital of at least $10.0 million. Working capital is calculated as GFE’s current assets plus the amount available under GFE’s long-term revolving term loan, less GFE’s current liabilities. |
|
· |
GFE must maintain local net worth of at least $34.0 million. Local net worth is defined as total assets, minus total liabilities, minus investments by GFE in other entities. |
|
· |
GFE must maintain a debt service coverage ratio of at least 1.5 to 1.0. The debt service coverage ratio is calculated as GFE’s net income (after taxes), plus depreciation and amortization, minus extraordinary gains (plus losses), minus gain (plus loss) on asset sales and divided by $4.0 million. |
|
· |
GFE may make member distributions of up to 75% of GFE’s net income without the consent of United FCS provided GFE remains in compliance with its loan covenants following the distribution. Any member distributions in excess of 75% of GFE’s net income must be pre-approved by United FCS. |
49
As of October 31, 2016, we were in compliance with these financial covenants and expect to be in compliance throughout fiscal year 2017 and thereafter. Management does not believe that it is reasonably likely that we will fall out of compliance with our material loan covenants in the next 12 months. However, if market conditions deteriorate in the future, circumstances may develop which could result in us violating the financial covenants or other terms of GFE’s credit facility. If we fail to comply with the terms of our credit agreement with United FCS, and United FCS refuses to waive the non-compliance, United FCS could terminate the credit facility and any commitment to loan funds to GFE.
At October 31, 2015, we had letters of credit totaling approximately $289,000 with United FCS as part of a credit requirement of Northern Natural Gas. Subsequent to our fiscal year end, Norther Natural Gas waived this credit requirement and the letters of credit were canceled and are no longer outstanding.
Credit Arrangements with Fagen Energy
Subsequent to our fiscal year end, we subscribed to purchase 1,500 capital units of Ring-neck Energy & Feed, LLC (“Ring-neck”) at a price of $5,000 per unit for a total of $7,500,000. If Ring-neck accepts our subscription, our investment is sufficient to secure the Company the right to appoint one director to the board of directors of Ring-neck. Details regarding our subscription for investment in Ring-neck are provided above in the section below entitled “PART I - ITEM 1. BUSINESS - Investments”.
In connection with the subscription, GFE entered into a credit facility with Fagen Energy, LLC (“Fagen Energy”) which allows GFE to borrow up to $7.5 million of variable-rate, amortizing fully non-recourse debt from Fagen Energy using the Ring-neck investment as collateral. Fagen Energy is an affiliate of Fagen, Inc., the design-builder for the Company’s ethanol plants and a member of GFE.
The Fagen Energy loan bears interest from date funds are first advanced on the loan through maturity, at a rate per annum equal to the sum of (x) the One Month LIBOR Index Rate plus (y) 3.05% per annum, with an interest rate floor of 3.55%. The Fagen Energy loan requires annual interest payments only for the first two years of the loan and monthly principal and interest payments for years 3 through 9 based on a 7-year amortization period. The monthly amortized payments will be re-amortized following any change in interest rate. The entire outstanding principal balance of the loan, plus any accrued and unpaid interest thereon, is due and payable in full on November 1, 2025. GFE is permitted to voluntarily prepay all or any portion of the outstanding balance of this loan at any time without premium or penalty.
Pursuant to a pledge agreement and commercial security agreement entered into in connection with the Fagen Energy loan, GFE’s obligations are secured by all of its right, title, and interest in its investment in Ring-neck, including the 1,500 units subscribed for by GFE. The loan is non-recourse to all of GFE’s other assets, meaning that in the event of default, the only remedy available to Fagen Energy will be to foreclose and seize all of GFE’s right, title and interest in its investment in Ring-neck. GFE expects to use the proceeds of the loan to finance its balance of its investment in Ring-neck. As of January 30, 2017, there were no amounts outstanding under this credit facility.
Heron Lake BioEnergy
Credit Arrangements with AgStar
HLBE has a comprehensive credit facility with AgStar Financial Services, FCLA (“AgStar”) which consists of a revolving term loan with a maturity date of March 1, 2022. As part of the credit facility closing, HLBE entered into an administrative agency agreement with CoBank, ACP (“CoBank”). CoBank purchased a participation interest in the AgStar loans and was appointed the administrative agent for the purpose of servicing the loans. As a result, CoBank acts as the agent for AgStar with respect to the credit facility.
50
Under the AgStar revolving term note, HLBE may borrow, repay, and re-borrow up to the aggregate principal commitment. The revolving term loan principal commitment, initially $28.0 million, declines by $3.5 million annually, effective March 1, 2015 and continuing each anniversary thereafter until maturity. In the event any amount is outstanding on this loan in excess of maximum aggregate principal commitment following a scheduled reduction, HLBE has agreed to repay principal on the loan until HLBE reachs the new reduced maximum aggregate principal commitment. The maximum aggregate principal commitment under this facility at October 31, 2016 and 2015 was $21.0 million and $24.5 million, respectively. The outstanding balance on the revolving term loan totaled $0 and approximately $4.8 million at October 31, 2016 and 2015, respectively. Therefore, after accounting for amounts outstanding under this facility, the aggregate principal amount available to HLBE for additional borrowing was $21.0 million at October 31, 2016.
Interest on this loan accrues at 3.25% above the One-Month London Interbank Offered Rate (LIBOR) Index rate. HLBE may elect to enter into a fixed interest rate on this loan at various times throughout the term of the loan as provided in the loan agreements. The interest rate was 3.45% at October 31, 2016, and October 31, 2015, respectively.
HLBE also agreed to pay an unused commitment fee on the unused portion of the revolving term loan commitment at the rate of 0.50% per annum. The loan is secured by substantially all of HLBE's assets including a subsidiary guarantee.
HLBE's credit facility with AgStar is subject to numerous financial and non-financial covenants that limit HLBE’s distributions and debt and require minimum working capital, minimum local net worth, and debt service coverage ratio, including the following:
|
· |
HLBE may not make loans or advances to Agrinatural, which exceed an aggregate principal amount of approximately $3.1 million without the consent of AgStar. As of October 31, 2016, HLBE has outstanding loans to Agrinatural in an aggregate principal amount of approximately $5.3 million. These loans were consented to by AgStar. |
|
· |
HLBE must maintain working capital of at least $8.0 million. Working capital is calculated as unconsolidated current assets plus the amount available under revolving term loan, less unconsolidated current liabilities. |
|
· |
HLBE must maintain net worth of at least $32.0 million. Local net worth is defined as unconsolidated total assets, minus unconsolidated total liabilities plus the approximately $3.9 million of subordinated convertible debt that was converted into units on July 1, 2014. |
|
· |
HLBE must maintain a debt service coverage ratio of at least 1.5 to 1.0. The debt service coverage ratio is, calculated on an unconsolidated basis, net income (after taxes), plus depreciation and amortization, minus non-cash dividends/income received, minus extraordinary gains (plus losses), minus gain (plus loss) on asset sales and divided by $4.0 million. |
|
· |
HLBE may make member distributions of up to 65% of our net income without the consent of AgStar provided we remain in compliance with its loan covenants following the distribution. Any member distributions in excess of 65% of HLBE’s net income must be pre-approved by AgStar. |
As of October 31, 2016 and 2015, HLBE was in compliance with these loan covenants. Management’s current financial projections indicate that HLBE will be in compliance with our financial covenants for fiscal year 2017 and thereafter. However, if market conditions deteriorate in the future, circumstances may develop which could result HLBE violating the financial covenants or other terms of its AgStar credit facility. If HLBE fails to comply with the terms of its credit agreement with AgStar, and AgStar refuses to waive the non-compliance, AgStar could terminate the credit facility and any commitment to loan funds to HLBE.
Other HLBE Credit Arrangements
In addition to its primary credit arrangement with AgStar, HLBE has other material credit arrangements and debt obligations.
51
In October 2003, HLBE entered into an industrial water supply development and distribution agreement with the City of Heron Lake, Jackson County, and Minnesota Soybean Processors, an unrelated company. In consideration of this agreement, HLBE and Minnesota Soybean Processors are allocated equally the debt service on $735,000 in water revenue bonds that were issued by the City to support this project that mature in February 2019. The parties have agreed that prior to the scheduled expiration of the agreement, they will negotiate in good faith to replace the agreement with a further agreement regarding the wells and related facilities.
In May 2006, HLBE entered into an industrial water supply treatment agreement with the City of Heron Lake and Jackson County. Under this agreement, HLBE pays monthly installments over 24 months starting January 1, 2007 equal to one years’ debt service on approximately $3.6 million in water revenue bonds, which will be returned to HLBE if any funds remain after final payment in full on the bonds and assuming HLBE complies with all payment obligations under the agreement.
As of October 31, 2016 and 2015, there was a total of approximately $1.6 million and $2.0 million in outstanding water revenue bonds, respectively. HLBE classifies its obligations under these bonds as assessments payable. The interest rates on the bonds range from 0.50% to 8.73%.
To fund the purchase of the distribution system and substation for the HLBE plant, HLBE entered into a loan agreement with Federated Rural Electric Association pursuant to which it borrowed $600,000 by a secured promissory note. Under the note, HLBE is required to make monthly payments to Federated Rural Electric Association of $6,250 consisting of principal and an annual maintenance fee of 1% beginning on October 10, 2009. In exchange for this loan, Federated Rural Electric Association was granted a security interest in the distribution system and substation for the plant. The balances of this loan at October 31, 2016 and 2015 were approximately $69,000 and $144,000, respectively.
HLBE also has a note payable to the minority owner of Agrinatural Gas, LLC in the amount of $200,000 and $300,000 at October 31, 2016 and 2015. Interest on the note is One Month LIBOR rate plus 4.0% and payment is due on demand at the discretion of the board of managers of Agrinatural. The interest rate was approximately 4.53% and 4.19% at October 31, 2016 and 2015, respectively.
HLBE Loans to Agrinatural
Original Agrinatural Credit Facility
On July 29, 2014, HLBE entered into an intercompany loan agreement and related loan documents with Agrinatural (the “Original Agrinatural Credit Facility”). Under the Original Agrinatural Credit Facility, HLBE agreed to make a five-year term loan in the principal amount of $3.05 million to Agrinatural for use by Agrinatural to repay approximately $1.4 million of its outstanding debt and provide approximately $1.6 million of working capital to Agrinatural. The Original Agrinatural Credit Facility contains customary financial and non-financial affirmative covenants and negative covenants for loans of this type and size.
On March 30, 2015, HLBE entered into an allonge (the “Allonge”) to the July 29, 2014 note with Agrinatural. Under the terms of the Allonge, HLBE and Agrinatural agreed to increase the principal amount of the Original Agrinatural Credit Facility to approximately $3.06 million, defer commencement of repayment of principal until May 1, 2015, decrease the monthly principal payment to $36,000 per month and shorten maturity of the Original Agrinatural Credit Facility to May 1, 2019.
Interest on the Original Agrinatural Credit Facility was not amended and accrues at a variable rate equal to the One-Month LIBOR rate plus 4.0%, with the interest rate capped and not to exceed 6.0% per annum. Accrued interest is due and payable on a monthly basis. Except as otherwise provided in the Allonge, all of the terms and conditions contained in the Original Agrinatural Credit Facility remain in full force and effect.
In exchange for the Loan Agreement, the Agrinatural executed a security agreement granting HLBE a first lien security interest in all of Agrinatural’s equipment and assets and a collateral assignment assigning HLBE all of Agrinatural’s interests in its contracts, leases, easements and other agreements. In addition, RES, the minority owner of Agrinatural, executed a guarantee under which RES guaranteed full payment and performance of 27% of Agrinatural’s obligations to HLBE.
52
The balance of this loan was approximately $2.4 million and $2.8 million at October 31, 2016 and 2015, respectively.
Additional Agrinatural Credit Facility
On March 30, 2015, HLBE entered into a second intercompany loan agreement and related loan documents (the “Additional Agrinatural Credit Facility”) with Agrinatural. Under the Additional Agrinatural Credit Facility, HLBE agreed to make a four-year term loan in the principal amount of $3.5 million to Agrinatural for use by Agrinatural to repay its outstanding trade debt and provide working capital. The Additional Agrinatural Credit Facility contains customary financial and non-financial affirmative covenants and negative covenants for loans of this type and size.
Interest on the additional term loan accrues at a variable rate equal to the One-Month LIBOR rate plus 4.0%, with the interest rate capped and not to exceed 6.0% per annum. Prior to May 1, 2015, Agrinatural is required to pay only monthly interest on the term loan. Commencing May 1, 2015, Agrinatural is required to make monthly installments of principal plus accrued interest. The entire principal balance and accrued and unpaid interest on the term loan is due and payable in full on May 1, 2019.
On May 19, 2016, HLBE and Agrinatural amended the Additional Agrinatural Credit Facility, entering into amendment to the loan agreement dated March 30, 2015 (the “Amendment”) and an allonge to the negotiable promissory note dated March 30, 2015 issued by Agrinatural to HLBE (the “Additional Allonge”) to increase the amount of the capital expenditures allowed by Agrinatural during the term of the facilty and defer a portion of the principal payments required for 2016.
As provided in the Amendment, for calendar year 2016, Agrinatural may, without consent of HLBE, proceed with and pay for capital expenditures in an amount up to $300,000 plus the amount of contributions in aid of construction received by Agrinatural from customers for capital improvements (“CIAC”), less a reserve for distribution to the Agrinatural members to cover the income or other taxes imposed as a result of receipt of CIAC in an amount equal to 40% of CIAC. For calendar years, 2017, 2018 and 2019, the Amendment provides that Agrinatural may, without consent of HLBE, proceed with and pay for capital expenditures in an amount up to $100,000 plus the amount of CIAC, less a reserve for distribution to the Agrinatural members to cover the income or other taxes imposed as a result of receipt of CIAC in an amount equal to 40% of CIAC. Prior to the Amendment, Agrinatural’s capital expenditures were restricted to $100,000 per year.
Under the terms of the Additional Allonge, HLBE and Agrinatural agreed to decrease monthly principal payments required for the remainder of calendar 2016 (May to December) from approximately $42,000 per month to approximately $9,000 per month with the portion of principal payments deferred in calendar year 2016 to continue to accrue interest at the rate set forth in the note and becoming a part of the balloon payment due at maturity.
In exchange for the Additional Agrinatural Credit Facility, Agrinatural executed a security agreement granting HLBE a first lien security interest in all of Agrinatural’s equipment and assets and a collateral assignment assigning HLBE all of Agrinatural’s interests in its contracts, leases, easements and other agreements. In addition, RES executed a guarantee under which RES guaranteed full payment and performance of 27% of Agrinatural’s obligations to HLBE under the Additional Agrinatural Credit Facility.
The balance of this loan was approximately $2.9 million and $3.3 million at October 31, 2015 and 2016, respectively.
53
Contractual Obligations
The following table provides information regarding the contractual obligations of the Company as of October 31, 2016 (amounts in thousands):
|
|
|
|
|
|
Less than |
|
One to |
|
Three to |
|
Greater Than |
|
||||
|
|
|
Total |
|
One Year |
|
Three Years |
|
Five Years |
|
Five Years |
|
|||||
|
Long-Term Debt Obligations (1) |
|
$ |
2,225 |
|
$ |
556 |
|
$ |
921 |
|
$ |
748 |
|
$ |
— |
|
|
Operating Lease Obligations (2) |
|
|
33,039 |
|
|
4,607 |
|
|
7,711 |
|
|
7,180 |
|
|
13,541 |
|
|
Purchase Obligations (3) |
|
|
10,395 |
|
|
10,395 |
|
|
— |
|
|
— |
|
|
— |
|
|
Total Contractual Obligations |
|
$ |
45,659 |
|
$ |
15,558 |
|
$ |
8,632 |
|
$ |
7,928 |
|
$ |
13,541 |
|
|
(1) |
Long-term debt obligations include principal and estimated interest under our credit facilities based on the interest rates in effect as of October 31, 2016, assuming contractual maturities. |
|
(2) |
Operating lease obligations include GFE’s and HLBE’s rail car leases (See Note 10 to the accompanying audited consolidated financial statements). |
|
(3) |
Purchase obligations consist of GFE’s and HLBE’s forward contracted corn deliveries. The amounts were determined assuming prices, including freight costs, at current market prices as of October 31, 2016 for basis contracts that had not yet been fixed. (See Note 14 to the accompanying audited consolidated financial statements). |
Off-Balance Sheet Arrangements
We currently have no off-balance sheet arrangements.
Critical Accounting Estimates
Note 1 to our consolidated financial statements contains a summary of our significant accounting policies, many of which require management to use estimates and assumptions. Accounting estimates are an integral part of the preparation of financial statements and are based upon management’s current judgment. We use our knowledge and experience about past events and certain future assumptions to make estimates and judgments involving matters that are inherently uncertain and that affect the reported amounts of assets and liabilities, the disclosure of contingent assets and liabilities, and the reported revenues and expenses. We believe that of our significant accounting policies, the following are most noteworthy because changes in these estimates or assumptions could materially affect our financial position and results of operations:
Revenue Recognition
The Company generally sells ethanol and related products pursuant to marketing agreements. Revenues from the production of ethanol and its co-products are recorded when the customer has taken title and assumed the risks and rewards of ownership, prices are fixed or determinable and collectability is reasonably assured. Title is generally assumed by the buyer at the Company's shipping point. The Company believes there are no ethanol sales, during any given month, which should be considered contingent and recorded as deferred revenue.
In accordance with the Company's agreements for the marketing and sale of ethanol and related products, marketing fees and commissions due to the marketers are deducted from the gross sales price as earned. Shipping costs incurred by the Company in the sale of ethanol are not specifically identifiable and as a result, are recorded based on the net selling price reported to the Company from the marketer. Shipping costs incurred by the Company in the sale of co‑products are included in cost of goods sold.
Agrinatural recognizes revenue when persuasive evidence of an arrangement exists, delivery has occurred or services have been rendered, the fee for the arrangement is fixed or determinable and collectability is reasonably assured.
54
Derivative Instruments
From time to time, we enter into forward sales contracts for ethanol, distillers and corn oil, and purchase contracts for corn and natural gas to hedge our exposure to commodity price fluctuations. These contracts provide for the purchase or sale of something other than a financial instrument or derivative instrument that will be delivered in quantities expected to be used or sold over a reasonable period in the normal course of business. Accordingly, we classify these sales and purchase contracts as normal sales and purchase contracts and as a result, these contracts are not marked to market in our financial statements.
On occasion, in order to reduce the risks caused by market fluctuations, the Company hedges its anticipated corn, natural gas, and denaturant purchases and ethanol sales by entering into options and futures contracts. These contracts are used with the intention to fix the purchase price of anticipated requirements for corn in the Company's ethanol production activities and the related sales price of ethanol. The fair value of these contracts is based on quoted prices in active exchange-traded or over-the-counter market conditions. Although the Company believes its commodity derivative positions are economic hedges, none have been formally designated as a hedge for accounting purposes and derivative positions are recorded on the balance sheet at their fair market value, with changes in fair value recognized in current period earnings or losses. The Company does not enter into financial instruments for trading or speculative purposes.
Inventory
We value our inventory at the lower of cost using the first in first out method or net realized value. Our estimates are based upon assumptions believed to be reasonable, but which are inherently uncertain and unpredictable. These valuations require the use of management’s assumptions which do not reflect unanticipated events and circumstances that may occur. In our analysis, we consider future corn costs and ethanol prices, break-even points for our plants and our risk management strategies in place through our use of derivative instruments. Given the significant assumptions required and the possibility that actual conditions will differ, we consider the valuation of the lower of cost or net realized value on inventory to be a critical accounting estimate.
Property and Equipment
Management’s estimate of the depreciable lives of property, plant, and equipment is based on the estimated useful lives. We review long-lived assets for impairment whenever events or changes in circumstances indicate that the related carrying amounts may not be recoverable. Impairment testing for assets requires various estimates and assumptions, including an allocation of cash flows to those assets and, if required, an estimate of the fair value of those assets. The Company tests for impairment at the asset group level, which is the lowest level for which identifiable cash flows are largely independent of the cash flows of other groups of assets and liabilities. Our estimates are based upon assumptions believed to be reasonable, but which are inherently uncertain and unpredictable. These valuations require the use of management’s assumptions, which do not reflect unanticipated events and circumstances that may occur. In our analysis, we consider future corn costs and ethanol prices, break-even points for our plant and our risk management strategies in place through our derivative instruments and forward contracts. Given the significant assumptions required and the possibility that actual conditions will differ, we consider the assessment of impairment of our long-lived assets to be a critical accounting estimate.
ITEM 7A. QUANTITATIVE AND QUALITATIVE DISCLOSURES ABOUT MARKET RISK
We are exposed to the impact of market fluctuations associated with interest rates and commodity prices as discussed below. We have no exposure to foreign currency risk as all of our business is conducted in U.S. Dollars. foreign currency risk as all of our business is conducted in U.S. Dollars. We use derivative financial instruments as part of an overall strategy to manage market risk. We use cash, futures and option contracts to hedge changes to the commodity prices of corn, ethanol and natural gas. We do not enter into these derivative financial instruments for trading or speculative purposes, nor do we designate these contracts as hedges for accounting purposes pursuant to the requirements of Generally Accepted Accounting Principles (“GAAP”).
55
Interest Rate Risk
Exposure to interest rate risk results primarily from our credit facilities with our credit facilities with United FCS and Fagen Energy and HLBE’s credit facilities with AgStar and its note payable to the minority owner of Agrinatural. The specifics of these credit facilities are discussed in greater detail in “ITEM 7 - MANAGEMENT’S DISCUSSION AND ANALYSIS OF FINANCIAL CONDITION AND RESULTS OF OPERATIONS - Credit Arrangements.”
At October 31, 2016, there were no amounts outstanding under GFE’s credit facility with United FCS or Fagen Energy or HLBE’s credit facility with AgStar. Therefore, at October 31, 2016, we had exposure to interest rate risk only from the amounts outstanding on note payable to the minority owner of Agrinatural. Below is a sensitivity analysis we prepared regarding our income exposure to changes in interest rates. The sensitivity analysis below shows the anticipated effect on our income from a 10% adverse change in interest rates for a one-year period.
|
Outstanding Variable |
|
|
|
|
|
|
|
|
|
|
|
|
Rate Debt at |
|
Interest Rate at |
|
Interest Rate Following 10% |
|
Approximate Adverse |
|
||||
|
October 31, 2016 |
|
October 31, 2016 |
|
Adverse Change |
|
Change to Income |
|
||||
|
$ |
200,000 |
|
4.20 |
% |
|
4.62 |
% |
|
$ |
1,000 |
|
Commodity Price Risk
We seek to minimize the risks from fluctuations in the prices of raw material inputs, such as corn and natural gas, and finished products, such as ethanol and distillers’ grains, through the use of hedging instruments. In practice, as markets move, we actively manage our risk and adjust hedging strategies as appropriate. Although we believe our hedge positions accomplish an economic hedge against our future purchases and sales, management has chosen not to use hedge accounting, which would match the gain or loss on our hedge positions to the specific commodity purchase being hedged. We are using fair value accounting for our hedge positions, which means as the current market price of our hedge positions changes, the realized or unrealized gains and losses are immediately recognized in our cost of goods sold or as an offset to revenues. The immediate recognition of hedging gains and losses under fair value accounting can cause net income to be volatile from quarter to quarter due to the timing of the change in value of the derivative instruments relative to the cost and use of the commodity being hedged.
Commodity Price Risk Protection
We seek to minimize the risks from fluctuations in the prices of corn, ethanol, denaturant and natural gas through the use of derivative instruments. In practice, as markets move, we actively manage our risk and adjust hedging strategies as appropriate. We do not use hedge accounting which would match the gain or loss on our hedge positions to the specific commodity contracts being hedged. Instead, we are using fair value accounting for our hedge positions, which means that as the current market price of our hedge positions changes, the gains and losses are immediately recognized in our revenue or cost of goods sold depending on the commodity that is hedged. The immediate recognition of hedging gains and losses under fair value accounting can cause net income to be volatile from quarter to quarter due to the timing of the change in value of the derivative instruments relative to the cost and use of the commodity being hedged.
As of October 31, 2016, we had price protection in place for approximately 24% of GFE’s anticipated corn needs at the GFE plant and 15% of GFE’s ethanol sales for the next 12 months. As of October 31, 2016, we had price protection in place for approximately 19% of HLBE’s anticipated corn needs and 15% of its ethanol sales for the next 12 months. As input prices move in reaction to market trends and information, our income statement will be affected depending on the impact such market movements have on the value of our derivative instruments. Depending on market movements, crop prospects and weather, these price protection positions may cause immediate adverse effects, but are expected to produce long-term positive growth for us.
56
A sensitivity analysis has been prepared to estimate our exposure to ethanol, corn and natural gas price risk. Market risk related to these factors is estimated as the potential change in income resulting from a hypothetical 10% adverse change in the spot prices of corn, natural gas, and ethanol as of October 31, 2016, net of the forward and future contracts used to hedge our market risk for corn and natural gas usage requirements. The volumes are based on our expected use and sale of these commodities for a one year period from October 31, 2016 for both the GFE and HLBE plants. The results of this analysis, which may differ from actual results, are as follows:
|
|
|
Estimated Volume Requirements for the next |
|
Hypothetical Adverse Change in |
|
|
|
|
|
|
|
|
12 months (net of forward and futures |
|
Price as of |
|
Approximate Adverse Change to |
|
||
|
|
|
contracts) |
|
October 31, 2016 |
|
Income |
|
||
|
Ethanol |
|
109,550,000 |
|
10 |
% |
|
$ |
17,648,300 |
|
|
Corn |
|
41,600,000 |
|
10 |
% |
|
$ |
12,961,000 |
|
|
Natural Gas |
|
3,270,000 |
|
10 |
% |
|
$ |
1,093,000 |
|
Participation in Captive Reinsurance Company
We participate in a captive reinsurance company (“Captive”). The Captive reinsures losses related to workman’s compensation, commercial property and general liability. Premiums are accrued by a charge to income for the period to which the premium relates and is remitted by our insurer to the captive reinsurer. The Captive reinsures losses in excess of a predetermined amount. The Captive insurer has estimated and collected a premium amount in excess of expected losses but less than the aggregate loss limits reinsured by the Captive. We have contributed limited capital surplus to the Captive that is available to fund losses should the actual losses sustained exceed premium funding. So long as the Captive is fully-funded through premiums and capital contributions to the aggregate loss limits reinsured, and the fronting insurers are financially strong, we cannot be assessed over the amount of our current contributions.
57
ITEM 8.FINANCIAL STATEMENTS AND SUPPLEMENTARY DATA

REPORT OF INDEPENDENT REGISTERED PUBLIC ACCOUNTING FIRM
Board of Governors
Granite Falls Energy, LLC and Subsidiaries
Granite Falls, Minnesota
We have audited the accompanying consolidated balance sheets of Granite Falls Energy, LLC and Subsidiaries (the “Company”) as of October 31, 2016 and 2015, and the related consolidated statements of operations, changes in members’ equity, and cash flows for each of the years in the three-year period ended October 31, 2016. Granite Falls Energy, LLC’s management is responsible for these consolidated financial statements. Our responsibility is to express an opinion on these consolidated financial statements based on our audits.
We conducted our audits in accordance with the standards of the Public Company Accounting Oversight Board (United States). Those standards require that we plan and perform the audit to obtain reasonable assurance about whether the consolidated financial statements are free of material misstatement. The Company is not required to have, nor were we engaged to perform, an audit of its internal control over financial reporting. Our audit included consideration of internal control over financial reporting as a basis for designing audit procedures that are appropriate in the circumstances, but not for the purpose of expressing an opinion on the effectiveness of the Company’s internal control over financial reporting. Accordingly, we express no such opinion. An audit also includes examining, on a test basis, evidence supporting the amounts and disclosures in the consolidated financial statements, assessing the accounting principles used and significant estimates made by management, as well as evaluating the overall financial statement presentation. We believe that our audits provide a reasonable basis for our opinion.
In our opinion, the consolidated financial statements referred to above present fairly, in all material respects, the financial position of Granite Falls Energy, LLC and Subsidiaries as of October 31, 2016 and 2015, and the results of its operations and its cash flows for each of the years in the three-year period ended October 31, 2016 in conformity with accounting principles generally accepted in the United States of America.
|
|
/s/ Boulay PLLP |
|
|
Certified Public Accountants |
|
|
|
|
Minneapolis, Minnesota |
|
|
January 30, 2017 |
|
58
GRANITE FALLS ENERGY, LLC AND SUBSIDIARIES
|
ASSETS |
|
October 31, 2016 |
|
October 31, 2015 |
|
||
|
Current Assets |
|
|
|
|
|
|
|
|
Cash |
|
$ |
13,797,857 |
|
$ |
12,696,536 |
|
|
Accounts receivable |
|
|
6,654,994 |
|
|
9,667,472 |
|
|
Inventory |
|
|
18,341,413 |
|
|
12,212,025 |
|
|
Commodity derivative instruments |
|
|
1,228,926 |
|
|
677,149 |
|
|
Prepaid expenses and other current assets |
|
|
325,989 |
|
|
259,862 |
|
|
Total current assets |
|
|
40,349,179 |
|
|
35,513,044 |
|
|
|
|
|
|
|
|
|
|
|
Property and Equipment, net |
|
|
78,968,016 |
|
|
84,304,162 |
|
|
|
|
|
|
|
|
|
|
|
Goodwill |
|
|
1,372,473 |
|
|
1,372,473 |
|
|
|
|
|
|
|
|
|
|
|
Other Assets |
|
|
781,254 |
|
|
821,402 |
|
|
|
|
|
|
|
|
|
|
|
Total Assets |
|
$ |
121,470,922 |
|
$ |
122,011,081 |
|
|
|
|
|
|
|
|
|
|
|
LIABILITIES AND MEMBERS' EQUITY |
|
|
|
|
|
|
|
|
Current Liabilities |
|
|
|
|
|
|
|
|
Current maturities of long-term debt |
|
$ |
490,057 |
|
$ |
517,957 |
|
|
Checks drawn in excess of bank balance |
|
|
1,866,683 |
|
|
1,836,682 |
|
|
Accounts payable |
|
|
5,624,840 |
|
|
4,643,130 |
|
|
Corn payable to FCE |
|
|
5,358,111 |
|
|
1,486,247 |
|
|
Commodity derivative instruments |
|
|
— |
|
|
1,114 |
|
|
Accrued expenses |
|
|
997,319 |
|
|
654,550 |
|
|
Total current liabilities |
|
|
14,337,010 |
|
|
9,139,680 |
|
|
|
|
|
|
|
|
|
|
|
Long-Term Debt, less current portion |
|
|
1,393,669 |
|
|
6,711,975 |
|
|
|
|
|
|
|
|
|
|
|
Commitments and Contingencies |
|
|
|
|
|
|
|
|
|
|
|
|
|
|
|
|
|
Members' Equity |
|
|
|
|
|
|
|
|
Members' equity attributable to Granite Falls Energy, LLC consists of 30,606 units authorized, issued, and outstanding at both October 31, 2016 and 2015 |
|
|
83,684,529 |
|
|
84,602,607 |
|
|
Non-controlling interest |
|
|
22,055,714 |
|
|
21,556,819 |
|
|
Total members' equity |
|
|
105,740,243 |
|
|
106,159,426 |
|
|
|
|
|
|
|
|
|
|
|
Total Liabilities and Members' Equity |
|
$ |
121,470,922 |
|
$ |
122,011,081 |
|
Notes to the Consolidated Financial Statements are an integral part of this Statement.
59
GRANITE FALLS ENERGY, LLC AND SUBSIDIARIES
Consolidated Statements of Operations
|
|
|
Fiscal Year Ended October 31, |
|
||||||||
|
|
|
2016 |
|
2015 |
|
|
2014 |
|
|||
|
|
|
|
|
|
|
|
|
|
|
|
|
|
Revenues |
|
$ |
215,526,226 |
|
$ |
231,254,508 |
|
|
$ |
300,954,984 |
|
|
|
|
|
|
|
|
|
|
|
|
|
|
|
Cost of Goods Sold |
|
|
198,627,132 |
|
|
208,654,190 |
|
|
|
237,433,629 |
|
|
|
|
|
|
|
|
|
|
|
|
|
|
|
Gross Profit |
|
|
16,899,094 |
|
|
22,600,318 |
|
|
|
63,521,355 |
|
|
|
|
|
|
|
|
|
|
|
|
|
|
|
Operating Expenses |
|
|
5,325,569 |
|
|
5,175,915 |
|
|
|
5,150,506 |
|
|
|
|
|
|
|
|
|
|
|
|
|
|
|
Operating Income |
|
|
11,573,525 |
|
|
17,424,403 |
|
|
|
58,370,849 |
|
|
|
|
|
|
|
|
|
|
|
|
|
|
|
Other Income (Expense): |
|
|
|
|
|
|
|
|
|
|
|
|
Other income, net |
|
|
99,735 |
|
|
38,169 |
|
|
|
242,920 |
|
|
Interest income |
|
|
8,400 |
|
|
9,369 |
|
|
|
8,886 |
|
|
Interest expense |
|
|
(453,398) |
|
|
(525,108) |
|
|
|
(485,238) |
|
|
Settlement of debt premium |
|
|
— |
|
|
— |
|
|
|
953,086 |
|
|
Total other income (expense), net |
|
|
(345,263) |
|
|
(477,570) |
|
|
|
719,654 |
|
|
|
|
|
|
|
|
|
|
|
|
|
|
|
Net Income |
|
$ |
11,228,262 |
|
$ |
16,946,833 |
|
|
$ |
59,090,503 |
|
|
|
|
|
|
|
|
|
|
|
|
|
|
|
Less: Net Income Attributable to Non-controlling Interest |
|
|
(2,505,454) |
|
|
(3,360,083) |
|
|
|
(10,316,612) |
|
|
|
|
|
|
|
|
|
|
|
|
|
|
|
Net Income Attributable to Granite Falls Energy, LLC |
|
$ |
8,722,808 |
|
$ |
13,586,750 |
|
|
$ |
48,773,891 |
|
|
|
|
|
|
|
|
|
|
|
|
|
|
|
Weighted Average Units Outstanding - Basic and Diluted |
|
|
30,606 |
|
|
30,606 |
|
|
|
30,606 |
|
|
|
|
|
|
|
|
|
|
|
|
|
|
|
Amounts attributable to Granite Falls Energy, LLC: |
|
|
|
|
|
|
|
|
|
|
|
|
|
|
|
|
|
|
|
|
|
|
|
|
|
Net Income Per Unit - Basic and Diluted |
|
$ |
285.00 |
|
$ |
443.92 |
|
|
$ |
1,593.61 |
|
|
|
|
|
|
|
|
|
|
|
|
|
|
|
Distributions Per Unit - Basic and Diluted |
|
$ |
315.00 |
|
$ |
1,050.00 |
|
|
$ |
180.00 |
|
Notes to the Consolidated Financial Statements are an integral part of this Statement.
60
GRANITE FALLS ENERGY, LLC AND SUBSIDIARIES
Consolidated Statement of Changes in Members’ Equity
|
|
|
Members' Equity |
|
|
|
|
|
|
|
|
|
|
|
Attributable to |
|
|
|
|
|
|
|
|
|
|
|
Granite Falls |
|
Non-controlling |
|
Total Members' |
|
|||
|
|
|
Energy, LLC |
|
Interest |
|
Equity |
|
|||
|
|
|
|
|
|
|
|
|
|
|
|
|
Balance - October 31, 2013 |
|
$ |
59,887,346 |
|
$ |
8,480,657 |
|
$ |
68,368,003 |
|
|
|
|
|
|
|
|
|
|
|
|
|
|
Distribution |
|
|
(5,509,080) |
|
|
— |
|
|
(5,509,080) |
|
|
Cancellation of accrued distribution to non-controlling interest |
|
|
— |
|
|
84,807 |
|
|
84,807 |
|
|
Issuance of subsidiary units attributable to non-controlling interest |
|
|
— |
|
|
3,936,000 |
|
|
3,936,000 |
|
|
Net income attributable to non-controlling interest |
|
|
— |
|
|
10,316,612 |
|
|
10,316,612 |
|
|
Net income attributable to Granite Falls Energy, LLC |
|
|
48,773,891 |
|
|
— |
|
|
48,773,891 |
|
|
|
|
|
|
|
|
|
|
|
|
|
|
Balance - October 31, 2014 |
|
|
103,152,157 |
|
|
22,818,076 |
|
|
125,970,233 |
|
|
|
|
|
|
|
|
|
|
|
|
|
|
Distribution |
|
|
(32,136,300) |
|
|
(4,621,340) |
|
|
(36,757,640) |
|
|
Net income attributable to non-controlling interest |
|
|
— |
|
|
3,360,083 |
|
|
3,360,083 |
|
|
Net income attributable to Granite Falls Energy, LLC |
|
|
13,586,750 |
|
|
— |
|
|
13,586,750 |
|
|
|
|
|
|
|
|
|
|
|
|
|
|
Balance - October 31, 2015 |
|
|
84,602,607 |
|
|
21,556,819 |
|
|
106,159,426 |
|
|
|
|
|
|
|
|
|
|
|
|
|
|
Distribution |
|
|
(9,640,886) |
|
|
(2,006,559) |
|
|
(11,647,445) |
|
|
Net income attributable to non-controlling interest |
|
|
— |
|
|
2,505,454 |
|
|
2,505,454 |
|
|
Net income attributable to Granite Falls Energy, LLC |
|
|
8,722,808 |
|
|
— |
|
|
8,722,808 |
|
|
|
|
|
|
|
|
|
|
|
|
|
|
Balance - October 31, 2016 |
|
$ |
83,684,529 |
|
$ |
22,055,714 |
|
$ |
105,740,243 |
|
Notes to the Consolidated Financial Statements are an integral part of this Statement.
61
GRANITE FALLS ENERGY, LLC AND SUBSIDIARIES
Consolidated Statements of Cash Flows
|
|
|
Fiscal Year Ended October 31, |
|
|||||||
|
|
|
2016 |
|
2015 |
|
2014 |
|
|||
|
|
|
|
|
|
|
|
|
|
|
|
|
Cash Flows from Operating Activities: |
|
|
|
|
|
|
|
|
|
|
|
Net income |
|
$ |
11,228,262 |
|
$ |
16,946,833 |
|
$ |
59,090,503 |
|
|
Adjustments to reconcile net income to net cash provided by operations: |
|
|
|
|
|
|
|
|
|
|
|
Depreciation and amortization |
|
|
9,681,148 |
|
|
9,650,226 |
|
|
9,267,367 |
|
|
Change in fair value of commodity derivative instruments |
|
|
(581,400) |
|
|
(303,925) |
|
|
(1,134,402) |
|
|
Loss on sale of equipment and other |
|
|
— |
|
|
— |
|
|
137,397 |
|
|
Settlement of debt premium |
|
|
— |
|
|
— |
|
|
(953,086) |
|
|
Changes in operating assets and liabilities: |
|
|
|
|
|
|
|
|
|
|
|
Restricted cash |
|
|
— |
|
|
492,099 |
|
|
(98,349) |
|
|
Commodity derivative instruments |
|
|
28,509 |
|
|
923,628 |
|
|
(236,449) |
|
|
Accounts recievable |
|
|
3,012,478 |
|
|
(385,771) |
|
|
(2,831,007) |
|
|
Inventory |
|
|
(6,129,388) |
|
|
(1,486,881) |
|
|
1,645,133 |
|
|
Prepaid expenses and other current assets |
|
|
(66,127) |
|
|
138,611 |
|
|
698,010 |
|
|
Accounts payable |
|
|
5,276,025 |
|
|
(1,017,508) |
|
|
269,699 |
|
|
Accrued expenses |
|
|
342,769 |
|
|
4,556 |
|
|
37,943 |
|
|
Net Cash Provided by Operating Activities |
|
|
22,792,276 |
|
|
24,961,868 |
|
|
65,892,759 |
|
|
|
|
|
|
|
|
|
|
|
|
|
|
Cash Flows from Investing Activities: |
|
|
|
|
|
|
|
|
|
|
|
Payments for capital expenditures |
|
|
(4,727,305) |
|
|
(8,824,669) |
|
|
(5,788,698) |
|
|
Proceeds from sale or disposal of assets |
|
|
— |
|
|
— |
|
|
80,285 |
|
|
Net Cash Used in Investing Activities |
|
|
(4,727,305) |
|
|
(8,824,669) |
|
|
(5,708,413) |
|
|
|
|
|
|
|
|
|
|
|
|
|
|
Cash Flows from Financing Activities: |
|
|
|
|
|
|
|
|
|
|
|
Proceeds from long-term debt |
|
|
9,820,222 |
|
|
13,440,989 |
|
|
— |
|
|
Payments on long-term debt |
|
|
(15,166,428) |
|
|
(9,169,704) |
|
|
(28,418,030) |
|
|
Payments on subsidiary convertible subordinated debt |
|
|
— |
|
|
— |
|
|
(207,000) |
|
|
Proceeds from checks drawn in excess of bank balance |
|
|
30,001 |
|
|
1,836,682 |
|
|
— |
|
|
Distributions to non-controlling interests |
|
|
(2,006,559) |
|
|
(4,621,340) |
|
|
— |
|
|
Member distributions paid |
|
|
(9,640,886) |
|
|
(32,136,300) |
|
|
(5,509,080) |
|
|
Net Cash Used in Financing Activities |
|
|
(16,963,650) |
|
|
(30,649,673) |
|
|
(34,134,110) |
|
|
|
|
|
|
|
|
|
|
|
|
|
|
Net Increase (Decrease) in Cash |
|
|
1,101,321 |
|
|
(14,512,474) |
|
|
26,050,236 |
|
|
|
|
|
|
|
|
|
|
|
|
|
|
Cash - Beginning of Period |
|
|
12,696,536 |
|
|
27,209,010 |
|
|
1,158,774 |
|
|
|
|
|
|
|
|
|
|
|
|
|
|
Cash - End of Period |
|
$ |
13,797,857 |
|
$ |
12,696,536 |
|
$ |
27,209,010 |
|
|
|
|
|
|
|
|
|
|
|
|
|
|
Supplemental Cash Flow Information |
|
|
|
|
|
|
|
|
|
|
|
Cash paid during the period for: |
|
|
|
|
|
|
|
|
|
|
|
Interest expense |
|
$ |
453,398 |
|
$ |
525,108 |
|
|
1,485,331 |
|
|
|
|
|
|
|
|
|
|
|
|
|
|
Supplemental Disclosure of Noncash Investing and Financing Activities |
|
|
|
|
|
|
|
|
|
|
|
Conversion of subsidiary subordinated convertible notes |
|
$ |
— |
|
$ |
— |
|
$ |
3,936,000 |
|
|
Cancellation of accrued distribution to non-controlling interest |
|
$ |
— |
|
$ |
— |
|
$ |
84,807 |
|
|
Capital expenditures and construction in process included in accounts payable |
|
$ |
— |
|
$ |
422,451 |
|
$ |
3,359,225 |
|
Notes to the Consolidated Financial Statements are an integral part of this Statement.
62
GRANITE FALLS ENERGY, LLC AND SUBSIDIARIES
Notes to Consolidated Financial Statements
1. SUMMARY OF SIGNIFICANT ACCOUNTING POLICIES
Nature of Business
Granite Falls Energy, LLC (“GFE”) is a Minnesota limited liability company currently producing fuel-grade ethanol, distillers’ grains, and crude corn oil near Granite Falls, Minnesota and sells these products, pursuant to marketing agreements, throughout the continental U.S. and on the international market. GFE’s plant has an approximate annual production capacity of 60 million gallons, but is currently permitted to produce up to 70 million gallons of undenatured ethanol on a twelve month rolling sum basis.
Additionally, GFE owns a majority interest in Heron Lake BioEnergy, LLC (“HLBE”). HLBE is a Minnesota limited liability company currently producing fuel-grade ethanol, distillers’ grains, and crude corn oil near Heron Lake, Minnesota and sells these products, pursuant to marketing agreements, throughout the continental U.S. HLBE’s plant has an approximate annual production capacity of 60 million gallons, but is currently permitted to produce up to 72.3 million gallons per year of undenatured ethanol on a twelve month rolling sum basis. Additionally, HLBE, through a majority owned subsidiary, operates a natural gas pipeline that provides natural gas to the HLBE’s ethanol production facility and other customers.
Principles of Consolidation
The accompanying consolidated financial statements consolidate the operating results and financial position of GFE, and its approximately 50.6% owned subsidiary, HLBE (through GFE’s 100% ownership of Project Viking, L.L.C.). Given GFE’s control over the operations of HLBE and its majority voting interest, GFE consolidates the financial statements of HLBE with its consolidated financial statements. The remaining approximately 49.4% ownership of HLBE is included in the consolidated financial statements as a non-controlling interest. HLBE, through its wholly owned subsidiary, HLBE Pipeline Company, LLC, owns 73.0% of Agrinatural Gas, LLC (“Agrinatural”). Given HLBE’s control over the operations of Agrinatural and its majority voting interest, HLBE consolidates the financial statements of Agrinatural with its consolidated financial statements, with the remaining approximately 27.0% ownership of HLBE attributed to the non-controlling interest. All intercompany balances and transactions are eliminated in consolidation. All references to “we”, “us”, “our”, and the “Company” collectively refer to GFE and its wholly owned and majority owned subsidiaries.
Fiscal Reporting Period
The Company’s fiscal year end for reporting financial operations is October 31 for financial reporting purposes.
Accounting Estimates
Management uses estimates and assumptions in preparing these consolidated financial statements in accordance with generally accepted accounting principles in the U.S. of America. Those estimates and assumptions affect the reported amounts of assets and liabilities, the disclosure of contingent assets and liabilities, and the reported revenues and expenses. The Company uses estimates and assumptions in accounting for the following significant matters, among others: economic lives of property, and equipment, valuation of commodity derivatives, inventory, and inventory purchase and sale commitments, and the assumptions used in the impairment analysis of long-lived assets, which includes goodwill. Actual results may differ from previously estimated amounts, and such differences may be material to our consolidated financial statements. The Company periodically reviews estimates and assumptions, and the effects of revisions are reflected in the period in which the revision is made.
Revenue Recognition
The Company generally sells ethanol and related products pursuant to marketing agreements. Revenues from the production of ethanol and the related products are recorded when the customer has taken title and assumed the risks and rewards of ownership, prices are fixed or determinable and collectability is reasonably assured. Ethanol and related products are generally shipped free on board (FOB) shipping point. The Company believes there are no ethanol sales, during any given month, which should be considered contingent and recorded as deferred revenue.
63
GRANITE FALLS ENERGY, LLC AND SUBSIDIARIES
Notes to Consolidated Financial Statements
In accordance with the Company’s agreements for the marketing and sale of ethanol and related products, marketing fees and commissions due to the marketers are deducted from the gross sales price as earned. These fees and commissions are recorded net of revenues, as they do not provide an identifiable benefit that is sufficiently separable from the sale of ethanol and related products. Shipping costs paid by the Company to the marketer in the sale of ethanol are not specifically identifiable and, as a result, are recorded based on the net selling price reported to the Company from the marketer. Shipping costs incurred by the Company in the sale of distillers’ grains and corn oil are included in cost of goods sold.
Agrinatural recognizes revenue when persuasive evidence of an arrangement exists, delivery has occurred or services have been rendered, the fee for the arrangement is fixed or determinable and collectability is reasonably assured.
Cash
The Company maintains its accounts primarily at multiple financial institutions, of which one is a member of the Company. At times throughout the year, the Company’s cash balances may exceed amounts insured by the Federal Deposit Insurance Corporation. The Company does not believe it is exposed to any significant credit risk on its cash balances.
Restricted Cash
The Company is periodically required to maintain at its broker cash balances related to open commodity derivative instrument positions as discussed in Note 6.
Accounts Receivable
Credit terms are extended to customers in the normal course of business. The Company performs ongoing credit evaluations of its customers’ financial condition and, generally, requires no collateral.
Accounts receivable are recorded at their estimated net realizable value. Accounts are considered past due if payment is not made on a timely basis in accordance with the Company’s credit terms. Accounts considered uncollectible are written off. The Company follows a policy of providing an allowance for doubtful accounts; however, based on historical experience, and its evaluation of the current status of receivables, the Company is of the belief that such accounts will be collectible in all material respects and thus an allowance was not necessary at October 31, 2016 or 2015. It is at least possible this estimate will change in the future.
Inventory
Inventory is stated at the lower of cost or net realizable value in accordance with the Financial Accounting Standards Board (“FASB”) Accounting Standards Update (“ASU”) No. 2015-11 issued in July 2015. Cost for all inventories is determined using the first in first out method. Net realizable value is the estimated selling prices in the ordinary course of business, less reasonably predictable costs of completion, disposal, and transportation. Inventory consists of raw materials, work in process, finished goods, and supplies. Corn is the primary raw material along with other raw materials. Finished goods consist of ethanol, distillers’ grains, and corn oil.
Derivative Instruments
From time to time, the Company enters into derivative transactions to hedge its exposures to commodity price fluctuations. The Company is required to record these derivatives in the balance sheets at fair value.
In order for a derivative to qualify as a hedge, specific criteria must be met and appropriate documentation maintained. Gains and losses from derivatives that do not qualify as hedges, or are undesignated, must be recognized immediately in earnings. If the derivative does qualify as a hedge, depending on the nature of the hedge, changes in the fair value of the derivative will be either offset against the change in fair value of the hedged assets, liabilities, or firm commitments through earnings or recognized in other comprehensive income until the hedged item is recognized in earnings. Changes in the fair value of undesignated derivatives are recorded in earnings.
64
GRANITE FALLS ENERGY, LLC AND SUBSIDIARIES
Notes to Consolidated Financial Statements
Additionally, the Company is required to evaluate its contracts to determine whether the contracts are derivatives. Certain contracts that literally meet the definition of a derivative may be exempted as “normal purchases or normal sales”. Normal purchases and normal sales are contracts that provide for the purchase or sale of something other than a financial instrument or derivative instrument that will be delivered in quantities expected to be used or sold over a reasonable period in the normal course of business.
Contracts that meet the requirements of normal purchases or normal sales are documented as normal and exempted from accounting and reporting requirements, and therefore, are not marked to market in our consolidated financial statements.
In order to reduce the risks caused by market fluctuations, the Company occasionally hedges its anticipated corn, natural gas, and denaturant purchases and ethanol sales by entering into options and futures contracts. These contracts are used with the intention to fix the purchase price of anticipated requirements for corn in the Company’s ethanol production activities and the related sales price of ethanol. The fair value of these contracts is based on quoted prices in active exchange-traded or over-the-counter market conditions. Although the Company believes its commodity derivative positions are economic hedges, none have been formally designated as a hedge for accounting purposes and derivative positions are recorded on the balance sheet at their fair market value, with changes in fair value recognized in current period earnings or losses. The Company does not enter into financial instruments for trading or speculative purposes.
The Company has adopted authoritative guidance related to “Derivatives and Hedging,” and has included the required enhanced quantitative and qualitative disclosure about objectives and strategies for using derivatives, quantitative disclosures about fair value amounts of gains and losses from derivative instruments, and disclosures about credit-risk-related contingent features in derivative agreements. See further discussion in Note 6.
Other Intangibles
Other intangibles are stated at cost and include road improvements located near the HLBE plant in which the Company has a beneficial interest in but does not own the road. The Company amortizes the assets over the economic useful life of 15 years. The Company recorded amortization expense in the amount of approximately $38,000, $38,000, and $58,000 during the fiscal years ended October 31, 2016, 2015, and 2014, respectively.
Property and Equipment
Property and equipment are stated at cost. Depreciation is provided over the following estimated useful lives by use of the straight-line method.
|
Asset Description |
|
Years |
|
|
|
Land improvements |
|
5 - 20 |
years |
|
|
Railroad improvements |
|
5 - 20 |
years |
|
|
Process equipment and tanks |
|
5 - 40 |
years |
|
|
Administration building |
|
10 - 40 |
years |
|
|
Office equipment |
|
3 - 10 |
years |
|
|
Rolling stock |
|
5 - 10 |
years |
|
Maintenance and repairs are expensed as incurred; major improvements and betterments are capitalized. Construction in progress expenditures will be depreciated using the straight-line method over their estimated useful lives once the assets are placed into service.
65
GRANITE FALLS ENERGY, LLC AND SUBSIDIARIES
Notes to Consolidated Financial Statements
Long-Lived Assets
Long-lived assets, such as property, plant, and equipment, and purchased intangible assets subject to amortization, are reviewed for impairment whenever events or changes in circumstances indicate that the carrying amount of an asset may not be recoverable. When determining impairment losses, a long lived asset should be groupled with other assets or liabilities at the lowest level for which identifiable cash flows are largely independent of the cash flows of other assets or liabilities. If circumstances require a long-lived asset be tested for possible impairment, the Company first compares undiscounted cash flows expected to be generated by an asset to the carrying value of the asset. If the carrying value of the long-lived asset is not recoverable on an undiscounted cash flow basis, impairment is recognized to the extent that the carrying value exceeds its fair value. Fair value is determined through various valuation techniques including, but not limited to, discounted cash flow models, quoted market values and third-party independent appraisals, as considered necessary. No indicators of impairment existed during fiscal 2016, 2015, or 2014 that would have triggered impairment testing, and therefore, no impairment expense was recorded during fiscal 2016, 2015, or 2014.
Fair Value of Financial Instruments
The Company’s accounting for fair value measurements of assets and liabilities that are recognized or disclosed at fair value in the financial statements on a recurring or nonrecurring basis adhere to the FASB fair value hierarchy that prioritizes the inputs to valuation techniques used to measure fair value. The Company has adopted guidance for fair value measurement related to nonfinancial items that are recognized and disclosed at fair value in the financial statements on a nonrecurring basis. The guidance establishes a fair value hierarchy that prioritizes the inputs to valuation techniques used to measure fair value. The hierarchy gives the highest priority to unadjusted quoted prices in active markets for identical assets or liabilities (Level 1 measurements) and the lowest priority to measurements involving significant unobservable inputs (Level 3 measurements).
The three levels of the fair value hierarchy are as follows:
|
· |
Level 1 inputs are quoted prices (unadjusted) in active markets for identical assets or liabilities that the Company has the ability to access at the measurement date. |
|
· |
Level 2 inputs include: |
|
1. |
Quoted prices in active markets for similar assets or liabilities. |
|
2. |
Quoted prices in markets that are observable for the asset or liability either directly or indirectly, for substantially the full term of the asset or liability. |
|
3. |
Inputs that derived primarily from or corroborated by observable market date by correlation or other means. |
|
· |
Level 3 inputs are unobservable inputs for the asset or liability. |
The level in the fair value hierarchy within which a fair measurement in its entirety falls is based on the lowest level input that is significant to the fair value measurement in its entirety.
Except for those assets and liabilities which are required by authoritative accounting guidance to be recorded at fair value in our balance sheets, the Company has elected not to record any other assets or liabilities at fair value. No events occurred during the fiscal years ended October 31, 2016, 2015, or 2014 that required adjustment to the recognized balances of assets or liabilities, which are recorded at fair value on a nonrecurring basis.
66
GRANITE FALLS ENERGY, LLC AND SUBSIDIARIES
Notes to Consolidated Financial Statements
The carrying value of cash, accounts receivable, accounts payable and accrued liabilities approximates fair value due to the short maturity of these instruments. The Company obtains fair value measurements from an independent pricing service for corn derivative contracts. The fair value measurements consider observable data that may include dealer quotes and live trading levels from the Chicago Board of Trade and New York Mercantile Exchange markets. The fair value of the long-term debt is estimated based on anticipated interest rates which management believes would currently be available to the Company for similar issues of debt, taking into account the current credit risk of the Company and other market factors. The Company believes the carrying value of the debt instruments approximate fair value.
Income Taxes
The Company is treated as a partnership for federal and state income tax purposes, and generally does not incur income taxes. Instead its earnings and losses are included in the income tax returns of its members. Therefore, no provision or liability for federal or state income taxes has been included in these financial statements. Differences between financial statement basis of assets and tax basis of assets is related to capitalization and amortization of organization and start-up costs for tax purposes, whereas these costs are expensed for financial statement purposes. In addition, the Company uses the alternative depreciation system for tax depreciation instead of the straight-line method that is used for book depreciation, which also causes temporary differences. The Company’s tax year end is December 31.
The Company had no significant uncertain tax positions as of October 31, 2016 or 2015 that would require disclosure, primarily due to the partnership tax status. The Company recognizes and measures tax benefits when realization of the benefits is uncertain under a two-step approach. The first step is to determine whether the benefit meets the more-likely-than-not condition for recognition and the second step is to determine the amount to be recognized based on the cumulative probability that exceeds 50%. Primarily due to the Company’s tax status as a partnership, the adoption of this guidance had no material impact on the Company’s financial condition or results of operations.
The Company files income tax returns in the U.S. federal and Minnesota state jurisdictions. For years before 2013, the Company is no longer subject to U.S. Federal or state income tax examinations.
Net Income per Unit
Basic net income per unit is computed by dividing net income by the weighted average number of members’ units outstanding during the period. Diluted net income per unit is computed by dividing net income by the weighted average number of members’ units and members’ unit equivalents outstanding during the period. There were no member unit equivalents outstanding during the periods presented; accordingly, for all periods presented, the calculations of the Company’s basic and diluted net income per unit are the same.
Correction Of An Immaterial Error
The Company revised the consolidated statements of cash flows for the fiscal years ended October 31, 2015 and 2014, to correct for non-cash acquisitions of property and equipment resulting in an increase in cash provided by operating activities of approximately $3,359,000 and $606,000, respectively, and a corresponding increase in net cash used in investing activities.
Environmental Liabilities
The Company’s operations are subject to environmental laws and regulations adopted by various governmental entities in the jurisdiction in which it operates. These laws require the Company to investigate and remediate the effects of the release or disposal of materials at its location. Accordingly, the Company has adopted policies, practices, and procedures in the areas of pollution control, occupational health, and the production, handling, storage, and use of hazardous materials to prevent material environmental or other damage, and to limit the financial liability, which could result from such events. Environmental liabilities are recorded when the liability is probable and the costs can be reasonably estimated. No expense has been recorded for the fiscal years ended October 31, 2016, 2015, or 2014.
67
GRANITE FALLS ENERGY, LLC AND SUBSIDIARIES
Notes to Consolidated Financial Statements
Goodwill
Goodwill represents the cost in excess of the fair value of net assets acquired. The Company conducts impairment assessments annually or when events indicate a triggering event has occurred. No indicators of impairment existed during fiscal 2016, 2015, or 2014 that would have triggered impairment testing, and therefore, no impairment expense was recorded during 2016, 2015, or 2014.
Reportable Operating Segments
Accounting Standards Codification (“ASC”) 280, “Segment Reporting,” establishes the standards for reporting information about segments in financial statements. Operating segments are defined as components of an enterprise for which separate financial information is available that is evaluated regularly by the chief operating decision maker in deciding how to allocate resources and in assessing performance. Therefore, in applying the criteria set forth in ASC 280, the Company determined that based on the nature of the products and production process and the expected financial results, the Company’s operations at GFE’s ethanol plant and HLBE’s plant, including the production and sale of ethanol and its co-products, are aggregated into one reporting segment.
Additionally, the Company also realizes relatively immaterial revenue from natural gas pipeline operations at Agrinatural, HLBE’s majority owned subsidiary. Before and after accounting for intercompany eliminations, these revenues from Agrinatural’s represent less than less than 1% of our consolidated revenues and have little to no impact on the overall performance of the Company. Therefore, the Company does not separately review Agrinatural’s revenues, cost of sales or other operating performance information. Rather, the Company reviews Agrinatural’s natural gas pipeline financial data on a consolidated basis with the Company’s ethanol production operating segment. The Company believes that the presentation of separate operating performance information for Agrinatural’s natural gas pipeline operations would not provide meaningful information to a reader of the Company’s consolidated financial statements and would not achieve the basic principles and objectives of ASC 280.
Recently Issued Accounting Pronouncements
Contract Revenue Recognition (Evaluating)
In May 2014 and amended in August 2015, the FASB issued ASU No. 2014-09 which amended the Revenue from Contracts with Customers (Topic 606) of the Accounting Standards Codification. The core principle of the new guidance is that an entity should recognize revenue to reflect the transfer of goods and services to customers in an amount equal to the consideration the entity receives or expects to receive. The guidance will be effective for the Company beginning November 1, 2018. The Company is currently evaluating the guidance and its effect on its consolidated financial statements.
Leases (Evaluating)
In February 2016, the FASB adopted ASU No. 2016-02, Leases (Topic 842), which provides guidance for accounting for leases. The new guidance requires companies to recognize the assets and liabilities for the rights and obligations created by leased assets, initially measured at the present value of the lease payments. The accounting guidance for lessors is largely unchanged. The guidance will be effective for the Company beginning November 1, 2019. The Company is currently evaluating the impact that the adoption of this guidance will have on its consolidated financial statements.
Restricted Cash (Evaluating)
In November 2016, the FASB issued ASU No. 2016-18, Restricted Cash, which amended Statement of Cash Flows (Topic 230) of the Accounting Standards Codification. The new guidance will require amounts generally described as restricted cash and restricted cash equivalents to be included with cash and cash equivalents when reconciling the beginning-of-period and end-of-period total amounts shown on the consolidated statement of cash flows. The amendments will be effective for the Company beginning November 1, 2018. The Company is currently evaluating the impact that adoption of this guidance will have on its consolidated financial statements.
68
GRANITE FALLS ENERGY, LLC AND SUBSIDIARIES
Notes to Consolidated Financial Statements
The Company has certain risks and uncertainties that it experiences during volatile market conditions. These volatilities can have a severe impact on operations. The Company’s revenues are derived primarily from the sale and distribution of ethanol, distillers’ grains and corn oil, which comprises less than 1% of total revenue, to customers primarily located in the U.S. Corn for the production process is supplied to our plants primarily from local agricultural producers and from purchases on the open market. Ethanol sales typically average 75-90% of total revenues and corn costs typically average 65-85% of cost of goods sold.
The Company’s operating and financial performance is largely driven by the prices at which they sell ethanol and the net expense of corn. The price of ethanol is influenced by factors such as supply and demand, the weather, government policies and programs, and unleaded gasoline prices and the petroleum markets as a whole. Excess ethanol supply in the market, in particular, puts downward pressure on the price of ethanol. Our largest cost of production is corn. The cost of corn is generally impacted by factors such as supply and demand, the weather, government policies and programs, and our risk management program used to protect against the price volatility of these commodities.
The supply and demand for ethanol are impacted by federal and state legislation and regulation, most significantly the Renewable Fuels Standard (“RFS”), and any changes in legislation or regulation could cause the demand for ethanol to decline or its supply to increase, which could have a material adverse effect on our business, results of operations and financial condition, and the ability to operate at a profit.
On November 30, 2015, the EPA announced final Renewable Volume Obligation (“RVO”) requirements for the RFS for calendar years 2014, 2015 and 2016. Although the new RVO requirements set are above the proposed reductions, they are below the original requirements set by the RFS. Opponents of ethanol such as large oil companies will likely continue their efforts to repeal or reduce the RFS through lawsuits or lobbying of Congress. Successful reduction or repeal of the blending requirements of the RFS could result in a significant decrease in ethanol demand.
U.S. ethanol production is expected to remain flat in 2017 at approximately 15.2 billion gallons according to the U.S. Energy Information Administration. Political uncertainty under a new administration could lead to a reduction of blending requirements which could reduce the demand for and price of ethanol. If demand for ethanol decreases, it could materially adversely affect our business, results of operations and financial condition.
Ethanol has historically traded at a discount to gasoline, however with the recent decline in oil prices, ethanol is currently trading at an approximately equivalent price to gasoline causing a disincentive for discretionary blending of ethanol beyond the required blend rate. Consequently, there may be a negative impact on ethanol pricing and demand, which could result in a material adverse effect on our business, results of operations and financial condition.
The following table provides information on those derivative assets and liabilities measured at fair value on a recurring basis at October 31, 2016:
|
|
|
|
|
Fair Value Measurement Using |
|
||||||||
|
|
|
|
|
Quoted Prices |
|
Significant Other |
|
Significant |
|
||||
|
|
|
Carrying Amount |
|
in Active Markets |
|
Observable Inputs |
|
Unobservable Inputs |
|
||||
|
Financial Asset: |
|
in Balance Sheet |
|
(Level 1) |
|
(Level 2) |
|
(Level 3) |
|
||||
|
Commodity Derivative Instruments - Corn |
|
$ |
451,575 |
|
$ |
451,575 |
|
$ |
— |
|
$ |
— |
|
|
Commodity Derivative Instruments - Ethanol |
|
$ |
777,351 |
|
$ |
777,351 |
|
$ |
— |
|
$ |
— |
|
69
GRANITE FALLS ENERGY, LLC AND SUBSIDIARIES
Notes to Consolidated Financial Statements
The following table provides information on those derivative assets measured at fair value on a recurring basis at October 31, 2015:
|
|
|
|
|
Fair Value Measurement Using |
|
||||||||
|
|
|
|
|
Quoted Prices |
|
Significant Other |
|
Significant |
|
||||
|
|
|
Carrying Amount |
|
in Active Markets |
|
Observable Inputs |
|
Unobservable Inputs |
|
||||
|
Financial Asset: |
|
in Balance Sheet |
|
(Level 1) |
|
(Level 2) |
|
(Level 3) |
|
||||
|
Commodity Derivative Instruments - Corn |
|
$ |
677,149 |
|
$ |
677,149 |
|
$ |
— |
|
$ |
— |
|
|
Financial Liabilities: |
|
|
|
|
|
|
|
|
|
|
|
|
|
|
Commodity Derivative Instruments - Corn |
|
$ |
1,114 |
|
$ |
1,114 |
|
$ |
— |
|
$ |
— |
|
We determine the fair value of commodity derivative instruments by obtaining fair value measurements from an independent pricing service. The fair value measurements consider observable data that may include dealer quotes and live trading levels from the Chicago Board of Trade market and New York Mercantile Exchange.
Granite Falls Energy
GFE sold all of the ethanol, distillers’ grains, and corn oil produced at its plant to two customers under marketing agreements during its fiscal year ended October 31, 2016.
The percentage of GFE’s total revenues attributable to each of its two major customers for the fiscal years ended October 31, 2016, 2015, and 2014 were as follows:
|
|
|
October 31, 2016 |
|
October 31, 2015 |
|
October 31, 2014 |
|
|
Eco-Energy, Inc. - Ethanol |
|
80.3% |
|
79.1% |
|
80.5% |
|
|
RPMG, Inc. - Distillers' Grains & Corn Oil |
|
19.7% |
|
20.7% |
|
19.2% |
|
The percentage of GFE’s total accounts receivable attributable to each of its two major customers at October 31, 2016 and 2015 were as follows:
|
|
|
October 31, 2016 |
|
October 31, 2015 |
|
|
Eco-Energy, Inc. - Ethanol |
|
70.2% |
|
88.7% |
|
|
RPMG, Inc. - Distillers' Grains & Corn Oil |
|
26.5% |
|
10.2% |
|
Heron Lake BioEnergy
HLBE sold all of the ethanol, distillers’ grains, and corn oil produced at its plant to three customers under marketing agreements during the fiscal years ended October 31, 2016.
The percentage of HLBE’s total revenues attributable to each of HLBE’s three major customers for the fiscal years ended October 31, 2016, 2015, and 2014 were as follows:
|
|
|
October 31, 2016 |
|
October 31, 2015 |
|
October 31, 2014 |
|
|
Eco-Energy, Inc. - Ethanol |
|
78.5% |
|
76.9% |
|
79.7% |
|
|
Gavilon Ingredients, LLC - Distillers' Grains |
|
15.4% |
|
19.2% |
|
16.3% |
|
|
RPMG, Inc. - Corn Oil |
|
4.4% |
|
2.4% |
|
2.1% |
|
The percentage of HLBE’s total accounts receivable attributable to each of HLBE’s three major customers at October 31, 2016 and 2015 were as follows:
|
|
|
October 31, 2016 |
|
October 31, 2015 |
|
|
Eco-Energy, Inc. - Ethanol |
|
78.6% |
|
68.9% |
|
|
Gavilon Ingredients, LLC - Distillers' Grains |
|
11.1% |
|
24.1% |
|
|
RPMG, Inc. - Corn Oil |
|
3.3% |
|
1.5% |
|
70
GRANITE FALLS ENERGY, LLC AND SUBSIDIARIES
Notes to Consolidated Financial Statements
Inventory consists of the following:
|
|
|
October 31, 2016 |
|
October 31, 2015 |
|
||
|
Raw materials |
|
$ |
9,098,492 |
|
$ |
4,504,388 |
|
|
Supplies |
|
|
2,755,958 |
|
|
2,631,452 |
|
|
Work in process |
|
|
1,347,754 |
|
|
1,445,084 |
|
|
Finished goods |
|
|
5,139,209 |
|
|
3,631,101 |
|
|
Totals |
|
$ |
18,341,413 |
|
$ |
12,212,025 |
|
As of October 31, 2016, the total notional amount of GFE’s outstanding corn derivative instruments was approximately 5,220,000 bushels, comprised of long corn positions on 3,300,000 bushels that were entered into to hedge forecasted ethanol sales through March 2017, and short corn positions on 1,920,000 bushels that were entered into to hedge forecasted corn purchases through December 2016. There may be offsetting positions that are not shown on a net basis that could lower the notional amount of positions outstanding. As of October 31, 2016, GFE did not have any cash collateral (restricted cash) related to corn derivatives held by a broker.
As of October 31, 2016, the total notional amount of HLBE’s outstanding corn derivative instruments was approximately 4,285,000 bushels, comprised of long corn positions on 3,100,000 bushels that were entered into to hedge forecasted ethanol sales through March 2017, and short corn positions on 1,185,000 bushels that were entered into to hedge forecasted corn purchases through August 2017. There may be offsetting positions that are not shown on a net basis that could lower the notional amount of positions outstanding. As of October 31, 2016, HLBE did not have any cash collateral (restricted cash) related to corn derivatives held by a broker.
The following tables provide details regarding the Company’s derivative instruments at October 31, 2016, none of which were designated as hedging instruments:
|
|
|
Balance Sheet location |
|
Assets |
|
Liabilities |
|
||
|
Corn contracts - GFE |
|
Commodity derivative instruments |
|
$ |
63,050 |
|
$ |
— |
|
|
Corn contracts - HLBE |
|
Commodity derivative instruments |
|
|
388,525 |
|
|
— |
|
|
Ethanol contracts - GFE |
|
Commodity derivative instruments |
|
|
503,538 |
|
|
— |
|
|
Ethanol contracts - HLBE |
|
Commodity derivative instruments |
|
|
273,813 |
|
|
— |
|
|
Totals |
|
|
|
$ |
1,228,926 |
|
$ |
— |
|
As of October 31, 2015, the total notional amount of the Company’s outstanding corn derivative instruments was approximately 2,615,000 bushels, comprised of 740,000 and 1,875,000 bushel equivalent positions held by GFE and HLBE, respectively, that were entered into to hedge forecasted corn purchases through December 2016. There may be offsetting positions that are not shown on a net basis that could lower the notional amount of positions outstanding as disclosed above.
The following tables provide details regarding the Company’s derivative instruments at October 31, 2015, none of which were designated as hedging instruments:
|
|
|
Balance Sheet location |
|
Assets |
|
Liabilities |
|
||
|
Corn contracts - GFE |
|
Commodity derivative instruments |
|
$ |
— |
|
$ |
1,114 |
|
|
Corn contracts - HLBE |
|
Commodity derivative instruments |
|
|
677,149 |
|
|
— |
|
|
Totals |
|
|
|
$ |
677,149 |
|
$ |
1,114 |
|
71
GRANITE FALLS ENERGY, LLC AND SUBSIDIARIES
Notes to Consolidated Financial Statements
The following tables provide details regarding the gains (losses) from Company’s derivative instruments in statements of operations, none of which are designated as hedging instruments:
|
|
|
Statement of |
|
Fiscal Year Ended October 31, |
|
|||||||
|
|
|
Operations Location |
|
2016 |
|
2015 |
|
2014 |
|
|||
|
Corn contracts |
|
Cost of Goods Sold |
|
$ |
708,364 |
|
$ |
303,925 |
|
$ |
1,134,402 |
|
|
Ethanol contracts |
|
Revenues |
|
|
(159,322) |
|
|
— |
|
|
— |
|
|
Natural gas contracts |
|
Cost of Goods Sold |
|
|
32,358 |
|
|
— |
|
|
— |
|
|
Total gain |
|
|
|
$ |
581,400 |
|
$ |
303,925 |
|
$ |
1,134,402 |
|
7. PROPERTY AND EQUIPMENT
A summary of property and equipment:
|
|
|
October 31, 2016 |
|
October 31, 2015 |
|
||
|
Land and improvements |
|
$ |
13,693,713 |
|
$ |
13,348,732 |
|
|
Railroad improvements |
|
|
8,005,523 |
|
|
8,005,523 |
|
|
Process equipment and tanks |
|
|
128,822,845 |
|
|
123,405,024 |
|
|
Administration building |
|
|
907,652 |
|
|
907,652 |
|
|
Office equipment |
|
|
569,328 |
|
|
569,328 |
|
|
Rolling stock |
|
|
2,018,049 |
|
|
1,777,863 |
|
|
Construction in progress |
|
|
315,631 |
|
|
2,013,765 |
|
|
|
|
|
154,332,741 |
|
|
150,027,887 |
|
|
Less: accumulated depreciation |
|
|
(75,364,725) |
|
|
(65,723,725) |
|
|
Net property and equipment |
|
$ |
78,968,016 |
|
$ |
84,304,162 |
|
Depreciation expense totaled approximately $9,641,000, $9,612,000, and $5,209,000 for the fiscal years ended October 31, 2016, 2015, and 2014, respectively.
Granite Falls Energy
GFE has a credit facility with a lender. This is a revolving term loan facility in the amount of $18,000,000. However, the amount available for borrowing under this facility reduces by $2,000,000 semi-annually beginning September 1, 2014, with final payment due March 1, 2018. GFE had no outstanding balance on the revolving term loan at October 31, 2016. Therefore, the aggregate principal amount available for borrowing by GFE under this revolving term loan facility at October 31, 2016 is $10,000,000.
The interest rate is based on the bank’s One Month London Interbank Offered Rate (“LIBOR”) Index Rate, plus 3.05%, which was 3.25% at both October 31, 2016, and October 31, 2015.
The credit facility requires GFE to comply with certain financial covenants at various times calculated monthly, quarterly or annually, including restriction of the payment of dividends and maintenance of certain financial ratios including minimum working capital, minimum net worth and a debt service coverage ratio as defined by the credit facility. Failure to comply with the protective loan covenants or maintain the required financial ratios may cause acceleration of the outstanding principal balances on the revolving term loan and/or the imposition of fees, charges or penalties. As of October 31, 2016 and 2015, GFE was in compliance with these financial covenants and expects to be in compliance throughout fiscal 2017.
The credit facility is secured by substantially all assets of GFE. There are no savings account balance collateral requirements as part of this credit facility.
72
GRANITE FALLS ENERGY, LLC AND SUBSIDIARIES
Notes to Consolidated Financial Statements
Heron Lake BioEnergy
HLBE has a revolving term loan with a lender with a maximum principal commitment initially totaling $28,000,000. Amounts borrowed by HLBE under the revolving term loan and repaid or prepaid may be re-borrowed at any time prior to the March 1, 2022 maturity date, subject to the maximum principal commitment. Under the terms of the credit facility, the revolving term loan commitment declines by $3,500,000 annually, starting March 1, 2015 and continues each anniversary thereafter until maturity. As a result, the aggregate principal commitment of this facility at October 31, 2016 was $21,000,000. HLBE had no outstanding balance on the revolving term loan at October 31, 2016 and approximately $4,823,000 oustanding at October 31, 2015. Therefore, after accounting for amounts outstanding under this facility at October 31, 2016 and 2015, the aggregate principal amount available to the Company for borrowing was approximately $21,000,000 and $19,677,000, respectively.
Interest on the revolving term loan accrues at a variable rate equal to 3.25% above the One-Month London Interbank Offered Rate (“LIBOR”) Index rate. HLBE may elect to enter into a fixed interest rate on this loan at various times throughout the term of the loan as provided in the loan agreements. The interest rate on the revolving term loan was 3.45% at both October 31, 2016, and October 31, 2015.
HLBE also agreed to pay an unused commitment fee on the unused portion of the revolving term loan commitment at the rate of 0.50% per annum. The revolving term loan is subject to a prepayment fee for any prepayment on the term loan prior to July 1, 2016 due to refinancing. The loan is secured by substantially all of the Company assets including a subsidiary guarantee.
The credit facility contains customary covenants, including restrictions on the payment of dividends and loans and advances to Agrinatural, and maintenance of certain financial ratios including minimum working capital, minimum net worth and a debt service coverage ratio as defined by the credit facility. Failure to comply with the protective loan covenants or maintain the required financial ratios may cause acceleration of the outstanding principal balances on the revolving term loan and/or the imposition of fees, charges or penalties. As of October 31, 2016 and 2015, HLBE was in compliance with these financial covenants and expects to be in compliance throughout fiscal 2017.
As part of the Credit Facility closing, HLBE entered into an Administrative Agency Agreement with CoBank, ACP (“CoBank”). CoBank purchased a participation interest in the AgStar loans and was appointed the administrative agent for the purpose of servicing the loans. As a result, CoBank will act as the agent for AgStar with respect to the Credit Facility. HLBE agreed to pay CoBank an annual fee of $2,500 as the agent for Ag Star.
73
GRANITE FALLS ENERGY, LLC AND SUBSIDIARIES
Notes to Consolidated Financial Statements
Long-term debt consists of the following:
|
|
|
October 31, 2016 |
|
October 31, 2015 |
|
||
|
GRANITE FALLS ENERGY: |
|
|
|
|
|
|
|
|
Revolving Term Loan |
|
$ |
— |
|
$ |
— |
|
|
|
|
|
|
|
|
|
|
|
HERON LAKE BIOENERGY: |
|
|
|
|
|
|
|
|
Revolving term note payable to lending institution, see terms above. |
|
|
— |
|
|
4,822,777 |
|
|
Assessment payable as part of water treatment agreement, due in semi-annual installments of $189,393 with interest at 6.55%, enforceable by statutory lien, with the final payment due in 2021. HLBE made deposits for one years' worth of debt service payments of approximately $364,000, which is included with other assets that are held on deposit to be applied with the final payments of the assessment. |
|
|
1,517,046 |
|
|
1,775,828 |
|
|
Assessment payable as part of water treatment agreement, due in semi-annual installments of $25,692 with interest at 0.50%, enforceable by statutory lien, with the final payment due in 2016. |
|
|
— |
|
|
51,199 |
|
|
Assessment payable as part of water supply agreement, due in monthly installments of $3,942 with interest at 8.73%, enforceable by statutory lien. |
|
|
97,930 |
|
|
136,378 |
|
|
Note payable to electrical company with monthly payments of $6,250 with interest at 0.00% and a 1.00% maintenance fee due each October, due September 2017. The electrical company is a member of HLBE. |
|
|
68,750 |
|
|
143,750 |
|
|
Note payable to non-controlling interest member of Agrinatural. Interest is at One Month LIBOR plus 4.0%, which was approximately 4.53% and 4.19% at October 31, 2016 and 2015, respectively. The note is considered due on demand with payments due at Agrinatural's Board of Managers' discretion. |
|
|
200,000 |
|
|
300,000 |
|
|
Totals |
|
|
1,883,726 |
|
|
7,229,932 |
|
|
Less: amounts due within one year |
|
|
490,057 |
|
|
517,957 |
|
|
Net long-term debt |
|
$ |
1,393,669 |
|
$ |
6,711,975 |
|
Estimated maturities of long-term debt at October 31, 2016 are as follows:
|
2016 |
|
$ |
490,057 |
|
|
2017 |
|
|
432,183 |
|
|
2018 |
|
|
319,139 |
|
|
2019 |
|
|
326,798 |
|
|
2020 |
|
|
315,549 |
|
|
Total debt |
|
$ |
1,883,726 |
|
Granite Falls Energy
GFE has one class of membership units. The units have no par value and have identical rights, obligations and privileges. Income and losses are allocated to all members based upon their respective percentage of units held. As of October 31, 2016, 2015, and 2014, GFE had 30,606 membership units authorized, issued, and outstanding, respectively.
Subsequent to fiscal year end, in December 2016, GFE’s Board of Governors declared a cash distribution of $365 per unit or approximately $11,171,000 for GFE unit holders of record as of December 21, 2016 to be paid by GFE in January 2017.
In December 2015, GFE’s Board of Governors declared a cash distribution of $315 per unit or approximately $9,641,000 for GFE unit holders of record as of December 17, 2015 was paid by GFE on January 25, 2016.
74
GRANITE FALLS ENERGY, LLC AND SUBSIDIARIES
Notes to Consolidated Financial Statements
In December 2014, GFE’s Board of Governors declared a cash distribution of $1,050 per unit or approximately $32,136,000 for GFE unit holders of record as of December 18, 2014. This distribution was paid by GFE on January 9, 2015.
In December 2013, GFE’s Board of Governors declared a cash distribution of $180 per unit or approximately $5,509,080 for GFE unit holders of record as of December 19, 2013. The distribution was paid by GFE on December 31, 2013.
Heron Lake BioEnergy
On December 17, 2015, HLBE’s board of governors declared a distribution of $0.05 per membership unit for a total of approximately $3,897,000 to be paid to HLBE unit holders of record as of December 18, 2015. The distribution was paid in January 2016. At December 17, 2015, GFE owned 39,420,949 Class A membership units and 15,000,000 Class B units of HLBE, and received an aggregate distribution from HLBE of $1,971,000. The remaining $1,926,000 was distributed by HLBE to the non-controlling interest.
On December 18, 2014, HLBE’s board of governors declared a distribution of $0.12 per membership unit for a total of approximately $9,352,000 to be paid to HLBE unit holders of record as of December 18, 2014. The distribution was paid by HLBE in January 2015. At December 18, 2014, GFE owned 39,420,949 Class A membership units and 15,000,000 Class B units of HLBE, and received an aggregate distribution from HLBE of $4,731,000. The remaining $4,621,000 was distributed by HLBE to the non-controlling interest.
Granite Falls Energy
GFE has lease agreements with leasing companies for 219 rail cars for the transportation of GFE’s ethanol with various maturity dates through December 2026. The rail car lease payments are due monthly in the aggregate amount of approximately $155,000.
GFE has lease agreements with leasing companies for 115 hopper cars to assist with the transport of the distillers’ grains by rail with various maturity dates through November 2025. The rail car lease payments are due monthly in the amount of approximately $76,000.
Rent expense for GFE’s leases was approximately $2,985,000, $2,204,000 and $2,387,000 for the fiscal years ended October 31, 2016, 2015, and 2014, respectively.
Heron Lake BioEnergy
HLBE has lease agreements with leasing companies for 145 rail cars for the transportation of HLBE’s ethanol with various maturity dates through January 2027. The rail car lease payments are due monthly in the aggregate amount of approximately $123,000.
HLBE has a lease agreement with a leasing company for 50 hopper cars to assist with the transport of the distillers’ grains by rail with a maturity date of May 2017. The rail car lease payments are due monthly in the amount of approximately $35,000.
Rent expense for HLBE’s leases was approximately $2,570,000, $1,969,000 and $1,829,000 for the fiscal years ended October 31, 2016, 2015, and 2014, respectively.
75
GRANITE FALLS ENERGY, LLC AND SUBSIDIARIES
Notes to Consolidated Financial Statements
At October 31, 2016, the Company had the following commitments for payments of rentals under operating leases which at inception had a non-cancelable term of more than one year:
|
November 1, 2016 to October 31, 2017 |
|
$ |
4,607,334 |
|
|
November 1, 2017 to October 31, 2018 |
|
|
3,984,816 |
|
|
November 1, 2018 to October 31, 2019 |
|
|
3,726,500 |
|
|
November 1, 2019 to October 31, 2020 |
|
|
3,589,800 |
|
|
November 1, 2020 to October 31, 2021 |
|
|
3,589,800 |
|
|
Thereafter |
|
|
13,540,650 |
|
|
Total minimum lease commitments |
|
$ |
33,038,900 |
|
GFE has a defined contribution plan available to all of its qualified employees. GFE contributes a match of 50% of the participant’s salary deferral up to a maximum of 3% of the employee’s salary. GFE contributions totaled approximately $63,000, $57,000, and $51,000 for the fiscal years ended October 31, 2016, 2015, and 2014, respectively.
HLBE has a defined contribution plan available to all of its qualified employees. HLBE contributes a match of 50% of the participant’s salary deferral up to a maximum of 4% of the employee’s salary. HLBE contributions totaled approximately $85,000, $81,000, and $81,000 for the fiscal years ended October 31, 2016, 2015, and 2014, respectively.
The differences between the financial statement basis and tax basis of assets are based on the following:
|
|
|
October 31, 2016 |
|
October 31, 2015 |
|
||
|
Financial statement basis of assets |
|
$ |
121,470,922 |
|
$ |
122,011,081 |
|
|
Organization & start-up costs capitalized for tax purposes, net |
|
|
357,554 |
|
|
446,943 |
|
|
Tax depreciation greater than book depreciation |
|
|
(17,884,622) |
|
|
(19,655,009) |
|
|
Unrealized derivatives (gains) losses |
|
|
(566,588) |
|
|
1,114 |
|
|
Capitalized inventory |
|
|
41,467 |
|
|
30,294 |
|
|
Net effect of consolidation of acquired subsidiary |
|
|
(36,496,913) |
|
|
(26,322,082) |
|
|
Income tax basis of assets |
|
$ |
66,921,820 |
|
$ |
76,512,341 |
|
There were no significant differences between the consolidated financial statement basis of liabilities and the income tax basis of liabilities at October 31, 2016 and 2015.
13. RELATED PARTY TRANSACTIONS
GFE Corn Storage and Grain Handling Agreement
GFE has a corn storage and grain handling agreement with Farmers Cooperative Elevator (“FCE”), a member of GFE. Under the agreement, GFE agrees to purchase all of the corn needed for the operation of the plant from FCE. The price of the corn purchased will be the bid price FCE establishes for the plant plus a set fee of per bushel. GFE purchased approximately $78,865,000 of corn from FCE during fiscal 2016, of which approximately $5,358,000 is included in corn payable at October 31, 2016. GFE purchased approximately $75,018,000 of corn from FCE during fiscal 2015, of which approximately $1,486,000 is included in corn payable at October 31, 2015. The Company purchased approximately $82,955,000 of corn from FCE during fiscal 2014.
HLBE Corn Purchases - Members
HLBE purchased approximately $15,008,000, $11,032,000, and $14,860,000 of corn from its board members, during the fiscal years ended October 31, 2016, 2015, and 2014.
76
GRANITE FALLS ENERGY, LLC AND SUBSIDIARIES
Notes to Consolidated Financial Statements
Agrinatural
During 2013, HLBE borrowed $300,000 from the non-controlling interest member of Agrinatural. Total interest paid in relation to this note payable amounted to approximately $20,000 for each of the fiscal years ended October 31, 2016 and approximately $16,000 for each of the years ended October 31, 2015 and 2014.
77
GRANITE FALLS ENERGY, LLC AND SUBSIDIARIES
Notes to Consolidated Financial Statements
Swan Engineering
On March 27, 2015, Agrinatural executed a new management and operating agreement with Swan Engineering, Inc. (“SEI”). SEI, together with an unrelated third party owns Rural Energy Solutions, LLC (“RES”), the 27% minority owner of Agrinatural. Under the new management and operating agreement, SEI will continue to provide Agrinatural with day-to-day management and operation of Agrinatural’s pipeline distribution business. In exchange for these services, Agrinatural will pay SEI an aggregate management fee equal to the fixed monthly base fee plus the variable customer management fee based on the number of customers served on the pipeline less the agreed monthly fee reduction of $4,500. For the year ended October 31, 2016, Agrinatural paid approximately $32,000 and $149,000 for the monthly base fee and variable customer management fee, respectively. For the year ended October 31, 2015, Agrinatural paid approximately $18,000 and $83,000 for the monthly base fee and variable customer management fee, respectively. The new management and operating agreement with SEI expires July 1, 2019 unless earlier terminated for cause as defined in the agreement.
On March 27, 2015, Agrinatural also executed a new project management agreement with SEI. Pursuant to the new project management agreement, SEI will continue to supervise all of Agrinatural’s pipeline construction projects. These projects are constructed by unrelated third-party pipeline construction companies. Under the new project management agreement, Agrinatural will pay SEI a total of 10% of the actual capital expenditures for construction projects approved by Agrinatural’s Board of Directors, excluding capitalized marketing costs. For the year ended October 31, 2016, the Company incurred approximately $28,000 for project management fees. For the year ended October 31, 2015, the Company paid approximately $19,000 for project management fees. The new project management with SEI expires June 30, 2019 unless earlier terminated for cause as defined in the agreement.
Amounts due to SEI from Agrinatural included in accounts payable on the consolidated balance sheets totaled approximately $131,000 and $340,000 at October 31, 2016 and 2015, respectively
14. COMMITMENTS AND CONTINGENCIES
Corn Purchase Commitments
At October 31, 2016, GFE had 1,920,000 bushels of stored corn totaling approximately $6,194,000 with FCE, a related party, that is included in inventory. Additionally, GFE had basis contracts for 900,000 bushels of corn for delivery in November 2016.
At October 31, 2016, GFE had cash and basis contracts for forward corn purchase commitments for approximately 3,183,000 bushels for deliveries through August 2017.
At October 31, 2016, HLBE had cash and basis contracts for forward corn purchase commitments for approximately 2,898,000 bushels for deliveries through August 2017.
Ethanol Marketing Agreement
GFE currently has an ethanol marketing agreement with Eco-Energy, Inc., an unrelated party (“Eco-Energy”). Pursuant to this marketing agreement, Eco-Energy agrees to purchase the entire ethanol output of GFE’s ethanol plant and to arrange for the transportation of ethanol; however, GFE is responsible for securing all of the rail cars necessary for the transport of ethanol by rail except for 43 rail cars leased to GFE by Eco-Energy under the marketing agreement. GFE pays Eco-Energy a marketing fee per gallon of ethanol sold in consideration of Eco-Energy’s services, as well as a fixed lease fee for rail cars leased from Eco-Energy to the GFE. During the third quarter of 2016, GFE amended its marketing agreement extending the term of the marketing agreement to December 31, 2019, with automatic renewals for additional three terms of three year periods unless terminated by either party by providing written notice to the other party at least 90 days prior to the end of the then current term. Additionally, the amendment provides for certain negotiated changes to the marketing fees payable to Eco-Energy by GFE and the timing of payments by Eco-Energy to GFE for the ethanol Eco-Energy purchases from GFE. The changes to the marketing fee and timing of payments by Eco-Energy were negotiated based on prevailing market-rate conditions for comparable ethanol marketing services.
78
GRANITE FALLS ENERGY, LLC AND SUBSIDIARIES
Notes to Consolidated Financial Statements
HLBE has an ethanol marketing agreement with Eco-Energy, an unrelated party, for the sale of ethanol. Under this marketing agreement, Eco-Energy purchases, markets and resells 100% of the ethanol produced at HLBE’s ethanol production facility and arranges for the transportation of HLBE’s ethanol. HLBE pays Eco-Energy a marketing fee per gallon of ethanol sold, as well as a fixed lease fee for rail cars leased from Eco-Energy to the HLBE. During the third quarter of 2016, HLBE entered into an amendment with Eco-Energy extending the term of the marketing agreement to December 31, 2019, with automatic renewals for additional three terms of three year periods unless terminated by either party by providing written notice to the other party at least 90 days prior to the end of the then current term. Additionally, the amendment provides for certain negotiated changes to the marketing fees payable to Eco-Energy by HLBE and the timing of payments by Eco-Energy to GFE for the ethanol Eco-Energy purchases from GFE. The changes to the marketing fee and timing of payments by Eco-Energy were negotiated based on prevailing market-rate conditions for comparable ethanol marketing services.
Ethanol marketing fees and commissions totaled approximately $1,256,000, $1,234,000 and $1,318,000 for the fiscal years ended October 31, 2016, 2015, and 2014 respectively, and are included net within revenues.
Ethanol Contracts
At October 31, 2016, GFE had fixed and basis contracts to sell approximately $18,801,000 of ethanol for various delivery periods through March 2017, which approximates 51% of its anticipated ethanol sales for this that period.
At October 31, 2016, HLBE had fixed and basis contracts to sell approximately $18,621,000 of ethanol for various delivery periods through March 2017, which approximates 51% of its anticipated ethanol sales for this that period.
Distillers Grain Marketing Agreement
GFE has a distillers’ grains marketing agreement with RPMG, Inc., an unrelated party. for the purpose of marketing and selling all distillers’ grains produced by GFE. The contract commenced on February 1, 2011 with an initial term of one year, and will continue to remain in effect until terminated by either party at its unqualified option, by providing written notice of not less than 90 days to the other party. Distillers’ grains commissions to RPMG totaled approximately $335,000, $421,000 and $518,000 for the fiscal years ended October 31, 2016, 2015, and 2014 respectively, and are included net within revenues.
At October 31, 2016, GFE had forward contracts to sell approximately $1,595,000 of distillers’ grain for deliveries in through January 2017, which approximates 40% of its anticipated distillers’ grain sales during that period.
HLBE has a distillers’ grains off-take agreement with Gavilon Ingredients, LLC (“Gavilon”), an unrelated party. Under this agreement, Gavilon purchases all of the distillers’ grains produced at HLBE’s ethanol plant in exchange for a service fee. The contract commenced on November 1, 2013 with an initial term of six months, and will continue to remain in effect until terminated by either party at its unqualified option, by providing written notice of not less than 60 days to the other party. Distillers’ grains service fees to Gavilon totaled approximately $283,000, $308,000 and $293,000 for the fiscal years ended October 31, 2016, 2015, and 2014 respectively, and are included net within revenues.
At October 31, 2016, HLBE had forward contracts to sell approximately $2,863,000 of distillers’ grains for delivery in March 2017, which approximates 40% of its anticipated distillers’ grain sales during that period.
Corn Oil Marketing Agreement
GFE has a corn oil marketing agreement with RPMG, an unrelated party, for the purpose of marketing and selling all corn oil produced by GFE. The contract commenced on April 29, 2010 with an initial term of one year, and will continue to remain in effect until terminated by either party at its unqualified option, by providing written notice of not less than 90 days to the other party.
HLBE has a corn oil marketing agreement with RPMG, an unrelated party, for the purpose of marketing and selling all corn oil produced by HLBE. The contract commenced on November 1, 2013 with an initial term of one year, and will continue to remain in effect until terminated by either party at its unqualified option, by providing written notice of not less than 90 days to the other party.
79
GRANITE FALLS ENERGY, LLC AND SUBSIDIARIES
Notes to Consolidated Financial Statements
Corn oil commissions totaled approximately $166,000, $125,000 and $112,000 for the fiscal years ended October 31, 2016, 2015, and 2014 respectively, and are included net within revenues.
At October 31, 2016, GFE had forward contracts to sell approximately $490,000 of corn oil for delivery through December 2016, which approximates 57% of its anticipated corn oil sales for this that period.
At October 31, 2016, HLBE had forward contracts to sell approximately $630,000 of corn oil for delivery through December 2016, which approximates 76% of its anticipated corn oil sales for this that period.
Contract for Natural Gas Pipeline to Plant
HLBE has a facilities agreement with Northern Border Pipeline Company which allows us access to an existing interstate natural gas pipeline located approximately 16 miles north from the HLBE plant. Agrinatural was formed to own and operate the pipeline and transports gas to the Company pursuant to a transportation agreement The Company also has a base agreement for the sale and purchase of natural gas with Constellation NewEnergy-Gas Division, LLC (“Constellation”). HLBE has a base agreement for the sale and purchase of natural gas with Constellation NewEnergy-Gas Division, LLC pursuant to which it buys all of its natural gas from Constellation. This agreement runs until March 31, 2017.
GFE has an agreement with an unrelated company for the construction of and maintenance of 9.5 miles of natural gas pipeline that will serve the GFE plant. The agreement requires the Company to receive a minimum of 1,400,000 DT of natural gas annually through the term of the agreement. The Company is charged a fee based on the amount of natural gas delivered through the pipeline.
Water Agreements
In October 2003, HLBE entered into an industrial water supply development and distribution agreement with the City of Heron Lake for 15 years. HLBE has the exclusive rights to the first 6000 gallons per minute of capacity that is available from the well, and provides for HLBE, combined with an unrelated company, to approve any other supply contracts that the City may enter into. In consideration, HLBE will pay one half of the City’s water well bond payments of $735,000, plus a 5% administrative fee, totaling approximately $594,000, and operating costs, relative to HLBE’s water usage, plus a 10% profit. These costs will be paid as water usage fees. HLBE recorded an assessment of approximately $367,000 with long-term debt as described in Note 8. HLBE pays operating and administrative expenses of approximately $12,000 per year.
In May 2006, HLBE entered into a water treatment agreement with the City of Heron Lake and Jackson County for 30 years. HLBE will pay for operating and maintenance costs of the plant in exchange for receiving treated water. In addition, HLBE agreed to an assessment for a portion of the capital costs of the water treatment plant. HLBE recorded assessments with long-term debt of $500,000 and $3,550,000 in fiscal 2007 and 2006, respectively, as described in Note 8. HLBE paid operating and maintenance expenses of approximately $24,000, $57,000, and $114,000 in fiscal 2016, 2015, and 2014, respectively.
15. SUBSEQUENT EVENTS
Subsequent to GFE’s fiscal year end, on November 1, 2016, GFE subscribed to purchase 1,500 capital units of Ring-neck Energy & Feed, LLC (“Ring-neck”) at a price of $5,000 per unit for a total of $7,500,000. GFE paid a down payment of $750,000 in connection with the subscription, and signed a promissory note for $6,750,000 for the remaining balance of the subscription. If Ring-neck accepts GFE’s subscription, GFE will be required to pay Ring-neck the entire amount due under the promissory note within 20 days of receiving notice from Ring-neck that it is due. If GFE fails to pay the entire amount due, GFE will be charged 12% interest per year, and Ring-neck may seek legal action to force GFE to pay. If Ring-neck does not meet certain conditions of its offering or rejects GFE’s subscription, GFE expects that its promissory note will be cancelled and our down payment will be refunded to us.
Ring-neck is a South Dakota limited liability company that intends to build an 80 million gallon per year ethanol manufacturing plant in outside of Onida, South Dakota in Sully County. If Ring-neck accepts our subscription, our investment is sufficient to secure the Company the right to appoint one director to the board of directors of Ring-neck.
80
GRANITE FALLS ENERGY, LLC AND SUBSIDIARIES
Notes to Consolidated Financial Statements
Subsequent to GFE’s fiscal year end and in connection with the subscription, GFE entered into a credit facility with Fagen Energy, LLC, a related party (“Fagen Energy”), which allows GFE to borrow up to $7.5 million of variable-rate, amortizing fully non-recourse debt from Fagen Energy using the Ring-neck investment as collateral. Fagen Energy is an affiliate of Fagen, Inc., the design-builder for the Company’s ethanol plants and a member of GFE.
The Fagen Energy loan bears interest from date funds are first advanced on the loan through maturity, at a rate per annum equal to the sum of (x) the One Month LIBOR Index Rate plus (y) 3.05% per annum, with an interest rate floor of 3.55%. The Fagen Energy loan requires annual interest payments only for the first two years of the loan and monthly principal and interest payments for years 3 through 9 based on a 7-year amortization period. The monthly amortized payments will be re-amortized following any change in interest rate. The entire outstanding principal balance of the loan, plus any accrued and unpaid interest thereon, is due and payable in full on November 1, 2025. GFE is permitted to voluntarily prepay all or any portion of the outstanding balance of this loan at any time without premium or penalty.
Pursuant to a pledge agreement and commercial security agreement entered into in connection with the Fagen Energy loan, GFE’s obligations are secured by all of its right, title, and interest in its investment in Ring-neck, including the 1,500 units subscribed for by GFE. The loan is non-recourse to all of GFE’s other assets, meaning that in the event of default, the only remedy available to Fagen Energy will be to foreclose and seize all of GFE’s right, title and interest in its investment in Ring-neck. GFE expects to use the proceeds of the loan to finance its balance of its investment in Ring-neck. As of January 30, 2017, there were no amounts outstanding under this credit facility.
From time to time in the ordinary course of business, the Company may be named as a defendant in legal proceedings related to various issues, including without limitation, workers’ compensation claims, tort claims, or contractual disputes. We are not currently a party to any material pending legal proceedings and we are not currently aware of any such proceedings contemplated by governmental authorities.
81
GRANITE FALLS ENERGY, LLC AND SUBSIDIARIES
Notes to Consolidated Financial Statements
17. QUARTERLY FINANCIAL DATA (UNAUDITED)
Summary quarterly results are as follows:
|
|
|
First |
|
Second |
|
Third |
|
Fourth |
|
||||
|
|
|
Quarter |
|
Quarter |
|
Quarter |
|
Quarter |
|
||||
|
Fiscal year ended October 31, 2016 |
|
|
|
|
|
|
|
|
|
|
|
|
|
|
Revenues |
|
$ |
51,001,654 |
|
$ |
50,974,398 |
|
$ |
58,018,553 |
|
$ |
55,531,621 |
|
|
Gross profit |
|
|
1,432,877 |
|
|
2,273,697 |
|
|
6,301,875 |
|
|
6,890,645 |
|
|
Operating income |
|
|
32,031 |
|
|
784,201 |
|
|
5,017,859 |
|
|
5,739,434 |
|
|
Net income attributable to GFE |
|
|
11,526 |
|
|
699,514 |
|
|
3,492,822 |
|
|
4,518,946 |
|
|
Basic and diluted earnings per unit attributable to GFE |
|
$ |
0.38 |
|
$ |
22.86 |
|
|
114.12 |
|
$ |
147.65 |
|
|
|
|
|
First |
|
|
Second |
|
|
Third |
|
|
Fourth |
|
|
|
|
|
Quarter |
|
|
Quarter |
|
|
Quarter |
|
|
Quarter |
|
|
Fiscal year ended October 31, 2015 |
|
|
|
|
|
|
|
|
|
|
|
|
|
|
Revenues |
|
$ |
58,692,502 |
|
$ |
59,067,109 |
|
$ |
58,671,723 |
|
$ |
54,823,174 |
|
|
Gross profit |
|
|
5,628,105 |
|
|
5,545,088 |
|
|
8,795,890 |
|
|
2,631,235 |
|
|
Operating income |
|
|
4,204,718 |
|
|
4,173,843 |
|
|
7,494,444 |
|
|
1,551,398 |
|
|
Net income attributable to GFE |
|
|
3,767,092 |
|
|
3,179,639 |
|
|
5,440,763 |
|
|
1,199,256 |
|
|
Basic and diluted earnings per unit attributable to GFE |
|
$ |
123.08 |
|
$ |
103.89 |
|
$ |
177.77 |
|
$ |
39.18 |
|
|
|
|
|
First |
|
|
Second |
|
|
Third |
|
|
Fourth |
|
|
|
|
|
Quarter |
|
|
Quarter |
|
|
Quarter |
|
|
Quarter |
|
|
Fiscal year ended October 31, 2014 |
|
|
|
|
|
|
|
|
|
|
|
|
|
|
Revenues |
|
$ |
77,463,813 |
|
$ |
81,324,024 |
|
$ |
78,383,846 |
|
$ |
63,783,301 |
|
|
Gross profit |
|
|
14,420,458 |
|
|
18,212,259 |
|
|
16,043,874 |
|
|
14,844,764 |
|
|
Operating income |
|
|
13,124,957 |
|
|
16,832,384 |
|
|
14,833,232 |
|
|
13,580,276 |
|
|
Net income attributable to GFE |
|
|
10,554,947 |
|
|
14,249,413 |
|
|
13,018,046 |
|
|
10,951,485 |
|
|
Basic and diluted earnings per unit attributable to GFE |
|
$ |
344.87 |
|
$ |
465.58 |
|
$ |
425.34 |
|
$ |
357.82 |
|
The above quarterly financial data is unaudited, but in the opinion of management, all adjustments necessary for a fair presentation of the selected data for these periods presented have been included.
82
ITEM 9. CHANGES IN AND DISAGREEMENTS WITH ACCOUNTANTS ON ACCOUNTING AND FINANCIAL DISCLOSURE.
None.
ITEM 9A.CONTROLS AND PROCEDURES
(a) Disclosure Controls and Procedures
We maintain disclosure controls and procedures that are designed to ensure that information required to be disclosed in the reports that we file or submit pursuant to the Securities Exchange Act of 1934 (the “Exchange Act”) is recorded, processed, summarized and reported within the time periods specified in the Securities and Exchange Commission’s rules and forms, and that such information is accumulated and communicated to our management, including our Chief Executive Officer and Chief Financial Officer, as appropriate, to allow for timely decisions regarding required disclosures.
Our management, including our Chief Executive Officer and General Manager (the principal executive officer), Steve Christensen, along with our Chief Financial Officer (the principal financial officer), Stacie Schuler, have reviewed and evaluated the effectiveness of our disclosure controls and procedures as of October 31, 2016. Based upon this review and evaluation, these officers have concluded that our consolidated disclosure controls and procedures are effective as of October 31, 2016.
(b)Management’s Report on Internal Control Over Financial Reporting
Management is responsible for establishing and maintaining adequate internal control over financial reporting as defined in Rules 13a15-(f) and 15d-15(f) under the Securities Exchange Act of 1934. The Company’s internal control over financial reporting is a process designed to provide reasonable assurance regarding the reliability of financial reporting and the preparation of financial statements for external purposes in accordance with U.S. generally accepted accounting principles. A company’s internal control over financial reporting includes those policies and procedures that:
(i) pertain to the maintenance of records that, in reasonable detail, accurately and fairly reflect the transactions and dispositions of the assets of the Company;
(ii) provide reasonable assurance that transactions are recorded as necessary to permit preparation of financial statements in accordance with generally accepted accounting principles, and that receipts and expenditures of the Company are being made only in accordance with authorizations of management and governors of the Company; and
(iii) provide reasonable assurance regarding prevention or timely detection of unauthorized acquisition, use or disposition of the Company’s assets that could have a material effect on the financial statements.
Because of its inherent limitations, internal control over financial reporting may not prevent or detect misstatements. Also, projections of any evaluation of effectiveness to future periods are subject to the risk that controls may become inadequate because of changes in conditions, or that the degree of compliance with the policies or procedures may deteriorate.
Under the supervision of our Chief Executive Officer and our Chief Financial Officer, we conducted an evaluation of the effectiveness of our internal control over financial reporting based on the criteria set forth in the 2013 Internal Control-Integrated Framework issued by the Committee of Sponsoring Organizations of the Treadway Commission. Based on this evaluation, management has concluded that the Company’s internal control over financial reporting was effective as of October 31, 2016.
An attestation report from our accounting firm on our internal control over financial reporting is not included in this annual report because an attestation report is only required under the regulations of the Securities and Exchange Commission for accelerated filers and large accelerated filers.
83
(c)Changes in Internal Control Over Financial Reporting
There were no changes in our internal control over financial reporting (as defined in Rule 13a-15(f) under the Exchange Act) that occurred during the fourth fiscal quarter ended October 31, 2016 that has materially affected, or is reasonably likely to materially affect, our internal control over financial reporting.
None.
Pursuant to General Instruction G(3), we omit Part III, Items 10, 11, 12, 13 and 14 and incorporate such items by reference to an amendment to this Annual Report on Form 10-K or to a definitive proxy statement (the “2017 Proxy Statement”) to be filed with the Securities and Exchange Commission within 120 days after the close of the fiscal year covered by this Annual Report (October 31, 2016).
ITEM 10.DIRECTORS, EXECUTIVE OFFICERS AND CORPORATE GOVERNANCE
The Information required by this Item is incorporated by reference to the 2017 Proxy Statement.
ITEM 11. EXECUTIVE COMPENSATION
The Information required by this Item is incorporated by reference to the 2017 Proxy Statement.
ITEM 12. SECURITY OWNERSHIP OF CERTAIN BENEFICIAL OWNERS AND MANAGEMENT AND RELATED STOCKHOLDER MATTERS.
The Information required by this Item is incorporated by reference to the 2017 Proxy Statement.
ITEM 13. CERTAIN RELATIONSHIPS AND RELATED TRANSACTIONS, AND DIRECTOR INDEPENDENCE
The Information required by this Item is incorporated by reference to the 2017 Proxy Statement.
ITEM 14. PRINCIPAL ACCOUNTANT FEES AND SERVICES.
The Information required by this Item is incorporated by reference to the 2017 Proxy Statement.
84
ITEM 15.EXHIBITS, FINANCIAL STATEMENT SCHEDULES
Exhibits Filed as Part of this Report and Exhibits Incorporated by Reference.
The following exhibits and financial statements are filed as part of, or are incorporated by reference into, this report:
|
(1) |
Financial Statements |
The financial statements appear beginning at page 58 of this report.
|
(2) |
Financial Statement Schedules |
All supplemental schedules are omitted as the required information is inapplicable or the information is presented in the financial statements or related notes.
|
(3) |
Exhibits |
See the “Exhibit Index” following the signature pages.
Pursuant to the requirements of Section 13 or 15(d) of the Securities Exchange Act of 1934, the registrant has duly caused this report to be signed on its behalf by the undersigned, thereunto duly authorized.
|
|
|
|
GRANITE FALLS ENERGY, LLC |
|
|
|
|
|
|
Date: |
January 30, 2017 |
|
/s/ Steve Christensen |
|
|
|
|
Steve Christensen |
|
|
|
|
Chief Executive Officer |
|
|
|
|
|
|
Date: |
January 30, 2017 |
|
/s/ Stacie Schuler |
|
|
|
|
Stacie Schuler |
|
|
|
|
Chief Financial Officer |
|
|
|
|
|
85
Pursuant to the requirements of the Securities Exchange Act of 1934, this report has been signed below by the following persons on behalf of the registrant and in the capacities and on the dates indicated.
|
|
|
|
|
|
Date: |
January 30, 2017 |
|
/s/ Steve Christensen |
|
|
|
|
Steve Christensen, Chief Executive Officer and General Manager |
|
|
|
|
(Principal Executive Officer) |
|
|
|
|
|
|
Date: |
January 30, 2017 |
|
/s/ Stacie Schuler |
|
|
|
|
Stacie Schuler, Chief Financial Officer |
|
|
|
|
(Principal Financial and Accounting Officer) |
|
|
|
|
|
|
Date: |
January 30, 2017 |
|
/s/ Paul Enstad |
|
|
|
|
Paul Enstad, Governor and Chairman |
|
|
|
|
|
|
Date: |
January 30, 2017 |
|
/s/ Rodney R. Wilkison |
|
|
|
|
Rodney R. Wilkison, Governor and Vice Chairman |
|
|
|
|
|
|
Date: |
January 30, 2017 |
|
/s/ Dean Buesing |
|
|
|
|
Dean Buesing, Governor and Secretary |
|
|
|
|
|
|
Date: |
January 30, 2017 |
|
/s/ Leslie Bergquist |
|
|
|
|
Leslie Bergquist, Governor |
|
|
|
|
|
|
Date: |
January 30, 2017 |
|
/s/ Marten Goulet |
|
|
|
|
Marten Goulet, Governor |
|
|
|
|
|
|
Date: |
January 30, 2017 |
|
/s/ Kenton Johnson |
|
|
|
|
Kenton Johnson, Governor |
|
|
|
|
|
|
Date: |
January 30, 2017 |
|
/s/ Sherry Jean Larson |
|
|
|
|
Sherry Jean Larson, Governor |
|
|
|
|
|
|
Date: |
January 30, 2017 |
|
/s/ Michael Lund |
|
|
|
|
Michael Lund, Governor |
|
|
|
|
|
|
Date: |
January 30, 2017 |
|
/s/ Marty Seifert |
|
|
|
|
Marty Seifert, Alternate Governor |
86
GRANITE FALLS ENERGY, LLC
INDEX TO EXHIBITS TO FORM 10-K FOR FISCAL YEAR ENDED OCTOBER 31, 2016
|
Exhibit |
|
Exhibit |
|
Incorporated by Reference To: |
|
3.1 |
|
Articles of Organization |
|
Exhibit 3.1 to the registrant’s Form SB-2 filed with the Commission on August 30, 2002 (File No. 000-51277). |
|
3.2 |
|
Amendment of Articles of Organization |
|
Exhibit 3.1 to the registrant’s Form 10-QSB filed with the Commission on August 15, 2005 (File No. 000-51277). |
|
3.3 |
|
Fifth Amended and Restated Operating and Member Control Agreement, First Amendment to the Fifth Amended and Restated Operating and Member Control Agreement and Second Amendment to the Fifth Amended and Restated Member Control Agreement |
|
Exhibit 3.2 to the registrant’s Form 10-QSB filed with the Commission on September 14, 2006 (File No. 000-51277). |
|
3.4 |
|
Third Amendment to the Fifth Amended and Restated Operating and Member Control Agreement |
|
Exhibit 3.1 to the registrant’s Form 10-Q filed with the Commission on June 14, 2013 (File No. 000-51277). |
|
4.1 |
|
Form of Membership Unit Certificate. |
|
Exhibit 4.1 to the registrant’s Pre-Effective Amendment No. 1 to Form SB-2 filed with the Commission on December 20, 2002 (File No. 000-51277). |
|
10.1 |
|
Corn Storage and Delivery Agreement and Pre-Closing Memorandum dated October 6, 2003 between the Company and Farmers Cooperative Elevator Company. |
|
Exhibit 10.2 to the registrant’s Form 10-QSB filed with the Commission on November 14, 2003 (File No. 000-51277). |
|
10.2 |
|
Grain Procurement Agreement with Farmers Cooperative Elevator Company. |
|
Exhibit 10.2 to the registrant’s Form 10-QSB filed with the Commission on November 15, 2004 (File No. 000-51277). |
|
10.3 |
|
Electric Service Agreement dated August, 2004 with Minnesota Valley Cooperative Light and Power. |
|
Exhibit 10.13 to the registrant’s Form 10-KSB filed with the Commission on March 31, 2005 (File No. 000-51277). |
|
10.4 |
|
Trinity Rail Proposal for Rail Cars. |
|
Exhibit 10.16 to the registrant’s Form 10-KSB filed with the Commission on March 31, 2005 (File No. 000-51277). |
|
10.5 |
|
Job Opportunity Building Zone Business Subsidy Agreement. |
|
Exhibit 10.17 to the registrant’s Form 10-KSB filed with the Commission on March 31, 2005 (File No. 000-51277). |
|
10.6 |
|
Ethanol Marketing Agreement with Eco-Energy, Inc. dated December 24, 2008. (+) |
|
Exhibit 10.1 to the registrant’s Form 10-K filed with the Commission on January 27, 2009 (File No. 000-51277). |
|
10.7 |
|
Corn Oil Marketing Agreement between the registrant and Renewable Products Marketing Group, LLC dated April 29, 2010. (+) |
|
Exhibit 10.1 to the registrant’s Form 10-Q filed with the Commission on June 14, 2010 (File No. 000-51277). |
|
10.8 |
|
Distillers’ Grains Marketing Agreement between RPMG, Inc. and Granite Falls Energy, LLC dated December 10, 2010. (+) |
|
Exhibit 10.31 to the registrant’s Form 10-K filed with the Commission on January 26, 2011 (File No. 000-51277). |
|
10.9 |
|
Insider Trading Policy of Granite Falls Energy, LLC dated February 17, 2011. |
|
Exhibit 10.1 to the registrant’s Form 10-Q filed with the Commission on March 16, 2011 (File No. 000-51277). |
|
10.10 |
|
Ethanol Marketing Agreement Amendment No. 2 between Eco-Energy, Inc. and Granite Falls Energy, LLC dated August 30, 2011. (+) |
|
Exhibit 99.1 to the registrant’s Form 8-K filed with the Commission on September 1, 2011 (File No. 000-51277). |
87
|
10.11 |
|
Master Loan Agreement between United FCS, PCA and Granite Falls Energy, LLC dated August 22, 2012. |
|
Exhibit 10.14 to the registrant’s Form 10-K filed with the Commission on January 29, 2013 (File No. 000-51277). |
|
10.12 |
|
Revolving Term Loan Supplement between United FCS, PCA and Granite Falls Energy, LLC dated August 22, 2012. |
|
Exhibit 10.15 to the registrant’s Form 10-K filed with the Commission on January 29, 2013 (File No. 000-51277). |
|
10.13 |
|
Monitored Revolving Credit Supplement between United FCS, PCA and Granite Falls Energy, LLC dated August 22, 2012. |
|
Exhibit 10.16 to the registrant’s Form 10-K filed with the Commission on January 29, 2013 (File No. 000-51277). |
|
10.14 |
|
Subscription Agreement Including Investment Representations, dated July 31, 2013, by and between Heron Lake BioEnergy, LLC and Project Viking, L.L.C. |
|
Exhibit 10.2 to the registrant’s Form 10-Q filed with the Commission on September 16, 2013 (File No. 000-51277). |
|
10.15 |
|
Subscription Supplement Agreement dated July 31, 2013, by and among Heron Lake BioEnergy, LLC, Granite Falls Energy, LLC and Project Viking, L.L.C. |
|
Exhibit 10.3 to the registrant’s Form 10-Q filed with the Commission on September 16, 2013 (File No. 000-51277). |
|
10.16 |
|
Management Services Agreement effective as of July 31, 2013 between Granite Falls Energy, LLC and Heron Lake BioEnergy, LLC. |
|
Exhibit 10.4 to the registrant’s Form 10-Q filed with the Commission on September 16, 2013 (File No. 000-51277). |
|
10.17 |
|
Revolving Credit Supplement dated July 26, 2013 between United FCS, PCA and Granite Falls Energy, LLC. |
|
Exhibit 10.9 to the registrant’s Form 10-Q filed with the Commission on September 16, 2013 (File No. 000-51277). |
|
10.18 |
|
Member Control Agreement of Heron Lake BioEnergy, LLC, as amended through August 30, 2011. |
|
Exhibit 3.2 to Heron Lake BioEnergy, LLC’s (“HLBE’s”) Form 8-K dated September 2, 2011 (File No. 000-51825). |
|
10.19 |
|
Industrial Water Supply Development and Distribution Agreement dated October 27, 2003 among Heron Lake BioEnergy, LLC (f/k/a Generation II Ethanol, LLC), City of Heron Lake, Jackson County, and Minnesota Soybean Processors. |
|
Exhibit 10.10 to HLBE’s Registration Statement on Form 10 filed on August 22, 2008 (the “2008 Registration Statement”) (File No. 000-51825). |
|
10.20 |
|
Industrial Water Supply Treatment Agreement dated May 23, 2006 among Heron Lake BioEnergy, LLC, City of Heron Lake and County of Jackson. |
|
Exhibit 10.11 to HLBE’s 2008 Registration Statement (File No. 000-51825). |
|
10.21 |
|
Secured Promissory Note issued December 28, 2007 by Heron Lake BioEnergy, LLC as borrower to Federated Rural Electric Association as lender in principal amount of $600,000. |
|
Exhibit 10.20 to HLBE’s 2008 Registration Statement (File No. 000-51825). |
|
10.22 |
|
Electric Service Agreement dated October 17, 2007 by and between Interstate Power and Light Company and Heron Lake BioEnergy, LLC. |
|
Exhibit 10.22 to HLBE’s 2008 Registration Statement (File No. 000-51825). |
|
10.23 |
|
Corn Oil Marketing Agreement dated September 4, 2013 by and among Heron Lake BioEnergy, LLC and RPMG, Inc. (+) |
|
Exhibit 10.76 to HLBE’s Form 10-K/A for the year ended October 31, 2013 (File No. 000-51825). |
|
10.24 |
|
Ethanol Marketing Agreement dated September 17, 2013 by and among Heron Lake BioEnergy, LLC and Eco-Energy, LLC. (+) |
|
Exhibit 10.77 to HLBE’s Form 10-K for the year ended October 31, 2013 (File No. 000-51825). |
88
|
10.25 |
|
Distillers’ grains Off-Take Agreement dated September 24, 2013 by and among Heron Lake BioEnergy, LLC and Gavilon Ingredients, LLC. (+) |
|
Exhibit 10.78 to HLBE’s Form 10-K/A for the year ended October 31, 2013 (File No. 000-51825). |
|
10.26 |
|
Amendment No. 3 Ethanol Marketing Agreement dated September 17, 2013 by and between Eco-Energy, LLC and Granite Falls Energy, LLC. (+) |
|
Exhibit 10.40 to the registrant’s Form 10-K filed with the Commission on January 29, 2014 (File No. 000-51277). |
|
10.27 |
|
Loan Agreement dated July 29, 2014 by and between Agrinatural Gas, LLC, and Heron Lake BioEnergy, LLC |
|
Exhibit 10.1 to HLBE’s Form 10-Q for the quarter ended July 31, 2014 (File No. 000-51825). |
|
10.28 |
|
Promissory Note dated July 29, 2014 between Heron Lake BioEnergy, LLC, as Holder, and Agrinatural Gas, LLC, as Borrower |
|
Exhibit 10.2 to HLBE’s Form 10-Q for the quarter ended July 31, 2014 (File No. 000-51825). |
|
10.29 |
|
Security Agreement dated July 29, 2014 by and between Agrinatural Gas, LLC, and Heron Lake BioEnergy, LLC |
|
Exhibit 10.3 to HLBE’s Form 10-Q for the quarter ended July 31, 2014 (File No. 000-51825). |
|
10.30 |
|
Collateral Assignment dated July 29, 2014 by and between Agrinatural Gas, LLC, and Heron Lake BioEnergy, LLC |
|
Exhibit 10.4 to HLBE’s Form 10-Q for the quarter ended July 31, 2014 (File No. 000-51825). |
|
10.31 |
|
Guaranty dated July 29, 2014 by Rural Energy Solutions, LLC, guarantor, in favor of Heron Lake BioEnergy, LLC |
|
Exhibit 10.5 to HLBE’s Form 10-Q for the quarter ended July 31, 2014 (File No. 000-51825). |
|
10.32 |
|
Master Loan Agreement dated July 29, 2014 by and between AgStar Financial Services, FLCA and Heron Lake BioEnergy, LLC |
|
Exhibit 10.6 to HLBE’s Form 10-Q for the quarter ended July 31, 2014 (File No. 000-51825). |
|
10.33 |
|
$ 28,000,000 Revolving Term Loan Supplement dated July 29, 2014 by and between AgStar Financial Services, FLCA and Heron Lake BioEnergy, LLC |
|
Exhibit 10.7 to HLBE’s Form 10-Q for the quarter ended July 31, 2014 (File No. 000-51825). |
|
10.34 |
|
Security Agreement dated July 29, 2014 between Heron Lake BioEnergy, LLC and AgStar Financial Services, FLCA and CoBank, ACB |
|
Exhibit 10.8 to HLBE’s Form 10-Q for the quarter ended July 31, 2014 (File No. 000-51825). |
|
10.35 |
|
Real Estate Mortgage, Assignment of Rents and Profits and Fixture Financing Statement dated July 29, 2014 by and between AgStar Financial Services, FLCA, CoBank, ACB and Heron Lake BioEnergy, LLC |
|
Exhibit 10.9 to HLBE’s Form 10-Q for the quarter ended July 31, 2014 (File No. 000-51825). |
|
10.36 |
|
Guaranty dated July 29, 2014 by HLBE Pipeline Company, LLC in favor of AgStar Financial Services, FLCA |
|
Exhibit 10.10 to HLBE’s Form 10-Q for the quarter ended July 31, 2014 (File No. 000-51825). |
|
10.37 |
|
Security Agreement dated July 29, 2014 between HLBE Pipeline Company, LLC and AgStar Financial Services, FLCA and CoBank, ACB |
|
Exhibit 10.11 to HLBE’s Form 10-Q for the quarter ended July 31, 2014 (File No. 000-51825). |
|
10.38 |
|
Employment Contract between Stacie Schuler and Granite Falls Energy, LLC dated October 31, 2014. (*) |
|
Exhibit 10.1 to the registrant’s Form 8-K filed with the Commission on November 5, 2014 (File No. 000-51277). |
89
|
10.39 |
|
Employment Contract between Eric Baukol and Granite Falls Energy, LLC dated October 31, 2014. (*) |
|
Exhibit 10.2 to the registrant’s Form 8-K filed with the Commission on November 5, 2014 (File No. 000-51277). |
|
10.40 |
|
Employment Contract between Steve Christensen and Granite Falls Energy, LLC dated October 31, 2014. (*) |
|
Exhibit 10.1 to the registrant’s Form 8-K filed with the Commission on November 26, 2014 (File No. 000-51277). |
|
10.41 |
|
Amendment No. 1 dated July 22, 2016 to the Ethanol Marketing Agreement dated September 17, 2013 by and among Heron Lake BioEnergy, LLC and Eco-Energy, LLC. (+) |
|
Exhibit 10.1 to HLBE’s Form 10-Q for the quarter ended July 31, 2016 (File No. 000-51825). |
|
10.42 |
|
Amendment No. 4 dated July 22, 2016 to the Ethanol Marketing Agreement dated December 24, 2008 by and among Eco-Energy, LLC and Granite Falls Energy, LLC. (+) |
|
Exhibit 10.2 to the registrant’s Form 10-Q for the quarter ended July 31, 2016 (File No. 000-51277). |
|
10.43 |
|
Promissory Note issued November 1, 2016 by Granite Falls Energy, LLC as borrower to Fagen Energy, LLC as lender in principal amount of $7,500,000. |
|
Exhibit 10.1 to the registrant’s Form 8-K filed with the Commission on November 1, 2016 (File No. 000-51277). |
|
10.44 |
|
Pledge Agreement Dated November 1, 2016 between Granite Falls Energy, LLC and Fagen Energy, LLC. |
|
Exhibit 10.2 to the registrant’s Form 8-K filed with the Commission on November 1, 2016 (File No. 000-51277). |
|
10.45 |
|
Commercial Security Agreement Dated November 1, 2016 between Granite Falls Energy, LLC and Fagen Energy, LLC. |
|
Exhibit 10.3 to the registrant’s Form 8-K filed with the Commission on November 1, 2016 (File No. 000-51277). |
|
14.1 |
|
Code of Ethics. |
|
Exhibit 14.1 to the registrant’s Form 10-KSB filed with the Commission on March 30, 2004 (File No. 000-51277). |
|
21.1 |
|
Subsidiaries of the registrant. |
|
Exhibit 21.1 to the registrant’s Form 10-K filed with the Commission on January 29, 2014 (File No. 000-51277). |
|
31.1 |
|
Certification of Chief Executive Officer pursuant to 17 CFR 240.13a-14(a). (**) |
|
|
|
31.2 |
|
Certification of Chief Financial Officer pursuant to 17 CFR 240.13a-14(a). (**) |
|
|
|
32.1 |
|
Certification of Chief Executive Officer pursuant to 18 U.S.C. Section 1350. (**) |
|
|
|
32.2 |
|
Certification of Chief Financial Officer pursuant to 18 U.S.C. Section 1350. (**) |
|
|
|
101 |
|
The following financial information from Granite Falls Ethanol, LLC’s Annual Report on Form 10-K for the fiscal year ended October 31, 2016, formatted in XBRL (eXtensible Business Reporting Language): (i) the Consolidated Balance Sheets as of October 31, 2016 and October 31, 2015, (ii) the Consolidated Statements of Operations for the fiscal years ended October 31, 2016, 2015, and 2014, (iii) the Consolidated Statement of Changes in Members’ Equity; (iv) the Consolidated Statements of Cash Flows for the fiscal years ended October 31, 2016, 2015, and 2014, and (v) the Notes to the Consolidated Financial Statements. (**) |
||
(*)Indicates compensatory agreement.
(+)Certain portions of this exhibit have been redacted and filed on a confidential basis with the Commission pursuant to a request for confidential treatment under Rule 24b-2 of under the Exchange Act. Spaces corresponding to the deleted portions are represented by brackets with asterisks [* * *].
(**)Filed herewith.
90