Attached files
| file | filename |
|---|---|
| 8-K - FORM 8-K - Hyatt Hotels Corp | d8k.htm |
 Exhibit 99.1 |
 2
Forward-Looking Statements in this presentation, which are not historical facts, are
forward-looking statements within the meaning of the Private Securities Litigation Reform
Act of 1995. These statements include statements about our plans, strategies, occupancy and ADR
trends, market share, the number of properties we expect to open in the future, our expected capital
expenditures, depreciation and amortization expense and interest expense, estimates, financial
performance, prospects or future events and involve known and unknown risks that are difficult
to predict. As a result, our actual results, performance or achievements may differ materially from those expressed or
implied by these forward-looking statements. In some cases, you can identify forward-looking
statements by the use of words such as “may,” “could,” “expect,”
“intend,” “plan,” “seek,” “anticipate,” “believe,” “estimate,” “predict,” “potential,” “continue,” “likely,” “will,”
“would” and variations of these terms and similar expressions, or the negative
of these terms or similar expressions. Such forward-looking statements are necessarily
based upon estimates and assumptions that, while considered reasonable by us and our management, are
inherently uncertain. Factors that may cause actual results to differ materially from current
expectations include, among others, the depth and duration of the current economic downturn;
levels of spending in the business, travel and leisure industries as well as consumer
confidence; declines in occupancy and average daily rate; hostilities, including future terrorist
attacks, or fear of hostilities that affect travel; travel-related accidents; changes
in the tastes and preferences of our customers; relationships with associates and labor unions
and changes in labor law; the financial condition of, and our relationships with, third-party
property owners, franchisees and hospitality venture partners; if our third-party owners,
franchisees or development partners are unable to access the capital necessary to fund
current operations or implement our plans for growth; risk associated with potential acquisitions and
dispositions and the introduction of new brand concepts; changes in the competitive
environment in our industry and the markets where we operate; outcomes of legal proceedings;
changes in federal, state, local or foreign tax law; fluctuations in currency exchange rates; general volatility of the capital
markets; our ability to access the capital markets; and other risks discussed in the Company’s
filings with the U.S. Securities and Exchange Commission, including our Annual Report on
Form 10-K, which filings are available from the SEC. We caution you not to place undue
reliance on any forward-looking statements, which are made as of the date of this presentation. We undertake no obligation to
update publicly any of these forward-looking statements to reflect actual results, new information
or future events, changes in assumptions or changes in other factors affecting
forward-looking statements, except to the extent required by applicable laws. If we
update one or more forward-looking statements, no inference should be drawn that we will make
additional updates with respect to those or other forward-looking
statements.
In this presentation, management has referred to Adjusted EBITDA, which is not presented in accordance
with US GAAP. For our definition of Adjusted EBITDA and a reconciliation of
consolidated Adjusted EBITDA to EBITDA and a reconciliation of EBITDA to net income (loss)
attributable to Hyatt Hotels Corporation, please refer to Part I, Item 7 “Management’s Discussion and Analysis of Financial
Condition and Results of Operations – Results of Operations” of our Annual Report on Form
10-K for fiscal year 2009 or the information posted on the Investor Relations page of the
Company’s website, which can be accessed at http://www.hyatt.com and by selecting the
Investor Relations link located at the bottom of the
page.
|
 3
Mission / Goal / Values
To
become the most preferred brand
in each segment that we serve for our
associates, guests and owners
foster a
common purpose and culture
within the Hyatt family through shared core values of
mutual respect, intellectual honesty and integrity,
humility, fun, creativity and innovation
We aim to
provide authentic hospitality
To
by making a difference in the lives of the people
we touch every day, including our
associates, guests and owners |
 4
Key Highlights
Global footprint in key gateway cities provides a foundation
for expansion in high growth markets
Strategy of owning, managing and franchising properties
provides diversity of earnings streams and growth opportunities
Strong capital base and ability to support growth
Experienced management team
Premier brands and a long-term strategic focus on
brand preference |
 5
Expanding Our Presence
in Attractive Markets
Increase market presence
Increase focus on franchising,
primarily in North America
Utilize our capital and asset base for
targeted growth
Improvement in the
Performance of Existing Hotels
Focus on associate engagement
Enhance operational efficiency
Enhance customer satisfaction
Increase revenue share of hotel in its
market
Renovate / re-invest in owned hotels
Strategy Drives Brand Preference and
Shareholder Value |
 6
Portfolio of Brands
Note: Percentages based upon room/unit counts as of March 31, 2010
Select Service Upscale
(15%)
Luxury
(4%)
Select Service Extended Stay
(3%)
Vacation Ownership / Residential
(2%)
Upper Upscale
(76%) |
 7
Distribution Overview
Hyatt /
Hyatt Regency
71,277
58%
Grand Hyatt
21,567
17%
Hyatt Place
19,055
15%
Hyatt
Residential
1,337
1%
Hyatt Vacation
Ownership
962
1%
Andaz
912
1%
Summerfield
Suites
4,213
3%
Park Hyatt
4,729
4%
Total Rooms by Brand
Total Room Portfolio Mix
Rooms
By
Region
Owned &
Leased
28,315
23%
Managed
64,468
52%
Franchised
17,224
14%
Unconsolidated
Hospitality Venture
11,746
9%
Residential
Property
1,337
1%
Vacation
Ownership
962
1%
Note: Room/unit counts as of March 31, 2010
1
Excludes Timeshare and Residences
We have 124,052 rooms/units in our worldwide portfolio
North
America
71%
ASPAC
17%
EAME
7%
Southwest
Asia
3%
Other
Americas
2%
1 |
 8
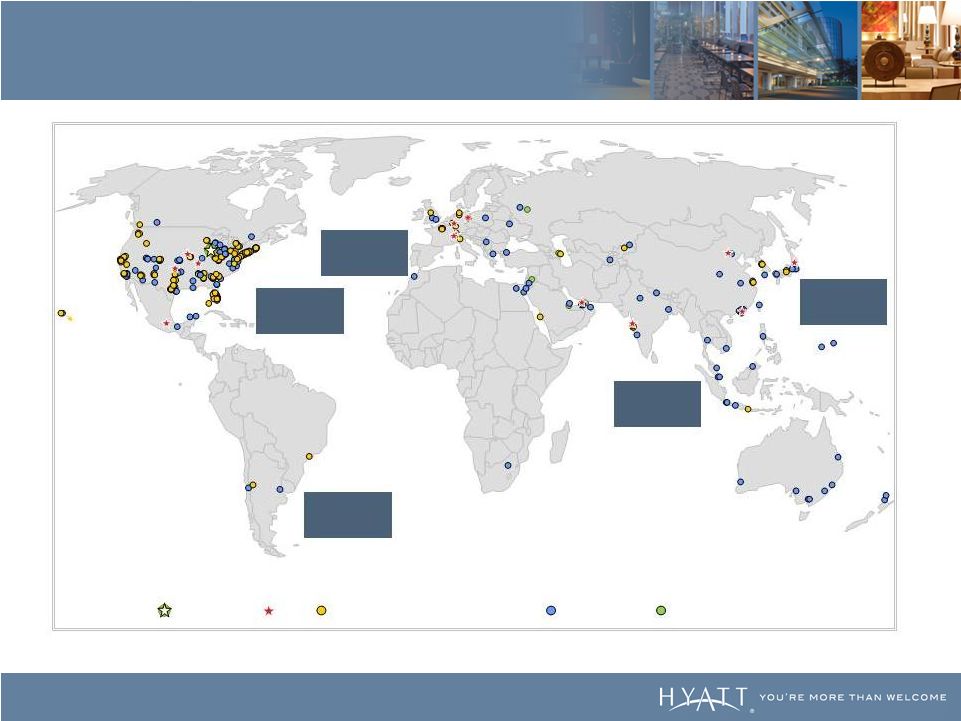
We Have a Global Footprint
Note:
Property counts as of March 31, 2010
Europe / Middle
East / Africa
Subtotal: 36
North America
Subtotal: 323
Latin America
Subtotal: 7
Southwest Asia
Subtotal: 16
Asia Pacific
Subtotal: 52
Offices
Managed and Franchised
Global Headquarters
Owned, Leased and Unconsolidated Hospitality Ventures
Vacation Ownership and Residential |
 9
$628M
$708M
$687M
$406M
Attractive Business Model
Adjusted
EBITDA
2006
2007
2009
2008
2009
Adjusted
EBITDA
($406mm)
Owned
and
Leased
Operating
Margin
23%
25%
26%
18%
2006
2007
2009
2008
50%
12%
13%
25%
Owned & Leased
North America Management
& Franchising
International Management &
Franchising
Unconsolidated Hospitality
Ventures
1
3
2
Represents 2009 Actual Adjusted EBITDA. Effective January 1, 2010, our Park Hyatt and Andaz branded
hotels are managed and reported geographically by the respective North American or international management and
franchising segment consistent with our brands. As a result of this change we are reporting the
operating results for the Park Hyatt and Andaz branded hotels located in North America in the North American management and
franchising segment for the year ended December 31, 2009. Corporate and other EBITDA of ($79) million
not included in percent breakdown. Owned and leased operating margin is defined as the margin on
owned and leased hotel results calculated as the difference between owned and leased hotels revenue and owned and leased hotels expense as reflected on
our consolidated statements of income (loss).
For our definition of Adjusted EBITDA and a reconciliation of consolidated Adjusted EBITDA to EBITDA
and a reconciliation of EBITDA to its most directly comparable GAAP measure, net income (loss) attributable to Hyatt
Hotels Corporation, see Part I, Item 7 “Management’s Discussion and Analysis of Financial
Condition and Results of Operations – Results of Operations” of our Annual Report on Form 10-K for fiscal year 2009 or the
information posted on the Investor Relations website, which can be accessed at
http://www.hyatt.com and by selecting the Investor Relations link located at the bottom of the page.
1
2
3 |
 10
Owned / Venture Hotels in Key
Gateway Cities
Chicago, IL
Park Hyatt Chicago
198 Rooms
Mumbai, India
Grand Hyatt Mumbai
547 Rooms
Grand Hyatt New York
1,311 Rooms
New York, NY
Seoul, Korea
Grand Hyatt Seoul
601 Rooms
São Paulo, Brazil
Grand Hyatt São Paulo
466 Rooms
Hyatt at Olive 8
346 Rooms
Seattle, WA
Andaz West Hollywood
238 Rooms
Los Angeles, CA
Park Hyatt Washington
216 Rooms
Washington,
D.C.
Paris, France
Park
Hyatt
Paris
-
Vendôme
167 Rooms
Zurich,
Switzerland
Park Hyatt Zurich
142 Rooms |
 11
Recent and Near-Term Hotel Openings
Provide Entry Into New Markets
Chennai, India
Hyatt Regency Chennai
325 Rooms
4Q 2010
154th Hyatt Place
92 Rooms
2Q 2010
Santa Fe, NM
Broomfield, CO
34th Summerfield Suites
123 Rooms
2Q 2010
Shenzhen, China
Grand Hyatt Shenzhen
491 Rooms
4Q 2009
Grand Hyatt Macau
791 Rooms
4Q 2009
Macau, China
New York, NY
Andaz Fifth Avenue
184 Rooms
3Q 2010
Andaz Wall Street
253 Rooms
1Q 2010
Abu Dhabi, UAE
Hyatt at Capital Gate, Abu Dhabi
190 Rooms
3Q 2010
Carlsbad, CA
Park Hyatt Aviara
Resort
329 Rooms
2Q 2010 |
 12
Expand into under-penetrated / underrepresented markets
As of December 31, 2009, substantiated by 120 executed
contracts (over 27,000 rooms)
55% international properties (70% of rooms)
Approximately 10 new countries and several new markets
Openings
Opened 30 new hotels in 2009 (removed 8 hotels)
Expect to open 25+ hotels in 2010
Expect to update prospective expansion information annually
Expansion Opportunities |
 13
$1.3 billion of cash and cash equivalents and undrawn borrowing
capacity of another $1.4 billion
One of the highest credit ratings among lodging peers with
modest current debt levels and significant liquidity
No significant near-term maturities ($143 million through 2012)
Strong Capital Base
Note: Balance sheet information as of March 31, 2010
|
 14
Experienced Management Team
Over 80,000 associates in 45 countries
GM’s have an average tenure of more than 21 years
Executive team has an average of 27 years of experience
Tom Pritzker, Executive Chairman of Hyatt’s Board of Directors, continues
a legacy of strategic leadership and innovation
|
 15
Financial Highlights
Operating leverage is significant
Focus on operating margins for our existing portfolio and on returns
on capital for the business overall
Continued efforts to expand in key gateway cities and
emerging markets
Strong balance sheet / liquidity |