Attached files
| file | filename |
|---|---|
| EX-32.2 - SECTION 906 CERTIFICATION - Hyatt Hotels Corp | exhibit322-63017.htm |
| EX-3.1 - AMENDED AND RESTATED CERTIFICATE OF INCORPORATION OF HYATT HOTELS CORPORATION - Hyatt Hotels Corp | exhibit31-63017.htm |
| EX-32.1 - SECTION 906 CERTIFICATION - Hyatt Hotels Corp | exhibit321-63017.htm |
| EX-31.2 - SECTION 302 CERTIFICATION - Hyatt Hotels Corp | exhibit312-63017.htm |
| EX-31.1 - SECTION 302 CERTIFICATION - Hyatt Hotels Corp | exhibit311-63017.htm |
UNITED STATES
SECURITIES AND EXCHANGE COMMISSION
Washington, DC 20549
Form 10-Q
(Mark One)
x | QUARTERLY REPORT PURSUANT TO SECTION 13 OR 15(d) OF THE SECURITIES EXCHANGE ACT OF 1934 |
For the quarterly period ended June 30, 2017
OR
¨ | TRANSITION REPORT PURSUANT TO SECTION 13 OR 15(d) OF THE SECURITIES EXCHANGE ACT OF 1934 |
For the transition period from to
Commission File No. 001-34521
HYATT HOTELS CORPORATION
(Exact Name of Registrant as Specified in Its Charter)
Delaware | 20-1480589 | |
(State or Other Jurisdiction of Incorporation or Organization) | (I.R.S. Employer Identification No.) | |
71 South Wacker Drive 12th Floor, Chicago, Illinois | 60606 | |
(Address of Principal Executive Offices) | (Zip Code) | |
(312) 750-1234
(Registrant’s Telephone Number, Including Area Code)
Indicate by check mark whether the registrant: (1) has filed all reports required to be filed by Section 13 or 15(d) of the Securities Exchange Act of 1934 during the preceding 12 months (or for such shorter period that the registrant was required to file such reports), and (2) has been subject to such filing requirements for the past 90 days. Yes x No ¨
Indicate by check mark whether the registrant has submitted electronically and posted on its corporate Web site, if any, every Interactive Data File required to be submitted and posted pursuant to Rule 405 of Regulation S-T (§ 232.405 of this chapter) during the preceding 12 months (or for such shorter period that the registrant was required to submit and post such files). Yes x No ¨
Indicate by check mark whether the registrant is a large accelerated filer, an accelerated filer, a non-accelerated filer, a smaller reporting company or an emerging growth company. See the definitions of "large accelerated filer," "accelerated filer", "smaller reporting company" and "emerging growth company" in Rule 12b-2 of the Exchange Act. (Check One):
Large accelerated filer | x | Accelerated filer | ¨ | ||
Non-accelerated filer | ¨ | Smaller reporting company | ¨ | ||
Emerging growth company | ¨ | ||||
If an emerging growth company, indicate by check mark if the registrant has elected not to use the extended transition period for complying with any new or revised financial accounting standards provided pursuant to Section 13(a) of the Exchange Act. ¨
Indicate by check mark whether the registrant is a shell company (as defined in Rule 12b-2 of the Exchange Act). Yes ¨ No x
As of July 28, 2017, there were 38,940,601 shares of the registrant’s Class A common stock, $0.01 par value, outstanding and 86,090,839 shares of the registrant’s Class B common stock, $0.01 par value, outstanding.
HYATT HOTELS CORPORATION
QUARTERLY REPORT ON FORM 10-Q
FOR THE PERIOD ENDED JUNE 30, 2017
TABLE OF CONTENTS
PART I – FINANCIAL INFORMATION | ||
Item 1. | ||
Item 2. | ||
Item 3. | ||
Item 4. | ||
PART II – OTHER INFORMATION | ||
Item 1. | ||
Item 1A. | ||
Item 2. | ||
Item 3. | ||
Item 4. | ||
Item 5. | ||
Item 6. | ||
PART I. FINANCIAL INFORMATION
Item 1. Financial Statements.
HYATT HOTELS CORPORATION AND SUBSIDIARIES
CONDENSED CONSOLIDATED STATEMENTS OF INCOME
(In millions of dollars, except per share amounts)
(Unaudited)
Three Months Ended | Six Months Ended | ||||||||||||||
June 30, 2017 | June 30, 2016 | June 30, 2017 | June 30, 2016 | ||||||||||||
REVENUES: | |||||||||||||||
Owned and leased hotels | $ | 577 | $ | 559 | $ | 1,149 | $ | 1,075 | |||||||
Management and franchise fees | 130 | 115 | 252 | 222 | |||||||||||
Other revenues | 15 | 11 | 37 | 20 | |||||||||||
Other revenues from managed properties | 473 | 480 | 944 | 937 | |||||||||||
Total revenues | 1,195 | 1,165 | 2,382 | 2,254 | |||||||||||
DIRECT AND SELLING, GENERAL, AND ADMINISTRATIVE EXPENSES: | |||||||||||||||
Owned and leased hotels | 430 | 413 | 857 | 802 | |||||||||||
Depreciation and amortization | 91 | 86 | 182 | 167 | |||||||||||
Other direct costs | 6 | 9 | 25 | 15 | |||||||||||
Selling, general, and administrative | 90 | 75 | 189 | 163 | |||||||||||
Other costs from managed properties | 473 | 480 | 944 | 937 | |||||||||||
Direct and selling, general, and administrative expenses | 1,090 | 1,063 | 2,197 | 2,084 | |||||||||||
Net gains and interest income from marketable securities held to fund operating programs | 10 | 7 | 25 | 8 | |||||||||||
Equity earnings (losses) from unconsolidated hospitality ventures | 1 | 19 | (2 | ) | 21 | ||||||||||
Interest expense | (20 | ) | (20 | ) | (41 | ) | (37 | ) | |||||||
Gains (losses) on sales of real estate | 34 | (21 | ) | 34 | (21 | ) | |||||||||
Other income (loss), net | 2 | 1 | 42 | (3 | ) | ||||||||||
INCOME BEFORE INCOME TAXES | 132 | 88 | 243 | 138 | |||||||||||
PROVISION FOR INCOME TAXES | (45 | ) | (21 | ) | (86 | ) | (37 | ) | |||||||
NET INCOME | 87 | 67 | 157 | 101 | |||||||||||
NET INCOME AND ACCRETION ATTRIBUTABLE TO NONCONTROLLING INTERESTS | — | — | — | — | |||||||||||
NET INCOME ATTRIBUTABLE TO HYATT HOTELS CORPORATION | $ | 87 | $ | 67 | $ | 157 | $ | 101 | |||||||
EARNINGS PER SHARE—Basic | |||||||||||||||
Net income | $ | 0.69 | $ | 0.50 | $ | 1.23 | $ | 0.75 | |||||||
Net income attributable to Hyatt Hotels Corporation | $ | 0.69 | $ | 0.50 | $ | 1.23 | $ | 0.75 | |||||||
EARNINGS PER SHARE—Diluted | |||||||||||||||
Net income | $ | 0.68 | $ | 0.49 | $ | 1.22 | $ | 0.74 | |||||||
Net income attributable to Hyatt Hotels Corporation | $ | 0.68 | $ | 0.49 | $ | 1.22 | $ | 0.74 | |||||||
See accompanying Notes to condensed consolidated financial statements.
1
HYATT HOTELS CORPORATION AND SUBSIDIARIES
CONDENSED CONSOLIDATED STATEMENTS OF COMPREHENSIVE INCOME
(In millions of dollars)
(Unaudited)
Three Months Ended | Six Months Ended | ||||||||||||||
June 30, 2017 | June 30, 2016 | June 30, 2017 | June 30, 2016 | ||||||||||||
Net income | $ | 87 | $ | 67 | $ | 157 | $ | 101 | |||||||
Other comprehensive income (loss), net of taxes: | |||||||||||||||
Foreign currency translation adjustments, net of tax expense of $- for the three and six months ended June 30, 2017 and June 30, 2016 | 19 | (9 | ) | 60 | 15 | ||||||||||
Unrealized gains on available-for-sale securities, net of tax expense of $7 and $28 for the three and six months ended June 30, 2017, respectively, and $8 and $5 for the three and six months ended June 30, 2016, respectively | 11 | 12 | 45 | 8 | |||||||||||
Other comprehensive income | 30 | 3 | 105 | 23 | |||||||||||
COMPREHENSIVE INCOME | 117 | 70 | 262 | 124 | |||||||||||
COMPREHENSIVE INCOME ATTRIBUTABLE TO NONCONTROLLING INTERESTS | — | — | — | — | |||||||||||
COMPREHENSIVE INCOME ATTRIBUTABLE TO HYATT HOTELS CORPORATION | $ | 117 | $ | 70 | $ | 262 | $ | 124 | |||||||
See accompanying Notes to condensed consolidated financial statements.
2
HYATT HOTELS CORPORATION AND SUBSIDIARIES
CONDENSED CONSOLIDATED BALANCE SHEETS
(In millions of dollars, except share and per share amounts)
(Unaudited)
June 30, 2017 | December 31, 2016 | ||||||
ASSETS | |||||||
CURRENT ASSETS: | |||||||
Cash and cash equivalents | $ | 400 | $ | 482 | |||
Restricted cash | 340 | 76 | |||||
Short-term investments | 51 | 56 | |||||
Receivables, net of allowances of $21 at June 30, 2017 and $18 at December 31, 2016 | 368 | 304 | |||||
Inventories | 15 | 28 | |||||
Prepaids and other assets | 153 | 153 | |||||
Prepaid income taxes | 36 | 40 | |||||
Total current assets | 1,363 | 1,139 | |||||
Investments | 181 | 186 | |||||
Property and equipment, net | 4,239 | 4,270 | |||||
Financing receivables, net of allowances | 19 | 19 | |||||
Goodwill | 145 | 125 | |||||
Intangibles, net | 671 | 599 | |||||
Deferred tax assets | 290 | 313 | |||||
Other assets | 993 | 1,098 | |||||
TOTAL ASSETS | $ | 7,901 | $ | 7,749 | |||
LIABILITIES, REDEEMABLE NONCONTROLLING INTEREST AND EQUITY | |||||||
CURRENT LIABILITIES: | |||||||
Current maturities of long-term debt | $ | 241 | $ | 119 | |||
Accounts payable | 159 | 162 | |||||
Accrued expenses and other current liabilities | 550 | 514 | |||||
Accrued compensation and benefits | 123 | 129 | |||||
Total current liabilities | 1,073 | 924 | |||||
Long-term debt | 1,446 | 1,445 | |||||
Other long-term liabilities | 1,530 | 1,472 | |||||
Total liabilities | 4,049 | 3,841 | |||||
Commitments and contingencies (see Note 11) | |||||||
Redeemable noncontrolling interest in preferred shares of a subsidiary | 9 | — | |||||
EQUITY: | |||||||
Preferred stock, $0.01 par value per share, 10,000,000 shares authorized and none outstanding at June 30, 2017 and December 31, 2016 | — | — | |||||
Class A common stock, $0.01 par value per share, 1,000,000,000 shares authorized, 39,422,221 issued and outstanding at June 30, 2017, and Class B common stock, $0.01 par value per share, 422,318,251 shares authorized, 86,090,839 shares issued and outstanding at June 30, 2017. Class A common stock, $0.01 par value per share, 1,000,000,000 shares authorized, 39,952,061 issued and outstanding at December 31, 2016, and Class B common stock, $0.01 par value per share, 422,857,621 shares authorized, 90,863,209 shares issued and outstanding at December 31, 2016 | 1 | 1 | |||||
Additional paid-in capital | 1,358 | 1,686 | |||||
Retained earnings | 2,650 | 2,493 | |||||
Accumulated other comprehensive loss | (172 | ) | (277 | ) | |||
Total stockholders’ equity | 3,837 | 3,903 | |||||
Noncontrolling interests in consolidated subsidiaries | 6 | 5 | |||||
Total equity | 3,843 | 3,908 | |||||
TOTAL LIABILITIES, REDEEMABLE NONCONTROLLING INTEREST AND EQUITY | $ | 7,901 | $ | 7,749 | |||
See accompanying Notes to condensed consolidated financial statements.
3
HYATT HOTELS CORPORATION AND SUBSIDIARIES
CONDENSED CONSOLIDATED STATEMENTS OF CASH FLOWS
(In millions of dollars)
(Unaudited)
Six Months Ended | |||||||
June 30, 2017 | June 30, 2016 | ||||||
CASH FLOWS FROM OPERATING ACTIVITIES: | |||||||
Net income | $ | 157 | $ | 101 | |||
Adjustments to reconcile net income to net cash provided by operating activities: | |||||||
Depreciation and amortization | 182 | 167 | |||||
(Gains) losses on sales of real estate | (34 | ) | 21 | ||||
Realized losses from marketable securities | 40 | — | |||||
Working capital changes and other | (26 | ) | (50 | ) | |||
Net cash provided by operating activities | 319 | 239 | |||||
CASH FLOWS FROM INVESTING ACTIVITIES: | |||||||
Purchases of marketable securities and short-term investments | (251 | ) | (226 | ) | |||
Proceeds from marketable securities and short-term investments | 252 | 232 | |||||
Contributions to investments | (23 | ) | (17 | ) | |||
Return of investments | 200 | 52 | |||||
Acquisitions, net of cash acquired | (243 | ) | (238 | ) | |||
Capital expenditures | (133 | ) | (85 | ) | |||
Proceeds from sales of real estate, net of cash disposed | 296 | 240 | |||||
Sales proceeds transferred to escrow as restricted cash | (267 | ) | — | ||||
Other investing activities | (13 | ) | 19 | ||||
Net cash used in investing activities | (182 | ) | (23 | ) | |||
CASH FLOWS FROM FINANCING ACTIVITIES: | |||||||
Proceeds from debt, net of issuance costs of $- and $4, respectively | 420 | 519 | |||||
Repayments of debt | (295 | ) | (428 | ) | |||
Repurchase of common stock | (348 | ) | (131 | ) | |||
Proceeds from redeemable noncontrolling interest in preferred shares of a subsidiary | 9 | — | |||||
Other financing activities | (7 | ) | (7 | ) | |||
Net cash used in financing activities | (221 | ) | (47 | ) | |||
EFFECT OF EXCHANGE RATE CHANGES ON CASH | 2 | 16 | |||||
NET (DECREASE) INCREASE IN CASH AND CASH EQUIVALENTS | (82 | ) | 185 | ||||
CASH AND CASH EQUIVALENTS—BEGINNING OF YEAR | 482 | 457 | |||||
CASH AND CASH EQUIVALENTS—END OF PERIOD | $ | 400 | $ | 642 | |||
SUPPLEMENTAL DISCLOSURE OF CASH FLOW INFORMATION: | |||||||
Cash paid during the period for interest | $ | 40 | $ | 37 | |||
Cash paid during the period for income taxes | $ | 63 | $ | 28 | |||
Non-cash investing and financing activities are as follows: | |||||||
Change in accrued capital expenditures | $ | 23 | $ | 6 | |||
See accompanying Notes to condensed consolidated financial statements.
4
HYATT HOTELS CORPORATION AND SUBSIDIARIES
NOTES TO CONDENSED CONSOLIDATED FINANCIAL STATEMENTS
(amounts in millions of dollars, unless otherwise indicated)
(Unaudited)
1. ORGANIZATION
Hyatt Hotels Corporation, a Delaware corporation, and its consolidated subsidiaries (collectively "Hyatt Hotels Corporation") provide hospitality services on a worldwide basis through the development, ownership, operation, management, franchising and licensing of hospitality related businesses. We develop, own, operate, manage, franchise, license or provide services to a portfolio of properties consisting of full service hotels, select service hotels, resorts and other properties, including timeshare, fractional and other forms of residential or vacation properties. At June 30, 2017, (i) we operated or franchised 321 full service hotels, comprising 124,432 rooms throughout the world, (ii) we operated or franchised 365 select service hotels, comprising 51,194 rooms, of which 329 hotels are located in the United States, and (iii) our portfolio of properties included 6 franchised all inclusive Hyatt-branded resorts, comprising 2,401 rooms, and 3 destination wellness resorts, comprising 421 rooms. At June 30, 2017, our portfolio of properties operated in 56 countries around the world.
As used in these Notes and throughout this Quarterly Report on Form 10-Q, (i) the terms "Company," "we," "us" or "our" mean Hyatt Hotels Corporation and its consolidated subsidiaries and (ii) the term "portfolio of properties" refers to hotels and other properties or residential ownership units that we develop, own, operate, manage, franchise, license or provide services to, including under our Park Hyatt, Miraval, Grand Hyatt, Hyatt Regency, Hyatt, Andaz, Hyatt Centric, The Unbound Collection by Hyatt, Hyatt Place, Hyatt House, Hyatt Ziva, Hyatt Zilara and Hyatt Residence Club brands.
The accompanying unaudited condensed consolidated financial statements have been prepared in accordance with accounting principles generally accepted in the United States of America ("GAAP") for interim financial information, the instructions to Form 10-Q and Article 10 of Regulation S-X. Accordingly, they do not include all information or footnotes required by GAAP for complete annual financial statements. As a result, this Quarterly Report on Form 10-Q should be read in conjunction with the Consolidated Financial Statements and accompanying Notes in our Annual Report on Form 10-K for the fiscal year ended December 31, 2016 (the "2016 Form 10-K").
We have eliminated all intercompany accounts and transactions in our condensed consolidated financial statements. We consolidate entities under our control, including entities where we are deemed to be the primary beneficiary.
Management believes the accompanying condensed consolidated financial statements reflect all adjustments, which are all of a normal recurring nature, considered necessary for a fair presentation of the interim periods.
2. RECENTLY ISSUED ACCOUNTING PRONOUNCEMENTS
Adopted Accounting Standards—In March 2016, the Financial Accounting Standards Board ("FASB") released Accounting Standards Update No. 2016-09 ("ASU 2016-09"), Compensation-Stock Compensation (Topic 718): Improvements to Employee Share-Based Payment Accounting. ASU 2016-09 simplifies the accounting for share-based payment transactions, including the income tax consequences, classification of awards as either equity or liabilities, and classification on the statement of cash flows. The provisions of ASU 2016-09 were effective for interim periods and fiscal years beginning after December 15, 2016. We adopted ASU 2016-09 on January 1, 2017, which resulted in recognition of excess tax benefits from share-based payment transactions on the condensed consolidated statements of income and within operating activities on the condensed consolidated statements of cash flows, on a prospective basis. ASU 2016-09 did not materially impact our condensed consolidated financial statements and prior periods have not been adjusted.
Future Adoption of Accounting Standards—In May 2014, the FASB released Accounting Standards Update No. 2014-09 ("ASU 2014-09"), Revenue from Contracts with Customers (Topic 606). ASU 2014-09 supersedes the revenue recognition requirements in Topic 605, Revenue Recognition, and provides a single, comprehensive revenue recognition model for contracts with customers. In August 2015, the FASB released Accounting Standards Update No. 2015-14 ("ASU 2015-14"), Revenue from Contracts with Customers (Topic 606): Deferral of the Effective Date. ASU 2015-14 delays the effective date of ASU 2014-09 by one year, making it effective for interim
5
periods and fiscal years beginning after December 15, 2017, with early adoption permitted as of the original effective date under ASU 2014-09.
ASU 2014-09 requires entities to recognize revenue when a customer obtains control of a good or a service. Revenues are recognized in an amount that reflects the consideration expected to be received in return for the goods or services. ASU 2014-09 also requires enhanced disclosures regarding the nature, amount, timing, and uncertainty of revenue and cash flows arising from contracts with customers.
The standard permits the use of either the full retrospective or modified retrospective (cumulative effect) transition method. We expect to adopt ASU 2014-09 utilizing the full retrospective transition method on January 1, 2018.
While we continue to evaluate possible impacts on our condensed consolidated financial statements, ASU 2014-09 is currently expected to impact either the amount or timing of revenue recognition as follows:
•Under existing guidance, gains on sales of real estate are deferred when we maintain substantial continuing involvement and are amortized into management and franchise fee revenues. Upon adoption of ASU 2014-09, gains on sales of real estate will be recognized when control of the property transfers to the buyer. Any remaining unamortized deferred gains at our date of adoption will be included as an adjustment to retained earnings. See Note 9 for the deferred gains on sales of hotel properties at June 30, 2017 and December 31, 2016. For the three and six months ended June 30, 2017, we recognized $6 million and $11 million, respectively, of management and franchise fee revenues related to the amortization of these deferred gains on our condensed consolidated statements of income.
•Under existing guidance, amortization of certain management and franchise agreement intangibles is recorded within depreciation and amortization on our condensed consolidated statements of income. Upon adoption of ASU 2014-09, certain management and franchise agreement intangibles will meet the definition of consideration paid to a customer and therefore, will be recorded as contra-revenue within management and franchise fee revenues on our condensed consolidated statements of income. For the three and six months ended June 30, 2017, we recognized $4 million and $8 million, respectively, of amortization expense related to management and franchise agreement intangibles that will meet the definition of consideration paid to a customer upon adoption of ASU 2014-09.
•Under existing guidance, incentive fees are recognized in the amount that would be due as if the contract were to terminate at that time. Under ASU 2014-09, variable consideration is included in the transaction price only if it is probable that a significant reversal in the cumulative amount of revenue recognized would not occur when the uncertainty associated with the variable consideration is subsequently resolved. This may result in a different pattern of quarterly recognition for incentive fees for certain contracts. We do not anticipate a material impact to incentive fee recognition on a full year basis.
•Under existing guidance, franchise application fees are recognized at a point in time. Upon adoption of ASU 2014-09, franchise application fees will be recognized over time. We do not expect a significant impact on our condensed consolidated financial statements.
We do not expect the standard to materially affect the amount or timing of revenue recognition for royalty fees from our franchised properties, base management fees from our managed properties, or revenues from hotel guest transactions at our owned and leased properties. We are continuing to evaluate other possible impacts to our condensed consolidated financial statements, including the impact related to our loyalty program.
In January 2016, the FASB released Accounting Standards Update No. 2016-01 ("ASU 2016-01"), Financial Instruments - Overall (Subtopic 825-10): Recognition and Measurement of Financial Assets and Financial Liabilities. ASU 2016-01 revises the accounting for equity investments and financial liabilities under the fair value option and the presentation and disclosure requirements for financial instruments. The provisions of ASU 2016-01 are effective for interim periods and fiscal years beginning after December 15, 2017. Upon adoption, the unrealized gains (losses) on available-for-sale ("AFS") equity securities, including our investment in Playa Hotels & Resorts N.V. ("Playa N.V.") (see Note 4), reported in accumulated other comprehensive loss at December 31, 2017 will be reclassified to retained earnings, and any subsequent changes in fair value will be recognized in net income on our condensed consolidated statements of income. We are continuing to evaluate the other possible impacts of adopting ASU 2016-01.
6
In February 2016, the FASB released Accounting Standards Update No. 2016-02 ("ASU 2016-02"), Leases (Topic 842). ASU 2016-02 requires lessees to record lease contracts on the balance sheet by recognizing a right-of-use asset and lease liability. The provisions of ASU 2016-02 are to be applied using a modified retrospective approach and are effective for interim periods and fiscal years beginning after December 15, 2018, with early adoption permitted. We are currently evaluating the impact of adopting ASU 2016-02 and expect this ASU may have a material effect on our condensed consolidated financial statements.
In June 2016, the FASB released Accounting Standards Update No. 2016-13 ("ASU 2016-13"), Financial Instruments - Credit Losses (Topic 326): Measurement of Credit Losses on Financial Instruments. ASU 2016-13 replaces the existing impairment model for most financial assets from an incurred loss impairment model to a current expected credit loss model, which requires an entity to recognize an impairment allowance equal to its current estimate of all contractual cash flows the entity does not expect to collect. ASU 2016-13 also requires credit losses relating to AFS debt securities to be recorded through an allowance for credit losses. The provisions of ASU 2016-13 are to be applied using a modified retrospective approach and are effective for interim periods and fiscal years beginning after December 15, 2019, with early adoption permitted. We are currently evaluating the impact of adopting ASU 2016-13.
In October 2016, the FASB released Accounting Standards Update No. 2016-16 ("ASU 2016-16"), Income Taxes (Topic 740): Intra-Entity Transfers of Assets Other Than Inventory. ASU 2016-16 requires an entity to recognize the income tax consequences of an intra-entity transfer of an asset other than inventory when the transfer occurs. The provisions of ASU 2016-16 are effective for interim periods and fiscal years beginning after December 15, 2017, with early adoption permitted. ASU 2016-16 requires an entity to adopt the amendments on a modified retrospective basis, recognizing the effects in retained earnings at the beginning of the year of adoption. Upon adoption, we do not expect ASU 2016-16 to have a material impact on our condensed consolidated financial statements.
In November 2016, the FASB released Accounting Standards Update No. 2016-18 ("ASU 2016-18"), Statement of Cash Flows (Topic 230): Restricted Cash (a consensus of the FASB Emerging Issues Task Force). ASU 2016-18 requires amounts generally described as restricted cash to be included with cash and cash equivalents when reconciling the total beginning and ending amounts for the periods shown on the statements of cash flows. The provisions of ASU 2016-18 are effective for interim periods and fiscal years beginning after December 15, 2017, and are to be applied on a retrospective basis with early adoption permitted. Currently, the transfers between cash and cash equivalents and restricted cash are included within operating and investing activities on our condensed consolidated statement of cash flows. Upon adoption, our restricted cash balances of $340 million and $76 million at June 30, 2017 and December 31, 2016, respectively, will be included in cash, cash equivalents, and restricted cash on our condensed consolidated statements of cash flows.
In January 2017, the FASB released Accounting Standards Update No. 2017-01 ("ASU 2017-01"), Business Combinations (Topic 805): Clarifying the Definition of a Business. ASU 2017-01 clarifies the definition of a business to assist entities with evaluating whether transactions should be accounted for as acquisitions or disposals of assets or businesses. Generally, our acquisitions of individual hotels are accounted for as business combinations, however, upon adoption of ASU 2017-01, there is an increased likelihood that the acquisitions of individual hotels will be accounted for as asset acquisitions. This standard is effective on a prospective basis, and therefore does not affect the accounting treatment for any previous transactions. The provisions of ASU 2017-01 are effective for interim periods and fiscal years beginning after December 15, 2017. We are continuing to evaluate other potential impacts of adopting ASU 2017-01.
In January 2017, the FASB released Accounting Standards Update No. 2017-04 ("ASU 2017-04"), Intangibles - Goodwill and Other (Topic 350): Simplifying the Test for Goodwill Impairment. ASU 2017-04 eliminates Step 2 from the impairment test which requires entities to determine the implied fair value of goodwill to measure if any impairment charge is necessary. Instead, entities will record an impairment charge based on the amount by which a reporting unit’s carrying value exceeds its fair value, not to exceed the carrying amount of goodwill. The provisions of ASU 2017-04 are to be applied on a prospective basis and are effective for annual and interim goodwill impairment tests in fiscal years beginning after December 15, 2019, with early adoption permitted. We are currently evaluating the impact of adopting ASU 2017-04.
7
3. EQUITY AND COST METHOD INVESTMENTS
June 30, 2017 | December 31, 2016 | ||||||
Equity method investments | $ | 175 | $ | 180 | |||
Cost method investments | 6 | 6 | |||||
Total investments | $ | 181 | $ | 186 | |||
During the six months ended June 30, 2017, an unconsolidated hospitality venture, which is classified as an equity method investment within our owned and leased hotels segment, sold a Hyatt Place hotel. We received proceeds of $4 million and recorded a gain of $2 million in equity earnings (losses) from unconsolidated hospitality ventures on our condensed consolidated statements of income.
During the three and six months ended June 30, 2017, we recorded insignificant impairment charges related to our unconsolidated hospitality ventures which are classified as equity method investments. During the three and six months ended June 30, 2016, we recorded a $2 million impairment charge in equity earnings (losses) from unconsolidated hospitality ventures related to one equity method investment.
The following table presents summarized financial information for all unconsolidated hospitality ventures in which we hold an investment accounted for under the equity method:
Three Months Ended June 30, | Six Months Ended June 30, | ||||||||||||||
2017 | 2016 | 2017 | 2016 | ||||||||||||
Total revenues | $ | 179 | $ | 342 | $ | 453 | $ | 626 | |||||||
Gross operating profit | 67 | 132 | 145 | 202 | |||||||||||
Income (loss) from continuing operations | 16 | 58 | (2 | ) | 78 | ||||||||||
Net income (loss) | 16 | 58 | (2 | ) | 78 | ||||||||||
4. MARKETABLE SECURITIES
We hold marketable securities to fund certain operating programs and for investment purposes. We periodically transfer cash and cash equivalents to time deposits, highly liquid and transparent commercial paper, corporate notes and bonds, U.S. government obligations and obligations of other government agencies for investment purposes.
Marketable Securities Held to Fund Operating Programs—Marketable securities held to fund operating programs, which are recorded at fair value and included on the condensed consolidated balance sheets, were as follows:
June 30, 2017 | December 31, 2016 | ||||||
Loyalty program | $ | 400 | $ | 394 | |||
Deferred compensation plans held in rabbi trusts (Note 9) | 377 | 352 | |||||
Captive insurance companies | 72 | 65 | |||||
Total marketable securities held to fund operating programs | $ | 849 | $ | 811 | |||
Less current portion of marketable securities held to fund operating programs included in cash and cash equivalents, short-term investments, and prepaids and other assets | (116 | ) | (109 | ) | |||
Marketable securities held to fund operating programs included in other assets | $ | 733 | $ | 702 | |||
8
Net gains and interest income from marketable securities held to fund operating programs on the condensed consolidated statements of income included realized and unrealized gains and losses and interest income related to the following:
Three Months Ended June 30, | Six Months Ended June 30, | ||||||||||||||
2017 | 2016 | 2017 | 2016 | ||||||||||||
Loyalty program | $ | 1 | $ | 2 | $ | 1 | $ | 3 | |||||||
Deferred compensation plans held in rabbi trusts | 9 | 5 | 24 | 5 | |||||||||||
Total net gains and interest income from marketable securities held to fund operating programs | $ | 10 | $ | 7 | $ | 25 | $ | 8 | |||||||
Our captive insurance companies hold marketable securities which are classified as AFS and are invested in U.S. government agencies, time deposits and corporate debt securities. We classify these investments as current or long-term, based on their contractual maturity dates, which range from 2017 through 2022.
Marketable Securities Held for Investment Purposes—Marketable securities held for investment purposes, which are recorded at fair value and included on the condensed consolidated balance sheets, were as follows:
June 30, 2017 | December 31, 2016 | ||||||
Interest bearing money market funds | $ | 57 | $ | 106 | |||
Time deposits | 45 | 45 | |||||
Preferred shares | — | 290 | |||||
Common shares | 145 | — | |||||
Total marketable securities held for investment purposes | $ | 247 | $ | 441 | |||
Less current portion of marketable securities held for investment purposes included in cash and cash equivalents and short-term investments | (102 | ) | (151 | ) | |||
Marketable securities held for investment purposes included in other assets | $ | 145 | $ | 290 | |||
Fair Value—We measured the following financial assets at fair value on a recurring basis:
June 30, 2017 | Cash and cash equivalents | Short-term investments | Prepaids and other assets | Other assets | |||||||||||||||
Level One - Quoted Prices in Active Markets for Identical Assets | |||||||||||||||||||
Interest bearing money market funds | $ | 67 | $ | 67 | $ | — | $ | — | $ | — | |||||||||
Mutual funds | 377 | — | — | — | 377 | ||||||||||||||
Common shares | 145 | — | — | — | 145 | ||||||||||||||
Level Two - Significant Other Observable Inputs | |||||||||||||||||||
Time deposits | 58 | — | 46 | — | 12 | ||||||||||||||
U.S. government obligations | 150 | — | — | 38 | 112 | ||||||||||||||
U.S. government agencies | 48 | — | 1 | 8 | 39 | ||||||||||||||
Corporate debt securities | 190 | — | 4 | 38 | 148 | ||||||||||||||
Mortgage-backed securities | 18 | — | — | 5 | 13 | ||||||||||||||
Asset-backed securities | 40 | — | — | 10 | 30 | ||||||||||||||
Municipal and provincial notes and bonds | 3 | — | — | 1 | 2 | ||||||||||||||
Total | $ | 1,096 | $ | 67 | $ | 51 | $ | 100 | $ | 878 | |||||||||
9
December 31, 2016 | Cash and cash equivalents | Short-term investments | Prepaids and other assets | Other assets | |||||||||||||||
Level One - Quoted Prices in Active Markets for Identical Assets | |||||||||||||||||||
Interest bearing money market funds | $ | 114 | $ | 114 | $ | — | $ | — | $ | — | |||||||||
Mutual funds | 352 | — | — | — | 352 | ||||||||||||||
Level Two - Significant Other Observable Inputs | |||||||||||||||||||
Time deposits | 59 | — | 46 | — | 13 | ||||||||||||||
U.S. government obligations | 142 | — | — | 33 | 109 | ||||||||||||||
U.S. government agencies | 53 | — | 9 | 8 | 36 | ||||||||||||||
Corporate debt securities | 181 | — | 1 | 35 | 145 | ||||||||||||||
Mortgage-backed securities | 22 | — | — | 5 | 17 | ||||||||||||||
Asset-backed securities | 34 | — | — | 8 | 26 | ||||||||||||||
Municipal and provincial notes and bonds | 5 | — | — | 1 | 4 | ||||||||||||||
Level Three - Significant Unobservable Inputs | |||||||||||||||||||
Preferred shares | 290 | — | — | — | 290 | ||||||||||||||
Total | $ | 1,252 | $ | 114 | $ | 56 | $ | 90 | $ | 992 | |||||||||
During the three and six months ended June 30, 2017 and June 30, 2016, there were no transfers between levels of the fair value hierarchy. We currently do not have non-financial assets or non-financial liabilities required to be measured at fair value on a recurring basis.
Preferred shares—During the year ended December 31, 2013, we invested $271 million in Playa Hotels & Resorts B.V. ("Playa") for convertible redeemable preferred shares which were classified as an AFS debt security. The fair value of the preferred shares was:
2017 | 2016 | ||||||
Fair value at January 1 | $ | 290 | $ | 335 | |||
Gross unrealized losses | (54 | ) | (7 | ) | |||
Realized losses | (40 | ) | — | ||||
Interest income | 94 | — | |||||
Cash redemption | (290 | ) | — | ||||
Fair value at March 31 | $ | — | $ | 328 | |||
Gross unrealized gains | — | 19 | |||||
Fair value at June 30 | $ | — | $ | 347 | |||
In October 2016, Playa redeemed 3,458,530 of our preferred shares plus accrued and unpaid paid in kind ("PIK") dividends thereon for $41 million.
In March 2017, Playa completed a business combination with Pace Holdings Corporation ("Pace"), and our preferred shares plus accrued and unpaid PIK dividends were redeemed in full for $290 million. Upon redemption, we recorded $94 million of interest income and $40 million of realized losses in other income (loss), net on our condensed consolidated statements of income. The realized losses were the result of a difference between the fair value of the initial investment and the contractual redemption price of $8.40 per share.
Common shares—Prior to the Playa business combination, we accounted for our common share investment in Playa as an equity method investment. As a result of the Playa business combination, Playa N.V. is publicly traded on the NASDAQ and our ownership percentage was diluted to 11.57%. As we no longer have the ability to significantly influence Playa, our investment was recharacterized as an AFS equity security in March 2017. The fair value of the common shares is classified as Level One in the fair value hierarchy as we are able to obtain market available pricing information. Our investment is re-measured quarterly at fair value through accumulated other
10
comprehensive loss on our condensed consolidated balance sheets. The remeasurement of our investment at fair value resulted in unrealized gains recorded in other comprehensive income of $127 million at June 30, 2017. In conjunction with the Playa business combination, we also received 1,738,806 of founders' warrants to purchase 579,602 additional shares of Playa N.V.'s common stock and 237,110 of earn-out warrants. During the three months ended June 30, 2017, we completed a non-cash exchange of the founders' warrants for additional common shares in Playa N.V. The earn-out warrants are recorded at a fair value of $2 million within other assets on our condensed consolidated balance sheets at June 30, 2017.
Held-to-Maturity Debt Securities—At June 30, 2017 and December 31, 2016, we had investments in held-to-maturity ("HTM") debt securities of $30 million and $27 million, respectively, which are investments in third-party entities that own certain of our hotels. The amortized costs of our investments approximate fair value and are classified as Level Three in the fair value hierarchy. The securities are mandatorily redeemable between 2020 and 2025.
5. FINANCING RECEIVABLES
June 30, 2017 | December 31, 2016 | ||||||
Unsecured financing to hotel owners | $ | 124 | $ | 119 | |||
Less allowance for losses | (105 | ) | (100 | ) | |||
Total long-term financing receivables, net | $ | 19 | $ | 19 | |||
Allowance for Losses and Impairments—The following table summarizes the activity in our financing receivables allowance:
2017 | 2016 | ||||||
Allowance at January 1 | $ | 100 | $ | 98 | |||
Provisions | 2 | 1 | |||||
Other adjustments | 1 | 1 | |||||
Allowance at March 31 | $ | 103 | $ | 100 | |||
Provisions | 2 | 3 | |||||
Allowance at June 30 | $ | 105 | $ | 103 | |||
Credit Monitoring—Our unsecured financing receivables were as follows:
June 30, 2017 | |||||||||||||||
Gross loan balance (principal and interest) | Related allowance | Net financing receivables | Gross receivables on non-accrual status | ||||||||||||
Loans | $ | 13 | $ | — | $ | 13 | $ | — | |||||||
Impaired loans (1) | 59 | (59 | ) | — | 59 | ||||||||||
Total loans | 72 | (59 | ) | 13 | 59 | ||||||||||
Other financing arrangements | 52 | (46 | ) | 6 | 46 | ||||||||||
Total unsecured financing receivables | $ | 124 | $ | (105 | ) | $ | 19 | $ | 105 | ||||||
(1) The unpaid principal balance was $44 million and the average recorded loan balance was $58 million at June 30, 2017.
11
December 31, 2016 | |||||||||||||||
Gross loan balance (principal and interest) | Related allowance | Net financing receivables | Gross receivables on non-accrual status | ||||||||||||
Loans | $ | 13 | $ | — | $ | 13 | $ | — | |||||||
Impaired loans (2) | 56 | (56 | ) | — | 56 | ||||||||||
Total loans | 69 | (56 | ) | 13 | 56 | ||||||||||
Other financing arrangements | 50 | (44 | ) | 6 | 44 | ||||||||||
Total unsecured financing receivables | $ | 119 | $ | (100 | ) | $ | 19 | $ | 100 | ||||||
Fair Value—We estimated the fair value of financing receivables, which are classified as Level Three in the fair value hierarchy, to be $19 million at June 30, 2017 and December 31, 2016.
6. ACQUISITIONS AND DISPOSITIONS
Acquisitions
Miraval—During the six months ended June 30, 2017, we acquired Miraval Group from an unrelated third party. The transaction included the Miraval Life in Balance Spa brand, Miraval Arizona Resort & Spa in Tucson, Arizona, Travaasa Resort in Austin, Texas, and the option to acquire Cranwell Spa & Golf Resort ("Cranwell") in Lenox, Massachusetts. We subsequently exercised our option and acquired approximately 95% of Cranwell during the six months ended June 30, 2017. These transactions are collectively referred to as "Miraval." Total cash consideration for Miraval was $237 million.
The following table summarizes the fair value of the identifiable net assets acquired in the acquisition of Miraval, which is recorded within corporate and other:
Current assets, net of cash acquired | $ | 2 | |
Property and equipment | 173 | ||
Indefinite-lived intangibles (1) | 37 | ||
Management agreement intangibles (2) | 14 | ||
Goodwill (3) | 17 | ||
Other definite-lived intangibles (4) | 7 | ||
Total assets | $ | 250 | |
Current liabilities | $ | 11 | |
Deferred tax liabilities | 3 | ||
Total liabilities | 14 | ||
Total net assets acquired attributable to Hyatt Hotels Corporation | 236 | ||
Total net assets acquired attributable to noncontrolling interests | 1 | ||
Total net assets acquired | $ | 237 | |
(1) Includes an intangible attributable to the Miraval brand.
(2) Amortized over a useful life of 20 years.
(3) The goodwill, of which $8 million is deductible for tax purposes, is attributable to Miraval's reputation as a renowned provider of wellness and mindfulness experiences, the extension of the Hyatt brand beyond traditional hotel stays, and the establishment of deferred tax liabilities.
(4) Amortized over useful lives ranging from two to seven years.
12
In conjunction with the acquisition of Miraval, a consolidated hospitality venture for which we are the managing member (the "Miraval Venture") issued $9 million of redeemable preferred shares to unrelated third-party investors. The preferred shares are non-voting, except as required by applicable law and certain contractual approval rights, and have liquidation preference over all other classes of securities within the Miraval Venture. The redeemable preferred shares earn a return of 12% and a redemption premium that increases over time depending on the length of time the redeemable preferred shares are outstanding. The preferred shares are redeemable at various time periods at the option of the Miraval Venture starting 12 months from the date of issuance. If not redeemed by the Miraval Venture prior to the two-year anniversary, the preferred shareholders have the option to require redemption of all preferred shares outstanding. The preferred shares are also redeemable upon the occurrence of certain change-in-control events. Under the current terms, the shares are classified as a redeemable noncontrolling interest in preferred shares of a subsidiary, which are presented between liabilities and equity on our condensed consolidated balance sheets and carried at the current redemption value.
The Confidante Miami Beach—During the three months ended June 30, 2016, we acquired Thompson Miami Beach for a purchase price of approximately $238 million, from a seller indirectly owned by a limited partnership affiliated with the brother of our Executive Chairman. Of the $238 million purchase price, assets acquired consist of $228 million of property and equipment, which was recorded in our owned and leased hotels segment, and $10 million of management agreement intangibles, which were recorded in our Americas management and franchising segment and are being amortized over a useful life of 20 years. We rebranded this hotel as The Confidante Miami Beach and added the hotel to The Unbound Collection by Hyatt. The purchase of The Confidante Miami Beach was structured and identified as replacement property in a potential reverse like-kind exchange agreement, but the allowable period to complete the exchange expired during the fourth quarter of 2016.
Dispositions
Hyatt Regency Grand Cypress—During the three months ended June 30, 2017, we sold Hyatt Regency Grand Cypress to an unrelated third party for $202 million, net of closing costs and proration adjustments, and entered into a long-term management agreement with the owner of the property. The sale resulted in a pre-tax gain of $26 million which was deferred and is being recognized in management and franchise fees over the term of the management agreement within our Americas management and franchising segment. The operating results and financial position of this hotel prior to the sale remain within our owned and leased hotels segment. Proceeds from the sale of Hyatt Regency Grand Cypress are held as restricted for use in a potential like-kind exchange.
Hyatt Regency Louisville—During the three months ended June 30, 2017, we sold Hyatt Regency Louisville to an unrelated third party for $65 million, net of closing costs and proration adjustments, and entered into a long-term franchise agreement with the owner of the property. The sale resulted in a pre-tax gain of $35 million, which was recognized in gains (losses) on sales of real estate on our condensed consolidated statements of income during the three and six months ended June 30, 2017. The operating results and financial position of this hotel prior to the sale remain within our owned and leased hotels segment. Proceeds from the sale of Hyatt Regency Louisville are held as restricted for use in a potential like-kind exchange.
Land Held for Development—During the three months ended June 30, 2017, we sold land and construction in progress for $29 million to an unconsolidated hospitality venture in which we have a 50% ownership interest, with the intent to complete development of a hotel in Glendale, California. The sale resulted in a pre-tax loss of $1 million, which was recognized in gains (losses) on sales of real estate on our condensed consolidated statements of income during the three and six months ended June 30, 2017.
Andaz 5th Avenue—During the three months ended June 30, 2016, we sold Andaz 5th Avenue to an unrelated third party for $240 million, net of $10 million of closing costs and proration adjustments and entered into a long-term management agreement with the owner of the property. The sale resulted in a pre-tax loss of $21 million which was recognized in gains (losses) on sales of real estate on our condensed consolidated statements of income during the three and six months ended June 30, 2016. The operating results and financial position of this hotel prior to the sale remain within our owned and leased hotels segment.
As a result of certain dispositions, we have agreed to provide customary indemnifications to third-party purchasers for certain liabilities incurred prior to sale and for breach of certain representations and warranties made during the sales process, such as representations of valid title, authority, and environmental issues that may not be limited by a contractual monetary amount. These indemnification agreements survive until the applicable statutes of limitation expire or until the agreed upon contract terms expire.
13
Like-Kind Exchange Agreements
Periodically, we enter into like-kind exchange agreements upon the disposition or acquisition of certain hotels. Pursuant to the terms of these agreements, the proceeds from the sales are placed into an escrow account administered by a qualified intermediary. The proceeds are recorded as restricted cash on our condensed consolidated balance sheets and released (i) if they are utilized as part of a like-kind exchange agreement, (ii) if we do not identify a suitable replacement property within 45 days after the agreement date, or (iii) when a like-kind exchange agreement is not completed within the remaining allowable time period.
7. INTANGIBLES, NET
June 30, 2017 | Weighted- average useful lives in years | December 31, 2016 | ||||||||
Management and franchise agreement intangibles | $ | 630 | 25 | $ | 589 | |||||
Lease related intangibles | 121 | 111 | 115 | |||||||
Brand and other indefinite-lived intangibles | 53 | — | 16 | |||||||
Advanced bookings intangibles | 12 | 6 | 11 | |||||||
Other definite-lived intangibles | 9 | 11 | 6 | |||||||
825 | 737 | |||||||||
Accumulated amortization | (154 | ) | (138 | ) | ||||||
Intangibles, net | $ | 671 | $ | 599 | ||||||
Three Months Ended June 30, | Six Months Ended June 30, | ||||||||||||||
2017 | 2016 | 2017 | 2016 | ||||||||||||
Amortization expense | $ | 8 | $ | 6 | $ | 15 | $ | 13 | |||||||
8. DEBT
Long-term debt, net of current maturities was $1,446 million and $1,445 million at June 30, 2017 and December 31, 2016, respectively.
Revolving Credit Facility—During the six months ended June 30, 2017, we had borrowings of $420 million and repayments of $290 million on our revolving credit facility. The weighted-average interest rate on these borrowings was 2.02% at June 30, 2017. At June 30, 2017 and December 31, 2016, we had $230 million and $100 million outstanding, respectively. At June 30, 2017, we had $1.3 billion available on our revolving credit facility.
Senior Notes—During the six months ended June 30, 2016, we issued $400 million of 4.850% senior notes due 2026, at an issue price of 99.920% (the "2026 Notes"). We received net proceeds of $396 million from the sale of the 2026 Notes, after deducting discounts and offering expenses of approximately $4 million. We used a portion of the net proceeds to pay for the redemption of $250 million of 3.875% senior notes due 2016 (the "2016 Notes") (as described below), with the remaining proceeds intended to be used for general corporate purposes. Interest on the 2026 Notes is payable semi-annually on March 15 and September 15 of each year.
The 2026 Notes, together with our $196 million of 6.875% senior notes due 2019 (the "2019 Notes"), $250 million of 5.375% senior notes due 2021 (the "2021 Notes"), and $350 million of 3.375% senior notes due 2023 (the "2023 Notes"), are collectively referred to as the "Senior Notes."
Debt Redemption—During the three months ended June 30, 2016, we redeemed all of our outstanding 2016 Notes, of which an aggregate principal amount of $250 million was outstanding. The redemption price, which was calculated in accordance with the terms of the 2016 Notes and included principal and accrued interest plus a make-whole premium, was $254 million. The make-whole premium was recorded within other income (loss), net on our condensed consolidated statements of income, see Note 17.
14
Senior Secured Term Loan—During the six months ended June 30, 2016, we repaid the senior secured term loan of $64 million related to Hyatt Regency Lost Pines Resort and Spa.
Fair Value—We estimated the fair value of debt, excluding capital leases, which consists of our Senior Notes, bonds and other long-term debt. Our Senior Notes and bonds are classified as Level Two due to the use and weighting of multiple market inputs in the final price of the security. We estimated the fair value of other debt instruments using a discounted cash flow analysis based on current market inputs for similar types of arrangements. Based upon the lack of availability of market data, we have classified our revolving credit facility and other debt as Level Three. The primary sensitivity in these calculations is based on the selection of appropriate discount rates. Fluctuations in these assumptions will result in different estimates of fair value.
June 30, 2017 | |||||||||||||||||||
Carrying value | Fair value | Quoted prices in active markets for identical assets (level one) | Significant other observable inputs (level two) | Significant unobservable inputs (level three) | |||||||||||||||
Debt (1) | $ | 1,688 | $ | 1,794 | $ | — | $ | 1,473 | $ | 321 | |||||||||
(1) Excludes capital lease obligations of $14 million and unamortized discounts and deferred financing fees of $15 million.
December 31, 2016 | |||||||||||||||||||
Carrying value | Fair value | Quoted prices in active markets for identical assets (level one) | Significant other observable inputs (level two) | Significant unobservable inputs (level three) | |||||||||||||||
Debt (2) | $ | 1,565 | $ | 1,642 | $ | — | $ | 1,450 | $ | 192 | |||||||||
9. LIABILITIES
June 30, 2017 | December 31, 2016 | ||||||
Deferred gains on sales of hotel properties | $ | 378 | $ | 363 | |||
Deferred compensation plans (Note 4) | 377 | 352 | |||||
Loyalty program liability | 292 | 296 | |||||
Guarantee liabilities (Note 11) | 118 | 124 | |||||
Other | 365 | 337 | |||||
Total other long-term liabilities | $ | 1,530 | $ | 1,472 | |||
Accrued expenses and other current liabilities included $150 million and $139 million of liabilities related to our loyalty program at June 30, 2017 and December 31, 2016, respectively.
10. INCOME TAXES
The effective income tax rates for the three months ended June 30, 2017 and June 30, 2016, were 34.1% and 24.7%, respectively. The effective income tax rates for the six months ended June 30, 2017 and June 30, 2016, were 35.3% and 27.2%, respectively. Our effective tax rates increased for the three and six months ended June 30, 2017 compared to the three and six months ended June 30, 2016, primarily due to the favorable impact of the reversal of uncertain tax positions in 2016 and the impact of foreign losses not benefited in 2017.
Unrecognized tax benefits were $91 million and $86 million at June 30, 2017 and December 31, 2016, respectively, of which $6 million and $5 million, respectively, would impact the effective tax rates if recognized.
During the first quarter of 2017, the Internal Revenue Service ("IRS") issued a "Notice of Deficiency" for our 2009 through 2011 tax years. We disagree with the IRS' assessment as it relates to the inclusion of loyalty program contributions as taxable income to the Company. In the second quarter of 2017, we filed a petition with the United States Tax Court for redetermination of the tax liability asserted by the IRS related to our loyalty program. If the IRS' position is upheld, it would result in an income tax liability of $119 million (including $26 million of estimated interest,
15
net of federal tax benefit) for the years under audit that would be primarily offset by a deferred tax asset, and therefore, only the related interest would have an impact on the effective tax rate if recognized. We believe we have adequate tax reserves in connection with this matter.
11. COMMITMENTS AND CONTINGENCIES
In the ordinary course of business, we enter into various commitments, guarantees, surety bonds, and letter of credit agreements, which are discussed below:
Commitments—At June 30, 2017, we are committed, under certain conditions, to lend or invest up to $437 million, net of any related letters of credit, in various business ventures.
Performance Guarantees—Certain of our contractual agreements with third-party owners require us to guarantee payments to the owners if specified levels of operating profit are not achieved by their hotels.
Our most significant performance guarantee relates to four managed hotels in France that we began managing in the second quarter of 2013 ("the four managed hotels in France"), which has a term of seven years, with approximately three years remaining. This guarantee has a maximum cap, but does not have an annual cap. The remaining maximum exposure related to our performance guarantees at June 30, 2017 was $378 million, of which €293 million ($335 million using exchange rates at June 30, 2017) related to the four managed hotels in France.
We had total net performance guarantee liabilities of $69 million and $79 million at June 30, 2017 and December 31, 2016, which included $53 million and $55 million recorded in other long-term liabilities, $17 million and $24 million in accrued expenses and other current liabilities, and $1 million and insignificant receivables on our condensed consolidated balance sheets, respectively. Our total performance guarantee liabilities are comprised of the fair value of the guarantee obligation liabilities recorded upon inception, net of amortization and any separate contingent liabilities, net of cash payments. Performance guarantee expense or income and income from amortization of the guarantee obligation liabilities are recorded in other income (loss), net on our condensed consolidated statements of income, see Note 17.
The four managed hotels in France | Other performance guarantees | All performance guarantees | ||||||||||||||||||||||
2017 | 2016 | 2017 | 2016 | 2017 | 2016 | |||||||||||||||||||
Beginning balance, January 1 | $ | 66 | $ | 93 | $ | 13 | $ | 4 | $ | 79 | $ | 97 | ||||||||||||
Amortization of initial guarantee obligation liability into income | (3 | ) | (8 | ) | (1 | ) | — | (4 | ) | (8 | ) | |||||||||||||
Performance guarantee expense, net | 26 | 19 | — | — | 26 | 19 | ||||||||||||||||||
Net payments during the period | (22 | ) | (14 | ) | (4 | ) | (1 | ) | (26 | ) | (15 | ) | ||||||||||||
Foreign currency exchange, net | 2 | 4 | — | — | 2 | 4 | ||||||||||||||||||
Ending balance, March 31 | $ | 69 | $ | 94 | $ | 8 | $ | 3 | $ | 77 | $ | 97 | ||||||||||||
Initial guarantee obligation liability upon inception | — | — | 3 | — | 3 | — | ||||||||||||||||||
Amortization of initial guarantee obligation liability into income | (4 | ) | (9 | ) | (1 | ) | — | (5 | ) | (9 | ) | |||||||||||||
Performance guarantee expense (income), net | 15 | 10 | (1 | ) | (2 | ) | 14 | 8 | ||||||||||||||||
Net (payments) receipts during the period | (27 | ) | (20 | ) | 3 | 1 | (24 | ) | (19 | ) | ||||||||||||||
Foreign currency exchange, net | 4 | (1 | ) | — | — | 4 | (1 | ) | ||||||||||||||||
Ending balance, June 30 | $ | 57 | $ | 74 | $ | 12 | $ | 2 | $ | 69 | $ | 76 | ||||||||||||
Additionally, we enter into certain management contracts where we have the right, but not an obligation, to make payments to certain hotel owners if their hotels do not achieve specified levels of operating profit. If we choose not to fund the shortfall, the hotel owner has the option to terminate the management contract. At June 30, 2017 and December 31, 2016, there were no amounts recorded on our condensed consolidated balance sheets related to these performance test clauses.
16
Debt Repayment Guarantees—We enter into various debt repayment guarantees related to our unconsolidated hospitality ventures and certain managed or franchised hotels. Typically, we enter into debt repayment guarantees in order to assist hotel owners in obtaining third-party financing or to obtain more favorable borrowing terms. Included within debt repayment guarantees are the following:
Property Description | Maximum potential future payments | Maximum exposure net of recoverability from third parties | Other long-term liabilities recorded at June 30, 2017 | Other long-term liabilities recorded at December 31, 2016 | Year of guarantee expiration | |||||||||||||
Hotel property in Washington State (1), (3), (4), (5) | $ | 215 | $ | — | $ | 30 | $ | 35 | 2020 | |||||||||
Hotel properties in India (2), (3) | 186 | 186 | 19 | 21 | 2020 | |||||||||||||
Hotel property in Brazil (1) | 80 | 40 | 3 | 3 | 2020 | |||||||||||||
Hotel property in Minnesota | 25 | 25 | 2 | 2 | 2021 | |||||||||||||
Hotel property in Arizona (1), (4) | 25 | — | 2 | 2 | 2019 | |||||||||||||
Hotel properties in California (1) | 31 | 13 | 6 | 6 | various, through 2021 | |||||||||||||
Other (1) | 36 | 14 | 3 | — | various, through 2021 | |||||||||||||
Total | $ | 598 | $ | 278 | $ | 65 | $ | 69 | ||||||||||
(1) We have agreements with our unconsolidated hospitality venture partner, the respective hotel owners or other third parties to recover certain amounts funded under the debt repayment guarantee; the recoverability mechanism may be in the form of cash, financing receivable, or HTM debt security.
(2) Debt repayment guarantee is denominated in Indian rupees and translated using exchange rates at June 30, 2017. We have the contractual right to recover amounts funded from the unconsolidated hospitality venture, which is a related party. We expect our maximum exposure to be $93 million, taking into account our partner’s 50% ownership interest in the unconsolidated hospitality venture.
(3) Under certain events or conditions, we have the right to force the sale of the property(ies) in order to recover amounts funded.
(4) If certain funding thresholds are met or if certain events occur, we have the ability to assume control of the property.
(5) We are subject to a completion guarantee whereby the parties agree to substantially complete the construction of the project by a specified date. In the event of default, we are obligated to complete construction using the funds available from the outstanding loan. Any additional funds paid by us are subject to recovery through a HTM debt security.
At June 30, 2017, the hotel owners are current on their debt service obligations.
Guarantee Liabilities Fair Value—We estimated the fair value of our guarantees to be $225 million and $231 million at June 30, 2017 and December 31, 2016, respectively. Due to the lack of readily available market data, we have classified our guarantees as Level Three in the fair value hierarchy.
Insurance—We obtain commercial insurance for potential losses for general liability, workers' compensation, automobile liability, employment practices, crime, property and other miscellaneous coverages. A portion of the risk is retained on a self-insurance basis primarily through U.S. based and licensed captive insurance companies that are wholly owned subsidiaries of Hyatt and generally insure our deductibles and retentions. Reserve requirements are established based on actuarial projections of ultimate losses. Losses estimated to be paid within 12 months are $33 million and $30 million at June 30, 2017 and December 31, 2016, respectively, and are classified within accrued expenses and other current liabilities on our condensed consolidated balance sheets, while losses expected to be payable in future periods are $63 million and $62 million at June 30, 2017 and December 31, 2016, respectively, and are included in other long-term liabilities on our condensed consolidated balance sheets. At
17
June 30, 2017, standby letters of credit of $7 million were issued to provide collateral for the estimated claims, which are guaranteed by us.
Collective Bargaining Agreements—At June 30, 2017, approximately 25% of our U.S. based employees were covered by various collective bargaining agreements, generally providing for basic pay rates, working hours, other conditions of employment and orderly settlement of labor disputes. Certain employees are covered by union sponsored multi-employer pension and health plans pursuant to agreements between us and various unions. Generally, labor relations have been maintained in a normal and satisfactory manner, and we believe our employee relations are good.
Surety Bonds—Surety bonds issued on our behalf were $25 million at June 30, 2017 and primarily relate to workers’ compensation, taxes, licenses and utilities related to our lodging operations.
Letters of Credit—Letters of credit outstanding on our behalf at June 30, 2017 were $239 million, which relate to our ongoing operations, collateral for estimated insurance claims, and securitization of our performance under our debt repayment guarantee associated with the hotel properties in India, which is only called upon if we default on our guarantee. The letters of credit outstanding do not reduce the available capacity under our revolving credit facility.
Capital Expenditures—As part of our ongoing business operations, significant expenditures are required to complete renovation projects that have been approved.
Other—We act as general partner of various partnerships owning hotel properties subject to mortgage indebtedness. These mortgage agreements generally limit the lender's recourse to security interests in assets financed and/or other assets of the partnership(s) and/or the general partner(s) thereof.
In conjunction with financing obtained for our unconsolidated hospitality ventures and certain managed hotels, we may provide standard indemnifications to the lender for loss, liability or damage occurring as a result of our actions or actions of the other unconsolidated hospitality venture owners.
We are subject, from time to time, to various claims and contingencies related to lawsuits, taxes and environmental matters, as well as commitments under contractual obligations. Many of these claims are covered under our current insurance programs, subject to deductibles. We recognize a liability associated with commitments and contingencies when a loss is probable and reasonably estimable. Although the ultimate liability for these matters cannot be determined at this point, based on information currently available, we do not expect the ultimate resolution of such claims and litigation will have a material effect on our condensed consolidated financial statements.
18
12. EQUITY
Stockholders' equity | Noncontrolling interests in consolidated subsidiaries | Total equity | |||||||||
Balance at January 1, 2017 | $ | 3,903 | $ | 5 | $ | 3,908 | |||||
Net income | 157 | — | 157 | ||||||||
Other comprehensive income | 105 | — | 105 | ||||||||
Contributions from noncontrolling interests | — | 1 | 1 | ||||||||
Repurchase of common stock | (348 | ) | — | (348 | ) | ||||||
Directors compensation | 2 | — | 2 | ||||||||
Employee stock plan issuance | 2 | — | 2 | ||||||||
Share-based payment activity | 16 | — | 16 | ||||||||
Balance at June 30, 2017 | $ | 3,837 | $ | 6 | $ | 3,843 | |||||
Stockholders' equity | Noncontrolling interests in consolidated subsidiaries | Total equity | |||||||||
Balance at January 1, 2016 | $ | 3,991 | $ | 4 | $ | 3,995 | |||||
Net income | 101 | — | 101 | ||||||||
Other comprehensive income | 23 | — | 23 | ||||||||
Repurchase of common stock | (131 | ) | — | (131 | ) | ||||||
Directors compensation | 2 | — | 2 | ||||||||
Employee stock plan issuance | 2 | — | 2 | ||||||||
Share-based payment activity | 16 | — | 16 | ||||||||
Balance at June 30, 2016 | $ | 4,004 | $ | 4 | $ | 4,008 | |||||
19
Accumulated Other Comprehensive Loss
Balance at April 1, 2017 | Current period other comprehensive income before reclassification | Amount reclassified from accumulated other comprehensive loss | Balance at June 30, 2017 | ||||||||||||
Foreign currency translation adjustments | $ | (258 | ) | $ | 19 | $ | — | $ | (239 | ) | |||||
Unrealized gains on AFS securities | 67 | 11 | — | 78 | |||||||||||
Unrecognized pension cost | (7 | ) | — | — | (7 | ) | |||||||||
Unrealized losses on derivative instruments | (4 | ) | — | — | (4 | ) | |||||||||
Accumulated other comprehensive income (loss) | $ | (202 | ) | $ | 30 | $ | — | $ | (172 | ) | |||||
Balance at January 1, 2017 | Current period other comprehensive income before reclassification | Amount reclassified from accumulated other comprehensive loss | Balance at June 30, 2017 | ||||||||||||
Foreign currency translation adjustments | $ | (299 | ) | $ | 60 | $ | — | $ | (239 | ) | |||||
Unrealized gains on AFS securities | 33 | 45 | — | 78 | |||||||||||
Unrecognized pension cost | (7 | ) | — | — | (7 | ) | |||||||||
Unrealized losses on derivative instruments | (4 | ) | — | — | (4 | ) | |||||||||
Accumulated other comprehensive income (loss) | $ | (277 | ) | $ | 105 | $ | — | $ | (172 | ) | |||||
Balance at April 1, 2016 | Current period other comprehensive income (loss) before reclassification | Amount reclassified from accumulated other comprehensive loss | Balance at June 30, 2016 | ||||||||||||
Foreign currency translation adjustments | $ | (233 | ) | $ | (9 | ) | $ | — | $ | (242 | ) | ||||
Unrealized gains on AFS securities | 35 | 12 | — | 47 | |||||||||||
Unrecognized pension cost | (7 | ) | — | — | (7 | ) | |||||||||
Unrealized losses on derivative instruments | (5 | ) | — | — | (5 | ) | |||||||||
Accumulated other comprehensive income (loss) | $ | (210 | ) | $ | 3 | $ | — | $ | (207 | ) | |||||
Balance at January 1, 2016 | Current period other comprehensive income before reclassification | Amount reclassified from accumulated other comprehensive loss | Balance at June 30, 2016 | ||||||||||||
Foreign currency translation adjustments | $ | (257 | ) | $ | 15 | $ | — | $ | (242 | ) | |||||
Unrealized gains on AFS securities | 39 | 8 | — | 47 | |||||||||||
Unrecognized pension cost | (7 | ) | — | — | (7 | ) | |||||||||
Unrealized losses on derivative instruments | (5 | ) | — | — | (5 | ) | |||||||||
Accumulated other comprehensive income (loss) | $ | (230 | ) | $ | 23 | $ | — | $ | (207 | ) | |||||
Share Repurchases—During 2017, 2016 and 2015, our board of directors authorized the repurchase of up to $500 million, $500 million and $400 million, respectively, of our common stock. These repurchases may be made from time to time in the open market, in privately negotiated transactions, or otherwise, including pursuant to a Rule 10b5-1 plan, at prices we deem appropriate and subject to market conditions, applicable law and other factors
20
deemed relevant in our sole discretion. The common stock repurchase program applies to our Class A common stock and our Class B common stock. The common stock repurchase program does not obligate us to repurchase any dollar amount or number of shares of common stock and the program may be suspended or discontinued at any time.
In March 2017, we entered into an accelerated share repurchase program ("2017 ASR") with a third-party financial institution. Under the 2017 ASR agreement, we paid $300 million and received an initial delivery of 4,596,822 Class A shares, which were repurchased at a price of $52.21 per share. This initial delivery of shares represents the minimum number of shares that we may receive under the agreement and was accounted for as a reduction to stockholders’ equity on the condensed consolidated balance sheets. Upon settlement of the 2017 ASR in the third quarter, the total number of shares ultimately delivered is determined based on the volume-weighted-average price of our common stock during that period. At June 30, 2017, the remaining shares yet to be delivered, totaled $60 million and were accounted for as an equity-classified forward contract. Subsequent to June 30, 2017, 500,000 Class A shares were delivered under partial settlement of the 2017 ASR. The initial delivery of shares resulted in a reduction in the weighted-average common shares calculation for basic and diluted earnings per share. See Note 16.
During the six months ended June 30, 2017, we repurchased 5,480,636 Class A shares, including shares repurchased pursuant to the 2017 ASR. The shares of common stock were repurchased at a weighted-average price of $52.48 per share for an aggregate purchase price of $288 million, excluding related insignificant expenses. Total shares repurchased during the six months ended June 30, 2017 represented approximately 4% of our total shares of common stock outstanding at December 31, 2016.
During the six months ended June 30, 2016, we repurchased 2,948,990 shares. The shares of common stock were repurchased at a weighted-average price of $44.47 per share for an aggregate purchase price of $131 million, excluding related insignificant expenses. The shares repurchased during the six months ended June 30, 2016 represented approximately 2% of our total shares of common stock outstanding at December 31, 2015.
The shares of Class A common stock repurchased on the open market were retired and returned to the status of authorized and unissued shares. At June 30, 2017, we had approximately $509 million remaining under the share repurchase authorization.
13. STOCK-BASED COMPENSATION
As part of our Long-Term Incentive Plan ("LTIP"), we award Stock Appreciation Rights ("SARs"), Restricted Stock Units ("RSUs"), Performance Share Units ("PSUs") and Performance Vesting Restricted Stock ("PSs") to certain employees. Compensation expense and unearned compensation presented below exclude amounts related to employees of our managed hotels and other employees whose payroll is reimbursed, as this expense has been and will continue to be reimbursed by our third-party hotel owners and is recorded in other revenues from managed properties and other costs from managed properties on our condensed consolidated statements of income. Stock-based compensation expense included in selling, general, and administrative expense on our condensed consolidated statements of income related to these awards was as follows:
Three Months Ended June 30, | Six Months Ended June 30, | ||||||||||||||
2017 | 2016 | 2017 | 2016 | ||||||||||||
SARs | $ | 1 | $ | 1 | $ | 9 | $ | 8 | |||||||
RSUs | 3 | 3 | 11 | 11 | |||||||||||
PSUs and PSs | 1 | — | 1 | 1 | |||||||||||
Total stock-based compensation recorded within selling, general, and administrative expenses | $ | 5 | $ | 4 | $ | 21 | $ | 20 | |||||||
SARs—During the six months ended June 30, 2017, we granted 605,601 SARs to employees with a weighted-average grant date fair value of $16.35.
RSUs— During the six months ended June 30, 2017, we granted 417,794 RSUs to employees with a weighted-average grant date fair value of $52.67.
21
PSUs—During the six months ended June 30, 2017, we granted 102,115 PSUs to our executive officers, with a weighted-average grant date fair value of $52.65. The performance period applicable to such PSUs is a three year period beginning January 1, 2017 and ending December 31, 2019.
Our total unearned compensation for our stock-based compensation programs at June 30, 2017 was $7 million for SARs, $20 million for RSUs and $6 million for PSUs and PSs, which will primarily be recorded to compensation expense over the next three years with respect to SARs and RSUs, and over the next two years with respect to PSUs and PSs.
14. RELATED-PARTY TRANSACTIONS
In addition to those included elsewhere in the Notes to our condensed consolidated financial statements, related-party transactions entered into by us are summarized as follows:
Leases—Our corporate headquarters have been located at the Hyatt Center in Chicago, Illinois, since 2005. A subsidiary of the Company holds a master lease for a portion of the Hyatt Center and has entered into sublease agreements with certain related parties. Future expected sublease income for this space from related parties is $3 million.
Legal Services—A partner in a law firm that provided services to us throughout the six months ended June 30, 2017 and June 30, 2016, is the brother-in-law of our Executive Chairman. We incurred $1 million and insignificant legal fees with this firm for the three months ended June 30, 2017 and June 30, 2016, respectively. We incurred $2 million and insignificant legal fees with this firm during the six months ended June 30, 2017 and June 30, 2016, respectively. Legal fees, when expensed, are included in selling, general, and administrative expenses. At June 30, 2017 and December 31, 2016, we had $1 million and insignificant amounts due to the law firm, respectively.
Equity Method Investments—We have equity method investments in entities that own properties for which we receive management or franchise fees. We recorded fees of $6 million and $8 million for the three months ended June 30, 2017 and June 30, 2016, respectively. We recorded fees of $12 million and $14 million for the six months ended June 30, 2017 and June 30, 2016, respectively. At June 30, 2017 and December 31, 2016, we had receivables due from these properties of $8 million and $7 million, respectively. Our ownership interest in these unconsolidated hospitality ventures generally varies from 24% to 70%. In addition, in some cases we provide loans (see Note 5) or guarantees (see Note 11) to these entities. During the three months ended June 30, 2017 and June 30, 2016, we recorded fees related to these guarantees of $2 million and $1 million, respectively. We recorded fees related to these guarantees of $3 million and $2 million during the six months ended June 30, 2017 and June 30, 2016, respectively.
Class B Share Conversion—During the three and six months ended June 30, 2017, 4,233,000 shares and 4,772,370 shares of Class B common stock, respectively, were converted on a share-for-share basis into shares of our Class A common stock, $0.01 par value per share, of which 539,370 shares were retired during the three months ended June 30, 2017. The remaining 4,233,000 shares of Class B common stock were retired subsequent to June 30, 2017. The retirements thereby reduce the shares of Class B common stock authorized and outstanding.
15. SEGMENT INFORMATION
Our reportable segments are components of the business which are managed discretely and for which discrete financial information is reviewed regularly by the chief operating decision maker to assess performance and make decisions regarding the allocation of resources. Our chief operating decision maker is our President and Chief Executive Officer. We define our reportable segments as follows:
• | Owned and leased hotels—This segment derives its earnings from owned and leased hotel properties located predominantly in the United States but also in certain international locations and for purposes of segment Adjusted EBITDA, includes our pro rata share of the Adjusted EBITDA of our unconsolidated hospitality ventures, based on our ownership percentage of each venture. Adjusted EBITDA includes intercompany expenses related to management fees paid to the Company's management and franchising segments, which are eliminated in consolidation. Intersegment revenues relate to promotional award redemptions at our owned and leased hotels related to our co-branded credit card, which are eliminated in consolidation. |
22
• | Americas management and franchising—This segment derives its earnings primarily from a combination of hotel management and licensing of our portfolio of brands to franchisees located in the United States, Latin America, Canada and the Caribbean. This segment's revenues also include the reimbursement of costs incurred on behalf of managed hotel property owners and franchisees with no added margin. These costs relate primarily to payroll costs at managed properties where the Company is the employer. These revenues and costs are recorded within other revenues from managed properties and other costs from managed properties, respectively. The intersegment revenues relate to management fees earned from the Company's owned hotels, which are eliminated in consolidation. |
• | ASPAC management and franchising—This segment derives its earnings primarily from a combination of hotel management and licensing of our portfolio of brands to franchisees located in Southeast Asia, as well as Greater China, Australia, South Korea, Japan and Micronesia. This segment's revenues also include the reimbursement of costs incurred on behalf of managed hotel property owners and franchisees with no added margin. These costs relate primarily to reservations, marketing and technology costs. These revenues and costs are recorded within other revenues from managed properties and other costs from managed properties, respectively. The intersegment revenues relate to management fees earned from the Company's owned hotels, which are eliminated in consolidation. |
• | EAME/SW Asia management and franchising—This segment derives its earnings primarily from a combination of hotel management and licensing of our portfolio of brands to franchisees located in Europe, Africa, the Middle East, India, Central Asia and Nepal. This segment's revenues also include the reimbursement of costs incurred on behalf of managed hotel property owners and franchisees with no added margin. These costs relate primarily to reservations, marketing and technology costs. These revenues and costs are recorded within other revenues from managed properties and other costs from managed properties, respectively. The intersegment revenues relate to management fees earned from the Company's owned hotels, which are eliminated in consolidation. |
Our chief operating decision maker evaluates performance based on each segment's revenue and Adjusted EBITDA. Adjusted EBITDA, as we define it, is a non-GAAP measure. We define Adjusted EBITDA as net income attributable to Hyatt Hotels Corporation plus our pro rata share of unconsolidated hospitality ventures Adjusted EBITDA based on our ownership percentage of each venture, adjusted to exclude interest expense; provision for income taxes; depreciation and amortization; equity earnings (losses) from unconsolidated hospitality ventures; stock-based compensation expense; gains (losses) on sales of real estate and other income (loss), net.
23
The table below shows summarized consolidated financial information by segment. Included within corporate and other are unallocated corporate expenses, results related to Miraval, license fees related to Hyatt Residence Club and results related to our co-branded credit card.
Three Months Ended June 30, | Six Months Ended June 30, | ||||||||||||||
2017 | 2016 | 2017 | 2016 | ||||||||||||
Owned and leased hotels | |||||||||||||||
Owned and leased hotels revenues | $ | 562 | $ | 559 | $ | 1,120 | $ | 1,075 | |||||||
Other revenues | — | — | 13 | — | |||||||||||
Intersegment revenues (a) | 2 | — | 4 | — | |||||||||||
Adjusted EBITDA | 136 | 149 | 279 | 280 | |||||||||||
Depreciation and amortization | 73 | 72 | 147 | 140 | |||||||||||
Americas management and franchising | |||||||||||||||
Management and franchise fees revenues | 109 | 100 | 213 | 191 | |||||||||||
Other revenues from managed properties | 431 | 436 | 859 | 857 | |||||||||||
Intersegment revenues (a) | 21 | 21 | 43 | 41 | |||||||||||
Adjusted EBITDA | 97 | 89 | 187 | 165 | |||||||||||
Depreciation and amortization | 4 | 4 | 9 | 9 | |||||||||||
ASPAC management and franchising | |||||||||||||||
Management and franchise fees revenues | 27 | 22 | 52 | 44 | |||||||||||
Other revenues from managed properties | 26 | 27 | 52 | 48 | |||||||||||
Intersegment revenues (a) | 1 | — | 1 | — | |||||||||||
Adjusted EBITDA | 16 | 12 | 31 | 24 | |||||||||||
Depreciation and amortization | 1 | 1 | 1 | 1 | |||||||||||
EAME/SW Asia management and franchising | |||||||||||||||
Management and franchise fees revenues | 17 | 16 | 33 | 32 | |||||||||||
Other revenues from managed properties | 16 | 17 | 33 | 32 | |||||||||||
Intersegment revenues (a) | 2 | 4 | 4 | 6 | |||||||||||
Adjusted EBITDA | 9 | 8 | 17 | 16 | |||||||||||
Depreciation and amortization | 2 | 2 | 3 | 3 | |||||||||||
Corporate and other | |||||||||||||||
Revenues | 33 | 13 | 59 | 22 | |||||||||||
Adjusted EBITDA | (29 | ) | (31 | ) | (58 | ) | (64 | ) | |||||||
Depreciation and amortization | 11 | 7 | 22 | 14 | |||||||||||
Eliminations | |||||||||||||||
Revenues (a) | (26 | ) | (25 | ) | (52 | ) | (47 | ) | |||||||
Adjusted EBITDA (b) | — | — | 1 | — | |||||||||||
Depreciation and amortization | — | — | — | — | |||||||||||
TOTAL | |||||||||||||||
Revenues | $ | 1,195 | $ | 1,165 | $ | 2,382 | $ | 2,254 | |||||||
Adjusted EBITDA | 229 | 227 | 457 | 421 | |||||||||||
Depreciation and amortization | 91 | 86 | 182 | 167 | |||||||||||
(a) | Intersegment revenues are included in the management and franchise fees revenues and owned and leased hotels revenues and are eliminated in Eliminations. |
(b) | Includes expenses recorded by our owned and leased hotels related to billings for depreciation of technology-related capital assets. |
24
The table below provides a reconciliation of our net income attributable to Hyatt Hotels Corporation to EBITDA and a reconciliation of EBITDA to our consolidated Adjusted EBITDA:
Three Months Ended June 30, | Six Months Ended June 30, | ||||||||||||||
2017 | 2016 | 2017 | 2016 | ||||||||||||
Net income attributable to Hyatt Hotels Corporation | $ | 87 | $ | 67 | $ | 157 | $ | 101 | |||||||
Interest expense | 20 | 20 | 41 | 37 | |||||||||||
Provision for income taxes | 45 | 21 | 86 | 37 | |||||||||||
Depreciation and amortization | 91 | 86 | 182 | 167 | |||||||||||
EBITDA | 243 | 194 | 466 | 342 | |||||||||||
Equity (earnings) losses from unconsolidated hospitality ventures | (1 | ) | (19 | ) | 2 | (21 | ) | ||||||||
Stock-based compensation expense (Note 13) | 5 | 4 | 21 | 20 | |||||||||||
(Gains) losses on sales of real estate (Note 6) | (34 | ) | 21 | (34 | ) | 21 | |||||||||
Other (income) loss, net (Note 17) | (2 | ) | (1 | ) | (42 | ) | 3 | ||||||||
Pro rata share of unconsolidated hospitality ventures Adjusted EBITDA | 18 | 28 | 44 | 56 | |||||||||||
Adjusted EBITDA | $ | 229 | $ | 227 | $ | 457 | $ | 421 | |||||||
25
16. EARNINGS PER SHARE
The calculation of basic and diluted earnings per share, including a reconciliation of the numerator and denominator, are as follows:
Three Months Ended June 30, | Six Months Ended June 30, | ||||||||||||||
2017 | 2016 | 2017 | 2016 | ||||||||||||
Numerator: | |||||||||||||||
Net income | $ | 87 | $ | 67 | $ | 157 | $ | 101 | |||||||
Net income and accretion attributable to noncontrolling interests | — | — | — | — | |||||||||||
Net income attributable to Hyatt Hotels Corporation | $ | 87 | $ | 67 | $ | 157 | $ | 101 | |||||||
Denominator: | |||||||||||||||
Basic weighted average shares outstanding | 125,504,276 | 133,991,118 | 127,614,404 | 134,560,660 | |||||||||||
Share-based compensation and equity-classified forward contract under the 2017 ASR | 1,300,290 | 904,836 | 1,279,859 | 848,400 | |||||||||||
Diluted weighted average shares outstanding | 126,804,566 | 134,895,954 | 128,894,263 | 135,409,060 | |||||||||||
Basic Earnings Per Share: | |||||||||||||||
Net income | $ | 0.69 | $ | 0.50 | $ | 1.23 | $ | 0.75 | |||||||
Net income and accretion attributable to noncontrolling interests | — | — | — | — | |||||||||||
Net income attributable to Hyatt Hotels Corporation | $ | 0.69 | $ | 0.50 | $ | 1.23 | $ | 0.75 | |||||||
Diluted Earnings Per Share: | |||||||||||||||
Net income | $ | 0.68 | $ | 0.49 | $ | 1.22 | $ | 0.74 | |||||||
Net income and accretion attributable to noncontrolling interests | — | — | — | — | |||||||||||
Net income attributable to Hyatt Hotels Corporation | $ | 0.68 | $ | 0.49 | $ | 1.22 | $ | 0.74 | |||||||
The computations of diluted net income per share for the three and six months ended June 30, 2017 and June 30, 2016 do not include the following shares of Class A common stock assumed to be issued as stock-settled SARs, RSUs and an equity-classified forward contract because they are anti-dilutive.
Three Months Ended June 30, | Six Months Ended June 30, | ||||||||||
2017 | 2016 | 2017 | 2016 | ||||||||
SARs | 49,900 | 117,930 | 41,100 | 4,501 | |||||||
RSUs | — | 14,089 | — | 10,946 | |||||||
Equity-classified forward contract under the 2017 ASR | 16,200 | — | — | — | |||||||
26
17. OTHER INCOME (LOSS), NET
Three Months Ended June 30, | Six Months Ended June 30, | ||||||||||||||
2017 | 2016 | 2017 | 2016 | ||||||||||||
Interest income (Note 4) | $ | 2 | $ | 2 | $ | 97 | $ | 3 | |||||||
Depreciation recovery | 6 | 6 | 12 | 11 | |||||||||||
Performance guarantee liability amortization (Note 11) | 5 | 9 | 9 | 17 | |||||||||||
Foreign currency gains, net | — | 3 | — | 3 | |||||||||||
Performance guarantee expense, net (Note 11) | (14 | ) | (8 | ) | (40 | ) | (27 | ) | |||||||
Realized losses (Note 4) | — | — | (40 | ) | — | ||||||||||
Debt settlement costs (Note 8) | — | (3 | ) | — | (3 | ) | |||||||||
Other | 3 | (8 | ) | 4 | (7 | ) | |||||||||
Other income (loss), net | $ | 2 | $ | 1 | $ | 42 | $ | (3 | ) | ||||||
27
Item 2. Management's Discussion and Analysis of Financial Condition and Results of Operations.
This quarterly report contains "forward-looking statements" within the meaning of the Private Securities
Litigation Reform Act of 1995. These statements include statements about the Company's plans, strategies, financial performance, prospects or future events and involve known and unknown risks that are difficult to predict. As a result, our actual results, performance or achievements may differ materially from those expressed or implied by these forward-looking statements. In some cases, you can identify forward-looking statements by the use of words such as "may," "could," "expect," "intend," "plan," "seek," "anticipate," "believe," "estimate," "predict," "potential," "continue," "likely," "will," "would" and variations of these terms and similar expressions, or the negative of these terms or similar expressions. Such forward-looking statements are necessarily based upon estimates and assumptions that, while considered reasonable by us and our management, are inherently uncertain. Factors that may cause actual results to differ materially from current expectations include, but are not limited to: the factors discussed in our filings with the SEC, including our Annual Report on Form 10-K; general economic uncertainty in key global markets and a worsening of global economic conditions or low levels of economic growth; the rate and the pace of economic recovery following economic downturns; levels of spending in business and leisure segments as well as consumer confidence; declines in occupancy and average daily rate; limited visibility with respect to future bookings; loss of key personnel; hostilities, or fear of hostilities, including future terrorist attacks, that affect travel; travel-related accidents; natural or man-made disasters such as earthquakes, tsunamis, tornadoes, hurricanes, floods, oil spills, nuclear incidents and global outbreaks of pandemics or contagious diseases or fear of such outbreaks; our ability to successfully achieve certain levels of operating profits at hotels that have performance guarantees in favor of our third party owners; the impact of hotel renovations; risks associated with our capital allocation plans and common stock repurchase program, including the amount and timing of share repurchases and the risk that our common stock repurchase program could increase volatility and fail to enhance stockholder value; the seasonal and cyclical nature of the real estate and hospitality businesses; changes in distribution arrangements, such as through Internet travel intermediaries; changes in the tastes and preferences of our customers, including the entry of new competitors in the lodging business; relationships with colleagues and labor unions and changes in labor laws; financial condition of, and our relationships with, third-party property owners, franchisees and hospitality venture partners; the possible inability of our third-party owners, franchisees or development partners to access capital necessary to fund current operations or implement our plans for growth; risks associated with potential acquisitions and dispositions and the introduction of new brand concepts; the timing of acquisitions and dispositions; failure to successfully complete proposed transactions (including the failure to satisfy closing conditions or obtain required approvals); unforeseen terminations of our management or franchise agreements; changes in federal, state, local or foreign tax law; increases in interest rates and operating costs; foreign exchange rate fluctuations or currency restructurings; lack of acceptance of new brands or innovation; our ability to successfully implement our new global loyalty platform and the level of acceptance of the new program by our guests; general volatility of the capital markets and our ability to access such markets; changes in the competitive environment in our industry, including as a result of industry consolidation, and the markets where we operate; cyber incidents and information technology failures; outcomes of legal or administrative proceedings; and violations of regulations or laws related to our franchising business. All forward-looking statements attributable to us or persons acting on our behalf are expressly qualified in their entirety by the cautionary statements set forth above. Forward-looking statements speak only as of the date they are made, and we do not undertake or assume any obligation to update publicly any of these forward-looking statements to reflect actual results, new information or future events, changes in assumptions or changes in other factors affecting forward-looking statements, except to the extent required by applicable laws. If we update one or more forward-looking statements, no inference should be drawn that we will make additional updates with respect to those or other forward-looking statements.
The following discussion should be read in conjunction with the Company's condensed consolidated financial statements and accompanying Notes, which appear elsewhere in this Quarterly Report on Form 10-Q.
Executive Overview
We are a global hospitality company engaged in the development, ownership, operation, management, franchising and licensing of a portfolio of properties, including hotels, resorts and residential and vacation ownership properties around the world. At June 30, 2017, our worldwide hotel portfolio consisted of 686 hotels (175,626 rooms), including:
• | 290 managed properties (94,382 rooms), all of which we operate under management agreements with third-party property owners; |
• | 326 franchised properties (53,629 rooms), all of which are owned by third parties that have franchise agreements with us and are operated by third parties; |
28
• | 33 owned properties (16,802 rooms) (including 1 consolidated hospitality venture), 1 capital leased property (171 rooms), and 7 operating leased properties (2,411 rooms), all of which we manage; and |
• | 23 managed properties and 6 franchised properties owned or leased by unconsolidated hospitality ventures (8,231 rooms). |
Our worldwide property portfolio also included:
• | 3 destination wellness resorts (421 rooms), all of which we own and operate (including 1 consolidated hospitality venture); |
• | 6 all inclusive resorts (2,401 rooms), all of which are owned by a third party in which we hold a common share investment and which operates the resorts under franchise agreements with us; |
• | 16 vacation ownership properties (1,038 units), all of which are licensed by Interval Leisure Group ("ILG") under the Hyatt Residence Club brand and operated by third parties, including ILG and its affiliates; and |
• | 20 residential properties (2,562 units), which consist of branded residences and serviced apartments. We manage all of the serviced apartments and those branded residential units that participate in a rental program with an adjacent Hyatt-branded hotel. |
We report our consolidated operations in U.S. dollars. Tabular amounts are displayed in millions of U.S. dollars, or as otherwise specifically identified. Percentages may not recompute due to rounding and percentage changes that are not meaningful are presented as "NM". Constant currency disclosures throughout Management's Discussion and Analysis of Financial Condition and Results of Operations are non-GAAP measures. See "—Non-GAAP Measures" for further discussion of constant currency disclosures. We manage our business within four reportable segments as described below:
• | Owned and leased hotels, which consists of our owned and leased full service and select service hotels and, for purposes of segment Adjusted EBITDA, our pro rata share of the Adjusted EBITDA of our unconsolidated hospitality ventures, based on our ownership percentage of each venture; |
• | Americas management and franchising, which consists of our management and franchising of properties located in the United States, Latin America, Canada and the Caribbean; |
• | ASPAC management and franchising, which consists of our management and franchising of properties located in Southeast Asia, as well as Greater China, Australia, South Korea, Japan and Micronesia; and |
• | EAME/SW Asia management and franchising, which consists of our management and franchising of properties located in Europe, Africa, the Middle East, India, Central Asia and Nepal. |
Within corporate and other, we include our unallocated corporate overhead, results of Miraval, license fees related to Hyatt Residence Club and results of our co-branded credit card. See Part I, Item 1 "Financial Statements—Note 15 to the Condensed Consolidated Financial Statements" for further discussion of our segment structure.
During the three months ended June 30, 2017, we entered into the following key transactions:
• | sold Hyatt Regency Grand Cypress for a net sales price of $202 million and entered into a long-term management agreement with the purchaser of the hotel; and |
• | sold Hyatt Regency Louisville for a net sales price of $65 million and entered into a long-term franchise agreement with the purchaser of the hotel. |
Our financial performance for the quarter ended June 30, 2017 reflects an increase in net income of $20 million compared to the quarter ended June 30, 2016. Consolidated revenues increased $30 million, or 2.6% ($34 million or 2.9% excluding the impact of currency), during the quarter ended June 30, 2017, compared to the quarter ended June 30, 2016. Owned and leased hotels revenues for the quarter ended June 30, 2017 increased $18 million compared to the quarter ended June 30, 2016, which included a net unfavorable currency impact of $3 million. The increase in owned and leased hotels revenues resulted primarily from an increase in non-comparable owned and leased hotels revenues of $30 million, including a $1 million net unfavorable currency impact, which was driven by acquisitions and a new hotel opening, partially offset by hotels sold in 2016 and 2017. Comparable owned and leased hotels revenues decreased $12 million, including a $2 million net unfavorable currency impact, which was primarily driven by full service hotels in the United States as a result of decreased group average daily rate ("ADR") and demand due in part to the shift of the Easter holiday.
29
Our management and franchise fees for the quarter ended June 30, 2017 increased $15 million compared to the quarter ended June 30, 2016, which included a $1 million net unfavorable currency impact. Fee increases were primarily attributable to our Americas management and franchising segment.
Our consolidated Adjusted EBITDA for the second quarter of 2017 increased $2 million compared to the second quarter of 2016, which included $2 million in net unfavorable currency impact. The increase was primarily driven by our Americas management and franchising segment which increased $8 million and our ASPAC management and franchising segment which increased $4 million, partially offset by our owned and leased segment which decreased $13 million. See "—Non-GAAP Measures" for an explanation of how we utilize Adjusted EBITDA, why we present it and material limitations on its usefulness, as well as a reconciliation of our net income attributable to Hyatt Hotels Corporation to EBITDA and a reconciliation of EBITDA to consolidated Adjusted EBITDA.
Hotel Chain Revenue per Available Room ("RevPAR") Statistics.
RevPAR | ||||||||||||||||
Three Months Ended June 30, | ||||||||||||||||
(Comparable Locations) | Number of Comparable Hotels (1) | 2017 | 2016 | Change | Change (in constant $) | |||||||||||
Systemwide hotels | 595 | $ | 143 | $ | 140 | 2.4 | % | 2.9 | % | |||||||
Owned and leased hotels | 37 | $ | 179 | $ | 182 | (1.7 | )% | (1.2 | )% | |||||||
Americas full service hotels | 153 | $ | 165 | $ | 163 | 1.4 | % | 1.6 | % | |||||||
Americas select service hotels | 298 | $ | 115 | $ | 113 | 1.8 | % | 1.8 | % | |||||||
ASPAC full service hotels | 70 | $ | 143 | $ | 136 | 5.4 | % | 7.2 | % | |||||||
EAME/SW Asia full service hotels | 63 | $ | 123 | $ | 119 | 3.3 | % | 5.1 | % | |||||||
EAME/SW Asia select service hotels | 10 | $ | 67 | $ | 58 | 16.9 | % | 17.2 | % | |||||||
(1) Comparable systemwide hotels include one select service hotel in ASPAC, which is not included in the ASPAC full service hotel statistics. The number of managed and franchised hotels presented above includes owned and leased hotels.
Americas management and franchising segment RevPAR increased during the second quarter of 2017 compared to the second quarter of 2016 driven by transient ADR growth and demand at our full service hotels.
While transient ADR and demand increased, group demand was lower in the second quarter of 2017, compared to the second quarter of 2016, both due in part to the timing of Easter. Our owned and leased hotels in the Americas also experienced decreased group demand as well as ADR declines due in part to the timing of Easter, partially offset by transient revenue growth as a result of increased demand and ADR. Group revenue booked in the second quarter of 2017 for stays in 2017 was lower compared to the same period last year. Group revenue booked in the second quarter of 2017 for stays in future years was higher compared to the same period last year.
ASPAC management and franchising segment RevPAR increased during the second quarter of 2017 compared to the second quarter of 2016 driven by strong transient demand in China, and increased group demand in Hong Kong and Japan, partially offset by a decline in visitor arrivals to South Korea. Additionally, Southeast Asia, Australia and the Pacific reported improved transient demand.
EAME/SW Asia management and franchising segment RevPAR increased during the second quarter of 2017 compared to the second quarter of 2016 driven by improved ADR in Western Europe and India, and strong occupancy in Southern Europe. In addition to strong ADR, the United Kingdom experienced increased occupancy due to one hotel undergoing a renovation during the comparable period in 2016. These increases within Western Europe were partially offset by soft demand in Switzerland. Southern Europe experienced improved occupancy throughout the region, including Turkey, which was impacted in 2016 by security concerns due to terrorist attacks in the country. Additionally, the Middle East experienced marginal RevPAR growth driven by increased occupancy in Dubai, partially offset by ADR declines in other Middle Eastern properties.
30
Results of Operations
Three and Six Months Ended June 30, 2017 Compared with Three and Six Months Ended June 30, 2016
Discussion on Consolidated Results
For additional information regarding our consolidated results below, please also refer to our condensed consolidated statements of income included in this quarterly report. The impacts from our investments in marketable securities held to fund operating programs, including securities held to fund our benefit programs funded through a rabbi trust and securities held to fund our loyalty program, were recorded on the various financial statement line items discussed below and have no impact on net income.
Owned and leased hotels revenues.
Three Months Ended June 30, | ||||||||||||||||||
2017 | 2016 | Better / (Worse) | Currency Impact | |||||||||||||||
Comparable owned and leased hotels revenues | $ | 500 | $ | 512 | $ | (12 | ) | (2.4 | )% | $ | (2 | ) | ||||||
Non-comparable owned and leased hotels revenues | 77 | 47 | 30 | 63.6 | % | (1 | ) | |||||||||||
Total owned and leased hotels revenues | $ | 577 | $ | 559 | $ | 18 | 3.2 | % | $ | (3 | ) | |||||||
Six Months Ended June 30, | ||||||||||||||||||
2017 | 2016 | Better / (Worse) | Currency Impact | |||||||||||||||
Comparable owned and leased hotels revenues | $ | 982 | $ | 989 | $ | (7 | ) | (0.7 | )% | $ | (6 | ) | ||||||
Non-comparable owned and leased hotels revenues | 167 | 86 | 81 | 93.5 | % | (1 | ) | |||||||||||
Total owned and leased hotels revenues | $ | 1,149 | $ | 1,075 | $ | 74 | 6.9 | % | $ | (7 | ) | |||||||
The decrease in comparable owned and leased hotels revenues for the three months ended June 30, 2017, compared to the three months ended June 30, 2016, was primarily driven by full service hotels in the United States, due in part to the shift of Easter from the first quarter of 2016 to the second quarter of 2017. The decrease for the six months ended June 30, 2017, compared to the same period in 2016, was driven by decreases at certain international hotels, primarily due to a net unfavorable currency impact and ADR and occupancy declines in Switzerland. The increases in non-comparable owned and leased hotels revenues for the three and six months ended June 30, 2017, compared to the same periods in 2016, were driven by acquisitions and a hotel opening, partially offset by hotels sold in 2016 and 2017. See "—Segment Results" for further discussion of owned and leased hotels revenues.
Management and franchise fee revenues.
Three Months Ended June 30, | ||||||||||||||
2017 | 2016 | Better / (Worse) | ||||||||||||
Base management fees | $ | 52 | $ | 49 | $ | 3 | 5.4 | % | ||||||
Incentive management fees | 34 | 30 | 4 | 11.5 | % | |||||||||
Franchise fees | 29 | 27 | 2 | 8.3 | % | |||||||||
Other fee revenues | 15 | 9 | 6 | 60.2 | % | |||||||||
Total management and franchise fees | $ | 130 | $ | 115 | $ | 15 | 12.0 | % | ||||||
Six Months Ended June 30, | ||||||||||||||
2017 | 2016 | Better / (Worse) | ||||||||||||
Base management fees | $ | 99 | $ | 94 | $ | 5 | 5.1 | % | ||||||
Incentive management fees | 69 | 60 | 9 | 14.3 | % | |||||||||
Franchise fees | 56 | 50 | 6 | 11.9 | % | |||||||||
Other fee revenues | 28 | 18 | 10 | 53.8 | % | |||||||||
Total management and franchise fees | $ | 252 | $ | 222 | $ | 30 | 13.1 | % | ||||||
31
The increases in management and franchise fees during the three and six months ended June 30, 2017, compared to the same periods in the prior year, which both included a $1 million net unfavorable currency impact, were primarily driven by the Americas management and franchising segment and ASPAC management and franchising segment. See "—Segment Results" for further discussion.
Other revenues. Other revenues increased $4 million and $17 million during the three and six months ended June 30, 2017, respectively, compared to the three and six months ended June 30, 2016. The increase for the three months ended June 30, 2017 was due to higher revenue from our co-branded credit card program as a result of increased point sales and our new agreement that was effective during the three months ended June 30, 2017. The increase for the six months ended June 30, 2017 was driven by the sales of villas at Andaz Maui at Wailea Resort, in which we acquired our partners' share of the unconsolidated hospitality venture during the fourth quarter of 2016.
Other revenues from managed properties.
Three Months Ended June 30, | ||||||||||||||
2017 | 2016 | Change | ||||||||||||
Other revenues from managed properties | $ | 473 | $ | 480 | $ | (7 | ) | (1.0 | )% | |||||
Less: rabbi trust impact | (4 | ) | (2 | ) | (2 | ) | (77.9 | )% | ||||||
Other revenues from managed properties excluding rabbi trust impact | $ | 469 | $ | 478 | $ | (9 | ) | (1.5 | )% | |||||
Six Months Ended June 30, | ||||||||||||||
2017 | 2016 | Change | ||||||||||||
Other revenues from managed properties | $ | 944 | $ | 937 | $ | 7 | 0.9 | % | ||||||
Less: rabbi trust impact | (11 | ) | (2 | ) | (9 | ) | (415.4 | )% | ||||||
Other revenues from managed properties excluding rabbi trust impact | $ | 933 | $ | 935 | $ | (2 | ) | (0.1 | )% | |||||
Excluding the impact of rabbi trust, other revenues from managed properties decreased during the three and six months ended June 30, 2017, compared to the three and six months ended June 30, 2016. The decrease during the three months ended June 30, 2017, compared to the same period in 2016, was driven by decreased reimbursements related to our loyalty program as a result of increased redemptions in the prior period due to a program modification in 2016. The decrease during the six months ended June 30, 2017, compared to the same period in the prior year, was driven by decreased full service payroll and related costs driven by hotel conversions and a hotel that left the chain in the first quarter of 2016, partially offset by increased reimbursements related to our loyalty program and technology costs.
Owned and leased hotels expense.
Three Months Ended June 30, | ||||||||||||||
2017 | 2016 | Better / (Worse) | ||||||||||||
Comparable owned and leased hotels expense | $ | 369 | $ | 371 | $ | 2 | 0.7 | % | ||||||
Non-comparable owned and leased hotels expense | 60 | 41 | (19 | ) | (46.2 | )% | ||||||||
Rabbi trust impact | 1 | 1 | — | (77.9 | )% | |||||||||
Total owned and leased hotels expense | $ | 430 | $ | 413 | $ | (17 | ) | (4.1 | )% | |||||
Six Months Ended June 30, | ||||||||||||||
2017 | 2016 | Better / (Worse) | ||||||||||||
Comparable owned and leased hotels expense | $ | 730 | $ | 728 | $ | (2 | ) | (0.2 | )% | |||||
Non-comparable owned and leased hotels expense | 123 | 73 | (50 | ) | (70.0 | )% | ||||||||
Rabbi trust impact | 4 | 1 | (3 | ) | (415.4 | )% | ||||||||
Total owned and leased hotels expense | $ | 857 | $ | 802 | $ | (55 | ) | (6.9 | )% | |||||
The increases in owned and leased hotels expense, which included $2 million and $5 million net favorable currency impact, respectively, in the three and six months ended June 30, 2017, compared to the same periods in the prior year, were primarily driven by increases in non-comparable owned and leased hotels expense related to acquisitions and a hotel opening, partially offset by hotels sold in 2016 and 2017.
32
Depreciation and amortization. Depreciation and amortization increased $5 million and $15 million, respectively, during the three and six months ended June 30, 2017, compared to the same periods in the prior year, primarily driven by acquisitions and a hotel opening, and assets placed in service mid-2016 related to technology projects, partially offset by decreased depreciation related to hotels sold in 2016 and 2017. A portion of the depreciation related to technology projects is recovered from our managed and franchised hotels and the corresponding recovery is included in other income (loss), net.
Other direct costs. Other direct costs decreased $3 million and increased $10 million during the three and six months ended June 30, 2017, respectively, compared to the three and six months ended June 30, 2016. The increase for the six months ended June 30, 2017 was driven by the sales of villas at Andaz Maui at Wailea Resort.
Selling, general, and administrative expenses.
Three Months Ended June 30, | ||||||||||||||
2017 | 2016 | Change | ||||||||||||
Selling, general, and administrative expenses | $ | 90 | $ | 75 | $ | 15 | 20.8 | % | ||||||
Less: rabbi trust impact | (8 | ) | (4 | ) | (4 | ) | (80.3 | )% | ||||||
Less: stock-based compensation expense | (5 | ) | (4 | ) | (1 | ) | (43.3 | )% | ||||||
Adjusted selling, general, and administrative expenses | $ | 77 | $ | 67 | $ | 10 | 15.7 | % | ||||||
Six Months Ended June 30, | ||||||||||||||
2017 | 2016 | Change | ||||||||||||
Selling, general, and administrative expenses | $ | 189 | $ | 163 | $ | 26 | 15.9 | % | ||||||
Less: rabbi trust impact | (20 | ) | (4 | ) | (16 | ) | (386.5 | )% | ||||||
Less: stock-based compensation expense | (21 | ) | (20 | ) | (1 | ) | (5.4 | )% | ||||||
Adjusted selling, general, and administrative expenses | $ | 148 | $ | 139 | $ | 9 | 6.4 | % | ||||||
Adjusted selling, general, and administrative expenses excludes the impact of expenses related to benefit programs funded through rabbi trusts and stock-based compensation expense. Adjusted selling, general, and administrative expenses, as we define it, is a non-GAAP measure. See "—Non-GAAP Measures" for further discussion of adjusted selling, general, and administrative expenses.
The increases in adjusted selling, general, and administrative expenses during three and six months ended June 30, 2017, compared to the same periods in the prior year, were primarily driven by the acquisition of Miraval and master brand marketing spend to support the launch of the World of Hyatt platform.
Net gains and interest income from marketable securities held to fund operating programs.
Three Months Ended June 30, | ||||||||||||||
2017 | 2016 | Better / (Worse) | ||||||||||||
Rabbi trust impact allocated to selling, general, and administrative expenses | $ | 8 | $ | 4 | $ | 4 | 80.3 | % | ||||||
Rabbi trust impact allocated to owned and leased hotels expense | 1 | 1 | — | 77.9 | % | |||||||||
Net gains and interest income from marketable securities held to fund our loyalty program allocated to owned and leased hotels revenues | 1 | 2 | (1 | ) | (47.2 | )% | ||||||||
Net gains and interest income from marketable securities held to fund operating programs | $ | 10 | $ | 7 | $ | 3 | 56.6 | % | ||||||
33
Six Months Ended June 30, | ||||||||||||||
2017 | 2016 | Better / (Worse) | ||||||||||||
Rabbi trust impact allocated to selling, general, and administrative expenses | $ | 20 | $ | 4 | $ | 16 | 386.5 | % | ||||||
Rabbi trust impact allocated to owned and leased hotels expense | 4 | 1 | 3 | 415.4 | % | |||||||||
Net gains and interest income from marketable securities held to fund our loyalty program allocated to owned and leased hotels revenues | 1 | 3 | (2 | ) | (60.4 | )% | ||||||||
Net gains and interest income from marketable securities held to fund operating programs | $ | 25 | $ | 8 | $ | 17 | 223.5 | % | ||||||
Equity earnings (losses) from unconsolidated hospitality ventures.
Three Months Ended June 30, | ||||||||||||||
2017 | 2016 | Better / (Worse) | ||||||||||||
Equity earnings (losses) from unconsolidated hospitality ventures | $ | 1 | $ | 19 | $ | (18 | ) | (92.7 | )% | |||||
Six Months Ended June 30, | ||||||||||||||
2017 | 2016 | Better / (Worse) | ||||||||||||
Equity earnings (losses) from unconsolidated hospitality ventures | $ | (2 | ) | $ | 21 | $ | (23 | ) | (106.9 | )% | ||||
The decreases during the three and six months ended June 30, 2017, as compared to the three and six months ended June 30, 2016, were attributable to the following:
• | $7 million and $3 million decreases, respectively, as a result of the Playa business combination with Pace in March 2017 as discussed in Part I, Item 1 "Financial Statements—Note 4 to the Condensed Consolidated Financial Statements." Subsequent to the business combination, our investment ceased to be accounted for as an equity method investment, and we therefore no longer have equity earnings or losses related to our investment; |
• | $6 million decrease in both the three and six months ended June 30, 2017 as 2016 included equity earnings attributable to a distribution from one of our unconsolidated hospitality ventures primarily as a result of its debt refinancing; and |
• | $2 million and $3 million decreases, respectively, due to foreign currency volatility at one of our foreign unconsolidated hospitality ventures which holds loans denominated in a currency other than its functional currency. |
The six months ended June 30, 2017, as compared to the six months ended June 30, 2016, also included a $7 million decrease due to equity earnings in 2016 related to a forfeited deposit on a sale of hotels by an unconsolidated hospitality venture that did not close.
Interest expense. Interest expense was flat and increased $4 million during the three and six months ended June 30, 2017, respectively, compared to the same periods in the prior year. The increase during the six months ended June 30, 2017 was driven by interest on the 2026 Notes, which were issued in the first quarter of 2016, and interest on the outstanding balance on our credit revolver in 2017. These increases were partially offset by interest on the 2016 Notes, which were redeemed in the second quarter of 2016.
Asset Impairments. During the six months ended June 30, 2017 and June 30, 2016, we did not record any asset impairments. However, a change in our assumptions and estimates by 4% could reduce the fair value of one of our reporting units at June 30, 2017, and could potentially result in an impairment of goodwill of up to $17 million.
Gains (losses) on sales of real estate. During the three and six months ended June 30, 2017, we sold Hyatt Regency Louisville resulting in a pre-tax gain of $35 million. During the three and six months ended June 30, 2016, we sold Andaz 5th Avenue resulting in a pre-tax loss of $21 million.
34
Other income (loss), net. Other income (loss), net increased $1 million and $45 million during the three and six months ended June 30, 2017, compared to the same periods in the prior year, respectively. The change for the six months ended June 30, 2017 was primarily attributable to $94 million of interest income and $40 million of realized losses related to the redemption of our Playa preferred shares.
Provision for income taxes.
Three Months Ended June 30, | ||||||||||||||
2017 | 2016 | Better / (Worse) | ||||||||||||
Income before income taxes | $ | 132 | $ | 88 | $ | 44 | 49.6 | % | ||||||
Provision for income taxes | (45 | ) | (21 | ) | (24 | ) | (106.2 | )% | ||||||
Effective tax rate | 34.1 | % | 24.7 | % | (9.4 | )% | ||||||||
Income tax expense increased $24 million in the quarter ended June 30, 2017 compared to the quarter ended June 30, 2016 primarily due to an increase in income before taxes for the quarter primarily driven by the gain on sale of Hyatt Regency Louisville. The effective tax rate increased for the same period primarily due to the favorable impact of the reversal of uncertain tax positions in 2016 and the impact of foreign losses that are not benefited in 2017.
Six Months Ended June 30, | ||||||||||||||
2017 | 2016 | Better / (Worse) | ||||||||||||
Income before income taxes | $ | 243 | $ | 138 | $ | 105 | 76.1 | % | ||||||
Provision for income taxes | (86 | ) | (37 | ) | (49 | ) | (128.3 | )% | ||||||
Effective tax rate | 35.3 | % | 27.2 | % | (8.1 | )% | ||||||||
Income tax expense increased $49 million in the six months ended June 30, 2017 compared to the six months ended June 30, 2016 primarily due to an increase in income before income taxes driven by the full redemption of our Playa preferred shares. The effective tax rate increased for the same period primarily due to the favorable impact of the reversal of uncertain tax positions in 2016 and the impact of foreign losses that are not benefited in 2017.
Segment Results
We evaluate segment operating performance using segment revenue and segment Adjusted EBITDA, as described in Part I, Item 1 "Financial Statements—Note 15 to the Condensed Consolidated Financial Statements."
35
The charts below illustrate revenues by segment excluding other revenues from managed properties for the three and six months ended June 30, 2017 and June 30, 2016, which are presented before intersegment eliminations.
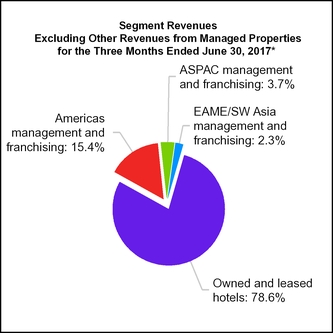
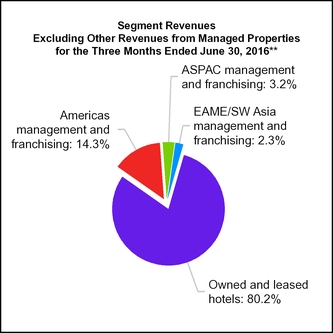
*Consolidated revenues for the three months ended June 30, 2017 included corporate and other revenues of $33 million, eliminations of $26 million and other revenues from managed properties of $473 million.
**Consolidated revenues for the three months ended June 30, 2016 included corporate and other revenues of $13 million, eliminations of $25 million and other revenues from managed properties of $480 million.

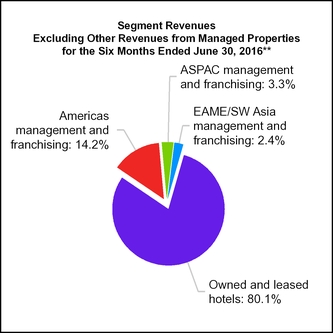
*Consolidated revenues for the six months ended June 30, 2017 included corporate and other revenues of $59 million, eliminations of $52 million and other revenues from managed properties of $944 million.
**Consolidated revenues for the six months ended June 30, 2016 included corporate and other revenues of $22 million, eliminations of $47 million and other revenues from managed properties of $937 million.
36
Owned and leased hotels segment revenues.
Three Months Ended June 30, | ||||||||||||||||||
2017 | 2016 | Better / (Worse) | Currency Impact | |||||||||||||||
Comparable owned and leased hotels revenues | $ | 502 | $ | 512 | $ | (10 | ) | (1.9 | )% | $ | (2 | ) | ||||||
Non-comparable owned and leased hotels revenues | 60 | 47 | 13 | 26.8 | % | (1 | ) | |||||||||||
Total owned and leased hotels revenues | 562 | 559 | 3 | 0.5 | % | (3 | ) | |||||||||||
Other revenues | — | — | — | — | % | — | ||||||||||||
Total segment revenues | $ | 562 | $ | 559 | $ | 3 | 0.5 | % | $ | (3 | ) | |||||||
Six Months Ended June 30, | ||||||||||||||||||
2017 | 2016 | Better / (Worse) | Currency Impact | |||||||||||||||
Comparable owned and leased hotels revenues | $ | 986 | $ | 989 | $ | (3 | ) | (0.2 | )% | $ | (6 | ) | ||||||
Non-comparable owned and leased hotels revenues | 134 | 86 | 48 | 55.1 | % | (1 | ) | |||||||||||
Total owned and leased hotels revenues | 1,120 | 1,075 | 45 | 4.2 | % | (7 | ) | |||||||||||
Other revenues | 13 | — | 13 | NM | — | |||||||||||||
Total segment revenues | $ | 1,133 | $ | 1,075 | $ | 58 | 5.4 | % | $ | (7 | ) | |||||||
The decrease in comparable owned and leased hotels revenues during the three months ended June 30, 2017, compared to the three months ended June 30, 2016, was primarily driven by decreases of $8 million at our hotels in the United States and $2 million at our international hotels. The revenue decline at our hotels in the United States was primarily due to decreased group business, driven in part by the shift of Easter. The decrease in comparable international hotels was primarily driven by a net unfavorable currency impact of $2 million and decreased performance at certain of our owned hotels in Europe, offset by increased group and transient business in Aruba. The decrease in comparable owned and leased hotels revenues during the six months ended June 30, 2017, compared to the six months ended June 30, 2016, was primarily driven by a decrease of $8 million at our international hotels due to a net unfavorable currency impact of $6 million and decreased performance at certain owned hotels in Europe. The decrease was partially offset by an increase of $5 million at our hotels in the United States, which was primarily driven by improved transient business.
The increases in non-comparable owned and leased hotels revenues for the three and six months ended June 30, 2017, compared to the same periods in 2016, were driven by the following:
• | the acquisition of our partners' interests in Andaz Maui at Wailea Resort and villas in 2016; |
• | the acquisitions of Royal Palms Resort and Spa and The Confidante Miami Beach in 2016; and |
• | the opening of Grand Hyatt Rio de Janeiro in 2016. |
The increases in revenues were partially offset by the dispositions of Andaz 5th Avenue and Hyatt Regency Birmingham (U.K.) in 2016 and Hyatt Regency Grand Cypress in 2017.
37
Three Months Ended June 30, | ||||||||||||||||||||||||||||||||||||
RevPAR | Occupancy | ADR | ||||||||||||||||||||||||||||||||||
2017 | 2016 | Better / (Worse) | Better / (Worse) Constant $ | 2017 | 2016 | Change in Occ % pts | 2017 | 2016 | Better / (Worse) | Better / (Worse) Constant $ | ||||||||||||||||||||||||||
Comparable owned and leased hotels | $ | 179 | $ | 182 | (1.7 | )% | (1.2 | )% | 79.4 | % | 80.5 | % | (1.1 | )% | $ | 225 | $ | 226 | (0.3 | )% | 0.2 | % | ||||||||||||||
Six Months Ended June 30, | ||||||||||||||||||||||||||||||||||||
RevPAR | Occupancy | ADR | ||||||||||||||||||||||||||||||||||
2017 | 2016 | Better / (Worse) | Better / (Worse) Constant $ | 2017 | 2016 | Change in Occ % pts | 2017 | 2016 | Better / (Worse) | Better / (Worse) Constant $ | ||||||||||||||||||||||||||
Comparable Owned and Leased Hotels | $ | 176 | $ | 176 | (0.1 | )% | 0.6 | % | 77.3 | % | 77.5 | % | (0.2 | )% | $ | 228 | $ | 227 | 0.2 | % | 0.9 | % | ||||||||||||||
Excluding the net unfavorable currency impact, the decrease in comparable RevPAR at our owned and leased hotels during the three months ended June 30, 2017, compared to the three months ended June 30, 2016, was primarily driven by decreased group business at our comparable full service hotels in the United States largely due to the timing of Easter. Excluding the net unfavorable currency impact, the increase in comparable RevPAR at our owned and leased hotels during the six months ended June 30, 2017, compared to the same period in 2016, was primarily driven by improved transient business in the Americas.
During the three and six months ended June 30, 2017, we removed two properties that were sold during the period from the comparable owned and leased hotels results.
Owned and leased hotels segment Adjusted EBITDA.
Three Months Ended June 30, | ||||||||||||||
2017 | 2016 | Better / (Worse) | ||||||||||||
Owned and leased hotels Adjusted EBITDA | $ | 118 | $ | 121 | $ | (3 | ) | (2.5 | )% | |||||
Pro rata share of unconsolidated hospitality ventures Adjusted EBITDA | 18 | 28 | (10 | ) | (34.8 | )% | ||||||||
Segment Adjusted EBITDA | $ | 136 | $ | 149 | $ | (13 | ) | (8.5 | )% | |||||
Six Months Ended June 30, | ||||||||||||||
2017 | 2016 | Better / (Worse) | ||||||||||||
Owned and leased hotels Adjusted EBITDA | $ | 235 | $ | 224 | $ | 11 | 4.9 | % | ||||||
Pro rata share of unconsolidated hospitality ventures Adjusted EBITDA | 44 | 56 | (12 | ) | (21.5 | )% | ||||||||
Segment Adjusted EBITDA | $ | 279 | $ | 280 | $ | (1 | ) | (0.4 | )% | |||||
Owned and leased hotels Adjusted EBITDA. Adjusted EBITDA at our comparable owned and leased hotels decreased $10 million during both the three and six months ended June 30, 2017, compared to the same periods in 2016, which included $1 million and $2 million net unfavorable currency impact, respectively. For the three months ended June 30, 2017, compared to the three months ended June 30, 2016, the decrease was driven by a decline in group business at our hotels in the Americas due to the shift in the timing of Easter. For the six months ended June 30, 2017, compared to the same period in 2016, the decrease was driven by decreased performance at certain of our international hotels in Europe. Adjusted EBITDA at our non-comparable hotels increased $7 million and $21 million during the three and six months ended June 30, 2017, respectively, compared to the same periods in 2016, primarily driven by the 2016 acquisition, opening and disposition activity previously discussed.
Pro rata share of unconsolidated hospitality ventures Adjusted EBITDA. Our pro rata share of Adjusted EBITDA from our unconsolidated hospitality ventures included an insignificant net favorable currency impact in both the three and six months ended June 30, 2017, compared to the same periods in 2016. Year-over-year decreases were primarily driven by the Playa business combination in the first quarter of 2017 and the acquisition of our
38
partners' share of Andaz Maui at Wailea Resort, partially offset by improved performance at an unconsolidated hospitality venture in India.
Americas management and franchising segment revenues.
Three Months Ended June 30, | ||||||||||||||
2017 | 2016 | Better / (Worse) | ||||||||||||
Segment revenues | ||||||||||||||
Management, franchise and other fees | $ | 109 | $ | 100 | $ | 9 | 9.2 | % | ||||||
Other revenues from managed properties | 431 | 436 | (5 | ) | (1.0 | )% | ||||||||
Total segment revenues | $ | 540 | $ | 536 | $ | 4 | 0.9 | % | ||||||
Six Months Ended June 30, | ||||||||||||||
2017 | 2016 | Better / (Worse) | ||||||||||||
Segment revenues | ||||||||||||||
Management, franchise and other fees | $ | 213 | $ | 191 | $ | 22 | 11.5 | % | ||||||
Other revenues from managed properties | 859 | 857 | 2 | 0.3 | % | |||||||||
Total segment revenues | $ | 1,072 | $ | 1,048 | $ | 24 | 2.4 | % | ||||||
Americas management and franchising revenues included an insignificant net unfavorable currency impact in both the three and six months ended June 30, 2017, compared to the same periods in 2016. The increases in management, franchise and other fees during the three and six months ended June 30, 2017, compared to the three and six months ended June 30, 2016, were primarily driven by a $5 million and $9 million increase in other fees, respectively. For the three months ended June 30, 2017, the increase in other fee revenues was driven by a management agreement termination fee related to a hotel conversion to franchised. For the six months ended June 30, 2017, the increase in other fees also included a franchise agreement termination fee related to a hotel that left the chain. Management fees increased $2 million and $7 million, respectively, driven by new hotels and improved performance at existing full service hotels. Franchise fees increased $2 million and $6 million, respectively, primarily driven by improved performance at our all inclusive properties and new select service hotels.
Other revenues from managed properties decreased during the three months ended June 30, 2017 and increased during the six months ended June 30, 2017, compared to the same periods in the prior year. The decrease during the three months ended June 30, 2017, compared to the same period in 2016, was driven by decreased reimbursements related to our loyalty program as a result of increased redemptions in the prior period due to a program modification in 2016. During the six months ended June 30, 2017, the increase was primarily driven by increased reimbursements related to our loyalty program, partially offset by decreased full service payroll related to hotel conversions and a hotel that left the chain.
Three Months Ended June 30, | ||||||||||||||||||||||||||||||||||||
RevPAR | Occupancy | ADR | ||||||||||||||||||||||||||||||||||
(Comparable Systemwide Hotels) | 2017 | 2016 | Better / (Worse) | Better / (Worse) Constant $ | 2017 | 2016 | Change in Occ % pts | 2017 | 2016 | Better / (Worse) | Better / (Worse) Constant $ | |||||||||||||||||||||||||
Americas Full Service | $ | 165 | $ | 163 | 1.4 | % | 1.6 | % | 80.1 | % | 79.9 | % | 0.2 | % | $ | 206 | $ | 204 | 1.2 | % | 1.4 | % | ||||||||||||||
Americas Select Service | $ | 115 | $ | 113 | 1.8 | % | 1.8 | % | 82.3 | % | 81.6 | % | 0.7 | % | $ | 139 | $ | 138 | 1.0 | % | 1.0 | % | ||||||||||||||
Six Months Ended June 30, | ||||||||||||||||||||||||||||||||||||
RevPAR | Occupancy | ADR | ||||||||||||||||||||||||||||||||||
(Comparable Systemwide Hotels) | 2017 | 2016 | Better / (Worse) | Better / (Worse) Constant $ | 2017 | 2016 | Change in Occ % pts | 2017 | 2016 | Better / (Worse) | Better / (Worse) Constant $ | |||||||||||||||||||||||||
Americas Full Service | $ | 157 | $ | 152 | 3.2 | % | 3.3 | % | 76.1 | % | 75.6 | % | 0.5 | % | $ | 206 | $ | 202 | 2.4 | % | 2.5 | % | ||||||||||||||
Americas Select Service | $ | 108 | $ | 105 | 2.8 | % | 2.8 | % | 78.2 | % | 77.5 | % | 0.7 | % | $ | 138 | $ | 135 | 1.8 | % | 1.8 | % | ||||||||||||||
39
Excluding the net unfavorable currency impact, comparable full service hotels RevPAR increased in the three and six months ended June 30, 2017, compared to the same periods in the prior year. For the three months ended June 30, 2017, the increase was driven by transient demand and ADR growth, partially driven by the timing of the Easter holiday. The increase for the six months ended June 30, 2017 was primarily driven by increased transient ADR as well as group demand and ADR. RevPAR at our select service hotels increased in the three and six months ended June 30, 2017, compared to the same periods in the prior year, driven by ADR growth and increased occupancy.
During the six months ended June 30, 2017, one property that left the chain was removed from the comparable Americas full service systemwide hotels and no properties were removed from the comparable Americas select service systemwide hotels.
Americas management and franchising segment Adjusted EBITDA.
Three Months Ended June 30, | ||||||||||||||
2017 | 2016 | Better / (Worse) | ||||||||||||
Segment Adjusted EBITDA | $ | 97 | $ | 89 | $ | 8 | 9.4 | % | ||||||
Six Months Ended June 30, | ||||||||||||||
2017 | 2016 | Better / (Worse) | ||||||||||||
Segment Adjusted EBITDA | $ | 187 | $ | 165 | $ | 22 | 13.4 | % | ||||||
Adjusted EBITDA increased in the three and six months ended June 30, 2017, both of which included an insignificant net unfavorable currency impact, compared to the three and six months ended June 30, 2016. The increases were driven by the aforementioned increases in management, franchise and other fees.
ASPAC management and franchising segment revenues.
Three Months Ended June 30, | ||||||||||||||
2017 | 2016 | Better / (Worse) | ||||||||||||
Segment revenues | ||||||||||||||
Management, franchise and other fees | $ | 27 | $ | 22 | $ | 5 | 18.7 | % | ||||||
Other revenues from managed properties | 26 | 27 | (1 | ) | (2.6 | )% | ||||||||
Total segment revenues | $ | 53 | $ | 49 | $ | 4 | 7.1 | % | ||||||
Six Months Ended June 30, | ||||||||||||||
2017 | 2016 | Better / (Worse) | ||||||||||||
Segment revenues | ||||||||||||||
Management, franchise and other fees | $ | 52 | $ | 44 | $ | 8 | 17.4 | % | ||||||
Other revenues from managed properties | 52 | 48 | 4 | 7.4 | % | |||||||||
Total segment revenues | $ | 104 | $ | 92 | $ | 12 | 12.2 | % | ||||||
ASPAC management and franchising revenues included a $1 million net unfavorable currency impact in both the three and six months ended June 30, 2017, compared to the three and six months ended June 30, 2016. The increases in management, franchise and other fees were primarily driven by a $3 million and $5 million increase in incentive fees, respectively, due to new hotels in Australia and China and improved performance at certain properties in China and Japan. The increase in other revenues from managed properties for the six months ended June 30, 2017, compared to the same period in 2016, was driven by reimbursements from our managed properties related to increased technology expenses.
40
Three Months Ended June 30, | ||||||||||||||||||||||||||||||||||||
RevPAR | Occupancy | ADR | ||||||||||||||||||||||||||||||||||
(Comparable Systemwide Hotels) | 2017 | 2016 | Better / (Worse) | Better / (Worse) Constant $ | 2017 | 2016 | Change in Occ % pts | 2017 | 2016 | Better / (Worse) | Better (Worse) Constant $ | |||||||||||||||||||||||||
ASPAC Full Service | $ | 143 | $ | 136 | 5.4 | % | 7.2 | % | 72.2 | % | 66.3 | % | 5.9 | % | $ | 198 | $ | 205 | (3.2 | )% | (1.6 | )% | ||||||||||||||
Six Months Ended June 30, | ||||||||||||||||||||||||||||||||||||
RevPAR | Occupancy | ADR | ||||||||||||||||||||||||||||||||||
(Comparable Systemwide Hotels) | 2017 | 2016 | Better / (Worse) | Better / (Worse) Constant $ | 2017 | 2016 | Change in Occ % pts | 2017 | 2016 | Better / (Worse) | Better (Worse) Constant $ | |||||||||||||||||||||||||
ASPAC Full Service | $ | 141 | $ | 134 | 5.2 | % | 6.2 | % | 70.5 | % | 64.9 | % | 5.6 | % | $ | 200 | $ | 207 | (3.1 | )% | (2.2 | )% | ||||||||||||||
Excluding the net unfavorable currency impact, the increases in comparable full service RevPAR during the three and six months ended June 30, 2017, compared to the same periods in 2016, were driven by increased occupancy across the region, partially offset by decreased ADR in China. The three months ended June 30, 2017, compared to the same period in 2016 also included decreased occupancy and ADR in South Korea.
During the three and six months ended June 30, 2017, no properties were removed from the comparable ASPAC full service systemwide hotels.
ASPAC management and franchising segment Adjusted EBITDA.
Three Months Ended June 30, | ||||||||||||||
2017 | 2016 | Better / (Worse) | ||||||||||||
Segment Adjusted EBITDA | $ | 16 | $ | 12 | $ | 4 | 33.0 | % | ||||||
Six Months Ended June 30, | ||||||||||||||
2017 | 2016 | Better / (Worse) | ||||||||||||
Segment Adjusted EBITDA | $ | 31 | $ | 24 | $ | 7 | 30.3 | % | ||||||
Adjusted EBITDA, which included a $1 million net unfavorable currency impact in each of the three and six months ended June 30, 2017 compared to the three and six months ended June 30, 2016, increased primarily due to the aforementioned increases in management, franchise and other fees in both periods.
EAME/SW Asia management and franchising segment revenues.
Three Months Ended June 30, | ||||||||||||||
2017 | 2016 | Better / (Worse) | ||||||||||||
Segment revenues | ||||||||||||||
Management, franchise and other fees | $ | 17 | $ | 16 | $ | 1 | 2.1 | % | ||||||
Other revenues from managed properties | 16 | 17 | (1 | ) | (0.2 | )% | ||||||||
Total segment revenues | $ | 33 | $ | 33 | $ | — | 0.9 | % | ||||||
Six Months Ended June 30, | ||||||||||||||
2017 | 2016 | Better / (Worse) | ||||||||||||
Segment revenues | ||||||||||||||
Management, franchise and other fees | $ | 33 | $ | 32 | $ | 1 | 2.1 | % | ||||||
Other revenues from managed properties | 33 | 32 | 1 | 4.7 | % | |||||||||
Total segment revenues | $ | 66 | $ | 64 | $ | 2 | 3.4 | % | ||||||
41
EAME/SW Asia management and franchising revenues included an insignificant net unfavorable currency impact in both the three and six months ended June 30, 2017, compared to the three and six months ended June 30, 2016. The increases in management, franchise and other fees in both the three and six months ended June 30, 2017, compared to the same periods in the prior year, were driven by increased incentive fees from certain properties in India, Eastern Europe, and Germany, partially offset by decreased performance in Switzerland.
Three Months Ended June 30, | ||||||||||||||||||||||||||||||||||||
RevPAR | Occupancy | ADR | ||||||||||||||||||||||||||||||||||
(Comparable Systemwide Hotels) | 2017 | 2016 | Better / (Worse) | Better / (Worse) Constant $ | 2017 | 2016 | Change in Occ % pts | 2017 | 2016 | Better / (Worse) | Better / (Worse) Constant $ | |||||||||||||||||||||||||
EAME/SW Asia Full Service | $ | 123 | $ | 119 | 3.3 | % | 5.1 | % | 66.0 | % | 62.7 | % | 3.3 | % | $ | 186 | $ | 190 | (1.9 | )% | (0.1 | )% | ||||||||||||||
EAME/SW Asia Select Service | $ | 67 | $ | 58 | 16.9 | % | 17.2 | % | 72.2 | % | 63.5 | % | 8.7 | % | $ | 93 | $ | 91 | 2.8 | % | 3.0 | % | ||||||||||||||
Six Months Ended June 30, | ||||||||||||||||||||||||||||||||||||
RevPAR | Occupancy | ADR | ||||||||||||||||||||||||||||||||||
(Comparable Systemwide Hotels) | 2017 | 2016 | Better / (Worse) | Better / (Worse) Constant $ | 2017 | 2016 | Change in Occ % pts | 2017 | 2016 | Better / (Worse) | Better / (Worse) Constant $ | |||||||||||||||||||||||||
EAME/SW Asia Full Service | $ | 119 | $ | 116 | 2.2 | % | 4.1 | % | 66.1 | % | 62.6 | % | 3.5 | % | $ | 180 | $ | 185 | (3.1 | )% | (1.3 | )% | ||||||||||||||
EAME/SW Asia Select Service | $ | 68 | $ | 61 | 12.1 | % | 12.7 | % | 70.9 | % | 63.2 | % | 7.7 | % | $ | 97 | $ | 97 | — | % | 0.5 | % | ||||||||||||||
Excluding the net unfavorable currency impact, the increases in comparable full service RevPAR during the three and six months ended June 30, 2017, compared to the same periods in 2016, were driven by increased occupancy and ADR in the United Kingdom, Germany and India, and increased occupancy in Dubai. These increases were partially offset by decreased ADR and occupancy in Switzerland.
During the six months ended June 30, 2017, one property was removed from the comparable EAME/SW Asia full service systemwide hotel results as a result of significant renovations and no properties were removed from the comparable EAME/SW Asia select service systemwide hotel results.
EAME/SW Asia management and franchising segment Adjusted EBITDA.
Three Months Ended June 30, | ||||||||||||||
2017 | 2016 | Better / (Worse) | ||||||||||||
Segment Adjusted EBITDA | $ | 9 | $ | 8 | $ | 1 | 3.6 | % | ||||||
Six Months Ended June 30, | ||||||||||||||
2017 | 2016 | Better / (Worse) | ||||||||||||
Segment Adjusted EBITDA | $ | 17 | $ | 16 | $ | 1 | 3.7 | % | ||||||
Adjusted EBITDA, which included an insignificant net unfavorable currency impact in both the three and six months ended June 30, 2017, compared to the three and six months ended June 30, 2016, increased due to the aforementioned increases in management, franchise and other fees in both periods.
Corporate and other.
Three Months Ended June 30, | ||||||||||||||
2017 | 2016 | Better / (Worse) | ||||||||||||
Corporate and other revenues | $ | 33 | $ | 13 | $ | 20 | 172.1 | % | ||||||
Corporate and other Adjusted EBITDA | $ | (29 | ) | $ | (31 | ) | $ | 2 | 2.3 | % | ||||
42
Six Months Ended June 30, | ||||||||||||||
2017 | 2016 | Better / (Worse) | ||||||||||||
Corporate and other revenues | $ | 59 | $ | 22 | $ | 37 | 173.2 | % | ||||||
Corporate and other Adjusted EBITDA | $ | (58 | ) | $ | (64 | ) | $ | 6 | 8.6 | % | ||||
Corporate and other revenues increased in the three and six months ended June 30, 2017, compared to the three and six months ended June 30, 2016, primarily driven by a $17 million and $33 million increase, respectively, in owned and leased hotels revenues on our condensed consolidated statements of income from the acquisition of Miraval and higher revenue from our co-branded credit card program as a result of increased point sales and our new agreement that was effective during the three months ended June 30, 2017.
Adjusted EBITDA increased for the three and six months ended June 30, 2017, compared to the same periods in the prior year, primarily driven by the aforementioned acquisition of Miraval and increased revenues related to our co-branded credit card program, partially offset by increased selling, general, and administrative expenses primarily related to master brand marketing spend to support the launch of the World of Hyatt platform.
Non-GAAP Measures
Adjusted Earnings Before Interest Expense, Taxes, Depreciation and Amortization ("Adjusted EBITDA") and EBITDA
We use the terms Adjusted EBITDA and EBITDA throughout this quarterly report. Adjusted EBITDA and EBITDA, as we define them, are non-GAAP measures. We define consolidated Adjusted EBITDA as net income attributable to Hyatt Hotels Corporation plus our pro rata share of unconsolidated hospitality ventures Adjusted EBITDA based on our ownership percentage of each venture, adjusted to exclude the following items:
• | interest expense; |
• | provision for income taxes; |
• | depreciation and amortization; |
• | equity earnings (losses) from unconsolidated hospitality ventures; |
• | stock-based compensation expense; |
• | gains (losses) on sales of real estate; and |
• | other income (loss), net. |
We calculate consolidated Adjusted EBITDA by adding the Adjusted EBITDA of each of our reportable segments and eliminations to corporate and other Adjusted EBITDA.
Our board of directors and executive management team focus on Adjusted EBITDA as a key performance and compensation measure both on a segment and on a consolidated basis. Adjusted EBITDA assists us in comparing our performance over various reporting periods on a consistent basis because it removes from our operating results the impact of items that do not reflect our core operations both on a segment and on a consolidated basis. Our President and Chief Executive Officer, who is our chief operating decision maker, also evaluates the performance of each of our reportable segments and determines how to allocate resources to those segments, in significant part, by assessing the Adjusted EBITDA of each segment. In addition, the compensation committee of our board of directors determines the annual variable compensation for certain members of our management based in part on consolidated Adjusted EBITDA, segment Adjusted EBITDA or some combination of both.
We believe Adjusted EBITDA is useful to investors because it provides investors the same information that we use internally for purposes of assessing our operating performance and making compensation decisions.
Adjusted EBITDA and EBITDA are not substitutes for net income attributable to Hyatt Hotels Corporation, net income or any other measure prescribed by GAAP. There are limitations to using non-GAAP measures such as Adjusted EBITDA and EBITDA. Although we believe that Adjusted EBITDA can make an evaluation of our operating performance more consistent because it removes items that do not reflect our core operations, other companies in our industry may define Adjusted EBITDA differently than we do. As a result, it may be difficult to use Adjusted EBITDA or similarly named non-GAAP measures that other companies may use to compare the performance of those companies to our performance. Because of these limitations, Adjusted EBITDA should not be considered as a measure of the income generated by our business. Our management compensates for these limitations by reference to our GAAP results and using Adjusted EBITDA supplementally. See our condensed consolidated statements of income in our condensed consolidated financial statements included elsewhere in this quarterly report.
43
See below for a reconciliation of net income attributable to Hyatt Hotels Corporation to EBITDA and a reconciliation of EBITDA to consolidated Adjusted EBITDA.
Adjusted selling, general, and administrative expenses
Adjusted selling, general, and administrative expenses, as we define it, is a non-GAAP measure. Adjusted selling, general, and administrative expenses excludes the impact of expenses related to benefit programs funded through rabbi trusts and stock-based compensation expense. Adjusted selling, general, and administrative expenses assist us in comparing our performance over various reporting periods on a consistent basis since it removes from our operating results the impact of items that do not reflect our core operations, both on a segment and consolidated basis. See "—Results of Operations" for a reconciliation of selling, general, and administrative expenses to Adjusted selling, general, and administrative expenses.
Constant dollar currency
We report the results of our operations both on an as reported basis, as well as on a constant dollar basis. Constant dollar currency, which is a non-GAAP measure, excludes the effects of movements in foreign currency exchange rates between comparative periods. We believe constant dollar analysis provides valuable information regarding our results as it removes currency fluctuations from our operating results. We calculate constant dollar currency by restating prior-period local currency financial results at the current period’s exchange rates. These adjusted amounts are then compared to our current period reported amounts to provide operationally driven variances in our results.
The charts below illustrate Adjusted EBITDA by segment for the three and six months ended June 30, 2017 and June 30, 2016:
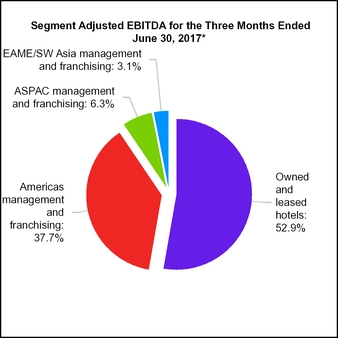
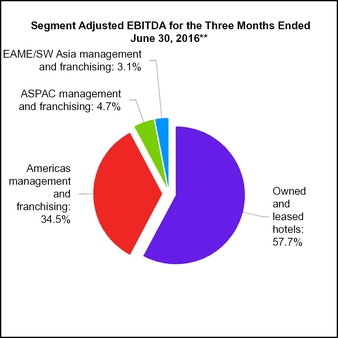
*Consolidated Adjusted EBITDA for the three months ended June 30, 2017 included corporate and other Adjusted EBITDA of $(29) million.
**Consolidated Adjusted EBITDA for the three months ended June 30, 2016 included corporate and other Adjusted EBITDA of $(31) million.
44
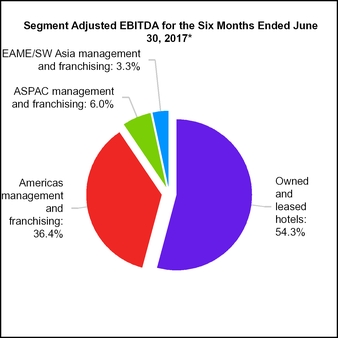
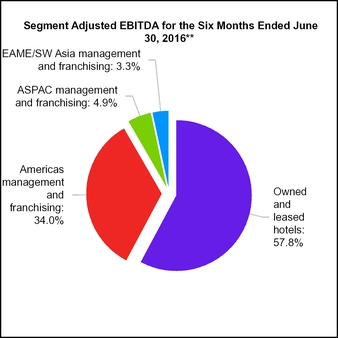
*Consolidated Adjusted EBITDA for the six months ended June 30, 2017 included eliminations of $1 million and corporate and other Adjusted EBITDA of $(58) million.
**Consolidated Adjusted EBITDA for the six months ended June 30, 2016 included corporate and other Adjusted EBITDA of $(64) million.
45
The table below provides a reconciliation of our net income attributable to Hyatt Hotels Corporation to EBITDA and a reconciliation of EBITDA to consolidated Adjusted EBITDA for the three and six months ended June 30, 2017 and June 30, 2016:
Three Months Ended June 30, | ||||||||||||||
2017 | 2016 | Change | ||||||||||||
Net income attributable to Hyatt Hotels Corporation | $ | 87 | $ | 67 | $ | 20 | 30.5 | % | ||||||
Interest expense | 20 | 20 | — | (1.1 | )% | |||||||||
Provision for income taxes | 45 | 21 | 24 | 106.2 | % | |||||||||
Depreciation and amortization | 91 | 86 | 5 | 6.2 | % | |||||||||
EBITDA | 243 | 194 | 49 | 25.0 | % | |||||||||
Equity (earnings) losses from unconsolidated hospitality ventures | (1 | ) | (19 | ) | 18 | 92.7 | % | |||||||
Stock-based compensation expense | 5 | 4 | 1 | 43.3 | % | |||||||||
(Gains) losses on sales of real estate | (34 | ) | 21 | (55 | ) | (260.0 | )% | |||||||
Other (income) loss, net | (2 | ) | (1 | ) | (1 | ) | (793.6 | )% | ||||||
Pro rata share of unconsolidated hospitality ventures Adjusted EBITDA | 18 | 28 | (10 | ) | (34.8 | )% | ||||||||
Adjusted EBITDA | $ | 229 | $ | 227 | $ | 2 | 0.6 | % | ||||||
Six Months Ended June 30, | ||||||||||||||
2017 | 2016 | Change | ||||||||||||
Net income attributable to Hyatt Hotels Corporation | $ | 157 | $ | 101 | $ | 56 | 55.8 | % | ||||||
Interest expense | 41 | 37 | 4 | 9.4 | % | |||||||||
Provision for income taxes | 86 | 37 | 49 | 128.3 | % | |||||||||
Depreciation and amortization | 182 | 167 | 15 | 9.3 | % | |||||||||
EBITDA | 466 | 342 | 124 | 36.1 | % | |||||||||
Equity (earnings) losses from unconsolidated hospitality ventures | 2 | (21 | ) | 23 | 106.9 | % | ||||||||
Stock-based compensation expense | 21 | 20 | 1 | 5.4 | % | |||||||||
(Gains) losses on sales of real estate | (34 | ) | 21 | (55 | ) | (260.5 | )% | |||||||
Other (income) loss, net | (42 | ) | 3 | (45 | ) | NM | ||||||||
Pro rata share of unconsolidated hospitality ventures Adjusted EBITDA | 44 | 56 | (12 | ) | (21.5 | )% | ||||||||
Adjusted EBITDA | $ | 457 | $ | 421 | $ | 36 | 8.5 | % | ||||||
Liquidity and Capital Resources
Overview
We finance our business primarily with existing cash, short-term investments, and cash generated from our operations. As part of our business strategy, we also recycle capital by using net proceeds from dispositions to support our acquisitions and new investment opportunities. When appropriate, we borrow cash under our revolving credit facility or from other third-party sources, and may also raise funds by issuing debt or equity securities as necessary. We maintain a cash investment policy that emphasizes preservation of capital. At June 30, 2017 and December 31, 2016, we had cash and cash equivalents and short-term investments of $451 million and $538 million, respectively. We believe that our cash position, short-term investments, and cash from operations, together with borrowing capacity under our revolving credit facility and our access to the capital markets, will be adequate to meet all of our funding requirements and capital deployment objectives for the foreseeable future.
We may, from time to time, seek to retire or purchase additional amounts of our outstanding equity and/or debt securities through cash purchases and/or exchanges for other securities, in open market purchases, privately
46
negotiated transactions or otherwise, including pursuant to a Rule 10b5-1 plan. Such repurchases or exchanges, if any, will depend on prevailing market conditions, our liquidity requirements, contractual restrictions, and other factors. The amounts involved may be material.
Recent Transactions Affecting our Liquidity and Capital Resources
During the six months ended June 30, 2017 and June 30, 2016, several transactions impacted our liquidity. See "—Sources and Uses of Cash."
Sources and Uses of Cash
Six Months Ended June 30, | |||||||
2017 | 2016 | ||||||
Cash provided by (used in): | |||||||
Operating activities | $ | 319 | $ | 239 | |||
Investing activities | (182 | ) | (23 | ) | |||
Financing activities | (221 | ) | (47 | ) | |||
Effect of exchange rate changes on cash | 2 | 16 | |||||
Net (decrease) increase in cash and cash equivalents | $ | (82 | ) | $ | 185 | ||
Cash Flows from Operating Activities
Cash provided by operating activities increased $80 million for the six months ended June 30, 2017, compared to the six months ended June 30, 2016, primarily due to $94 million of interest income received upon the redemption of our Playa preferred shares.
Cash Flows from Investing Activities
During the six months ended June 30, 2017:
• | We acquired Miraval for approximately $237 million. |
• | We invested $133 million in capital expenditures (see "—Capital Expenditures"). |
• | We invested $23 million in unconsolidated hospitality ventures. |
• | We sold Hyatt Regency Grand Cypress for approximately $202 million of net cash proceeds, which was recorded as restricted cash. |
• | We received distributions of $196 million related to the redemption of our Playa preferred shares. |
• | We sold Hyatt Regency Louisville for approximately $65 million of net cash proceeds, which was recorded as restricted cash. |
• | We sold land and construction in progress to an unconsolidated hospitality venture, in which we have a 50%, ownership interest for approximately $29 million. |
During the six months ended June 30, 2016:
• | We acquired Thompson Miami Beach for approximately $238 million. |
• | We invested $85 million in capital expenditures (see "—Capital Expenditures"). |
• | We invested $17 million in unconsolidated hospitality ventures. |
• | We sold Andaz 5th Avenue for approximately $240 million of net cash proceeds. |
• | We received distributions of $52 million from unconsolidated hospitality ventures. |
• | We released $29 million from restricted cash related to the finalization from the Canada Revenue Agency in connection with the 2014 disposition of Park Hyatt Toronto. |
Cash Flows from Financing Activities
During the six months ended June 30, 2017, we repurchased 5,480,636 shares of common stock at a weighted-average price of $52.48 per share for an aggregate purchase price of $288 million. Included in the repurchases are 4,596,822 shares repurchased under the 2017 ASR at a price of $52.21 per share for an
47
aggregate purchase price of $240 million. At June 30, 2017, the remaining $60 million of shares under the 2017 ASR had not yet settled. Subsequent to June 30, 2017, 500,000 Class A shares were delivered under partial settlement of the 2017 ASR. During the six months ended June 30, 2016, we repurchased 2,948,990 shares of common stock at a weighted-average price of $44.47 per share for an aggregate purchase price of $131 million.
During the six months ended June 30, 2017, we drew $420 million and subsequently repaid $290 million on our revolving credit facility. During the six months ended June 30, 2016, we drew and subsequently repaid $110 million on our revolving credit facility.
During the six months ended June 30, 2016, we issued our 2026 Notes and received net proceeds of $396 million, after deducting discounts and offering expenses of approximately $4 million, and we repaid the senior secured term loan of $64 million related to Hyatt Regency Lost Pines Resort and Spa. During the three months ended June 30, 2016, all of our outstanding 2016 Notes were redeemed for $250 million.
During the six months ended June 30, 2017, the Miraval Venture issued $9 million of redeemable noncontrolling interest in preferred shares of a subsidiary in connection with our acquisition of Miraval.
We define net debt as total debt less the total of cash and cash equivalents and short-term investments. We consider net debt and its components to be an important indicator of liquidity and a guiding measure of capital structure strategy. Net debt is a non-GAAP measure and may not be computed the same as similarly titled measures used by other companies. The following table provides a summary of our debt to capital ratios:
June 30, 2017 | December 31, 2016 | ||||||
Consolidated debt (1) | $ | 1,687 | $ | 1,564 | |||
Stockholders’ equity | 3,837 | 3,903 | |||||
Total capital | 5,524 | 5,467 | |||||
Total debt to total capital | 30.5 | % | 28.6 | % | |||
Consolidated debt (1) | 1,687 | 1,564 | |||||
Less: Cash and cash equivalents and short-term investments | 451 | 538 | |||||
Net consolidated debt | $ | 1,236 | $ | 1,026 | |||
Net debt to total capital | 22.4 | % | 18.8 | % | |||
(1) | Excludes approximately $565 million and $745 million of our share of unconsolidated hospitality venture indebtedness at June 30, 2017 and December 31, 2016, respectively, substantially all of which is non-recourse to us and a portion of which we guarantee pursuant to separate agreements. The decrease from December 31, 2016 is primarily attributable to Playa, which is no longer an unconsolidated hospitality venture as discussed in Part I, Item 1 "Financial Statements—Note 4 to the Condensed Consolidated Financial Statements." |
Capital Expenditures
We routinely make capital expenditures to enhance our business. We classify our capital expenditures into maintenance, enhancements to existing properties, and investment in new properties under development or recently opened. We have been and will continue to be prudent with respect to our capital spending, taking into account our cash flow from operations.
The following is a summary of our capital expenditures:
June 30, 2017 | June 30, 2016 | ||||||
Maintenance | $ | 39 | $ | 26 | |||
Enhancements to existing properties | 63 | 24 | |||||
Investment in new properties under development or recently opened | 31 | 35 | |||||
Total capital expenditures | $ | 133 | $ | 85 | |||
The increase in enhancements to existing properties is driven by increased renovation activity at an international owned full service property and expenditures related to our new corporate office.
48
Senior Notes
The table below sets forth the outstanding principal balance of our Senior Notes at June 30, 2017. Interest on the Senior Notes is payable semi-annually.
Description | Principal Amount | ||
2019 Notes | $ | 196 | |
2021 Notes | 250 | ||
2023 Notes | 350 | ||
2026 Notes | 400 | ||
Total | $ | 1,196 | |
We are in compliance with all applicable covenants under the indenture governing our Senior Notes at June 30, 2017.
Revolving Credit Facility
There was an outstanding balance on our revolving credit facility of $230 million and $100 million at June 30, 2017 and December 31, 2016, respectively. At June 30, 2017, we had available borrowing capacity of approximately $1.3 billion under our revolving credit facility, net of outstanding undrawn letters of credit.
We are in compliance with all applicable covenants under the revolving credit facility at June 30, 2017.
Letters of Credit
We issue letters of credit either under the revolving credit facility or directly with financial institutions. We had $239 million and $230 million in letters of credit issued directly with financial institutions outstanding at June 30, 2017 and December 31, 2016, respectively. These letters of credit had weighted-average fees of 98 basis points and a range of maturity of up to approximately four years at June 30, 2017.
Critical Accounting Policies and Estimates
The preparation of financial statements in accordance with GAAP requires management to make estimates and assumptions that affect reported amounts and related disclosures. We have discussed those estimates that we believe are critical and require the use of complex judgment in their application in our 2016 Form 10-K. Since the date of our 2016 Form 10-K, there have been no material changes to our critical accounting policies or the methodologies or assumptions we apply under them.
49
Item 3. Quantitative and Qualitative Disclosures About Market Risk.
We are exposed to market risk primarily from changes in interest rates and foreign currency exchange rates. In certain situations, we seek to reduce earnings and cash flow volatility associated with changes in interest rates and foreign currency exchange rates by entering into financial arrangements to provide a hedge against a portion of the risks associated with such volatility. We continue to have exposure to such risks to the extent they are not hedged. We enter into derivative financial arrangements to the extent they meet the objectives described above, and we do not use derivatives for trading or speculative purposes. At June 30, 2017, we were a party to hedging transactions, including the use of derivative financial instruments, as discussed below.
Interest Rate Risk
In the normal course of business, we are exposed to the impact of interest rate changes due to our borrowing activities. Our objective is to manage the risk of interest rate changes on the results of operations, cash flows, and the market value of our debt by creating an appropriate balance between our fixed and floating-rate debt. We enter into interest rate derivative transactions from time to time, including interest rate swaps, in order to maintain a level of exposure to interest rate variability that we deem acceptable. At June 30, 2017 and December 31, 2016, we did not hold any interest rate swap contracts.
The following table sets forth the contractual maturities and the total fair values at June 30, 2017 for our financial instruments materially affected by interest rate risk:
Maturities by Period | |||||||||||||||||||||||||||||||
2017 | 2018 | 2019 | 2020 | 2021 | Thereafter | Total Carrying Amount (1) | Total Fair Value | ||||||||||||||||||||||||
Fixed-rate debt | $ | 4 | $ | 4 | $ | 200 | $ | 5 | $ | 255 | $ | 918 | $ | 1,386 | $ | 1,473 | |||||||||||||||
Average interest rate (2) | 4.89 | % | |||||||||||||||||||||||||||||
Floating-rate debt (3) | $ | 233 | $ | 5 | $ | 5 | $ | 5 | $ | 5 | $ | 49 | $ | 302 | $ | 321 | |||||||||||||||
Average interest rate (2) | 3.58 | % | |||||||||||||||||||||||||||||
(1) Excludes capital lease obligations of $14 million and unamortized discounts and deferred financing fees of $15 million.
(2) Average interest rate as of June 30, 2017.
(3) Includes Grand Hyatt Rio de Janeiro construction loan which had a 7.93% interest rate at June 30, 2017.
Foreign Currency Exposures and Exchange Rate Instruments
We transact business in various foreign currencies and utilize foreign currency forward contracts to offset our exposure associated with the fluctuations of certain foreign currencies. The U.S. dollar equivalents of the notional amounts of the outstanding forward contracts, the majority of which relate to intercompany transactions, with terms of less than one year, were $189 million and $204 million at June 30, 2017 and December 31, 2016, respectively.
We intend to offset the gains and losses related to our third-party debt, debt repayment guarantees, and intercompany transactions with gains or losses on our foreign currency forward contracts such that there is a negligible effect on net income. Our exposure to market risk has not materially changed from what we previously disclosed in our 2016 Form 10-K.
For the three and six months ended June 30, 2017, the effect of these derivative instruments within other income (loss), net on our condensed consolidated statements of income were losses of $3 million and $8 million, respectively. For the three and six months ended June 30, 2016, the effect of these derivative instruments within other income (loss), net was a gain of $13 million.
50
Item 4. Controls and Procedures.
Disclosure Controls and Procedures. We maintain a set of disclosure controls and procedures designed to ensure that information required to be disclosed by the Company in reports that it files or submits under the Securities Exchange Act of 1934, as amended (the "Exchange Act"), is recorded, processed, summarized and reported within the time periods specified in SEC rules and forms. In accordance with Rule 13a-15(b) of the Exchange Act, as of the end of the period covered by this quarterly report, an evaluation was carried out under the supervision and with the participation of our management, including our Principal Executive Officer and Principal Financial Officer, of the effectiveness of our disclosure controls and procedures. Based on that evaluation, our Principal Executive Officer and Principal Financial Officer concluded that our disclosure controls and procedures, as of the end of the period covered by this quarterly report, were effective to provide reasonable assurance that information required to be disclosed by the Company in reports that it files or submits under the Exchange Act is recorded, processed, summarized and reported within the time periods specified in SEC rules and forms and is accumulated and communicated to our management, including the Principal Executive Officer and Principal Financial Officer, as appropriate to allow timely decisions regarding required disclosure.
Changes in Internal Control Over Financial Reporting. There has been no change in our internal control over financial reporting during our most recent fiscal quarter that has materially affected, or is reasonably likely to materially affect, our internal control over financial reporting.
51
PART II. OTHER INFORMATION
Item 1. Legal Proceedings.
We are involved in various claims and lawsuits arising in the normal course of business, including proceedings involving tort and other general liability claims, workers' compensation and other employee claims, intellectual property claims and claims related to our management of certain hotel properties. Most occurrences involving liability, claims of negligence and employees are covered by insurance with solvent insurance carriers. We recognize a liability when we believe the loss is probable and reasonably estimable. We currently believe that the ultimate outcome of such lawsuits and proceedings will not, individually or in the aggregate, have a material effect on our consolidated financial position, results of operations or liquidity.
Item 1A. Risk Factors.
At June 30, 2017, there have been no material changes from the risk factors previously disclosed in response to Item 1A. to Part I of our Annual Report on Form 10-K for the fiscal year ended December 31, 2016.
Item 2. Unregistered Sales of Equity Securities and Use of Proceeds.
Issuer Purchases of Equity Securities
The following table sets forth information regarding our purchases of shares of Class A common stock during the quarter ended June 30, 2017:
Total number of shares purchased | Weighted average price paid per share | Total number of shares purchased as part of publicly announced plans | Maximum number (or approximate dollar value) of shares that may yet be purchased under the program (1) | |||||||||||
April 1 to April 30, 2017 | — | $ | — | — | $ | 9,119,281 | ||||||||
May 1 to May 31, 2017 | — | $ | — | — | $ | 509,119,281 | ||||||||
June 1 to June 30, 2017 | — | $ | — | — | $ | 509,119,281 | ||||||||
Total | — | $ | — | — | ||||||||||
(1) | On each of December 13, 2016 and May 4, 2017, we announced approvals of expansions of our share repurchase program pursuant to which we are authorized to purchase up to an additional $250 million and $500 million, respectively, of Class A and Class B common stock in the open market, in privately negotiated transactions, or otherwise, including pursuant to a Rule 10b5-1 plan. The repurchase program does not have an expiration date. At June 30, 2017, we had approximately $509 million remaining under our current share repurchase authorization. During the first quarter, we entered into the 2017 ASR to repurchase $300 million of our Class A common stock. At June 30, 2017, there are $60 million of shares that had not yet settled. See Part I, Item 1 "Financial Statements—Note 12 to the Condensed Consolidated Financial Statements" for further details regarding the 2017 share repurchase plan. |
52
Item 3. Defaults Upon Senior Securities.
None.
Item 4. Mine Safety Disclosures.
Not Applicable.
Item 5. Other Information.
None.
53
Item 6. Exhibits.
Exhibit Number | Exhibit Description |
3.1 | Amended and Restated Certificate of Incorporation of Hyatt Hotels Corporation |
3.2 | Amended and Restated Bylaws of Hyatt Hotels Corporation (incorporated by reference to Exhibit 3.2 to the Company's Current Report on Form 8-K (File No. 001-34521) filed with the Securities and Exchange Commission on September 11, 2014) |
31.1 | Certification of the Chief Executive Officer pursuant to Rules 13a-14(a) and 15d-14(a) of the Securities Exchange Act of 1934, as amended, as adopted pursuant to Section 302 of the Sarbanes-Oxley Act of 2002 |
31.2 | Certification of the Chief Financial Officer pursuant to Rules 13a-14(a) and 15d-14(a) of the Securities Exchange Act of 1934, as amended, as adopted pursuant to Section 302 of the Sarbanes-Oxley Act of 2002 |
32.1 | Certification of the Chief Executive Officer pursuant to 18 U.S.C. Section 1350, as adopted pursuant to Section 906 of the Sarbanes-Oxley Act of 2002 |
32.2 | Certification of the Chief Financial Officer pursuant to 18 U.S.C. Section 1350, as adopted pursuant to Section 906 of the Sarbanes-Oxley Act of 2002 |
101.INS | XBRL Instance Document |
101.SCH | XBRL Taxonomy Extension Schema Document |
101.CAL | XBRL Taxonomy Extension Calculation Linkbase Document |
101.DEF | XBRL Taxonomy Extension Definition Linkbase Document |
101.LAB | XBRL Taxonomy Extension Label Linkbase Document |
101.PRE | XBRL Taxonomy Extension Presentation Linkbase Document |
54
SIGNATURES
Pursuant to the requirements of the Securities Exchange Act of 1934, the registrant has duly caused this report to be signed on its behalf by the undersigned thereunto duly authorized.
Hyatt Hotels Corporation | |||
Date: | August 3, 2017 | By: | /s/ Mark S. Hoplamazian |
Mark S. Hoplamazian | |||
President and Chief Executive Officer | |||
(Principal Executive Officer) | |||
Pursuant to the requirements of the Securities Exchange Act of 1934, this report has been signed by the undersigned, in his capacity as the principal financial officer of the registrant.
Hyatt Hotels Corporation | |||
Date: | August 3, 2017 | By: | /s/ Patrick J. Grismer |
Patrick J. Grismer | |||
Executive Vice President, Chief Financial Officer | |||
(Principal Financial Officer) | |||
55