Attached files
| file | filename |
|---|---|
| EX-32.2 - SECTION 906 CERTIFICATION - Hyatt Hotels Corp | exhibit322-93016.htm |
| EX-32.1 - SECTION 906 CERTIFICATION - Hyatt Hotels Corp | exhibit321-93016.htm |
| EX-3.1 - AMENDED AND RESTATED CERTIFICATE OF INCORPORATION OF HYATT HOTELS CORPORATION - Hyatt Hotels Corp | exhibit31-93016.htm |
| EX-31.2 - SECTION 302 CERTIFICATION - Hyatt Hotels Corp | exhibit312-93016.htm |
| EX-31.1 - SECTION 302 CERTIFICATION - Hyatt Hotels Corp | exhibit311-93016.htm |
| EX-10.1 - AMENDED AND RESTATED SUMMARY OF NON-EMPLOYEE DIRECTOR COMPENSATION - Hyatt Hotels Corp | exhibit101-93016.htm |
| EX-3.3 - CERTIFICATE OF RETIREMENT - Hyatt Hotels Corp | exhibit33-93016.htm |
UNITED STATES
SECURITIES AND EXCHANGE COMMISSION
Washington, DC 20549
Form 10-Q
(Mark One)
x | QUARTERLY REPORT PURSUANT TO SECTION 13 OR 15(d) OF THE SECURITIES EXCHANGE ACT OF 1934 |
For the quarterly period ended September 30, 2016
OR
¨ | TRANSITION REPORT PURSUANT TO SECTION 13 OR 15(d) OF THE SECURITIES EXCHANGE ACT OF 1934 |
For the transition period from to
Commission File No. 001-34521
HYATT HOTELS CORPORATION
(Exact Name of Registrant as Specified in Its Charter)
Delaware | 20-1480589 | |
(State or Other Jurisdiction of Incorporation or Organization) | (I.R.S. Employer Identification No.) | |
71 South Wacker Drive 12th Floor, Chicago, Illinois | 60606 | |
(Address of Principal Executive Offices) | (Zip Code) | |
(312) 750-1234
(Registrant’s Telephone Number, Including Area Code)
Indicate by check mark whether the registrant: (1) has filed all reports required to be filed by Section 13 or 15(d) of the Securities Exchange Act of 1934 during the preceding 12 months (or for such shorter period that the registrant was required to file such reports), and (2) has been subject to such filing requirements for the past 90 days. Yes x No ¨
Indicate by check mark whether the registrant has submitted electronically and posted on its corporate Web site, if any, every Interactive Data File required to be submitted and posted pursuant to Rule 405 of Regulation S-T (§ 232.405 of this chapter) during the preceding 12 months (or for such shorter period that the registrant was required to submit and post such files). Yes x No ¨
Indicate by check mark whether the registrant is a large accelerated filer, an accelerated filer, a non-accelerated filer, or a smaller reporting company. See the definitions of "large accelerated filer," "accelerated filer" and "smaller reporting company" in Rule 12b-2 of the Exchange Act. (Check One):
Large accelerated filer | x | Accelerated filer | ¨ | ||
Non-accelerated filer | ¨ | Smaller reporting company | ¨ | ||
Indicate by check mark whether the registrant is a shell company (as defined in Rule 12b-2 of the Exchange Act). Yes ¨ No x
As of October 28, 2016, there were 23,611,575 shares of the registrant’s Class A common stock, $0.01 par value, outstanding and 107,247,326 shares of the registrant’s Class B common stock, $0.01 par value, outstanding.
HYATT HOTELS CORPORATION
QUARTERLY REPORT ON FORM 10-Q
FOR THE PERIOD ENDED SEPTEMBER 30, 2016
TABLE OF CONTENTS
PART I – FINANCIAL INFORMATION | ||
Item 1. | ||
Item 2. | ||
Item 3. | ||
Item 4. | ||
PART II – OTHER INFORMATION | ||
Item 1. | ||
Item 1A. | ||
Item 2. | ||
Item 3. | ||
Item 4. | ||
Item 5. | ||
Item 6. | ||
PART I. FINANCIAL INFORMATION
Item 1. Financial Statements.
HYATT HOTELS CORPORATION AND SUBSIDIARIES
CONDENSED CONSOLIDATED STATEMENTS OF INCOME
(In millions of dollars, except per share amounts)
(Unaudited)
Three Months Ended | Nine Months Ended | ||||||||||||||
September 30, 2016 | September 30, 2015 | September 30, 2016 | September 30, 2015 | ||||||||||||
REVENUES: | |||||||||||||||
Owned and leased hotels | $ | 519 | $ | 500 | $ | 1,594 | $ | 1,549 | |||||||
Management and franchise fees | 110 | 103 | 332 | 320 | |||||||||||
Other revenues | 11 | 10 | 31 | 26 | |||||||||||
Other revenues from managed properties | 448 | 440 | 1,385 | 1,324 | |||||||||||
Total revenues | 1,088 | 1,053 | 3,342 | 3,219 | |||||||||||
DIRECT AND SELLING, GENERAL, AND ADMINISTRATIVE EXPENSES: | |||||||||||||||
Owned and leased hotels | 402 | 385 | 1,204 | 1,160 | |||||||||||
Depreciation and amortization | 87 | 78 | 254 | 233 | |||||||||||
Other direct costs | 8 | 8 | 23 | 20 | |||||||||||
Selling, general, and administrative | 74 | 54 | 237 | 221 | |||||||||||
Other costs from managed properties | 448 | 440 | 1,385 | 1,324 | |||||||||||
Direct and selling, general, and administrative expenses | 1,019 | 965 | 3,103 | 2,958 | |||||||||||
Net gains (losses) and interest income from marketable securities held to fund operating programs | 12 | (15 | ) | 20 | (6 | ) | |||||||||
Equity earnings (losses) from unconsolidated hospitality ventures | 25 | (17 | ) | 46 | (46 | ) | |||||||||
Interest expense | (20 | ) | (17 | ) | (57 | ) | (51 | ) | |||||||
Asset impairments | — | (5 | ) | — | (5 | ) | |||||||||
Gains (losses) on sales of real estate | — | — | (21 | ) | 9 | ||||||||||
Other income (loss), net | 4 | 11 | 1 | (3 | ) | ||||||||||
INCOME BEFORE INCOME TAXES | 90 | 45 | 228 | 159 | |||||||||||
PROVISION FOR INCOME TAXES | (28 | ) | (20 | ) | (65 | ) | (72 | ) | |||||||
NET INCOME | 62 | 25 | 163 | 87 | |||||||||||
NET INCOME ATTRIBUTABLE TO NONCONTROLLING INTERESTS | — | — | — | — | |||||||||||
NET INCOME ATTRIBUTABLE TO HYATT HOTELS CORPORATION | $ | 62 | $ | 25 | $ | 163 | $ | 87 | |||||||
EARNINGS PER SHARE—Basic | |||||||||||||||
Net income | $ | 0.48 | $ | 0.18 | $ | 1.22 | $ | 0.60 | |||||||
Net income attributable to Hyatt Hotels Corporation | $ | 0.48 | $ | 0.18 | $ | 1.22 | $ | 0.60 | |||||||
EARNINGS PER SHARE—Diluted | |||||||||||||||
Net income | $ | 0.47 | $ | 0.18 | $ | 1.21 | $ | 0.60 | |||||||
Net income attributable to Hyatt Hotels Corporation | $ | 0.47 | $ | 0.18 | $ | 1.21 | $ | 0.60 | |||||||
See accompanying Notes to condensed consolidated financial statements.
1
HYATT HOTELS CORPORATION AND SUBSIDIARIES
CONDENSED CONSOLIDATED STATEMENTS OF COMPREHENSIVE INCOME
(In millions of dollars)
(Unaudited)
Three Months Ended | Nine Months Ended | ||||||||||||||
September 30, 2016 | September 30, 2015 | September 30, 2016 | September 30, 2015 | ||||||||||||
Net income | $ | 62 | $ | 25 | $ | 163 | $ | 87 | |||||||
Other comprehensive income (loss), net of taxes: | |||||||||||||||
Foreign currency translation adjustments, net of tax (benefit) expense of $- for the three and nine months ended September 30, 2016 and $- and $(2) for the three and nine months ended September 30, 2015, respectively | (12 | ) | (35 | ) | 3 | (82 | ) | ||||||||
Unrealized gains (losses) on available-for-sale securities, net of tax (benefit) expense of $(5) and $- for the three and nine months ended September 30, 2016, respectively, and $6 and $10 for the three and nine months ended September 30, 2015, respectively | (8 | ) | 9 | — | 15 | ||||||||||
Unrealized gains on derivative activity, net of tax expense of $- for the three and nine months ended September 30, 2016 and $- for the three and nine months ended September 30, 2015 | — | 1 | — | 1 | |||||||||||
Other comprehensive income (loss) | (20 | ) | (25 | ) | 3 | (66 | ) | ||||||||
COMPREHENSIVE INCOME | 42 | — | 166 | 21 | |||||||||||
COMPREHENSIVE INCOME ATTRIBUTABLE TO NONCONTROLLING INTERESTS | — | — | — | — | |||||||||||
COMPREHENSIVE INCOME ATTRIBUTABLE TO HYATT HOTELS CORPORATION | $ | 42 | $ | — | $ | 166 | $ | 21 | |||||||
See accompanying Notes to condensed consolidated financial statements.
2
HYATT HOTELS CORPORATION AND SUBSIDIARIES
CONDENSED CONSOLIDATED BALANCE SHEETS
(In millions of dollars, except share and per share amounts)
(Unaudited)
September 30, 2016 | December 31, 2015 | ||||||
ASSETS | |||||||
CURRENT ASSETS: | |||||||
Cash and cash equivalents | $ | 544 | $ | 457 | |||
Restricted cash | 66 | 96 | |||||
Short-term investments | 46 | 46 | |||||
Receivables, net of allowances of $17 and $15 at September 30, 2016 and December 31, 2015, respectively | 318 | 298 | |||||
Inventories | 16 | 12 | |||||
Prepaids and other assets | 180 | 152 | |||||
Prepaid income taxes | 49 | 63 | |||||
Total current assets | 1,219 | 1,124 | |||||
Investments | 306 | 327 | |||||
Property and equipment, net | 3,971 | 4,031 | |||||
Financing receivables, net of allowances | 21 | 20 | |||||
Goodwill | 127 | 129 | |||||
Intangibles, net | 591 | 547 | |||||
Deferred tax assets | 318 | 301 | |||||
Other assets | 1,094 | 1,112 | |||||
TOTAL ASSETS | $ | 7,647 | $ | 7,591 | |||
LIABILITIES AND EQUITY | |||||||
CURRENT LIABILITIES: | |||||||
Current maturities of long-term debt | $ | 19 | $ | 328 | |||
Accounts payable | 127 | 141 | |||||
Accrued expenses and other current liabilities | 565 | 516 | |||||
Accrued compensation and benefits | 121 | 122 | |||||
Total current liabilities | 832 | 1,107 | |||||
Long-term debt | 1,447 | 1,042 | |||||
Other long-term liabilities | 1,451 | 1,447 | |||||
Total liabilities | 3,730 | 3,596 | |||||
Commitments and contingencies (see Note 11) | |||||||
EQUITY: | |||||||
Preferred stock, $0.01 par value per share, 10,000,000 shares authorized and none outstanding as of September 30, 2016 and December 31, 2015 | — | — | |||||
Class A common stock, $0.01 par value per share, 1,000,000,000 shares authorized, 23,592,340 issued and outstanding at September 30, 2016, and Class B common stock, $0.01 par value per share, 439,741,738 shares authorized, 107,247,326 shares issued and outstanding at September 30, 2016. Class A common stock, $0.01 par value per share, 1,000,000,000 shares authorized, 26,604,687 issued and outstanding at December 31, 2015, and Class B common stock, $0.01 par value per share, 441,623,374 shares authorized, 109,628,962 shares issued and outstanding at December 31, 2015 | 1 | 1 | |||||
Additional paid-in capital | 1,687 | 1,931 | |||||
Retained earnings | 2,452 | 2,289 | |||||
Accumulated other comprehensive loss | (227 | ) | (230 | ) | |||
Total stockholders’ equity | 3,913 | 3,991 | |||||
Noncontrolling interests in consolidated subsidiaries | 4 | 4 | |||||
Total equity | 3,917 | 3,995 | |||||
TOTAL LIABILITIES AND EQUITY | $ | 7,647 | $ | 7,591 | |||
See accompanying Notes to condensed consolidated financial statements.
3
HYATT HOTELS CORPORATION AND SUBSIDIARIES
CONDENSED CONSOLIDATED STATEMENTS OF CASH FLOWS
(In millions of dollars)
(Unaudited)
Nine Months Ended | |||||||
September 30, 2016 | September 30, 2015 | ||||||
CASH FLOWS FROM OPERATING ACTIVITIES: | |||||||
Net income | $ | 163 | $ | 87 | |||
Adjustments to reconcile net income to net cash provided by operating activities: | |||||||
Depreciation and amortization | 254 | 233 | |||||
Deferred income taxes | (16 | ) | (43 | ) | |||
Equity (earnings) losses from unconsolidated hospitality ventures and distributions received | (21 | ) | 70 | ||||
(Gains) losses on sales of real estate | 21 | (9 | ) | ||||
Working capital changes and other | (50 | ) | 58 | ||||
Net cash provided by operating activities | 351 | 396 | |||||
CASH FLOWS FROM INVESTING ACTIVITIES: | |||||||
Purchases of marketable securities and short-term investments | (365 | ) | (450 | ) | |||
Proceeds from marketable securities and short-term investments | 373 | 422 | |||||
Contributions to investments | (31 | ) | (29 | ) | |||
Return of investments | 78 | 4 | |||||
Acquisitions, net of cash acquired | (331 | ) | — | ||||
Capital expenditures | (140 | ) | (185 | ) | |||
Proceeds from sales of real estate, net of cash disposed | 289 | 86 | |||||
Sales proceeds transferred from escrow to cash and cash equivalents | 29 | 143 | |||||
Proceeds from financing receivables | 1 | 28 | |||||
(Increase) decrease in restricted cash | (1 | ) | 19 | ||||
Other investing activities | 4 | (14 | ) | ||||
Net cash (used in) provided by investing activities | (94 | ) | 24 | ||||
CASH FLOWS FROM FINANCING ACTIVITIES: | |||||||
Proceeds from long-term debt, net of issuance costs of $4 and $- as of September 30, 2016 and September 30, 2015, respectively | 520 | 12 | |||||
Repayments of long-term debt | (435 | ) | (5 | ) | |||
Repurchase of common stock | (268 | ) | (539 | ) | |||
Other financing activities | (2 | ) | (2 | ) | |||
Net cash used in financing activities | (185 | ) | (534 | ) | |||
EFFECT OF EXCHANGE RATE CHANGES ON CASH | 15 | (2 | ) | ||||
NET INCREASE (DECREASE) IN CASH AND CASH EQUIVALENTS | 87 | (116 | ) | ||||
CASH AND CASH EQUIVALENTS—BEGINNING OF YEAR | 457 | 685 | |||||
CASH AND CASH EQUIVALENTS—END OF PERIOD | $ | 544 | $ | 569 | |||
SUPPLEMENTAL DISCLOSURE OF CASH FLOW INFORMATION: | |||||||
Cash paid during the period for interest | $ | 73 | $ | 66 | |||
Cash paid during the period for income taxes | $ | 74 | $ | 121 | |||
Non-cash investing and financing activities are as follows: | |||||||
Non-cash management and franchise agreement intangibles | $ | 38 | $ | — | |||
Change in accrued capital expenditures | $ | 5 | $ | (1 | ) | ||
See accompanying Notes to condensed consolidated financial statements.
4
HYATT HOTELS CORPORATION AND SUBSIDIARIES
NOTES TO CONDENSED CONSOLIDATED FINANCIAL STATEMENTS
(amounts in millions of dollars, unless otherwise indicated)
(Unaudited)
1. ORGANIZATION
Hyatt Hotels Corporation, a Delaware corporation, and its consolidated subsidiaries (collectively "Hyatt Hotels Corporation") provide hospitality services on a worldwide basis through the development, ownership, operation, management, franchising and licensing of hospitality related businesses. We develop, own, operate, manage, franchise, license or provide services to a portfolio of properties consisting of full service hotels, select service hotels, resorts and other properties, including timeshare, fractional and other forms of residential or vacation properties. As of September 30, 2016, (i) we operated or franchised 307 full service hotels, comprising 120,528 rooms throughout the world, (ii) we operated or franchised 332 select service hotels, comprising 46,203 rooms, of which 307 hotels are located in the United States, and (iii) our portfolio of properties included 6 franchised all inclusive Hyatt-branded resorts, comprising 2,401 rooms. As of September 30, 2016, our portfolio of properties operated in 54 countries around the world.
As used in these Notes and throughout this Quarterly Report on Form 10-Q, (i) the terms "Company," "we," "us," or "our" mean Hyatt Hotels Corporation and its consolidated subsidiaries and (ii) the term "portfolio of properties" refers to hotels and other properties or residential ownership units that we develop, own, operate, manage, franchise, license or provide services to, including under our Park Hyatt, Grand Hyatt, Hyatt Regency, Hyatt, Andaz, Hyatt Centric, The Unbound Collection by Hyatt, Hyatt Place, Hyatt House, Hyatt Ziva, Hyatt Zilara and Hyatt Residence Club brands.
The accompanying unaudited condensed consolidated financial statements have been prepared in accordance with accounting principles generally accepted in the United States of America ("GAAP") for interim financial information, the instructions to Form 10-Q and Article 10 of Regulation S-X. Accordingly, they do not include all information or footnotes required by GAAP for complete annual financial statements. As a result, this Quarterly Report on Form 10-Q should be read in conjunction with the Consolidated Financial Statements and accompanying Notes in our Annual Report on Form 10-K for the fiscal year ended December 31, 2015 (the "2015 Form 10-K").
We have eliminated all intercompany accounts and transactions in our condensed consolidated financial statements. We consolidate entities under our control, including entities where we are deemed to be the primary beneficiary.
Management believes the accompanying condensed consolidated financial statements reflect all adjustments, which are all of a normal recurring nature, considered necessary for a fair presentation of the interim periods.
2. RECENTLY ISSUED ACCOUNTING STANDARDS
Adopted Accounting Standards—In April 2015, the Financial Accounting Standards Board ("FASB") released Accounting Standards Update No. 2015-03 ("ASU 2015-03"), Interest - Imputation of Interest (Subtopic 835-30): Simplifying the Presentation of Debt Issuance Costs. ASU 2015-03 requires debt issuance costs related to a recognized debt liability be presented in the balance sheet as a direct deduction from the carrying amount of the debt liability, consistent with debt discounts. The provisions of ASU 2015-03 are effective for interim periods and fiscal years beginning after December 15, 2015. We adopted the standard on January 1, 2016, and as a result we reclassified $5 million of debt issuance costs previously included in other assets to long-term debt on our condensed consolidated balance sheets as of December 31, 2015.
Future Adoption of Accounting Standards—In May 2014, the FASB released Accounting Standards Update No. 2014-09 ("ASU 2014-09"), Revenue from Contracts with Customers (Topic 606). ASU 2014-09 supersedes the revenue recognition requirements in Topic 605, Revenue Recognition, and provides a single, comprehensive revenue recognition model for contracts with customers. In August 2015, the FASB released Accounting Standards Update No. 2015-14 ("ASU 2015-14"), Revenue from Contracts with Customers (Topic 606): Deferral of the Effective Date. ASU 2015-14 delays the effective date of ASU 2014-09 by one year, making it effective for interim periods and fiscal years beginning after December 15, 2017, with early adoption permitted as of the original effective date under ASU 2014-09. We are currently evaluating the impact of adopting ASU 2014-09.
5
In January 2016, the FASB released Accounting Standards Update No. 2016-01 ("ASU 2016-01"), Financial Instruments - Overall (Subtopic 825-10): Recognition and Measurement of Financial Assets and Financial Liabilities. ASU 2016-01 revises the accounting for equity investments and financial liabilities under the fair value option and the presentation and disclosure requirements for financial instruments. The provisions of ASU 2016-01 are effective for interim periods and fiscal years beginning after December 15, 2017. We are currently evaluating the impact of adopting ASU 2016-01.
In February 2016, the FASB released Accounting Standards Update No. 2016-02 ("ASU 2016-02"), Leases (Topic 842). ASU 2016-02 requires lessees to record lease contracts on the balance sheet by recognizing a right-of-use asset and lease liability. The provisions of ASU 2016-02 are effective for interim periods and fiscal years beginning after December 15, 2018, with early adoption permitted. We are currently evaluating the impact of adopting ASU 2016-02.
In June 2016, the FASB released Accounting Standards Update No. 2016-13 ("ASU 2016-13"), Financial Instruments - Credit Losses (Topic 326): Measurement of Credit Losses on Financial Instruments. ASU 2016-13 replaces the existing impairment model for most financial assets from an incurred loss impairment model to a current expected credit loss model, which requires an entity to recognize an impairment allowance equal to its current estimate of all contractual cash flows the entity does not expect to collect. ASU 2016-13 also requires credit losses relating to available-for-sale ("AFS") debt securities to be recorded through an allowance for credit losses. The provisions of ASU 2016-13 are effective for interim periods and fiscal years beginning after December 15, 2019, with early adoption permitted. We are currently evaluating the impact of adopting ASU 2016-13.
3. EQUITY AND COST METHOD INVESTMENTS
We have investments recorded under both the equity and cost methods. These investments are an integral part of our business and are strategically and operationally important to our overall results. Our equity and cost method investment balances recorded at September 30, 2016 and December 31, 2015 were as follows:
September 30, 2016 | December 31, 2015 | ||||||
Equity method investments | $ | 299 | $ | 304 | |||
Cost method investments | 7 | 23 | |||||
Total investments | $ | 306 | $ | 327 | |||
During the three months ended September 30, 2016, two unconsolidated hospitality ventures in which we hold or held an ownership interest and which are classified as equity method investments within our owned and leased hotels segment, each sold a Hyatt Place hotel, for which we received combined proceeds of $7 million. We recorded gains of $5 million in equity earnings (losses) from unconsolidated hospitality ventures on our condensed consolidated statements of income.
During the three months ended September 30, 2015, we sold an entity which held an interest in one of our foreign currency denominated equity method investments within our owned and leased hotels segment, for which we received proceeds of $3 million. In connection with the sale, we released $21 million of accumulated foreign currency translation losses, which were recorded to equity earnings (losses) from unconsolidated hospitality ventures on our condensed consolidated statements of income.
During the three and nine months ended September 30, 2016, we recorded $0 and $2 million of net losses from our cost method investments, respectively. Gains or losses from cost method investments are recorded within other income (loss), net on our condensed consolidated statements of income.
During the three and nine months ended September 30, 2016, we recorded $2 million and $4 million of impairment charges, respectively, in equity earnings (losses) from unconsolidated hospitality ventures on our condensed consolidated statements of income.
6
The following table presents summarized financial information for all unconsolidated hospitality ventures in which we hold an investment accounted for under the equity method:
Three Months Ended September 30, | Nine Months Ended September 30, | ||||||||||||||
2016 | 2015 | 2016 | 2015 | ||||||||||||
Total revenues | $ | 326 | $ | 280 | $ | 952 | $ | 825 | |||||||
Gross operating profit | 110 | 88 | 312 | 236 | |||||||||||
Income from continuing operations | 40 | 42 | 118 | 26 | |||||||||||
Net income | 40 | 42 | 118 | 26 | |||||||||||
4. MARKETABLE SECURITIES
We hold marketable securities to fund certain operating programs and for investment purposes. We periodically transfer cash and cash equivalents to time deposits, highly liquid and transparent commercial paper, corporate notes and bonds, and U.S. government obligations and obligations of other government agencies for investment purposes.
Marketable Securities Held to Fund Operating Programs—At September 30, 2016 and December 31, 2015, our total marketable securities held to fund operating programs, which are recorded at fair value and included on the condensed consolidated balance sheets, were as follows:
September 30, 2016 | December 31, 2015 | ||||||
Marketable securities held by Hyatt Gold Passport Fund | $ | 401 | $ | 384 | |||
Marketable securities held to fund deferred compensation plans held in rabbi trusts (Note 9) | 353 | 333 | |||||
Marketable securities held to fund our captive insurance companies | 65 | 82 | |||||
Total marketable securities held to fund operating programs | 819 | 799 | |||||
Less current portion of marketable securities held to fund operating programs included in cash and cash equivalents, short-term investments, and prepaids and other assets | (158 | ) | (121 | ) | |||
Marketable securities held to fund operating programs included in other assets | $ | 661 | $ | 678 | |||
Net gains (losses) and interest income from marketable securities held to fund operating programs on the condensed consolidated statements of income included realized and unrealized gains and losses and interest income related to the following:
Three Months Ended September 30, | Nine Months Ended September 30, | ||||||||||||||
2016 | 2015 | 2016 | 2015 | ||||||||||||
Hyatt Gold Passport Fund | $ | — | $ | — | $ | 3 | $ | 1 | |||||||
Deferred compensation plans held in rabbi trusts | 12 | (15 | ) | 17 | (7 | ) | |||||||||
Total net gains (losses) and interest income from marketable securities held to fund operating programs | $ | 12 | $ | (15 | ) | $ | 20 | $ | (6 | ) | |||||
Our captive insurance companies hold marketable securities which are classified as AFS and are invested in U.S. government agencies, time deposits and corporate debt securities. We classify these investments as current or long-term, based on their contractual maturity dates, which range from 2016 through 2021. During the three and nine months ended September 30, 2016, we recorded an insignificant unrealized loss and $1 million of unrealized gains, respectively, related to these AFS securities on the condensed consolidated balance sheets through other comprehensive income (loss).
7
Marketable Securities Held for Investment Purposes—At September 30, 2016 and December 31, 2015, our total marketable securities held for investment purposes, which are recorded at fair value and included on the condensed consolidated balance sheets, were as follows:
September 30, 2016 | December 31, 2015 | ||||||
Interest bearing money market funds | $ | 62 | $ | 5 | |||
Time deposits | 30 | 30 | |||||
Preferred shares | 334 | 335 | |||||
Total marketable securities held for investment purposes | $ | 426 | $ | 370 | |||
Less current portion of marketable securities held for investment purposes included in cash and cash equivalents and short-term investments | (92 | ) | (35 | ) | |||
Marketable securities held for investment purposes included in other assets | $ | 334 | $ | 335 | |||
Fair Value—As of September 30, 2016 and December 31, 2015, we measured the following financial assets at fair value on a recurring basis:
September 30, 2016 | Cash and Cash Equivalents | Short-term Investments | Prepaids and Other Assets | Other Assets | |||||||||||||||
Level One - Quoted Prices in Active Markets for Identical Assets | |||||||||||||||||||
Interest bearing money market funds | $ | 69 | $ | 69 | $ | — | $ | — | $ | — | |||||||||
Mutual funds | 353 | — | — | — | 353 | ||||||||||||||
Level Two - Significant Other Observable Inputs | |||||||||||||||||||
Time deposits | 43 | — | 32 | — | 11 | ||||||||||||||
U.S. government obligations | 140 | — | — | 48 | 92 | ||||||||||||||
U.S. government agencies | 61 | — | 13 | 12 | 36 | ||||||||||||||
Corporate debt securities | 185 | — | 1 | 54 | 130 | ||||||||||||||
Mortgage-backed securities | 26 | — | — | 9 | 17 | ||||||||||||||
Asset-backed securities | 31 | — | — | 11 | 20 | ||||||||||||||
Municipal and provincial notes and bonds | 3 | — | — | 1 | 2 | ||||||||||||||
Level Three - Significant Unobservable Inputs | |||||||||||||||||||
Preferred shares | 334 | — | — | — | 334 | ||||||||||||||
Total | $ | 1,245 | $ | 69 | $ | 46 | $ | 135 | $ | 995 | |||||||||
8
December 31, 2015 | Cash and Cash Equivalents | Short-term Investments | Prepaids and Other Assets | Other Assets | |||||||||||||||
Level One - Quoted Prices in Active Markets for Identical Assets | |||||||||||||||||||
Interest bearing money market funds | $ | 18 | $ | 18 | $ | — | $ | — | $ | — | |||||||||
Mutual funds | 333 | — | — | — | 333 | ||||||||||||||
Level Two - Significant Other Observable Inputs | |||||||||||||||||||
Time deposits | 45 | — | 38 | — | 7 | ||||||||||||||
U.S. government obligations | 131 | — | — | 32 | 99 | ||||||||||||||
U.S. government agencies | 83 | — | 6 | 10 | 67 | ||||||||||||||
Corporate debt securities | 168 | — | 2 | 36 | 130 | ||||||||||||||
Mortgage-backed securities | 26 | — | — | 6 | 20 | ||||||||||||||
Asset-backed securities | 27 | — | — | 7 | 20 | ||||||||||||||
Municipal and provincial notes and bonds | 3 | — | — | 1 | 2 | ||||||||||||||
Level Three - Significant Unobservable Inputs | |||||||||||||||||||
Preferred shares | 335 | — | — | — | 335 | ||||||||||||||
Total | $ | 1,169 | $ | 18 | $ | 46 | $ | 92 | $ | 1,013 | |||||||||
During the three and nine months ended September 30, 2016 and September 30, 2015, there were no transfers between levels of the fair value hierarchy. Our policy is to recognize transfers in and transfers out as of the end of each quarterly reporting period. We currently do not have non-financial assets or non-financial liabilities required to be measured at fair value on a recurring basis.
We invest a portion of our cash into short-term interest bearing money market funds that have a maturity of less than ninety days. Consequently, the balances are recorded in cash and cash equivalents. The funds are held with open-ended registered investment companies, and the fair value of the funds is classified as Level One as we are able to obtain market available pricing information on an ongoing basis. The fair value of our mutual funds is classified as Level One as they trade with sufficient frequency and volume to enable us to obtain pricing information on an ongoing basis. Time deposits are recorded at par value, which approximates fair value and are classified as Level Two. The remaining securities, other than our investment in preferred shares, are classified as Level Two due to the use and weighting of multiple market inputs being considered in the final price of the security. Market inputs include quoted market prices from active markets for identical securities, quoted market prices for identical securities in inactive markets, and quoted market prices in active and inactive markets for similar securities.
9
Preferred shares—During the year ended December 31, 2013, we invested $271 million in Playa Hotels & Resorts B.V. ("Playa") for redeemable, convertible preferred shares. We have the option to convert our preferred shares and any accrued and unpaid paid in kind ("PIK") dividends thereon into shares of common stock at any time through the later of the second anniversary of the closing of our investment or an initial public offering by Playa ("Playa IPO"). The preferred investment is redeemable at our option in August 2021. In the event of a Playa IPO or other equity issuance by Playa, we have the option to request that Playa redeem up to $125 million of preferred shares at par plus any accrued and unpaid PIK dividends thereon. As a result, we have classified the preferred investment as an AFS debt security, which is re-measured quarterly at fair value on the condensed consolidated balance sheets through other comprehensive income (loss). The fair value of the preferred shares was:
2016 | 2015 | ||||||
Fair value at January 1 | $ | 335 | $ | 280 | |||
Gross unrealized gains | 19 | 10 | |||||
Gross unrealized losses | (7 | ) | — | ||||
Fair value at June 30 | $ | 347 | $ | 290 | |||
Gross unrealized gains | — | 15 | |||||
Gross unrealized losses | (13 | ) | — | ||||
Fair value at September 30 | $ | 334 | $ | 305 | |||
On September 27, 2016, Playa publicly filed a Registration Statement on Form S-1 with the U.S. Securities and Exchange Commission ("SEC"), in conjunction with its proposed initial public offering ("IPO") of common shares. In connection with the potential Playa IPO, we have committed to convert up to $50 million of our preferred shares at par plus any accrued and unpaid PIK dividends thereon at a conversion price equal to the lower of $8.40 per share or the IPO price. The remaining preferred shares and any accrued and unpaid PIK dividends thereon are expected to be redeemed by Playa with IPO proceeds. The conversion and redemption are expected to close simultaneously with the Playa IPO. There is no assurance that Playa will complete its proposed IPO. In a transaction separate from their IPO, Playa redeemed 3,458,530 of our preferred shares plus accrued and unpaid PIK dividends thereon for $41 million in October 2016.
Due to the lack of availability of market data, the preferred shares are classified as Level Three. Historically, we estimated the fair value of the Playa preferred shares using an option-pricing model. As a result of the potential Playa IPO, we revised our valuation approach at September 30, 2016 and utilized a hybrid of the option-pricing model and the probability-weighted expected return method, to estimate the fair value of our preferred shares. The hybrid model includes various scenarios, such as the successful completion of the Playa IPO and assumptions around conversion and redemption, as well as scenarios where we continue to use the option-pricing model. We assigned a probability to each scenario to arrive at our estimated fair value as of September 30, 2016. Our scenarios include assumptions regarding (i) a potential range of IPO prices and size of the offering, (ii) conversion of up to $50 million of our preferred shares into common shares of Playa and (iii) the redemption of 3,458,530 shares, which closed in October 2016. These option-pricing model scenarios include assumptions regarding the expected term, risk-free interest rate over the expected term, volatility, dividend yield and enterprise value. Financial forecasts were used in the computation of the enterprise value using the income approach, based on assumed revenue growth rates and operating margin levels. The risks associated with achieving these forecasts were assessed in selecting the appropriate weighted-average cost of capital.
The option-pricing scenarios include variations of the expected term, risk-free interest rate, volatility, and dividend yield assumptions as follows:
September 30, 2016 | December 31, 2015 | ||||
Expected term | 0.50 to 1.25 years | 0.75 years | |||
Risk-free Interest Rate | 0.45% to 0.64% | 0.57 | % | ||
Volatility | 47.6% to 47.9% | 46.0 | % | ||
Dividend Yield | 12.0 | % | 12.0 | % | |
There is inherent uncertainty in our assumptions and fluctuations in these assumptions or the probabilities assigned to each scenario may result in different estimates of fair value. At September 30, 2016, the assumption which most significantly impacted the fair value of the preferred shares is the assignment of probabilities to each
10
potential scenario. A change to the assigned probabilities may cause the fair value to decrease up to $15 million and increase up to $60 million, representing the difference between the low and high end of the range of fair values based on each scenario.
Held-to-Maturity Debt Securities—At September 30, 2016 and December 31, 2015, we had investments in held-to-maturity ("HTM") debt securities of $25 million, which are investments in third-party entities that own certain of our hotels. The amortized cost of our investments approximates fair value. The securities are mandatorily redeemable between 2020 and 2025.
5. FINANCING RECEIVABLES
Our financing receivables at September 30, 2016 and December 31, 2015 were as follows:
September 30, 2016 | December 31, 2015 | ||||||
Unsecured financing to hotel owners | $ | 127 | $ | 120 | |||
Less allowance for losses | (106 | ) | (98 | ) | |||
Less current portion included in receivables, net | — | (2 | ) | ||||
Total long-term financing receivables, net | $ | 21 | $ | 20 | |||
During the three months ended September 30, 2015, all of our outstanding secured financing receivables to hotel owners were settled. We received net cash proceeds of $26 million, an unsecured financing receivable of $6 million, and preferred equity investments of $7 million. The settlements of the secured financing receivables resulted in a net recovery of $8 million, which was recognized in other income (loss), net on our condensed consolidated statements of income during the three months ended September 30, 2015.
Allowance for Losses and Impairments—For the three and nine months ended September 30, 2016 and September 30, 2015, the activity in our financing receivables allowance was as follows:
Secured Financing | Unsecured Financing | Total | |||||||||
Allowance at January 1, 2016 | $ | — | $ | 98 | $ | 98 | |||||
Provisions | — | 4 | 4 | ||||||||
Other Adjustments | — | 1 | 1 | ||||||||
Allowance at June 30, 2016 | — | 103 | 103 | ||||||||
Provisions | — | 3 | 3 | ||||||||
Allowance at September 30, 2016 | $ | — | $ | 106 | $ | 106 | |||||
Secured Financing | Unsecured Financing | Total | |||||||||
Allowance at January 1, 2015 | $ | 13 | $ | 87 | $ | 100 | |||||
Provisions | 2 | 4 | 6 | ||||||||
Other Adjustments | — | (1 | ) | (1 | ) | ||||||
Allowance at June 30, 2015 | 15 | 90 | 105 | ||||||||
Provisions | 1 | 1 | 2 | ||||||||
Write-offs | (1 | ) | — | (1 | ) | ||||||
Recoveries | (9 | ) | — | (9 | ) | ||||||
Other Adjustments | (6 | ) | 4 | (2 | ) | ||||||
Allowance at September 30, 2015 | $ | — | $ | 95 | $ | 95 | |||||
11
Credit Monitoring—Our unsecured financing receivables were as follows:
September 30, 2016 | |||||||||||||||
Gross Loan Balance (Principal and Interest) | Allowance | Net Financing Receivables | Gross Receivables on Non-Accrual Status | ||||||||||||
Loans | $ | 14 | $ | — | $ | 14 | $ | — | |||||||
Impaired loans (1) | 63 | (63 | ) | — | 63 | ||||||||||
Total loans | 77 | (63 | ) | 14 | 63 | ||||||||||
Other financing arrangements | 50 | (43 | ) | 7 | 43 | ||||||||||
Total unsecured financing receivables | $ | 127 | $ | (106 | ) | $ | 21 | $ | 106 | ||||||
(1) The unpaid principal balance was $45 million and the average recorded loan balance was $61 million at September 30, 2016.
December 31, 2015 | |||||||||||||||
Gross Loan Balance (Principal and Interest) | Allowance | Net Financing Receivables | Gross Receivables on Non-Accrual Status | ||||||||||||
Loans | $ | 15 | $ | — | $ | 15 | $ | — | |||||||
Impaired loans (2) | 58 | (58 | ) | — | 58 | ||||||||||
Total loans | 73 | (58 | ) | 15 | 58 | ||||||||||
Other financing arrangements | 47 | (40 | ) | 7 | 40 | ||||||||||
Total unsecured financing receivables | $ | 120 | $ | (98 | ) | $ | 22 | $ | 98 | ||||||
Fair Value—We estimated the fair value of financing receivables which are classified as Level Three in the fair value hierarchy to be approximately $22 million at September 30, 2016 and December 31, 2015. During the three and nine months ended September 30, 2016 and September 30, 2015, there were no transfers between levels of the fair value hierarchy.
6. ACQUISITIONS AND DISPOSITIONS
Acquisitions
Royal Palms Resort and Spa—During the three months ended September 30, 2016, we acquired Royal Palms Resort and Spa from an unrelated third party for a net purchase price of approximately $86 million, net of $2 million of proration adjustments. Due to the iconic nature of the hotel, we retained the Royal Palms Resort and Spa name and added the hotel to The Unbound Collection by Hyatt. Of the $88 million purchase price, assets acquired and recorded in our owned and leased hotels segment consist of $75 million of property and equipment, $9 million of indefinite-lived brand intangibles, and $1 million of advanced bookings intangibles. We also recorded $3 million of management agreement intangibles in our Americas management and franchising segment, which are being amortized over a useful life of 20 years. The purchase of Royal Palms Resort and Spa was structured and identified as a replacement property in a potential reverse like-kind exchange agreement.
The Confidante Miami Beach—During the nine months ended September 30, 2016, we acquired Thompson Miami Beach for a purchase price of approximately $238 million, from a seller indirectly owned by a limited partnership affiliated with the brother of our Executive Chairman. Of the $238 million purchase price, assets acquired consist of $228 million of property and equipment, which was recorded in our owned and leased hotels segment, and $10 million of management agreement intangibles, which were recorded in our Americas management and franchising segment and are being amortized over a useful life of 20 years. We rebranded this hotel as The Confidante Miami Beach, and added the hotel to The Unbound Collection by Hyatt. The purchase of
12
The Confidante Miami Beach was structured and identified as a replacement property in a potential reverse like-kind exchange agreement.
Dispositions
Hyatt Regency Birmingham (U.K.)—During the three months ended September 30, 2016, we sold the shares of the company that owns Hyatt Regency Birmingham (U.K.) to an unrelated third party for approximately $49 million, net of closing costs and proration adjustments and entered into a long-term management agreement with the owner of the property. The sale resulted in a $17 million pre-tax gain which has been deferred and is being recognized in management and franchise fees over the term of the management agreement, within our EAME/SW Asia management segment. The operating results and financial position of this hotel prior to the sale remain within our owned and leased hotels segment.
Andaz 5th Avenue—During the nine months ended September 30, 2016, we sold Andaz 5th Avenue to an unrelated third party for $240 million, net of $10 million of closing costs and proration adjustments and entered into a long-term management agreement with the owner of the property. The sale resulted in a $21 million pre-tax loss which was recognized in gains (losses) on sales of real estate on our condensed consolidated statements of income during the nine months ended September 30, 2016. The operating results and financial position of this hotel prior to the sale remain within our owned and leased hotels segment.
Hyatt Regency Indianapolis—During the nine months ended September 30, 2015, we sold Hyatt Regency Indianapolis to an unrelated third party for $69 million, net of closing costs and entered into a long-term franchise agreement with the owner of the property. The sale resulted in a pre-tax gain of $8 million, which was recognized in gains (losses) on sales of real estate on our condensed consolidated statements of income during the nine months ended September 30, 2015. The operating results and financial position of this hotel prior to the sale remain within our owned and leased hotels segment.
Land Held for Development—During the nine months ended September 30, 2015, we sold land and construction in progress for $14 million to an unconsolidated hospitality venture in which we have a 40% ownership interest, for which we received $12 million in cash proceeds as of September 30, 2015.
A Hyatt House Hotel— During the nine months ended September 30, 2015, we sold a select service property to an unrelated third party for $5 million, net of closing costs, resulting in a $1 million pre-tax gain which was recognized in gains (losses) on sales of real estate on our condensed consolidated statements of income during the nine months ended September 30, 2015. The operating results and financial position of this hotel prior to the sale remain within our owned and leased hotels segment.
As a result of certain dispositions, we have agreed to provide customary indemnifications to third-party purchasers for certain liabilities incurred prior to sale and for breach of certain representations and warranties made during the sales process, such as representations of valid title, authority, and environmental issues that may not be limited by a contractual monetary amount. These indemnification agreements survive until the applicable statutes of limitation expire, or until the agreed upon contract terms expire.
Like-Kind Exchange Agreements
Periodically, we enter into like-kind exchange agreements upon the disposition of certain hotels. Pursuant to the terms of these agreements, the proceeds from the sales are placed into an escrow account administered by a qualified intermediary. The proceeds are recorded to restricted cash on our condensed consolidated balance sheets and released once they are utilized as part of a like-kind exchange agreement or when a like-kind exchange agreement is not completed within the allowable time period.
In conjunction with the sale of five Hyatt Place properties during the year ended December 31, 2014, we entered into like-kind exchange agreements with a qualified intermediary. Pursuant to the like-kind exchange agreements, the combined net proceeds of $51 million from the sales of these hotels were placed into an escrow account administered by a qualified intermediary. During the nine months ended September 30, 2015, we released the net proceeds because the identified replacement property was not acquired in order to complete the exchange.
In conjunction with the sale of thirty-eight select service properties during the year ended December 31, 2014, we entered into like-kind exchange agreements with a qualified intermediary for twenty-seven of the select service hotels. In the fourth quarter of 2014, we utilized the net proceeds from twenty-one of the twenty-seven hotels as part of the like-kind exchange agreement to acquire Park Hyatt New York. During the nine months ended
13
September 30, 2015, we released $92 million of net proceeds related to the remaining six hotels from restricted cash, as the intermediary distributed these funds from escrow to complete the reverse like-kind exchange transaction in connection with the acquisition of Hyatt Regency Lost Pines Resort and Spa.
7. INTANGIBLE ASSETS
The following is a summary of intangible assets at September 30, 2016 and December 31, 2015:
September 30, 2016 | Weighted- Average Useful Lives in Years | December 31, 2015 | ||||||||
Management and franchise agreement intangibles | $ | 572 | 25 | $ | 535 | |||||
Lease related intangibles | 121 | 112 | 136 | |||||||
Brand intangibles | 16 | — | 7 | |||||||
Advanced booking intangibles | 10 | 6 | 12 | |||||||
Other | 6 | 14 | 8 | |||||||
725 | 698 | |||||||||
Accumulated amortization | (134 | ) | (151 | ) | ||||||
Intangibles, net | $ | 591 | $ | 547 | ||||||
Amortization expense relating to intangible assets for the three and nine months ended September 30, 2016 and September 30, 2015 was as follows:
Three Months Ended September 30, | Nine Months Ended September 30, | ||||||||||||||
2016 | 2015 | 2016 | 2015 | ||||||||||||
Amortization expense | $ | 7 | $ | 8 | $ | 20 | $ | 23 | |||||||
8. DEBT
Long-term debt, net of current maturities, at September 30, 2016 and December 31, 2015, was $1,447 million and $1,042 million, respectively.
Senior Notes—During the nine months ended September 30, 2016, we issued $400 million of 4.850% senior notes due 2026, at an issue price of 99.920% (the "2026 Notes"). We received net proceeds of $396 million from the sale of the 2026 Notes, after deducting discounts and offering expenses of approximately $4 million. We used a portion of the net proceeds to pay for the redemption of the 2016 Notes (as described below), with the remaining proceeds intended to be used for general corporate purposes. Interest on the 2026 Notes is payable semi-annually on March 15 and September 15 of each year, beginning on September 15, 2016.
The 2026 Notes, together with our $250 million of 3.875% senior notes repaid in 2016 (the "2016 Notes"), $196 million of 6.875% senior notes due 2019 (the "2019 Notes"), $250 million of 5.375% senior notes due 2021 (the "2021 Notes"), and $350 million of 3.375% senior notes due 2023 (the "2023 Notes"), are collectively referred to as the "Senior Notes."
Debt Redemption—During the nine months ended September 30, 2016, we redeemed all of our outstanding 2016 Notes, of which an aggregate principal amount of $250 million was outstanding. The redemption price, which was calculated in accordance with the terms of the 2016 Notes and included principal and accrued interest plus a make-whole premium, was $254 million. The make-whole premium was recorded within other income (loss), net on our condensed consolidated statements of income, see Note 17.
Senior Secured Term Loan—During the nine months ended September 30, 2016, we repaid the senior secured term loan related to Hyatt Regency Lost Pines Resort and Spa of $64 million.
Fair Value—We estimated the fair value of debt, excluding capital leases, which consists of our Senior Notes, bonds and other long-term debt. Our Senior Notes and bonds are classified as Level Two due to the use and weighting of multiple market inputs in the final price of the security. Market inputs include quoted market prices from active markets for identical securities, quoted market prices for identical securities in inactive markets, and quoted market prices in active and inactive markets for similar securities. We estimated the fair value of our other long-term
14
debt instruments using a discounted cash flow analysis based on current market inputs for similar types of arrangements. Based upon the lack of availability of market data, we have classified our other long-term debt as Level Three. The primary sensitivity in these calculations is based on the selection of appropriate discount rates. Fluctuations in these assumptions will result in different estimates of fair value.
At September 30, 2016 and December 31, 2015, we had the following debt balances, excluding capital lease obligations, as described above:
September 30, 2016 | |||||||||||||||||||
Carrying Value | Fair Value | Quoted Prices in Active Markets for Identical Assets (Level One) | Significant Other Observable Inputs (Level Two) | Significant Unobservable Inputs (Level Three) | |||||||||||||||
Debt, excluding capital lease obligations | $ | (1,451 | ) | $ | (1,604 | ) | $ | — | $ | (1,506 | ) | $ | (98 | ) | |||||
December 31, 2015 | |||||||||||||||||||
Carrying Value | Fair Value | Quoted Prices in Active Markets for Identical Assets (Level One) | Significant Other Observable Inputs (Level Two) | Significant Unobservable Inputs (Level Three) | |||||||||||||||
Debt, excluding capital lease obligations | $ | (1,354 | ) | $ | (1,421 | ) | $ | — | $ | (1,277 | ) | $ | (144 | ) | |||||
During the three and nine months ended September 30, 2016 and September 30, 2015, there were no transfers between levels of the fair value hierarchy.
9. LIABILITIES
Other long-term liabilities at September 30, 2016 and December 31, 2015 consisted of the following:
September 30, 2016 | December 31, 2015 | ||||||
Deferred gains on sales of hotel properties | $ | 368 | $ | 367 | |||
Deferred compensation plans | 353 | 333 | |||||
Hyatt Gold Passport Fund | 259 | 280 | |||||
Guarantee liabilities (see Note 11) | 129 | 120 | |||||
Other | 342 | 347 | |||||
Total | $ | 1,451 | $ | 1,447 | |||
Accrued expenses and other current liabilities included $176 million and $166 million of liabilities related to the Hyatt Gold Passport Fund at September 30, 2016 and December 31, 2015, respectively.
10. INCOME TAXES
The effective income tax rates for the three months ended September 30, 2016 and September 30, 2015, were 30.2% and 44.6%, respectively. The effective income tax rates for the nine months ended September 30, 2016 and September 30, 2015, were 28.4% and 45.3%, respectively. Our effective tax rates decreased for the three and nine months ended September 30, 2016 compared to the three and nine months ended September 30, 2015, primarily due to the 2016 tax impact of global transfer pricing changes implemented during the fourth quarter of 2015 and a reversal of uncertain tax positions for certain filing positions in foreign jurisdictions recorded in the third quarter. In addition to the aforementioned items, the 2015 effective tax rates were higher compared to 2016 due to the effect of certain unconsolidated hospitality venture losses that were not fully benefited in 2015.
Unrecognized tax benefits were $100 million and $110 million at September 30, 2016 and December 31, 2015, respectively, of which $13 million and $21 million, respectively, would impact the effective tax rates if recognized.
15
11. COMMITMENTS AND CONTINGENCIES
In the ordinary course of business, we enter into various commitments, guarantees, surety bonds, and letter of credit agreements, which are discussed below:
Commitments—At September 30, 2016, we committed, under certain conditions, to lend or invest up to $366 million, net of any related letters of credit, in various business ventures.
During the three months ended September 30, 2016, we entered into a commitment to fund up to $50 million of preferred equity in a third-party entity which is developing a hotel in Seattle, Washington, for which we also provided a debt repayment guarantee. During the nine months ended September 30, 2016, we also entered into a commitment to purchase land and a to-be-constructed hotel located in Portland, Oregon from the developer upon substantial completion of construction for a purchase price of approximately $160 million.
Performance Guarantees—Certain of our contractual agreements with third-party owners require us to guarantee payments to the owners if specified levels of operating profit are not achieved by their hotels.
Our most significant performance guarantee relates to four managed hotels in France that we began managing in the second quarter of 2013 ("the four managed hotels in France"), which has a term of 7 years, with approximately 3.75 years remaining, and does not have an annual cap. The remaining maximum exposure related to our performance guarantees at September 30, 2016 was $416 million, of which €344 million ($387 million using exchange rates as of September 30, 2016) related to the four managed hotels in France.
We had total net performance guarantee liabilities of $73 million and $97 million at September 30, 2016 and December 31, 2015, which included $59 million and $81 million recorded in other long-term liabilities and $14 million and $16 million in accrued expenses and other current liabilities on our condensed consolidated balance sheets, respectively. Our total performance guarantee liabilities are comprised of the fair value of the guarantee obligation liabilities recorded upon inception, net of amortization and any separate contingent liabilities, net of cash payments. Performance guarantee expense or income and income from amortization of the guarantee obligation liabilities are recorded in other income (loss), net on the condensed consolidated statements of income, see Note 17.
The following table details the total performance guarantee liability:
The Four Managed Hotels in France | Other Performance Guarantees | All Performance Guarantees | ||||||||||||||||||||||
2016 | 2015 | 2016 | 2015 | 2016 | 2015 | |||||||||||||||||||
Beginning balance, January 1 | $ | 93 | $ | 106 | $ | 4 | $ | 5 | $ | 97 | $ | 111 | ||||||||||||
Amortization of initial guarantee obligation liability into income | (17 | ) | (5 | ) | — | — | (17 | ) | (5 | ) | ||||||||||||||
Performance guarantee (income) expense, net | 29 | 15 | (2 | ) | (1 | ) | 27 | 14 | ||||||||||||||||
Net payments during the period | (34 | ) | (22 | ) | — | — | (34 | ) | (22 | ) | ||||||||||||||
Foreign currency exchange, net | 3 | (9 | ) | — | — | 3 | (9 | ) | ||||||||||||||||
Ending balance, June 30 | 74 | 85 | 2 | 4 | 76 | 89 | ||||||||||||||||||
Amortization of initial guarantee obligation liability into income | (8 | ) | (2 | ) | — | (1 | ) | (8 | ) | (3 | ) | |||||||||||||
Performance guarantee (income) expense, net | 13 | (1 | ) | — | (1 | ) | 13 | (2 | ) | |||||||||||||||
Net (payments) receipts during the period | (10 | ) | — | 1 | 1 | (9 | ) | 1 | ||||||||||||||||
Foreign currency exchange, net | 1 | — | — | — | 1 | — | ||||||||||||||||||
Ending balance, September 30 | $ | 70 | $ | 82 | $ | 3 | $ | 3 | $ | 73 | $ | 85 | ||||||||||||
Additionally, we enter into certain management contracts where we have the right, but not an obligation, to make payments to certain hotel owners if their hotels do not achieve specified levels of operating profit. If we choose not to fund the shortfall, the hotel owner has the option to terminate the management contract. At September 30, 2016 and December 31, 2015, there were no amounts recorded on our condensed consolidated balance sheets related to these performance test clauses.
16
Debt Repayment Guarantees—We enter into various debt repayment guarantees primarily related to our unconsolidated hospitality ventures and certain managed hotels. Typically, we enter into debt repayment guarantees in order to assist hotel owners in obtaining third party financing or to obtain more favorable borrowing terms. Included within debt repayment guarantees are the following:
Property Description | Maximum Potential Future Payments | Maximum Exposure Net of Recoverability from Third Parties | Other Long-term Liabilities recorded at September 30, 2016 | Other Long-term Liabilities recorded at December 31, 2015 | Year of Guarantee Expiration | |||||||||||||
Hotel property in Washington (1), (3), (4), (5) | $ | 215 | $ | — | $ | 38 | $ | — | 2020 | |||||||||
Hotel properties in India (2), (3) | 180 | 180 | 23 | 27 | 2020 | |||||||||||||
Hotel property in Brazil (1) | 80 | 40 | 3 | 4 | 2020 | |||||||||||||
Hotel property in Minnesota | 25 | 25 | 2 | 2 | 2021 | |||||||||||||
Hotel property in Arizona (1), (4) | 25 | — | 2 | 3 | 2019 | |||||||||||||
Vacation ownership property (1) | 17 | — | — | — | 2016 | |||||||||||||
Hotel property in Hawaii (1) | 15 | 8 | 2 | 3 | 2017 | |||||||||||||
Hotel property in Colorado | 13 | 13 | — | — | 2016 | |||||||||||||
Other (1) | 17 | 1 | — | — | various, through 2017 | |||||||||||||
Total | $ | 587 | $ | 267 | $ | 70 | $ | 39 | ||||||||||
(1) We have agreements with either our unconsolidated hospitality venture partner, the respective hotel owners or other third parties to recover certain amounts funded under the debt repayment guarantee; the recoverability mechanism may be in the form of cash, notes receivable, or HTM debt securities.
(2) We have the contractual right to recover amounts funded from the unconsolidated hospitality venture, which is a related party. We expect our maximum exposure to be $90 million, taking into account our partner’s 50% ownership interest in the unconsolidated hospitality venture.
(3) Under certain events or conditions, we have the right to force the sale of the property(ies) in order to recover amounts funded.
(4) If certain funding thresholds are met or if certain events occur, we have the ability to assume control of the property.
(5) We are subject to a completion guarantee whereby the parties agree to substantially complete the construction of the project by a specified date. In the event of default, we are obligated to complete construction using the funds available from the outstanding loan. Any additional funds paid by us are subject to recovery through a HTM debt security.
As of September 30, 2016, the hotel owners are current on their debt service obligations.
Insurance—We obtain commercial insurance for potential losses for general liability, workers' compensation, automobile liability, employment practices, crime, property and other miscellaneous coverages. A portion of the risk is retained on a self-insurance basis primarily through U.S. based and licensed captive insurance companies that are wholly owned subsidiaries of Hyatt and generally insure our deductibles and retentions. Reserve requirements are established based on actuarial projections of ultimate losses. Losses estimated to be paid within twelve months are $40 million and $35 million at September 30, 2016 and December 31, 2015, respectively, and are classified within accrued expenses and other current liabilities on our condensed consolidated balance sheets, while losses expected to be payable in future periods are $55 million and $57 million as of September 30, 2016 and December 31, 2015, respectively, and are included in other long-term liabilities on our condensed consolidated balance sheets. At September 30, 2016, standby letters of credit of $7 million were issued to provide collateral for the estimated claims, which are guaranteed by us. For further discussion, see the "—Letters of Credit" section of this footnote.
17
Collective Bargaining Agreements—At September 30, 2016, approximately 26% of our U.S. based employees were covered by various collective bargaining agreements, generally providing for basic pay rates, working hours, other conditions of employment and orderly settlement of labor disputes. Generally, labor relations have been maintained in a normal and satisfactory manner, and we believe our employee relations are good.
Surety Bonds—Surety bonds issued on our behalf were $24 million at September 30, 2016 and primarily relate to workers’ compensation, taxes, licenses and utilities related to our lodging operations.
Letters of Credit—Letters of credit outstanding on our behalf as of September 30, 2016 were $238 million, which relate to our ongoing operations and securitization of our performance under our debt repayment guarantee associated with the hotel properties in India, which is only called upon if we default on our guarantee. The letters of credit outstanding do not reduce the available capacity under our revolving credit facility.
Capital Expenditures—As part of our ongoing business operations, significant expenditures are required to complete renovation projects that were approved.
Other—We act as general partner of various partnerships owning hotel properties subject to mortgage indebtedness. These mortgage agreements generally limit the lender’s recourse to security interests in the assets financed and/or other assets of the partnership(s) and/or the general partner(s) thereof.
In conjunction with financing obtained for our unconsolidated hospitality ventures and certain managed hotels, we may provide standard indemnifications to the lender for loss, liability or damage occurring as a result of our actions or actions of the other hospitality venture owners.
We are subject, from time to time, to various claims and contingencies related to lawsuits, taxes and environmental matters, as well as commitments under contractual obligations. Many of these claims are covered under current insurance programs, subject to deductibles. We recognize a liability associated with commitments and contingencies when a loss is probable and reasonably estimable. Although the ultimate liability for these matters cannot be determined at this point, based on information currently available, we do not expect the ultimate resolution of such claims and litigation will have a material effect on our condensed consolidated financial statements.
18
12. EQUITY
Stockholders’ Equity and Noncontrolling Interests—The following tables detail the equity activity for the nine months ended September 30, 2016 and September 30, 2015, respectively.
Stockholders’ equity | Noncontrolling interests in consolidated subsidiaries | Total equity | |||||||||
Balance at January 1, 2016 | $ | 3,991 | $ | 4 | $ | 3,995 | |||||
Net income | 163 | — | 163 | ||||||||
Other comprehensive income (loss) | 3 | — | 3 | ||||||||
Repurchase of common stock | (268 | ) | — | (268 | ) | ||||||
Directors compensation | 2 | — | 2 | ||||||||
Employee stock plan issuance | 3 | — | 3 | ||||||||
Share-based payment activity | 19 | — | 19 | ||||||||
Balance at September 30, 2016 | $ | 3,913 | $ | 4 | $ | 3,917 | |||||
Stockholders’ equity | Noncontrolling interests in consolidated subsidiaries | Total equity | |||||||||
Balance at January 1, 2015 | $ | 4,627 | $ | 4 | $ | 4,631 | |||||
Net income | 87 | — | 87 | ||||||||
Other comprehensive income (loss) | (66 | ) | — | (66 | ) | ||||||
Repurchase of common stock | (539 | ) | — | (539 | ) | ||||||
Directors compensation | 2 | — | 2 | ||||||||
Employee stock plan issuance | 3 | — | 3 | ||||||||
Share-based payment activity | 16 | — | 16 | ||||||||
Balance at September 30, 2015 | $ | 4,130 | $ | 4 | $ | 4,134 | |||||
Accumulated Other Comprehensive Loss—The following tables detail the accumulated other comprehensive loss activity, net of tax, for the three and nine months ended September 30, 2016 and September 30, 2015, respectively.
Balance at July 1, 2016 | Current period other comprehensive income (loss) before reclassification | Amount reclassified from accumulated other comprehensive loss (a) | Balance at September 30, 2016 | ||||||||||||
Foreign currency translation adjustments | $ | (242 | ) | $ | (15 | ) | $ | 3 | $ | (254 | ) | ||||
Unrealized gains (losses) on AFS securities | 47 | (8 | ) | — | 39 | ||||||||||
Unrecognized pension cost | (7 | ) | — | — | (7 | ) | |||||||||
Unrealized losses on derivative instruments | (5 | ) | — | — | (5 | ) | |||||||||
Accumulated Other Comprehensive Income (Loss) | $ | (207 | ) | $ | (23 | ) | $ | 3 | $ | (227 | ) | ||||
(a) The amount reclassified from accumulated other comprehensive loss related to the sale of the shares of the company that owns Hyatt Regency Birmingham (U.K.) and was recorded within other long-term liabilities on our condensed consolidated balance sheets. | |||||||||||||||
19
Balance at January 1, 2016 | Current period other comprehensive income (loss) before reclassification | Amount reclassified from accumulated other comprehensive loss (a) | Balance at September 30, 2016 | ||||||||||||
Foreign currency translation adjustments | $ | (257 | ) | $ | — | $ | 3 | $ | (254 | ) | |||||
Unrealized gains on AFS securities | 39 | — | — | 39 | |||||||||||
Unrecognized pension cost | (7 | ) | — | — | (7 | ) | |||||||||
Unrealized losses on derivative instruments | (5 | ) | — | — | (5 | ) | |||||||||
Accumulated Other Comprehensive Income (Loss) | $ | (230 | ) | $ | — | $ | 3 | $ | (227 | ) | |||||
(a) The amount reclassified from accumulated other comprehensive loss related to the sale of the shares of the company that owns Hyatt Regency Birmingham (U.K.) and was recorded within other long-term liabilities on our condensed consolidated balance sheets. | |||||||||||||||
Balance at July 1, 2015 | Current period other comprehensive income (loss) before reclassification | Amount reclassified from accumulated other comprehensive loss (b) | Balance at September 30, 2015 | ||||||||||||
Foreign currency translation adjustments | $ | (202 | ) | $ | (56 | ) | $ | 21 | $ | (237 | ) | ||||
Unrealized gains on AFS securities | 12 | 9 | — | 21 | |||||||||||
Unrecognized pension cost | (5 | ) | — | — | (5 | ) | |||||||||
Unrealized gains (losses) on derivative instruments | (6 | ) | 1 | — | (5 | ) | |||||||||
Accumulated Other Comprehensive Income (Loss) | $ | (201 | ) | $ | (46 | ) | $ | 21 | $ | (226 | ) | ||||
(b) The amount reclassified from accumulated other comprehensive loss was recognized within equity earnings (losses) from unconsolidated hospitality ventures on our condensed consolidated statements of income. | |||||||||||||||
Balance at January 1, 2015 | Current period other comprehensive income (loss) before reclassification | Amount reclassified from accumulated other comprehensive loss (b) | Balance at September 30, 2015 | ||||||||||||
Foreign currency translation adjustments | $ | (155 | ) | $ | (103 | ) | $ | 21 | $ | (237 | ) | ||||
Unrealized gains on AFS securities | 6 | 15 | — | 21 | |||||||||||
Unrecognized pension cost | (5 | ) | — | — | (5 | ) | |||||||||
Unrealized gains (losses) on derivative instruments | (6 | ) | 1 | — | (5 | ) | |||||||||
Accumulated Other Comprehensive Income (Loss) | $ | (160 | ) | $ | (87 | ) | $ | 21 | $ | (226 | ) | ||||
(b) The amount reclassified from accumulated other comprehensive loss was recognized within equity earnings (losses) from unconsolidated hospitality ventures on our condensed consolidated statements of income.
Share Repurchase—During 2016, 2015, and 2014, our board of directors authorized the repurchase of up to $250 million, $400 million and $700 million, respectively, of our common stock. These repurchases may be made from time to time in the open market, in privately negotiated transactions, or otherwise, including pursuant to a Rule 10b5-1 plan, at prices we deem appropriate and subject to market conditions, applicable law and other factors deemed relevant in our sole discretion. The common stock repurchase program applies to our Class A common stock and/or our Class B common stock. The common stock repurchase program does not obligate us to repurchase any dollar amount or number of shares of common stock and the program may be suspended or discontinued at any time.
20
During the nine months ended September 30, 2016 and September 30, 2015, we repurchased 5,556,424 and 9,614,463 shares of common stock, respectively. These shares of common stock were repurchased at a weighted-average price of $48.25 and $56.05 per share, respectively, for an aggregate purchase price of $268 million and $539 million, respectively, excluding related insignificant expenses in both periods. The shares repurchased during the nine months ended September 30, 2016 represented approximately 4% of our total shares of common stock outstanding as of December 31, 2015. The shares repurchased during the nine months ended September 30, 2015 represented approximately 6% of our total shares of common stock outstanding as of December 31, 2014. The shares of Class A common stock repurchased on the open market were retired and returned to the status of authorized and unissued shares while the shares of Class B common stock repurchased were retired and the total number of authorized Class B shares was reduced by the number of shares repurchased. As of September 30, 2016, we had $111 million remaining under the share repurchase authorization.
Treasury Stock Retirement—During the nine months ended September 30, 2015, we retired 195,423 shares of treasury stock. These shares were retired at a weighted-average price of $43.41 per share resulting in an $8 million reduction in treasury stock. The retired shares of treasury stock were returned to the status of authorized and unissued.
13. STOCK-BASED COMPENSATION
As part of our Long-Term Incentive Plan, we award Stock Appreciation Rights ("SARs"), Restricted Stock Units ("RSUs"), Performance Share Units ("PSUs") and Performance Vesting Restricted Stock ("PSSs") to certain employees. Stock-based compensation expense and unearned compensation presented below exclude amounts related to employees of our managed hotels and other employees whose payroll is reimbursed, as this expense has been and will continue to be reimbursed by our third-party hotel owners and is recorded in other revenues from managed properties and other costs from managed properties on our condensed consolidated statements of income. Stock-based compensation expense included in selling, general, and administrative expense on our condensed consolidated statements of income related to these awards for the three and nine months ended September 30, 2016 and September 30, 2015 were as follows:
Three Months Ended September 30, | Nine Months Ended September 30, | ||||||||||||||
2016 | 2015 | 2016 | 2015 | ||||||||||||
SARs | $ | 1 | $ | 1 | $ | 9 | $ | 9 | |||||||
RSUs | 2 | 3 | 13 | 14 | |||||||||||
PSUs and PSSs | (2 | ) | (5 | ) | (1 | ) | (3 | ) | |||||||
Total stock-based compensation recorded within selling, general, and administrative expenses | $ | 1 | $ | (1 | ) | $ | 21 | $ | 20 | ||||||
SARs—Each vested SAR gives the holder the right to the difference between the value of one share of our Class A common stock at the exercise date and the value of one share of our Class A common stock at the grant date. Vested SARs can be exercised over their life in accordance with the plan. All outstanding SARs have a 10-year contractual term, are settled in shares of our Class A common stock and are accounted for as equity instruments.
During the nine months ended September 30, 2016, we granted 924,424 SARs to employees with a weighted-average grant date fair value of $14.52. The fair value of each SAR was estimated on the grant date using the Black-Scholes-Merton option-pricing model.
RSUs—Each vested RSU represents the right to receive a single share of our Class A common stock (or, in the case of an insignificant portion of total RSUs granted, its cash equivalent value). The value of the stock-settled RSUs is based on the fair value of our Class A common stock as of the grant date. We record compensation expense for RSUs over the vesting period of the individual award. Vesting is dependent upon continuous service by the employee, but will accelerate due to death or disability or in the event of a change in control. Compensation expense for retirement eligible grantees is recorded in full once the grantee becomes retirement eligible. In certain limited situations we also grant cash-settled RSUs which are recorded as liability instruments. During the nine months ended September 30, 2016, we granted a total of 444,629 RSUs (an insignificant portion of which are cash-settled RSUs) to employees which, with respect to stock-settled RSUs, had a weighted-average grant date fair value of $47.36.
21
PSUs and PSSs—We granted both PSUs and PSSs to certain executive officers.
PSUs vest and are paid out in Class A common stock based upon the performance of the Company through the end of the applicable three year performance period relative to the applicable performance target. During the nine months ended September 30, 2016, we granted to our executive officers a total of 111,620 PSUs, with a weighted-average grant date fair value of $47.36. The performance period applicable to such PSUs is a three year period beginning January 1, 2016 and ending December 31, 2018. The PSUs will vest at the end of the performance period only if the performance threshold is met and continued service requirements are satisfied; there is no interim performance metric except in the case of certain change in control transactions.
PSSs vest and restrictions on transfer thereon lapse based upon the performance of the Company through the end of the applicable three year performance period relative to the applicable performance target. The PSSs vest in full if the maximum performance metric is achieved. At the end of the performance period, the PSSs that do not vest will be forfeited. The PSSs will vest at the end of the performance period only if the performance threshold is met and applicable continued service requirements are met; there is no interim performance metric except in the case of certain change in control transactions.
Our total unearned compensation for our stock-based compensation programs as of September 30, 2016 was $7 million for SARs, $15 million for RSUs and $2 million for PSUs and PSSs, which will be recorded to compensation expense over the next three years with respect to SARs and RSUs, with a limited portion of the SAR and RSU awards extending to four years, and over the next two years with respect to PSUs and PSSs.
14. RELATED-PARTY TRANSACTIONS
In addition to those included elsewhere in the Notes to the condensed consolidated financial statements, related-party transactions entered into by us are summarized as follows:
Leases—Our corporate headquarters have been located at the Hyatt Center in Chicago, Illinois, since 2005. A subsidiary of the Company holds a master lease for a portion of the Hyatt Center and has entered into sublease agreements with certain related parties. Future expected sublease income for this space from related parties is $4 million.
Equity Method Investments—We have equity method investments in entities that own properties for which we provide management and/or franchise services and receive fees. We recorded fees of $8 million and $7 million for the three months ended September 30, 2016 and September 30, 2015, respectively. We recorded fees of $22 million and $19 million for the nine months ended September 30, 2016 and September 30, 2015, respectively. As of September 30, 2016 and December 31, 2015, we had receivables due from these properties of $7 million and $6 million, respectively. In addition, in some cases we provide loans (see Note 5) or guarantees (see Note 11) to these entities. During the three and nine months ended September 30, 2016, we recorded fees related to these guarantees of $1 million and $3 million, respectively. Our ownership interest in these unconsolidated hospitality ventures generally varies from 24% to 70%. See Note 3 for further details regarding these investments.
Class B Share Repurchase—During the three and nine months ended September 30, 2016, we repurchased 1,881,636 shares of Class B common stock for a weighted average price of $53.15 per share, for an aggregate purchase price of approximately $100 million. The shares repurchased represented approximately 1% of our total shares of common stock outstanding prior to the repurchase. During the nine months ended September 30, 2015, we repurchased 1,776,501 shares of Class B common stock for a weighted average price of $58.91 per share, for an aggregate purchase price of approximately $105 million. The shares repurchased represented approximately 1% of our total shares of common stock outstanding prior to the repurchase. The shares of Class B common stock were repurchased in privately negotiated transactions from trusts for the benefit of certain Pritzker family members and limited partnerships owned indirectly by trusts for the benefit of certain Pritzker family members and were retired, thereby reducing the total number of shares outstanding and reducing the shares of Class B common stock authorized and outstanding by the repurchased share amount.
Class B Share Conversion—During the three months ended September 30, 2016, 500,000 shares of Class B common stock were converted on a share-for-share basis into shares of our Class A common stock, $0.01 par value per share. The shares of Class B common stock that were converted into shares of Class A common stock have been retired, thereby reducing the shares of Class B common stock authorized and outstanding.
22
15. SEGMENT INFORMATION
Our reportable segments are components of the business which are managed discretely and for which discrete financial information is reviewed regularly by the chief operating decision maker to assess performance and make decisions regarding the allocation of resources. Our chief operating decision maker is the President and Chief Executive Officer. We define our reportable segments as follows:
• | Owned and leased hotels—This segment derives its earnings from owned and leased hotel properties located predominantly in the United States but also in certain international locations and, for purposes of segment Adjusted Earnings Before Interest Expense, Taxes, Depreciation and Amortization ("Adjusted EBITDA"), includes our pro rata share of the Adjusted EBITDA of our unconsolidated hospitality ventures, based on our ownership percentage of each venture. |
• | Americas management and franchising—This segment derives its earnings primarily from a combination of hotel management and licensing of our portfolio of brands to franchisees located in the United States, Latin America, Canada and the Caribbean. This segment’s revenues also include the reimbursement of costs incurred on behalf of managed hotel property owners and franchisees with no added margin. These costs relate primarily to payroll costs at managed properties where the Company is the employer. These revenues and costs are recorded within other revenues from managed properties and other costs from managed properties, respectively. The intersegment revenues relate to management fees collected from the Company’s owned hotels, which are eliminated in consolidation. |
• | ASPAC management and franchising—This segment derives its earnings primarily from a combination of hotel management and licensing of our portfolio of brands to franchisees located in Southeast Asia, as well as greater China, Australia, South Korea, Japan and Micronesia. This segment’s revenues also include the reimbursement of costs incurred on behalf of managed hotel property owners and franchisees with no added margin. These costs relate primarily to reservations, marketing and IT costs. These revenues and costs are recorded within other revenues from managed properties and other costs from managed properties, respectively. The intersegment revenues relate to management fees collected from the Company’s owned hotels, which are eliminated in consolidation. |
• | EAME/SW Asia management—This segment derives its earnings primarily from hotel management of our portfolio of brands located primarily in Europe, Africa, the Middle East, India, Central Asia and Nepal. This segment’s revenues also include the reimbursement of costs incurred on behalf of managed hotel property owners with no added margin. These costs relate primarily to reservations, marketing and IT costs. These revenues and costs are recorded within other revenues from managed properties and other costs from managed properties, respectively. The intersegment revenues relate to management fees collected from the Company’s owned hotels, which are eliminated in consolidation. |
Our chief operating decision maker evaluates performance based on each segment’s revenue and Adjusted EBITDA. Adjusted EBITDA, as we define it, is a non-GAAP measure. We define Adjusted EBITDA as net income attributable to Hyatt Hotels Corporation plus our pro rata share of unconsolidated hospitality ventures Adjusted EBITDA based on our ownership percentage of each venture, adjusted to exclude equity earnings (losses) from unconsolidated hospitality ventures; stock-based compensation expense; asset impairments; gains (losses) on sales of real estate; other income (loss), net; depreciation and amortization; interest expense; and provision for income taxes.
Effective January 1, 2016, our definition of Adjusted EBITDA has been updated to exclude stock-based compensation expense, to facilitate comparison with our competitors. We have applied this change in the definition of Adjusted EBITDA to 2015 historical results to allow for comparability between the periods presented.
23
The table below shows summarized consolidated financial information by segment. Included within corporate and other are unallocated corporate expenses, license fees related to Hyatt Residence Club, and our co-branded credit card.
Three Months Ended September 30, | Nine Months Ended September 30, | ||||||||||||||
2016 | 2015 | 2016 | 2015 | ||||||||||||
Owned and leased hotels | |||||||||||||||
Owned and leased hotels revenues | $ | 519 | $ | 500 | $ | 1,594 | $ | 1,549 | |||||||
Adjusted EBITDA | 120 | 110 | 400 | 374 | |||||||||||
Depreciation and amortization | 71 | 69 | 211 | 208 | |||||||||||
Americas management and franchising | |||||||||||||||
Management and franchise fees revenues | 90 | 85 | 281 | 269 | |||||||||||
Other revenues from managed properties | 409 | 409 | 1,266 | 1,225 | |||||||||||
Intersegment revenues (a) | 16 | 15 | 57 | 55 | |||||||||||
Adjusted EBITDA | 77 | 74 | 242 | 229 | |||||||||||
Depreciation and amortization | 5 | 5 | 14 | 14 | |||||||||||
ASPAC management and franchising | |||||||||||||||
Management and franchise fees revenues | 23 | 21 | 67 | 65 | |||||||||||
Other revenues from managed properties | 24 | 19 | 72 | 59 | |||||||||||
Intersegment revenues (a) | 1 | — | 1 | 1 | |||||||||||
Adjusted EBITDA | 14 | 12 | 38 | 37 | |||||||||||
Depreciation and amortization | — | — | 1 | 1 | |||||||||||
EAME/SW Asia management | |||||||||||||||
Management and franchise fees revenues | 15 | 16 | 47 | 49 | |||||||||||
Other revenues from managed properties | 15 | 12 | 47 | 40 | |||||||||||
Intersegment revenues (a) | 2 | 4 | 8 | 10 | |||||||||||
Adjusted EBITDA | 8 | 7 | 24 | 23 | |||||||||||
Depreciation and amortization | 1 | 1 | 4 | 4 | |||||||||||
Corporate and other | |||||||||||||||
Revenues | 12 | 10 | 34 | 29 | |||||||||||
Adjusted EBITDA | (27 | ) | (32 | ) | (91 | ) | (92 | ) | |||||||
Depreciation and amortization | 10 | 3 | 24 | 6 | |||||||||||
Eliminations (a) | |||||||||||||||
Revenues | (19 | ) | (19 | ) | (66 | ) | (66 | ) | |||||||
Adjusted EBITDA | — | — | — | — | |||||||||||
Depreciation and amortization | — | — | — | — | |||||||||||
TOTAL | |||||||||||||||
Revenues | $ | 1,088 | $ | 1,053 | $ | 3,342 | $ | 3,219 | |||||||
Adjusted EBITDA | 192 | 171 | 613 | 571 | |||||||||||
Depreciation and amortization | 87 | 78 | 254 | 233 | |||||||||||
(a) | Intersegment revenues are included in the management and franchise fees revenues and eliminated in Eliminations. |
24
The table below provides a reconciliation of our consolidated Adjusted EBITDA to EBITDA and a reconciliation of EBITDA to net income attributable to Hyatt Hotels Corporation for the three and nine months ended September 30, 2016 and September 30, 2015.
Three Months Ended September 30, | Nine Months Ended September 30, | ||||||||||||||
2016 | 2015 | 2016 | 2015 | ||||||||||||
Adjusted EBITDA | $ | 192 | $ | 171 | $ | 613 | $ | 571 | |||||||
Equity earnings (losses) from unconsolidated hospitality ventures | 25 | (17 | ) | 46 | (46 | ) | |||||||||
Stock-based compensation expense (see Note 13) | (1 | ) | 1 | (21 | ) | (20 | ) | ||||||||
Asset impairments (a) | — | (5 | ) | — | (5 | ) | |||||||||
Gains (losses) on sales of real estate (see Note 6) | — | — | (21 | ) | 9 | ||||||||||
Other income (loss), net (see Note 17) | 4 | 11 | 1 | (3 | ) | ||||||||||
Pro rata share of unconsolidated hospitality ventures Adjusted EBITDA | (23 | ) | (21 | ) | (79 | ) | (63 | ) | |||||||
EBITDA | 197 | 140 | 539 | 443 | |||||||||||
Depreciation and amortization | (87 | ) | (78 | ) | (254 | ) | (233 | ) | |||||||
Interest expense | (20 | ) | (17 | ) | (57 | ) | (51 | ) | |||||||
Provision for income taxes | (28 | ) | (20 | ) | (65 | ) | (72 | ) | |||||||
Net income attributable to Hyatt Hotels Corporation | $ | 62 | $ | 25 | $ | 163 | $ | 87 | |||||||
(a) | In conjunction with our regular assessment of impairment indicators, we identified property and equipment whose carrying value exceeded its fair value and as a result recorded an impairment charge of $5 million in the three and nine months ended September 30, 2015 to asset impairments within our owned and leased hotels segment on our condensed consolidated statements of income. |
25
16. EARNINGS PER SHARE
The calculation of basic and diluted earnings per share, including a reconciliation of the numerator and denominator, were as follows:
Three Months Ended September 30, | Nine Months Ended September 30, | ||||||||||||||
2016 | 2015 | 2016 | 2015 | ||||||||||||
Numerator: | |||||||||||||||
Net income | $ | 62 | $ | 25 | $ | 163 | $ | 87 | |||||||
Net income attributable to noncontrolling interests | — | — | — | — | |||||||||||
Net income attributable to Hyatt Hotels Corporation | $ | 62 | $ | 25 | $ | 163 | $ | 87 | |||||||
Denominator: | |||||||||||||||
Basic weighted average shares outstanding | 131,917,434 | 141,876,299 | 133,672,570 | 144,457,314 | |||||||||||
Share-based compensation | 1,146,718 | 1,131,077 | 933,563 | 1,229,860 | |||||||||||
Diluted weighted average shares outstanding | 133,064,152 | 143,007,376 | 134,606,133 | 145,687,174 | |||||||||||
Basic Earnings Per Share: | |||||||||||||||
Net income | $ | 0.48 | $ | 0.18 | $ | 1.22 | $ | 0.60 | |||||||
Net income attributable to noncontrolling interests | — | — | — | — | |||||||||||
Net income attributable to Hyatt Hotels Corporation | $ | 0.48 | $ | 0.18 | $ | 1.22 | $ | 0.60 | |||||||
Diluted Earnings Per Share: | |||||||||||||||
Net income | $ | 0.47 | $ | 0.18 | $ | 1.21 | $ | 0.60 | |||||||
Net income attributable to noncontrolling interests | — | — | — | — | |||||||||||
Net income attributable to Hyatt Hotels Corporation | $ | 0.47 | $ | 0.18 | $ | 1.21 | $ | 0.60 | |||||||
The computations of diluted net income per share for the three and nine months ended September 30, 2016 and September 30, 2015 do not include the following shares of Class A common stock assumed to be issued as stock-settled SARs and RSUs because they are anti-dilutive.
Three Months Ended September 30, | Nine Months Ended September 30, | ||||||||||
2016 | 2015 | 2016 | 2015 | ||||||||
SARs | 73,300 | 1,700 | 80,400 | 10,100 | |||||||
RSUs | — | — | 4,200 | — | |||||||
26
17. OTHER INCOME (LOSS), NET
The table below provides a reconciliation of the components in other income (loss), net, for the three and nine months ended September 30, 2016 and September 30, 2015, respectively.
Three Months Ended September 30, | Nine Months Ended September 30, | ||||||||||||||
2016 | 2015 | 2016 | 2015 | ||||||||||||
Performance guarantee liability amortization (see Note 11) | $ | 8 | $ | 3 | $ | 25 | $ | 8 | |||||||
Depreciation recovery | 8 | 2 | 19 | 2 | |||||||||||
Interest income | 2 | 2 | 5 | 6 | |||||||||||
Foreign currency gains (losses), net | (1 | ) | (6 | ) | 2 | (13 | ) | ||||||||
Performance guarantee income (expense), net (see Note 11) | (13 | ) | 2 | (40 | ) | (12 | ) | ||||||||
Debt settlement costs (see Note 8) | — | — | (3 | ) | — | ||||||||||
Recoveries (provisions) on hotel loans, net (see Note 5) | — | 8 | (1 | ) | 6 | ||||||||||
Other | — | — | (6 | ) | — | ||||||||||
Other income (loss), net | $ | 4 | $ | 11 | $ | 1 | $ | (3 | ) | ||||||
27
Item 2. Management's Discussion and Analysis of Financial Condition and Results of Operations.
This quarterly report contains "forward-looking statements" within the meaning of the Private Securities
Litigation Reform Act of 1995. These statements include statements about the Company's plans, strategies, financial performance, prospects or future events and involve known and unknown risks that are difficult to predict. As a result, our actual results, performance or achievements may differ materially from those expressed or implied by these forward-looking statements. In some cases, you can identify forward-looking statements by the use of words such as "may," "could," "expect," "intend," "plan," "seek," "anticipate," "believe," "estimate," "predict," "potential," "continue," "likely," "will," "would" and variations of these terms and similar expressions, or the negative of these terms or similar expressions. Such forward-looking statements are necessarily based upon estimates and assumptions that, while considered reasonable by us and our management, are inherently uncertain. Factors that may cause actual results to differ materially from current expectations include, but are not limited to: the factors discussed in our filings with the SEC, including our Annual Report on Form 10-K; general economic uncertainty in key global markets and a worsening of global economic conditions or low levels of economic growth; the rate and the pace of economic recovery following economic downturns; levels of spending in business and leisure segments as well as consumer confidence; declines in occupancy and average daily rate; limited visibility with respect to future bookings; loss of key personnel; hostilities, or fear of hostilities, including future terrorist attacks, that affect travel; travel-related accidents; natural or man-made disasters such as earthquakes, tsunamis, tornadoes, hurricanes, floods, oil spills, nuclear incidents and global outbreaks of pandemics or contagious diseases or fear of such outbreaks; our ability to successfully achieve certain levels of operating profits at hotels that have performance guarantees in favor of our third party owners; the impact of hotel renovations; our ability to successfully execute our common stock repurchase program; the seasonal and cyclical nature of the real estate and hospitality businesses; changes in distribution arrangements, such as through Internet travel intermediaries; changes in the tastes and preferences of our customers, including the entry of new competitors in the lodging business; relationships with colleagues and labor unions and changes in labor laws; financial condition of, and our relationships with, third-party property owners, franchisees and hospitality venture partners; the possible inability of our third-party owners, franchisees or development partners to access capital necessary to fund current operations or implement our plans for growth; risks associated with potential acquisitions and dispositions and the introduction of new brand concepts; the timing of acquisitions and dispositions; failure to successfully complete proposed transactions (including the failure to satisfy closing conditions or obtain required approvals); unforeseen terminations of our management or franchise agreements; changes in federal, state, local or foreign tax law; increases in interest rates and operating costs; foreign exchange rate fluctuations or currency restructurings; lack of acceptance of new brands or innovation; our ability to successfully implement our new global loyalty program; general volatility of the capital markets and our ability to access such markets; changes in the competitive environment in our industry, including as a result of industry consolidation, and the markets where we operate; cyber incidents and information technology failures; outcomes of legal or administrative proceedings; and violations of regulations or laws related to our franchising business. All forward-looking statements attributable to us or persons acting on our behalf are expressly qualified in their entirety by the cautionary statements set forth above. Forward-looking statements speak only as of the date they are made, and we do not undertake or assume any obligation to update publicly any of these forward-looking statements to reflect actual results, new information or future events, changes in assumptions or changes in other factors affecting forward-looking statements, except to the extent required by applicable laws. If we update one or more forward-looking statements, no inference should be drawn that we will make additional updates with respect to those or other forward-looking statements.
The following discussion should be read in conjunction with the Company's condensed consolidated financial statements and accompanying Notes, which appear elsewhere in this Quarterly Report on Form 10-Q.
Executive Overview
We are a global hospitality company engaged in the development, ownership, operation, management, franchising and licensing of a portfolio of properties, including hotels, resorts and residential and vacation ownership properties around the world. As of September 30, 2016, our worldwide hotel portfolio consisted of 639 hotels (166,731 rooms), including:
• | 276 managed properties (90,276 rooms), all of which we operate under management agreements with third-party property owners; |
• | 292 franchised properties (48,267 rooms), all of which are owned by third parties that have franchise agreements with us and are operated by third parties; |
• | 34 owned properties (17,714 rooms) (including 1 consolidated hospitality venture), 1 capital leased property (171 rooms), and 7 operating leased properties (2,411 rooms), all of which we manage; and |
28
• | 20 managed properties and 9 franchised properties owned or leased by unconsolidated hospitality ventures (7,892 rooms). |
Our worldwide property portfolio also included:
• | 6 all inclusive resorts (2,401 rooms), all of which are owned and operated by an unconsolidated hospitality venture that has franchise agreements with us; |
• | 16 vacation ownership properties (1,038 units), all of which are licensed by Interval Leisure Group ("ILG") under the Hyatt Residence Club brand and operated by third parties, including ILG and its affiliates; and |
• | 18 residential properties (2,417 units), which consist of branded residences and serviced apartments. We manage all of the serviced apartments and those branded residential units that participate in a rental program with an adjacent Hyatt-branded hotel. |
We report our consolidated operations in U.S. dollars. Constant currency disclosures throughout Management's Discussion and Analysis of Financial Condition and Results of Operations are non-GAAP measures. See "—Segment Results" below for further discussion of constant currency disclosures. We manage our business within four reportable segments as described below:
• | Owned and leased hotels, which consists of our owned and leased full service and select service hotels and, for purposes of segment Adjusted EBITDA, our pro rata share of the Adjusted EBITDA of our unconsolidated hospitality ventures, based on our ownership percentage of each venture; |
• | Americas management and franchising, which consists of our management and franchising of properties located in the United States, Latin America, Canada and the Caribbean; |
• | ASPAC management and franchising, which consists of our management and franchising of properties located in Southeast Asia, as well as greater China, Australia, South Korea, Japan and Micronesia; and |
• | EAME/SW Asia management, which consists of our management of properties located primarily in Europe, Africa, the Middle East, India, Central Asia and Nepal. |
The results of our unallocated corporate overhead, license fees related to Hyatt Residence Club and our co-branded credit card are reported within corporate and other. See Note 15 for further discussion of our segment structure.
During the three months ended September 30, 2016, we purchased Royal Palms Resort and Spa for approximately $88 million. The hotel is included in The Unbound Collection by Hyatt.
During the third quarter, we announced plans for the following future openings:
• | Hyatt Centric Carlisle Bay, the first Hyatt-branded hotel in Barbados; |
• | Hyatt Regency Phnom Penh, the first Hyatt Regency in Cambodia; and |
• | Hyatt Regency Zadar Maraska, the first Hyatt-branded hotel in Croatia. |
We opened 11 hotels in the third quarter including Andaz Ottawa Byward Market, the first Andaz hotel in Canada.
On October 27, 2016, we announced a new global loyalty program, World of Hyatt, which will launch on March 1, 2017.
Our financial performance for the quarter ended September 30, 2016 reflects an increase in net income of $37 million compared to the quarter ended September 30, 2015. Consolidated revenues increased $35 million, or 3.3% ($39 million or 3.7% excluding the impact of currency), during the quarter ended September 30, 2016 compared to the quarter ended September 30, 2015. Owned and leased hotels revenues for the quarter ended September 30, 2016 increased $19 million compared to the quarter ended September 30, 2015, which included net unfavorable currency impact of $4 million. The increase in owned and leased hotels revenues resulted primarily from an increase in non-comparable owned and leased hotels revenues of $13 million, including $1 million in net unfavorable currency impact, which was primarily driven by new openings and acquisitions in 2016, partially offset by hotels sold in 2016. Additionally, comparable owned and leased hotels revenues increased $6 million, including $3 million in net unfavorable currency impact, which was primarily driven by full service hotels in the United States and Mexico as a result of improved transient and group Revenue per Available Room ("RevPAR").
29
Our management and franchise fees for the quarter ended September 30, 2016 increased $7 million compared to the quarter ended September 30, 2015, which included an insignificant net unfavorable currency impact. Fee increases were primarily due to increased franchise fees from new and converted hotels and improved performance at existing hotels in the Americas.
Our consolidated Adjusted EBITDA for the third quarter of 2016 increased $21 million compared to the third quarter of 2015, which included $1 million in net unfavorable currency impact. The increase was primarily driven by our owned and leased hotels segment which increased $10 million and a $5 million increase attributable to corporate and other. See "—Non-GAAP Measures" below for an explanation of how we use Adjusted EBITDA, why we present it and material limitations on its usefulness, as well as a reconciliation of our consolidated Adjusted EBITDA to EBITDA and a reconciliation of EBITDA to net income attributable to Hyatt Hotels Corporation
Hotel Chain RevPAR Statistics.
RevPAR | ||||||||||||||||
Three Months Ended September 30, | ||||||||||||||||
(Comparable Locations) | Number of Comparable Hotels (1) | 2016 | 2015 | Change | Change (in constant $) | |||||||||||
Comparable systemwide hotels | 539 | $ | 140 | $ | 137 | 2.6 | % | 2.5 | % | |||||||
Owned and leased hotels | 39 | $ | 171 | $ | 171 | 0.3 | % | 1.0 | % | |||||||
Americas full service hotels | 148 | $ | 158 | $ | 152 | 3.6 | % | 3.8 | % | |||||||
Americas select service hotels | 267 | $ | 110 | $ | 106 | 4.6 | % | 4.6 | % | |||||||
ASPAC full service hotels | 60 | $ | 149 | $ | 143 | 4.4 | % | 1.8 | % | |||||||
EAME/SW Asia full service hotels | 58 | $ | 121 | $ | 134 | (9.7 | )% | (7.8 | )% | |||||||
EAME/SW Asia select service hotels | 5 | $ | 66 | $ | 63 | 4.7 | % | 5.0 | % | |||||||
(1) Comparable systemwide hotels include one select service hotel in ASPAC, which is not included in the ASPAC full service hotel statistics. The number of managed and franchised hotels presented above includes owned and leased hotels.
In the Americas management and franchising segment, transient Average Daily Rate ("ADR") growth as well as group occupancy and ADR growth at our full service hotels contributed to RevPAR increases in the third quarter of 2016 compared to the third quarter of 2015, partly due to the shift of the Jewish holidays out of the third quarter of 2016 and into the fourth quarter of 2016. Our owned and leased hotels segment, which consists of hotels located primarily in the Americas, experienced transient revenue growth as a result of increased ADR in the third quarter of 2016. Group occupancy experienced moderate growth at our owned and leased hotels in the United States, due to the shift of the Jewish holidays out of the third quarter of 2016.
In the Americas management and franchising segment, short-term group bookings made in the third quarter of 2016 for stays in 2016 were lower compared to bookings made in the third quarter of 2015 for stays in 2015. Long-term bookings made in the third quarter of 2016 for stays beyond 2016 increased compared to bookings made in the third quarter of 2015 for years beyond 2015.
ASPAC management and franchising segment results for the third quarter of 2016 were relatively flat as the region continued to be negatively impacted by a shifting preference in tourism destinations. While overall demand remained strong, the region experienced decreased ADR during the third quarter of 2016. Our hotels in South Korea experienced improved results as the tourism industry has recovered after the country was negatively impacted by the MERS outbreak in 2015. Hong Kong, Macau and Taiwan markets experienced lower visitor arrivals and we expect this trend to continue. Hong Kong, however, had strong group results during the third quarter despite the difficult market conditions.
The RevPAR decline in our EAME/SW Asia management segment during the third quarter of 2016 resulted from decreased ADR and occupancy in France, Switzerland and Turkey. The hotels in France and Turkey continued to experience lower demand due to security concerns and terrorism in the region. Our hotel in Switzerland experienced reduced occupancy as a result of a decline in transient demand. These decreases were partially offset by a combination of strong rate and occupancy growth across Southwest Asia as the hotels continued to benefit from an improved business environment. We expect the current trends in the EAME/SW Asia regions to continue to impact the segment's results for 2016.
30
Results of Operations
Three and Nine Months Ended September 30, 2016 Compared with Three and Nine Months Ended September 30, 2015
Discussion on Consolidated Results
For additional information regarding our consolidated results below, please also refer to our condensed consolidated statements of income included in this quarterly filing. The impact from our investments in marketable securities held to fund operating programs, including securities held to fund our benefit programs funded through a rabbi trust and securities held to fund our Gold Passport program, were recorded on the various financial statement line items discussed below and have no impact on net income.
Owned and leased hotels revenues.
Three Months Ended September 30, | ||||||||||||||||||
(in millions, except percentages) | 2016 | 2015 | Better / (Worse) | Currency Impact | ||||||||||||||
Comparable owned and leased hotels revenues | $ | 492 | $ | 486 | $ | 6 | 1.2 | % | $ | (3 | ) | |||||||
Non-comparable owned and leased hotels revenues | 27 | 14 | 13 | 92.9 | % | (1 | ) | |||||||||||
Total Owned and Leased Hotels Revenues | $ | 519 | $ | 500 | $ | 19 | 3.8 | % | $ | (4 | ) | |||||||
Nine Months Ended September 30, | ||||||||||||||||||
(in millions, except percentages) | 2016 | 2015 | Better / (Worse) | Currency Impact | ||||||||||||||
Comparable owned and leased hotels revenues | $ | 1,533 | $ | 1,505 | $ | 28 | 1.9 | % | $ | (17 | ) | |||||||
Non-comparable owned and leased hotels revenues | 61 | 44 | 17 | 38.6 | % | (1 | ) | |||||||||||
Total Owned and Leased Hotels Revenues | $ | 1,594 | $ | 1,549 | $ | 45 | 2.9 | % | $ | (18 | ) | |||||||
The increases in comparable owned and leased hotels revenues for the three and nine months ended September 30, 2016 compared to the three and nine months ended September 30, 2015 were primarily driven by full service hotels in the United States and Mexico, partially offset by decreases at certain international hotels primarily due to net unfavorable currency impact and market weakness. The increases in non-comparable owned and leased hotels revenues for the three and nine months ended September 30, 2016 compared to the three and nine months ended September 30, 2015 were driven by acquisitions and openings in 2016, partially offset by hotels sold in 2015 and 2016. See "—Segment Results" below for further discussion of owned and leased hotels revenues.
Management and franchise fee revenues.
Three Months Ended September 30, | ||||||||||||||
(in millions, except percentages) | 2016 | 2015 | Better / (Worse) | |||||||||||
Base management fees | $ | 49 | $ | 47 | $ | 2 | 4.3 | % | ||||||
Incentive management fees | 25 | 23 | 2 | 8.7 | % | |||||||||
Franchise fees | 27 | 24 | 3 | 12.5 | % | |||||||||
Other fee revenues | 9 | 9 | — | — | % | |||||||||
Total management and franchise fees | $ | 110 | $ | 103 | $ | 7 | 6.8 | % | ||||||
Nine Months Ended September 30, | ||||||||||||||
(in millions, except percentages) | 2016 | 2015 | Better / (Worse) | |||||||||||
Base management fees | $ | 143 | $ | 140 | $ | 3 | 2.1 | % | ||||||
Incentive management fees | 85 | 83 | 2 | 2.4 | % | |||||||||
Franchise fees | 77 | 67 | 10 | 14.9 | % | |||||||||
Other fee revenues | 27 | 30 | (3 | ) | (10.0 | )% | ||||||||
Total management and franchise fees | $ | 332 | $ | 320 | $ | 12 | 3.8 | % | ||||||
31
The increase in management and franchise fees included an insignificant and $2 million net unfavorable currency impact during the three and nine months ended September 30, 2016, respectively, compared to the same periods in the prior year. The increase in franchise fees for the three and nine months ended September 30, 2016 was primarily driven by new and converted hotels and improved performance at existing hotels in the Americas.
Other revenues from managed properties.
Three Months Ended September 30, | ||||||||||||||
(in millions, except percentages) | 2016 | 2015 | Better / (Worse) | |||||||||||
Other revenues from managed properties excluding rabbi trust impact | $ | 443 | $ | 447 | $ | (4 | ) | (0.9 | )% | |||||
Rabbi trust impact | 5 | (7 | ) | 12 | 171.4 | % | ||||||||
Other revenues from managed properties | $ | 448 | $ | 440 | $ | 8 | 1.8 | % | ||||||
Nine Months Ended September 30, | ||||||||||||||
(in millions, except percentages) | 2016 | 2015 | Better / (Worse) | |||||||||||
Other revenues from managed properties excluding rabbi trust impact | $ | 1,378 | $ | 1,327 | $ | 51 | 3.8 | % | ||||||
Rabbi trust impact | 7 | (3 | ) | 10 | 333.3 | % | ||||||||
Other revenues from managed properties | $ | 1,385 | $ | 1,324 | $ | 61 | 4.6 | % | ||||||
Excluding the impact of rabbi trust, other revenues from managed properties decreased during the three months ended September 30, 2016, compared to the three months ended September 30, 2015, due to decreased full service hotels payroll and related costs driven by hotel conversions and a hotel that left the chain, partially offset by increased reimbursements related to our Hyatt Gold Passport program due to increased member participation. Excluding the impact of rabbi trust, other revenues from managed properties increased during the nine months ended September 30, 2016, compared to the nine months ended September 30, 2015, due to a higher volume of reimbursements paid to us by our managed properties for increased member participation in our Hyatt Gold Passport program and increased select service hotels payroll and related costs, partially offset by decreased full service hotels payroll and related costs driven by hotel conversions and one hotel that left the chain.
Owned and leased hotels expense.
Three Months Ended September 30, | ||||||||||||||
(in millions, except percentages) | 2016 | 2015 | Better / (Worse) | |||||||||||
Comparable owned and leased hotels expense | $ | 378 | $ | 377 | $ | (1 | ) | (0.3 | )% | |||||
Non-comparable owned and leased hotels expense | 22 | 11 | (11 | ) | (100.0 | )% | ||||||||
Rabbi trust impact | 2 | (3 | ) | (5 | ) | (166.7 | )% | |||||||
Total Owned and Leased Hotels Expense | $ | 402 | $ | 385 | $ | (17 | ) | (4.4 | )% | |||||
Nine Months Ended September 30, | ||||||||||||||
(in millions, except percentages) | 2016 | 2015 | Better / (Worse) | |||||||||||
Comparable owned and leased hotels expense | $ | 1,143 | $ | 1,125 | $ | (18 | ) | (1.6 | )% | |||||
Non-comparable owned and leased hotels expense | 58 | 37 | (21 | ) | (56.8 | )% | ||||||||
Rabbi trust impact | 3 | (2 | ) | (5 | ) | (250.0 | )% | |||||||
Total Owned and Leased Hotels Expense | $ | 1,204 | $ | 1,160 | $ | (44 | ) | (3.8 | )% | |||||
Comparable owned and leased hotels expense included $2 million and $11 million net favorable currency impact, in the three and nine months ended September 30, 2016, respectively, compared to the same periods in the prior year. The increase in the nine months ended September 30, 2016 was primarily driven by increased payroll and related costs and property taxes at certain properties. Non-comparable owned and leased hotels expense included $1 million net favorable currency impact, in both the three and nine months ended September 30, 2016, compared to the same periods in the prior year. The increases in both periods were primarily driven by acquisitions and openings in 2016, partially offset by hotels sold in 2016 and 2015.
32
Depreciation and amortization. Depreciation and amortization increased $9 million and $21 million during the three and nine months ended September 30, 2016, respectively, compared to the same periods in the prior year. The increases were primarily driven by depreciation for assets placed in service in 2015 and 2016 related to IT projects, acquisitions and hotel openings, partially offset by decreased depreciation related to the sale of Andaz 5th Avenue. A portion of the depreciation related to IT assets is recovered from our managed and franchised hotels and the corresponding recovery is included in other income (loss), net.
Selling, general, and administrative expenses.
Three Months Ended September 30, | ||||||||||||||
(in millions, except percentages) | 2016 | 2015 | Better / (Worse) | |||||||||||
Selling, general, and administrative expenses | $ | 74 | $ | 54 | $ | (20 | ) | (37.0 | )% | |||||
Less rabbi trust impact | (10 | ) | 12 | 22 | 183.3 | % | ||||||||
Less stock-based compensation expense | (1 | ) | 1 | 2 | 200.0 | % | ||||||||
Adjusted selling, general, and administrative expenses | $ | 63 | $ | 67 | $ | 4 | 6.0 | % | ||||||
Nine Months Ended September 30, | ||||||||||||||
(in millions, except percentages) | 2016 | 2015 | Better / (Worse) | |||||||||||
Selling, general, and administrative expenses | $ | 237 | $ | 221 | $ | (16 | ) | (7.2 | )% | |||||
Less rabbi trust impact | (14 | ) | 5 | 19 | 380.0 | % | ||||||||
Less stock-based compensation expense | (21 | ) | (20 | ) | 1 | 5.0 | % | |||||||
Adjusted selling, general, and administrative expenses | $ | 202 | $ | 206 | $ | 4 | 1.9 | % | ||||||
Adjusted selling, general, and administrative expenses excludes the impact of expenses related to benefit programs funded through rabbi trusts and stock-based compensation expense. Adjusted selling, general, and administrative expenses, as we define it, is a non-GAAP measure. See "—Non-GAAP Measures" below for further discussion of adjusted selling, general, and administrative expenses. Effective January 1, 2016 our definition of Adjusted EBITDA has been updated to exclude stock-based compensation expense, therefore, our definition of adjusted selling, general, and administrative expenses has also been updated to exclude stock-based compensation expense. We have applied this change in the definition of adjusted selling, general, and administrative expenses to 2015 historical results to allow for comparability between the periods presented.
Adjusted selling, general, and administrative expenses decreased during the three months ended September 30, 2016, compared to the same period in the prior year, driven by reductions in professional fees related to certain initiatives completed during 2015 and other taxes assessed in the prior year. The decrease during the nine months ended September 30, 2016 compared to the same period in the prior year, was driven by reductions in professional fees, partially offset by increases in payroll and related costs.
Net gains (losses) and interest income from marketable securities held to fund operating programs.
Three Months Ended September 30, | ||||||||||||||
(in millions, except percentages) | 2016 | 2015 | Better / (Worse) | |||||||||||
Rabbi trust impact allocated to selling, general, and administrative expenses | $ | 10 | $ | (12 | ) | $ | 22 | 183.3 | % | |||||
Rabbi trust impact allocated to owned and leased hotels expense | 2 | (3 | ) | 5 | 166.7 | % | ||||||||
Net gains and interest income from marketable securities held to fund our Gold Passport program allocated to owned and leased hotels revenues | — | — | — | — | % | |||||||||
Net gains (losses) and interest income from marketable securities held to fund operating programs | $ | 12 | $ | (15 | ) | $ | 27 | 180.0 | % | |||||
33
Nine Months Ended September 30, | ||||||||||||||
(in millions, except percentages) | 2016 | 2015 | Better / (Worse) | |||||||||||
Rabbi trust impact allocated to selling, general, and administrative expenses | $ | 14 | $ | (5 | ) | $ | 19 | 380.0 | % | |||||
Rabbi trust impact allocated to owned and leased hotels expense | 3 | (2 | ) | 5 | 250.0 | % | ||||||||
Net gains and interest income from marketable securities held to fund our Gold Passport program allocated to owned and leased hotels revenues | 3 | 1 | 2 | 200.0 | % | |||||||||
Net gains (losses) and interest income from marketable securities held to fund operating programs | $ | 20 | $ | (6 | ) | $ | 26 | 433.3 | % | |||||
Equity earnings (losses) from unconsolidated hospitality ventures.
Three Months Ended September 30, | ||||||||||||||
(in millions, except percentages) | 2016 | 2015 | Better / (Worse) | |||||||||||
Equity earnings (losses) from unconsolidated hospitality ventures | $ | 25 | $ | (17 | ) | $ | 42 | 247.1 | % | |||||
Nine Months Ended September 30, | ||||||||||||||
(in millions, except percentages) | 2016 | 2015 | Better / (Worse) | |||||||||||
Equity earnings (losses) from unconsolidated hospitality ventures | $ | 46 | $ | (46 | ) | $ | 92 | 200.0 | % | |||||
The three and nine months ended September 30, 2016 included $20 million of equity earnings attributable to one of our unconsolidated hospitality ventures primarily related to their debt refinancing, which resulted in a distribution during the third quarter of 2016, and $5 million related to two of our unconsolidated hospitality ventures which sold hotels during the third quarter. Equity earnings during the nine months ended September 30, 2016 also included $7 million related to a forfeited deposit on a sale of hotels that did not close. Additionally, during the three and nine months ended September 30, 2016, we recorded $2 million and $4 million of impairment charges, respectively.
The three and nine months ended September 30, 2015 included the sale of an entity that held an interest in one of our foreign currency denominated unconsolidated hospitality ventures which resulted in a loss of $21 million due to the release of accumulated foreign currency translation upon sale. The nine months ended September 30, 2015 also included $28 million of equity losses related to two foreign unconsolidated hospitality ventures. Such losses are attributable to the following, among other items: (i) foreign currency losses recorded by one of our unconsolidated hospitality ventures which holds loans denominated in a currency other than its functional currency, resulting in losses due to currency volatility during the period, and (ii) operating and non-operating losses related to one of our unconsolidated hospitality ventures driven primarily by interest, tax, and other nonrecurring expenses recorded during the period.
Interest expense. Interest expense increased $3 million and $6 million during the three and nine months ended September 30, 2016, respectively, compared to the same periods in the prior year driven by interest expense related to the 2026 Notes issued in the first quarter of 2016, partially offset by decreased interest expense related to the 2016 Notes which were redeemed during the second quarter of 2016.
Asset Impairments. During the three and nine months ended September 30, 2015, we recognized $5 million of asset impairment charges related to property and equipment within our owned and leased hotels segment.
Gains (losses) on sales of real estate. During the nine months ended September 30, 2016, we sold Andaz 5th Avenue resulting in a pre-tax loss of $21 million. During the nine months ended September 30, 2015, we sold Hyatt Regency Indianapolis resulting in a pre-tax gain of $8 million and a Hyatt House property resulting in a pre-tax gain of $1 million.
Other income (loss), net. Other income (loss), net decreased $7 million and increased $4 million during the three and nine months ended September 30, 2016, respectively, compared to the same periods in the prior year. These changes are primarily driven by performance guarantee income (expense), net related to the four managed hotels in France. See Note 11 for further details related to our performance guarantees. Other income (loss), net for
34
the three and nine months ended September 30, 2015 included foreign currency losses recorded by entities which hold loans denominated in a currency other than its functional currency, primarily related to the Brazilian real. Refer to Note 17 for a reconciliation of the components in other income (loss), net.
Provision for income taxes.
Three Months Ended September 30, | ||||||||||||||
(in millions, except percentages) | 2016 | 2015 | Better / (Worse) | |||||||||||
Income before income taxes | $ | 90 | $ | 45 | $ | 45 | 100.0 | % | ||||||
Provision for income taxes | (28 | ) | (20 | ) | (8 | ) | (40.0 | )% | ||||||
Effective tax rate | 30.2 | % | 44.6 | % | 14.4 | % | ||||||||
Nine Months Ended September 30, | ||||||||||||||
(in millions, except percentages) | 2016 | 2015 | Better / (Worse) | |||||||||||
Income before income taxes | $ | 228 | $ | 159 | $ | 69 | 43.4 | % | ||||||
Provision for income taxes | (65 | ) | (72 | ) | 7 | 9.7 | % | |||||||
Effective tax rate | 28.4 | % | 45.3 | % | 16.9 | % | ||||||||
Provision for income taxes increased $8 million during the three months ended September 30, 2016 compared to the three months ended September 30, 2015 due to an increase in income in the third quarter of 2016, partially offset by benefits described below. Income tax expense decreased $7 million for the nine month period ended September 30, 2016 compared to the same period in 2015. The decrease was due to a tax benefit recognized in 2016 as a result of the global transfer pricing changes implemented during the fourth quarter of 2015 to better align the methodology with our global business operating model and the release of tax reserves in certain foreign jurisdictions. Additionally, the periods ended September 30, 2015 were unfavorably impacted by the effect of certain foreign unconsolidated hospitality venture losses that were not fully benefited in 2015.
Segment Results
We evaluate segment operating performance using segment revenue and segment Adjusted EBITDA, as described in Note 15, which includes discussion of an update to the definition of Adjusted EBITDA effective January 1, 2016.
35
The charts below illustrate revenues by segment excluding other revenues from managed properties for the three and nine months ended September 30, 2016 and September 30, 2015, which are presented before intersegment eliminations.

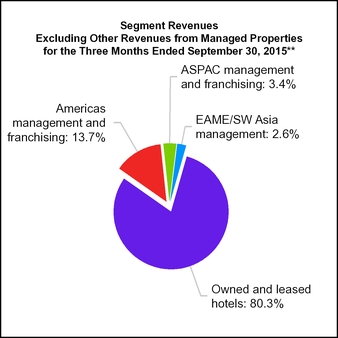
*Consolidated revenues for the three months ended September 30, 2016 included corporate and other revenues of $12 million, eliminations of $19 million and other revenues from managed properties of $448 million.
**Consolidated revenues for the three months ended September 30, 2015 included corporate and other revenues of $10 million, eliminations of $19 million and other revenues from managed properties of $440 million.


*Consolidated revenues for the nine months ended September 30, 2016 included corporate and other revenues of $34 million, eliminations of $66 million and other revenues from managed properties of $1,385 million.
**Consolidated revenues for the nine months ended September 30, 2015 included corporate and other revenues of $29 million, eliminations of $66 million and other revenues from managed properties of $1,324 million.
36
Owned and leased hotels revenues.
Three Months Ended September 30, | ||||||||||||||||||
(in millions, except percentages) | 2016 | 2015 | Better / (Worse) | Currency Impact | ||||||||||||||
Comparable owned and leased hotels revenues | $ | 492 | $ | 486 | $ | 6 | 1.2 | % | $ | (3 | ) | |||||||
Non-comparable owned and leased hotels revenues | 27 | 14 | 13 | 92.9 | % | (1 | ) | |||||||||||
Total Owned and Leased Hotels Revenues | $ | 519 | $ | 500 | $ | 19 | 3.8 | % | $ | (4 | ) | |||||||
Nine Months Ended September 30, | ||||||||||||||||||
(in millions, except percentages) | 2016 | 2015 | Better / (Worse) | Currency Impact | ||||||||||||||
Comparable owned and leased hotels revenues | $ | 1,533 | $ | 1,505 | $ | 28 | 1.9 | % | $ | (17 | ) | |||||||
Non-comparable owned and leased hotels revenues | 61 | 44 | 17 | 38.6 | % | (1 | ) | |||||||||||
Total Owned and Leased Hotels Revenues | $ | 1,594 | $ | 1,549 | $ | 45 | 2.9 | % | $ | (18 | ) | |||||||
The increases in comparable owned and leased hotels revenues during the three and nine months ended September 30, 2016 compared to the three and nine months ended September 30, 2015, were primarily driven by increases of $12 million and $42 million in the United States, respectively, partially offset by decreases of $6 million and $14 million, respectively, at our international hotels. During the three months ended September 30, 2016 compared to the three months ended September 30, 2015, revenue growth at our United States comparable full service hotels was primarily a result of improved transient rate and food and beverage revenues. During the nine months ended September 30, 2016 compared to the nine months ended September 30, 2015, revenue growth at our United States comparable full service hotels was primarily a result of increased group and transient rates as well as food and beverage revenues. The decreases in comparable international hotels during the three and nine months ended September 30, 2016 compared to the same periods in 2015, were primarily driven by net unfavorable currency impact of $3 million and $17 million, respectively. Unfavorable performance in EAME/SW Asia was partially offset by favorable performance in Mexico. The increases in non-comparable owned and leased hotels revenues were driven by the opening of Grand Hyatt Rio de Janeiro and the acquisitions of The Confidante Miami Beach and Royal Palms Resort and Spa, partially offset by the sale of Andaz 5th Avenue.
Three Months Ended September 30, | ||||||||||||||||||||||||||||||||||||
RevPAR | Occupancy | ADR | ||||||||||||||||||||||||||||||||||
2016 | 2015 | Better / (Worse) | Better / (Worse) Constant $ | 2016 | 2015 | Change in Occ % pts | 2016 | 2015 | Better / (Worse) | Better / (Worse) Constant $ | ||||||||||||||||||||||||||
Comparable Owned and Leased Hotels | $ | 171 | $ | 171 | 0.3 | % | 1.0 | % | 79.4 | % | 78.4 | % | 1.0 | % | $ | 216 | $ | 218 | (0.9 | )% | (0.3 | )% | ||||||||||||||
Nine Months Ended September 30, | ||||||||||||||||||||||||||||||||||||
RevPAR | Occupancy | ADR | ||||||||||||||||||||||||||||||||||
2016 | 2015 | Better / (Worse) | Better / (Worse) Constant $ | 2016 | 2015 | Change in Occ % pts | 2016 | 2015 | Better / (Worse) | Better / (Worse) Constant $ | ||||||||||||||||||||||||||
Comparable Owned and Leased Hotels | $ | 173 | $ | 170 | 2.0 | % | 3.0 | % | 78.0 | % | 77.3 | % | 0.7 | % | $ | 222 | $ | 219 | 1.1 | % | 2.0 | % | ||||||||||||||
Excluding the net unfavorable currency impact, the increase in comparable RevPAR at our owned and leased hotels during the three months ended September 30, 2016 compared to the three months ended September 30, 2015 was primarily driven by improved transient ADR and group occupancy at our comparable full service hotels in the United States and Mexico, partially offset by decreased ADR at our comparable full service hotels in EAME/SW Asia. The increase during the nine months ended September 30, 2016 compared to the nine months ended September 30, 2015 was primarily driven by improved ADR and occupancy at our comparable full service hotels in the United States and Mexico, partially offset by decreased ADR at our comparable full service hotels in EAME/SW Asia.
37
During the three and nine months ended September 30, 2016, we removed one and two properties, respectively, that were sold during the periods from the comparable owned and leased hotels results.
Owned and leased hotels segment Adjusted EBITDA.
Three Months Ended September 30, | ||||||||||||||
(in millions, except percentages) | 2016 | 2015 | Better / (Worse) | |||||||||||
Owned and leased hotels Adjusted EBITDA | $ | 97 | $ | 89 | $ | 8 | 9.0 | % | ||||||
Pro rata share of unconsolidated hospitality ventures Adjusted EBITDA | 23 | 21 | 2 | 9.5 | % | |||||||||
Segment Adjusted EBITDA | $ | 120 | $ | 110 | $ | 10 | 9.1 | % | ||||||
Nine Months Ended September 30, | ||||||||||||||
(in millions, except percentages) | 2016 | 2015 | Better / (Worse) | |||||||||||
Owned and leased hotels Adjusted EBITDA | $ | 321 | $ | 311 | $ | 10 | 3.2 | % | ||||||
Pro rata share of unconsolidated hospitality ventures Adjusted EBITDA | 79 | 63 | 16 | 25.4 | % | |||||||||
Segment Adjusted EBITDA | $ | 400 | $ | 374 | $ | 26 | 7.0 | % | ||||||
Owned and leased hotels Adjusted EBITDA. Adjusted EBITDA at our comparable owned and leased hotels increased $6 million and $14 million during the three and nine months ended September 30, 2016, respectively, compared to the same periods in 2015, which included $1 million and $5 million in net unfavorable currency impact. These increases were largely due to revenue growth in the United States and Mexico. Partially offsetting the revenue growth in the nine months ended September 30, 2016 were increased payroll and related costs and property taxes at certain properties. Adjusted EBITDA at our non-comparable hotels increased $2 million during the three months ended September 30, 2016, compared to the same period in 2015, primarily driven by the opening of Grand Hyatt Rio de Janeiro, partially offset by the sale of Andaz 5th Avenue. Adjusted EBITDA at our non-comparable hotels decreased $4 million during the nine months ended September 30, 2016, compared to the same period in 2015, primarily driven by the sale of Andaz 5th Avenue and the acquisition of The Confidante Miami Beach.
Pro rata share of unconsolidated hospitality ventures Adjusted EBITDA. Our pro rata share of Adjusted EBITDA from our unconsolidated hospitality ventures included an insignificant currency impact during the three and nine months ended September 30, 2016, respectively, compared to the same periods in 2015. The increases during the three and nine months ended September 30, 2016, compared to the same periods in 2015 were primarily driven by hotel openings and improved performance at hotels within two ventures that operate in resort markets.
In the event of successful completion of the Playa IPO, our common stock investment in Playa may be recharacterized as an investment in an equity security. Depending on both the magnitude of the Playa IPO and the amount of our common stock ownership subsequent to the Playa IPO, we may no longer account for our investment under the equity method of accounting. In this situation, our share of Playa’s results would no longer be included in our pro rata share of unconsolidated ventures Adjusted EBITDA, which comprised approximately one third of the pro rata share of unconsolidated ventures Adjusted EBITDA for the nine months ended September 30, 2016.
38
Americas management and franchising segment revenues.
Three Months Ended September 30, | ||||||||||||||
(in millions, except percentages) | 2016 | 2015 | Better / (Worse) | |||||||||||
Segment Revenues | ||||||||||||||
Management, Franchise and Other Fees | $ | 90 | $ | 85 | $ | 5 | 5.9 | % | ||||||
Other Revenues from Managed Properties | 409 | 409 | — | — | % | |||||||||
Total Segment Revenues | $ | 499 | $ | 494 | $ | 5 | 1.0 | % | ||||||
Nine Months Ended September 30, | ||||||||||||||
(in millions, except percentages) | 2016 | 2015 | Better / (Worse) | |||||||||||
Segment Revenues | ||||||||||||||
Management, Franchise and Other Fees | $ | 281 | $ | 269 | $ | 12 | 4.5 | % | ||||||
Other Revenues from Managed Properties | 1,266 | 1,225 | 41 | 3.3 | % | |||||||||
Total Segment Revenues | $ | 1,547 | $ | 1,494 | $ | 53 | 3.5 | % | ||||||
Americas management and franchising revenues included an insignificant and $1 million net unfavorable currency impact in the three and nine months ended September 30, 2016, respectively, compared to the same periods in 2015.
Management, franchise and other fees increased $5 million and $12 million during the three and nine months ended September 30, 2016, respectively, compared to the three and nine months ended September 30, 2015. Franchise fees increased $3 million and $10 million, respectively, compared to the same periods in the prior year primarily driven by converted full service hotels, new select service hotels and improved performance at existing hotels. Management fees increased $3 million and $5 million, respectively, compared to the same periods in the prior year. The increases during the three and nine months ended September 30, 2016 were driven by a $2 million and $3 million increase in base fees, respectively, primarily related to increased fees due to strong RevPAR growth at select service hotels and a recent full service hotel opening. The three and nine months ended September 30, 2016 also included increased incentive fees of $1 million and $2 million, respectively, spread across the portfolio. Other fee revenues decreased $1 million and $3 million during the three and nine months ended September 30, 2016, respectively, compared to the same periods in the prior year as the 2015 periods included termination fees of $2 million and $3 million, respectively.
Other revenues from managed properties were flat during the three months ended September 30, 2016, compared to the three months ended September 30, 2015, due to decreased full service hotels payroll and related costs driven by hotel conversions and one hotel that left the chain, offset by increased reimbursements related to our Hyatt Gold Passport program due to increased member participation. Other revenues from managed properties increased $41 million during the nine months ended September 30, 2016, compared to the nine months ended September 30, 2015, due to a higher volume of reimbursements paid to us by our managed properties for increased member participation in our Hyatt Gold Passport program and increased select service hotels payroll and related costs, partially offset by decreased full service hotels payroll and related costs driven by hotel conversions and one hotel that left the chain.
Three Months Ended September 30, | ||||||||||||||||||||||||||||||||||||
RevPAR | Occupancy | ADR | ||||||||||||||||||||||||||||||||||
(Comparable Systemwide Hotels) | 2016 | 2015 | Better / (Worse) | Better / (Worse) Constant $ | 2016 | 2015 | Change in Occ % pts | 2016 | 2015 | Better / (Worse) | Better / (Worse) Constant $ | |||||||||||||||||||||||||
Americas Full Service | $ | 158 | $ | 152 | 3.6 | % | 3.8 | % | 79.5 | % | 78.8 | % | 0.7 | % | $ | 199 | $ | 193 | 2.7 | % | 2.9 | % | ||||||||||||||
Americas Select Service | $ | 110 | $ | 106 | 4.6 | % | 4.6 | % | 81.7 | % | 80.9 | % | 0.8 | % | $ | 135 | $ | 131 | 3.5 | % | 3.6 | % | ||||||||||||||
39
Nine Months Ended September 30, | ||||||||||||||||||||||||||||||||||||
RevPAR | Occupancy | ADR | ||||||||||||||||||||||||||||||||||
(Comparable Systemwide Hotels) | 2016 | 2015 | Better / (Worse) | Better / (Worse) Constant $ | 2016 | 2015 | Change in Occ % pts | 2016 | 2015 | Better / (Worse) | Better / (Worse) Constant $ | |||||||||||||||||||||||||
Americas Full Service | $ | 154 | $ | 150 | 2.6 | % | 3.1 | % | 76.9 | % | 77.0 | % | (0.1 | )% | $ | 200 | $ | 195 | 2.7 | % | 3.3 | % | ||||||||||||||
Americas Select Service | $ | 107 | $ | 101 | 6.0 | % | 6.0 | % | 79.7 | % | 77.8 | % | 1.9 | % | $ | 134 | $ | 130 | 3.4 | % | 3.5 | % | ||||||||||||||
Our full service hotels comparable RevPAR increased in the three months ended September 30, 2016 compared to the same periods in the prior year primarily due to transient ADR growth, as well as group occupancy and ADR growth, partly driven by the shift of the Jewish holidays out of the third quarter of 2016 and into the fourth quarter of 2016. Our full service hotels comparable RevPAR increased in the nine months ended September 30, 2016 compared to the same period in the prior year primarily due to increased transient occupancy and ADR, as well as increased group ADR.
During the three months ended September 30, 2016, no properties were removed from the comparable Americas full service or select service systemwide hotels. During the nine months ended September 30, 2016, we removed one property from the comparable Americas full service systemwide hotels that left the chain and no properties were removed from the comparable Americas select service systemwide hotels.
Americas management and franchising segment Adjusted EBITDA.
Three Months Ended September 30, | ||||||||||||||
(in millions, except percentages) | 2016 | 2015 | Better / (Worse) | |||||||||||
Segment Adjusted EBITDA | $ | 77 | $ | 74 | $ | 3 | 4.1 | % | ||||||
Nine Months Ended September 30, | ||||||||||||||
(in millions, except percentages) | 2016 | 2015 | Better / (Worse) | |||||||||||
Segment Adjusted EBITDA | $ | 242 | $ | 229 | $ | 13 | 5.7 | % | ||||||
Adjusted EBITDA increased in the three and nine months ended September 30, 2016, which included an insignificant and $1 million net unfavorable currency impact, respectively, compared to the three and nine months ended September 30, 2015, due primarily to the aforementioned $5 million and $12 million increase in management, franchise and other fees, respectively.
ASPAC management and franchising segment revenues.
Three Months Ended September 30, | ||||||||||||||
(in millions, except percentages) | 2016 | 2015 | Better / (Worse) | |||||||||||
Segment Revenues | ||||||||||||||
Management, Franchise and Other Fees | $ | 23 | $ | 21 | $ | 2 | 9.5 | % | ||||||
Other Revenues from Managed Properties | 24 | 19 | 5 | 26.3 | % | |||||||||
Total Segment Revenues | $ | 47 | $ | 40 | $ | 7 | 17.5 | % | ||||||
Nine Months Ended September 30, | ||||||||||||||
(in millions, except percentages) | 2016 | 2015 | Better / (Worse) | |||||||||||
Segment Revenues | ||||||||||||||
Management, Franchise and Other Fees | $ | 67 | $ | 65 | $ | 2 | 3.1 | % | ||||||
Other Revenues from Managed Properties | 72 | 59 | 13 | 22.0 | % | |||||||||
Total Segment Revenues | $ | 139 | $ | 124 | $ | 15 | 12.1 | % | ||||||
ASPAC management and franchising total revenues included an insignificant and $1 million net unfavorable currency impact in the three and nine months ended September 30, 2016, respectively, compared to the three and nine months ended September 30, 2015. The increases in other revenues from managed properties in both the
40
three and nine month periods were driven by a higher volume of reimbursements paid to us by our managed properties for increased member participation in our Hyatt Gold Passport program.
Three Months Ended September 30, | ||||||||||||||||||||||||||||||||||||
RevPAR | Occupancy | ADR | ||||||||||||||||||||||||||||||||||
(Comparable Systemwide Hotels) | 2016 | 2015 | Better / (Worse) | Better / (Worse) Constant $ | 2016 | 2015 | Change in Occ % pts | 2016 | 2015 | Better / (Worse) | Better (Worse) Constant $ | |||||||||||||||||||||||||
ASPAC Full Service | $ | 149 | $ | 143 | 4.4 | % | 1.8 | % | 73.1 | % | 70.1 | % | 3.0 | % | $ | 204 | $ | 204 | 0.1 | % | (2.4 | )% | ||||||||||||||
Nine Months Ended September 30, | ||||||||||||||||||||||||||||||||||||
RevPAR | Occupancy | ADR | ||||||||||||||||||||||||||||||||||
(Comparable Systemwide Hotels) | 2016 | 2015 | Better / (Worse) | Better / (Worse) Constant $ | 2016 | 2015 | Change in Occ % pts | 2016 | 2015 | Better / (Worse) | Better (Worse) Constant $ | |||||||||||||||||||||||||
ASPAC Full Service | $ | 144 | $ | 142 | 1.0 | % | 1.7 | % | 69.6 | % | 67.2 | % | 2.4 | % | $ | 207 | $ | 212 | (2.6 | )% | (2.0 | )% | ||||||||||||||
Excluding the favorable currency impact, the increase in comparable full service RevPAR during the three months ended September 30, 2016 compared to the same period in 2015 was driven by increased occupancy in Hong Kong, South Korea and Southeast Asia. These increases were partially offset by decreased occupancy in Japan and decreased ADR in Hong Kong and certain hotels in Southeast Asia. Excluding the unfavorable currency impact, the increase in comparable full service RevPAR during the nine months ended September 30, 2016 compared to the same period in 2015 was driven by increased occupancy in most areas of China, South Korea and Southeast Asia. These increases were partially offset by decreased ADR in China and certain hotels in Southeast Asia.
During the three months ended September 30, 2016, no properties were removed from the comparable ASPAC full service systemwide hotels. During the nine months ended September 30, 2016, we removed two properties from the comparable ASPAC full service systemwide hotels, one as a result of a significant renovation and one that left the chain.
ASPAC management and franchising segment Adjusted EBITDA.
Three Months Ended September 30, | ||||||||||||||
(in millions, except percentages) | 2016 | 2015 | Better / (Worse) | |||||||||||
Segment Adjusted EBITDA | $ | 14 | $ | 12 | $ | 2 | 16.7 | % | ||||||
Nine Months Ended September 30, | ||||||||||||||
(in millions, except percentages) | 2016 | 2015 | Better / (Worse) | |||||||||||
Segment Adjusted EBITDA | $ | 38 | $ | 37 | $ | 1 | 2.7 | % | ||||||
Adjusted EBITDA included an insignificant and $1 million net unfavorable currency impact in the three and nine months ended September 30, 2016, respectively, compared to the three and nine months ended September 30, 2015. The increase in Adjusted EBITDA in the three and nine months ended September 30, 2016 compared to the same periods in prior year, was primarily driven by an increase in management, franchise and other fees. The increase in management, franchise and other fees in the nine months ended September 30, 2016 was partially offset by an increase in payroll and related costs.
41
EAME/SW Asia management segment revenues.
Three Months Ended September 30, | ||||||||||||||
(in millions, except percentages) | 2016 | 2015 | Better / (Worse) | |||||||||||
Segment Revenues | ||||||||||||||
Management and Other Fees | $ | 15 | $ | 16 | $ | (1 | ) | (6.3 | )% | |||||
Other Revenues from Managed Properties | 15 | 12 | 3 | 25.0 | % | |||||||||
Total Segment Revenues | $ | 30 | $ | 28 | $ | 2 | 7.1 | % | ||||||
Nine Months Ended September 30, | ||||||||||||||
(in millions, except percentages) | 2016 | 2015 | Better / (Worse) | |||||||||||
Segment Revenues | ||||||||||||||
Management and Other Fees | $ | 47 | $ | 49 | $ | (2 | ) | (4.1 | )% | |||||
Other Revenues from Managed Properties | 47 | 40 | 7 | 17.5 | % | |||||||||
Total Segment Revenues | $ | 94 | $ | 89 | $ | 5 | 5.6 | % | ||||||
EAME/SW Asia management total revenues included an insignificant and $1 million net unfavorable currency impact, respectively, in the three and nine months ended September 30, 2016 compared to the three and nine months ended September 30, 2015. Excluding the unfavorable currency impact, the increase in both periods was primarily driven by an increase in other revenues from managed properties.
Three Months Ended September 30, | ||||||||||||||||||||||||||||||||||||
RevPAR | Occupancy | ADR | ||||||||||||||||||||||||||||||||||
(Comparable Systemwide Hotels) | 2016 | 2015 | Better / (Worse) | Better / (Worse) Constant $ | 2016 | 2015 | Change in Occ % pts | 2016 | 2015 | Better / (Worse) | Better / (Worse) Constant $ | |||||||||||||||||||||||||
EAME/SW Asia Full Service | $ | 121 | $ | 134 | (9.7 | )% | (7.8 | )% | 64.6 | % | 63.8 | % | 0.8 | % | $ | 187 | $ | 210 | (10.7 | )% | (8.8 | )% | ||||||||||||||
EAME/SW Asia Select Service | $ | 66 | $ | 63 | 4.7 | % | 5.0 | % | 73.9 | % | 66.8 | % | 7.1 | % | $ | 89 | $ | 94 | (5.3 | )% | (5.1 | )% | ||||||||||||||
Nine Months Ended September 30, | ||||||||||||||||||||||||||||||||||||
RevPAR | Occupancy | ADR | ||||||||||||||||||||||||||||||||||
(Comparable Systemwide Hotels) | 2016 | 2015 | Better / (Worse) | Better / (Worse) Constant $ | 2016 | 2015 | Change in Occ % pts | 2016 | 2015 | Better / (Worse) | Better / (Worse) Constant $ | |||||||||||||||||||||||||
EAME/SW Asia Full Service | $ | 120 | $ | 132 | (8.4 | )% | (5.4 | )% | 63.2 | % | 63.6 | % | (0.4 | )% | $ | 190 | $ | 207 | (7.9 | )% | (4.9 | )% | ||||||||||||||
EAME/SW Asia Select Service | $ | 69 | $ | 62 | 10.5 | % | 11.2 | % | 71.0 | % | 62.6 | % | 8.4 | % | $ | 97 | $ | 99 | (2.6 | )% | (2.0 | )% | ||||||||||||||
Excluding the unfavorable currency impact, the decrease in comparable full service RevPAR during the three and nine months ended September 30, 2016 compared to the same periods in 2015, was driven by decreased ADR and occupancy in France, Switzerland and Turkey. These decreases were partially offset by increased ADR and occupancy in Eastern Europe and India. The nine months ended September 30, 2016 compared to the same period in 2015 also included decreased ADR and occupancy in Africa.
During the three and nine months ended September 30, 2016, two properties were removed from the comparable EAME/SW Asia full service systemwide hotel results as a result of significant renovations and no properties were removed from the comparable EAME/SW Asia select service systemwide hotel results. One of the properties removed from the comparable systemwide hotel results, Hyatt Regency Paris Étoile, was removed this quarter as the renovation will take longer than originally anticipated. Removing this hotel from the comparable hotel results yielded an increase in EAME/SW Asia full service RevPAR of 300 basis points.
42
EAME/SW Asia management segment Adjusted EBITDA.
Three Months Ended September 30, | ||||||||||||||
(in millions, except percentages) | 2016 | 2015 | Better / (Worse) | |||||||||||
Segment Adjusted EBITDA | $ | 8 | $ | 7 | $ | 1 | 14.3 | % | ||||||
Nine Months Ended September 30, | ||||||||||||||
(in millions, except percentages) | 2016 | 2015 | Better / (Worse) | |||||||||||
Segment Adjusted EBITDA | $ | 24 | $ | 23 | $ | 1 | 4.3 | % | ||||||
Adjusted EBITDA included an insignificant and $1 million net unfavorable currency impact during the three and nine months ended September 30, 2016, respectively, compared to the three and nine months ended September 30, 2015. The increase in Adjusted EBITDA during the three and nine months ended September 30, 2016 was primarily driven by a decrease in payroll and related costs.
Corporate and other. Corporate and other included unallocated corporate expenses, license fees related to Hyatt Residence Club, and the results of our co-branded credit card.
Three Months Ended September 30, | ||||||||||||||
(in millions, except percentages) | 2016 | 2015 | Better / (Worse) | |||||||||||
Corporate and other revenues | $ | 12 | $ | 10 | $ | 2 | 20.0 | % | ||||||
Corporate and other Adjusted EBITDA | $ | (27 | ) | $ | (32 | ) | $ | 5 | 15.6 | % | ||||
Nine Months Ended September 30, | ||||||||||||||
(in millions, except percentages) | 2016 | 2015 | Better / (Worse) | |||||||||||
Corporate and other revenues | $ | 34 | $ | 29 | $ | 5 | 17.2 | % | ||||||
Corporate and other Adjusted EBITDA | $ | (91 | ) | $ | (92 | ) | $ | 1 | 1.1 | % | ||||
The increase in Adjusted EBITDA during the three months ended September 30, 2016, compared to the same period in the prior year is driven by a $4 million decrease in adjusted selling, general, and administrative costs, primarily in professional fees, due to certain initiatives completed during 2015. The increase in Adjusted EBITDA during the nine months ended September 30, 2016, compared to the same period in the prior year is driven by a $5 million increase in revenues related to our co-branded credit card, partially offset by a corresponding $3 million increase in other direct costs.
Non-GAAP Measures
Adjusted Earnings Before Interest Expense, Taxes, Depreciation and Amortization ("Adjusted EBITDA") and EBITDA
We use the terms Adjusted EBITDA and EBITDA throughout this quarterly report. Adjusted EBITDA and EBITDA, as we define them, are non-GAAP measures. We define consolidated Adjusted EBITDA as net income attributable to Hyatt Hotels Corporation plus our pro rata share of unconsolidated hospitality ventures Adjusted EBITDA based on our ownership percentage of each venture, adjusted to exclude the following items:
• | equity earnings (losses) from unconsolidated hospitality ventures; |
• | stock-based compensation expense; |
• | asset impairments; |
• | gains (losses) on sales of real estate; |
• | other income (loss), net; |
• | depreciation and amortization; |
• | interest expense; and |
• | provision for income taxes. |
Effective January 1, 2016, our definitions of Adjusted EBITDA and Adjusted selling, general, and administrative expenses, as defined below, have been updated to exclude stock-based compensation expense, to facilitate comparison with our competitors. We have applied this change in the definition of Adjusted EBITDA to 2015 historical results to allow for comparability between the periods presented.
We calculate consolidated Adjusted EBITDA by adding the Adjusted EBITDA of each of our reportable segments to corporate and other Adjusted EBITDA.
43
Our board of directors and executive management team focus on Adjusted EBITDA as a key performance and compensation measure both on a segment and on a consolidated basis. Adjusted EBITDA assists us in comparing our performance over various reporting periods on a consistent basis because it removes from our operating results the impact of items that do not reflect our core operating performance both on a segment and on a consolidated basis. Our President and Chief Executive Officer, who is our chief operating decision maker, also evaluates the performance of each of our reportable segments and determines how to allocate resources to those segments, in significant part, by assessing the Adjusted EBITDA of each segment. In addition, the compensation committee of our board of directors determines the annual variable compensation for certain members of our management based in part on consolidated Adjusted EBITDA, segment Adjusted EBITDA or some combination of both.
We believe Adjusted EBITDA is useful to investors because it provides investors the same information that we use internally for purposes of assessing our operating performance and making compensation decisions.
Adjusted EBITDA and EBITDA are not substitutes for net income attributable to Hyatt Hotels Corporation, net income, cash flows from operating activities or any other measure prescribed by GAAP. There are limitations to using non-GAAP measures such as Adjusted EBITDA and EBITDA. Although we believe that Adjusted EBITDA can make an evaluation of our operating performance more consistent because it removes items that do not reflect our core operations, other companies in our industry may define Adjusted EBITDA differently than we do. As a result, it may be difficult to use Adjusted EBITDA or similarly named non-GAAP measures that other companies may use to compare the performance of those companies to our performance. Because of these limitations, Adjusted EBITDA should not be considered as a measure of the income generated by our business or discretionary cash available to us to invest in the growth of our business. Our management compensates for these limitations by reference to our GAAP results and using Adjusted EBITDA supplementally. See our condensed consolidated statements of income and condensed consolidated statements of cash flows in our condensed consolidated financial statements included elsewhere in this quarterly report.
See below for a reconciliation of our consolidated Adjusted EBITDA to EBITDA and a reconciliation of EBITDA to net income attributable to Hyatt Hotels Corporation.
Adjusted selling, general and administrative expenses
Adjusted selling, general, and administrative expenses, as we define it, is a non-GAAP measure. Adjusted selling, general, and administrative expenses excludes the impact of expenses related to benefit programs funded through rabbi trusts and stock-based compensation expense. Adjusted selling, general, and administrative expenses assist us in comparing our performance over various reporting periods on a consistent basis since it removes from our operating results the impact of items that do not reflect our core operating performance, both on a segment and consolidated basis. See "—Results of Operations" above for a reconciliation of Adjusted selling, general, and administrative expenses to selling, general, and administrative expenses.
Constant dollar currency
We report the results of our operations both on an as reported basis, as well as on a constant dollar basis. Constant dollar currency, which is a non-GAAP measure, excludes the effects of movements in foreign currency exchange rates between comparative periods. We believe constant dollar analysis provides valuable information regarding our results as it removes currency fluctuations from our operating results. We calculate constant dollar currency by restating prior-period local currency financial results at the current period’s exchange rates. These adjusted amounts are then compared to our current period reported amounts to provide operationally driven variances in our results.
44
The charts below illustrate Adjusted EBITDA by segment for the three and nine months ended September 30, 2016 and September 30, 2015.
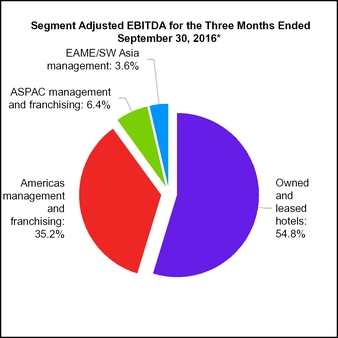
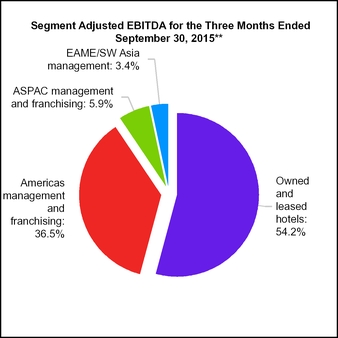
*Consolidated Adjusted EBITDA for the three months ended September 30, 2016 included Corporate and other Adjusted EBITDA of $(27) million
**Consolidated Adjusted EBITDA for the three months ended September 30, 2015 included Corporate and other Adjusted EBITDA of $(32) million
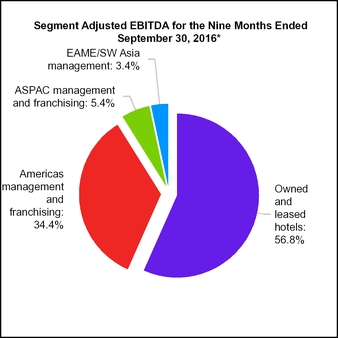

*Consolidated Adjusted EBITDA for the nine months ended September 30, 2016 included Corporate and other Adjusted EBITDA of $(91) million
**Consolidated Adjusted EBITDA for the nine months ended September 30, 2015 included Corporate and other Adjusted EBITDA of $(92) million
45
The table below provides a reconciliation of our consolidated Adjusted EBITDA to EBITDA and a reconciliation of EBITDA to net income attributable to Hyatt Hotels Corporation for the three and nine months ended September 30, 2016 and September 30, 2015:
(in millions) | Three Months Ended September 30, | |||||||||||||
2016 | 2015 | Better / (Worse) | ||||||||||||
Adjusted EBITDA | $ | 192 | $ | 171 | $ | 21 | 12.3 | % | ||||||
Equity earnings (losses) from unconsolidated hospitality ventures | 25 | (17 | ) | 42 | 247.1 | % | ||||||||
Stock-based compensation expense | (1 | ) | 1 | (2 | ) | (200.0 | )% | |||||||
Asset impairments | — | (5 | ) | 5 | 100.0 | % | ||||||||
Other income (loss), net | 4 | 11 | (7 | ) | (63.6 | )% | ||||||||
Pro rata share of unconsolidated hospitality ventures Adjusted EBITDA | (23 | ) | (21 | ) | (2 | ) | (9.5 | )% | ||||||
EBITDA | 197 | 140 | 57 | 40.7 | % | |||||||||
Depreciation and amortization | (87 | ) | (78 | ) | (9 | ) | (11.5 | )% | ||||||
Interest expense | (20 | ) | (17 | ) | (3 | ) | (17.6 | )% | ||||||
Provision for income taxes | (28 | ) | (20 | ) | (8 | ) | (40.0 | )% | ||||||
Net income attributable to Hyatt Hotels Corporation | $ | 62 | $ | 25 | $ | 37 | 148.0 | % | ||||||
(in millions) | Nine Months Ended September 30, | |||||||||||||
2016 | 2015 | Better / (Worse) | ||||||||||||
Adjusted EBITDA | $ | 613 | $ | 571 | $ | 42 | 7.4 | % | ||||||
Equity earnings (losses) from unconsolidated hospitality ventures | 46 | (46 | ) | 92 | 200.0 | % | ||||||||
Stock-based compensation expense | (21 | ) | (20 | ) | (1 | ) | (5.0 | )% | ||||||
Asset impairments | — | (5 | ) | 5 | 100.0 | % | ||||||||
Gains (losses) on sales of real estate | (21 | ) | 9 | (30 | ) | (333.3 | )% | |||||||
Other income (loss), net | 1 | (3 | ) | 4 | 133.3 | % | ||||||||
Pro rata share of unconsolidated hospitality ventures Adjusted EBITDA | (79 | ) | (63 | ) | (16 | ) | (25.4 | )% | ||||||
EBITDA | 539 | 443 | 96 | 21.7 | % | |||||||||
Depreciation and amortization | (254 | ) | (233 | ) | (21 | ) | (9.0 | )% | ||||||
Interest expense | (57 | ) | (51 | ) | (6 | ) | (11.8 | )% | ||||||
Provision for income taxes | (65 | ) | (72 | ) | 7 | 9.7 | % | |||||||
Net income attributable to Hyatt Hotels Corporation | $ | 163 | $ | 87 | $ | 76 | 87.4 | % | ||||||
Liquidity and Capital Resources
Overview
We finance our business primarily with existing cash, short-term investments and cash generated from our operations. As part of our business strategy, we also recycle capital by using net proceeds from dispositions to support our acquisitions and new investment opportunities. When appropriate, we borrow cash under our revolving credit facility or from other third-party sources, and may also raise funds by issuing debt or equity securities as necessary. We maintain a cash investment policy that emphasizes preservation of capital. At September 30, 2016 and December 31, 2015, we had cash and cash equivalents and short-term investments of $590 million and $503 million, respectively. We believe that our cash position, short-term investments and cash from operations, together with borrowing capacity under our revolving credit facility and our access to the capital markets, will be adequate to meet all of our funding requirements and capital deployment objectives for the foreseeable future.
46
We may, from time to time, seek to retire or purchase additional amounts of our outstanding equity and/or debt securities through cash purchases and/or exchanges for other securities, in open market purchases, privately negotiated transactions or otherwise, including pursuant to a Rule 10b5-1 plan. Such repurchases or exchanges, if any, will depend on prevailing market conditions, our liquidity requirements, contractual restrictions and other factors. The amounts involved may be material.
Recent Transactions Affecting our Liquidity and Capital Resources
During the nine months ended September 30, 2016 and September 30, 2015, several transactions impacted our liquidity. See "—Sources and Uses of Cash."
Sources and Uses of Cash
(in millions) | Nine Months Ended September 30, | ||||||
2016 | 2015 | ||||||
Cash provided by (used in): | |||||||
Operating activities | $ | 351 | $ | 396 | |||
Investing activities | (94 | ) | 24 | ||||
Financing activities | (185 | ) | (534 | ) | |||
Effect of exchange rate changes on cash | 15 | (2 | ) | ||||
Net increase (decrease) in cash and cash equivalents | $ | 87 | $ | (116 | ) | ||
Cash Flows from Operating Activities
Cash provided by operating activities decreased $45 million for the nine months ended September 30, 2016, compared to the nine months ended September 30, 2015, as 2015 included the release of restricted cash from one of our captive insurance companies which was invested in marketable securities. Additionally, the timing of certain accruals also contributed to the decrease, which was partially offset by a decrease in income tax payments.
Cash Flows from Investing Activities
During the nine months ended September 30, 2016:
• | We acquired Thompson Miami Beach for approximately $238 million. |
• | Capital expenditures were $140 million (see "—Capital Expenditures" below). |
• | We acquired Royal Palms Resort and Spa for a net purchase price of approximately $86 million. |
• | We invested $31 million in unconsolidated hospitality ventures. |
• | We sold Andaz 5th Avenue for approximately $240 million, net of closing costs and proration adjustments. |
• | We received distributions of $78 million from unconsolidated hospitality ventures. |
• | We sold the shares of the company that owns Hyatt Regency Birmingham (U.K.) for approximately $49 million, net of closing costs and proration adjustments. |
• | We released $29 million from restricted cash related to the finalization from the Canada Revenue Agency in connection with the 2014 disposition of Park Hyatt Toronto. |
During the nine months ended September 30, 2015:
• | We released $143 million from escrow to cash and cash equivalents related to release of proceeds from like-kind exchanges. |
• | We received net proceeds of $75 million from the maturity of time deposits. |
• | We sold Hyatt Regency Indianapolis for approximately $69 million. |
• | We received proceeds of $28 million from financing receivables. |
• | We released $19 million from restricted cash related to the development of a hotel in Brazil. |
• | We sold land and construction in progress for approximately $14 million and received $12 million in cash. |
• | We sold a Hyatt House hotel for approximately $5 million. |
47
• | Capital expenditures were $185 million (see "—Capital Expenditures" below). |
• | We had net purchases of $114 million of marketable securities and short-term investments related to Hyatt Gold Passport and our captive insurance companies. |
• | We invested $29 million in unconsolidated hospitality ventures. |
Cash Flows from Financing Activities
During the nine months ended September 30, 2016, we repurchased 5,556,424 shares of common stock for an aggregate purchase price of $268 million. During the nine months ended September 30, 2015, we repurchased 9,614,463 shares of common stock for an aggregate purchase price of $539 million.
During the nine months ended September 30, 2016, we issued our 2026 Notes and received net proceeds of $396 million, after deducting discounts and offering expenses of approximately $4 million. During the nine months ended September 30, 2016, all of our outstanding 2016 Notes were redeemed for $250 million.
During the nine months ended September 30, 2016, we repaid the senior secured term loan of $64 million related to Hyatt Regency Lost Pines Resort and Spa.
During the nine months ended September 30, 2016, we drew and subsequently repaid $110 million on our revolving credit facility. During the nine months ended September 30, 2015, we did not draw on our revolving credit facility.
We define net debt as total debt less the total of cash and cash equivalents and short-term investments. We consider net debt and its components to be an important indicator of liquidity and a guiding measure of capital structure strategy. Net debt is a non-GAAP measure and may not be computed the same as similarly titled measures used by other companies. The following table provides a summary of our debt to capital ratios:
(in millions, except percentages) | September 30, 2016 | December 31, 2015 | |||||
Consolidated debt (1) | $ | 1,466 | $ | 1,370 | |||
Stockholders’ equity | 3,913 | 3,991 | |||||
Total capital | 5,379 | 5,361 | |||||
Total debt to total capital | 27.3 | % | 25.6 | % | |||
Consolidated debt (1) | 1,466 | 1,370 | |||||
Less: Cash and cash equivalents and short-term investments | 590 | 503 | |||||
Net consolidated debt | $ | 876 | $ | 867 | |||
Net debt to total capital | 16.3 | % | 16.2 | % | |||
(1) | Excludes approximately $799 million and $692 million of our share of unconsolidated hospitality venture indebtedness at September 30, 2016 and December 31, 2015, respectively, substantially all of which is non-recourse to us and a portion of which we guarantee pursuant to separate agreements. |
Capital Expenditures
We routinely make capital expenditures to enhance our business. We classify our capital expenditures into maintenance, enhancements to existing properties and investment in new properties under development or recently opened. We have been and will continue to be prudent with respect to our capital spending, taking into account our cash flow from operations.
The following is a summary of our capital expenditures during the nine months ended September 30, 2016 and September 30, 2015:
(in millions) | September 30, 2016 | September 30, 2015 | |||||
Maintenance | $ | 42 | $ | 81 | |||
Enhancements to existing properties | 44 | 35 | |||||
Investment in new properties under development or recently opened | 54 | 69 | |||||
Total capital expenditures | $ | 140 | $ | 185 | |||
48
The decrease in maintenance expenditures in 2016 compared to 2015 is driven by decreased technology spending and decreased spending at domestic and international owned full service properties. The increase in enhancements to existing properties is driven by increased renovation activity at domestic owned full service properties and expenditures related to our new corporate office. Expenditures related to new properties under development or recently opened are primarily driven by construction spending on our development of a hotel in Brazil, which opened in early 2016, and two new select service hotels under development in the United States.
Senior Notes
The table below sets forth the outstanding principal balance of our Senior Notes at September 30, 2016. Interest on the Senior Notes is payable semi-annually.
Description | Principal Amount (in millions) | ||
2019 Notes | $ | 196 | |
2021 Notes | 250 | ||
2023 Notes | 350 | ||
2026 Notes | 400 | ||
Total | $ | 1,196 | |
We are in compliance with all applicable covenants under the indenture governing our Senior Notes as of September 30, 2016.
Revolving Credit Facility
There was no outstanding balance on our revolving credit facility at September 30, 2016 or December 31, 2015. At September 30, 2016, we had available borrowing capacity of approximately $1.5 billion under our revolving credit facility, net of outstanding undrawn letters of credit.
We are in compliance with all applicable covenants under the revolving credit facility at September 30, 2016.
Letters of Credit
We issue letters of credit either under the revolving credit facility or directly with financial institutions. At September 30, 2016 and December 31, 2015 we had a total of $238 million and $228 million, respectively, in letters of credit issued directly with financial institutions. These letters of credit had weighted-average fees of 99 basis points at September 30, 2016. The range of maturity on these letters of credit was up to five years at September 30, 2016.
Critical Accounting Policies and Estimates
The preparation of financial statements in accordance with GAAP requires management to make estimates and assumptions that affect reported amounts and related disclosures. We have discussed those estimates that we believe are critical and require the use of complex judgment in their application in our 2015 Form 10-K. Since the date of our 2015 Form 10-K, there have been no material changes to our critical accounting policies or the methodologies or assumptions we apply under them.
49
Item 3. Quantitative and Qualitative Disclosures About Market Risk.
We are exposed to market risk primarily from changes in interest rates and foreign currency exchange rates. In certain situations, we seek to reduce earnings and cash flow volatility associated with changes in interest rates and foreign currency exchange rates by entering into financial arrangements to provide a hedge against a portion of the risks associated with such volatility. We continue to have exposure to such risks to the extent they are not hedged. We enter into derivative financial arrangements to the extent they meet the objectives described above, and we do not use derivatives for trading or speculative purposes. At September 30, 2016 and December 31, 2015, we were a party to hedging transactions, including the use of derivative financial instruments, as discussed below.
Interest Rate Risk
In the normal course of business, we are exposed to the impact of interest rate changes due to our borrowing activities. Our objective is to manage the risk of interest rate changes on the results of operations, cash flows, and the market value of our debt by creating an appropriate balance between our fixed and floating-rate debt. We enter into interest rate derivative transactions from time to time, including interest rate swaps, in order to maintain a level of exposure to interest rate variability that we deem acceptable. At September 30, 2016 and December 31, 2015, we held no interest rate swap contracts.
Foreign Currency Exposures and Exchange Rate Instruments
We transact business in various foreign currencies and utilize foreign currency forward contracts to offset our exposure associated with the fluctuations of certain foreign currencies. These foreign currency exposures typically arise from third-party debt, debt repayment guarantees and intercompany transactions.
The U.S. dollar equivalents of the notional amounts of the outstanding forward contracts, the majority of which relate to intercompany transactions, with terms of less than one year, were as follows (in U.S. dollars):
(in millions) | September 30, 2016 | December 31, 2015 | |||||
Pound sterling | $ | 142 | $ | 170 | |||
Korean won | 34 | 33 | |||||
Canadian dollar | 33 | 61 | |||||
Swiss franc | 21 | 9 | |||||
Indian rupee | — | 27 | |||||
Brazilian real | — | 4 | |||||
Total notional amount of forward contracts | $ | 230 | $ | 304 | |||
We intend to offset the gains and losses related to our third-party debt, debt repayment guarantees and intercompany transactions with gains or losses on our foreign currency forward contracts such that there is a negligible effect on net income. The effect of these derivatives instruments within other income (loss), net on our condensed consolidated statements of income were gains of $3 million and $16 million for the three and nine months ended September 30, 2016, respectively. For the three and nine months ended September 30, 2015, the effect of these derivative instruments within other income (loss), net were gains of $12 million and $16 million, respectively. We expect to continue this practice relating to our intercompany transactions, and may also begin to manage the risks associated with other transactional foreign currency volatility within our business.
50
Item 4. Controls and Procedures.
Disclosure Controls and Procedures. We maintain a set of disclosure controls and procedures designed to ensure that information required to be disclosed by the Company in reports that it files or submits under the Securities Exchange Act of 1934, as amended (the "Exchange Act"), is recorded, processed, summarized and reported within the time periods specified in SEC rules and forms. In accordance with Rule 13a-15(b) of the Exchange Act, as of the end of the period covered by this quarterly report, an evaluation was carried out under the supervision and with the participation of our management, including our Principal Executive Officer and Principal Financial Officer, of the effectiveness of our disclosure controls and procedures. Based on that evaluation, our Principal Executive Officer and Principal Financial Officer concluded that our disclosure controls and procedures, as of the end of the period covered by this quarterly report, were effective to provide reasonable assurance that information required to be disclosed by the Company in reports that it files or submits under the Exchange Act is recorded, processed, summarized and reported within the time periods specified in SEC rules and forms and is accumulated and communicated to our management, including the Principal Executive Officer and Principal Financial Officer, as appropriate to allow timely decisions regarding required disclosure.
Changes in Internal Control Over Financial Reporting. There has been no change in our internal control over financial reporting during our most recent fiscal quarter that has materially affected, or is reasonably likely to materially affect, our internal control over financial reporting.
51
PART II. OTHER INFORMATION
Item 1. Legal Proceedings.
We are involved in various claims and lawsuits arising in the normal course of business, including proceedings involving tort and other general liability claims, workers' compensation and other employee claims, intellectual property claims and claims related to our management of certain hotel properties. Most occurrences involving liability, claims of negligence and employees are covered by insurance with solvent insurance carriers. We recognize a liability when we believe the loss is probable and reasonably estimable. We currently believe that the ultimate outcome of such lawsuits and proceedings will not, individually or in the aggregate, have a material effect on our consolidated financial position, results of operations or liquidity.
Item 1A. Risk Factors.
At September 30, 2016, there have been no material changes from the risk factors previously disclosed in response to Item 1A. to Part I of our Annual Report on Form 10-K for the fiscal year ended December 31, 2015.
Item 2. Unregistered Sales of Equity Securities and Use of Proceeds.
Issuer Purchases of Equity Securities
The following table sets forth information regarding our purchases of shares of Class A and Class B common stock during the quarter ended September 30, 2016:
Total Number of Shares Purchased (1) | Weighted Average Price Paid per Share | Total Number of Shares Purchased as Part of Publicly Announced Plans | Maximum Number (or Approximate Dollar Value) of Shares that May Yet Be Purchased under the Program | |||||||||||
July 1 to July 31, 2016 | 399,249 | $ | 50.09 | 399,249 | $ | 227,969,499 | ||||||||
August 1 to August 31, 2016 | 2,208,185 | $ | 52.98 | 2,208,185 | $ | 110,972,257 | ||||||||
September 1 to September 30, 2016 | — | $ | — | — | $ | 110,972,257 | ||||||||
Total | 2,607,434 | $ | 52.54 | 2,607,434 | ||||||||||
(1) | On February 18, 2016, we announced the approval of an expansion of our share repurchase program pursuant to which we are authorized to purchase up to an additional $250 million of Class A and Class B common stock in the open market, in privately negotiated transactions, or otherwise, including pursuant to a Rule 10b5-1 plan. The repurchase program does not have an expiration date. At September 30, 2016, we had approximately $111 million remaining under our current share repurchase authorization. |
52
Item 3. Defaults Upon Senior Securities.
None.
Item 4. Mine Safety Disclosures.
Not Applicable.
Item 5. Other Information.
On November 1, 2016, we filed a Certificate of Retirement with the Secretary of State of the State of Delaware to retire 500,000 shares of Class B common stock, $0.01 par value per share, of the Company (the "Class B Common Stock"). All 500,000 shares of Class B Common Stock were converted into shares of Class A common stock, $0.01 par value per share, of the Company (the "Class A Common Stock"), in connection with the sale of 500,000 shares of Class B Common Stock by certain selling stockholders into the public market pursuant to an automatic shelf registration statement on Form S-3 (File No. 333-196372) filed with the SEC on May 29, 2014. Our Amended and Restated Certificate of Incorporation requires that any shares of Class B Common Stock that are converted into shares of Class A Common Stock be retired and may not be reissued.
Effective upon filing, the Certificate of Retirement amended our Amended and Restated Certificate of Incorporation to reduce the total authorized number of shares of capital stock of the Company by 500,000 shares. The total number of authorized shares of the Company is now 1,449,241,738, such shares consisting of 1,000,000,000 shares designated Class A Common Stock, 439,241,738 shares designated Class B Common Stock, and 10,000,000 shares designated Preferred Stock, par value $0.01 per share. A copy of the Certificate of Retirement is attached as Exhibit 3.3 to this Quarterly Report on Form 10-Q.
53
Item 6. Exhibits.
Exhibit Number | Exhibit Description |
3.1 | Amended and Restated Certificate of Incorporation of Hyatt Hotels Corporation |
3.2 | Amended and Restated Bylaws of Hyatt Hotels Corporation (incorporated by reference to Exhibit 3.2 to the Company's Current Report on Form 8-K (File No. 001-34521) filed with the Securities and Exchange Commission on September 11, 2014) |
3.3 | Certificate of Retirement of 500,000 shares of Class B Common Stock |
10.1 | Hyatt Hotels Corporation Amended and Restated Summary of Non-Employee Director Compensation (Effective January 1, 2017) |
31.1 | Certification of the Chief Executive Officer pursuant to Rules 13a-14(a) and 15d-14(a) of the Securities Exchange Act of 1934, as amended, as adopted pursuant to Section 302 of the Sarbanes-Oxley Act of 2002 |
31.2 | Certification of the Chief Financial Officer pursuant to Rules 13a-14(a) and 15d-14(a) of the Securities Exchange Act of 1934, as amended, as adopted pursuant to Section 302 of the Sarbanes-Oxley Act of 2002 |
32.1 | Certification of the Chief Executive Officer pursuant to 18 U.S.C. Section 1350, as adopted pursuant to Section 906 of the Sarbanes-Oxley Act of 2002 |
32.2 | Certification of the Chief Financial Officer pursuant to 18 U.S.C. Section 1350, as adopted pursuant to Section 906 of the Sarbanes-Oxley Act of 2002 |
101.INS | XBRL Instance Document |
101.SCH | XBRL Taxonomy Extension Schema Document |
101.CAL | XBRL Taxonomy Extension Calculation Linkbase Document |
101.DEF | XBRL Taxonomy Extension Definition Linkbase Document |
101.LAB | XBRL Taxonomy Extension Label Linkbase Document |
101.PRE | XBRL Taxonomy Extension Presentation Linkbase Document |
54
SIGNATURES
Pursuant to the requirements of the Securities Exchange Act of 1934, the registrant has duly caused this report to be signed on its behalf by the undersigned thereunto duly authorized.
Hyatt Hotels Corporation | |||
Date: | November 3, 2016 | By: | /s/ Mark S. Hoplamazian |
Mark S. Hoplamazian | |||
President and Chief Executive Officer | |||
(Principal Executive Officer) | |||
Pursuant to the requirements of the Securities Exchange Act of 1934, this report has been signed by the undersigned, in his capacity as the principal financial officer of the registrant.
Hyatt Hotels Corporation | |||
Date: | November 3, 2016 | By: | /s/ Patrick J. Grismer |
Patrick J. Grismer | |||
Executive Vice President, Chief Financial Officer | |||
(Principal Financial Officer) | |||
55