Attached files
| file | filename |
|---|---|
| 8-K - WEX INC. 8-K - WEX Inc. | a52467302.htm |
Exhibit 99.1

WEX Second Quarter
2021 Earnings July 29, 2021

This earnings release contains forward-looking statements, including statements regarding: expectations
for future revenue and adjusted net income performance; assumptions underlying the Company's future financial performance and future operations; future growth opportunities and expectations; future impacts from areas of investment; expectations
for the macro environment; and expectations for volumes. Any statements that are not statements of historical facts may be deemed to be forward-looking statements. When used in this earnings release, the words “anticipate,” “believe,”
“continue,” “could,” “estimate,” “expect,” “intend,” “may,” “plan,” “project” and similar expressions are intended to identify forward-looking statements, although not all forward-looking statements contain such words. These forward-looking
statements are subject to a number of risks and uncertainties that could cause actual results to differ materially, including: the extent to which the coronavirus (COVID-19) pandemic and measures taken in response thereto impact our business,
results of operations and financial condition in excess of current expectations; the impact of fluctuations in fuel prices and the resulting impact on our revenues and net income; the effects of general economic conditions, including those
caused by the effects of COVID-19, on overall employment, travel and fueling patterns as well as payment and transaction processing activity; changes or limitations on interchange fees; failure to comply with the applicable requirements of
MasterCard or Visa contracts and rules; the Company’s failure to maintain or renew key commercial agreements or to maintain volumes under such agreements; breaches of the Company’s technology systems or those of our third-party service
providers and any resulting negative impact on our reputation, liabilities or relationships with customers or merchants; the effects of the Company’s business expansion and acquisition efforts; failure to expand the Company’s technological
capabilities and service offerings as rapidly as the Company’s competitors; the failure of corporate investments to result in anticipated strategic value; the actions of regulatory bodies, including banking and securities regulators, or
possible changes in banking or financial regulations impacting the Company’s industrial bank, the Company as the corporate parent or other subsidiaries or affiliates; the Company’s failure to comply with the Treasury Regulations applicable to
non-bank custodians; potential adverse changes to business or employee relationships, including those resulting from the completion of an acquisition; competitive responses to any acquisitions; uncertainty of the expected financial performance
of the combined operations following completion of an acquisition; the failure to complete or successfully integrate the Company’s acquisitions or the ability to realize anticipated synergies and cost savings from such transactions; unexpected
costs, charges or expenses resulting from an acquisition; the Company’s failure to successfully acquire, integrate, operate and expand commercial fuel card programs; the impact and size of credit losses; the impact of changes to the Company’s
credit standards; failure to successfully implement the Company’s information technology strategies and capabilities in connection with its technology outsourcing and insourcing arrangements, and any resulting cost associated with that failure;
legal, regulatory, political and economic uncertainty surrounding the United Kingdom’s departure from the European Union and the resulting trade agreement; the impact of foreign currency exchange rates on the Company’s operations, revenue and
income; changes in interest rates; the impact of the future transition from LIBOR as a global benchmark to a replacement rate; the impact of the Company’s recently amended and restated credit agreement and its presently outstanding notes on our
operations; the impact of increased leverage on the Company’s operations, results or borrowing capacity generally, and as a result of acquisitions specifically; the impact of sales or dispositions of significant amounts of our outstanding
common stock into the public market, or the perception that such sales or dispositions could occur; the possible dilution to our stockholders caused by the issuance of additional shares of common stock or equity-linked securities, whether as
result of our convertible notes or otherwise; the incurrence of impairment charges if our assessment of the fair value of certain of our reporting units changes; the uncertainties of litigation; as well as other risks and uncertainties
identified in Item 1A of our annual report on Form 10-K for the year ended December 31, 2020, filed with the Securities and Exchange Commission on March 1, 2021. The Company's forward-looking statements do not reflect the potential future
impact of any alliance, merger, acquisition, disposition or stock repurchases. The forward-looking statements speak only as of the date of this earnings release and undue reliance should not be placed on these statements. The Company disclaims
any obligation to update any forward-looking statements as a result of new information, future events or otherwise.Non-GAAP Information:For additional important information and disclosure regarding our use of non-GAAP metrics, specifically
adjusted net income attributable to shareholders and adjusted operating income, please see our most recent earnings release, issued on July 29, 2021. See the Appendix to this presentation for an explanation and reconciliation of (i) non-GAAP
adjusted net income attributable to shareholders (or “adjusted net income” or “ANI”) to GAAP net (loss) income attributable to shareholders, and (ii) ANI per diluted share to GAAP net (loss) income per diluted share.Note: The Company rounds
amounts in the consolidated financial statements to thousands and calculates all percentages and per-share data from underlying whole-dollar amounts. Thus, certain amounts may not foot, crossfoot, or recalculate exactly based on reported
numbers due to rounding. WEX Forward-Looking Statements
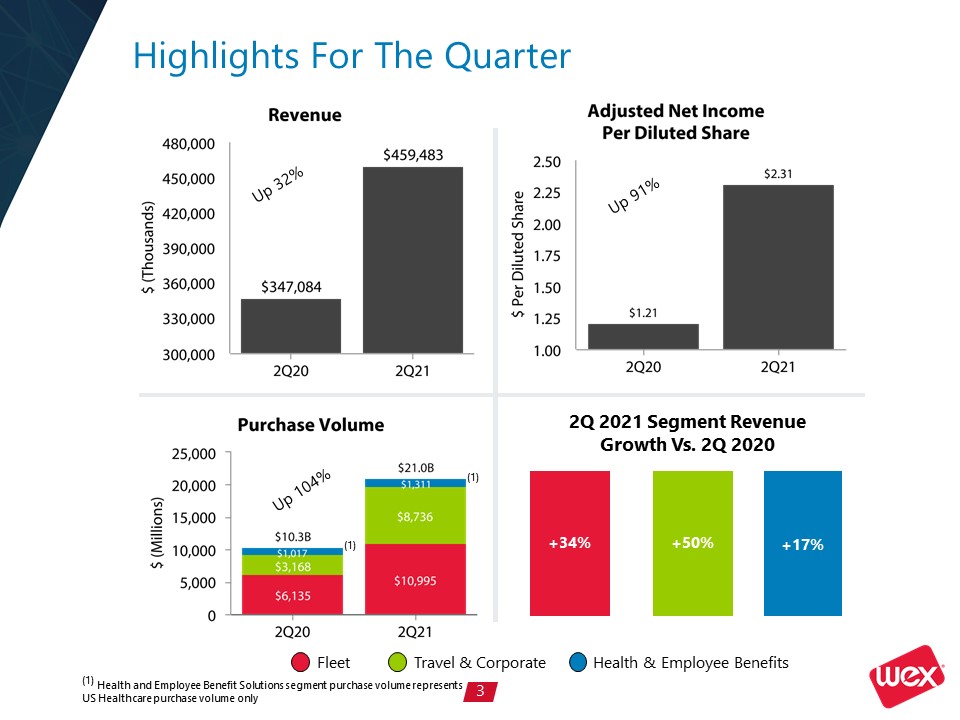
Highlights For The Quarter Fleet Travel & Corporate Health & Employee Benefits Up
32% Up 91% Up 104% 2Q 2021 Segment Revenue Growth Vs. 2Q 2020 +17% +50% +34% (1) Health and Employee Benefit Solutions segment purchase volume represents US Healthcare purchase volume only (1) (1)

Executing on our Commitments ACHIEVEMENTS THIS QUARTER INNOVATION / EXECUTION / INTEGRITY /
RELATIONSHIPS / COMMUNITY STRATEGIC PILLARS & CORE VALUES Exceeded high end of revenue expectations and adjusted earnings per share grew 29% sequentiallyMore than doubled volume, with $21 billion of purchase volume processed during Q2 vs
the prior yearExpanded margins, with strong momentum in organic growth and continued progress integrating acquired businessesIncreased TAM with further expansion of our health and benefit ecosystemIncreased focus and investment to further
capture digital opportunities across the companyIssued our inaugural ESG report, and as a result of our 2021 Annual Meeting of Shareholders, 5 of WEX’s Board members are women and 25% are ethnically diverseFostering a flexible work environment,
which allows our talent to focus on customer needs

Quarterly Highlights & Technology Closed acquisition of benefitexpressExpands WEX’s total
addressable market in the large health and employee benefits marketplaceStrong complement to existing consumer-directed health and lifestyle spending accounts businessForms full-service benefits marketplace with benefit administration,
compliance services, and consumer-directed health and lifestyle spending accountsElectric Vehicle (EV) payment solutionsProviding EV payment solutions, including data capture, seamless integration and secure payments solutions to
customersGeneral Services Administration, the largest public fleet in the U.S., uses WEX EV payment and reporting solutionsWell-positioned to address growing and future needs of EV customers BUILDING FOR THE FUTURE Best-in-class technology
platform and deep payment expertiseAllows WEX to seamlessly integrate into customers’ operations via APIsCloud-first approach enables modular integrated solutionsEasily integrate and implement new programs and unique ability to quickly scale
offeringsBolsters value proposition and leads to high customer retention ratesCore to overall strategy
Powerful health and benefits ecosystemStrategically expanding ecosystem Ability to cross-sell offerings, including COBRA services
Customized
accounts payable automation solutionsAmerican Express renewed contract for additional
5 yearsWEX technology streamlines AP processes by
working with business’s existing accountsAllows Amex Business and Corporate Card
customers to make
supplier payments via single and multi-use virtual cardsExtending functionality, data and systemintegrations across WEX INNOVATIVE TECHNOLOGY

Key Differentiators Deep Payment Expertise across Multiple Sectors Best-In-Class Technology Platform
and Innovation Cloud-Native Infrastructure Seamless Integration into Customers’ Operations via APIs Differentiated Products and Business Segments Experienced Management & Values-Based Culture

Weekly Volume Metrics Key UpdatesJuly month-to-date domestic fuel price is $3.18Weekly purchase volume
changes for March through July 2021 have been benchmarked to 2019 to provide a more meaningful comparisonIncludes purchase volume for eNett and Optal as if they were owned for the entire period shown Fleet Payment Processing Gallon Volume
& Travel and Corporate Payments Purchase Volume

Weekly Volume Metrics Key Updates:Includes purchase volume for eNett and Optal as if they were owned
for the entire period shownTravel customer purchase volume April - June not shown due to scale. Actual growth rates were between 200% and 1800% Fleet Payment Processing Gallon Volume & Travel and Corporate Payments Purchase Volume
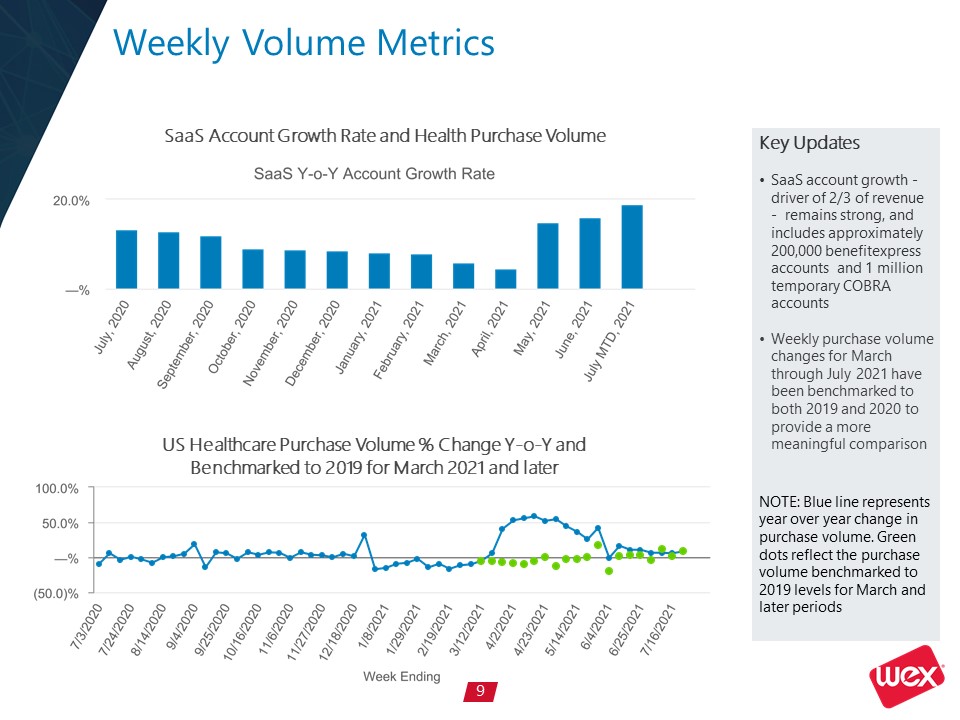
Weekly Volume Metrics Key Updates
SaaS account growth - driver of 2/3 of revenue - remains strong, and
includes approximately 200,000 benefitexpress accounts and 1 million temporary COBRA accountsWeekly purchase volume changes for March through July 2021 have been benchmarked to both 2019 and 2020 to provide a more meaningful comparisonNOTE:
Blue line represents year over year change in purchase volume. Green dots reflect the purchase volume benchmarked to 2019 levels for March and later periods SaaS Account Growth Rate and Health Purchase Volume US Healthcare Purchase Volume
% Change Y-o-Y and Benchmarked to 2019 for March 2021 and later

WEX Second Quarter
2021 Financial Results

Company Results - Q2 2021 2Q21 2Q20 $ ∆ Yr/Yr % ∆ Yr/Yr Total
Revenue $ 459,483 $ 347,084 $ 112,399 32 % Net (loss) income attributable to shareholders $ (33,856 ) $ 72,658 $ (106,514 ) (147) % Net (loss) income attributable to WEX Inc. per diluted
share $ (0.76 ) $ 1.66 $ (2.42 ) NM Adjusted net income attributable to shareholders $ 104,894 $ 52,955 $ 51,939 98 % Adjusted net income attributable to shareholders per diluted
share $ 2.31 $ 1.21 $ 1.10 91 % In thousands except per diluted share dataNM - Not meaningful Excellent Results Reflect Continued Sequential Improvement and Gains vs Prior Year

Revenue Breakdown - Q2 2021 2Q21 2Q20 $ ∆ Yr/Yr % ∆ Yr/Yr Total
Revenue $459,483 $347,084 $112,399 32 % Segment Revenue: Fleet Solutions $274,388 $204,380 $70,008 34 % Travel and Corporate Solutions $81,762 $54,495 $27,267 50 % Health and Employee Benefit
Solutions $103,333 $88,209 $15,124 17 % Sequential and Year Over Year Improvement in Revenue for Each Segment In thousands unless otherwise noted

Fleet Solutions 2Q21 2Q20 $ ∆ Yr/Yr % ∆ Yr/Yr Total Segment Revenue
($) 274,388 204,380 70,008 34 % Payment Processing Revenue ($) 126,450 90,147 36,303 40 % Finance Fee Revenue ($) 59,258 42,463 16,795 40 % All Other Revenue
($) 88,680 71,770 16,910 24 % Payment Processing Transactions 130,104 103,086 27,018 26 % Net Payment Processing Rate (%) 1.15 % 1.47 % (0.32) % (22) % Average US Fuel Price
($/gallon) 3.04 2.07 0.97 47 % Net Late Fee Rate (%) 0.41 % 0.57 % (0.16) % (28) % Strong Growth Rates With Revenue and Volume Exceeding Pre-Pandemic Levels In thousands unless otherwise noted

Travel and Corporate Solutions 2Q21 2Q20 $ ∆ Yr/Yr % ∆ Yr/Yr Total Segment Revenue
($) 81,762 54,495 27,267 50 % Payment Processing Revenue ($) 68,282 43,261 25,021 58 % All Other Revenue ($) 13,480 11,234 2,246 20 % Purchase Volume
($) 8,736,019 3,168,064 5,567,955 176 % Net Interchange Rate (%) 0.78 % 1.37 % (0.59) % (43) % Corporate Payment Customers Continue Solid Growth with Travel Volumes Rebounding In thousands unless otherwise noted

Health and Employee Benefit Solutions 2Q21 2Q20 $ ∆ Yr/Yr % ∆ Yr/Yr Total Segment Revenue
($) 103,333 88,209 15,124 17 % Payment Processing Revenue ($) 18,694 14,053 4,641 33 % Account Servicing Revenue ($) 79,482 62,602 16,880 27 % All Other Revenue
($) 5,157 11,554 (6,397 ) (55) % Purchase Volume * ($) 1,311,131 1,017,318 293,813 29 % Average Number of SaaS Accounts* 16,380 14,487 1,893 13 % Return to Double-Digit Revenue Growth and
Continued Strong SaaS Account Growth In thousands unless otherwise noted* U.S. only

Operating Expenses and Segment Adjusted Operating Income Margins Increase in Fleet Solutions adjusted
segment operating income margins reflects revenue growth, very low credit losses, higher fuel prices and operating leverage in expense baseIncrease in Travel and Corporate Solutions adjusted segment operating income margins reflects additional
benefits from eNett and Optal synergies, and increased volumeSlight decrease in Health and Employee Benefit Solutions adjusted segment operating income margins reflects acquisition of benefitexpress in JuneUnallocated Corporate costs as a
percentage of total revenue were down slightly Segment Adjusted Operating Income Margin Three months ended June 30, March 31, 2021 2020 2021 Fleet Solutions 50.2% 37.8% 48.5% Travel and
Corporate Solutions 21.0% 20.1% 9.9% Health and Employee Benefit Solutions 28.1% 28.6% 31.7% Adjusted operating income margin (1) 36.3% 28.7% 34.0% Cost of services Selling general and administrative (1) Adjusted
operating income margin is derived by dividing adjusted operating income by the revenue of the corresponding segment (or the entire Company for adjusted operating income). See appendix for a reconciliation of GAAP operating income to total
segment adjusted operating income and adjusted operating income.

Tax Rate Key UpdatesANI tax rate consistent with the prior year quarterGAAP tax rate in Q2 2021 driven
by excess tax benefits arising from stock-based compensationGAAP tax rate in Q2 2020 unusually high due to a decrease in pre-tax income, a shift in jurisdictional earnings and sizable non deductible expenses

Additional Balance Sheet Items Key UpdatesCorporate cash1 balance was $108.7 million Executed on
$900 million of new interest rate swaps at a fixed average LIBOR rate of 67 basis pointsAs of June 30, 2021, available borrowing capacity of $613 million on revolving credit facilityAmended and restated credit facility April 1, 2021, increasing
borrowing capacity by $60 million and increasing Tranche A term loans by approximately $117 million and extending maturities to 2026 and 2028Leverage ratio of just under 4.0X 1 Corporate cash and leverage ratio are calculated in
accordance with the terms of the Company’s Amended and Restated Credit Agreement as filed with the SEC.Note: Total Financing Debt includes outstanding borrowings on the revolving line of credit, term loans, and convertible notes.

Guidance Q3 2021 % Change Year over Year FY 2021 % Change Year over Year Revenue (in
millions) $465 - $480 22% - 26% $1,805 - $1,835 16% - 18% Adjusted Net Income (in millions) $98 - $107 38% - 51% $377 - $395 41% - 47% Adjusted Net Income per Diluted Share 1 $2.15 - $2.35 35% - 48% $8.30 - $8.70 37% -
44% Assumed Average Domestic Fuel Price ($/Gallon) $3.18 $3.00 Assumed Adjusted Net Income Tax Rate 24.5% - 25.5% 24.5% - 25.5% Assumed Number of Shares Outstanding 45.4 million 45.4 million 1 The Company's
adjusted net income guidance, which is a non-GAAP measure, excludes unrealized gains and losses on financial instruments, net foreign currency remeasurement gains and losses, acquisition related intangible amortization, other acquisition and
divestiture related items, stock-based compensation, other costs, changes in fair value of contingent consideration, debt restructuring and debt issuance cost amortization, similar adjustments attributable to our non-controlling interests and
certain tax related items. We are unable to reconcile our adjusted net income guidance to the comparable GAAP measure without unreasonable effort because of the difficulty in predicting the amounts to be adjusted, including but not limited to,
foreign currency exchange rates, unrealized gains and losses on derivative instruments, acquisition and divestiture related items and adjustments to the redemption value of a non-controlling interest, which may have a significant impact on our
financial results.

Appendix
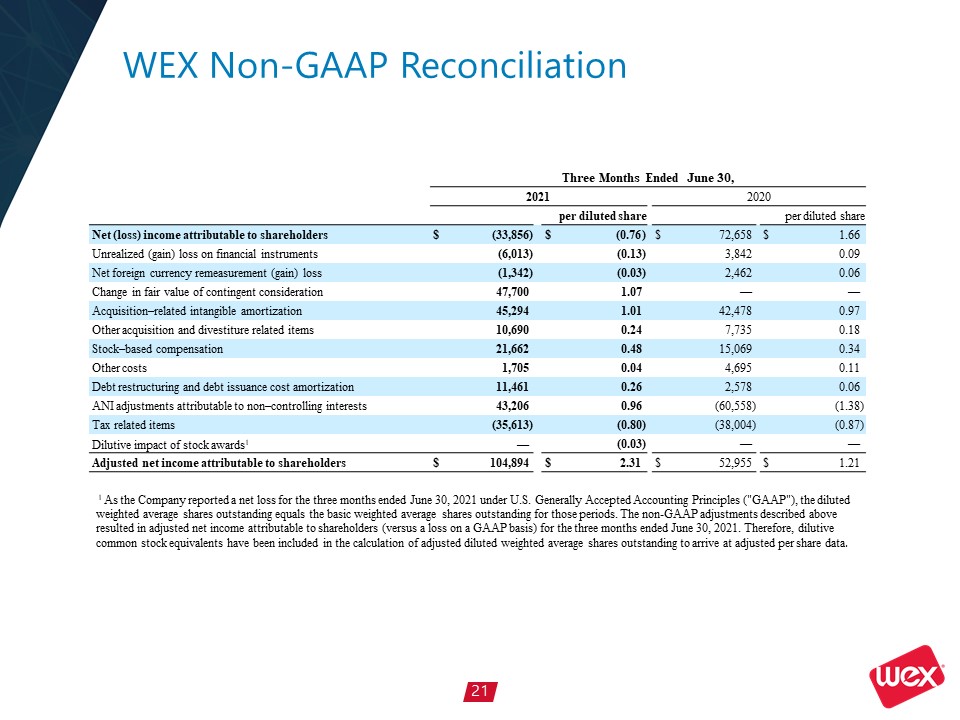
WEX Non-GAAP Reconciliation Three Months Ended June
30, 2021 2020 per diluted share per diluted share Net (loss) income attributable to
shareholders $ (33,856 ) $ (0.76 ) $ 72,658 $ 1.66 Unrealized (gain) loss on financial instruments (6,013 ) (0.13 ) 3,842 0.09 Net foreign currency remeasurement (gain)
loss (1,342 ) (0.03 ) 2,462 0.06 Change in fair value of contingent consideration 47,700 1.07 — — Acquisition–related intangible
amortization 45,294 1.01 42,478 0.97 Other acquisition and divestiture related items 10,690 0.24 7,735 0.18 Stock–based compensation 21,662 0.48 15,069 0.34 Other
costs 1,705 0.04 4,695 0.11 Debt restructuring and debt issuance cost amortization 11,461 0.26 2,578 0.06 ANI adjustments attributable to non–controlling
interests 43,206 0.96 (60,558 ) (1.38 ) Tax related items (35,613 ) (0.80 ) (38,004 ) (0.87 ) Dilutive impact of stock awards1 — (0.03 ) — — Adjusted net income
attributable to shareholders $ 104,894 $ 2.31 $ 52,955 $ 1.21 1 As the Company reported a net loss for the three months ended June 30, 2021 under U.S. Generally Accepted Accounting Principles ("GAAP"), the diluted
weighted average shares outstanding equals the basic weighted average shares outstanding for those periods. The non-GAAP adjustments described above resulted in adjusted net income attributable to shareholders (versus a loss on a GAAP basis)
for the three months ended June 30, 2021. Therefore, dilutive common stock equivalents have been included in the calculation of adjusted diluted weighted average shares outstanding to arrive at adjusted per share data.

WEX Non-GAAP Reconciliation Reconciliation of GAAP Operating Income to Total Segment Adjusted Operating
Income and Adjusted Operating Income Three months ended June 30, Three months ended March 31, 2021 2020 2021 Operating
income $ 82,278 $ 28,782 $ 50,541 Unallocated corporate expenses 17,174 13,953 16,209 Acquisition-related intangible amortization 45,294 42,478 42,454 Other acquisition and divestiture
related items 10,690 7,735 14,796 Stock-based compensation 21,662 15,069 18,943 Other costs 1,705 4,695 12,237 Debt restructuring costs 5,299 687 637 Total Segment
adjusted operating income $ 184,102 $ 113,399 $ 155,817 Unallocated corporate expenses (17,174 ) (13,953 ) (16,209 ) Adjusted operating income $ 166,928 $ 99,446 $ 139,608

WEX Non-GAAP Reconciliation The Company's non-GAAP adjusted net income excludes unrealized gains and
losses on financial instruments, net foreign currency gains and losses, changes in fair value of contingent consideration, acquisition-related intangible amortization, other acquisition and divestiture related items, stock-based compensation,
other costs, debt restructuring and debt issuance cost amortization, adjustments attributable to our non-controlling interests and certain tax related items. The Company's non-GAAP adjusted operating income excludes acquisition-related
intangible amortization, other acquisition and divestiture related items, stock-based compensation, other costs, and debt restructuring costs. Total segment adjusted operating income incorporates these same adjustments and further excludes
unallocated corporate expenses.Although adjusted net income, adjusted operating income and total segment adjusted operating income are not calculated in accordance with GAAP, these non-GAAP measures are integral to the Company's reporting and
planning processes and the chief operating decision maker of the Company uses segment adjusted operating income to allocate resources among our operating segments. The Company considers these measures integral because they exclude the above
specified items that the Company's management excludes in evaluating the Company's performance. Specifically, in addition to evaluating the Company's performance on a GAAP basis, management evaluates the Company's performance on a basis that
excludes the above items because: Exclusion of the non-cash, mark-to-market adjustments on financial instruments, including interest rate swap agreements and investment securities, helps management identify and assess trends in the Company's
underlying business that might otherwise be obscured due to quarterly non-cash earnings fluctuations associated with these financial instruments. Additionally, the non-cash mark-to-market adjustments on financial instruments are difficult to
forecast accurately, making comparisons across historical and future quarters difficult to evaluate.Net foreign currency gains and losses primarily result from the remeasurement to functional currency of cash, accounts receivable and accounts
payable balances, certain intercompany notes denominated in foreign currencies and any gain or loss on foreign currency hedges relating to these items. The exclusion of these items helps management compare changes in operating results between
periods that might otherwise be obscured due to currency fluctuations. The change in fair value of contingent consideration, which is related to the acquisition of certain contractual rights to serve as custodian or sub-custodian to health
savings accounts, is dependent upon changes in future interest rates and has no significant impact on the ongoing operations of the Company. Additionally, the non-cash, mark-to-market adjustments on financial instruments are difficult to
forecast accurately, making comparisons across historical and future quarters difficult to evaluate.The Company considers certain acquisition-related costs, including investment banking fees, warranty and indemnity insurance, certain
integration related expenses and amortization of acquired intangibles, as well as gains and losses from divestitures, to be unpredictable, dependent on factors that may be outside of our control and unrelated to the continuing operations of the
acquired or divested business or the Company. In addition, the size and complexity of an acquisition, which often drives the magnitude of acquisition-related costs, may not be indicative of such future costs. The Company believes that excluding
acquisition-related costs and gains or losses on divestitures facilitates the comparison of our financial results to the Company's historical operating results and to other companies in our industry.Stock-based compensation is different from
other forms of compensation as it is a non-cash expense. For example, a cash salary generally has a fixed and unvarying cash cost. In contrast, the expense associated with an equity-based award is generally unrelated to the amount of cash
ultimately received by the employee, and the cost to the Company is based on a stock-based compensation valuation methodology and underlying assumptions that may vary over time.We exclude certain other costs when evaluating our continuing
business performance when such items are not consistently occurring and do not reflect expected future operating expense, nor provide insight into the fundamentals of current or past operations of our business. These include costs related to
certain identified initiatives (including technology initiatives) to further streamline the business, improve the Company's efficiency, create synergies, and globalize the Company's operations, all with an objective to improve scale and
efficiency and increase profitability going forward. For the six months ended June 30, 2021, other costs additionally include a penalty of $10.3 million incurred on termination of a vendor contract. For the three and six months ended June 30,
2020, other costs include certain costs incurred in association with COVID-19, including the cost of providing additional health, welfare and technological support to our employees as they work remotely.Debt restructuring and debt issuance cost
amortization are unrelated to the continuing operations of the Company. Debt restructuring costs do not reflect expected future operating expense, nor do they provide insight into the fundamentals of current or past operations of our business.
In addition, since debt issuance cost amortization is dependent upon the financing method, which can vary widely company to company, we believe that excluding these costs helps to facilitate comparison to historical results as well as to other
companies within our industry.The adjustments attributable to non-controlling interests, including adjustments to the redemption value of a non-controlling interest and non-cash adjustments related to the tax receivable agreement, have no
significant impact on the ongoing operations of the business. The tax related items are the difference between the Company’s U.S. GAAP tax provision and a pro forma tax provision based upon the Company’s adjusted net income before taxes as well
as the impact from certain discrete tax items. The methodology utilized for calculating the Company’s adjusted net income tax provision is the same methodology utilized in calculating the Company’s U.S. GAAP tax provision. The Company does not
allocate certain corporate expenses to our operating segments, as these items are centrally controlled and are not directly attributable to any reportable segment. For the same reasons, WEX believes that adjusted net income, adjusted operating
income and total segment adjusted operating income may also be useful to investors when evaluating the Company's performance. However, because adjusted net income, adjusted operating income and total segment adjusted operating income are
non-GAAP measures, they should not be considered as a substitute for, or superior to, net income, operating income or cash flows from operating activities as determined in accordance with GAAP. In addition, adjusted net income, adjusted
operating income and total segment adjusted operating income as used by WEX may not be comparable to similarly titled measures employed by other companies.