Attached files
| file | filename |
|---|---|
| EX-10.29 - EXHIBIT 10.29 - WEX Inc. | wex20171231ex1029sphillips.htm |
| EX-32.2 - EXHIBIT 32.2 - WEX Inc. | wex20171231ex322.htm |
| EX-32.1 - EXHIBIT 32.1 - WEX Inc. | wex20171231ex321.htm |
| EX-31.2 - EXHIBIT 31.2 - WEX Inc. | wex20171231ex312.htm |
| EX-31.1 - EXHIBIT 31.1 - WEX Inc. | wex20171231ex311.htm |
| EX-23.1 - EXHIBIT 23.1 - WEX Inc. | wex20171231ex231.htm |
| EX-21.1 - EXHIBIT 21.1 - WEX Inc. | wex20171231ex211.htm |
| EX-10.32 - EXHIBIT 10.32 - WEX Inc. | wex20171231ex1032sphillips.htm |
| EX-10.31 - EXHIBIT 10.31 - WEX Inc. | wex20171231ex1031sphillips.htm |
| EX-10.30 - EXHIBIT 10.30 - WEX Inc. | wex20171231ex1030sphillips.htm |
UNITED STATES
SECURITIES AND EXCHANGE COMMISSION
Washington, D.C. 20549
FORM 10-K
(Mark One)
þ | ANNUAL REPORT PURSUANT TO SECTION 13 OR 15(d) OF THE SECURITIES EXCHANGE ACT OF 1934 |
For the fiscal year ended December 31, 2017
OR
¨ | TRANSITION REPORT PURSUANT TO SECTION 13 OR 15(d) OF THE SECURITIES EXCHANGE ACT OF 1934 |
For the transition period from to .
Commission file number 001-32426

WEX INC.
(Exact name of registrant as specified in its charter)
Delaware | 01-0526993 | |
(State or other jurisdiction of incorporation or organization) | (I.R.S. Employer Identification No.) | |
97 Darling Avenue South Portland, Maine | 04106 | |
(Address of principal executive offices) | (Zip Code) | |
(207) 773-8171
(Registrant’s telephone number, including area code)
Securities registered pursuant to Section 12(b) of the Act:
Title of each class | Name of each exchange on which registered | |||
Common Stock, $0.01 par value | New York Stock Exchange | |||
Securities registered pursuant to Section 12(g) of the Act:
None
(Title of class)
Indicate by check mark if the registrant is a well-known seasoned issuer, as defined in Rule 405 of the Securities Act.
þ Yes ¨ No
Indicate by check mark if the registrant is not required to file reports pursuant to Section 13 or Section 15(d) of the Act.
¨ Yes þ No
Indicate by check mark whether the registrant (1) has filed all reports required to be filed by Section 13 or 15(d) of the Securities Exchange Act of 1934 during the preceding 12 months (or for such shorter period that the registrant was required to file such reports), and (2) has been subject to such filing requirements for the past 90 days.
þ Yes ¨ No
Indicate by check mark whether the registrant has submitted electronically and posted on its corporate Web site, if any, every Interactive Data File required to be submitted and posted pursuant to Rule 405 of Regulation S-T (§ 232.405 of this chapter) during the preceding 12 months (or for such shorter period that the registrant was required to submit and post such files).
þ Yes ¨ No
Indicate by check mark if disclosure of delinquent filers pursuant to Item 405 of Regulation S-K (§229.405 of this chapter) is not contained herein, and will not be contained, to the best of registrant’s knowledge, in definitive proxy or information statements incorporated by reference in Part III of this Form 10-K or any amendment to this Form 10-K. þ
Indicate by check mark whether the registrant is a large accelerated filer, an accelerated filer, a non-accelerated filer, a smaller reporting company, or emerging growth company. See definitions of “large accelerated filer,” “accelerated filer,” “smaller reporting company,” and emerging growth company in Rule 12b-2 of the Exchange Act.
Large accelerated filer þ | Accelerated filer ¨ | |
Non-accelerated filer ¨ | Smaller reporting company ¨ | |
(Do not check if a smaller reporting company) | Emerging growth company ¨ | |
If an emerging growth company, indicate by check mark if the registrant has elected not to use the extended transition period for complying with any new or revised financial accounting standards provided pursuant to Section 13(a) of the Exchange Act. ¨
Indicate by check mark whether the registrant is a shell company (as defined in Rule 12b-2 of the Act).
¨ Yes þ No
The aggregate market value of the voting and non-voting common equity held by non-affiliates of the registrant (assuming for the purpose of this calculation, but without conceding, that all directors, officers and any 10 percent or greater stockholders are affiliates of the registrant) as of June 30, 2017, the last business day of the registrant’s most recently completed second fiscal quarter, was $4,405,939,486 (based on the closing price of the registrant’s common stock on that date as reported on the New York Stock Exchange).
There were 43,031,993 shares of the registrant’s common stock outstanding as of February 26, 2018.
DOCUMENTS INCORPORATED BY REFERENCE
Portions of the Company’s Proxy Statement for the 2018 Annual Meeting of Stockholders are incorporated by reference in Part III. With the exception of the sections of the 2018 Proxy Statement specifically incorporated herein by reference, the 2018 Proxy Statement is not deemed to be filed as part of the 10-K.
TABLE OF CONTENTS | ||
Item 1. | ||
Item 1A. | ||
Item 1B. | ||
Item 2. | ||
Item 3. | ||
Item 4. | ||
Item 5. | ||
Item 6. | ||
Item 7. | ||
Item 7A. | ||
Item 8. | ||
Item 9. | ||
Item 9A. | ||
Item 9B. | ||
Item 10. | ||
Item 11. | ||
Item 12. | ||
Item 13. | ||
Item 14. | ||
Item 15. | ||
Item 16. | ||
Unless otherwise indicated or required by the context, the terms “we,” “us,” “our,” “WEX,” or the “Company,” in this Annual Report on Form 10-K mean WEX Inc. and all of its subsidiaries that are consolidated under Generally Accepted Accounting Principles in the United States.
FORWARD–LOOKING STATEMENTS
The Private Securities Litigation Reform Act of 1995 provides a “safe harbor” for statements that are forward-looking and are not statements of historical facts. This Annual Report includes forward-looking statements including, but not limited to, statements about management’s plan and goals, and the “Strategy” section of this Annual Report in Item 1. Any statements in this Annual Report that are not statements of historical facts are forward-looking statements. When used in this Annual Report, the words “anticipate,” “believe,” “continue,” “could,” “estimate,” “expect,” “intend,” “may,” “plan,” “project” and similar expressions are intended to identify forward-looking statements, although not all forward-looking statements contain such words. Forward-looking statements relate to our future plans, objectives, expectations and intentions and are not historical facts and accordingly involve known and unknown risks and uncertainties and other factors that may cause the actual results or performance to be materially different from future results or performance expressed or implied by these forward-looking statements. The following factors, among others, could cause actual results to differ materially from those contained in forward-looking statements made in this Annual Report and in oral statements made by our authorized officers:
• | the effects of general economic conditions on fueling patterns as well as payment and transaction processing activity; |
• | the impact of foreign currency exchange rates on the Company’s operations, revenue and income; |
• | changes in interest rates; |
• | the impact of fluctuations in fuel prices; |
• | the effects of the Company’s business expansion and acquisition efforts; |
• | potential adverse changes to business or employee relationships, including those resulting from the completion of an acquisition; |
• | competitive responses to any acquisitions; |
• | uncertainty of the expected financial performance of the combined operations following completion of an acquisition; |
• | the ability to successfully integrate the Company's acquisitions; |
• | the ability to realize anticipated synergies and cost savings; |
• | unexpected costs, charges or expenses resulting from an acquisition; |
• | the Company's failure to successfully operate and expand ExxonMobil's European and Asian commercial fuel card programs; |
• | the failure of corporate investments to result in anticipated strategic value; |
• | the impact and size of credit losses; |
• | the impact of changes to the Company's credit standards; |
• | breaches of the Company’s technology systems or those of our third-party service providers and any resulting negative impact on our reputation, liabilities or relationships with customers or merchants; |
• | the Company’s failure to maintain or renew key agreements; |
• | failure to expand the Company’s technological capabilities and service offerings as rapidly as the Company’s competitors; |
• | failure to successfully implement the Company's information technology strategies and capabilities in connection with its technology outsourcing and insourcing arrangements and any resulting cost associated with that failure; |
• | the actions of regulatory bodies, including banking and securities regulators, or possible changes in banking or financial regulations impacting the Company’s industrial bank, the Company as the corporate parent or other subsidiaries or affiliates; |
• | the impact of the Company’s outstanding notes on its operations; |
• | the impact of increased leverage on the Company's operations, results or borrowing capacity generally, and as a result of acquisitions specifically; |
• | the incurrence of impairment charges if our assessment of the fair value of certain of our reporting units changes; |
• | the uncertainties of litigation; as well as |
• | other risks and uncertainties identified in Item 1A of this Annual Report and in connection with such forward-looking statements. |
Our forward-looking statements and these factors do not reflect the potential future impact of any alliance, merger, acquisition, disposition or stock repurchases. The forward-looking statements speak only as of the date of the initial filing of this Annual Report and undue reliance should not be placed on these statements. We disclaim any obligation to update any forward-looking statements as a result of new information, future events or otherwise.
1
ACRONYMS AND ABBREVIATIONS
The acronyms and abbreviations identified below are used in this Annual Report including the accompanying consolidated financial statements and the notes thereto. The following is provided to aid the reader and provide a reference point when reviewing the Annual Report:
2013 Credit Agreement | Amended and restated credit agreement entered into on January 18, 2013 by and among the Company and certain of our subsidiaries, as borrowers, and WEX Card Holdings Australia Pty Ltd, as specified designated borrower, with a lending syndicate | |
2014 Credit Agreement | Second amended and restated credit agreement entered into on August 22, 2014, by and among the Company and certain of its subsidiaries, as borrowers, WEX Card Holding Australia Pty Ltd., as designated borrower, and Bank of America, N.A., as administrative agent on behalf of consenting lenders. | |
2016 Credit Agreement | Credit agreement entered into on July 1, 2016 by and among the Company and certain of its subsidiaries, as borrowers, WEX Card Holding Australia Pty Ltd., as designated borrower, and Bank of America, N.A., as administrative agent on behalf of the lenders | |
Adjusted Net Income or ANI | A non-GAAP measure that adjusts net earnings attributable to shareholders to exclude unrealized gains and losses on derivatives, net foreign currency remeasurement gains and losses, acquisition-related ticking fees, acquisition-related intangible amortization, other acquisition and divestiture related items, stock-based compensation, restructuring and other costs, impairment charges and asset write-offs, gain on divestiture, a one-time vendor settlement, debt restructuring and debt issuance cost amortization, non-cash adjustments related to tax receivable agreement, reserves for regulatory penalties, adjustments attributed to our non-controlling interest and certain tax related items. | |
Adjusted Operating Income | A non-GAAP measure that adjusts operating income to exclude specified items that the Company's management excludes in evaluating segment performance, including acquisition and divestiture related expenses and adjustments including the amortization of purchased intangibles, the expense associated with stock-based compensation, restructuring and other costs, impairment charges and asset write-offs, gain on divestiture, a one-time vendor settlement, debt restructuring costs and reserves for regulatory penalties. | |
AOC | AOC Solutions and one of its affiliate companies, 3Delta Systems, Inc. The Company acquired certain assets and assumed certain liabilities of AOC Solutions and its affiliate in 2017. | |
ASU 2014-09 | Accounting Standards Update No. 2014-09 Revenue from Contracts with Customers (Topic 606) | |
ASU 2016-01 | Accounting Standards Update No. 2016-01 Financial Instruments - Overall (Subtopic 825-10): Recognition and Measurement of Financial Assets and Financial Liabilities | |
ASU 2016-02 | Accounting Standards Update No. 2016-02 Leases (Topic 842) | |
ASU 2016-09 | Accounting Standards Update No. 2016-09 Compensation-Stock Compensation (Topic 718): Improvements to Employee Share-Based Payment Accounting | |
ASU 2016-13 | Accounting Standards Update No. 2016-13 Financial Instruments-Credit Losses (Topic 326): Measurement of Credit Losses on Financial Instruments | |
ASU 2016-18 | Accounting Standards Update No. 2016-18 Statement of Cash Flows (Topic 230): Restricted Cash | |
ASU 2017-09 | Accounting Standards Update No. 2017-09 Compensation—Stock Compensation (Topic 718): Scope of Modification Accounting | |
Australian Securitization Subsidiary | Southern Cross WEX 2015-1 Trust, a bankruptcy-remote subsidiary consolidated by the Company | |
Average expenditure per payment processing transaction | Average total dollars of spend in a funded fuel transaction | |
Benaissance | Benaissance, a provider of integrated SaaS technologies and services for healthcare premium billing, payment and workflow management, acquired by the Company on November 18, 2015. | |
Company | WEX Inc. and all entities included in the consolidated financial statements | |
EBITDA | A non-GAAP measure that adjusts income before income taxes to exclude interest, depreciation and amortization | |
EFS | Electronic Funds Source, LLC, a provider of customized corporate payment solutions for fleet and corporate customers with a focus on the large and mid-sized over-the-road fleets. On July 1, 2016, the Company acquired WP Mustang Topco LLC, the indirect parent of Electronic Funds Source, LLC and Warburg Pincus Private Equity XI (Lexington), LLC, an affiliated entity, from investment funds affiliated with Warburg Pincus LLC. | |
European Fleet business | European commercial fleet card portfolio acquired from ExxonMobil | |
European Securitization Subsidiary | Gorham Trade Finance B.V., a bankruptcy-remote subsidiary consolidated by the Company | |
Evolution1 | EB Holdings Corp. and its subsidiaries which includes Evolution1, Inc., acquired by the Company on July 16, 2014 | |
Evolution1 Plan | Evolution1 401(k) Plan sponsored by Evolution1 Inc. | |
FASB | Financial Accounting Standards Board | |
2
FDIC | Federal Deposit Insurance Corporation | |
GAAP | Generally Accepted Accounting Principles in the United States | |
Indenture | The Notes were issued pursuant to an indenture dated as of January 30, 2013 among the Company, the guarantors listed therein, and The Bank of New York Mellon Trust Company, N.A., as trustee | |
NCI | Non-controlling interest | |
NOL | Net operating loss | |
NYSE | New York Stock Exchange | |
Notes | $400 million notes with a 4.75% fixed rate, issued on January 30, 2013 | |
Over-the-road | Typically heavy trucks traveling long distances | |
Payment solutions purchase volume | Total amount paid by customers for transactions | |
Payment processing transactions | Funded payment transactions where the Company maintains the receivable for total purchase | |
PPG | Price per gallon of fuel | |
rapid! PayCard | rapid! PayCard, previously a line of business of the Company, sold on January 7, 2015 | |
SaaS | Software-as-a-service | |
SEC | Securities and Exchange Commission | |
Ticking fees | A fee incurred by a borrower to compensate the lender for maintaining a commitment of funds for the prospective borrower for a period of time | |
Total fleet transactions | Total of transaction processing and payment processing transactions of our Fleet Solutions segment | |
Transaction processing transactions | Unfunded payment transactions where the Company is the processor and only has receivables for the processing fee | |
UNIK | UNIK S.A., the Company's Brazilian subsidiary, which has been subsequently branded WEX Latin America | |
WEX | WEX Inc. | |
WEX Europe Services | Consists primarily of our European Fleet business acquired by the Company from ExxonMobil on December 1, 2014 | |
WEX Health | Evolution1 and Benaissance, collectively | |
PART I
ITEM 1. BUSINESS
Our Company
WEX Inc. is a leading provider of corporate payment solutions. WEX Inc. began operations in 1983 as a Maine corporation and was acquired in February 1996 by an entity that subsequently merged with HFS Incorporated to form Cendant Corporation in December 1997. In June 1999, our predecessor, Wright Express, was sold to Avis Group Holdings, Inc., which was acquired by Cendant Corporation in March 2001. In anticipation of our initial public offering, the Company’s operations were transferred to a Delaware LLC, which was converted into a Delaware corporation in 2005 in conjunction with our initial public offering on February 16, 2005 (NYSE:WEX). Over the past 30 years, we have expanded the scope of our business from a fleet payment provider into a multi-channel provider of corporate payment solutions.
We currently operate in three business segments: Fleet Solutions, Travel and Corporate Solutions, and Health and Employee Benefit Solutions. Our products and services enable us to provide exceptional payment security and control across a wide spectrum of payment sectors.
Fleet Solutions provides customers with fleet vehicle payment processing services specifically designed for the needs of commercial and government fleets. During the year ended December 31, 2017, Fleet Solutions revenue represented approximately 66 percent of our total revenue. As of December 31, 2017, the segment services over 11.4 million vehicles. Management estimates that WEX fleet cards are accepted at over 90 percent of fuel locations in each of the United States and Australia. With the acquisition of our European Fleet business in December 2014, WEX fleet cards are accepted at all ExxonMobil stations throughout Europe.
Travel and Corporate Solutions focuses on the complex payment environment of business-to-business payments, providing customers with payment processing solutions for their corporate payment and transaction monitoring needs. Travel and Corporate Solutions revenue, which represented approximately 18 percent of our total revenue during the year ended December 31, 2017, is generated primarily in the online travel market. The Travel and Corporate Solutions segment also includes payment solutions for payables and travel expenses. The segment has operations in North America, Europe, South America and Asia-Pacific.
3
Health and Employee Benefit Solutions represented approximately 16 percent of our total revenue during the year ended December 31, 2017. During 2015, our wholly-owned subsidiary Evolution1 acquired Benaissance, a provider of integrated SaaS technologies and services for the Consolidated Omnibus Budget Reconciliation Act (“COBRA”) and healthcare premium billing, payment and workflow management, to complement our healthcare financial technology platform products and services. During 2016, we collectively rebranded Evolution1 and Benaissance as WEX Health. The Health and Employee Benefit Solutions segment also includes payroll related benefits offered to customers in Brazil.
The Company’s U.S. operations include WEX Inc. and our wholly-owned subsidiaries WEX Bank, WEX FleetOne, EFS and WEX Health. Our international operations include our wholly-owned operations, WEX Fuel Cards Australia, WEX Prepaid Cards Australia, WEX Canada, WEX New Zealand, WEX Asia, WEX Europe Limited, UNIK S.A., a Brazil-based company that we refer to as "WEX Latin America," and a controlling interest in WEX Europe Services Limited and its subsidiaries.
WEX Bank, a Utah industrial bank incorporated in 1998, is a FDIC insured depository institution. The functions performed at WEX Bank contribute to the U.S. and Canadian operations of Fleet Solutions and the operations of Travel and Corporate Solutions by providing a funding mechanism, among other services. With our ownership of WEX Bank, we have access to low-cost sources of capital. WEX Bank raises capital primarily through the issuance of brokered deposit accounts and provides the financing and makes credit decisions that enable the Fleet Solutions and Travel and Corporate Solutions segments to extend credit to customers. WEX Bank approves customer applications, maintains appropriate credit lines for each customer, is the account issuer, and is the counterparty for the customer relationships for most of our programs in the U.S. Operations such as sales, marketing, merchant relations, customer service, software development and IT are performed as a service within our organization but outside of WEX Bank. WEX Bank’s primary regulators are the Utah Department of Financial Institutions (“Utah DFI”) and the FDIC. The activities performed by WEX Bank are integrated into the operations of our Fleet Solutions and Travel and Corporate Solutions segments.
Developments
Prior to our initial public offering in 2005, the Company’s growth had primarily been organic. Our growth in the past several years has been supplemented by acquisitions. Our acquisitions over the last few years include:
• | Effective October 18, 2017, we acquired certain assets and assumed certain liabilities of AOC, a provider of commercial payments technology. This acquisition will broaden our capabilities, increase our pool of employees with payments platform experience and allow us to evolve with the needs of our customers and partners through the use of AOC’s payments processing technology platforms. |
• | On July 1, 2016, we acquired EFS, a provider of customized payment solutions for fleet and corporate customers with a focus on the large and mid-sized over-the-road fleets, in order to expand our customer footprint and utilize EFS's technology to better serve the needs of our fleet customers. |
• | On November 18, 2015, our wholly-owned subsidiary Evolution1 acquired Benaissance, a provider of integrated SaaS technologies and services for COBRA and healthcare premium billing, payment and workflow management, to complement our healthcare payments products and services. |
• | On August 31, 2015, we acquired the remaining 49 percent ownership in UNIK S.A., a majority-owned subsidiary prior to this transaction. |
• | On December 1, 2014, our majority owned subsidiary, WEX Europe Services Limited, acquired the assets of ExxonMobil's European commercial fuel card program, which includes operations, funding, pricing, sales and marketing in nine countries in Europe. |
• | On July 16, 2014, we acquired Evolution1, a provider of financial technology platform solutions within the healthcare industry. |
• | On October 15, 2013, our majority-owned subsidiary WEX Latin America acquired FastCred, a provider of fleet cards to the heavy truck or over-the-road segment of the fleet market in Brazil. |
During the year ended December 31, 2017, the Company sold $8.9 million in net assets of its Telapoint business for proceeds of $29.9 million, which resulted in a pre-tax book gain of $21.0 million. The divestiture was not material to the Company's annual revenue, net income or earnings per share. The Company does not view this divestiture as a strategic shift in its operations.
On January 7, 2015, we sold the operations of rapid! PayCard for $20.0 million, which resulted in a pre-tax book gain of $1.2 million. Our primary focus in the U.S. continues to be in the fleet, travel, and healthcare industries. As such, we divested the operations of rapid! PayCard, which were not material to our annual revenue, net income or earnings per share.
4
On July 29, 2014, we sold our Pacific Pride subsidiary for $49.7 million, which resulted in a pre-tax book gain of $27.5 million. The Company decided to sell the operations of Pacific Pride as it did not align with the long-term strategy of the core fleet business. The Company entered into a multi-year agreement with the buyer that will continue to allow WEX branded card acceptance at Pacific Pride locations.
Competitive Strengths
We believe the following strengths distinguish us from our competitors:
• | Our proprietary closed-loop fuel networks in the U.S. and Australia are among the largest in each country. We describe our fleet payment processing networks as “closed-loop” because we have a direct contractual relationship with both the merchant and the fleet, and only WEX transactions can be processed on these networks. We have built networks that management estimates to provide coverage to over 90 percent of fuel locations in the U.S. and Australia, as well as wide acceptance in Europe and Brazil. This provides our customers with the convenience of broad acceptance. |
• | Our proprietary closed-loop fuel networks provide us with access to a higher level of fleet-specific information and control as compared to what is typically available on an open-loop network. This provides high-level purchase controls at the point of sale, including the flexibility of allowing fleets to restrict purchases and receive automated alerts. Additionally, we have the ability to refine the information reporting provided to our fleet customers and customers of our strategic relationships. |
• | We offer a differentiated set of products and services, including security and purchase controls, to allow our customers and the customers of our strategic relationships to better manage their vehicle fleets. We provide customized analysis and reporting on the efficiency of fleet vehicles and the purchasing behavior of fleet vehicle drivers. We make this data available to fleet customers through both traditional reporting services and sophisticated web-based data analysis tools. |
• | Our long-standing strategic relationships, multi-year contracts and high contract renewal rates have contributed to the stability and recurring nature of our revenue base. We believe that we offer a compelling value to our customers relative to our competitors given the breadth and quality of our products and services and our deep understanding of our customers’ operational needs. We have a large installed customer base, with more than 11.4 million vehicles serviced as of December 31, 2017 and co-branded strategic relationships with five of the largest U.S. fleet management providers and with dozens of oil companies that use our private label solutions. Our wide site acceptance, together with our private-label portfolios and value-added product and service offerings, drive high customer satisfaction levels, with a U.S. fleet retention rate in excess of 97 percent (based on the 2017 rate of voluntary customer attrition). |
• | Our capabilities in the over-the-road segment of the market enhance our ability to serve fleet customers who operate both heavy duty trucks and cars or light duty vehicles in the U.S. and Canada as well as to blend the small fleet and private label businesses for greater scale. The July 2016 acquisition of EFS expanded our customer footprint within the over-the-road market segment. |
• | Our purchase of ExxonMobil's commercial fuel card program, which uses a closed-loop network in Europe, combined with the long term supply agreement to serve the current and future European Fleet business, provides us with a strong foundation in the large European fleet market. |
• | Our travel and corporate payment products offer corporate customers enhanced security and control for complex payment needs, while the addition of the EFS Corporate Payment Solutions set of products expands our presence into the electronic accounts payable segment of the market. Our strategic relationships include four of the largest online travel agencies in the world. We continue to expand our online travel payment solution capabilities and geographies, which currently include North America, Europe, South America and Asia-Pacific. As of December 31, 2017, we settle transactions in 21 different currencies. |
• | The demand for our payment processing, account servicing and transaction processing services combined with significant operating scale has historically driven strong revenue growth and earnings potential. We have an extensive history of organic revenue growth driven by our various marketing channels, our extensive network of fuel and service providers, and our growth in transaction volume. Further, we have completed a number of strategic acquisitions to expand our product and service offerings, which have contributed to our revenue growth and diversification of our products and services. |
• | WEX Health has become a leading provider of cloud-based healthcare payments technology, through the acquisition of Evolution1 in 2014 and Benaissance in 2015. Our large partner network expands our opportunities in the growing |
5
healthcare financial technology platform market. WEX Health benefits from both high retention rates and revenue predictability as a result of its SaaS business model.
• | We have an enterprise-wide risk management program that helps us identify and manage inherent risks related to our liquidity, extension of credit and interest rates. Our ownership of WEX Bank provides us with access to low cost sources of capital, which provide liquidity to fund our short-term card receivables. We have maintained a long record of low credit losses due to the short-term, non-revolving credit issued to our customer base. Our credit risk management program is enhanced by our proprietary scoring models, managing credit lines and early suspension policy. Interest rate risk is managed through diversified funding sources at WEX Bank including interest bearing money market deposits and certificates of deposit with varying maturities. Some of our merchant contracts include some ability to raise rates if interest rates rise. |
• | We have an experienced and committed management team that has substantial industry knowledge and a proven track record of financial success. The team has been successful in driving strong growth with consistent operating performance. We believe that our management team positions us well to continue successfully implementing our growth strategy and capturing operating efficiencies. |
Strategy
Our Company’s path forward will be shaped by the following three strategic priorities:
• | Drive continued growth. We continue to see significant organic growth opportunities across each of our Fleet Solutions, Travel and Corporate Solutions, and Health and Employee Benefit Solutions segments. We seek to capture this growth opportunity through our product excellence, marketing capabilities, sales force productivity, and revenue management practices. Our acquisition strategy will complement our organic growth by both enhancing scale and adding differentiation to our current offerings. |
• | Lead through superior technology. We have built and differentiate ourselves in the marketplace on a distinctive set of technologies in our Fleet Solutions, Travel and Corporate Solutions, and Health and Employee Benefit Solutions segments. As our markets continue to evolve, our ability to quickly and cost effectively innovate and deliver superior technological solutions continue to set us apart from our peers. |
• | Set standard for operational excellence. We stand apart in our segments by reliably delivering the best solutions to our partners and customers. We are continually optimizing our cost structure and capturing new revenue synergies across our lines of business. Gains in operational efficiency simplify our business, making us more nimble to capture market opportunities as they arise. |
6
FLEET SOLUTIONS SEGMENT
Overview
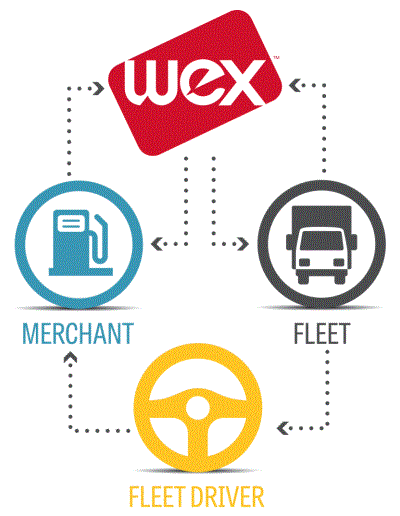
The Fleet Solutions segment provides customers with fleet vehicle payment processing services specifically designed for the needs of commercial and government fleets. We are a leading provider of fleet vehicle payment processing services with over 11.4 million vehicles at year end using our fleet payment solutions to purchase fuel and maintenance services. Our competitive advantages in the fleet market include brand strength and product offerings, commitment to customer satisfaction and a financing model with attractive credit terms. Our fleet products are based upon proprietary technology with closed-loop networks in the U.S., Australia and Europe and wide site acceptance domestically and abroad.
As part of our value proposition, we deliver security through individualized driver identification and real-time transaction updates, purchase controls and sophisticated reporting tools. We collect a broad array of information at the point of sale, including the amount of the expenditure, the identity of the driver and vehicle, the odometer reading, the identity of the fuel or vehicle maintenance provider and the items purchased. We use this information to provide customers with analytical tools to help them effectively manage their vehicle fleets and control costs. We deliver value to our customers by providing customized offerings for accepting merchants, processing payments and providing information management products and services to fleets.
Our proprietary closed-loop networks allow us to provide our customers with highly detailed, fleet-specific information and customized controls that are not typically available on open-loop networks, such as limiting purchases to fuel only and restricting the time of day and day of the week when fuel is purchased. Our network also enables us to avoid dependence on third-party processors. In addition, our relationships with both fleets and merchants enable us to provide security and controls and provide customizable reporting.
The following illustrates our proprietary closed-loop network:
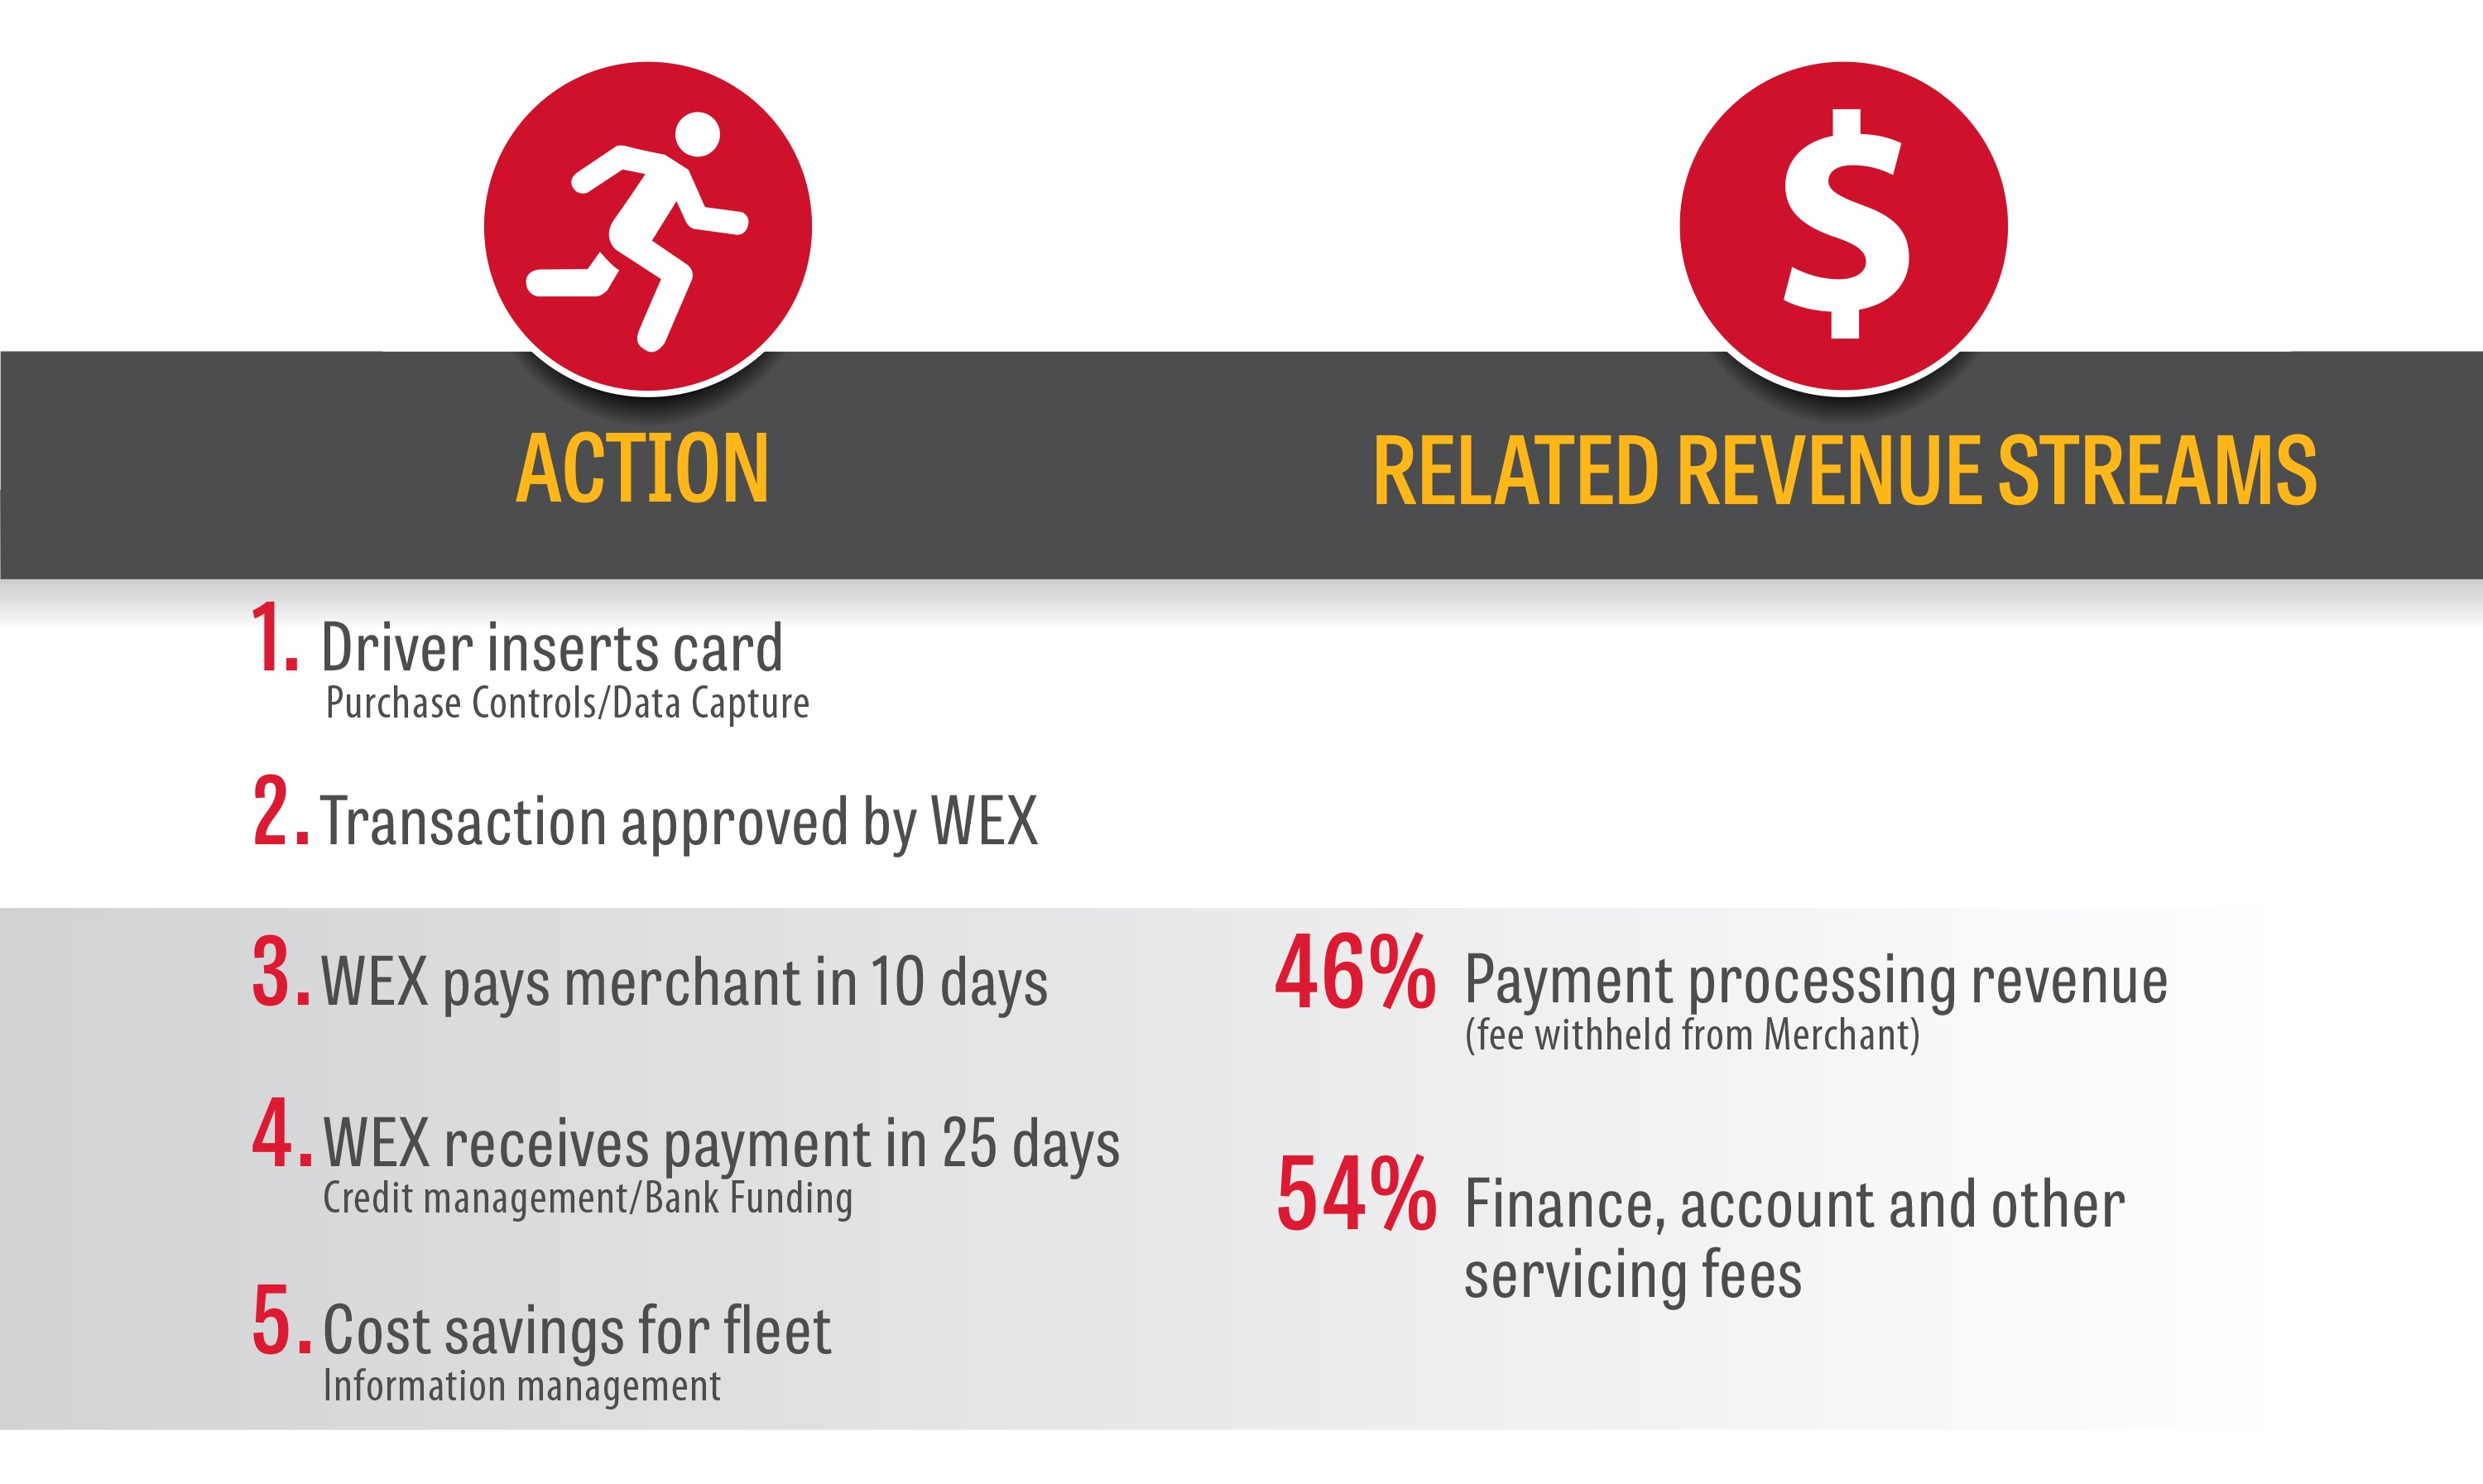
Payment processing transactions represent a majority of the revenue stream in the Fleet Solutions segment. In a payment processing transaction, we extend short-term credit to the fleet customer and pay the purchase price for the fleet customer’s transaction, less the payment processing fees we retain, to the merchant. Revenue from our WEX Europe Services operations is primarily generated by transactions where our revenue is derived from the difference between the negotiated price of the fuel from the supplier and the price charged to the fleet customer. We collect the total purchase price from the fleet customer, normally within 30 days from the billing date.
7
The following illustration depicts our business process for a typical WEX direct network domestic fuel payment processing transaction:
With the acquisition of EFS, we have diversified our market position in the over-the-road fleet segment. We offer customizable over-the-road fleet payment solutions that address comprehensive business needs including:
• | Real-time interactive interfaces delivering data integrity through a seamless user interface |
• | Alternative payment and money transfer options |
• | Comprehensive settlement solutions |
• | Real-time reports and analytics for compliance and cost-optimization |
• | Fuel reconciliation and mobile optimization tools |
Products and Services
Payment processing fees are based on a percentage of the aggregate dollar amount of the customer’s purchase, a fixed amount per transaction or a combination of both. Additionally, payment processing revenue related to our WEX Europe Services operations is specifically derived from the difference between our negotiated price of the fuel from the supplier and the agreed upon price paid by the fleets. In 2017, we processed approximately 430 million payment processing transactions, compared to 386 million payment processing transactions in 2016. Additionally, we receive revenue from account servicing fees, factoring receivables and finance fees.
We offer the following services:
• | Customer service, account activation and account retention: We offer customer service, account activation and account retention services to fleets and fleet management companies and the fuel and vehicle maintenance providers on our network. Our services include promoting the adoption and use of our products and programs and account retention programs on behalf of our customers and partners. |
• | Authorization and billing inquiries and account maintenance: We handle authorization and billing questions, account changes and other issues for fleets through our dedicated customer contact centers, which are available |
8
24 hours a day, seven days a week. Fleet customers also have self-service options available to them through our websites.
• | Premium fleet services: We assign designated account managers to businesses and government agencies with large fleets. These representatives have in-depth knowledge of both our programs and the operations and objectives of the fleets they service. |
• | Credit and collections services: We have developed proprietary account approval, credit management and fraud detection programs. Our underwriting model produces a proprietary score, which we use to predict the likelihood of an account becoming delinquent within 12 months of activation. We also use a credit maintenance model to manage ongoing accounts, which helps us to predict the likelihood of account delinquency over an ongoing 18-month time horizon. We have developed a collections scoring model that we use to rank and prioritize past due accounts for collection activities. We also employ fraud specialists who monitor accounts, alert customers and provide case management expertise to minimize losses and reduce program abuse. |
• | Merchant services: Our representatives work with fuel and vehicle maintenance providers to enroll these providers in our network, test all network and terminal software and hardware, and to provide training on our sale, transaction authorization and settlement processes. |
• | ClearView analytics platform: We provide customers with access to a web-based data analytics platform that offers insights to fleet managers, including integrating and analyzing business fleet fuel purchases to uncover fraud, manage product type controls and identify cost saving opportunities. |
• | SmartHub mobile app: This mobile application gives business managers access to their account information anytime and anywhere, including the ability to view and make bill payments, access transaction details and control the status of driver fuel cards. As a result, this offering helps customers improve efficiencies, reduce late fees, gain valuable insights and control unauthorized driver spending. |
Information Management
We provide standard and customized information to customers through monthly vehicle analysis reports, custom reports and our websites. We also alert customers of unusual transactions or transactions that fall outside of pre-established parameters. Customers can access their account information through our website including account history and recent transactions, and download the related details. In addition, fleet managers can elect to be notified by email when limits are exceeded in specified purchase categories, including limits on transactions within a time range and gallons per day.
Marketing Channels
We market our fleet products and services both directly and indirectly to commercial and government vehicle fleet customers with small, medium and large fleets, and over-the-road, long haul fleets. Our product suite includes payment processing and transaction processing services, WEX branded fleet cards in North America and Motorpass/Motorcharge-branded fleet cards in Australia. As of December 31, 2017, our direct line of business serviced 4.0 million vehicles. As of the same period, our over-the-road line of business serviced 1.0 million vehicles, marketed under the EFS, EFS Transportation Services, T-Chek and Fleet One brands.
We also market our products and services indirectly through co-branded and private label relationships. With a co-branded relationship product, we market our products and services for, and in collaboration with, both fuel providers and fleet management companies using their brand names and our logo on a co-branded fleet card. These companies seek to offer our payment processing and information management services as a component of their total offering to their fleet customers. As of December 31, 2017, our co-branded marketing channel serviced 2.1 million vehicles.
Our private label programs market our products and services for, and in collaboration with, fuel retailers, using only their brand names. The fuel retailers with which we have formed strategic relationships offer our payment processing and information management products and services to their fleet customers in order to establish and enhance customer loyalty. These fleets use these products and services to purchase fuel at locations of the fuel retailer with whom we have the private label relationship. As of December 31, 2017, our private label marketing channel serviced 4.3 million vehicles.
9
TRAVEL AND CORPORATE SOLUTIONS SEGMENT
Overview
Our Travel and Corporate Solutions segment is comprised of our virtual and prepaid products with which we provide innovative corporate purchasing and payment capabilities that can be integrated with our customers’ internal systems to streamline their corporate payments, accounts payable and reconciliation processes.
Products and Services
The Travel and Corporate Solutions segment allows businesses to centralize purchasing, simplify complex supply chain processes and eliminate the paper check writing associated with traditional purchase order programs. Our product suite includes virtual, credit, debit and prepaid products.
Our virtual card is used for transactions where no card is presented, including, for example, transactions conducted over the telephone, by mail, by fax or on the Internet. Our virtual card also can be used for transactions that require pre-authorization, such as hotel reservations. Under our virtual card programs, each transaction is assigned a unique account number with a customized credit limit and expiration date. These controls are in place to limit fraud and unauthorized spending. The unique account number limits purchase amounts and tracks, settles and reconciles purchases more easily, creating efficiencies and cost savings for our customers. The virtual card products offer both credit and debit options.
Our electronic accounts payable solution utilizes virtual card payments that are both broadly accepted and highly secure. This product reduces manual processing costs and facilitates comprehensive payment terms management to maximize margin improvement, efficiency and control.
Our corporate travel and expenses card offers broad global acceptance, reduced risk of fraud and enhanced travel data, and is designed for organizations whose employees travel on business. We make trips easier to plan, more productive, and less expensive through enhanced spending controls for both the company and its travelers.
Our prepaid and gift card products are offered through WEX Prepaid Card Australia and WEX Europe Limited to companies throughout Australia and Europe. These products provide secure payment and financial management solutions with single card options, access to open or closed loop redemption, load limits and variable expirations.
10
The following illustration depicts our business process for a typical travel virtual card product transaction: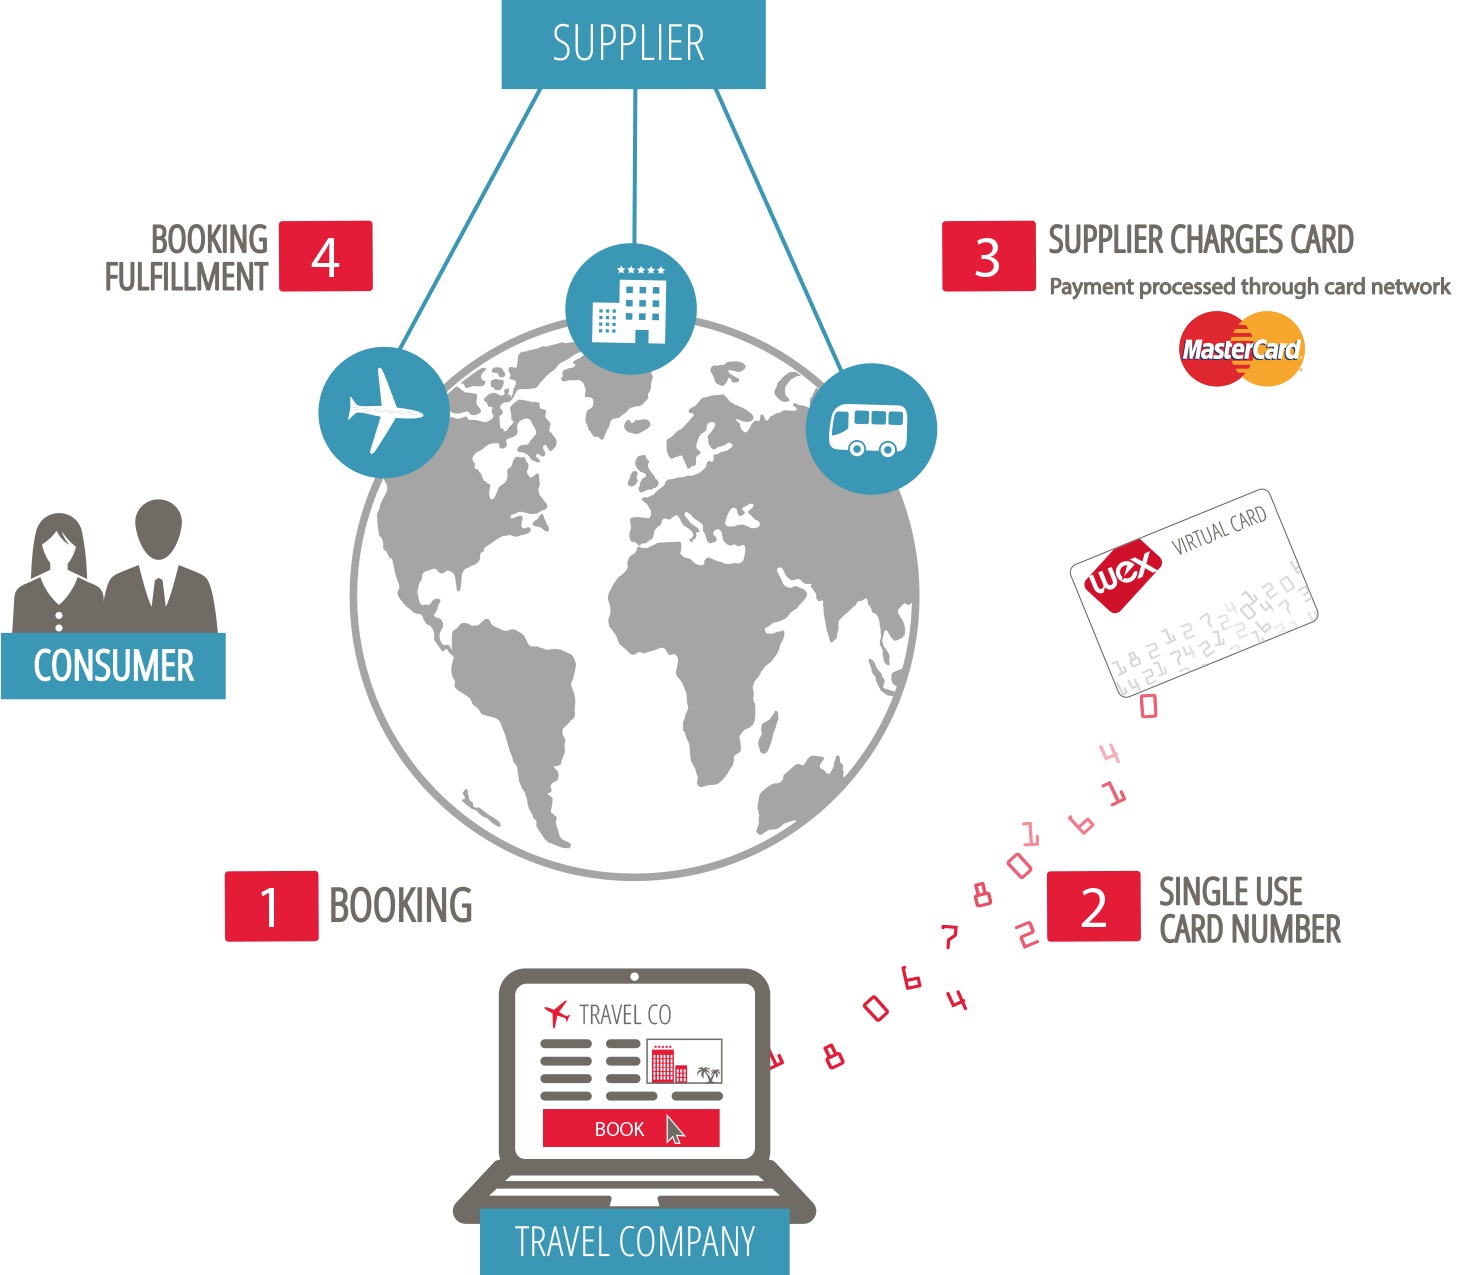
1 Guest books a hotel through a travel website owned by an online travel company
2 Online travel company reserves room at hotel through reservation system using a WEX virtual card number to reserve the room.
3 Upon checkout, hotel authorizes payment using the WEX virtual card number. The WEX virtual card restricts charge to predetermined cost of room, incidental expenses are paid for by guest.
4 Online travel company pays WEX. WEX earns fee by retaining percentage of the online travel company reimbursement payment.
Marketing Channels
We market our Travel and Corporate Solutions segment products and services both directly and indirectly to new and existing customers. Our products are marketed to commercial and government organizations and we use existing open-loop networks.
11
HEALTH AND EMPLOYEE BENEFIT SOLUTIONS SEGMENT
Overview
Our Health and Employee Benefit Solutions segment is comprised of our healthcare payment products and SaaS platforms with which we provide simplified payment capabilities in a complex healthcare market as well as employee benefit products in Brazil.
Products and Services
With our healthcare payment products, we provide consumer-directed payments in the complex healthcare market. We partner with health plans, third-party administrators, financial institutions, payroll companies and software providers to provide a software as a service product to support employers' healthcare benefits programs and to administer COBRA, flexible spending, health saving and reimbursement accounts, and other healthcare related employee and dependent benefits.
We currently have relationships with approximately 300,000 employers, reaching 25 million consumers. Revenue is generated primarily from SaaS based monthly fees to partners and interchange fees from spending on customer debit cards issued under flexible spending, health savings and reimbursement accounts. Cards are branded with either Visa or MasterCard and operate on a restricted open loop network.
Our benefit products are offered through our wholly-owned subsidiary, WEX Latin America. Employees using our benefit products have access to salary advances payable in up to 24 monthly installments which are secured by future salary earnings. These advances are funded primarily through securitization of the corresponding receivables.
Health and Employee Benefit Solutions segment revenues are generated primarily from platform usage subscription fees and interchange fees from spending on the WEX Health payment cards.
Marketing Channels
We market our Health and Employee Benefit Solutions products and services to consumers through an extensive partner network, which includes health plans, third party administrators, financial institutions, payroll providers and software providers. Our employee benefit products are marketed to consumers through employers in Brazil.
OTHER ITEMS
Employees
As of December 31, 2017, WEX Inc. and its subsidiaries had more than 3,300 employees, of which approximately 2,500 were located in the United States. None of our U.S.-based employees are subject to a collective bargaining agreement. In Europe, certain employees are members of trade unions or works councils. In Brazil, certain employees are members of unions. The Company believes that its relations with its employees, unions and work councils are generally satisfactory. This belief was reinforced by the Company being certified as a "Great Place to Work" in 2017 by Great Place to Work®.
Competition
We have a strong competitive position in each of our segments. Our product features and extensive account management services are key factors behind our position in the fleet industry. We face competition in all of our segments. Our competitors vie with us for prospective direct fleet customers as well as for companies with which to form strategic relationships. We compete with companies that perform payment and transaction processing or similar services. Financial institutions that issue Visa, MasterCard and American Express credit and charge cards currently compete against us primarily in the Fleet Solutions and Travel and Corporate Solutions segments. We also compete with other healthcare payment service providers.
The most significant competitive factors include the breadth of features offered, functionality, servicing capability and price. For more information regarding risks related to competition, see the information in Item 1A, under the heading “Our industry continues to become increasingly competitive, which makes it more challenging for us to maintain profit margins at historical levels.”
12
Technology
We believe that investment in technology is a crucial step in maintaining and enhancing our competitive position in the marketplace. Our data center network and infrastructure is supported by secure data centers with redundant locations. We have data centers in various locations in the United States including South Portland, Maine and Aurora, Colorado. We also have data centers and infrastructure located in various locations throughout Europe, Australia, New Zealand and Brazil.
Our fleet fuel-based closed-loop proprietary platforms capture detailed information from the fuel and maintenance locations within our network. Operating a proprietary network not only enhances our value proposition, it also enables us to limit dependence on third-party processors and to respond rapidly to changing customer needs with system upgrades, while maintaining a more secure environment than an open-loop network typically allows. Our virtual card open-loop network uses internally developed software and third-party processors. Our infrastructure has been designed around industry-standard architectures to reduce downtime in the event of outages or catastrophic occurrences. At WEX Health, we maintain an integrated multi-account payment platform, including a mobile application. In Australia, New Zealand, Brazil and the United Kingdom, we use standalone platforms to support operations.
Our secure networks are designed to isolate our databases from unauthorized access. We use security protocols among all applications, and our employees access critical components on a need-to-know basis. As of December 31, 2017, we have not experienced any material incidents in network, application or data security. We are continually improving our technology to enhance customer relationships and to increase efficiency and security. We also review technologies and services provided by others in order to maintain the high level of service expected by our customers and continue to invest in our infrastructure.
For information regarding technology related risks, see the information in Item 1A under the headings “Our business is regularly subject to cyberattacks and attempted security and privacy breaches and we may not be able to adequately protect our information systems, including the data we collect about our customers, which could subject us to liability and damage our reputation”, “Our failure to effectively implement new technology could jeopardize our position as a leader in our industry,” “We are dependent on technology systems and electronic communications networks managed by third parties, which could result in our inability to prevent service disruptions” and “If the technologies we use in operating our business and interacting with our customers fail, are unavailable, or do not operate to expectations, or we fail to successfully implement technology strategies and capabilities in connection with our outsourcing arrangements, our business and results of operation could be adversely impacted.”
Seasonality
Our businesses are affected by seasonal variations. For example, fuel prices are typically higher during the summer and online travel sales are typically higher during the third quarter. In addition, we experience seasonality in our Health and Employee Benefits Solutions segment, as consumer spend is correlated with insurance deductibles, typically resulting in higher spend in the early part of the year until employees meet their deductibles.
Intellectual Property
We rely on a combination of patent, copyright, trade secret and trademark laws, confidentiality procedures, contractual provisions and other similar measures to protect the proprietary information and technology used in our business. We generally enter into confidentiality, professional services and/or license agreements with our consultants and corporate partners and control access to and distribution of our technology, documentation and other proprietary information. Despite the efforts to protect our proprietary rights, unauthorized parties may attempt to copy or otherwise obtain the use of our products or technology that we consider proprietary and third parties may attempt to develop similar technology independently. We pursue registration and protection of our trademarks in the U.S. and other countries in which we operate or plan to operate. We market our products and services using the WEX, Fleet One, EFS and the WEX Health Cloud brand names in the U.S., the Motorpass and Motorcharge brand names in Australia and the WEX Latin America brand name in Brazil.
Regulation - United States
The Company and its affiliates are subject to certain state and federal laws and regulations, which govern insured depository institutions and their affiliates as well as our operations in the healthcare market. WEX Bank is subject to supervision and examination by both the Utah DFI and the FDIC. The Company and its affiliates are subject to certain limitations on transactions with affiliates set forth in the Federal Reserve Act (“FRA”). The Company is subject to anti-tying provisions in the Bank Holding Company Act. State and Federal laws and regulations limit the loans WEX Bank may make to one borrower and the types of investments WEX Bank may make.
Below is a description of the material elements of the laws, regulations, policies and other regulatory matters affecting the operations of WEX in the United States.
13
Exemption from Certain Requirements of the Bank Holding Company Act
As an industrial bank organized under the laws of Utah that does not accept demand deposits that may be withdrawn by check or similar means, WEX Bank meets the criteria for exemption from the definition of “bank” under the Bank Holding Company Act. As a result, the Company is generally, except as stated above, not subject to the Bank Holding Company Act.
Restrictions on Intercompany Borrowings and Transactions
Sections 23A and 23B of the FRA and the implementing regulations limit the extent to which the Company can borrow or otherwise obtain credit from or engage in other “covered transactions” with WEX Bank. “Covered transactions” include loans or extensions of credit, purchases of or investments in securities, purchases of assets, including assets subject to an agreement to repurchase, acceptance of securities as collateral for a loan or extension of credit, or the issuance of a guarantee, acceptance, or letter of credit. Although the applicable rules do not serve as an outright ban on engaging in “covered transactions,” they do limit the amount of covered transactions WEX Bank may have with any one affiliate and with all affiliates in the aggregate. The applicable rules also require that the Company engage in such transactions with WEX Bank only on terms and under circumstances that are substantially the same, or at least as favorable to WEX Bank, as those prevailing at the time for comparable transactions with nonaffiliated companies. Furthermore, with certain exceptions, each loan or extension of credit by WEX Bank to the Company or its other affiliates must be secured by collateral with a market value ranging from 100 percent to 130 percent of the amount of the loan or extension of credit, depending on the type of collateral.
The Consumer Financial Protection Bureau
The Dodd-Frank Act established the Consumer Financial Protection Bureau (“CFPB”) to regulate the offering of consumer financial products or services under the federal consumer financial laws. In addition, the CFPB was granted general authority to prevent covered persons or service providers from committing or engaging in unfair, deceptive or abusive acts or practices under federal law in connection with any transaction with a consumer for a consumer financial product or service. The CFPB has broad rulemaking authority for a wide range of consumer protection laws. The legislation also gives the state attorneys general the ability to enforce applicable federal consumer protection laws.
In addition, the Durbin Amendment to the Dodd-Frank Act provided that interchange fees that a card issuer or payment network receives or charges for debit transactions will now be regulated by the Federal Reserve and must be “reasonable and proportional” to the cost incurred by the card issuer in authorizing, clearing and settling the transaction. Payment network fees may not be used directly or indirectly to compensate card issuers in circumvention of the interchange transaction fee restrictions. In July 2011, the Federal Reserve published the final rules governing debit interchange fees. Effective in October 2011, with certain exemptions, debit interchange rates were capped at $0.21 per transaction with an additional component of five basis points of the transaction’s value to reflect a portion of the issuer’s fraud losses plus, for qualifying issuing financial institutions, an additional $0.01 per transaction in debit interchange for fraud prevention costs.
Brokered Deposits
Under FDIC regulations, depending upon their capital classification, banks may be restricted in their ability to accept brokered deposits. “Well capitalized” banks are permitted to accept brokered deposits, but banks that are not “well capitalized” are not permitted to accept such deposits. The FDIC may, on a case-by-case basis, permit banks that are “adequately capitalized” to accept brokered deposits if the FDIC determines that acceptance of such deposits would not constitute an unsafe or unsound banking practice.
Other Financial Regulatory Requirements
WEX Bank must monitor and report unusual or suspicious account activity, as well as transactions involving amounts in excess of prescribed limits, as required by the Bank Secrecy Act and Internal Revenue Service regulations. The USA PATRIOT Act of 2001 substantially broadened the scope of U.S. anti-money laundering laws and regulations by imposing significant new compliance and due diligence obligations, identifying new crimes and penalties and expanding the extra-territorial jurisdiction of the United States. The United States Treasury Department has proposed and, in some cases, issued a number of implementing regulations which impose obligations on financial institutions to maintain appropriate policies, procedures and controls to detect, prevent and report money laundering and terrorist financing and to verify the identity of their customers. Certain of those regulations impose specific due diligence requirements on financial institutions that maintain correspondent or private banking relationships with non-U.S. financial institutions or persons. Failure of a financial institution to maintain and implement adequate programs to combat money laundering and terrorist financing could have serious legal and reputational consequences for the institution.
The U.S. federal government has imposed economic sanctions that affect transactions with designated foreign countries, nationals and others. These sanctions, which are administered by the United States Treasury’s Office of Foreign Assets Control
14
(“OFAC”), take many different forms but generally include one or more of the following elements: (i) restrictions on trade with or investment in a sanctioned country, including prohibitions against direct or indirect imports from and exports to a sanctioned country and prohibitions on “U.S. persons” engaging in financial transactions relating to making investments in, or providing investment-related advice or assistance to, a sanctioned country; and (ii) a blocking of assets in which the government or specially designated nationals of the sanctioned country have an interest, by prohibiting transfers of property subject to U.S. jurisdiction (including property in the possession or control of U.S. persons). Blocked assets (for example, property and bank deposits) cannot be paid out, withdrawn, set off or transferred in any manner without a license from OFAC. Failure to comply with these sanctions could have serious legal and reputational consequences.
Under the Financial Services Modernization Act of 1999, also referred to as the “Gramm-Leach-Bliley Act" (or “GLBA”), the Company and WEX Bank are required to maintain a comprehensive written information security program that includes administrative, technical and physical safeguards relating to customer information. However, this requirement does not generally apply to information about companies or about individuals who obtain financial products or services for business, commercial, or agricultural purposes. The GLBA also requires the Company and WEX Bank to provide initial and annual privacy notices to customers that describe in general terms their information sharing practices. If the Company and WEX Bank intend to share nonpublic personal information about customers with affiliates and/or nonaffiliated third parties, they must provide customers with a notice and a reasonable period of time for each consumer to “opt out” of any such disclosure. In addition to U.S. federal privacy laws, states also have adopted statutes, regulations and other measures governing the collection and distribution of nonpublic personal information about customers. In some cases these state measures are preempted by federal law, but if not, the Company and WEX Bank must monitor and comply with such laws in the conduct of its business.
Escheat Laws
We are subject to unclaimed or abandoned property state laws in the United States and in certain foreign countries that require us to transfer to certain government authorities the unclaimed property of others that we hold when that property has been unclaimed for a certain period of time. Moreover, we are subject to audit by state and foreign regulatory authorities with regard to our escheatment practices.
Restrictions on Dividends
WEX Bank is subject to various regulatory requirements relating to the payment of dividends, including requirements to maintain capital above regulatory minimums. A banking regulator may determine that the payment of dividends would be inappropriate and could prohibit payment. Further, WEX Bank may not pay a dividend if it is undercapitalized or would become undercapitalized as a result of paying the dividend. Utah law permits WEX Bank to pay dividends out of the net profits of the industrial bank after providing for all expenses, losses, interest, and taxes accrued or due, but if WEX Bank’s surplus account is less than 100 percent of its capital stock, WEX Bank must transfer up to 10 percent of its net profits to the surplus account prior to the payment of any dividends.
Company Obligations to WEX Bank
Any non-deposit obligation of WEX Bank to the Company is subordinate, in right of payment, to deposits and other indebtedness of WEX Bank. In the event of the Company’s bankruptcy, any commitment by the Company to a federal bank regulatory agency to maintain the capital of WEX Bank will be assumed by the bankruptcy trustee and entitled to priority of payment.
Restrictions on Ownership of WEX Inc. Common Stock
WEX Bank, and therefore the Company, is subject to bank regulations that impose requirements on entities that might control WEX Bank through control of the Company. These requirements are discussed in Item 1A under the heading “If any entity controls 10 percent or more of our common stock and such entity has caused a violation of applicable banking laws by its failure to obtain any required approvals prior to acquiring that common stock, we have the power to, and may be required to, restrict such entity’s ability to vote shares held by it.”
Healthcare Regulation
The federal and state governments in the U.S. continue to enact and consider many broad-based legislative and regulatory proposals that could materially impact various aspects of our health-related business. The plans that our partners administer feature consumer accounts that pay for out-of-pocket expenses incurred by employees and qualified dependents. These accounts include Consumer-Directed Health ("CDH") accounts such as Health Savings Accounts, Flexible Spending Accounts, and Health Reimbursement Arrangements (commonly referred to as HSAs, FSAs and HRAs, respectively), as well as wellness incentives, commuter benefits, and other account-based arrangements. Most of these accounts are tax-advantaged under the appropriate law.
15
Employers are continuing to use CDH approaches to manage the rate of increase in healthcare expenditures and to enable employees to make decisions about the use of their healthcare savings. CDH programs provide consumers with visibility of and control over payment for healthcare expenses.
The products that WEX Health's software and payment solutions support are subject to various state and federal laws, including the Affordable Care Act, and regulations promulgated by the Internal Revenue Service, the Department of Health and Human Services, the Department of Labor, and the Consumer Financial Protection Bureau. As such, changes in the status of tax-advantaged CDH accounts could affect the attractiveness of these products.
In addition to tax-related regulation, the Patient Protection and Affordable Care Act and the Health Care and Education Reconciliation Act (collectively referred to as “Health Care Reform”) mandated broad changes affecting insured and self-insured health benefit plans that impact our current business model, including our relationship with current and future customers, producers and health care providers, products, services, processes and technology. Health Care Reform left many details to be established through regulations. While federal agencies have published proposed and final regulations with respect to most provisions, some issues remain uncertain. The 2017 Tax Cuts and Jobs Act repealed certain provisions of Health Care Reform, including reducing to zero the tax penalty for going without Health Care Reform-compliant healthcare coverage. The current U.S. Administration and Congress have signaled their intent to significantly modify or completely repeal Health Care Reform and the associated implementing regulations. It is unclear what, if any, additional measures may be taken in this regard. Accordingly, there may be an extended period of uncertainty and unpredictability in the U.S. health care market, which may materially affect the availability and cost of health coverage, the viability of health care providers and health benefit plans, the proportion of persons in the U.S. who have health insurance; the distribution between privately funded and government funded health insurance; and the future demand for, and profitability of, the offerings of our health-related business under our current business model.
In connection with the processing of data, we frequently undertake or are subject to specific compliance obligations under privacy and data security-related laws, including the Health Insurance Portability and Accountability Act of 1996, or HIPAA, the Gramm-Leach-Bliley Act, and similar state and federal laws governing the collection, use, protection and disclosure of nonpublic personally identifiable information, including individually identifiable health information.
HIPAA and its implementing regulations, as amended by the Health Information Technology for Economic and Clinical Health Act, or the HITECH Act, impose requirements relating to the privacy, security and transmission of individually identifiable health information. Among other things, HIPAA, as amended by the HITECH Act, and its implementing regulations, subjects us to regulations and contractual obligations that impose privacy and security standards and breach notification and reporting requirements.
In addition to tax, federal data privacy, security laws and regulations, we are subject to state laws governing confidentiality and security of personally identifiable information and additional state-imposed breach notification and reporting requirements.
Regulation - Foreign
The conduct of our businesses and the use of our products and services outside the U.S., are subject to various foreign laws and regulations administered by government entities and agencies in the countries and territories where we operate. Below is a summary of material applicable laws and regulations in the jurisdictions around the world in which we do business.
Asia-Pacific
Australia
The Company’s Australian operations are subject to laws and regulations of the Commonwealth of Australia governing banking and payment systems, financial services, credit products and money laundering. Because none of WEX Australia, WEX Fuel Cards Australia or WEX Prepaid Cards Australia holds an Australian Financial Services License or credit license or is an authorized deposit-taking institution, they operate within a framework of regulatory relief and exemptions afforded them on the basis that they satisfy the requisite conditions. The Australian operations are also subject to the Privacy Act (1988) and the Australian Privacy Principles.
Asia, including Singapore
The Company's operations in Asia are subject to the operation of the laws and regulation of the countries in which we operate, including laws with regards to banking and payment systems, financial services, money laundering and data protection.
16
Europe
The Company’s European operations are subject to laws and regulations of the European Union and the countries in which we operate including, among others, those governing payment services, data protection, including General Data Protection Regulation (commonly referred to as "GDPR"), and information security, consumer credit and anti-money laundering.
Brazil
The Company’s Brazilian operations are subject to laws and regulations of the Brazilian government, in particular the Central Bank of Brazil. Brazil’s labor systems are governed by the Consolidation of Brazilian Labor Laws. Brazil is a signatory of the World Trade Organization’s Trade-Related Aspects of Intellectual Property Rights agreement. This agreement establishes a minimum protection standard to property rights and requires signatory countries to review and adapt national laws that meet that standard.
Segments and Geographic Information
For an analysis of financial information about our segments as well as our geographic areas, see Item 8 - Note 23, Segment Information of our consolidated financial statements included elsewhere in this Annual Report on Form 10-K.
For a description of the risks related to our foreign operations, see the information in Item 1A, Risk Factors under the heading “We are exposed to risks associated with operations outside of the United States, which could harm both our U.S. and international operations.”
Available Information
The Company’s principal executive offices are located at 97 Darling Avenue, South Portland, ME 04106. Our telephone number is (207) 773-8171, and our Internet address is www.wexinc.com. The Company’s annual, quarterly and current reports, proxy statements and certain other information filed with the SEC, as well as amendments thereto, may be obtained free of charge from our website. These documents are posted to our website as soon as reasonably practicable after we have filed or furnished these documents with the SEC. These documents are also available at the SEC’s Public Reference Room at 100 F Street, NE, Washington, DC 20549. The public may obtain information on the operation of the Public Reference Room by calling the SEC at 1-800-SEC-0330. The SEC maintains an Internet site that contains reports, proxy and information statements and other information regarding issuers that file electronically with the SEC at www.sec.gov. The Company’s Audit Committee Charter, Compensation Committee Charter, Finance Committee Charter, Corporate Governance Committee Charter, Corporate Governance Guidelines and Code of Business Conduct and Ethics are available without charge through the “Corporate Governance” portion of the Investor Relations page of the Company’s website. Copies will also be provided, free of charge, to any stockholder upon written request to Investor Relations at the address above or by telephone at (866) 230-1633.
The Company’s Internet site and the information contained on it are not incorporated into this Form 10-K and should not be considered part of this report.
17
ITEM 1A. RISK FACTORS
The risks and uncertainties described below are not the only risks and uncertainties that we face. Additional risks and uncertainties not presently known to us or that we currently deem immaterial may also impair our business operations. If any of those risks actually occurs, our business, financial condition, results of operations and cash flows could suffer. The risks and uncertainties discussed below also include forward-looking statements and our actual results may differ materially from those discussed in these forward-looking statements.
Risks Relating to Our Company
A significant portion of our revenues are related to the dollar amount of fuel purchased by our customers, and, as a result, volatility in fuel prices could have an adverse effect on our revenues.
Our customers in our Fleet Solutions segment primarily purchase fuel. Accordingly, a significant part of our revenue is dependent on fuel prices, which are prone to volatility. As of December 31, 2017, management estimates that approximately 21 percent of our total revenues result from fees paid to us by fuel providers based on a negotiated percentage of the purchase price of fuel purchased by our customers. We estimate that during 2017, each one cent decline in average domestic fuel prices below average actual prices would result in approximately a $1.2 million decline in 2017 revenue. Therefore, extended declines in the price of fuel would have a material adverse effect on our total revenues. In the fourth quarter of 2014, we suspended our fuel price hedging program and as of the second quarter of 2016, we no longer had any remaining fuel hedging derivatives outstanding. As a result, we are exposed to the full impact of fuel price declines and our net income is exposed to fuel price volatility unless and until a fuel price hedging program is reinstated. If fuel prices decline, the lack of a hedge will negatively impact our revenue and income.
Fuel prices are dependent on many factors, all of which are beyond our control. These factors include, among others:
• | supply and demand for oil and gas, and expectations regarding supply and demand; |
• | speculative trading; |
• | actions by major oil exporting nations; |
• | level of U.S. oil production; |
• | advances in oil production technologies; |
• | political conditions in other oil-producing, gas-producing or supply-route countries, including revolution, insurgency, terrorism or war; |
• | refinery capacity; |
• | weather; |
• | the prices of foreign exports and the availability of alternate fuel sources; |
• | value of the U.S. dollar versus other major currencies; |
• | actions by members of Organization of Petroleum Exporting Countries and other major oil-producing nations; |
• | implementation of fuel efficiency standards and the adoption by fleet customers of vehicles with greater fuel efficiency or alternative fuel sources; |
• | general worldwide economic conditions; and |
• | governmental regulations, taxes and tariffs. |
Another component of our revenue stream is the late fees that our customers pay on past due balances. As a result, a decrease in the price of fuel leads to a decline in the amount of late fees we earn from customers who fail to pay us timely.
A portion of our revenue in Europe is derived from the difference between the negotiated price of the fuel from the supplier and the price charged to the fleet customer. As a result, a contraction in these differences would reduce revenues and could adversely affect our operating results.
Revenue from our European Fleet business is derived from transactions where our revenue is tied to the difference between the negotiated price of the fuel from the supplier and the price charged to the fleet customer. The merchant’s cost of fuel is dependent on several factors including, among others, the factors described above affecting fuel prices. We experience fuel-price related revenue contraction when the merchant’s cost of fuel increases at a faster rate than the fuel
18
price we charge to our fleet customers, or the fuel-price we charge to our fleet customers decreases at a faster rate than the merchant’s cost of fuel. Accordingly, we generate less revenue, which could adversely affect our operating results.
Changes in interchange fees could decrease our revenue.
A portion of our revenue is generated by network processing fees charged to merchants, known as interchange fees, associated with transactions processed using our cards. Interchange fee amounts associated with cards are affected by a number of factors, including regulatory limits and fee changes. In addition, interchange fees are the subject of intense legal and regulatory scrutiny and competitive pressures in the electronic payments industry. For example, the Durbin Amendment to the Dodd-Frank Act, which serves to limit interchange fees may restrict or otherwise impact the way we do business or limit our ability to charge certain fees to customers. The Consumer Financial Protection Bureau, or the CFPB, is also engaged in rulemaking and regulation of the payments industry, in particular with respect to prepaid cards. On January 25, 2018, the CFPB issued a final rule amending several aspects of its prepaid accounts rule adopted in October 2016 and delayed the overall effective date for such prepaid accounts rule to April 1, 2019. The extensive nature of these regulations and the implementation dates for this additional rulemaking may result in additional compliance obligations and expense for our business and our customers. These factors could result in lower interchange fees generally in the future. Temporary or permanent decreases in the interchange fees associated with our card transactions, could adversely affect our business and operating results.
If we fail to adequately assess and monitor credit risks posed by our customers, we could experience an increase in credit loss.
We are subject to credit risk posed by our customers, many of which are small-to mid-sized businesses. Because we often fund a customer's entire receivable while our revenue is generated from only a small percentage of that amount, our risk of loss is amplified by the customer's failure to pay. We use various formulas and models to screen potential customers and establish appropriate credit limits, but these formulas and models cannot eliminate all potential credit risks and may not prevent us from approving applications that are fraudulently completed. Moreover, businesses that are good credit risks at the time of application may deteriorate over time and we may fail to detect such changes. In addition, changes to our policies on the types and profiles of businesses to which we extend credit could also have an adverse impact on our credit losses. In times of economic slowdown, the number of our customers who default on payments owed to us tends to increase. If we fail to adequately manage our credit risks, our provision for credit losses on the income statement could be significantly higher.
We may incur substantial losses due to fraudulent use of our payment cards, payment systems or vouchers.
Under certain circumstances, we may bear the risk of substantial losses due to fraudulent use of our payment cards or payment systems. We are also subject to risk from fraudulent acts of employees or contractors. Although we maintain insurance for certain types of losses, the coverage may be insufficient or limited and may not fully protect against those losses. Additionally, criminals use sophisticated illegal activities to target us, including "skimming", counterfeit cards and accounts, and identity theft. A single, significant incident or a series of incidents of fraud or theft could lead to, among other things, some or all of the following:
• | increased overall level of fraud; |
• | direct financial losses as a result of fraudulent activity; |
• | reputational harm; |
• | decreased desirability of our services; |
• | greater regulation; |
• | increased compliance costs; |
• | imposition of regulatory sanctions; or |
• | significant monetary fines. |
All of the above could have a material adverse effect on our operations, business success, financial condition and results of operations. Our bad debt expense, inclusive of fraud losses, was $61.1 million in 2017 compared to $33.3 million in 2016.
Fluctuations in foreign currency exchange rates could affect our financial results.
We earn revenues, pay expenses, own assets and incur liabilities in countries using currencies other than the U.S. dollar. Such currencies include, but are not limited to, the Australian dollar, the Canadian dollar, the Euro, British Pound sterling, New Zealand dollar and Brazilian Real. Because our consolidated financial statements are presented in U.S. dollars, we must translate revenues, income and expenses, as well as assets and liabilities, into U.S. dollars at exchange rates in
19
effect during or at the end of each reporting period. Realized and unrealized gains and losses on foreign currency transactions as well as the re-measurement of our cash, receivable and payable balances that are denominated in foreign currencies, are recorded directly in the consolidated statements of income. In addition, gains and losses associated with the Company's foreign currency exchange derivatives are recorded on the consolidated statements of income.
Therefore, increases or decreases in the value of the U.S. dollar against other major currencies that we use to conduct our business will affect our revenues, operating income and the value of balance sheet items denominated in those currencies. Fluctuations in foreign currency exchange rates, particularly fluctuations in the U.S. dollar against other currencies, may materially affect our financial results.
Our exposure to counterparty risk could create an adverse effect on our financial condition.
We engage in a number of transactions where counterparty risk is a relevant factor, including transactions with customers, derivatives counterparties and those businesses we work with to provide services, among others. These risks are dependent upon market conditions and also the real and perceived viability of the counterparty. The failure or perceived weakness of any of our counterparties has the potential to expose us to risk of loss in certain situations. Certain contracts and arrangements that we enter into with counterparties may provide us with indemnification clauses to protect us from financial loss. If the counterparty fails to, or is unable to fulfill these indemnification clauses, we may incur losses as well as harm to our reputation.
We have substantial indebtedness, which may materially and adversely affect our financial flexibility and our ability to meet our debt service obligations.
Our 2016 Credit Agreement, as amended on January 17, 2018, provides for a tranche A term loan facility in an amount equal to $455 million that matures on July 1, 2021 (of which $421 million remained outstanding at the time of the amendment), a tranche B term loan facility in an amount equal to $1,335 million that matures on July 1, 2023 and a $570 million secured revolving credit facility, with a $250 million sublimit for letters of credit and a $20 million sublimit for swingline loans, that terminates on July 1, 2021. Prior to maturity, amounts under the credit facility will be reduced by mandatory amortization payments and may be reduced by the mandatory prepayment of our tranche B term loan facility out of a certain portion of our excess cash or by optional prepayments. In addition to the 2016 Credit Agreement, our indebtedness consists of our 4.750 percent senior notes in the principal amount of $400 million due 2023 (the “Notes”), deposits issued by WEX Bank and other liabilities outstanding. Our indebtedness could, among other things:
• | require us to dedicate a substantial portion of our cash flow to repaying our indebtedness, thus reducing the amount of funds available for other general corporate purposes; |
• | limit our ability to borrow additional funds necessary for working capital, capital expenditures or other general corporate purposes; |
• | increase our vulnerability to adverse general economic or industry conditions; and |
• | limit our flexibility in planning for, or reacting to changes in, our business. |
There can be no assurance that we will be able to meet our indebtedness obligations, including any of our obligations under the Notes. In addition, we may need to incur substantial additional indebtedness in the future to fund our operations or certain strategic objectives. However, we may not be able to obtain the additional financing necessary for these purposes.
In addition, under the 2016 Credit Agreement, unless otherwise agreed by the requisite lenders under the revolving credit facility, we are required to remain in compliance with a consolidated EBITDA to consolidated interest charge ratio, measured quarterly, of no less than 3.25 to 1.00; and a consolidated funded indebtedness (excluding up to $350 million of consolidated funded indebtedness due to permitted securitization transactions and excluding the amount of consolidated funded indebtedness constituting the non-recourse portion of permitted factoring transactions) to consolidated EBITDA ratio,measured quarterly, of no more than 5.00 to 1.00, which ratio shall step down to 4.50 to 1.00 at December 31, 2018 and 4.00 to 1.00 at December 31, 2019. In addition, in the event of an acquisition meeting certain specified criteria, the consolidated leverage ratio shall be permanently increased by 0.50:1.00. The 2016 Credit Agreement also contains various affirmative and negative covenants that, subject to certain customary exceptions, restrict our ability to, among other things, create liens over our property, incur additional indebtedness, enter into sale and lease-back transactions, make loans, advances or other investments, make non-ordinary course asset sales, declare or pay dividends or make other distributions with respect to equity interests, change the nature of our business, enter into certain agreements which restrict our ability to pay dividends or other distributions or create liens on our property, transact business with affiliates and/or merge or
20
consolidate with any other person. Our ability to comply with these provisions may be affected by events beyond our control. Failure to comply with the financial covenants or any other non-financial or restrictive covenant in our 2016 Credit Agreement could create a default. Upon a default, our lenders could accelerate the indebtedness under the facilities (except only the requisite lenders under the revolving credit facility and the tranche A term loan facility may accelerate the revolving credit facility due to a breach of the financial covenants), foreclose against their collateral or seek other remedies, which could trigger a default under the Notes and would jeopardize our ability to continue our current operations.
Despite our substantial indebtedness, we may still be able to incur more debt, intensifying the risks described above.
Subject to restrictions in our 2016 Credit Agreement and the Notes, we may incur additional indebtedness, which could increase the risks associated with our already substantial indebtedness. Subject to certain limitations, including compliance with the covenants in our 2016 Credit Agreement, we have the ability to borrow additional funds under our 2016 Credit Agreement.
This indebtedness could have the effect, among other things, of reducing our flexibility to respond to changing business and economic conditions and increasing interest expense.
Moreover, we may be required to raise substantial additional financing to fund working capital, capital expenditures, acquisitions or other general corporate requirements. Our ability to arrange additional financing or refinancing will depend on, among other factors, our financial position and performance, as well as prevailing market conditions and other factors beyond our control. There can be no assurance that we will be able to obtain additional financing or refinancing on terms acceptable to us or at all.
Volatility in the financial markets may negatively impact our ability to access credit and the terms at which we would access such credit.
Adverse conditions in the credit market may limit our ability to access credit at a time when we would like or need to do so. Our senior secured revolving credit facility under the 2016 Credit Agreement expires in July 2021 when the outstanding balance of the revolving credit facility and the tranche A term loan will be due, and in 2023 the tranche B term loan and the Notes will be due. Any limitation on the availability of funds or credit facilities could have an impact on our ability to refinance the maturing debt or react to changing economic and business conditions which could adversely impact us.
Volatility in the financial markets may negatively impact WEX Bank’s ability to attract and retain deposits.
Adverse conditions in the credit market may limit WEX Bank’s ability to attract deposits at a time when it would like or need to do so. A significant credit ratings downgrade, material capital market disruptions, significant withdrawals by depositors at WEX Bank, or adverse changes to its industrial bank charter could impact our ability to maintain adequate liquidity and impact our ability to provide competitive offerings to our customers. Any limitation of availability of deposits could have an impact on our ability to finance our U.S. accounts receivable which would adversely impact us.
Our industrial bank subsidiary is subject to funding risks associated with its reliance on brokered deposits.
Under applicable regulations, if WEX Bank were no longer “well capitalized,” it would not be able to accept brokered deposits without the approval of the FDIC. WEX Bank’s inability to accept brokered deposits, or a loss of a significant amount of its brokered deposits, could adversely affect our liquidity. Additionally, such circumstances could require it to raise deposit rates in an attempt to attract new deposits, or to obtain funds through other sources at higher rates, which would adversely affect our results of operations.
To service our indebtedness, we will require a significant amount of cash. Our ability to generate cash depends on many factors beyond our control.
Our ability to make payments on and to refinance our indebtedness, and to fund capital expenditures, acquisitions and research and development efforts will depend on our ability to generate cash. This, to a certain extent, is subject to economic, financial, competitive, legislative, regulatory and other factors that are beyond our control.
We have substantial indebtedness, and may incur additional indebtedness, which could lead to increased interest expense and could increases the amount of cash flows required to fund interest expense associated with our indebtedness. In addition, certain obligations under the 2016 Credit Agreement bear interest at variable interest rates. We currently maintain five forward-fixed interest rate swap agreements which are intended to fix the future interest payments associated with $1,300 million of our variable-rate borrowings; however, those swap agreements expire at various points prior to the
21
expiration of the 2016 Credit Agreement. In addition, interest rate increases still could result in larger debt service requirements. Such an increase in our debt service obligations would adversely affect our cash flows.
We cannot assure you that our business will generate sufficient cash flows from operations, that anticipated cost savings and operating improvements will be realized on schedule or at all, that future borrowings will be available to us under our 2016 Credit Agreement or any subsequent credit agreement, or that we can obtain alternative financing proceeds in an amount sufficient to enable us to pay our indebtedness, including the Notes, or to fund our other liquidity needs. We may need to refinance all or a portion of our indebtedness, including the Notes, at or before maturity. We cannot assure you that we will be able to refinance any of our indebtedness on commercially reasonable terms or at all.
The debt service obligations under our 2016 Credit Agreement could also reduce funds available for working capital, capital expenditures, acquisitions and other general corporate purposes and may create competitive disadvantages relative to other companies with lower debt levels. The 2016 Credit Agreement was used in part to finance the acquisition of EFS. If we do not achieve the expected benefits and cost savings from the acquisition, or if the financial performance of the combined company does not meet current expectations, then our ability to service our indebtedness may be adversely impacted.
In an environment of increasing interest rates, interest expense on the variable rate portion of our borrowings would increase and we may not be able to replace our maturing debt with new debt that carries the same interest rates. We may be adversely affected by significant changes in the brokered deposit market.
Our industrial bank subsidiary, WEX Bank, uses collectively brokered deposits, including certificates of deposit and interest-bearing money-market deposits, to finance payments to major oil companies. Certificates of deposit carry fixed interest rates from issuance to maturity, which vary and are relatively short term in duration. The interest-bearing money market deposits carry variable rates. Upon maturity, the deposits will likely be replaced by issuing new deposits to the extent that they are needed. In a rising interest rate environment, WEX Bank would not be able to replace maturing deposits with deposits that carry the same or lower interest rates. Therefore, rising interest rates would result in reduced net income to the extent that certificates of deposit and money market deposits mature and are replaced. At December 31, 2017, WEX Bank had outstanding $630.9 million in certificates of deposit maturing within one year, $306.9 million in certificates of deposit maturing between one and three years, and $285.9 million in interest-bearing money market deposits, for an aggregate exposure of $1,223.7 million in brokered deposits at WEX Bank.
Additionally, under our 2016 Credit Agreement and Notes, we had $2,139.4 million of fixed and variable interest rate indebtedness outstanding at December 31, 2017, consisting of $400.0 million of borrowings under our bond facility at a fixed rate of 4.750 percent and $1,300 million of borrowings under our 2016 Credit Agreement that bore interest at floating rates, subject to the partial hedging arrangement described above. An increase in interest rates would increase the cost of borrowing under our 2016 Credit Agreement.
Our 2016 Credit Agreement uses LIBOR as a reference rate for our term loans and revolving credit facility, such that the interest due pursuant to a such loans may be calculated using LIBOR (subject to a stated minimum value). On July 27, 2017, the United Kingdom’s Financial Conduct Authority, which regulates LIBOR, announced that it intends to phase out LIBOR by the end of 2021. It is unclear if at that time LIBOR will cease to exist or if new methods of calculating LIBOR will be established such that it continues to exist after 2021. The future of LIBOR at this time is uncertain. If the method for calculation of LIBOR changes, if LIBOR is no longer available or if lenders have increased costs due to changes in LIBOR, we may suffer from potential increases in interest rates on our floating debt rate. Further, we may need to renegotiate our 2016 Credit Agreement and the loans that utilize LIBOR as a factor in determining the interest rate to replace LIBOR with the new standard that is established.
The Dodd-Frank Act may have a significant impact on our business, results of operation and financial condition.
On July 21, 2010, the Dodd-Frank Wall Street Reform and Consumer Protection Act of 2010, or the Dodd-Frank Act, was enacted into law. The Dodd-Frank Act, among other things, when fully implemented, will result in substantial changes in the regulation of derivatives and capital market activities. The impact of the Dodd-Frank Act is difficult to assess because many provisions are being phased in over time and because the current Presidential administration has indicated it may make or propose changes to provisions of the Dodd-Frank Act. In particular, the Dodd-Frank Act establishes federal oversight and regulation of the over-the-counter derivatives market and entities that participate in that market. The rules, if enacted in their proposed form, may require us to change to any fuel price, currency and interest rate hedging practices we may then use to comply with new regulatory requirements. Potential changes include clearing and execution methodology of our derivatives transactions. The Dodd-Frank Act also requires many counterparties to derivatives instruments to spin off some of their derivatives activities to a separate entity. These new entities may not be as creditworthy as the current counterparty. Presently, we cannot assess the capital or margin requirements which might apply to our over-the-counter
22
transactions. Once implemented, these changes could result in increased transaction costs. In summary, the Dodd-Frank Act and any new regulations could increase the cost of derivative contracts or modify the way in which we conduct those transactions. Additionally, we are required to pay to the lenders under the 2016 Credit Agreement, any increased costs associated with the Dodd-Frank Act and other changes in laws, rules or regulations, subject to the terms of the 2016 Credit Agreement.
The Dodd-Frank Act also created the CFPB, to regulate the offering of consumer financial products or services under the federal consumer financial laws. The CFPB assumed rulemaking authority under the existing federal consumer financial protection laws, and enforces those laws against and examines certain non-depository institutions and insured depository institutions with total assets greater than $10 billion and their affiliates. In addition, the CFPB was granted general authority to prevent covered persons or service providers from committing or engaging in unfair, deceptive or abusive acts or practices under federal law in connection with any transaction with a consumer for a consumer financial product or service, or the offering of a consumer financial product or service. The CFPB also has broad rulemaking authority for a wide range of consumer protection laws. It is unclear what changes will be promulgated by the CFPB and what effect, if any, such changes would have on our business and operations.
As required under the Dodd-Frank Act, the Government Accountability Office issued its study on the implications of any elimination of the exemption to the definition of “bank” for industrial banks under the Bank Holding Company Act. The study did not make a recommendation regarding the elimination of this exemption. However, if this exemption were eliminated without any grandfathering or accommodations for existing institutions, we could be required to become a bank holding company which could require us to either cease certain activities or divest WEX Bank.
The current U.S. Administration and Congress have signaled their intent to significantly or completely repeal the Dodd-Frank Act and the associated implementing regulations, and it is unclear what, if any, measures may be implemented to replace it. Accordingly, there may be an extended period of uncertainty and unpredictability regarding the provisions of federal law and regulations that affect our business and operations.
The Dodd-Frank Act and any related legislation or regulations, or any repeal or replacement of such legislation or regulations, may have a material impact on our business, results of operations and financial condition. The full impact of the Dodd-Frank Act will not be known until all of the regulations implementing the statute are adopted and implemented. However, compliance with these new laws and regulations may require us to make changes to our business, and, there is a significant possibility that the Dodd-Frank Act will, at a minimum, result in increased regulatory burden and compliance costs. We may be required to invest significant management time and resources to address the various provisions of the Dodd-Frank Act and the numerous regulations that are required to be issued under it, or to address the changed business environment resulting from a repeal of all or part of the Dodd Frank Act and any related legislation or regulation.
Decreased demand for fuel and other vehicle products and services could harm our business and results of operations.
Demand for fuel and other vehicle products and services may be reduced by factors that are beyond our control, such as the implementation of fuel efficiency standards and the development by vehicle manufacturers and adoption by our fleet customers of vehicles with greater fuel efficiency or alternative fuel sources. To the extent that our customers require less fuel, that decline in purchase volume could reduce our revenues, limiting our profitability and preventing us from taking on other initiatives.
Our business is dependent on several key strategic relationships, the loss of which could adversely affect our results of operations.
Revenue we received from services we provided to our top five customers and strategic relationships accounted for approximately 10 percent of our total revenues in 2017. Accordingly, we are dependent on maintaining our strategic relationships and our results of operations would be lower in the event that any of these relationships ceases to exist. Likewise, we have agreements with the major oil companies, fuel retailers and truck stop merchants whose locations accept our payment processing services. The termination of any of these agreements would reduce the number of locations where our payment processing services are accepted; therefore, we could lose our competitive advantage and our operating results could be adversely affected. While we regularly monitor these relationships, there can be no guarantee that we will be able to maintain them in the future.
We may never realize the anticipated benefits of acquisitions we have completed or may undertake.
We have acquired and may attempt to acquire businesses, technologies, services, products or licenses in technologies that we believe are a strategic fit with our business. The process of integrating and operating any acquired
23
business, technology, service or product may result in unforeseen redundancies, operating difficulties, and expenditures and may divert significant management attention from our ongoing business operations. As a result, we may incur a variety of costs in connection with acquisitions and may never realize the anticipated benefits.
We are exposed to risks associated with operations outside of the United States, which could harm both our U.S. and international operations.
We conduct operations in North America, South America, Asia Pacific and Europe. As part of our business strategy and growth plan, we plan to further expand internationally. Expansion of our international operations could impose substantial burdens on our resources, divert management’s attention from U.S. operations and otherwise harm our business. In addition, there are many barriers to competing successfully in the international market, including:
• | fluctuation in foreign currencies; |
• | changes in the relations between the United States and foreign countries; |
• | actions of foreign or United States governmental authorities affecting trade and foreign investment; |
• | increased infrastructure costs including complex legal, tax, accounting and information technology laws and treaties; |
• | interpretation and application of local laws and regulations including, among others, those impacting anti-money laundering, bribery, financial transaction reporting and positive balance or prepaid cards; |
• | enforceability of intellectual property and contract rights; |
• | potentially adverse tax consequences due to, but not limited to, the repatriation of cash and negative consequences from changes in or interpretations of tax laws |
• | competitive pressure on products and services from companies based outside the U.S. that can leverage lower costs of operations; |
• | the United Kingdom's decision in a June 23, 2016 referendum to leave the European Union (EU) (commonly referred to as “Brexit”); and |
• | local labor conditions and regulations. |
We cannot assure you that our investments outside the United States will produce desired levels of revenue or costs, or that one or more of the factors listed above will not harm our business.
New laws, regulations and enforcement activities could negatively impact our business and the markets we presently operate in or could limit our expansion opportunities.
Our operations are subject to substantial regulation both domestically and internationally. There are often new regulatory efforts which could result in significant constraints and may impact our operations. These existing and emerging regulations can make the expansion of our business very difficult and negatively impact our revenue. Among the regulations that impact us or could impact us are those governing: interchange rates; interest rate and fee restrictions; credit access and disclosure requirements; collection and pricing requirements; compliance obligations; data security and data breach requirements; identity theft avoidance programs; health care mandates; and anti-money laundering compliance programs. We also often must obtain permission to conduct business in new locations from government regulators. Changes to these regulations, including expansion of consumer-oriented regulation to business-to-business transactions, could negatively impact our operations, financial condition and results of operations and could further increase our compliance costs and limit our ability to expand to new markets.
We also conduct business with other highly regulated businesses such as banks, payment card issuers, and health insurance providers. These industries are subject to significant potential reforms that could negatively affect these businesses, their ability to maintain or expand their products and services, and the costs associated with doing so. These developments could also negatively impact our business.
24
Laws or regulations developed in one jurisdiction or for one product could result in new laws or regulations in other jurisdictions or for other products.
Regulators often monitor other approaches to the governance of the payment industry. As a result, a law or regulation enacted in one jurisdiction could result in similar developments in another. In addition, law and regulation involving one product could influence the extension of regulations to other product offerings.
The expansion of certain regulations could negatively impact our business in other geographies or for other products. Rules and regulations concerning interchange and business operations regulations, for example, may differ from country to country which adds complexity and expense to our operations.
These varying and increasingly complex regulations could limit our ability to globalize our products and could significantly and adversely affect our business, financial condition and results of operations.
Regulations and industry standards intended to protect or limit access to personal information could adversely affect our ability to effectively provide our services.
Governmental bodies in the United States and abroad have adopted, or are considering the adoption of, laws and regulations restricting the transfer of, and requiring safeguarding of, non-public personal information. For example, in the United States, all financial institutions must undertake certain steps to ensure the privacy and security of consumer financial information. In Europe, the adoption of General Data Protection Regulation (commonly referred to as GDPR) also requires additional privacy protections. In connection with providing services to our clients, we are required by regulations and arrangements with payment networks and certain clients to provide assurances regarding the confidentiality and security of non-public consumer information. These arrangements require periodic audits by independent companies regarding our compliance with industry standards such as payment card industry, or PCI, standards and also allow for similar audits regarding best practices established by regulatory guidelines. The compliance standards relate to our infrastructure and operational procedures designed to safeguard the confidentiality and security of non-public consumer personal information received from our customers. Our ability to maintain compliance with these standards and satisfy these audits will affect our ability to attract and maintain business in the future. If we fail to comply with these regulations, we could be exposed to suits for breach of contract or to governmental proceedings. In addition, our client relationships and reputation could be harmed, and we could be inhibited in our ability to obtain new clients. If more restrictive privacy laws or rules are adopted by authorities in the future on the federal or state level, our compliance costs may increase, our opportunities for growth may be curtailed by our compliance capabilities or reputational harm and our potential liability for security breaches may increase, all of which could have a material adverse effect on our business, financial condition and results of operations.
Changes in our tax rates, the adoption of new U.S. or international tax legislation or exposure to additional tax liabilities could affect our future results.
We are subject to taxes in the U.S. and numerous foreign jurisdictions. Our future effective tax rates could be affected by changes in the mix of earnings in countries with differing statutory tax rates, changes in the valuation of deferred tax assets and liabilities, or changes in tax laws or their interpretation. Any of these changes could have a material adverse effect on our profitability. We are also subject to the examination of our income tax returns by the Internal Revenue Service and other tax authorities. We regularly assess the likelihood of adverse outcomes resulting from these examinations to determine the adequacy of our provision for taxes. There can be no assurance that the outcomes from these examinations will not materially adversely affect our financial condition and operating results.
On December 22, 2017, President Trump signed into law new legislation that significantly revised the Internal Revenue Code of 1986, as amended. The newly enacted federal income tax law, among other things, contains significant changes to corporate taxation, including reduction of the corporate tax rate from a top marginal rate of 35% to a flat rate of 21%, limitation of the tax deduction for interest expense to 30% of adjusted earnings (except for certain small businesses), limitation of the deduction for net operating losses to 80% of current year taxable income and elimination of net operating loss carrybacks, in each case, for losses arising in taxable years beginning after December 31, 2017 (though any such net operating losses may be carried forward indefinitely), one time taxation of offshore earnings at reduced rates regardless of whether they are repatriated, elimination of U.S. tax on foreign earnings (subject to certain important exceptions), immediate deductions for certain new investments instead of deductions for depreciation expense over time, and modifying or repealing many business deductions and credits. Notwithstanding the reduction in the corporate income tax rate, the overall impact of the new federal tax law is uncertain and our business and financial condition could be adversely affected. In addition, it is uncertain how various states will respond to the newly enacted federal tax law. The impact of this tax reform on holders of our common stock is also uncertain and could be adverse. We urge our stockholders to consult with their legal and tax advisors with respect to this legislation and the potential tax consequences of investing in or holding our common stock.
25
The healthcare industry changes often and technology-enabled services used by consumers are relatively new and unproven.
The market for technology-enabled services for healthcare consumers changes rapidly and new products and services are consistently being introduced. Opportunities to gain market share are challenging due to the significant resources of our existing and potential competitors. It is uncertain whether or how fast this market will continue to grow. In order to remain competitive, we are continually involved in a number of projects to develop new services or compete with these new market entrants, including the development of mobile versions of our proprietary technology platform. These projects carry risks, such as cost overruns, delays in delivery, performance problems and lack of acceptance by our customers.
Based on our experience, consumers are still learning about health savings accounts, which are often referred to as HSAs, and other similar tax-advantaged healthcare savings arrangements. The willingness of consumers to increase their use of technology platforms to manage their healthcare saving and spending tax advantaged benefits will impact our operating results.
We may incur impairment charges on goodwill or other intangible assets.
We account for goodwill in accordance with Financial Accounting Standards Board, which is often referred to as FASB, Accounting Standard Codification Topic 350, Intangibles—Goodwill and Other. Our reporting units and related indefinite-lived intangible assets are tested annually during the fourth fiscal quarter of each year in order to determine whether their carrying value exceeds their fair value. In addition, they are tested on an interim basis if an event occurs or circumstances change between annual tests that would more likely than not reduce their fair value below carrying value. If we determine the fair value of the goodwill or other indefinite-lived intangible assets is less than their carrying value as a result of the tests, an impairment loss is recognized. Any such write-down would adversely affect our results of operations.
Our goodwill resides in multiple reporting units. The profitability of individual reporting units may suffer periodically from downturns in customer demand and other factors, the high level of competition existing within our industry, and the level of overall economic activity. Individual reporting units may be relatively more impacted by these factors than the Company as a whole. As a result, demand for the services of one or more of the reporting units could decline which could adversely affect our operations and cash flow, and could result in an impairment of goodwill or intangible assets. As a result of our annual impairment analyses during the fourth quarter of fiscal 2017, we did not identify any impairment of goodwill and other indefinite-lived intangible assets. For all reporting units, we use a discounted cash flow model of the projected earnings of reporting units to determine the amount of goodwill impairment. While we currently believe that the fair value of all of our intangibles substantially exceeds carrying value and that those intangibles so classified will contribute indefinitely to the cash flows of the Company, materially different assumptions regarding future performance of our reporting units or the weighted-average cost of capital used in the valuations could result in impairment losses and/or additional amortization expense.
If our industrial bank subsidiary fails to meet certain criteria, we may become subject to regulation under the Bank Holding Company Act, which could force us to divest WEX Bank or cease all of our non-banking activities and thus could have an adverse effect on our revenue and business or could create a default under our 2016 Credit Agreement.
WEX Bank meets the criteria for exemption of an industrial bank from the definition of “bank” under the Bank Holding Company Act. WEX Bank’s failure to qualify for this exemption would cause us to become subject to regulation under the Bank Holding Company Act. This would require us to divest WEX Bank or become a Bank Holding Company and to possibly cease certain non-banking activities which may be impermissible for a Bank Holding Company, and could create a default under our 2016 Credit Agreement. Failure to qualify for this exemption could thus have an adverse effect on our revenue and business.
The loss or suspension of the charter for our Utah industrial bank or changes in regulatory requirements could be disruptive to operations and increase costs.
The regulatory status of WEX Bank enables it to issue certificates of deposit, accept money market deposits and borrow on a federal funds rate basis from other banks. These funds are used to support our operations. WEX Bank operates under a uniform set of state lending laws, and its operations are subject to extensive state and federal regulation. WEX Bank, a Utah industrial bank incorporated in 1998, is an FDIC-insured depository institution. The bank’s primary regulators are the Utah DFI and the FDIC. Continued licensing and federal deposit insurance are subject to ongoing satisfaction of compliance and safety and soundness requirements. If WEX Bank were to lose its bank charter, we would either outsource our credit support activities or perform these activities ourselves, which would subject us to the credit laws of each individual state in which we conduct business. Furthermore, we could not be a MasterCard issuer and would have to work
26
with another financial institution to issue the product or sell the portfolio. Any such change would be disruptive to our operations and could result in significant incremental costs. In addition, changes in the bank regulatory environment, including the implementation of new or varying measures or interpretations by the State of Utah or the federal government, may significantly affect or restrict the manner in which we conduct business in the future or could create a default under our 2016 Credit Agreement.
We are subject to extensive supervision and regulation that could restrict our activities and impose financial requirements or limitations on the conduct of our business and limit our ability to generate income.
We are subject to extensive federal and state regulation and supervision, including that of the FDIC, the CFPB, and the Utah DFI. Banking regulations are primarily intended to protect depositors’ funds, federal deposit insurance funds and the banking system as a whole, not shareholders or noteholders. These regulations affect our payment operations, capital structure, investment practices, dividend policy and growth, among other things. Failure to comply with laws, regulations or policies could result in sanctions by regulatory agencies, damages, civil money penalties or reputational damage, which could have a material adverse effect on our business, financial condition and results of operations. While we have policies and procedures designed to prevent any such violations, there can be no assurance that such violations will not occur. The U.S. Congress and federal regulatory agencies frequently revise banking and securities laws, regulations and policies. We cannot predict whether or in what form any other proposed regulations or statutes will be adopted or the extent to which our business may be affected by any new regulation or statute. Such changes could subject our business to additional costs, limit the types of financial services and products we may offer and increase the ability of non-banks to offer competing financial services and products, among other things.
Our industrial bank subsidiary is subject to regulatory capital requirements that may require us to make capital contributions to this subsidiary, and that may restrict the ability of the subsidiary to make cash available to us.
WEX Bank must maintain minimum amounts of regulatory capital. If WEX Bank does not meet these capital requirements, its regulators have broad discretion to institute a number of corrective actions that could have a direct material effect on our financial condition. WEX Bank, as an institution insured by the FDIC, must maintain certain capital ratios, paid-in capital minimums and adequate allowances for loan losses. Under the Dodd-Frank Act, we are also required to serve as a source of financial strength for WEX Bank. If WEX Bank were to fail to meet any of the capital requirements to which it is subject, or if required under Dodd-Frank’s source of strength requirements, we may be forced to provide WEX Bank with additional capital, which could impair our ability to service our indebtedness or may not be permitted under the terms of our 2016 Credit Agreement or Notes. To pay any dividend, WEX Bank must maintain adequate capital above regulatory guidelines. Accordingly, WEX Bank may be unable to make any of its cash or other assets available to us, including to service our indebtedness.
We are subject to limitations on transactions with our industrial bank subsidiary, which may limit our ability to engage in transactions with and obtain credit from our industrial bank.
Sections 23A and 23B of the FRA and the implementing regulations limit the extent to which we can borrow or otherwise obtain credit from or engage in other “covered transactions” with WEX Bank. “Covered transactions” include loans or extensions of credit, purchases of or investments in securities, purchases of assets, including assets subject to an agreement to repurchase, acceptance of securities as collateral for a loan or extension of credit, or the issuance of a guarantee, acceptance, or letter of credit. Although the applicable rules do not serve as an outright ban on engaging in “covered transactions,” they do limit the amount of covered transactions WEX Bank may have with any one affiliate and with all affiliates in the aggregate. The applicable rules also require that we engage in such transactions with WEX Bank only on terms and under circumstances that are substantially the same, or at least as favorable to WEX Bank, as those prevailing at the time for comparable transactions with nonaffiliated companies. Furthermore, with certain exceptions, each loan or extension of credit by WEX Bank to the Company or its other affiliates must be secured by collateral with a market value ranging from 100 percent to 130 percent of the amount of the loan or extension of credit, depending on the type of collateral. Accordingly, WEX Bank may be unable to provide credit or engage in transactions with us, including transactions intended to help us service our indebtedness.
If the technologies we use in operating our business and interacting with our customers fail, are unavailable, or do not operate to expectations, or we fail to successfully implement technology strategies and capabilities in connection with our outsourcing arrangements, our business and results of operation could be adversely impacted.
We utilize a combination of proprietary and third-party technologies to operate our business and interact with our customers, partners and suppliers, among others. This includes technology that we have developed, have contracted with others to develop, have outsourced to a single provider to operate or have obtained through third-parties by way of service agreements. To the extent that our proprietary technology or a third-party providers’ technology does not work as agreed to
27
or as expected, or if we experience outages or unavailability resulting from their operations and the services they provide to us, our ability to efficiently and effectively deliver services could be adversely impacted and our business and results of operations could be adversely affected. Similarly, any failure by our customers or partners to access the technology that we develop internally could have an adverse effect on our business, results of operations and financial condition. Although we make substantial investments in technology, there is no guarantee that it will function as intended once it is placed into operation. Lastly, given our reliance on technology, we regularly assess our technology plans, including both platforms and technology infrastructure. To the extent that we conclude that certain technologies should be retired, that existing platforms should be consolidated, or that we should change our technology strategies, we may be required to impair or accelerate depreciation on certain assets. Any of these potential changes or failures in our technology strategies may also divert management’s attention and have a material adverse effect on our business and results of operations.
Our business is regularly subject to cyberattacks and attempted security and privacy breaches and we may not be able to adequately protect our information systems, including the data we collect about our customers, which could subject us to liability and damage our reputation.
We collect and store data about our customers and their fleets, including bank account information and spending data. Our customers expect us to keep this information in our confidence. In certain instances, the information we collect includes social security numbers. As a result of applicable laws, we are required to take commercially reasonable measures to prevent and mitigate the impact of cyber-attack, as well as the unauthorized access, acquisition, release and use of “personally identifiable information," such as social security numbers. While social security numbers constitute a very small part of the data we keep, in the event of a security breach we would be required to determine the types of information compromised and determine corrective actions and next steps under applicable laws, which would require us to expend capital and other resources to address the security breach and protect against future breaches. An increasing number of organizations, including large on-line and off-line merchants and businesses, large Internet companies, financial institutions, and government institutions, have disclosed breaches of their information security systems, some of which have involved sophisticated and highly targeted attacks, including on portions of their websites or infrastructure. Like those companies, we too, are subject to regular and repeated attempts to breach our information security protections.
As outsourcing, specialization of functions, third-party digital services and technology innovation within the payments industry increase (including with respect to mobile technologies, tokenization, big data and cloud storage solutions), more third parties are involved in processing card transactions and there is a risk the confidentiality, integrity, privacy and/or security of data held by, or accessible to, third parties, including merchants that accept our cards, payment processors and our business partners, may be compromised, which could lead to unauthorized transactions on our cards and costs associated with responding to such an incident. In addition, high profile data breaches could change consumer behaviors, impact our ability to access data to make product offers and credit decisions and result in legislation and additional regulatory requirements.
The techniques used in attempts to obtain unauthorized, improper or illegal access to our systems, our data or our customers' data, to degrade service, or to sabotage our systems are constantly evolving, are difficult to detect quickly, and may not be recognized until after a successful penetration of our information security systems. Unauthorized parties attempt to gain access to our systems or facilities through various means, including, among others, targeting our systems or facilities or our third-party vendors or customers, or attempting to fraudulently induce our employees, partners, customers or others into disclosing user names, passwords, payment card information, or other sensitive information, which may in turn be used to access our information technology systems. Certain efforts may be state-sponsored and supported by significant financial and technological resources, making them even more difficult to detect. Like many companies, we are a target for such breaches and attacks. Although we have developed systems and processes that are designed to protect our data and customer data and to prevent data loss and other security breaches, and will continue to expend significant additional resources to bolster these protections, these security measures cannot provide absolute security. Our information technology and infrastructure may be vulnerable to successful cyberattacks or security breaches, and third parties may be able to access our customers’ personal or proprietary information and data that are stored on or accessible through those systems.
Our security measures may also be breached due to employee error, malfeasance, system errors or vulnerabilities, or other irregularities. Any actual or perceived breach of our security could interrupt our operations; result in our systems or services being unavailable; result in improper disclosure of data; materially harm our reputation and brand; result in significant legal and financial exposure; lead to loss of customer confidence in, or decreased use of, our products and services; and, adversely affect our business and results of operations. Any breaches of network or data security at our partners, some of whom maintain information about our customers, or breaches of our customers' systems could have similar effects. In addition, our customers could have vulnerabilities on their own computer systems that are entirely unrelated to our systems, but could mistakenly attribute their own vulnerabilities to us. While we take commercially
28
appropriate steps to safeguard data used by and contained on the systems of our partners, customers and vendors, we cannot control all access to those systems and they are therefore subject to potential cyberattacks and fraud.
Furthermore, as we have increased the number of platforms as well as the size of our networks and information systems, our reliance on these technologies have become increasingly important to our operating activities. The potential negative impact that a platform, network or information system shutdown may have on our operating activities has increased. Shutdowns may be caused by cyberattacks and unexpected catastrophic events such as natural disasters or other unforeseen events, such as software or hardware defects or cyber-attacks by groups or individuals.
Under the Financial Services Modernization Act of 1999, also referred to as the “Gramm-Leach-Bliley Act" or GLBA, and some state laws, we and WEX Bank are required to maintain a comprehensive written information security program that includes administrative, technical and physical safeguards relating to consumer information. This requirement generally does not extend to information about companies or about individuals who obtain financial products or services for business, commercial, or agricultural purposes.
The GLBA also requires us and WEX Bank to provide initial and annual privacy notices to customers that describe in general terms our information sharing practices. If we or WEX Bank intend to share nonpublic personal information about consumers with affiliates and/or nonaffiliated third parties, we and WEX Bank must provide customers with a notice and a reasonable period of time for each customer to “opt out” of any such disclosure. In addition to U.S. federal privacy laws with which we must comply, states also have adopted statutes, regulations and other measures governing the collection and distribution of nonpublic personal information about customers. In some cases these state measures are preempted by federal law, but if not, we and WEX Bank must monitor and seek to comply with individual state privacy laws in the conduct of our businesses.
When we handle individually identifiable health information, regulations issued under Health Insurance Portability and Accountability Act of 1996, or HIPAA, and the Health Information Technology for Economic and Clinical Health Act, or HITECH, our contracts with our customers, and supplemental state laws require us to implement privacy and data security measures and to comply with breach notification requirements. We may be subject to contractual damages and civil or criminal penalties if we are found to violate these privacy, security and breach notification requirements.
Our efforts to comply with existing and future health and financial data laws and regulations, both in the U.S. and abroad, is costly and time-consuming. Incidents involving our handling of this protected and sensitive information may consume significant financial and managerial resources and may damage our reputation, which may discourage customers from using, renewing, or expanding their use of our services.
Any security breach, inadvertent transmission of information about our customers, failure to comply with applicable breach notification and reporting requirements, or any violation of international, federal or state privacy laws could expose us to liability in excess of any applicable insurance policies, litigation, regulatory scrutiny, and/or cause damage to our reputation. We may also be required to expend significant resources to implement additional data protection measures or to modify the features and functionality of our system offerings in a way that is less attractive to customers.
Our failure to effectively implement new technology could jeopardize our position as a leader in our industry.
As a provider of information management and payment processing services, we must constantly adapt and respond to the technological advances offered by our competitors and the informational requirements of our customers, including those related to the Internet, in order to maintain and improve upon our competitive position. We may not be able to expand our technological capabilities and service offerings as rapidly as our competitors, which could jeopardize our position as a leader in our industry.
We are dependent on technology systems and electronic communications networks managed by third parties, which could result in our inability to prevent service disruptions.
Our ability to process and authorize transactions electronically depends on our ability to electronically communicate with our fuel and vehicle maintenance providers through point-of-sale devices and electronic networks that are owned and operated by third parties. The electronic communications networks upon which we depend are often subject to disruptions of various magnitudes and durations. Any severe disruption of one or more of these networks could impair our ability to authorize transactions or collect information about such transactions, which, in turn, could harm our reputation for dependable service and adversely affect our results of operations. In addition, our ability to collect enhanced data relating to our customers’ purchases may be limited by the use of older point-of-sale devices by fuel and vehicle maintenance providers. To the extent that fuel and vehicle maintenance providers within our network are slow to adopt advanced point-of-sale devices, we may not be able to offer the latest services and capabilities that our customers demand.
29
Our industry continues to become increasingly competitive, which makes it more challenging for us to maintain profit margins at historical levels.
We face and expect to continue to face competition in each category of the overall industry from several companies that seek to offer competing capabilities and services. Historically, we have been able to provide customers with a wide spectrum of services and capabilities and, therefore, we have not considered price to be the exclusive or even the primary basis on which we compete. As our competitors have continued to develop their service offerings, it has become increasingly more challenging for us to compete solely on the basis of superior capabilities or service. In some areas of our business we have been forced to respond to competitive pressures by reducing our fees. We have seen erosion of our historical profit margins as we encourage existing strategic relationships to sign long-term contracts. If these trends continue and if competition intensifies, our profitability may be adversely impacted.
While we have traditionally offered our services to all categories of the fleet industry, some of our competitors have successfully garnered significant share in particular categories of the overall industry. To the extent that our competitors are regarded as leaders in specific categories, they may have an advantage over us as we attempt to further penetrate these categories.
We also face increased competition in our efforts to enter into new strategic relationships and renew existing strategic relationships on similar terms.
Compliance with anti-money laundering laws and regulations creates additional compliance costs and reputational risk.
We must monitor and report unusual or suspicious account activity, as well as transactions involving amounts in excess of prescribed limits, as required by the Bank Secrecy Act and Internal Revenue Service regulations and other regulations. The USA PATRIOT Act of 2001 imposes significant anti-money laundering compliance and due diligence obligations on financial institutions, including WEX Bank. Financial regulators have issued various implementing regulations and have made enforcement a top priority. Failure to maintain and implement adequate programs to combat money laundering and terrorist financing, or to comply with all of the relevant laws or regulations, could result in the imposition of fines or penalties and other serious legal and reputational consequences which may impact our financial results.
Our increased presence in foreign jurisdictions increases the possibility of foreign law violations or violation of the U.S. Foreign Corrupt Practices Act (“FCPA”), the United Kingdom Bribery Act of 2010 (“UKBA”) and the Brazilian Anti-Corruption Law ("ACL").
We are subject to the FCPA, the ACL and the UKBA, as we own subsidiaries organized under UK and Brazilian law, which serve as a holding companies for other subsidiaries. While the FCPA generally prohibits U.S. companies and their intermediaries from making improper payments to foreign officials for the purpose of obtaining or retaining business, the UKBA is broader in its reach and prohibits bribery in purely commercial contexts. Any violation of the FCPA, the UKBA or similar laws and regulations, including the ACL, could result in significant expenses, divert management attention, and otherwise have a negative impact on us. Any determination that we have violated the FCPA, UKBA, ACL or laws of any other jurisdiction could subject us to, among other things, penalties and legal expenses that could harm our reputation and have a material adverse effect on our financial condition and results of operation. The possibility of violations of the FCPA, UKBA, ACL or similar laws or regulations may increase as we expand globally and into countries with recognized corruption problems.
The failure to maintain effective systems of internal control over financial reporting and disclosure controls and procedures could result in the inability to accurately report our financial results or prevent material misstatement due to fraud, which could cause current and potential shareholders to lose confidence in our financial reporting, adversely affect the trading price of our securities, harm our operating results or trigger a default under the 2016 Credit Agreement.
Effective internal control over financial reporting and disclosure controls and procedures are necessary for us to provide reliable financial reports and effectively prevent fraud and operate successfully as a public company. Our financial reporting and disclosure controls and procedures are reliant, in part, on information we receive from third parties that supply information to us regarding transactions that we process. The failure to develop or maintain effective internal control over financial reporting and disclosure controls and procedures could harm our reputation or operating results, or cause us to fail to meet our reporting obligations, or trigger a default under the 2016 Credit Agreement. As we expand our business operations domestically and internationally, we will need to maintain effective internal control over financial reporting and
30
disclosure controls and procedures. If we are unable to do so, our external auditors could issue a qualified opinion on the effectiveness of our internal control over financial reporting.
Ineffective internal control over financial reporting and disclosure controls and procedures could cause investors to lose confidence in our reported financial information, which could have a negative effect on the trading price of our securities or affect our ability to access the capital markets and could result in regulatory proceedings against us by, among others, the SEC. In addition, a material weakness in internal control over financial reporting may lead to deficiencies in the preparation of financial statements, which in turn could lead to litigation claims against us. The defense of any such claims may cause the diversion of management’s attention and resources, and we may be required to pay damages if any such claims or proceedings are not resolved in our favor. Any litigation, even if resolved in our favor, could cause us to incur significant legal and other expenses. Such events could also affect our ability to raise capital to fund future business initiatives.
Our ability to attract and retain qualified employees is critical to our success and the failure to do so may materially adversely affect our performance.
We believe our employees, including our executive management team, are our most important resource and, in our industry and geographic area, competition for qualified personnel is intense. If we were unable to retain and attract qualified employees, our performance could be materially adversely affected.
Risks Relating to Our Common Stock
If any entity controls 10 percent or more of our common stock and such entity has caused a violation of applicable banking laws by its failure to obtain any required approvals prior to acquiring that common stock, we have the power to, and may be required to, restrict such entity’s ability to vote shares held by it.
As owners of a Utah industrial bank, we are subject to Utah banking regulations that require any entity that controls 10 percent or more of our common stock to obtain the prior approval of Utah banking authorities. Federal law also prohibits a person or group of persons from acquiring “control” of us unless the FDIC has been notified and has not objected to the transaction. Under the FDIC’s regulations, the acquisition of 10 percent or more of a class of our voting stock would generally create a rebuttable presumption of control. In addition, our certificate of incorporation requires that if any stockholder fails to provide us with satisfactory evidence that any required approvals have been obtained, we may, or will if required by state or federal regulators, restrict such stockholder’s ability to vote such shares with respect to any matter subject to a vote of our stockholders.
As a result of these regulatory requirements, certain existing and potential stockholders may choose not to invest or invest more in our stock. This could limit the number of potential investors and impact our ability to attract further funds.
Provisions in our charter documents, Delaware law and applicable banking law may delay or prevent our acquisition by a third party.
Our certificate of incorporation and by-laws contain several provisions that may make it more difficult for a third party to acquire control of us without the approval of our board of directors. These provisions include, among other things, a classified board of directors, the elimination of stockholder action by written consent, advance notice for raising business or making nominations at meetings of stockholders and “blank check” preferred stock. Blank check preferred stock enables our board of directors, without stockholder approval, to designate and issue additional series of preferred stock with such special dividend, liquidation, conversion, voting or other rights, including the right to issue convertible securities with no limitations on conversion, and rights to dividends and proceeds in a liquidation that are senior to the common stock, as our board of directors may determine. These provisions may make it more difficult or expensive for a third party to acquire a majority of our outstanding voting common stock. We also are subject to certain provisions of Delaware law, which could delay, deter or prevent us from entering into an acquisition, including Section 203 of the Delaware General Corporation Law, which prohibits a Delaware corporation from engaging in a business combination with an interested stockholder unless specific conditions are met. These provisions also may delay, prevent or deter a merger, acquisition, tender offer, proxy contest or other transaction that might otherwise result in our stockholders receiving a premium over the market price for their common stock.
In addition, because we own a Utah industrial bank, any purchaser of our common stock who would own 10 percent or more of our common stock after such purchase would be required to obtain the consent of Utah banking authorities and the federal banking authorities prior to consummating any such acquisition. These regulatory requirements may preclude or delay the purchase of a relatively large ownership stake by potential investors.
31
ITEM 1B. UNRESOLVED STAFF COMMENTS
None.
ITEM 2. PROPERTIES
All of our facilities are leased. The following table presents the details of our principal leased properties as of December 31, 2017:
Property location | Square footage | Purpose of leased property | Segment | ||||
South Portland, Maine | 178,300 | Corporate headquarters, operations center and warehouse | All | ||||
Midvale, Utah | 12,400 | Bank operations | Fleet Solutions, Travel and Corporate Solutions | ||||
Melbourne, Australia | 21,500 | Australia fuel and prepaid card operations | Fleet Solutions, Travel and Corporate Solutions | ||||
São Paulo, Brazil | 19,200 | Brazil fuel, virtual and paycard operations | All | ||||
Crewe, England | 14,700 | European fuel operations | Fleet Solutions | ||||
Fargo, North Dakota | 40,000 | WEX Health operations | Health and Employee Benefit Solutions | ||||
Nashville, Tennessee | 42,500 | EFS Operations | Fleet Solutions, Travel and Corporate Solutions | ||||
Additional financial information about our leased facilities appears in Item 8 – Note 18, Commitments and Contingencies of our consolidated financial statements.
ITEM 3. LEGAL PROCEEDINGS
On August 11, 2016, the Company was sued in the Circuit Court of St. Charles County, Missouri, in a putative class action alleging the Company improperly sent unauthorized facsimile advertisements in violation of the Telephone Consumer Protection Act, 47 U.S.C. § 227 (the “TCPA”). The named plaintiff sought to represent a nationwide class of recipients of unauthorized facsimile advertisements from the Company (collectively, the "Plaintiffs") and requested statutory damages for each facsimile advertisement. The Plaintiffs further alleged that the opt-out notice of the faxes did not meet the criteria set forth in the TCPA or its underlying regulations. The Company removed the case to the United States District Court for the Eastern District of Missouri on September 15, 2016. On October 14, 2016, the Company filed an answer denying liability and stating the facsimile advertisement at issue was sent by FleetOne, LLC, the Company’s wholly-owned subsidiary. On May 10, 2017, the parties agreed to a settlement in principle to resolve the class claims, which was preliminarily approved by the court on October 6, 2017. The court entered its final judgment approving the settlement agreement on January 19, 2018. The settlement amount is not material to the Company's financial position, results of operations, cash flows or liquidity.
In addition, from time to time, we are subject to legal proceedings and claims in the ordinary course of business. As of the date of this filing, the current estimate of a reasonably possible loss contingency from all legal proceedings is not material to the Company's consolidated financial position, results of operations, cash flows or liquidity.
ITEM 4. MINE SAFETY DISCLOSURES
Not applicable.
32
PART II
ITEM 5. MARKET FOR REGISTRANT’S COMMON EQUITY, RELATED STOCKHOLDER MATTERS AND ISSUER PURCHASES OF EQUITY SECURITIES
Market Information
The principal market for the Company’s common stock is the New York Stock Exchange (“NYSE”) and our ticker symbol is WEX. The following table sets forth, for the indicated calendar periods, the reported intraday high and low sales prices of the common stock on the NYSE Composite Tape:
High | Low | ||||||
2017 | |||||||
First quarter | $ | 122.91 | $ | 99.79 | |||
Second quarter | $ | 109.16 | $ | 97.26 | |||
Third quarter | $ | 115.82 | $ | 101.14 | |||
Fourth quarter | $ | 142.26 | $ | 111.53 | |||
2016 | |||||||
First quarter | $ | 88.04 | $ | 54.42 | |||
Second quarter | $ | 96.84 | $ | 78.95 | |||
Third quarter | $ | 108.86 | $ | 86.27 | |||
Fourth quarter | $ | 117.14 | $ | 99.17 | |||
As of February 26, 2018, the closing price of our common stock was $153.64 per share, there were 43,031,993 shares of our common stock outstanding and there were 13 holders of record of our common stock. The actual number of stockholders is greater than this number of record holders and includes stockholders who are beneficial owners but whose shares are held in street name by brokers or nominees.
Dividends
The Company has not declared any dividends on its common stock since it commenced trading on the NYSE on February 16, 2005. The timing and amount of future dividends, if any, will be (i) dependent upon the Company’s results of operations, financial condition, cash requirements and other relevant factors, (ii) subject to the discretion of the Board of Directors of the Company and (iii) payable only out of the Company’s surplus or current net profits in accordance with the General Corporation Law of the State of Delaware.
The Company has certain restrictions on the dividends it may pay under its revolving credit agreement, including pro forma compliance with a ratio of consolidated funded indebtedness to consolidated EBITDA of 2.50:1.00 for the most recent period of four fiscal quarters.
Share Repurchases
On September 23, 2013, we announced a share repurchase program authorizing the purchase of up to $150 million of our common stock from time to time which expired on September 30, 2017. On September 20, 2017, our board of directors approved a new share repurchase program authorizing the purchase of up to $150 million of our common stock expiring on September 2021. Share repurchases are to be made on the open market and can be commenced or suspended at any time.
We did not purchase any shares of our common stock during the year ended December 31, 2017. The approximate dollar value of shares that were available to be purchased under our share repurchase program was $150 million as of December 31, 2017.
33
ITEM 6. SELECTED FINANCIAL DATA
The following table sets forth our summary historical financial information for the periods ended and as of the dates indicated. You should read the following historical financial information along with Item 7 and the consolidated financial statements and related notes thereto contained in this Form 10-K. The financial information included in the table below is derived from audited financial statements:
December 31, | |||||||||||||||||||
(in thousands, except per share data) | 2017 | 2016 | 2015 | 2014 | 2013 | ||||||||||||||
Income statement information, for the year ended | |||||||||||||||||||
Total revenues | $ | 1,250,548 | $ | 1,018,460 | $ | 854,637 | $ | 817,647 | $ | 717,463 | |||||||||
Total operating expenses | $ | 1,011,278 | $ | 823,332 | $ | 625,844 | $ | 511,409 | $ | 440,724 | |||||||||
Financing interest expense | $ | 107,067 | $ | 113,418 | $ | 46,189 | $ | 36,042 | $ | 29,419 | |||||||||
Net realized and unrealized gains (losses) on fuel price derivatives | $ | — | $ | 711 | $ | 5,848 | $ | 46,212 | $ | (9,851 | ) | ||||||||
Net earnings attributable to shareholders | $ | 160,266 | $ | 60,637 | $ | 101,904 | $ | 202,211 | $ | 149,208 | |||||||||
Basic earnings per share | $ | 3.73 | $ | 1.49 | $ | 2.63 | $ | 5.20 | $ | 3.83 | |||||||||
Diluted earnings per share | $ | 3.72 | $ | 1.48 | $ | 2.62 | $ | 5.18 | $ | 3.82 | |||||||||
Weighted average basic shares of common stock outstanding | 42,977 | 40,809 | 38,771 | 38,890 | 38,946 | ||||||||||||||
Weighted average diluted shares of common stock outstanding | 43,105 | 40,914 | 38,843 | 39,000 | 39,103 | ||||||||||||||
Balance sheet information, at end of period | |||||||||||||||||||
Total assets | $ | 6,739,175 | $ | 5,997,097 | $ | 3,847,909 | $ | 4,105,379 | $ | 3,419,753 | |||||||||
Liabilities and stockholders’ equity | |||||||||||||||||||
Total liabilities | $ | 5,018,617 | $ | 4,491,350 | $ | 2,752,228 | $ | 3,011,068 | $ | 2,497,727 | |||||||||
Redeemable non-controlling interest | — | — | — | 16,590 | 18,729 | ||||||||||||||
Total stockholders’ equity | 1,720,558 | 1,505,747 | 1,095,681 | 1,077,721 | 903,297 | ||||||||||||||
Total liabilities and stockholders’ equity | $ | 6,739,175 | $ | 5,997,097 | $ | 3,847,909 | $ | 4,105,379 | $ | 3,419,753 | |||||||||
34
ITEM 7. MANAGEMENT’S DISCUSSION AND ANALYSIS OF FINANCIAL CONDITION AND RESULTS OF OPERATIONS
The discussion below focuses on the factors affecting our consolidated results of operations for the years ended December 31, 2017, 2016 and 2015 and financial condition at December 31, 2017 and 2016 and, where appropriate, factors that may affect our future financial performance, unless stated otherwise. This discussion should be read in conjunction with the consolidated financial statements, notes to the consolidated financial statements and selected consolidated financial data. Our MD&A is presented in the following sections:
• | 2017 Highlights and Year in Review |
• | Segments |
• | Results of Operations |
• | Liquidity and Capital Resources |
• | Critical Accounting Policies and Estimates |
• | Recently Adopted Accounting Standards |
2017 Highlights and Year in Review
WEX is a leading provider of corporate payment solutions. Our opportunities for growth extend well beyond the fleet fuel market, in particular to the online travel and healthcare payments markets. Building on a leading market position in our core fleet business, we continue to expand our company.
Our strategic approach to entering new markets is focused on three steps:
• | Identify complicated markets facing complex payment challenges and inefficiencies, |
• | Develop products and services that address these unmet market needs, and, |
• | Operate with systemic efficiency through scale and cost management. |
We have a proven model in the fleet space where we have developed a leading market position and a strong margin profile. We have done the same in the online travel industry where we have become a leader in global virtual payments and continue to grow the business and create scale on a global basis. Through the acquisitions of Evolution1 and Benaissance, WEX Health has continued to expand into the consumer directed healthcare payments market.
The following events and accomplishments occurred during 2017:
• | Contributions from all three of our segments resulted in the Company surpassing $1.2 billion in annual revenues in 2017, 23% growth relative to the prior year. |
• | Effective October 18, the Company acquired certain assets and assumed certain liabilities of AOC, a longstanding technology provider for our virtual card product. This acquisition will broaden the Company's capabilities, increase our pool of employees with payments platform expertise and allow the Company to evolve with the needs of its customers and partners through the use of AOC’s payments processing technology platforms. |
The Company purchased AOC for $130 million, which was funded with cash on hand and through the Company's 2016 Credit Agreement.
• | Effective October 30, the Company added $100 million of capacity to its revolving line of credit to provide additional liquidity and flexibility. |
• | Effective July 3, the Company repriced the secured term loans under the 2016 Credit Agreement, which reduced the applicable interest rate margin at current borrowing levels for both LIBOR borrowings and base rate borrowings for the Company's tranche A term loans and tranche B term loans, 50 basis points and 75 basis points, respectively. Based on amounts outstanding under these term loans at December 31, the repricing is expected to provide an annualized savings of approximately $11 million in interest expense, approximately half of which was realized in 2017. |
• | On December 20, the Company entered into two additional forward-fixed interest rate swap agreements to manage the interest rate risk associated with $500 million of outstanding variable-interest rate borrowings. Commencing December 2017, the Company will receive variable interest of 1-month LIBOR under these swaps and will pay a weighted average annualized fixed rate of 2.21% over the five year term. With the commencement |
35
of these interest rate swaps, we have reduced the variability of the future interest payments associated with $1.7 billion of our borrowings, including our fixed rate notes outstanding.
Our Company's management believes the following metrics were important to our overall performance in 2017:
• | Average number of vehicles serviced increased 9 percent from 2016 to approximately 10.9 million for 2017, primarily related to growth in our worldwide customer base. As of December 31, 2017, vehicles serviced totaled 11.4 million. |
• | Total fleet transactions processed increased 14 percent from 2016 to 516.8 million in 2017. Payment processing transactions increased 11 percent from 2016 to 429.7 million in 2017, and transaction processing transactions increased 27 percent from 2016 to 87.1 million in 2017. The increase in payment processing transactions resulted from a large customer portfolio converting from a transaction processing relationship to a payment processing relationship late in 2016, the acquisition of EFS and organic growth. The primary driver for the increase in transaction processing transactions was due to the acquisition of EFS, partially offset by the portfolio conversion mentioned above. |
• | Average expenditure per payment processing transaction in our Fleet Solutions segment increased 19 percent to $70.49 for 2017, from $59.19 in 2016. The average U.S. fuel price per gallon during 2017 was $2.50, a 13 percent increase as compared to the same period in the prior year. |
• | Credit loss expense in the Fleet Solutions segment was $59.3 million during 2017, as compared to $27.3 million during 2016, resulting primarily from higher incidences of magnetic stripe card skimming fraud during 2017. Spend volume increased 33 percent in 2017 as compared to 2016. Our credit losses were 17.2 basis points of fuel expenditures for 2017, as compared to 11.1 basis points of fuel expenditures for 2016. |
• | Our Travel and Corporate Solutions purchase volume grew to $30.3 billion in 2017, a 27 percent increase from 2016. This increase is primarily driven by worldwide organic growth, most notably in the U.S. and Europe. This favorable impact was offset by changes in the net interchange rate for this segment, which decreased 29% in 2017 as compared to 2016 due to contract renegotiations with one of our large partners. |
• | Our foreign currency exchange exposure is primarily related to the re-measurement of our cash, receivable and payable balances that are denominated in foreign currencies. Movements in the exchange rates associated with our foreign held currencies resulted in a gain of $29.9 million in 2017, as compared to a loss of $7.7 million in 2016. |
• | Our effective tax rate was 10.9 percent for 2017 as compared to 34.0 percent for 2016. The decline in our tax rate is primarily due the reduction of our net deferred tax liabilities resulting from the change in federal corporate income tax rate to 21 percent from 35 percent effective January 1, 2018 as part of the 2017 Tax Cuts and Jobs Act (the "2017 Tax Act"), partly offset by the increase in valuation allowance. Our federal income tax expense for periods beginning in 2018 will be based on the new rate. Future tax rates may fluctuate due to changes in the mix of earnings among different tax jurisdictions, as well as impacts that tax rate and earnings mix changes have on our net deferred tax assets. |
• | Financing interest expense decreased $6.4 million in 2017, as compared to 2016. The decrease resulted from the absence of certain ticking fees incurred in 2016, partly offset by higher relative average borrowings and effective interest rates. |
Segments
WEX operates in three reportable segments: Fleet Solutions, Travel and Corporate Solutions, and Health and Employee Benefit Solutions. The Fleet Solutions segment provides payment, transaction processing and information management services specifically designed for the needs of commercial and government fleets. The Travel and Corporate Solutions segment focuses on the complex payment environment of business-to-business payments, providing customers with payment processing solutions for their corporate payment and transaction monitoring needs. The Health and Employee Benefit Solutions segment provides a SaaS platform for consumer directed healthcare payments, as well as payroll related benefits to customers in Brazil.
36
Results of Operations
The Company does not allocate foreign currency gains and losses, financing interest expense, unrealized and realized gains and losses on derivative instruments and non-cash adjustments related to our tax receivable agreement to our operating segments as management believes these items are unpredictable and can obscure underlying trends.
YEAR ENDED DECEMBER 31, 2017, AS COMPARED TO THE YEAR ENDED DECEMBER 31, 2016
FLEET SOLUTIONS SEGMENT
The following table reflects comparative operating results and key operating statistics within our Fleet Solutions segment:
(in thousands, except per transaction and per gallon data) | 2017 | 2016 | Increase (decrease) | |||||||
Revenues | ||||||||||
Payment processing revenue | $ | 360,158 | $ | 297,900 | 21 | % | ||||
Account servicing revenue | 165,083 | 127,106 | 30 | % | ||||||
Finance fee revenue | 159,336 | 124,725 | 28 | % | ||||||
Other revenue | 138,389 | 92,330 | 50 | % | ||||||
Total revenues | 822,966 | 642,061 | 28 | % | ||||||
Total operating expenses | 679,337 | 545,451 | 25 | % | ||||||
Operating income | $ | 143,629 | $ | 96,610 | 49 | % | ||||
Key operating statistics (a) (b) | ||||||||||
Payment processing revenue: | ||||||||||
Payment processing transactions | 429,716 | 385,861 | 11 | % | ||||||
Payment processing fuel spend | $ | 30,288,539 | $ | 22,838,237 | 33 | % | ||||
Average price per gallon of fuel - Domestic – ($USD/gal) | $ | 2.50 | $ | 2.21 | 13 | % | ||||
Net payment processing rate | 1.19 | % | 1.30 | % | (8 | )% | ||||
(a) As of July 1, 2016, these key operating statistics include our EFS acquisition.
(b) Key operating statistics have been modified to provide added insight into segment revenue trends. Metrics for the years ended December 31, 2016 and 2015 have also been conformed to the current year presentation.
Revenues
Payment processing revenue increased $62.3 million for 2017, as compared to 2016, due primarily to the impact of a 13% increase in the annual average domestic price per gallon of fuel and higher payment processing volumes. Higher volumes resulted from organic growth, the acquisition of EFS and a large customer portfolio converting from a transaction processing relationship to a payment processing relationship in the beginning of 2016. These favorable factors were partly offset by a decrease in our interchange rate as result of the large portfolio conversion mentioned above.
Account servicing revenue increased $38.0 million for 2017, as compared to 2016, resulting from worldwide price modernization efforts over the course of the prior year and the EFS acquisition.
Other revenues increased $46.1 million in 2017, as compared to 2016, resulting primarily from higher transaction processing revenue due to the acquisition of EFS and additional pricing modernization efforts.
Finance fee revenue is comprised of the following components:
(in thousands) | 2017 | 2016 | Increase (decrease) | |||||||
Late fee revenue | $ | 125,763 | $ | 102,497 | 23 | % | ||||
Factoring fee revenue | 29,018 | 19,689 | 47 | % | ||||||
Cardholder interest income | 535 | 544 | (2 | )% | ||||||
Other finance fee revenue | 4,020 | 1,995 | 102 | % | ||||||
Total finance fee revenue | $ | 159,336 | $ | 124,725 | 28 | % | ||||
37
Late fee revenue is primarily fees charged for receivables not paid within the terms of the customer agreement based upon the outstanding customer receivable balance. Late fee revenue is earned when a customer’s receivable balance becomes delinquent and is calculated using the greater of a minimum charge or a stated late fee rate multiplied by the outstanding balance that is subject to a late fee charge. Changes in the absolute amount of such outstanding balances can be attributed to changes in (i) fuel prices; (ii) customer specific transaction volume; and (iii) customer specific delinquencies. Late fee revenue can also be impacted by changes in (i) late fee rates and (ii) increases or decreases in customer overdue balances. Late fee rates are determined and set based primarily on the risk associated with our customers, coupled with a strategic view of standard rates within our industry. Periodically, we assess the market rates associated within our industry to determine appropriate late fee rates. We consider factors such as the Company’s overall financial model and strategic plan, the cost to our business from customers failing to pay timely and the impact such late payments have on our financial results. These assessments are typically conducted at least annually but may occur more often depending on macro-economic factors.
Late fee revenue increased $23.3 million in 2017, as compared to 2016, due to the change in overdue balances. For the majority of 2016, late fee ranges and minimum charges were 0 to 6.99 percent monthly and $75, respectively. For the majority of 2017, late fee ranges were 0 to 7.99 percent monthly, with minimum charges of $75. The weighted average late fee rate, net of related charge-offs was 4.4% and 4.3% for 2017 and 2016, respectively.
Concessions to certain customers experiencing financial difficulties may be granted and are limited to extending the time to pay, placing a customer on a payment plan or granting waivers of late fees. There were no material concessions to customers experiencing financial difficulties during both the years ended December 31, 2017 and 2016. Though not material, the Company granted certain concessions to domestic customers impacted by hurricanes and forest fires during 2017.
The primary source of factoring fee revenue is calculated as a negotiated percentage fee of the receivable balance that we purchase. A secondary source of factoring fee revenue is a flat rate service fee to our customers that request a non-contractual same day funding of the receivable balance. Factoring fee revenue increased $9.3 million in 2017, as compared to 2016. The increase in factoring fee revenue is due to organic growth and customer demand for our services.
Expenses
The following table compares selected expense line items within our Fleet Solutions segment:
(in thousands) | 2017 | 2016 | Increase (decrease) | |||||||
Expense | ||||||||||
Salary and other personnel | $ | 259,047 | $ | 201,817 | 28 | % | ||||
Restructuring | 6,203 | 7,486 | (17 | )% | ||||||
Service fees | 68,766 | 95,555 | (28 | )% | ||||||
Provision for credit losses | 59,251 | 27,264 | 117 | % | ||||||
Technology leasing and support | 36,388 | 28,763 | 27 | % | ||||||
Depreciation and amortization | 143,300 | 100,860 | 42 | % | ||||||
Operating interest | 8,611 | 3,476 | 148 | % | ||||||
Impairment charges | 22,144 | — | NM | |||||||
Gain on divestiture | (20,958 | ) | — | NM | ||||||
All other operating expenses1 | $ | 96,585 | $ | 80,230 | 20 | % | ||||
1 Includes all expenses located in our consolidated statements of income which are not separately described above.
NM - Not Meaningful
Salary and other personnel expenses increased $57.2 million for 2017, as compared to 2016, due primarily to resources assumed as part of the EFS acquisition, as well as personnel to support the in-sourcing of technology functions from a third party provider and business growth. Additionally, we recognized higher expenses associated with variable compensation plans based on performance.
We incurred restructuring costs of approximately $6.2 million and $7.5 million for 2017 and 2016, respectively. Restructuring costs decreased due to the wind-down of prior year restructuring initiatives related to our European Fleet business, partly offset by employee costs and office closure costs associated with our EFS acquisition, which are expected to be paid through 2018.
38
Service fees decreased $26.8 million during 2017, as compared to 2016, primarily due to one-time expenses associated with the acquisition of EFS as well as costs to outsource certain back office technology incurred during 2016, partly offset by an increase in professional fees.
Provision for credit losses increased $32.0 million for 2017, as compared to 2016, resulting from higher incidences of magnetic stripe card skimming fraud during 2017. Additionally, credit losses were impacted by higher relative fuel spend and the acquisition of EFS. During 2017, the Company took a number of steps to combat fraud losses, including establishing portfolio limits on the number of transactions and amount of fuel purchases. Additionally, we implemented new real-time technology during the fourth quarter of 2017, designed to increase fraud detection speed. As a result of these actions, monthly fraud losses trended downwards in the second half of 2017, most significantly in the fourth quarter. We anticipate that fraud incidents will continue to trend down slightly in terms of size and frequency in 2018.
We generally measure our credit loss performance by calculating credit losses as a percentage of total fuel expenditures on the payment processing transactions. This metric for credit losses was 17.2 basis points of fuel expenditures for 2017, as compared to 11.1 basis points of fuel expenditures for 2016. We generally use a roll rate methodology to calculate the amount necessary for our ending receivable reserve balance. This methodology considers total receivable balances, recent charge off experience, recoveries on previously charged off accounts, and the dollars that are delinquent to calculate the total reserve. In addition, management undertakes a detailed evaluation of the receivable balances to help further ensure overall reserve adequacy. The expense we recognize in each quarter is the amount necessary to bring the reserve to its required level based on accounts receivable aging and net charge offs.
Technology leasing and support expenses increased $7.6 million in 2017, as compared to 2016. This increase is primarily due to additional software licensing expense and maintenance, resulting from incremental technological investments in our Fleet Solutions business, including EFS.
Depreciation and amortization increased $42.4 million in 2017, as compared to 2016, due primarily to a full year of amortization of intangibles acquired in the EFS acquisition. Refer to Item 8 – Note 3, Business Acquisition of this report for more information. Additionally, following the acquisition of EFS, we evaluated the estimated useful life of our existing over-the-road payment processing technology. As a result of this analysis, we accelerated amortization related to this technology during the third quarter of 2016, resulting in incremental amortization during 2017 as compared to the same period in the prior year. This technology is fully amortized as of December 31, 2017.
Operating interest expense increased $5.1 million in 2017, as compared to 2016, primarily due to higher interest rates paid on recently issued certificates of deposit, which replaced previously held non-interest bearing deposits following the expiration of an agreement with a deposit partner during the fourth quarter of 2016. Additionally, payment processing volume increases and higher fuel prices contributed to the increase in operating interest expense.
During the second quarter of 2017, we incurred a $16.2 million non-cash impairment and asset write-off related to in-sourcing certain technology functions. Additionally, as part of a recent technology plan assessment, we streamlined certain payment processing software offerings and incurred a $5.9 million non-cash software impairment and asset write-off charge.
During 2017, management determined that our Telapoint business did not align with the long-term strategy of our core Fleet business. During November 2017, the Company sold net assets of $8.9 million of this business, which resulted in a pre-tax book gain of approximately $21.0 million.
All other operating expenses increased $16.4 million in 2017, as compared to 2016, resulting primarily from higher costs to support business growth, including incremental expenses as result of the EFS acquisition.
39
TRAVEL AND CORPORATE SOLUTIONS SEGMENT
The following table reflects comparative operating results and key operating statistics within our Travel and Corporate Solutions segment:
(in thousands) | 2017 | 2016 | Increase (decrease) | |||||||
Revenues | ||||||||||
Payment processing revenue | $ | 158,660 | $ | 175,762 | (10 | )% | ||||
Account servicing revenue | 7,531 | 1,247 | 504 | % | ||||||
Finance fee revenue | 760 | 643 | 18 | % | ||||||
Other revenue | 57,096 | 37,595 | 52 | % | ||||||
Total revenues | 224,047 | 215,247 | 4 | % | ||||||
Total operating expenses | 146,061 | 130,817 | 12 | % | ||||||
Operating income | $ | 77,986 | $ | 84,430 | (8 | )% | ||||
Key operating statistics (a) | ||||||||||
Payment processing revenue: | ||||||||||
Payment solutions purchase volume | $ | 30,344,752 | $ | 23,965,023 | 27 | % | ||||
(a) As of July 1, 2016, this key operating statistic includes EFS purchase volumes.
Revenues
Payment processing revenue decreased approximately $17.1 million for 2017, as compared to 2016, primarily due to a decrease in our net interchange rate resulting from contract renegotiations with a large travel customer which went into effect in January 2017. This unfavorable factor was partly offset by an increase in corporate charge card purchase volume from our WEX travel product in all our markets, most notably the U.S. and Europe, and the acquisition of EFS.
Account servicing revenue increased approximately $6.3 million for 2017, as compared to 2016, primarily due to the acquisition of AOC.
Other revenue increased approximately $19.5 million, primarily due to higher international settlement fees.
Concessions to certain customers experiencing financial difficulties may be granted and are limited to extending the time to pay, placing a customer on a payment plan or granting waivers of late fees. As of December 31, 2017 and 2016, customer balances with such concessions totaled $7.9 million and $16.7 million, respectively. The Company waived $2.1 million and $1.3 million in late fees in 2017 and 2016, respectively.
Expenses
The following table compares expense line items within our Travel and Corporate Solutions segment:
(in thousands) | 2017 | 2016 | Increase (decrease) | |||||||
Expense | ||||||||||
Salary and other personnel | $ | 29,273 | $ | 22,728 | 29 | % | ||||
Service fees | 52,199 | 58,254 | (10 | )% | ||||||
Provision for credit losses | (68 | ) | 5,676 | (101 | )% | |||||
Technology leasing and support | 9,590 | 13,991 | (31 | )% | ||||||
Depreciation and amortization | 17,703 | 6,187 | 186 | % | ||||||
Operating interest | 8,367 | 2,969 | 182 | % | ||||||
Impairment charge | 22,027 | — | NM | |||||||
All other operating expenses | $ | 6,970 | $ | 21,012 | (67 | )% | ||||
NM - Not Meaningful
Salary and other personnel expenses increased $6.5 million in 2017, as compared to 2016, due primarily to the acquisitions of AOC and EFS.
40
Service fees decreased by $6.1 million in 2017, as compared to 2016, due primarily to lower network processing fees paid as a result of our MasterCard contract renewal executed during the third quarter of 2016, partly offset by incremental expenses resulting from higher relative purchase volumes.
Provision for credit losses decreased $5.7 million in 2017, as compared to 2016. Prior year results were negatively impacted by two discrete credit losses, including the bankruptcy of one of our online travel agency customers. We recovered a portion of this prior year provision for credit loss during 2017.
Technology leasing and support decreased $4.4 million in 2017, as compared to 2016, due primarily to cost savings as a result of the AOC acquisition. Prior to its acquisition, AOC was one of the Company's important technology providers.
Depreciation and amortization expenses increased $11.5 million in 2017, as compared to 2016, due to a full year of amortization of intangibles acquired in the EFS acquisition and amortization from our recent AOC acquisition.
Operating interest increased $5.4 million in 2017, as compared to 2016, due to higher deposit interest rates. Following the expiration of an agreement with a deposit partner during the fourth quarter of 2016, we issued certificates of deposit to replace previously held non-interest bearing deposits. Additionally, higher payment processing volumes contributed to the increase in operating interest expense.
Following the acquisition of AOC in the fourth quarter of 2017, the Company reevaluated certain payment processing software under development. In doing so, we determined the developed technology obtained as part of the AOC acquisition more closely aligns with our current technological strategy. As result, $22.0 million of previously capitalized software development was determined to have no future benefit and was therefore written off during 2017.
All other operating expenses decreased $14.0 million in 2017, as compared to 2016. 2016 results were negatively impacted by a one-time $15.5 million vendor settlement executed in 2016 in exchange for the release of potential claims related to in-sourcing certain technology.
HEALTH AND EMPLOYEE BENEFIT SOLUTIONS SEGMENT
The following table reflects comparative operating results and key operating statistics within our Health and Employee Benefit Solutions segment:
(in thousands) | 2017 | 2016 | Increase | |||||||
Revenues | ||||||||||
Payment processing revenue | $ | 50,348 | $ | 46,957 | 7 | % | ||||
Account servicing revenue | 103,956 | 82,660 | 26 | % | ||||||
Finance fee revenue | 27,486 | 13,572 | 103 | % | ||||||
Other revenue | 21,745 | 17,963 | 21 | % | ||||||
Total revenues | 203,535 | 161,152 | 26 | % | ||||||
Total operating expenses | 185,880 | 147,063 | 26 | % | ||||||
Operating income | $ | 17,655 | $ | 14,089 | 25 | % | ||||
Key operating statistics (a) | ||||||||||
Payment processing revenue: | ||||||||||
Purchase volume | $ | 4,317,236 | 3,823,035 | 13 | % | |||||
Account servicing revenue: | ||||||||||
Average number of SaaS accounts | 9,213 | 7,197 | 28 | % | ||||||
(a) Key operating statistics have been modified to provide added insight into segment revenue trends. Metrics for the years ended December 31, 2016 and 2015 have also been conformed to the current year presentation.
Revenues
Payment processing revenue increased approximately $3.4 million for 2017, as compared to 2016, resulting primarily from an increase in WEX Health purchase volume due to growth in consumers, partly offset by a slight decline in WEX Latin America revenues.
41
Account servicing revenue increased $21.3 million for 2017, as compared to 2016. This increase was primarily due to WEX Health customer signings and existing customer growth, which resulted in a higher number of participants using our SaaS healthcare technology platform.
Finance fee revenue increased $13.9 million in 2017, as compared to 2016, due primarily to growth in revenue earned on our salary advance product in Brazil.
Concessions to certain customers experiencing financial difficulties may be granted and are limited to extending the time to pay, placing a customer on a payment plan or granting waivers of late fees. There were no material concessions granted during either of the years ended December 31, 2017 or 2016.
Other revenue increased $3.8 million in 2017, as compared to 2016, resulting primarily from an increase in Brazil card transactions and higher ancillary WEX Health fees as result of a growing customer base.
Expenses
The following table compares selected expense line items within our Health and Employee Benefit Solutions segment:
(in thousands) | 2017 | 2016 | Increase | |||||||
Expense | ||||||||||
Salary and other personnel | $ | 75,124 | $ | 61,753 | 22 | % | ||||
Service fees | 28,172 | 19,243 | 46 | % | ||||||
Depreciation and amortization | 42,721 | 34,604 | 23 | % | ||||||
Operating interest | 7,504 | 5,941 | 26 | % | ||||||
All other operating expenses | $ | 32,359 | $ | 25,522 | 27 | % | ||||
Salary and other personnel expenses increased $13.4 million in 2017, as compared to 2016, primarily due to higher average WEX Health and WEX Latin America headcount and related employee benefit costs in support of significant business growth. Additionally, we recognized higher expenses associated with variable compensation plans based on performance.
Service fees increased by $8.9 million in 2017, as compared to 2016, primarily due to costs incurred as a result of the increase in participants using our SaaS healthcare offerings.
Depreciation and amortization expenses increased $8.1 million in 2017, as compared to 2016, resulting from incremental amortization of acquired intangibles and higher depreciation expense primarily on capitalized software development costs.
Operating interest increased $1.6 million in 2017, as compared to 2016, primarily due to an increase in customer receivable balances due to business growth and higher relative average interest rates.
All other operating expenses increased $6.8 million in 2017, as compared to 2016, primarily due to expenses to support significant business growth and higher revenue-based taxes in Brazil.
NON-OPERATING INCOME AND EXPENSES
The following table reflects comparative results for certain amounts excluded from operating profit:
(in thousands) | 2017 | 2016 | Increase (decrease) | |||||
Financing interest expense | (107,067 | ) | (113,418 | ) | (6 | )% | ||
Net foreign currency gain (loss) | 29,919 | (7,665 | ) | NM | ||||
Net unrealized gains on interest rate swap agreements | 1,314 | 12,908 | (90 | )% | ||||
Non-cash adjustments related to tax receivable agreement | 15,259 | (563 | ) | NM | ||||
NM - Not Meaningful
Financing interest expense decreased $6.4 million in 2017, as compared to 2016. 2016 was unfavorably impacted by $30 million of ticking fees incurred for the commitment of funds to finance the acquisition of EFS. The absence of this expense in 2017 was partly offset by higher relative borrowings and effective interest rates under the 2016 Credit Agreement. The Company recently completed two separate repricings of the 2016 Credit Agreement which reduced the applicable interest rate margin on
42
outstanding term loans going forward. See Item 8 - Note 13, Financing Debt and Note 25, Subsequent Event for further information regarding these repricings.
Our foreign currency exchange exposure is primarily related to the re-measurement of our cash, receivable and payable balances, including intercompany transactions that are denominated in foreign currencies. In 2017, net foreign currency gain was $29.9 million, as compared to a net foreign currency loss of $7.7 million in 2016. In 2017, we recognized gains on trade receivables and intercompany loans primarily from a strengthening of the British Pound Sterling and the Euro relative to the US dollar. In 2016, we experienced foreign currency exchange losses from fluctuations in exchange rates that resulted in a significant devaluation of major currencies to which our business is exposed, including the British Pound Sterling, the Euro and the Australian dollar.
Net unrealized gains on interest rate swap agreements was $1.3 million in 2017, as compared to $12.9 million in 2016. In 2017, the favorable impact of increases in the variable interest rates on our swap agreements was almost entirely offset by the decrease in remaining swap duration.
Non-cash adjustments related to tax receivable agreement were $15.3 million in 2017 resulting from a decrease in a tax sharing liability due to our former parent company as result of recent tax reform which reduced the federal statutory rate from 35% to 21%.
INCOME TAXES
Our effective tax rate was 10.9 percent for 2017 as compared to 34.0 percent for 2016. The decline in our tax rate is primarily due the reduction of our net deferred tax liabilities resulting from the change in federal corporate income tax rates effective January 1, 2018 as part of the 2017 Tax Act, partly offset by the increase in valuation allowance.
In December 2017, the 2017 Tax Act was signed into law making significant changes to the Internal Revenue Code. Changes include, but are not limited to, a federal corporate tax rate decrease from 35 percent to 21 percent for tax years beginning after December 31, 2017, the transition of U.S. international taxation from a worldwide tax system to a territorial system and a one-time transition tax on the mandatory deemed repatriation of foreign earnings. The Company has estimated the provision for income taxes in accordance with the 2017 Tax Act and guidance available as of the date of this filing and as a result has recorded a provisional amount of one-time income tax benefit of approximately $60 million in the fourth quarter of 2017, the period in which the legislation was enacted. This benefit was primarily related to the remeasurement of certain deferred tax assets and liabilities based on the tax rates at which they are expected to reverse in the future and a reduction in the amount due under our tax receivable agreement, which decreased primarily as a result of the decline in the federal corporate income tax rate. These favorable impacts were partly offset by income tax expense related to the one-time transition tax on the mandatory deemed repatriation of foreign earnings.
The 2017 Tax Act also changes the taxation of foreign earnings, and companies generally will not be subject to United States federal income taxes upon the receipt of dividends from foreign subsidiaries and will not be permitted foreign tax credits related to such dividends. However, the 2017 Tax Act creates a new requirement to tax certain foreign earnings relating to Global Intangible Low Taxed Income (“GILTI”). Based on the recent FASB guidance, the Company can elect an accounting policy choice of either treating taxes due on future U.S. inclusions in taxable income related to GILTI as a current period expense when incurred or factoring such amounts into the Company’s measurement of its deferred taxes. Because of the complexity of the new GILTI tax rules, and anticipated guidance from U.S. Treasury we will continue to evaluate this provision of the 2017 Tax Act. Therefore, we have not recorded any deferred taxes related to GILTI and have not elected an accounting policy for GILTI at this time.
Undistributed earnings of certain foreign subsidiaries of the Company amounted to approximately $59 million and $26 million at December 31, 2017 and 2016, respectively. These earnings are considered to be indefinitely reinvested. Beginning in 2018, except for GILTI, the Company will no longer record United States federal income tax on its share of the income of its foreign subsidiaries, nor will it record a benefit for foreign tax credits related to that income.
On December 22, 2017, Staff Accounting Bulletin No. 118 was issued to address the application of U.S. GAAP in situations when a registrant does not have the necessary information available, prepared, or analyzed (including computations) in reasonable detail to complete the accounting for certain income tax effects of the Act. Accordingly, any subsequent adjustments to the amount of one-time benefit noted above will be recorded to current income tax provision during the measurement period which is not expected to extend beyond one year from the enactment date. The effects of other provisions of the 2017 Tax Act are not expected to have a material impact on our results of operations.
43
YEAR ENDED DECEMBER 31, 2016, AS COMPARED TO THE YEAR ENDED DECEMBER 31, 2015
FLEET SOLUTIONS SEGMENT
The following table reflects comparative operating results and key operating statistics within our Fleet Solutions segment:
(in thousands, except per transaction and per gallon data) | 2016 | 2015 | Increase (decrease) | |||||||
Revenues | ||||||||||
Payment processing revenue | $ | 297,900 | $ | 305,855 | (3 | )% | ||||
Account servicing revenue | 127,106 | 100,850 | 26 | % | ||||||
Finance fee revenue | 124,725 | 83,554 | 49 | % | ||||||
Other revenue | 92,330 | 57,419 | 61 | % | ||||||
Total revenues | 642,061 | 547,678 | 17 | % | ||||||
Total operating expenses | 545,451 | 413,595 | 32 | % | ||||||
Operating income | $ | 96,610 | $ | 134,083 | (28 | )% | ||||
Key operating statistics (a) | ||||||||||
Payment processing revenue: | ||||||||||
Payment processing transactions | 385,861 | 342,975 | 13 | % | ||||||
Payment processing fuel spend | $ | 22,838,237 | $ | 21,911,834 | 4 | % | ||||
Average price per gallon of fuel - Domestic – ($USD/gal) | $ | 2.21 | $ | 2.55 | (13 | )% | ||||
Net payment processing rate | 1.30 | % | 1.40 | % | (7 | )% | ||||
(a) Key operating statistics have been modified to provide added insight into segment revenue trends. Metrics for the years ended December 31, 2016 and 2015 have conformed to the current year presentation. As of July 1, 2016, these key operating statistics include our EFS acquisition.
Revenues
Payment processing revenue decreased $8.0 million for 2016, as compared to 2015, due primarily to the impact of a 13% decrease in the average domestic price per gallon of fuel in the 2016 as compared to 2015 and the unfavorable impact of foreign currency exchange rates. These unfavorable factors were partly offset by a higher payment processing volume related to the acquisition of EFS, a large customer portfolio converting from a transaction processing relationship to a payment processing relationship in the beginning of 2016 and organic growth.
Account servicing revenue increased $26.3 million for 2016, as compared to 2015, resulting from the acquisition of EFS and organic growth from an increase in fees to certain customers as part of our price modernization efforts.
Other revenues increased $34.9 million in 2016, as compared to 2015, primarily due to the acquisition of EFS.
Finance fee revenue is comprised of the following components:
(in thousands) | 2016 | 2015 | Increase | |||||||
Late fee revenue | $ | 102,497 | $ | 67,027 | 53 | % | ||||
Factoring fee revenue | 19,689 | 15,585 | 26 | % | ||||||
Cardholder interest income | 544 | 515 | 6 | % | ||||||
Other finance fee revenue | 1,995 | 427 | 367 | % | ||||||
Total finance fee revenue | $ | 124,725 | $ | 83,554 | 49 | % | ||||
Late fees increased $35.5 million in 2016, as compared to 2015. The increase in late fees was primarily due to $39.1 million due to rate increases, partly offset by a decrease of $3.6 million due to the change in overdue balances. During the first half of 2015, late fee rates ranged from 0 to 3.75 percent monthly with a minimum late fee charge of $50. For the second half of 2015, late fee rate ranges and minimum charges were 0 to 5.50 percent monthly and $75, respectively. During the second quarter of 2016, late fee ranges were changed to 0 to 6.99 percent monthly, while minimum charges remained at $75. The weighted average late fee rate, net of related charge-offs was 4.3% and 2.6% for 2016 and 2015, respectively.
Concessions to certain customers experiencing financial difficulties may be granted and are limited to extending the time to pay, placing a customer on a payment plan or granting waivers of late fees. There were no material concessions to customers experiencing financial difficulties during either of the years ended December 31, 2016 and 2015.
44
Factoring fee revenue increased $4.1 million in 2016, as compared to 2015. The increase in factoring fee revenue is due to organic growth and customer demand for our services.
Other finance fee revenue increased $1.6 million in 2016 primarily resulting from the EFS acquisition.
Expenses
The following table compares selected expense line items within our Fleet Solutions segment:
(in thousands) | 2016 | 2015 | Increase (decrease) | |||||||
Expense | ||||||||||
Salary and other personnel | $ | 201,817 | $ | 171,122 | 18 | % | ||||
Restructuring | 7,486 | 9,010 | (17 | )% | ||||||
Service fees | 95,555 | 63,075 | 51 | % | ||||||
Provision for credit losses | 27,264 | 20,822 | 31 | % | ||||||
Technology leasing and support | 28,763 | 25,099 | 15 | % | ||||||
Occupancy and equipment | 17,947 | 15,062 | 19 | % | ||||||
Depreciation and amortization | 100,860 | 54,453 | 85 | % | ||||||
Other | $ | 27,043 | $ | 21,718 | 25 | % | ||||
Salary and other personnel expenses increased $30.7 million for 2016, as compared to 2015, due primarily to the acquisition of EFS, and to a lesser extent, increases in variable compensation plans and employee benefit costs.
We recorded restructuring costs of approximately $7.5 million and $9.0 million for 2016 and 2015, respectively. The costs primarily reflect employee termination benefits and office closing costs to be paid through 2018. These initiatives are expected to streamline our domestic and international fleet businesses, driving acquisition synergies and creating greater efficiencies.
Service fees increased $32.5 million during 2016, as compared to 2015. The increase is due primarily to expenses associated with the acquisition of EFS and costs to outsource certain back office technology.
Provision for credit losses increased $6.4 million for 2016, as compared to 2015. We generally measure our credit loss performance by calculating credit losses as a percentage of total fuel expenditures on the payment processing transactions. This metric for credit losses was 11.9 basis points of fuel expenditures for 2016, as compared to 9.4 basis points of fuel expenditures for 2015. We generally use a roll rate methodology to calculate the amount necessary for our ending receivable reserve balance. This methodology considers total receivable balances, recent charge off experience, recoveries on previously charged off accounts, and the dollars that are delinquent to calculate the total reserve. In addition, management undertakes a detailed evaluation of the receivable balances to help further ensure overall reserve adequacy. The expense we recognize in each quarter is the amount necessary to bring the reserve to its required level based on accounts receivable aging and net charge offs.
Technology leasing and support expenses increased $3.7 million in 2016, as compared to 2015, resulting from additional software maintenance expense, due primarily to the EFS acquisition.
Occupancy and equipment increased $2.9 million in 2016, as compared to 2015, due primarily to higher rent expense, the majority of which resulted from the EFS acquisition.
Depreciation and amortization increased $46.4 million in 2016, as compared to 2015, due primarily to amortization of intangibles obtained from the EFS acquisition. Additionally, the Company evaluated the estimated useful life of our existing over-the-road payment processing technology following the EFS acquisition. As a result of this analysis, we recorded approximately $10.1 million of accelerated amortization related to this technology during the second half of 2016 and will amortize approximately $11.5 million of remaining net book value associated with this technology over the next six months.
Other expenses increased $5.3 million in 2016, as compared to 2015, resulting primarily from the EFS acquisition.
45
TRAVEL AND CORPORATE SOLUTIONS SEGMENT
The following table reflects comparative operating results and key operating statistics within our Travel and Corporate Solutions segment:
(in thousands) | 2016 | 2015 | Increase (decrease) | |||||||
Revenues | ||||||||||
Payment processing revenue | $ | 175,762 | $ | 151,311 | 16 | % | ||||
Account servicing revenue | 1,247 | 1,930 | (35 | )% | ||||||
Finance fee revenue | 643 | 326 | 97 | % | ||||||
Other revenue | 37,595 | 41,852 | (10 | )% | ||||||
Total revenues | 215,247 | 195,419 | 10 | % | ||||||
Total operating expenses | 130,817 | 109,101 | 20 | % | ||||||
Operating income | 84,430 | 86,318 | (2 | )% | ||||||
Key operating statistics(a) | ||||||||||
Payment processing revenue: | ||||||||||
Payment solutions purchase card volume | $ | 23,965,023 | $ | 19,440,663 | 23 | % | ||||
(a) As of July 1, 2016, these key operating statistics include our EFS acquisition.
Revenues
Payment processing revenue increased approximately $24.5 million for 2016, as compared to 2015, primarily due to an increase in corporate charge card purchase volume from our WEX travel product and the acquisition of EFS. These favorable impacts were partly offset by the unfavorable impact of foreign currency exchange rates, and a decrease in the virtual card net interchange rate resulting from contract renegotiations and increased volumes in 2016 from certain large customers resulting in higher rebates. In the fourth quarter of 2016, we renegotiated our contract with one of our large customers, which will increase the rebates we provide to them effective in the first quarter of 2017.
Other revenue decreased approximately $4.3 million, primarily due to lower rates charged on cross border transactions.
Concessions to certain customers experiencing financial difficulties may be granted and are limited to extending the time to pay, placing a customer on a payment plan or granting waivers of late fees. As of and for the year ended December 31, 2016, customer balances with such concessions totaled $16.7 million and resulted in approximately $1.3 million in waived late fees. There were no material concessions granted during the year ended December 31, 2015.
Expenses
The following table compares selected expense line items within our Travel and Corporate Solutions segment:
(in thousands) | 2016 | 2015 | Increase (decrease) | |||||||
Expense | ||||||||||
Salary and other personnel | $ | 22,728 | $ | 21,754 | 4 | % | ||||
Service fees | 58,254 | 62,162 | (6 | )% | ||||||
Provision for credit losses | 5,676 | 1,324 | 329 | % | ||||||
Depreciation and amortization | 6,187 | 2,999 | 106 | % | ||||||
Other | $ | 16,833 | $ | 3,961 | 325 | % | ||||
Salary and other personnel expenses increased $1.0 million in 2016, as compared to 2015, due primarily to the acquisition of EFS.
Service fees decreased by $3.9 million in 2016, as compared to 2015, due primarily to benefits realized from certain contract renewals, partly offset by the acquisition of EFS.
Provision for credit losses increased $4.4 million in 2016, as compared to 2015, primarily due to reserves taken for specific travel customers in Europe, including the bankruptcy of one of our online travel agency customers during the third quarter of 2016.
46
Depreciation and amortization expenses increased $3.2 million in 2016, as compared to 2015, resulting from related amortization on acquired EFS intangible assets.
Other expenses increased $12.9 million in 2016, as compared to 2015, primarily resulting from a one-time $15.5 million vendor settlement in exchange for the release of potential claims related to in-sourcing certain technology.
HEALTH AND EMPLOYEE BENEFIT SOLUTIONS SEGMENT
The following table reflects comparative operating results and key operating statistics within our Health and Employee Benefit Solutions segment:
(in thousands) | 2016 | 2015 | Increase | |||||||
Revenues | ||||||||||
Payment processing revenue | $ | 46,957 | 38,703 | 21 | % | |||||
Account servicing revenue | 82,660 | 53,912 | 53 | % | ||||||
Finance fee revenue | 13,572 | 5,113 | 165 | % | ||||||
Other revenue | 17,963 | 13,812 | 30 | % | ||||||
Total revenues | 161,152 | 111,540 | 44 | % | ||||||
Total operating expenses | 147,063 | 103,148 | 43 | % | ||||||
Operating income | 14,089 | 8,392 | 68 | % | ||||||
Key operating statistics(a) | ||||||||||
Payment processing revenue: | ||||||||||
Purchase volume | $ | 3,823,035 | $ | 3,533,724 | 8 | % | ||||
Account servicing revenue: | ||||||||||
Average number of SaaS accounts | 7,197 | 4,956 | 45 | % | ||||||
(a) Key operating statistics have been modified to provide added insight into segment revenue trends. Metrics for the years ended December 31, 2016 and 2015 have conformed to the current year presentation.
Revenues
Payment processing revenue increased approximately $8.3 million for 2016, as compared to 2015, due primarily to higher spend volumes resulting from the growth of WEX Health interchange consumers.
Account servicing revenue increased $28.7 million for 2016, as compared to 2015. This increase was due primarily to WEX Health new and existing customer growth, which resulted in a higher number of participants using our SaaS healthcare offerings, and revenues from Benaissance, which was acquired in November 2015.
Finance fee revenue increased $8.5 million in 2016, as compared to 2015, due primarily to organic growth in revenue earned on our salary advance product in Brazil resulting from an increase in the number of installments selected by our customers in 2016 as compared to the prior year.
Concessions to certain customers experiencing financial difficulties may be granted and are limited to extending the time to pay, placing a customer on a payment plan or granting waivers of late fees. There were no material concessions granted during either of the years ended December 31, 2016 or 2015.
Other revenue increased $4.2 million in 2016, as compared to 2015, due primarily to growth and other ancillary fees from the Benaissance acquisition.
Expenses
The following table compares selected expense line items within our Health and Employee Benefit Solutions segment:
(in thousands) | 2016 | 2015 | Increase | |||||||
Expense | ||||||||||
Salary and other personnel | $ | 61,753 | $ | 41,688 | 48 | % | ||||
Service fees | 19,243 | $ | 13,607 | 41 | % | |||||
Occupancy and equipment | 6,336 | $ | 4,455 | 42 | % | |||||
Depreciation and amortization | $ | 34,604 | $ | 25,625 | 35 | % | ||||
47
Salary and other personnel expenses increased $20.1 million in 2016, as compared to 2015, primarily due to additional headcount and variable compensation plan costs at WEX Health to support growth, including the impact from the acquisition of Benaissance.
Service fees increased by $5.6 million in 2016, as compared to 2015, primarily related to higher costs resulting from growth in WEX Health consumers and from the acquisition of Benaissance.
Occupancy and equipment expenses increased $1.9 million in 2016, as compared to 2015, primarily due to incremental facility leasing costs from the acquisition of Benaissance and growth of our WEX Health facilities and related costs.
Depreciation and amortization expenses increased $9.0 million in 2016, as compared to 2015. This increase resulted from higher amortization expense, primarily on acquired Benaissance intangibles and capitalized software development costs.
NON-OPERATING INCOME AND EXPENSES
The following table reflects comparative results for certain amounts excluded from operating profit:
(in thousands) | 2016 | 2015 | Increase (decrease) | |||||
Financing interest expense | (113,418 | ) | (46,189 | ) | 146 | % | ||
Net foreign currency loss | (7,665 | ) | (5,689 | ) | (35 | )% | ||
Net unrealized gains on interest rate swap agreements | 12,908 | — | NM | |||||
NM - Not Meaningful
Financing interest expense increased $67.2 million in 2016, as compared to 2015. The increase was primarily due to ticking fees incurred for the commitment of funds to finance the acquisition of EFS and higher relative borrowings and effective interest rates under the 2016 Credit Agreement.
Net foreign currency loss increased $2.0 million in 2016, as compared to 2015. In both 2016 and 2015, most prominently in the fourth quarter of each year, we experienced losses from fluctuations in exchange rates that resulted in a significant devaluation of major currencies to which our business is exposed, including the British Pound Sterling, the Euro and the Australian dollar. In 2016, this unfavorable factor was partly offset by recognized foreign currency gains related to intercompany loans resulting from a strengthening of the Euro against the British Pound Sterling.
In November 2016, the Company entered into three forward-fixed interest rate swap agreements to manage the interest rate risk associated with our outstanding variable-interest rate borrowings. These derivative instruments do not qualify for hedge accounting. Accordingly, realized and unrealized gains and losses on these derivative instruments affect our net income. During 2016, we recorded an unrealized gain of $12.9 million on these interest rate swap agreements.
INCOME TAXES
Our effective tax rate was 34.0 percent for 2016 as compared to 40.7 percent for 2015. The change in our tax rate reflects a shift in jurisdictional profitability between 2015 and 2016. Increased profits in 2016 within tax jurisdictions with tax rates lower than the United States resulted in a reduction to our effective tax rate. Our 2016 tax rate reflects the release of certain historical foreign reserve positions in Australia, primarily driven by a lapse of statute, as well as a reduction in our domestic production activities deduction as a result of lower taxable income in the United States.
NON-GAAP FINANCIAL MEASURES
The Company's non-GAAP adjusted net income excludes unrealized gains and losses on derivatives, net foreign currency remeasurement gains and losses, acquisition-related ticking fees, acquisition-related intangible amortization, other acquisition and divestiture related items, stock-based compensation, restructuring and other costs, gain on divestiture, a one-time vendor settlement, debt restructuring and debt issuance cost amortization, non-cash adjustments related to tax receivable agreement, reserves for regulatory penalties, adjustments attributed to our non-controlling interest and certain tax related items. In addition, for the three months and year ended December 31, 2017, we have excluded certain impairment charges and asset write-offs as described below.
Although adjusted net income is not calculated in accordance with GAAP, this non-GAAP measure is integral to the Company's reporting and planning processes and the chief operating decision maker of the Company uses adjusted operating income to allocate resources among our operating segments. The Company considers this measure integral because it excludes the above-specified items that the Company's management excludes in evaluating the Company's performance. Specifically, in
48
addition to evaluating the Company's performance on a GAAP basis, management evaluates the Company's performance on a basis that excludes the above items because:
• | Exclusion of the non-cash, mark-to-market adjustments on derivative instruments, including fuel-price related derivatives and interest rate swap agreements, helps management identify and assess trends in the Company's underlying business that might otherwise be obscured due to quarterly non-cash earnings fluctuations associated with these derivative contracts. The non-cash, mark-to-market adjustments on derivative instruments are difficult to forecast accurately, making comparisons across historical and future quarters difficult to evaluate. |
• | Net foreign currency gains and losses primarily result from the remeasurement to functional currency of cash, receivable and payable balances, certain intercompany notes denominated in foreign currencies and any gain or loss on foreign currency hedges relating to these items. The exclusion of these items helps management compare changes in operating results between periods that might otherwise be obscured due to currency fluctuations. |
• | The Company considers certain acquisition-related costs, including certain financing costs, ticking fees, investment banking fees, warranty and indemnity insurance, certain integration related expenses and amortization of acquired intangibles, as well as gains and losses from divestitures to be unpredictable, dependent on factors that may be outside of our control and unrelated to the continuing operations of the acquired or divested business or the Company. In addition, the size and complexity of an acquisition, which often drives the magnitude of acquisition-related costs, may not be indicative of such future costs. The Company believes that excluding acquisition-related costs and gains or losses of divestitures facilitates the comparison of our financial results to the Company's historical operating results and to other companies in our industry. |
• | Stock-based compensation is different from other forms of compensation, as it is a non-cash expense. For example, a cash salary generally has a fixed and unvarying cash cost. In contrast, the expense associated with an equity-based award is generally unrelated to the amount of cash ultimately received by the employee, and the cost to the Company is based on a stock-based compensation valuation methodology and underlying assumptions that may vary over time. |
• | Restructuring and other costs include employee termination benefits from certain identified initiatives to further streamline the business, improve the Company's efficiency, create synergies and to globalize the Company's operations, all with an objective to improve scale and increase profitability going forward. We exclude these items when evaluating our continuing business performance as such items are not consistently occurring and do not reflect expected future operating expense, nor provide insight into the fundamentals of current or past operations of our business. |
• | Impairment charges and asset write-offs represent non-cash asset write-offs related to the following: |
◦ | Impairment of certain prepaid services following a strategic decision to in-source certain technology functions. |
◦ | Impairments of certain payment processing software following the acquisition of AOC and as part of our ongoing platform consolidation strategy, designed to ensure we continue to deliver superior technology to our customers. |
These charges do not reflect recurring costs that are relevant to our continuing operations. The Company believes that excluding these nonrecurring expenses facilitates the comparison of our financial results to the Company's historical operating results and to other companies in our industry.
• | Vendor settlement represents a payment in exchange for the release of potential claims related to insourcing certain technology, and does not reflect recurring costs that would be relevant to the continuing operations of the Company. The Company believes that excluding this nonrecurring expense facilitates the comparison of our financial results to the Company's historical operating results and to other companies in our industry. |
• | Debt restructuring and debt issuance cost amortization are non-cash items that are unrelated to the continuing operations of the Company. Debt restructuring costs are not consistently occurring and do not reflect expected future operating expense, nor provide insight into the fundamentals of current or past operations of our business. In addition, since debt issuance cost amortization is dependent upon the financing method which can vary widely company to company, we believe that excluding these costs helps to facilitate comparison to historical results as well as to other companies within our industry. |
• | The adjustments attributable to non-controlling interests, including adjustments to the redemption value of a non-controlling interest, and the non-cash adjustments related to our tax receivable agreement have no significant impact on the ongoing operations of the business. |
49
• | Regulatory reserves reflect charges related to the impact of a regulatory action which resulted in WEX paying a penalty in 2016. We have excluded this item when evaluating our continuing business performance as it is not consistently recurring and does not reflect an expected future operating expense, nor provide insight into the fundamentals of the current or past operations of our business. |
• | The tax related items are the difference between the Company’s U.S. GAAP tax provision and a pro forma tax provision based upon the Company’s adjusted net income before taxes as well as the impact from certain discrete tax items. The methodology utilized for calculating the Company’s adjusted net income tax provision is the same methodology utilized in calculating the Company’s U.S. GAAP tax provision. |
For the same reasons, WEX believes that adjusted net income may also be useful to investors as one means of evaluating the Company's performance. However, because adjusted net income is a non-GAAP measure, it should not be considered as a substitute for, or superior to, net income, operating income or cash flows from operating activities as determined in accordance with GAAP. In addition, adjusted net income as used by WEX may not be comparable to similarly titled measures employed by other companies.
The following table reconciles net earnings attributable to shareholders to adjusted net income attributable to shareholders:
Year ended December 31, | |||||||||||
2017 | 2016 | 2015 | |||||||||
Net earnings attributable to shareholders | $ | 160,266 | $ | 60,637 | $ | 101,904 | |||||
Unrealized (gains) losses on derivative instruments | (1,314 | ) | (7,901 | ) | 35,962 | ||||||
Net foreign currency remeasurement (gain) loss | (29,919 | ) | 7,665 | 5,689 | |||||||
Acquisition-related ticking fees | — | 30,045 | — | ||||||||
Acquisition-related intangible amortization | 153,810 | 97,829 | 47,792 | ||||||||
Other acquisition and divestiture related items | 5,000 | 20,879 | 4,137 | ||||||||
Gain on divestiture | (20,958 | ) | — | (1,215 | ) | ||||||
Stock-based compensation | 30,487 | 19,742 | 12,420 | ||||||||
Restructuring and other costs | 11,129 | 13,995 | 9,010 | ||||||||
Impairment charges and asset write-offs | 44,171 | — | — | ||||||||
Vendor settlement | — | 15,500 | — | ||||||||
Debt restructuring and issuance cost amortization | 10,519 | 12,673 | 3,097 | ||||||||
Non-cash adjustments related to tax receivable agreement | (15,259 | ) | 563 | (2,145 | ) | ||||||
Regulatory reserve | — | — | 1,750 | ||||||||
ANI adjustments attributable to non-controlling interests | (1,563 | ) | (2,583 | ) | 4,996 | ||||||
Tax related items | (113,327 | ) | (79,834 | ) | (32,286 | ) | |||||
Adjusted net income attributable to shareholders | $ | 233,042 | $ | 189,210 | $ | 191,111 | |||||
LIQUIDITY, CAPITAL RESOURCES AND CASH FLOWS
We believe that our cash generating capability, financial condition and operations, together with our revolving credit agreement, term loans, and notes outstanding, as well as other available methods of financing (including deposits, participation loans, borrowed federal funds, and securitization facilities), will be adequate to fund our cash needs for at least the next 12 months.
The table below summarizes our cash activities:
Year ended December 31, | |||||||||||
(in thousands) | 2017 | 2016 | 2015 | ||||||||
Net cash provided by (used for) operating activities | $ | 132,949 | $ | (151,131 | ) | $ | 445,100 | ||||
Net cash used for investing activities | (163,501 | ) | (1,160,439 | ) | (126,658 | ) | |||||
Net cash provided by (used for) financing activities | $ | 359,385 | $ | 1,216,081 | $ | (319,538 | ) | ||||
2017 Highlights
• | Cash provided by operating activities was primarily due to higher net income adjusted for non-cash charges. This favorable factor was partly offset cash used by accounts receivables, net of associated payables. |
50
• | Cash used by investing activities was due to the acquisition of AOC and capital additions primarily related to the development of internal-use software as we expand globally and provide competitive products and services to our customers. These impacts were partly offset by the sale of our Telapoint business after determining that its operations did not align with the core strategy of our Fleet business. The AOC acquisition was funded with cash on hand and through the Company's 2016 Credit Agreement. |
• | The Company added $100 million of capacity to its revolving line of credit to provide additional liquidity and flexibility. |
• | Cash provided by financing activities resulted from increased bank deposits to fund accounts receivable, borrowings under the 2016 Credit Agreement associated with the AOC acquisition and increased third-party bank participation in customer receivables. |
2016 Highlights
• | On July 1, 2016, we completed the acquisition of EFS, a provider of customized corporate payment solutions for fleet and corporate customers with a focus on the large and mid-sized over-the-road fleet segments for approximately $1.4 billion in cash and stock consideration. |
In conjunction with the EFS acquisition, we successfully closed on the 2016 Credit Agreement, which increased our available financing. The 2016 Credit Agreement provides for term loan facilities in the amount of $1.7 billion, a $470 million secured revolving credit facility and the option for additional loans subject to certain criteria.
• | During 2016, our increase in accounts receivable resulted in a $442.3 million use of cash, net of the customer receivables acquired as part of the EFS acquisition. This was primarily funded by operating activities. Accounts receivable increased as a result of higher revenues during the month ended December 31, 2016 as compared to the same period in 2015, resulting primarily from an increase in transaction volume. |
• | In November 2016, we entered into three forward-fixed interest rate swap agreements to manage the interest rate risk associated with our outstanding variable-interest rate borrowings. Commencing January 2017, the Company receives variable interest of 1-month LIBOR under these swaps and pays fixed rates between 0.896% to 1.125%, reducing a portion of the variability of the future interest payments associated with $800 million of our borrowings. |
• | During 2016, cash outflows from capital additions totaled $61.8 million, primarily related to the development of internal-use software as we expand globally and provide competitive products and services to our customers. |
2015 Highlights
• | During 2015, cash provided by operating activities was primarily provided by a decrease in accounts receivable, net of the accounts receivable balances acquired with our acquisitions, net income, and depreciation and amortization expense. Accounts receivable decreased in 2015 over 2014 as a result of decreases in fuel prices. |
• | On November 18, 2015, we acquired Benaissance for approximately $80.7 million. The transaction was financed through the Company’s cash on hand and existing credit facility. |
• | On August 31, 2015, we acquired the remaining 49 percent ownership in UNIK, that we did not previously own, for approximately $46 million. The transaction was financed through the Company’s cash on hand and existing credit facility. |
• | On January 7, 2015, we sold our operations of rapid! PayCard for $20.0 million, which resulted in a pre-tax gain of $1.2 million. |
• | During 2015, we incurred restructuring charges of $9.0 million, of which approximately $1.4 million was paid during the year. These expenses consist of employee termination benefits and third party service fees. |
• | During 2015, we had approximately $63 million of capital expenditures. A significant portion of our capital expenditures are for the development of internal-use computer software primarily to enhance product features and functionality in the United States and the development of our global fleet platform. Our capital spending is financed primarily through internally generated funds. |
51
Liquidity
General
In general, our trade receivables provide for payment terms of 30 days or less. Receivables not paid within the terms of the customer agreement are generally subject to late fees based upon the outstanding customer receivable balance. Beginning in the first quarter of 2015, we began to extend revolving credit to certain customers with respect to small fleet receivables. These accounts are also subject to late fees and balances that are not paid in full are subject to interest charges based on a revolving balance. As of December 31, 2017 and 2016, we had approximately $12.2 million and $3.4 million, respectively, of receivables with revolving credit.
At December 31, 2017, approximately 95 percent of the outstanding balance of $2.7 billion of total trade accounts receivable was 29 days or less past due and approximately 97 percent of the outstanding balance of total trade accounts receivable was 59 days or less past due. The outstanding balance is made up of receivables from a wide range of industries. No one customer represented 10 percent of the outstanding receivables balance as of December 31, 2017. One customer represented 11 percent of the outstanding receivables balance as of December 31, 2016.
Our short-term cash requirements consist primarily of funding the working capital needs of our business, payments on maturities and withdrawals of brokered deposits and borrowed federal funds, required capital expenditures, repayments on our credit facility, interest payments on our credit facility and other operating expenses. WEX Bank can fund our short-term domestic cash requirements through the issuance of brokered deposits and borrowed federal funds. Any remaining cash needs are primarily funded through operations. Our long-term cash requirements consist primarily of amounts owed on our 2016 Credit Agreement and Notes, amounts due to Wyndham Worldwide Corporation as part of our tax receivable agreement and various facilities lease agreements.
Undistributed earnings of certain foreign subsidiaries of the Company amounted to an estimated $58.7 million and $25.8 million at December 31, 2017 and 2016, respectively. These earnings are considered to be indefinitely reinvested. As discussed in Item 8 - Note 14, Income Taxes, the United States enacted the 2017 Tax Act in December 2017, which impacted undistributed earnings, among other things. The 2017 Tax Act imposes a one time “transition tax” on foreign undistributed earnings, which will be paid with our 2017 U.S. Income Tax Return. To determine the amount of the transition tax, the Company must determine, in addition to other factors, the amount of post-1986 earnings and profits of the relevant foreign subsidiaries, as well as the amount of non-U.S. income taxes paid on such earnings. The Company is able to make a reasonable estimate of the transition tax and recorded a provisional transition tax obligation of $9.1 million. However, the Company is continuing to gather additional information to more precisely compute the amount of the transition tax. Upon distribution of these earnings in the form of dividends or otherwise, the Company would be subject to withholding taxes payable to the various foreign countries, but would have no further federal income tax liability, except for the difference in the provisional and actual tax. The Company’s primary tax jurisdictions are the United States, Australia and the United Kingdom.
Earnings outside of the United States are accompanied by certain financial risks, such as changes in foreign currency exchange rates. Changes in foreign currency exchange rates may reduce the reported value of our foreign currency revenues, net of expenses, and cash flows. We cannot predict changes in currency exchange rates, the impact of exchange rate changes, nor the degree to which we will be able to manage the impact of currency exchange rate changes.
Deposits and Borrowed Federal Funds
WEX Bank issues certificates of deposit in various maturities ranging between 3 month and three years, with interest rates ranging from 1.00 percent to 2.15 percent as of December 31, 2017, as compared to interest rates ranging from 0.65 percent to 1.35 percent as of December 31, 2016.
As of December 31, 2017, we had approximately $937.7 million of certificates of deposit outstanding at a weighted average interest rate of 1.51 percent, compared to $725.6 million of certificates of deposit outstanding at a weighted average interest rate of 0.96 percent as of December 31, 2016.
WEX Bank also issues interest-bearing money market deposits with variable interest rates ranging from 1.24 percent to 1.55 percent as of December 31, 2017, as compared to variable interest rates ranging from 0.48 percent to 0.87 percent as of December 31, 2016.
As of December 31, 2017, we had approximately $285.9 million of brokered money market deposits outstanding at a weighted average interest rate of 1.49 percent, compared to $325.5 million of brokered money market deposits at a weighted average interest rate of 0.76 percent as of December 31, 2016.
52
WEX Bank may issue brokered deposits without limitation, subject to FDIC rules governing minimum financial ratios, which include risk-based asset and capital requirements. As of December 31, 2017, all brokered deposits were in denominations of $250,000 or less, corresponding to FDIC deposit insurance limits. Interest-bearing money market funds may be withdrawn at any time. We believe that our brokered deposits are paying competitive yields and that there continues to be consumer demand for these instruments.
We also carry non-interest bearing deposits that are required for certain customers as collateral for their credit accounts. We had $70.2 million and $67.8 million of these deposits on hand at December 31, 2017 and 2016, respectively.
WEX Bank also borrows from lines of credit on a federal funds rate basis to supplement the financing of our accounts receivable. Our federal funds lines of credit were $400.0 million and $250.0 million as of December 31, 2017 and 2016 respectively, with no outstanding balance as of December 31, 2017.
2016 Credit Agreement
On July 1, 2016, we entered into the 2016 Credit Agreement in order to permit the additional financing necessary to facilitate the EFS acquisition. The 2016 Credit Agreement provided for a tranche A term loan facility in an original principal amount equal to $455 million, a tranche B term loan facility in an original principal amount equal to $1,200 million, and a $470 million secured revolving credit facility, with a $250 million sublimit for letters of credit and a $20 million sublimit for swingline loans.
Incremental loans of up to the greater of $375 million (plus the amount of certain prepayments) and an unlimited amount subject to satisfaction of a consolidated leverage ratio test could be made available under the 2016 Credit Agreement upon the request of the Company, subject to specified terms and conditions, including receipt of lender commitments. Effective July 3, 2017, the Company entered into a First Amendment to the 2016 Credit Agreement, which repriced the secured term loans under the 2016 Credit Agreement. The consolidated leverage ratio as defined in the 2016 Credit Agreement (i.e. consolidated funded indebtedness to consolidated EBITDA), was also modified for purposes of calculating the interest rate margin for tranche A term loans and revolving loans and determining compliance with the financial covenant by allowing the Company to exclude up to $75 million of certain corporate cash balances for purposes of determining consolidated funded indebtedness. Effective October 30, 2017, the Company entered into a Second Amendment to the 2016 Credit Agreement, which added $100 million of capacity to its revolving line of credit to provide additional liquidity and flexibility during 2017. Effective January 17, 2018, the Company entered into a Third Amendment to the 2016 Credit Agreement, which further repriced the tranche B term loans under the 2016 Credit Agreement, increased the outstanding amounts on these tranche B term loans from $1.182 billion to $1.335 billion, and made certain other changes to the 2016 Credit Agreement, including increasing the maximum consolidated leverage ratio for the period of December 31, 2018 through September 30, 2019 and upon the occurrence of an acquisition meeting certain specified criteria, permitting the incurrence of unsecured indebtedness as long as the Company is in pro forma compliance with the financial covenants and resetting and amending the test for incremental loans.
Proceeds from the 2016 Credit Agreement were used to pay the cash portion of the purchase price for the EFS acquisition, repay amounts outstanding under the 2014 Credit Agreement (which was superseded by the 2016 Credit Agreement), and pay related fees, expenses and other transaction costs, as well as for working capital and other general corporate purposes.
Our credit agreements contain various financial covenants requiring us to maintain certain financial ratios. In addition to the financial covenants, the credit agreements contain various customary restrictive covenants including restrictions in certain situations on the payment of dividends. WEX Bank is not subject to certain of these restrictions. We were in compliance with all material covenants and restrictions at December 31, 2017.
As of December 31, 2017, we had $136.5 million of outstanding borrowings against our $570.0 million revolving credit facility, which terminates in July of 2021. The combined outstanding debt under our tranche A term loan facility, which expires in July of 2021, and our tranche B term loan facility, which expires in July of 2023, totaled $1.6 billion at December 31, 2017. As of December 31, 2017, amounts outstanding under the 2016 Credit Agreement bore a weighted average effective interest rate of 4.2%.
See Item 8 - Note 13, Financing Debt for further information regarding interest rates, voluntary prepayments rights and principal payments required under our 2014 and 2016 Credit Agreements.
Ticking Fees
In January 2016, we began to incur ticking fees for the debt financing commitment associated with the 2016 Credit Agreement in anticipation of the then pending acquisition of EFS. Through June 30, 2016, we recorded $30 million of ticking fees, which is included in financing interest expense. These ticking fees were calculated based on the financing commitment of
53
an aggregate principal amount of $2.125 billion that remained in place until the closing of the EFS acquisition on July 1, 2016. The total amount of ticking fees paid at the closing of the EFS acquisition was $22.2 million. The excess ticking fees of $7.9 million were netted against the net debt issuance costs related to the 2016 Credit Agreement and will be amortized over the 2016 Credit Agreement's terms using the effective interest method for the tranche A and B term loans and the revolver.
Notes Outstanding
On January 30, 2013, the Company completed a $400 million offering in aggregate principal amount of its 4.750 percent senior notes due 2023 (the “Notes”) at an issue price of 100.0 percent of the principal amount, plus accrued interest, from January 30, 2013. Proceeds from the Notes were used to pay down the entire outstanding balance of the revolver portion of our 2013 Credit Agreement. The remaining proceeds are available for working capital purposes, acquisitions, payment of dividends and other restricted payments, refinancing of indebtedness, and other general corporate purposes.
WEX Latin America Debt
WEX Latin America had debt of approximately $9.7 million and $30.8 million as of December 31, 2017 and 2016, respectively. This is comprised of credit facilities held in Brazil and loan arrangements related to our accounts receivable, with various maturity dates. The average interest rate was 21.2 percent and 19.7 percent for the years ended December 31, 2017 and 2016, respectively. This debt is classified in Other debt on the Company’s consolidated balance sheets for the periods presented.
Participation Debt
WEX Bank maintains agreements with third-party banks to fund customer balances that exceed WEX Bank's lending limit to an individual customer. During the year ended December 31, 2017, the Company increased the funding capacity of these arrangements by $90.0 million to $185.0 million. Associated borrowings carry a variable interest rate of 1 month to 3 month LIBOR plus a margin of 225 basis points. The balance of the debt was approximately $185.0 million and $95.0 million at December 31, 2017 and 2016, respectively, and was secured by an interest in the underlying customer receivables. The balance will fluctuate on a daily basis based on customer funding needs. The commitment will mature in amounts of $85.0 million and $50.0 million on May 30, 2018 and December 31, 2021, respectively, with the remaining $50 million maturing on demand.
Australian Securitization Facility
During the second quarter of 2017, the Company extended an existing securitized debt agreement with the Bank of Tokyo-Mitsubishi UFJ, Ltd. through April 2018. Under the terms of the agreement, each month, on a revolving basis, the Company sells certain of its Australian receivables to the Company's Australian Securitization Subsidiary. The Australian Securitization Subsidiary, in turn, uses the receivables as collateral to issue asset-backed commercial paper (“securitized debt”) for approximately 85 percent of the securitized receivables. The amount collected on the securitized receivables is restricted to pay the securitized debt and is not available for general corporate purposes.
The Company pays a variable interest rate on the outstanding balance of the securitized debt, based on the Australian Bank Bill Rate plus an applicable margin. The interest rate was 2.53 percent and 2.65 percent as of December 31, 2017 and 2016, respectively. The Company had securitized debt under this facility of approximately $90,000 and $78,600 as of December 31, 2017 and 2016, respectively.
European Securitization Facility
On April 7, 2016, the Company entered into a five year securitized debt agreement with the Bank of Tokyo-Mitsubishi UFJ, Ltd. Under the terms of the agreement, the Company sells certain of its receivables from selected European countries to our European Securitization Subsidiary. The European Securitization Subsidiary, in turn, uses the receivables as collateral to issue securitized debt. The amount collected on the securitized receivables is restricted to pay the securitized debt and is not available for general corporate purposes. The amounts of receivables to be securitized under this agreement will be determined by management on a monthly basis. The Company had $17.9 million of securitized debt under this facility as of December 31, 2017 at an interest rate of 1.11 percent and $5.7 million of securitized debt under this facility as of December 31, 2016 at an interest rate of 0.95 percent.
WEX Latin America Securitization Facility
During the second quarter of 2017, WEX Latin America entered into a securitized debt agreement to sell certain unsecured receivables associated with our salary payment card product to an investment fund managed by an unrelated third-party financial institution. Under the terms of the agreement, the investment fund's purchase price incorporates a discount relative to the face value of the transferred receivables. Additionally, the investment fund compensates WEX Latin America for continuing to service these receivables through their duration, which on average is less than six months.
54
During 2017, WEX Latin America securitized approximately $49.1 million of receivables to the investment fund for cash proceeds of approximately $43.8 million. This $5.3 million discount is recognized as operating interest in the Company's consolidated statements of income using the effective interest method over the weighted average term of the salary advances. As of December 31, 2017, the Company had approximately $19.0 million of securitized debt under this facility.
WEX Europe Services Accounts Receivable Factoring
During the first quarter of 2017, WEX Europe Services entered into a factoring arrangement with an unrelated third-party financial institution (the "Purchasing Bank”) to sell certain of its accounts receivable in order to accelerate the collection of the Company's cash and reduce internal costs, thereby improving liquidity. Under this arrangement, the Purchasing Bank establishes a credit limit for each customer account. The factored receivables are without recourse to the extent that the customer balances are maintained at or below the established credit limit. For customer receivable balances in excess of the Purchasing Bank's credit limit, the Company maintains the risk of default. The Company obtained a true sale opinion from an independent attorney, which states that the factoring agreement creates a sale of receivables under local law for amounts transferred both below and above the established credit limits. Additionally, there are no indications of the Company's continuing involvement in the factored receivables. As a result, the Purchasing Bank is deemed the purchaser of these receivables and is entitled to enforce payment of these amounts from the debtor.
This factoring arrangement is accounted for as a sale and accordingly the Company records the receivables sold as a reduction of accounts receivable and proceeds as cash provided by operating activities. The Company sold approximately $574.4 million of receivables under this arrangement during year ended December 31, 2017. Charge-backs on balances in excess of the credit limit during the year ended December 31, 2017 were insignificant.
Other Liquidity Matters
On July 1, 2016, the Company completed the acquisition of EFS for approximately $1.2 billion in cash and 4 million shares of its common stock.
At December 31, 2017, we had variable-rate borrowings of $1.7 billion under our 2016 Credit Agreement. We periodically review our projected borrowings under our 2016 Credit Agreement and the current interest rate environment in order to ascertain whether interest rate swaps should be used to reduce our exposure to interest rate volatility. During 2016 and 2017, we entered into five interest rate swap contracts that mature between December 2018 and December 2022. Collectively, these derivative contracts are intended to fix the future interest payments associated with $1.3 billion of our variable rate borrowings at between 0.896% to 2.212%. See Item 8 – Note 11, Derivative Instruments for more information. See Note 17, Fair Value for more information.
Our long-term cash requirements consist primarily of amounts owed on our 2016 Credit Agreement, our outstanding Notes, amounts due to Wyndham Worldwide Corporation (see Note 15, Tax Receivable Agreement, in Part II, Item 8) as part of our tax receivable agreement, and various facilities lease agreements.
As of December 31, 2017, we also had $27.5 million in letters of credit outstanding. At December 31, 2017, we had $1,707.1 million of borrowed funds, and $406.0 million available under the 2016 Credit Agreement, subject to the covenants as described above.
We currently have authorization from our Board to purchase up to $150 million of our common stock until September 2021, which is entirely unused as of December 31, 2017. The program is funded either through our future cash flows or through borrowings on our 2016 Credit Agreement. Share repurchases are made on the open market and may be commenced or suspended at any time. The Company’s management, based on its evaluation of market and economic conditions and other factors, determines the timing and number of shares repurchased.
We discuss our hedging strategies relative to commodity and interest rate risk in Item 7A below. Our fuel price derivatives were entered into to mitigate the volatility that domestic fuel prices introduce to our revenue streams. These derivatives restricted a portion of our fuel price exposure to a collar range, established at the time the fuel price derivatives were purchased. During the fourth quarter of 2014, we suspended purchases under our fuel derivatives program due to unusually low prices in the commodities market. After the first quarter of 2016, we were no longer hedged for changes in fuel prices. Management will continue to monitor the fuel price market and evaluate our alternatives as it relates to this hedging program.
Management believes that we can adequately fund our cash needs for at least the next 12 months.
55
Contractual Obligations
The table below summarizes the estimated dollar amounts of payments under contractual obligations as of December 31, 2017, for the periods specified:
(in thousands) | 2018 | 2019 | 2020 | 2021 | 2022 and Thereafter | Total | |||||||||||||||||
Operating Lease Obligations(a) | $ | 13,559 | $ | 9,903 | $ | 8,532 | $ | 8,093 | $ | 16,948 | $ | 57,035 | |||||||||||
Debt Obligations | |||||||||||||||||||||||
Term Loans | 34,750 | 34,750 | 34,750 | 364,625 | 1,134,000 | 1,602,875 | |||||||||||||||||
Interest payments on term loans(b) | 66,330 | 64,876 | 63,423 | 57,370 | 72,948 | 324,947 | |||||||||||||||||
$400 million notes offering | — | — | — | — | 400,000 | 400,000 | |||||||||||||||||
Interest on $400 million notes offering | 19,000 | 19,000 | 19,000 | 19,000 | 20,583 | 96,583 | |||||||||||||||||
Other debt(c) | 194,737 | — | — | — | — | 194,737 | |||||||||||||||||
Securitization facility(d) | 126,901 | — | — | — | — | 126,901 | |||||||||||||||||
Other Commitments | |||||||||||||||||||||||
Certificates of deposit | 630,879 | 220,353 | 86,512 | — | — | 937,744 | |||||||||||||||||
Minimum volume purchase commitments(e) | 181,428 | 181,428 | — | — | — | 362,856 | |||||||||||||||||
Tax receivable agreement(f) | 9,682 | 8,698 | 1,893 | — | — | 20,273 | |||||||||||||||||
Other(g) | 2,500 | 2,500 | 2,500 | 2,500 | 3,300 | 13,300 | |||||||||||||||||
Total | $ | 1,279,766 | $ | 541,508 | $ | 216,610 | $ | 451,588 | $ | 1,647,779 | $ | 4,137,251 | |||||||||||
(a) Operating leases – We lease office space, office equipment and computer equipment under long-term operating leases, which are recorded in occupancy and equipment or technology leasing and support. See Item 8 - Note 18, Commitments and Contingencies for more information.
(b) Interest payments on term loans – Interest payments are based on effective rates and credit spreads in effect as of December 31, 2017. See Item 8 - Note 13, Financing Debt for more information.
(c) Other debt – This amount consists of participation debt at WEX Bank and debt balances at one of the Company's subsidiaries. Interest payments due were not included as the amount was not material.
(d) Securitization facility – Interest payments due on the securitization facility are not included as the amount was not material.
(e) Minimum volume purchase commitments – One of the Company's subsidiaries is required to purchase a minimum amount of fuel from their suppliers on an annual basis. If the minimum requirement is not fulfilled, they are subject to penalties based on the amount of spend below the minimum annual volume commitment. Starting in 2020, annual volume commitments reset based on prior year volume purchased. The table above represents the Company's annual penalty assuming we purchase no fuel under these commitments after December 31, 2017.
(f) Tax receivable agreement – As a consequence of the Company’s separation from its former parent company in 2005, the tax basis of the Company’s net tangible and intangible assets increased, reducing the amount of tax that the Company would pay in the future to the extent the Company generated taxable income in sufficient amounts. The Company is contractually obligated to remit a portion of any such cash savings to a third party. The estimate of payments owed is reflected as Amounts due under tax receivable agreement on the consolidated balance sheets. See Item 8 - Note 15, Tax Receivable Agreement for more information.
(g) Other – This amount is comprised of future payments due for contractually obligated outsourced information technology services.
Uncertain tax liabilities – The Company has excluded $5,037 in gross unrecognized tax benefits as of December 31, 2017 from the table above due to the uncertainty about the timing of payments to the taxing authority.
56
Off-balance Sheet Arrangements
In addition to the operating leases included in the table above, we have the following off-balance sheet arrangements as of December 31, 2017:
• | Extension of credit to customers – We have entered into commitments to extend credit in the ordinary course of business. We had approximately $6.3 billion of unused commitments to extend credit at December 31, 2017, as part of established customer agreements. These amounts may increase or decrease during 2018 as we increase or decrease credit to customers, subject to appropriate credit reviews, as part of our lending product agreements. Many of these commitments are not expected to be utilized; therefore, we do not believe total unused credit available to customers and customers of strategic relationships represents future cash requirements. We can adjust most of our customers’ credit lines at our discretion at any time. We believe that we can adequately fund actual cash requirements related to these credit commitments through the issuance of certificates of deposit, borrowed federal funds and other debt facilities. |
• | Letters of credit – As of December 31, 2017, we had $27.5 million outstanding in irrevocable letters of credit issued by us in favor of third-party beneficiaries, primarily related to facility lease agreements and virtual card and fuel payment processing activity at our foreign subsidiaries. These irrevocable letters of credit are unsecured and are renewed on an annual basis unless the Company chooses not to renew them. |
• | Accounts receivable factoring – See Item 8 - Note 12, Off-Balance Sheet Arrangements for further information. |
57
Application of Critical Accounting Policies and Estimates
Our discussion and analysis of our financial condition and results of operations are based upon our consolidated financial statements, which have been prepared in accordance with Generally Accepted Accounting Principles. Preparation of these financial statements requires us to make estimates and judgments that affect reported amounts of assets and liabilities, revenue and expenses and related disclosure of contingent assets and liabilities at the date of our financial statements. We continually evaluate our judgments and estimates in determination of our financial condition and operating results. We base our estimates on historical experience and on various other assumptions that we believe to be reasonable under the circumstances, the results of which form the basis for making judgments about the carrying values of assets and liabilities that are not readily apparent from other sources. Estimates are based on information available as of the date of the financial statements and, accordingly, actual results could differ from these estimates, sometimes materially. Critical accounting policies and estimates are defined as those that are both most important to the portrayal of our financial condition and operating results and require management’s most subjective judgments. Our consolidated financial statements are based on the selection and application of critical accounting policies and estimates, the most significant of which are included in the tables below.
Revenue Recognition
Description | Assumptions/Approach Used | Effect if Actual Results Differ from Assumptions | ||
The majority of the Company’s revenues are comprised of transaction-based fees, which are generally calculated based on measures such as: (i) percentage of dollar value of volume processed; (ii) number of transactions processed; or (iii) some combination thereof. In Europe, our Fleet Solutions payment processing revenue is specifically derived from the difference between the negotiated price of the fuel from the supplier and the agreed upon price paid by the fleets. Interchange income is earned from the Company’s suite of card products. Interchange income is a fee paid by a merchant bank to the card-issuing bank through the interchange network. Interchange fees are set by the credit card providers. The Company recognizes interchange income as it is earned. The Company assesses fees for providing ancillary services, such as information products and services, SaaS based fees, professional services and marketing services. Other revenues also include cross-border fees, fees for overnight shipping, certain customized electronic reporting and customer contact services provided on behalf of certain of the Company’s customers. The Company has entered into agreements with major oil companies, fuel retailers and vehicle maintenance providers which provide products and/or services to the Company’s customers. These agreements specify that a transaction is deemed to be captured when the Company has validated that the transaction has no errors and has accepted and posted the data to the Company’s records. The Company recognizes revenues when persuasive evidence of an arrangement exists, the products and services have been provided to the client, the sales price is fixed or determinable and collectability is reasonably assured. | The Company generally records revenue net of costs based on the following criteria: (i) the Company is not the primary obligor in the arrangement; (ii) the Company has no inventory risk; (iii) the Company does not have reasonable latitude with respect to establishing the price for the product; (iv) the Company does not make any changes to the product or have any involvement in the product specifications; and (v) the amount the Company earns for its services is fixed, within a limited range. The Company enters into contracts with certain large customers or strategic relationships that provide for fee rebates tied to performance milestones. Rebates are recorded as a reduction in revenue in the same period that revenue is earned or performance occurs. Rebates and incentives are calculated based on estimated performance and the terms of the related business agreements. Service related revenues are recognized in the period that the work is performed. The Company recognizes SaaS based service fees in the healthcare market for the per-participant per-month fee which is recognized on a monthly basis subsequent to billing being completed. Interchange fees are recorded as received and ancillary service revenue is recognized when the related services have been provided. | In preparing the financial statements, management must make estimates related to the contractual terms, customer performance and sales volume to determine the total amounts recorded as deductions, such as rebates and incentives, from revenue. Management also considers historical results in making such estimates. The actual amounts ultimately paid to the customer may be different from our estimates. Such differences are recorded once they have been determined and have historically not been significant. | ||
58
Reserve for Credit Losses
Description | Assumptions/Approach Used | Effect if Actual Results Differ from Assumptions | ||
The reserve for losses relating to accounts receivable represents management’s estimate of the losses inherent in the Company’s outstanding portfolio of receivables, including losses from skimming fraud. The reserve for credit losses reduces the Company’s accounts receivable balances as reported in its financial statements to the net realizable value. | Management has consistently considered its portfolio of charge card receivables as a large group of smaller balance accounts that it has collectively evaluated for impairment. Reserves for losses on these receivables are primarily based on a model that analyzes specific portfolio statistics, including average charge-off rates for various stages of receivable aging (including: current, 30 days, 60 days, 90 days) over historical periods including average bankruptcy and recovery rates. Receivables are generally written off when they are 150 days past due or declaration of bankruptcy by the customer. The reserve reflects management’s judgment regarding overall reserve adequacy. Management considers whether to adjust the reserve that is calculated by the analytic model based on other factors, such as the actual charge-offs for the preceding reporting periods, expected charge-offs and recoveries for the subsequent reporting periods, a review of accounts receivable balances which become past due, changes in customer payment patterns, known fraudulent activity in the portfolio, as well as leading economic and market indicators. | To the extent historical credit experience is not indicative of future performance, actual loss experience could differ significantly from management’s judgments and expectations, resulting in either higher or lower future provisions for credit losses, as applicable. As of December 31, 2017, we have estimated a reserve for credit losses which is 1.18 percent of the total gross accounts receivable balance. An increase or decrease to this reserve by 0.5 percent would increase or decrease the provision for credit losses for the year by $12.8 million. As of December 31, 2017, 2016 and 2015, our reserve for credit losses in an annual period has ranged from 0.91 percent to 1.18 percent of the total receivable balance. | ||
59
Business Combinations, Acquired Intangible Assets and Goodwill
Description | Assumptions/Approach Used | Effect if Actual Results Differ from Assumptions | ||
Business combinations are accounted for at fair value. The accounting for business combinations requires estimates and judgment as to expectations for future cash flows of the acquired business, and the allocation of those cash flows to identifiable intangible assets, in determining the estimated fair value for assets and liabilities acquired. Goodwill is comprised of the cost of business acquisitions in excess of the fair value assigned to the net tangible and identifiable intangible assets acquired. Goodwill is not amortized but is reviewed for impairment annually, or when events or changes in the business environment indicate that the carrying value of the reporting unit may exceed its fair value. Acquired intangible assets result from the allocation of the cost of an acquisition. These acquired intangibles include assets that amortize, primarily software and customer relationships, and those that do not amortize, specifically trademarks and certain trade names. The annual review of goodwill and non-amortizing intangibles values is performed as of October 1 of each year. | The fair values assigned to tangible and intangible assets acquired and liabilities assumed are based on management’s estimates and assumptions, as well as other information compiled by management, including valuations that utilize customary valuation procedures and techniques. In the fourth quarter of 2017, we elected to bypass the qualitative approach and instead proceeded directly to step one of the two-step impairment test to assess the fair value of all of our reporting units. For the reporting units that carry goodwill balances, our impairment test consists of a comparison of each reporting unit’s carrying value to its estimated fair value. A reporting unit, for the purpose of the impairment test, is one level below the operating segment level. We have three reporting segments that are further broken into several reporting units for the impairment review. The estimated fair value of a reporting unit is primarily based on discounted estimated future cash flows. An appropriate discount rate is used, as well as risk premium for specific business units, based on the Company’s cost of capital or reporting unit-specific economic factors. We generally validate the model through a reconciliation of the fair value of all our reporting units to our overall market capitalization. The assumptions used to estimate the discounted cash flows are based on our best estimates about payment processing fees/interchange rates, sales volumes, costs (including fuel prices), future growth rates, working capital needs, capital expenditures and market conditions over an estimate of the remaining operating period at the reporting unit level. The discount rate at each reporting unit is based on the weighted average cost of capital that is determined by evaluating the risk free rate of return, cost of debt, and expected equity premiums. Non-goodwill intangible assets are considered non-recoverable if the carrying amount exceeds the sum of undiscounted cash flows expected to result from the use of the assets. The recoverability test is based on management’s intended use of the assets. If the asset fails the recoverability test, impairment is measured as the amount by which the carrying amount of the asset group exceeds its fair value. Fair value measurements under FASB Accounting Standards Codification (“ASC”) 820 - Fair Value Measurements and Disclosures, are based on the assumptions of market participants. When determining the fair value of the asset group, entities must consider the highest and best use of the assets from a market-participant perspective. | We review the carrying values of the unamortizing and amortizing assets for impairment annually and whenever events or changes in business circumstances indicate that the carrying amount of an asset may not be recoverable. Such circumstances would include, but are not limited to, a significant decrease in the perceived market price of the intangible, a significant adverse change in the way the asset is being used, or a history of operating or cash flow losses associated with the use of the intangible. Our goodwill resides in multiple reporting units. The profitability of individual reporting units may suffer periodically from downturns in customer demand or other economic factors. Individual reporting units may be more impacted than the Company as a whole. Specifically, during times of economic slowdown, our customers may reduce their expenditures. As a result, demand for the services of one or more of the reporting units could decline which could adversely affect our operations, cash flow, and liquidity and could result in an impairment of goodwill or intangible assets. As of December 31, 2017, the Company had an aggregate of approximately $3,030 million on its consolidated balance sheet related to goodwill and intangible assets of acquired entities. The results of our goodwill impairment test indicate an excess of estimated fair value over the carrying amount for each of our reporting units by a range of approximately $90 million to $2.5 billion. Although no reporting units are deemed at risk of impairment as of December 31, 2017, the potential for impairment exists in the future should actual results deteriorate versus our current expectations. | ||
60
Income Taxes
Description | Assumptions/Approach Used | Effect if Actual Results Differ from Assumptions | ||
In preparing the consolidated financial statements, we calculate income tax expense (benefit) based on our interpretation of the tax laws in the various jurisdictions where we conduct business. This requires us to estimate current tax obligations and to assess temporary differences between the financial statement carrying amounts and the tax bases of assets and liabilities. These differences result in deferred tax assets and liabilities, the net amount of which we show as a line item on the consolidated balance sheet. All or a portion of the benefit of income tax positions is recognized only when we have made a determination that it is more likely than not that the tax position will be sustained upon examination, based upon the technical merits of the position and other factors. For tax positions that are determined as more likely than not to be sustained upon examination, the tax benefit recognized is the largest amount of benefit that is greater than 50% likely of being realized upon ultimate settlement. We must also assess the likelihood that the deferred tax assets will be realized. To the extent we believe that realization is not more likely than not, we establish a valuation allowance. When we establish a valuation allowance or increase this allowance, we generally record a corresponding income tax expense in the consolidated statement of income in the period of the change. Conversely, to the extent circumstances indicate that realization is more likely than not, the valuation allowance is decreased to the amount realizable, which generates an income tax benefit. | Management must make judgments to determine income tax expense (benefit), deferred tax assets and liabilities and any valuation allowance to be recorded against deferred tax assets. During the ordinary course of business, there are many transactions and calculations for which the ultimate tax determination is uncertain. Changes in our estimates occur periodically due to changes in tax rates, changes in business operations, implementation of tax planning strategies, the expiration of relevant statutes of limitations, resolution with taxing authorities of uncertain tax positions and newly enacted statutory, judicial and regulatory guidance. We record a valuation allowance to reduce deferred tax assets to the amount that is more likely than not to be realized. Significant judgment is required in determining valuation allowances. In evaluating the ability to recover deferred tax assets, we consider all available positive and negative evidence including past operating results, the existence of cumulative losses in the most recent years, forecasted earnings, future taxable income, and prudent and feasible tax planning strategies. In establishing a liability for unrecognized tax benefits, assumptions are made in determining whether, and to what extent, a tax position may be sustained. It requires significant management judgment regarding applicable statutes and their related interpretation as they apply to our particular facts and circumstances. | Although we believe that our income tax related judgments and estimates are reasonable, it is possible that our actual results could be different than what we expected, and we may be exposed to a material change in our total income tax expense, tax-related balances, or valuation allowances. Upon income tax audit, any unfavorable tax settlement may require use of our cash and result in an increase in our effective tax rate in the period of settlement. A favorable tax settlement could be recognized as a reduction in our effective tax rate in the period of settlement. | ||
New Accounting Standards
See Item 8 – Note 2, “Recent Accounting Pronouncements” for recently issued accounting standards that have not yet been adopted.
61
ITEM 7A. QUANTITATIVE AND QUALITATIVE DISCLOSURES ABOUT MARKET RISK
The Company is exposed to market risk related to interest rates, foreign currency exchange rates and commodity prices. From time to time, the Company enters into derivative instrument arrangements to manage these risks.
Interest Rate Risk
2016 Credit Agreement
At December 31, 2017, we had variable-rate borrowings of $1.7 billion under our 2016 Credit Agreement. We periodically review our projected borrowings under our 2016 Credit Agreement and the current interest rate environment in order to ascertain whether interest rate swaps should be used to reduce our exposure to interest rate volatility. During 2016 and 2017, we entered into five interest rate swap contracts that mature between December 2018 and December 2022. Collectively, these derivative contracts are intended to fix the future interest payments associated with $1.3 billion of our variable rate borrowings at between 0.896% to 2.212%. See Item 8 – Note 11, Derivative Instruments for more information.
Deposits
At December 31, 2017, WEX Bank had deposits (includes certificates of deposits, interest bearing money market deposits and participation debt) outstanding of $1.2 billion. The deposits are generally short-term in nature. Upon maturity, the deposits will likely be replaced by issuing new deposits to the extent they are needed.
Sensitivity Analysis
The following table presents a sensitivity analysis of the impact of changes in interest rates on our deposits and corporate debt, assuming amounts outstanding, the notional amounts of our interest rate swap agreements, and certificate of deposit maturities in place as of December 31, 2017 remain constant. Actual results may differ materially.
2018 impact of 1.00% increase in interest rates | |||
2016 Credit Agreement | $ | 4,378 | |
Participation agreements | 1,850 | ||
Certificates of deposits | 3,538 | ||
Money market deposits | 2,766 | ||
Foreign Currency Risk
Our exposure to foreign currency fluctuation is due to our financial statements being presented in U.S. dollars and our foreign subsidiaries transacting in currencies other than the U.S. dollar, which results in gains and losses that are reflected in our consolidated statements of operations. We currently do not utilize hedging instruments to mitigate these risks. However, growth in our international operations increases this exposure and we may initiate strategies to hedge certain foreign currency risks in the future.
Commodity Price Risk
We previously used derivative instruments to manage the impact of volatility in North American fuel prices on our earnings. We entered into put and call option contracts (“Options”) based on the wholesale price of unleaded gasoline and retail price of diesel fuel, which settled on a monthly basis through the first quarter of 2016. The Options were intended to lock in a range of prices during any given quarter on a portion of our forecasted earnings subject to fuel price variations. During the fourth quarter of 2014, we suspended purchases under our fuel derivatives program due to unusually low prices in the commodities market. After the first quarter of 2016, we were no longer hedged for changes in fuel prices. Management will continue to monitor the fuel price market and evaluate its alternatives as it relates to this hedging program.
62
ITEM 8. FINANCIAL STATEMENTS AND SUPPLEMENTARY DATA
INDEX TO CONSOLIDATED FINANCIAL STATEMENTS
63
REPORT OF INDEPENDENT REGISTERED PUBLIC ACCOUNTING FIRM
To the Board of Directors and Stockholders of WEX Inc.
South Portland, Maine
Opinion on the Financial Statements
We have audited the accompanying consolidated balance sheets of WEX Inc. and subsidiaries (the "Company”) as of December 31, 2017 and 2016, the related consolidated statements of income, comprehensive income, stockholders' equity, and cash flows, for each of the three years in the period ended December 31, 2017, and the related notes (collectively referred to as the "financial statements”). In our opinion, the financial statements present fairly, in all material respects, the financial position of the Company as of December 31, 2017 and 2016, and the results of its operations and its cash flows for each of the three years in the period ended December 31, 2017, in conformity with accounting principles generally accepted in the United States of America.
We have also audited, in accordance with the standards of the Public Company Accounting Oversight Board (United States) (PCAOB), the Company's internal control over financial reporting as of December 31, 2017, based on criteria established in Internal Control - Integrated Framework (2013) issued by the Committee of Sponsoring Organizations of the Treadway Commission and our report dated March 1, 2018, expressed an unqualified opinion on the Company's internal control over financial reporting.
Basis for Opinion
These financial statements are the responsibility of the Company's management. Our responsibility is to express an opinion on the Company's financial statements based on our audits. We are a public accounting firm registered with the PCAOB and are required to be independent with respect to the Company in accordance with the U.S. federal securities laws and the applicable rules and regulations of the Securities and Exchange Commission and the PCAOB.
We conducted our audits in accordance with the standards of the PCAOB. Those standards require that we plan and perform the audit to obtain reasonable assurance about whether the financial statements are free of material misstatement, whether due to error or fraud. Our audits included performing procedures to assess the risks of material misstatement of the financial statements, whether due to error or fraud, and performing procedures that respond to those risks. Such procedures included examining, on a test basis, evidence regarding the amounts and disclosures in the financial statements. Our audits also included evaluating the accounting principles used and significant estimates made by management, as well as evaluating the overall presentation of the financial statements. We believe that our audits provide a reasonable basis for our opinion.
/s/ Deloitte & Touche LLP
Boston, Massachusetts
March 1, 2018
We have served as the Company's auditor since 2003
64
WEX INC.
CONSOLIDATED BALANCE SHEETS
(in thousands, except per share data)
December 31, | |||||||
2017 | 2016 | ||||||
Assets | |||||||
Cash and cash equivalents | $ | 508,072 | $ | 190,930 | |||
Accounts receivable (net of allowances of $30,207 in 2017 and $21,454 in 2016) | 2,527,840 | 2,054,701 | |||||
Securitized accounts receivable, restricted | 150,235 | 97,417 | |||||
Income taxes receivable | — | 10,765 | |||||
Available-for-sale securities | 23,358 | 23,525 | |||||
Property, equipment and capitalized software (net of accumulated depreciation of $264,928 in 2017 and $228,336 in 2016) | 163,908 | 167,278 | |||||
Deferred income taxes, net | 7,752 | 6,934 | |||||
Goodwill | 1,876,132 | 1,838,441 | |||||
Other intangible assets (net of accumulated amortization of $392,827 in 2017 and $254,142 in 2016) | 1,154,047 | 1,265,468 | |||||
Other assets | 327,831 | 341,638 | |||||
Total assets | $ | 6,739,175 | $ | 5,997,097 | |||
Liabilities and Stockholders’ Equity | |||||||
Accounts payable | $ | 811,362 | $ | 617,118 | |||
Accrued expenses | 323,222 | 331,579 | |||||
Income taxes payable | 1,076 | — | |||||
Deposits | 1,293,854 | 1,118,823 | |||||
Securitized debt | 126,901 | 84,323 | |||||
Revolving line-of-credit facility and term loans, net | 1,707,064 | 1,599,291 | |||||
Deferred income taxes, net | 119,283 | 152,906 | |||||
Notes outstanding, net | 396,269 | 395,534 | |||||
Other debt | 194,737 | 125,755 | |||||
Amounts due under tax receivable agreement | 20,273 | 47,302 | |||||
Other liabilities | 24,576 | 18,719 | |||||
Total liabilities | 5,018,617 | 4,491,350 | |||||
Commitments and contingencies (Note 18) | |||||||
Stockholders’ Equity | |||||||
Common stock $0.01 par value; 175,000 shares authorized; 47,352 shares issued in 2017 and 47,173 in 2016; 43,022 shares outstanding in 2017 and 42,841 in 2016 | 473 | 472 | |||||
Additional paid-in capital | 569,319 | 547,627 | |||||
Retained earnings | 1,404,683 | 1,244,271 | |||||
Accumulated other comprehensive loss | (90,795 | ) | (122,839 | ) | |||
Treasury stock at cost; 4,428 shares in 2017 and 2016 | (172,342 | ) | (172,342 | ) | |||
Total WEX Inc. stockholders' equity | 1,711,338 | 1,497,189 | |||||
Non-controlling interest | 9,220 | 8,558 | |||||
Total stockholders’ equity | 1,720,558 | 1,505,747 | |||||
Total liabilities and stockholders’ equity | $ | 6,739,175 | $ | 5,997,097 | |||
See notes to consolidated financial statements.
65
WEX INC.
CONSOLIDATED STATEMENTS OF INCOME
(in thousands, except per share data)
Year ended December 31, | |||||||||||
2017 | 2016 | 2015 | |||||||||
Revenues | |||||||||||
Payment processing revenue | $ | 569,166 | $ | 520,619 | $ | 495,869 | |||||
Account servicing revenue | 276,570 | 211,012 | 156,693 | ||||||||
Finance fee revenue | 187,582 | 138,940 | 88,993 | ||||||||
Other revenue | 217,230 | 147,889 | 113,082 | ||||||||
Total revenues | $ | 1,250,548 | $ | 1,018,460 | $ | 854,637 | |||||
Expenses | |||||||||||
Salary and other personnel | 363,444 | 286,298 | 234,564 | ||||||||
Restructuring | 7,139 | 7,486 | 9,010 | ||||||||
Service fees | 149,137 | 173,052 | 138,844 | ||||||||
Provision for credit losses | 61,148 | 33,348 | 22,825 | ||||||||
Technology leasing and support | 52,179 | 47,602 | 41,315 | ||||||||
Occupancy and equipment | 27,729 | 25,820 | 20,618 | ||||||||
Depreciation and amortization | 203,724 | 141,651 | 83,077 | ||||||||
Operating interest expense | 24,482 | 12,386 | 5,628 | ||||||||
Cost of hardware and equipment | 4,314 | 3,122 | 3,236 | ||||||||
Impairment charges and asset write-offs | 44,171 | — | — | ||||||||
Gain on divestitures | (20,958 | ) | — | (1,215 | ) | ||||||
Other | 94,769 | 92,567 | 67,942 | ||||||||
Total operating expenses | 1,011,278 | 823,332 | 625,844 | ||||||||
Operating income | 239,270 | 195,128 | 228,793 | ||||||||
Financing interest expense | (107,067 | ) | (113,418 | ) | (46,189 | ) | |||||
Net foreign currency gain (loss) | 29,919 | (7,665 | ) | (5,689 | ) | ||||||
Net unrealized gains on interest rate swap agreements | 1,314 | 12,908 | — | ||||||||
Net realized and unrealized gains on fuel price derivatives | — | 711 | 5,848 | ||||||||
Non-cash adjustments related to tax receivable agreement | 15,259 | (563 | ) | 2,145 | |||||||
Income before income taxes | 178,695 | 87,101 | 184,908 | ||||||||
Income taxes | 19,525 | 29,625 | 75,296 | ||||||||
Net income | 159,170 | 57,476 | 109,612 | ||||||||
Less: Net loss from non-controlling interests | (1,096 | ) | (3,161 | ) | (1,705 | ) | |||||
Net earnings attributable to WEX Inc. | 160,266 | 60,637 | 111,317 | ||||||||
Accretion of non-controlling interest | — | — | (9,413 | ) | |||||||
Net earnings attributable to shareholders | $ | 160,266 | $ | 60,637 | $ | 101,904 | |||||
Net earnings attributable to WEX Inc. per share: | |||||||||||
Basic | $ | 3.73 | $ | 1.49 | $ | 2.63 | |||||
Diluted | $ | 3.72 | $ | 1.48 | $ | 2.62 | |||||
Weighted average common shares outstanding: | |||||||||||
Basic | 42,977 | 40,809 | 38,771 | ||||||||
Diluted | 43,105 | 40,914 | 38,843 | ||||||||
See notes to consolidated financial statements.
66
WEX INC.
CONSOLIDATED STATEMENTS OF COMPREHENSIVE INCOME
(in thousands)
Year ended December 31, | |||||||||||
2017 | 2016 | 2015 | |||||||||
Net income | $ | 159,170 | $ | 57,476 | $ | 109,612 | |||||
Changes in available-for-sale securities, net of tax benefit of $3 in 2017, $144 in 2016 and $49 in 2015 | (5 | ) | (251 | ) | (83 | ) | |||||
Foreign currency translation | 33,692 | (19,855 | ) | (49,952 | ) | ||||||
Comprehensive income | 192,857 | 37,370 | 59,577 | ||||||||
Less: Comprehensive income (loss) attributable to non-controlling interest | 547 | (3,879 | ) | (7,979 | ) | ||||||
Comprehensive income attributable to WEX Inc. | $ | 192,310 | $ | 41,249 | $ | 67,556 | |||||
See notes to consolidated financial statements.
67
WEX INC.
CONSOLIDATED STATEMENTS OF STOCKHOLDERS’ EQUITY
(in thousands)
Common Stock Issued | Additional Paid-in Capital | Accumulated Other Comprehensive Loss | Treasury Stock | Retained Earnings | Non-Controlling Interest | Total Stockholders' Equity | ||||||||||||||||||||||||
Shares | Amount | |||||||||||||||||||||||||||||
Balance at December 31, 2014 | 43,021 | $ | 430 | $ | 179,077 | $ | (50,581 | ) | $ | (150,331 | ) | $ | 1,081,730 | $ | 17,396 | $ | 1,077,721 | |||||||||||||
Stock issued upon exercise of stock options | 3 | — | 33 | — | — | — | — | 33 | ||||||||||||||||||||||
Tax benefit from stock options and restricted stock units | — | — | 650 | — | — | — | — | 650 | ||||||||||||||||||||||
Stock issued upon vesting of restricted and deferred stock units | 55 | 1 | (1 | ) | — | — | — | — | — | |||||||||||||||||||||
Stock-based compensation, net of share repurchases for tax withholdings | — | — | 9,140 | — | — | — | — | 9,140 | ||||||||||||||||||||||
Purchase of shares of treasury stock | — | — | — | — | (22,011 | ) | — | — | (22,011 | ) | ||||||||||||||||||||
Changes in available-for-sale securities, net of tax benefit of $49 | — | — | — | (83 | ) | — | — | — | (83 | ) | ||||||||||||||||||||
Adjustment of redeemable non-controlling interest | — | — | (13,927 | ) | (9,108 | ) | — | (9,413 | ) | — | (32,448 | ) | ||||||||||||||||||
Foreign currency translation | — | — | — | (43,679 | ) | — | — | (2,063 | ) | (45,742 | ) | |||||||||||||||||||
Net income (loss) | — | — | — | — | — | 111,317 | (2,896 | ) | 108,421 | |||||||||||||||||||||
Balance at December 31, 2015 | 43,079 | 431 | 174,972 | (103,451 | ) | (172,342 | ) | 1,183,634 | 12,437 | 1,095,681 | ||||||||||||||||||||
Stock issued upon exercise of stock options | 21 | — | 300 | — | — | — | — | 300 | ||||||||||||||||||||||
Tax deficiency from stock options and restricted stock units | — | — | (100 | ) | — | — | — | — | (100 | ) | ||||||||||||||||||||
Stock issued upon vesting of restricted and deferred stock units | 61 | 1 | (1 | ) | — | — | — | — | — | |||||||||||||||||||||
Stock-based compensation, net of share repurchases for tax withholdings | — | — | 17,543 | — | — | — | — | 17,543 | ||||||||||||||||||||||
Stock issued for July 1, 2016 purchase of EFS | 4,012 | 40 | 354,913 | — | — | — | — | 354,953 | ||||||||||||||||||||||
Changes in available-for-sale securities, net of tax benefit of $144 | — | — | — | (251 | ) | — | — | — | (251 | ) | ||||||||||||||||||||
Foreign currency translation | — | — | — | (19,137 | ) | — | — | (718 | ) | (19,855 | ) | |||||||||||||||||||
Net income (loss) | — | — | — | — | — | 60,637 | (3,161 | ) | 57,476 | |||||||||||||||||||||
Balance at December 31, 2016 | 47,173 | 472 | 547,627 | (122,839 | ) | (172,342 | ) | 1,244,271 | 8,558 | 1,505,747 | ||||||||||||||||||||
Cumulative-effect adjustment 1 | — | — | — | — | — | 261 | — | 261 | ||||||||||||||||||||||
Other | — | — | — | — | — | (115 | ) | 115 | — | |||||||||||||||||||||
Stock issued upon exercise of stock options | 12 | — | 733 | — | — | — | — | 733 | ||||||||||||||||||||||
Stock issued upon vesting of restricted and deferred stock units | 166 | 1 | (1 | ) | — | — | — | — | — | |||||||||||||||||||||
Stock-based compensation, net of share repurchases for tax withholdings | 1 | — | 20,960 | — | — | — | — | 20,960 | ||||||||||||||||||||||
Changes in available-for-sale securities, net of tax benefit of $3 | — | — | — | (5 | ) | — | — | — | (5 | ) | ||||||||||||||||||||
Foreign currency translation | — | — | — | 32,049 | — | — | 1,643 | 33,692 | ||||||||||||||||||||||
Net income | — | — | — | — | — | 160,266 | (1,096 | ) | 159,170 | |||||||||||||||||||||
Balance at December 31, 2017 | 47,352 | $ | 473 | $ | 569,319 | $ | (90,795 | ) | $ | (172,342 | ) | $ | 1,404,683 | $ | 9,220 | $ | 1,720,558 | |||||||||||||
1 Includes the impact of modified retrospective transition as part of the Company's ASU 2016-09 adoption to recognize previously disallowed excess tax benefits that increased a net operating loss.
See notes to consolidated financial statements.
68
WEX INC.
CONSOLIDATED STATEMENTS OF CASH FLOWS
(in thousands)
Year ended December 31, | |||||||||||
2017 | 2016 | 2015 | |||||||||
Cash flows from operating activities | |||||||||||
Net income | $ | 159,170 | $ | 57,476 | $ | 109,612 | |||||
Adjustments to reconcile net income to net cash provided by operating activities: | |||||||||||
Net unrealized loss (gain) | 8,109 | (26,478 | ) | 16,201 | |||||||
Stock-based compensation | 30,487 | 19,742 | 12,420 | ||||||||
Depreciation and amortization | 203,724 | 141,651 | 83,077 | ||||||||
Ticking fees expensed | — | 30,045 | — | ||||||||
Debt restructuring and debt issuance cost amortization | 7,957 | 12,673 | 3,097 | ||||||||
Gain on divestiture | (20,958 | ) | — | (1,215 | ) | ||||||
Deferred income taxes | (888 | ) | 19,499 | 37,359 | |||||||
Provision for credit losses | 61,148 | 33,348 | 22,825 | ||||||||
Impairment charges and asset write-offs | 44,171 | — | — | ||||||||
Non-cash adjustments related to tax receivable agreement | (15,259 | ) | — | — | |||||||
Changes in operating assets and liabilities, net of effects of acquisitions: | |||||||||||
Accounts receivable | (542,017 | ) | (436,071 | ) | 199,717 | ||||||
Other assets | 503 | (63,730 | ) | (17,653 | ) | ||||||
Accounts payable | 194,542 | 75,807 | (33,201 | ) | |||||||
Accrued expenses | (2,378 | ) | 1,669 | 16,594 | |||||||
Income taxes | 11,507 | (14,614 | ) | 10,687 | |||||||
Other liabilities | 4,900 | 8,086 | (2,322 | ) | |||||||
Amounts due under tax receivable agreement | (11,769 | ) | (10,234 | ) | (12,098 | ) | |||||
Net cash provided by (used for) operating activities | 132,949 | (151,131 | ) | 445,100 | |||||||
Cash flows from investing activities | |||||||||||
Purchases of property, equipment and capitalized software | (79,276 | ) | (61,799 | ) | (63,491 | ) | |||||
Purchases of available-for-sale securities | (474 | ) | (5,853 | ) | (349 | ) | |||||
Maturities of available-for-sale securities | 631 | 495 | 594 | ||||||||
Acquisitions and investment, net of cash | (114,282 | ) | (1,089,282 | ) | (80,677 | ) | |||||
Acquisition of an intangible asset | — | (4,000 | ) | — | |||||||
Proceeds from divestitures | 29,900 | — | 17,265 | ||||||||
Net cash used for investing activities | (163,501 | ) | (1,160,439 | ) | (126,658 | ) | |||||
Cash flows from financing activities | |||||||||||
Excess tax benefits from equity instrument share-based payment arrangements | — | 597 | 650 | ||||||||
Repurchase of share-based awards to satisfy tax withholdings | (9,527 | ) | (2,200 | ) | (2,392 | ) | |||||
Proceeds from stock option exercises | 733 | 300 | 33 | ||||||||
Net change in deposits | 173,052 | 248,926 | (107,345 | ) | |||||||
Net activity on other debt | 68,525 | 62,474 | (435 | ) | |||||||
Borrowings on revolving line-of-credit facility | 4,367,168 | 3,505,732 | 2,203,027 | ||||||||
Repayments on revolving line-of-credit facility | (4,239,241 | ) | (3,707,248 | ) | (2,402,118 | ) | |||||
Borrowings on term loans | — | 1,643,000 | — | ||||||||
Repayments on term loans | (34,750 | ) | (476,126 | ) | (27,500 | ) | |||||
Loan origination fees | (985 | ) | (40,868 | ) | — | ||||||
Net change in securitized debt | 34,410 | 3,665 | 84,571 | ||||||||
Ticking fees paid | — | (22,171 | ) | — | |||||||
Purchase of redeemable non-controlling interest | — | — | (46,018 | ) | |||||||
Purchase of shares of treasury stock | — | — | (22,011 | ) | |||||||
Net cash provided by (used for) financing activities | 359,385 | 1,216,081 | (319,538 | ) | |||||||
Effect of exchange rates on cash and cash equivalents | (11,691 | ) | 6,430 | (3,678 | ) | ||||||
Net change in cash and cash equivalents | 317,142 | (89,059 | ) | (4,774 | ) | ||||||
69
Cash and cash equivalents, beginning of year | 190,930 | 279,989 | 284,763 | ||||||||
Cash and cash equivalents, end of year | $ | 508,072 | $ | 190,930 | $ | 279,989 | |||||
Supplemental cash flow information | |||||||||||
Interest paid | $ | 128,888 | $ | 116,272 | $ | 49,032 | |||||
Income taxes paid | $ | 6,679 | $ | 23,946 | $ | 27,186 | |||||
Supplemental disclosure of non-cash investing and financing activities | |||||||||||
Capital expenditures incurred but not paid | $ | 4,596 | $ | 10,900 | $ | 5,446 | |||||
Issuance of common stock in a business combination | $ | — | $ | 354,953 | $ | — | |||||
See notes to consolidated financial statements.
70
WEX INC.
NOTES TO CONSOLIDATED FINANCIAL STATEMENTS
(in thousands, except per share data)
1. | Summary of Significant Accounting Policies |
Business Description
WEX Inc. (“Company”, "we" or "our”) is a provider of corporate card payment solutions. The Company provides products and services that meet the needs of businesses in various geographic regions including North and South America, Asia Pacific and Europe. The Company’s Fleet Solutions, Travel and Corporate Solutions, and Health and Employee Benefit Solutions segments provide their customers with security and control for complex payments across a wide spectrum of business sectors. The Company markets its products and services directly, as well as through strategic relationships which include major oil companies, fuel retailers, vehicle maintenance providers, online travel agencies and health partners.
Basis of Presentation
The accompanying consolidated financial statements of the Company for the years ended December 31, 2017, 2016 and 2015, include the accounts of the Company and its wholly and majority-owned subsidiaries. All intercompany accounts and transactions have been eliminated in consolidation.
The Company rounds amounts in the consolidated financial statements to thousands and calculates all percentages and per-share data from underlying whole-dollar amounts. Thus, certain amounts may not foot, crossfoot, or recalculate based on reported numbers due to rounding.
Use of Estimates and Assumptions
The Company prepares its consolidated financial statements in conformity with GAAP and with the Rules and Regulations of the SEC, specifically Regulation S-X and the instructions to Form 10-K. These principles require management to make estimates and assumptions that affect the reported amounts of assets and liabilities and the disclosures of contingent assets and liabilities as of the date of the financial statements and the reported amounts of revenue and expenses during the period. Actual results could differ from those estimates and those differences may be material.
Cash and Cash Equivalents
Highly liquid investments with remaining maturities at the time of purchase of three months or less (that are readily convertible to cash) are considered to be cash equivalents and are stated at cost, which approximates fair value. Cash equivalents include federal funds sold, which are unsecured short-term investments entered into with financial institutions.
Restricted Cash
Restricted cash represents funds collected from individuals or employers on behalf of our customers that are to be remitted to third parties or funds required to be maintained on hand under certain vendor agreements. This restricted cash, which is not available to fund the Company’s operations, totaled $18,866 and $22,412 as of December 31, 2017 and 2016, respectively, and is classified in other assets on the Company’s consolidated balance sheets. We maintain an offsetting liability against restricted cash collected and remitted on behalf of our customers.
Accounts Receivable, Net of Allowances
Accounts receivable is stated at net realizable value. The balance includes a reserve for credit losses which reflects management’s estimate of uncollectable balances resulting from credit and fraud losses. Management has consistently considered its portfolio of charge card receivables as a large group of smaller balance accounts that it has collectively evaluated for impairment. The reserve for credit losses is established based on the determination of the amount of expected credit losses inherent in the accounts receivable as of the reporting date. Management reviews delinquency reports, historical collection rates, changes in customer payment patterns, economic trends, geography and other information in order to make judgments as to probable credit losses. Management also uses historical charge off experience to determine the amount of losses inherent in accounts receivable at the reporting date. Assumptions regarding probable credit losses are reviewed periodically and may be impacted by actual performance of accounts receivable and changes in any of the factors discussed above. The balance also includes a reserve for waived finance fees, which is used to maintain customer goodwill and recorded against the late fee revenue recognized.
71
WEX INC.
NOTES TO CONSOLIDATED FINANCIAL STATEMENTS (continued)
(in thousands, except per share data)
Available-for-sale Securities
The Company records certain investments as available-for-sale securities. Available-for-sale securities are carried at fair value, with unrealized gains and losses, net of tax, reported on the consolidated balance sheets in accumulated other comprehensive loss. Realized gains and losses and declines in fair value determined to be other-than-temporary are included in non-operating expenses. The cost basis of securities is based on the specific identification method. Interest and dividends earned on securities classified as available-for-sale are included in other revenue. Available-for-sale securities held by the Company were purchased and are held by WEX Bank in order to meet the requirements of the Community Reinvestment Act.
Derivatives
From time to time, the Company utilizes derivative instruments as part of its overall strategy to manage its exposure to fluctuations in fuel prices and to reduce the impact of interest and foreign currency exchange rate volatility. The Company's derivative instruments are recorded at fair value on the consolidated balance sheets. The Company’s derivative instruments have not been designated as hedges; therefore, both realized and unrealized gains and losses are recognized in earnings. For the purposes of cash flow presentation, realized and unrealized gains or losses are included within cash flows from operating activities.
Property and Equipment
Property and equipment are stated at cost, net of accumulated depreciation. Replacements, renewals and improvements are capitalized and costs for repair and maintenance are expensed as incurred. Depreciation is primarily computed using the straight-line method over the estimated useful lives shown below.
Below are the estimated useful lives for assets placed in service during 2017 and beyond:
Estimated Useful Lives | |
Furniture, fixtures and equipment | 3 to 5 years |
Internal-use computer software | 1.5 to 7 years |
Computer software | 3 years |
Leasehold improvements(a) | up to 5 years |
(a) Leasehold improvements are primarily depreciated using the straight-line method over the lesser of the useful life of the asset or the remaining lease term.
Capitalized Software
The Company develops software that is used to provide processing and information management services to customers. A significant portion of the Company’s capital expenditures is devoted to the development of such internal-use computer software. Costs incurred during the preliminary project stage are expensed as incurred. Software development costs are capitalized during the application development stage. Capitalization begins when the preliminary project stage is complete, as well as when management authorizes and commits to the funding of the project. Capitalization of costs ceases when the software is ready for its intended use. Costs related to maintenance of internal-use software are expensed as incurred. Software development costs are amortized using the straight-line method over the estimated useful life of the software.
Below are the amounts of internal-use software capitalized and amortized:
Year ended December 31, | |||||||||||
2017 | 2016 | 2015 | |||||||||
Amounts capitalized for internal-use computer software (including work-in-process) | $ | 50,682 | $ | 55,379 | $ | 52,218 | |||||
Amounts expensed for amortization of internal-use computer software | $ | 32,582 | $ | 27,581 | $ | 20,316 | |||||
Goodwill and Other Intangible Assets
The Company classifies intangible assets in the following three categories: (1) intangible assets with definite lives subject to amortization, (2) intangible assets with indefinite lives not subject to amortization and (3) goodwill. The Company tests intangible assets with definite lives for impairment if conditions exist that indicate the carrying value may not be recoverable. Such conditions may include a reduction in operating cash flow or a dramatic change in the manner in which the asset is intended to be used. The Company records an impairment charge when the carrying value of the definite-lived intangible asset is not recoverable from the undiscounted cash flows generated from the use of the asset.
72
WEX INC.
NOTES TO CONSOLIDATED FINANCIAL STATEMENTS (continued)
(in thousands, except per share data)
Intangible assets with indefinite lives and goodwill are not amortized. The Company tests these intangible assets and goodwill for impairment at least annually or more frequently if facts or circumstances indicate that such intangible assets or goodwill might be impaired. All goodwill and intangible assets are assigned to reporting units, which are one level below the Company’s operating segments. The Company performs impairment tests at the reporting unit level. Such impairment tests include comparing the fair value of the respective reporting unit with its carrying value, including goodwill. The Company uses both discounted cash flow analyses and comparable company pricing multiples to determine the fair value of our reporting units. Such analyses are corroborated using market analytics. Certain assumptions are used in determining the fair value, including assumptions about future cash flows and terminal values. When appropriate, the Company considers the assumptions that it believes hypothetical marketplace participants would use in estimating future cash flows. In addition, an appropriate discount rate is used, based on the Company’s cost of capital or reporting unit-specific economic factors. When the fair value is less than the carrying value of the intangible assets or the reporting unit, the Company records an impairment charge to reduce the carrying value of the assets to the reporting unit's implied fair value. The Company's annual goodwill and intangible asset impairment tests performed as of October 1, 2017, 2016 and 2015 did not identify any impairment.
Intangible assets that are deemed to have definite lives are amortized over their useful lives, which is the period of time that the asset is expected to contribute directly or indirectly to future cash flows. The Company determines the useful lives of its identifiable intangible assets after considering the specific facts and circumstances related to each intangible asset. The factors that management considers when determining useful lives include the contractual term of agreements, the history of the asset, the Company’s long-term strategy for the use of the asset, any laws or other local regulations which could impact the useful life of the asset and other economic factors, including competition and specific market conditions. An evaluation of the remaining useful lives of the definite-lived intangible assets is performed periodically to determine if any change is warranted.
Impairment and Disposals of Assets
Long-lived assets are tested for impairment whenever facts or circumstances, such as a reduction in operating cash flow or a dramatic change in the manner the asset is intended to be used, indicate the carrying amount of the asset may not be recoverable. The Company compares the estimated undiscounted future cash flows associated with these assets or operations to their carrying value to determine if a write-down to fair value is required.
During 2017, the Company impaired certain software currently under development for payment processing and prepaid services related to technology outsourcing as these items were determined to have no future benefit. See Note 22, Impairment and Restructuring Activities, for further discussion. The Company did not recognize any significant impairment expense on the Company’s assets during the years ended December 31, 2016 and 2015. Disposals in the ordinary course of business are recorded in occupancy and equipment in the consolidated statements of income.
Fair Value of Financial Instruments
The Company holds mortgage-backed securities, fixed-income securities, derivatives (see Note 11, Derivative Instruments) and certain other financial instruments that are carried at fair value. The Company determines fair value based upon quoted prices when available or through the use of alternative approaches, such as model pricing, when market quotes are not readily accessible or available. Various factors are considered in determining the fair value of the Company’s obligations, including: closing exchange or over-the-counter market price quotations; time value and volatility factors underlying options and derivatives; price activity for equivalent instruments; and the Company’s own-credit standing.
These valuation techniques may be based upon observable and unobservable inputs. Observable inputs reflect market data obtained from independent sources, while unobservable inputs reflect the Company’s market assumptions. These two types of inputs create the following fair value hierarchy:
• | Level 1 – Quoted prices for identical instruments in active markets. |
• | Level 2 – Quoted prices for similar instruments in active markets; quoted prices for identical or similar instruments in markets that are not active; and model-derived valuations whose inputs are observable or whose significant value drivers are observable. |
• | Level 3 – Instruments whose significant value drivers are unobservable. |
Assets and liabilities measured at fair value are classified in their entirety based on the lowest level of input that is significant to the fair value measurement. Our assessment of the significance of a particular input to the fair value measurement in its entirety requires judgment and considers factors specific to the asset or liability.
73
WEX INC.
NOTES TO CONSOLIDATED FINANCIAL STATEMENTS (continued)
(in thousands, except per share data)
The carrying values of cash and cash equivalents, accounts receivable, accounts payable, accrued expenses, and other liabilities approximate their respective fair values due to the short-term nature of such instruments. The carrying values of certificates of deposit, interest-bearing money market deposits and borrowed federal funds approximate their respective fair values as the interest rates on these financial instruments are variable market-based rates. All other financial instruments are reflected at fair value on the consolidated balance sheets.
Revenue Recognition
The majority of the Company’s revenues are comprised of transaction-based fees, which are generally calculated based on measures such as (i) percentage of dollar value of volume processed; (ii) number of transactions processed; or (iii) some combination thereof. The Company has entered into agreements with major oil companies, fuel retailers, vehicle maintenance providers, online travel agencies and health partners which provide products and/or services to the Company’s customers. These agreements specify that a transaction is deemed to be captured when the Company has validated that the transaction has no errors and has accepted and posted the data to the Company’s records. The Company recognizes revenues when persuasive evidence of an arrangement exists, the products and services have been provided to the client, the sales price is fixed or determinable and collectability is reasonably assured.
The Company generally records revenue net of costs based on the following criteria: (i) the Company is not the primary obligor in the arrangement; (ii) the Company has no inventory risk; (iii) the Company does not have reasonable latitude with respect to establishing the price for the product; (iv) the Company does not make any changes to the product or have any involvement in the product specifications; and, (v) the amount the Company earns for its services is fixed, within a limited range.
The Company enters into contracts with certain large customers or strategic relationships that provide for fee rebates tied to performance milestones. Rebates are recorded as a reduction in revenue in the same period that revenue is earned or performance occurs. Rebates and incentives are calculated based on estimated performance and the terms of the related business agreements.
A description of the major components of revenue are as follows:
Payment Processing Revenue. Revenue consists of transaction fees as well as interchange income:
• | Fleet transaction fees are assessed to major oil companies, fuel retailers and vehicle maintenance providers. We extend short-term credit to the fleet customer and pay the purchase price for the fleet customer’s transaction, less the payment processing fees we retain, to the merchant. We collect the total purchase price from the fleet customer. The fee charged is generally based upon a percentage of the total transaction amount; however, it may also be based on a fixed amount charged per transaction or on a combination of both measures. The Company records revenue at the time the transaction is captured. |
• | In Europe, our fleet payment processing revenue is specifically derived from the difference between the negotiated price of the fuel from the supplier and the agreed upon price paid by the fleets. |
• | Interchange income is earned from the Company’s suite of card products in the Fleet Solutions and Health and Employee Benefit Solutions segments, as well as on our virtual card technology. Interchange income is a fee paid by a merchant bank to the card-issuing bank through the interchange network. Interchange fees are set by the credit card providers. The Company recognizes interchange income as earned. |
With regard to fleet and travel payment processing revenue, the Company is generally responsible for the collection of the total transaction amount from the customer and the payment to the merchant of their sales amount, net of the payment processing revenue earned by the Company, and as such, recognizes revenue net of the cost of the underlying products and services. As a consequence, the Company’s accounts receivable and accounts payable related to its payment processing revenues are reflective of the total transaction amount processed by the Company, not the Company’s revenue.
Account Servicing Revenue. In our Fleet Solutions segment, account servicing revenue is primarily comprised of monthly fees based on vehicles serviced. These fees are primarily in return for providing monthly vehicle data reports. In our Health and Employee Benefit Solutions segment, we also recognize account servicing fees for the per-participant per-month fee charged per consumer on our healthcare financial technology platform. Account servicing revenue is recognized monthly, as the Company fulfills its contractual service obligations.
Finance Fees. The Company earns revenue by assessing monthly finance fees on accounts with overdue balances. These fees are recognized as revenue at the time the fees are assessed. The finance fee is calculated using a stated late fee rate based on
74
WEX INC.
NOTES TO CONSOLIDATED FINANCIAL STATEMENTS (continued)
(in thousands, except per share data)
the entire balance outstanding from the customer or a minimum, whichever is higher. On occasion, these fees are waived to maintain customer goodwill. The Company’s established reserve for such waived amounts is estimated and offset against the late fee revenue recognized. These waived fees amounted to approximately $16,900, $10,900 and $6,000 in 2017, 2016 and 2015, respectively. The Company engages in factoring, the purchase of accounts receivable from a third party at a discount. Revenue earned in this transaction is recorded in finance fees. We also recognize fees for interest associated with the Company’s fuel desk product and revenue earned on the Company’s foreign salary advance product.
Other. The Company earns transaction fees, which are principally based on the number of transactions processed; however, the fees may be a percentage of the total transaction amount. These fees are recognized at the time the transaction is captured.
The Company assesses fees for providing ancillary services, such as information products and services, professional services and marketing services. Other revenues also include international settlement fees, fees for overnight shipping, certain customized electronic reporting and customer contact services provided on behalf of certain of the Company’s customers. Service related revenues are recognized in the period that the work is performed.
Interest and dividends earned on investments in available-for-sale securities are included in other revenues. Such income is recognized in the period that it is earned.
The Company sells telematics devices as part of its WEX Telematics program. The Company recognizes revenue from these sales when the customer has accepted delivery of the product and collectability of the sales amount is reasonably assured.
From time to time the Company enters into agreements with suppliers, partners and customers and offers incentives to establish access to new channels, enter new market segments and expand the use and acceptance of WEX products and services. As part of these agreements the Company may agree to pay an up-front bonus or fee. The Company capitalizes these payments within other assets in the consolidated balance sheets and amortizes each monthly, generally on a straight-line basis against the related revenue earned throughout the life of the agreement.
Stock-Based Compensation
The Company recognizes the fair value of all stock-based payments to employees in its financial statements. The Company estimates the fair value of service-based stock option awards and market performance-based stock option awards on the grant date using a Black-Scholes-Merton valuation model and a Monte Carlo simulation model, respectively. The fair value of Restricted Stock Units (“RSUs”), including Performance Based Restricted Stock Units (“PBRSUs”), is determined and fixed on the grant date based on the Company's stock price.
Stock-based compensation expense is net of estimated forfeitures and is recorded over each award's requisite service period. The Company uses the straight-line methodology for recognizing the expense associated with service-based stock options and RSU grants and a graded-vesting methodology for the expense recognition of market performance-based stock options and PBRSUs.
Stock-based compensation is recorded in salary and other personnel expense in the consolidated statements of income.
Advertising Costs
Advertising and marketing costs are expensed in the period incurred. During the years ended December 31, 2017, 2016 and 2015, advertising expense was $17,141, $14,864 and $12,891, respectively.
Income Taxes
Income taxes are accounted for under the asset and liability method. Under this method, deferred tax assets and liabilities are recognized for the future tax consequences attributable to differences between the financial statement carrying amounts of existing assets and liabilities and their respective tax bases. Deferred tax assets and liabilities are measured using enacted tax rates expected to apply to taxable income in the years in which those temporary differences are expected to be recovered or settled. The effect on deferred tax assets and liabilities of a change in tax rates is recognized in the period that includes the enactment date.
The ultimate realization of deferred tax assets is dependent upon the generation of future taxable income during the periods in which the associated temporary differences became deductible. A valuation allowance is established for those jurisdictions in which deferred tax assets realization is deemed less than more likely than not.
75
WEX INC.
NOTES TO CONSOLIDATED FINANCIAL STATEMENTS (continued)
(in thousands, except per share data)
Current accounting guidance prescribes a recognition threshold and measurement attribute for the financial statement recognition and measurement of a tax position taken or expected to be taken in a tax return. This accounting guidance also provides guidance on derecognition, classification, interest and penalties, accounting in the interim periods, disclosure, and transition. Penalties and interest related to uncertain tax positions are recognized as a component of income tax expense. To the extent penalties and interest are not assessed with respect to uncertain tax positions, amounts accrued are reduced and reflected as a reduction of the overall income tax provision.
Earnings per Share
Basic earnings per share is computed by dividing net earnings attributable to shareholders by the weighted average number of shares of common stock and vested deferred stock units (“DSUs”) outstanding during the year. The computation of diluted earnings per share is similar to the computation of basic earnings per share, except that the denominator is increased for the assumed exercise of dilutive options and assumed issuance of unvested RSUs and DSUs and unvested PBRSUs for which the performance condition has been met as of the date of determination using the treasury stock method unless the effect is anti-dilutive. The treasury stock method assumes that proceeds, including cash received from the exercise of employee stock options and the total unrecognized compensation expense for unvested share-based compensation awards, would be used to purchase the Company's common stock at the average market price during the period. Prior to the January 2017 adoption of ASU 2016-09, the treasury stock method also included excess tax benefits in its proceeds calculation.
The following table summarizes net earnings attributable to shareholders and reconciles basic and diluted shares outstanding used in the earnings per share computations:
Year ended December 31, | |||||||||||
2017 | 2016 | 2015 | |||||||||
Net earnings attributable to shareholders | $ | 160,266 | $ | 60,637 | $ | 101,904 | |||||
Weighted average common shares outstanding – Basic | 42,977 | 40,809 | 38,771 | ||||||||
Dilutive impact of share based compensation awards | 128 | 105 | 72 | ||||||||
Weighted average common shares outstanding – Diluted | 43,105 | 40,914 | 38,843 | ||||||||
Foreign Currency Movement
The financial statements of the Company’s foreign subsidiaries, where the local currency is the functional currency, are
translated to U.S. dollars using year-end spot exchange rates for assets and liabilities, average exchange rates for revenue and expenses and historical exchange rates for equity transactions. The resulting foreign currency translation adjustment is recorded as a component of accumulated other comprehensive loss.
translated to U.S. dollars using year-end spot exchange rates for assets and liabilities, average exchange rates for revenue and expenses and historical exchange rates for equity transactions. The resulting foreign currency translation adjustment is recorded as a component of accumulated other comprehensive loss.
Realized and unrealized gains and losses on foreign currency transactions as well as the re-measurement of the Company's cash, receivable and payable balances that are denominated in foreign currencies, are recorded directly in net foreign currency gain (loss) in the consolidated statements of income. However, gains or losses resulting from intercompany transactions where repayment is not anticipated for the foreseeable future are not recognized in the consolidated statements of income. In these situations, the gains or losses are deferred and included as a component of accumulated other comprehensive loss. In addition, gains and losses associated with the Company's foreign currency exchange derivatives are recorded in net foreign currency gain (loss) in the consolidated statements of income.
Accumulated Other Comprehensive Loss
Accumulated other comprehensive loss includes unrealized gains and losses on available-for-sale securities and foreign currency translation adjustments pertaining to the net investment in foreign operations. Amounts are recognized net of tax to the extent applicable. Realized gains or losses on securities transactions are classified as non-operating in the consolidated statements of income.
76
WEX INC.
NOTES TO CONSOLIDATED FINANCIAL STATEMENTS (continued)
(in thousands, except per share data)
2. | Recent Accounting Pronouncements |
The following table provides a brief description of recent accounting pronouncements that could have a material effect on our financial statements:
Standard | Description | Date/Method of Adoption | Effect on financial statements or other significant matters | |||
Adopted During the Year Ended December 31, 2017 | ||||||
Accounting Standards Update (“ASU”) 2016-09 Compensation-Stock Compensation (Topic 718): Improvements to Employee Share-Based Payment Accounting | This standard simplifies several aspects of accounting for employee share-based payment transactions, including the accounting for income taxes, forfeitures, statutory tax withholding requirements, and classification in the statement of cash flows. | January 1, 2017 | Prior to the adoption of this guidance, the Company used the "with and without" method to determine when excess tax benefits were realized. As a result of certain US net operating loss carryforwards, excess tax benefits to date have not reduced taxes paid and therefore were not previously recognized in our financial statements. This standard required prospective recognition of all the tax effects related to share-based payments in the income statement. The impact of adoption was recorded as a cumulative effect adjustment to retained earnings of $261. For the year ended December 31, 2017, the Company recognized approximately $1,600 of excess tax benefits within our income tax provision. The Company has elected to prospectively classify these excess tax benefits as cash flows from operating activities effective January 1, 2017. The Company will continue to estimate the number of awards expected to vest, rather than electing to account for forfeitures as they occur. Adoption of this standard has not impacted the Company's minimum statutory tax withholding practices. | |||
ASU 2017-09 Compensation—Stock Compensation (Topic 718): Scope of Modification Accounting | This standard clarifies when a change to the terms or conditions of a share-based payment award must be accounted for as a modification. Under the new guidance, an entity will not apply modification accounting to a share-based payment award if there is no change to the award’s fair value, vesting conditions and classification as an equity or liability instrument. | The Company elected to early adopt this standard effective July 1, 2017. | The adoption has not impacted the Company's consolidated financial statements and related disclosures. | |||
Not Yet Adopted as of December 31, 2017 | ||||||
ASU 2016-18 Statement of Cash Flows (Topic 230): Restricted Cash | This standard clarifies the classification and presentation of restricted cash in the statement of cash flows. The statement of cash flows must explain the change during the period in the total of cash and cash equivalents and amounts described as restricted cash or cash equivalents. | The standard is effective for annual reporting periods beginning after December 15, 2017, including interim periods within those fiscal years, and requires retrospective application to all periods presented. Early adoption is permitted. | Upon adoption, restricted cash will be included in cash and restricted cash equivalents when reconciling the beginning of year and end of year amounts presented on the consolidated statements of cash flows. Restricted cash totaled $18,866 and $22,412 as of December 31, 2017 and 2016, respectively, and is recorded in other assets on the consolidated balance sheets. | |||
ASU 2016-13 Financial Instruments-Credit Losses (Topic 326): Measurement of Credit Losses on Financial Instruments | This standard requires financial assets measured at amortized cost basis to be presented at the net amount expected to be collected. The measurement of expected credit losses will be based on historical experience, current conditions, and reasonable and supportable forecasts that impact the collectability of the reported amount. | The standard is effective for annual reporting periods beginning after December 15, 2019, including interim periods within those fiscal years. | The Company is evaluating the impact the standard will have on the consolidated financial statements and related disclosures. | |||
77
WEX INC.
NOTES TO CONSOLIDATED FINANCIAL STATEMENTS (continued)
(in thousands, except per share data)
Standard | Description | Date/Method of Adoption | Effect on financial statements or other significant matters | |||
ASU 2016-02 Leases (Topic 842) | This standard increases transparency and comparability among organizations by recognizing lease assets and lease liabilities on the balance sheet and disclosing key information about leasing arrangements. Certain qualitative and quantitative disclosures are required. | The standard is effective for annual reporting periods beginning after December 15, 2018, including interim periods within that reporting period. When transitioning, the standard requires leases to be recognized and measured at the beginning of the earliest period presented using a modified retrospective approach. | The Company is evaluating the impact the standard will have on the consolidated financial statements and related disclosures. | |||
ASU 2016-01 Financial Instruments - Overall (Subtopic 825-10): Recognition and Measurement of Financial Assets and Financial Liabilities | This standard requires equity investments, except those accounted for under the equity method of accounting, or those that result in consolidation of the investee, to be measured at fair value with changes in fair value recognized in net income. | The standard is effective for annual reporting periods beginning after December 15, 2017, including interim periods within that reporting period. | The Company is evaluating the impact the pronouncement will have on the consolidated financial statements and related disclosures. | |||
78
WEX INC.
NOTES TO CONSOLIDATED FINANCIAL STATEMENTS (continued)
(in thousands, except per share data)
Standard | Description | Date/Method of Adoption | Effect on financial statements or other significant matters | |||
ASU 2014-09 Revenue from Contracts with Customers (Topic 606) | This standard supersedes most existing revenue recognition guidance under GAAP. The new revenue recognition standard requires entities to recognize revenue for the transfer of promised goods or services to customers in an amount that reflects the consideration to which the entity expects to be entitled in exchange for those goods or services. In addition, the standard requires disclosure of the nature, amount, timing and uncertainty of revenue and cash flows arising from contracts with customers. | The Company adopted this standard on January 1, 2018. The guidance permits two methods of adoption: full retrospective approach, which requires an entity to restate each prior period that is reported in the financial statements and modified retrospective approach, which requires a cumulative adjustment to retained earnings as of the effective date, without restatement of prior period amounts. The Company adopted the standard using the modified retrospective method. | Topic 606 does not apply to rights or obligations associated with financial instruments (e.g. interest income), including the Company’s finance fee and interest income from banking relationships and cardholders. In addition, fees associated with cardholder arrangements are outside the scope of Topic 606. As a result of detailed analysis, management has determined that approximately 30 percent of consolidated revenues for the year ended December 31, 2017 are outside the scope of Topic 606. The Company’s revenue from discount and interchange, transaction processing and certain fees is within the scope of Topic 606. FASB and its Transition Resource Group have issued clarifications on various aspects of ASU 2014-09. The Company has determined there will be two significant changes in the classification on our consolidated statement of income which will impact reported total revenues and operating expenses but have no impact on income from operations. • Certain amounts paid to partners in our Fleet Solutions and Travel and Corporate Solutions segments have been determined to fall under the cost to obtain a contract guidance. As a result, these amounts, which were previously presented net of revenues, will be reflected as a selling expense going forward. Based on 2017 results, this change would have increased both reported revenues and expenses by approximately $52,000.• Network fees paid to Visa and MasterCard by all three of our segments, which have previously been presented within service fees expense, will be presented net of revenue going forward. Based on 2017 results, this change would have reduced both reported revenues and expenses by approximately $24,000. The majority of network fee expenses are incurred by our Travel and Corporate Solutions segment. • Under the new guidance certain costs to obtain a contract, such as sales commissions are to be capitalized and amortized over the life of the contract, with a practical expedient available for contracts under one year in duration. We have evaluated our worldwide sales commission structure and determined that the vast majority of commission expense will continue to be expensed. In 2017, we incurred approximately $1,000 of sales commissions which meet the criteria for capitalization under the new guidance.Except for the items mentioned above, we have determined that the timing and measurement of revenue associated with the Company’s transaction processing services, including discount and interchange and other transaction processing fees, will not be significantly impacted by the new standard. As such, we estimate that applying the modified retrospective method to outstanding contracts as of our January 1, 2018 implementation date will have an immaterial cumulative effect on the opening balance of 2018 retained earnings. The Company has implemented changes to its accounting policies, business processes and internal controls to support the recognition, measurement and disclosure requirements under the new standard. | |||
79
WEX INC.
NOTES TO CONSOLIDATED FINANCIAL STATEMENTS (continued)
(in thousands, except per share data)
3. | Business Acquisitions and Other Intangible Asset Acquisitions |
The Company incurred and expensed costs directly related to completed acquisitions of $956, $19,168 and $342 in 2017, 2016 and 2015, respectively, which are included primarily within service fees in the consolidated statements of income.
AOC
Effective October 18, 2017, the Company acquired certain assets and assumed certain liabilities of AOC Solutions and one of its affiliate companies, 3Delta Systems, Inc. (collectively “AOC”), an industry leader in commercial payments technology. The acquisition of AOC, a longstanding technology provider for our virtual card product, will broaden the Company's capabilities, increase our pool of employees with payments platform expertise and allow the Company to evolve with the needs of its customers and partners through the use of AOC’s payments processing technology platforms.
The Company purchased AOC for $129,828, which was funded with cash on hand and through borrowings under the 2016 Credit Agreement. The Company records adjustments to the assets acquired and liabilities assumed throughout the measurement period, which may be up to one year from the acquisition date. The Company has obtained information to assist in determining the fair values of certain assets acquired and liabilities assumed since the acquisition, resulting primarily in the recording of other intangible assets and goodwill. Goodwill is calculated as the consideration in excess of net assets recognized and represents the future economic benefits arising from other assets acquired that could not be individually identified and separately recognized, including synergies derived from the acquisition. The goodwill and intangible assets recorded from this business combination were assigned to our Travel and Corporate Solutions segment.
The Company has not finalized the purchase accounting and is currently evaluating the tax basis and the allocation of book basis to the assets acquired and liabilities assumed in this business combination. Specifically, the Company is still reviewing the valuation as well as performing procedures to verify the completeness and accuracy of the data used in the independent valuation for intangible assets identified in the table below. Additionally, we are assessing the value of acquired in-process research and development software. The preliminary estimates could change significantly upon completion of this evaluation. The goodwill recognized in this business combination will be deductible for income tax purposes.
The following is a summary of the preliminary allocation of the purchase price to the assets and liabilities acquired:
As Reported December 31, 2017 | |||
Total consideration | $ | 129,828 | |
Less: | |||
Cash | 15,546 | ||
Accounts receivable | 4,171 | ||
Property and equipment | 2,530 | ||
Customer relationships(a) | 15,000 | ||
Developed technologies(b) | 24,100 | ||
Trademarks and trade names(c) | 1,460 | ||
Other liabilities | (685 | ) | |
Recorded goodwill | $ | 67,706 | |
(a) Weighted average life – 8.9 years.
(b) Weighted average life – 3.4 years.
(c) Weighted average life – 4.0 years.
(a) (b) (c) The weighted average life of these amortized intangible assets is 5.4 years.
Since the acquisition date, the operations of AOC contributed net revenues of approximately $6,685 and net loss before taxes of approximately $620 during 2017. No pro forma information has been included in these financial statements as the operations of AOC for the period that they were not part of the Company are not material to the Company's revenues, net income and earnings per share.
80
WEX INC.
NOTES TO CONSOLIDATED FINANCIAL STATEMENTS (continued)
(in thousands, except per share data)
EFS
On July 1, 2016, the Company acquired all of the outstanding membership interests of EFS, a provider of customized payment solutions for fleet and corporate customers with a focus on the large and mid-sized over-the-road fleets. The acquisition enabled the Company to expand its customer footprint and to utilize EFS' technology to better serve the needs of all fleet customers.
In consideration for the acquisition of EFS, the Company issued 4,012 shares of its common stock valued at approximately $355,000 based on the July 1, 2016 closing price of the Company's common stock on the NYSE. This represented approximately 9.4 percent of the Company's outstanding common stock after giving effect to the issuance of the new shares in connection with this acquisition. The cash consideration for the transaction totaled approximately $1,182,000, and was funded with amounts received under the 2016 Credit Agreement described further in Note 13, Financing Debt. The value of the total cash and stock consideration paid for the acquisition of EFS was approximately $1,444,000, net of approximately $93,000 in cash acquired.
The Company obtained information to determine the fair values of certain assets acquired and liabilities assumed throughout the one year measurement period and recorded adjustments to the assets acquired and liabilities assumed, resulting in the recording of other intangible assets and goodwill as described below. Goodwill is calculated as the consideration in excess of net assets recognized and represents the future economic benefits arising from other assets acquired that could not be individually identified and separately recognized, including synergies derived from the acquisition. The Company finalized the EFS purchase accounting in the second quarter of 2017.
The tax structure of EFS consists of limited liability companies and corporations. The Company’s tax election will allow a step-up in tax basis related to its 49.5 percent direct ownership in the parent limited liability company. The remaining 50.5 percent ownership in the parent limited liability company is held by another limited liability company, taxed as a corporation, that is part of the EFS structure and will therefore receive carry over tax basis. The difference between book and tax basis resulting from receiving carry over tax basis has been reflected in the financial statements as an investment in partnership deferred tax liability. The Company has determined that approximately $557,000 of the goodwill recognized in this business combination will be deductible for income tax purposes.
The following represents the components and final allocation of the purchase price:
As Reported December 31, 2016 | Measurement Period Adjustments | As Reported, Final | |||||||||
Total consideration, net of cash acquired | $ | 1,444,235 | $ | — | $ | 1,444,235 | |||||
Less: | |||||||||||
Accounts receivable | 162,684 | — | 162,684 | ||||||||
Property and equipment | 2,387 | 1 | 2,388 | ||||||||
Customer relationships(a)(b) | 842,700 | (1,300 | ) | 841,400 | |||||||
Developed technologies(a)(c) | 32,120 | — | 32,120 | ||||||||
Trademarks and trade names(a)(d) | 13,700 | — | 13,700 | ||||||||
Deferred income tax assets | 34,992 | 6,352 | 41,344 | ||||||||
Other assets | — | 739 | 739 | ||||||||
Accounts payable | (153,777 | ) | 248 | (153,529 | ) | ||||||
Accrued expenses | (128,267 | ) | 9,361 | (118,906 | ) | ||||||
Deferred income tax liabilities | (91,194 | ) | 28,071 | (63,123 | ) | ||||||
Recorded goodwill(a) | $ | 728,890 | $ | (43,472 | ) | $ | 685,418 | ||||
(a) $1,235,331 in goodwill and other intangible assets recorded from this business combination were allocated to our Fleet Solutions segment, the remaining $337,307 was allocated to our Travel and Corporate Solutions segment.
(b) Weighted average life – 8.1 years.
(c) Weighted average life – 2.0 years.
(d) Weighted average life – 7.7 years.
(b) (c) (d) The weighted average life of these amortized intangible assets is 7.9 years.
The pro forma financial information presented below includes the effects of the EFS acquisition as if it had been consummated on January 1, 2015. These pro forma results have been calculated after applying the Company's accounting policies and adjusting results to reflect the intangible amortization and interest expense associated with the 2016 Credit Agreement used to fund the acquisition and related income tax results assuming they were applied and incurred since January 1, 2015. In addition, non-recurring costs that were incurred in 2016 and are directly attributable to the acquisition have been reflected in pro forma results for the year ended December 31, 2015. Such adjustments include $19,168 of transaction costs and $7,074 of expenses
81
WEX INC.
NOTES TO CONSOLIDATED FINANCIAL STATEMENTS (continued)
(in thousands, except per share data)
incurred as part of the July 2016 debt modification and extinguishment, net of the related income tax results. The pro forma results of operations do not include any cost savings or other synergies that may result from the acquisition or any estimated integration costs that have been or will be incurred by the Company. Accordingly, the following pro forma information is not necessarily indicative of either the future results of operations or results that would have been achieved if the acquisition had taken place at the beginning of 2015. Subsequent to the July 1, 2016 acquisition date, the operations of EFS contributed revenues of approximately $83,300 and net income before taxes of approximately $5,800 to the Company's 2016 consolidated statement of income.
The following represents unaudited pro forma operational results as if the acquisition had occurred as of January 1, 2015:
Year Ended December 31, | |||||||
2016 | 2015 | ||||||
Total revenues | $ | 1,089,880 | $ | 994,619 | |||
Net earnings attributable to shareholders | $ | 42,821 | $ | 36,763 | |||
Pro forma net income attributable to shareholders per common share: | |||||||
Basic | $ | 1.00 | $ | 0.86 | |||
Diluted | $ | 1.00 | $ | 0.86 | |||
Benaissance
On November 18, 2015, the Company purchased the stock of Benaissance for $80,677. The transaction was financed through the Company’s cash on hand and existing credit facility. Benaissance provides financial management for health benefits administration by offering SaaS solutions for individual single point and consolidated group premium billing. The Company acquired Benaissance to enhance the Company's positioning in the growing healthcare market.
The Company obtained information to determine the fair values of certain assets acquired and liabilities assumed throughout the one year measurement period and recorded adjustments to the assets acquired and liabilities assumed, resulting in the recording of other intangible assets and goodwill as described below. Goodwill is expected to be deductible for tax purposes.
Since the acquisition date, the operations of Benaissance contributed net revenues of approximately $2,085 and net income of approximately $399 during 2015. The results of operations for Benaissance are presented in the Company's Health and Employee Benefit Solutions segment.
The following is a summary of the final allocation of the purchase price to the assets and liabilities acquired:
Consideration paid (net of cash acquired) | $ | 80,677 | |
Less: | |||
Accounts receivable | 1,594 | ||
Other tangible assets and liabilities, net | 314 | ||
Acquired software and developed technology(a) | 10,300 | ||
Customer relationships(b) | 27,700 | ||
Trade name(c) | 1,500 | ||
Recorded goodwill | $ | 39,269 | |
(a) Weighted average life – 5.0 years.
(b) Weighted average life – 7.6 years.
(c) Weighted average life – 8.1 years
(a) (b) (c) The weighted average life of these amortized intangible assets is 6.9 years.
No pro forma information has been included in these financial statements as the operations of Benaissance for the period that they were not part of the Company are not material to the Company's revenues, net income and earnings per share.
Acquisition of remaining 49% of UNIK
On August 31, 2015, the Company acquired the remaining 49 percent ownership in UNIK for $46,018.
82
WEX INC.
NOTES TO CONSOLIDATED FINANCIAL STATEMENTS (continued)
(in thousands, except per share data)
4. | Divestitures |
Telapoint
During the year ended December 31, 2017, the Company sold $8,942 in net assets of its Telapoint business for proceeds of $29,900, subject to a working capital adjustment. The sale resulted in a pre-tax book gain of $20,958. Costs incurred related to this divestiture were immaterial. Prior to the sale, the Telapoint business was assigned to our North American Fleet reporting unit, which is included within our Fleet Solutions reportable segment.
The divestiture was not material to the Company's annual revenue, net income or earnings per share. The Company does not view this divestiture as a strategic shift in its operations.
rapid! PayCard
On January 7, 2015, the Company sold the assets of its rapid! PayCard operations for $20,000, which resulted in a pre-tax book gain of approximately $1,215. The Company's primary focus in the U.S. continues to be in the fleet, travel, and healthcare industries. As such, the Company divested the operations of rapid! PayCard, which were not material to the Company's annual revenue, net income or earnings per share. The Company does not view this divestiture as a strategic shift in its operations.
5. | Accounts Receivable |
In general, the Company’s trade receivables provide for payment terms of 30 days or less. Receivables not paid within the terms of the customer agreement are generally subject to late fees based upon the outstanding customer receivable balance.
The Company extends revolving credit to certain small fleet customers. These accounts are also subject to late fees and balances that are not paid in full are subject to interest charges based on the revolving balance. The Company had approximately $12,200 and $3,400 in receivables with revolving credit balances as of December 31, 2017 and 2016, respectively.
Concentration of Credit Risk
The receivables portfolio consists of a large group of homogeneous smaller balances from customers across a wide range of industries, which are collectively evaluated for impairment. No one customer represented 10 percent or more of the outstanding receivables balance as of December 31, 2017. One customer represented 11 percent of the outstanding receivables balance as of December 31, 2016. The following table presents the outstanding balance of accounts receivable that are less than 60 days past due, in each case as a percentage of total trade accounts receivable:
December 31, | |||||
Delinquency Status | 2017 | 2016 | |||
29 days or less past due | 95 | % | 93 | % | |
59 days or less past due | 97 | % | 98 | % | |
Reserves for Accounts Receivable
Receivables are generally written off when they are 150 days past due or upon declaration of bankruptcy by the customer. The reserve for credit losses is calculated by an analytic model that also takes into account other factors, such as the actual charge-offs for the preceding reporting periods, expected charge-offs and recoveries for the subsequent reporting periods, a review of past due accounts receivable balances, changes in customer payment patterns, known fraudulent activity in the portfolio, as well as leading economic and market indicators.
83
WEX INC.
NOTES TO CONSOLIDATED FINANCIAL STATEMENTS (continued)
(in thousands, except per share data)
The following table presents changes in the accounts receivable allowances:
Year ended December 31, | |||||||||||
2017 | 2016 | 2015 | |||||||||
Balance, beginning of year | $ | 21,454 | $ | 14,672 | $ | 14,627 | |||||
Provision for credit losses1 | 61,148 | 33,348 | 22,825 | ||||||||
Charges to other accounts2 | 16,869 | 10,166 | 6,155 | ||||||||
Charge-offs | (77,229 | ) | (43,309 | ) | (33,885 | ) | |||||
Recoveries of amounts previously charged-off | 7,526 | 6,201 | 5,202 | ||||||||
Currency translation | 439 | 376 | (252 | ) | |||||||
Balance, end of year | $ | 30,207 | $ | 21,454 | $ | 14,672 | |||||
1 During 2017, the majority of the increase relates to higher incidences of magnetic stripe card skimming fraud.
2 The Company earns revenue by assessing monthly finance fees on accounts with overdue balances. These fees are recognized as revenue at the time the fees are assessed. The finance fee is calculated using the greater of a minimum charge or a stated late fee rate multiplied by the outstanding balance that is subject to a late fee charge. On occasion, these fees are waived to maintain customer goodwill. Charges to other accounts represents the offset against the late fee revenue recognized when the Company establishes a reserve for such waived amounts.
6. | Investments |
Available-for-sale Securities
The Company’s available-for-sale securities as of December 31, 2017 and 2016, are presented below:
Cost | Gross Unrealized Gains | Gross Unrealized Losses | Fair Value(a) | ||||||||||||
2017 | |||||||||||||||
Mortgage-backed securities | $ | 325 | $ | 4 | $ | 24 | $ | 305 | |||||||
Asset-backed securities | 350 | — | 5 | 345 | |||||||||||
Municipal bonds | 539 | 1 | 6 | 534 | |||||||||||
Equity securities(b) | 22,888 | — | 714 | 22,174 | |||||||||||
Total available-for-sale securities | $ | 24,102 | $ | 5 | $ | 749 | $ | 23,358 | |||||||
2016 | |||||||||||||||
Mortgage-backed securities | $ | 498 | $ | 15 | $ | 23 | $ | 490 | |||||||
Asset-backed securities | 650 | — | 2 | 648 | |||||||||||
Municipal bonds | 697 | 1 | 16 | 682 | |||||||||||
Equity securities(b) | 22,414 | — | 709 | 21,705 | |||||||||||
Total available-for-sale securities | $ | 24,259 | $ | 16 | $ | 750 | $ | 23,525 | |||||||
(a) The Company’s techniques used to measure the fair value of its investments are discussed in Note 17, Fair Value.
(b) Excludes $6,798 and $5,673 in equity securities designated as trading as of December 31, 2017 and 2016, respectively, included in other assets on the consolidated balance sheets. See Note 16, Employee Benefit Plans for additional information.
The Company reviews its investments to identify and evaluate indications of possible impairment. Factors considered in determining whether a loss is temporary include the length of time and extent to which the fair value has been less than the cost basis, the financial condition and near-term prospects of the investee, and the Company’s intent and ability to hold the investment for a period of time sufficient to allow for any anticipated recovery in market value. Substantially all of the Company’s fixed income securities are rated investment grade or better. The amount of available-for-sale securities that have been in a continuous unrealized loss position for more than twelve months is insignificant. The Company’s management has determined that these gross unrealized losses at December 31, 2017 and 2016 are temporary in nature.
The Company had maturities of available-for-sale securities of $631, $495 and $594 for the years ended December 31 2017, 2016 and 2015, respectively.
84
WEX INC.
NOTES TO CONSOLIDATED FINANCIAL STATEMENTS (continued)
(in thousands, except per share data)
The maturity dates of the Company’s available-for-sale securities are as follows:
December 31, | |||||||||||||||
2017 | 2016 | ||||||||||||||
Cost | Fair Value | Cost | Fair Value | ||||||||||||
Due after 1 year through year 5 | $ | — | $ | — | $ | 165 | $ | 165 | |||||||
Due after 5 years through year 10 | 390 | 385 | 529 | 529 | |||||||||||
Due after 10 years | 499 | 494 | 653 | 636 | |||||||||||
Mortgage-backed securities with original maturities of 30 years | 325 | 305 | 498 | 490 | |||||||||||
Equity securities with no maturity dates | 22,888 | 22,174 | 22,414 | 21,705 | |||||||||||
Total | $ | 24,102 | $ | 23,358 | $ | 24,259 | $ | 23,525 | |||||||
7. | Property, Equipment and Capitalized Software, Net |
Property, equipment and capitalized software, net consist of the following:
December 31, | |||||||
2017 | 2016 | ||||||
Furniture, fixtures and equipment | $ | 75,015 | $ | 69,513 | |||
Computer software | 308,362 | 254,163 | |||||
Software under development | 21,452 | 49,922 | |||||
Leasehold improvements | 23,248 | 21,257 | |||||
Capital leases | 759 | 759 | |||||
Total | 428,836 | 395,614 | |||||
Less: accumulated depreciation and amortization | (264,928 | ) | (228,336 | ) | |||
Total property, equipment and capitalized software, net | $ | 163,908 | $ | 167,278 | |||
Depreciation expense was $49,913, $43,821 and $35,285 in 2017, 2016 and 2015, respectively. During the year ended December 31, 2017, the Company impaired approximately $28,000 of software under development. See Note 22, Impairment and Restructuring Activities for further information. The Company did not incur significant impairment charges during 2016 and 2015.
85
WEX INC.
NOTES TO CONSOLIDATED FINANCIAL STATEMENTS (continued)
(in thousands, except per share data)
8. | Goodwill and Other Intangible Assets |
Goodwill
The changes in goodwill during the period January 1 to December 31, 2017 were as follows:
Fleet Solutions Segment | Travel and Corporate Solutions Segment | Health and Employee Benefit Solutions Segment | Total | ||||||||||||
Gross goodwill, January 1, 2017 | $ | 1,293,138 | $ | 202,771 | $ | 353,722 | $ | 1,849,631 | |||||||
Acquisition adjustments for EFS | (37,296 | ) | (6,176 | ) | — | (43,472 | ) | ||||||||
Acquisition of AOC | — | 67,706 | — | 67,706 | |||||||||||
Divestiture of Telapoint | (4,469 | ) | — | — | (4,469 | ) | |||||||||
Impact of foreign currency translation | 18,345 | 740 | (214 | ) | 18,871 | ||||||||||
Gross goodwill, December 31, 2017 | 1,269,718 | 265,041 | 353,508 | 1,888,267 | |||||||||||
Accumulated impairment, January 1, 2017 | (855 | ) | (10,335 | ) | — | (11,190 | ) | ||||||||
Impact of foreign currency translation | (72 | ) | (873 | ) | — | (945 | ) | ||||||||
Accumulated impairment, December 31, 2017 | $ | (927 | ) | $ | (11,208 | ) | $ | — | $ | (12,135 | ) | ||||
Net goodwill, January 1, 2017 | $ | 1,292,283 | $ | 192,436 | $ | 353,722 | $ | 1,838,441 | |||||||
Net goodwill, December 31, 2017 | $ | 1,268,791 | $ | 253,833 | $ | 353,508 | $ | 1,876,132 | |||||||
The changes in goodwill during the period January 1 to December 31, 2016 were as follows:
Fleet Solutions Segment | Travel and Corporate Solutions Segment | Health and Employee Benefit Solutions Segment | Total | ||||||||||||
Gross goodwill, January 1, 2016 | $ | 735,770 | $ | 38,134 | $ | 350,321 | $ | 1,124,225 | |||||||
Acquisition of EFS | 561,119 | 167,771 | — | 728,890 | |||||||||||
Acquisition adjustments | — | — | 502 | 502 | |||||||||||
Impact of foreign currency translation | (3,751 | ) | (3,134 | ) | 2,899 | (3,986 | ) | ||||||||
Gross goodwill, December 31, 2016 | 1,293,138 | 202,771 | 353,722 | 1,849,631 | |||||||||||
Accumulated impairment, January 1, 2016 | (867 | ) | (10,480 | ) | — | (11,347 | ) | ||||||||
Impact of foreign currency translation | 12 | 145 | — | 157 | |||||||||||
Accumulated impairment, December 31, 2016 | $ | (855 | ) | $ | (10,335 | ) | $ | — | $ | (11,190 | ) | ||||
Net goodwill, January 1, 2016 | $ | 734,903 | $ | 27,654 | $ | 350,321 | $ | 1,112,878 | |||||||
Net goodwill, December 31, 2016 | $ | 1,292,283 | $ | 192,436 | $ | 353,722 | $ | 1,838,441 | |||||||
86
WEX INC.
NOTES TO CONSOLIDATED FINANCIAL STATEMENTS (continued)
(in thousands, except per share data)
Other Intangible Assets
Other intangible assets consist of the following:
December 31, 2017 | December 31, 2016 | ||||||||||||||||||||||
Gross Carrying Amount | Accumulated Amortization | Net Carrying Amount | Gross Carrying Amount | Accumulated Amortization | Net Carrying Amount | ||||||||||||||||||
Definite-lived intangible assets | |||||||||||||||||||||||
Acquired software and developed technology | $ | 203,861 | $ | (96,197 | ) | $ | 107,664 | $ | 187,499 | $ | (69,483 | ) | $ | 118,016 | |||||||||
Customer relationships | 1,257,232 | (269,216 | ) | 988,016 | 1,247,624 | (167,301 | ) | 1,080,323 | |||||||||||||||
Licensing agreements | 34,546 | (15,029 | ) | 19,517 | 30,760 | (9,126 | ) | 21,634 | |||||||||||||||
Non-compete agreement | — | — | — | 4,000 | — | 4,000 | |||||||||||||||||
Patent | 2,581 | (2,076 | ) | 505 | 2,380 | (1,724 | ) | 656 | |||||||||||||||
Trade name | 44,079 | (10,309 | ) | 33,770 | 41,029 | (6,508 | ) | 34,521 | |||||||||||||||
$ | 1,542,299 | $ | (392,827 | ) | $ | 1,149,472 | $ | 1,513,292 | $ | (254,142 | ) | $ | 1,259,150 | ||||||||||
Indefinite-lived intangible assets | |||||||||||||||||||||||
Trademarks, trade names and brand names | 4,575 | 6,318 | |||||||||||||||||||||
Total | $ | 1,154,047 | $ | 1,265,468 | |||||||||||||||||||
During the years ended December 31, 2017, 2016 and 2015, amortization expense was $153,811, $97,829 and $47,792, respectively. The following table presents the estimated amortization expense related to the definite-lived intangible assets listed above for each of the next five fiscal years:
2018 | $ | 141,583 | |
2019 | 127,393 | ||
2020 | 116,164 | ||
2021 | 100,367 | ||
2022 | $ | 89,267 | |
9. | Accounts Payable |
Accounts payable consists of:
December 31, | |||||||
2017 | 2016 | ||||||
Merchant payables | $ | 720,553 | $ | 520,058 | |||
Other payables | 90,809 | 97,060 | |||||
Accounts payable | $ | 811,362 | $ | 617,118 | |||
10. | Deposits, Borrowed Federal Funds and Other Debt |
Deposits and Borrowed Federal Funds
WEX Bank has issued certificates of deposit with maturities ranging from 3 months to 3 years and with interest rates ranging from 1.00 percent to 2.15 percent as of December 31, 2017. WEX Bank may issue certificates of deposits without limitation, subject to FDIC rules governing minimum financial ratios, which include risk-based asset and capital requirements. As of December 31, 2017, all certificates of deposit were in denominations of $250 or less, corresponding to FDIC deposit insurance limits.
The Company requires deposits from certain customers as collateral for credit that has been extended. These deposits are generally non-interest bearing. Interest-bearing money market deposits are issued in denominations of $250 or less, and pay interest
87
WEX INC.
NOTES TO CONSOLIDATED FINANCIAL STATEMENTS (continued)
(in thousands, except per share data)
at variable rates based on LIBOR or the Federal Funds rate. Money market deposits may be withdrawn by the holder at any time, although notification may be required and the monthly number of transactions is limited.
The following table presents information about deposits:
December 31, | |||||||
2017 | 2016 | ||||||
Certificates of deposit with maturities within 1 year | $ | 630,879 | $ | 517,524 | |||
Certificates of deposit with maturities greater than 1 year and less than 5 years | 306,865 | 208,048 | |||||
Interest-bearing money market deposits | 285,899 | 325,464 | |||||
Customer deposits | 70,211 | 67,787 | |||||
Total deposits | $ | 1,293,854 | $ | 1,118,823 | |||
Weighted average cost of funds on certificates of deposit outstanding | 1.51 | % | 0.96 | % | |||
Weighted average cost of interest-bearing money market deposits | 1.49 | % | 0.76 | % | |||
The Company also had federal funds lines of credit totaling $400,000 and $250,000 at December 31, 2017 and 2016, respectively. There were no borrowings against these lines of credit at December 31, 2017 and 2016.
Other Debt
WEX Latin America Debt
WEX Latin America had debt of approximately $9,747 and $30,755 as of December 31, 2017 and 2016, respectively. This is comprised of credit facilities and loan arrangements with various maturity dates.
Participation Debt
WEX Bank maintains agreements with third-party banks to fund customer balances that exceed WEX Bank's lending limit to an individual customer. During the year ended December 31, 2017, the Company increased the funding capacity of these arrangements by $90,000 to $185,000. Associated borrowings carry a variable interest rate of 1 month to 3 month LIBOR plus a margin of 225 basis points. The balance of the debt was approximately $185,000 and $95,000 at December 31, 2017 and December 31, 2016 respectively, and was secured by an interest in the underlying customer receivables. The balance will fluctuate on a daily basis based on customer funding needs. The commitment will mature in amounts of approximately $85,000 and $50,000 on May 30, 2018 and December 31, 2021, respectively, with the remaining $50,000 maturing on demand.
The following table presents the average interest rates and balances for deposits, borrowed federal funds and other debt:
Year ended December 31, | ||||||||
2017 | 2016 | 2015 | ||||||
Average interest rate: | ||||||||
Deposits | 1.22 | % | 0.94 | % | 0.65 | % | ||
Borrowed federal funds | 1.24 | % | 0.69 | % | 0.39 | % | ||
Interest-bearing money market deposits | 1.12 | % | 0.50 | % | 0.25 | % | ||
WEX Latin America debt | 21.21 | % | 19.70 | % | 15.21 | % | ||
Participation agreement | 3.46 | % | 2.94 | % | 2.57 | % | ||
11. | Derivative Instruments |
The Company is exposed to certain market risks relating to its ongoing business operations. From time to time, the Company enters into derivative instrument arrangements to manage various risks including interest rate risk, foreign exchange risk, and commodity price risk. None of these derivative instruments qualify for hedge accounting treatment.
88
WEX INC.
NOTES TO CONSOLIDATED FINANCIAL STATEMENTS (continued)
(in thousands, except per share data)
Interest Rate Swap Agreements
At December 31, 2017, we had variable-rate borrowings of $1.7 billion under our 2016 Credit Agreement. During 2016 and 2017, we entered into five interest rate swap contracts. Collectively, these derivative contracts are intended to fix the future interest payments associated with $1.3 billion of our variable rate borrowings at between 0.896% to 2.212%.
The notional amounts, fixed and variable interest rates and maturities of the interest rate swap agreements are as follows:
Tranche A | Tranche B | Tranche C | Tranche D | Tranche E | |
Notional amount at inception | $300,000 | $200,000 | $400,000 | $150,000 | $250,000 |
Amortization | N/A | N/A | 5% annually | N/A | N/A |
Maturity date | 12/30/2022 | 12/30/2022 | 12/31/2020 | 12/31/2020 | 12/31/2018 |
Fixed interest rate | 2.204% | 2.212% | 1.108% | 1.125% | 0.896% |
See Note 17, Fair Value for more information regarding the valuation of the Company's interest rate swaps.
Foreign Currency Exchange Program
The Company utilizes a limited foreign currency exchange hedging program, entering into short-term foreign currency swaps to convert the foreign currency exposures of certain foreign currency denominated intercompany loans and investments to the base currency. The Company will continue to monitor its foreign currency exposure for discrete items and may, from time to time, hedge certain foreign currency transactions.
The following table summarizes the contracts related to the Company's foreign currency swaps, which settle in U.S. dollars at various dates within 5 days after year-end:
Aggregate Notional Amount | |||||||
December 31, | |||||||
2017 | 2016 | ||||||
Australian dollar | A$ | 5,000 | A$ | 15,000 | |||
The amount of gains and losses associated with these foreign currency swaps were not material for the years ended December 31, 2017, 2016 and 2015.
Fuel Derivatives Program
The Company previously utilized fuel price derivative instruments, which were designed to reduce the volatility of the Company’s cash flows associated with its fuel price-related earnings exposure in North America. After the first quarter of 2016, the Company was no longer hedged for changes in fuel prices. Management will continue to monitor the fuel price market and evaluate its alternatives as it relates to this hedging program.
The following table summarizes the changes in fair value of the fuel price derivatives which have been recorded on the consolidated statements of income:
Year ended December 31, | |||||||
2016 | 2015 | ||||||
Realized gains | $ | 5,718 | $ | 41,810 | |||
Change in unrealized fuel price derivatives | (5,007 | ) | (35,962 | ) | |||
Net realized and unrealized gains on fuel price derivatives | $ | 711 | $ | 5,848 | |||
89
WEX INC.
NOTES TO CONSOLIDATED FINANCIAL STATEMENTS (continued)
(in thousands, except per share data)
Consolidated Derivative Instruments
The following table presents information on the location and amounts of derivative fair values on the consolidated balance sheets, which are recorded at fair value:
Asset Derivatives | Liability Derivatives | ||||||||||||||||||||||
December 31, 2017 | December 31, 2016 | December 31, 2017 | December 31, 2016 | ||||||||||||||||||||
Derivatives Not Designated as Hedging Instruments | Balance Sheet Location | Fair Value | Balance Sheet Location | Fair Value | Balance Sheet Location | Fair Value | Balance Sheet Location | Fair Value | |||||||||||||||
Interest rate swaps | Other assets | $ | 15,919 | Other assets | $ | 12,908 | Other liabilities | $ | 1,697 | Other liabilities | $ | — | |||||||||||
Foreign currency contracts | Accounts receivable | $ | — | Accounts receivable | $ | 29 | Accounts payable | $ | — | Accounts payable | $ | — | |||||||||||
The following table presents information on the location and amounts of derivative gains and losses:
Derivatives Not Designated as Hedging Instruments | Location of Gain Recognized in Income on Derivative | Amount of Gain (Loss) Recognized in Income on Derivative | |||||||||||
December 31, | |||||||||||||
2017 | 2016 | 2015 | |||||||||||
Foreign currency contracts | Net foreign currency gain | $ | — | $ | 59 | $ | 27,236 | ||||||
Interest rate swap agreements - unrealized portion | Net unrealized gains on interest rate swap agreements | $ | 1,314 | $ | 12,908 | $ | — | ||||||
Interest rate swap agreements - realized portion | Financing interest income | $ | 214 | $ | — | $ | — | ||||||
Commodity contracts | Net realized and unrealized gains on fuel price derivatives | $ | — | $ | 711 | $ | 5,848 | ||||||
12. | Off-Balance Sheet Arrangements |
WEX Europe Services Accounts Receivable Factoring
During the first quarter of 2017, WEX Europe Services entered into a factoring arrangement with an unrelated third-party financial institution (the “Purchasing Bank”) to sell certain of its accounts receivable in order to accelerate the collection of the Company's cash and reduce internal costs, thereby improving liquidity. Under this arrangement, the Purchasing Bank establishes a credit limit for each customer account. The factored receivables are without recourse to the extent that the customer balances are maintained at or below the established credit limit. For customer receivable balances in excess of the Purchasing Bank's credit limit, the Company maintains the risk of default. The Company obtained a true sale opinion from an independent attorney, which states that the factoring agreement creates a sale of receivables under local law for amounts transferred both below and above the established credit limits. Additionally, there are no indications of the Company's continuing involvement in the factored receivables. As a result, the Purchasing Bank is deemed the purchaser of these receivables and is entitled to enforce payment of these amounts from the debtor.
This factoring arrangement is accounted for as a sale and accordingly the Company records the receivables sold as a reduction of accounts receivable and proceeds as cash provided by operating activities. The Company sold approximately $574,400 of receivables under this arrangement during year ended December 31, 2017. Proceeds received are recorded net of applicable expenses, interest and commissions. This resulted in a loss on factoring of approximately $3,700 for the year ended December 31, 2017, which was recorded in Other expenses in the consolidated statement of income. As of December 31, 2017, the Company had associated factoring receivables of approximately $61,800, of which approximately $3,700 were in excess of the established credit limit. Charge-backs on balances in excess of the credit limit during the year ended December 31, 2017 were insignificant.
WEX Latin America Accounts Receivable Factoring
During the first quarter of 2017, WEX Latin America entered into a factoring agreement to sell certain unsecured receivables associated with our salary payment card product, without recourse, to an unrelated third-party financial institution. Under the terms of the agreement, the Company retains no rights or interest and has no obligations with respect to the receivables. As such, the factoring under this arrangement is accounted for as a sale. The Company sold $16,300 of receivables during the year ended December 31, 2017. This resulted in a loss on factoring of $800 for the year ended December 31, 2017, which was recorded in Other expenses in the consolidated statement of income. The receivables sold under this agreement were recorded as a reduction
90
WEX INC.
NOTES TO CONSOLIDATED FINANCIAL STATEMENTS (continued)
(in thousands, except per share data)
of accounts receivable and proceeds as cash provided by operating activities. There were no sales under this factoring arrangement during the second half of 2017; a securitization agreement replaced this factoring arrangement as Brazil's primary funding mechanism. See Note 13, Financing Debt, for more information on this securitization arrangement.
13. | Financing Debt |
The following table summarizes the Company's outstanding borrowings under the agreements outlined below:
Year ended December 31, | |||||||
2017 | 2016 | ||||||
Revolving line-of-credit facility | $ | 136,535 | $ | — | |||
Term loans | 1,602,875 | 1,637,625 | |||||
Revolving line-of-credit facility and term loans(a) | $ | 1,739,410 | $ | 1,637,625 | |||
Unamortized debt issuance costs | (32,346 | ) | (38,334 | ) | |||
Revolving line-of-credit facility and term loans, net | $ | 1,707,064 | $ | 1,599,291 | |||
Notes outstanding(a) | $ | 400,000 | $ | 400,000 | |||
Unamortized debt issuance costs | (3,731 | ) | (4,466 | ) | |||
Notes outstanding, net | $ | 396,269 | $ | 395,534 | |||
(a) See Note 17, Fair Value for more information regarding the Company's 2016 Credit Agreement and notes outstanding.
2016 Credit Agreement
On July 1, 2016, the Company entered into the 2016 Credit Agreement, which replaced the 2014 Credit Agreement. The 2016 Credit Agreement provided for term loan facilities and a secured revolving credit facility, with a sublimit for letters of credit and swingline loans. Effective October 30, 2017, the Company entered into a Second Amendment to the 2016 Credit Agreement, which added $100,000 of capacity to its revolving line of credit to provide additional liquidity and flexibility. As amended, the 2016 Credit Agreement provides for a tranche A term loan facility in an amount equal to $455,000, a tranche B term loan facility in an amount equal to $1,200,000 and a $570,000 secured revolving credit facility. Under this agreement, $1,025,000 matures on July 1, 2021 and $1,200,000 matures on July 1, 2023. Prior to maturity, amounts under the credit facility will be reduced by mandatory payments. Additional loans may be made available under the 2016 Credit Agreement upon request of the Company subject to specified terms and conditions, including receipt of lender commitments. Proceeds from the 2016 Credit Agreement may be used for working capital purposes, acquisitions, payment of dividends and other restricted payments, refinancing of indebtedness and other general corporate purposes.
As of December 31, 2017, the Company had $570,000 borrowing capacity, subject to the covenants as described below. As of December 31, 2017 and 2016, the Company has posted approximately $27,500 and $13,300, respectively, in letters of credit as collateral for lease agreements and virtual card and fuel payment processing activity at its foreign subsidiaries. The Company had approximately $406,000 available under the revolving credit facility as of December 31, 2017. As of both December 31, 2017 and 2016, amounts outstanding under the 2016 Credit Agreement bore a weighted average effective interest rate of 4.2%.
Effective July 3, 2017, the Company repriced the secured term loans under the 2016 Credit Agreement (the “2016 First Amendment”), which reduced the applicable interest rate margin at current borrowing levels for both LIBOR borrowings and base rate borrowings for the Company's tranche A term loans and tranche B term loans. The consolidated leverage ratio as defined in the 2016 Credit Agreement (i.e. consolidated funded indebtedness less up to $350,000 in permitted securitization transactions of the Company and its subsidiaries to consolidated EBITDA) was also modified for purposes of calculating the interest rate margin for tranche A term loans and revolving loans and determining compliance with the financial covenant by allowing the Company to exclude up to $75 million of certain corporate cash balances for purposes of determining consolidated funded indebtedness.
After giving effect to the terms of the 2016 First Amendment, amounts outstanding under the 2016 Credit Agreement were repriced to bear interest at a rate equal to, at the Company’s option, (a) the Eurocurrency Rate, as defined in the 2016 Credit Agreement, plus a margin of between 1.75% to 3.25% (2.75% at December 31, 2017) with respect to the revolving credit facility, between 1.75% to 2.75% (2.25% at December 31, 2017) with respect to the tranche A term loan facility, which represents a reduction of 50 basis points and 2.75% with respect to the tranche B term loan facility, which represents a reduction of 75 basis points (with the Eurocurrency Rate subject to a 0.00% floor), in each case, based on the consolidated leverage ratio or (b) the highest of (i) the Federal Funds Rate plus 0.50%, (ii) the prime rate announced by Bank of America, and (iii) the Eurocurrency Rate plus 1.00%,
91
WEX INC.
NOTES TO CONSOLIDATED FINANCIAL STATEMENTS (continued)
(in thousands, except per share data)
in each case plus a margin of 0.75% to 2.25% (1.75% at December 31, 2017) with respect to the revolving credit facility, 0.75% to 1.75% (1.25% at December 31, 2017) with respect to the tranche A term loan facility and 2.25% with respect to the tranche B term loan facility, with the margin determined in the case of the revolving credit facility and the tranche A term loan facility based on the consolidated leverage ratio. The Company maintains interest rate swap agreements to manage the interest rate risk associated with its outstanding variable-interest rate borrowings under the 2016 Credit Agreement. See Note 11, Derivative Instruments, for further discussion.
In addition, the Company has agreed to pay a quarterly commitment fee at a rate per annum ranging from 0.30% to 0.50% (0.45% at December 31, 2017) based on the consolidated leverage ratio of the daily unused portion of the 2016 Credit Agreement. The tranche B term loan facility was issued with an original issue discount of 1.00%.
As the debt repricings under the 2016 First Amendment were not considered substantially different, the Company applied modification accounting and no gain or loss was recognized as a result of the debt modification. Amounts paid as part of this repricing were not material.
The 2016 Credit Agreement requires the Company to prepay outstanding term loans, subject to certain exceptions:
• | solely with respect to the tranche B term loan facility, currently with 50% (subject to reduction to 25% and 0% based upon the Company’s consolidated leverage ratio) of the Company’s annual Excess Cash Flow (as defined in the 2016 Credit Agreement); |
• | with 100% of the net cash proceeds of certain asset sales where the proceeds exceed certain thresholds, and certain casualty and condemnation events, subject to reinvestment rights and certain other exceptions; and |
• | with 100% of the net cash proceeds of any incurrence or issuance of certain debt, other than debt permitted under the 2016 Credit Agreement. |
The Company may voluntarily prepay outstanding loans from time to time, subject to certain conditions, without premium or penalty other than customary “breakage” costs with respect to Eurocurrency Rate loans, provided, however, that if on or prior to the date that is six (6) months following the 2016 First Amendment effective date, the Company prepays any loans under the tranche B term loan facility in connection with a repricing transaction, the Company must pay a prepayment premium of 1.00% of the aggregate principal amount of the tranche B term loans so prepaid.
The Company is required to make scheduled quarterly payments each equal to 1.25% in the case of the tranche A term loan facility, and 0.25% in the case of the tranche B term loan facility, of the original principal amount of the respective term loans made on the closing date, with the balance due at maturity.
The 2016 Credit Agreement contains customary representations and warranties, as well as affirmative and negative covenants. The 2016 Credit Agreement also requires, solely for the benefit of the lenders under the tranche A term loan facility and the revolving credit facility, that the Company maintain at the end of each fiscal quarter the following financial ratios:
• | a consolidated EBITDA to consolidated interest charge coverage ratio of no less than 3.25 to 1.00; and |
• | a consolidated funded indebtedness (excluding (i) up to an agreed amount of consolidated funded indebtedness under permitted securitization transactions and (ii) the non-recourse portion of any permitted factoring transaction) to consolidated EBITDA ratio of, initially, no more than 5.40 to 1.00, which ratio shall step down to 5.25 to 1.00 at December 31, 2016, 5.00 to 1.00 at December 31, 2017, 4.25 to 1.00 at December 31, 2018 and 4.00 to 1.00 at December 31, 2019. |
The obligations under the 2016 Credit Agreement are secured by a security interest in, subject to certain exceptions, substantially all of the assets of the Company pursuant to the terms of a U.S. Security Agreement, dated as of July 1, 2016, in favor of Bank of America, as collateral agent for the lenders.
Debt Covenants
The 2016 Credit Agreement and the Indenture contain covenants that limit the Company and its subsidiaries’ ability and the ability of its restricted subsidiaries and, in certain limited circumstances, WEX Bank and the Company’s other regulated subsidiaries, to (i) incur additional debt, (ii) pay dividends or make other distributions on, redeem or repurchase capital stock, or make investments or other restricted payments, (iii) enter into transactions with affiliates, (iv) dispose of assets or issue stock of restricted subsidiaries or regulated subsidiaries, (v) create liens on assets, or (vi) effect a consolidation or merger or sell all, or
92
WEX INC.
NOTES TO CONSOLIDATED FINANCIAL STATEMENTS (continued)
(in thousands, except per share data)
substantially all, of the Company’s assets. These covenants are subject to important exceptions and qualifications. At any time that the Notes are rated investment grade, which is not currently the case, and subject to certain conditions, certain covenants will be suspended with respect to the Notes. WEX Bank and the Company’s other regulated subsidiaries will not be subject to some of the restrictive covenants in the Indenture that place limitations on the Company and its restricted subsidiaries’ actions, and where WEX Bank and the Company’s regulated subsidiaries are subject to covenants, there are significant exceptions and limitations on the application of those covenants to WEX Bank and the Company’s regulated subsidiaries.
2014 Credit Agreement
On July 1, 2016, concurrently with the financing transactions discussed above, the Company repaid in full all outstanding amounts under the 2014 Credit Agreement and terminated all commitments by the lenders to extend further credit thereunder and all guarantees and security interests granted by the Company to the lenders thereunder. The Company did not incur any early termination penalties in connection with the termination of the 2014 Credit Agreement.
As of June 30, 2016, the Company had borrowings, net of loan origination fees, of $282,639 and $445,000 against its revolving credit facility and amortizing term loan arrangement, respectively. As of June 30, 2016, amounts outstanding under the amortizing term loan bore interest at a rate of LIBOR plus 200 basis points. The revolving credit facility bore interest at a rate equal to, at the Company's option, (a) LIBOR plus 200 basis points, (b) the prime rate plus 100 basis points for domestic borrowings; and the Eurocurrency rate plus 200 basis points for international borrowings.
Notes Outstanding
On January 30, 2013, the Company completed a $400,000 offering in an aggregate principal amount of 4.750 percent senior notes due 2023 (the “Notes”) at an issue price of 100.0 percent of the principal amount, plus accrued interest, from January 30, 2013, in a private placement to “qualified institutional buyers” as defined in Rule 144A under the Securities Act of 1933, as amended (the “Securities Act”), and in offshore transactions pursuant to Regulation S under the Securities Act. The Notes were issued pursuant to the Indenture among the Company, the guarantors listed therein, and The Bank of New York Mellon Trust Company, N.A., as trustee.
The Notes will mature on February 1, 2023, and interest will accrue at the rate of 4.750 percent per annum. Interest is only payable semiannually in arrears on February 1 and August 1 of each year, commencing on August 1, 2013.
The Notes are guaranteed on a senior secured basis by each of the Company’s restricted subsidiaries and each of the Company’s regulated subsidiaries that guarantees the Company’s 2013 Credit Agreement, which, as of the issue date, consist of four of the Company’s restricted subsidiaries. WEX Bank, which represents a substantial amount of the Company’s operations, is not a guarantor and is not subject to many of the restrictive covenants in the indenture governing the Notes.
The Notes and guarantees described above are general senior secured obligations ranking equally with the Company’s existing and future senior debt, senior in right of payment to all of the Company’s subordinated debt, and effectively equal in lien priority to the Company’s 2016 Credit Agreement. In addition, the Notes and the guarantees are structurally subordinated to all liabilities of the Company’s subsidiaries that are not guarantors, including WEX Bank.
At any time on or after February 1, 2018, the Company may redeem the Notes, in whole or in part, at the following redemption prices (expressed as a percentage of principal amount of the Notes) if redeemed during the twelve month period beginning on February 1 of the following years: (i) 102.375 percent in 2018, (ii) 101.583 percent in 2019, (iii) 100.792 percent in 2020, and (iv) 100.0 percent in 2021 and thereafter; plus, in each case, accrued and unpaid interest, if any, to, but excluding, the date of redemption. At any time prior to February 1, 2018, the Company could have redeemed the Notes, in whole or in part, at a redemption price equal to 100.0 percent of the principal amount of such Notes redeemed plus a “make-whole” premium (as described in the Indenture), together with any accrued and unpaid interest, if any, to, but excluding, the date of redemption.
Upon the occurrence of a change of control of the Company (as described in the Indenture), the Company must offer to repurchase the Notes at 101 percent of the principal amount of the Notes, plus accrued and unpaid interest, if any, to, but excluding, the date of repurchase.
93
WEX INC.
NOTES TO CONSOLIDATED FINANCIAL STATEMENTS (continued)
(in thousands, except per share data)
Debt Commitments
The table below summarizes the Company's annual principal payments on its term loans under the 2016 Credit Agreement for each of the next five years:
2018 | $ | 34,750 | |
2019 | 34,750 | ||
2020 | 34,750 | ||
2021 | 364,625 | ||
2022 | $ | 12,000 | |
WEX Latin America Securitization Facility
During the second quarter of 2017, WEX Latin America entered into a securitized debt agreement to sell certain unsecured receivables associated with our salary payment card product to an investment fund managed by an unrelated third-party financial institution. Under the terms of the agreement, the investment fund's purchase price incorporates a discount relative to the face value of the transferred receivables. Additionally, the investment fund compensates WEX Latin America for continuing to service these receivables through their duration, which on average is less than six months.
This securitization arrangement does not meet the derecognition conditions and accordingly WEX Latin America continues to report the transferred receivables in our consolidated balance sheet with no change in the basis of accounting. Additionally, we recognize the cash proceeds received from the investment fund and record offsetting securitized debt in our consolidated balance sheet.
During 2017, WEX Latin America securitized approximately $49,100 of receivables to the investment fund for cash proceeds of approximately $43,800. This $5,300 discount is recognized as operating interest in the Company's consolidated statements of income using the effective interest method over the weighted average term of the salary advances. The Company received approximately $3,000 of servicing fee income upon the sale of these receivables, which is recognized as other revenue in our consolidated statements of income on a straight-line basis over the anticipated loan servicing period. As of December 31, 2017, approximately $19,000 of securitized debt is recognized on our consolidated balance sheet related to this securitization arrangement.
Australian Securitization Facility
During the second quarter of 2017, the Company extended an existing securitized debt agreement with the Bank of Tokyo-Mitsubishi UFJ, Ltd. through April 2018. Under the terms of the agreement, each month, on a revolving basis, the Company sells certain of its Australian receivables to the Company's Australian Securitization Subsidiary. The Australian Securitization Subsidiary, in turn, uses the receivables as collateral to issue asset-backed commercial paper (“securitized debt”) for approximately 85 percent of the securitized receivables. The amount collected on the securitized receivables is restricted to pay the securitized debt and is not available for general corporate purposes.
The Company pays a variable interest rate on the outstanding balance of the securitized debt, based on the Australian Bank Bill Rate plus an applicable margin. The interest rate was 2.53 percent and 2.65 percent as of December 31, 2017 and 2016, respectively. The Company had securitized debt under this facility of approximately $90,000 and $78,600 as of December 31, 2017 and 2016, respectively.
European Securitization Facility
On April 7, 2016, the Company entered into a five year securitized debt agreement with the Bank of Tokyo-Mitsubishi UFJ, Ltd. Under the terms of the agreement, the Company sells certain of its receivables from selected European countries to its European Securitization Subsidiary. The European Securitization Subsidiary, in turn, uses the receivables as collateral to issue securitized debt. The amount collected on the securitized receivables is restricted to pay the securitized debt and is not available for general corporate purposes. The amounts of receivables to be securitized under this agreement are determined by management on a monthly basis. The interest rate was 1.11 percent and 0.95 percent as of December 31, 2017 and 2016, respectively. The Company had securitized debt under this facility of approximately $17,900 and $5,700 as of December 31, 2017 and 2016, respectively.
94
WEX INC.
NOTES TO CONSOLIDATED FINANCIAL STATEMENTS (continued)
(in thousands, except per share data)
Debt Issuance Cost
In the third quarter of 2016, the Company capitalized approximately $49,810 of debt issuance costs, including an original issue discount of $12,000 associated with the 2016 Credit Agreement. These debt issuance costs are being amortized into interest expense over the 2016 Credit Agreement's term using the effective interest method for the tranche A and B term loans and the revolver. Additionally, the Company expensed approximately $5,056 during the third quarter of 2016 related to noncapitalizable third-party costs incurred in connection with the modification of the certain 2014 Credit Agreement syndicate loans.
The Company recognized a loss of $2,018 associated with the early extinguishment of the 2014 Credit Agreement during the year ended December 31, 2016, including a partial write-off of previously capitalized debt issuance costs and newly paid lender fees associated with the extinguishment of syndicate borrowings.
In January 2016, the Company began to incur ticking fees for the debt financing commitment associated with the 2016 Credit Agreement in anticipation of the then pending acquisition of EFS. Pursuant to the terms set forth in the bank commitment letter, the ticking fees were calculated based on the financing commitment in the aggregate amount of $2,125,000, and remained in place until the closing of the EFS acquisition on July 1, 2016 (see Note 3, Business Acquisitions and Other Intangible Asset Acquisitions). Total ticking fees expensed to financing interest were $30,045 for the year ended December 31, 2016. In conjunction with the continued negotiation of the Company's new credit agreement, the amount of ticking fees to be paid at the time of closing was reduced by $7,874 to $22,171. The excess ticking fees were reflected as a reduction of the $49,810 debt issuance costs related to the 2016 Credit Agreement noted above and will be amortized over the 2016 Credit Agreement's term using the effective interest method for the tranche A and B term loans and the revolver.
Other
As of December 31, 2017, WEX Bank pledged approximately $343,800 of fleet receivables held by WEX Bank to the Federal Reserve Bank as collateral for potential borrowings, through the Federal Reserve Bank Discount Window. Amounts that can be borrowed are based on the amount of collateral pledged to the Federal Reserve Bank and were $277,326 as of December 31, 2017. WEX Bank had no borrowings on this line of credit through the Federal Reserve Bank Discount Window as of December 31, 2017.
14. | Income Taxes |
Income (losses) before income taxes consisted of the following:
Year ended December 31, | |||||||||||
2017 | 2016 | 2015 | |||||||||
United States | $ | 149,344 | $ | 32,622 | $ | 203,692 | |||||
Foreign | 29,351 | 54,479 | (18,784 | ) | |||||||
Total | $ | 178,695 | $ | 87,101 | $ | 184,908 | |||||
Income taxes from continuing operations consisted of the following for the years ended December 31:
United States | State and Local | Foreign | Total | ||||||||||||
2017 | |||||||||||||||
Current | $ | 2,253 | $ | 3,687 | $ | 14,473 | $ | 20,413 | |||||||
Deferred | $ | (11,234 | ) | $ | 13,280 | $ | (2,934 | ) | (888 | ) | |||||
Income taxes | $ | 19,525 | |||||||||||||
2016 | |||||||||||||||
Current | $ | (1,232 | ) | $ | 3,033 | $ | 8,325 | $ | 10,126 | ||||||
Deferred | $ | 21,565 | $ | (5,106 | ) | $ | 3,040 | 19,499 | |||||||
Income taxes | $ | 29,625 | |||||||||||||
2015 | |||||||||||||||
Current | $ | 22,570 | $ | 4,288 | $ | 9,173 | $ | 36,031 | |||||||
Deferred | $ | 37,553 | $ | 5,631 | $ | (3,919 | ) | 39,265 | |||||||
Income taxes | $ | 75,296 | |||||||||||||
95
WEX INC.
NOTES TO CONSOLIDATED FINANCIAL STATEMENTS (continued)
(in thousands, except per share data)
2017 Tax Act
On December 22, 2017, the 2017 Tax Act was signed into law making significant changes to the Internal Revenue Code. Changes include, but are not limited to, a federal corporate tax rate decrease from 35% to 21% for tax years beginning after December 31, 2017, the transition of U.S. international taxation from a worldwide tax system to a territorial system and a one-time transition tax on the mandatory deemed repatriation of foreign earnings. The Company has estimated the provision for income taxes in accordance with the 2017 Tax Act and guidance available as of the date of this filing and as a result has recorded a provisional amount of one-time income tax benefit of $60,636 in the fourth quarter of 2017, the period in which the legislation was enacted.
The one-time income tax benefit includes:
• | a tax benefit of $62,488 related to the remeasurement of certain deferred tax assets and liabilities based on the tax rates at which they are expected to reverse in the future; |
• | as discussed in Note 15, Tax Receivable Agreement, for the year ended December 31, 2017, the amount due under our tax receivable agreement decreased primarily as a result of the decline in the federal corporate income tax rate, resulting in the Company recognizing non-taxable income of $15,259. The favorable tax effect of this permanent difference was $5,726; |
• | an income tax expense of $9,098 related to the one-time transition tax on the mandatory deemed repatriation of foreign earnings; and |
• | the reversal of net deferred tax liabilities of $1,520 related to the cumulative undistributed earnings. |
The 2017 Tax Act also changes the taxation of foreign earnings, and companies generally will not be subject to United States federal income taxes upon the receipt of dividends from foreign subsidiaries and will not be permitted foreign tax credits related to such dividends. However, the 2017 Tax Act creates a new requirement to tax certain foreign earnings relating to GILTI. Based on the recent FASB guidance, the Company can elect an accounting policy choice of either treating taxes due on future U.S. inclusions in taxable income related to GILTI as a current period expense when incurred or factoring such amounts into the Company’s measurement of its deferred taxes. Because of the complexity of the new GILTI tax rules, and anticipated guidance from the U.S. Treasury, we will continue to evaluate this provision of the 2017 Tax Act. Therefore, we have not recorded any deferred taxes related to GILTI and have not elected an accounting policy for GILTI at this time.
Undistributed earnings of certain foreign subsidiaries of the Company amounted to $58,675 and $25,824 at December 31, 2017 and 2016, respectively. These earnings are considered to be indefinitely reinvested. Beginning in 2018, except for GILTI, the Company will no longer record United States federal income tax on its share of the income of its foreign subsidiaries, nor will it record a benefit for foreign tax credits related to that income. Accordingly, the Company reversed net deferred tax liabilities related to its cumulative undistributed foreign earnings and deferred tax assets for related foreign tax credits, resulting in a corresponding net tax benefit in 2017. Upon distribution of these earnings in the form of dividends or otherwise, the Company would be subject to withholding taxes payable, where applicable, to foreign countries, but would have no further federal income tax liability.
On December 22, 2017, Staff Accounting Bulletin No. 118 was issued to address the application of U.S. GAAP in situations when a registrant does not have the necessary information available, prepared, or analyzed (including computations) in reasonable detail to complete the accounting for certain income tax effects of the 2017 Tax Act. Accordingly, any subsequent adjustments to the amount of one-time benefit of $60,636 will be recorded to current income tax provision during the measurement period which is not expected to extend beyond one year from the enactment date. The effects of other provisions of the 2017 Tax Act are not expected to have a material impact on our consolidated financial statements.
96
WEX INC.
NOTES TO CONSOLIDATED FINANCIAL STATEMENTS (continued)
(in thousands, except per share data)
The reconciliation between the income tax computed by applying the U.S. federal statutory rate and the reported effective tax rate on income from continuing operations is as follows:
Year ended December 31, | ||||||||
2017 | 2016 | 2015 | ||||||
Federal statutory rate | 35.0 | % | 35.0 | % | 35.0 | % | ||
State income taxes (net of federal income tax benefit) | 2.0 | 1.1 | 2.5 | |||||
Foreign income tax rate differential | (0.6 | ) | (4.4 | ) | 1.4 | |||
Revaluation of deferred tax assets for foreign and state tax rate changes, net | 0.4 | (0.9 | ) | 0.7 | ||||
Research and development credit | — | (0.5 | ) | 0.2 | ||||
Release of tax reserves | — | (4.9 | ) | — | ||||
Withholding taxes | 0.2 | 0.3 | — | |||||
2017 Tax Act | (33.9 | ) | — | — | ||||
Domestic production exclusions | — | — | (1.8 | ) | ||||
Change in valuation allowance | 5.8 | 2.3 | 1.6 | |||||
Nondeductible expenses | 0.9 | 3.4 | 0.3 | |||||
Incremental tax benefit from share-based compensation awards | (0.9 | ) | — | — | ||||
Other | 2.0 | 2.6 | 0.8 | |||||
Effective tax rate | 10.9 | % | 34.0 | % | 40.7 | % | ||
Our effective tax rate was 10.9 percent for 2017 as compared to 34.0 percent for 2016. The decline in our tax rate is primarily due the reduction of our net deferred tax liabilities resulting from the change in federal corporate income tax rate to 21 percent from 35 percent effective January 1, 2018 as part of the 2017 Tax Act, partly offset by the increase in valuation allowance.
Our effective tax rate was 34.0 percent for 2016 as compared to 40.7 percent for 2015. The change in our tax rate reflects a shift in jurisdictional profitability between 2015 and 2016. Increased profits in 2016 within tax jurisdictions with tax rates lower than the United States resulted in a reduction to our effective tax rate. Our 2016 tax rate reflects the release of certain historical foreign reserve positions in Australia, primarily driven by a lapse of statute, as well as a reduction in our domestic production activities deduction as a result of lower taxable income in the United States.
The tax effects of temporary differences in the recognition of income and expense for tax and financial reporting purposes that give rise to significant portions of the deferred tax assets and the deferred tax liabilities are presented below:
December 31, | |||||||
2017 | 2016 | ||||||
Deferred assets related to: | |||||||
Reserve for credit losses | $ | 6,562 | $ | 7,122 | |||
Tax credit carryforwards | 1,283 | 5,178 | |||||
Stock-based compensation, net | 9,858 | 12,729 | |||||
Net operating loss carry forwards | 54,700 | 56,501 | |||||
Accruals | 7,355 | 18,985 | |||||
Deferred financing costs | — | 5,420 | |||||
Other | — | 164 | |||||
Total | 79,758 | 106,099 | |||||
Deferred tax liabilities related to: | |||||||
Other liabilities | 2,060 | 643 | |||||
Deferred financing costs | 7,219 | — | |||||
Property, equipment and capitalized software | 22,315 | 32,759 | |||||
Intangibles | 141,908 | 118,695 | |||||
Investment in partnership | — | 94,354 | |||||
Total | 173,502 | 246,451 | |||||
Valuation allowance | 17,787 | 5,620 | |||||
Deferred income taxes, net | $ | (111,531 | ) | $ | (145,972 | ) | |
97
WEX INC.
NOTES TO CONSOLIDATED FINANCIAL STATEMENTS (continued)
(in thousands, except per share data)
Net deferred tax (liabilities) assets by jurisdiction are as follows:
December 31, | |||||||
2017 | 2016 | ||||||
United States | $ | (116,229 | ) | $ | (148,389 | ) | |
Australia | (945 | ) | (2,020 | ) | |||
United Kingdom | 7,315 | 6,474 | |||||
New Zealand | 188 | 183 | |||||
The Netherlands | 249 | 206 | |||||
Brazil | (1,073 | ) | (2,497 | ) | |||
Canada | (1,036 | ) | 71 | ||||
Deferred income taxes, net | $ | (111,531 | ) | $ | (145,972 | ) | |
The 2017 decrease in our net deferred tax liabilities resulted from the change in federal corporate income tax rate to 21 percent from 35 percent effective January 1, 2018 as part of 2017 Tax Act, partly offset by current year activity. The Company also recorded $34,462 as a reduction to net deferred tax liabilities related to the finalization of purchase price accounting of the EFS acquisition.
At December 31, 2017, the Company changed the tax structure of EFS to convert the limited liability company from a partnership to an entity disregarded as separate from its owners for federal tax purposes. Accordingly, investment in partnership deferred tax liability was allocated to the deferred tax liabilities and assets related to the underlying assets, primarily intangibles. The Company had approximately $294,318 of post apportionment state, $112,688 of federal and $77,622 of foreign net operating loss carry forwards at December 31, 2017 and approximately $211,010 of post apportionment state, $103,739 of federal and $54,062 of foreign net operating loss carry forwards at December 31, 2016. The U.S. losses expire at various times through 2037. Foreign losses in Brazil and the UK have indefinite carry forward periods.
At December 31, 2017, the Company maintained valuation allowances for the following items: (i) acquired and certain net operating losses in the UK (ii) Evolution1’s equity investment in its minority-owned subsidiaries, (iii) state tax credits, and (iv) certain net operating losses and estimated non-deductible expenses. In each case, the Company has determined it is not likely that the benefits will be utilized. No other valuation allowances have been established for any other deferred tax assets as the Company believes it is more likely than not that its deferred tax assets will be utilized within the carry forward periods. During 2017 and 2016, the Company recorded tax expense of $12,167 and $2,000, respectively, for net increases to the valuation allowance. The substantial majority of the 2017 increase in valuation allowance was related to the state net operating losses for our parent company’s separate state filings.
At December 31, 2017, the Company had $4,859 of unrecognized tax benefits, net of federal income tax benefit, of which $3,944, if fully recognized, would decrease our effective tax rate. No significant changes to the existing unrecognized tax benefits are expected within the next 12 months. The Company recognizes interest and penalties related to unrecognized tax benefits in income tax expense. The Company recorded tax expense of $12 and $263 for interest and penalties related to uncertain tax positions for the years ended December 31, 2017 and December 21, 2015, respectively while a tax benefit of $2,251 was recorded for the year ended December 21, 2016. As of December 31, 2017 and 2016, the Company had no material amounts accrued for interest and penalties related to unrecognized tax benefits.
A reconciliation of the beginning and ending amount of gross unrecognized tax benefits excluding interest and penalties is as follows:
Year ended December 31, | |||||||||||
2017 | 2016 | 2015 | |||||||||
Beginning balance | $ | 4,960 | $ | 4,776 | $ | 4,856 | |||||
Increases related to prior year tax positions | 1,332 | 4,960 | 431 | ||||||||
Decreases related to prior year tax positions, due to foreign currency exchange | — | — | (511 | ) | |||||||
Decreases related to prior year tax positions | — | (431 | ) | — | |||||||
Settlements | (1,255 | ) | — | — | |||||||
Lapse of statute | — | (4,345 | ) | — | |||||||
Ending balance | $ | 5,037 | $ | 4,960 | $ | 4,776 | |||||
98
WEX INC.
NOTES TO CONSOLIDATED FINANCIAL STATEMENTS (continued)
(in thousands, except per share data)
The Company’s primary tax jurisdictions are the United States, Australia and the United Kingdom. The Company or one of its subsidiaries files income tax returns in the United States federal jurisdiction and various state and foreign jurisdictions, where required. In the normal course of business, the Company is no longer subject to income tax examination after the Internal Revenue Service statute of limitations of three years. The Internal Revenue Service is currently in the process of examining the Company’s US federal income tax returns for 2010 through 2015. The Company is currently appealing adjustments proposed by the Internal Revenue Service in connection with the ongoing audits. The Company is also subject to an ongoing examination in New Zealand by Inland Revenue for calendar tax years 2013, 2014 and 2015, but no adjustments have been proposed, and the Company believes its position does not warrant a reserve.
15. | Tax Receivable Agreement |
As a consequence of the Company’s separation from its former parent company in 2005, the tax basis of the Company’s net tangible and intangible assets increased (the “Tax Basis Increase”). The Tax Basis Increase reduced the amount of tax that the Company would pay in the future to the extent the Company generated taxable income in sufficient amounts. The Company was contractually obligated, pursuant to its 2005 Tax Receivable Agreement with the Company’s former parent company (Cendant Corporation), to remit 85 percent of any such cash savings.
Pursuant to the Separation and Distribution Agreement dated as of July 27, 2006, by and among Cendant Corporation (now known as Avis Budget Group, Inc. or “Avis”), Realogy Corporation (“Realogy”), Wyndham Worldwide Corporation (“Wyndham”) and Travelport Inc., Realogy acquired from Cendant the right to receive 62.5 percent of the payments by WEX Inc. to Cendant and Wyndham acquired from Cendant the right to receive 37.5 percent of the payments by WEX Inc. to Cendant under the 2005 Tax Receivable Agreement.
On June 26, 2009, the Company entered into a Tax Receivable Prepayment Agreement with Realogy, pursuant to which the Company paid Realogy $51,000, net of bank fees and legal expenses, as prepayment in full to settle the remaining obligations to Realogy under the 2005 Tax Receivable Agreement. In connection with the Tax Receivable Prepayment Agreement with Realogy, the Company entered into a Ratification Agreement on June 26, 2009 (the “Ratification Agreement”) with Avis, Realogy and Wyndham which amended the 2005 Tax Receivable Agreement to require the Company to pay 31.875 percent of the future tax savings related to the Tax Basis Increase to Wyndham.
The estimated amount of future payments owed to Wyndham is reflected as amounts due under tax receivable agreement on the consolidated balance sheets. The estimate is dependent upon future statutory tax rates and the Company’s ability to generate sufficient taxable income adequate to cover the tax depreciation, amortization and interest expense associated with the Tax Basis Increase. Estimated blended tax rates are impacted by a number of factors including tax law changes, statutory tax rate changes, state apportionment and state filing combinations. The Company regularly reviews its estimated blended tax rates and projections of future taxable earnings to determine whether changes in the estimated liability are required. Any changes to the estimated future payments due to changes in estimated blended tax rates are recorded in the consolidated statements of income as non-cash adjustments related to tax receivable agreement.
There has been a reassessment of the projected blended tax rates for each period presented. For the year ended December 31, 2017, the net future benefits decreased, primarily as a result of the decline in Federal statutory tax rate as part of the 2017 Tax Act, which decreased the associated liability to Wyndham, resulting in a $15,259 offset to non-operating expense. In addition, the liability decreased due to payments of $11,769 made during the year ended December 31, 2017. For the year ended December 31, 2016, the net future benefits increased, which increased the associated liability to Wyndham, resulting in a charge to non-operating expense of $563. In addition, the liability decreased due to payments of $10,797 made during the year ended December 31, 2016. For the year ended December 31, 2015, the net future benefits decreased, which decreased the associated liability to Wyndham, resulting in a $2,145 offset to non-operating expense.
16. | Employee Benefit Plans |
The Company sponsors a 401(k) retirement and savings plan. Eligible employees may participate in the plan immediately. The Company’s employees who are at least 18 years of age, have worked at least 1,000 hours in the past year, and have completed one year of service are eligible for Company matching contributions in the plan. The Company matches 100 percent of each employee’s contributions up to a maximum of 6 percent of each employee’s eligible compensation. All contributions vest immediately. WEX Inc. has the right to discontinue the plan at any time. Contributions to the plan are voluntary. The Company contributed $6,710, $5,297 and $4,571 in matching funds to the plan for the years ended December 31, 2017, 2016 and 2015, respectively.
99
WEX INC.
NOTES TO CONSOLIDATED FINANCIAL STATEMENTS (continued)
(in thousands, except per share data)
During 2016, the Company acquired EFS, which as of the date of the acquisition had its own employee savings plan (“the EFS Plan”). As of December 31, 2016, the EFS Plan was merged with the existing WEX plan, and the existing WEX plan recorded a receivable for the amount of net assets available for benefits expected to be received from the EFS Plan. On February 1, 2017, the WEX plan received net assets available for benefits totaling $15,159 in a transfer from the EFS Plan. On January 1, 2017, EFS employees became eligible to participate in the existing WEX plan.
During 2014, the Company acquired Evolution1 which, as of the date of the acquisition, had its own employee savings plan, (“the Evolution1 Plan”). As of December 31, 2014, the Evolution1 Plan was merged with the existing WEX plan, and the existing plan recorded a receivable for the amount of net assets available for benefits it expected to receive from the Evolution1 Plan. Net assets available for benefits totaling $21,739 were received by the plan on January 2, 2015, in a transfer from the Evolution1 Plan. On January 1, 2015, Evolution1 employees became eligible to participate in the existing WEX plan.
The Company also sponsors a defined contribution plan for certain employees designated by the Company. Participants may elect to defer receipt of designated percentages or amounts of their compensation. The Company maintains a grantor’s trust to hold the assets under the Company’s defined contribution plan. The obligation related to the defined contribution plan totaled $6,798 and $5,673 at December 31, 2017 and 2016, respectively, and are included in other liabilities on the consolidated balance sheets. The assets held in trust are designated as trading securities and, as such, these trading securities are to be recorded at fair value with any changes recorded currently to earnings. The aggregate market value of the securities within the trust was $6,798 and $5,673 at December 31, 2017 and 2016, respectively, and are included in other assets on the consolidated balance sheets.
The Company has defined benefit pension plans in Germany and Norway. The total net unfunded status for the Company’s foreign defined benefit pension plans was $291 and $5,979 as of December 31, 2017 and 2016, respectively, recognized as accrued expenses in the consolidated balance sheets. The Company will measure these plan obligations on an annual basis. The change in fair value to the defined benefit pension plans is recorded through the consolidated statements of income. The expense under each of these defined benefit pension plans for 2017 and 2016 was not material to the consolidated financial statements.
17. | Fair Value |
The following table presents the Company’s assets and liabilities that are measured at fair value on a recurring basis and the related hierarchy levels:
December 31, | |||||||||
Fair Value Hierarchy | 2017 | 2016 | |||||||
Assets: | |||||||||
Mortgage-backed securities | 2 | $ | 305 | $ | 490 | ||||
Asset-backed securities | 2 | 345 | 648 | ||||||
Municipal bonds | 2 | 534 | 682 | ||||||
Fixed-income mutual fund | 1 | 22,174 | 21,705 | ||||||
Available-for-sale securities | 23,358 | 23,525 | |||||||
Executive deferred compensation plan trust (a) | 1 | 6,798 | 5,673 | ||||||
Interest rate swaps (a) | 2 | 15,919 | 12,908 | ||||||
Liabilities: | |||||||||
Interest rate swaps (b) | 2 | $ | 1,697 | $ | — | ||||
(a) The fair value is recorded in other assets.
(b) The fair value is recorded in other liabilities.
We did not have any transfers between Level 1, Level 2 or Level 3 of the fair value hierarchy during the years ended December 31, 2017 and 2016. See Note 1, Summary of Significant Accounting Policies for a description of the levels of the fair value hierarchy.
Available-For-Sale Securities
When available, the Company uses quoted market prices to determine the fair value of available-for-sale securities; such inputs are classified as Level 1 of the fair-value hierarchy. These securities primarily consist of an open-ended mutual fund which
100
WEX INC.
NOTES TO CONSOLIDATED FINANCIAL STATEMENTS (continued)
(in thousands, except per share data)
is invested in fixed-income securities and is held in order to satisfy the regulatory requirements of WEX Bank. For mortgage-backed and asset-backed debt securities and bonds, the Company generally uses quoted prices for recent trading activity of assets with similar characteristics to the debt security or bond being valued. The securities and bonds priced using such methods are generally valued using Level 2 inputs.
Executive Deferred Compensation Plan Trust
The obligations related to the deferred compensation plan trust are classified as Level 1 in the fair value hierarchy because the fair value is determined using quoted prices for identical instruments in active markets.
Interest Rate Swaps
The Company determines the fair value of its interest rate swaps based on the discounted cash flows of the difference between the projected fixed payments on the swaps and the implied floating payments using the current LIBOR curve, which are Level 2 inputs of the fair value hierarchy.
Notes Outstanding
On January 30, 2013, the Company completed an offering in an aggregate principal amount of $400,000 of 4.750 percent senior notes due February 1, 2023, with interest payable semiannually. The Notes outstanding have a fair value of $410,000 and $390,000 as of December 31, 2017 and December 31, 2016, respectively. The fair value is based on market rates for the issuance of our debt. The Company determined the fair value of its Notes outstanding is classified as Level 2 in the fair value hierarchy.
2016 Credit Agreement
The Company determines the fair value of the amount outstanding under its 2016 Credit Agreement based on the market rates for the issuance of the Company's debt which are Level 2 inputs in the fair value hierarchy. As of both December 31, 2017 and 2016, the carrying value of the 2016 Credit Agreement approximated its fair value.
18. | Commitments and Contingencies |
Litigation
On August 11, 2016, the Company was sued in the Circuit Court of St. Charles County, Missouri, in a putative class action alleging the Company improperly sent unauthorized facsimile advertisements in violation of the Telephone Consumer Protection Act, 47 U.S.C. § 227 (the “TCPA”). The named plaintiff sought to represent a nationwide class of recipients of unauthorized facsimile advertisements from the Company (collectively, the "Plaintiffs") and requested statutory damages for each facsimile advertisement. The Plaintiffs further alleged that the opt-out notice of the faxes did not meet the criteria set forth in the TCPA or its underlying regulations. The Company removed the case to the United States District Court for the Eastern District of Missouri on September 15, 2016. On October 14, 2016, the Company filed an answer denying liability and stating the facsimile advertisement at issue was sent by FleetOne, LLC, the Company’s wholly-owned subsidiary. On May 10, 2017, the parties agreed to a settlement in principle to resolve the class claims, which was preliminarily approved by the court on October 6, 2017. The court entered its final judgment approving the settlement agreement on January 19, 2018. The settlement amount is not material to the Company's financial position, results of operations, cash flows or liquidity.
In addition, from time to time, we are subject to legal proceedings and claims in the ordinary course of business. As of the date of this filing, the current estimate of a reasonably possible loss contingency from all legal proceedings is not material to the Company's consolidated financial position, results of operations, cash flows or liquidity.
Extension of Credit to Customers
The Company had aggregate unused commitments of approximately $6,300,000 and $5,400,000 at December 31, 2017 and 2016, respectively, related to payment processing services, primarily related to commitments to extend credit to customers and customers of strategic relationships as part of the Company’s established lending product agreements. Many of these commitments are not expected to be used; therefore, total unused credit available to customers and customers of strategic relationships does not represent future cash requirements. The Company can increase or decrease its customers’ credit lines at its discretion at any time, subject to limited notice requirements in some instances. These amounts are not recorded on the consolidated balance sheets.
101
WEX INC.
NOTES TO CONSOLIDATED FINANCIAL STATEMENTS (continued)
(in thousands, except per share data)
Operating Leases
The Company leases office space and equipment under non-cancelable operating lease agreements that expire at various dates through 2026. In addition, the Company rents office equipment under agreements that may be canceled at any time. Rental expense related to office space, equipment, and vehicle leases amounted to $15,471, $15,104 and $11,310 for the years ended December 31, 2017, 2016 and 2015, respectively. These amounts were included in occupancy and equipment on the consolidated statements of income. The Company leases information technology hardware and software under agreements that may be terminated by the Company at any time. Lease and rental expense related to information technology hardware and software leases totaled $8,765, $12,875 and $11,288 for the years ended December 31, 2017, 2016 and 2015, respectively. These amounts were included in technology leasing and support on the consolidated statements of income.
Future minimum lease payments under non-cancelable operating leases are as follows:
2018 | $ | 13,559 | |
2019 | 9,903 | ||
2020 | 8,532 | ||
2021 | 8,093 | ||
2022 | 6,734 | ||
Thereafter | 10,214 | ||
Total minimum lease payments | $ | 57,035 | |
Minimum Volume Purchase Commitments
One of the Company's subsidiaries is required to purchase a minimum amount of fuel from suppliers on an annual basis through 2024. Should the Company fail to meet these minimum volume commitments, a penalty will be assessed as defined under the contracts. Starting in 2020, annual volume commitments reset based on prior year volume purchased. If the Company does not purchase fuel under these commitments after December 31, 2017, it would incur total penalties through 2019 totaling $362,856. During the year ended December 31, 2017, the Company incurred $1,217 in shortfall penalties under these contracts. During the years ended December 31, 2016 and 2015, the Company did not incur material shortfall penalties under these contracts. The Company considers the associated risk of loss to be remote based on current operations.
19. | Accumulated Other Comprehensive Loss |
A reconciliation of accumulated other comprehensive loss for the years ended December 31, 2017 and 2016, is as follows:
2017 | 2016 | ||||||||||||||
Unrealized Losses on Available- for-Sale Securities | Foreign Currency Items | Unrealized Losses on Available- for-Sale Securities | Foreign Currency Items | ||||||||||||
Beginning balance | $ | (463 | ) | $ | (122,376 | ) | $ | (212 | ) | $ | (103,239 | ) | |||
Other comprehensive loss | (5 | ) | 32,049 | (251 | ) | (19,137 | ) | ||||||||
Ending balance | $ | (468 | ) | $ | (90,327 | ) | $ | (463 | ) | $ | (122,376 | ) | |||
No significant amounts were reclassified from accumulated other comprehensive loss in the periods presented.
The change in foreign currency items is primarily due to the foreign currency translation of non-cash assets such as goodwill and other intangible assets related to the Company's foreign subsidiaries. The total tax effect on foreign currency translation adjustments was $4,851 and $5,416 as of December 31, 2017 and 2016, respectively.
20. | Dividend Restrictions |
The Company has certain restrictions on the dividends it may pay under its revolving credit agreement, including pro forma compliance with a ratio of consolidated funded indebtedness to consolidated EBITDA of 2.50:1.00 for the most recent period of four fiscal quarters. However, if the Company's leverage ratio does not exceed 5.25 through September 30, 2017, 5.00 through September 30, 2018, 4.50 through September 30, 2019, or 4.00 from December 31, 2019 and thereafter, after execution
102
WEX INC.
NOTES TO CONSOLIDATED FINANCIAL STATEMENTS (continued)
(in thousands, except per share data)
of a restricted payment, the Company may pay $50,000 per annum for restricted payments, including dividends, of which 100% of unused amounts may be carried over into subsequent years. The Company has not declared any dividends on its common stock since it commenced trading on the NYSE on February 16, 2005.
Dividends paid by WEX Bank have provided a substantial part of the Company’s operating funds and for the foreseeable future it is anticipated that dividends paid by WEX Bank will continue to be a source of operating funds to the Company. Capital adequacy requirements serve to limit the amount of dividends that may be paid by WEX Bank. WEX Bank is chartered under the laws of the State of Utah and the FDIC insures its deposits. Under Utah law, WEX Bank may only pay a dividend out of net profits after it has (i) provided for all expenses, losses, interest and taxes accrued or due from WEX Bank and (ii) transferred to a surplus fund 10 percent of its net profits before dividends for the period covered by the dividend, until the surplus reaches 100 percent of its capital stock. For purposes of these Utah dividend limitations, WEX Bank’s capital stock is $5,250 and its capital surplus exceeds 100 percent of capital stock.
Under FDIC regulations, WEX Bank may not pay any dividend if, following the payment of the dividend, WEX Bank would be “undercapitalized,” as defined under the Federal Deposit Insurance Act and applicable regulations. The FDIC also has the authority to prohibit WEX Bank from engaging in business practices that the FDIC considers to be unsafe or unsound, which, depending on the financial condition of WEX Bank, could include the payment of dividends.
WEX Bank complied with the aforementioned dividend restrictions for each of the years ended December 31, 2017, 2016 and 2015.
21. | Stock-Based Compensation |
In 2010, the Company adopted the WEX Inc. 2010 Equity Incentive Plan (the “Plan”), which replaced the Company’s 2005 Equity and Incentive Plan. In May 2015, the Company adopted the 2015 Section 162(m) Performance Incentive Plan (collectively the “Plans”). The Plans, which are stockholder-approved, permit the grant of stock options, stock appreciation rights, restricted stock, restricted stock units and other stock-based or cash-based awards to non-employee directors, officers, employees, advisors or consultants. The Plans permit the Company to grant a total number of shares which is the sum of; (i) 3,800 shares of common stock; (ii) plus such additional number of shares of common stock (up to 1,596) that were reserved for issuance under the Company’s Amended and Restated 2005 Equity and Incentive Plan (the “Prior Plan”) that remained available for grant under the Prior Plan at the time the 2010 Plan was adopted. There were 1,617,334 units of common stock available for grant for future equity-incentive compensation awards under the Plan at December 31, 2017.
On December 31, 2017, the Company had four stock-based compensation award types, which are described below. The compensation cost that has been charged against income for these programs totals $30,487, $19,742 and $12,420 for 2017, 2016 and 2015, respectively. The associated tax benefit related to these costs was $7,347, $7,200 and $4,542, for 2017, 2016 and 2015, respectively.
Restricted Stock Units
The Company periodically grants restricted stock units (“RSUs”), which represent a right to receive a specific number of shares of the Company's common stock at a specified date, to non-employee directors and certain employees. RSUs granted to non-employee directors vest 12 months from the date of grant, or upon termination of board service if the director elects to defer receipt. RSUs issued to certain employees generally vest evenly over up to three years and provide for accelerated vesting if there is a change of control (as defined in the Plan). The fair value of each RSU award is based on the closing market price of the Company’s stock on the day of grant as reported by the New York Stock Exchange (“NYSE”).
The following is a summary of RSU activity during the year ended December 31, 2017:
Restricted Stock Units | Units | Weighted- Average Grant- Date Fair Value | ||||
Outstanding at January 1, 2017 | 206 | $ | 88.78 | |||
Granted | 111 | 105.64 | ||||
Shares released, including 26 shares withheld for tax (a) | (86 | ) | 84.51 | |||
Forfeited | (58 | ) | 98.98 | |||
Outstanding at December 31, 2017 | 173 | $ | 98.31 | |||
103
WEX INC.
NOTES TO CONSOLIDATED FINANCIAL STATEMENTS (continued)
(in thousands, except per share data)
(a) The Company withholds shares of common stock to pay the minimum required statutory taxes due upon RSU vesting. Cash is then remitted by the Company to the appropriate taxing authority.
As of December 31, 2017, there was $9,613 of total unrecognized compensation cost related to RSUs. That cost is expected to be recognized over a weighted-average period of 1.3 years. The total grant-date fair value of RSUs granted was $11,700, $18,826 and $7,846 during 2017, 2016 and 2015, respectively. The total fair value of RSUs that vested during 2017, 2016 and 2015 was $7,310, $3,648 and $4,521, respectively.
Performance-Based Restricted Stock Units
The Company periodically grants performance-based restricted stock units (“PBRSUs”) to employees. A PBRSU is a right to receive stock based on the achievement of both performance goals and continued employment during the vesting period. In a PBRSU, the number of shares earned varies based upon meeting certain performance goals. PBRSU awards generally have performance goals spanning one to three years, depending on the nature of the performance goal. The fair value of each PBRSU award is based on the closing market price of the Company’s stock on the grant date as reported by the NYSE.
The following is a summary of PBRSU activity during the year ended December 31, 2017:
Performance-Based Restricted Stock Units | Shares | Weighted- Average Grant-Date Fair Value | ||||
Outstanding at January 1, 2017 | 310 | $ | 84.83 | |||
Granted | 185 | 105.15 | ||||
Forfeited | (27 | ) | 85.31 | |||
Vested, including 64 shares withheld for tax (a) | (174 | ) | 91.92 | |||
Performance adjustment | 20 | 89.85 | ||||
Outstanding at December 31, 2017 | 314 | $ | 93.18 | |||
(a) The Company withholds shares of common stock to pay the minimum required statutory taxes due upon PBRSU vesting. Cash is then remitted by the Company to the appropriate taxing authority.
As of December 31, 2017, there was $13,430 of unrecognized compensation cost related to the PBRSUs that is expected to be recognized over a weighted-average period of 1.9 years. The total grant-date fair value of PBRSUs granted during 2017, 2016 and 2015 was $15,014, $15,921 and $6,860, respectively. The total fair value of PBRSUs that vested during 2017, 2016 and 2015 was $15,948, $4,858 and $2,035, respectively.
Stock Options
Market Performance-Based Stock Options
In May 2017, the Company granted market performance-based stock options with a contractual term of ten years to members of senior management. The options contain a market condition that begins operating on the third anniversary of the grant date, requiring the closing price of the Company's stock to meet or exceed certain price thresholds for twenty consecutive trading days (“Stock Price Hurdle”) in order for shares to vest. In addition, award recipients must be continually employed from the grant date until such date that the Stock Price Hurdle is satisfied in order for shares to vest. To the extent both the service condition and the Stock Price Hurdles are not met by the end of a defined measurement period, these options will be canceled.
The grant date fair value of these options was estimated on the date of the grant using a Monte-Carlo simulation model used to simulate a distribution of future stock price paths based on historical volatility levels.
The table below summarizes the assumptions used to calculate the fair value:
Exercise price | $ | 99.69 | |
Expected stock price volatility | 31.14 | % | |
Risk-free interest rate | 2.18 | % | |
Weighted average fair value of performance options granted | $ | 28.69 | |
104
WEX INC.
NOTES TO CONSOLIDATED FINANCIAL STATEMENTS (continued)
(in thousands, except per share data)
The Company will expense these options on a graded basis over the derived service period of approximately three years regardless of whether the market condition is satisfied. Upon satisfaction of a Stock Price Hurdle, any unrecognized compensation expense for that specific tranche will be accelerated.
Service-Based Stock Options
Stock options granted to certain officers and employees under the Plan generally become exercisable over three years (with approximately 33 percent of the total grant vesting each year on the anniversary of the grant date) and expire 10 years from the date of grant.
Based on the Company's lack of historical option exercise experience and granting of stock options with "plain vanilla” characteristics, the Company uses the simplified method to estimate the expected term of its employee stock options. The fair value of each option award is estimated on the grant date using the following assumptions and a Black-Scholes-Merton option-pricing model. The expected term assumption as it relates to the valuation of the options represents the period of time that options granted are expected to be outstanding. The Company also estimates expected volatilities that are based on implied volatilities from traded options on the Company's stock, historical volatility of the Company’s stock, and other factors. The option-pricing model includes a risk-free interest rate for the period matching the expected term of the option and is based on the U.S. Treasury yield curve in effect at the time of the grant. The dividend yield used in the option-pricing model is the calculated yield on the Company’s stock at the time of the grant.
The table below summarizes the assumptions used to calculate the fair value by year of grant:
2017 | 2016 | 2015 | |||||||||
Weighted average expected life (in years) | 6.0 | 6.0 | 6.0 | ||||||||
Weighted average exercise price | $ | 104.95 | $ | 77.20 | $ | 103.40 | |||||
Weighted average volatility | 30.67 | % | 31.93 | % | 30.46 | % | |||||
Weighted average risk-free rate | 2.13 | % | 1.62 | % | 1.73 | % | |||||
Weighted average fair value | $ | 35.58 | $ | 26.14 | $ | 33.93 | |||||
The following is a summary of all stock option activity during the year ended December 31, 2017:
Stock Options | Shares | Weighted- Average Exercise Price | Weighted- Average Remaining Contractual Term (in years) | Aggregate Intrinsic Value | ||||||||
Outstanding at January 1, 2017 | 180 | $ | 81.90 | |||||||||
Granted | 682 | 100.72 | ||||||||||
Exercised | (12 | ) | 59.43 | |||||||||
Forfeited | (16 | ) | 78.96 | |||||||||
Outstanding at December 31, 2017 | 834 | $ | 97.70 | 9.07 | $ | 36,302 | ||||||
Exercisable on December 31, 2017 | 66 | $ | 88.90 | 7.77 | $ | 3,452 | ||||||
Vested and expected to vest at December 31, 2017 | 760 | $ | 98.45 | 9.18 | $ | 32,529 | ||||||
As of December 31, 2017, there was $17,077 of total unrecognized compensation cost related to options. That cost is expected to be recognized over a weighted-average period of 1.2 years. The total intrinsic value of options exercised during the years ended December 31, 2017, 2016 and 2015 was $642, $1,712 and $216, respectively. The total grant-date fair value of options granted during 2017, 2016 and 2015 was $20,516, $3,297, and $1,855, respectively.
Deferred Stock Units
Non-employee directors may elect to defer their cash fees and RSUs in the form of deferred stock units ("DSUs"). The Company previously granted non-employee directors fully vested RSUs. These awards were fully vested upon grant and are distributed as common stock on the date which is 200 days immediately following the date upon which such director’s service as a member of the Company’s Board of Directors terminates for any reason. There were approximately 94 and 101 DSUs outstanding as of December 31, 2017 and 2016, respectively. Unvested DSUs as of December 31, 2017 and 2016 were not material.
105
WEX INC.
NOTES TO CONSOLIDATED FINANCIAL STATEMENTS (continued)
(in thousands, except per share data)
22. | Impairment and Restructuring Activities |
Impairment Charges and Asset Write-Offs
Following the acquisition of AOC in the fourth quarter of 2017, the Company reevaluated software currently under development for payment processing within our Travel and Corporate Solutions segment. From this, we determined the developed technology obtained in the AOC acquisition more closely aligns with our technological strategy. As result, approximately $22,000 of software under development was determined to have no future benefit and therefore impaired during the year ended December 31, 2017. We also impaired approximately $6,000 of computer software within the Fleet Solutions segment in 2017 as a result of our ongoing platform consolidation strategy, designed to ensure we continue to deliver superior technology to our customers.
During the year ended December 31, 2017, the Company executed a vendor contract amendment based on a strategic decision to in-source certain previously outsourced technology functions. As a result of this action, the Company determined that approximately $16,000 of prepaid services had no future benefit and were therefore written off within the Fleet Solutions segment during the same period.
Restructuring
In the first quarter of 2015, the Company commenced a restructuring initiative (the “2015 Restructuring Initiative”) as a result of its global review of operations. The review of operations identified certain initiatives to further streamline the business, to improve the Company's efficiency, and to globalize the Company's operations, all with an objective to improve scale and increase profitability going forward. The Company continued its efforts to improve its overall operational efficiency and began a second restructuring initiative (the “2016 Restructuring Initiative”) during the second quarter of 2016. In connection with the EFS acquisition, the Company initiated a restructuring program in the third quarter of 2016 (the “Acquisition Integration Restructuring Initiative”).
The restructuring expenses related to these initiatives primarily consist of employee costs and office closure costs directly associated with the respective programs. The Company has determined the amount of expenses related to these initiatives is probable and reasonably estimable. As such, it has recorded the impact on the consolidated statements of income and in accrued expenses on the consolidated balance sheets. Restructuring charges incurred to date under these initiatives were $24,479 as of December 31, 2017.
The balances under these initiatives are expected to be paid through 2018. Based on current plans, which are subject to change, the amount of additional restructuring costs that the Company expects to incur is immaterial.
The following table presents the Company's 2015 Restructuring Initiative liability:
Years Ended December 31, | |||||||
2017 | 2016 | ||||||
Balance, beginning of year | $ | 5,231 | $ | 7,249 | |||
Restructuring charges1 | 2,642 | 2,182 | |||||
Reserve release | (77 | ) | (816 | ) | |||
Cash paid | (4,020 | ) | (3,921 | ) | |||
Other2 | (1,158 | ) | (166 | ) | |||
Impact of foreign currency translation | 62 | 703 | |||||
Balance, end of year | $ | 2,680 | $ | 5,231 | |||
1 Primarily consists of employee costs.
2 In 2017, the liability was transferred to the 2016 Restructuring Initiative.
106
WEX INC.
NOTES TO CONSOLIDATED FINANCIAL STATEMENTS (continued)
(in thousands, except per share data)
The following table presents the Company's 2016 Restructuring Initiative liability:
Years Ended December 31, | |||||||
2017 | 2016 | ||||||
Balance, beginning of year | $ | 3,662 | $ | — | |||
Restructuring charges1 | 285 | 3,506 | |||||
Reserve release | (1,590 | ) | — | ||||
Cash paid | (3,479 | ) | (4 | ) | |||
Other2 | 1,158 | 166 | |||||
Impact of foreign currency translation | 702 | (6 | ) | ||||
Balance, end of year | $ | 738 | $ | 3,662 | |||
1 Primarily consists of employee costs.
2 In 2017, the liability was transferred from the 2015 Restructuring Initiative.
The following table presents the Company's Acquisition Integration Restructuring Initiative liability:
Years Ended December 31, | |||||||
2017 | 2016 | ||||||
Balance, beginning of year | $ | 1,764 | $ | — | |||
Restructuring charges1 | 6,121 | 2,614 | |||||
Reserve release | (242 | ) | — | ||||
Cash paid | (2,650 | ) | (850 | ) | |||
Other | 107 | — | |||||
Impact of foreign currency translation | (7 | ) | — | ||||
Balance, end of year | $ | 5,093 | $ | 1,764 | |||
1 Primarily consists of office closure costs.
The following table presents the Company's total restructuring liability:
Years Ended December 31, | |||||||
2017 | 2016 | ||||||
Balance, beginning of year | $ | 10,657 | $ | 7,249 | |||
Restructuring charges | 9,048 | 8,302 | |||||
Reserve release | (1,909 | ) | (816 | ) | |||
Cash paid | (10,149 | ) | (4,775 | ) | |||
Other | 107 | — | |||||
Impact of foreign currency translation | 757 | 697 | |||||
Balance, end of year | $ | 8,511 | $ | 10,657 | |||
107
WEX INC.
NOTES TO CONSOLIDATED FINANCIAL STATEMENTS (continued)
(in thousands, except per share data)
23. | Segment Information |
Operating segments are defined as components of an enterprise about which separate financial information is available and is evaluated regularly by the chief operating decision maker (“CODM”) in deciding how to allocate resources and assess performance. The Company's CODM is its Chief Executive Officer. The operating segments are aggregated into the three reportable segments described below.
• | Fleet Solutions provides customers with payment and transaction processing services specifically designed for the needs of commercial and government fleets. This segment also provides information management services to these fleet customers. |
• | Travel and Corporate Solutions focuses on the complex payment environment of business-to-business payments, providing customers with payment processing solutions for their corporate payment and transaction monitoring needs. |
• | Health and Employee Benefit Solutions provides healthcare payment products and SaaS consumer directed platforms, as well as payroll related benefits to customers. |
During the third quarter of 2017, the Company revised its operating segment measurement from adjusted pre-tax income to adjusted operating income. The Company no longer allocates financing interest expense to our operating segments as management believes this item can obscure underlying business trends. As such, we believe adjusted operating income reflects an enhanced measurement of segment profitability. Segment results for the years ended December 31, 2016 and 2015 have been revised to reflect this change in operating segment measurement.
Adjusted operating income adjusts operating income to exclude: (i) acquisition and divestiture related items (including acquisition-related intangible amortization); (ii) stock-based compensation; (iii) restructuring and other costs; (iv) gains on divestitures; (v) debt restructuring costs (vi) reserves for regulatory penalties, (vii) impairment charges and asset write-offs. For the year ended December 31, 2016, adjusted operating income excluded a vendor settlement.
The accounting policies of the reportable segments are generally the same as those described in the summary of significant accounting policies. Assets are not allocated to the segments for internal reporting purposes.
The following tables present the Company’s reportable segment results on an adjusted operating income basis for the years ended December 31, 2017, 2016 and 2015:
Year Ended December 31, 2017 | Fleet Solutions | Travel and Corporate Solutions | Health and Employee Benefit Solutions | Total | |||||||||||
Payment processing revenue | $ | 360,158 | $ | 158,660 | $ | 50,348 | $ | 569,166 | |||||||
Account servicing revenue | 165,083 | 7,531 | 103,956 | 276,570 | |||||||||||
Finance fee revenue | 159,336 | 760 | 27,486 | 187,582 | |||||||||||
Other revenue | 138,389 | 57,096 | 21,745 | 217,230 | |||||||||||
Total revenue | $ | 822,966 | $ | 224,047 | $ | 203,535 | $ | 1,250,548 | |||||||
Depreciation and amortization | $ | 143,301 | $ | 17,703 | $ | 42,720 | $ | 203,724 | |||||||
Adjusted operating income | $ | 297,322 | $ | 117,432 | $ | 50,718 | $ | 465,472 | |||||||
108
WEX INC.
NOTES TO CONSOLIDATED FINANCIAL STATEMENTS (continued)
(in thousands, except per share data)
Year Ended December 31, 2016 | Fleet Solutions | Travel and Corporate Solutions | Health and Employee Benefit Solutions | Total | |||||||||||
Payment processing revenue | $ | 297,900 | $ | 175,762 | $ | 46,957 | $ | 520,619 | |||||||
Account servicing revenue | 127,106 | 1,247 | 82,660 | 211,013 | |||||||||||
Finance fee revenue | 124,725 | 643 | 13,572 | 138,940 | |||||||||||
Other revenue | 92,330 | 37,595 | 17,963 | 147,888 | |||||||||||
Total revenue | $ | 642,061 | $ | 215,247 | $ | 161,152 | $ | 1,018,460 | |||||||
Depreciation and amortization | $ | 100,860 | $ | 6,187 | $ | 34,604 | $ | 141,651 | |||||||
Adjusted operating income | $ | 215,424 | $ | 104,531 | $ | 43,118 | $ | 363,073 | |||||||
Year Ended December 31, 2015 | Fleet Solutions | Travel and Corporate Solutions | Health and Employee Benefit Solutions | Total | |||||||||||
Payment processing revenue | $ | 305,855 | $ | 151,311 | $ | 38,703 | $ | 495,869 | |||||||
Account servicing revenue | 100,850 | 1,930 | 53,912 | 156,692 | |||||||||||
Finance fee revenue | 83,554 | 326 | 5,113 | 88,993 | |||||||||||
Other revenue | 57,419 | 41,852 | 13,812 | 113,083 | |||||||||||
Total revenue | $ | 547,678 | $ | 195,419 | $ | 111,540 | $ | 854,637 | |||||||
Depreciation and amortization | $ | 54,453 | $ | 2,999 | $ | 25,625 | $ | 83,077 | |||||||
Adjusted operating income | $ | 186,731 | $ | 87,380 | $ | 28,576 | $ | 302,687 | |||||||
No one customer accounted for more than 10 percent of the total consolidated revenue in 2017, 2016 or 2015.
The following table presents the Company's interest income by segment for the years ended December 31, 2017, 2016 and 2015:
2017 | 2016 | 2015 | |||||||||
Fleet Solutions | $ | 3,681 | $ | 3,053 | $ | 1,704 | |||||
Travel and Corporate Solutions | 717 | 498 | 348 | ||||||||
Health and Employee Benefit Solutions | 27,507 | 13,581 | 5,116 | ||||||||
Total interest income | $ | 31,905 | $ | 17,132 | $ | 7,168 | |||||
109
WEX INC.
NOTES TO CONSOLIDATED FINANCIAL STATEMENTS (continued)
(in thousands, except per share data)
The following table reconciles adjusted operating income to income before income taxes:
Year ended December 31, | |||||||||||
2017 | 2016 | 2015 | |||||||||
Fleet Solutions | $ | 297,322 | $ | 215,424 | $ | 186,731 | |||||
Travel and Corporate Solutions | 117,432 | 104,531 | 87,380 | ||||||||
Health and Employee Benefit Solutions | 50,718 | 43,118 | 28,576 | ||||||||
Adjusted operating income | $ | 465,472 | $ | 363,073 | $ | 302,687 | |||||
Acquisition-related intangible amortization | (153,810 | ) | (97,829 | ) | (47,792 | ) | |||||
Other acquisition and divestiture related items | (5,000 | ) | (20,879 | ) | (4,137 | ) | |||||
Stock-based compensation | (30,487 | ) | (19,742 | ) | (12,420 | ) | |||||
Restructuring and other costs | (11,129 | ) | (13,995 | ) | (9,010 | ) | |||||
Impairment charges and asset write-offs | (44,171 | ) | — | — | |||||||
Gain on divestiture | 20,958 | — | 1,215 | ||||||||
Vendor settlement | — | (15,500 | ) | — | |||||||
Debt restructuring | (2,563 | ) | — | — | |||||||
Regulatory reserve | — | — | (1,750 | ) | |||||||
Operating income | $ | 239,270 | $ | 195,128 | $ | 228,793 | |||||
Financing interest expense | (107,067 | ) | (113,418 | ) | (46,189 | ) | |||||
Net foreign currency gain (loss) | 29,919 | (7,665 | ) | (5,689 | ) | ||||||
Net unrealized gains on interest rate swap agreements | 1,314 | 12,908 | — | ||||||||
Net realized and unrealized gains on fuel price derivatives | — | 711 | 5,848 | ||||||||
Non-cash adjustments related to tax receivable agreement | 15,259 | (563 | ) | 2,145 | |||||||
Income before income taxes | $ | 178,695 | $ | 87,101 | $ | 184,908 | |||||
Geographic Data
Revenue by principal geographic area, based on the country in which the sale originated, was as follows:
Year ended December 31, | |||||||||||
2017 | 2016 | 2015 | |||||||||
United States | $ | 1,037,322 | $ | 839,917 | $ | 691,088 | |||||
Australia | 62,030 | 53,068 | 50,387 | ||||||||
Other international1 | 151,196 | 125,475 | 113,162 | ||||||||
Total revenues | $ | 1,250,548 | $ | 1,018,460 | $ | 854,637 | |||||
1 No single country, other than the United States and Australia, made up more than 5 percent of total revenues for any of the years presented.
Net property, equipment and capitalized software are subject to geographic risks because they are generally difficult to move and relatively illiquid. Net property, equipment and capitalized software by principal geographic area was as follows:
Year ended December 31, | |||||||||||
2017 | 2016 | 2015 | |||||||||
United States | $ | 148,490 | $ | 146,165 | $ | 79,265 | |||||
Australia | 5,432 | 5,493 | 5,445 | ||||||||
Other international | 9,986 | 15,620 | 53,875 | ||||||||
Net property, equipment and capitalized software | $ | 163,908 | $ | 167,278 | $ | 138,585 | |||||
24. | Supplementary Regulatory Capital Disclosure |
The Company's subsidiary, WEX Bank is subject to various regulatory capital requirements administered by the FDIC and the Utah Department of Financial Institutions. Failure to meet minimum capital requirements can initiate certain mandatory,
110
WEX INC.
NOTES TO CONSOLIDATED FINANCIAL STATEMENTS (continued)
(in thousands, except per share data)
and possible additional discretionary, actions by regulators that, if undertaken, could have a direct material effect on the Company’s financial statements. Under capital adequacy guidelines and the regulatory framework for prompt corrective action, WEX Bank must meet specific capital guidelines that involve quantitative measures of WEX Bank’s assets, liabilities, and certain off-balance-sheet items as calculated under regulatory accounting practices. WEX Bank’s capital amounts and classification are also subject to qualitative judgments by the regulators about components, risk weightings, and other factors.
Quantitative measures established by regulation to ensure capital adequacy require WEX Bank to maintain minimum amounts and ratios as defined in the regulations. As of December 31, 2017 and December 31, 2016, the most recent FDIC exam report categorized WEX Bank as “well capitalized” under the regulatory framework for prompt corrective action. There are no conditions or events subsequent to that examination report that management believes have changed WEX Bank’s capital rating.
The following table presents WEX Bank's actual and regulatory minimum capital amounts and ratios:
Actual Amount | Ratio | Minimum for Capital Adequacy Purposes Amount | Ratio | Minimum to Be Well Capitalized Under Prompt Corrective Action Provisions Amount | Ratio | |||||||||||||||
December 31, 2017 | ||||||||||||||||||||
Total Capital to risk-weighted assets | $ | 316,129 | 13.38 | % | $ | 188,991 | 8.00 | % | $ | 236,239 | 10.00 | % | ||||||||
Tier 1 Capital to average assets | 304,555 | 12.50 | % | 97,452 | 4.00 | % | 121,815 | 5.00 | % | |||||||||||
Common equity to risk-weighted assets | 304,555 | 12.89 | % | 106,308 | 4.50 | % | 153,555 | 6.50 | % | |||||||||||
Tier 1 Capital to risk-weighted assets | $ | 304,555 | 12.89 | % | $ | 141,743 | 6.00 | % | $ | 188,991 | 8.00 | % | ||||||||
December 31, 2016 | ||||||||||||||||||||
Total Capital to risk-weighted assets | $ | 228,402 | 12.59 | % | $ | 145,182 | 8.00 | % | $ | 181,477 | 10.00 | % | ||||||||
Tier 1 Capital to average assets | 214,847 | 11.10 | % | 77,413 | 4.00 | % | 96,767 | 5.00 | % | |||||||||||
Common equity to risk-weighted assets | 214,847 | 11.84 | % | 81,665 | 4.50 | % | 117,961 | 6.50 | % | |||||||||||
Tier 1 Capital to risk-weighted assets | $ | 214,847 | 11.84 | % | $ | 108,887 | 6.00 | % | $ | 145,183 | 8.00 | % | ||||||||
25. | Subsequent Event |
On January 17, 2018, the Company further repriced the secured term loans under the 2016 Credit Agreement, which reduced the applicable interest rate margin for the Company’s tranche B term loans by 50 basis points for both LIBOR borrowings and base rate borrowings, increased the outstanding amounts on these tranche B term loans from $1.182 billion to $1.335 billion, and made certain other changes to the 2016 Credit Agreement, including increasing the maximum consolidated leverage ratio for the period of December 31, 2018 through September 30, 2019 and upon the occurrence of an acquisition meeting certain specified criteria, permitting the incurrence of unsecured indebtedness as long as the Company is in pro forma compliance with the financial covenants, resetting the six month soft call period for a repricing of the tranche B term loans and resetting and amending the test for incremental loans. Following the repricing, the applicable interest rate margin for the tranche B term loans was set at 2.25% for LIBOR borrowings and 1.25% for base rate borrowings. The Company incurred approximately $6 million of expenses upon the closing of this repricing.
111
WEX INC.
NOTES TO CONSOLIDATED FINANCIAL STATEMENTS (continued)
(in thousands, except per share data)
26. | Quarterly Financial Results (Unaudited) |
Summarized quarterly results for the years ended December 31, 2017 and 2016, are as follows:
Three months ended | ||||||||||||||||
March 31 | June 30 | September 30 | December 31 | |||||||||||||
2017 | ||||||||||||||||
Total revenues | $ | 291,357 | $ | 303,884 | $ | 324,002 | $ | 331,305 | ||||||||
Operating income | $ | 60,752 | $ | 47,581 | $ | 63,723 | $ | 67,214 | ||||||||
Net earnings attributable to shareholders(a) | $ | 29,401 | $ | 17,090 | $ | 33,971 | $ | 79,804 | ||||||||
Earnings per share:(a) | ||||||||||||||||
Basic | $ | 0.69 | $ | 0.40 | $ | 0.79 | $ | 1.86 | ||||||||
Diluted | $ | 0.68 | $ | 0.40 | $ | 0.79 | $ | 1.85 | ||||||||
2016 | ||||||||||||||||
Total revenues(b) | $ | 205,928 | $ | 233,936 | $ | 287,756 | $ | 290,840 | ||||||||
Operating income(b) | $ | 41,127 | $ | 51,635 | $ | 54,568 | $ | 47,798 | ||||||||
Net earnings attributable to shareholders(b) | $ | 23,086 | $ | 12,567 | $ | 19,696 | $ | 5,288 | ||||||||
Earnings per share:(b) | ||||||||||||||||
Basic | $ | 0.60 | $ | 0.32 | $ | 0.46 | $ | 0.12 | ||||||||
Diluted | $ | 0.59 | $ | 0.32 | $ | 0.46 | $ | 0.12 | ||||||||
(a) The three months ended December 31, 2017 includes a tax benefit of approximately $60 million as a result of the 2017 Tax Act.
(b) Results for three months ended September 30, 2016 and December 31, 2016 include the operations of EFS and the issuance of approximately 4,000 shares of common stock for the acquisition of EFS on July 1, 2016.
Basic and diluted net income per share are computed independently for each quarter presented. Therefore, the sum of quarterly basic and diluted net income per share information may not equal annual basic and diluted net income per share.
112
ITEM 9. CHANGES IN AND DISAGREEMENTS WITH ACCOUNTANTS ON ACCOUNTING AND FINANCIAL DISCLOSURE
Not applicable.
ITEM 9A. CONTROLS AND PROCEDURES
Evaluation of Disclosure Controls and Procedures
The principal executive officer and principal financial officer of WEX Inc. evaluated the effectiveness of the Company’s disclosure controls and procedures as of the end of the period covered by this report. “Disclosure controls and procedures” are controls and other procedures of a company that are designed to ensure that information required to be disclosed by the company in the reports that it files or submits under the Securities Exchange Act of 1934, within the time periods specified in the SEC’s rules and forms, is recorded, processed, summarized and reported, and is accumulated and communicated to the company’s management, including its principal executive officer and principal financial officer, as appropriate to allow timely decisions regarding required disclosure. Based on their evaluation, the principal executive officer and principal financial officer of WEX Inc. concluded that the Company’s disclosure controls and procedures were effective as of December 31, 2017.
Management’s Annual Report on Internal Control Over Financial Reporting
WEX Inc.'s management is responsible for establishing and maintaining adequate internal control over financial reporting. Internal control over financial reporting is defined in Rule 13a-15(f) promulgated under the Exchange Act as a process designed to provide reasonable assurance regarding the reliability of financial reporting and the preparation of financial statements for external purposes in accordance with accounting principles generally accepted in the United States of America. Internal control over financial reporting includes maintaining records that in reasonable detail accurately and fairly reflect our transactions and disposition of assets; providing reasonable assurance that transactions are recorded as necessary for preparation of our financial statements; providing reasonable assurance that receipts and expenditures are made only in accordance with management and Board authorizations; and providing reasonable assurance regarding prevention or timely detection of unauthorized acquisition, use or disposition of our assets that could have a material effect on our financial statements. Because of its inherent limitations, internal control over financial reporting is not intended to provide absolute assurance that a misstatement of our financial statements would be prevented or detected. Also, projections of any evaluation of effectiveness to future periods are subject to the risk that controls may become inadequate because of changes in conditions or that the degree of compliance with policies or procedures may deteriorate.
Under the supervision and with the participation of management, including the principal executive officer and principal financial and accounting officer, an evaluation was conducted of the effectiveness of the internal control over financial reporting based on the framework in Internal Control - Integrated Framework (2013) issued by The Committee of Sponsoring Organizations of the Treadway Commission. Based on our evaluation under the framework in Internal Control - Integrated Framework (2013), management concluded that WEX Inc.’s internal control over financial reporting was effective as of December 31, 2017. The effectiveness of our internal control over financial reporting as of December 31, 2017, has been audited by Deloitte & Touche LLP, an independent registered public accounting firm, as stated in their attestation report which is included herein.
Changes in Internal Control Over Financial Reporting
In the course of completing its assessment of internal control over financial reporting as of December 31, 2016, management identified a number of deficiencies related to the design and operating effectiveness of information technology (“IT”) general controls for certain information systems that comprise part of the Company’s system of internal control over financial reporting and are relevant to the preparation of its consolidated financial statements (such information technology systems are referred to as the “affected IT systems”). These deficiencies involved user access controls and program change management controls. These controls are intended to ensure that access to financial applications and data is adequately restricted to appropriate personnel, and that changes affecting the financial applications and underlying account records are made by only authorized individuals.
As a result of the deficiencies identified as of December 31, 2016, management concluded that, as of December 31, 2016, there was a material weakness in internal control over financial reporting related to information technology general controls in the areas of user access and program change management for the affected IT systems. A material weakness is a deficiency, or a combination of deficiencies, in internal control over financial reporting, such that there is a reasonable possibility that a material misstatement of our annual or interim financial statements will not be prevented or detected on a timely basis.
113
Over the course of 2017, we actively engaged in the implementation of a remediation plan to ensure that controls contributing to this material weakness were redesigned appropriately and would operate effectively in the future. The remediation actions taken included the following:
• | Improving the design, operation and monitoring of control activities and procedures associated with user and administrator access to the affected IT systems, through the implementation of preventive and detective control activities; |
• | Redesigning and implementing detective monitoring controls within IT to directly mitigate the risks; |
• | Enhancing resources in the functional areas that support and monitor our IT controls; and |
• | Exercising direct performance of the controls related to effected IT systems. |
Based upon the actions taken during 2017, which were substantially completed in the fourth quarter of 2017, and our testing and evaluation of the effectiveness of our internal control over financial reporting, we have concluded that the material weakness in internal control over financial reporting related to information technology general controls no longer existed as of December 31, 2017.
Other than the changes discussed above, there has been no change in our internal control over financial reporting during the quarter ended December 31, 2017, that has materially affected, or is reasonably likely to materially affect, our internal control over financial reporting.
114
REPORT OF INDEPENDENT REGISTERED PUBLIC ACCOUNTING FIRM
To the Board of Directors and Stockholders of WEX Inc.
South Portland, Maine
Opinion on Internal Control over Financial Reporting
We have audited the internal control over financial reporting of WEX Inc. and subsidiaries (the “Company”) as of December 31, 2017, based on criteria established in Internal Control - Integrated Framework (2013) issued by the Committee of Sponsoring Organizations of the Treadway Commission (COSO). In our opinion, the Company maintained, in all material respects, effective internal control over financial reporting as of December 31, 2017, based on criteria established in Internal Control - Integrated Framework (2013) issued by COSO.
We have also audited, in accordance with the standards of the Public Company Accounting Oversight Board (United States) (PCAOB), the consolidated financial statements as of and for the year ended December 31, 2017, of the Company and our report dated March 1, 2018, expressed an unqualified opinion on those financial statements.
Basis for Opinion
The Company’s management is responsible for maintaining effective internal control over financial reporting and for its assessment of the effectiveness of internal control over financial reporting, included in the accompanying Management’s Annual Report on Internal Control Over Financial Reporting appearing at Item 9A. Our responsibility is to express an opinion on the Company’s internal control over financial reporting based on our audit. We are a public accounting firm registered with the PCAOB and are required to be independent with respect to the Company in accordance with the U.S. federal securities laws and the applicable rules and regulations of the Securities and Exchange Commission and the PCAOB.
We conducted our audit in accordance with the standards of the PCAOB. Those standards require that we plan and perform the audit to obtain reasonable assurance about whether effective internal control over financial reporting was maintained in all material respects. Our audit included obtaining an understanding of internal control over financial reporting, assessing the risk that a material weakness exists, testing and evaluating the design and operating effectiveness of internal control based on the assessed risk, and performing such other procedures as we considered necessary in the circumstances. We believe that our audit provides a reasonable basis for our opinion.
Definition and Limitations of Internal Control over Financial Reporting
A company’s internal control over financial reporting is a process designed to provide reasonable assurance regarding the reliability of financial reporting and the preparation of financial statements for external purposes in accordance with generally accepted accounting principles. A company’s internal control over financial reporting includes those policies and procedures that (1) pertain to the maintenance of records that, in reasonable detail, accurately and fairly reflect the transactions and dispositions of the assets of the company; (2) provide reasonable assurance that transactions are recorded as necessary to permit preparation of financial statements in accordance with generally accepted accounting principles, and that receipts and expenditures of the company are being made only in accordance with authorizations of management and directors of the company; and (3) provide reasonable assurance regarding prevention or timely detection of unauthorized acquisition, use, or disposition of the company’s assets that could have a material effect on the financial statements.
Because of its inherent limitations, internal control over financial reporting may not prevent or detect misstatements. Also, projections of any evaluation of effectiveness to future periods are subject to the risk that controls may become inadequate because of changes in conditions, or that the degree of compliance with the policies or procedures may deteriorate.
/s/ Deloitte & Touche LLP
Boston, Massachusetts
March 1, 2018
115
ITEM 9B. OTHER INFORMATION
Not applicable.
PART III
ITEM 10. DIRECTORS, EXECUTIVE OFFICERS AND CORPORATE GOVERNANCE
See the information in the Company’s proxy statement for the 2018 Annual Meeting of Stockholders captioned “Members of the Board of Directors,” “Non-Director Members of the Executive Management Team,” “Section 16(a) Beneficial Ownership Reporting Compliance,” “Director Nominations,” “Communications with the Board of Directors,” “Board and Committee Meetings” and “Corporate Governance Information,” which information is incorporated herein by reference.
Website Availability of Corporate Governance and Other Documents
The following documents are available on the Corporate Governance page of the investor relations section of the Company’s website, www.wexinc.com: (1) the Code of Business Conduct and Ethics, which covers all employees, officers and our board of directors, (2) the Company’s Corporate Governance Guidelines and (3) key Board Committee charters, including charters for the Audit, Corporate Governance and Compensation Committees. Stockholders also may obtain printed copies of these documents by submitting a written request to Investor Relations, WEX Inc., 97 Darling Avenue, South Portland, Maine USA 04106. The Company intends to post on its website, www.wexinc.com, all disclosures that are required by law or New York Stock Exchange listing standards concerning any amendments to, or waivers from, the Code of Business Conduct and Ethics.
ITEM 11. EXECUTIVE COMPENSATION
See the information in the Company’s proxy statement for the 2018 Annual Meeting of Stockholders captioned “Executive Compensation” and the related subsections, “Director Compensation” and “Compensation Committee Interlocks and Insider Participation,” which information is incorporated herein by reference.
ITEM 12. SECURITY OWNERSHIP OF CERTAIN BENEFICIAL OWNERS AND MANAGEMENT AND RELATED STOCKHOLDER MATTERS
See the information in the Company’s proxy statement for the 2018 Annual Meeting of Stockholders captioned “Securities Authorized for Issuance Under Equity Compensation Plans” and “Principal Stockholders” and the related subsections, which information is incorporated herein by reference.
ITEM 13. CERTAIN RELATIONSHIPS AND RELATED TRANSACTIONS, AND DIRECTOR INDEPENDENCE
See the information in the Company’s proxy statement for the 2018 Annual Meeting of Stockholders captioned “Director Independence” and “Certain Relationships and Related Transactions,” which information is incorporated herein by reference.
ITEM 14. PRINCIPAL ACCOUNTING FEES AND SERVICES
See the section of the Company’s proxy statement for the 2018 Annual Meeting of Stockholders captioned “Auditor Selection and Fees,” which information is incorporated herein by reference.
116
PART IV
ITEM 15. EXHIBITS AND FINANCIAL STATEMENT SCHEDULES
The following documents are filed as part of this report:
1. Financial Statements (see Index to Consolidated Financial Statements on page 63).
2. The exhibit index attached to this Annual Report on Form 10-K is hereby incorporated by reference.
ITEM 16. FORM 10-K SUMMARY
Not applicable.
EXHIBIT INDEX
Exhibit No. | Description | ||
2.1 | |||
3.1 | |||
3.2 | |||
3.3 | |||
4.1 | |||
4.2 | |||
4.3 | |||
10.1 | |||
10.2 | |||
10.3 | |||
10.4 | |||
117
10.5 | |||
10.6 | |||
10.7 | |||
10.8 | |||
10.9 | |||
10.10 | |||
†10.11 | |||
†10.12 | |||
†10.13 | |||
†10.14 | |||
† 10.15 | |||
† 10.16 | |||
† 10.17 | |||
† 10.18 | |||
† 10.19 | |||
† 10.20 | |||
† 10.21 | |||
118
† 10.22 | |||
† 10.23 | |||
† 10.24 | |||
† 10.25 | |||
† 10.26 | |||
† 10.27 | |||
† 10.28 | |||
* † 10.29 | |||
* † 10.30 | |||
* † 10.31 | |||
* † 10.32 | |||
10.33 | |||
10.34 | |||
10.35 | |||
10.36 | |||
10.37 | |||
10.38 | |||
* 21.1 | |||
* 23.1 | |||
* 31.1 | |||
119
* 31.2 | |||
* 32.1 | |||
* 32.2 | |||
* 101.INS | XBRL Instance Document | ||
* 101.SCH | XBRL Taxonomy Extension Schema Document | ||
* 101.CAL | XBRL Taxonomy Calculation Linkbase Document | ||
* 101.LAB | XBRL Taxonomy Label Linkbase Document | ||
* 101.PRE | XBRL Taxonomy Presentation Linkbase Document | ||
* 101.DEF | XBRL Taxonomy Extension Definition Linkbase Document | ||
* | Filed with this report. | ||
† | Denotes a management contract or compensatory plan or arrangement required to be filed as an exhibit pursuant to Item 15(b) of this Form 10-K. | ||
SIGNATURES
Pursuant to the requirements of Section 13 or 15(d) of the Securities Exchange Act of 1934, the Registrant has duly caused this report to be signed on its behalf by the undersigned, thereunto duly authorized.
WEX INC. | |||
March 1, 2018 | By: | /s/ Roberto Simon | |
Roberto Simon Chief Financial Officer (principal financial officer and principal accounting officer) | |||
120
Pursuant to the requirements of the Securities Exchange Act of 1934, this Report has been signed below by the following persons on behalf of the Registrant and in the capacities and on the dates indicated.
March 1, 2018 | /s/ Melissa D. Smith | |
Melissa D. Smith | ||
President, Chief Executive Officer and Director | ||
(principal executive officer) | ||
March 1, 2018 | /s/ Roberto Simon | |
Roberto Simon | ||
Chief Financial Officer | ||
(principal financial and accounting officer) | ||
March 1, 2018 | /s/ Michael E. Dubyak | |
Michael E. Dubyak | ||
Chairman of the Board | ||
March 1, 2018 | /s/ Rowland T. Moriarty | |
Rowland T. Moriarty | ||
Lead Director | ||
March 1, 2018 | /s/ John E. Bachman | |
John E. Bachman | ||
Director | ||
March 1, 2018 | /s/ Shikhar Ghosh | |
Shikhar Ghosh | ||
Director | ||
March 1, 2018 | /s/ George L. McTavish | |
George L. McTavish | ||
Director | ||
March 1, 2018 | /s/ James C. Neary | |
James C. Neary | ||
Director | ||
March 1, 2018 | /s/ Kirk Pond | |
Kirk Pond | ||
Director | ||
March 1, 2018 | /s/ Regina O. Sommer | |
Regina O. Sommer | ||
Director | ||
March 1, 2018 | /s/ Jack A. VanWoerkom | |
Jack A. VanWoerkom | ||
Director | ||
121