Attached files
| file | filename |
|---|---|
| 8-K - 8-K - CAPSTEAD MORTGAGE CORP | cmo-8k_20210504.htm |

INVESTOR PRESENTATION FIRST QUARTER 2021 Exhibit 99.1
Statement Concerning Forward-looking Statements This document contains “forward-looking statements” within the meaning of the Private Securities Litigation Reform Act of 1995. Forward-looking statements include, without limitation, any statement that may predict, forecast, indicate or imply future results, performance or achievements, and may contain the words “believe,” “anticipate,” “expect,” “estimate,” “intend,” “will be,” “will likely continue,” “will likely result,” or words or phrases of similar meaning. Actual results could differ materially from those projected in these forward-looking statements due to a variety of factors, without limitation, fluctuations in interest rates, the availability of suitable qualifying investments, changes in mortgage prepayments, the availability and terms of financing, changes in market conditions as a result of federal corporate and individual tax law changes, changes in legislation or regulation affecting the mortgage and banking industries or Fannie Mae, Freddie Mac or Ginnie Mae securities, the availability of new investment capital, the liquidity of secondary markets and funding markets, our ability to maintain our qualification as a REIT for U.S. federal tax purposes, our ability to maintain our exemption from registration under the Investment Company Act of 1940, as amended, and other changes in general economic conditions. These and other applicable uncertainties, factors and risks are described more fully in the Company’s filings with the U.S. Securities and Exchange Commission. Forward-looking statements speak only as of the date the statement is made and the Company undertakes no obligation to update or revise any forward-looking statements, whether as a result of new information, future events or otherwise. Accordingly, readers of this document are cautioned not to place undue reliance on any forward-looking statements included herein. 1 Safe Harbor Statement - Private Securities Litigation Reform Act of 1995 1
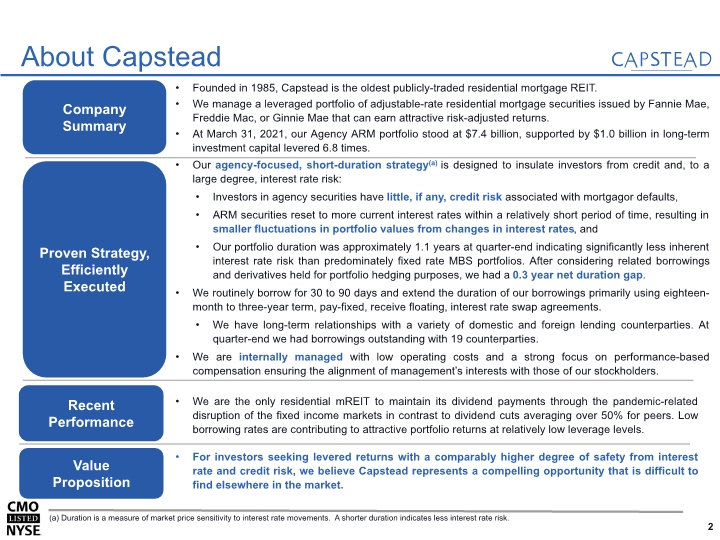
We are the only residential mREIT to maintain its dividend payments through the pandemic-related disruption of the fixed income markets in contrast to dividend cuts averaging over 50% for peers. Low borrowing rates are contributing to attractive portfolio returns at relatively low leverage levels. Company Summary Proven Strategy, Efficiently Executed Founded in 1985, Capstead is the oldest publicly-traded residential mortgage REIT. We manage a leveraged portfolio of adjustable-rate residential mortgage securities issued by Fannie Mae, Freddie Mac, or Ginnie Mae that can earn attractive risk-adjusted returns. At March 31, 2021, our Agency ARM portfolio stood at $7.4 billion, supported by $1.0 billion in long-term investment capital levered 6.8 times. Our agency-focused, short-duration strategy(a) is designed to insulate investors from credit and, to a large degree, interest rate risk: Investors in agency securities have little, if any, credit risk associated with mortgagor defaults, ARM securities reset to more current interest rates within a relatively short period of time, resulting in smaller fluctuations in portfolio values from changes in interest rates, and Our portfolio duration was approximately 1.1 years at quarter-end indicating significantly less inherent interest rate risk than predominately fixed rate MBS portfolios. After considering related borrowings and derivatives held for portfolio hedging purposes, we had a 0.3 year net duration gap. We routinely borrow for 30 to 90 days and extend the duration of our borrowings primarily using eighteen-month to three-year term, pay-fixed, receive floating, interest rate swap agreements. We have long-term relationships with a variety of domestic and foreign lending counterparties. At quarter-end we had borrowings outstanding with 19 counterparties. We are internally managed with low operating costs and a strong focus on performance-based compensation ensuring the alignment of management’s interests with those of our stockholders. For investors seeking levered returns with a comparably higher degree of safety from interest rate and credit risk, we believe Capstead represents a compelling opportunity that is difficult to find elsewhere in the market. (a) Duration is a measure of market price sensitivity to interest rate movements. A shorter duration indicates less interest rate risk. Value Proposition About Capstead 2 Recent Performance
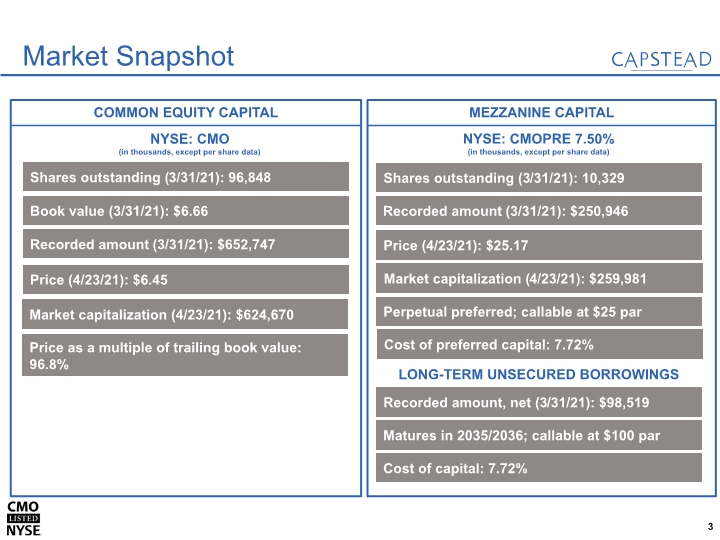
MEZZANINE CAPITAL COMMON EQUITY CAPITAL 50% 16% 84% Market Snapshot 3 NYSE: CMOPRE 7.50% (in thousands, except per share data) Shares outstanding (3/31/21): 10,329 Price (4/23/21): $25.17 Perpetual preferred; callable at $25 par Cost of preferred capital: 7.72% Shares outstanding (3/31/21): 96,848 NYSE: CMO (in thousands, except per share data) Book value (3/31/21): $6.66 Price (4/23/21): $6.45 Market capitalization (4/23/21): $624,670 Price as a multiple of trailing book value: 96.8% LONG-TERM UNSECURED BORROWINGS Recorded amount, net (3/31/21): $98,519 Cost of capital: 7.72% Market capitalization (4/23/21): $259,981 Matures in 2035/2036; callable at $100 par Recorded amount (3/31/21): $652,747 Recorded amount (3/31/21): $250,946
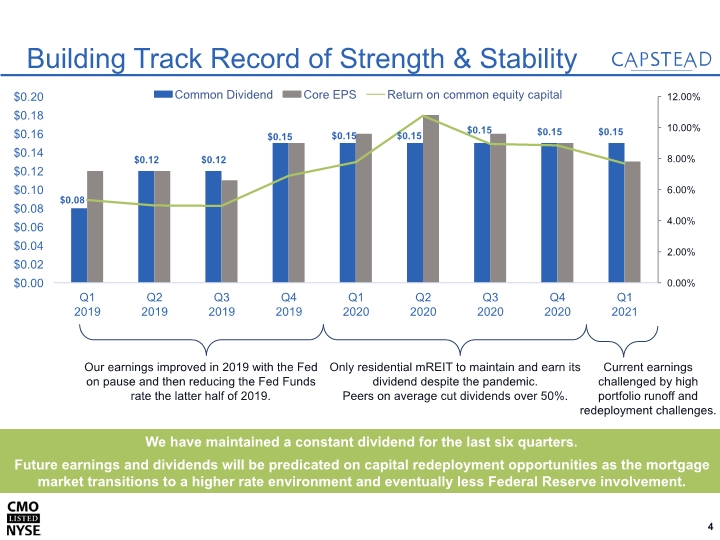
4 We have maintained a constant dividend for the last six quarters. Future earnings and dividends will be predicated on capital redeployment opportunities as the mortgage market transitions to a higher rate environment and eventually less Federal Reserve involvement. Building Track Record of Strength & Stability Our earnings improved in 2019 with the Fed on pause and then reducing the Fed Funds rate the latter half of 2019. Only residential mREIT to maintain and earn its dividend despite the pandemic. Peers on average cut dividends over 50%. Current earnings challenged by high portfolio runoff and redeployment challenges.
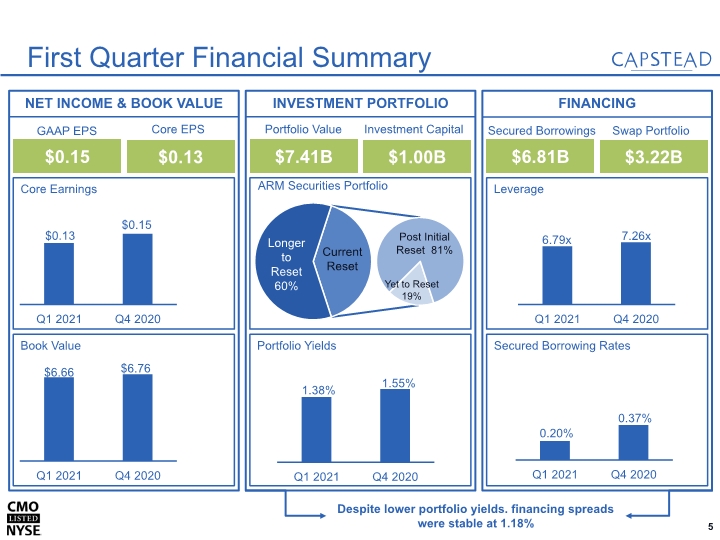
NET INCOME & BOOK VALUE INVESTMENT PORTFOLIO FINANCING GAAP EPS Core EPS $7.41B $1.00B Portfolio Value Investment Capital $6.81B $3.22B Secured Borrowings Swap Portfolio Secured Borrowing Rates Leverage First Quarter Financial Summary 5 Despite lower portfolio yields. financing spreads were stable at 1.18%
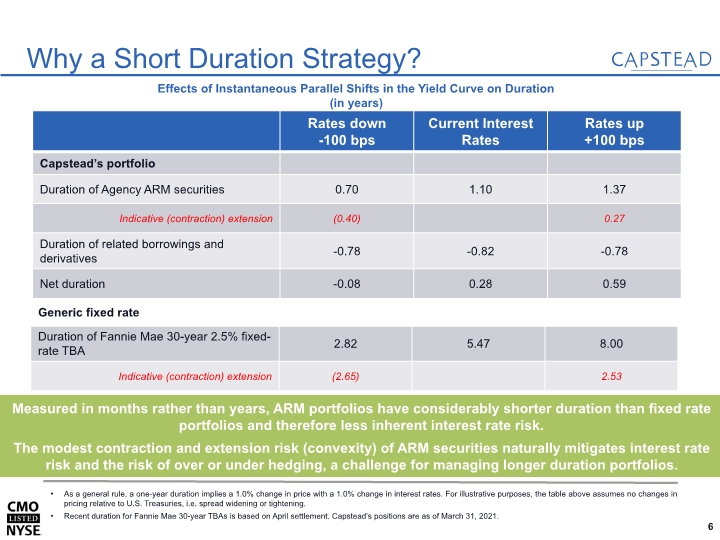
6 Measured in months rather than years, ARM portfolios have considerably shorter duration than fixed rate portfolios and therefore less inherent interest rate risk. The modest contraction and extension risk (convexity) of ARM securities naturally mitigates interest rate risk and the risk of over or under hedging, a challenge for managing longer duration portfolios. Why a Short Duration Strategy? Effects of Instantaneous Parallel Shifts in the Yield Curve on Duration (in years) As a general rule, a one-year duration implies a 1.0% change in price with a 1.0% change in interest rates. For illustrative purposes, the table above assumes no changes in pricing relative to U.S. Treasuries, i.e. spread widening or tightening. Recent duration for Fannie Mae 30-year TBAs is based on April settlement. Capstead’s positions are as of March 31, 2021.
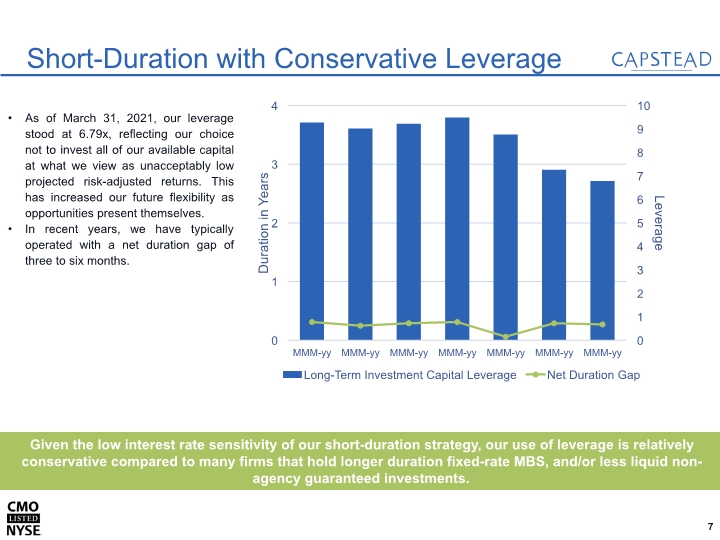
7 Given the low interest rate sensitivity of our short-duration strategy, our use of leverage is relatively conservative compared to many firms that hold longer duration fixed-rate MBS, and/or less liquid non-agency guaranteed investments. Short-Duration with Conservative Leverage As of March 31, 2021, our leverage stood at 6.79x, reflecting our choice not to invest all of our available capital at what we view as unacceptably low projected risk-adjusted returns. This has increased our future flexibility as opportunities present themselves. In recent years, we have typically operated with a net duration gap of three to six months.
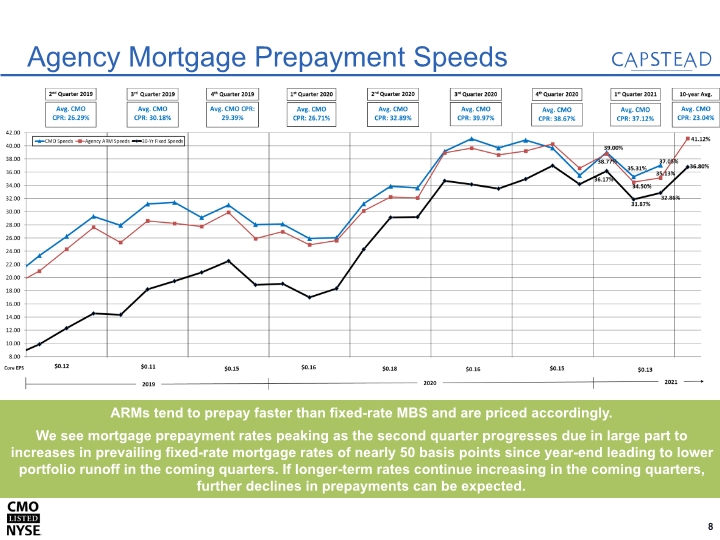
8 Agency Mortgage Prepayment Speeds ARMs tend to prepay faster than fixed-rate MBS and are priced accordingly. We see mortgage prepayment rates peaking as the second quarter progresses due in large part to increases in prevailing fixed-rate mortgage rates of nearly 50 basis points since year-end leading to lower portfolio runoff in the coming quarters. If longer-term rates continue increasing in the coming quarters, further declines in prepayments can be expected.
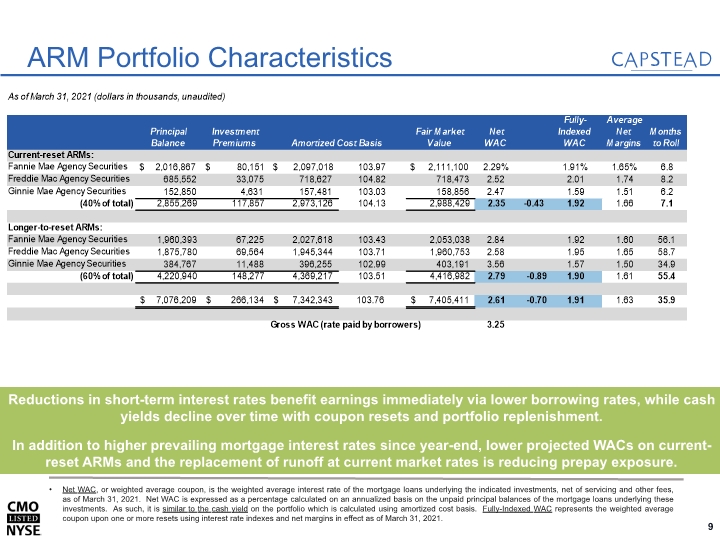
9 ARM Portfolio Characteristics Net WAC, or weighted average coupon, is the weighted average interest rate of the mortgage loans underlying the indicated investments, net of servicing and other fees, as of March 31, 2021. Net WAC is expressed as a percentage calculated on an annualized basis on the unpaid principal balances of the mortgage loans underlying these investments. As such, it is similar to the cash yield on the portfolio which is calculated using amortized cost basis. Fully-Indexed WAC represents the weighted average coupon upon one or more resets using interest rate indexes and net margins in effect as of March 31, 2021. Reductions in short-term interest rates benefit earnings immediately via lower borrowing rates, while cash yields decline over time with coupon resets and portfolio replenishment. In addition to higher prevailing mortgage interest rates since year-end, lower projected WACs on current-reset ARMs and the replacement of runoff at current market rates is reducing prepay exposure.
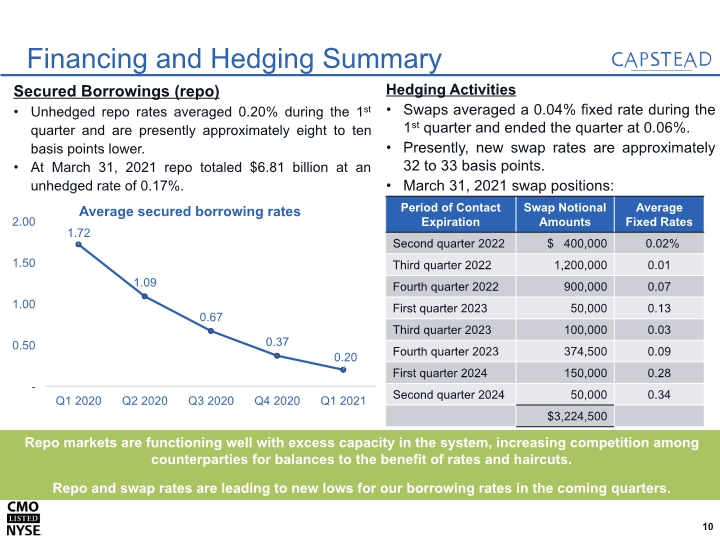
10 Repo markets are functioning well with excess capacity in the system, increasing competition among counterparties for balances to the benefit of rates and haircuts. Repo and swap rates are leading to new lows for our borrowing rates in the coming quarters. Financing and Hedging Summary Secured Borrowings (repo) Unhedged repo rates averaged 0.20% during the 1st quarter and are presently approximately eight to ten basis points lower. At March 31, 2021 repo totaled $6.81 billion at an unhedged rate of 0.17%. Hedging Activities Swaps averaged a 0.04% fixed rate during the 1st quarter and ended the quarter at 0.06%. Presently, new swap rates are approximately 32 to 33 basis points. March 31, 2021 swap positions:
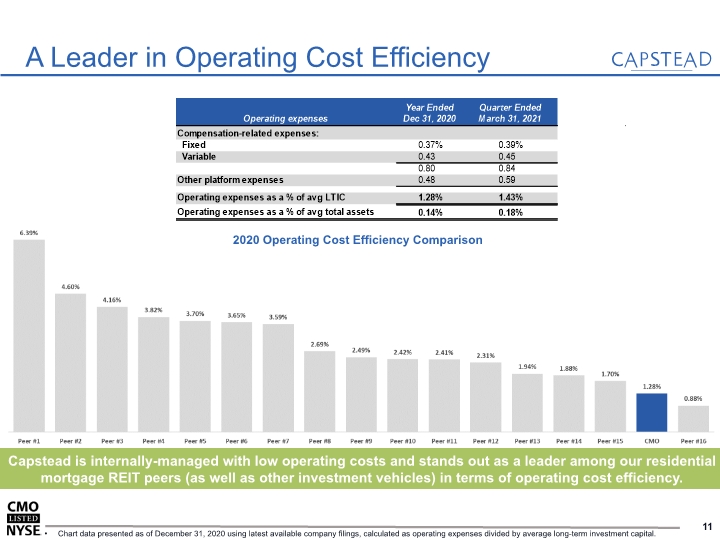
A Leader in Operating Cost Efficiency 11 Capstead is internally-managed with low operating costs and stands out as a leader among our residential mortgage REIT peers (as well as other investment vehicles) in terms of operating cost efficiency. Chart data presented as of December 31, 2020 using latest available company filings, calculated as operating expenses divided by average long-term investment capital. 2020 Operating Cost Efficiency Comparison

APPENDIX – Financial Information 12
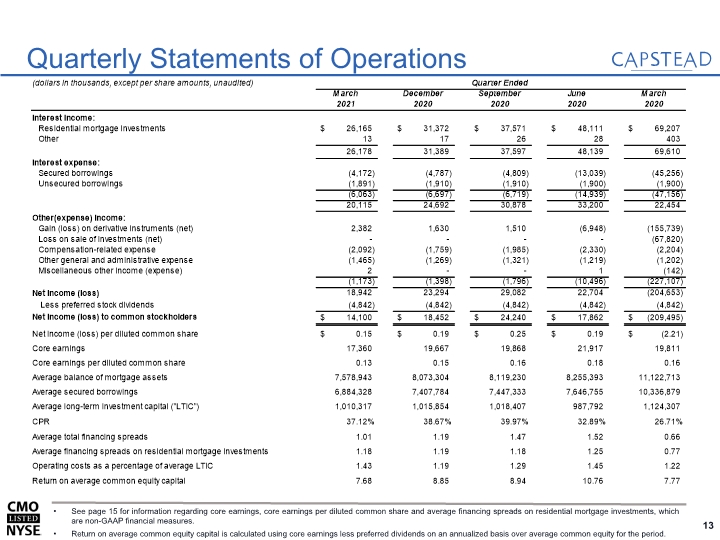
Quarterly Statements of Operations 13 See page 15 for information regarding core earnings, core earnings per diluted common share and average financing spreads on residential mortgage investments, which are non-GAAP financial measures. Return on average common equity capital is calculated using core earnings less preferred dividends on an annualized basis over average common equity for the period.
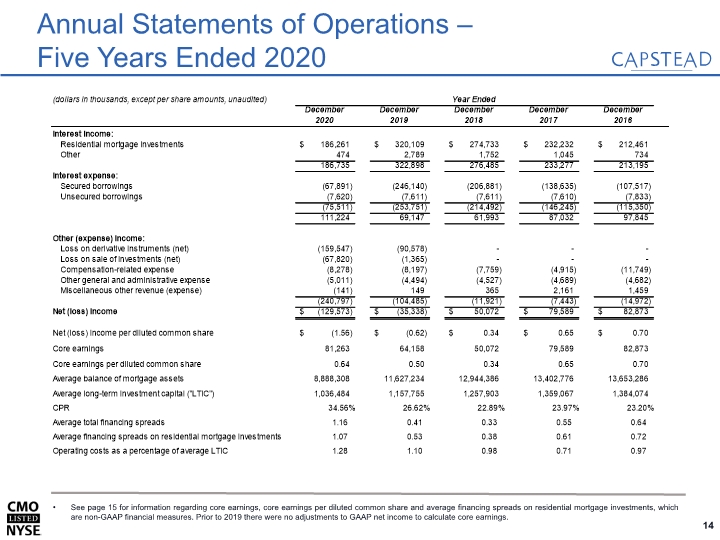
Annual Statements of Operations – Five Years Ended 2020 14 See page 15 for information regarding core earnings, core earnings per diluted common share and average financing spreads on residential mortgage investments, which are non-GAAP financial measures. Prior to 2019 there were no adjustments to GAAP net income to calculate core earnings.
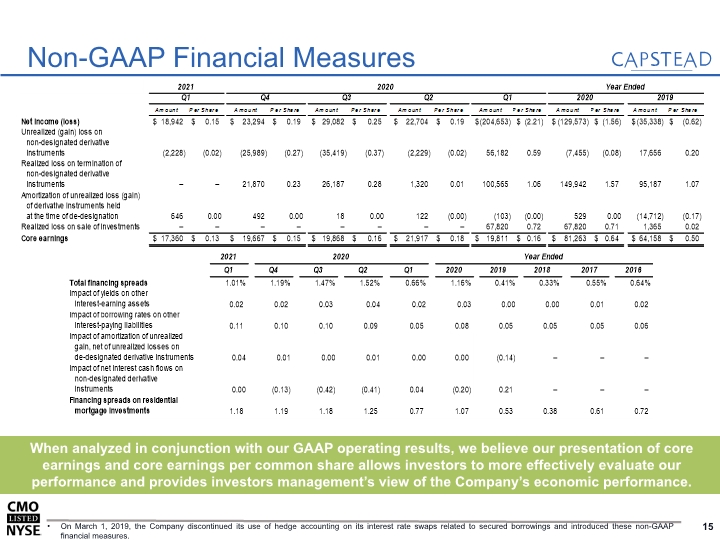
15 When analyzed in conjunction with our GAAP operating results, we believe our presentation of core earnings and core earnings per common share allows investors to more effectively evaluate our performance and provides investors management’s view of the Company’s economic performance. Non-GAAP Financial Measures On March 1, 2019, the Company discontinued its use of hedge accounting on its interest rate swaps related to secured borrowings and introduced these non-GAAP financial measures.
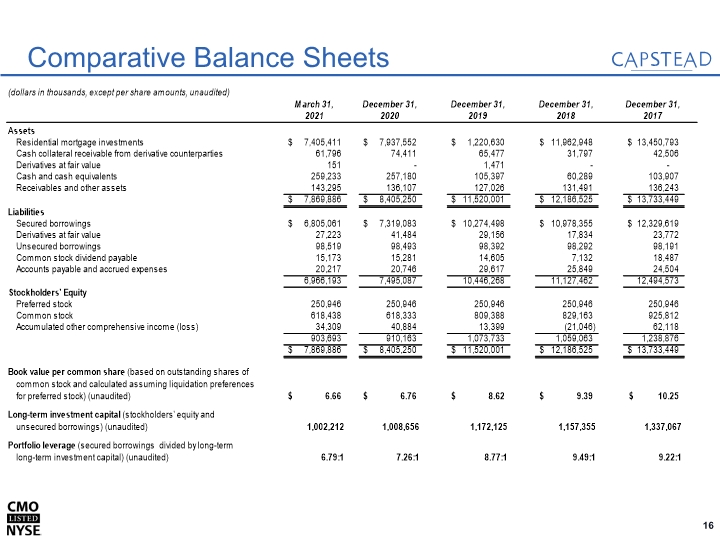
Comparative Balance Sheets 16
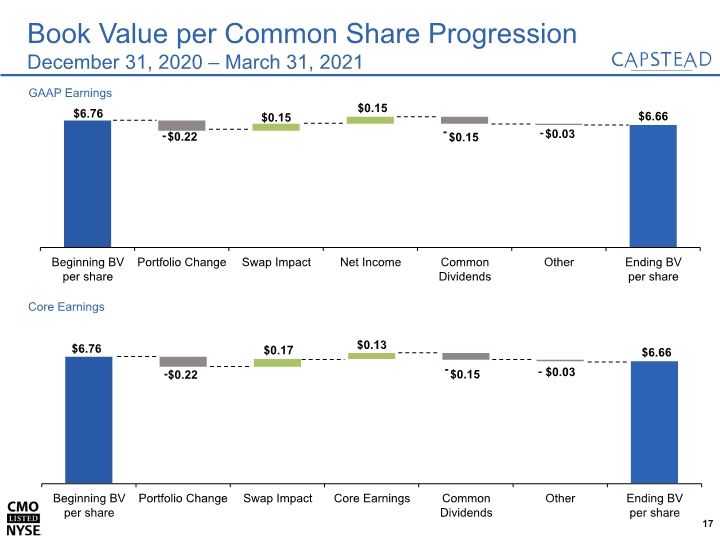
Book Value per Common Share Progression December 31, 2020 – March 31, 2021 17 GAAP Earnings Core Earnings
Phillip A. Reinsch – President and Chief Executive Officer Appointed President, CEO and Director in July 2016 after serving as Chief Financial Officer since 2003 Served in other executive positions at Capstead since 1993 Robert R. Spears – Executive Vice President, Chief Investment Officer Served in asset and liability management positions at Capstead since 1994 Formerly Vice President of secondary marketing with NationsBanc Mortgage Corporation Roy S. Kim – Senior Vice President, Asset and Liability Management Joined Capstead in April 2015 augmenting our asset and liability management capabilities with primary responsibility for liability and derivative management Has over 20 years experience in the mortgage finance industry, primarily in trading capacities with JP Morgan and Bank of America Lance J. Phillips – Senior Vice President, Chief Financial Officer and Secretary Joined Capstead in October 2017 Has over 20 years experience in the accounting and finance industry, most recently as Vice President and Principal Accounting Officer for InfraREIT, Inc. 18 Our top four executive officers have over 75 years of mortgage finance industry experience. Experienced Management Team
