Attached files
| file | filename |
|---|---|
| EX-99.1 - PRESS RELEASE - ENTERPRISE FINANCIAL SERVICES CORP | exhibit991pressrelease0426.htm |
| 8-K - 8-K - ENTERPRISE FINANCIAL SERVICES CORP | efsc-20210426.htm |
Enterprise Financial Services Corp Strategic Combination with First Choice Bancorp April 26, 2021 Filed by Enterprise Financial Services Corp pursuant to Rule 425 under the Securities Act of 1933, as amended, and deemed filed pursuant to Rule 14a-12 under the Securities and Exchange Act of 1934, as amended Subject Company: First Choice Bancorp Commission File No: 001-38476 Exhibit 99.2
Forward-Looking Statements Certain statements contained in this press release may be considered forward-looking statements regarding Enterprise, including its wholly- owned subsidiary EB&T, FCBP, including its wholly-owned subsidiary First Choice, and Enterprise’s proposed acquisition of FCBP and First Choice. These forward-looking statements may include: statements regarding the acquisition, the consideration payable in connection with the acquisition, and the ability of the parties to consummate the acquisition. Forward-looking statements are typically identified by words such as “believe,” “expect,” “anticipate,” “intend,” “outlook,” “estimate,” “forecast,” “project,” “pro forma” and other similar words and expressions. Forward-looking statements are subject to numerous assumptions, risks and uncertainties, which change over time. Forward-looking statements speak only as of the date they are made. Because forward-looking statements are subject to assumptions and uncertainties, actual results or future events could differ, possibly materially, from those that EFSC or FCBP anticipated in their forward-looking statements and future results could differ materially from historical performance. Factors that could cause or contribute to such differences include, but are not limited to, the possibility: that expected benefits of the acquisition may not materialize in the timeframe expected or at all, or may be more costly to achieve; that the acquisition may not be timely completed, if at all; the occurrence of any event, change or other circumstances that could give rise to the right of one or both of the parties to terminate the definitive transaction agreement; the outcome of any legal proceedings that may be instituted against EFSC or FCBP; that prior to the completion of the acquisition or thereafter, EFSC’s and FCBP’s respective businesses may not perform as expected due to transaction-related uncertainty or other factors; that the parties are unable to successfully implement integration strategies; that required regulatory, EFSC shareholder or FCBP shareholder or other approvals are not obtained or other closing conditions are not satisfied in a timely manner or at all; that adverse regulatory conditions may be imposed in connection with regulatory approvals of the acquisition; reputational risks and the reaction of the companies’ employees or customers to the transaction; diversion of management time on acquisition- related issues; that the COVID-19 pandemic, including uncertainty and volatility in financial, commodities and other markets, and disruptions to banking and other financial activity, could harm Enterprise and FCBP’s business, financial position and results of operations, and could adversely affect the timing and anticipated benefits of the proposed acquisition; and those factors and risks referenced from time to time in EFSC’s or FCBP’s filings with the SEC, including in their Annual Reports on Form 10-K for the fiscal year ended December 31, 2020, and their other filings with the SEC. For any forward-looking statements made in this press release or in any documents, EFSC and FCBP claim the protection of the safe harbor for forward-looking statements contained in the Private Securities Litigation Reform Act of 1995. Annualized, pro forma, projected and estimated numbers in this document are used for illustrative purposes only, are not forecasts and may not reflect actual results. Except to the extent required by applicable law or regulation, each of EFSC and FCBP disclaims any obligation to revise or publicly release any revision or update to any of the forward-looking statements included herein to reflect events or circumstances that occur after the date on which such statements were made. 2
Additional Information Additional Information About the Acquisition and Where to Find It This press release does not constitute an offer to sell or the solicitation of an offer to buy any securities or a solicitation of any vote or approval. In connection with the proposed acquisition transaction, along with other relevant documents, a registration statement on Form S-4 will be filed with the SEC that will include a joint proxy statement/prospectus to be distributed to the shareholders of EFSC and FCBP in connection with their votes on the acquisition. Shareholders of EFSC and FCBP are urged to read the registration statement and the joint proxy statement/prospectus regarding the acquisition when they become available and any other relevant documents filed with the SEC, as well as any amendments or supplements to those documents, because they will contain important information about the proposed acquisition. The final joint proxy statement/prospectus will be mailed to shareholders of EFSC and FCBP. Investors and security holders will be able to obtain the documents, and any other documents EFSC has filed with the SEC, free of charge at the SEC’s website, www.sec.gov. In addition, documents filed with the SEC by EFSC in connection with the proposed acquisition will be available free of charge by (1) accessing EFSC’s website at www.enterprisebank.com under the “Investor Relations” link, (2) writing EFSC at 150 North Meramec, Clayton, Missouri 63105, Attention: Investor Relations, (3) accessing FCBP’s website at https://investors.firstchoicebankca.com under the “SEC Filings” tab, or (4) writing FCBP at 17785 Center Court Drive, N Suite 750, Cerritos, CA 90703, Attention: General Counsel. EFSC and FCBP and certain of their directors, executive officers and certain other members of management and employees may be deemed to be participants in the solicitation of proxies from the shareholders of EFSC and FCBP in connection with the proposed acquisition. Information about the directors and executive officers of EFSC is set forth in the proxy statement for EFSC’s 2021 annual meeting of shareholders, as filed with the SEC on a Schedule 14A on March 17, 2021. Information about the directors and officers of FCBP will be set forth in the Form-10-K/A, to be filed with the SEC on or about April 27, 2021 and in the proxy statement of FCBP to be filed on Schedule 14A during the third quarter of 2021. Additional information regarding the interests of those participants and other persons who may be deemed participants in the transaction may be obtained by reading the joint proxy statement/prospectus regarding the proposed acquisition when it becomes available. Free copies of this document may be obtained as described in the preceding paragraph. 3
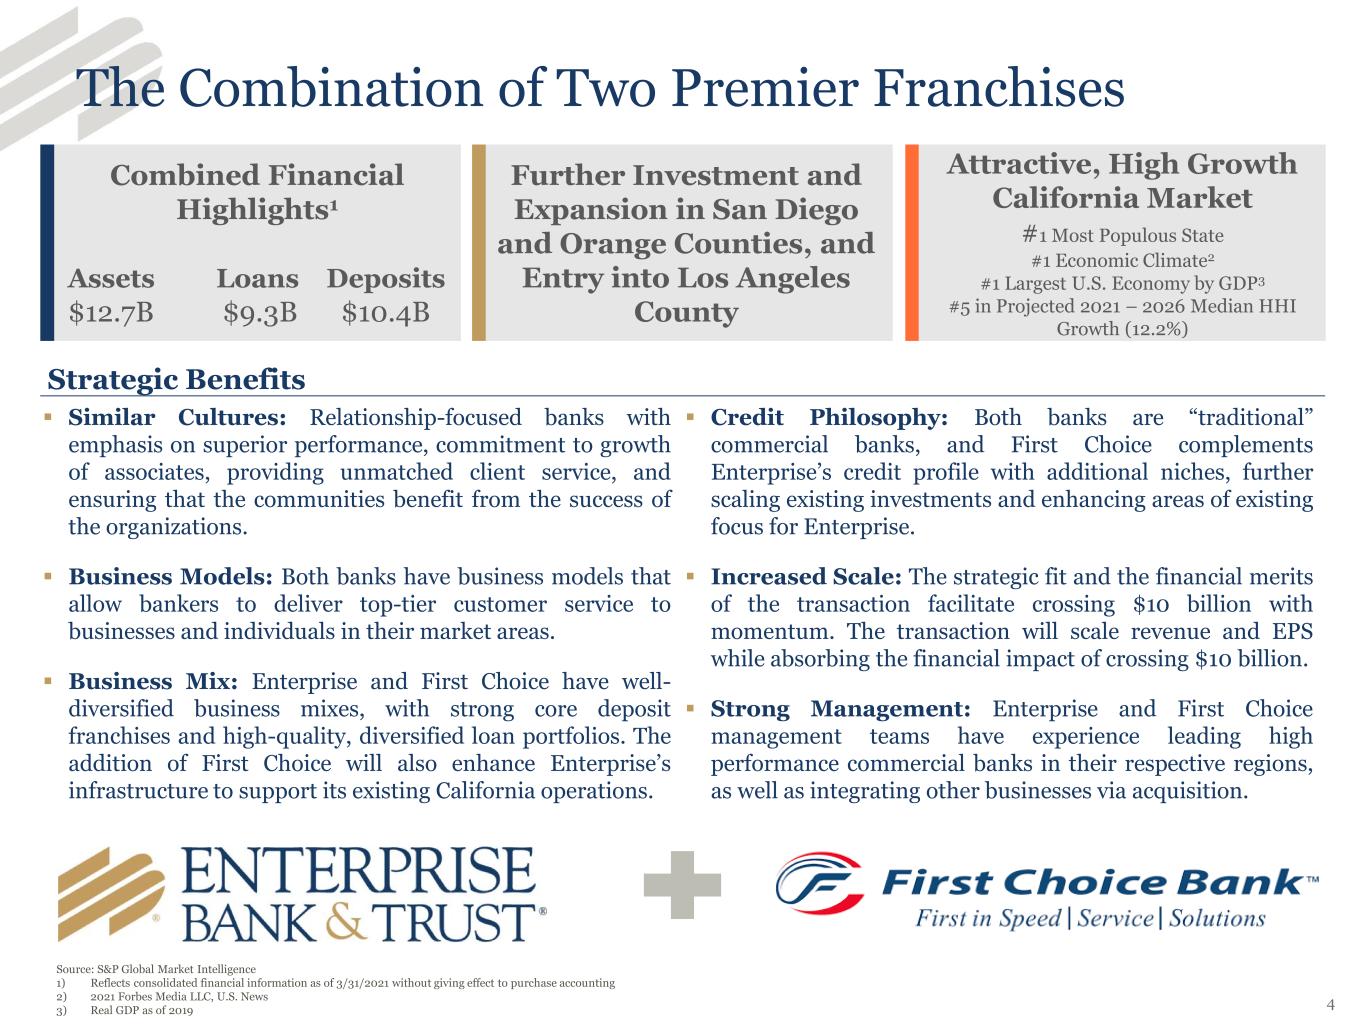
The Combination of Two Premier Franchises Combined Financial Highlights1 Assets Loans Deposits $12.7B $9.3B $10.4B Further Investment and Expansion in San Diego and Orange Counties, and Entry into Los Angeles County Attractive, High Growth California Market #1 Most Populous State #1 Economic Climate2 #1 Largest U.S. Economy by GDP3 #5 in Projected 2021 – 2026 Median HHI Growth (12.2%) Strategic Benefits ▪ Similar Cultures: Relationship-focused banks with emphasis on superior performance, commitment to growth of associates, providing unmatched client service, and ensuring that the communities benefit from the success of the organizations. ▪ Business Models: Both banks have business models that allow bankers to deliver top-tier customer service to businesses and individuals in their market areas. ▪ Business Mix: Enterprise and First Choice have well- diversified business mixes, with strong core deposit franchises and high-quality, diversified loan portfolios. The addition of First Choice will also enhance Enterprise’s infrastructure to support its existing California operations. ▪ Credit Philosophy: Both banks are “traditional” commercial banks, and First Choice complements Enterprise’s credit profile with additional niches, further scaling existing investments and enhancing areas of existing focus for Enterprise. ▪ Increased Scale: The strategic fit and the financial merits of the transaction facilitate crossing $10 billion with momentum. The transaction will scale revenue and EPS while absorbing the financial impact of crossing $10 billion. ▪ Strong Management: Enterprise and First Choice management teams have experience leading high performance commercial banks in their respective regions, as well as integrating other businesses via acquisition. Source: S&P Global Market Intelligence 1) Reflects consolidated financial information as of 3/31/2021 without giving effect to purchase accounting 2) 2021 Forbes Media LLC, U.S. News 3) Real GDP as of 2019 4
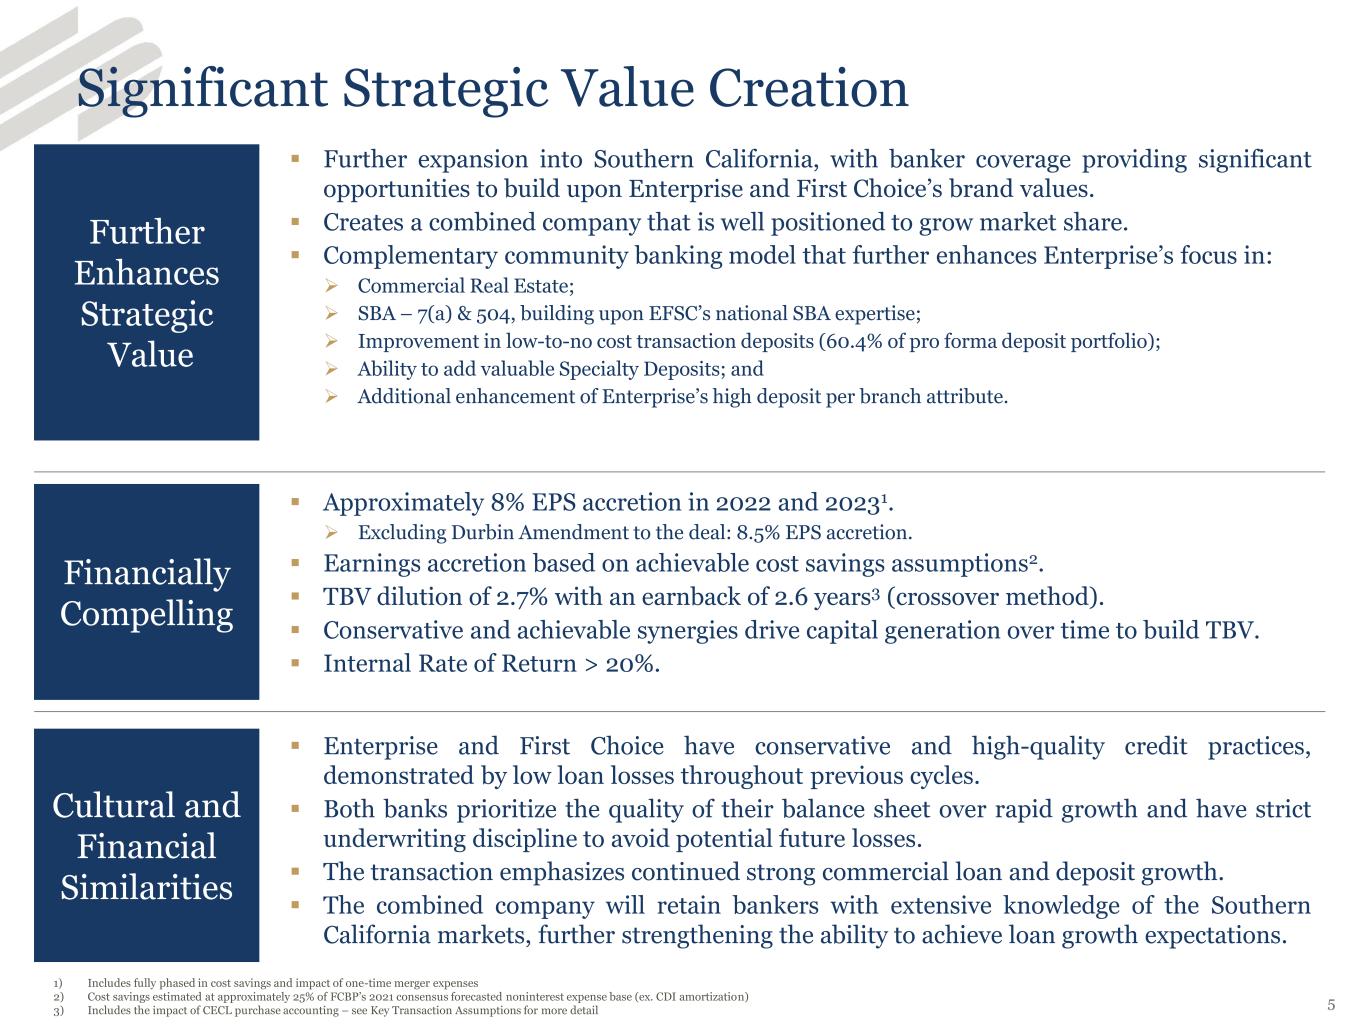
Significant Strategic Value Creation Further Enhances Strategic Value Financially Compelling Cultural and Financial Similarities ▪ Further expansion into Southern California, with banker coverage providing significant opportunities to build upon Enterprise and First Choice’s brand values. ▪ Creates a combined company that is well positioned to grow market share. ▪ Complementary community banking model that further enhances Enterprise’s focus in: ➢ Commercial Real Estate; ➢ SBA – 7(a) & 504, building upon EFSC’s national SBA expertise; ➢ Improvement in low-to-no cost transaction deposits (60.4% of pro forma deposit portfolio); ➢ Ability to add valuable Specialty Deposits; and ➢ Additional enhancement of Enterprise’s high deposit per branch attribute. ▪ Approximately 8% EPS accretion in 2022 and 20231. ➢ Excluding Durbin Amendment to the deal: 8.5% EPS accretion. ▪ Earnings accretion based on achievable cost savings assumptions2. ▪ TBV dilution of 2.7% with an earnback of 2.6 years3 (crossover method). ▪ Conservative and achievable synergies drive capital generation over time to build TBV. ▪ Internal Rate of Return > 20%. ▪ Enterprise and First Choice have conservative and high-quality credit practices, demonstrated by low loan losses throughout previous cycles. ▪ Both banks prioritize the quality of their balance sheet over rapid growth and have strict underwriting discipline to avoid potential future losses. ▪ The transaction emphasizes continued strong commercial loan and deposit growth. ▪ The combined company will retain bankers with extensive knowledge of the Southern California markets, further strengthening the ability to achieve loan growth expectations. 1) Includes fully phased in cost savings and impact of one-time merger expenses 2) Cost savings estimated at approximately 25% of FCBP’s 2021 consensus forecasted noninterest expense base (ex. CDI amortization) 3) Includes the impact of CECL purchase accounting – see Key Transaction Assumptions for more detail 5
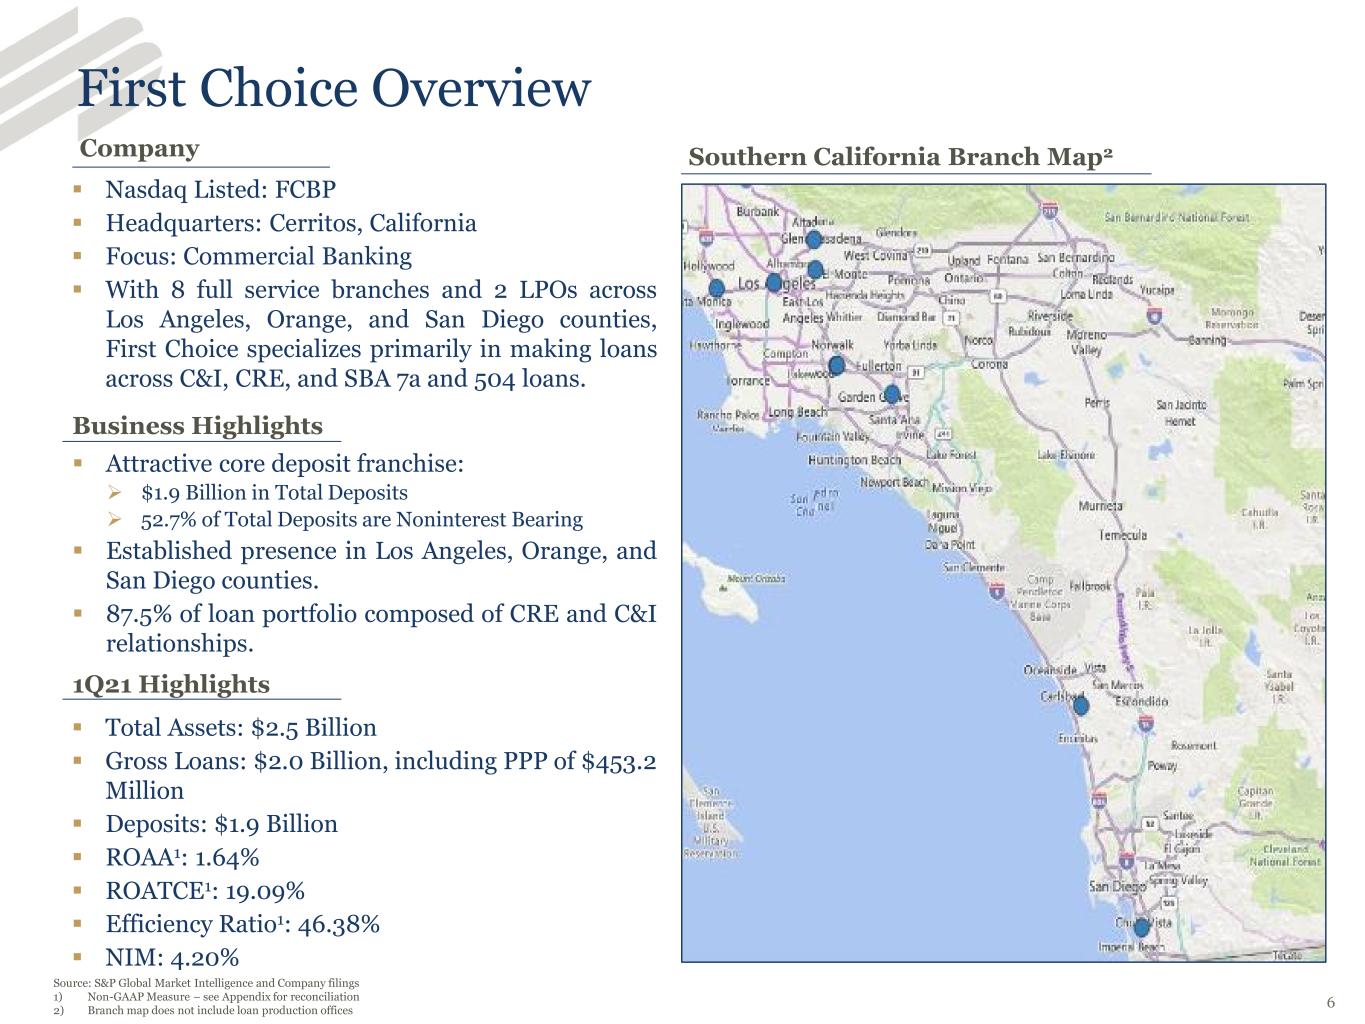
First Choice Overview Source: S&P Global Market Intelligence and Company filings 1) Non-GAAP Measure – see Appendix for reconciliation 2) Branch map does not include loan production offices ▪ Nasdaq Listed: FCBP ▪ Headquarters: Cerritos, California ▪ Focus: Commercial Banking ▪ With 8 full service branches and 2 LPOs across Los Angeles, Orange, and San Diego counties, First Choice specializes primarily in making loans across C&I, CRE, and SBA 7a and 504 loans. ▪ Attractive core deposit franchise: ➢ $1.9 Billion in Total Deposits ➢ 52.7% of Total Deposits are Noninterest Bearing ▪ Established presence in Los Angeles, Orange, and San Diego counties. ▪ 87.5% of loan portfolio composed of CRE and C&I relationships. ▪ Total Assets: $2.5 Billion ▪ Gross Loans: $2.0 Billion, including PPP of $453.2 Million ▪ Deposits: $1.9 Billion ▪ ROAA1: 1.64% ▪ ROATCE1: 19.09% ▪ Efficiency Ratio1: 46.38% ▪ NIM: 4.20% Southern California Branch Map2Company Business Highlights 1Q21 Highlights 6
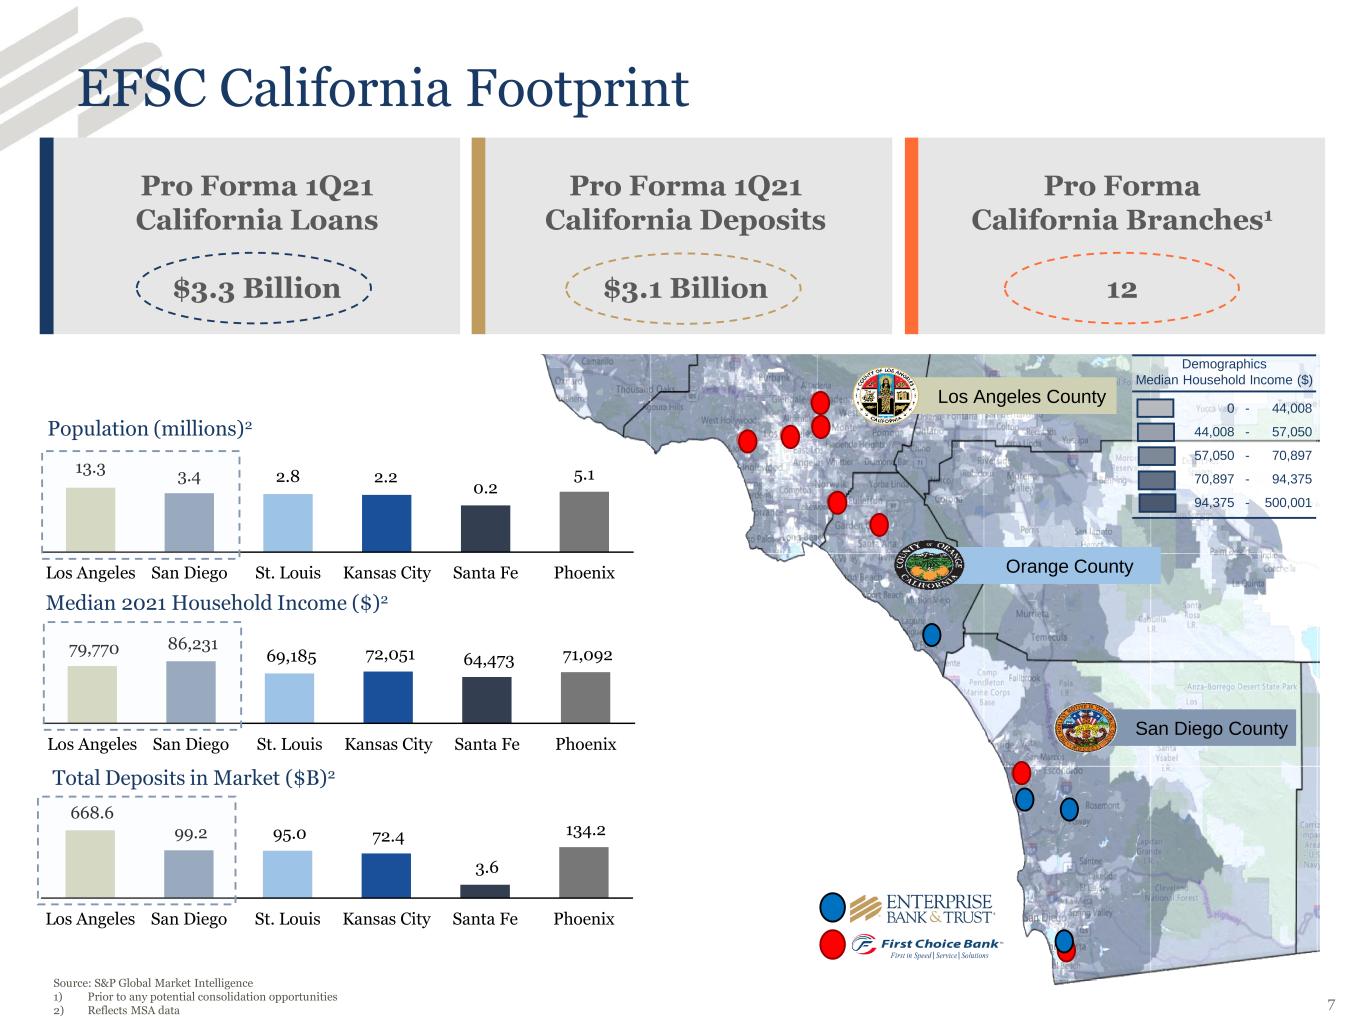
EFSC California Footprint 13.3 3.4 2.8 2.2 0.2 5.1 Los Angeles San Diego St. Louis Kansas City Santa Fe Phoenix Population (millions)2 Median 2021 Household Income ($)2 79,770 86,231 69,185 72,051 64,473 71,092 Los Angeles San Diego St. Louis Kansas City Santa Fe Phoenix Total Deposits in Market ($B)2 668.6 99.2 95.0 72.4 3.6 134.2 Los Angeles San Diego St. Louis Kansas City Santa Fe Phoenix Source: S&P Global Market Intelligence 1) Prior to any potential consolidation opportunities 2) Reflects MSA data Pro Forma 1Q21 California Loans $3.3 Billion Pro Forma 1Q21 California Deposits $3.1 Billion Pro Forma California Branches1 12 Demographics Median Household Income ($) 0 - 44,008 44,008 - 57,050 57,050 - 70,897 70,897 - 94,375 94,375 - 500,001 7 Orange County Los Angeles County San Diego County
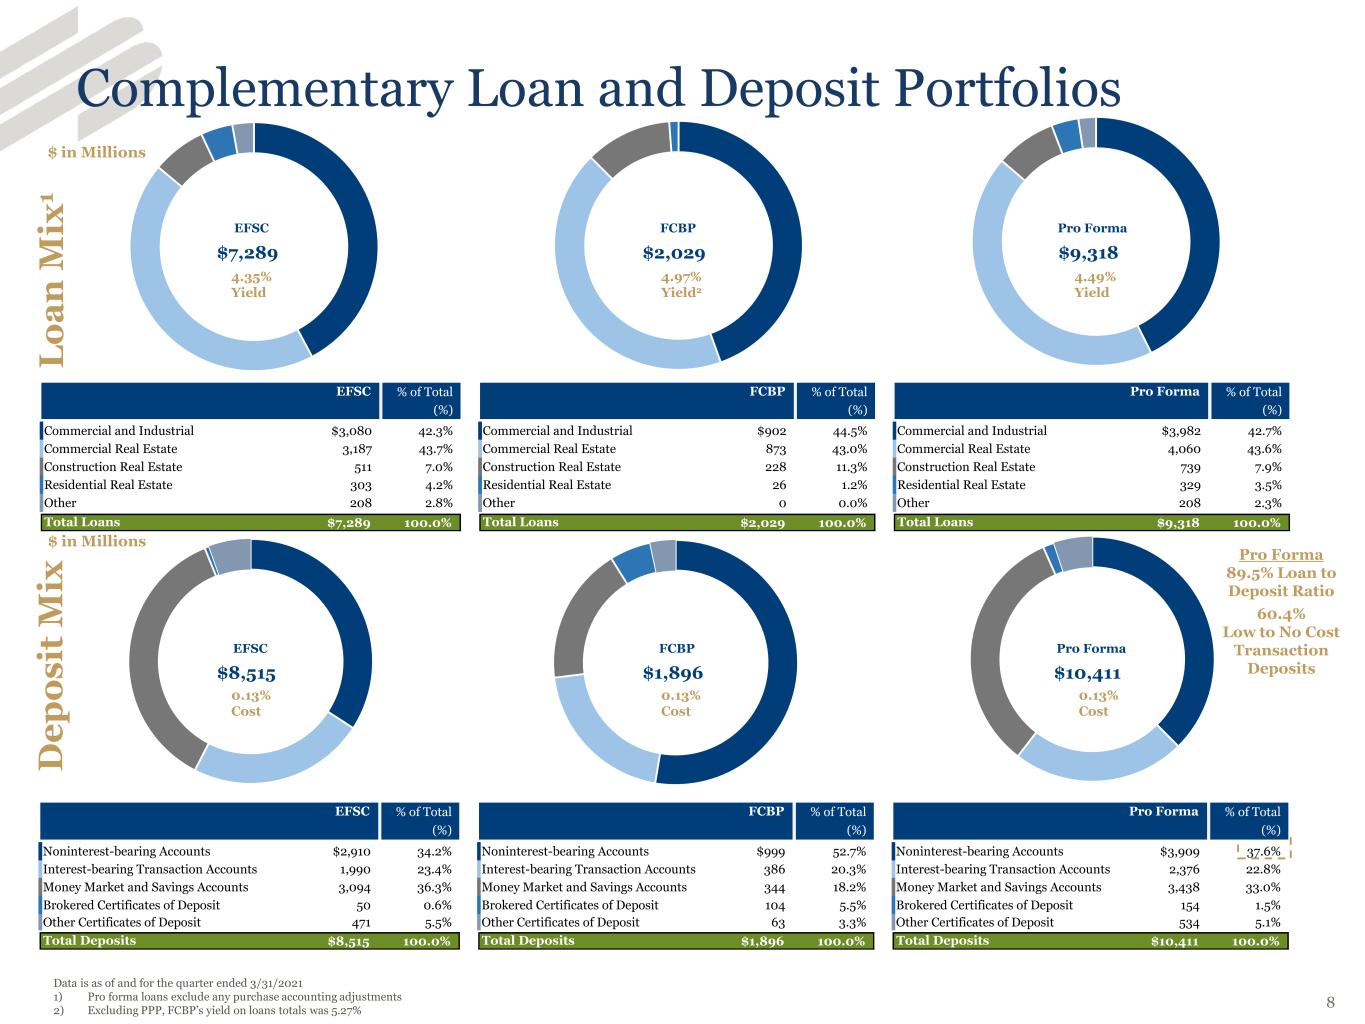
Complementary Loan and Deposit Portfolios Data is as of and for the quarter ended 3/31/2021 1) Pro forma loans exclude any purchase accounting adjustments 2) Excluding PPP, FCBP’s yield on loans totals was 5.27% 4.35% Yield 0.13% Cost 4.97% Yield2 4.49% Yield 0.13% Cost 0.13% Cost Pro Forma 89.5% Loan to Deposit Ratio 60.4% Low to No Cost Transaction Deposits L o a n M ix 1 D e p o s it M ix 8 $ in Millions $ in Millions % of Total % of Total % of Total (%) (%) (%) Commercial and Industrial $3,080 42.3% Commercial and Industrial $902 44.5% Commercial and Industrial $3,982 42.7% Commercial Real Estate 3,187 43.7% Commercial Real Estate 873 43.0% Commercial Real Estate 4,060 43.6% Construction Real Estate 511 7.0% Construction Real Estate 228 11.3% Construction Real Estate 739 7.9% Residential Real Estate 303 4.2% Residential Real Estate 26 1.2% Residential Real Estate 329 3.5% Other 208 2.8% Other 0 0.0% Other 208 2.3% Total Loans $7,289 100.0% Total Loans $2,029 100.0% Total Loans $9,318 100.0% EFSC FCBP Pro Forma $7,289 $2,029 $9,318 EFSC FCBP Pro Forma % of Total % of Total % of Total (%) (%) (%) Noninterest-bearing Accounts $2,910 34.2% Noninterest-bearing Accounts $999 52.7% Noninterest-bearing Accounts $3,909 37.6% Interest-bearing Transaction Accounts 1,990 23.4% Interest-bearing Transaction Accounts 386 20.3% Interest-bearing Transaction Accounts 2,376 22.8% Money Market and Savings Accounts 3,094 36.3% Money Market and Savings Accounts 344 18.2% Money Market and Savings Accounts 3,438 33.0% Brokered Certificates of Deposit 50 0.6% Brokered Certificates of Deposit 104 5.5% Brokered Certificates of Deposit 154 1.5% Other Certificates of Deposit 471 5.5% Other Certificates of Deposit 63 3.3% Other Certificates of Deposit 534 5.1% Total Deposits $8,515 100.0% Total Deposits $1,896 100.0% Total Deposits $10,411 100.0% EFSC FCBP Pro Forma $8,515 $1,896 $10,411 EFSC FCBP Pro Forma
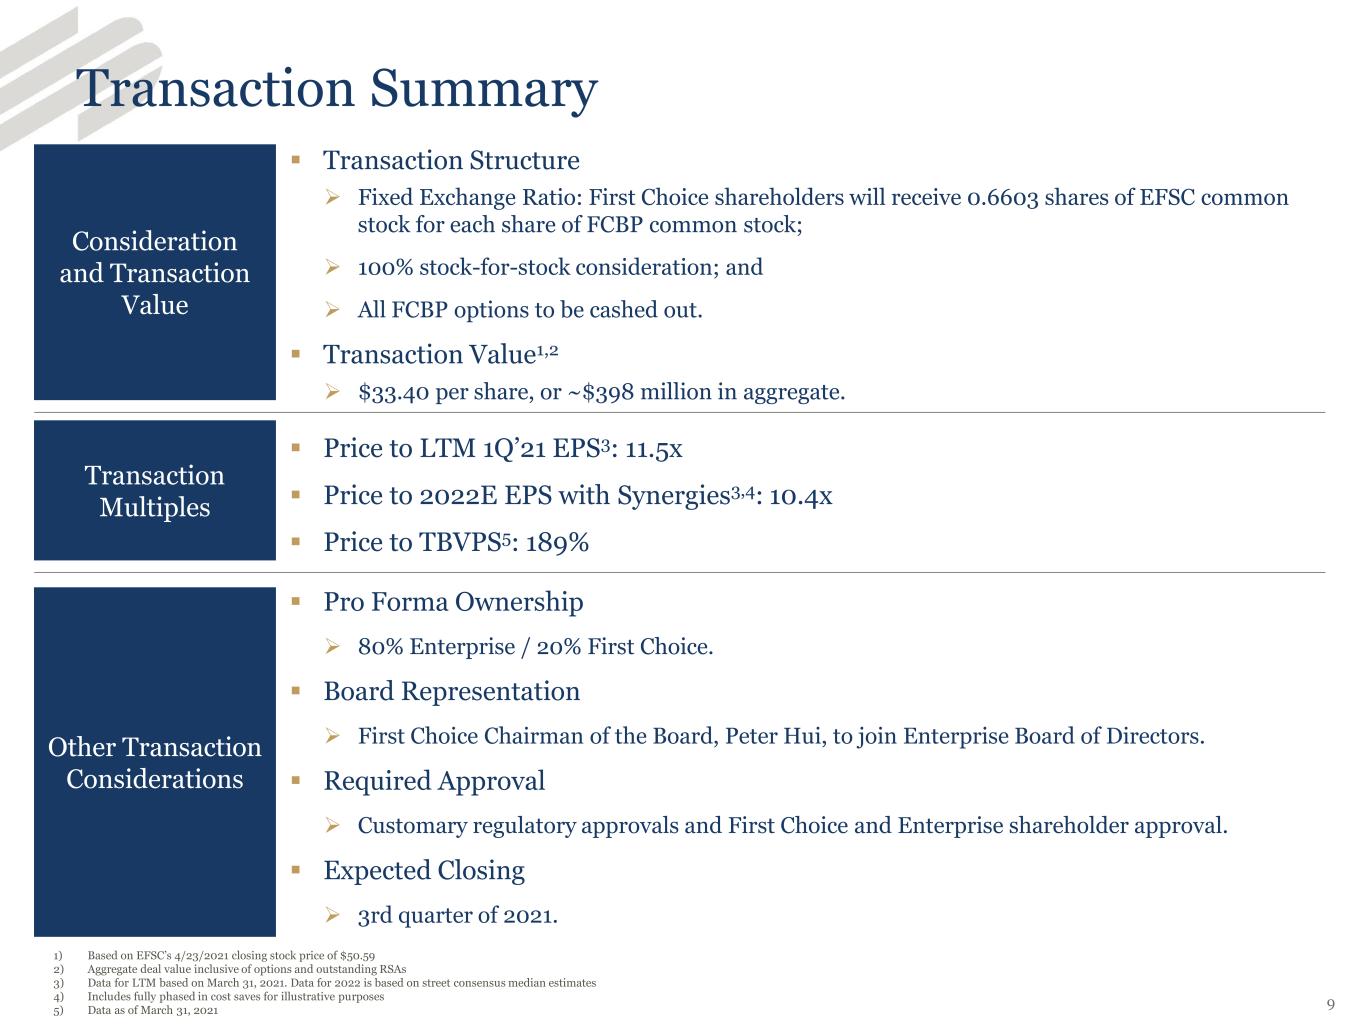
Transaction Summary Consideration and Transaction Value Other Transaction Considerations ▪ Transaction Structure ➢ Fixed Exchange Ratio: First Choice shareholders will receive 0.6603 shares of EFSC common stock for each share of FCBP common stock; ➢ 100% stock-for-stock consideration; and ➢ All FCBP options to be cashed out. ▪ Transaction Value1,2 ➢ $33.40 per share, or ~$398 million in aggregate. Transaction Multiples ▪ Price to LTM 1Q’21 EPS3: 11.5x ▪ Price to 2022E EPS with Synergies3,4: 10.4x ▪ Price to TBVPS5: 189% ▪ Pro Forma Ownership ➢ 80% Enterprise / 20% First Choice. ▪ Board Representation ➢ First Choice Chairman of the Board, Peter Hui, to join Enterprise Board of Directors. ▪ Required Approval ➢ Customary regulatory approvals and First Choice and Enterprise shareholder approval. ▪ Expected Closing ➢ 3rd quarter of 2021. 1) Based on EFSC’s 4/23/2021 closing stock price of $50.59 2) Aggregate deal value inclusive of options and outstanding RSAs 3) Data for LTM based on March 31, 2021. Data for 2022 is based on street consensus median estimates 4) Includes fully phased in cost saves for illustrative purposes 5) Data as of March 31, 2021 9
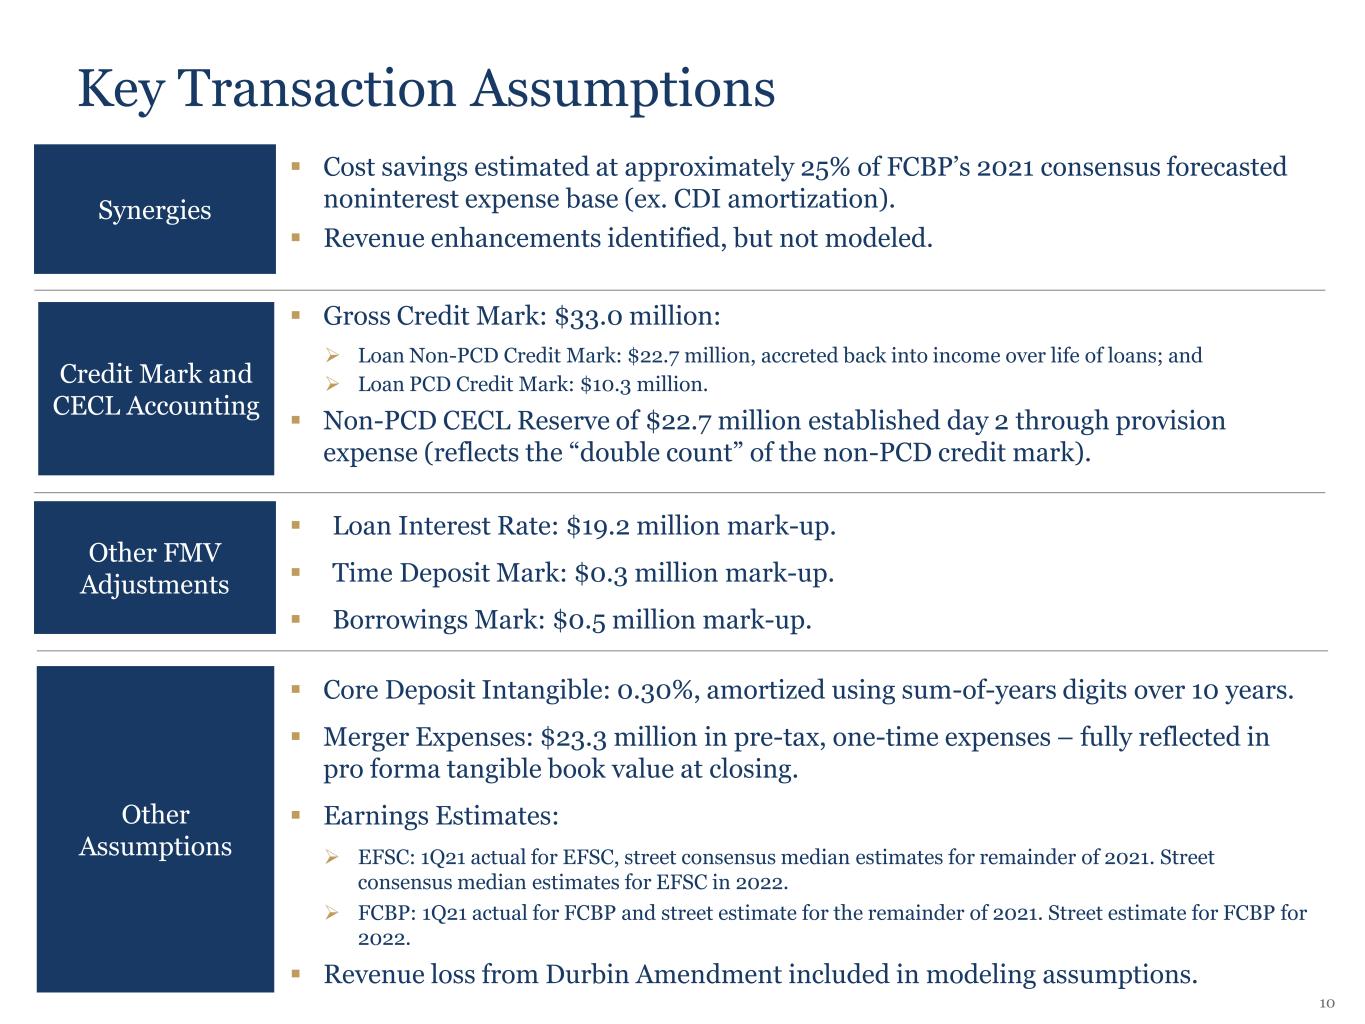
Key Transaction Assumptions Synergies Other FMV Adjustments ▪ Cost savings estimated at approximately 25% of FCBP’s 2021 consensus forecasted noninterest expense base (ex. CDI amortization). ▪ Revenue enhancements identified, but not modeled. Credit Mark and CECL Accounting ▪ Loan Interest Rate: $19.2 million mark-up. ▪ Time Deposit Mark: $0.3 million mark-up. ▪ Borrowings Mark: $0.5 million mark-up. ▪ Gross Credit Mark: $33.0 million: ➢ Loan Non-PCD Credit Mark: $22.7 million, accreted back into income over life of loans; and ➢ Loan PCD Credit Mark: $10.3 million. ▪ Non-PCD CECL Reserve of $22.7 million established day 2 through provision expense (reflects the “double count” of the non-PCD credit mark). Other Assumptions ▪ Core Deposit Intangible: 0.30%, amortized using sum-of-years digits over 10 years. ▪ Merger Expenses: $23.3 million in pre-tax, one-time expenses – fully reflected in pro forma tangible book value at closing. ▪ Earnings Estimates: ➢ EFSC: 1Q21 actual for EFSC, street consensus median estimates for remainder of 2021. Street consensus median estimates for EFSC in 2022. ➢ FCBP: 1Q21 actual for FCBP and street estimate for the remainder of 2021. Street estimate for FCBP for 2022. ▪ Revenue loss from Durbin Amendment included in modeling assumptions. 10
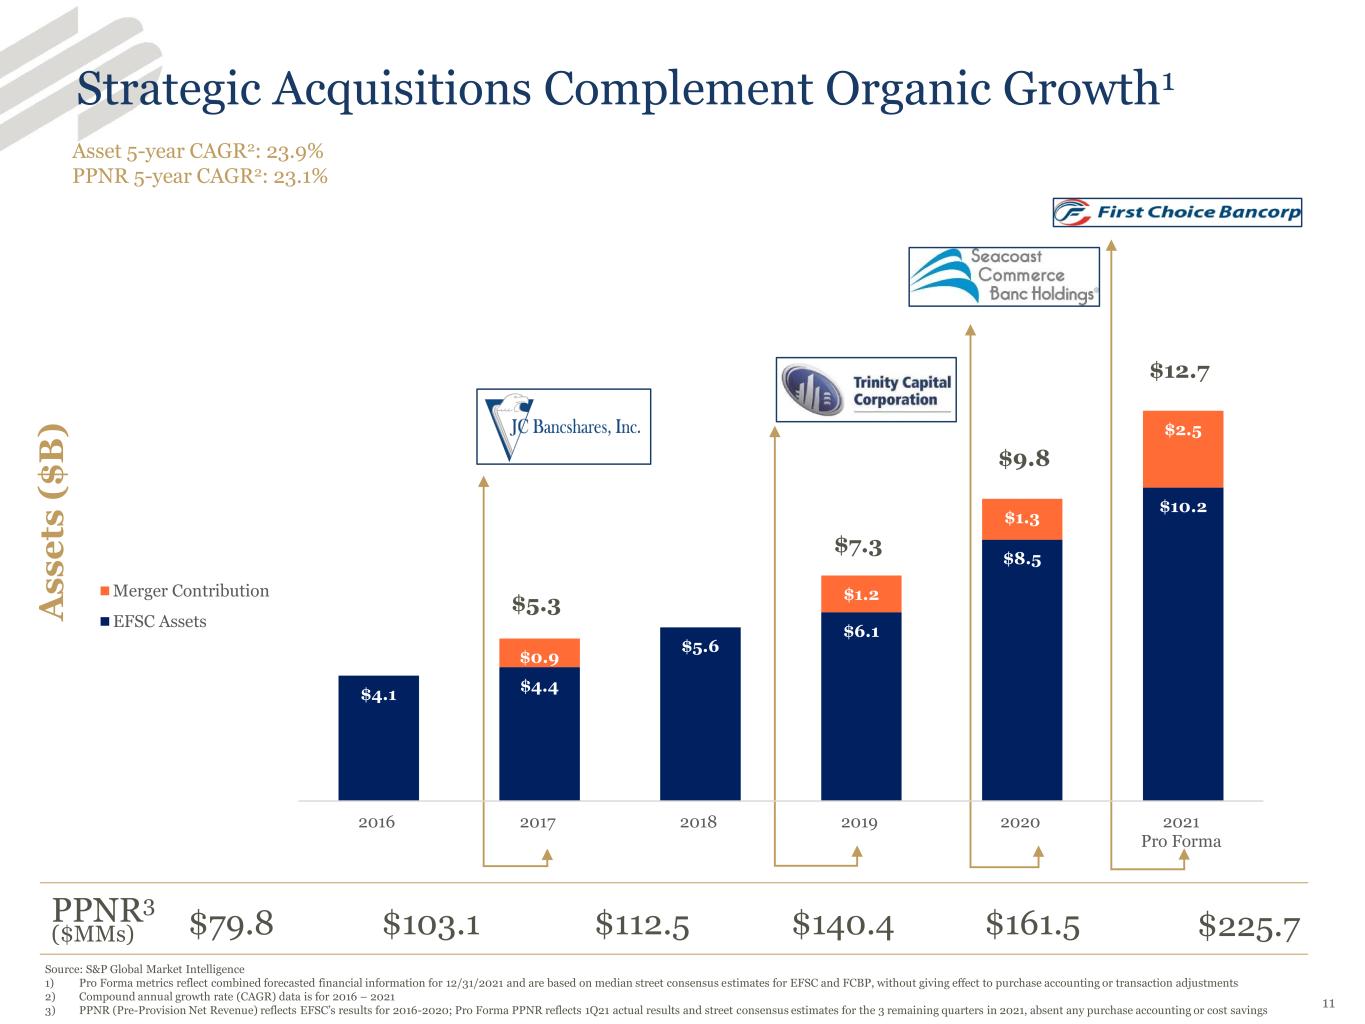
Strategic Acquisitions Complement Organic Growth1 Source: S&P Global Market Intelligence 1) Pro Forma metrics reflect combined forecasted financial information for 12/31/2021 and are based on median street consensus estimates for EFSC and FCBP, without giving effect to purchase accounting or transaction adjustments 2) Compound annual growth rate (CAGR) data is for 2016 – 2021 3) PPNR (Pre-Provision Net Revenue) reflects EFSC’s results for 2016-2020; Pro Forma PPNR reflects 1Q21 actual results and street consensus estimates for the 3 remaining quarters in 2021, absent any purchase accounting or cost savings A s s e ts ( $ B ) Asset 5-year CAGR2: 23.9% PPNR 5-year CAGR2: 23.1% PPNR3 ($MMs) $79.8 $103.1 $112.5 $140.4 $161.5 $225.7 11 Jefferson County Assets $933.1 Million $5.3 $7.3 $9.8 $12.7 $4.1 $4.4 $5.6 $6.1 $8.5 $10.2 $0.9 $1.2 $1.3 $2.5 2016 2017 2018 2019 2020 2021 Pro Forma Merger Contribution EFSC Assets
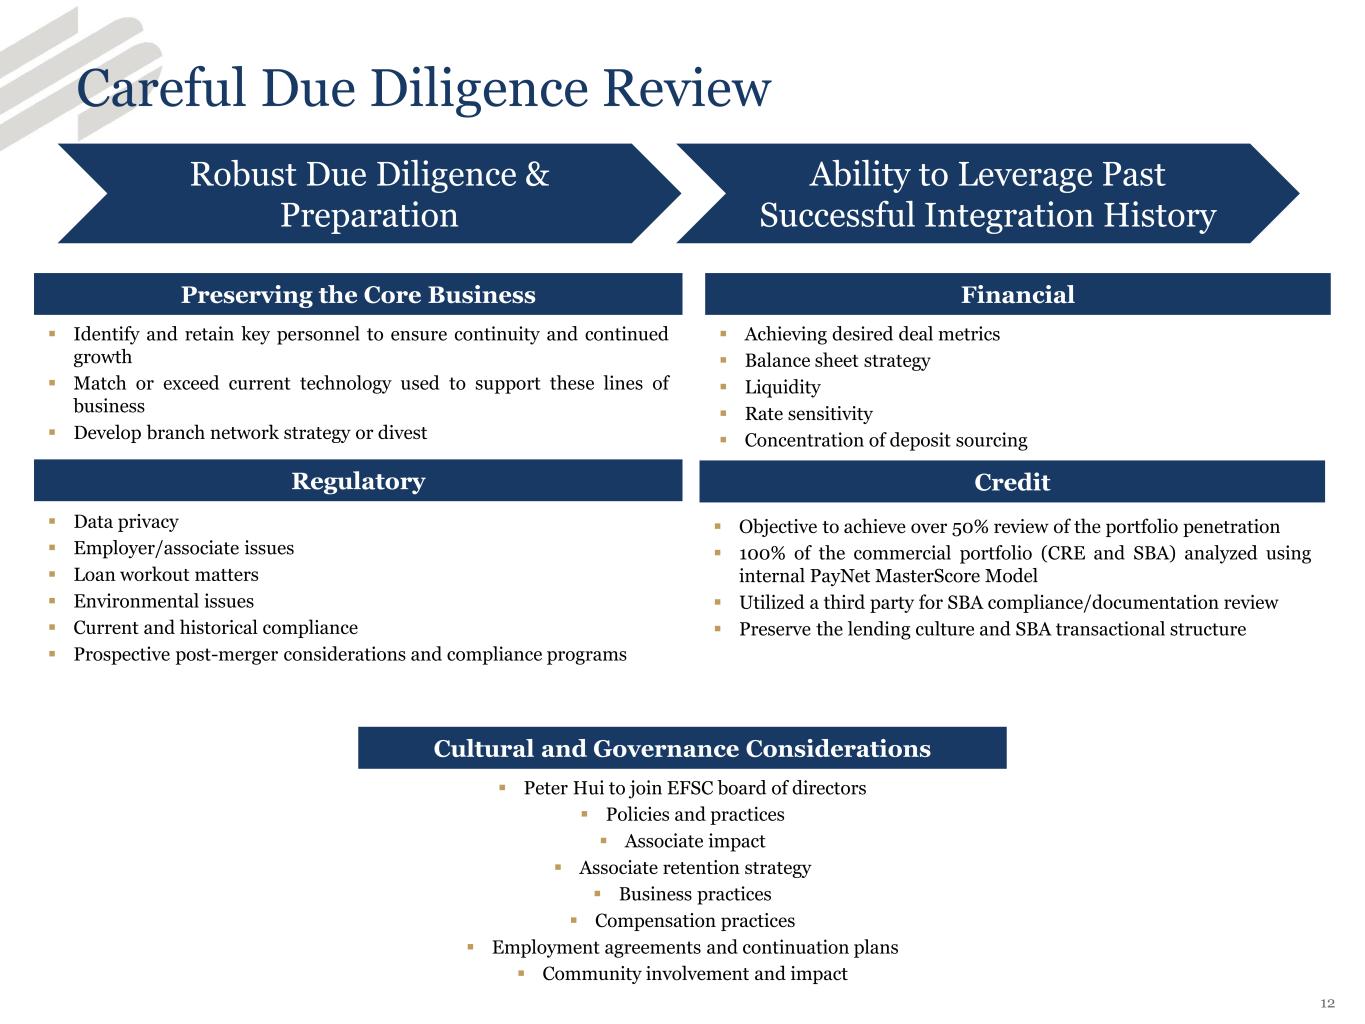
Careful Due Diligence Review Preserving the Core Business ▪ Identify and retain key personnel to ensure continuity and continued growth ▪ Match or exceed current technology used to support these lines of business ▪ Develop branch network strategy or divest Regulatory ▪ Data privacy ▪ Employer/associate issues ▪ Loan workout matters ▪ Environmental issues ▪ Current and historical compliance ▪ Prospective post-merger considerations and compliance programs Cultural and Governance Considerations ▪ Peter Hui to join EFSC board of directors ▪ Policies and practices ▪ Associate impact ▪ Associate retention strategy ▪ Business practices ▪ Compensation practices ▪ Employment agreements and continuation plans ▪ Community involvement and impact Financial ▪ Achieving desired deal metrics ▪ Balance sheet strategy ▪ Liquidity ▪ Rate sensitivity ▪ Concentration of deposit sourcing Credit ▪ Objective to achieve over 50% review of the portfolio penetration ▪ 100% of the commercial portfolio (CRE and SBA) analyzed using internal PayNet MasterScore Model ▪ Utilized a third party for SBA compliance/documentation review ▪ Preserve the lending culture and SBA transactional structure Robust Due Diligence & Preparation Ability to Leverage Past Successful Integration History 12
Appendix
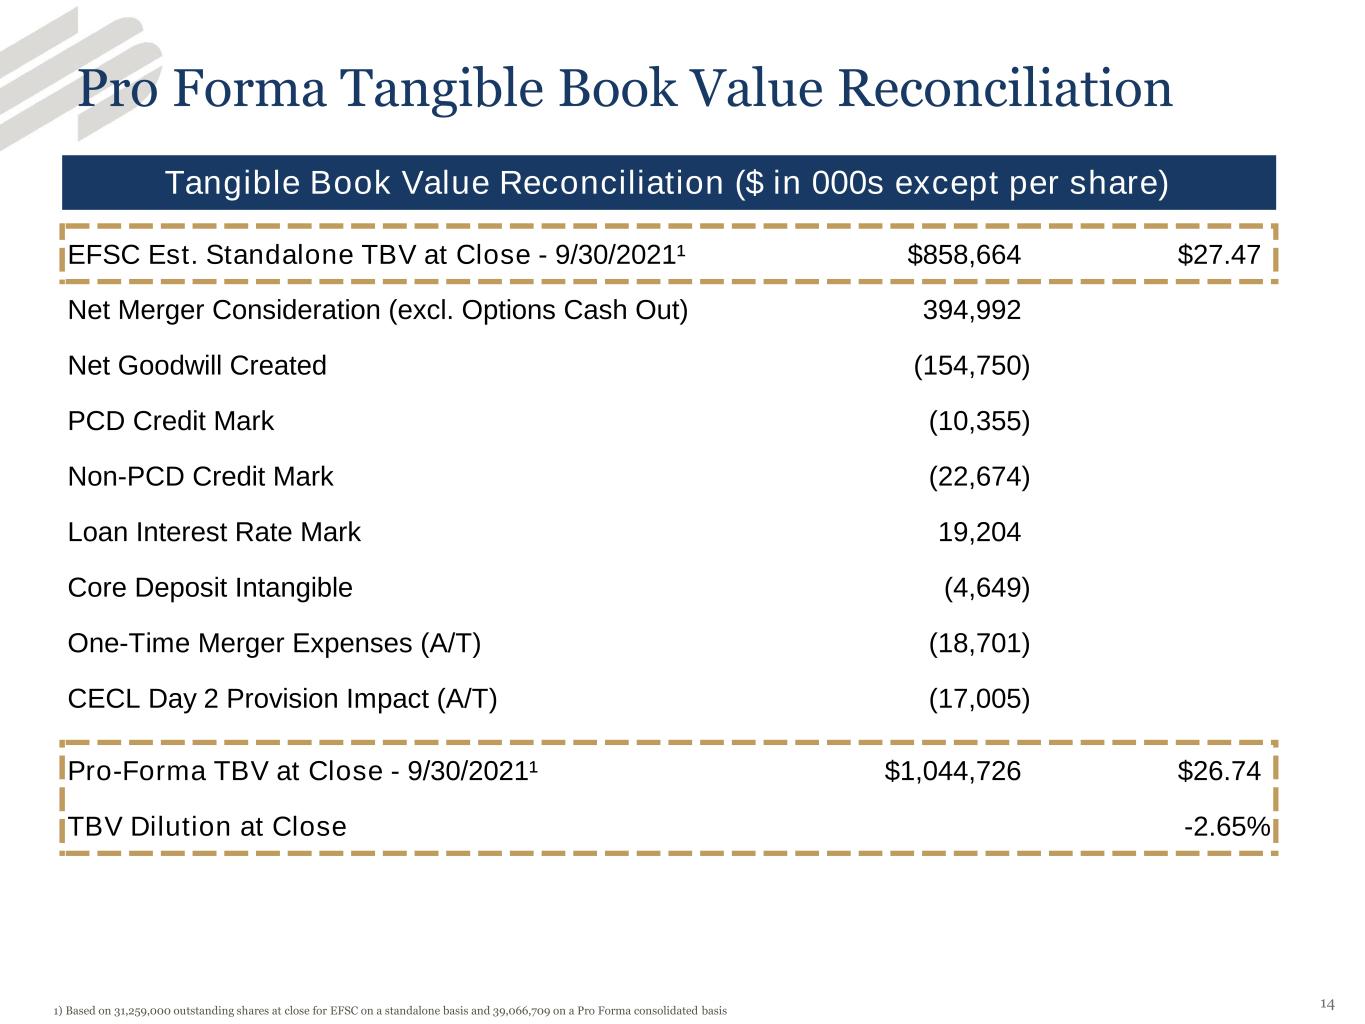
Pro Forma Tangible Book Value Reconciliation 1) Based on 31,259,000 outstanding shares at close for EFSC on a standalone basis and 39,066,709 on a Pro Forma consolidated basis 14 Tangible Book Value Reconciliation ($ in 000s except per share) EFSC Est. Standalone TBV at Close - 9/30/2021¹ $858,664 $27.47 Net Merger Consideration (excl. Options Cash Out) 394,992 Net Goodwill Created (154,750) PCD Credit Mark (10,355) Non-PCD Credit Mark (22,674) Loan Interest Rate Mark 19,204 Core Deposit Intangible (4,649) One-Time Merger Expenses (A/T) (18,701) CECL Day 2 Provision Impact (A/T) (17,005) Pro-Forma TBV at Close - 9/30/2021¹ $1,044,726 $26.74 TBV Dilution at Close -2.65%
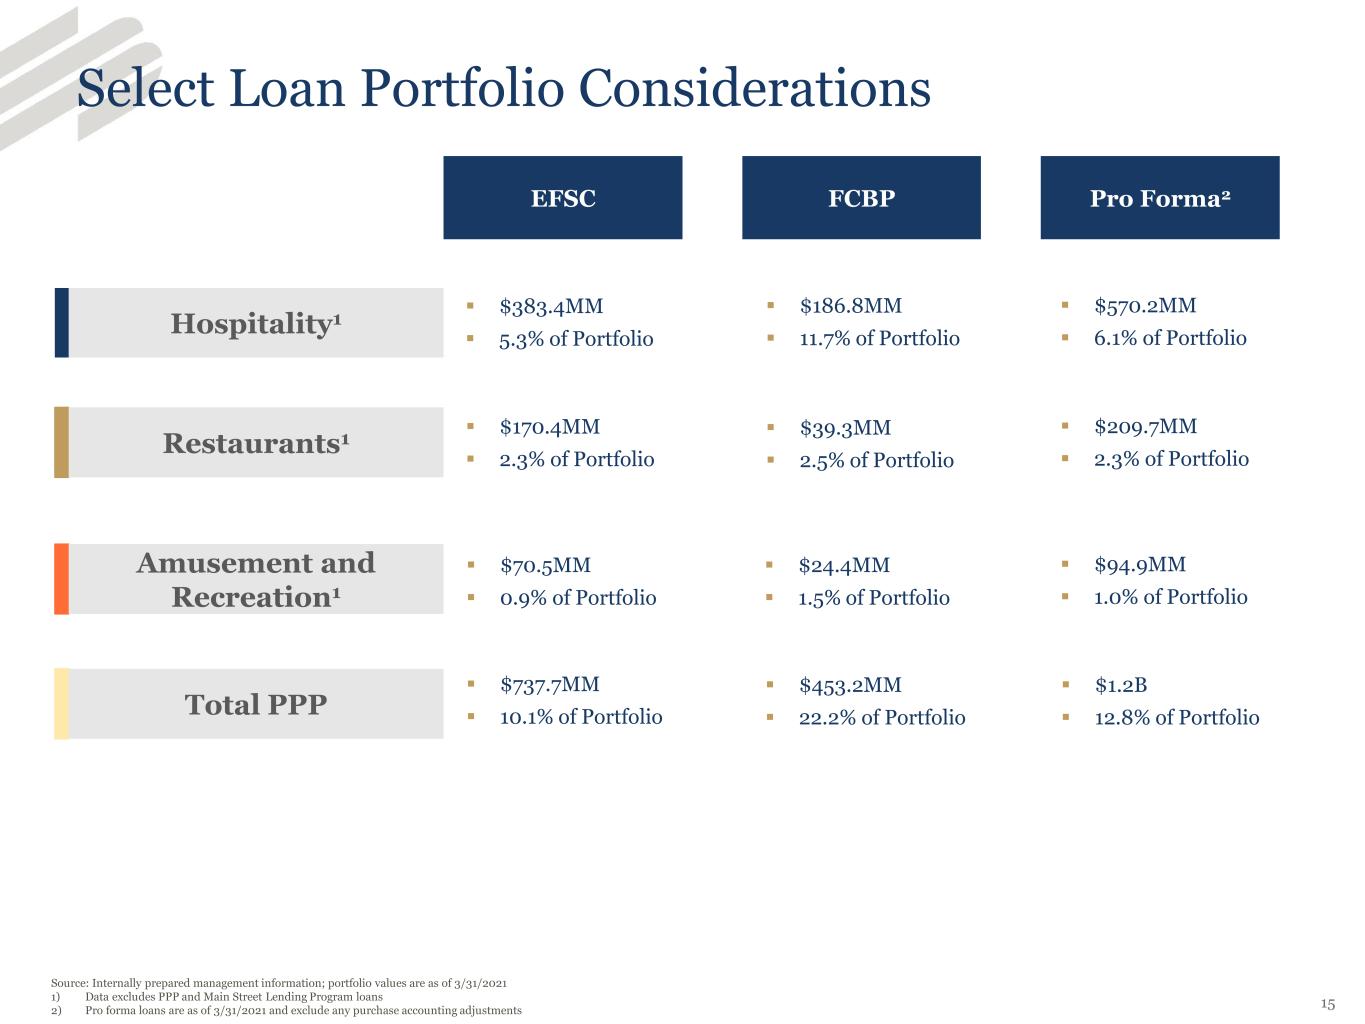
Select Loan Portfolio Considerations Source: Internally prepared management information; portfolio values are as of 3/31/2021 1) Data excludes PPP and Main Street Lending Program loans 2) Pro forma loans are as of 3/31/2021 and exclude any purchase accounting adjustments EFSC FCBP Pro Forma2 15 Hospitality1 ▪ $383.4MM ▪ 5.3% of Portfolio ▪ $170.4MM ▪ 2.3% of Portfolio ▪ $186.8MM ▪ 11.7% of Portfolio ▪ $39.3MM ▪ 2.5% of Portfolio ▪ $570.2MM ▪ 6.1% of Portfolio ▪ $209.7MM ▪ 2.3% of Portfolio Restaurants1 ▪ $70.5MM ▪ 0.9% of Portfolio ▪ $24.4MM ▪ 1.5% of Portfolio ▪ $94.9MM ▪ 1.0% of Portfolio Amusement and Recreation1 ▪ $737.7MM ▪ 10.1% of Portfolio ▪ $453.2MM ▪ 22.2% of Portfolio ▪ $1.2B ▪ 12.8% of Portfolio Total PPP
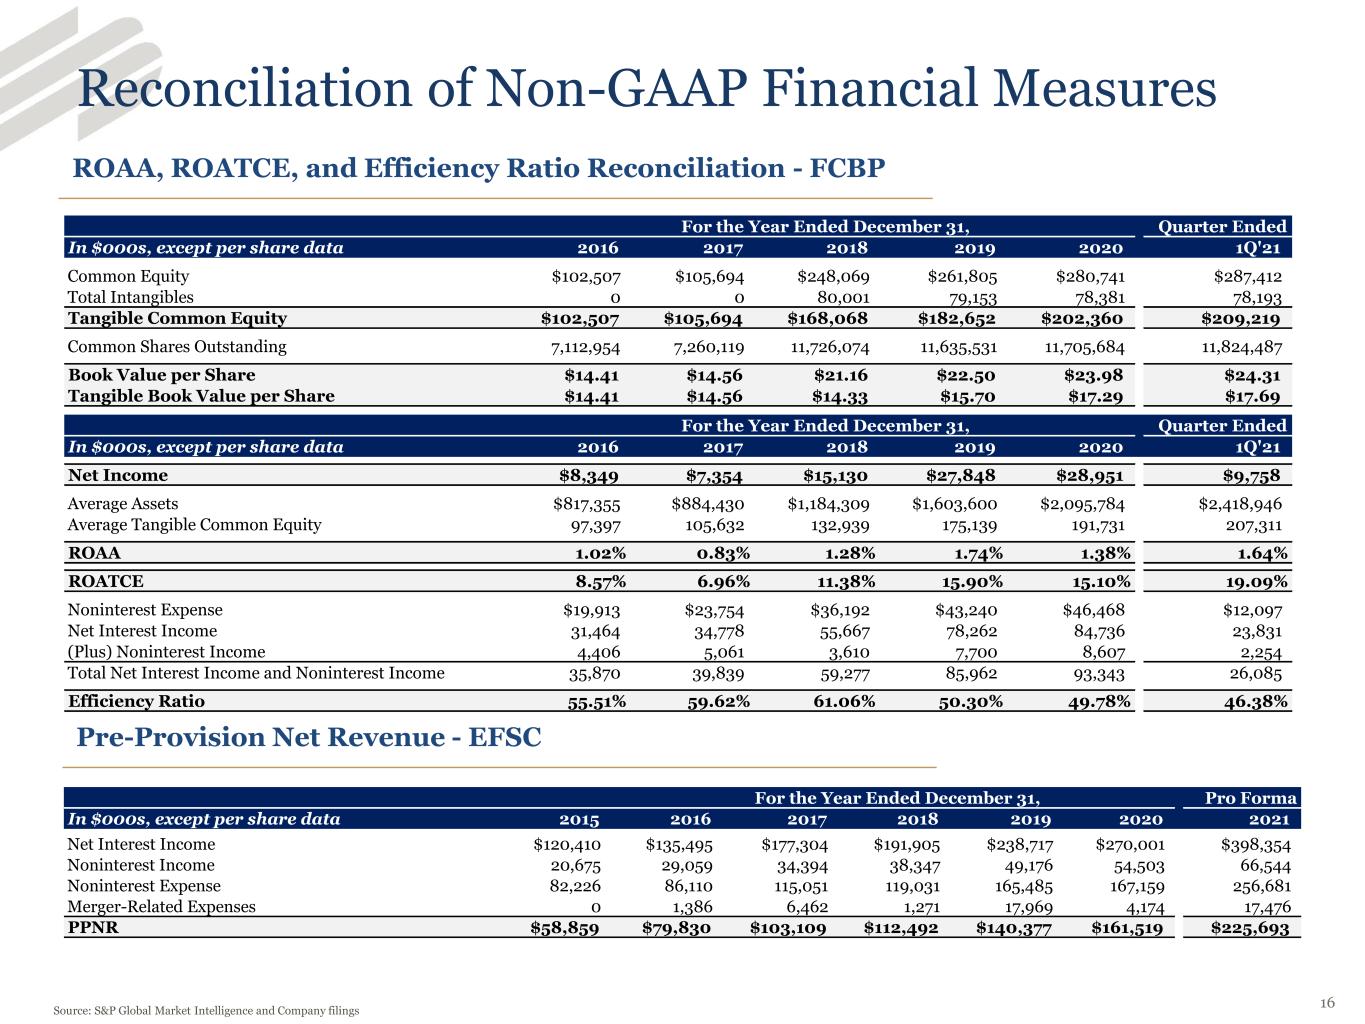
Reconciliation of Non-GAAP Financial Measures ROAA, ROATCE, and Efficiency Ratio Reconciliation - FCBP Source: S&P Global Market Intelligence and Company filings Pre-Provision Net Revenue - EFSC 16 For the Year Ended December 31, Pro Forma In $000s, except per share data 2015 2016 2017 2018 2019 2020 2021 Net Interest Income $120,410 $135,495 $177,304 $191,905 $238,717 $270,001 $398,354 Noninterest Income 20,675 29,059 34,394 38,347 49,176 54,503 66,544 Noninterest Expense 82,226 86,110 115,051 119,031 165,485 167,159 256,681 Merger-Related Expenses 0 1,386 6,462 1,271 17,969 4,174 17,476 PPNR $58,859 $79,830 $103,109 $112,492 $140,377 $161,519 $225,693 For the Year Ended December 31, Quarter Ended In $000s, except per share data 2016 2017 2018 2019 2020 1Q'21 Common Equity $102,507 $105,694 $248,069 $261,805 $280,741 $287,412 Total Intangibles 0 0 80,001 79,153 78,381 78,193 Tangible Common Equity $102,507 $105,694 $168,068 $182,652 $202,360 $209,219 Common Shares Outstanding 7,112,954 7,260,119 11,726,074 11,635,531 11,705,684 11,824,487 Book Value per Share $14.41 $14.56 $21.16 $22.50 $23.98 $24.31 Tangible Book Value per Share $14.41 $14.56 $14.33 $15.70 $17.29 $17.69 For the Year Ended December 31, Quarter Ended In $000s, except per share data 2016 2017 2018 2019 2020 1Q'21 Net Income $8,349 $7,354 $15,130 $27,848 $28,951 $9,758 Average Assets $817,355 $884,430 $1,184,309 $1,603,600 $2,095,784 $2,418,946 Average Tangible Common Equity 97,397 105,632 132,939 175,139 191,731 207,311 ROAA 1.02% 0.83% 1.28% 1.74% 1.38% 1.64% ROATCE 8.57% 6.96% 11.38% 15.90% 15.10% 19.09% Noninterest Expense $19,913 $23,754 $36,192 $43,240 $46,468 $12,097 Net Interest Income 31,464 34,778 55,667 78,262 84,736 23,831 (Plus) Noninterest Income 4,406 5,061 3,610 7,700 8,607 2,254 Total Net Interest Income and Noninterest Income 35,870 39,839 59,277 85,962 93,343 26,085 Efficiency Ratio 55.51% 59.62% 61.06% 50.30% 49.78% 46.38%

