Attached files
UNITED STATES
SECURITIES AND EXCHANGE COMMISSION
WASHINGTON, D. C. 20549
SECURITIES AND EXCHANGE COMMISSION
WASHINGTON, D. C. 20549
FORM 10-K
| [X] | Annual Report Pursuant to Section 13 or 15(d) of the Securities and Exchange Act of 1934 | |
| For the fiscal year ended December 31, 2009 | ||
| [ ] | Transition Report Pursuant to Section 13 or 15(d) of the Securities and Exchange Act of 1934 | |
| For the transition period from to | ||
| Commission file number 001-15373 | ||
ENTERPRISE FINANCIAL SERVICES
CORP
Incorporated in the State of Delaware
I.R.S. Employer Identification # 43-1706259
Address: 150 North Meramec
Clayton, MO 63105
Telephone: (314) 725-5500
Incorporated in the State of Delaware
I.R.S. Employer Identification # 43-1706259
Address: 150 North Meramec
Clayton, MO 63105
Telephone: (314) 725-5500
___________________
| Securities registered pursuant to Section 12(b) of the Act: | |
| (Title of class) | (Name of each exchange on which registered) |
| Common Stock, par value $.01 per share | NASDAQ Global Select Market |
Securities registered pursuant to Section
12(g) of the Act:
None
None
Indicate by checkmark
if the registrant is a well-known seasoned issuer, as defined in Rule 405 of the
Securities Act. Yes [ ] No [X]
Indicate by checkmark
if the registrant is not required to file reports pursuant to Section 13 or
Section 15(d) of the Act. Yes
[ ] No [X]
Indicate by check
mark whether the registrant (1) has filed all reports required to be filed by
Section 13 or 15(d) of the Securities Exchange Act of 1934 during the preceding
12 months, and (2) has been subject to such filing requirements for the past 90
days. Yes [X] No [ ]
Indicate by check
mark if disclosure of delinquent filers pursuant to Item 405 of Regulation S-K
is not contained herein, and will not be contained, to the best of registrant’s
knowledge, in definitive proxy or information statements incorporated by
reference in Part III of this Form 10-K. [ ]
Indicate by check
mark whether the registrant has submitted electronically and posted on its
website, if any, every Interactive Data file required to be submitted and posted
pursuant to Rule 405 of Regulation S-7 (§ 232.405 of this chapter) during the
preceding 12 months (or for such shorter period that the registrant was required
to submit and post such files) Yes [ ] No [
]
Indicate by check
mark whether the registrant is a large accelerated filer, an accelerated filer,
or a non-accelerated filer. See definition of “accelerated filer and large
accelerated filer” in Rule 12b-2 of the Exchange Act. (Check one):
| Large accelerated filer: [ ] | Accelerated filer: [X] | Non-accelerated filer: [ ] | Smaller Reporting Company: [ ] |
| (Other than a smaller reporting company) | |||
Indicate by check
mark whether the registrant is a shell company as defined in Rule 12b-2 of the
Exchange Act Yes [ ] No [X]
The aggregate market
value of the common stock held by non-affiliates of the Registrant was
approximately $123,481,194 based on the closing price of the common stock of
$9.01 on March 1, 2010, as reported by the NASDAQ Global Select
Market.
As of March 1, 2010,
the Registrant had 14,851,609 shares of common stock outstanding.
DOCUMENTS INCORPORATED BY
REFERENCE
Certain information required for Part III of this report is incorporated by reference to the Registrant’s Proxy Statement for the
2010 Annual Meeting of Shareholders, which will be filed within 120 days of December 31, 2009.
Certain information required for Part III of this report is incorporated by reference to the Registrant’s Proxy Statement for the
2010 Annual Meeting of Shareholders, which will be filed within 120 days of December 31, 2009.
ENTERPRISE FINANCIAL SERVICES CORP
2009 ANNUAL REPORT ON FORM 10-K
2009 ANNUAL REPORT ON FORM 10-K
TABLE OF CONTENTS
| Page | ||||
| Part I | ||||
| Item 1: | Business | 1 | ||
| Item 1A: | Risk Factors | 6 | ||
| Item 1B: | Unresolved SEC Comments | 12 | ||
| Item 2: | Properties | 12 | ||
| Item 3: | Legal Proceedings | 12 | ||
| Item 4: | Submission of Matters to Vote of Security Holders | 12 | ||
| Part II | ||||
| Item 5: | Market for Registrant’s Common Equity, Related Stockholder Matters and Issuer Purchases of Equity Securities | 13 | ||
| Item 6: | Selected Financial Data | 16 | ||
| Item 7: | Management’s Discussion and Analysis of Financial Condition and Results of Operations | 17 | ||
| Item 7A: | Quantitative and Qualitative Disclosures About Market Risk | 47 | ||
| Item 8: | Financial Statements and Supplementary Data | 48 | ||
| Item 9: | Changes in and Disagreements with Accountants on Accounting and Financial Disclosure | 93 | ||
| Item 9A: | Controls and Procedures | 94 | ||
| Item 9B: | Other Information | 96 | ||
| Part III | ||||
| Item 10: | Directors, Executive Officers and Corporate Governance | 96 | ||
| Item 11: | Executive Compensation | 96 | ||
| Item 12: | Security Ownership of Certain Beneficial Owners and Management and Related Stockholder Matters | 96 | ||
| Item 13: | Certain Relationships and Related Transactions, and Director Independence | 96 | ||
| Item 14: | Principal Accountant Fees and Services | 96 | ||
| Part IV | ||||
| Item 15: | Exhibits, Financial Statement Schedules | 97 | ||
| Signatures | 101 | |||
Safe Harbor Statement Under the Private Securities Litigation Reform Act
of 1995
Readers should note that in addition to the historical information contained herein, some of the information in this report contains forward-looking statements within the meaning of the federal securities laws. Forward-looking statements typically are identified with use of terms such as “may,” “will,” “expect,” “anticipate,” “estimate,” “potential,” “could” and similar words, although some forward-looking statements are expressed differently. You should be aware that the Company’s actual results could differ materially from those contained in the forward-looking statements due to a number of factors, including: burdens imposed by federal and state regulation, changes in accounting regulations or standards of banks; credit risk; exposure to general and local economic conditions; risks associated with rapid increase or decrease in prevailing interest rates; consolidation within the banking industry; competition from banks and other financial institutions; our ability to attract and retain relationship officers and other key personnel; or technological developments; and other risks discussed in more detail in Item 1A: “Risk Factors”, all of which could cause the Company’s actual results to differ from those set forth in the forward-looking statements.
Readers should note that in addition to the historical information contained herein, some of the information in this report contains forward-looking statements within the meaning of the federal securities laws. Forward-looking statements typically are identified with use of terms such as “may,” “will,” “expect,” “anticipate,” “estimate,” “potential,” “could” and similar words, although some forward-looking statements are expressed differently. You should be aware that the Company’s actual results could differ materially from those contained in the forward-looking statements due to a number of factors, including: burdens imposed by federal and state regulation, changes in accounting regulations or standards of banks; credit risk; exposure to general and local economic conditions; risks associated with rapid increase or decrease in prevailing interest rates; consolidation within the banking industry; competition from banks and other financial institutions; our ability to attract and retain relationship officers and other key personnel; or technological developments; and other risks discussed in more detail in Item 1A: “Risk Factors”, all of which could cause the Company’s actual results to differ from those set forth in the forward-looking statements.
Our acquisitions could cause results to differ
from expected results due to costs and expenses that are greater, or benefits
that are less, than we currently anticipate, or the assumption of unanticipated
liabilities.
Readers are cautioned not to place undue
reliance on our forward-looking statements, which reflect management’s analysis
only as of the date of the statements. The Company does not intend to publicly
revise or update forward-looking statements to reflect events or circumstances
that arise after the date of this report. Readers should carefully review all
disclosures we file from time to time with the Securities and Exchange
Commission (the “SEC”) which are available on our website at
www.enterprisebank.com.
PART I
ITEM 1: BUSINESS
General
Enterprise Financial Services Corp (“we” or “the Company” or “EFSC”), a Delaware corporation, is a financial holding company headquartered in St. Louis, Missouri. The Company provides a full range of banking and wealth management services to individuals and business customers located in the St. Louis, Kansas City and Phoenix metropolitan markets through its banking subsidiary, Enterprise Bank & Trust (“Enterprise” or “the Bank”). Our executive offices are located at 150 North Meramec, Clayton, Missouri 63105 and our telephone number is (314) 725-5500.
Enterprise Financial Services Corp (“we” or “the Company” or “EFSC”), a Delaware corporation, is a financial holding company headquartered in St. Louis, Missouri. The Company provides a full range of banking and wealth management services to individuals and business customers located in the St. Louis, Kansas City and Phoenix metropolitan markets through its banking subsidiary, Enterprise Bank & Trust (“Enterprise” or “the Bank”). Our executive offices are located at 150 North Meramec, Clayton, Missouri 63105 and our telephone number is (314) 725-5500.
On December 11, 2009,
Enterprise entered into a loss sharing agreement with the Federal Deposit
Insurance Corporation (“FDIC”) and acquired certain assets and assumed certain
liabilities of Valley Capital Bank, a full service community bank that was
headquartered in Mesa, Arizona. Under the terms of the agreement, we acquired
tangible assets with an estimated fair value of approximately $42.4 million and
assumed liabilities with an estimated fair value of approximately $43.4 million.
Under the loss sharing agreement, Enterprise will share in the losses on assets
covered under the agreement (”Covered Assets”). The FDIC has agreed to reimburse
Enterprise for 80 percent of the losses on Covered Assets up to $11,000,000 and
95 percent of the losses on Covered Assets exceeding $11,000,000. Reimbursement
for losses on single family one-to-four residential mortgage loans are made
quarterly until December 31, 2019 and reimbursement for losses on non-single
family one-to-four residential mortgage loans are made quarterly until December
31, 2014. The reimbursable losses from the FDIC are based on the book value of
the acquired loans and foreclosed assets as determined by the FDIC as of the
date of the acquisition, December 11, 2009.
On January 20, 2010,
we sold our life insurance subsidiary, Millennium Brokerage Group, LLC
(“Millennium”), for $4.0 million in cash. Enterprise acquired 60% of Millennium
in October 2005 and acquired the remaining 40% in December 2007. As a result of
the sale, Millennium is reported as a discontinued operation for all periods
presented herein.
On January 25, 2010,
the Company completed the sale of 1,931,610 shares, or $15.0 million of its
common stock in a private placement offering. We intend to use the net proceeds
of the offering for general corporate purposes, which may include, without
limitation, providing capital to support the growth of our subsidiaries and
other strategic business opportunities in our market areas, including
FDIC-assisted transactions. We may also seek the approval of our regulators to
utilize the proceeds of this offering and other cash available to us to
repurchase all or a portion of the securities that we issued to the United
States Department of the Treasury (the “U.S. Treasury”).
1
On December 19, 2008,
pursuant to the Capital Purchase Program (“CPP” or the “Capital Purchase
Program”) established by the U. S. Treasury, EFSC issued and sold to the
Treasury for an aggregate purchase price of $35.0 million in cash (i) 35,000
shares of its Fixed Rate Cumulative Perpetual Preferred Stock, Series A, par
value $.01 per share, having a liquidation preference of $1,000 per share (the
“Series A Preferred Stock”), and (ii) a ten-year warrant to purchase up to
324,074 shares of common stock, par value $.01 per share, of EFSC, at an initial
exercise price of $16.20 per share, subject to certain anti-dilution and other
adjustments (the “Warrant”).
Available Information
Our website is www.enterprisebank.com. Various reports provided to the SEC including our annual reports, quarterly reports, current reports and proxy statements are available free of charge on our website. These reports are made available as soon as reasonably practicable after they are filed with or furnished to the SEC. Our filings with the SEC are also available on the SEC’s website at http://www.sec.gov.
Our website is www.enterprisebank.com. Various reports provided to the SEC including our annual reports, quarterly reports, current reports and proxy statements are available free of charge on our website. These reports are made available as soon as reasonably practicable after they are filed with or furnished to the SEC. Our filings with the SEC are also available on the SEC’s website at http://www.sec.gov.
Business Strategy
Our stated mission is “to guide our clients to a lifetime of financial success.” We have established an accompanying corporate vision “to build an exceptional company that clients value, shareholders prize and where our associates flourish.” These tenets are fundamental to our business strategies and operations.
Our stated mission is “to guide our clients to a lifetime of financial success.” We have established an accompanying corporate vision “to build an exceptional company that clients value, shareholders prize and where our associates flourish.” These tenets are fundamental to our business strategies and operations.
Our general business
strategy is to generate superior shareholder returns by providing comprehensive
financial services through banking and wealth management lines of business
primarily to private businesses, their owner families and other success-minded
individuals.
Our commercial
banking line of business offers a broad range of business and personal banking
services. Lending services include commercial, commercial real estate, financial
and industrial development, real estate construction and development,
residential real estate, and consumer loans. A wide variety of deposit products
and a complete suite of treasury management and international trade services
complement our lending capabilities.
The wealth management
line of business includes the Company’s trust operations and Missouri state tax
credit brokerage activities. Enterprise Trust, a division of Enterprise
(“Enterprise Trust” or “Trust”) provides financial planning, advisory,
investment management and trust services to our target markets. Business
financial services are focused in the areas of retirement plans, management
compensation and management succession planning. Personal advisory services
include estate planning, financial planning, business succession planning and
retirement planning services. Investment management and fiduciary services are
provided to individuals, businesses, institutions and nonprofit organizations.
State tax credit brokerage activities consist of the acquisition of Missouri
state tax credit assets and sale of these tax credits to clients.
Key success factors
in pursuing our strategy include a focused and relationship-oriented
distribution and sales approach, emphasis on growing wealth management revenues,
aggressive credit and interest rate risk management, advanced technology and
tightly managed expense growth.
Building long-term client relationships –
Our historical growth
strategy has been largely client relationship driven. We continuously seek to
add clients who fit our target market of business owners and associated
families. Those relationships are maintained, cultivated and expanded over time.
This strategy enables us to attract clients with significant and growing
borrowing needs, and maintain those relationships as they grow. Our banking
officers are typically highly experienced. As a result of our long-term
relationship orientation, we are able to fund loan growth primarily with core
deposits from our business and professional clients. This is supplemented by
borrowing from the Federal Home Loan Bank of Des Moines (the “FHLB”), the
Federal Reserve, and by issuing brokered certificates of deposits, priced at or
below alternative cost of funds.
Growing Wealth Management
business – Enterprise
Trust offers both fiduciary and financial advisory services. We employ a full
complement of attorneys, certified financial planners, estate planning
professionals, as well as other investment professionals who offer a broad range
of services for business owners and high net worth individuals. Employing an
intensive, personalized methodology, Enterprise Trust representatives assist
clients in defining lifetime goals and designing plans to achieve them.
Consistent with the Company’s long-term relationship strategy, Trust
representatives maintain close contact with clients ensuring follow up,
discipline, and appropriate adjustments as circumstances change.
Capitalizing on technology – We view our technological capabilities to
be a competitive advantage. Our systems provide Internet banking, expanded
treasury management products, check and document imaging, as well as a 24-hour
voice response system. Other services currently offered by Enterprise include
controlled disbursements, repurchase agreements and sweep investment accounts.
Our treasury management suite of products blends advanced technology and
personal service, often creating a competitive advantage over larger, nationwide
banks. Technology is also utilized extensively in internal systems, operational
support functions to improve customer service, and management reporting and
analysis.
2
Maintaining asset quality – Senior management and the head of credit
administration monitor our asset quality through regular reviews of loans. In
addition, the Bank’s loan portfolio is subject to ongoing monitoring by a loan
review function that reports directly to the audit committee of our board of
directors.
Expense management – The Company is focused on leveraging its
current expense base and measures the “efficiency ratio” as a benchmark for
improvement. The efficiency ratio is equal to noninterest expense divided by
total revenue (net interest income plus noninterest income). Continued
improvement is targeted to increase earnings per share and generate higher
returns on equity.
Market Areas and Approach to Geographic
Expansion
Enterprise operates in the St. Louis, Kansas City and Phoenix metropolitan areas. The Company, as part of its expansion effort, plans to continue its strategy of operating relatively fewer offices with a larger asset base per office, emphasizing commercial banking and wealth management and employing experienced staff who are compensated on the basis of performance and customer service.
Enterprise operates in the St. Louis, Kansas City and Phoenix metropolitan areas. The Company, as part of its expansion effort, plans to continue its strategy of operating relatively fewer offices with a larger asset base per office, emphasizing commercial banking and wealth management and employing experienced staff who are compensated on the basis of performance and customer service.
St. Louis
The Company has four Enterprise banking facilities in the St. Louis metropolitan area. The St. Louis region enjoys a stable, diverse economic base and is ranked the 19th largest metropolitan statistical area in the United States. It is an attractive market for us with nearly 70,000 privately held businesses and over 50,000 households with investible assets of $1.0 million or more. We are the largest publicly-held, locally headquartered bank in this market.
The Company has four Enterprise banking facilities in the St. Louis metropolitan area. The St. Louis region enjoys a stable, diverse economic base and is ranked the 19th largest metropolitan statistical area in the United States. It is an attractive market for us with nearly 70,000 privately held businesses and over 50,000 households with investible assets of $1.0 million or more. We are the largest publicly-held, locally headquartered bank in this market.
Kansas City
At December 31, 2009, the Company had seven banking facilities in the Kansas City Market. Kansas City is also an attractive private company market with over 50,000 privately held businesses and over 35,000 households with investible assets of $1.0 million or more. To more efficiently deploy our resources, on February 28, 2008, we sold the Enterprise branch in Liberty, Missouri and on July 31, 2008, we sold the Kansas state bank charter of Great American along with the DeSoto, Kansas branch. See Item 8, Note 3 – Acquisitions and Divestitures for more information.
At December 31, 2009, the Company had seven banking facilities in the Kansas City Market. Kansas City is also an attractive private company market with over 50,000 privately held businesses and over 35,000 households with investible assets of $1.0 million or more. To more efficiently deploy our resources, on February 28, 2008, we sold the Enterprise branch in Liberty, Missouri and on July 31, 2008, we sold the Kansas state bank charter of Great American along with the DeSoto, Kansas branch. See Item 8, Note 3 – Acquisitions and Divestitures for more information.
Phoenix
On December 11, 2009, Enterprise acquired certain assets and assumed certain liabilities of Valley Capital Bank in Mesa, Arizona in an FDIC-assisted transaction. The single location opened on December 14, 2009 as an Enterprise branch. After receiving regulatory approval, Enterprise opened a new branch in the western suburbs of Phoenix on February 16, 2010. See Note 3 – Acquisitions and Divestitures for more information.
On December 11, 2009, Enterprise acquired certain assets and assumed certain liabilities of Valley Capital Bank in Mesa, Arizona in an FDIC-assisted transaction. The single location opened on December 14, 2009 as an Enterprise branch. After receiving regulatory approval, Enterprise opened a new branch in the western suburbs of Phoenix on February 16, 2010. See Note 3 – Acquisitions and Divestitures for more information.
Despite the market
downturn in residential real estate, we believe the Phoenix market offers
substantial long-term growth opportunities for Enterprise. The demographic and
geographic factors that propelled Phoenix into one of the fastest growing and
most dynamic markets in the country still exist, and we believe these factors
should drive continued growth in that market long after the current real estate
slump is over. Today, Phoenix has more than 86,000 privately held businesses and
72,000 households with investible assets over $1.0 million each.
Competition
The Company and its subsidiaries operate in highly competitive markets. Our geographic markets are served by a number of large multi-bank holding companies with substantial capital resources and lending capacity. Many of the larger banks have established specialized units, which target private businesses and high net worth individuals. Also, the St. Louis, Kansas City and Phoenix markets have numerous small community banks. In addition to other financial holding companies and commercial banks, we compete with credit unions, thrifts, investment managers, brokerage firms, and other providers of financial services and products.
The Company and its subsidiaries operate in highly competitive markets. Our geographic markets are served by a number of large multi-bank holding companies with substantial capital resources and lending capacity. Many of the larger banks have established specialized units, which target private businesses and high net worth individuals. Also, the St. Louis, Kansas City and Phoenix markets have numerous small community banks. In addition to other financial holding companies and commercial banks, we compete with credit unions, thrifts, investment managers, brokerage firms, and other providers of financial services and products.
3
Supervision and Regulation
Financial Holding Company
The Company is a financial holding company registered under the Bank Holding Company Act of 1956, as amended (“BHCA”). As a financial holding company, the Company is subject to regulation and examination by the Federal Reserve Board, and is required to file periodic reports of its operations and such additional information as the Federal Reserve may require. In order to remain a financial holding company, the Company must continue to be considered well managed and well capitalized by the Federal Reserve and have at least a “satisfactory” rating under the Community Reinvestment Act. See “Liquidity and Capital Resources” in the Management Discussion and Analysis for more information on our capital adequacy and “Bank Subsidiary – Community Reinvestment Act” below for more information on Community Reinvestment.
The Company is a financial holding company registered under the Bank Holding Company Act of 1956, as amended (“BHCA”). As a financial holding company, the Company is subject to regulation and examination by the Federal Reserve Board, and is required to file periodic reports of its operations and such additional information as the Federal Reserve may require. In order to remain a financial holding company, the Company must continue to be considered well managed and well capitalized by the Federal Reserve and have at least a “satisfactory” rating under the Community Reinvestment Act. See “Liquidity and Capital Resources” in the Management Discussion and Analysis for more information on our capital adequacy and “Bank Subsidiary – Community Reinvestment Act” below for more information on Community Reinvestment.
Acquisitions: With certain limited exceptions, the BHCA
requires every financial holding company or bank holding company to obtain the
prior approval of the Federal Reserve before (i) acquiring substantially all the
assets of any bank, (ii) acquiring direct or indirect ownership or control of
any voting shares of any bank if, after such acquisition, it would own or
control more than 5% of the voting shares of such bank (unless it already owns
or controls the majority of such shares), or (iii) merging or consolidating with
another bank holding company. The BHCA also prohibits a financial holding
company generally from engaging directly or indirectly in activities other than
those involving banking, activities closely related to banking that are
permitted for a bank holding company, securities, insurance or merchant banking.
Federal legislation permits bank holding companies to acquire control of banks
throughout the United States.
United States Department of the Treasury
Capital Purchase Program: On December 19, 2008, the Company received an investment of approximately
$35.0 million from the U.S. Treasury under the Capital Purchase
Program. In exchange for the investment, the Company
issued to the U.S. Treasury (i) 35,000 shares of EFSC Fixed Rate Cumulative
Perpetual Preferred Stock, Series A (the “Series A Preferred Stock”) and (ii) a
warrant (the “Warrant”) to purchase 324,074 shares of EFSC common stock, par
value $0.01 per share (the “Common Stock”) at a price of $16.20 per share. The
Series A Preferred Stock qualifies as Tier 1 capital and pays cumulative
dividends at a rate of 5% per annum for the first five years, and 9% per annum
thereafter.
Pursuant to the terms
of the purchase agreement with the U.S. Treasury, our ability to declare or pay
dividends or distributions on, or purchase, redeem or otherwise acquire for
consideration, shares of junior stock and parity stock is subject to
restrictions, including a restriction against increasing dividends from the last
quarterly cash dividend per share ($0.0525) declared on the common stock prior
to December 19, 2008. The redemption, purchase or other acquisition of trust
preferred securities of EFSC or our affiliates is also restricted. These
restrictions will terminate on the earlier of (a) the third anniversary of the
date of issuance of the Series A Preferred Stock and (b) the date on which the
Series A Preferred Stock has been redeemed in whole or U.S. Treasury has
transferred all of the Series A Preferred Stock to third parties.
In addition, the
ability of EFSC to declare or pay dividends or distributions on, or repurchase,
redeem or otherwise acquire for consideration, shares of its other classes of
stock is subject to restrictions in the event that EFSC fails to declare and pay
full dividends (or declare and set aside a sum sufficient for payment thereof)
on its Series A Preferred Stock.
We are also subject
to restrictions on the amount and type of compensation that we can pay our
employees and are required to provide monthly reports to the U.S. Treasury
regarding our lending activity during the time that the U.S. Treasury owns
shares of the Series A Preferred Stock.
Dividend Restrictions: In addition to the restrictions imposed by
the CPP on our ability to pay dividends to holders of our common stock, under
Federal Reserve Board policies, bank holding companies may pay cash dividends on
common stock only out of income available over the past year and only if
prospective earnings retention is consistent with the organization’s expected
future needs and financial condition and if the organization is not in danger of
not meeting its minimum regulatory capital requirements. Federal Reserve Board
policy also provides that bank holding companies should not maintain a level of
cash dividends that undermines the bank holding company’s ability to serve as a
source of strength to its banking subsidiaries.
4
Bank Subsidiary
At December 31, 2009, Enterprise was our only bank subsidiary. Enterprise is a Missouri trust company with banking powers and is subject to supervision and regulation by the Missouri Division of Finance. In addition, as a Federal Reserve non-member bank, it is subject to supervision and regulation by the FDIC. Enterprise is a member of the FHLB of Des Moines.
At December 31, 2009, Enterprise was our only bank subsidiary. Enterprise is a Missouri trust company with banking powers and is subject to supervision and regulation by the Missouri Division of Finance. In addition, as a Federal Reserve non-member bank, it is subject to supervision and regulation by the FDIC. Enterprise is a member of the FHLB of Des Moines.
Enterprise is subject
to extensive federal and state regulatory oversight. The various regulatory
authorities regulate or monitor all areas of the banking operations, including
security devices and procedures, adequacy of capitalization and loss reserves,
loans, investments, borrowings, deposits, mergers, issuance of securities,
payment of dividends, interest rates payable on deposits, interest rates or fees
chargeable on loans, establishment of branches, corporate reorganizations,
maintenance of books and records, and adequacy of staff training to carry on
safe lending and deposit gathering practices. Enterprise must maintain certain
capital ratios and is subject to limitations on aggregate investments in real
estate, bank premises, and furniture and fixtures. Enterprise is subject to
periodic examination by the FDIC and Missouri Division of Finance.
Dividends by the Bank Subsidiary:
Under Missouri law,
Enterprise may pay dividends to the Company only from a portion of its undivided
profits and may not pay dividends if its capital is impaired.
Transactions with Affiliates and Insiders:
Enterprise is subject to
the provisions of Regulation W promulgated by the Federal Reserve, which
encompasses Sections 23A and 23B of the Federal Reserve Act. Regulation W places
limits and conditions on the amount of loans or extensions of credit to,
investments in, or certain other transactions with, affiliates and on the amount
of advances to third parties collateralized by the securities or obligations of
affiliates. Regulation W also prohibits, among other things, an institution from
engaging in certain transactions with certain affiliates unless the transactions
are on terms substantially the same, or at least as favorable to such
institution or its subsidiaries, as those prevailing at the time for comparable
transactions with nonaffiliated companies.
Community Reinvestment Act: The Community Reinvestment Act (“CRA”)
requires that, in connection with examinations of financial institutions within
its jurisdiction, the FDIC shall evaluate the record of the financial
institutions in meeting the credit needs of their local communities, including
low and moderate income neighborhoods, consistent with the safe and sound
operation of those institutions. These factors are also considered in evaluating
mergers, acquisitions, and applications to open a branch or facility. The
Company has a satisfactory rating under CRA.
USA Patriot Act: The Uniting and Strengthening America by
Providing Appropriate Tools Required to Intercept and Obstruct Terrorism Act of
2001 (the "USA PATRIOT Act") requires each financial institution to: (i)
establish an anti-money laundering program; (ii) establish due diligence
policies, procedures and controls with respect to its private banking accounts
and correspondent banking accounts involving foreign individuals and certain
foreign banks; and (iii) implement certain due diligence policies, procedures
and controls with regard to correspondent accounts in the United States for, or
on behalf of, a foreign bank that does not have a physical presence in any
country. In addition, the USA PATRIOT Act contains a provision encouraging
cooperation among financial institutions, regulatory authorities and law
enforcement authorities with respect to individuals, entities and organizations
engaged in, or reasonably suspected of engaging in, terrorist acts or money
laundering activities.
Limitations on Loans and Transactions:
The Federal Reserve Act
generally imposes certain limitations on extensions of credit and other
transactions by and between banks that are members of the Federal Reserve and
other affiliates (which includes any holding company of which a bank is a
subsidiary and any other non-bank subsidiary of such holding company). Banks
that are not members of the Federal Reserve are also subject to these
limitations. Further, federal law prohibits a bank holding company and its
subsidiaries from engaging in certain tie-in arrangements in connection with any
extension of credit, lease or sale of property or the furnishing of
services.
Deposit Insurance Fund: The FDIC establishes rates for the payment of
premiums by federally insured banks for deposit insurance. The Deposit Insurance
Fund (“DIF”) is maintained for commercial banks, with insurance premiums from
the industry used to offset losses from insurance payouts when banks and thrifts
fail. The FDIC is authorized to set the reserve ratio for the DIF annually at
between 1.15% and 1.50% of estimated insured deposits.
To fund this program,
pursuant to the Federal Deposit Insurance Reform Act of 2005, the FDIC adopted a
new risk-based deposit insurance premium system that provides for quarterly
assessments. Beginning in 2007, institutions were grouped into one of four
categories based on their FDIC ratings and capital ratios.
5
To restore its
reserve ratio, the FDIC raised the base annual assessment rate for all
institutions in 2009. As a result of this increase, institutions pay an
assessment of between 12 and 77.5 basis points depending on the institution’s
risk classification. Under the new assessment structure, Enterprise’s average
annual assessment during 2009 was 15.43 basis points (excluding the special
assessment described below). An institution’s risk classification is assigned
based on its capital levels and the level of supervisory concern the institution
poses to the regulators. Institutions assigned to higher-risk classifications
pay assessments at higher rates than institutions that pose a lower risk. Each
institution’s assessment rate is further adjusted based on the institution’s
reliance on brokered deposits and/or other secured liabilities and the amount of
unsecured debt.
On February 27, 2009,
the FDIC imposed a one-time special assessment equal to $995,000 which was paid
in the third quarter of 2009. In addition, on November 12, 2009, the FDIC
adopted a final rule imposing a 13-quarter prepayment of FDIC premiums. As a
result, Enterprise prepaid $11.5 million in December 2009. The prepayment will
be expensed over the subsequent three years.
Employees
At December 31, 2009, we had approximately 308 full-time equivalent employees. None of the Company’s employees are covered by a collective bargaining agreement. Management believes that its relationship with its employees is good.
At December 31, 2009, we had approximately 308 full-time equivalent employees. None of the Company’s employees are covered by a collective bargaining agreement. Management believes that its relationship with its employees is good.
ITEM 1A: RISK FACTORS
An investment in our
common shares is subject to risks inherent to our business. Before making an
investment decision, you should carefully consider the risks and uncertainties
described below together with all of the other information included or
incorporated by reference in this report. The risks and uncertainties described
below are not the only ones we face. Although we have significant risk
management policies, procedures and verification processes in place, additional
risks and uncertainties that management is not aware of or focused on or that
management currently deems immaterial may also materially and adversely impair
our business operations. The value of our common shares could decline due to any
of these risks, and you could lose all or part of your investment.
Risks Related To Our
Business
Various factors may cause our allowance for
loan losses to increase.
We maintain an allowance for loan losses, which is a reserve established through a provision for loan losses charged to expense, that represents management’s estimate of probable losses within the existing portfolio of loans. The allowance, in the judgment of management, is sufficient to reserve for estimated loan losses and risks inherent in the loan portfolio. The Company’s loan loss allowance increased during the 2008 fiscal year and through 2009 due to changes in economic conditions affecting borrowers, new information regarding existing loans, and identification of additional problem loans. We continue to monitor the adequacy of our loan loss allowance and may need to increase it if economic conditions continue to deteriorate. In addition, bank regulatory agencies periodically review our allowance for loan losses and may require an increase in the provision for loan losses or the recognition of further loan charge-offs, based on judgments that can differ somewhat from those of our own management. In addition, if charge-offs in future periods exceed the allowance for loan losses (i.e., if the loan allowance is inadequate), we will need additional loan loss provisions to increase the allowance for loan losses. Additional provisions to increase the allowance for loan losses, should they become necessary, would result in a decrease in net income or an increase in net loss and a reduction in capital, and may have a material adverse effect on our financial condition and results of operations.
We maintain an allowance for loan losses, which is a reserve established through a provision for loan losses charged to expense, that represents management’s estimate of probable losses within the existing portfolio of loans. The allowance, in the judgment of management, is sufficient to reserve for estimated loan losses and risks inherent in the loan portfolio. The Company’s loan loss allowance increased during the 2008 fiscal year and through 2009 due to changes in economic conditions affecting borrowers, new information regarding existing loans, and identification of additional problem loans. We continue to monitor the adequacy of our loan loss allowance and may need to increase it if economic conditions continue to deteriorate. In addition, bank regulatory agencies periodically review our allowance for loan losses and may require an increase in the provision for loan losses or the recognition of further loan charge-offs, based on judgments that can differ somewhat from those of our own management. In addition, if charge-offs in future periods exceed the allowance for loan losses (i.e., if the loan allowance is inadequate), we will need additional loan loss provisions to increase the allowance for loan losses. Additional provisions to increase the allowance for loan losses, should they become necessary, would result in a decrease in net income or an increase in net loss and a reduction in capital, and may have a material adverse effect on our financial condition and results of operations.
Our loan portfolio is concentrated in certain
markets which could result in increased credit risk.
Substantially all of our loans are to businesses and individuals in the St. Louis, Kansas City, and Phoenix metropolitan areas. The regional economic conditions in areas where we conduct our business have an impact on the demand for our products and services as well as the ability of our customers to repay loans, the value of the collateral securing loans and the stability of our deposit funding sources.
Substantially all of our loans are to businesses and individuals in the St. Louis, Kansas City, and Phoenix metropolitan areas. The regional economic conditions in areas where we conduct our business have an impact on the demand for our products and services as well as the ability of our customers to repay loans, the value of the collateral securing loans and the stability of our deposit funding sources.
Our loan portfolio mix, which has a
concentration of loans secured by real estate, could result in increased credit
risk.
A significant portion of our portfolio is secured by real estate and thus we have a high degree of risk from a downturn in our real estate markets. If real estate values continue to decline further in our markets, the value of real estate collateral securing our loans could be significantly reduced. Our ability to recover on defaulted loans where the primary reliance for repayment is on the real estate collateral by foreclosing and selling that real estate would then be diminished and we would be more likely to suffer losses on defaulted loans.
A significant portion of our portfolio is secured by real estate and thus we have a high degree of risk from a downturn in our real estate markets. If real estate values continue to decline further in our markets, the value of real estate collateral securing our loans could be significantly reduced. Our ability to recover on defaulted loans where the primary reliance for repayment is on the real estate collateral by foreclosing and selling that real estate would then be diminished and we would be more likely to suffer losses on defaulted loans.
6
Additionally, because
Kansas is a judicial foreclosure state, all foreclosures must be processed
through the Kansas state courts. Until the court confirms that the nonperforming
loan is in default, we can take no action against the borrower or the property.
Due to this process, it takes approximately one year for us to foreclose on real
estate collateral located in the State of Kansas. Our ability to recover on
defaulted loans in our Kansas market may be delayed and we would be more likely
to suffer losses on defaulted loans in this market.
Liquidity risk could impair our ability to
fund operations and jeopardize our financial condition.
Liquidity is essential to our business. An inability to raise funds through deposits, borrowings, the sale of loans and other sources could have a substantial material adverse effect on our liquidity. Our access to funding sources in amounts adequate to finance our activities could be impaired by factors that affect us specifically or the financial services industry in general. Factors that could detrimentally impact our access to liquidity sources include a decrease in the level of our business activity due to a market downtown, our failure to remain well capitalized, or adverse regulatory action against us. Our ability to acquire deposits or borrow could also be impaired by factors that are not specific to us, such as a severe disruption of the financial markets or negative views and expectations about the prospects for the financial services industry as a whole as the recent turmoil faced by banking organizations in the domestic and worldwide credit markets deteriorates.
Liquidity is essential to our business. An inability to raise funds through deposits, borrowings, the sale of loans and other sources could have a substantial material adverse effect on our liquidity. Our access to funding sources in amounts adequate to finance our activities could be impaired by factors that affect us specifically or the financial services industry in general. Factors that could detrimentally impact our access to liquidity sources include a decrease in the level of our business activity due to a market downtown, our failure to remain well capitalized, or adverse regulatory action against us. Our ability to acquire deposits or borrow could also be impaired by factors that are not specific to us, such as a severe disruption of the financial markets or negative views and expectations about the prospects for the financial services industry as a whole as the recent turmoil faced by banking organizations in the domestic and worldwide credit markets deteriorates.
We believe the level
of liquid assets at Enterprise is sufficient to meet our current and anticipated
funding needs. In addition to amounts currently borrowed at December 31, 2009,
we could borrow an additional $118.5 million from the Federal Home Loan Bank of
Des Moines under blanket loan pledges and an additional $279.7 million from the
Federal Reserve Bank under pledged loan agreements. We also have access to $30.0
million in overnight federal funds lines from various correspondent banks. Of
our $282.5 million investment portfolio available for sale, approximately $211.6
million is available for pledging or can be sold to enhance liquidity, if
necessary. In addition, we believe our current level of cash at the holding
company will be sufficient to meet all projected cash needs in 2010. See
“Liquidity and Capital Resources” for more information.
Our business is subject to interest rate risk
and variations in interest rates may negatively affect our financial
performance.
A substantial portion of our income is derived from the differential or “spread” between the interest earned on loans, investment securities and other interest-earning assets, and the interest paid on deposits, borrowings and other interest-bearing liabilities. Because of the differences in the maturities and repricing characteristics of our interest-earning assets and interest-bearing liabilities, changes in interest rates do not produce equivalent changes in interest income earned on interest-earning assets and interest paid on interest-bearing liabilities. Significant fluctuations in market interest rates could materially and adversely affect not only our net interest spread, but also our asset quality and loan origination volume.
A substantial portion of our income is derived from the differential or “spread” between the interest earned on loans, investment securities and other interest-earning assets, and the interest paid on deposits, borrowings and other interest-bearing liabilities. Because of the differences in the maturities and repricing characteristics of our interest-earning assets and interest-bearing liabilities, changes in interest rates do not produce equivalent changes in interest income earned on interest-earning assets and interest paid on interest-bearing liabilities. Significant fluctuations in market interest rates could materially and adversely affect not only our net interest spread, but also our asset quality and loan origination volume.
If our businesses do not perform well, we may
be required to establish a valuation allowance against the deferred income tax
asset, which could have a material adverse effect on our results of operations
and financial condition.
Deferred income taxes represent the tax effect of the differences between the book and tax basis of assets and liabilities. Deferred tax assets are assessed periodically by management to determine if they are realizable. If based on available information, it is more likely than not that the deferred income tax asset will not be realized, then a valuation allowance must be established with a corresponding charge to net income. As of December 31, 2009, the Company did not carry a valuation allowance against its deferred tax asset balance of $18.3 million. Future facts and circumstances may require a valuation allowance. Charges to establish a valuation allowance could have a material adverse effect on our results of operations and financial position.
Deferred income taxes represent the tax effect of the differences between the book and tax basis of assets and liabilities. Deferred tax assets are assessed periodically by management to determine if they are realizable. If based on available information, it is more likely than not that the deferred income tax asset will not be realized, then a valuation allowance must be established with a corresponding charge to net income. As of December 31, 2009, the Company did not carry a valuation allowance against its deferred tax asset balance of $18.3 million. Future facts and circumstances may require a valuation allowance. Charges to establish a valuation allowance could have a material adverse effect on our results of operations and financial position.
If the Bank continues to incur losses that
erode its capital, it may become subject to enhanced regulation or supervisory
action.
Under federal and state laws and regulations pertaining to the safety and soundness of insured depository institutions, the Missouri Division of Finance and the Federal Reserve, and separately the FDIC as insurer of the Bank’s deposits, have authority to compel or restrict certain actions if the Bank’s capital should fall below adequate capital standards as a result of future operating losses, or if its bank regulators determine that it has insufficient capital. Among other matters, the corrective actions include but are not limited to requiring affirmative action to correct any conditions resulting from any violation or practice; directing an increase in capital and the maintenance of specific minimum capital ratios; restricting the Bank’s operations; limiting the rate of interest it may pay on brokered deposits; restricting the amount of distributions and dividends and payment of interest on its trust preferred securities; requiring the Bank to enter into informal or formal enforcement orders, including memoranda of understanding, written agreements and consent or cease and desist orders to take corrective action and enjoin unsafe and unsound practices; removing officers and directors and assessing civil monetary penalties; and taking possession and closing and liquidating the Bank. See “Supervision and Regulation”.
Under federal and state laws and regulations pertaining to the safety and soundness of insured depository institutions, the Missouri Division of Finance and the Federal Reserve, and separately the FDIC as insurer of the Bank’s deposits, have authority to compel or restrict certain actions if the Bank’s capital should fall below adequate capital standards as a result of future operating losses, or if its bank regulators determine that it has insufficient capital. Among other matters, the corrective actions include but are not limited to requiring affirmative action to correct any conditions resulting from any violation or practice; directing an increase in capital and the maintenance of specific minimum capital ratios; restricting the Bank’s operations; limiting the rate of interest it may pay on brokered deposits; restricting the amount of distributions and dividends and payment of interest on its trust preferred securities; requiring the Bank to enter into informal or formal enforcement orders, including memoranda of understanding, written agreements and consent or cease and desist orders to take corrective action and enjoin unsafe and unsound practices; removing officers and directors and assessing civil monetary penalties; and taking possession and closing and liquidating the Bank. See “Supervision and Regulation”.
7
Changes in government regulation and
supervision may increase our costs.
Our operations are subject to extensive regulations by federal, state and local governmental authorities. Banking regulations are primarily intended to protect depositors’ funds, federal deposit insurance funds and the banking system as a whole, not stockholders. We are now also subject to supervisions, regulation and investigation by the U.S. Treasury and the Office of the Special Inspector General for the Troubled Asset Relief Program (“TARP”) by virtue of our participation in the Capital Purchase Program. Changes to statutes, regulations or regulatory policies; changes in the interpretation or implementation of statutes, regulations or policies could subject us to additional costs, limit the types of financial services and products that we may offer and/or increase the ability of non-banks to offer competing financial services and products, among other things.
Our operations are subject to extensive regulations by federal, state and local governmental authorities. Banking regulations are primarily intended to protect depositors’ funds, federal deposit insurance funds and the banking system as a whole, not stockholders. We are now also subject to supervisions, regulation and investigation by the U.S. Treasury and the Office of the Special Inspector General for the Troubled Asset Relief Program (“TARP”) by virtue of our participation in the Capital Purchase Program. Changes to statutes, regulations or regulatory policies; changes in the interpretation or implementation of statutes, regulations or policies could subject us to additional costs, limit the types of financial services and products that we may offer and/or increase the ability of non-banks to offer competing financial services and products, among other things.
Any future increases in FDIC insurance
premiums will adversely impact our earnings.
In 2009, the FDIC charged a “special assessment” equal to five basis point special assessment on each insured depository institution’s assets minus Tier 1 capital. Our special assessment amounted to $995,000 and was paid on September 30, 2009. The FDIC also raised our annual assessment rate by 9.11 basis points to an average of 15.43 basis points. It is possible that the FDIC may impose additional special assessments in the future or further increase our annual assessment, which could adversely affect our earnings.
In 2009, the FDIC charged a “special assessment” equal to five basis point special assessment on each insured depository institution’s assets minus Tier 1 capital. Our special assessment amounted to $995,000 and was paid on September 30, 2009. The FDIC also raised our annual assessment rate by 9.11 basis points to an average of 15.43 basis points. It is possible that the FDIC may impose additional special assessments in the future or further increase our annual assessment, which could adversely affect our earnings.
We may be adversely affected by the soundness
of other financial institutions.
Financial services institutions are interrelated as a result of trading, clearing, counterparty or other relationships. We have exposure to different institutions and counterparties, and execute transactions with various counterparties in the financial industry, including federal home loan banks, commercial banks, brokers and dealers, investment banks and other institutional clients. Recent defaults by financial services institutions, and even rumors or questions about one or more financial services institutions or the financial services industry in general, have led to market wide liquidity problems and could lead to losses or defaults by us or by other institutions. Any such losses could materially and adversely affect our results of operations.
Financial services institutions are interrelated as a result of trading, clearing, counterparty or other relationships. We have exposure to different institutions and counterparties, and execute transactions with various counterparties in the financial industry, including federal home loan banks, commercial banks, brokers and dealers, investment banks and other institutional clients. Recent defaults by financial services institutions, and even rumors or questions about one or more financial services institutions or the financial services industry in general, have led to market wide liquidity problems and could lead to losses or defaults by us or by other institutions. Any such losses could materially and adversely affect our results of operations.
We have engaged in and may continue to engage
in further expansion through acquisitions, including FDIC-assisted transactions,
which could negatively affect our business and earnings.
Our earnings, financial condition, and prospects after a merger or acquisition depend in part on our ability to successfully integrate the operations of the acquired company. We may be unable to integrate operations successfully or to achieve expected cost savings. Any cost savings which are realized may be offset by losses in revenues or other charges to earnings.
Our earnings, financial condition, and prospects after a merger or acquisition depend in part on our ability to successfully integrate the operations of the acquired company. We may be unable to integrate operations successfully or to achieve expected cost savings. Any cost savings which are realized may be offset by losses in revenues or other charges to earnings.
We periodically
evaluate merger and acquisition opportunities and conduct due diligence
activities related to possible transactions with other financial institutions
and financial services companies. As a result, merger or acquisition discussions
and, in some cases, negotiations may take place and future mergers or
acquisitions involving cash, debt or equity securities may occur at any time.
Acquisitions typically involve the payment of a premium over book value, and,
therefore, some dilution of our tangible book value per common share may occur
in connection with any future transaction. Furthermore, failure to realize the
expected revenue increases, cost savings, increases in geographic or product
presence, and/or other projected benefits from an acquisition could have a
material adverse effect on our financial condition and results of operations.
Finally, to the extent that we issue capital stock in connection with
transactions, such transactions and related stock issuances may have a dilutive
effect on earnings per share of our common stock and share ownership of our
stockholders.
We operate in a highly competitive industry
and market areas.
We face substantial competition in all areas of our operations from a variety of different competitors, many of which are larger and may have more financial resources. Such competitors primarily include national and super-regional banks as well as smaller community banks within the markets in which we operate. However, we also face competition from many other types of financial institutions, including, without limitation, credit unions, mortgage banking companies, mutual funds, insurance companies, investment management firms, and other local, regional and national financial services firms. The financial services industry could become even more competitive as a result of legislative, regulatory and technological changes and continued consolidation.
We face substantial competition in all areas of our operations from a variety of different competitors, many of which are larger and may have more financial resources. Such competitors primarily include national and super-regional banks as well as smaller community banks within the markets in which we operate. However, we also face competition from many other types of financial institutions, including, without limitation, credit unions, mortgage banking companies, mutual funds, insurance companies, investment management firms, and other local, regional and national financial services firms. The financial services industry could become even more competitive as a result of legislative, regulatory and technological changes and continued consolidation.
Loss of our key employees could adversely
affect our business.
Our success depends, in large part, on our ability to attract and retain key people. Competition for the best people in most activities in which we are engaged can be intense and we may not be able to hire or retain the people we want and/or need. Although we maintain employment agreements with certain key employees, and have incentive compensation plans aimed, in part, at long-term employee retention, the unexpected loss of services of one or more of our key personnel could still occur, and such events may have a material adverse impact on our business because of the loss of the employee’s skills, knowledge of our market, business relationships and the difficulty of promptly finding qualified replacement personnel.
Our success depends, in large part, on our ability to attract and retain key people. Competition for the best people in most activities in which we are engaged can be intense and we may not be able to hire or retain the people we want and/or need. Although we maintain employment agreements with certain key employees, and have incentive compensation plans aimed, in part, at long-term employee retention, the unexpected loss of services of one or more of our key personnel could still occur, and such events may have a material adverse impact on our business because of the loss of the employee’s skills, knowledge of our market, business relationships and the difficulty of promptly finding qualified replacement personnel.
8
Pursuant to our
participation in the CPP, we adopted certain standards for executive
compensation and corporate governance for the period during which the U.S.
Treasury holds the equity issued pursuant to our participation in the CPP. These
standards generally apply to our Chief Executive Officer, Chief Financial
Officer and the three next most highly compensated senior executive officers,
although certain restrictions apply to as many as twenty-five (25) of our most
highly compensated employees. The restrictions severely limit the amount and
types of compensation we can pay our executive officers and key employees,
including a complete prohibition on any severance or other compensation upon
termination of employment, significant caps on bonuses and retention payments.
Such restrictions may impede our ability to attract and retain skilled people in
our top management ranks.
We may need to raise additional capital in the
future, which may not be available to us or may only be available on unfavorable
terms.
We may need to raise additional capital in the future in order to support any additional provisions for loan losses and loan charge-offs, to maintain our capital ratios or for a number of other reasons. The condition of the financial markets may be such that we may not be able to obtain additional capital or the additional capital may only be available on terms that are not attractive to us.
We may need to raise additional capital in the future in order to support any additional provisions for loan losses and loan charge-offs, to maintain our capital ratios or for a number of other reasons. The condition of the financial markets may be such that we may not be able to obtain additional capital or the additional capital may only be available on terms that are not attractive to us.
Our controls and procedures may fail or be
circumvented.
Management regularly reviews and updates our internal controls, disclosure controls and procedures, and corporate governance policies and procedures. Any system of controls, however well designed and operated, is based in part on certain assumptions and can provide only reasonable, not absolute, assurances that the objectives of the system are met. Any failure or circumvention of our controls and procedures or failure to comply with regulations related to controls and procedures could have a material adverse effect on our business, results of operations and financial condition.
Management regularly reviews and updates our internal controls, disclosure controls and procedures, and corporate governance policies and procedures. Any system of controls, however well designed and operated, is based in part on certain assumptions and can provide only reasonable, not absolute, assurances that the objectives of the system are met. Any failure or circumvention of our controls and procedures or failure to comply with regulations related to controls and procedures could have a material adverse effect on our business, results of operations and financial condition.
During the third
quarter of 2009, we determined that the Company did not have a formal process of
reviewing existing contracts with continuing accounting significance and as a
result did not detect an error in the accounting for loan participations
executed subject to its standard participation agreement. This resulted in the
restatement of our financial results at December 31, 2007, December 31, 2008,
each quarter in 2008 and the first and second quarters of 2009. Except for
labeling affected prior period financial statements as “Restated,” no further
changes are being made to our above described corrected financial statements and
no further restatement of our financial statements is anticipated. As previously
disclosed, as a result of the amendment of the loan participation agreements,
the overall effect of these adjustments from the original period of correction
to December 31, 2009 was neutral to the Company’s financial
results.
After identifying the
error, we concluded that a material weakness in our internal controls over
financial reporting existed during the periods affected by the error. Management
concluded that the material weakness was the Company’s lack of a formal process
to periodically review existing contracts and agreements with continuing
accounting significance.
During the fourth
quarter of 2009, management implemented a formal process to review all contracts
and agreements with continuing accounting significance on an annual basis. As a
result of the review conducted in the fourth quarter, management did not
identify any other errors in its previous accounting for such contracts or
agreements. We believe that these steps remediated the above described material
weakness. Although we believe that this material weakness has been remediated,
there can be no assurance that similar weaknesses will not occur in the future
which could adversely affect our future results of operations or our stock
price. See Item 8, Note 2 – Loan Participation Restatement and Item 9A for more
information.
Our information systems may experience an
interruption or breach in security.
We rely heavily on communications and information systems to conduct our business. Any failure, interruption or breach in security of these systems could result in failures or disruptions in our customer relationship management, general ledger, deposit, loan and other systems. While we have policies and procedures designed to prevent or limit the effect of the possible failure, interruption or security breach of our information systems, there can be no assurance that any such failure, interruption or security breach will not occur or, if they do occur, that they will be adequately addressed. The occurrence of any failure, interruption or security breach of our information systems could damage our reputation, result in a loss of customer business, subject us to additional regulatory scrutiny, or expose us to civil litigation and possible financial liability, any of which could have a material adverse effect on our financial condition and results of operations.
We rely heavily on communications and information systems to conduct our business. Any failure, interruption or breach in security of these systems could result in failures or disruptions in our customer relationship management, general ledger, deposit, loan and other systems. While we have policies and procedures designed to prevent or limit the effect of the possible failure, interruption or security breach of our information systems, there can be no assurance that any such failure, interruption or security breach will not occur or, if they do occur, that they will be adequately addressed. The occurrence of any failure, interruption or security breach of our information systems could damage our reputation, result in a loss of customer business, subject us to additional regulatory scrutiny, or expose us to civil litigation and possible financial liability, any of which could have a material adverse effect on our financial condition and results of operations.
9
Risks Associated With Our
Shares
Our share price can be
volatile.
The trading price of our common stock has fluctuated significantly and may do so in the future. These fluctuations may result from a number of factors, many of which are outside of our control. The stock market and, in particular, the market for financial institution stocks, has experienced significant volatility recently. In addition, the trading volume in our common stock is lower than for many other publicly traded companies. As a result of these factors, the market price of our common stock may be volatile.
The trading price of our common stock has fluctuated significantly and may do so in the future. These fluctuations may result from a number of factors, many of which are outside of our control. The stock market and, in particular, the market for financial institution stocks, has experienced significant volatility recently. In addition, the trading volume in our common stock is lower than for many other publicly traded companies. As a result of these factors, the market price of our common stock may be volatile.
An investment in our common stock is not an
insured deposit.
An investment in our common stock is not a savings account, deposit or other obligation of our bank subsidiary, any non-bank subsidiary or any other bank, and are not insured against loss by the FDIC, any other deposit insurance fund or by any other public or private entity. Investment in our common stock is inherently risky for the reasons described in this “Risk Factors” section and elsewhere in this report and is subject to the same market forces that affect the price of common stock in any company. As a result, if you acquire our common shares, you may lose some or all of your investment.
An investment in our common stock is not a savings account, deposit or other obligation of our bank subsidiary, any non-bank subsidiary or any other bank, and are not insured against loss by the FDIC, any other deposit insurance fund or by any other public or private entity. Investment in our common stock is inherently risky for the reasons described in this “Risk Factors” section and elsewhere in this report and is subject to the same market forces that affect the price of common stock in any company. As a result, if you acquire our common shares, you may lose some or all of your investment.
Our ability to pay dividends is limited by
various statutes and regulations and depends primarily on the Bank’s ability to
distribute funds to us, which is also limited by various statutes and
regulations.
Enterprise Financial Services Corp depends on payments from the Bank, including dividends and payments under tax sharing agreements, for substantially all of its revenue. Federal and state regulations limit the amount of dividends and the amount of payments that the Bank may make to Enterprise Financial Services Corp under tax sharing agreements. In certain circumstances, the Missouri Division of Finance, FDIC or Federal Reserve could restrict or prohibit the Bank from distributing dividends or making other payments to us. In the event that the Bank was restricted from paying dividends to Enterprise Financial Services Corp or make payments under the tax sharing agreement, Enterprise Financial Services Corp may not be able to service its debt, pay its other obligations or pay dividends on our Series A Preferred Stock or pay dividends on its common stock. If we are unable or determine not to pay dividends on our common stock, the market price of the common stock could be materially adversely affected.
Enterprise Financial Services Corp depends on payments from the Bank, including dividends and payments under tax sharing agreements, for substantially all of its revenue. Federal and state regulations limit the amount of dividends and the amount of payments that the Bank may make to Enterprise Financial Services Corp under tax sharing agreements. In certain circumstances, the Missouri Division of Finance, FDIC or Federal Reserve could restrict or prohibit the Bank from distributing dividends or making other payments to us. In the event that the Bank was restricted from paying dividends to Enterprise Financial Services Corp or make payments under the tax sharing agreement, Enterprise Financial Services Corp may not be able to service its debt, pay its other obligations or pay dividends on our Series A Preferred Stock or pay dividends on its common stock. If we are unable or determine not to pay dividends on our common stock, the market price of the common stock could be materially adversely affected.
The terms of our outstanding preferred stock
limit our ability to pay dividends on and repurchase our common
stock.
The terms of our Series A Preferred Stock provide that prior to the earlier of (i) December 19, 2011 and (ii) the date on which all of the shares of the Series A Preferred Stock have been redeemed by us or transferred by the U.S. Treasury to third parties, we may not, without the consent of the U.S. Treasury, (a) increase the cash dividend on our common stock above $0.0525 per share per quarter or (b) subject to limited exceptions, redeem, repurchase or otherwise acquire shares of our common stock or preferred stock other than shares of our Series A Preferred Stock. These restrictions could have a negative effect on the value of our common stock.
The terms of our Series A Preferred Stock provide that prior to the earlier of (i) December 19, 2011 and (ii) the date on which all of the shares of the Series A Preferred Stock have been redeemed by us or transferred by the U.S. Treasury to third parties, we may not, without the consent of the U.S. Treasury, (a) increase the cash dividend on our common stock above $0.0525 per share per quarter or (b) subject to limited exceptions, redeem, repurchase or otherwise acquire shares of our common stock or preferred stock other than shares of our Series A Preferred Stock. These restrictions could have a negative effect on the value of our common stock.
Our outstanding preferred stock impacts net
income available to our common stockholders and earnings per common
share.
The dividends declared and the accretion of discount on our outstanding Series A Preferred Stock reduce the net income available to common stockholders and our earnings per common share. Our outstanding Series A Preferred Stock will also receive preferential treatment in the event of liquidation, dissolution or winding up of the Company.
The dividends declared and the accretion of discount on our outstanding Series A Preferred Stock reduce the net income available to common stockholders and our earnings per common share. Our outstanding Series A Preferred Stock will also receive preferential treatment in the event of liquidation, dissolution or winding up of the Company.
Holders of the Series A Preferred Stock may,
under certain circumstances, have the right to elect two directors to our board
of directors.
In the event that we fail to pay dividends on the Series A Preferred Stock for an aggregate of six or more quarters (whether or not consecutive), the authorized number of directors then constituting our board of directors will be increased by two. Holders of the Series A Preferred Stock, together with the holders of any outstanding parity stock with like voting rights voting as a single class, will be entitled to elect the two additional directors at the next annual meeting (or at a special meeting called for the purpose of electing the preferred stock directors prior to the next annual meeting) and at each subsequent annual meeting until all accrued and unpaid dividends for all past dividend periods have been paid in full.
In the event that we fail to pay dividends on the Series A Preferred Stock for an aggregate of six or more quarters (whether or not consecutive), the authorized number of directors then constituting our board of directors will be increased by two. Holders of the Series A Preferred Stock, together with the holders of any outstanding parity stock with like voting rights voting as a single class, will be entitled to elect the two additional directors at the next annual meeting (or at a special meeting called for the purpose of electing the preferred stock directors prior to the next annual meeting) and at each subsequent annual meeting until all accrued and unpaid dividends for all past dividend periods have been paid in full.
10
Holders of the Series A Preferred Stock have
voting rights in certain circumstances.
Except as otherwise required by law and in connection with the rights to elect directors as described above, holders of the Series A Preferred Stock have voting rights in certain circumstances. So long as shares of the Series A Preferred Stock are outstanding, in addition to any other vote or consent of shareholders required by law or our amended and restated charter, the vote or consent of holders owning at least 66 2/3% of the shares of Series A Preferred Stock outstanding is required for (1) any authorization or issuance of shares ranking senior to the Series A Preferred Stock; (2) any amendment to the rights of the Series A Preferred Stock so as to adversely affect the rights, preferences, privileges or voting power of the Series A Preferred Stock; or (3) consummation of any merger, share exchange or similar transaction unless the shares of Series A Preferred Stock remain outstanding, or if we are not the surviving entity in such transaction, are converted into or exchanged for preference securities of the surviving entity and the shares of Series A Preferred Stock remaining outstanding or such preference securities have such rights, preferences, privileges and voting power as are not materially less favorable to the holders than the rights, preferences, privileges and voting power of the shares of Series A Preferred Stock.
Except as otherwise required by law and in connection with the rights to elect directors as described above, holders of the Series A Preferred Stock have voting rights in certain circumstances. So long as shares of the Series A Preferred Stock are outstanding, in addition to any other vote or consent of shareholders required by law or our amended and restated charter, the vote or consent of holders owning at least 66 2/3% of the shares of Series A Preferred Stock outstanding is required for (1) any authorization or issuance of shares ranking senior to the Series A Preferred Stock; (2) any amendment to the rights of the Series A Preferred Stock so as to adversely affect the rights, preferences, privileges or voting power of the Series A Preferred Stock; or (3) consummation of any merger, share exchange or similar transaction unless the shares of Series A Preferred Stock remain outstanding, or if we are not the surviving entity in such transaction, are converted into or exchanged for preference securities of the surviving entity and the shares of Series A Preferred Stock remaining outstanding or such preference securities have such rights, preferences, privileges and voting power as are not materially less favorable to the holders than the rights, preferences, privileges and voting power of the shares of Series A Preferred Stock.
There may be future sales or other dilution of
our equity, which may adversely affect the market price of our common
stock.
We are not restricted from issuing additional common stock or preferred stock, including any securities that are convertible into or exchangeable for, or that represent the right to receive, common stock or preferred stock or any substantially similar securities. EFSC’s board of directors has broad discretion regarding the type and price of such securities.
We are not restricted from issuing additional common stock or preferred stock, including any securities that are convertible into or exchangeable for, or that represent the right to receive, common stock or preferred stock or any substantially similar securities. EFSC’s board of directors has broad discretion regarding the type and price of such securities.
The market price of
our common stock could decline as a result of sales of a large number of shares
of common stock or preferred stock or similar securities in the market, or the
perception that such sales could occur. Holders of our common stock do not have
anti-dilution or preemptive rights under the Delaware General Corporation Law,
as amended (“DGCL”), EFSC’s certificate of incorporation (as amended and
together with all certificates of designations) or by-laws. Shares of our common
stock are not redeemable and have no subscription or conversion rights.
Additionally, the
ownership interest of holders of our common stock could be diluted to the extent
the CPP Warrant is exercised for up to 324,074 shares of our common stock.
Although the U.S. Treasury has agreed not to vote any of the shares of common
stock it receives upon exercise of the CPP Warrant, a transferee of any portion
of the CPP Warrant or of any shares of common stock acquired upon exercise of
the CPP Warrant is not bound by this restriction. In addition, to the extent
options to purchase common stock under our employee stock option plans are
exercised, holders of our common stock could incur additional dilution. Further,
if we sell additional equity or convertible debt securities, such sales could
result in increased dilution to our stockholders.
The terms of the CPP
Warrant include an anti-dilution adjustment, which provides that, if we issue
common stock or securities convertible into or exercisable, or exchangeable for,
common stock at a price that is less than ninety percent (90%) of the market
price of such shares on the last trading day preceding the date we agree to sell
such shares, the number of shares of our common stock to be issued would
increase and the per share price of the common stock to be purchased pursuant to
the warrant would decrease.
We have outstanding subordinated debentures
issued to statutory trust subsidiaries, which have issued and sold preferred
securities to investors.
If we are unable to make payments on any of our subordinated debentures for more than twenty (20) consecutive quarters, we would be in default under the governing agreements for such securities and the amounts due under such agreements would be immediately due and payable. Additionally, if for any interest payment period we do not pay interest in respect of the subordinated debentures (which will be used to make distributions on the trust preferred securities), or if for any interest payment period we do not pay interest in respect of the subordinated debentures, or if any other event of default occurs, then we generally will be prohibited from declaring or paying any dividends or other distributions, or redeeming, purchasing or acquiring, any of our capital securities, including the common stock, during the next succeeding interest payment period applicable to any of the subordinated debentures, or next succeeding interest payment period, as the case may be.
If we are unable to make payments on any of our subordinated debentures for more than twenty (20) consecutive quarters, we would be in default under the governing agreements for such securities and the amounts due under such agreements would be immediately due and payable. Additionally, if for any interest payment period we do not pay interest in respect of the subordinated debentures (which will be used to make distributions on the trust preferred securities), or if for any interest payment period we do not pay interest in respect of the subordinated debentures, or if any other event of default occurs, then we generally will be prohibited from declaring or paying any dividends or other distributions, or redeeming, purchasing or acquiring, any of our capital securities, including the common stock, during the next succeeding interest payment period applicable to any of the subordinated debentures, or next succeeding interest payment period, as the case may be.
Moreover, any other
financing agreements that we enter into in the future may limit our ability to
pay cash dividends on our capital stock, including the common stock. In the
event that our existing or future financing agreements restrict our ability to
pay dividends in cash on the common stock, we may be unable to pay dividends in
cash on the common stock unless we can refinance amounts outstanding under those
agreements. In addition, if we are unable or determine not to pay interest on
our subordinated debentures, the market price of our common stock could be
materially adversely affected.
11
Anti-takeover provisions could negatively
impact our stockholders.
Provisions of Delaware law and of our certificate of incorporation, as amended, and bylaws as well as various provisions of federal and Missouri state law applicable to bank and bank holding companies could make it more difficult for a third party to acquire control of us or have the effect of discouraging a third party from attempting to acquire control of us. We are subject to Section 203 of the DGCL, which would make it more difficult for another party to acquire us without the approval of our board of directors. Additionally, our certificate of incorporation, as amended, authorizes our board of directors to issue preferred stock and preferred stock could be issued as a defensive measure in response to a takeover proposal. In the event of a proposed merger, tender offer or other attempt to gain control of the Company, our board of directors would have the ability to readily issue available shares of preferred stock as a method of discouraging, delaying or preventing a change in control of the Company. Such issuance could occur whether or not our stockholders favorably view the merger, tender offer or other attempt to gain control of the Company. These and other provisions could make it more difficult for a third party to acquire us even if an acquisition might be in the best interest of our stockholders. Although we have no present intention to issue any additional shares of its authorized preferred stock, there can be no assurance that the Company will not do so in the future.
Provisions of Delaware law and of our certificate of incorporation, as amended, and bylaws as well as various provisions of federal and Missouri state law applicable to bank and bank holding companies could make it more difficult for a third party to acquire control of us or have the effect of discouraging a third party from attempting to acquire control of us. We are subject to Section 203 of the DGCL, which would make it more difficult for another party to acquire us without the approval of our board of directors. Additionally, our certificate of incorporation, as amended, authorizes our board of directors to issue preferred stock and preferred stock could be issued as a defensive measure in response to a takeover proposal. In the event of a proposed merger, tender offer or other attempt to gain control of the Company, our board of directors would have the ability to readily issue available shares of preferred stock as a method of discouraging, delaying or preventing a change in control of the Company. Such issuance could occur whether or not our stockholders favorably view the merger, tender offer or other attempt to gain control of the Company. These and other provisions could make it more difficult for a third party to acquire us even if an acquisition might be in the best interest of our stockholders. Although we have no present intention to issue any additional shares of its authorized preferred stock, there can be no assurance that the Company will not do so in the future.
ITEM 1B: UNRESOLVED SEC COMMENTS
Not
applicable.
ITEM 2: PROPERTIES
Banking facilities
Our executive offices are located at 150 North Meramec, Clayton, Missouri, 63105. As of December 31, 2009, we had four banking locations and a support center in the St. Louis metropolitan area, seven banking locations in the Kansas City metropolitan area, one banking location in Mesa, Arizona and a loan production officer in central Phoenix. We own four of the facilities and lease the remainder. Most of the leases expire between 2010 and 2017 and include one or more renewal options of 5 years. One lease expires in 2026. All the leases are classified as operating leases. We believe all our properties are in good condition.
Our executive offices are located at 150 North Meramec, Clayton, Missouri, 63105. As of December 31, 2009, we had four banking locations and a support center in the St. Louis metropolitan area, seven banking locations in the Kansas City metropolitan area, one banking location in Mesa, Arizona and a loan production officer in central Phoenix. We own four of the facilities and lease the remainder. Most of the leases expire between 2010 and 2017 and include one or more renewal options of 5 years. One lease expires in 2026. All the leases are classified as operating leases. We believe all our properties are in good condition.
Wealth management
facilities
In February 2008, we purchased approximately 11,000 square feet of commercial condominium space in Clayton Missouri located approximately two blocks from our executive offices. We relocated the St. Louis-based Trust Advisory operations to this location in the fourth quarter of 2008. Enterprise Trust also has offices in Kansas City. Expenses related to the space used by Enterprise Trust are allocated to the Wealth Management segment.
In February 2008, we purchased approximately 11,000 square feet of commercial condominium space in Clayton Missouri located approximately two blocks from our executive offices. We relocated the St. Louis-based Trust Advisory operations to this location in the fourth quarter of 2008. Enterprise Trust also has offices in Kansas City. Expenses related to the space used by Enterprise Trust are allocated to the Wealth Management segment.
ITEM 3: LEGAL PROCEEDINGS
The Company and its
subsidiaries are, from time to time, parties to various legal proceedings
arising out of their businesses. Management believes that there are no such
proceedings pending or threatened against the Company or its subsidiaries which,
if determined adversely, would have a material adverse effect on the business,
financial condition, results of operations or cash flows of the Company or any
of its subsidiaries.
ITEM 4: SUBMISSION OF MATTERS TO VOTE OF
SECURITY HOLDERS
Not applicable.
12
PART II
ITEM 5: MARKET FOR COMMON STOCK AND RELATED STOCKHOLDER MATTERS AND
ISSUER PURCHASE OF EQUITY SECURITIES
Common Stock Market
Prices
The Company’s common stock trades on the NASDAQ Global Select Market under the symbol “EFSC”. Below are the dividends declared by quarter along with what the Company believes are the high and low closing sales prices for the common stock. There may have been other transactions at prices not known to the Company. As of March 1, 2010, the Company had 662 common stock shareholders of record and a market price of $9.01 per share. The number of holders of record does not represent the actual number of beneficial owners of our common stock because securities dealers and others frequently hold shares in “street name” for the benefit of individual owners who have the right to vote shares.
The Company’s common stock trades on the NASDAQ Global Select Market under the symbol “EFSC”. Below are the dividends declared by quarter along with what the Company believes are the high and low closing sales prices for the common stock. There may have been other transactions at prices not known to the Company. As of March 1, 2010, the Company had 662 common stock shareholders of record and a market price of $9.01 per share. The number of holders of record does not represent the actual number of beneficial owners of our common stock because securities dealers and others frequently hold shares in “street name” for the benefit of individual owners who have the right to vote shares.
| 2009 | 2008 | |||||||||||||||||||||||
| 4th Qtr | 3rd Qtr | 2nd Qtr | 1st Qtr | 4th Qtr | 3rd Qtr | 2nd Qtr | 1st Qtr | |||||||||||||||||
| Closing Price | $ | 7.71 | $ | 9.25 | $ | 9.09 | $ | 9.76 | $ | 15.24 | $ | 22.56 | $ | 18.85 | $ | 25.00 | ||||||||
| High | 9.25 | 12.24 | 11.46 | 14.81 | 22.49 | 23.04 | 25.25 | 25.00 | ||||||||||||||||
| Low | 7.25 | 8.96 | 7.88 | 7.52 | 11.49 | 15.95 | 18.60 | 18.19 | ||||||||||||||||
| Cash dividends paid on common shares | 0.0525 | 0.0525 | 0.0525 | 0.0525 | 0.0525 | 0.0525 | 0.0525 | 0.0525 | ||||||||||||||||
Securities Authorized for Issuance Under
Equity Compensation Plans
The following table provides information as of December 31, 2009, regarding securities issued and to be issued under our equity compensation plans that were in effect during the year ended December 31, 2009:
The following table provides information as of December 31, 2009, regarding securities issued and to be issued under our equity compensation plans that were in effect during the year ended December 31, 2009:
| Number of securities | ||||||
| remaining available for | ||||||
| Number of securities to | Weighted-average | future issuance under | ||||
| be issued upon exercise | exercise price of | equity compensation plans | ||||
| of outstanding options, | outstanding options, | (excluding shares | ||||
| warrants and rights | warrants and rights | reflected in column (a)) | ||||
| Plan Category | (a) | (b) | (c) | |||
| Equity compensation | ||||||
| plans approved by the | ||||||
| Company's shareholders | 803,735 | $16.77 | 915,063 | |||
| Equity compensation | ||||||
| plans not approved by | ||||||
| the Company's | ||||||
| shareholders | -- | -- | -- | |||
| Total | 803,735 (1) | $16.77 | 915,063 (2) | |||
(1) Includes the
following:
- 29,090 shares of common stock to
be issued upon exercise of outstanding stock options under the 1996 Stock
Incentive Plan (Plan III);
- 185,535 shares of common stock to
be issued upon exercise of outstanding stock options under the 1999 Stock
Incentive Plan (Plan IV);
- 196,670 shares of common stock to
be issued upon exercise of outstanding stock options under the 2002 Stock
Incentive Plan (Plan V);
- 389,940 shares of common stock
used as the base for grants of stock settled stock appreciation rights under
the 2002 Stock Incentive Plan (Plan V);
- 2,500 shares of common stock to be issued upon exercise of outstanding stock options under the 1998 Nonqualified Plan.
(2) Includes the
following:
- 849,723 shares of common stock
available for issuance under the 2002 Stock Incentive Plan (Plan
V);
- 65,340 shares of common stock available for issuance under the Non-management Director Stock Plan.
13
Dividends
The holders of shares of common stock of the Company are entitled to receive dividends when declared by the Company’s Board of Directors out of funds legally available for the purpose of paying dividends. Holders of our Series A Preferred Stock originally issued to the U.S. Treasury on December 19, 2008, are entitled to cumulative dividends of 5% per annum. Dividends on the Series A Preferred Stock are currently payable at the rate of $1.8 million per annum. Dividends on the Series A Preferred Stock are prior to and in preference to any dividends payable on our common stock. Pursuant to the terms of the purchase agreement with the U.S. Treasury under the Capital Purchase Program, prior to December 19, 2011 our ability to declare or pay dividends on junior securities is subject to restrictions, including a restriction against increasing the dividend rate on our common stock from the last quarterly cash dividend per share ($0.0525) declared on our common stock prior to December 19, 2008. The amount of dividends, if any, that may be declared by the Company also depends on many other factors, including future earnings, bank regulatory capital requirements and business conditions as they affect the Company and its subsidiaries. As a result, no assurance can be given that dividends will be paid in the future with respect to the Company’s common stock. In addition, the Company currently plans to retain most of its earnings to strengthen our balance sheet given the weak economic environment.
The holders of shares of common stock of the Company are entitled to receive dividends when declared by the Company’s Board of Directors out of funds legally available for the purpose of paying dividends. Holders of our Series A Preferred Stock originally issued to the U.S. Treasury on December 19, 2008, are entitled to cumulative dividends of 5% per annum. Dividends on the Series A Preferred Stock are currently payable at the rate of $1.8 million per annum. Dividends on the Series A Preferred Stock are prior to and in preference to any dividends payable on our common stock. Pursuant to the terms of the purchase agreement with the U.S. Treasury under the Capital Purchase Program, prior to December 19, 2011 our ability to declare or pay dividends on junior securities is subject to restrictions, including a restriction against increasing the dividend rate on our common stock from the last quarterly cash dividend per share ($0.0525) declared on our common stock prior to December 19, 2008. The amount of dividends, if any, that may be declared by the Company also depends on many other factors, including future earnings, bank regulatory capital requirements and business conditions as they affect the Company and its subsidiaries. As a result, no assurance can be given that dividends will be paid in the future with respect to the Company’s common stock. In addition, the Company currently plans to retain most of its earnings to strengthen our balance sheet given the weak economic environment.
14
Performance Graph
The following Stock Performance Graph and related information should not be deemed “soliciting material” or to be “filed” with the SEC nor shall such performance be incorporated by reference into any future filings under the Securities Act of 1933 or Securities Exchange Act of 1934, each as amended, except to the extent that the Company specifically incorporates it by reference into such filing.
The following Stock Performance Graph and related information should not be deemed “soliciting material” or to be “filed” with the SEC nor shall such performance be incorporated by reference into any future filings under the Securities Act of 1933 or Securities Exchange Act of 1934, each as amended, except to the extent that the Company specifically incorporates it by reference into such filing.
The following graph*
compares the cumulative total shareholder return on the Company’s common stock
from December 31, 2004 through December 31, 2009. The graph compares the
Company’s common stock with the NASDAQ Composite and the SNL $1B-$5B Bank Index.
The graph assumes an investment of $100.00 in the Company’s common stock and
each index on December 31, 2004 and reinvestment of all quarterly dividends. The
investment is measured as of each subsequent fiscal year end. There is no
assurance that the Company’s common stock performance will continue in the
future with the same or similar results as shown in the graph.
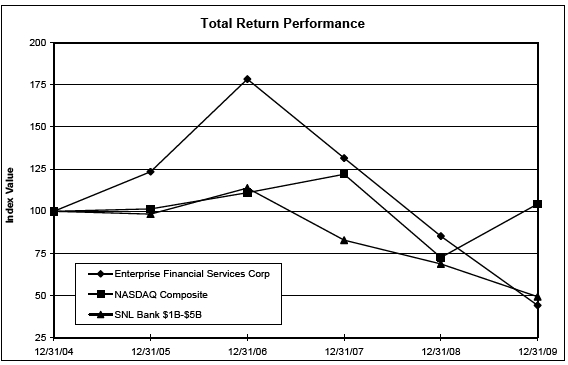
| Period Ending | ||||||||||||
| Index | 12/31/04 | 12/31/05 | 12/31/06 | 12/31/07 | 12/31/08 | 12/31/09 | ||||||
| Enterprise Financial Services Corp | 100.00 | 123.41 | 178.43 | 131.52 | 85.18 | 44.08 | ||||||
| NASDAQ Composite | 100.00 | 101.37 | 111.03 | 121.92 | 72.49 | 104.31 | ||||||
| SNL Bank $1B-$5B | 100.00 | 98.29 | 113.74 | 82.85 | 68.72 | 49.26 | ||||||
*Source: SNL
Financial L.C. Used with permission. All rights reserved.
15
ITEM 6: SELECTED FINANCIAL DATA
The following
consolidated selected financial data is derived from the Company’s audited
financial statements as of and for the five years ended December 31, 2009. This
information should be read in connection with our audited consolidated financial
statements, related notes and “Management’s Discussion and Analysis of Financial
Condition and Results of Operations” appearing elsewhere in this report. See
“Loan Participations” in Item 7, Management’s Discussion and Analysis and Item
8, Note 2 – Loan Participation Restatement for more information on the Restated
columns.
| Year ended December 31, | ||||||||||||||||||||
| Restated | Restated | Restated | Restated | |||||||||||||||||
| (in thousands, except per share data) | 2009 | 2008 | 2007 | 2006 | 2005 | |||||||||||||||
| EARNINGS SUMMARY: | ||||||||||||||||||||
| Interest income | $ | 118,486 | $ | 127,021 | $ | 130,249 | $ | 98,545 | $ | 71,648 | ||||||||||
| Interest expense | 48,845 | 60,338 | 69,242 | 47,308 | 27,087 | |||||||||||||||
| Net interest income | 69,641 | 66,683 | 61,007 | 51,236 | 44,561 | |||||||||||||||
| Provision for loan losses | 40,412 | 26,510 | 5,120 | 2,273 | 1,523 | |||||||||||||||
| Noninterest income | 19,877 | 20,341 | 12,852 | 9,897 | 8,187 | |||||||||||||||
| Noninterest expense | 98,427 | 48,776 | 44,695 | 37,754 | 33,667 | |||||||||||||||
| (Loss) income from continuing operations | (49,321 | ) | 11,738 | 24,044 | 21,107 | 17,558 | ||||||||||||||
| Income tax (benefit) expense from continuing operations | (2,650 | ) | 3,672 | 8,098 | 7,357 | 6,300 | ||||||||||||||
| Net (loss) income from continuing operations | (46,671 | ) | 8,066 | 15,946 | 13,750 | 11,258 | ||||||||||||||
| Net (loss) income | $ | (47,955 | ) | $ | 1,848 | $ | 17,255 | $ | 15,379 | $ | 11,275 | |||||||||
| PER SHARE DATA: | ||||||||||||||||||||
| Basic (loss) earnings per common share: | ||||||||||||||||||||
| From continuing operations | $ | (3.82 | ) | $ | 0.63 | $ | 1.30 | $ | 1.25 | $ | 1.12 | |||||||||
| Total | (3.92 | ) | 0.14 | 1.41 | 1.40 | 1.12 | ||||||||||||||
| Diluted (loss) earnings per common share: | ||||||||||||||||||||
| From continuing operations | (3.82 | ) | 0.63 | 1.27 | 1.21 | 1.05 | ||||||||||||||
| Total | (3.92 | ) | 0.14 | 1.37 | 1.35 | 1.05 | ||||||||||||||
| Cash dividends paid on common shares | 0.21 | 0.21 | 0.21 | 0.18 | 0.14 | |||||||||||||||
| Book value per common share | 10.25 | 14.33 | 13.91 | 11.50 | 8.83 | |||||||||||||||
| Tangible book value per common share | 10.05 | 10.27 | 8.81 | 8.40 | 7.25 | |||||||||||||||
| BALANCE SHEET DATA: | ||||||||||||||||||||
| Ending balances: | ||||||||||||||||||||
| Loans | 1,833,260 | 2,201,457 | 1,784,278 | 1,376,452 | 1,048,302 | |||||||||||||||
| Allowance for loan losses | 42,995 | 33,808 | 22,585 | 17,475 | 13,332 | |||||||||||||||
| Goodwill | 953 | 48,512 | 57,177 | 29,983 | 12,042 | |||||||||||||||
| Intangibles, net | 1,643 | 3,504 | 6,053 | 5,789 | 4,548 | |||||||||||||||
| Assets | 2,365,655 | 2,493,767 | 2,141,329 | 1,600,004 | 1,332,673 | |||||||||||||||
| Deposits | 1,941,416 | 1,792,784 | 1,585,013 | 1,315,508 | 1,116,244 | |||||||||||||||
| Subordinated debentures | 85,081 | 85,081 | 56,807 | 35,054 | 30,930 | |||||||||||||||
| Borrowings | 167,438 | 392,926 | 312,427 | 105,481 | 82,854 | |||||||||||||||
| Shareholders' equity | 163,912 | 214,572 | 172,515 | 132,683 | 92,386 | |||||||||||||||
| Average balances: | ||||||||||||||||||||
| Loans | 2,098,275 | 2,001,073 | 1,599,596 | 1,214,436 | 1,014,697 | |||||||||||||||
| Earning assets | 2,334,700 | 2,125,581 | 1,723,214 | 1,355,704 | 1,150,997 | |||||||||||||||
| Assets | 2,462,237 | 2,298,882 | 1,856,466 | 1,440,685 | 1,198,795 | |||||||||||||||
| Interest-bearing liabilities | 2,025,339 | 1,883,904 | 1,469,258 | 1,110,845 | 910,348 | |||||||||||||||
| Shareholders' equity | 177,374 | 182,175 | 160,783 | 112,633 | 81,191 | |||||||||||||||
| SELECTED RATIOS: | ||||||||||||||||||||
| Return on average common equity | (34.51 | ) % | 0.98 | % | 10.73 | % | 13.65 | % | 13.89 | % | ||||||||||
| Return on average assets | (2.05 | ) | 0.08 | 0.93 | 1.07 | 0.94 | ||||||||||||||
| Efficiency ratio | 109.95 | 56.05 | 60.51 | 61.76 | 63.83 | |||||||||||||||
| Average common equity to average assets | 5.92 | 7.89 | 8.65 | 7.78 | 6.77 | |||||||||||||||
| Yield on average interest-earning assets | 5.15 | 6.04 | 7.63 | 7.34 | 6.28 | |||||||||||||||
| Cost of interest-bearing liabilities | 2.41 | 3.20 | 4.71 | 4.26 | 2.98 | |||||||||||||||
| Net interest rate spread | 2.74 | 2.84 | 2.92 | 3.08 | 3.31 | |||||||||||||||
| Net interest rate margin | 3.06 | 3.20 | 3.61 | 3.85 | 3.93 | |||||||||||||||
| Nonperforming loans to total loans | 2.10 | 1.61 | 0.71 | 0.47 | 0.14 | |||||||||||||||
| Nonperforming assets to total assets | 2.74 | 1.98 | 0.73 | 0.50 | 0.11 | |||||||||||||||
| Net chargeoffs to average loans | 1.42 | 0.76 | 0.13 | 0.10 | 0.02 | |||||||||||||||
| Allowance for loan losses to total loans | 2.35 | 1.54 | 1.27 | 1.27 | 1.27 | |||||||||||||||
| Dividend payout ratio - basic | (5.62 | ) | 144.02 | 15.29 | 12.85 | 12.60 | ||||||||||||||
16
ITEM 7: MANAGEMENT’S DISCUSSION AND ANALYSIS
OF FINANCIAL CONDITION AND RESULTS OF OPERATIONS
INTRODUCTION
The objective of this section is to provide an overview of the results of operations and financial condition of the Company for the three years ended December 31, 2009. It should be read in conjunction with the Consolidated Financial Statements, Notes and other financial data presented elsewhere in this report, particularly the information regarding the Company’s business operations described in Item 1.
The objective of this section is to provide an overview of the results of operations and financial condition of the Company for the three years ended December 31, 2009. It should be read in conjunction with the Consolidated Financial Statements, Notes and other financial data presented elsewhere in this report, particularly the information regarding the Company’s business operations described in Item 1.
EXECUTIVE SUMMARY
This overview of management’s discussion and analysis highlights selected information in this document and may not contain all of the information that is important to you. For a more complete understanding of trends, events, commitments, uncertainties, liquidity, capital resources and critical accounting estimates, you should carefully read this entire document.
This overview of management’s discussion and analysis highlights selected information in this document and may not contain all of the information that is important to you. For a more complete understanding of trends, events, commitments, uncertainties, liquidity, capital resources and critical accounting estimates, you should carefully read this entire document.
We accomplished a
number of objectives in 2009 and early 2010 as we position our Company for
continued growth when the credit cycle rebounds. In addition to bolstering our
allowance for loan losses, we took significant steps to fortify our balance
sheet and position the Company for economic recovery. In 2009, we strengthened
our liquidity by growing core deposits more than 23% over 2008 and tightly
controlled our operating expenses. In addition, on December 11, 2009, we
completed an FDIC-assisted acquisition of Valley Capital Bank in Mesa, Arizona.
This strategic acquisition positioned us to begin operating full-service
branches in the Phoenix market. On January 20, 2010, we sold Millennium, a
non-strategic subsidiary. And lastly, over the past fourteen months, we have
added $75.0 million in new regulatory capital, including $15.0 million from a
January 2010 private offering of our common stock. See “Supervision and
Regulation”, “Liquidity and Capital Resources” and Item 8, Note 3 – Acquisitions
and Divestitures for more information.
During the third
quarter of 2009, we determined that the Company did not have a formal process of
reviewing existing contracts with continuing accounting significance and as a
result did not detect an error in the accounting for loan participations
executed subject to its standard participation agreement. This resulted in the
restatement of our financial results at December 31, 2007, December 31, 2008,
each quarter in 2008 and the first and second quarters of 2009. Except for
labeling affected prior period financial statements as “Restated,” no further
changes are being made to our above described corrected financial statements and
no further restatement of our financial statements is anticipated. All prior
period results presented have been restated for the error. The overall effect of
these adjustments from the original period of correction to December 31, 2009
was neutral to the Company’s financial results. See “Loan Participations” below
and Item 8, Note 2 – Loan Participation Restatement for more information.
Operating Results
For 2009, we reported a net loss of $48.0 million compared to a net loss of $1.8 million in 2008. After deducting preferred stock dividends, net loss available to common shareholders was $50.4 million, or $3.92 per diluted share, compared to net income available to common shareholders of $1.8 million, or $0.14 per diluted share in 2008. Included in 2009 results are:
For 2009, we reported a net loss of $48.0 million compared to a net loss of $1.8 million in 2008. After deducting preferred stock dividends, net loss available to common shareholders was $50.4 million, or $3.92 per diluted share, compared to net income available to common shareholders of $1.8 million, or $0.14 per diluted share in 2008. Included in 2009 results are:
- $45.4 million pre-tax, non-cash
goodwill impairment charge related to our Banking reporting
unit;
- $1.6 million pre-tax loss on the
sale of Millennium;
- $7.4 million gain from the extinguishment of debt related to loan participations.
Goodwill impairment
The goodwill impairment charge is a non-cash accounting adjustment that does not reduce the Company’s regulatory or tangible capital position, liquidity or cash flow and does not impact the Company’s operations. The goodwill impairment charge was primarily driven by the deterioration in the general economic environment and the resulting decline in the Company’s share price and market capitalization in the first quarter of 2009. See Item 8, Note 10 – Goodwill and Intangible Assets for more information.
The goodwill impairment charge is a non-cash accounting adjustment that does not reduce the Company’s regulatory or tangible capital position, liquidity or cash flow and does not impact the Company’s operations. The goodwill impairment charge was primarily driven by the deterioration in the general economic environment and the resulting decline in the Company’s share price and market capitalization in the first quarter of 2009. See Item 8, Note 10 – Goodwill and Intangible Assets for more information.
Millennium sale
On January 20, 2010, we sold Millennium for $4.0 million in cash, resulting in a $1.6 million pre-tax loss on the sale. Millennium financial results are reported as discontinued operations for all periods presented herein. See “Noninterest income” for more information.
On January 20, 2010, we sold Millennium for $4.0 million in cash, resulting in a $1.6 million pre-tax loss on the sale. Millennium financial results are reported as discontinued operations for all periods presented herein. See “Noninterest income” for more information.
17
Loan Participations
During a review of loan participation agreements in the third quarter of 2009, the Company determined that certain of these agreements contained language inconsistent with sale accounting treatment. The agreements provided us with the unilateral ability to repurchase participated loans at their outstanding loan balance plus accrued interest at any time. In effect, the repurchase option afforded us with effective control over the participated portion of the loan, which conflicts with sale accounting treatment.
During a review of loan participation agreements in the third quarter of 2009, the Company determined that certain of these agreements contained language inconsistent with sale accounting treatment. The agreements provided us with the unilateral ability to repurchase participated loans at their outstanding loan balance plus accrued interest at any time. In effect, the repurchase option afforded us with effective control over the participated portion of the loan, which conflicts with sale accounting treatment.
In order to correct
the error, we recorded the participated portion of such loans as portfolio
loans, along with secured borrowing liabilities (included in Other borrowings in
the consolidated balance sheets) to finance the loans. We also recorded
incremental interest income on the loans offset by incremental interest expense
on the secured borrowings. Additional provisions for loan losses and the related
income tax effect were also recorded. However, under the terms of the
agreements, the participating banks absorb credit losses, if any, on the
participated portion of the loan. We have corrected the error by restating prior
period financial statements and related financial information set forth herein.
As secured borrowings
on our consolidated balance sheet, any reduction of the liability to the
participating bank reflecting the participated bank’s portion of the credit loss
is recorded only upon legal defeasance of such liability as a component of the
gain or loss on extinguishment. During the third quarter of 2009, we recorded a
$5.3 million pre-tax gain from the extinguishment of debt resulting from the
foreclosure of the collateral on one of our participated loans, which was
carried net of provisions for loan losses totaling $5.3 million in previous
periods.
In the fourth quarter
of 2009, the Company obtained amended agreements that comply with sale
accounting treatment from all of the participating banks. As a result, the
Company eliminated the participated portion of the loans, net of the allowance
for losses, and the related liability from our December 31, 2009 consolidated
balance sheet, and recognized an additional gain from the extinguishment of debt
of $2.1 million in the fourth quarter of 2009. The overall effect of these
adjustments from the original period of correction to December 31, 2009 was
neutral to the Company’s financial results and key ratios. The error is
described in more detail in Item 8, Note 2 – Loan Participation Restatement and
Item 9A.
Operating Results
We reported a net loss from continuing operations of $46.7 million, or $3.82 per diluted share, for 2009, compared to net income of $8.1 million, or $0.63 per diluted share, for 2008. For 2009, net loss from discontinued operations was $1.3 million, or $0.10 per diluted share, compared to a net loss of $6.2 million, or $0.49 per diluted share in 2008.
We reported a net loss from continuing operations of $46.7 million, or $3.82 per diluted share, for 2009, compared to net income of $8.1 million, or $0.63 per diluted share, for 2008. For 2009, net loss from discontinued operations was $1.3 million, or $0.10 per diluted share, compared to a net loss of $6.2 million, or $0.49 per diluted share in 2008.
On a pre-tax,
pre-provision basis, the Company’s operating income from continuing operations
was $31.9 million, for the year 2009 compared to $35.2 million in 2008. The
reduction in 2009 operating income from continuing operations compared to 2008
is largely attributable to the fair value adjustments on state tax credits held
for sale and the related interest rate caps used to hedge market risk along with
increases in loan legal and other real estate expenses.
18
We are presenting
pre-tax, pre-provision income from continuing operations, which is a non-GAAP
(Generally Accepted Accounting Principles) financial measure, because we believe
adjusting our results to exclude discontinued operations, loan loss provision
expense, impairment charges, special FDIC assessments and unusual gains or
losses provides shareholders with a more comparable basis for evaluating
period-to-period operating results. A schedule reconciling pre-tax income (loss)
from continuing operations to pre-tax, pre-provision income from continuing
operations is provided in the attached tables.
| For the Quarter Ended | ||||||||||||||||||||
| Restated | Restated | |||||||||||||||||||
| Dec 31, | Sep 30, | Jun 30, | Mar 31, | Total Year | ||||||||||||||||
| (In thousands) | 2009 | 2009 | 2009 | 2009 | 2009 | |||||||||||||||
| Pre-tax income (loss) from continuing operations | $ | 8 | $ | 7,003 | $ | (1,634 | ) | $ | (54,698 | ) | $ | (49,321 | ) | |||||||
| Goodwill impairment charge | - | - | - | 45,377 | 45,377 | |||||||||||||||
| Sales and fair value writedowns of other real estate | 1,166 | 602 | 508 | 549 | 2,825 | |||||||||||||||
| Sale of securities | (3 | ) | - | (636 | ) | (316 | ) | (955 | ) | |||||||||||
| Gain on extinguishment of debt | (2,062 | ) | (5,326 | ) | - | - | (7,388 | ) | ||||||||||||
| FDIC special assessment (included in Other noninterest expense) | - | (105 | ) | 1,100 | - | 995 | ||||||||||||||
| (Loss) income before income tax | (891 | ) | 2,174 | (662 | ) | (9,088 | ) | (8,467 | ) | |||||||||||
| Provision for loan losses | 8,400 | 6,480 | 9,073 | 16,459 | 40,412 | |||||||||||||||
| Pre-tax, pre-provision income from continuing operations | $ | 7,509 | $ | 8,654 | $ | 8,411 | $ | 7,371 | $ | 31,945 | ||||||||||
| For the Quarter Ended (Restated) | ||||||||||||||||||||
| Dec 31, | Sep 30, | Jun 30, | Mar 31, | Total Year | ||||||||||||||||
| (In thousands) | 2008 | 2008 | 2008 | 2008 | 2008 | |||||||||||||||
| Pre-tax (loss) income from continuing operations | $ | (6,291 | ) | $ | 8,214 | $ | 4,386 | $ | 5,429 | $ | 11,738 | |||||||||
| Sales and fair value writedowns of other real estate | 91 | (242 | ) | (351 | ) | 9 | (492 | ) | ||||||||||||
| Sale of securities | (88 | ) | - | (73 | ) | - | (161 | ) | ||||||||||||
| Gain on sale of Kansas City nonstrategic branches/charter | 0 | (2,840 | ) | 19 | (579 | ) | (3,400 | ) | ||||||||||||
| Retention payment | 875 | 125 | - | - | 1,000 | |||||||||||||||
| (Loss) income before income tax | (5,413 | ) | 5,257 | 3,981 | 4,859 | 8,685 | ||||||||||||||
| Provision for loan losses | 16,296 | 3,007 | 4,378 | 2,829 | 26,510 | |||||||||||||||
| Pre-tax, pre-provision income from continuing operations | $ | 10,883 | $ | 8,264 | $ | 8,359 | $ | 7,688 | $ | 35,195 | ||||||||||
Below are highlights
of our Banking and Wealth Management segments. For more information on our
segments, see Item 8, Note 21 – Segment Reporting. Unless otherwise noted, this
discussion excludes discontinued operations.
Banking
For 2009, the Banking segment recorded a net loss of $43.2 million compared to net income of $10.5 million for 2008. Excluding the non-tax deductible goodwill impairment of $45.4 million, the Banking segment recorded net income of $2.2 million for 2009. Below is a summary of 2009:
For 2009, the Banking segment recorded a net loss of $43.2 million compared to net income of $10.5 million for 2008. Excluding the non-tax deductible goodwill impairment of $45.4 million, the Banking segment recorded net income of $2.2 million for 2009. Below is a summary of 2009:
- Loan demand – At
December 31, 2009, portfolio loans were $1.833 billion, a decrease of $368.0
million, or 17%, from December 31, 2008. Net of the loan participations,
portfolio loans declined $144.0 million, or 7%.
Loan demand appears to be soft as business clients postpone expansion efforts and pare back debt. Our loan portfolio mix at December 31, 2009, from a collateral perspective, changed significantly from December 31, 2008 in two categories. Construction loans collateralized by real estate totaled $224.4 million or 12% of the portfolio, at December 31, 2009 compared to $378.1 million or 17% of the portfolio at December 31, 2008. This reduction reflects the soft real estate markets and the Company’s intentional efforts to reduce our construction loan exposure. Loans collateralized by commercial real estate totaled $820.2 million, or 45% of the portfolio at December 31, 2009 compared to $888.0 million, or 40% of the portfolio at December 31, 2008. Approximately $318.0 million, or 39%, of that total, represented real estate that was “owner-occupied” by commercial and industrial businesses compared to $333.0 million, or 38% at December 31, 2008.
We expect modest loan growth in 2010 as business activity should improve slightly and additional capacity from new hires and focused sales teams take effect.
19
- Deposit growth – Our
focus for 2009 was to reduce our reliance on brokered deposits, grow our core
deposits, and increase our percentage of non-interest bearing deposits. We
adjusted our incentive programs to focus our associates on deposit gathering
efforts and aggressively managed deposit rates to achieve this
objective.
Total deposits were $1.94 billion at December 31, 2009, an increase of $149.0 million, or 8%, from December 31, 2008. Total deposits increased $88.0 million, or 5%, during the fourth quarter of 2009. Noninterest-bearing demand deposits represented 15% of total deposits at December 31, 2009 compared to 14% at December 31, 2008. Noninterest-bearing demand deposit growth was particularly strong in the fourth quarter of 2009, with an increase of $32.0 million, or 12%.
Excluding brokered certificates of deposit, “core” deposits grew $328.0 million, or 23%, from a year ago, and $139.0 million, or 9%, during the fourth quarter of 2009. Core deposits include certificates of deposit sold to clients through the reciprocal CDARS program. As of December 31, 2009, Enterprise had $135.0 million of reciprocal CDARS deposits outstanding compared to $60.0 million at December 31, 2008.
Brokered deposits declined $180.0 million, or 53%, from December 31, 2008 to $156.0 million. For the year ended December 31, 2009, brokered deposits represented 8% of total deposits compared to 19% for the year ended December 31, 2008.
- Asset quality – We
are entering the fourth year of slow residential housing activity in St. Louis
and Kansas City. In addition, commercial real estate markets, especially
retail, are softening.
Nonperforming loans were $38.5 million, or 2.10%, of portfolio loans at December 31, 2009. The allowance for loan losses was $43.0 million, or 2.35%, of portfolio loans versus $33.8 million, or 1.54% of portfolio loans, at the end of 2008. In 2009, we incurred $29.8 million of net charge-offs, or 1.42% of average loans compared to $15.2 million of net charge-offs, or 0.76% of average loans in 2008.
Management expects 2010 nonperforming assets and chargeoff levels to remain elevated.
- Net Interest Rate Margin –
Our fully tax-equivalent net interest rate margin was 3.06% for
2009 versus 3.20% for 2008. The margin has been compressed as a result of
sharply lower interest rates, a higher percentage of earning assets in
securities and short-term investments, higher levels of nonperforming loans
and a change in core deposit mix from money market deposits to higher rate
time deposits. We expect wider margins in 2010 based on better earning asset
mix, risk-based pricing, and continued discipline on funding
costs.
- Arizona Expansion –
On December 11, 2009, Enterprise acquired certain assets and
assumed certain liabilities of Valley Capital Bank in Mesa, Arizona from the
FDIC. At December 31, 2009, Valley Capital had approximately $37 million in
deposits and $18 million in loans and foreclosed real estate at fair value. As
part of the transaction, Enterprise and the FDIC entered into a loss sharing
arrangement on the assets acquired.
This acquisition represents the expansion of our Arizona growth strategy, which began with the establishment of a loan production office in Phoenix in late 2007. The acquisition allows us to operate a full-service bank in Arizona and enables us to open additional locations in the greater Phoenix area, subject to the normal regulatory approvals. After receiving regulatory approval, Enterprise opened a new branch location in the western suburbs of Phoenix on February 16, 2010.
In connection with this transaction, we recorded $953,000 of goodwill based on the fair value of the assets purchased and liabilities assumed. We estimate approximately $3.5 million of the discount on assets will accrete into income over the expected life of the assets and expect the transaction to be accretive to earnings in 2010. We did not record a core deposit intangible, as most of the acquired deposits were high-rate, internet CDs that are being re-priced and are expected to run off.
Please refer to Item 8, Note 3 – Acquisitions and Divestitures for more information.
Wealth Management
The Wealth Management segment is comprised of Enterprise Trust and our state tax credit brokerage activities. Wealth Management is a strategic line of business consistent with our Company mission of “guiding our clients to a lifetime of financial success.” It is a driver of fee income and is intended to help us diversify our dependency on bank spread incomes.
The Wealth Management segment is comprised of Enterprise Trust and our state tax credit brokerage activities. Wealth Management is a strategic line of business consistent with our Company mission of “guiding our clients to a lifetime of financial success.” It is a driver of fee income and is intended to help us diversify our dependency on bank spread incomes.
For 2009, Wealth
Management recorded a $608,000 net loss from continuing operations compared to
net income from continuing operations of $1.9 million in 2008. Revenues for
Trust are net of commissions and other direct investment expenses such as
custody charges and investment management expenses.
20
- Trust revenues – Revenues from the Trust division decreased $1.4 million, or 24%, for
the year. The decline was primarily due to reduced sales and client attrition
related to reorganization and staff changes. Trust assets under administration
were $1.280 billion at December 31, 2009, a 5% increase over one year
ago.
- State tax credit brokerage activities – In 2009, gains from state tax credit brokerage activities were $1.0 million compared to $4.2 million in 2008. The net effects from fair value adjustments on the tax credit assets and related interest rate caps used to economically hedge the tax credits represents $3.8 million of the decline.
RESULTS OF CONTINUING OPERATIONS
ANALYSIS
Net Interest Income
Comparison of 2009 vs. 2008
Net interest income is the primary source of the Company’s revenue. Net interest income is the difference between interest income on earning assets, such as loans and securities, and the interest expense on interest-bearing deposits and other borrowings used to fund interest earning and other assets. The amount of net interest income is affected by changes in interest rates and by the amount and composition of interest-earning assets and interest-bearing liabilities, such as the mix of fixed vs. variable rate loans. When and how often loans and deposits mature and re-price also impacts net interest income.
Net interest spread
and net interest rate margin are utilized to measure and explain changes in net
interest income. Interest rate spread is the difference between the yield on
interest-earning assets and the rate paid for interest-bearing liabilities that
fund those assets. The net interest rate margin is expressed as the percentage
of net interest income to average interest-earning assets. The net interest rate
margin exceeds the interest rate spread because noninterest-bearing sources of
funds (net free funds), principally demand deposits and shareholders’ equity,
also support earning assets.
Net interest income
(on a tax-equivalent basis) increased $3.3 million, or 5%, from $68.1 million
for 2008 to $71.4 million for 2009. Total interest income decreased $8.2 million
while total interest expense decreased $11.5 million.
Average
interest-earning assets were $2.335 billion in 2009, an increase of $209.0
million, or 10%, from 2008. Securities and short-term investments accounted for
the majority of the growth, increasing by $112.0 million, or 90%, to $236
million. Loans increased $97.0 million, or 5%, to $2.098 billion. Interest
income on loans increased $6.1 million from growth and decreased by $14.6
million due to the impact of rates, for a net decrease of $8.5 million versus
2008.
Average
interest-bearing liabilities increased $141.0 million, or 7%, to $2.025 billion
compared to $1.884 billion for 2008. The growth in interest-bearing liabilities
resulted from a $132.0 million increase in interest-bearing core deposits, a
$15.0 million increase in brokered certificates of deposit, and a $26.0 million
increase in subordinated debentures. Borrowed funds declined by $32.0 million in
2009. For 2009, interest expense on interest-bearing liabilities increased $6.4
million due to growth while the impact of declining rates decreased interest
expense on interest-bearing liabilities by $17.9 million, for a net decrease of
$11.5 million versus 2008. See “Liquidity and Capital Resources” for more
information.
For the year ended
December 31, 2009, the tax-equivalent net interest rate margin was 3.06%
compared to 3.20% for 2008. The margin has been compressed as a result of
sharply declining interest rates, an increase in securities and short-term
investments as a percentage of earning assets, higher levels of nonperforming
loans and a change in core deposit mix from money market deposits to higher rate
time deposits. In 2010, we expect wider margins due to improved earning asset
mix, risk-based loan pricing and continued discipline on funding
costs.
Comparison of 2008 vs. 2007
Net interest income (on a tax-equivalent basis) increased $5.9 million, or 9%, from $62.2 million for 2007 to $68.1 million for 2008. Total interest income decreased $3.0 million while total interest expense decreased $8.9 million.
Net interest income (on a tax-equivalent basis) increased $5.9 million, or 9%, from $62.2 million for 2007 to $68.1 million for 2008. Total interest income decreased $3.0 million while total interest expense decreased $8.9 million.
Average
interest-earning assets were $2.126 billion in 2008, an increase of $402.0
million, or 23%, from 2007. Loans
accounted for the majority of the growth, increasing by $401.0 million, or 25%,
to $2.001 billion. Interest income on loans increased $27.8 million from growth
and decreased by $30.8 million due to the impact of rates, for a net decrease of
$3.0 million versus 2007.
21
Average
interest-bearing liabilities increased $415.0 million, or 28%, to $1.884 billion
compared to $1.469 billion for 2007. The growth in interest-bearing liabilities
resulted from a $100.0 million increase in interest-bearing core deposits, a
$93.0 million increase in brokered certificates of deposit, a $5.0 million
increase in subordinated debentures, and a $147.0 million increase in borrowed
funds including FHLB advances and federal funds purchased. Secured borrowings
related to our loan participations increased $69.0 million. In December 2008, we
began utilizing the Federal Reserve discount window, due to its lower borrowing
rates. For 2008, interest expense on interest-bearing liabilities increased
$18.1 million due to growth while the impact of declining rates decreased
interest expense on interest-bearing liabilities by $27.0 million, for a net
decrease of $8.9 million versus 2007. See “Liquidity and Capital Resources” for
more information.
For the year ended
December 31, 2008, the tax-equivalent net interest rate margin was 3.20%
compared to 3.61% for 2007. The margin was compressed as a result of sharply
declining short-term rates along with an increased volume of wholesale funding
to support loan growth along with higher average levels of nonperforming loans
in 2008 versus the prior year.
Average Balance Sheet
The following table presents, for the periods indicated, certain information related to our average interest-earning assets and interest-bearing liabilities, as well as, the corresponding interest rates earned and paid, all on a tax equivalent basis.
The following table presents, for the periods indicated, certain information related to our average interest-earning assets and interest-bearing liabilities, as well as, the corresponding interest rates earned and paid, all on a tax equivalent basis.
The loans and
deposits associated with Great American are included for ten months of 2007.
Approximately $30.0 million of deposits associated with the DeSoto branch are
included for seven months of 2008.
| For the years ended December 31, | ||||||||||||||||||||||||||||||
| Restated | Restated | |||||||||||||||||||||||||||||
| 2009 | 2008 | 2007 | ||||||||||||||||||||||||||||
| Interest | Average | Interest | Average | Interest | Average | |||||||||||||||||||||||||
| Average | Income/ | Yield/ | Average | Income/ | Yield/ | Average | Income/ | Yield/ | ||||||||||||||||||||||
| (in thousands) | Balance | Expense | Rate | Balance | Expense | Rate | Balance | Expense | Rate | |||||||||||||||||||||
| Assets | ||||||||||||||||||||||||||||||
| Interest-earning assets: | ||||||||||||||||||||||||||||||
|
Taxable loans (1)
|
$ | 2,044,449 | $ | 109,451 | 5.35 | % | $ | 1,958,806 | $ | 119,018 | 6.08 | % | $ | 1,561,851 | $ | 122,522 | 7.84 | % | ||||||||||||
| Tax-exempt loans (2) | 53,826 | 4,868 | 9.04 | 42,267 | 3,850 | 9.11 | 37,745 | 3,287 | 8.71 | |||||||||||||||||||||
| Total loans | 2,098,275 | 114,319 | 5.45 | 2,001,073 | 122,868 | 6.14 | 1,599,596 | 125,809 | 7.87 | |||||||||||||||||||||
|
Taxable investments in debt and equity
securities
|
172,815 | 5,778 | 3.34 | 111,902 | 5,268 | 4.71 | 111,332 | 5,093 | 4.57 | |||||||||||||||||||||
| Non-taxable investments in debt and equity | ||||||||||||||||||||||||||||||
| securities (2) | 634 | 37 | 5.84 | 804 | 48 | 5.97 | 936 | 53 | 5.66 | |||||||||||||||||||||
| Short-term investments | 62,976 | 136 | 0.22 | 11,802 | 254 | 2.15 | 11,350 | 498 | 4.39 | |||||||||||||||||||||
| Total securities and short-term investments | 236,425 | 5,951 | 2.52 | 124,508 | 5,570 | 4.47 | 123,618 | 5,644 | 4.57 | |||||||||||||||||||||
| Total interest-earning assets | 2,334,700 | 120,270 | 5.15 | 2,125,581 | 128,438 | 6.04 | 1,723,214 | 131,453 | 7.63 | |||||||||||||||||||||
| Noninterest-earning assets: | ||||||||||||||||||||||||||||||
| Cash and due from banks | 23,959 | 40,349 | 44,417 | |||||||||||||||||||||||||||
| Other assets | 146,671 | 159,832 | 108,879 | |||||||||||||||||||||||||||
| Allowance for loan losses | (43,093 | ) | (26,880 | ) | (20,044 | ) | ||||||||||||||||||||||||
| Total assets | $ | 2,462,237 | $ | 2,298,882 | $ | 1,856,466 | ||||||||||||||||||||||||
| Liabilities and Shareholders' Equity | ||||||||||||||||||||||||||||||
| Interest-bearing liabilities: | ||||||||||||||||||||||||||||||
| Interest-bearing transaction accounts | $ | 122,563 | $ | 662 | 0.54 | % | $ | 121,371 | 1,554 | 1.28 | % | $ | 120,418 | 3,078 | 2.56 | % | ||||||||||||||
| Money market accounts | 636,350 | 6,079 | 0.96 | 687,867 | 13,786 | 2.00 | 579,029 | 23,578 | 4.07 | |||||||||||||||||||||
|
Savings
|
9,147 | 35 | 0.38 | 9,594 | 55 | 0.57 | 11,126 | 125 | 1.12 | |||||||||||||||||||||
| Certificates of deposit | 786,631 | 23,427 | 2.98 | 588,561 | 24,525 | 4.17 | 503,926 | 26,083 | 5.18 | |||||||||||||||||||||
| Total interest-bearing deposits | 1,554,691 | 30,203 | 1.94 | 1,407,393 | 39,920 | 2.84 | 1,214,499 | 52,864 | 4.35 | |||||||||||||||||||||
| Subordinated debentures | 85,081 | 5,171 | 6.08 | 58,851 | 3,536 | 6.01 | 53,500 | 3,859 | 7.21 | |||||||||||||||||||||
| Borrowed funds | 385,567 | 13,471 | 3.49 | 417,660 | 16,882 | 4.04 | 201,260 | 12,519 | 6.22 | |||||||||||||||||||||
| Total interest-bearing liabilities | 2,025,339 | 48,845 | 2.41 | 1,883,904 | 60,338 | 3.20 | 1,469,259 | 69,242 | 4.71 | |||||||||||||||||||||
| Noninterest-bearing liabilities: | ||||||||||||||||||||||||||||||
| Demand deposits | 250,435 | 221,925 | 215,610 | |||||||||||||||||||||||||||
| Other liabilities | 9,089 | 10,878 | 10,814 | |||||||||||||||||||||||||||
| Total liabilities | 2,284,863 | 2,116,707 | 1,695,683 | |||||||||||||||||||||||||||
| Shareholders' equity | 177,374 | 182,175 | 160,783 | |||||||||||||||||||||||||||
| Total liabilities & shareholders' equity | $ | 2,462,237 | $ | 2,298,882 | $ | 1,856,466 | ||||||||||||||||||||||||
| Net interest income | $ | 71,425 | $ | 68,100 | $ | 62,211 | ||||||||||||||||||||||||
| Net interest spread | 2.74 | % | 2.84 | % | 2.92 | % | ||||||||||||||||||||||||
| Net interest rate margin (3) | 3.06 | 3.20 | 3.61 | |||||||||||||||||||||||||||
| (1) |
Average
balances include non-accrual loans. The income on such loans is included
in interest but is recognized only upon receipt. Loan fees, net of
amortization of deferred loan origination fees and costs, included in
interest income are approximately $1,626,000, $1,394,000 and $690,000 for
the years ended December 31, 2009, 2008, and 2007,
respectively.
|
|
| (2) |
Non-taxable
income is presented on a fully tax-equivalent basis using the combined
statutory federal and state income tax in effect for the year. The
tax-equivalent adjustments reflected in the above table are approximately
$1,784,000, $1,417,000 and $1,204,000 for the years ended December 31,
2009, 2008, and 2007, respectively.
|
|
| (3) |
Net interest
income divided by average total interest-earning
assets.
|
22
Rate/Volume
The following table sets forth, on a tax-equivalent basis for the periods indicated, a summary of the changes in interest income and interest expense resulting from changes in yield/rates and volume.
The loans and
deposits associated with Great American are included for ten months of 2007.
Approximately $30.0 million of deposits associated with the DeSoto branch are
included for seven months of 2008.
| Restated | ||||||||||||||||||||||||
| 2009 compared to 2008 | 2008 compared to 2007 | |||||||||||||||||||||||
| Increase (decrease) due to | Increase (decrease) due to | |||||||||||||||||||||||
| (in thousands) | Volume(1) | Rate(2) | Net | Volume(1) | Rate(2) | Net | ||||||||||||||||||
| Interest earned on: | ||||||||||||||||||||||||
| Taxable loans | $ | 5,038 | $ | (14,605 | ) | $ | (9,567 | ) | $ | 27,419 | (30,923 | ) | $ | (3,504 | ) | |||||||||
| Nontaxable loans (3) | 1,045 | (27 | ) | 1,018 | 407 | 156 | 563 | |||||||||||||||||
| Taxable investments in debt | ||||||||||||||||||||||||
| and equity securities | 2,326 | (1,816 | ) | 510 | 26 | 149 | 175 | |||||||||||||||||
| Nontaxable investments in debt | ||||||||||||||||||||||||
| and equity securities (3) | (10 | ) | (1 | ) | (11 | ) | (8 | ) | 3 | (5 | ) | |||||||||||||
| Short-term investments | 281 | (399 | ) | (118 | ) | 19 | (263 | ) | (244 | ) | ||||||||||||||
| Total interest-earning assets | $ | 8,680 | $ | (16,848 | ) | $ | (8,168 | ) | $ | 27,863 | $ | (30,878 | ) | $ | (3,015 | ) | ||||||||
| Interest paid on: | ||||||||||||||||||||||||
| Interest-bearing transaction accounts | $ | 15 | $ | (907 | ) | $ | (892 | ) | 24 | (1,548 | ) | (1,524 | ) | |||||||||||
| Money market accounts | (964 | ) | (6,743 | ) | (7,707 | ) | 3,824 | (13,616 | ) | (9,792 | ) | |||||||||||||
| Savings | (3 | ) | (17 | ) | (20 | ) | (15 | ) | (55 | ) | (70 | ) | ||||||||||||
| Certificates of deposit | 6,979 | (8,077 | ) | (1,098 | ) | 3,986 | (5,544 | ) | (1,558 | ) | ||||||||||||||
| Subordinated debentures | 1,594 | 41 | 1,635 | 362 | (685 | ) | (323 | ) | ||||||||||||||||
| Borrowed funds | (1,233 | ) | (2,178 | ) | (3,411 | ) | 9,905 | (5,542 | ) | 4,363 | ||||||||||||||
| Total interest-bearing liabilities | 6,388 | (17,881 | ) | (11,493 | ) | 18,086 | (26,990 | ) | (8,904 | ) | ||||||||||||||
| Net interest income | $ | 2,292 | $ | 1,033 | $ | 3,325 | $ | 9,777 | $ | (3,888 | ) | $ | 5,889 | |||||||||||
| (1) |
Change in
volume multiplied by yield/rate of prior period.
|
|
| (2) |
Change in
yield/rate multiplied by volume of prior period.
|
|
| (3) |
Nontaxable
income is presented on a fully tax-equivalent basis using the combined
statutory federal and state income tax rate in effect for each
year.
|
|
|
NOTE: The
change in interest due to both rate and volume has been allocated to rate
and volume changes in proportion to the relationship of the absolute
dollar amounts of the change in
each.
|
Provision for loan losses. The provision for loan losses was $40.4
million for 2009 compared to $26.5 million for 2008. The increase was due to an
increase in nonperforming loans and adverse risk rating changes primarily in the
residential and commercial real estate portfolios.
The provision for
loan losses was $26.5 million for 2008 compared to $5.1 million for 2007. The
increase was due to strong loan growth, an increase in nonperforming loans and
adverse risk rating changes primarily in the residential builder
portfolio.
See the sections
below captioned “Loans” And “Allowance for Loan Losses” for more information on
our loan portfolio and asset quality.
Noninterest Income
The following table presents a comparative summary of the major components of noninterest income.
The following table presents a comparative summary of the major components of noninterest income.
| Years ended December 31, | ||||||||||||||||||||
| Change 2009 | Change 2008 | |||||||||||||||||||
| (in thousands) | 2009 | 2008 | 2007 | over 2008 | over 2007 | |||||||||||||||
| Wealth Management revenue | $ | 4,524 | $ | 5,916 | $ | 7,159 | $ | (1,392 | ) | $ | (1,243 | ) | ||||||||
| Service charges on deposit accounts | 5,012 | 4,376 | 3,228 | 636 | 1,148 | |||||||||||||||
| Other service charges and fee income | 963 | 1,000 | 852 | (37 | ) | 148 | ||||||||||||||
| Sale of branches/charter | - | 3,400 | - | (3,400 | ) | 3,400 | ||||||||||||||
| Sale of other real estate | (436 | ) | 552 | (48 | ) | (988 | ) | 600 | ||||||||||||
| State tax credit activity, net | 1,035 | 4,201 | 792 | (3,166 | ) | 3,409 | ||||||||||||||
| Sale of securities | 955 | 161 | 233 | 794 | (72 | ) | ||||||||||||||
| Extinguishment of debt | 7,388 | - | - | 7,388 | - | |||||||||||||||
| Miscellaneous income | 436 | 735 | 636 | (299 | ) | 99 | ||||||||||||||
| Total noninterest income | $ | 19,877 | $ | 20,341 | $ | 12,852 | $ | (464 | ) | $ | 7,489 | |||||||||
23
Comparison 2009 vs. 2008
Noninterest income decreased 2% during 2009. The 2009 results include a $7.4 million pre-tax gain from the extinguishment of debt. See Item 8, Note 2 – Loan Participation Restatement for more information. The 2008 results include a $3.4 million pre-tax gain on the sale of the Great American charter along with the Desoto, Kansas and the Liberty, Missouri branches. Excluding these amounts, noninterest income decreased $4.5 million, or 26%, during 2009. This decrease is mainly due to lower wealth management revenue and lower gains from the state tax credit activities.
Noninterest income decreased 2% during 2009. The 2009 results include a $7.4 million pre-tax gain from the extinguishment of debt. See Item 8, Note 2 – Loan Participation Restatement for more information. The 2008 results include a $3.4 million pre-tax gain on the sale of the Great American charter along with the Desoto, Kansas and the Liberty, Missouri branches. Excluding these amounts, noninterest income decreased $4.5 million, or 26%, during 2009. This decrease is mainly due to lower wealth management revenue and lower gains from the state tax credit activities.
Wealth Management
revenue from the Trust division decreased $1.4 million, or 24%. The revenue
declines were primarily due to lower average asset values from net client
attrition and adverse financial markets in late 2008 and early 2009. Assets
under administration were $1.3 billion at December 31, 2009, a $59 million, or
5% increase from one year ago due to stronger fourth quarter financial
markets.
Increases in Service
charges on deposit accounts were primarily due to the declining earnings
crediting rate on commercial accounts, which increased service charges
earned.
In 2009, we sold
$22.3 million of other real estate at a loss of $436,000. In 2008, we sold $7.9
million of other real estate at a gain of $552,000.
Gains from state tax
credit brokerage activities were $1.0 million in 2009, compared to $4.2 million
in 2008. The $3.2 million decrease is primarily due to a $5.9 million negative
fair value adjustment on the tax credit assets offset by a $2.1 million increase
in the fair value adjustment on the related interest rate caps used to
economically hedge the tax credits and a $660,000 increase from the sale of
state tax credits to clients.
In 2009, given the
anticipated acceleration in prepayments on mortgage-backed securities and
resultant loss in fair value, we elected to sell and reinvest a portion of our
investment portfolio. We sold approximately $49.0 million of agency mortgage
backed securities realizing a gain of $955,000 on these sales. With the proceeds
from the securities sales, certain borrowings and excess cash, we purchased
approximately $272.0 million of fixed rate agency mortgage backed, floating rate
Small Business Administration securities and Municipal securities in
2009.
In 2009, we recorded
a $7.4 million pre-tax gain from the extinguishment of debt resulting from the
foreclosure of one of our participated loans and the amendment of all
participation agreements. See Item 8, Note 2 – Loan Participation Restatement
for more information on the accounting treatment of the loan
participations.
The decrease in
Miscellaneous income resulted from a $530,000 loss realized in 2009 from the
termination of two interest rate swaps and a $638,500 gain recognized in 2008
for ineffectiveness related to a terminated cash flow hedge. See Item 8, Note 8
– Derivative Financial Instruments for more information.
Our ratio of
noninterest income to total revenue was 22% for the year ended December 31, 2009
compared to 23% for the year ended December 31, 2008.
Comparison 2008 vs. 2007
Noninterest income increased 58% during 2008. Our ratio of noninterest income to total revenue at December 31, 2008 was 23%, compared to 17% in 2007.
Noninterest income increased 58% during 2008. Our ratio of noninterest income to total revenue at December 31, 2008 was 23%, compared to 17% in 2007.
Wealth Management
revenue decreased $1.2 million, or 17%, from 2007. This decrease is a result of
lower revenue and margins from the Trust division due to the declining market
value of assets under management and client attrition related to advisor
turnover. Assets under administration were $1.2 billion at December 31, 2008, a
28% decrease from 2007.
Increases in Service
charges on deposit accounts were primarily due to the declining earnings
crediting rate on commercial accounts, which increased service charges earned.
Other service charges and fee income increases were the result of higher fee
volumes on debit cards, merchant processing, and fee income from our
International Banking operation.
In 2008, gain on sale
of branches/charter includes a $550,000 pre-tax gain on the sale of the Liberty
branch and a $2.8 million pre-tax gain on the sale of the Great American charter
along with the Desoto Kansas branch.
In 2008, we sold $7.9
million of other real estate at a net gain of $552,000. In 2007, we sold $5.6
million of other real estate at a net loss of $48,000.
24
In the fourth quarter
of 2007, we signed an agreement whereby we will purchase the rights to receive
ten-year streams of state tax credits at agreed upon discount rates and then
re-sell them to our clients for a profit. Gains from state tax credit brokerage
activities were $4.2 million in 2008, compared to $792,000 in 2007. Of the 2008
total, $3.1 million represented the net effects from fair value adjustments on
the tax credit assets and related interest rate caps used to economically hedge
the tax credits. The remaining increase of $1.1 million reflects the full year
of the brokerage activity compared to a partial year in 2007 and was consistent
with the Company’s performance expectations for its first full year of
operations.
Noninterest Expense
The following table presents a comparative summary of the major components of noninterest expense.
The following table presents a comparative summary of the major components of noninterest expense.
| Years ended December 31, | ||||||||||||||||||
| Change 2009 | Change 2008 | |||||||||||||||||
| (in thousands) | 2009 | 2008 | 2007 | over 2008 | over 2007 | |||||||||||||
| Employee compensation and benefits | $ | 25,969 | $ | 27,656 | $ | 27,412 | $ | (1,687 | ) | $ | 244 | |||||||
| Occupancy | 4,709 | 3,985 | 3,651 | 724 | 334 | |||||||||||||
| Furniture and equipment | 1,425 | 1,390 | 1,366 | 35 | 24 | |||||||||||||
| Data processing | 2,147 | 2,139 | 1,873 | 8 | 266 | |||||||||||||
| Communications | 556 | 536 | 502 | 20 | 34 | |||||||||||||
| Director related expense | 459 | 481 | 409 | (22 | ) | 72 | ||||||||||||
| Meals and entertainment | 1,037 | 1,181 | 1,317 | (144 | ) | (136 | ) | |||||||||||
| Marketing and public relations | 504 | 674 | 622 | (170 | ) | 52 | ||||||||||||
| FDIC and other insurance | 4,204 | 1,617 | 911 | 2,587 | 706 | |||||||||||||
| Amortization of intangibles | 482 | 599 | 692 | (117 | ) | (93 | ) | |||||||||||
| Goodwill impairment charges | 45,377 | - | - | 45,377 | - | |||||||||||||
| Postage, courier, and armored car | 772 | 863 | 891 | (91 | ) | (28 | ) | |||||||||||
| Professional, legal, and consulting | 2,278 | 1,971 | 1,417 | 307 | 554 | |||||||||||||
| Loan, legal and other real estate expense | 4,788 | 1,717 | 501 | 3,071 | 1,216 | |||||||||||||
| Other taxes | 566 | 542 | 471 | 24 | 71 | |||||||||||||
| Other | 3,154 | 3,425 | 2,660 | (271 | ) | 765 | ||||||||||||
| Total noninterest expense | $ | 98,427 | $ | 48,776 | $ | 44,695 | $ | 49,651 | $ | 4,081 | ||||||||
Comparison of 2009 vs. 2008
Noninterest expense increased $49.7 million, or 102%, in 2009. The increase was primarily due to a $45.4 million goodwill impairment charge associated with the banking segment. Excluding the goodwill impairment charge, noninterest expenses increased $4.3 million, or 9%. The Company’s efficiency ratio for 2009 was 110%. Excluding the goodwill impairment charge, the efficiency ratio was 59%, compared to 56% in 2008.
Noninterest expense increased $49.7 million, or 102%, in 2009. The increase was primarily due to a $45.4 million goodwill impairment charge associated with the banking segment. Excluding the goodwill impairment charge, noninterest expenses increased $4.3 million, or 9%. The Company’s efficiency ratio for 2009 was 110%. Excluding the goodwill impairment charge, the efficiency ratio was 59%, compared to 56% in 2008.
Employee compensation and benefits.
Employee compensation and
benefits decreased $1.7 million, or 6%, over 2008. Included in the 2008 results
are expenses of $1.0 million related to the final stock payment pursuant to the
expiration of an executive retention agreement associated with the acquisition
of Great American. Excluding this amount, employee compensation and benefits
decreased $687,000 or 3%, primarily due to headcount reductions and stringent
controls on staffing and compensation levels.
All other expense categories.
All other expense
categories include $45.4 million for the goodwill impairment charge associated
with the banking segment. Excluding this charge, all other expense categories
increased $6.0 million, or 28%, over 2008.
Occupancy expense
increases were due to scheduled rent increases on various Company facilities and
expenses related to a new Wealth Management location which was occupied in the
fourth quarter of 2008.
FDIC and other
insurance increased $2.6 million primarily due to additional FDIC premiums for
the FDIC special assessment and newly implemented rate structure. On December
29, 2009, we were required to prepay an estimated quarterly risk-based
assessment for fourth quarter 2009 and for all of 2010, 2011 and 2012. The
prepayment amount was $11.5 million, which will be expensed over the subsequent
three years. See “Supervision and Regulation – Deposit Insurance Fund” in Part I
– Item I for more information.
Professional, legal
and consulting increased due to various legal and consulting projects related to
new federal regulations, compensation committee assistance, board governance,
significant accounting issues and litigation defense.
25
Loan legal and other
real estate expense increased $3.1 million due to increased levels of
nonperforming loans and other real estate properties. The increase includes $2.4
million of fair value adjustments on other real estate due to the softening real
estate markets for both residential and commercial properties.
Comparison of 2008 vs. 2007
Noninterest expenses
increased $4.0 million, or 9%, in 2008. The Company’s efficiency ratio for 2008
is 56% compared to 61% in 2007.
Employee compensation and benefits.
Employee compensation and
benefits increased $244,000, or 1%, over 2007. Included in the increase is $1.0
million related to the final stock payment pursuant to the expiration of an
executive retention agreement associated with the acquisition of Great American.
Excluding this charge, employee compensation and benefits decreased $756,000 or
3% due to lower variable compensation expenses driven by Company financial
results.
All other expense categories.
All other expense
categories increased $3.8 million or 22% over 2007.
Occupancy expense
increases were due to scheduled rent increases on various Company facilities
along with leasehold improvements completed at the Operations Center and our
Clayton headquarters.
Furniture and
equipment increases were due to expansion at the Operations Center and in the
Kansas City region.
Data processing
expenses increased due to upgrades to the Company’s main operating system,
licensing fee increases for our core banking system as a result of our increased
asset size and increased maintenance fees for various Company
systems.
Meals and
entertainment expenses decreased due to less travel and controlled
customer-related entertainment expenses.
FDIC and other
insurance increased $706,000 due to higher FDIC insurance premiums (due to a
higher rate structure imposed by the FDIC on all insured financial
institutions.) Professional, legal and consulting increased due to the Arizona
de novo bank activities, consulting services in Wealth Management and various
legal matters.
Increases in Loan
legal and other real estate expenses were due to increased levels of
nonperforming loans and other real estate properties.
Discontinued Operations
On January 20, 2010,
we sold Millennium to an investor group led mostly by former managers of
Millennium for $4.0 million in cash, resulting in a $1.6 million pre-tax loss.
As a result of the sale, we have reclassified the results of Millennium for the
current and prior periods to discontinued operations. The amount of the loss on
the sale is primarily due to the write-off of the remaining goodwill associated
with the Millennium reporting unit.
For 2009, net loss
from discontinued operations was $1.3 million, compared to a net loss of $6.2
million from discontinued operations in 2008 and $1.3 million of net income from
discontinued operations in 2007. The 2008 loss includes $9.2 million of pre-tax
goodwill impairment charges. Lower levels of paid premium sales and lower sales
margins over the last two years significantly reduced Millennium’s operating
results.
Income Taxes
In 2009, the Company
recorded income tax benefit of $3.4 million on a pre-tax loss of $51.3 million,
resulting in an effective tax rate of (6.6%). The goodwill impairment charge of
$45.4 million was not tax-deductible. The pre-tax loss includes a loss of $1.6
million related to the sale of Millennium which is reported as discontinued
operations for all periods. The following items were included in Income tax
(benefit) expense and impacted the 2009 effective tax rate:
- the expiration of the statute of
limitations for the 2005 tax year warranted the release of $324,000 of
reserves related to certain state tax positions;
- reserves associated with various
tax benefits of $115,000 related to certain federal tax items were
released;
- recognition of federal tax benefits of $720,000 related to low income housing tax credits from a limited partnership interest.
26
In 2008, the Company
recorded income tax expense of $1.6 million on pre-tax income of $6.0 million,
resulting in an effective tax rate of 26.3%. The following items were included
in Income tax expense and impacted the 2008 effective tax rate:
- the expiration of the statute of
limitations for the 2004 tax year warranted the release of $436,000 of
reserves related to certain state tax positions;
- reserves associated with various
tax benefits of $80,000 related to certain federal tax items were released;
and
- recognition of federal tax benefits of $511,000 related to low income housing tax credits from a limited partnership interest.
Fourth Quarter 2009
Discussion
Fourth quarter 2009 net income from continuing operations was $380,000 compared to a net loss from continuing operations of $3.4 million for the prior year period. After deducting dividends on preferred stock, the Company reported a net loss available to common shareholders of $0.02 per diluted share for the fourth quarter of 2009 compared to net loss available to common shareholders of $0.28 per diluted share for the fourth quarter of 2008.
Fourth quarter 2009 net income from continuing operations was $380,000 compared to a net loss from continuing operations of $3.4 million for the prior year period. After deducting dividends on preferred stock, the Company reported a net loss available to common shareholders of $0.02 per diluted share for the fourth quarter of 2009 compared to net loss available to common shareholders of $0.28 per diluted share for the fourth quarter of 2008.
Including
discontinued operations, the Company reported a net loss of $1.5 million, or
$0.12 per diluted share, for the fourth quarter of 2009, compared to a net loss
of $5.4 million, or $0.43 per share, for the fourth quarter of
2008.
The tax-equivalent
net interest rate margin was 3.15% for the fourth quarter of 2009 as compared to
3.09% for the same period in 2008. Net interest income in the fourth quarter of
2009 increased $531,000 from the fourth quarter of 2008. This increase in net
interest income was the result of a $4.2 million decrease in interest expense
offset by a $3.7 million decrease in interest income. The yield on average
interest-earning assets decreased from 5.60% during the fourth quarter of 2008
to 4.89% during the same period in 2009. The decline was primarily due to higher
levels of securities and short-term investments as a percentage of earning
assets and higher levels of nonperforming loans. The cost of interest-bearing
liabilities decreased from 2.82% for the fourth quarter of 2008 to 2.06% for the
same period in 2009.
The provision for
loan losses was $8.4 million for the fourth quarter of 2009 compared to $6.5
million for the third quarter of 2009, and $16.3 million in the fourth quarter
of 2008. Changes in the provision for loan losses from quarter to quarter are
due to changes in loan risk ratings. Additional provision is the result of
increases in adverse loan risk rating changes, while decreases are the result of
fewer adverse loan risk rating changes. Provision for loan losses on the
participated loan balances were $349,000 in the fourth quarter of 2009, compared
to ($420,000) in the third quarter of 2009, and $2.2 million in the fourth
quarter of 2008.
Noninterest income
was $4.2 million during the fourth quarter of 2009, a $1.9 million decrease over
noninterest income of $6.1 million for the same period in 2008. The decrease is
due to state tax credit brokerage activities which generated $62,000 in gains in
the fourth quarter of 2009 versus $2.6 million in the fourth quarter of 2008.
While sales activity remained strong, as the Company generated $975,000 in gains
from the sale of state tax credits in the fourth quarter of 2009 compared to
$708,000 in the prior year period, recording the tax credit assets and related
interest rate hedges to fair value offset $913,000 of the sales gains in the
fourth quarter.
Other items
contributing to the decrease include declining Trust revenues, additional losses
on Other real estate and a decrease in Other income related to a 2008 gain
reclassified from accumulated other comprehensive income to earnings for
measured ineffectiveness of cash flow hedges. Offsetting these decreases was
$2.1 million gain from the extinguishment of debt related to the accounting for
loan participations.
Noninterest expenses
were $13.7 million during the fourth quarter of 2009 versus $13.3 million during
the same period in 2008.
Income tax benefit
related to continuing operations was $372,000 during the fourth quarter of 2009
compared to $2.9 million in the same period in 2008. The effective tax rate was
(46.5%) for the fourth quarter of 2009 compared to (45.4%) for the fourth
quarter of 2008.
27
FINANCIAL CONDITION
Comparison for December 31, 2009 and 2008
Total assets at December 31, 2009 were $2.37 billion compared to $2.49 billion at December 31, 2008, a decrease of $128.0 million, or 5%. Loan participations of $224.0 million were included in Total assets at December 31, 2008. These assets were removed from the balance sheet as of December 31, 2009.
Excluding the impact
of loan participations, total assets increased $96.0 million, or 4% during 2009.
The increase was primarily driven by a $186.0 million increase in securities
available for sale and a $64.0 million increase in cash and cash equivalents,
partially offset by a $143.9 million, or 7%, decrease in loans.
Investments were
$295.7 million at December 31, 2009 compared to $108.3 million at December 31,
2008. In 2009, the portfolio grew with additions to the government sponsored
agency debentures, mortgage backed securities (including CMO's) and government
guaranteed securities. We also began to build a portfolio of tax free municipal
securities.
Goodwill and
intangible assets were $2.6 million at December 31, 2009, compared to $52.0
million at December 31, 2008, a decrease of $49.4 million. The decrease in
goodwill and intangible assets was due to $45.4 million of impairment charges
related to the Banking segment and the write-off of the remaining Millennium
goodwill and intangible as a result of the Millennium sale. See Item 8, Note 10
– Goodwill and Intangible Assets for more information.
At December 31, 2009,
Other assets included $11.5 million of prepaid FDIC insurance and $8.5 million
of indemnification receivable from the FDIC as a result of our Arizona
acquisition.
At December 31, 2009,
deposits were $1.94 billion, an increase of $149.0 million, or 8%, from $1.79
billion at December 31, 2008. Total brokered CD’s at December 31, 2009 were
$156.0 million compared to $336.0 million at December 31, 2008, a decrease of
$180.0 million. Excluding brokered deposits, core deposits increased $328.0
million, or 23%, in 2009.
Other borrowings at
December 31, 2008 contain $227.0 million of secured borrowing related to the
loan participations. These secured borrowings were removed from the balance
sheet as of December 31, 2009.
At December 31, 2008,
the Company had $0 outstanding on its $16.0 million line of credit. The line of
credit expired in April 2009 and we did not replace this line of credit in 2009.
We believe our current level of cash at the holding company will be sufficient
to meet all projected cash needs in 2010. See “Liquidity and Capital Resources”
for more information.
On December 19, 2008,
the Company sold 35,000 shares of preferred stock and a warrant to purchase
324,074 shares of EFSC common stock, for an aggregate investment by the U.S.
Treasury of $35.0 million. See Item 8, Note 5 – Preferred Stock and Common Stock
Warrants for more information. On January 25, 2010, the Company completed the
sale of 1,931,610 shares, or $15.0 million of its common stock in a private
placement offering.
Loans
Total loans, less unearned loan fees, decreased $368.0 million, or 17% during 2009. Net of loan participations, loans outstanding declined $139.0 million, or 7%. The Company’s lending strategy emphasizes commercial, residential real estate, real estate construction and commercial real estate loans to small and medium sized businesses and their owners in the St. Louis, Kansas City and Phoenix metropolitan markets. Consumer lending is minimal. Weak loan demand and lower line usage due to the stressed real estate markets, business deleveraging, and lackluster local economies, along with higher net charge-offs all contributed to the decline in loan balances.
Total loans, less unearned loan fees, decreased $368.0 million, or 17% during 2009. Net of loan participations, loans outstanding declined $139.0 million, or 7%. The Company’s lending strategy emphasizes commercial, residential real estate, real estate construction and commercial real estate loans to small and medium sized businesses and their owners in the St. Louis, Kansas City and Phoenix metropolitan markets. Consumer lending is minimal. Weak loan demand and lower line usage due to the stressed real estate markets, business deleveraging, and lackluster local economies, along with higher net charge-offs all contributed to the decline in loan balances.
A common underwriting
policy is employed throughout the Company. Lending to small and medium sized
businesses is riskier from a credit perspective than lending to larger
companies, but the risk is appropriately considered with higher loan pricing and
ancillary income from cash management activities. As additional risk mitigation,
the Company will generally hold only $10.0 million or less of aggregate credit
exposure (both direct and indirect) with one borrower, in spite of a legal
lending limit of over $60.0 million. There are five borrowing relationships
where we have committed more than $10.0 million with the largest being a $20.0
million line of credit with minimal usage. For the $1.8 billion loan portfolio,
the Company’s average loan relationship size was just under $1.0 million, and
the average note size was under $500,000.
28
The Company also buys
and sells loan participations with other banks to help manage its credit
concentration risk. At December 31, 2009 the Company had purchased $264.0
million ($176.0 million outstanding) and had sold $382.0 million ($293.0 million
outstanding.) Approximately 50 borrowers make up our participations purchased,
with an average outstanding loan balance of $3.5 million. Eighteen
relationships, or $91.9 million of the $176.0 million in participations
purchased, met the definition of a “Shared National Credit”; however, only three
of the relationships, or $12.8 million, were considered out of our
market.
The following table
sets forth the composition of the Company’s loan portfolio by type of loans as
reported in the quarterly Federal Financial Institutions Examination Council
Report of Condition and Income (“Call report”) at the dates indicated. A review
of our Call report data during the preparation of our regulatory reports
resulted in some immaterial changes between loan types. Therefore, the data
presented below and in our Call report is different than the data presented in
our 2009 earnings press release on Form 8-K dated January 26, 2010.
| December 31, | ||||||||||||||||||||
| Restated | Restated | Restated | Restated | |||||||||||||||||
| (in thousands) | 2009 | 2008 | 2007 | 2006 | 2005 | |||||||||||||||
| Commercial and industrial | $ | 558,016 | $ | 675,216 | $ | 549,479 | $ | 380,065 | $ | 278,996 | ||||||||||
| Real estate: | ||||||||||||||||||||
| Commercial | 820,248 | 887,963 | 720,072 | 597,547 | 424,390 | |||||||||||||||
| Construction | 224,389 | 378,092 | 301,710 | 207,189 | 151,185 | |||||||||||||||
| Residential | 214,067 | 235,019 | 175,258 | 156,109 | 157,115 | |||||||||||||||
| Consumer and other | 16,540 | 25,167 | 37,759 | 35,542 | 36,616 | |||||||||||||||
| Total Loans | $ | 1,833,260 | $ | 2,201,457 | $ | 1,784,278 | $ | 1,376,452 | $ | 1,048,302 | ||||||||||
| December 31, | ||||||||||||||||||||
| Restated | Restated | Restated | Restated | |||||||||||||||||
| 2009 | 2008 | 2007 | 2006 | 2005 | ||||||||||||||||
| Commercial and industrial | 30.4 | % | 30.7 | % | 30.8 | % | 27.6 | % | 26.6 | % | ||||||||||
| Real estate: | ||||||||||||||||||||
| Commercial | 44.7 | % | 40.3 | % | 40.4 | % | 43.4 | % | 40.5 | % | ||||||||||
| Construction | 12.2 | % | 17.2 | % | 16.9 | % | 15.1 | % | 14.4 | % | ||||||||||
| Residential | 11.7 | % | 10.7 | % | 9.8 | % | 11.3 | % | 15.0 | % | ||||||||||
| Consumer and other | 1.0 | % | 1.1 | % | 2.1 | % | 2.6 | % | 3.5 | % | ||||||||||
| Total Loans | 100.0 | % | 100.0 | % | 100.0 | % | 100.0 | % | 100.0 | % | ||||||||||
Commercial and
industrial loans are made based on the borrower’s character, experience, general
credit strength, and ability to generate cash flows for repayment from income
sources, even though such loans may also be secured by real estate or other
assets. Only $11.1 million of this balance at December 31, 2009 was unsecured.
The credit risk related to commercial loans is largely influenced by general
economic conditions and the resulting impact on a borrower’s operations.
Commercial and industrial loans are primarily made to borrowers operating within
the manufacturing industry.
Real estate loans are
also based on the borrower’s character, but more emphasis is placed on the
estimated collateral values.
Approximately $318.0
million, or 17%, of commercial real estate loans were owner-occupied by
commercial and industrial businesses where the primary source of repayment is
dependent on sources other than the underlying collateral. Multifamily
properties and other commercial properties on which income from the property is
the primary source of repayment represent the balance of this category. The
majority of this category of loans is secured by commercial and multi-family
properties located within our two primary metropolitan markets. These loans are
underwritten based on the cash flow coverage of the property, typically meet the
Company’s loan to value guidelines, and generally require either the limited or
full guaranty of principal sponsors of the credit.
Real estate
construction loans, relating to residential and commercial properties, represent
financing secured by raw ground or real estate under development for eventual
sale. Approximately $48.0 million of these loans include the use of interest
reserves and follow standard underwriting guidelines. Construction projects are
monitored by the officer and a centralized independent loan disbursement
function is employed. Given the weak demand and stress in both the residential
and commercial real estate markets, the Company reduced the level of these loan
types in 2009.
29
Residential real
estate loans include residential mortgages, which are loans that, due to size,
do not qualify for conventional home mortgages that the Company sells into the
secondary market, second mortgages and home equity lines. Residential mortgage
loans are usually limited to a maximum of 80% of collateral value.
Consumer and other
loans represent loans to individuals on both a secured and unsecured basis.
Credit risk is mitigated by thoroughly reviewing the creditworthiness of the
borrowers prior to origination.
Following is a
further breakdown of our loan categories using Call report codes at December 31,
2009:
| % of portfolio | ||||||
| Restated | ||||||
| 2009 | 2008 | |||||
| Real Estate: | ||||||
| Construction & Land Development | 12 | % | 18 | % | ||
| Commercial Owner Occupied | ||||||
| Commercial & Industrial | 19 | % | 15 | % | ||
|
Churches/ Schools/ Nursing
Homes/ Other
|
1 | % | 1 | % | ||
| Total | 20 | % | 16 | % | ||
| Commercial Non Owner Occupied | ||||||
| Retail | 8 | % | 6 | % | ||
| Commercial Office | 7 | % | 6 | % | ||
| Multi-Family Housing | 5 | % | 4 | % | ||
|
Industrial/
Warehouse
|
3 | % | 3 | % | ||
|
Churches/ Schools/ Nursing
Homes/ Other
|
2 | % | 2 | % | ||
| Total | 25 | % | 21 | % | ||
| Residential: | ||||||
| Owner Occupied | 8 | % | 7 | % | ||
| Non Owner Occupied | 4 | % | 3 | % | ||
| Total | 12 | % | 10 | % | ||
| Total Real Estate | 69 | % | 65 | % | ||
| Non Real Estate | ||||||
| Commercial & Industrial | 30 | % | 34 | % | ||
| Consumer & Other | 1 | % | 1 | % | ||
| 31 | % | 35 | % | |||
| 100 | % | 100 | % | |||
The Construction and
Land Development category represents $224.4 million, or 12%, of the total loan
portfolio. Within that category, there was $24.1 million of loans secured by raw
ground, $99.4 million of commercial construction, $99.9 million of residential
construction, and $1.0 million of mixed use construction.
The commercial
construction component of the portfolio consisted of approximately 80 loan
relationships with an average outstanding loan balance of $1.2 million. The
largest loans were an $8.0 million line of credit secured by commercially zoned
land in St. Louis, a $5.8 million fixed line secured by commercially zoned land
in Kansas City, and a $5.3 million development loan for construction of a hotel
in Phoenix, Arizona.
The residential
construction component of the portfolio consists of single family housing
development properties primarily in our St. Louis and Kansas City markets. There
were approximately 140 loan relationships in this category with an average
outstanding loan balance of $713,000. The largest loan was a $5.9 million
residential development in Kansas City.
30
The largest segments
of the non-owner occupied components of the commercial real estate portfolio are
retail and commercial office permanent loans. At December 31, 2009, we had
$149.8 million of non-owner occupied permanent loans secured by retail
properties. There were approximately 100 loan relationships in this category
with an average outstanding loan balance of $1.5 million. The three largest
loans outstanding at year end were an $8.8 million loan secured by various
retail properties in Kansas City, an $8.3 million loan secured by a retail strip
center in St. Louis, and a $6.9 million loan secured by a single tenant retail
store in Florida.
Vacancy rates for
retail space in the St. Louis and Kansas City markets totaled 9.8% and 9.0%,
respectively at year end, as compared to the national retail vacancy rate of
12.4%.
At December 31, 2009,
we had $134.9 million of non-owner occupied permanent loans secured by
commercial office properties. There were approximately 90 loan relationships
with an average outstanding loan balance of $1.5 million. The three largest
loans outstanding at year end were an $8.8 million loan secured by a single
tenant office building in Kansas City, a $7.9 million loan secured by several
office properties in Kansas City, and a $7.4 million loan secured by an office
building in St. Louis.
Vacancy rates for
commercial office space in the St. Louis and Kansas City markets totaled 15.6%
and 16.9%, respectively at year end, as compared to the national commercial
office vacancy rate of 16.3%.
Factors that are
critical to managing overall credit quality are sound loan underwriting and
administration, systematic monitoring of existing loans and commitments, early
identification of potential problems, an adequate allowance for loan losses, and
sound non-accrual and charge-off policies.
Significant loan
concentrations are considered to exist for a financial institution when there
are amounts loaned to numerous borrowers engaged in similar activities that
would cause them to be similarly impacted by economic or other conditions. At
December 31, 2009, no significant concentrations exceeding 10% of total loans
existed in the Company's loan portfolio, except as described above.
31
Loans at December 31,
2009 mature or reprice as follows:
| Loans Maturing or Repricing | ||||||||||||
| After One | ||||||||||||
| In One | Through | After | ||||||||||
| (in thousands) | Year or Less | Five Years | Five Years | Total | ||||||||
| Fixed Rate Loans (1) | ||||||||||||
| Commercial and industrial | $ | 79,249 | $ | 120,855 | $ | 7,535 | $ | 207,639 | ||||
| Real estate: | ||||||||||||
| Commercial | 197,842 | 377,561 | 25,046 | 600,449 | ||||||||
| Construction | 71,107 | 18,836 | 9,997 | 99,940 | ||||||||
| Residential | 49,045 | 70,085 | 854 | 119,984 | ||||||||
| Consumer and other | 3,296 | 1,629 | 0 | 4,925 | ||||||||
| Total | $ | 400,539 | $ | 588,966 | $ | 43,432 | $ | 1,032,937 | ||||
| Variable Rate Loans (1)(2) | ||||||||||||
| Commercial and industrial | $ | 350,377 | $ | - | $ | - | $ | 350,377 | ||||
| Real estate: | ||||||||||||
| Commercial | 219,799 | - | - | 219,799 | ||||||||
| Construction | 124,449 | - | - | 124,449 | ||||||||
| Residential | 94,083 | - | - | 94,083 | ||||||||
| Consumer and other | 11,615 | - | - | 11,615 | ||||||||
| Total | $ | 800,323 | $ | - | $ | - | $ | 800,323 | ||||
| Loans (1)(2) | ||||||||||||
| Commercial and industrial | $ | 429,626 | $ | 120,855 | $ | 7,535 | $ | 558,016 | ||||
| Real estate: | ||||||||||||
| Commercial | 417,641 | 377,561 | 25,046 | 820,248 | ||||||||
| Construction | 195,556 | 18,836 | 9,997 | 224,389 | ||||||||
| Residential | 143,128 | 70,085 | 854 | 214,067 | ||||||||
| Consumer and other | 14,911 | 1,629 | 0 | 16,540 | ||||||||
| Total | $ | 1,200,862 | $ | 588,966 | $ | 43,432 | $ | 1,833,260 | ||||
| (1) | Loan balances include unearned loan (fees) costs, net. | |
| (2) | Not adjusted for impact of interest rate swap agreements. |
Fixed rate loans
comprise approximately 56% of the loan portfolio at December 31, 2009 and 47% at
December 31, 2008. However, most of this increase in fixed rate loans matures or
reprices within one year. Variable rate loans are based on the prime rate or the
London Interbank Offered Rate (“LIBOR”). The Bank’s “prime rate” has been 4.00%
since late 2008 when the Federal Reserve lowered the targeted Fed Funds rate to
0.25%. Some of the variable rate loans also use the “Wall Street Journal Prime
Rate” which has been 3.25% since late 2008. Most loan originations have one to
three year maturities. While the loan relationship has a much longer life, the
shorter maturities allow the Company to revisit the underwriting and pricing on
each relationship periodically. Management monitors this mix as part of its
interest rate risk management. See “Interest Rate Risk” section.
Of the $417.6 million
of commercial real estate loans maturing in one year or less, $172.4 million or
41% represents loans secured by non-owner occupied commercial
properties.
Allowance for Loan Losses
The loan portfolio is the primary asset subject to credit risk. Credit risk is controlled and monitored through the use of lending standards, a thorough review of potential borrowers, and ongoing review of loan payment performance. Active asset quality administration, including early problem loan identification and timely resolution of problems, further ensures appropriate management of credit risk. Credit risk management for each loan type is discussed briefly in the section entitled “Loans.”
The loan portfolio is the primary asset subject to credit risk. Credit risk is controlled and monitored through the use of lending standards, a thorough review of potential borrowers, and ongoing review of loan payment performance. Active asset quality administration, including early problem loan identification and timely resolution of problems, further ensures appropriate management of credit risk. Credit risk management for each loan type is discussed briefly in the section entitled “Loans.”
32
The allowance for
loan losses represents management’s estimate of an amount adequate to provide
for probable credit losses in the loan portfolio at the balance sheet date.
Various quantitative and qualitative factors are analyzed and provisions are
made to the allowance for loan losses. Such provisions are reflected in our
consolidated statements of income. The evaluation of the adequacy of the
allowance for loan losses is based on management’s ongoing review and grading of
the loan portfolio, consideration of past loss experience, trends in past due
and nonperforming loans, risk characteristics of the various classifications of
loans, existing economic conditions, the fair value of underlying collateral,
and other factors that could affect probable credit losses. Assessing these
numerous factors involves significant judgment and could be significantly
impacted by the current economic conditions. Management considers the allowance
for loan losses a critical accounting policy. See “Critical Accounting Policies”
for more information.
In determining the
allowance and the related provision for loan losses, three principal elements
are considered:
| 1) | specific allocations based upon probable losses identified during a quarterly review of the loan portfolio, | ||
| 2) | allocations based principally on the Company’s risk rating formulas, and | ||
| 3) | an unallocated allowance based on subjective factors. | ||
The first element
reflects management’s estimate of probable losses based upon a systematic review
of specific loans considered to be impaired. These estimates are based upon
collateral exposure, if they are collateral dependent for collection. Otherwise,
discounted cash flows are estimated and used to assign loss. At December 31,
2009 the allocated allowance for loan losses on individually impaired loans was
$8.1 million, or 21% of the total impaired loans, with the largest allocation
being $1.5 million on one residential real estate project. At December 31, 2008,
the allocated allowance for loan losses on individually impaired loans was $7.4
million, or 22% of the total impaired loans, with the largest allocation being
$1.3 million on commercial ground.
The second element
reflects the application of our loan rating system. This rating system is
similar to those employed by state and federal banking regulators. Loans are
rated and assigned a loss allocation factor for each category that is based on a
loss migration analysis using the Company’s loss experience and heavily
weighting the most recent twelve months. The higher the rating assigned to a
loan, the greater the loss allocation percentage that is applied.
The unallocated
allowance is based on management’s evaluation of conditions that are not
directly reflected in the determination of the formula and specific allowances.
The evaluation of the inherent loss with respect to these conditions is subject
to a higher degree of uncertainty because they may not be identified with
specific problem credits or portfolio segments. The conditions evaluated in
connection with the unallocated allowance include the following:
-
general economic and business conditions affecting our key lending areas;
-
credit quality trends (including trends in nonperforming loans expected to result from existing conditions);
-
collateral values;
-
competitive factors resulting in shifts in underwriting criteria; and
-
findings of our loan monitoring process.
Executive management reviews these
conditions quarterly in discussion with our entire lending staff. To the extent
that any of these conditions is evidenced by a specifically identifiable problem
credit or portfolio segment as of the evaluation date, management’s estimate of
the effect of such conditions may be reflected as a specific allowance,
applicable to such credit or portfolio segment. Where any of these conditions is
not evidenced by a specifically identifiable problem credit or portfolio segment
as of the evaluation date, management’s evaluation of the probable loss related
to such condition is reflected in the unallocated allowance.
The allocation of the
allowance for loan losses by loan category is a result of the analysis above.
The allocation methodology applied by the Company, designed to assess the
adequacy of the allowance for loan losses, focuses on changes in the size and
character of the loan portfolio, changes in levels of impaired and other
nonperforming loans, the risk inherent in specific loans, concentrations of
loans to specific borrowers or industries, existing economic conditions, and
historical losses on each portfolio category. Because each of the criteria used
is subject to change, the allocation of the allowance for loan losses is made
for analytical purposes and is not necessarily indicative of the trend of future
loan losses in any particular loan category. The total allowance is available to
absorb losses from any segment of the portfolio. Management continues to target
and maintain the allowance for loan losses equal to the allocation methodology
plus an unallocated portion, as determined by economic conditions and other
qualitative and quantitative factors affecting the Company’s borrowers, as
described above.
Management is
currently evaluating a more refined “dual risk rating system” wherein each
borrower is assigned a “probability of default” and a “loss given default”
rating. The probability of default is primarily based on borrower cash flow and
the loss given default is based on the adequacy of the collateral value relative
to the loan amount. Management believes that this more refined rating system
will allow the Company to more accurately assess the risk elements in the
portfolio. If adopted, it is not anticipated that the new system will have a
material effect on the current level of the allowance for loan losses.
Management believes that the allowance for loan losses is adequate at December
31, 2009.
33
The following table
summarizes changes in the allowance for loan losses arising from loans charged
off and recoveries on loans previously charged off, by loan category, and
additions to the allowance charged to expense.
| At December 31, | |||||||||||||||||||
| Restated | Restated | Restated | Restated | ||||||||||||||||
| (in thousands) | 2009 | 2008 | 2007 | 2006 | 2005 | ||||||||||||||
| Allowance at beginning of year | $ | 33,808 | $ | 22,585 | $ | 17,475 | $ | 13,331 | $ | 11,974 | |||||||||
| (Disposed) acquired allowance for loan losses | - | (50 | ) | 2,010 | 3,069 | - | |||||||||||||
| Release of allowance related to loan participations sold | (1,383 | ) | - | - | - | - | |||||||||||||
| Loans charged off: | |||||||||||||||||||
| Commercial and industrial | 3,663 | 3,783 | 238 | 1,067 | 171 | ||||||||||||||
| Real estate: | |||||||||||||||||||
| Commercial | 5,710 | 1,384 | 43 | 25 | 424 | ||||||||||||||
| Construction | 15,086 | 8,044 | 705 | - | - | ||||||||||||||
| Residential | 5,931 | 2,367 | 1,418 | 504 | - | ||||||||||||||
| Consumer and other | 42 | 31 | 125 | 2 | 49 | ||||||||||||||
| Total loans charged off | 30,432 | 15,609 | 2,529 | 1,598 | 644 | ||||||||||||||
| Recoveries of loans previously charged off: | |||||||||||||||||||
| Commercial and industrial | 62 | 64 | 347 | 362 | 209 | ||||||||||||||
| Real estate: | |||||||||||||||||||
| Commercial | 66 | - | 15 | 1 | 74 | ||||||||||||||
| Construction | 28 | 241 | 25 | - | - | ||||||||||||||
| Residential | 422 | 56 | 17 | 31 | 177 | ||||||||||||||
| Consumer and other | 12 | 11 | 105 | 6 | 19 | ||||||||||||||
| Total recoveries of loans | 590 | 372 | 509 | 400 | 479 | ||||||||||||||
| Net loan chargeoffs | 29,842 | 15,237 | 2,020 | 1,198 | 165 | ||||||||||||||
| Provision for loan losses | 40,412 | 26,510 | 5,120 | 2,273 | 1,522 | ||||||||||||||
| Allowance at end of year | $ | 42,995 | $ | 33,808 | $ | 22,585 | $ | 17,475 | $ | 13,331 | |||||||||
| Average loans | $ | 2,098,275 | $ | 2,001,073 | $ | 1,599,596 | $ | 1,214,437 | $ | 1,014,697 | |||||||||
| Total portfolio loans | 1,833,260 | 2,201,457 | 1,784,278 | 1,376,452 | 1,048,302 | ||||||||||||||
| Nonperforming loans | 38,540 | 35,487 | 12,720 | 6,475 | 1,421 | ||||||||||||||
| Net chargeoffs to average loans | 1.42 | % | 0.76 | % | 0.13 | % | 0.10 | % | 0.02 | % | |||||||||
| Allowance for loan losses to loans | 2.35 | 1.54 | 1.27 | 1.27 | 1.27 | ||||||||||||||
The following table
is a summary of the allocation of the allowance for loan losses for the five
years ended December 31, 2009:
| December 31, | ||||||||||||||||||||||||||||||
| Restated | Restated | Restated | Restated | |||||||||||||||||||||||||||
| 2009 | 2008 | 2007 | 2006 | 2005 | ||||||||||||||||||||||||||
| Percent by | Percent by | Percent by | Percent by | Percent by | ||||||||||||||||||||||||||
| Category to | Category to | Category to | Category to | Category to | ||||||||||||||||||||||||||
| (in thousands) | Allowance | Total Loans | Allowance | Total Loans | Allowance | Total Loans | Allowance | Total Loans | Allowance | Total Loans | ||||||||||||||||||||
| Commercial and industrial | $ | 9,715 | 30.4 | % | $ | 6,431 | 30.7 | % | $ | 4,582 | 30.8 | % | $ | 3,673 | 27.6 | % | $ | 3,295 | 26.6 | % | ||||||||||
| Real estate: | ||||||||||||||||||||||||||||||
| Commercial | 19,600 | 44.8 | 11,085 | 40.3 | 7,229 | 40.4 | 5,900 | 43.4 | 4,315 | 40.5 | ||||||||||||||||||||
| Construction | 4,289 | 12.2 | 7,886 | 17.2 | 5,418 | 16.9 | 2,970 | 15.1 | 1,116 | 14.4 | ||||||||||||||||||||
| Residential | 3,859 | 11.7 | 2,762 | 10.7 | 2,632 | 9.8 | 2,070 | 11.3 | 1,817 | 15.0 | ||||||||||||||||||||
| Consumer and other | 45 | 0.9 | 188 | 1.1 | 438 | 2.1 | 513 | 2.6 | 313 | 3.5 | ||||||||||||||||||||
| Not allocated | 5,487 | 5,456 | 2,286 | 2,349 | 2,476 | |||||||||||||||||||||||||
| Total allowance | $ | 42,995 | 100.0 | % | $ | 33,808 | 100.0 | % | $ | 22,585 | 100.0 | % | $ | 17,475 | 100.0 | % | $ | 13,332 | 100.0 | % | ||||||||||
34
Nonperforming assets
Nonperforming loans are defined as loans on non-accrual status, loans 90 days or more past due but still accruing, and restructured loans that are still accruing interest or in a non-accrual status. Restructured loans involve the granting of a concession to a borrower experiencing financial difficulty involving the modification of terms of the loan, such as changes in payment schedule or interest rate. Nonperforming assets include nonperforming loans plus foreclosed real estate.
Nonperforming loans are defined as loans on non-accrual status, loans 90 days or more past due but still accruing, and restructured loans that are still accruing interest or in a non-accrual status. Restructured loans involve the granting of a concession to a borrower experiencing financial difficulty involving the modification of terms of the loan, such as changes in payment schedule or interest rate. Nonperforming assets include nonperforming loans plus foreclosed real estate.
Nonperforming loans
exclude credit-impaired loans that were acquired in the December 2009
FDIC-assisted transaction in Arizona. These purchased credit-impaired loans are
accounted for on a pool basis, and the pools are considered to be performing.
See Item 8, Note 3 – Acquisition and Divestitures for more information on these
loans.
Loans are placed on
non-accrual status when contractually past due 90 days or more as to interest or
principal payments. Additionally, whenever management becomes aware of facts or
circumstances that may adversely impact the collectibility of principal or
interest on loans, it is management’s practice to place such loans on
non-accrual status immediately, rather than delaying such action until the loans
become 90 days past due. Previously accrued and uncollected interest on such
loans is reversed. Income is recorded only to the extent that a determination
has been made that the principal balance of the loan is collectable and the
interest payments are subsequently received in cash, or for a restructured loan,
the borrower has made six consecutive contractual payments. If collectability of
the principal is in doubt, payments received are applied to loan
principal.
Loans past due 90
days or more but still accruing interest are also included in nonperforming
loans. Loans past due 90 days or more but still accruing are classified as such
where the underlying loans are both well secured (the collateral value is
sufficient to cover principal and accrued interest) and are in the process of
collection.
The Company’s
nonperforming loans meet the definition of “impaired loans” under U.S. GAAP. As
of December 31, 2009, 2008, and 2007, the Company had 39, 26, and 19 impaired
loan relationships, respectively.
The following table
presents the categories of nonperforming assets and certain ratios as of the
dates indicated:
| At December 31, | ||||||||||||||||||||
| Restated | Restated | Restated | Restated | |||||||||||||||||
| (in thousands) | 2009 | 2008 | 2007 | 2006 | 2005 | |||||||||||||||
| Non-accrual loans | $ | 37,441 | $ | 35,487 | $ | 12,720 | $ | 6,363 | $ | 1,421 | ||||||||||
| Loans past due 90 days or more | ||||||||||||||||||||
| and still accruing interest | - | - | - | 112 | - | |||||||||||||||
| Restructured loans | 1,099 | - | - | - | - | |||||||||||||||
| Total nonperforming loans | 38,540 | 35,487 | 12,720 | 6,475 | 1,421 | |||||||||||||||
| Foreclosed property | 26,372 | 13,868 | 2,963 | 1,500 | - | |||||||||||||||
| Total nonperforming assets | $ | 64,912 | $ | 49,355 | $ | 15,683 | $ | 7,975 | $ | 1,421 | ||||||||||
| Total assets | $ | 2,365,655 | $ | 2,493,767 | $ | 2,141,329 | $ | 1,600,004 | $ | 1,332,673 | ||||||||||
| Total loans | 1,833,260 | 2,201,457 | 1,784,278 | 1,376,452 | 1,048,302 | |||||||||||||||
| Total loans plus foreclosed property | 1,859,632 | 2,215,325 | 1,787,241 | 1,377,952 | 1,048,302 | |||||||||||||||
| Nonperforming loans to loans | 2.10 | % | 1.61 | % | 0.71 | % | 0.47 | % | 0.14 | % | ||||||||||
| Nonperforming assets to loans plus | ||||||||||||||||||||
| foreclosed property | 3.49 | 2.23 | 0.88 | 0.58 | 0.14 | |||||||||||||||
| Nonperforming assets to total assets | 2.74 | 1.98 | 0.73 | 0.50 | 0.11 | |||||||||||||||
| Allowance for loan losses to nonperforming loans | 112.00 | % | 95.00 | % | 178.00 | % | 270.00 | % | 938.00 | % | ||||||||||
35
Nonperforming loans
Nonperforming loans at December 31, 2009 based on Call Report codes were as follows:
Nonperforming loans at December 31, 2009 based on Call Report codes were as follows:
| (in thousands) | Amount | ||
| Construction Real Estate/ Land Acquisition and Development | $ | 21,682 | |
| Commercial Real Estate | 9,384 | ||
| Residential Real Estate | 4,130 | ||
| Commercial and Industrial | 3,254 | ||
| Consumer & Other | 90 | ||
| Total | $ | 38,540 | |
The following table
summarizes the changes in nonperforming loans by quarter for 2009.
| 2009 | ||||||||||||||||||||
| Restated | Restated | |||||||||||||||||||
| (in thousands) | 4th Qtr | 3rd Qtr | 2nd Qtr | 1st Qtr | Total Year | |||||||||||||||
| Nonperforming loans beginning of period | $ | 46,982 | $ | 54,699 | $ | 54,421 | $ | 35,487 | $ | 35,487 | ||||||||||
| Additions to nonaccrual loans | 16,318 | 17,900 | 26,790 | 31,421 | 92,429 | |||||||||||||||
| Additions to restructured loans | 1,099 | - | - | - | 1,099 | |||||||||||||||
| Chargeoffs | (11,519 | ) | (6,254 | ) | (5,018 | ) | (7,051 | ) | (29,842 | ) | ||||||||||
| Other principal reductions | (559 | ) | (4,113 | ) | (5,252 | ) | (2,596 | ) | (12,520 | ) | ||||||||||
| Moved to Other real estate | (11,339 | ) | (9,903 | ) | (11,497 | ) | (978 | ) | (33,717 | ) | ||||||||||
| Moved to performing | (2,442 | ) | (5,347 | ) | (4,745 | ) | (1,862 | ) | (14,396 | ) | ||||||||||
| Nonperforming loans end of period | $ | 38,540 | $ | 46,982 | $ | 54,699 | $ | 54,421 | $ | 38,540 | ||||||||||
Approximately, $5.3
million of the decline between third and fourth quarter of 2009 was the result
of amending the loan participation agreements so that they qualified for sale
accounting treatment. At December 31, 2009, the nonperforming loans represent 39
relationships. The largest of these is a $4.0 million commercial real estate
loan. Five relationships comprise 41% of the nonperforming loans. Approximately
52% of the nonperforming loans were in the Kansas City market, 47% were in the
St. Louis market and less than 1% were in the Phoenix market.
At December 31, 2008,
of the total nonperforming loans, $23.6 million, or 67%, related to five
relationships: $10.6 million secured by a partially completed retail center;
$3.5 million secured by commercial ground; $4.7 million secured by a medical
office building; $2.8 million secured by a single family residence; and $1.9
million secured by a residential development. The remaining nonperforming loans
consisted of 20 relationships. Eighty-four percent of the total nonperforming
loans are located in the Kansas City market.
At December 31, 2007,
of the total nonperforming loans, $7.3 million, or 57%, were related to eight
residential homebuilders in St. Louis and Kansas City. The two largest related
to a residential builder in Kansas City totaling $2.2 million and a
single-family rehab builder in Kansas City totaling $1.6 million. The remaining
nonperforming loans consisted of 11 relationships, nearly all of which were
related to the soft residential housing markets in St. Louis and Kansas
City.
Two credits in the
Kansas City market secured by real estate represented $3.7 million of the total
nonperforming loans at December 31, 2006. Six of the remaining ten relationships
on non-accrual at December 31, 2006 and approximately 50% of the nonperforming
loan balances related to smaller relationships acquired in the NorthStar
transaction. At December 31, 2005, the nonperforming loans consisted of five
accounts with two credits accounting for 68% of the total.
36
Other real estate
Other real estate at December 31, 2009 was $26.4 million, an increase of $12.5 million over 2008. The increase includes $3.5 million of other real estate acquired through the FDIC-assisted transaction. At December 31, 2009, Other real estate was comprised of 22% completed homes, 30% residential lots and 48% commercial real estate. The largest single component of Other real estate is a medical office building with a book value of $5.0 million.
Other real estate at December 31, 2009 was $26.4 million, an increase of $12.5 million over 2008. The increase includes $3.5 million of other real estate acquired through the FDIC-assisted transaction. At December 31, 2009, Other real estate was comprised of 22% completed homes, 30% residential lots and 48% commercial real estate. The largest single component of Other real estate is a medical office building with a book value of $5.0 million.
| 2009 | ||||||||||||||||||||
| 4th Quarter | 3rd Quarter | 2nd Quarter | 1st Quarter | Year-to-date | ||||||||||||||||
| Other real estate at beginning of period | $ | 19,273 | $ | 16,053 | $ | 13,251 | $ | 13,868 | $ | 13,868 | ||||||||||
| Additions and expenses capitalized | ||||||||||||||||||||
| to prepare property for sale | 11,342 | 9,915 | 11,788 | 1,155 | 34,200 | |||||||||||||||
| Addition of Valley Capital ORE | 3,455 | - | - | - | 3,455 | |||||||||||||||
| Writedowns in fair value | (587 | ) | (688 | ) | (506 | ) | (608 | ) | (2,389 | ) | ||||||||||
| Sales | (7,111 | ) | (6,007 | ) | (8,480 | ) | (1,164 | ) | (22,762 | ) | ||||||||||
| Other real estate at end of period | $ | 26,372 | $ | 19,273 | $ | 16,053 | $ | 13,251 | $ | 26,372 | ||||||||||
The writedowns in
fair value were recorded in Loan legal and other real estate owned based on
current market activity shown in the appraisals. In addition, the Company
realized a net loss of $436,000 on sales of other real estate and recorded these
losses as part of Noninterest income. Management believes it is prudent to sell
these properties, rather than wait for an improved real estate
market.
Potential problem loans
Potential problem loans, which are not included in nonperforming loans, amounted to approximately $83.2 million, or 4.54% of total loans outstanding at December 31, 2009, compared to $15.8 million, or 0.80% of total loans outstanding at December 31, 2008. The $67.4 million increase in potential problem loans consists primarily of five commercial and industrial relationships totaling $18.6 million, five commercial real estate credits totaling $25.9 million, and two residential construction credits totaling $4.8 million. Potential problem loans represent those loans with a well-defined weakness and where information about possible credit problems of borrowers has caused management to have serious doubts about the borrower’s ability to comply with present repayment terms. Given this level of potential problem loans combined with the Company’s demonstrated ability to work through this adverse credit cycle so far, we believe that nonperforming asset levels will remain elevated in 2010 but manageable.
Potential problem loans, which are not included in nonperforming loans, amounted to approximately $83.2 million, or 4.54% of total loans outstanding at December 31, 2009, compared to $15.8 million, or 0.80% of total loans outstanding at December 31, 2008. The $67.4 million increase in potential problem loans consists primarily of five commercial and industrial relationships totaling $18.6 million, five commercial real estate credits totaling $25.9 million, and two residential construction credits totaling $4.8 million. Potential problem loans represent those loans with a well-defined weakness and where information about possible credit problems of borrowers has caused management to have serious doubts about the borrower’s ability to comply with present repayment terms. Given this level of potential problem loans combined with the Company’s demonstrated ability to work through this adverse credit cycle so far, we believe that nonperforming asset levels will remain elevated in 2010 but manageable.
Investments
At December 31, 2009, our investment portfolio was $296.0 million, or 13%, of total assets. Our debt securities portfolio is primarily comprised of U.S. government agency obligations, mortgage-backed pools, and collateralized mortgage obligations (“CMO’s”). Our other investments primarily consist of the common stock investment of our trust preferred securities and other private equity investments. The size of the investment portfolio is generally 5-15% of total assets and will vary within that range based on liquidity. Typically, management classifies securities as available for sale to maximize management flexibility, although securities may be purchased with the intention of holding to maturity. Securities available-for-sale are carried at fair value, with related unrealized net gains or losses, net of deferred income taxes, recorded as an adjustment to equity capital.
At December 31, 2009, our investment portfolio was $296.0 million, or 13%, of total assets. Our debt securities portfolio is primarily comprised of U.S. government agency obligations, mortgage-backed pools, and collateralized mortgage obligations (“CMO’s”). Our other investments primarily consist of the common stock investment of our trust preferred securities and other private equity investments. The size of the investment portfolio is generally 5-15% of total assets and will vary within that range based on liquidity. Typically, management classifies securities as available for sale to maximize management flexibility, although securities may be purchased with the intention of holding to maturity. Securities available-for-sale are carried at fair value, with related unrealized net gains or losses, net of deferred income taxes, recorded as an adjustment to equity capital.
The table below sets
forth the carrying value of investment securities held by the Company at the
dates indicated:
| December 31, | |||||||||||||||||
| 2009 | 2008 | 2007 | |||||||||||||||
| (in thousands) | Amount | % | Amount | % | Amount | % | |||||||||||
| Obligations of U.S. Government agencies | $ | 27,189 | 9.2 | % | $ | - | 0.0 | % | $ | - | 0.0 | % | |||||
| Obligations of U.S. Government sponsored enterprises | 75,814 | 25.6 | % | - | 0.0 | % | 28,720 | 34.5 | % | ||||||||
| Obligations of states and political subdivisions | 3,408 | 1.2 | % | 772 | 0.7 | % | 949 | 1.1 | % | ||||||||
| Residential mortgage-backed securities | 176,050 | 59.5 | % | 95,659 | 88.4 | % | 41,087 | 49.3 | % | ||||||||
| FHLB capital stock | 8,476 | 2.9 | % | 7,517 | 6.9 | % | 9,106 | 10.9 | % | ||||||||
| Other investments | 4,713 | 1.6 | % | 4,367 | 4.0 | % | 3,471 | 4.2 | % | ||||||||
| $ | 295,650 | 100.0 | % | $ | 108,315 | 100.0 | % | $ | 83,333 | 100.0 | % | ||||||
37
In 2009 the portfolio
grew with additions to the government sponsored agency debentures, mortgage
backed securities (including CMO's) and government guaranteed securities. All
residential mortgage-backed securities were issued by government sponsored
enterprises. This combination gives us an appropriate balance between return and
cashflow certainty given the current interest rate environment. We also began to
build a portfolio of federally tax free municipal securities.
At December 31, 2009,
of the $8.5 million in FHLB capital stock, $2.7 million is required for FHLB
membership and $5.8 million is required to support our outstanding advances.
Historically, it has been the FHLB practice to automatically repurchase
activity-based stock that became excess because of a member's reduction in
advances. The FHLB has the discretion, but is not required, to repurchase any
shares that a member is not required to hold.
The Company had no
securities classified as trading at December 31, 2009, 2008, or 2007.
The following table
summarizes expected maturity and yield information on the investment portfolio
at December 31, 2009:
| Within 1 year | 1 to 5 years | 5 to 10 years | Over 10 years | No Stated Maturity | Total | |||||||||||||||||||||||||||||||
| (in thousands) | Amount | Yield | Amount | Yield | Amount | Yield | Amount | Yield | Amount | Yield | Amount | Yield | ||||||||||||||||||||||||
| Obligations of U.S. Government agencies | $ | - | 0.00 | % | $ | 19,266 | 2.00 | % | $ | 2,720 | 2.21 | % | $ | 5,203 | 2.04 | % | $ | - | 0.00 | % | $ | 27,189 | 2.03 | % | ||||||||||||
| Obligations of U.S. Government sponsored enterprises |
56,281 | 1.22 | % | 14,202 | 1.14 | % | - | 0.00 | % | 5,331 | 3.55 | % | - | 0.00 | % | 75,814 | 1.37 | % | ||||||||||||||||||
| Obligations of states and political
subdivisions |
280 | 4.40 | % | 298 | 6.07 | % | 310 | 5.94 | % | 2,520 | 0.61 | % | - | 0.00 | % | 3,408 | 1.88 | % | ||||||||||||||||||
| Residential mortgage-backed securities | 8,740 | 3.91 | % | 137,459 | 3.53 | % | 24,690 | 3.53 | % | 5,161 | 5.12 | % | - | 0.00 | % | 176,050 | 3.59 | % | ||||||||||||||||||
| FHLB capital stock | - | 0.00 | % | - | 0.00 | % | - | 0.00 | % | - | 0.00 | % | 8,476 | 1.78 | % | 8,476 | 1.78 | % | ||||||||||||||||||
| Other investments | - | 0.00 | % | - | 0.00 | % | - | 0.00 | % | - | 0.00 | % | 4,713 | 3.57 | % | 4,713 | 3.57 | % | ||||||||||||||||||
| Total | $ | 65,301 | 1.59 | % | $ | 171,225 | 3.16 | % | $ | 27,720 | 3.42 | % | $ | 18,215 | 3.15 | % | $ | 13,189 | 2.42 | % | $ | 295,650 | 2.81 | % | ||||||||||||
Yields on tax exempt
securities are computed on a taxable equivalent basis using a tax rate of 36%.
Expected maturities will differ from contractual maturities, as borrowers may
have the right to call on repay obligations with or without prepayment
penalties.
Deposits
The following table shows, for the periods indicated, the average annual amount and the average rate paid by type of deposit:
The following table shows, for the periods indicated, the average annual amount and the average rate paid by type of deposit:
| For the year ended December 31, | ||||||||||||||||||
| 2009 | 2008 | 2007 | ||||||||||||||||
| Weighted | Weighted | Weighted | ||||||||||||||||
| (in thousands) | Average balance | average rate | Average balance | average rate | Average balance | average rate | ||||||||||||
| Interest-bearing transaction accounts | $ | 122,563 | 0.54 | % | $ | 121,371 | 1.28 | % | $ | 120,418 | 2.56 | % | ||||||
| Money market accounts | 636,350 | 0.96 | % | 687,867 | 2.00 | % | 579,029 | 4.07 | % | |||||||||
| Savings accounts | 9,147 | 0.38 | % | 9,594 | 0.57 | % | 11,126 | 1.12 | % | |||||||||
| Certificates of deposit | 786,631 | 2.98 | % | 588,561 | 4.17 | % | 503,926 | 5.18 | % | |||||||||
| 1,554,691 | 1.94 | % | 1,407,393 | 2.84 | % | 1,214,499 | 4.35 | % | ||||||||||
| Noninterest-bearing demand deposits | 250,435 | -- | 221,925 | -- | 215,610 | -- | ||||||||||||
| $ | 1,805,126 | 1.67 | % | $ | 1,629,318 | 2.45 | % | $ | 1,430,109 | 3.70 | % | |||||||
Our deposit focus for
2009 was to reduce our reliance on brokered deposits, grow our core deposits,
and increase our percentage of non-interest bearing deposits. We adjusted our
incentive programs to focus our associates on deposit gathering efforts and
aggressively managed deposit rates to achieve this objective. Our marketing
efforts centered primarily around growing our base of commercial clients through
direct calling efforts. Many new relationships were developed with closely-held
businesses that prefer building strong relationships with locally owned banks.
Such relationships are typically long term, stable sources of
deposits.
Treasury management
continued to be an important part of our offering as businesses sought to use
these products and services to help minimize expenses and improve back room
efficiency. The Bank originated 83 new treasury management relationships during
2009 representing over $80.0 million in new deposits and $239,000 in annualized
fee income.
38
Greater
emphasis was placed on our retail banking program through increased sales
training, and media and direct mail promotions. Nearly $120.0 million was raised
in a 13-15 month certificate of deposit campaign and approximately $21.0 million
was raised through direct mail money market campaigns. Management also focused
on reducing the dependency on brokered certificates of deposits and used
successful retail campaigns to help replace these funds. Brokered certificates
of deposits declined $180 million, or 53%, from $336.0 million at December 31,
2008 to $156.0 million at December 31, 2009. For the year ended December 31,
2009, brokered certificates of deposits represented 8% of total deposits
compared to 19% for the year ended December 31, 2008. Noninterest-bearing demand
deposits represented 15% of total deposits at December 31, 2009 compared to 14%
at December 31, 2008. Noninterest-bearing demand deposit growth was particularly
strong in the fourth quarter of 2009, with an increase of $32.0 million, or
12%.
Maturities of
certificates of deposit of $100,000 or more were as follows as of December 31,
2009:
| (in thousands) | Total | |
| Three months or less | $ | 98,862 |
| Over three through six months | 113,068 | |
| Over six through twelve months | 146,102 | |
| Over twelve months | 85,034 | |
| Total | $ | 443,067 |
Liquidity and Capital
Resources
Since September 2008, we have raised $75.0 million in regulatory capital, raising our risk-based capital ratio to 13.32% - well in excess of the regulatory guidelines. On December 12, 2008, we completed a private placement of $25.0 million in Convertible Trust Preferred Securities that qualify as Tier II regulatory capital until they would convert to EFSC common stock. On December 19, 2008, we received $35.0 million from the U.S. Treasury under the Capital Purchase Program. In January, 2010, the Company added $15.0 million in common equity in a private placement offering to accredited investors. On a pro-forma basis, the additional equity increased the Company’s tangible common equity ratio to 6.08% from 5.48% at year end 2009 and its total risk-based regulatory capital ratio to 14.05% from 13.32%, enhancing its already well-capitalized position. A reconciliation of shareholders’ equity to tangible common equity and total assets to tangible assets is provided below in “Capital Resources”. The tangible common equity ratio is widely followed by analysts of bank and financial holding companies and we believe it is an important financial measure of capital strength even though it is considered to be a non-GAAP measure.
Since September 2008, we have raised $75.0 million in regulatory capital, raising our risk-based capital ratio to 13.32% - well in excess of the regulatory guidelines. On December 12, 2008, we completed a private placement of $25.0 million in Convertible Trust Preferred Securities that qualify as Tier II regulatory capital until they would convert to EFSC common stock. On December 19, 2008, we received $35.0 million from the U.S. Treasury under the Capital Purchase Program. In January, 2010, the Company added $15.0 million in common equity in a private placement offering to accredited investors. On a pro-forma basis, the additional equity increased the Company’s tangible common equity ratio to 6.08% from 5.48% at year end 2009 and its total risk-based regulatory capital ratio to 14.05% from 13.32%, enhancing its already well-capitalized position. A reconciliation of shareholders’ equity to tangible common equity and total assets to tangible assets is provided below in “Capital Resources”. The tangible common equity ratio is widely followed by analysts of bank and financial holding companies and we believe it is an important financial measure of capital strength even though it is considered to be a non-GAAP measure.
As of December 31,
2008, $20.0 million of the capital funds were used to pay off the Company’s line
of credit and term loan. In December 2008, we also injected $18.0 million into
Enterprise to support continued loan growth and bolster its capital ratios.
Subject to other demands for cash, we expect to use our capital funds to support
continuing loan growth and strengthening our capital position as appropriate.
Some portion of this additional capital may also be deployed to take advantage
of acquisition opportunities that may emerge from the current unsettled nature
of the financial industry. We may also seek the approval of our regulators to
utilize cash available to us to repurchase all or a portion of the securities
that we issued to the U. S. Treasury.
Liquidity
The objective of liquidity management is to ensure we have the ability to generate sufficient cash or cash equivalents in a timely and cost-effective manner to meet our commitments as they become due. Typical demands on liquidity are deposit run-off from demand deposits, maturing time deposits which are not renewed, and fundings under credit commitments to customers. Funds are available from a number of sources, such as from the core deposit base and from loans and securities repayments and maturities. Additionally, liquidity is provided from sales of the securities portfolio, fed fund lines with correspondent banks, the Federal Reserve and the FHLB, the ability to acquire large and brokered deposits and the ability to sell loan participations to other banks. These alternatives are an important part of our liquidity plan and provide flexibility and efficient execution of the asset-liability management strategy.
The objective of liquidity management is to ensure we have the ability to generate sufficient cash or cash equivalents in a timely and cost-effective manner to meet our commitments as they become due. Typical demands on liquidity are deposit run-off from demand deposits, maturing time deposits which are not renewed, and fundings under credit commitments to customers. Funds are available from a number of sources, such as from the core deposit base and from loans and securities repayments and maturities. Additionally, liquidity is provided from sales of the securities portfolio, fed fund lines with correspondent banks, the Federal Reserve and the FHLB, the ability to acquire large and brokered deposits and the ability to sell loan participations to other banks. These alternatives are an important part of our liquidity plan and provide flexibility and efficient execution of the asset-liability management strategy.
Our Asset-Liability
Management Committee oversees our liquidity position, the parameters of which
are approved by the Board of Directors. Our liquidity position is
monitored monthly by producing a liquidity report, which measures the amount of
liquid versus non-liquid assets and liabilities. Our liquidity management framework includes measurement of several key
elements, such as the loan to deposit ratio, a liquidity ratio, and a dependency
ratio. The Company’s liquidity framework also incorporates contingency planning
to assess the nature and volatility of funding sources and to determine
alternatives to these sources. While core deposits and loan and investment
repayments are principal sources of liquidity, funding diversification is
another key element of liquidity management and is achieved by strategically
varying depositor types, terms, funding markets, and instruments.
39
For the year ended
December 31, 2009, net cash provided by operating activities was $8.5 million
more than for 2008. Net cash used in investing activities was $66.0 million for
2009 versus $437.0 million in 2008. The decrease of $370.0 million was primarily
due to a decrease in loan volume. Net cash provided by financing activities was
$102.0 million in 2009 versus $305.0 million in 2008. The change in cash
provided by financing activities is due to a decrease in interest-bearing
deposits.
Strong capital
ratios, credit quality and core earnings are essential to retaining
cost-effective access to the wholesale funding markets. Deterioration in any of
these factors could have a negative impact on the Company’s ability to access
these funding sources and, as a result, these factors are monitored on an
ongoing basis as part of the liquidity management process. Enterprise is subject
to regulations and, among other things, may be limited in its ability to pay
dividends or transfer funds to the parent Company. Accordingly, consolidated
cash flows as presented in the consolidated statements of cash flows may not
represent cash immediately available for the payment of cash dividends to the
Company’s shareholders or for other cash needs.
Parent Company
liquidity
The parent company’s liquidity is managed to provide the funds necessary to pay dividends to shareholders, service debt, invest in subsidiaries as necessary, and satisfy other operating requirements. The parent company had cash and cash equivalents of $19.5 million and $23.8 million, respectively, at December 31, 2009 and 2008. The parent company’s primary funding sources to meet its liquidity requirements are dividends from Enterprise and proceeds from the issuance of equity (i.e. stock option exercises). We believe our current level of cash at the holding company will be sufficient to meet all projected cash needs in 2010.
The parent company’s liquidity is managed to provide the funds necessary to pay dividends to shareholders, service debt, invest in subsidiaries as necessary, and satisfy other operating requirements. The parent company had cash and cash equivalents of $19.5 million and $23.8 million, respectively, at December 31, 2009 and 2008. The parent company’s primary funding sources to meet its liquidity requirements are dividends from Enterprise and proceeds from the issuance of equity (i.e. stock option exercises). We believe our current level of cash at the holding company will be sufficient to meet all projected cash needs in 2010.
Another source of
funding for the parent company includes the issuance of subordinated debentures.
As of December 31, 2009, the Company had $82.6 million of outstanding
subordinated debentures as part of nine Trust Preferred Securities Pools. These
securities are classified as debt but are included in regulatory capital and the
related interest expense is tax-deductible, which makes them a very attractive
source of funding. See Item 8, Note 12 – Subordinated Debentures for more
information.
Enterprise liquidity
Enterprise has a variety of funding sources available to increase financial flexibility. In addition to amounts currently borrowed at December 31, 2009, Enterprise could borrow an additional $118.5 million available from the FHLB of Des Moines under blanket loan pledges and an additional $279.7 million available from the Federal Reserve Bank under pledged loan agreements. Enterprise has unsecured federal funds lines with three correspondent banks totaling $30.0 million.
Enterprise has a variety of funding sources available to increase financial flexibility. In addition to amounts currently borrowed at December 31, 2009, Enterprise could borrow an additional $118.5 million available from the FHLB of Des Moines under blanket loan pledges and an additional $279.7 million available from the Federal Reserve Bank under pledged loan agreements. Enterprise has unsecured federal funds lines with three correspondent banks totaling $30.0 million.
Investment securities
are another important tool to Enterprise’s liquidity objective. As of December
31, 2009, the entire investment portfolio was available for sale. Of the $282.5
million investment portfolio available for sale, $211.6 million was pledged as
collateral for public deposits, treasury, tax and loan notes, and other
requirements. The remaining debt securities could be pledged or sold to enhance
liquidity, if necessary.
In July 2008,
Enterprise joined the Certificate of Deposit Account Registry Service, or CDARS,
which allows us to provide our customers with access to additional levels of
FDIC insurance coverage. The CDARS program is designed to provide full FDIC
insurance on deposit amounts larger than the stated minimum by exchanging or
reciprocating larger depository relationships with other member banks. Our
depositors’ funds are broken into smaller amounts and placed with other banks
that are members of the network. Each member bank issues CDs in amounts that are
eligible for FDIC insurance. CDARS are considered brokered deposits according to
banking regulations; however, the Company considers the reciprocal deposits
placed through the CDARS program as core funding since the original funds came
from clients and does not report the balances as brokered sources in its
external financial reports. Enterprise must remain “well-capitalized” in order
to utilize the CDARS program. As of December 31, 2009, Enterprise had $135.0
million of reciprocal CDARS deposits outstanding.
In addition to the
reciprocal deposits available through CDARS, we also have access to the “one-way
buy” program, which allows us to bid on the excess deposits of other CDARS
member banks. The Company will report any outstanding “one-way buy” funds as
brokered funds in its internal and external financial reports. At December 31,
2009, we had no outstanding “one-way buy” deposits.
As long as Enterprise
remains “well-capitalized”, we have the ability to sell certificates of deposit
through various national or regional brokerage firms, if needed. At December 31,
2009, we had $156.0 million of brokered certificates of deposit outstanding.
40
Over the normal
course of business, Enterprise enters into certain forms of off-balance sheet
transactions, including unfunded loan commitments and letters of credit. These
transactions are managed through the Company’s various risk management
processes. Management considers both on-balance sheet and off-balance sheet
transactions in its evaluation of Enterprise’s liquidity. Enterprise has $458.0
million in unused loan commitments as of December 31, 2009. While this
commitment level would be very difficult to fund given Enterprise’s current
liquidity resources, the nature of these commitments is such that the likelihood
of funding them is very low.
At December 31, 2009
and 2008, approximately $8,405,000 and $10,018,000, respectively, of cash and
due from banks represented required reserves on deposits maintained by
Enterprise in accordance with Federal Reserve Bank requirements.
Capital Resources
As a financial holding company, the Company is subject to “risk based” capital adequacy guidelines established by the Federal Reserve. Risk-based capital guidelines were designed to relate regulatory capital requirements to the risk profile of the specific institution and to provide for uniform requirements among the various regulators. Currently, the risk-based capital guidelines require the Company to meet a minimum total capital ratio of 8.0% of which at least 4.0% must consist of Tier 1 capital. Tier 1 capital consists of (a) common shareholders’ equity (excluding the unrealized market value adjustments on the available-for-sale securities and cash flow hedges), (b) qualifying perpetual preferred stock and related additional paid in capital subject to certain limitations specified by the FDIC, and (c) minority interests in the equity accounts of consolidated subsidiaries less (d) goodwill, (e) mortgage servicing rights within certain limits, and (f) any other intangible assets and investments in subsidiaries that the FDIC determines should be deducted from Tier 1 capital. The FDIC also requires a minimum leverage ratio of 3.0%, defined as the ratio of Tier 1 capital to average total assets for banking organizations deemed the strongest and most highly rated by banking regulators. A higher minimum leverage ratio is required of less highly rated banking organizations. Total capital, a measure of capital adequacy, includes Tier 1 capital, allowance for loan losses, and subordinated debentures.
As a financial holding company, the Company is subject to “risk based” capital adequacy guidelines established by the Federal Reserve. Risk-based capital guidelines were designed to relate regulatory capital requirements to the risk profile of the specific institution and to provide for uniform requirements among the various regulators. Currently, the risk-based capital guidelines require the Company to meet a minimum total capital ratio of 8.0% of which at least 4.0% must consist of Tier 1 capital. Tier 1 capital consists of (a) common shareholders’ equity (excluding the unrealized market value adjustments on the available-for-sale securities and cash flow hedges), (b) qualifying perpetual preferred stock and related additional paid in capital subject to certain limitations specified by the FDIC, and (c) minority interests in the equity accounts of consolidated subsidiaries less (d) goodwill, (e) mortgage servicing rights within certain limits, and (f) any other intangible assets and investments in subsidiaries that the FDIC determines should be deducted from Tier 1 capital. The FDIC also requires a minimum leverage ratio of 3.0%, defined as the ratio of Tier 1 capital to average total assets for banking organizations deemed the strongest and most highly rated by banking regulators. A higher minimum leverage ratio is required of less highly rated banking organizations. Total capital, a measure of capital adequacy, includes Tier 1 capital, allowance for loan losses, and subordinated debentures.
The Company met the
definition of “well-capitalized” (the highest category) at December 31, 2009,
2008, and 2007. The following table summarizes the Company’s risk-based capital
and leverage ratios at the dates indicated:
| At December 31, | |||||||||||
| (Dollars in thousands) | 2009 | 2008 | 2007 | ||||||||
| Tier 1 capital to risk weighted assets | 10.67 | % | 8.89 | % | 9.32 | % | |||||
| Total capital to risk weighted assets | 13.32 | % | 12.81 | % | 10.54 | % | |||||
| Leverage ratio (Tier 1 capital to average assets) | 8.96 | % | 8.67 | % | 8.62 | % | |||||
| Tangible common equity to tangible assets | 5.48 | % | 5.38 | % | 5.24 | % | |||||
| Tier 1 capital | $ | 215,099 | $ | 190,253 | $ | 164,957 | |||||
| Total risk-based capital | $ | 268,454 | $ | 273,978 | $ | 186,549 | |||||
Below is a
reconciliation of shareholders’ equity to tangible common equity and total
assets to tangible assets. The tangible common equity ratio is presented because
management believes it is an important financial measure of capital strength
even though it is considered to be a non-GAAP measure.
| For the years ended December 31, | |||||||||||
| Restated | Restated | ||||||||||
| (In thousands) | 2009 | 2008 | 2007 | ||||||||
| Shareholders' equity | $ | 163,912 | $ | 214,572 | $ | 172,149 | |||||
| Less: Preferred stock | (31,802 | ) | (31,116 | ) | - | ||||||
| Less: Goodwill | (953 | ) | (48,512 | ) | (57,177 | ) | |||||
| Less: Intangible assets | (1,643 | ) | (3,504 | ) | (6,053 | ) | |||||
|
Tangible common
equity
|
$ | 129,515 | $ | 131,440 | $ | 108,919 | |||||
| Total assets | $ | 2,365,655 | $ | 2,493,767 | $ | 2,141,329 | |||||
| Less: Goodwill | (953 | ) | (48,512 | ) | (57,177 | ) | |||||
| Less: Intangible assets | (1,643 | ) | (3,504 | ) | (6,053 | ) | |||||
| Tangible assets | $ | 2,363,059 | $ | 2,441,751 | $ | 2,078,099 | |||||
| Tangible common equity to tangible assets | 5.48 | % | 5.38 | % | 5.24 | % | |||||
41
Risk Management
Market risk arises from exposure to changes in interest rates and other relevant market rate or price risk. The Company faces market risk in the form of interest rate risk through transactions other than trading activities. Market risk from these activities, in the form of interest rate risk, is measured and managed through a number of methods. The Company uses financial modeling techniques to measure interest rate risk. These techniques measure the sensitivity of future earnings due to changing interest rate environments. Guidelines established by the Bank’s Asset/Liability Management Committee and approved by the Company’s Board of Directors are used to monitor exposure of earnings at risk. General interest rate movements are used to develop sensitivity as the Company feels it has no primary exposure to a specific point on the yield curve. These limits are based on the Company’s exposure to a 100 basis points and 200 basis points immediate and sustained parallel rate move, either upward or downward.
Market risk arises from exposure to changes in interest rates and other relevant market rate or price risk. The Company faces market risk in the form of interest rate risk through transactions other than trading activities. Market risk from these activities, in the form of interest rate risk, is measured and managed through a number of methods. The Company uses financial modeling techniques to measure interest rate risk. These techniques measure the sensitivity of future earnings due to changing interest rate environments. Guidelines established by the Bank’s Asset/Liability Management Committee and approved by the Company’s Board of Directors are used to monitor exposure of earnings at risk. General interest rate movements are used to develop sensitivity as the Company feels it has no primary exposure to a specific point on the yield curve. These limits are based on the Company’s exposure to a 100 basis points and 200 basis points immediate and sustained parallel rate move, either upward or downward.
Interest Rate Risk
Our interest rate sensitivity management seeks to avoid fluctuating interest margins to enhance consistent growth of net interest income through periods of changing interest rates. Interest rate sensitivity varies with different types of interest-earning assets and interest-bearing liabilities. We attempt to maintain interest-earning assets, comprised primarily of both loans and investments, and interest-bearing liabilities, comprised primarily of deposits, maturing or repricing in similar time horizons in order to minimize or eliminate any impact from market interest rate changes. In order to measure earnings sensitivity to changing rates, the Company uses a static gap analysis and earnings simulation model.
Our interest rate sensitivity management seeks to avoid fluctuating interest margins to enhance consistent growth of net interest income through periods of changing interest rates. Interest rate sensitivity varies with different types of interest-earning assets and interest-bearing liabilities. We attempt to maintain interest-earning assets, comprised primarily of both loans and investments, and interest-bearing liabilities, comprised primarily of deposits, maturing or repricing in similar time horizons in order to minimize or eliminate any impact from market interest rate changes. In order to measure earnings sensitivity to changing rates, the Company uses a static gap analysis and earnings simulation model.
The static GAP
analysis starts with contractual repricing information for assets, liabilities,
and off-balance sheet instruments. These items are then combined with repricing
estimations for administered rate (interest-bearing demand deposits, savings,
and money market accounts) and non-rate related products (demand deposit
accounts, other assets, and other liabilities) to create a baseline repricing
balance sheet. In addition, mortgage-backed securities are adjusted based on
industry estimates of prepayment speeds.
The following table
represents the estimated interest rate sensitivity and periodic and cumulative
gap positions calculated as of December 31, 2009. Significant assumptions used
for this table include: loans will repay at historic repayment rates;
interest-bearing demand accounts and savings accounts are interest sensitive due
to immediate repricing, and fixed maturity deposits will not be withdrawn prior
to maturity. A significant variance in actual results from one or more of these
assumptions could materially affect the results reflected in the
table.
| Beyond | ||||||||||||||||||||||||
| 5 years | ||||||||||||||||||||||||
| or no stated | ||||||||||||||||||||||||
| (in thousands) | Year 1 | Year 2 | Year 3 | Year 4 | Year 5 | maturity | Total | |||||||||||||||||
| Interest-Earning Assets | ||||||||||||||||||||||||
| Securities available for sale | $ | 118,701 | $ | 40,556 | $ | 43,266 | $ | 17,030 | $ | 58,897 | $ | 4,011 | $ | 282,461 | ||||||||||
| Other investments | - | - | - | - | 13,189 | 13,189 | ||||||||||||||||||
| Interest-bearing deposits | 83,430 | - | - | - | - | - | 83,430 | |||||||||||||||||
| Federal funds sold | 7,472 | - | - | - | - | - | 7,472 | |||||||||||||||||
| Loans (1) | 1,201,974 | 187,344 | 169,030 | 182,070 | 92,842 | - | 1,833,260 | |||||||||||||||||
| Loans held for sale | 4,243 | - | - | - | - | - | 4,243 | |||||||||||||||||
| Total interest-earning assets | $ | 1,415,820 | $ | 227,900 | $ | 212,296 | $ | 199,100 | $ | 151,739 | $ | 17,200 | $ | 2,224,055 | ||||||||||
| Interest-Bearing Liabilities | ||||||||||||||||||||||||
| Savings, NOW and Money market deposits | $ | 841,435 | $ | - | $ | - | $ | - | $ | - | $ | - | $ | 841,435 | ||||||||||
| Certificates of deposit | 668,183 | 89,363 | 25,059 | 26,769 | 949 | - | 810,323 | |||||||||||||||||
| Subordinated debentures | 42,374 | - | 14,433 | 25,774 | - | - | 82,581 | |||||||||||||||||
| Other borrowings | 60,138 | 5,300 | 22,000 | - | - | 80,000 | 167,438 | |||||||||||||||||
| Total interest-bearing liabilities | $ | 1,612,130 | $ | 94,663 | $ | 61,492 | $ | 52,543 | $ | 949 | $ | 80,000 | $ | 1,901,777 | ||||||||||
| Interest-sensitivity GAP | ||||||||||||||||||||||||
| GAP by period | $ | (196,310 | ) | $ | 133,237 | $ | 150,804 | $ | 146,557 | $ | 150,790 | $ | (62,800 | ) | $ | 322,278 | ||||||||
| Cumulative GAP | $ | (196,310 | ) | $ | (63,073 | ) | $ | 87,731 | $ | 234,288 | $ | 385,078 | $ | 322,278 | $ | 322,278 | ||||||||
| Ratio of interest-earning assets to | ||||||||||||||||||||||||
| interest-bearing liabilities | ||||||||||||||||||||||||
| Periodic | 0.88 | 2.41 | 3.45 | 3.79 | 159.89 | 0.22 | 1.17 | |||||||||||||||||
| Cumulative GAP as of December 31, 2009 | 0.88 | 0.96 | 1.05 | 1.13 | 1.21 | 1.17 | 1.17 | |||||||||||||||||
(1)
Adjusted for the impact of the interest rate swaps.
42
At December 31, 2009,
the Company was asset sensitive on a cumulative basis for all periods based on
contractual maturities. Asset sensitive means that assets will reprice faster
than liabilities.
Along with the static
GAP analysis, determining the sensitivity of short-term future earnings to a
hypothetical plus or minus 100 and 200 basis point parallel rate shock can be
accomplished through the use of simulation modeling. In addition to the
assumptions used to create the static gap, simulation of earnings includes the
modeling of the balance sheet as an ongoing entity. Future business assumptions
involving administered rate products, prepayments for future rate-sensitive
balances, and the reinvestment of maturing assets and liabilities are included.
These items are then modeled to project net interest income based on a
hypothetical change in interest rates. The resulting net interest income for the
next 12-month period is compared to the net interest income amount calculated
using flat rates. This difference represents the Company’s earnings sensitivity
to a plus or minus 100 basis points parallel rate shock.
The resulting
simulations for December 31, 2009 demonstrated that the Company’s balance sheet
was relatively neutral to interest rate changes. The simulations projected that
the annual net interest income of Enterprise would decrease by approximately
1.7% if rates increased by 100 basis points under a parallel rate shock,
primarily due to holding the Enterprise prime rate at 4.0% and implementing
floors on variable rate loans to protect a higher level of current earnings. The
simulations also projected that net interest income would decrease by 2.17% if
rates decreased by 100 basis points under a parallel rate shock, based primarily
on the assumption that deposit rates are near a minimum. Given the very low
level of short term interest rates, the falling interest rate shock simulations
are fairly irrelevant.
The Company
occasionally uses interest rate derivative financial instruments as an
asset/liability management tool to hedge mismatches in interest rate exposure
indicated by the net interest income simulation described above. They are used
to modify the Company’s exposures to interest rate fluctuations and provide more
stable spreads between loan yields and the rate on their funding sources. At
December 31, 2009, the Company had $30.3 million in notional amount of
outstanding interest rate swaps to help manage interest rate risk. Derivative
financial instruments are also discussed in Item 8, Note 8 – Derivative
Financial Instruments.
Contractual Obligations, Off-Balance Sheet
Risk, and Contingent Liabilities
Through the normal course of operations, the Company has entered into certain contractual obligations and other commitments. Such obligations relate to funding of operations through deposits or debt issuances, as well as leases for premises and equipment. As a financial services provider, the Company routinely enters into commitments to extend credit. While contractual obligations represent future cash requirements of the Company, a significant portion of commitments to extend credit may expire without being drawn upon. Such commitments are subject to the same credit policies and approval process accorded to loans made by the Company.
Through the normal course of operations, the Company has entered into certain contractual obligations and other commitments. Such obligations relate to funding of operations through deposits or debt issuances, as well as leases for premises and equipment. As a financial services provider, the Company routinely enters into commitments to extend credit. While contractual obligations represent future cash requirements of the Company, a significant portion of commitments to extend credit may expire without being drawn upon. Such commitments are subject to the same credit policies and approval process accorded to loans made by the Company.
The required
contractual obligations and other commitments, excluding any contractual
interest(1), at December 31, 2009 were as follows:
| Over 1 Year | |||||||||||
| Less Than | Less than | Over | |||||||||
| (in thousands) | Total | 1 Year | 5 Years | 5 Years | |||||||
| Operating leases | $ | 18,625 | $ | 1,984 | $ | 8,574 | $ | 8,067 | |||
| Certificates of deposit | 810,323 | 668,260 | 141,603 | 460 | |||||||
| Subordinated debentures | 85,081 | - | - | 85,081 | |||||||
| Federal Home Loan Bank advances | 128,100 | 20,800 | 27,300 | 80,000 | |||||||
| Commitments to extend credit | 457,776 | 322,855 | 109,457 | 25,464 | |||||||
| Standby letters of credit | 32,263 | 32,263 | - | - | |||||||
| Private equity bank fund | 2,842 | - | 2,842 | - | |||||||
| (1) |
In the banking
industry, interest-bearing obligations are principally utilized to fund
interest-earning assets. As such, interest charges on related contractual
obligations were excluded from reported amounts as the potential cash
outflows would have corresponding cash inflows from interest-earning
assets.
|
The Company also
enters into derivative contracts under which the Company either receives cash
from or pays cash to counterparties depending on changes in interest rates.
Derivative contracts are carried at fair value on the consolidated balance sheet
with the fair value representing the net present value of expected future cash
receipts or payments based on market interest rates as of the balance sheet
date. The fair value of these contracts changes daily as market interest rates
change. Derivative liabilities are not included as contractual cash obligations
as their fair value does not represent the amounts that may ultimately be paid
under these contracts.
43
CRITICAL ACCOUNTING
POLICIES
The following accounting policies are considered most critical to the understanding of the Company’s financial condition and results of operations. These critical accounting policies require management’s most difficult, subjective and complex judgments about matters that are inherently uncertain. Because these estimates and judgments are based on current circumstances, they may change over time or prove to be inaccurate based on actual experiences. In the event that different assumptions or conditions were to prevail, and depending upon the severity of such changes, the possibility of a materially different financial condition and/or results of operations could reasonably be expected. The impact and any associated risks related to our critical accounting policies on our business operations are discussed throughout “Management’s Discussion and Analysis of Financial Condition and Results of Operations,” where such policies affect our reported and expected financial results. For a detailed discussion on the application of these and other accounting policies, see Item 8, Note 1 – Significant Accounting Policies.
The following accounting policies are considered most critical to the understanding of the Company’s financial condition and results of operations. These critical accounting policies require management’s most difficult, subjective and complex judgments about matters that are inherently uncertain. Because these estimates and judgments are based on current circumstances, they may change over time or prove to be inaccurate based on actual experiences. In the event that different assumptions or conditions were to prevail, and depending upon the severity of such changes, the possibility of a materially different financial condition and/or results of operations could reasonably be expected. The impact and any associated risks related to our critical accounting policies on our business operations are discussed throughout “Management’s Discussion and Analysis of Financial Condition and Results of Operations,” where such policies affect our reported and expected financial results. For a detailed discussion on the application of these and other accounting policies, see Item 8, Note 1 – Significant Accounting Policies.
The Company has
prepared all of the consolidated financial information in this report in
accordance with U.S. generally accepted accounting principles (“U.S. GAAP”). The
Company makes estimates and assumptions that affect the reported amount of
assets and liabilities, disclosure of contingent assets and liabilities at the
date of the consolidated financial statements, and the reported amounts of
revenue and expenses during the reporting period. Such estimates include the
valuation of loans, goodwill, intangible assets, and other long-lived assets,
along with assumptions used in the calculation of income taxes, among others.
These estimates and assumptions are based on management’s best estimates and
judgment. Management evaluates its estimates and assumptions on an ongoing basis
using historical experience and other factors, including the current economic
environment, which management believes to be reasonable under the circumstances.
We adjust such estimates and assumptions when facts and circumstances dictate.
Decreasing real estate values, illiquid credit markets, volatile equity markets,
and declines in consumer spending have combined to increase the uncertainty
inherent in such estimates and assumptions. As future events and their effects
cannot be determined with precision, actual results could differ significantly
from these estimates. Changes in estimates resulting from continuing changes in
the economic environment will be reflected in the financial statement in future
periods. There can be no assurances that actual results will not differ from
those estimates.
Allowance for Loan
Losses
The Company maintains an allowance for loan losses (“the allowance”), which is intended to be management’s best estimate of probable inherent losses in the outstanding loan portfolio. The allowance is based on management’s continuing review and evaluation of the loan portfolio. The review and evaluation combines several factors including: consideration of past loan loss experience; trends in past due and nonperforming loans; risk characteristics of the various classifications of loans; existing economic conditions; the fair value of underlying collateral; and other qualitative and quantitative factors which could affect probable credit losses. Because current economic conditions can change and future events are inherently difficult to predict, the anticipated amount of estimated loan losses, and therefore the adequacy of the allowance, could change significantly. As an integral part of their examination process, various regulatory agencies also review the allowance for loan losses. These agencies may require that certain loan balances be charged off when their credit evaluations differ from those of management, based on their judgments about information available to them at the time of their examination. The Company believes the allowance for loan losses is adequate and properly recorded in the consolidated financial statements.
The Company maintains an allowance for loan losses (“the allowance”), which is intended to be management’s best estimate of probable inherent losses in the outstanding loan portfolio. The allowance is based on management’s continuing review and evaluation of the loan portfolio. The review and evaluation combines several factors including: consideration of past loan loss experience; trends in past due and nonperforming loans; risk characteristics of the various classifications of loans; existing economic conditions; the fair value of underlying collateral; and other qualitative and quantitative factors which could affect probable credit losses. Because current economic conditions can change and future events are inherently difficult to predict, the anticipated amount of estimated loan losses, and therefore the adequacy of the allowance, could change significantly. As an integral part of their examination process, various regulatory agencies also review the allowance for loan losses. These agencies may require that certain loan balances be charged off when their credit evaluations differ from those of management, based on their judgments about information available to them at the time of their examination. The Company believes the allowance for loan losses is adequate and properly recorded in the consolidated financial statements.
Acquisitions and
Divestitures
Assets and liabilities of acquired entities are recorded at their estimated fair values at the date of acquisition. Goodwill represents the excess of the purchase price over the fair value of net assets, including the amount assigned to identifiable intangible assets. The purchase price allocation process requires an analysis of the fair values of the assets acquired and the liabilities assumed. When a business combination agreement provides for an adjustment to the cost of the combination contingent on future events, the Company includes that adjustment in the cost of the combination when the contingent consideration is determinable beyond a reasonable doubt and can be reliably estimated. The results of operations of the acquired business are included in the Company’s consolidated financial statements from the respective date of acquisition. As a general rule, goodwill established in connection with a stock purchase is nondeductible for tax purposes.
Assets and liabilities of acquired entities are recorded at their estimated fair values at the date of acquisition. Goodwill represents the excess of the purchase price over the fair value of net assets, including the amount assigned to identifiable intangible assets. The purchase price allocation process requires an analysis of the fair values of the assets acquired and the liabilities assumed. When a business combination agreement provides for an adjustment to the cost of the combination contingent on future events, the Company includes that adjustment in the cost of the combination when the contingent consideration is determinable beyond a reasonable doubt and can be reliably estimated. The results of operations of the acquired business are included in the Company’s consolidated financial statements from the respective date of acquisition. As a general rule, goodwill established in connection with a stock purchase is nondeductible for tax purposes.
44
Assets classified as held for sale are reported at the lower
of its carrying value at the date the assets is initially classified as held for
sale or its fair value less costs to sell. The results of operations of a
component that either has been disposed of or held for sale is reported as
discontinued operation if:
- the operations and cash flows of
the disposal group will be eliminated from the ongoing operations as a result
of the disposal transaction; and
- the Company will not have any significant continuing involvement in the operations of the entity after the disposal transaction.
Any incremental
direct costs incurred to transact the sale are allocated against the gain or
loss on the sale. These costs would include items like legal fees, title
transfer fees, broker fees, etc. Any goodwill associated with the portion of the
reporting unit that constitutes a business to be disposed of is included in the
carrying amount of the business in determining the gain or loss on the sale.
Also, any intangible assets or write down to fair value associated with the
entity to be disposed of is also included in the carrying amount of the business
in determining the gain or loss on the sale. The gain or loss on the sale is
classified in the consolidated statements of income as noninterest
income.
Goodwill and Other Intangible
Assets
Our goodwill impairment tests are completed as of December 31 each year and for goodwill and intangible assets whenever events or changes in circumstances indicate that the Company may not be able to recover the respective asset’s carrying amount. Such tests involve the use of various estimates and assumptions. Management believes that the estimates and assumptions utilized are reasonable. However, the Company may incur impairment charges related to goodwill or intangible assets in the future due to changes in business prospects or other matters that could affect our estimates and assumptions.
Our goodwill impairment tests are completed as of December 31 each year and for goodwill and intangible assets whenever events or changes in circumstances indicate that the Company may not be able to recover the respective asset’s carrying amount. Such tests involve the use of various estimates and assumptions. Management believes that the estimates and assumptions utilized are reasonable. However, the Company may incur impairment charges related to goodwill or intangible assets in the future due to changes in business prospects or other matters that could affect our estimates and assumptions.
Goodwill is tested
for impairment at the reporting unit level. Reporting units are defined as the
same level as, or one level below, an operating segment. An operating segment is
a component of a business for which separate financial information is available
that management regularly evaluates in deciding how to allocate resources and
assess performance. The Company’s reporting units are Trust and the Banking
operations of Enterprise. At December 31, 2009 and 2008, the Trust reporting
unit had no goodwill.
Businesses must
identify potential impairments by comparing the fair value of a reporting unit
to its carrying amount, including goodwill. Goodwill impairment does not occur
as long as the fair value of the unit is greater than its carrying value. The
second step of the impairment test is only required if a goodwill impairment is
identified in step one. The second step of the test compares the implied fair
market value of goodwill to its carrying amount. If the carrying amount of
goodwill exceeds its implied fair market value, an impairment loss is
recognized. That loss is equal to the carrying amount of goodwill that is in
excess of its implied fair market value.
Intangible assets
other than goodwill, such as core deposit intangibles, that are determined to
have finite lives are amortized over their estimated remaining useful lives.
These assets are reviewed for impairment whenever events or changes in
circumstances indicate that the carrying amount of an asset may not be
recoverable. Recoverability of assets to be held and used is measured by a
comparison of the carrying amount of an asset to estimated undiscounted future
cash flows expected to be generated by the asset. If the carrying amount of an
asset exceeds its estimated future cash flows, an impairment charge is
recognized by the amount by which the carrying amount of the asset exceeds the
fair value of the asset.
There are three
general approaches commonly used in business valuation: income approach,
asset-based approach, and market approach. Within each of these approaches,
there are various techniques for determining the value of a business using the
definition of value appropriate for the appraisal assignment. Professional
judgment is required to determine which valuation methods are the most
appropriate. The valuation may utilize one or more of the approaches. Generally,
the income approaches determine value by calculating the net present value of
the benefit stream generated by the business (discounted cash flow); the
asset-based approaches determine value by adding the sum of the parts of the
business (net asset value); and the market approaches determine value by
comparing the subject company to other companies in the same industry, of the
same size, and/or within the same region.
Banking reporting unit
The Banking reporting unit’s goodwill and intangible assets were evaluated for impairment as of March 31, 2009. In connection with these tests, we determined that the deterioration in the general economic environment and the resulting decline in the Company’s share price and market capitalization in the first quarter of 2009 required a goodwill impairment charge. As a result, the Company recorded a $45.4 million, pre-tax goodwill impairment charge as of March 31, 2009 thus eliminating all goodwill in the Banking segment at that time.
The Banking reporting unit’s goodwill and intangible assets were evaluated for impairment as of March 31, 2009. In connection with these tests, we determined that the deterioration in the general economic environment and the resulting decline in the Company’s share price and market capitalization in the first quarter of 2009 required a goodwill impairment charge. As a result, the Company recorded a $45.4 million, pre-tax goodwill impairment charge as of March 31, 2009 thus eliminating all goodwill in the Banking segment at that time.
The 2008 and 2007
annual impairment evaluations of the goodwill and intangible balances did not
identify any impairment for the Banking reporting unit.
45
In conjunction with
the December 2009 FDIC-assisted transaction, we recorded $953,000 of goodwill
based on the fair value of the assets purchased and liabilities
assumed.
State Tax Credits Held for
Sale
The Company purchases the rights to receive 10-year streams of state tax credits at agreed upon discount rates and sells such tax credits to Wealth Management clients. All state tax credits purchased prior to 2009 are accounted for at fair value. All state tax credits purchased in 2009 are accounted for at lower of cost or fair value. The Company elected not to account for the state tax credits purchased in 2009 at fair value in order to limit the volatility of the fair value changes in our consolidated statements of operations.
The Company purchases the rights to receive 10-year streams of state tax credits at agreed upon discount rates and sells such tax credits to Wealth Management clients. All state tax credits purchased prior to 2009 are accounted for at fair value. All state tax credits purchased in 2009 are accounted for at lower of cost or fair value. The Company elected not to account for the state tax credits purchased in 2009 at fair value in order to limit the volatility of the fair value changes in our consolidated statements of operations.
The Company is not
aware of an active financial market for the 10-year streams of state tax credit
financial instruments. However, the Company’s principal market for these tax
credits consists of state residents who buy them to reduce their state tax
exposure. The state tax credits purchased by the Company are held until they are
“usable” and then are sold to our clients for a profit.
The Company utilizes
a discounted cash flow analysis (income approach) to determine the fair value of
the state tax credits. The fair value measurement is calculated using an
internal valuation model. The inputs to the fair value calculation include: the
amount of tax credits generated each year, the anticipated sale price of the tax
credit, the timing of the sale and a discount rate. The discount rate is defined
as the LIBOR swap curve at a point equal to the remaining life in years of
credits plus a risk premium spread. With the exception of the discount rate, the
inputs to the fair value calculation are observable and readily available. The
discount rate is an “unobservable input” and is based on the Company’s
assumptions. As a result, fair value measurement for these instruments falls
within Level 3 of the fair value hierarchy.
At December 31, 2009,
the discount rates utilized in our state tax credits fair value calculation
ranged from 2.30% to 6.01%. Changes in the fair value of the state tax credits
held for sale reduced the State tax credit activity, net in the consolidated
statement of operations for the year ended December 31, 2009 by $1.3 million. A
rate simulation with a 100 basis point parallel rate shock to the discount rate
was run for December 31, 2009. The resulting simulation indicates that if the
LIBOR swap curve were to increase by 100 basis points, the fair value of the
state tax credits would be lower by approximately $1.1 million. We would expect
a portion of this decline would be offset by a change in the value of derivative
financial instruments used to economically hedge the state tax
credits.
These Level 3 fair
value measurements are based primarily upon our own estimates and are calculated
based on the current economic and regulatory environment, interest rate risks
and other factors. Therefore, the results cannot be determined with precision,
cannot be substantiated by comparison to quoted prices in active markets, and
may not be realized in a current sale or immediate settlement of the asset or
liability. Additionally, there are inherent uncertainties in any fair value
measurement technique, and changes in the underlying assumptions used, including
the discount rate and estimate of future cash flows, could significantly affect
the fair value measurement amounts.
Derivative Financial
Instruments
The Company uses derivative financial instruments to assist in managing interest rate sensitivity. The derivative financial instruments used are interest rate swaps and caps. Derivative financial instruments are required to be measured at fair value and recognized as either assets or liabilities in the consolidated financial statements. Fair value represents the payment the Company would receive or pay if the item were sold or bought in a current transaction. As of December 31, 2009, the Company used nondesignated derivative financial instruments to economically hedge changes in the fair value of state tax credits held for sale and changes in the fair value of certain loans accounted for as trading instruments. In addition, the Company also offers an interest-rate hedge program that includes interest rate swaps to assist its customers in managing their interest-rate risk profile. In order to eliminate the interest-rate risk associated with offering these products, the Company enters into derivative contracts with third parties to offset the customer contracts. These customer accommodation interest rate swap contracts are not designated as hedging instruments.
The Company uses derivative financial instruments to assist in managing interest rate sensitivity. The derivative financial instruments used are interest rate swaps and caps. Derivative financial instruments are required to be measured at fair value and recognized as either assets or liabilities in the consolidated financial statements. Fair value represents the payment the Company would receive or pay if the item were sold or bought in a current transaction. As of December 31, 2009, the Company used nondesignated derivative financial instruments to economically hedge changes in the fair value of state tax credits held for sale and changes in the fair value of certain loans accounted for as trading instruments. In addition, the Company also offers an interest-rate hedge program that includes interest rate swaps to assist its customers in managing their interest-rate risk profile. In order to eliminate the interest-rate risk associated with offering these products, the Company enters into derivative contracts with third parties to offset the customer contracts. These customer accommodation interest rate swap contracts are not designated as hedging instruments.
46
- Cash Flow Hedges – Derivatives
designated as cash flow hedges are recorded at fair value. The effective
portion of the change in fair value is recorded (net of taxes) as a component
of other comprehensive income (“OCI”) in shareholders’ equity. Amounts
recorded in OCI are subsequently reclassified into interest income or expense
(depending on whether the hedged item is an asset or liability) when the
underlying transaction affects earnings. The ineffective portion of the change
in fair value is recorded in noninterest income. Upon dedesignation of a
derivative financial instrument from a cash flow hedge relationship, any
remaining amounts in OCI are recorded in noninterest income over the expected
remaining life of the underlying forecasted hedge transaction. The net
interest differential between the hedged item and the hedging derivative
financial instrument are recorded as an adjustment to interest income or
interest expense of the related asset or liability.
- Fair Value Hedges – For
derivatives designated as fair value hedges, the change in fair value of the
derivative instrument and related hedged item are recorded in the related
interest income or expense, as applicable, except for the ineffective portion,
which is recorded in noninterest income in the consolidated statements of
income. The swap agreement is accounted for on an accrual basis with the net
interest differential being recognized as an adjustment to interest income or
interest expense of the related asset or liability.
- Non-Designated Hedges – Certain derivative financial instruments are not designated as cash flow or as fair value hedges for accounting purposes. These non-designated derivatives are entered into to provide interest rate protection on net interest income or noninterest income but do not meet hedge accounting treatment. Changes in the fair value of these instruments are recorded in interest income or noninterest income in the consolidated statements of operations depending on the underlying hedged item.
The judgments and
assumptions most critical to the application of this accounting policy are those
affecting the estimation of fair value and hedge effectiveness. Changes in
assumptions and conditions could result in greater than expected inefficiencies
that, if large enough, could reduce or eliminate the economic benefits
anticipated when the hedges were established and/or invalidate continuation of
hedge accounting. Greater inefficiency and discontinuation of hedge accounting
can result in increased volatility in reported earnings. For cash flow hedges,
this would result in more or all of the change in the fair value of the related
derivative financial instruments being reported in income. In December 2008, the
Company discontinued hedge accounting on two prime based loan hedge
relationships as a result of the significant decrease in the prime rate. As a
result of the dedesignation, the changes in the fair value of the related
derivative financial instruments are being reported in income without a
corresponding and offsetting change in the fair value for the loans previously
hedged.
Deferred Tax Assets and
Liabilities
The Company accounts for income taxes under the asset/liability method. Deferred tax assets and liabilities are recognized for future tax effects of temporary differences, net operating loss carry forwards and tax credits. Deferred tax assets are reduced if necessary, by a deferred tax asset valuation allowance. A valuation allowance is established when in the judgment of management, it is more likely than not that such deferred tax assets will not become realizable. In this case, we would adjust the recorded value of our deferred tax assets, which would result in a direct charge to income tax expense in the period that the determination is made. Likewise, we would reverse the valuation allowance when realization of the deferred tax asset is expected.
The Company accounts for income taxes under the asset/liability method. Deferred tax assets and liabilities are recognized for future tax effects of temporary differences, net operating loss carry forwards and tax credits. Deferred tax assets are reduced if necessary, by a deferred tax asset valuation allowance. A valuation allowance is established when in the judgment of management, it is more likely than not that such deferred tax assets will not become realizable. In this case, we would adjust the recorded value of our deferred tax assets, which would result in a direct charge to income tax expense in the period that the determination is made. Likewise, we would reverse the valuation allowance when realization of the deferred tax asset is expected.
Effects of New Accounting
Pronouncements
See Item 8, Note 24 – New Authoritative Accounting Guidance for information on recent accounting pronouncements and their impact, if any, on our consolidated financial statements.
See Item 8, Note 24 – New Authoritative Accounting Guidance for information on recent accounting pronouncements and their impact, if any, on our consolidated financial statements.
ITEM 7A: QUANTITATIVE AND QUALITATIVE
DISCLOSURES ABOUT MARKET RISK
Please refer to “Risk
Factors” included in Item 1A and “Risk Management” included in Management’s
Discussion and Analysis under Item 7.
47
ITEM 8: FINANCIAL STATEMENTS AND SUPPLEMENTARY
DATA
Enterprise Financial Services Corp and
subsidiaries
| Page Number | |
| Report of Independent Registered Public Accounting Firm | 49 |
| Consolidated Balance Sheets at December 31, 2009 and 2008 | 50 |
| Consolidated Statements of Operations for the years | |
| ended December 31, 2009, 2008, and 2007 | 51 |
| Consolidated Statements of Shareholders’ Equity and Comprehensive (Loss) Income | |
| for the years ended December 31, 2009, 2008, and 2007 | 52 |
| Consolidated Statements of Cash Flows for the | |
| years ended December 31, 2009, 2008, and 2007 | 53 |
| Notes to Consolidated Financial Statements | 54 |
48
Report of Independent Registered Public
Accounting Firm
The Board of
Directors and Shareholders
Enterprise Financial Services Corp:
Enterprise Financial Services Corp:
We have audited the
accompanying consolidated balance sheets of Enterprise Financial Services Corp
and subsidiaries (the Company) as of December 31, 2009 and 2008, and the related
consolidated statements of operations, shareholders’ equity and comprehensive
(loss) income, and cash flows for each of the years in the three-year period
ended December 31, 2009. These consolidated financial statements are the
responsibility of the Company’s management. Our responsibility is to express an
opinion on these consolidated financial statements based on our audits.
We conducted our
audits in accordance with the standards of the Public Company Accounting
Oversight Board (United States). Those standards require that we plan and
perform the audit to obtain reasonable assurance about whether the financial
statements are free of material misstatement. An audit includes examining, on a
test basis, evidence supporting the amounts and disclosures in the financial
statements. An audit also includes assessing the accounting principles used and
significant estimates made by management, as well as evaluating the overall
financial statement presentation. We believe that our audits provide a
reasonable basis for our opinion.
In our opinion, the
consolidated financial statements referred to above present fairly, in all
material respects, the financial position of the Company as of December 31, 2009
and 2008, and the results of their operations and their cash flows for each of
the years in the three-year period ended December 31, 2009, in conformity with
U.S. generally accepted accounting principles.
As discussed in Note
2 to the consolidated financial statements, the 2008 and 2007 financial
statements have been restated to correct a misstatement.
We also have audited,
in accordance with the standards of the Public Company Accounting Oversight
Board (United States), the Company’s internal control over financial reporting
as of December 31, 2009, based on criteria established in Internal Control –
Integrated Framework issued by the Committee of Sponsoring Organizations of the
Treadway Commission (COSO), and our report dated March 12, 2010 expressed an
unqualified opinion on the effectiveness of the Company’s internal control over
financial reporting.
 |
| St. Louis, MO March 12, 2010 |
49
ENTERPRISE FINANCIAL SERVICES CORP AND
SUBSIDIARIES
Consolidated Balance Sheets
Years ended December 31, 2009 and 2008
Consolidated Balance Sheets
Years ended December 31, 2009 and 2008
| December 31, | ||||||||
| (In thousands, except share and per share data) | Restated | |||||||
| 2009 | 2008 | |||||||
| Assets | ||||||||
| Cash and due from banks | $ | 16,064 | $ | 25,626 | ||||
| Federal funds sold | 7,472 | 2,637 | ||||||
| Interest-bearing deposits | 83,430 | 14,384 | ||||||
| Total cash and cash equivalents | 106,966 | 42,647 | ||||||
| Securities available for sale | 282,461 | 96,431 | ||||||
| Other investments, at cost | 13,189 | 11,884 | ||||||
| Loans held for sale | 4,243 | 2,632 | ||||||
| Portfolio loans | 1,833,260 | 2,201,457 | ||||||
| Less: Allowance for loan losses | 42,995 | 33,808 | ||||||
| Portfolio loans, net | 1,790,265 | 2,167,649 | ||||||
| Other real estate | 26,372 | 13,868 | ||||||
| Fixed assets, net | 22,301 | 25,158 | ||||||
| Accrued interest receivable | 7,751 | 7,557 | ||||||
| State tax credits, held for sale, including $32,485 and $39,142 | ||||||||
| carried at fair value, respectively | 51,258 | 39,142 | ||||||
| Goodwill | 953 | 48,512 | ||||||
| Intangibles, net | 1,643 | 3,504 | ||||||
| Assets of discontinued operations held for sale | 4,000 | - | ||||||
| Other assets | 54,253 | 34,783 | ||||||
| Total assets | $ | 2,365,655 | $ | 2,493,767 | ||||
| Liabilities and Shareholders' Equity | ||||||||
| Deposits: | ||||||||
| Demand deposits | $ | 289,658 | $ | 247,361 | ||||
| Interest-bearing transaction accounts | 142,061 | 126,644 | ||||||
| Money market accounts | 690,552 | 702,886 | ||||||
| Savings | 8,822 | 7,826 | ||||||
| Certificates of deposit: | ||||||||
| $100k and over | 443,067 | 520,197 | ||||||
| Other | 367,256 | 187,870 | ||||||
| Total deposits | 1,941,416 | 1,792,784 | ||||||
| Subordinated debentures | 85,081 | 85,081 | ||||||
| Federal Home Loan Bank advances | 128,100 | 119,957 | ||||||
| Other borrowings | 39,338 | 272,969 | ||||||
| Accrued interest payable | 2,125 | 2,473 | ||||||
| Other liabilities | 5,683 | 5,931 | ||||||
| Total liabilities | 2,201,743 | 2,279,195 | ||||||
| Shareholders' equity: | ||||||||
| Preferred stock, $0.01 par value; | ||||||||
| 5,000,000 shares authorized; | ||||||||
| 35,000 shares issued and outstanding | 31,802 | 31,116 | ||||||
| Common stock, $0.01 par value; | ||||||||
| 30,000,000 shares authorized; 12,958,820 and | ||||||||
| 12,876,981 shares issued, respectively | 130 | 129 | ||||||
| Treasury stock, at cost; 76,000 shares | (1,743 | ) | (1,743 | ) | ||||
| Additional paid in capital | 117,000 | 115,112 | ||||||
| Retained earnings | 15,790 | 68,710 | ||||||
| Accumulated other comprehensive income | 933 | 1,248 | ||||||
| Total shareholders' equity | 163,912 | 214,572 | ||||||
| Total liabilities and shareholders' equity | $ | 2,365,655 | $ | 2,493,767 | ||||
See accompanying
notes to consolidated financial statements.
50
ENTERPRISE FINANCIAL SERVICES CORP AND
SUBSIDIARIES
Consolidated Statements of Operations
Years ended December 31, 2009, 2008 and 2007
Consolidated Statements of Operations
Years ended December 31, 2009, 2008 and 2007
| Years ended December 31, | ||||||||||||
| (In thousands, except per share data) | Restated | Restated | ||||||||||
| 2009 | 2008 | 2007 | ||||||||||
| Interest income: | ||||||||||||
| Interest and fees on loans | $ | 112,548 | $ | 121,467 | $ | 124,624 | ||||||
| Interest on debt securities: | ||||||||||||
| Taxable | 5,459 | 4,722 | 4,571 | |||||||||
| Nontaxable | 24 | 31 | 34 | |||||||||
| Interest on federal funds sold | 6 | 211 | 481 | |||||||||
| Interest on interest-bearing deposits | 130 | 43 | 17 | |||||||||
| Dividends on equity securities | 319 | 547 | 522 | |||||||||
| Total interest income | 118,486 | 127,021 | 130,249 | |||||||||
| Interest expense: | ||||||||||||
| Interest-bearing transaction accounts | 662 | 1,554 | 3,078 | |||||||||
| Money market accounts | 6,079 | 13,786 | 23,578 | |||||||||
| Savings | 35 | 55 | 125 | |||||||||
| Certificates of deposit: | ||||||||||||
| $100 and over | 15,592 | 18,127 | 18,329 | |||||||||
| Other | 7,835 | 6,398 | 7,754 | |||||||||
| Subordinated debentures | 5,171 | 3,536 | 3,859 | |||||||||
| Federal Home Loan Bank advances | 4,797 | 6,649 | 4,277 | |||||||||
| Notes payable and other borrowings | 8,674 | 10,233 | 8,242 | |||||||||
| Total interest expense | 48,845 | 60,338 | 69,242 | |||||||||
| Net interest income | 69,641 | 66,683 | 61,007 | |||||||||
| Provision for loan losses | 40,412 | 26,510 | 5,120 | |||||||||
| Net interest income after provision for loan losses | 29,229 | 40,173 | 55,887 | |||||||||
| Noninterest income: | ||||||||||||
| Wealth Management revenue | 4,524 | 5,916 | 7,159 | |||||||||
| Service charges on deposit accounts | 5,012 | 4,376 | 3,228 | |||||||||
| Other service charges and fee income | 963 | 1,000 | 852 | |||||||||
| Sale of branches/charter | - | 3,400 | - | |||||||||
| Sale of other real estate | (436 | ) | 552 | (48 | ) | |||||||
| State tax credit activity, net | 1,035 | 4,201 | 792 | |||||||||
| Sale of investment securities | 955 | 161 | 233 | |||||||||
| Extinguishment of debt | 7,388 | - | - | |||||||||
| Miscellaneous income | 436 | 735 | 636 | |||||||||
| Total noninterest income | 19,877 | 20,341 | 12,852 | |||||||||
| Noninterest expense: | ||||||||||||
| Employee compensation and benefits | 25,969 | 27,656 | 27,412 | |||||||||
| Occupancy | 4,709 | 3,985 | 3,651 | |||||||||
| Furniture and equipment | 1,425 | 1,390 | 1,366 | |||||||||
| Data processing | 2,147 | 2,139 | 1,873 | |||||||||
| Amortization of intangibles | 482 | 599 | 692 | |||||||||
| Goodwill impairment charge | 45,377 | - | - | |||||||||
| Loan legal and other real estate expense | 4,788 | 1,717 | 501 | |||||||||
| Other | 13,530 | 11,290 | 9,200 | |||||||||
| Total noninterest expense | 98,427 | 48,776 | 44,695 | |||||||||
| (Loss) income from continuing operations before income tax (benefit) expense | (49,321 | ) | 11,738 | 24,044 | ||||||||
| Income tax (benefit) expense | (2,650 | ) | 3,672 | 8,098 | ||||||||
| (Loss) income from continuing operations | (46,671 | ) | 8,066 | 15,946 | ||||||||
| (Loss) income from discontinued operations before income tax (benefit) expense | (408 | ) | (9,757 | ) | 2,045 | |||||||
| Loss on disposal before income tax benefit | (1,587 | ) | - | - | ||||||||
| Income tax (benefit) expense | (711 | ) | (3,539 | ) | 736 | |||||||
| (Loss) income from discontinued operations | (1,284 | ) | (6,218 | ) | 1,309 | |||||||
| Net (loss) income | $ | (47,955 | ) | $ | 1,848 | $ | 17,255 | |||||
| Net (loss) income available to common shareholders | $ | (50,369 | ) | $ | 1,769 | $ | 17,255 | |||||
| Basic (loss) earnings per common share: | ||||||||||||
| From continuing operations | $ | (3.82 | ) | $ | 0.63 | $ | 1.30 | |||||
| From discontinued operations | (0.10 | ) | (0.49 | ) | 0.11 | |||||||
| Total | $ | (3.92 | ) | $ | 0.14 | $ | 1.41 | |||||
| Diluted (loss) earnings per common share: | ||||||||||||
| From continuing operations | $ | (3.82 | ) | $ | 0.63 | $ | 1.27 | |||||
| From discontinued operations | (0.10 | ) | (0.49 | ) | 0.10 | |||||||
| Total | $ | (3.92 | ) | $ | 0.14 | $ | 1.37 | |||||
See accompanying
notes to consolidated financial statements.
51
ENTERPRISE FINANCIAL SERVICES CORP AND
SUBSIDIARIES
Consolidated Statements of Shareholders’ Equity and Comprehensive (Loss) Income
Years ended December 31, 2007, 2008, and 2009
Consolidated Statements of Shareholders’ Equity and Comprehensive (Loss) Income
Years ended December 31, 2007, 2008, and 2009
| Accumulated | ||||||||||||||||||||||||||
| other | Total | |||||||||||||||||||||||||
| Preferred | Common | Treasury | Additional paid | Retained | comprehensive | shareholders' | ||||||||||||||||||||
| (in thousands, except per share data) | Stock | in capital | earnings | income (loss) | equity | |||||||||||||||||||||
| Balance December 31, 2006 (Restated) | $ | - | $ | 115 | $ | - | $ | 78,026 | $ | 55,133 | $ | (592 | ) | $ | 132,682 | |||||||||||
| Cumulative effect of adoption of FIN 48 | - | - | - | - | 138 | - | 138 | |||||||||||||||||||
| Balance January 1, 2007 (Restated) | $ | - | $ | 115 | $ | - | $ | 78,026 | $ | 55,271 | $ | (592 | ) | $ | 132,820 | |||||||||||
| Net income (Restated) | - | - | - | - | 17,255 | - | 17,255 | |||||||||||||||||||
| Change in fair value of investment securities, net of tax | - | - | - | - | - | 858 | 858 | |||||||||||||||||||
| Reclassification adjustment for realized gain | ||||||||||||||||||||||||||
| on sale of securities included in net income, net of tax | - | - | - | - | - | (149 | ) | (149 | ) | |||||||||||||||||
| Total comprehensive income (Restated) | 17,964 | |||||||||||||||||||||||||
| Cash dividends paid on common shares, $0.21 per share | - | - | - | - | (2,638 | ) | - | (2,638 | ) | |||||||||||||||||
| Issuance under equity compensation plans, net, 194,737 shares | - | 2 | - | 1,486 | - | - | 1,488 | |||||||||||||||||||
| Purchase of Treasury Stock, 76,000 shares | - | - | (1,743 | ) | - | - | - | (1,743 | ) | |||||||||||||||||
| Acquisition of Clayco Banc Corporation, 698,733 shares | - | 7 | - | 21,193 | - | - | 21,200 | |||||||||||||||||||
| Additional contingent shares issued in connection with | ||||||||||||||||||||||||||
| acquisition of NorthStar Bancshares, Inc., 49,348 shares | - | 1 | - | 1,281 | - | - | 1,282 | |||||||||||||||||||
| Share-based compensation | - | - | - | 1,760 | - | - | 1,760 | |||||||||||||||||||
| Excess tax benefit related to equity compensation plans | - | - | - | 381 | - | - | 381 | |||||||||||||||||||
| Balance December 31, 2007 (Restated) | $ | - | $ | 125 | $ | (1,743 | ) | $ | 104,127 | $ | 69,888 | $ | 117 | $ | 172,514 | |||||||||||
| Cumulative effect of adoption of SFAS No. 159 | - | - | - | (365 | ) | - | (365 | ) | ||||||||||||||||||
| Balance January 1, 2008 (Restated) | $ | - | $ | 125 | $ | (1,743 | ) | $ |
104,127
|
$ | 69,523 | $ | 117 | $ | 172,149 | |||||||||||
| Net income (Restated) | - | - | - | - | 1,848 | - | 1,848 | |||||||||||||||||||
| Change in fair value of available for sale securities, net of tax | - | - | - | - | - | 816 | 816 | |||||||||||||||||||
| Reclassification adjustment for realized gain | ||||||||||||||||||||||||||
| on sale of securities included in net income, net of tax | - | - | - | - | - | (103 | ) | (103 | ) | |||||||||||||||||
| Change in fair value of cash flow hedges, net of tax | - | - | - | - | 418 | 418 | ||||||||||||||||||||
| Total comprehensive income (Restated) | 2,979 | |||||||||||||||||||||||||
| Cash dividends paid on common shares, $0.21 per share | - | - | - | - | (2,661 | ) | - | (2,661 | ) | |||||||||||||||||
| Issuance of preferred stock and associated warrants, 35,000 shares | 31,116 | - | - | 3,884 | - | - | 35,000 | |||||||||||||||||||
| Issuance under equity compensation plans, net 361,665 shares | - | 4 | - | 3,555 | - | - | 3,559 | |||||||||||||||||||
| Additional share-based compensation in connection with | ||||||||||||||||||||||||||
| acquisition of Clayco Banc Corporation, 32,959 shares | - | - | - | 1,000 | - | - | 1,000 | |||||||||||||||||||
| Share-based compensation | - | - | - | 2,085 | - | - | 2,085 | |||||||||||||||||||
| Excess tax benefit related to equity compensation plans | - | - | - | 460 | - | - | 460 | |||||||||||||||||||
| Balance December 31, 2008 (Restated) | $ | 31,116 | $ | 129 | $ | (1,743 | ) | $ | 115,112 | $ | 68,710 | $ | 1,248 | $ | 214,572 | |||||||||||
| Net loss | - | - | - | - | (47,955 | ) | - | (47,955 | ) | |||||||||||||||||
| Change in fair value of available for sale securities, net of tax | - | - | - | - | - | 455 | 455 | |||||||||||||||||||
| Reclassification adjustment for realized gain | ||||||||||||||||||||||||||
| on sale of securities included in net income, net of tax | - | - | - | - | - | (611 | ) | (611 | ) | |||||||||||||||||
| Reclassification of cash flow hedge, net of tax | - | - | - | - | - | (159 | ) | (159 | ) | |||||||||||||||||
| Total comprehensive loss | (48,270 | ) | ||||||||||||||||||||||||
| Cash dividends paid on common shares, $0.21 per share | - | - | - | - | (2,694 | ) | - | (2,694 | ) | |||||||||||||||||
| Cash dividends paid on preferred stock | - | - | - | - | (1,585 | ) | - | (1,585 | ) | |||||||||||||||||
| Preferred stock accretion of discount and issuance cost | 686 | - | - | (130 | ) | (686 | ) | - | (130 | ) | ||||||||||||||||
| Issuance under equity compensation plans, net, 81,839 shares | - | 1 | - | 322 | - | - | 323 | |||||||||||||||||||
| Share-based compensation | - | - | - | 2,034 | - | - | 2,034 | |||||||||||||||||||
| Excess tax expense on additional share-based compensation | ||||||||||||||||||||||||||
| in connection with acquisition of Clayco Banc Corporation | - | - | - | (364 | ) | - | - | (364 | ) | |||||||||||||||||
| Excess tax benefit related to equity compensation plans | - | - | - | 26 | - | - | 26 | |||||||||||||||||||
| Balance December 31, 2009 | $ | 31,802 | $ | 130 | $ | (1,743 | ) | $ | 117,000 | $ | 15,790 | $ | 933 | $ | 163,912 | |||||||||||
See accompanying
notes to consolidated financial statements.
52
| Years ended December 31, | |||||||||||
| Restated | Restated | ||||||||||
| (in thousands) | 2009 | 2008 | 2007 | ||||||||
| Cash flows from operating activities: | |||||||||||
| Net (loss) income | $ | (47,955 | ) | $ | 1,848 | $ | 17,255 | ||||
| Adjustments to reconcile net (loss) income to net cash from operating activities | |||||||||||
| Depreciation | 3,595 | 2,690 | 2,465 | ||||||||
| Provision for loan losses | 40,412 | 26,510 | 5,120 | ||||||||
| Deferred income taxes | (2,545 | ) | (7,699 | ) | 565 | ||||||
| Net amortization of debt securities | 1,415 | 545 | (195 | ) | |||||||
| Amortization of intangible assets | 1,078 | 1,444 | 1,604 | ||||||||
| Gain on sale of investment securities | (955 | ) | (161 | ) | (233 | ) | |||||
| Mortgage loans originated | (91,884 | ) | (46,416 | ) | (81,221 | ) | |||||
| Proceeds from mortgage loans sold | 89,636 | 47,300 | 80,551 | ||||||||
| Loss (gain) on sale of other real estate | 436 | (552 | ) | 48 | |||||||
| Gain on state tax credits, net | (1,035 | ) | (4,201 | ) | (792 | ) | |||||
| Additional share-based compensation from acquisition of Clayco | - | 1,000 | - | ||||||||
| Excess tax expense on additional share-based compensation from acquisition of Clayco | 364 | - | - | ||||||||
| Excess tax benefits of share-based compensation | (26 | ) | (460 | ) | (381 | ) | |||||
| Share-based compensation | 2,202 | 2,255 | 1,944 | ||||||||
| Gain on sale of branches/charter | - | (3,400 | ) | - | |||||||
| Loss on disposal of Millennium Brokerage Group | 1,587 | - | - | ||||||||
| Goodwill impairment charge | 45,377 | 9,200 | - | ||||||||
| Changes in: | |||||||||||
| Accrued interest receivable and income tax receivable | 2,230 | (3,054 | ) | 720 | |||||||
| Accrued interest payable and other liabilities | (214 | ) | (2,203 | ) | (1,013 | ) | |||||
| Prepaid FDIC insurance | (11,472 | ) | - | - | |||||||
| Other, net | (3,498 | ) | (4,356 | ) | (1,220 | ) | |||||
| Net cash provided by operating activities | 28,748 | 20,290 | 25,217 | ||||||||
| Cash flows from investing activities: | |||||||||||
| Cash paid in sale of branch/charter, net of cash and cash equivalents received | - | (20,736 | ) | (9,375 | ) | ||||||
| Cash received from acquisition | 15,105 | - | - | ||||||||
| Net decrease (increase) in loans | 98,239 | (369,123 | ) | (168,032 | ) | ||||||
| Proceeds from the sale/maturity/redemption/recoveries of: | |||||||||||
| Debt and equity securities, available for sale | 85,377 | 41,505 | 104,212 | ||||||||
| Other investments | 426 | 21,216 | 11,622 | ||||||||
| State tax credits held for sale | 7,709 | 4,422 | 4,578 | ||||||||
| Other real estate | 16,034 | 6,753 | 5,260 | ||||||||
| Loans previously charged off | 590 | 372 | 509 | ||||||||
| Payments for the purchase/origination of: | |||||||||||
| Available for sale debt and equity securities | (271,954 | ) | (71,699 | ) | (67,066 | ) | |||||
| Other investments | (2,184 | ) | (26,707 | ) | (1,831 | ) | |||||
| State tax credits held for sale | (15,227 | ) | (15,271 | ) | (27,726 | ) | |||||
| Fixed assets | (552 | ) | (7,467 | ) | (3,379 | ) | |||||
| Net cash used in investing activities | (66,437 | ) | (436,735 | ) | (151,228 | ) | |||||
| Cash flows from financing activities: | |||||||||||
| Net increase (decrease) in noninterest-bearing deposit accounts | 39,592 | (28,868 | ) | 28,313 | |||||||
| Net increase in interest-bearing deposit accounts | 65,686 | 273,312 | 90,092 | ||||||||
| Proceeds from issuance of subordinated debentures | - | 28,274 | 18,557 | ||||||||
| Paydown of subordinated debentures | - | - | (4,124 | ) | |||||||
| Net proceeds from Federal Home Loan Bank advances | 8,143 | (32,943 | ) | 96,303 | |||||||
| Net proceeds from federal funds purchased | (19,400 | ) | 19,400 | - | |||||||
| Net increase in other borrowings | 12,578 | 16,080 | 923 | ||||||||
| Net proceeds from notes payable | - | (6,000 | ) | 1,999 | |||||||
| Cash dividends paid on common stock | (2,694 | ) | (2,661 | ) | (2,638 | ) | |||||
| Excess tax expense on additional share-based compensation from acquisition of Clayco | (364 | ) | - | - | |||||||
| Excess tax benefits of share-based compensation | 26 | 460 | 381 | ||||||||
| Issuance of preferred stock and warrants | - | 35,000 | - | ||||||||
| Cash dividends paid on preferred stock | (1,585 | ) | - | - | |||||||
| Preferred stock issuance cost | (130 | ) | - | - | |||||||
| Repurchase of common stock | - | - | (1,743 | ) | |||||||
| Proceeds from the exercise of common stock options | 156 | 3,389 | 1,304 | ||||||||
| Net cash provided by financing activities | 102,008 | 305,443 | 229,367 | ||||||||
| Net increase (decrease) in cash and cash equivalents | 64,319 | (111,002 | ) | 103,356 | |||||||
| Cash and cash equivalents, beginning of period | 42,647 | 153,649 | 50,293 | ||||||||
| Cash and cash equivalents, end of period | $ | 106,966 | $ | 42,647 | $ | 153,649 | |||||
| Supplemental disclosures of cash flow information: | |||||||||||
| Cash (received) paid during the period for: | |||||||||||
| Interest | $ | 49,193 | $ | 52,495 | $ | 61,223 | |||||
| Income taxes | (2,817 | ) | 11,579 | 7,854 | |||||||
| Noncash transactions: | |||||||||||
| Common stock issued for acquisitions | $ | - | $ | - | $ | 22,482 | |||||
| Transfer to other real estate owned in settlement of loans | 33,717 | 18,432 | 5,979 | ||||||||
| Sales of other real estate financed | 6,258 | 1,840 | - | ||||||||
See accompanying notes to consolidated financial
statements.
53
ENTERPRISE FINANCIAL SERVICES CORP AND
SUBSIDIARIES
Notes to Consolidated Financial Statements
NOTE 1—SUMMARY OF SIGNIFICANT ACCOUNTING
POLICIES
The more significant
accounting policies used by the Company in the preparation of the consolidated
financial statements are summarized below:
Business and
Consolidation
Enterprise Financial Services Corp (the “Company” or “EFSC”) is a financial holding company that provides a full range of banking and wealth management services to individuals and corporate customers located in the St. Louis, Kansas City and Phoenix metropolitan markets through its banking subsidiary, Enterprise Bank & Trust (“Enterprise”). The consolidated financial statements include the accounts of the Company, and its subsidiaries, all of which are wholly owned. Millennium results are reported as discontinued operations for all periods presented (see Note 3). All material intercompany accounts and transactions have been eliminated.
Enterprise Financial Services Corp (the “Company” or “EFSC”) is a financial holding company that provides a full range of banking and wealth management services to individuals and corporate customers located in the St. Louis, Kansas City and Phoenix metropolitan markets through its banking subsidiary, Enterprise Bank & Trust (“Enterprise”). The consolidated financial statements include the accounts of the Company, and its subsidiaries, all of which are wholly owned. Millennium results are reported as discontinued operations for all periods presented (see Note 3). All material intercompany accounts and transactions have been eliminated.
On January 20, 2010,
the Company sold its interest in Millennium Brokerage Group, LLC (“Millennium”)
for $4.0 million in cash. Enterprise acquired 60% of Millennium in October 2005
and acquired the remaining 40% in December 2007. As a result of the sale,
Millennium financial results are reported as discontinued operations for all
periods presented.
On December 11, 2009,
Enterprise entered into an agreement with the Federal Deposit Insurance
Corporation (“FDIC”) and acquired certain assets and assumed certain liabilities
of Valley Capital Bank N.A., a full service community bank that was
headquartered in Mesa, Arizona.
On July 31, 2008, the
Company sold its remaining interest in Great American Bank (“Great American”).
See Note 3 –
Acquisition and Divestitures for more information on the above transactions.
The Company is
subject to competition from other financial and nonfinancial institutions
providing financial services in the markets served by the Company’s subsidiary.
Additionally, the Company and its banking subsidiary are subject to the
regulations of certain federal and state agencies and undergo periodic
examinations by those regulatory agencies.
Accounting Standards
Codification
The Financial Accounting Standards Board’s (“FASB”) Accounting Standards Codification (“ASC”) became effective on July 1, 2009. At that date, the ASC became FASB’s officially recognized source of authoritative U.S. generally accepted accounting principles (“U.S. GAAP”) applicable to all public and non-public non-governmental entities, superseding existing FASB, American Institute of Certified Public Accountants (“AICPA”), Emerging Issues Task Force (“EITF”) and related literature. Rules and interpretive releases of the SEC under the authority of federal securities laws are also sources of authoritative GAAP for SEC registrants. All other accounting literature is considered non-authoritative. The switch to the ASC affects the way companies refer to U.S. GAAP in financial statements and accounting policies. Citing particular content in the ASC involves specifying the unique numeric path to the content through the Topic, Subtopic, Section and Paragraph structure.
The Financial Accounting Standards Board’s (“FASB”) Accounting Standards Codification (“ASC”) became effective on July 1, 2009. At that date, the ASC became FASB’s officially recognized source of authoritative U.S. generally accepted accounting principles (“U.S. GAAP”) applicable to all public and non-public non-governmental entities, superseding existing FASB, American Institute of Certified Public Accountants (“AICPA”), Emerging Issues Task Force (“EITF”) and related literature. Rules and interpretive releases of the SEC under the authority of federal securities laws are also sources of authoritative GAAP for SEC registrants. All other accounting literature is considered non-authoritative. The switch to the ASC affects the way companies refer to U.S. GAAP in financial statements and accounting policies. Citing particular content in the ASC involves specifying the unique numeric path to the content through the Topic, Subtopic, Section and Paragraph structure.
Use of Estimates
The consolidated financial statements of the Company and its subsidiaries have been prepared in conformity with U.S. GAAP and conform to predominant practices within the banking industry. In preparing the consolidated financial statements, management is required to make estimates and assumptions, which significantly affect the reported amounts in the consolidated financial statements. Such estimates include the valuation of loans, goodwill, intangible assets, and other long-lived assets, along with assumptions used in the calculation of income taxes, among others. These estimates and assumptions are based on management’s best estimates and judgment. Management evaluates its estimates and assumptions on an ongoing basis using historical experience and other factors, including the current economic environment, which management believes to be reasonable under the circumstances. We adjust such estimates and assumptions when facts and circumstances dictate. Decreasing real estate values, illiquid credit markets, volatile equity markets, and declines in consumer spending have combined to increase the uncertainty inherent in such estimates and assumptions. As future events and their effects cannot be determined with precision, actual results could differ significantly from these estimates. Changes in those estimates resulting from continuing changes in the economic environment will be reflected in the financial statement in future periods.
The consolidated financial statements of the Company and its subsidiaries have been prepared in conformity with U.S. GAAP and conform to predominant practices within the banking industry. In preparing the consolidated financial statements, management is required to make estimates and assumptions, which significantly affect the reported amounts in the consolidated financial statements. Such estimates include the valuation of loans, goodwill, intangible assets, and other long-lived assets, along with assumptions used in the calculation of income taxes, among others. These estimates and assumptions are based on management’s best estimates and judgment. Management evaluates its estimates and assumptions on an ongoing basis using historical experience and other factors, including the current economic environment, which management believes to be reasonable under the circumstances. We adjust such estimates and assumptions when facts and circumstances dictate. Decreasing real estate values, illiquid credit markets, volatile equity markets, and declines in consumer spending have combined to increase the uncertainty inherent in such estimates and assumptions. As future events and their effects cannot be determined with precision, actual results could differ significantly from these estimates. Changes in those estimates resulting from continuing changes in the economic environment will be reflected in the financial statement in future periods.
54
Fair Value
Effective January 1, 2008, the Company adopted the Fair Value Measurements and Disclosures provisions of ASC 820 (as amended), which establishes a framework for measuring fair value and requires enhanced disclosures about fair value measurements. ASC 820 clarifies that fair value is an exit price, representing the amount that would be received to sell an asset or paid to transfer a liability in an orderly transaction between market participants. ASC 820 also requires disclosure about how fair value is determined for assets and liabilities and establishes a hierarchy for which these assets and liabilities must be grouped, based on significant levels of inputs. See Note 20 – Fair Value Measurements for more information.
Effective January 1, 2008, the Company adopted the Fair Value Measurements and Disclosures provisions of ASC 820 (as amended), which establishes a framework for measuring fair value and requires enhanced disclosures about fair value measurements. ASC 820 clarifies that fair value is an exit price, representing the amount that would be received to sell an asset or paid to transfer a liability in an orderly transaction between market participants. ASC 820 also requires disclosure about how fair value is determined for assets and liabilities and establishes a hierarchy for which these assets and liabilities must be grouped, based on significant levels of inputs. See Note 20 – Fair Value Measurements for more information.
Cash Flow Information
For purposes of reporting cash flows, the Company considers cash and due from banks, interest-bearing deposits and federal funds sold to be cash and cash equivalents. At December 31, 2009 and 2008, approximately $8,405,000 and $10,018,000, respectively, of cash and due from banks represented required reserves on deposits maintained by the Company in accordance with Federal Reserve Bank requirements.
For purposes of reporting cash flows, the Company considers cash and due from banks, interest-bearing deposits and federal funds sold to be cash and cash equivalents. At December 31, 2009 and 2008, approximately $8,405,000 and $10,018,000, respectively, of cash and due from banks represented required reserves on deposits maintained by the Company in accordance with Federal Reserve Bank requirements.
Reclassification
Certain immaterial reclassifications have been made to the 2008 and 2007 amounts to conform to the current year presentation. Such reclassifications had no effect on previously reported consolidated net income or shareholders’ equity. In addition, as described in Note 2 – Loan Participation Restatement, amounts related to loan participations have been restated in 2008 and 2007.
Certain immaterial reclassifications have been made to the 2008 and 2007 amounts to conform to the current year presentation. Such reclassifications had no effect on previously reported consolidated net income or shareholders’ equity. In addition, as described in Note 2 – Loan Participation Restatement, amounts related to loan participations have been restated in 2008 and 2007.
Investments
The Company has classified all investments in debt securities as available for sale.
The Company has classified all investments in debt securities as available for sale.
Securities classified
as available for sale are carried at estimated fair value. Unrealized holding
gains and losses for available for sale securities are excluded from earnings
and reported as a net amount in a separate component of shareholders’ equity
until realized. All previous fair value adjustments included in the separate
component of shareholders’ equity are reversed upon sale.
Declines in the fair
value of securities below their cost that are deemed to be other than temporary
are reflected in operations as realized losses. In estimating
other-than-temporary impairment losses, management systematically evaluates
investment securities for other-than-temporary declines in fair value on a
quarterly basis. This analysis requires management to consider various factors,
which include (1) the present value of the cash flows expected to be collected
compared to the amortized cost of the security, (2) duration and magnitude of
the decline in value, (3) the financial condition of the issuer or issuers, (4)
structure of the security, and (5) the intent to sell the security or whether
its more likely than not that the Company would be required to sell the security
before its anticipated recovery in market value.
Premiums and
discounts are amortized or accreted over the expected lives of the respective
securities as an adjustment to yield using the interest method. Dividend and
interest income is recognized when earned. Realized gains and losses are
included in earnings and are derived using the specific identification method
for determining the cost of securities sold.
Loans Held for Sale
The Company provides long-term financing of one-to-four-family residential real estate by originating fixed and variable rate loans. Long-term, fixed and variable rate loans are sold into the secondary market without recourse. Upon receipt of an application for a real estate loan, the Company determines whether the loan will be sold into the secondary market or retained in the Company’s loan portfolio. The interest rates on the loans sold are locked with the buyer and the Company bears no interest rate risk related to these loans. Mortgage loans held for sale are carried at the lower of cost or fair value, which is determined on a specific identification method. The Company does not retain servicing on any loans sold, nor did the Company have any capitalized mortgage servicing rights at December 31, 2009 or 2008. Gains on the sale of loans held for sale are reported net of direct origination fees and costs in the Company’s consolidated statements of operations.
The Company provides long-term financing of one-to-four-family residential real estate by originating fixed and variable rate loans. Long-term, fixed and variable rate loans are sold into the secondary market without recourse. Upon receipt of an application for a real estate loan, the Company determines whether the loan will be sold into the secondary market or retained in the Company’s loan portfolio. The interest rates on the loans sold are locked with the buyer and the Company bears no interest rate risk related to these loans. Mortgage loans held for sale are carried at the lower of cost or fair value, which is determined on a specific identification method. The Company does not retain servicing on any loans sold, nor did the Company have any capitalized mortgage servicing rights at December 31, 2009 or 2008. Gains on the sale of loans held for sale are reported net of direct origination fees and costs in the Company’s consolidated statements of operations.
Portfolio Loans
Loans are reported at the principal balance outstanding net of unearned fees and costs. Loan origination fees and direct origination costs are deferred and recognized over the lives of the related loans as a yield adjustment using a method, which approximates the interest method.
Loans are reported at the principal balance outstanding net of unearned fees and costs. Loan origination fees and direct origination costs are deferred and recognized over the lives of the related loans as a yield adjustment using a method, which approximates the interest method.
Interest income on
loans is accrued to income based on the principal amount outstanding. The
recognition of interest income is discontinued when a loan becomes 90 days past
due or a significant deterioration in the borrower’s credit has occurred which,
in management’s opinion, negatively impacts the collectability of the
loan.
55
Subsequent interest
payments received on such loans are applied to principal if any doubt exists as
to the collectability of such principal; otherwise, such receipts are recorded
as interest income. Loans that have not been restructured are returned to
accrual status when management believes full collectability of principal and
interest is expected. Non-accrual loans that have been restructured will remain
in a nonaccrual status until the borrower has made six consecutive contractual
payments.
Loans Acquired Through
Transfer
Loans acquired through the completion of a transfer, including loans acquired in a business combination, that have evidence of deterioration of credit quality since origination and for which it is probable, at acquisition, that the Company will be unable to collect all contractually required payments receivable are initially recorded at fair value (as determined by the present value of expected future cash flows) with no valuation allowance. The difference between the undiscounted cash flows expected at acquisition and the investment in the loans, or the “accretable yield,” is recognized as interest income on a level-yield method over the life of the loans. Contractually required payments for interest and principal that exceed the undiscounted cash flows expected at acquisition, or the “nonaccretable difference,” are not recognized as a yield adjustment or as a loss accrual or a valuation allowance. Increases in expected cash flows subsequent to the initial investment are recognized prospectively through adjustment of the yield on the loans over their remaining lives. Decreases in expected cash flows are recognized as impairment. Valuation allowances on these impaired loans reflect only losses incurred after the acquisition (meaning the present value of all cash flows expected at acquisition that ultimately are not to be received).
Loans acquired through the completion of a transfer, including loans acquired in a business combination, that have evidence of deterioration of credit quality since origination and for which it is probable, at acquisition, that the Company will be unable to collect all contractually required payments receivable are initially recorded at fair value (as determined by the present value of expected future cash flows) with no valuation allowance. The difference between the undiscounted cash flows expected at acquisition and the investment in the loans, or the “accretable yield,” is recognized as interest income on a level-yield method over the life of the loans. Contractually required payments for interest and principal that exceed the undiscounted cash flows expected at acquisition, or the “nonaccretable difference,” are not recognized as a yield adjustment or as a loss accrual or a valuation allowance. Increases in expected cash flows subsequent to the initial investment are recognized prospectively through adjustment of the yield on the loans over their remaining lives. Decreases in expected cash flows are recognized as impairment. Valuation allowances on these impaired loans reflect only losses incurred after the acquisition (meaning the present value of all cash flows expected at acquisition that ultimately are not to be received).
Impaired Loans
A loan is considered impaired when management believes it is probable that collection of all amounts due, both principal and interest, according to the contractual terms of the loan agreement will not occur. Non-accrual loans, loans past due greater than 90 days and still accruing, and restructured loans qualify as “impaired loans.” Loans are also considered “impaired” when it becomes probable that the Company will be unable to collect all amounts due according to the loan’s contractual terms. Restructured loans involve the granting of a concession to a borrower experiencing financial difficulty involving the modification of terms of the loan, such as changes in payment schedule or interest rate.
A loan is considered impaired when management believes it is probable that collection of all amounts due, both principal and interest, according to the contractual terms of the loan agreement will not occur. Non-accrual loans, loans past due greater than 90 days and still accruing, and restructured loans qualify as “impaired loans.” Loans are also considered “impaired” when it becomes probable that the Company will be unable to collect all amounts due according to the loan’s contractual terms. Restructured loans involve the granting of a concession to a borrower experiencing financial difficulty involving the modification of terms of the loan, such as changes in payment schedule or interest rate.
When measuring
impairment, the expected future cash flows of an impaired loan are discounted at
the loan’s effective interest rate. Alternatively, impairment is measured by
reference to an observable market price, if one exists, or the fair value of the
collateral for a collateral-dependent loan. Interest income on impaired loans is
recorded when cash is received and only if principal is considered to be fully
collectible. Loans and leases, which are deemed uncollectable, are charged off
and deducted from the allowance for loan losses, while recoveries of amounts
previously charged off are credited to the allowance for loan
losses.
Impaired loans
exclude credit-impaired loans that were acquired in the December 2009
FDIC-assisted transaction in Arizona. These purchased credit-impaired loans are
accounted for on a pool basis, and the pools are considered to be performing.
See Note 3 – Acquisition and Divestitures for more information on these
loans.
Allowance For Loan
Losses
The allowance for loan losses is increased by provision charged to expense and is available to absorb charge offs, net of recoveries. Management utilizes a systematic, documented approach in determining the appropriate level of the allowance for loan losses. The level of the allowance reflects management’s continuing evaluation of industry concentrations; specific credit risks; loan loss experience; current loan portfolio quality; present economic, political and regulatory conditions; and unexpected losses inherent in the current loan portfolio. The determination of the appropriate level of the allowance for loan losses inherently involves a degree of subjectivity and requires that we make significant estimates of current credit risks and future trends, all of which may undergo material changes. Changes in economic conditions affecting borrowers, new information regarding existing loans, identification of additional problem loans and other factors, both within and outside of our control, may require an increase in the allowance for loan losses.
The allowance for loan losses is increased by provision charged to expense and is available to absorb charge offs, net of recoveries. Management utilizes a systematic, documented approach in determining the appropriate level of the allowance for loan losses. The level of the allowance reflects management’s continuing evaluation of industry concentrations; specific credit risks; loan loss experience; current loan portfolio quality; present economic, political and regulatory conditions; and unexpected losses inherent in the current loan portfolio. The determination of the appropriate level of the allowance for loan losses inherently involves a degree of subjectivity and requires that we make significant estimates of current credit risks and future trends, all of which may undergo material changes. Changes in economic conditions affecting borrowers, new information regarding existing loans, identification of additional problem loans and other factors, both within and outside of our control, may require an increase in the allowance for loan losses.
Management believes
the allowance for loan losses is adequate to absorb probable losses in the loan
portfolio. While management uses available information to recognize losses on
loans, future additions to the allowance may be necessary based on changes in
economic conditions and other factors. In addition, various regulatory agencies,
as an integral part of the examination process, periodically review the Bank’s
loan portfolio. Such agencies may require additions to the allowance for loan
losses based on their judgments and interpretations of information available to
them at the time of their examinations.
56
Other Real Estate
Other real estate represents property acquired through foreclosure or deeded to the Company in lieu of foreclosure on loans on which the borrowers have defaulted as to the payment of principal and interest. Other real estate is recorded on an individual asset basis at the lower of cost or fair value less estimated costs to sell. The fair value of other real estate is based upon estimates of future cash flows, market value of similar assets, if available or independent appraisals. These estimates involve significant uncertainties and judgments and cannot be determined with certainty. As a result, fair value estimates may not be realizable in a current sale or settlement of the other real estate. Subsequent reductions in fair value are expensed.
Other real estate represents property acquired through foreclosure or deeded to the Company in lieu of foreclosure on loans on which the borrowers have defaulted as to the payment of principal and interest. Other real estate is recorded on an individual asset basis at the lower of cost or fair value less estimated costs to sell. The fair value of other real estate is based upon estimates of future cash flows, market value of similar assets, if available or independent appraisals. These estimates involve significant uncertainties and judgments and cannot be determined with certainty. As a result, fair value estimates may not be realizable in a current sale or settlement of the other real estate. Subsequent reductions in fair value are expensed.
Gains and losses
resulting from the sale of other real estate are credited or charged to current
period earnings. Costs of maintaining and operating other real estate are
expensed as incurred, and expenditures to complete or improve other real estate
properties are capitalized if the expenditures are expected to be recovered upon
ultimate sale of the property.
Fixed Assets
Buildings, leasehold improvements, and furniture, fixtures, equipment, and capitalized software are stated at cost less accumulated depreciation and amortization is computed using the straight-line method over their respective estimated useful lives. Furniture, fixtures and equipment is depreciated over three to ten years and buildings and leasehold improvements over ten to forty years based upon lease obligation periods.
Buildings, leasehold improvements, and furniture, fixtures, equipment, and capitalized software are stated at cost less accumulated depreciation and amortization is computed using the straight-line method over their respective estimated useful lives. Furniture, fixtures and equipment is depreciated over three to ten years and buildings and leasehold improvements over ten to forty years based upon lease obligation periods.
State Tax Credits Held for
Sale
The Company purchases the rights to receive 10-year streams of state tax credits at agreed upon discount rates and sells such tax credits to Wealth Management customers. All state tax credits purchased prior to 2009 are accounted for at fair value. All state tax credits purchased in 2009 are accounted for at the lower of cost or fair value. The Company elected not to account for the state tax credits purchased in 2009 at fair value in order to limit the volatility of the fair value changes in the Company’s consolidated statements of operations.
The Company purchases the rights to receive 10-year streams of state tax credits at agreed upon discount rates and sells such tax credits to Wealth Management customers. All state tax credits purchased prior to 2009 are accounted for at fair value. All state tax credits purchased in 2009 are accounted for at the lower of cost or fair value. The Company elected not to account for the state tax credits purchased in 2009 at fair value in order to limit the volatility of the fair value changes in the Company’s consolidated statements of operations.
Goodwill and Other Intangible
Assets
The Company tests goodwill for impairment on an annual basis and whenever events or changes in circumstances indicate that the Company may not be able to recover the respective asset’s carrying amount. Such tests involve the use of estimates and assumptions. Core deposit intangibles are amortized using an accelerated method over an estimated useful life of approximately 10 years.
The Company tests goodwill for impairment on an annual basis and whenever events or changes in circumstances indicate that the Company may not be able to recover the respective asset’s carrying amount. Such tests involve the use of estimates and assumptions. Core deposit intangibles are amortized using an accelerated method over an estimated useful life of approximately 10 years.
Businesses must
identify potential goodwill impairments by comparing the fair value of a
reporting unit to its carrying amount, including goodwill. Goodwill impairment
is not indicated as long as the fair value of the reporting unit is greater than
its carrying value. The second step of the impairment test is only required if a
goodwill impairment is identified in step one. The second step of the test
compares the implied fair value of goodwill to its carrying amount. If the
carrying amount of goodwill exceeds its implied fair value, an impairment loss
is recognized. That loss is equal to the carrying amount of goodwill that is in
excess of its implied fair market value.
Impairment of Long-Lived
Assets
Long-lived assets, such as fixed assets and purchased intangibles subject to amortization, are reviewed for impairment whenever events or changes in circumstances indicate that the carrying amount of an asset may not be recoverable. Recoverability of assets to be held and used is measured by a comparison of the carrying amount of an asset to estimated undiscounted future cash flows expected to be generated by the asset. If the carrying amount of an asset exceeds its estimated future cash flows, an impairment charge is recognized by the amount by which the carrying amount of the asset exceeds the fair value of the asset. Assets to be disposed of are separately presented in the balance sheet and reported at the lower of the carrying amount or fair value less costs to sell, and are no longer depreciated. The assets and liabilities of a disposal group classified as held for sale are presented separately in the appropriate asset and liability sections of the balance sheet.
Long-lived assets, such as fixed assets and purchased intangibles subject to amortization, are reviewed for impairment whenever events or changes in circumstances indicate that the carrying amount of an asset may not be recoverable. Recoverability of assets to be held and used is measured by a comparison of the carrying amount of an asset to estimated undiscounted future cash flows expected to be generated by the asset. If the carrying amount of an asset exceeds its estimated future cash flows, an impairment charge is recognized by the amount by which the carrying amount of the asset exceeds the fair value of the asset. Assets to be disposed of are separately presented in the balance sheet and reported at the lower of the carrying amount or fair value less costs to sell, and are no longer depreciated. The assets and liabilities of a disposal group classified as held for sale are presented separately in the appropriate asset and liability sections of the balance sheet.
Derivative Financial Instruments and Hedging
Activities
The Company uses derivative financial instruments to assist in the management of interest rate sensitivity and to modify the repricing, maturity and option characteristics of certain assets and liabilities. In addition, the Company also offers an interest-rate hedge program that includes interest rate swaps to assist its customers in managing their interest-rate risk profile. In order to eliminate the interest-rate risk associated with offering these products, the Company enters into derivative contracts with third parties to offset the customer contracts.
The Company uses derivative financial instruments to assist in the management of interest rate sensitivity and to modify the repricing, maturity and option characteristics of certain assets and liabilities. In addition, the Company also offers an interest-rate hedge program that includes interest rate swaps to assist its customers in managing their interest-rate risk profile. In order to eliminate the interest-rate risk associated with offering these products, the Company enters into derivative contracts with third parties to offset the customer contracts.
Derivative
instruments are required to be measured at fair value and recognized as either
assets or liabilities in the consolidated financial statements. Fair value
represents the payment the Company would receive or pay if the item were sold or
bought in a current transaction. The accounting for changes in fair value (gains
or losses) of a hedged item is dependent on whether the related derivative is
designated and qualifies for “hedge accounting.” The Company assigns derivatives
to one of these categories at the purchase date: fair value hedge, cash flow
hedge or non-designated derivatives. An assessment of the expected and ongoing
hedge effectiveness of any derivative designated a fair value hedge or cash flow
hedge is performed as required by the accounting standards. Derivatives are
included in other assets and other liabilities in the consolidated balance
sheets. Generally, the only derivative instruments used by the Company have been
interest rate swaps and interest rate caps.
57
The following is a
summary of the Company’s accounting policies for derivative instruments and
hedging activities.
- Cash Flow Hedges – Derivatives designated as cash flow
hedges are recorded at fair value. The effective portion of the change in fair
value is recorded (net of taxes) as a component of other comprehensive income
(“OCI”) in shareholders’ equity. Amounts recorded in OCI are subsequently
reclassified into interest income or expense (depending on whether the hedged
item is an asset or liability) when the underlying transaction affects
earnings. The ineffective portion of the change in fair value is recorded in
noninterest income. Upon dedesignation of a derivative financial instrument
from a cash flow hedge relationship, any remaining amounts in OCI are recorded
in noninterest income over the expected remaining life of the underlying
forecasted hedge transaction. The net interest differential between the hedged
item and the hedging derivative financial instrument are recorded as an
adjustment to interest income or interest expense of the related asset or
liability.
- Fair Value Hedges – For derivatives designated as fair value
hedges, the change in fair value of the derivative instrument and related
hedged item are recorded in the related interest income or expense, as
applicable, except for the ineffective portion, which is recorded in
noninterest income in the consolidated statements of income. The swap agreement is accounted for on an
accrual basis with the net interest differential being recognized as an
adjustment to interest income or interest expense of the related asset or
liability.
- Non-Designated Hedges – Certain derivative financial instruments are not designated as cash flow or as fair value hedges for accounting purposes. These non-designated derivatives are intended to provide interest rate protection on net interest income or noninterest income but do not meet hedge accounting treatment. Customer accommodation interest rate swap contracts are not designated as hedging instruments. Changes in the fair value of these instruments are recorded in interest income or noninterest income in the consolidated statements of income depending on the underlying hedged item.
Income Taxes
The Company and its subsidiaries file consolidated federal income tax returns. Deferred tax assets and liabilities are recognized for the estimated future tax consequences attributable to differences between the financial statement carrying amounts of existing assets and liabilities and their respective tax bases. Deferred tax assets and liabilities are measured using enacted tax rates in effect for the year in which those temporary differences are expected to be recovered or settled. A valuation allowance is recognized if the Company determines it is more likely than not that all or some portion of the deferred tax asset will not be recognized. In estimating accrued taxes, the Company assesses the relative merits and risks of the appropriate tax treatment considering statutory, judicial and regulatory guidance in the context of the tax position. Because of the complexity of tax laws and regulations, interpretation can be difficult and subject to legal judgment given specific facts and circumstances. It is possible that others, given the same information, may at any point in time reach different reasonable conclusions regarding the estimated amounts of accrued taxes.
The Company and its subsidiaries file consolidated federal income tax returns. Deferred tax assets and liabilities are recognized for the estimated future tax consequences attributable to differences between the financial statement carrying amounts of existing assets and liabilities and their respective tax bases. Deferred tax assets and liabilities are measured using enacted tax rates in effect for the year in which those temporary differences are expected to be recovered or settled. A valuation allowance is recognized if the Company determines it is more likely than not that all or some portion of the deferred tax asset will not be recognized. In estimating accrued taxes, the Company assesses the relative merits and risks of the appropriate tax treatment considering statutory, judicial and regulatory guidance in the context of the tax position. Because of the complexity of tax laws and regulations, interpretation can be difficult and subject to legal judgment given specific facts and circumstances. It is possible that others, given the same information, may at any point in time reach different reasonable conclusions regarding the estimated amounts of accrued taxes.
Stock-Based
Compensation
Stock-based compensation is recognized as an expense in the financial statements and measured at the grant date fair value for all equity classified awards.
Stock-based compensation is recognized as an expense in the financial statements and measured at the grant date fair value for all equity classified awards.
Acquisitions and
Divestitures
The Company accounts for business combinations using the purchase method of accounting. Accordingly, the assets and liabilities of the acquired entities have been recorded at their estimated fair values at the date of acquisition. Goodwill represents the excess of the purchase price over the fair value of net assets, including the amount assigned to identifiable intangible assets. The Company has one year to finalize the fair values and resulting goodwill resulting from any business combination.
The Company accounts for business combinations using the purchase method of accounting. Accordingly, the assets and liabilities of the acquired entities have been recorded at their estimated fair values at the date of acquisition. Goodwill represents the excess of the purchase price over the fair value of net assets, including the amount assigned to identifiable intangible assets. The Company has one year to finalize the fair values and resulting goodwill resulting from any business combination.
58
The purchase price
allocation process requires an estimation of the fair values of the assets
acquired and the liabilities assumed. When a business combination agreement
provides for an adjustment to the cost of the combination contingent on future
events, the Company includes that adjustment in the cost of the combination when
the contingent consideration is determinable beyond a reasonable doubt and can
be reliably estimated. The results of operations of the acquired business are
included in the Company’s consolidated financial statements from the respective
date of acquisition. As a general rule, goodwill established in connection with
a stock purchase is nondeductible for tax purposes.
For divestitures, the
Company measures an asset (disposal group) classified as held for sale at the
lower of its carrying value at the date the asset is initially classified as
held for sale or its fair value less costs to sell. The Company reports the
results of operations of a component that either has been disposed of or held to
sale as discontinued operations if:
- The operations and cash
flows of the disposal group will be eliminated from the ongoing operations as
a result of the disposal transaction, and
- The Company will not have any significant continuing involvement in the operations of the entity after the disposal transaction.
Any incremental
direct costs incurred to transact the sale are allocated against the gain or
loss on the sale. These costs would include items like legal fees, title
transfer fees, broker fees, etc. Any goodwill and intangible assets associated
with the portion of the reporting unit to be disposed of is included in the
carrying amount of the business in determining the gain or loss on the
sale.
NOTE 2—LOAN PARTICIPATION RESTATEMENT
During a review of
loan participation agreements in the third quarter of 2009, the Company
determined that certain of its loan participation agreements contained language
inconsistent with sale accounting treatment. The agreements provided the Company
with the unilateral ability to repurchase participated portions of loans at
their outstanding loan balance plus accrued interest at any time, which
conflicts with sale accounting treatment. As a result, rather than accounting
for loans participated to other banks as sales, the Company should have recorded
the participated portion of the loans as portfolio loans, and should have
recorded secured borrowings from the participating banks to finance such loans.
In order to correct the error, the Company recorded the participated portion of
such loans as portfolio loans, along with a secured borrowing liability
(included in Other borrowings in the consolidated balance sheets) to finance the
loans. The Company also recorded incremental interest income on the loans offset
by incremental interest expense on the secured borrowing. Additional provisions
for loan losses and the related income tax effect were also recorded. The
revision did not impact net cash provided by operating activities.
In the fourth quarter
of 2009, the Company obtained amended agreements so that all of the Company’s
loan participation agreements qualify for sale accounting treatment as of
December 31, 2009.
The Company has
corrected the error by restating the prior period consolidated financial
statements. Accordingly, the consolidated statements of operations,
shareholders’ equity and comprehensive (loss) income and cash flows for the
years ended December 31, 2008 and 2007, and the December 31, 2008 consolidated
balance sheet presented herein have been restated to correct the
error.
59
The effect of
correcting the error in the consolidated statements of operations for the years
ended December 31, 2008 and 2007 is presented below.
| For the Year ended December 31, | ||||||||||||
| 2008 | 2007 | |||||||||||
| (in thousands, except per share data) | As reported | As restated | As reported | As restated | ||||||||
| Income Statement: | ||||||||||||
| Total interest income | $ | 117,981 | $ | 127,021 | $ | 122,517 | $ | 130,249 | ||||
| Total interest expense | 51,258 | 60,338 | 61,465 | 69,242 | ||||||||
| Provision for loan losses | 22,475 | 26,510 | 4,615 | 5,120 | ||||||||
| Income tax expense | 1,586 | 133 | 9,016 | 8,834 | ||||||||
| Net income | 4,430 | 1,848 | 17,578 | 17,255 | ||||||||
| Net income available to common shareholders | 4,351 | 1,769 | 17,578 | 17,255 | ||||||||
| Earnings per share: | ||||||||||||
| Basic earnings per share | 0.35 | 0.14 | 1.44 | 1.41 | ||||||||
| Diluted earnings per share | 0.34 | 0.14 | 1.40 | 1.37 | ||||||||
The effect of
correcting the error in the consolidated balance sheet at December 31, 2008 is
included in the following table.
| At December 31, 2008 | ||||||
| (in thousands) | As reported | As restated | ||||
| Portfolio loans | $ | 1,977,175 | $ | 2,201,457 | ||
| Allowance for loan losses | 31,309 | 33,808 | ||||
| Other assets | 32,973 | 34,783 | ||||
| Total assets | 2,270,174 | 2,493,767 | ||||
| Loan participations (included in Other Borrowings) | - | 226,809 | ||||
| Total liabilities | 2,052,386 | 2,279,195 | ||||
| Shareholders' equity | 217,788 | 214,572 | ||||
Under the terms of
the agreements, the participating banks absorb credit losses, if any, on the
participated portion of the loan. However, as secured borrowings on the
Company’s consolidated financial statements, any reduction of the liability to
the participating bank reflecting the participated bank’s portion of the credit
loss is recorded only upon legal defeasance of such liability as a component of
the gain or loss on extinguishment. During the third quarter of 2009, the
Company recorded a $5.3 million pre-tax gain from the extinguishment of debt
resulting from the foreclosure of the collateral on one of its participated
loans, which was carried net of provisions for loan losses totaling $5.3 million
in previous periods.
In the fourth quarter
of 2009, the Company obtained amended agreements that comply with sale
accounting treatment from all of the participating banks. As a result, the
Company eliminated the participated loans, net of the allowance for losses, and
the related liability from our December 31, 2009 consolidated balance sheet, and
recognized an additional gain from the extinguishment of debt of $2.1
million.
60
NOTE 3—ACQUISITIONS AND
DIVESTITURES
Acquisition of Valley
Capital
On December 11, 2009, Enterprise entered into a loss sharing agreement with the FDIC and acquired certain assets and assumed certain liabilities of Valley Capital Bank NA (“Valley”), a full service community bank that was headquartered in Mesa, Arizona.
On December 11, 2009, Enterprise entered into a loss sharing agreement with the FDIC and acquired certain assets and assumed certain liabilities of Valley Capital Bank NA (“Valley”), a full service community bank that was headquartered in Mesa, Arizona.
The acquisition
consisted of tangible assets with an estimated fair value of approximately $42.4
million and liabilities with an estimated fair value of approximately $43.4
million. The following table summarizes the estimated fair values of the assets
acquired and liabilities assumed at the date of the acquisition:
| (in thousands) | Amount | |||
| Cash and cash equivalents | $ | 3,542 | ||
| Federal funds sold | 11,563 | |||
| Other investments | 59 | |||
| Portfolio loans | 14,730 | |||
| Other real estate | 3,455 | |||
| FDIC indemnification asset | 8,519 | |||
| Other assets | 567 | |||
| Total deposits | (43,355 | ) | ||
| Other liabilities | (33 | ) | ||
| Goodwill | $ | (953 | ) | |
Under the loss
sharing agreement, Enterprise will share in the losses on assets covered under
the agreement (“Covered Assets”). The FDIC has agreed to reimburse Enterprise
for 80 percent of the losses on Covered Assets up to $11,000,000 and 95 percent
of the losses on Covered Assets exceeding $11,000,000. Reimbursement for losses
on single family one-to-four residential mortgage loans are made quarterly until
the end of the quarter in which the tenth anniversary of the closing of the
acquisition occurs, and reimbursement for losses on non-single family
one-to-four residential mortgage loans are made quarterly until the end of the
quarter in which the fifth anniversary of the closing of the acquisition occurs.
The reimbursable losses from the FDIC are based on the book value of the
relevant loans and foreclosed assets as determined by the FDIC as of the date of
the acquisition, December 11, 2009. There was no allowance for credit losses
established related to the acquired loans at December 11, 2009.
The loss sharing
agreement is subject to the servicing procedures as specified in the agreement
with the FDIC. The expected reimbursements under the loss sharing agreement were
recorded as an indemnification asset at their estimated fair value of $8,519,000
on the acquisition date. Based upon the acquisition date fair values of the net
assets acquired, goodwill of $953,000 was recorded.
The preliminary
estimate of the cash flows expected to be received on credit-impaired loans
acquired in the Valley Capital acquisition were $10,579,000. The estimated fair
value of the loans is $9,225,000, net of an accretable yield of $1,354,000.
These amounts were determined based upon the estimated remaining life of the
underlying loans, including the effects of estimated prepayments. At the
acquisition date, a majority of these loans were valued based on the liquidation
value of the underlying collateral because the future cash flows are primarily
based on the liquidation of underlying collateral.
The preliminary
estimate of the cash flows expected to be received on non-credit-impaired loans
acquired in the Valley Capital acquisition were $7,089,000. The estimated fair
value of the loans is $5,505,000, net of an accretable yield of $1,584,000.
These amounts were determined based upon the estimated remaining life of the
underlying loans, which include the effects of estimated
prepayments.
The determination of
the initial fair value of loans and other real estate acquired in the
transaction and the initial fair value of the related FDIC indemnification asset
involve a high degree of judgment and complexity. The carrying value of the
acquired loans and other real estate and the FDIC indemnification asset reflect
management’s best estimate of the fair value of each of these assets as of the
date of acquisition. However, the amount that Enterprise realizes on these
assets could differ materially from the carrying value reflected in these
financial statements, based upon the timing and amount of collections on the
acquired loans in future periods. Because of the loss sharing agreement with the
FDIC on these assets, Enterprise should not incur any significant losses. To the
extent the actual values realized for the acquired loans are different from the
estimate, the indemnification asset will generally be affected in an offsetting
manner due to the loss sharing support from the FDIC.
61
Sale of Millennium - Discontinued
Operations
On October 13, 2005, the Company acquired 60% of Millennium, a Tennessee limited liability company, for total consideration of $15,000,000. On December 31, 2007, the Company purchased the remaining 40% interest for cash of $1,500,000. As a result, Millennium became a wholly owned subsidiary of the Company.
On October 13, 2005, the Company acquired 60% of Millennium, a Tennessee limited liability company, for total consideration of $15,000,000. On December 31, 2007, the Company purchased the remaining 40% interest for cash of $1,500,000. As a result, Millennium became a wholly owned subsidiary of the Company.
Millennium was no
longer considered a core business by management, therefore, on January 20, 2010,
the Company sold Millennium for cash of $4,000,000 resulting in a $1,587,000
pre-tax loss, net of associated costs. The operating results for Millennium,
including the loss on sale, have been reclassified and shown as discontinued
operations in the consolidated statements of operations for all periods
presented. At December 31, 2009, the Company presented the remaining assets of
Millennium of $4,000,000 as Assets of discontinued operations held for sale in
the consolidated balance sheet. The Company will not have any direct significant
continuing involvement with Millennium.
Acquisition of Clayco Banc
Corporation
On February 28, 2007, the Company acquired 100% of the total outstanding common stock of Kansas City-based Clayco Banc Corporation (“Clayco”) and its wholly owned subsidiary Great American Bank for total consideration of $36,000,000, consisting of cash of $14,800,000 and 698,733 shares of common stock valued at $21,200,000. At the time of acquisition, 32,959 shares valued at $1,000,000 were deposited into an escrow account as part of an executive retention agreement. At December 31, 2008 the contingency was resolved, the shares were released to the executive, and the Company recorded additional compensation expense of $1,000,000.
On February 28, 2007, the Company acquired 100% of the total outstanding common stock of Kansas City-based Clayco Banc Corporation (“Clayco”) and its wholly owned subsidiary Great American Bank for total consideration of $36,000,000, consisting of cash of $14,800,000 and 698,733 shares of common stock valued at $21,200,000. At the time of acquisition, 32,959 shares valued at $1,000,000 were deposited into an escrow account as part of an executive retention agreement. At December 31, 2008 the contingency was resolved, the shares were released to the executive, and the Company recorded additional compensation expense of $1,000,000.
Acquisition of NorthStar Bancshares
On July 5, 2006, the Company acquired 100% of the total outstanding common stock of Kansas City-based NorthStar Bancshares, Inc. and its wholly owned subsidiary, NorthStar Bank NA (“NorthStar”), for total consideration of $36,000,000, consisting of cash of $8,000,000 and 1,091,500 shares of common stock valued at $28,000,000.
On July 5, 2006, the Company acquired 100% of the total outstanding common stock of Kansas City-based NorthStar Bancshares, Inc. and its wholly owned subsidiary, NorthStar Bank NA (“NorthStar”), for total consideration of $36,000,000, consisting of cash of $8,000,000 and 1,091,500 shares of common stock valued at $28,000,000.
As part of the
acquisition, $4,573,000 of the purchase price consisting of cash of $17,000 and
177,356 shares of common stock valued at $4,556,000 was deposited into a
“Reserved Credit Escrow” account pending the collection of certain loans. The
escrowed funds were considered “contingent consideration” under U.S. GAAP and
therefore, were not recorded in common stock or additional paid in capital until
the contingency was resolved. The Reserved Credit Escrow amount had scheduled
release dates in January and July 2007 based on the receipt of principal
payments or proceeds from the sale of several identified loans and other real
estate. In January 2007, no proceeds were released. In July 2007, $1,300,000 of
the escrow was released to the selling stockholders of NorthStar. This consisted
of 49,348 shares of EFSC common stock and $6,400 in cash. The remaining balance
of the escrow was released to the Company. With the contingency resolved, the
Company recorded the additional common stock, paid in capital and related
goodwill.
Sale of Liberty Branch
On February 28, 2008, the Company sold its Enterprise banking branch located in Liberty, Missouri to an unaffiliated bank. Deposit liabilities of $7,358,000 were transferred and approximately $158,000 of fixed assets were sold. Goodwill and core deposit intangibles related to Liberty of $97,000 and $269,000, respectively, were written off on the sale date. The gain on the sale was $550,000.
On February 28, 2008, the Company sold its Enterprise banking branch located in Liberty, Missouri to an unaffiliated bank. Deposit liabilities of $7,358,000 were transferred and approximately $158,000 of fixed assets were sold. Goodwill and core deposit intangibles related to Liberty of $97,000 and $269,000, respectively, were written off on the sale date. The gain on the sale was $550,000.
Great American
Transactions
On June 26, 2008, the Company transferred the assets and deposit liabilities of the Great American Claycomo branch along with certain other assets and liabilities of Great American to Enterprise. Approximately $168,000,000 of assets and $126,000,000 of liabilities were transferred to Enterprise.
On June 26, 2008, the Company transferred the assets and deposit liabilities of the Great American Claycomo branch along with certain other assets and liabilities of Great American to Enterprise. Approximately $168,000,000 of assets and $126,000,000 of liabilities were transferred to Enterprise.
On July 31, 2008, the
Company sold the Great American bank charter and its remaining DeSoto branch to
an unaffiliated bank holding company, for cash of $6,500,000. The net assets of
the Great American charter on the date of the sale were $2,500,000, comprised of
assets of approximately $33,000,000 and liabilities of approximately
$30,500,000. Goodwill and core deposit intangibles related to Great American of
$680,000 and $336,000, respectively, were written off on the sale date. The gain
on the sale was $2,850,000.
62
NOTE 4—EARNINGS (LOSS) PER SHARE
Basic earnings (loss)
per common share is calculated by dividing net income (loss) available to common
shareholders by the weighted average number of common shares outstanding during
the period. Diluted earnings per common share gives effect to all dilutive
potential common shares outstanding during the period using the treasury stock
method and convertible preferred stock using the if-converted method. The
following table presents a summary of per share data and amounts for the periods
indicated.
| Years ended December 31, | |||||||||||
| Restated | Restated | ||||||||||
| (in thousands, except per share data) | 2009 | 2008 | 2007 | ||||||||
| Net (loss) income from continuing operations | $ | (46,671 | ) | $ | 8,066 | $ | 15,946 | ||||
| Net (loss) income from discontinued operations | (1,284 | ) | (6,218 | ) | 1,309 | ||||||
| Net (loss) income | (47,955 | ) | 1,848 | 17,255 | |||||||
| Preferred stock dividend | (1,750 | ) | (58 | ) | - | ||||||
| Accretion of preferred stock discount | (664 | ) | (21 | ) | - | ||||||
| Net (loss) income available to common shareholders | $ | (50,369 | ) | $ | 1,769 | $ | 17,255 | ||||
| Weighted average common shares outstanding | 12,833 | 12,589 | 12,239 | ||||||||
| Additional dilutive common stock equivalents | - | - | 323 | ||||||||
| Diluted common shares outstanding | 12,833 | 12,589 | 12,562 | ||||||||
| Basic (loss) earnings per common share: | |||||||||||
| From continuing operations | $ | (3.82 | ) | $ | 0.63 | $ | 1.30 | ||||
| From discontinued operations | (0.10 | ) | (0.49 | ) | 0.11 | ||||||
| From continuing and discontinued operations | $ | (3.92 | ) | $ | 0.14 | $ | 1.41 | ||||
| Diluted (loss) earnings per common share: | |||||||||||
| From continuing operations | $ | (3.82 | ) | $ | 0.63 | $ | 1.27 | ||||
| From discontinued operations | (0.10 | ) | (0.49 | ) | 0.10 | ||||||
| From continuing and discontinued operations | $ | (3.92 | ) | $ | 0.14 | $ | 1.37 | ||||
There were 2,757,074
common stock equivalents (including 324,074 convertible stock warrants) for
fiscal year 2009; 515,566 common stock equivalents (including 1,566 convertible
stock warrants) for fiscal year 2008; and 215,000 common stock equivalents for
fiscal year 2007, which were excluded from the earnings per share calculations
because their effect was anti-dilutive.
NOTE 5 – PREFERRED STOCK AND COMMON STOCK
WARRANTS
On December 19, 2008,
the Company entered into an agreement with the United States Department of the
Treasury (“U.S. Treasury”) under the Troubled Asset Recovery Program-Capital
Purchase Program, pursuant to which the Company sold (i) 35,000 shares of Fixed
Rate Cumulative Perpetual Preferred Stock, Series A (“Senior Preferred Stock”)
and (ii) a warrant to purchase 324,074 shares of EFSC common stock (“common
stock warrants”), par value $0.01 per share, for an aggregate investment by the
U.S. Treasury of $35,000,000.
The proceeds received
were allocated between the Senior Preferred Stock and the common stock warrants
based upon their relative fair values, which resulted in the recording of a
discount on the senior preferred stock upon issuance that reflects the value
allocated to the warrant. The discount is being accreted using a level-yield
basis over five years, consistent with management’s estimate of the life of the
preferred stock. The allocated carrying value of the senior preferred stock and
common stock warrants on the date of issuance (based on their relative fair
values) were $31,116,000 and $3,884,000, respectively. Cumulative dividends on
the senior preferred stock are payable at 5% per annum for the first five years
and at a rate of 9% per annum thereafter on the liquidation preference of $1,000
per share.
63
The Company is
prohibited from paying any dividend with respect to shares of common stock
unless all accrued and unpaid dividends are paid in full on the Senior Preferred
Stock for all past dividend periods. The Senior Preferred Stock is non-voting,
other than class voting rights on matters that could adversely affect the Senior
Preferred Stock. The Senior Preferred Stock is callable at par after three
years. Prior to the end of three years, according to the terms of the operative
agreements, the Senior Preferred Stock may be redeemed with the proceeds from
one or more qualified equity offerings of any Tier 1 perpetual preferred or
common stock of EFSC of at least $8,750,000 (each a “Qualified Equity
Offering”), although certain amendments to the Emergency Economic Stabilization
Act of 2008 enacted in February of 2009 eliminate this restriction on the means
of redeeming the Senior Preferred Stock. The U.S. Treasury may also transfer the
Senior Preferred Stock to a third party at any time.
Common Stock Warrants
The common stock warrants have a term of 10 years and are exercisable at any time, in whole or in part, at an exercise price of $16.20 per share (subject to certain anti-dilution adjustments). Assumptions were used in estimating the fair value of common stock warrants. The weighted average expected life of the common stock warrant represents the period of time that common stock warrants are expected to be outstanding. The risk-free interest rate was based on the U.S. Treasury yield curve in effect at the time of grant. The expected volatility was based on the historical volatility of the Company’s stock. The following assumptions were used in estimating the fair value for the common stock warrants: a weighted average expected life of 10 years, a risk-free interest rate of 3.1%, an expected volatility of 47.3%, and a dividend yield of 5%. Based on these assumptions, the estimated fair value of the common stock warrants was $2,972,000. As previously noted, based on the warrants’ fair value relative to the senior preferred stock fair value, $3,884,000 of the $35,000,000 of proceeds was recorded to Additional paid in capital in the December 31, 2009 and 2008 consolidated balance sheets.
The common stock warrants have a term of 10 years and are exercisable at any time, in whole or in part, at an exercise price of $16.20 per share (subject to certain anti-dilution adjustments). Assumptions were used in estimating the fair value of common stock warrants. The weighted average expected life of the common stock warrant represents the period of time that common stock warrants are expected to be outstanding. The risk-free interest rate was based on the U.S. Treasury yield curve in effect at the time of grant. The expected volatility was based on the historical volatility of the Company’s stock. The following assumptions were used in estimating the fair value for the common stock warrants: a weighted average expected life of 10 years, a risk-free interest rate of 3.1%, an expected volatility of 47.3%, and a dividend yield of 5%. Based on these assumptions, the estimated fair value of the common stock warrants was $2,972,000. As previously noted, based on the warrants’ fair value relative to the senior preferred stock fair value, $3,884,000 of the $35,000,000 of proceeds was recorded to Additional paid in capital in the December 31, 2009 and 2008 consolidated balance sheets.
NOTE 6—INVESTMENTS
The following table
presents the amortized cost, gross unrealized gains and losses and fair value of
securities available-for-sale:
| December 31, 2009 | |||||||||||||
| Gross | Gross | ||||||||||||
| Amortized | Unrealized | Unrealized | |||||||||||
| (in thousands) | Cost | Gains | Losses | Fair Value | |||||||||
| Available for sale securities: | |||||||||||||
| Obligations of U.S. Government agencies | $ | 26,940 | $ | 249 | $ | - | $ | 27,189 | |||||
| Obligations of U.S. Government sponsored enterprises | 75,880 | 115 | (181 | ) | 75,814 | ||||||||
| Obligations of states and political subdivisions | 3,868 | 10 | (471 | ) | 3,408 | ||||||||
| Residential mortgage-backed securities | 174,562 | 1,960 | (471 | ) | 176,050 | ||||||||
| $ | 281,250 | $ | 2,334 | $ | (1,123 | ) | $ | 282,461 | |||||
| |
|||||||||||||
| December 31, 2008 | |||||||||||||
| Gross | Gross | ||||||||||||
| Amortized | Unrealized | Unrealized | |||||||||||
| (in thousands) | Cost | Gains | Losses | Fair Value | |||||||||
| Available for sale securities: | |||||||||||||
| Obligations of states and political subdivisions | $ | 765 | $ | 7 | $ | - | $ | 772 | |||||
| Residential mortgage-backed securities | 94,368 | 1,438 | (147 | ) | 95,659 | ||||||||
| $ | 95,133 | $ | 1,445 | $ | (147 | ) | $ | 96,431 | |||||
At December 31, 2009
and December 31, 2008, there were no holdings of securities of any one issuer,
other than the government agencies and sponsored enterprises, in an amount
greater than 10% of shareholders’ equity. The residential mortgage-backed
securities are all issued by government sponsored enterprises. Available for
sale securities having a carrying value of $66,400,000 and $72,800,000 at
December 31, 2009 and December 31, 2008, respectively, were pledged as
collateral to secure public deposits and for other purposes as required by law
or contract provisions.
64
The amortized cost
and estimated fair value of debt securities classified as available for sale at
December 31, 2009, by contractual maturity, are shown below. Expected maturities
may differ from contractual maturities because borrowers may have the right to
call or prepay obligations with or without call or prepayment
penalties.
| Amortized | Estimated | |||||
| (in thousands) | Cost | Fair Value | ||||
| Due in one year or less | $ | 56,461 | $ | 56,562 | ||
| Due after one year through five years | 33,569 | 33,766 | ||||
| Due after five years through ten years | 3,198 | 3,030 | ||||
| Due after ten years | 13,460 | 13,053 | ||||
| Mortgage-backed securities | 174,562 | 176,050 | ||||
| $ | 281,250 | $ | 282,461 | |||
The following table
represents a summary of available-for-sale investment securities that had an
unrealized loss:
| December 31, 2009 | ||||||||||||||||||
| Less than 12 months | 12 months or more | Total | ||||||||||||||||
| Unrealized | Unrealized | Unrealized | ||||||||||||||||
| (in thousands) | Fair Value | Losses | Fair Value | Losses | Fair Value | Losses | ||||||||||||
| Obligations of U.S. government sponsored agencies | $ | 29,557 | $ | 181 | $ | - | $ | - | $ | 29,557 | $ | 181 | ||||||
| Obligations of the state and political subdivisions | 2,830 | 471 | - | - | 2,830 | 471 | ||||||||||||
| Residential mortgage-backed securities | 74,625 | 471 | - | - | 74,625 | 471 | ||||||||||||
| $ | 107,012 | $ | 1,123 | $ | - | $ | - | $ | 107,012 | $ | 1,123 | |||||||
| December 31, 2008 | ||||||||||||||||||
| Less than 12 months | 12 months or more | Total | ||||||||||||||||
| Unrealized | Unrealized | Unrealized | ||||||||||||||||
| (in thousands) | Fair Value | Losses | Fair Value | Losses | Fair Value | Losses | ||||||||||||
| Residential mortgage-backed securities | $ | 21,709 | $ | 144 | $ | 628 | $ | 3 | $ | 22,337 | $ | 147 | ||||||
The unrealized losses
at both December 31, 2009 and December 31, 2008, were attributable to changes in
market interest rates since the securities were purchased. Management
systematically evaluates investment securities for other-than-temporary declines
in fair value on a quarterly basis. This analysis requires management to
consider various factors, which include (1) the present value of the cash flows
expected to be collected compared to the amortized cost of the security, (2)
duration and magnitude of the decline in value, (3) the financial condition of
the issuer or issuers, (4) structure of the security and (5) the intent to sell
the security or whether its more likely than not that the Company would be
required to sell the security before its anticipated recovery in market value.
At December 31, 2009, management performed its quarterly analysis of all
securities with an unrealized loss and concluded no material individual
securities were other-than-temporarily impaired.
The gross gains and
gross losses realized from sales of available-for-sale investment securities at
December 31, 2009 and December 31, 2008 were as follows:
| December 31, | ||||||
| (in thousands) | 2009 | 2008 | ||||
| Gross gains realized | $ | 955 | $ | 226 | ||
| Gross losses realized | - | 65 | ||||
| Net gains realized | $ | 955 | $ | 161 | ||
Enterprise is a
member of the Federal Home Loan Bank (“FHLB”) of Des Moines. As a member of the
FHLB system administered by the Federal Housing Finance Board, the bank is
required to maintain a minimum investment in the capital stock of its respective
FHLB consisting of membership stock and activity-based stock. The FHLB capital
stock of $8,476,000 is recorded at cost, and is included in other investments in
the consolidated balance sheets, which represents redemption value. The
remaining amounts in other investments include the Company’s investment in the
Company’s trust preferred securities (see Note 12) and various private equity
investments.
65
NOTE 7—PORTFOLIO LOANS
Below is a summary of
loans by category at December 31, 2009 and 2008:
| December 31, | |||||||
| Restated | |||||||
| (in thousands) | 2009 | 2008 | |||||
| Real Estate Loans: | |||||||
|
Construction and land
development
|
$ | 224,390 | $ | 378,092 | |||
| Farmland | 6,681 | 7,583 | |||||
| 1-4 Family residential | 214,066 | 235,019 | |||||
| Multifamily residential | 87,865 | 66,421 | |||||
| Other real estate loans | 725,701 | 813,959 | |||||
| Total real estate loans | $ | 1,258,703 | $ | 1,501,074 | |||
| Commercial and industrial | 558,017 | 675,216 | |||||
| Other | 16,387 | 25,716 | |||||
| Total Loans | $ | 1,833,107 | $ | 2,202,006 | |||
| Unearned loan (fees) costs, net | 153 | (549 | ) | ||||
| Total loans, including unearned loan (fees) costs | $ | 1,833,260 | $ | 2,201,457 | |||
Enterprise grants
commercial, residential, and consumer loans primarily in the St. Louis, Kansas
City and Phoenix metropolitan areas. The Company has a diversified loan
portfolio, with no particular concentration of credit in any one economic
sector; however, a substantial portion of the portfolio is concentrated in and
secured by real estate. The ability of the Company’s borrowers to honor their
contractual obligations is dependent upon the local economy and its effect on
the real estate market.
Following is a
summary of activity for the year ended December 31, 2009 of loans to executive
officers and directors or to entities in which such individuals had beneficial
interests as a shareholder, officer, or director. Such loans were made in the
normal course of business on substantially the same terms, including interest
rates and collateral, as those prevailing at the time for comparable
transactions with other customers and did not involve more than the normal risk
of collectability.
| (in thousands) | Total | |||
| Balance January 1, 2009 | $ | 6,047 | ||
| New loans and advances | 5,571 | |||
| Payments | (2,378 | ) | ||
| Balance December 31, 2009 | $ | 9,240 | ||
A summary of activity
in the allowance for loan losses for the years ended December 31, 2009, 2008,
and 2007 is as follows:
| Restated | Restated | |||||||||||
| (in thousands) | 2009 | 2008 | 2007 | |||||||||
| Balance at beginning of year | $ | 33,808 | $ | 22,585 | $ | 17,475 | ||||||
| (Disposed) acquired allowance for loan losses | - | (50 | ) | 2,010 | ||||||||
| Release of allowance related to loan participations | (1,383 | ) | - | - | ||||||||
| Provision for loan losses | 40,412 | 26,510 | 5,120 | |||||||||
| Loans charged off | (30,432 | ) | (15,609 | ) | (2,529 | ) | ||||||
| Recoveries of loans previously charged off | 590 | 372 | 509 | |||||||||
| Balance at end of year | $ | 42,995 | $ | 33,808 | $ | 22,585 | ||||||
A summary of impaired
loans at December 31, 2009, 2008, and 2007 is as follows:
| December 31, | |||||||||
| Restated | Restated | ||||||||
| (in thousands) | 2009 | 2008 | 2007 | ||||||
| Non-accrual loans | $ | 37,441 | $ | 35,487 | $ | 12,720 | |||
| Performing loans | - | 3,660 | - | ||||||
| Loans past due 90 days or more and still accruing interest | - | - | - | ||||||
| Restructured loans | 1,099 | - | - | ||||||
| Total impaired loans | $ | 38,540 | $ | 39,147 | $ | 12,720 | |||
| Allowance for losses on impaired loans | $ | 8,099 | $ | 8,545 | $ | 3,515 | |||
| Impaired loans with no related allowance for loan losses | 3,514 | - | 204 | ||||||
| Average balance of impaired loans during the year | 44,407 | 17,364 | 11,268 | ||||||
There were no loans
over 90 days past due and still accruing interest at December 31, 2009, 2008 or
2007. If interest on impaired loans would have been accrued based upon the
original contractual terms, such income would have been $3,320,000, $3,169,000,
and $1,153,000 for the years ended December 31, 2009, 2008, and 2007,
respectively. The cash amount collected and recognized as interest income on
impaired loans was $112,000, $121,000, and $113,000 for the years ended December
31, 2009, 2008, and 2007, respectively. The amount recognized as interest income
on impaired loans continuing to accrue interest was $16,000, $0, and $0 for the
years ended December 31, 2009, 2008, and 2007, respectively. At December 31,
2009 there were $820,000 of unadvanced commitments on impaired
loans.
NOTE 8—DERIVATIVE FINANCIAL
INSTRUMENTS
The Company is a
party to various derivative financial instruments that are used in the normal
course of business to meet the needs of its clients and as part of its risk
management activities. These instruments include interest rate swaps and option
contracts. The Company does not enter into derivative financial instruments for
trading or speculative purposes.
Interest rate swap
contracts involve the exchange of fixed and floating rate interest payment
obligations without the exchange of the underlying principal amounts. The
Company enters into interest rate swap contracts on behalf of its clients and
also utilizes such contracts to reduce or eliminate the exposure to changes in
the cash flows or fair value of hedged assets or liabilities due to changes in
interest rates. Interest rate option contracts consist of caps and provide for
the transfer or reduction of interest rate risk in exchange for a
fee.
All derivative
financial instruments, whether designated as hedges or not, are recorded on the
consolidated balance sheet at fair value within Other assets or Other
liabilities. The accounting for changes in the fair value of a derivative in the
consolidated statement of operations depends on whether the contract has been
designated as a hedge and qualifies for hedge accounting.
To qualify for hedge
accounting treatment, a derivative must be highly effective in mitigating the
designated changes in fair value or cash flow of the hedged item. Prior to
entering into a hedge, the Company formally documents the relationship between
hedging instruments and hedged items, as well as the related risk management
objective. The documentation process includes linking derivatives that are
designated as fair value or cash flow hedges to specific assets or liabilities
in the consolidated balance sheet or to specific forecasted transactions, and
defining the effectiveness and ineffectiveness testing methods to be used. The
Company also formally assesses, both at the hedge’s inception and on an ongoing
basis, whether the derivatives that are used in hedging transactions have been,
and are expected to continue to be, highly effective in offsetting changes in
fair values or cash flows of hedged items.
67
Using derivative
instruments means assuming counterparty credit risk. Counterparty credit risk
relates to the loss we could incur if a counterparty were to default on a
derivative contract. Notional amounts of derivative financial instruments do not represent credit risk, and
are not recorded in the consolidated balance sheet. They are used merely to
express the volume of this activity. We monitor the overall credit risk and
exposure to individual counterparties. We do not anticipate nonperformance by
any counterparties. The amount of counterparty credit exposure is the unrealized
gains, if any, on such derivative contracts. At December 31, 2009 and December
31, 2008, Enterprise had pledged cash of $1,500,000 and $470,000, respectively,
as collateral in connection with interest rate swap agreements. At December 31,
2007, we had not pledged securities or received collateral in connection with
our derivative agreements.
Risk Management Instruments. The Company enters into certain derivative
contracts to economically hedge state tax credits and certain loans and
certificates of deposit.
- Economic hedge of state tax
credits. In November 2008, the Company entered into a series of
interest rate caps in order to economically hedge changes in fair value of the
State tax credits held for sale. The Company paid $2,082,000 at inception of
the contracts. No principal payments are exchanged. See Note 20—Fair Value
Measurements for further discussion of the fair value of the state tax
credits.
- Economic hedge of prime based
loans. At December 31, 2008, Enterprise had two outstanding interest
rate swap agreements whereby Enterprise paid a variable rate of interest
equivalent to the prime rate and received a fixed rate of interest. The
interest rate swaps had notional amounts of $40,000,000 each and Enterprise
received fixed rates of 4.81% and 4.25%, respectively. The swaps were designed
to hedge the cash flows associated with a portfolio of prime based loans.
Amounts paid or received under these swap agreements were accounted for on an
accrual basis and recognized in interest income on loans. The net cash flows
related to these cash flow hedges increased interest income on loans by
$76,000 in 2008.
At December 31, 2008, the Company had recorded $1,291,000 in Other assets in the consolidated balance sheet related to the fair value of the interest rate swaps. The effective portion of the change in the derivatives’ gain or loss was reported as a component of Accumulated other comprehensive income, net of taxes. The ineffective portion of the change in the cash flow hedge’s gain or loss was recorded in operations. On December 16, 2008, the prime rate used to determine the variable rate payments Enterprise made to its counterparty was lowered to a rate less than the Enterprise prime rate which was used to determine the variable rate receipts from the prime based borrowers. As a result of the variable rate differential, the Company concluded that the cash flow hedges would not be prospectively effective and dedesignated the related interest rate swaps.
The Company reclassified $638,500 from Accumulated other comprehensive income in the consolidated statement of shareholders’ equity and comprehensive income into Noninterest income in the consolidated statement of operations for the year ended December 31, 2008. During 2009, the Company reclassified $248,000 of remaining hedge-related amounts from Accumulated other comprehensive income to operations. At December 31, 2009, the amount remaining in Accumulated other comprehensive income was $404,000. The Company expects to reclassify $242,000 of remaining hedge-related amounts from Accumulated other comprehensive income to operations over the next twelve months.
On February 4, 2009, the swaps were terminated. The Company received cash of $861,000, and realized a loss of $530,000. The loss was included in Miscellaneous income in the 2009 consolidated statement of operations. As a result, Enterprise had no cash flow hedges at December 31, 2009.
- Fair Value hedge of certificates of
deposit. At December 31, 2009, 2008 and 2007, Enterprise had no
outstanding derivative financial instruments designated as fair value hedges.
Previously, Enterprise had entered into interest rate swap agreements whereby
Enterprise paid a variable rate of interest based on a spread to the one or
three-month LIBOR and received a fixed rate of interest equal to that of the
hedged instrument. The changes in fair value of the derivative instrument and
related hedged item were recognized through interest expense.
One swap with a notional amount of $10,000,000, under which Enterprise received a fixed rate of 2.90%, matured in February 2007. Amounts paid or received were accounted for on an accrual basis and recognized as interest expense of the related hedged instrument. The net cash flows related to fair value hedges increased interest expense on certificates of deposit by $41,000 in 2007. For 2007, all fair value hedges were effective, and therefore, the amounts recorded to interest expense for the derivative instrument and related hedged item were entirely offset.
68
The table below
summarizes the notional amounts and fair values of the derivative instruments
used to manage risk.
| Asset Derivatives | Liability Derivatives | |||||||||||||||||
| (Other Assets) | (Other Liabilities) | |||||||||||||||||
| Notional Amount | Fair Value | Fair Value | ||||||||||||||||
| December 31, | December 31, | December 31, | December 31, | December 31, | December 31, | |||||||||||||
| (in thousands) | 2009 | 2008 | 2009 | 2008 | 2009 | 2008 | ||||||||||||
| Non-designated hedging instruments | ||||||||||||||||||
| Interest rate cap contracts | $ | 84,050 | $ | 188,050 | $ | 1,117 | $ | 544 | $ | - | $ | - | ||||||
| Cash flow hedging instruments | ||||||||||||||||||
| Interest rate swap contracts | $ | - | $ | 80,000 | $ | - | $ | 1,291 | $ | - | $ | - | ||||||
The following table
shows the location and amount of gains and losses related to derivatives used
for risk management purposes that were recorded in the consolidated statements
of operations for 2009 and 2008.
| Amount of Gain or (Loss) | ||||||||||
| Location of Gain or (Loss) | Recognized in Operations on | |||||||||
| Recognized in Operations on | Derivative | |||||||||
| (in thousands) | Derivative | 2009 | 2008 | |||||||
| Non-designated hedging instruments | ||||||||||
| Interest rate cap contracts | State tax credit activity, net | $ | 573 | $ | (1,538 | ) | ||||
| Interest rate swap contracts | Miscellaneous income | $ | (282 | ) | $ | - | ||||
Client-Related Derivative Instruments.
As an accommodation to
certain customers, the Company enters into interest rate swaps to economically
hedge changes in fair value of certain loans. In addition, the Company also
offers an interest-rate hedge program that includes interest rate swaps to
assist its customers in managing their interest-rate risk profile. In order to
eliminate the interest-rate risk associated with offering these products, the
Company enters into derivative contracts with third parties to offset the
customer contracts. The table below summarizes the notional amounts and fair
values of the client-related derivative instruments.
| Asset Derivatives | Liability Derivatives | |||||||||||||||||
| (Other Assets) | (Other Liabilities) | |||||||||||||||||
| Notional Amount | Fair Value | Fair Value | ||||||||||||||||
| December 31, | December 31, | December 31, | December 31, | December 31, | December 31, | |||||||||||||
| (in thousands) | 2009 | 2008 | 2009 | 2008 | 2009 | 2008 | ||||||||||||
| Non-designated hedging instruments | ||||||||||||||||||
| Interest rate swap contracts | $ | 30,279 | $ | 17,429 | $ | 120 | $ | - | $ | 1,105 | $ | 1,467 | ||||||
Changes in the fair
value of client-related derivative instruments are recognized currently in
operations. The following table shows the location and amount of gains and
losses recorded in the consolidated statements of operations for 2009 and
2008.
| Amount of Gain or (Loss) | ||||||||||
| Location of Gain or (Loss) | Recognized in Operations on | |||||||||
| Recognized in Operations on | Derivative | |||||||||
| (in thousands) | Derivative | 2009 | 2008 | |||||||
| Non-designated hedging instruments | ||||||||||
| Interest rate swap contracts | Interest and fees on loans | $ | (579 | ) | $ | (229 | ) | |||
69
NOTE 9—FIXED ASSETS
A summary of fixed
assets at December 31, 2009 and 2008 is as follows:
| December 31, | ||||||
| (in thousands) | 2009 | 2008 | ||||
| Land | $ | 2,249 | $ | 2,249 | ||
| Buildings and leasehold improvements | 21,798 | 22,726 | ||||
| Furniture, fixtures and equipment | 12,095 | 12,658 | ||||
| Capitalized software | 263 | 214 | ||||
| 36,405 | 37,847 | |||||
| Less accumulated depreciation and amortization | 14,105 | 12,689 | ||||
| Total fixed assets | $ | 22,301 | $ | 25,158 | ||
Depreciation and
amortization of building, leasehold improvements, and furniture, fixtures,
equipment and capitalized software included in noninterest expense amounted to
$3,550,000, $2,512,000, and $2,197,000 in 2009, 2008, and 2007,
respectively.
The Company has
facilities leased under agreements that expire in various years through 2026.
The Company’s aggregate rent expense totaled $2,658,000, $2,631,000, and
$2,356,000 in 2009, 2008, and 2007, respectively. Sublease rental income was
$122,500, $110,200 and $37,000 for 2009, 2008, and 2007. The future aggregate
minimum rental commitments (in thousands) required under the leases are as
follows:
| Year | Amount | ||
| 2010 | 1,984 | ||
| 2011 | 1,951 | ||
| 2012 | 1,924 | ||
| 2013 | 1,170 | ||
| 2014 | 1,151 | ||
| Thereafter | 8,067 | ||
| Total | $ | 16,247 | |
For leases which
renew or are subject to periodic rental adjustments, the monthly rental payments
will be adjusted based on then current market conditions and rates of inflation.
70
NOTE 10—GOODWILL AND INTANGIBLE ASSETS
The tables below
present an analysis of the goodwill and intangible assets for the years ended
December 31, 2009, 2008 and 2007.
| Reporting Unit | ||||||||||||
| (in thousands) | Millennium | Banking | Total | |||||||||
| Balance at December 31, 2006 | $ | 10,293 | $ | 19,690 | $ | 29,983 | ||||||
| Acquisition-related adjustments (1) | - | 481 | 481 | |||||||||
| Goodwill from purchase of Clayco Banc Corporation | - | 25,208 | 25,208 | |||||||||
| Goodwill from purchase of 40% of Millennium Brokerage Group | 1,505 | - | 1,505 | |||||||||
| Balance at December 31, 2007 | 11,798 | 45,379 | 57,177 | |||||||||
| Acquisition-related adjustments (1) | 36 | 776 | 812 | |||||||||
| Goodwill write-off related to sale of Liberty branch | - | (97 | ) | (97 | ) | |||||||
| Goodwill write-off related to sale of DeSoto branch | - | (680 | ) | (680 | ) | |||||||
| Goodwill impairment related to Millennium Brokerage Group | (8,700 | ) | - | (8,700 | ) | |||||||
| Balance at December 31, 2008 | 3,134 | 45,378 | 48,512 | |||||||||
| Goodwill impairment related to Banking segment | - | (45,378 | ) | (45,378 | ) | |||||||
| Goodwill from purchase of Valley Capital Bank | - | 953 | 953 | |||||||||
| Reclassification to assets held for sale | (3,134 | ) | - | (3,134 | ) | |||||||
| Balance at December 31, 2009 | $ | - | $ | 953 | $ | 953 | ||||||
| (1) |
Includes
additional purchase accounting adjustments on the Millennium, NorthStar
and Clayco acquisitions necessary to reflect additional valuation data
since the respective acquisition dates. See Note 3 – Acquisitions and
Divestitures for more
information.
|
| Customer and | ||||||||||||
| Trade Name | Core Deposit | |||||||||||
| (in thousands) | Intangibles | Intangible | Net Intangible | |||||||||
| Balance at December 31, 2006 | $ | 3,636 | $ | 2,153 | $ | 5,789 | ||||||
| Intangibles from purchase of Clayco Banc Corporation | - | 1,868 | 1,868 | |||||||||
| Amortization expense | (912 | ) | (692 | ) | (1,604 | ) | ||||||
| Balance at December 31, 2007 | 2,724 | 3,329 | 6,053 | |||||||||
| Amortization expense | (845 | ) | (599 | ) | (1,444 | ) | ||||||
| Intangible write-off related to sale of Liberty branch | - | (269 | ) | (269 | ) | |||||||
| Intangible write-off related to sale of DeSoto branch/Great American charter | - | (336 | ) | (336 | ) | |||||||
| Intangible write-off related to Millennium | (500 | ) | - | (500 | ) | |||||||
| Balance at December 31, 2008 | 1,379 | 2,125 | 3,504 | |||||||||
| Reclassification to assets held for sale | (783 | ) | - | (783 | ) | |||||||
| Amortization expense | (596 | ) | (482 | ) | (1,078 | ) | ||||||
| Balance at December 31, 2009 | $ | - | $ | 1,643 | $ | 1,643 | ||||||
The following table
reflects the expected amortization schedule for the core deposit intangible (in
thousands) at December 31, 2009.
| Core Deposit | |||
| Year | Intangible | ||
| 2010 | $ | 420 | |
| 2011 | 358 | ||
| 2012 | 296 | ||
| 2013 | 234 | ||
| 2014 | 172 | ||
| After 2014 | 163 | ||
| $ | 1,643 | ||
The goodwill
associated with the Banking reporting unit was evaluated at March 31, 2009. Due
primarily to the deterioration in the general economic environment and the
resulting decline in the Company’s share price and market capitalization, this
analysis determined that the carrying value of the reporting unit was higher
than the fair value of the reporting unit, which resulted in a non-cash goodwill
impairment charge of $45,377,000 at March 31, 2009, thus eliminating all
goodwill in the Banking segment at that time. This impairment charge did not
reduce the Company’s regulatory capital
or cash flows. The Company also tested the Banking reporting unit core deposit
intangibles for impairment and determined there was no
impairment.
71
NOTE 11—MATURITY OF CERTIFICATES OF DEPOSIT
Following is a
summary of certificates of deposit maturities at December 31, 2009:
| $100,000 | |||||||||
| (in thousands) | and Over | Other | Total | ||||||
| Less than 1 year | $ | 358,032 | $ | 310,228 | $ | 668,260 | |||
| Greater than 1 year and less than 2 years | 49,087 | 40,206 | 89,293 | ||||||
| Greater than 2 years and less than 3 years | 10,065 | 14,980 | 25,045 | ||||||
| Greater than 3 years and less than 4 years | 25,312 | 1,458 | 26,770 | ||||||
| Greater than 4 years and less than 5 years | 111 | 384 | 495 | ||||||
| Over 5 years | 460 | - | 460 | ||||||
| $ | 443,067 | $ | 367,256 | $ | 810,323 | ||||
NOTE 12—SUBORDINATED
DEBENTURES
The Corporation has
nine wholly-owned statutory business trusts. These trusts issued preferred
securities that were sold to third parties. The sole purpose of the trusts was
to invest the proceeds in junior subordinated debentures of the Company that
have terms identical to the trust preferred securities. In addition to the
statutory business trusts, on September 30, 2008, Enterprise completed a
$2,500,000 private placement of subordinated capital notes.
The amounts and terms
of each respective issuance at December 31 were as follows:
| Amount | ||||||||||||
| (in thousands) | 2009 | 2008 | Maturity Date | Call date | Interest Rate | |||||||
| EFSC Clayco Trust I | $ | 3,196 | $ | 3,196 | December 17, 2033 | December 17, 2008 | Floats @ 3MO LIBOR + 2.85% | |||||
| EFSC Capital Trust II | 5,155 | 5,155 | June 17, 2034 | June 17, 2009 | Floats @ 3MO LIBOR + 2.65% | |||||||
| EFSC Capital Trust III | 11,341 | 11,341 | December 15, 2034 | December 15, 2009 | Floats @ 3MO LIBOR + 1.97% | |||||||
| EFSC Clayco Trust II | 4,124 | 4,124 | September 15, 2035 | September 15, 2010 | Floats @ 3MO LIBOR + 1.83% | |||||||
| EFSC Capital Trust IV | 10,310 | 10,310 | December 15, 2035 | December 15, 2010 | Fixed for 5 years @ 6.14%(1) | |||||||
| EFSC Capital Trust V | 4,124 | 4,124 | September 15, 2036 | September 15, 2011 | Floats @ 3MO LIBOR + 1.60% | |||||||
| EFSC Capital Trust VI | 14,433 | 14,433 | March 30, 2037 | March 30, 2012 | Fixed for 5 years @ 6.573%(2) | |||||||
| EFSC Capital Trust VII | 4,124 | 4,124 | December 15, 2037 | December 15, 2012 | Floats @ 3MO LIBOR + 2.25% | |||||||
| EFSC Capital Trust VIII | 25,774 | 25,774 | December 15, 2038 | December 15, 2013 (3) | Fixed @ 9% | |||||||
| Total trust preferred securities | 82,581 | 82,581 | ||||||||||
| Enterprise Subordinated notes | 2,500 | 2,500 | October 1, 2018 | October 1, 2013 | Fixed @ 10% | |||||||
| Total Subordinated debentures | $ | 85,081 | $ | 85,081 | ||||||||
| (1) | After October 2010, floats @ 3MO LIBOR + 1.44% |
| (2) | After February 2012, floats @ 3MO LIBOR + 1.60% |
| (3) | Convertible to EFSC common stock at a conversion price of $17.37. Forced conversion by EFSC if EFSC common stock trades at greater than or equal to $22.58 for twenty consecutive trading days after two years. |
The subordinated
debentures, which are the sole assets of the trusts, are subordinate and junior
in right of payment to all present and future senior and subordinated
indebtedness and certain other financial conditions of the Company. The Company
fully and unconditionally guarantees each trust’s securities obligations. The
trust preferred securities are included in Tier 1 capital for regulatory capital
purposes, subject to certain limitations.
The securities are
redeemable in whole or in part on or after their respective call dates.
Mandatory redemption dates may be shortened if certain conditions are met. The
securities are classified as subordinated debentures in the Company’s
consolidated balance sheets. Interest on the subordinated debentures held by the
trusts is recorded as interest expense in the Company’s consolidated statements
of operations. The Company’s investment in these trusts are included in other
investments in the consolidated balance sheets.
On December 12, 2008,
the Company closed an offering of $25,000,000 in convertible trust preferred
securities through EFSC Capital Trust VIII, a statutory business trust sponsored
by the Company. The proceeds from the offering were used to provide additional
parent company liquidity and regulatory capital. The securities have a 9% coupon, mature in 30 years and are callable by
the Company after 5 years. They are convertible into 1,439,263 shares of the
Company’s common stock at a conversion price of $17.37. The Company may
terminate the conversion rights, subject to certain limitations, after a
two-year lockout period, if the Company’s price per share exceeds $22.58 for
twenty consecutive trading days. An entity managed and controlled by certain
members of the Company’s Board of Directors purchased $5,000,000 of the
convertible trust preferred securities of EFSC Capital Trust VIII on December
12, 2008.
72
NOTE 13—FEDERAL HOME LOAN BANK
ADVANCES
FHLB advances are
collateralized by 1-4 family residential real estate loans, business loans and
certain commercial real estate loans. At December 31, 2009 and 2008 the carrying
value of the loans pledged to the FHLB of Des Moines was $462,000,000 and
$465,000,000, respectively.
Enterprise also has
an $8,476,000 investment in the capital stock of the FHLB of Des Moines and
maintains a secured line of credit that had availability of approximately
$118,504,000 at December 31, 2009.
The following table
summarizes the type, maturity and rate of the Company’s FHLB advances at
December 31:
| 2009 | 2008 | |||||||||||
| Outstanding | Weighted | Outstanding | Weighted | |||||||||
| (in thousands) | Term | Balance | Rate | Balance | Rate | |||||||
| Long term non-amortizing fixed advance | less than 1 year | $ | 20,800 | 4.19% | $ | 81,050 | 3.48% | |||||
| Long term non-amortizing fixed advance | 1 - 2 years | 5,300 | 2.04% | 20,800 | 4.19% | |||||||
| Long term non-amortizing fixed advance | 2 - 3 years | 22,000 | 2.90% | 300 | 6.07% | |||||||
| Long term non-amortizing fixed advance | 3 - 4 years | - | - | 7,000 | 4.52% | |||||||
| Long term non-amortizing fixed advance | 4 - 5 years | - | - | - | - | |||||||
| Long term non-amortizing fixed advance | 5 - 10 years | 80,000 | 3.51% | 10,000 | 4.53% | |||||||
| Mortgage matched fixed advance | 10 - 15 years | - | - | 807 | 5.69% | |||||||
| Total Federal Home Loan Bank Advances | $ | 128,100 | 3.45% | $ | 119,957 | 3.77% | ||||||
All of the FHLB
advances have fixed interest rates. At December 31, 2009, $58,100,000 of the
advances are prepayable by the Company at anytime, subject to prepayment
penalties. Of the advances with a term of five to ten years, $70,000,000 were
callable by the FHLB as of December 31, 2009.
NOTE 14—OTHER BORROWINGS AND NOTES
PAYABLE
A summary of other
borrowings is as follows:
| December 31, | ||||||||
| Restated | ||||||||
| (in thousands) | 2009 | 2008 | ||||||
| Federal funds purchased | $ | - | $ | 19,400 | ||||
| Securities sold under repurchase agreements | 39,338 | 26,760 | ||||||
| Secured borrowings | - | 226,809 | ||||||
| Total | $ | 39,338 | $ | 272,969 | ||||
| Average balance during the year | $ | 254,217 | $ | 208,637 | ||||
| Maximum balance outstanding at any month-end | 404,134 | 272,969 | ||||||
| Weighted average interest rate during the year | 3.41 | % | 4.66 | % | ||||
| Weighted average interest rate at December 31 | 0.55 | % | 3.42 | % | ||||
73
Secured borrowings
In connection with the loan participation correction, the Company recorded the participated portion of such loans as portfolio loans, along with a secured borrowing liability to finance the loans. The Company also recorded incremental interest income on the loans offset by incremental interest expense on the secured borrowing. The average balance outstanding during 2009 and 2008 was $182,800,000 and $172,900,000, respectively. For the twelve months ended December 31, 2009 and 2008, the maximum balance outstanding at any month-end was $236,100,000 and $226,800,000. The weighted average interest rate on these borrowings was 4.53% and 5.25% for the years ended December 31, 2009 and 2008. The weighted average interest rate at December 31, 2008 was 4.00%. See Note 2 –Loan Participation Restatement for more information.
In connection with the loan participation correction, the Company recorded the participated portion of such loans as portfolio loans, along with a secured borrowing liability to finance the loans. The Company also recorded incremental interest income on the loans offset by incremental interest expense on the secured borrowing. The average balance outstanding during 2009 and 2008 was $182,800,000 and $172,900,000, respectively. For the twelve months ended December 31, 2009 and 2008, the maximum balance outstanding at any month-end was $236,100,000 and $226,800,000. The weighted average interest rate on these borrowings was 4.53% and 5.25% for the years ended December 31, 2009 and 2008. The weighted average interest rate at December 31, 2008 was 4.00%. See Note 2 –Loan Participation Restatement for more information.
Federal Reserve line
Enterprise also has a line with the Federal Reserve Bank of St. Louis for back-up liquidity purposes. As of December 31, 2009, approximately $279,700,000 was available under this line. This line is secured by a pledge of certain eligible loans aggregating approximately $430,000,000.
Enterprise also has a line with the Federal Reserve Bank of St. Louis for back-up liquidity purposes. As of December 31, 2009, approximately $279,700,000 was available under this line. This line is secured by a pledge of certain eligible loans aggregating approximately $430,000,000.
Notes Payable
At December 31, 2008 the Company had a $16,000,000 unsecured bank line of credit and a $4,000,000 term loan that expired on April 30, 2009. As of September 30, 2008, the Company became noncompliant with certain covenants regarding classified loans as a percentage of bank equity and loan loss reserves. The Company repaid all outstanding balances on the line of credit and term loan in December 2008. The Company did not renew this arrangement at maturity. Both the line of credit and term loan accrued interest based on LIBOR plus 1.25% and were payable quarterly. For the year ended December 31, 2008, the average balance and maximum month-end balance of these instruments was $12,849,000 and $20,000,000, respectively.
At December 31, 2008 the Company had a $16,000,000 unsecured bank line of credit and a $4,000,000 term loan that expired on April 30, 2009. As of September 30, 2008, the Company became noncompliant with certain covenants regarding classified loans as a percentage of bank equity and loan loss reserves. The Company repaid all outstanding balances on the line of credit and term loan in December 2008. The Company did not renew this arrangement at maturity. Both the line of credit and term loan accrued interest based on LIBOR plus 1.25% and were payable quarterly. For the year ended December 31, 2008, the average balance and maximum month-end balance of these instruments was $12,849,000 and $20,000,000, respectively.
NOTE 15—LITIGATION AND OTHER CLAIMS
Various legal claims
have arisen during the normal course of business, which in the opinion of
management, after discussion with legal counsel; will not result in any material
liability.
NOTE 16—REGULATORY MATTERS
The Company and
Enterprise are subject to various regulatory capital requirements administered
by the Federal banking agencies. Failure to meet minimum capital requirements
can initiate certain mandatory and possible additional discretionary actions by
regulators that, if undertaken, could have a direct material effect on the
financial statements of the Company and Enterprise. Under capital adequacy
guidelines and the regulatory framework for prompt corrective action, the
Company and Enterprise must meet specific capital guidelines that involve
quantitative measures of assets, liabilities, and certain off-balance-sheet
items as calculated under regulatory accounting practices. Enterprise’s capital
amounts and classification are also subject to qualitative judgments by the
regulators about components, risk weightings, and other factors.
Quantitative measures
established by regulation to ensure capital adequacy require the Company and
Enterprise to maintain minimum amounts and ratios (set forth in the following
table) of total and Tier 1 capital to risk-weighted assets, and of Tier 1
capital to average assets. Management believes, as of December 31, 2009 and
2008, that the Company and Enterprise meet all capital adequacy requirements to
which they are subject.
As of December 31,
2009 and 2008, Enterprise was categorized as “well capitalized” under the
regulatory framework for prompt corrective action. To be categorized as “well
capitalized” Enterprise must maintain minimum total risk-based, Tier 1
risk-based and Tier 1 leverage ratios as set forth in the table.
74
The actual capital
amounts and ratios are also presented in the table below.
| To Be Well | ||||||||||||||||||
| Capitalized Under | ||||||||||||||||||
| For Capital | Applicable | |||||||||||||||||
| Actual | Adequacy Purposes | Action Provisions | ||||||||||||||||
| (in thousands) | Amount | Ratio | Amount | Ratio | Amount | Ratio | ||||||||||||
| As of December 31, 2009: | ||||||||||||||||||
| Total Capital (to Risk Weighted Assets) | ||||||||||||||||||
| Enterprise Financial Services Corp | $ | 268,454 | 13.32 | % | $ | 161,231 | 8.00 | % | $ | - | - | % | ||||||
| Enterprise Bank & Trust | 226,372 | 11.37 | 159,278 | 8.00 | 199,098 | 10.00 | ||||||||||||
| Tier 1 Capital (to Risk Weighted Assets) | ||||||||||||||||||
| Enterprise Financial Services Corp | 215,099 | 10.67 | 80,616 | 4.00 | - | - | ||||||||||||
| Enterprise Bank & Trust | 198,761 | 9.98 | 79,639 | 4.00 | 119,459 | 6.00 | ||||||||||||
| Tier 1 Capital (to Average Assets) | ||||||||||||||||||
| Enterprise Financial Services Corp | 215,099 | 8.96 | 72,018 | 3.00 | - | - | ||||||||||||
| Enterprise Bank & Trust | 198,761 | 8.38 | 71,185 | 3.00 | 118,642 | 5.00 | ||||||||||||
| As of December 31, 2008: | ||||||||||||||||||
| Total Capital (to Risk Weighted Assets) | ||||||||||||||||||
| Enterprise Financial Services Corp | $ | 273,978 | 12.81 | % | $ | 171,136 | 8.00 | % | $ | - | - | % | ||||||
| Enterprise Bank & Trust | 230,008 | 10.86 | 169,479 | 8.00 | 211,849 | 10.00 | ||||||||||||
| Tier 1 Capital (to Risk Weighted Assets) | ||||||||||||||||||
| Enterprise Financial Services Corp | 190,253 | 8.89 | 85,568 | 4.00 | - | - | ||||||||||||
| Enterprise Bank & Trust | 200,968 | 9.49 | 84,739 | 4.00 | 127,109 | 6.00 | ||||||||||||
| Tier 1 Capital (to Average Assets) | ||||||||||||||||||
| Enterprise Financial Services Corp | 190,253 | 8.67 | 71,788 | 3.00 | - | - | ||||||||||||
| Enterprise Bank & Trust | 200,968 | 8.45 | 71,352 | 3.00 | 118,920 | 5.00 | ||||||||||||
NOTE 17—COMPENSATION PLANS
The Company has
adopted share-based compensation plans to reward and provide long-term incentive
for directors and key employees of the Company. These plans provide for the
granting of stock, stock options, stock appreciation rights, and restricted
stock units (“RSUs”), as designated by the Company’s Board of Directors. The
Company uses authorized and unissued shares to satisfy share award exercises.
During 2009, share-based compensation was issued in the form of stock and
stock-settled stock appreciation rights (“SSAR”). At December 31, 2009, there
were 849,723 shares available for grant under the various share-based
compensation plans. An additional 65,340 shares of stock were available for
issuance under the Stock Plan for Non-Management Directors approved by the
Shareholders in April 2006.
Total share-based
compensation expense that was charged against income was $2,202,000, $2,255,000,
and $1,906,000 for the years ended December 31, 2009, 2008, and 2007,
respectively. The total income tax (expense) benefit recognized in Additional
paid in capital for share-based compensation arrangements was ($338,000),
$460,000, and $381,000 for the years ended December 31, 2009, 2008, and 2007,
respectively.
Employee Stock Options and Stock-settled Stock
Appreciation Rights
In
determining compensation cost for stock options and SSARs, the Black-Scholes
option-pricing model is used to estimate the fair value on date of grant. The
Black-Scholes model is a closed-end model that uses the assumptions in the
following table. The risk-free rate for the expected term is based on the U.S.
Treasury zero-coupon spot rates in effect at the time of grant. Expected
volatility is based on historical volatility of the Company’s common stock. The
Company uses historical exercise behavior and other factors to estimate the
expected term of the options, which represents the period of time that the
options granted are expected to be outstanding.
| 2009 | 2008 | 2007 | ||||
| Risk-free interest rate | 2.5% | 3.9% | 5.2% | |||
| Expected dividend rate | 0.6% | 0.6% | 0.6% | |||
| Expected volatility | 54.8% | 39.4% | 36.0% | |||
| Expected term | 6 years | 6 years | 6 years |
75
Stock options have
been granted to key employees with exercise prices equal to the market price of
the Company’s common stock at the date of grant and 10-year contractual terms.
Stock options have a vesting schedule of three to five years. In 2007, the
Company began granting SSARs to key employees. The SSARs are subject to
continued employment, have a 10-year contractual term and vest ratably over five
years. Neither stock options nor SSARs carry voting or dividend rights until
exercised. At December 31, 2009, there was $35,000 and $2,026,000 of total
unrecognized compensation cost related to stock options and SSARs, respectively,
which is expected to be recognized over a weighted average period of 1 year and
2.7 years, respectively. Various information related to the stock options and
SSARs is shown below.
| (in thousands, except grant date fair value) | 2009 | 2008 | 2007 | ||||||
| Weighted average grant date fair value of options and SSARs | $ | 8.99 | $ | 8.27 | $ | 10.69 | |||
| Compensation expense | 896 | 705 | 452 | ||||||
| Intrinsic value of option exercises on date of exercise | 1 | 2,177 | 1,961 | ||||||
| Cash received from the exercise of stock options | 15 | 3,148 | 1,233 | ||||||
Following is a
summary of the employee stock option and SSAR activity for 2009.
| Weighted | |||||||||||
| Weighted | Average | ||||||||||
| Average | Remaining | Aggregate | |||||||||
| Exercise | Contractual | Intrinsic | |||||||||
| (Dollars in thousands, except share data) | Shares | Price | Term | Value | |||||||
| Outstanding at December 31, 2008 | 827,471 | $ | 17.03 | ||||||||
| Granted | 7,000 | 8.99 | |||||||||
| Exercised | (1,500 | ) | 10.00 | ||||||||
| Forfeited | (29,236 | ) | 22.65 | ||||||||
| Outstanding at December 31, 2009 | 803,735 | $ | 16.77 | 5.5 years | $ | - | |||||
| Exercisable at December 31, 2009 | 559,065 | $ | 15.20 | 4.2 years | $ | - | |||||
| Vested and expected to vest at December 31, 2009 | 734,721 | $ | 16.23 | 5.5 years | $ | - | |||||
Restricted Stock Units
As part of a long-term incentive plan, the Company awards nonvested stock, in the form of RSUs to employees. RSUs are subject to continued employment and vest ratably over five years. RSUs do not carry voting or dividend rights until vested. Sales of the units are restricted prior to vesting. Various information related to the RSUs is shown below.
As part of a long-term incentive plan, the Company awards nonvested stock, in the form of RSUs to employees. RSUs are subject to continued employment and vest ratably over five years. RSUs do not carry voting or dividend rights until vested. Sales of the units are restricted prior to vesting. Various information related to the RSUs is shown below.
| (in thousands) | 2009 | 2008 | 2007 | ||||||
| Compensation expense | $ | 1,138 | $ | 1,380 | $ | 1,308 | |||
| Total fair value at vesting date | 417 | 765 | 1,384 | ||||||
| Total unrecognized compensation cost for nonvested stock units | 1,879 | 3,038 | 3,441 | ||||||
| Expected years to recognize unearned compensation | 2.2 years | 3.0 years | 3.1 years | ||||||
A summary of the
status of the Company's RSU awards as of December 31, 2009 and changes during
the year then ended is presented below.
| Weighted | ||||||
| Average | ||||||
| Grant Date | ||||||
| Shares | Fair Value | |||||
| Outstanding at December 31, 2008 | 150,463 | $ | 22.89 | |||
| Granted | - | - | ||||
| Vested | (54,074 | ) | 22.53 | |||
| Forfeited | (18,239 | ) | 23.29 | |||
| Outstanding at December 31, 2009 | 78,150 | $ | 23.05 | |||
76
Stock Plan for Non-Management
Directors
In 2006, the Company adopted a Stock Plan for Non-Management Directors, which provides for issuing shares of common stock to non-employee directors as compensation in lieu of cash. The plan was approved by the shareholders and allows up to 100,000 shares to be awarded. Shares are issued twice a year and compensation expense is recorded as the shares are earned, therefore, there is no unrecognized compensation cost related to this plan. In 2009, the Company issued 17,015 shares of stock at a weighted average fair value of $9.86 per share. In 2008, the Company issued 9,544 shares of stock at a weighted average fair value of $17.83 per share. The Company recognized $168,000 and $170,000 of stock-based compensation expense for the shares issued to the directors in 2009 and 2008, respectively.
In 2006, the Company adopted a Stock Plan for Non-Management Directors, which provides for issuing shares of common stock to non-employee directors as compensation in lieu of cash. The plan was approved by the shareholders and allows up to 100,000 shares to be awarded. Shares are issued twice a year and compensation expense is recorded as the shares are earned, therefore, there is no unrecognized compensation cost related to this plan. In 2009, the Company issued 17,015 shares of stock at a weighted average fair value of $9.86 per share. In 2008, the Company issued 9,544 shares of stock at a weighted average fair value of $17.83 per share. The Company recognized $168,000 and $170,000 of stock-based compensation expense for the shares issued to the directors in 2009 and 2008, respectively.
Moneta Plan
In 1997, the Company entered into a solicitation and referral agreement with Moneta Group, Inc. (“Moneta”), a nationally recognized firm in the financial planning industry. There have been no options granted to Moneta under the agreement since 2003. The fair value of each option granted to Moneta was estimated on the date of grant using the Black-Scholes option pricing model. The Company recognized the fair value of the options over the vesting period as expense. As of December 31, 2006, the fair value of all Moneta options had been recognized.
In 1997, the Company entered into a solicitation and referral agreement with Moneta Group, Inc. (“Moneta”), a nationally recognized firm in the financial planning industry. There have been no options granted to Moneta under the agreement since 2003. The fair value of each option granted to Moneta was estimated on the date of grant using the Black-Scholes option pricing model. The Company recognized the fair value of the options over the vesting period as expense. As of December 31, 2006, the fair value of all Moneta options had been recognized.
Following is a
summary of the Moneta stock option activity for 2009.
| Weighted | |||||||||||
| Weighted | Average | ||||||||||
| Average | Remaining | Aggregate | |||||||||
| Exercise | Contractual | Intrinsic | |||||||||
| (Dollars in thousands, except share data) | Shares | Price | Term | Value | |||||||
| Outstanding at December 31, 2008 | 91,001 | $ | 13.55 | ||||||||
| Granted | - | - | |||||||||
| Exercised | (22,462 | ) | 10.33 | ||||||||
| Forfeited | (39,193 | ) | 14.98 | ||||||||
| Outstanding at December 31, 2009 | 29,346 | $ | 14.10 | 1.9 years | $ | - | |||||
| Exercisable at December 31, 2009 | 29,346 | $ | 14.10 | 1.9 years | $ | - | |||||
401(k) plans
Effective January 1, 1993, the Company adopted a 401(k) thrift plan which covers substantially all full-time employees over the age of 21. The amount charged to expense for the Company’s contributions to the plan was $349,000, $496,000 and $421,000 for 2009, 2008, and 2007, respectively.
Effective January 1, 1993, the Company adopted a 401(k) thrift plan which covers substantially all full-time employees over the age of 21. The amount charged to expense for the Company’s contributions to the plan was $349,000, $496,000 and $421,000 for 2009, 2008, and 2007, respectively.
NOTE 18—INCOME TAXES
The components of
income tax (benefit) expense for the years ended December 31 are as
follows:
| Years ended December 31, | |||||||||||
| Restated | Restated | ||||||||||
| (in thousands) | 2009 | 2008 | 2007 | ||||||||
| Current: | |||||||||||
| Federal | $ | (383 | ) | $ | 7,599 | $ | 7,637 | ||||
| State and local | (433 | ) | 233 | 632 | |||||||
| Deferred | (2,545 | ) | (7,699 | ) | 565 | ||||||
| Total income tax (benefit) expense | $ | (3,361 | ) | $ | 133 | $ | 8,834 | ||||
| Income tax (benefit) expense is included in the financial statements as follows: | |||||||||||
| Continuing operations | $ | (2,650 | ) | $ | 3,672 | $ | 8,098 | ||||
| Discontinued operations | (711 | ) | (3,539 | ) | 736 | ||||||
| Total income tax (benefit) expense | $ | (3,361 | ) | $ | 133 | $ | 8,834 | ||||
77
A reconciliation of
expected income tax (benefit) expense, computed by applying the statutory
federal income tax rate of 35% in 2009, 2008, and 2007 to income before income
taxes and the amounts reflected in the consolidated statements of operations is
as follows:
| Years ended December 31, | ||||||||||||
| Restated | Restated | |||||||||||
| (in thousands) | 2009 | 2008 | 2007 | |||||||||
| Income tax (benefit) expense at statutory rate | $ | (17,961 | ) | $ | 653 | $ | 9,126 | |||||
| Increase (reduction) in income tax resulting from: | ||||||||||||
| Tax-exempt income | (597 | ) | (401 | ) | (303 | ) | ||||||
| Goodwill write off | 15,882 | - | - | |||||||||
| State and local income tax expense | (282 | ) | 151 | 411 | ||||||||
| Non-deductible expenses | 187 | 208 | 258 | |||||||||
| Other, net | (590 | ) | (478 | ) | (658 | ) | ||||||
| Total income tax (benefit) expense | $ | (3,361 | ) | $ | 133 | $ | 8,834 | |||||
A net deferred income
tax asset of $18,260,000 and $15,035,000 is included in other assets in the
consolidated balance sheets at December 31, 2009 and 2008, respectively. The tax
effect of temporary differences that gave rise to significant portions of the
deferred tax assets and deferred tax liabilities is as follows:
| Years ended December 31, | ||||||
| Restated | ||||||
| (in thousands) | 2009 | 2008 | ||||
| Deferred tax assets: | ||||||
| Allowance for loan losses | $ | 15,631 | $ | 13,123 | ||
| Deferred compensation | 1,298 | 824 | ||||
| Intangible assets | 3,473 | 3,244 | ||||
| Tax credit carryforwards | 806 | - | ||||
| Other, net | 517 | 314 | ||||
| Total deferred tax assets | $ | 21,725 | $ | 17,505 | ||
| Deferred tax liabilities: | ||||||
| Unrealized gains on securities available for sale | $ | 537 | $ | 467 | ||
| State tax credits held for sale, net of economic hedge | 1,216 | 1,056 | ||||
| Core deposit intangibles | 598 | 774 | ||||
| Office equipment and leasehold improvements | 1,114 | 173 | ||||
| Total deferred tax liabilities | 3,465 | 2,470 | ||||
| Net deferred tax asset | $ | 18,260 | $ | 15,035 | ||
A valuation allowance
is provided on deferred tax assets when it is more likely than not that some
portion of the assets will not be realized. The Company did not have any
valuation allowances as of December 31, 2009 or December 31, 2008. Management
believes it is more likely than not that the results of future operations will
generate sufficient taxable income to realize the deferred tax assets
above.
The Company, or one
of its subsidiaries, files income tax returns in the U.S. federal jurisdiction
and in seven states. With few exceptions, the Company is no longer subject to
U.S. federal, state or local income tax audits by tax authorities for years
before 2006. The Company is not currently under audit by any taxing
jurisdiction.
The Company
recognizes interest and penalties related to uncertain tax positions in income
tax expense and classifies such interest and penalties in the liability for
unrecognized tax benefits. As of December 31, 2009, the Company had
approximately $185,000 accrued for interest and penalties.
The Company
recognized a $138,000 decrease in the liability for unrecognized tax benefits as
an increase to the January 1, 2007 balance of retained earnings. The Company
recognizes interest and penalties related to uncertain tax positions in income
tax expense and classifies such interest and penalties in the liability for
unrecognized tax benefits.
78
As of December 31,
2009, the gross amount of unrecognized tax benefits was $1,337,000 and the total
amount of unrecognized tax benefits that would impact the effective tax rate, if
recognized, was $946,000. The Company believes it is reasonably possible that an
additional $334,000 in unrecognized tax benefits related to certain federal and
state tax items will be recognized during 2010 as a result of the expiration of
certain statues of limitations.
The activity in the
accrued liability for unrecognized tax benefits was as follows:
| (in thousands) | 2009 | 2008 | ||||||
| Balance at beginning of year | $ | 1,690 | $ | 2,412 | ||||
| Additions based on tax positions related to the | ||||||||
| current year | 142 | 245 | ||||||
| Additions for tax positions of prior years | 180 | 241 | ||||||
| Reductions for tax positions of prior years | - | (491 | ) | |||||
| Settlements of lapse of exposure | (675 | ) | (717 | ) | ||||
| Balance at end of year | $ | 1,337 | $ | 1,690 | ||||
NOTE 19—COMMITMENTS
The Company issues
financial instruments with off balance sheet risk in the normal course of the
business of meeting the financing needs of its customers. These financial
instruments include commitments to extend credit and standby letters of credit.
These instruments may involve, to varying degrees, elements of credit and
interest-rate risk in excess of the amounts recognized in the consolidated
balance sheets.
The Company’s extent
of involvement and maximum potential exposure to credit loss in the event of
nonperformance by the other party to the financial instrument for commitments to
extend credit and standby letters of credit is represented by the contractual
amount of these instruments. The Company uses the same credit policies in making
commitments and conditional obligations as it does for financial instruments
included on its consolidated balance sheets. At December 31, 2009, no amounts
have been accrued for any estimated losses for these financial
instruments.
The contractual
amount of off-balance-sheet financial instruments as of December 31, 2009 and
2008 is as follows:
| December 31, | December 31, | |||||
| (in thousands) | 2009 | 2008 | ||||
| Commitments to extend credit | $ | 457,777 | $ | 555,361 | ||
| Standby letters of credit | 32,263 | 33,875 | ||||
Commitments to extend
credit are agreements to lend to a customer as long as there is no violation of
any condition established in the contract. Commitments usually have fixed
expiration dates or other termination clauses and may require payment of a fee.
Of the total commitments to extend credit at December 31, 2009 and 2008,
approximately $84,310,000 and $131,000,000, respectively, represents fixed rate
loan commitments. Since certain of the commitments may expire without being
drawn upon, the total commitment amounts do not necessarily represent future
cash requirements. The Company evaluates each customer’s credit worthiness on a
case-by-case basis. The amount of collateral obtained, if deemed necessary by
the bank upon extension of credit, is based on management’s credit evaluation of
the borrower. Collateral held varies, but may include accounts receivable,
inventory, premises and equipment, and real estate.
Standby letters of
credit are conditional commitments issued by the bank subsidiaries to guarantee
the performance of a customer to a third party. These standby letters of credit
are issued to support contractual obligations of each bank’s customers. The
credit risk involved in issuing letters of credit is essentially the same as the
risk involved in extending loans to customers. The approximate remaining term of
standby letters of credit range from 1 month to 5 years at December 31,
2009.
79
NOTE 20—FAIR VALUE
MEASUREMENTS
The fair value of an
asset or liability is the price that would be received to sell that asset or
paid to transfer that liability in an orderly transaction occurring in the
principal market (or most advantageous market in the absence of a principal
market) for such asset or liability. In estimating fair value, the Company
utilizes valuation techniques that are consistent with the market approach, the
income approach and/or the cost approach. Such valuation techniques are
consistently applied. Inputs to valuation techniques include the assumptions
that market participants would use in pricing an asset or liability. ASC Topic
820, “Fair Value Measurements and Disclosures,” establishes a fair value
hierarchy for valuation inputs that gives the highest priority to quoted prices
in active markets for identical assets or liabilities and the lowest priority to
unobservable inputs. The fair value hierarchy is as follows:
- Level 1 Inputs - Unadjusted quoted prices in active markets
for identical assets or liabilities that the reporting entity has the ability
to access at the measurement date.
- Level 2 Inputs - Inputs other than quoted prices included
in Level 1 that are observable for the asset or liability, either directly or
indirectly. These might include quoted prices for similar assets or
liabilities in active markets, quoted prices for identical or similar assets
or liabilities in markets that are not active, inputs other than quoted prices
that are observable for the asset or liability (such as interest rates,
volatilities, prepayment speeds, credit risks, etc.) or inputs that are
derived principally from or corroborated by market data by correlation or
other means.
- Level 3 Inputs - Unobservable inputs for determining the fair values of assets or liabilities that reflect an entity's own assumptions about the assumptions that market participants would use in pricing the assets or liabilities.
The following table
summarizes financial instruments measured at fair value on a recurring basis as
of December 31, 2009, segregated by the level of the valuation inputs within the
fair value hierarchy utilized to measure fair value:
| Quoted | ||||||||||||
| Prices in | ||||||||||||
| Active | Significant | |||||||||||
| Markets for | Other | Significant | ||||||||||
| Identical | Observable | Unobservable | ||||||||||
| Assets | Inputs | Inputs | Total Fair | |||||||||
| (in thousands) | (Level 1) | (Level 2) | (Level 3) | Value | ||||||||
| Assets | ||||||||||||
| Securities available for sale | $ | - | $ | 279,631 | $ | 2,830 | $ | 282,461 | ||||
| State tax credits held for sale | - | - | 32,485 | 32,485 | ||||||||
| Derivative financial instruments | - | 1,237 | - | 1,237 | ||||||||
| Portfolio loans | - | 17,226 | - | 17,226 | ||||||||
| Total assets | $ | - | $ | 298,094 | $ | 35,315 | $ | 333,409 | ||||
| Liabilities | ||||||||||||
| Derivative financial instruments | $ | - | $ | 1,105 | $ | - | $ | 1,105 | ||||
| Total liabilities | $ | - | $ | 1,105 | $ | - | $ | 1,105 | ||||
- Securities available for
sale. Securities
classified as available for sale are reported at fair value utilizing Level 2
and Level 3 inputs. The Company obtains fair value measurements from an
independent pricing service. The fair value measurements consider observable
data that may include dealer quotes, market spreads, cash flows, the U.S.
Treasury yield curve, live trading levels, trade execution data, market
consensus prepayment speeds, credit information and the bond's terms and
conditions. Through December 31, 2009, Level 3 securities available for sale
include three Auction Rate Securities.
- Portfolio Loans. Certain fixed rate portfolio loans are
accounted for as trading instruments and reported at fair value. Fair value on
these loans is determined using a third party valuation model with observable
Level 2 market data inputs.
- State tax credits held for sale. At December 31, 2009, of the $51,258,000 of state tax credits held for sale on the consolidated balance sheet, approximately $32,485,000 were carried at fair value. The remaining $18,773,000 of state tax credits were accounted for at the lower of cost or fair value. The Company elected not to account for the state tax credits purchased in 2009 at fair value in order to limit the volatility of the fair value changes in our consolidated statements of operations.
80
The Company is not aware of an active market that exists for the 10-year
streams of state tax credit financial instruments. However, the Company’s
principal market for these tax credits consists of state residents who buy these
credits from local and regional accounting firms who broker them. As such, the
Company employed a discounted cash flow analysis (income approach) to determine
the fair value.
The fair value measurement is calculated using an internal valuation
model with observable market data including discounted cash flows based upon the
terms and conditions of the tax credits. Assuming that the underlying project
remains in compliance with the various federal and state rules governing the tax
credit program, each project will generate about 10 years of tax credits. The
inputs to the fair value calculation include: the amount of tax credits
generated each year, the anticipated sale price of the tax credit, the timing of
the sale and a discount rate. The discount rate is defined as the LIBOR swap
curve at a point equal to the remaining life in years of credits plus a 205
basis point spread. With the exception of the discount rate, the other inputs to
the fair value calculation are observable and readily available. The discount
rate is considered a Level 3 input because it is an “unobservable input” and is
based on the Company’s assumptions. Given the significance of this input to our fair value calculation, the
state tax credit assets are reported as Level 3 assets.
Economically, the Company equates the state tax credits to a fixed rate
loan. After considering various risks, such as credit risk, compliance risk, and
recapture risk, management concluded the state tax credits are equivalent to a
fixed rate loan priced at Prime minus 75 basis points. When pricing a fixed rate
loan, most banks utilize the Prime-based swap curve, which is based on the LIBOR
swap curve plus a prime equivalent spread of 265 to 285 basis points depending
on market pricing and the maturity of the underlying loan. The Prime-based swap
curve is available daily on Bloomberg or other national pricing services. As a
result, management concluded the spread of 205 basis points (prime equivalent
spread of 285 basis points minus 75 basis points) to the LIBOR curve should be
utilized in the fair value calculation.
At December 31, 2009, the discount rates utilized in our state tax
credits fair value calculation ranged from 2.30% to 6.01%. Resulting changes in
the fair value of the state tax credits held for sale decreased Gain on state
tax credits in the consolidated statement of operations by $1,304,000 for the
year ended December 31, 2009.
- Derivatives. Derivatives are reported at fair value utilizing Level 2 inputs. The Company obtains counterparty quotations to value its interest rate swaps and caps. In addition, the Company validates the counterparty quotations with third party valuation sources. Derivatives with negative fair values are included in Other liabilities in the consolidated balance sheets. Derivatives with positive fair value are included in Other assets in the consolidated balance sheets.
The following table
presents the changes in Level 3 financial instruments measured at fair value as
of December 31, 2009.
| Securities | ||||||||
| available for | ||||||||
| sale, at fair | State tax credits | |||||||
| (in thousands) | value | held for sale | ||||||
| Balance at December 31, 2008 | $ | - | $ | 39,142 | ||||
| Total gains or losses (realized and unrealized): | ||||||||
| Included in earnings | - | 444 | ||||||
| Included in other comprehensive income | (470 | ) | - | |||||
| Purchases, sales, issuances and settlements, net | 3,300 | (7,102 | ) | |||||
| Transfer in and/or out of Level 3 | - | - | ||||||
| Balance at December 31, 2009 | $ | 2,830 | $ | 32,485 | ||||
| Change in unrealized gains or losses relating to | ||||||||
| assets still held at the reporting date | $ | (470 | ) | $ | (1,304 | ) | ||
Certain financial
assets and financial liabilities are measured at fair value on a non-recurring
basis; that is, the instruments are not measured at fair value on an ongoing
basis but are subject to fair value adjustments in certain circumstances (for
example, when there is evidence of impairment).
81
- Loans held for sale. These loans are reported at the lower of
cost or fair value. Fair value is determined based on expected proceeds based
on sales contracts and commitments and are considered Level 2
inputs.
- Impaired loans. Impaired loans are included as Portfolio
loans on the Company’s consolidated balance sheet with amounts specifically
reserved for credit impairment in the Allowance for loan losses. From time to
time, fair value adjustments are recorded on impaired loans to reflect (1)
partial write-downs that are based on the current appraised or market-quoted
value of the underlying collateral or (2) the full charge-off of the loan
carrying value. In some cases, the properties for which market quotes or
appraised values have been obtained are located in areas where comparable
sales data is limited, outdated, or unavailable. In addition, the Company may
adjust the valuations based on other relevant market conditions or
information. Accordingly, fair value estimates, including those obtained from
real estate brokers or other third-party consultants, for collateral-dependent
impaired loans are classified in Level 3 of the valuation
hierarchy.
- Other Real Estate. These assets are reported at the lower of
the loan carrying amount at foreclosure or fair value less estimated costs to
sell. Fair value is based on third party appraisals of each property and the
Company’s judgment of other relevant market conditions. These are considered
Level 3 inputs.
- State Tax Credits. Certain state tax credits are reported at the lower of cost or fair value. Fair value is based on recent selling prices of the state tax credits.
The following table
presents the financial instruments and non-financial assets measured at fair
value on a non-recurring basis as of December 31, 2009.
| Quoted Prices | |||||||||||||||||
| in Active | Significant | ||||||||||||||||
| Markets for | Other | Significant | |||||||||||||||
| Identical | Observable | Unobservable | Total gains (losses) for | ||||||||||||||
| Total Fair | Assets | Inputs | Inputs | the years ended | |||||||||||||
| (in thousands) | Value | (Level 1) | (Level 2) | (Level 3) | December 31, 2009 | ||||||||||||
| Impaired loans (1) | $ | 7,590 | $ | - | $ | - | $ | 7,590 | $ | (17,596 | ) | ||||||
| Other real estate (1) | 6,955 | - | - | 6,955 | (2,389 | ) | |||||||||||
| Goodwill | - | - | - | - | (45,377 | ) | |||||||||||
| Total | $ | 14,545 | $ | - | $ | - | $ | 14,545 | $ | (65,361 | ) | ||||||
(1) The amounts
represent only balances measured at fair value during the period and still held
as of the reporting date.
82
Following is a
summary of the carrying amounts and fair values of the Company’s financial
instruments on the consolidated balance sheets at December 31, 2009 and
2008:
| December 31, 2009 | December 31, 2008 (Restated) | |||||||||||
| Carrying | Estimated | Carrying | Estimated | |||||||||
| (in thousands) | Amount | fair value | Amount | fair value | ||||||||
| Balance sheet assets | ||||||||||||
| Cash and due from banks | $ | 16,064 | $ | 16,064 | $ | 25,626 | $ | 25,626 | ||||
| Federal funds sold | 7,472 | 7,472 | 2,637 | 2,637 | ||||||||
| Interest-bearing deposits | 83,430 | 83,430 | 14,384 | 14,384 | ||||||||
| Securities available for sale | 282,461 | 282,461 | 96,431 | 96,431 | ||||||||
| Other investments | 13,189 | 13,189 | 11,884 | 11,884 | ||||||||
| Loans held for sale | 4,243 | 4,243 | 2,632 | 2,632 | ||||||||
| Derivative financial instruments | 1,237 | 1,237 | 1,835 | 1,835 | ||||||||
| Portfolio loans, net | 1,790,265 | 1,794,633 | 2,167,649 | 2,212,966 | ||||||||
| State tax credits, held for sale | 51,258 | 51,258 | 39,142 | 39,142 | ||||||||
| Accrued interest receivable | 7,751 | 7,751 | 7,557 | 7,557 | ||||||||
| Balance sheet liabilities | ||||||||||||
| Deposits | 1,941,416 | 1,944,910 | 1,792,784 | 1,800,958 | ||||||||
| Subordinated debentures | 85,081 | 43,060 | 85,081 | 71,394 | ||||||||
| Federal Home Loan Bank advances | 128,100 | 138,688 | 119,957 | 134,691 | ||||||||
| Other borrowed funds | 39,338 | 39,360 | 272,969 | 272,982 | ||||||||
| Derivative financial instruments | 1,105 | 1,105 | 1,467 | 1,467 | ||||||||
| Accrued interest payable | 2,125 | 2,125 | 2,473 | 2,473 | ||||||||
The following methods
and assumptions were used to estimate the fair value of each class of financial
instruments for which it is practical to estimate such value:
Cash, Federal funds sold, and other short-term
instruments
For cash and due from banks, federal funds purchased, interest-bearing deposits, and accrued interest receivable (payable), the carrying amount is a reasonable estimate of fair value, as such instruments reprice in a short time period.
For cash and due from banks, federal funds purchased, interest-bearing deposits, and accrued interest receivable (payable), the carrying amount is a reasonable estimate of fair value, as such instruments reprice in a short time period.
Securities available for
sale
The Company obtains fair value measurements for available for sale debt instruments from an independent pricing service. The fair value measurements consider observable data that may include dealer quotes, market spreads, cash flows, the U.S. Treasury yield curve, live trading levels, trade execution data, market consensus prepayment speeds, credit information and the bond's terms and conditions.
The Company obtains fair value measurements for available for sale debt instruments from an independent pricing service. The fair value measurements consider observable data that may include dealer quotes, market spreads, cash flows, the U.S. Treasury yield curve, live trading levels, trade execution data, market consensus prepayment speeds, credit information and the bond's terms and conditions.
Other investments
Other investments, which primarily consists of membership stock in the FHLB is reported at cost, which approximates fair value.
Other investments, which primarily consists of membership stock in the FHLB is reported at cost, which approximates fair value.
Portfolio loans, net
The fair value of adjustable-rate loans approximates cost. The fair value of fixed-rate loans is estimated by discounting the future cash flows using the current rates at which similar loans would be made to borrowers for the same remaining maturities. The fair value of the Valley Capital loans is based on the present value of expected future cash flows. The fair value of loans sold under participation agreements (see Note 2 – Loan Participation Restatement) is estimated to equal their carrying value, given our ability to settle at carrying value. As described in Note 2, all of the participation agreements were modified in 2009. The method of estimating fair value does not incorporate the exit-price concept of fair value prescribed by ASC Topic 820.
The fair value of adjustable-rate loans approximates cost. The fair value of fixed-rate loans is estimated by discounting the future cash flows using the current rates at which similar loans would be made to borrowers for the same remaining maturities. The fair value of the Valley Capital loans is based on the present value of expected future cash flows. The fair value of loans sold under participation agreements (see Note 2 – Loan Participation Restatement) is estimated to equal their carrying value, given our ability to settle at carrying value. As described in Note 2, all of the participation agreements were modified in 2009. The method of estimating fair value does not incorporate the exit-price concept of fair value prescribed by ASC Topic 820.
State tax credits held for
sale
The fair value of state tax credits held for sale is calculated using an internal valuation model with unobservable market data including discounted cash flows based upon the terms and conditions of the tax credits.
The fair value of state tax credits held for sale is calculated using an internal valuation model with unobservable market data including discounted cash flows based upon the terms and conditions of the tax credits.
83
Derivative financial
instruments
The fair value of derivative financial instruments is based on quoted market prices by the counterparty and verified by the Company using public pricing information.
The fair value of derivative financial instruments is based on quoted market prices by the counterparty and verified by the Company using public pricing information.
Deposits
The fair value of demand deposits, interest-bearing transaction accounts, money market accounts and savings deposits is the amount payable on demand at the reporting date. The fair value of fixed-maturity certificates of deposit is estimated by discounting the future cash flows using the rates currently offered for deposits of similar remaining maturities. The fair value of the Valley Capital deposits is estimated to equal their carrying value.
The fair value of demand deposits, interest-bearing transaction accounts, money market accounts and savings deposits is the amount payable on demand at the reporting date. The fair value of fixed-maturity certificates of deposit is estimated by discounting the future cash flows using the rates currently offered for deposits of similar remaining maturities. The fair value of the Valley Capital deposits is estimated to equal their carrying value.
Subordinated debentures
Fair value of subordinated debentures is based on discounting the future cash flows using rates currently offered for financial instruments of similar remaining maturities.
Fair value of subordinated debentures is based on discounting the future cash flows using rates currently offered for financial instruments of similar remaining maturities.
Federal Home Loan Bank
advances
The fair value of the FHLB advances is based on the discounted value of contractual cash flows. The discount rate is estimated using current rates on borrowed money with similar remaining maturities.
The fair value of the FHLB advances is based on the discounted value of contractual cash flows. The discount rate is estimated using current rates on borrowed money with similar remaining maturities.
Other borrowed funds
Other borrowed funds include customer repurchase agreements, federal funds purchased, notes payable, and secured borrowings related to loan participations. The fair value of federal funds purchased, customer repurchase agreements and notes payable are assumed to be equal to their carrying amount since they have an adjustable interest rate. The fair value of the secured borrowings related to the loan participations (see Note 2 – Loan Participation Restatement) is estimated to equal the carrying value of the participated loans, given our ability to settle at carrying value.
Other borrowed funds include customer repurchase agreements, federal funds purchased, notes payable, and secured borrowings related to loan participations. The fair value of federal funds purchased, customer repurchase agreements and notes payable are assumed to be equal to their carrying amount since they have an adjustable interest rate. The fair value of the secured borrowings related to the loan participations (see Note 2 – Loan Participation Restatement) is estimated to equal the carrying value of the participated loans, given our ability to settle at carrying value.
Commitments to extend credit and standby
letters of credit
The fair value of commitments to extend credit and standby letters of credit would be estimated using the fees currently charged to enter into similar agreements, taking into account the remaining terms of the agreements, the likelihood of the counterparties drawing on such financial instruments, and the present creditworthiness of such counterparties. The Company believes such commitments have been made on terms which are competitive in the markets in which it operates; however, no premium or discount is offered thereon and accordingly, the Company has not assigned a value to such instruments for purposes of this disclosure.
The fair value of commitments to extend credit and standby letters of credit would be estimated using the fees currently charged to enter into similar agreements, taking into account the remaining terms of the agreements, the likelihood of the counterparties drawing on such financial instruments, and the present creditworthiness of such counterparties. The Company believes such commitments have been made on terms which are competitive in the markets in which it operates; however, no premium or discount is offered thereon and accordingly, the Company has not assigned a value to such instruments for purposes of this disclosure.
Limitations
Fair value estimates are made at a specific point in time, based on relevant market information and information about the financial instrument. These estimates are subjective in nature and involve uncertainties and matters of significant judgment, and therefore, cannot be determined with precision. Such estimates include the valuation of loans, goodwill, intangible assets, and other long-lived assets, along with assumptions used in the calculation of income taxes, among others. These estimates and assumptions are based on management’s best estimates and judgment. Management evaluates its estimates and assumptions on an ongoing basis using historical experience and other factors, including the current economic environment, which management believes to be reasonable under the circumstances. We adjust such estimates and assumptions when facts and circumstances dictate. Decreasing real estate values, illiquid credit markets, volatile equity markets, and declines in consumer spending have combined to increase the uncertainty inherent in such estimates and assumptions. As future events and their effects cannot be determined with precision, actual results could differ significantly from these estimates. Changes in estimates resulting from continuing changes in the economic environment will be reflected in the financial statement in future periods. In addition, these estimates do not reflect any premium or discount that could result from offering for sale at one time the Company’s entire holdings of a particular financial instrument. Fair value estimates are based on existing on-balance and off-balance-sheet financial instruments without attempting to estimate the value of anticipated future business and the value of assets and liabilities that are not considered financial instruments. In addition, the tax ramifications related to the realization of the unrealized gains and losses can have a significant effect on fair value estimates and have not been considered in many of the estimates.
Fair value estimates are made at a specific point in time, based on relevant market information and information about the financial instrument. These estimates are subjective in nature and involve uncertainties and matters of significant judgment, and therefore, cannot be determined with precision. Such estimates include the valuation of loans, goodwill, intangible assets, and other long-lived assets, along with assumptions used in the calculation of income taxes, among others. These estimates and assumptions are based on management’s best estimates and judgment. Management evaluates its estimates and assumptions on an ongoing basis using historical experience and other factors, including the current economic environment, which management believes to be reasonable under the circumstances. We adjust such estimates and assumptions when facts and circumstances dictate. Decreasing real estate values, illiquid credit markets, volatile equity markets, and declines in consumer spending have combined to increase the uncertainty inherent in such estimates and assumptions. As future events and their effects cannot be determined with precision, actual results could differ significantly from these estimates. Changes in estimates resulting from continuing changes in the economic environment will be reflected in the financial statement in future periods. In addition, these estimates do not reflect any premium or discount that could result from offering for sale at one time the Company’s entire holdings of a particular financial instrument. Fair value estimates are based on existing on-balance and off-balance-sheet financial instruments without attempting to estimate the value of anticipated future business and the value of assets and liabilities that are not considered financial instruments. In addition, the tax ramifications related to the realization of the unrealized gains and losses can have a significant effect on fair value estimates and have not been considered in many of the estimates.
NOTE 21—SEGMENT
REPORTING
The Company has two primary operating segments, Banking and Wealth Management, which are delineated by the products and services that each segment offers. The segments are evaluated separately on their individual performance, as well as, their contribution to the Company as a whole.
The Company has two primary operating segments, Banking and Wealth Management, which are delineated by the products and services that each segment offers. The segments are evaluated separately on their individual performance, as well as, their contribution to the Company as a whole.
84
The Banking operating
segment consists of a full-service commercial bank, Enterprise, with locations
in St. Louis, Kansas City and Phoenix, Arizona. The majority of the Company’s
assets and income result from the Banking segment. With the exception of the
loan production office in Phoenix, all banking locations have the same product
and service offerings, have similar types and classes of customers and utilize
similar service delivery methods. Pricing guidelines and operating policies for
products and services are the same across all regions.
The Wealth Management
segment includes the Trust division of Enterprise and the state tax credit
brokerage activities. The Trust division provides estate planning, investment
management, and retirement planning as well as consulting on management
compensation, strategic planning and management succession issues. State tax
credits are part of a fee initiative designed to augment the Company’s wealth
management segment and banking lines of business. Also included in the Wealth
Management segment are the discontinued operations of Millennium. The Corporate
segment’s principal activities include the direct ownership of the Company’s
banking and non-banking subsidiaries and the issuance of debt and equity. Its
principal sources of revenue are dividends from its subsidiaries and stock
option exercises.
The financial
information for each business segment reflects that information which is
specifically identifiable or which is allocated based on an internal allocation
method. There were no material intersegment revenues among the three segments.
Management periodically makes changes to methods of assigning costs and income
to its business segments to better reflect operating results. When appropriate,
these changes are reflected in prior year information presented
below.
85
Following are the
financial results for the Company’s operating segments.
| Years ended December 31, | ||||||||||||||||
| 2009 | ||||||||||||||||
| Wealth | Corporate and | |||||||||||||||
| (in thousands) | Banking | Management | Intercompany | Total | ||||||||||||
| Net interest income (expense) | $ | 75,505 | $ | (1,095 | ) | $ | (4,769 | ) | $ | 69,641 | ||||||
| Provision for loan losses | 40,412 | - | - | 40,412 | ||||||||||||
| Noninterest income | 14,263 | 5,559 | 55 | 19,877 | ||||||||||||
| Noninterest expense | 42,143 | 6,442 | 4,465 | 53,050 | ||||||||||||
| Goodwill impairment | 45,377 | - | - | 45,377 | ||||||||||||
| Loss from continuing operations before income tax expense | (38,164 | ) | (1,978 | ) | (9,179 | ) | (49,321 | ) | ||||||||
| Income tax expense (benefit) | 4,997 | (1,370 | ) | (6,277 | ) | (2,650 | ) | |||||||||
| Net loss from continuing operations | (43,161 | ) | (608 | ) | (2,902 | ) | (46,671 | ) | ||||||||
| Loss from discontinued operations before income tax | - | (1,995 | ) | - | (1,995 | ) | ||||||||||
| Income tax benefit | - | (711 | ) | - | (711 | ) | ||||||||||
| Net loss from discontinued operations | - | (1,284 | ) | - | (1,284 | ) | ||||||||||
| Total net loss | $ | (43,161 | ) | $ | (1,892 | ) | $ | (2,902 | ) | $ | (47,955 | ) | ||||
| Portfolio loans, net | $ | 1,833,260 | $ | - | $ | - | $ | 1,833,260 | ||||||||
| Goodwill | 953 | - | - | 953 | ||||||||||||
| Intangibles, net | 1,644 | - | - | 1,644 | ||||||||||||
| Deposits | 1,960,942 | - | (19,526 | ) | 1,941,416 | |||||||||||
| Borrowings | 121,442 | 48,496 | 82,581 | 252,519 | ||||||||||||
| Total assets | 2,287,936 | 59,225 | 18,494 | 2,365,655 | ||||||||||||
| 2008 | ||||||||||||||||
| Restated | Wealth | Corporate and | Restated | |||||||||||||
| Banking | Management | Intercompany | Total | |||||||||||||
| Net interest income (expense) | $ | 71,628 | $ | (1,083 | ) | $ | (3,862 | ) | $ | 66,683 | ||||||
| Provision for loan losses | 26,510 | - | - | 26,510 | ||||||||||||
| Noninterest income | 10,027 | 10,117 | 197 | 20,341 | ||||||||||||
| Noninterest expense | 38,851 | 6,007 | 3,918 | 48,776 | ||||||||||||
| Goodwill impairment | - | - | - | - | ||||||||||||
| Income (loss) from continuing operations before income tax expense | 16,294 | 3,027 | (7,583 | ) | 11,738 | |||||||||||
| Income tax expense (benefit) | 5,843 | 1,092 | (3,263 | ) | 3,672 | |||||||||||
| Net income (loss) from continuing operations | 10,451 | 1,935 | (4,320 | ) | 8,066 | |||||||||||
| Loss from discontinued operations before income tax | - | (9,757 | ) | - | (9,757 | ) | ||||||||||
| Income tax benefit | - | (3,539 | ) | - | (3,539 | ) | ||||||||||
| Net loss from discontinued operations | - | (6,218 | ) | - | (6,218 | ) | ||||||||||
| Total net income (loss) | $ | 10,451 | $ | (4,283 | ) | $ | (4,320 | ) | $ | 1,848 | ||||||
| Portfolio loans, net | $ | 2,201,457 | $ | - | $ | - | $ | 2,201,457 | ||||||||
| Goodwill | 45,378 | 3,134 | - | 48,512 | ||||||||||||
| Intangibles, net | 2,126 | 1,378 | - | 3,504 | ||||||||||||
| Deposits | 1,818,514 | - | (25,730 | ) | 1,792,784 | |||||||||||
| Borrowings | 360,349 | 35,077 | 82,581 | 478,007 | ||||||||||||
| Total assets | 2,427,934 | 48,775 | 17,058 | 2,493,767 | ||||||||||||
| 2007 | ||||||||||||||||
| Restated | Wealth | Corporate and | Restated | |||||||||||||
| Banking | Management | Intercompany | Total | |||||||||||||
| Net interest income (expense) | $ | 64,840 | $ | 93 | $ | (3,926 | ) | $ | 61,007 | |||||||
| Provision for loan losses | 5,120 | - | - | 5,120 | ||||||||||||
| Noninterest income | 4,472 | 7,951 | 429 | 12,852 | ||||||||||||
| Noninterest expense | 35,483 | 5,853 | 3,359 | 44,695 | ||||||||||||
| Goodwill impairment | - | - | - | - | ||||||||||||
| Income (loss) from continuing operations before income tax expense | 28,709 | 2,191 | (6,856 | ) | 24,044 | |||||||||||
| Income tax expense (benefit) | 10,101 | 789 | (2,792 | ) | 8,098 | |||||||||||
| Net income (loss) from continuing operations | 18,608 | 1,402 | (4,064 | ) | 15,946 | |||||||||||
| Income from discontinued operations before income tax | - | 2,045 | - | 2,045 | ||||||||||||
| Income tax expense | - | 736 | - | 736 | ||||||||||||
| Net income from discontinued operations | - | 1,309 | - | 1,309 | ||||||||||||
| Total net income (loss) | $ | 18,608 | $ | 2,711 | $ | (4,064 | ) | $ | 17,255 | |||||||
| Portfolio loans, net | $ | 1,784,278 | $ | - | $ | - | $ | 1,784,278 | ||||||||
| Goodwill | 45,379 | 11,798 | - | 57,177 | ||||||||||||
| Intangibles, net | 3,330 | 2,723 | - | 6,053 | ||||||||||||
| Deposits | 1,588,963 | - | (3,951 | ) | 1,585,012 | |||||||||||
| Borrowings | 283,278 | 23,149 | 62,807 | 369,234 | ||||||||||||
| Total assets | 2,094,706 | 42,542 | 4,081 | 2,141,329 | ||||||||||||
86
NOTE 22—PARENT COMPANY ONLY CONDENSED
FINANCIAL STATEMENTS
Condensed Balance
Sheets
| December 31, | ||||||
| Restated | ||||||
| (in thousands) | 2009 | 2008 | ||||
| Assets | ||||||
| Cash | $ | 19,474 | $ | 23,840 | ||
| Investment in Enterprise Bank & Trust | 202,361 | 246,445 | ||||
| Investment in Millennium Holding Company | 6,777 | 8,861 | ||||
| Other assets | 18,546 | 18,947 | ||||
| Total assets | $ | 247,158 | $ | 298,093 | ||
| Liabilities and Shareholders' Equity | ||||||
| Subordinated debentures | $ | 82,581 | $ | 82,581 | ||
| Accounts payable and other liabilities | 665 | 940 | ||||
| Shareholders' equity | 163,912 | 214,572 | ||||
| Total liabilities and shareholders' equity | $ | 247,158 | $ | 298,093 | ||
Condensed Statements
of Operations
| Years ended December 31, | |||||||||||
| Restated | Restated | ||||||||||
| (in thousands) | 2009 | 2008 | 2007 | ||||||||
| Income: | |||||||||||
| Dividends from subsidiaries | $ | 800 | $ | 45,811 | $ | 8,440 | |||||
| Other | 203 | 3,162 | 559 | ||||||||
| Total income | 1,003 | 48,973 | 8,999 | ||||||||
| Expenses: | |||||||||||
| Interest expense-subordinated debentures | 4,918 | 3,471 | 3,859 | ||||||||
| Interest expense-notes payable | - | 507 | 197 | ||||||||
| Other expenses | 4,465 | 4,918 | 3,359 | ||||||||
| Total expenses | 9,383 | 8,896 | 7,415 | ||||||||
| Net (loss) income before taxes and equity in undistributed earnings of subsidiaries | (8,380 | ) | 40,077 | 1,584 | |||||||
| Income tax benefit | 6,277 | 2,338 | 2,792 | ||||||||
| Net (loss) income before equity in undistributed earnings of subsidiaries | (2,103 | ) | 42,415 | 4,376 | |||||||
| Equity in undistributed earnings of subsidiaries | (45,852 | ) | (40,567 | ) | 12,879 | ||||||
| Net (loss) income | $ | (47,955 | ) | $ | 1,848 | $ | 17,255 | ||||
87
Condensed Statements
of Cash Flow
| Years Ended December 31, | |||||||||||
| Restated | Restated | ||||||||||
| (in thousands) | 2009 | 2008 | 2007 | ||||||||
| Cash flows from operating activities: | |||||||||||
| Net (loss) income | $ | (47,955 | ) | $ | 1,848 | $ | 17,255 | ||||
| Adjustments to reconcile net income to net cash | |||||||||||
| provided by operating activities: | |||||||||||
| Gain on sale of charter | - | (2,850 | ) | - | |||||||
| Share-based compensation | 2,202 | 2,255 | 1,944 | ||||||||
| Net loss (income) of subsidiaries | 45,052 | (5,244 | ) | (21,319 | ) | ||||||
| Dividends from subsidiaries | 800 | 45,811 | 8,440 | ||||||||
| Excess tax benefits of share-based compensation | (26 | ) | (460 | ) | (381 | ) | |||||
| Additional share-based compensation from acquisition of Clayco | - | 1,000 | - | ||||||||
| Excess tax expense on additional share-based compensation from | |||||||||||
| acquisition of Clayco | 364 | - | - | ||||||||
| Other, net | 587 | (28 | ) | (2,096 | ) | ||||||
| Net cash provided by operating activities | 1,024 | 42,332 | 3,843 | ||||||||
| Cash flows from investing activities: | |||||||||||
| Cash contributions to subsidiaries | - | (73,988 | ) | - | |||||||
| Cash received in sale of charter, net of cash and cash equivalents paid | - | 5,575 | - | ||||||||
| Cash paid for acquisitions, net of cash acquired | - | - | (17,085 | ) | |||||||
| Purchases of other investments | (287 | ) | (1,494 | ) | (784 | ) | |||||
| Proceeds from maturities and principal paydowns on other investments | - | - | 124 | ||||||||
| Purchase of limited partnership interests | (512 | ) | (5,034 | ) | (1,171 | ) | |||||
| Net cash used in investing activities | (799 | ) | (74,941 | ) | (18,916 | ) | |||||
| Cash flows from financing activities: | |||||||||||
|
Proceeds
from notes payable
|
- | 15,000 | 6,750 | ||||||||
| Paydowns of notes payable | - | (21,000 | ) | (4,751 | ) | ||||||
| Proceeds from issuance of subordinated debentures | - | 25,774 | 18,557 | ||||||||
| Paydown of subordinated debentures | - | - | (4,124 | ) | |||||||
| Cash dividends paid | (2,694 | ) | (2,661 | ) | (2,638 | ) | |||||
| Excess tax expense on additional share-based compensation from | |||||||||||
| acquisition of Clayco | (364 | ) | - | - | |||||||
| Excess tax benefits of share-based compensation | 26 | 460 | 381 | ||||||||
| Issuance of preferred stock and warrants | - | 35,000 | - | ||||||||
| Dividends paid on preferred stock | (1,585 | ) | - | - | |||||||
| Preferred Stock accretion of discount and issuance cost | (130 | ) | - | - | |||||||
| Common stock repurchased | - | - | (1,743 | ) | |||||||
| Proceeds from the exercise of common stock options | 156 | 3,389 | 1,304 | ||||||||
| Net cash (used in) provided by financing activities | (4,591 | ) | 55,962 | 13,736 | |||||||
| Net (decrease) increase in cash and cash equivalents | (4,366 | ) | 23,353 | (1,337 | ) | ||||||
| Cash and cash equivalents, beginning of year | 23,840 | 487 | 1,824 | ||||||||
| Cash and cash equivalents, end of year | $ | 19,474 | $ | 23,840 | $ | 487 | |||||
| Noncash transactions: | |||||||||||
| Common stock issued for acquisitions of businesses | $ | - | $ | - | $ | 22,482 | |||||
88
NOTE 23—QUARTERLY CONDENSED FINANCIAL
INFORMATION (Unaudited)
The following table
presents the unaudited quarterly financial information for the years ended
December 31, 2009 and 2008 (restated for certain periods).
| 2009 | |||||||||||||||
| Restated | Restated | ||||||||||||||
| 4th | 3rd | 2nd | 1st | ||||||||||||
| (in thousands, except per share data) | Quarter | Quarter | Quarter | Quarter | |||||||||||
| Interest income | $ | 28,013 | $ | 30,314 | $ | 30,341 | $ | 29,818 | |||||||
| Interest expense | 10,098 | 12,931 | 12,846 | 12,970 | |||||||||||
| Net interest income | 17,915 | 17,383 | 17,495 | 16,848 | |||||||||||
| Provision for loan losses | 8,400 | 6,480 | 9,073 | 16,459 | |||||||||||
| Net interest income after provision for loan losses | 9,515 | 10,903 | 8,422 | 389 | |||||||||||
| Noninterest income | 4,225 | 9,073 | 3,748 | 2,831 | |||||||||||
| Noninterest expense | 13,732 | 12,973 | 13,805 | 57,917 | |||||||||||
| Income (loss) from continuing operations before income tax (benefit) expense | 8 | 7,003 | (1,635 | ) | (54,697 | ) | |||||||||
| Income tax (benefit) expense | (372 | ) | 2,245 | (1,673 | ) | (2,850 | ) | ||||||||
| Income (loss) from continuing operations | 380 | 4,758 | 38 | (51,847 | ) | ||||||||||
| (Loss) income from discontinued operations before income tax (benefit) expense | (315 | ) | (129 | ) | (442 | ) | 478 | ||||||||
| Loss on disposal before income tax benefit | (1,587 | ) | - | - | - | ||||||||||
| Income tax (benefit) expense | (668 | ) | (58 | ) | (103 | ) | 118 | ||||||||
| (Loss) income from discontinued operations | (1,234 | ) | (71 | ) | (339 | ) | 360 | ||||||||
| Net (loss) income | $ | (854 | ) | $ | 4,687 | $ | (301 | ) | $ | (51,487 | ) | ||||
| Net (loss) income available to common shareholders | $ | (1,462 | ) | $ | 4,082 | $ | (903 | ) | $ | (52,086 | ) | ||||
| Basic (loss) earnings per common share: | |||||||||||||||
| Basic from continuing operations | $ | (0.02 | ) | $ | 0.33 | $ | (0.04 | ) | $ | (4.09 | ) | ||||
| Basic from discontinued operations | (0.10 | ) | (0.01 | ) | (0.03 | ) | 0.03 | ||||||||
| Basic from continuing operations and discontinued operation | $ | (0.12 | ) | $ | 0.32 | $ | (0.07 | ) | $ | (4.06 | ) | ||||
| Diluted (loss) earnings per common share: | |||||||||||||||
| Diluted from continuing operations | $ | (0.02 | ) | $ | 0.32 | $ | (0.04 | ) | $ | (4.09 | ) | ||||
| Diluted from discontinued operations | (0.10 | ) | (0.01 | ) | (0.03 | ) | 0.03 | ||||||||
| Diluted from continuing operations and discontinued operation | $ | (0.12 | ) | $ | 0.31 | $ | (0.07 | ) | $ | (4.06 | ) | ||||
| 2008 (Restated) | |||||||||||||||
| 4th | 3rd | 2nd | 1st | ||||||||||||
| (in thousands, except per share data) | Quarter | Quarter | Quarter | Quarter | |||||||||||
| Interest income | $ | 31,486 | $ | 31,450 | $ | 31,478 | $ | 32,607 | |||||||
| Interest expense | 14,294 | 14,870 | 14,686 | 16,488 | |||||||||||
| Net interest income | 17,192 | 16,580 | 16,792 | 16,119 | |||||||||||
| Provision for loan losses | 16,296 | 3,007 | 4,378 | 2,829 | |||||||||||
| Net interest income after provision for loan losses | 896 | 13,573 | 12,414 | 13,290 | |||||||||||
| Noninterest income | 6,083 | 6,444 | 3,370 | 4,444 | |||||||||||
| Noninterest expense | 13,270 | 11,803 | 11,397 | 12,306 | |||||||||||
| (Loss) income from continuing operations before income tax (benefit) expense | (6,291 | ) | 8,214 | 4,387 | 5,428 | ||||||||||
| Income tax (benefit) expense | (2,853 | ) | 3,113 | 1,487 | 1,925 | ||||||||||
| (Loss) income from continuing operations | (3,438 | ) | 5,101 | 2,900 | 3,503 | ||||||||||
| (Loss) income from discontinued operations before income tax (benefit) expense | (2,972 | ) | (6,130 | ) | (240 | ) | (415 | ) | |||||||
| Income tax (benefit) expense | (1,069 | ) | (2,231 | ) | (88 | ) | (151 | ) | |||||||
| (Loss) income from discontinued operations | (1,903 | ) | (3,899 | ) | (152 | ) | (264 | ) | |||||||
| Net (loss) income | $ | (5,341 | ) | $ | 1,202 | $ | 2,748 | $ | 3,239 | ||||||
| Net (loss) income available to common shareholders | $ | (5,420 | ) | $ | 1,202 | $ | 2,748 | $ | 3,239 | ||||||
| Basic (loss) earnings per common share: | |||||||||||||||
| Basic from continuing operations | $ | (0.28 | ) | $ | 0.40 | $ | 0.23 | $ | 0.28 | ||||||
| Basic from discontinued operations | (0.15 | ) | (0.31 | ) | (0.01 | ) | (0.02 | ) | |||||||
| Basic from continuing operations and discontinued operation | $ | (0.43 | ) | $ | 0.09 | $ | 0.22 | $ | 0.26 | ||||||
| Diluted (loss) earnings per common share: | |||||||||||||||
| Diluted from continuing operations | $ | (0.28 | ) | $ | 0.40 | $ | 0.23 | $ | 0.28 | ||||||
| Diluted from discontinued operations | (0.15 | ) | (0.31 | ) | (0.01 | ) | (0.02 | ) | |||||||
| Diluted from continuing operations and discontinued operation | $ | (0.43 | ) | $ | 0.09 | $ | 0.22 | $ | 0.26 | ||||||
The first quarter and
second quarters of 2009 and all quarters of 2008 have been restated to reflect
the loan participation adjustment. The sum of the quarterly EPS amounts may not
equal the full year amounts due to rounding.
89
The following table
presents the unaudited quarterly financial information for the years ended
December 31, 2009 and 2008 (as reported for certain periods).
| 2009 | ||||||||||||||||
| As reported | As reported | |||||||||||||||
| 2nd | 1st | |||||||||||||||
| (in thousands, except per share data) | Quarter | Quarter | ||||||||||||||
| Interest income | $ | 27,755 | $ | 27,323 | ||||||||||||
| Interest expense | 10,260 | 10,475 | ||||||||||||||
|
Net interest income
|
17,495 | 16,848 | ||||||||||||||
| Provision for loan losses | 8,000 | 15,100 | ||||||||||||||
|
Net interest income after
provision for loan losses
|
9,495 | 1,748 | ||||||||||||||
| Noninterest income | 3,747 | 2,832 | ||||||||||||||
| Noninterest expense | 13,804 | 57,918 | ||||||||||||||
|
Income (loss) from continuing
operations before income tax (benefit) expense
|
(562 | ) | (53,338 | ) | ||||||||||||
|
Income tax (benefit)
expense
|
(1,287 | ) | (2,361 | ) | ||||||||||||
|
Income (loss) from continuing
operations
|
725 | (50,977 | ) | |||||||||||||
|
(Loss) income from discontinued
operations before income tax (benefit) expense
|
(442 | ) | 478 | |||||||||||||
|
Loss on disposal before income tax
benefit
|
- | - | ||||||||||||||
|
Income tax (benefit)
expense
|
(103 | ) | 118 | |||||||||||||
|
(Loss) income from discontinued
operations
|
(339 | ) | 360 | |||||||||||||
|
Net (loss) income
|
$ | 386 | $ | (50,617 | ) | |||||||||||
|
Net (loss) income available to common
shareholders
|
$ | (216 | ) | $ | (51,216 | ) | ||||||||||
| Basic (loss) earnings per common share: | ||||||||||||||||
|
Basic from continuing
operations
|
$ | 0.01 | $ | (4.02 | ) | |||||||||||
|
Basic from discontinued
operations
|
(0.03 | ) | 0.03 | |||||||||||||
|
Basic from continuing operations
and discontinued operation
|
$ | (0.02 | ) | $ | (3.99 | ) | ||||||||||
| Diluted (loss) earnings per common share: | ||||||||||||||||
|
Diluted from continuing
operations
|
$ | 0.01 | $ | (4.02 | ) | |||||||||||
|
Diluted from discontinued
operations
|
(0.03 | ) | 0.03 | |||||||||||||
|
Diluted from continuing operations
and discontinued operation
|
$ | (0.02 | ) | $ | (3.99 | ) | ||||||||||
| 2008 (As reported) | ||||||||||||||||
| 4th | 3rd | 2nd | 1st | |||||||||||||
| (in thousands, except per share data) | Quarter | Quarter | Quarter | Quarter | ||||||||||||
| Interest income | $ | 29,159 | $ | 29,283 | $ | 29,271 | $ | 30,227 | ||||||||
| Interest expense | 11,963 | 12,705 | 12,481 | 14,109 | ||||||||||||
|
Net interest
income
|
17,196 | 16,578 | 16,790 | 16,118 | ||||||||||||
| Provision for loan losses | 14,125 | 2,825 | 3,200 | 2,325 | ||||||||||||
|
Net interest income after
provision for loan losses
|
3,071 | 13,753 | 13,590 | 13,793 | ||||||||||||
| Noninterest income | 6,079 | 6,446 | 3,370 | 4,446 | ||||||||||||
| Noninterest expense | 13,270 | 11,802 | 11,398 | 12,306 | ||||||||||||
|
(Loss) income from continuing
operations before income tax (benefit) expense
|
(4,120 | ) | 8,397 | 5,562 | 5,933 | |||||||||||
|
Income tax (benefit)
expense
|
(2,071 | ) | 3,179 | 1,910 | 2,106 | |||||||||||
|
(Loss) income from continuing
operations
|
(2,049 | ) | 5,218 | 3,652 | 3,827 | |||||||||||
|
(Loss) income from discontinued
operations before income tax (benefit) expense
|
(2,972 | ) | (6,130 | ) | (240 | ) | (415 | ) | ||||||||
|
Income tax (benefit)
expense
|
(1,069 | ) | (2,231 | ) | (88 | ) | (151 | ) | ||||||||
|
(Loss) income from discontinued
operations
|
(1,903 | ) | (3,899 | ) | (152 | ) | (264 | ) | ||||||||
|
Net (loss) income
|
$ | (3,952 | ) | $ | 1,319 | $ | 3,500 | $ | 3,563 | |||||||
|
Net (loss) income available to common
shareholders
|
$ | (4,031 | ) | $ | 1,319 | $ | 3,500 | $ | 3,563 | |||||||
| Basic (loss) earnings per common share: | ||||||||||||||||
|
Basic from continuing
operations
|
$ | (0.17 | ) | $ | 0.41 | $ | 0.29 | $ | 0.31 | |||||||
|
Basic from discontinued
operations
|
(0.15 | ) | (0.31 | ) | (0.01 | ) | (0.02 | ) | ||||||||
|
Basic from continuing operations
and discontinued operation
|
$ | (0.32 | ) | $ | 0.10 | $ | 0.28 | $ | 0.29 | |||||||
| Diluted (loss) earnings per common share: | ||||||||||||||||
|
Diluted from continuing
operations
|
$ | (0.17 | ) | $ | 0.41 | $ | 0.28 | $ | 0.30 | |||||||
|
Diluted from discontinued
operations
|
(0.15 | ) | (0.31 | ) | (0.01 | ) | (0.02 | ) | ||||||||
|
Diluted from continuing operations
and discontinued operation
|
$ | (0.32 | ) | $ | 0.10 | $ | 0.27 | $ | 0.28 | |||||||
90
NOTE 24—NEW AUTHORITATIVE ACCOUNTING GUIDANCE
As discussed in Note
1—Significant Accounting Policies, on July 1, 2009, the Accounting Standards
Codification became FASB’s officially recognized source of authoritative U.S.
generally accepted accounting principles applicable to all public and non-public
non-governmental entities, superseding existing FASB, AICPA, EITF and related
literature. Rules and interpretive releases of the SEC under the authority of
federal securities laws are also sources of authoritative GAAP for SEC
registrants. All other accounting literature is considered non-authoritative.
The switch to the ASC affects the way companies refer to U.S. GAAP in financial
statements and accounting policies. Citing particular content in the ASC
involves specifying the unique numeric path to the content through the Topic,
Subtopic, Section and Paragraph structure.
FASB ASC Topic 260, “Earnings Per Share” On January 1, 2009, the Company adopted new
authoritative accounting guidance under ASC Topic 260, “Earnings Per Share,”
which provides that unvested share-based payment awards that contain
nonforfeitable rights to dividends or dividend equivalents (whether paid or
unpaid) are participating securities and shall be included in the computation of
earnings per share pursuant to the two-class method.
FASB ASC Topic 320, “Investments—Debt and Equity
Securities” New
authoritative accounting guidance under ASC Topic 320, “Investments—Debt and
Equity Securities,” (i) changes existing guidance for determining whether an
impairment is other than temporary to debt securities and (ii) replaces the
existing requirement that the entity’s management assert it has both the intent
and ability to hold an impaired security until recovery with a requirement that
management assert: (a) it does not have the intent to sell the security; and (b)
it is more likely than not it will not have to sell the security before recovery
of its cost basis. Under ASC Topic 320, declines in the fair value of
held-to-maturity and available-for-sale securities below their cost that are
deemed to be other than temporary are reflected in earnings as realized losses
to the extent the impairment is related to credit losses. The amount of the
impairment related to other factors is recognized in other comprehensive income.
The Company adopted the provisions of the new authoritative accounting guidance
under ASC Topic 320 during the first quarter of 2009. Adoption of the new
guidance did not significantly impact the Company’s financial
statements.
FASB ASC Topic 805, “Business Combinations” On January 1, 2009, new authoritative accounting guidance under ASC Topic
805, “Business Combinations,” became applicable to the Company’s accounting for
business combinations closing on or after January 1, 2009. ASC Topic 805 applies
to all transactions and other events in which one entity obtains control over
one or more other businesses. ASC Topic 805 requires an acquirer, upon initially
obtaining control of another entity, to recognize the assets, liabilities and
any non-controlling interest in the acquiree at fair value as of the acquisition
date. Contingent consideration is required to be recognized and measured at fair
value on the date of acquisition rather than at a later date when the amount of
that consideration may be determinable beyond a reasonable doubt. This fair
value approach replaces the cost-allocation process required under previous
accounting guidance whereby the cost of an acquisition was allocated to the
individual assets acquired and liabilities assumed based on their estimated fair
value. ASC Topic 805 requires acquirers to expense acquisition-related costs as
incurred rather than allocating such costs to the assets acquired and
liabilities assumed, as was previously the case under prior accounting guidance.
Assets acquired and liabilities assumed in a business combination that arise
from contingencies are to be recognized at fair value if fair value can be
reasonably estimated. If fair value of such an asset or liability cannot be
reasonably estimated, the asset or liability would generally be recognized in
accordance with ASC Topic 450, “Contingencies.” Under ASC Topic 805, the
requirements of ASC Topic 420, “Exit or Disposal Cost Obligations,” would have
to be met in order to accrue for a restructuring plan in purchase accounting.
Pre-acquisition contingencies are to be recognized at fair value, unless it is a
non-contractual contingency that is not likely to materialize, in which case,
nothing should be recognized in purchase accounting and, instead, that
contingency would be subject to the probable and estimable recognition criteria
of ASC Topic 450, “Contingencies.”
FASB ASC Topic 810, “Consolidation” New authoritative accounting guidance under
ASC Topic 810, “Consolidation,” amended prior guidance to establish accounting
and reporting standards for the non-controlling interest in a subsidiary and for
the deconsolidation of a subsidiary. Under ASC Topic 810, a non-controlling
interest in a subsidiary, which is sometimes referred to as minority interest,
is an ownership interest in the consolidated entity that should be reported as a
component of equity in the consolidated financial statements. Among other
requirements, ASC Topic 810 requires consolidated net income to be reported at
amounts that include the amounts attributable to both the parent and the
non-controlling interest. It also requires disclosure, on the face of the
consolidated income statement, of the amounts of consolidated net income
attributable to the parent and to the non-controlling interest. The new
authoritative accounting guidance under ASC Topic 810 became effective for the
Company on January 1, 2009 and did not have a significant impact on the
Company’s financial statements.
91
Further new
authoritative accounting guidance under ASC Topic 810 amends prior guidance to
change how a company determines when an entity that is insufficiently
capitalized or is not controlled through voting (or similar rights) should be
consolidated. The determination of whether a company is required to consolidate
an entity is based on, among other things, an entity’s purpose and design and a
company’s ability to direct the activities of the entity that most significantly
impact the entity’s economic performance. The new authoritative accounting
guidance requires additional disclosures about the reporting entity’s
involvement with variable-interest entities and any significant changes in risk
exposure due to that involvement as well as its affect on the entity’s financial
statements. The new authoritative accounting guidance under ASC Topic 810 will
be effective January 1, 2010 and is not expected to have a significant impact on
the Company’s financial statements.
FASB ASC Topic 815, “Derivatives and Hedging” New authoritative accounting guidance under ASC Topic 815, “Derivatives
and Hedging,” amends prior guidance to amend and expand the disclosure
requirements for derivatives and hedging activities to provide greater
transparency about (i) how and why an entity uses derivative instruments, (ii)
how derivative instruments and related hedge items are accounted for under ASC
Topic 815, and (iii) how derivative instruments and related hedged items affect
an entity’s financial position, results of operations and cash flows. To meet
those objectives, the new authoritative accounting guidance requires qualitative
disclosures about objectives and strategies for using derivatives, quantitative
disclosures about fair value amounts of gains and losses on derivative
instruments and disclosures about credit-risk-related contingent features in
derivative agreements. The new authoritative accounting guidance under ASC Topic
815 became effective for the Company on January 1, 2009 and the required
disclosures are reported in Note 8—Derivative Financial
Instruments.
FASB ASC Topic 820, “Fair Value Measurements and
Disclosures” ASC Topic 820,
“Fair Value Measurements and Disclosures,” defines fair value, establishes a
framework for measuring fair value in generally accepted accounting principles,
and expands disclosures about fair value measurements. The provisions of ASC
Topic 820 became effective for the Company on January 1, 2008 for financial
assets and financial liabilities and on January 1, 2009 for non-financial assets
and non-financial liabilities (see Note 20—Fair Value Measurements).
Additional new
authoritative accounting guidance under ASC Topic 820 affirms that the objective
of fair value when the market for an asset is not active is the price that would
be received to sell the asset in an orderly transaction, and clarifies and
includes additional factors for determining whether there has been a significant
decrease in market activity for an asset when the market for that asset is not
active. ASC Topic 820 requires an entity to base its conclusion about whether a
transaction was not orderly on the weight of the evidence. The new accounting
guidance amended prior guidance to expand certain disclosure requirements. The
Company adopted the new authoritative accounting guidance under ASC Topic 820
during the first quarter of 2009. Adoption of the new guidance did not
significantly impact the Company’s financial statements.
Further new
authoritative accounting guidance (Accounting Standards Update No. 2009-5) under
ASC Topic 820 provides guidance for measuring the fair value of a liability in
circumstances in which a quoted price in an active market for the identical
liability is not available. In such instances, a reporting entity is required to
measure fair value utilizing a valuation technique that uses (i) the quoted
price of the identical liability when traded as an asset, (ii) quoted prices for
similar liabilities or similar liabilities when traded as assets, or (iii)
another valuation technique that is consistent with the existing principles of
ASC Topic 820, such as an income approach or market approach. The new
authoritative accounting guidance also clarifies that when estimating the fair
value of a liability, a reporting entity is not required to include a separate
input or adjustment to other inputs relating to the existence of a restriction
that prevents the transfer of the liability. The forgoing new authoritative
accounting guidance under ASC Topic 820 became effective for the Company’s
financial statements for periods ending after October 1, 2009 and did not have a
significant impact on the Company’s financial statements.
FASB ASC Topic 825 “Financial Instruments” New authoritative accounting guidance under
ASC Topic 825, “Financial Instruments,” permits entities to choose to measure
eligible financial instruments at fair value at specified election dates. The
fair value measurement option (i) may be applied instrument by instrument, with
certain exceptions, (ii) is generally irrevocable and (iii) is applied only to
entire instruments and not to portions of instruments. Unrealized gains and
losses on items for which the fair value measurement option has been elected
must be reported in earnings at each subsequent reporting date. The forgoing
provisions of ASC Topic 825 became effective for the Company on January 1, 2008
(see Note 20—Fair Value Measurements).
FASB ASC Topic 855, “Subsequent Events” New authoritative accounting guidance under
ASC Topic 855, “Subsequent Events,” establishes general standards of accounting
for and disclosure of events that occur after the balance sheet date but before
financial statements are issued or available to be issued. ASC Topic 855 defines
(i) the period after the balance sheet date during which a reporting entity’s
management should evaluate events or transactions that may occur for potential
recognition or disclosure in the financial statements, (ii) the circumstances
under which an entity should recognize events or transactions occurring after
the balance sheet date in its financial statements, and (iii) the disclosures an
entity should make about events or transactions that occurred after the balance
sheet date. The new authoritative accounting guidance under ASC Topic 855 became
effective for the Company’s financial statements for periods ending after June
15, 2009 and did not have a significant impact on the Company’s financial
statements.
92
FASB ASC Topic 860, “Transfers and Servicing” New authoritative
accounting guidance under ASC Topic 860, “Transfers and Servicing,” amends prior
accounting guidance to enhance reporting about transfers of financial assets,
including securitizations, and where companies have continuing exposure to the
risks related to transferred financial assets. The new authoritative accounting
guidance eliminates the concept of a “qualifying special-purpose entity” and
changes the requirements for derecognizing financial assets. The new
authoritative accounting guidance also requires additional disclosures about all
continuing involvements with transferred financial assets including information
about gains and losses resulting from transfers during the period. The new
authoritative accounting guidance under ASC Topic 860 will be effective January
1, 2010 and is not expected to have a significant impact on the Company’s
financial statements.
FASB ASU 2010-06, “Improving Disclosures about Fair Value Measurements”
This ASU requires
disclosing the amounts of significant transfers in and out of Level 1 and 2 fair
value measurements and to describe the reasons for the transfers. The
disclosures are effective for reporting periods beginning after December 15,
2009. Additionally, disclosures of the gross purchases, sales, issuances and
settlements activity in Level 3 fair value measurements will be required for
fiscal years beginning after December 15, 2010.
ITEM 9: CHANGES IN AND DISAGREEMENTS WITH
ACCOUNTANTS ON ACCOUNTING AND
FINANCIAL DISCLOSURE
FINANCIAL DISCLOSURE
NONE
93
ITEM 9A: CONTROLS AND PROCEDURES
(a) Evaluation of Disclosure Controls and
Procedures
As of December 31, 2009, under the supervision and with the participation of the Company’s Chief Executive Officer (“CEO”) and the Chief Financial Officer (“CFO”), management has evaluated the effectiveness of the design and operation of the Company’s disclosure controls and procedures pursuant to Exchange Act Rule 13a-15. Based on that evaluation, the CEO and CFO concluded that the Company’s disclosure controls and procedures were effective as of December 31, 2009, to ensure that information required to be disclosed in the Company’s periodic SEC filings is processed, recorded, summarized and reported when required.
As of December 31, 2009, under the supervision and with the participation of the Company’s Chief Executive Officer (“CEO”) and the Chief Financial Officer (“CFO”), management has evaluated the effectiveness of the design and operation of the Company’s disclosure controls and procedures pursuant to Exchange Act Rule 13a-15. Based on that evaluation, the CEO and CFO concluded that the Company’s disclosure controls and procedures were effective as of December 31, 2009, to ensure that information required to be disclosed in the Company’s periodic SEC filings is processed, recorded, summarized and reported when required.
(b) Management’s Assessment of Internal Control Over Financial
Reporting
The Company’s management is responsible for establishing and maintaining adequate internal control over financial reporting. The Company’s internal control over financial reporting is a process designed under the supervision of the Company’s CEO and CFO to provide reasonable assurance regarding reliability of financial reporting and preparation of the Company’s financial statements for external reporting purposes in accordance with U.S. GAAP.
The Company’s management is responsible for establishing and maintaining adequate internal control over financial reporting. The Company’s internal control over financial reporting is a process designed under the supervision of the Company’s CEO and CFO to provide reasonable assurance regarding reliability of financial reporting and preparation of the Company’s financial statements for external reporting purposes in accordance with U.S. GAAP.
The Company’s
management assessed the effectiveness of the Company’s internal control over
financial reporting as of December 31, 2009, based on the criteria set forth by
the Committee of Sponsoring Organization of the Treadway Commission (COSO) in
“Internal Control-Integrated Framework.” Based on the assessment, management
determined that, as of December 31, 2009, the Company’s internal control over
financial reporting was effective based on these criteria.
KPMG LLP, the
Company’s independent registered public accounting firm, has issued an audit
report on the effectiveness of the Company’s internal control over financial
reporting as of December 31, 2009, which is included below.
(c) Changes to Internal Control Over Financial Reporting
There were no changes in the Company’s internal controls over financial reporting that have materially affected or are reasonably likely to materially affect the Company’s internal controls over financial reporting, except as discussed below with respect to remediation of a material weakness that was identified during 2009.
There were no changes in the Company’s internal controls over financial reporting that have materially affected or are reasonably likely to materially affect the Company’s internal controls over financial reporting, except as discussed below with respect to remediation of a material weakness that was identified during 2009.
(d) Remediation of Material Weakness; Changes in Internal Controls
In connection with the identification of the loan participation accounting error described in Item 7, Management Discussion & Analysis and in Item 8, Note 2 of the consolidated financial statements elsewhere in this Form 10K, the Company also determined that a material weakness in its internal controls over financial reporting existed during the periods affected by the error, including as of December 31, 2008 and December 31, 2007. The Company’s management concluded that the material weakness was the Company’s lack of a formal process to periodically review existing contracts and agreements with continuing accounting significance. To remediate this material weakness, during the fourth quarter of 2009 the Company implemented a formal process to review all contracts and agreements with continuing accounting significance on an annual basis. As a result of the review conducted in the fourth quarter, management did not identify any other errors in its previous accounting for such contracts or agreements. Management believes that this new process has remediated the material weakness in the Company’s internal control over financial reporting.
In connection with the identification of the loan participation accounting error described in Item 7, Management Discussion & Analysis and in Item 8, Note 2 of the consolidated financial statements elsewhere in this Form 10K, the Company also determined that a material weakness in its internal controls over financial reporting existed during the periods affected by the error, including as of December 31, 2008 and December 31, 2007. The Company’s management concluded that the material weakness was the Company’s lack of a formal process to periodically review existing contracts and agreements with continuing accounting significance. To remediate this material weakness, during the fourth quarter of 2009 the Company implemented a formal process to review all contracts and agreements with continuing accounting significance on an annual basis. As a result of the review conducted in the fourth quarter, management did not identify any other errors in its previous accounting for such contracts or agreements. Management believes that this new process has remediated the material weakness in the Company’s internal control over financial reporting.
94
Report of Independent Registered Public
Accounting Firm
The Board of
Directors and Shareholders
Enterprise Financial Services Corp:
Enterprise Financial Services Corp:
We have audited
Enterprise Financial Services Corp’s (the Company) internal control over
financial reporting as of December 31, 2009, based on criteria established in
Internal Control – Integrated Framework issued by the Committee of Sponsoring
Organizations of the Treadway Commission (COSO). The Company’s management is
responsible for maintaining effective internal control over financial reporting
and for its assessment of the effectiveness of internal control over financial
reporting, included in the accompanying Management’s Report on Internal Control
over Financial Reporting. Our responsibility is to express an opinion on the
Company’s internal control over financial reporting based on our audit.
We conducted our
audit in accordance with the standards of the Public Company Accounting
Oversight Board (United States). Those standards require that we plan and
perform the audit to obtain reasonable assurance about whether effective
internal control over financial reporting was maintained in all material
respects. Our audit included obtaining an understanding of internal control over
financial reporting, assessing the risk that a material weakness exists, and
testing and evaluating the design and operating effectiveness of internal
control based on the assessed risk. Our audit also included performing such
other procedures as we considered necessary in the circumstances. We believe
that our audit provides a reasonable basis for our opinion.
A company’s internal
control over financial reporting is a process designed to provide reasonable
assurance regarding the reliability of financial reporting and the preparation
of financial statements for external purposes in accordance with generally
accepted accounting principles. A company’s internal control over financial
reporting includes those policies and procedures that (1) pertain to the
maintenance of records that, in reasonable detail, accurately and fairly reflect
the transactions and dispositions of the assets of the company; (2) provide
reasonable assurance that transactions are recorded as necessary to permit
preparation of financial statements in accordance with generally accepted
accounting principles, and that receipts and expenditures of the company are
being made only in accordance with authorizations of management and directors of
the company; and (3) provide reasonable assurance regarding prevention or timely
detection of unauthorized acquisition, use, or disposition of the company’s
assets that could have a material effect on the financial statements.
Because of its
inherent limitations, internal control over financial reporting may not prevent
or detect misstatements. Also, projections of any evaluation of effectiveness to
future periods are subject to the risk that controls may become inadequate
because of changes in conditions, or that the degree of compliance with the
policies or procedures may deteriorate.
In our opinion, the
Company maintained, in all material respects, effective internal control over
financial reporting as of December 31, 2009, based on criteria established in
Internal Control – Integrated Framework issued by COSO.
We also have audited,
in accordance with the standards of the Public Company Accounting Oversight
Board (United States), the consolidated balance sheets of the Company as of
December 31, 2009 and 2008, and the related consolidated statements of
operations, shareholders’ equity and comprehensive (loss) income, and cash flows
for each of the years in the three-year period ended December 31, 2009, and our
report dated March 12, 2010 expressed an unqualified opinion on those
consolidated financial statements.

St. Louis,
MO
March 12, 2010
March 12, 2010
95
ITEM 9B: OTHER INFORMATION
The Company is not
aware of any information required to be disclosed in a report on Form 8-K during
the fourth quarter covered by their Form 10-K, but not reported, whether or not
otherwise required by this Form 10-K.
PART III
ITEM 10: DIRECTORS, EXECUTIVE OFFICERS AND
CORPORATE GOVERNANCE
The information
required by this item is incorporated herein by reference to the Company’s Proxy
Statement for its annual meeting to be held on Thursday, April 29, 2010. The
Company’s executive officers consist of the named executive officers disclosed
in the Compensation Discussion and Analysis Section of the Proxy
Statement.
ITEM 11: EXECUTIVE COMPENSATION
The information
required by this item is incorporated herein by reference to the Company’s Proxy
Statement for its annual meeting to be held on Thursday, April 29, 2010.
ITEM 12: SECURITY OWNERSHIP OF CERTAIN
BENEFICIAL OWNERS AND MANAGEMENT AND
RELATED STOCKHOLDER MATTERS
RELATED STOCKHOLDER MATTERS
The information
required by this item is incorporated herein by reference to the Company’s Proxy
Statement for its annual meeting to be held on Thursday, April 29, 2010.
ITEM 13: CERTAIN RELATIONSHIPS AND RELATED
TRANSACTIONS AND DIRECTOR
INDEPENDENCE
INDEPENDENCE
The information
required by this item is incorporated herein by reference to the Company’s Proxy
Statement for its annual meeting to be held on Thursday, April 29, 2010.
ITEM 14: PRINCIPAL ACCOUNTANT FEES AND
SERVICES
The information
required by this item is incorporated by reference to the Company’s Proxy
Statement for its annual meeting to be held on Thursday, April 29, 2010.
96
PART IV
ITEM 15. EXHIBITS AND FINANCIAL STATEMENT
SCHEDULES
(a) 1. Financial
Statements
The consolidated
financial statements of Enterprise Financial Services Corp and its subsidiaries
and independent auditors' reports are included in Part II (Item 8) of this Form
10 K.
2. Financial Statement
Schedules
All financial
statement schedules have been omitted, as they are either inapplicable or
included in the Notes to Consolidated Financial Statements.
3. Exhibits
The following
documents are included or incorporated by reference in this Annual Report on
Form 10-K:
|
Exhibit
No. |
||
| 3.1 |
Certificate of
Incorporation of Registrant, (incorporated herein by reference to Exhibit
3.1 of Registrant’s Registration Statement on Form S-1 filed on December
19, 1996 (File No. 333-14737)).
|
|
| 3.2 |
Amendment to
the Certificates of Incorporation of Registrant (incorporated herein by
reference to Exhibit 4.2 to Registrant’s Registration Statement on Form
S-8 filed on July 1, 1999 (File No. 333-82087)).
|
|
| 3.3 |
Amendment to
the Certificate of Incorporation of Registrant (incorporated herein by
reference to Exhibit 3.1 to Registrant’s Quarterly Report on Form 10-Q for
the period ending September 30, 1999).
|
|
| 3.4 |
Amendment to
the Certificate of Incorporation of Registrant (incorporated herein by
reference to Exhibit 99.2 to Registrant’s Current Report on Form 8-K filed
on April 30, 2002).
|
|
| 3.5 |
Amendment to
the Certificate of Incorporation of Registrant (incorporated herein by
reference to Appendix A to Registrant’s Proxy Statement on Form 14-A filed
on November 20, 2008).
|
|
| 3.6 |
Certificate of
Designations of Registrant for Fixed Rate Cumulative Perpetual Preferred
Stock, Series A, dated December 17, 2008 (incorporated herein by reference
to Exhibit 3.1 to Registrant’s Current Report on Form 8-K filed on
December 23, 2008).
|
|
| 3.7 |
Bylaws of
Registrant, as amended, (incorporated herein by reference to Exhibit 3.1
to Registrant’s Current Report on Form 8-K filed on October 2,
2007).
|
|
| 10.1* |
Key Executive
Employment Agreement dated effective as of July 1, 2008 by and between
Registrant and Stephen P. Marsh (incorporated herein by reference to
Exhibit 99.1 to Registrant’s Current Report on Form 8-K filed on November
25, 2008), and amended by that First Amendment of Executive Employment
Agreement dated as of December 19, 2008 (incorporated herein by reference
to Exhibit 99.6 to Registrant’s Current Report on Form 8-K filed on
December 23, 2008).
|
|
| 10.2* |
Key Executive
Employment Agreement dated effective as of December 1, 2004 by and between
Registrant and Frank H. Sanfilippo (incorporated herein by reference to
Exhibit 10.1 to Registrant’s Current Report on Form 8-K filed on December
1, 2004), and amended by that First Amendment of Executive Employment
Agreement dated as of December 19, 2008 (incorporated herein by reference
to Exhibit 99.5 to Registrant’s Current Report on Form 8-K filed on
December 23, 2008).
|
|
| 10.3* |
Key Executive
Employment Agreement dated effective as of September 24, 2008, by and
between Registrant and Peter F. Benoist (incorporated herein by reference
to Exhibit 10.1 to Registrant’s Current Report on Form 8-K filed on
September 30, 2008), and amended by that First Amendment of Executive
Employment Agreement dated as of December 19, 2008 (incorporated herein by
reference to Exhibit 99.3 to Registrant’s Current Report on Form 8-K filed
on December 23, 2008).
|
|
97
| 10.4* |
Key Executive
Employment Agreement dated effective as of November 1, 2004, by and
between Registrant and Linda M. Hanson (incorporated herein by reference
to Exhibit 10.14 to Registrant’s Report on Form 10-K for the year ended
December 31, 2007), and amended by that First Amendment of Executive
Employment Agreement dated as of December 19, 2008 (incorporated herein by
reference to Exhibit 99.4 to Registrant’s Current Report on Form 8-K filed
on December 23, 2008).
|
|
| 10.5* |
Key Executive
Employment Agreement dated effective as of October 5, 2007, by and among
Registrant, Enterprise Bank & Trust, and John G. Barry (filed
herewith), and amended by that First Amendment of Executive Employment
Agreement dated as of December 19, 2008 (incorporated herein by reference
to Exhibit 99.7 to Registrant’s Current Report on Form 8-K filed on
December 23, 2008).
|
|
| 10.6 |
Waiver executed
by each of Peter F. Benoist, Frank H. Sanfilippo, Linda M. Hanson, Stephen
P. Marsh and John G. Barry (incorporated herein by reference to Exhibit
99.2 to Registrant’s Current Report on Form 8-K filed on December 23,
2008).
|
|
| 10.7* |
Enterprise
Financial Services Corp Deferred Compensation Plan I (incorporated herein
by reference to Exhibit 10.1 of Registrant’s Quarterly Report on Form 10-Q
for the period ended March 31, 2000).
|
|
| 10.8* |
Enterprise
Financial Services Corp Amended and Restated Deferred Compensation Plan I
dated effective as of December 31, 2008 (incorporated by reference to
Exhibit 10.9 to Registrant’s Report on Form 10-K for the year ended
December 31, 2008).
|
|
| 10.9* |
Enterprise
Financial Services Corp, Third Incentive Stock Option Plan (incorporated
herein by reference to Exhibit 4.5 to Registrant’s Registration Statement
on Form S-8 filed on December 29, 1997 (File No. 333-43365)).
|
|
| 10.10* |
Enterprise
Financial Services Corp, Fourth Incentive Stock Option Plan (incorporated
herein by reference to Registrant’s 1998 Proxy Statement on Form 14-A).
|
|
| 10.11* |
Enterprise
Financial Services Corp, Stock Plan for Non-Management Directors
(incorporated herein by reference to Registrant’s Proxy Statement on Form
14-A filed on March 7, 2006).
|
|
| 10.12* |
Enterprise
Financial Services Corp, 2002 Stock Incentive Plan, as amended
(incorporated herein by reference to Registrant’s Proxy Statement on Form
14-A, filed on March 17, 2008).
|
|
| 10.13* |
Enterprise
Financial Services Corp, Annual Incentive Plan (incorporated herein by
reference to Registrant’s Proxy Statement on Form 14-A, filed on March 7,
2006).
|
|
| 10.14* |
Enterprise
Financial Services Corp, Incentive Stock Purchase Plan (incorporated
herein by reference to Exhibit 4.6 to Registrant’s Registration Statement
on Form S-8 filed on November 1, 2002 (File No. 333-100928)).
|
|
| 10.15.1 |
$20,000,000 Amended and Restated Credit
Agreement, as modified by the Third Modification Agreement dated April 30,
2007, by and between Registrant and U.S. Bank National Association
(incorporated herein by reference to Exhibit 10.1 to Registrant’s Current
Report on Form 8-K filed on June 22, 2007).
|
|
| 10.15.2 |
$20,000,000 Amended and Restated Credit
Agreement, as modified by the Fourth, Fifth and Sixth Modification
Agreements dated April 30, 2008, June 30, 2008, and December 11, 2008, by
and between Registrant and U.S. Bank National Association (incorporated
herein by reference to Exhibit 10.16.1 to Registrant’s Report on Form 10-K
for the year ended December 31, 2008).
|
|
98
| 10.16 |
Stock Purchase
Agreement dated February 5, 2008 between Registrant and First Financial
Bancshares, Inc. (incorporated herein by reference to Exhibit 2.1 to
Registrant’s Current Report on Form 8-K filed on February 6,
2008).
|
||
| 10.17 |
Condominium
Sale Contract, dated October 3, 2007, by and between Enterprise Bank &
Trust and Maryland Walk LLC (incorporated herein by reference to Exhibit
10.1 to Registrant’s Current Report on Form 8-K dated October 9,
2007).
|
||
| 10.18 |
Indenture dated
December 12, 2008, by and between Registrant and Wilmington Trust Company
(incorporated herein by reference to Exhibit 4.1 to Registrant’s Current
Report on Form 8-K filed on December 15, 2008).
|
||
| 10.19 |
Amended and
Restated Declaration of Trust dated December 12, 2008, by and among
Registrant, Wilmington Trust Company, and each of the Administrators named
therein (incorporated herein by reference to Exhibit 4.2 to Registrant’s
Current Report on Form 8-K filed on December 15, 2008).
|
||
| 10.20 |
Guarantee dated
December 12, 2008, by and between Registrant and Wilmington Trust Company
(incorporated herein by reference to Exhibit 4.3 to Registrant’s Current
Report on Form 8-K filed on December 15, 2008).
|
||
| 10.21 |
First Amendment
to Amended and Restated Declaration of Trust No. 2 dated January 9, 2009
by and among Registrant, Wilmington Trust Company and each of the
Administrators named therein (incorporated herein by reference to Exhibit
10.23 to Registrant’s Report on Form 10-K for the year ended December 31,
2008).
|
||
| 10.22 |
Warrant to
Purchase Shares of Common Stock dated December 19, 2008, by Registrant in
favor of the United States Department of the Treasury (incorporated herein
by reference to Exhibit 4.1 to Registrant’s Current Report on Form 8-K
filed on December 23, 2008).
|
||
| 10.23 |
Letter
Agreement dated December 19, 2008, including Securities Purchase Agreement
– Standard Terms incorporated by reference therein, by and between
Registrant and the United States Department of the Treasury (incorporated
herein by reference to Exhibit 99.1 to Registrant’s Current Report on Form
8-K filed on December 23, 2008).
|
||
| 21.1 |
Subsidiaries of
Registrant.
|
||
| 23.1 |
Consent of KPMG
LLP.
|
||
| 24.1 |
Power of
Attorney.
|
||
| 31.1 |
Chief Executive
Officer’s Certification required by Rule 13(a)-14(a).
|
||
| 31.2 |
Chief Financial
Officer’s Certification required by Rule 13(a)-14(a).
|
||
| 32.1 |
Chief Executive
Officer Certification pursuant to 18 U.S.C. § 1350, as adopted pursuant to
section § 906 of the Sarbanes-Oxley Act of 2002.
|
||
| 32.2 |
Chief Financial
Officer Certification pursuant to 18 U.S.C. § 1350, as adopted pursuant to
section § 906 of the Sarbanes-Oxley Act of 2002.
|
||
| 99.1 |
Certification
of Chief Executive Officer pursuant to Section III(b)(4) of the Emergency
Economic Stabilization Act of 2008.
|
||
| 99.2 |
Certification
of Chief Financial Officer pursuant to Section III(b)(4) of the Emergency
Economic Stabilization Act of 2008.
|
||
99
* Management contract
or compensatory plan or arrangement.
| Note: | ||
|
In accordance
with Item 601 (b) (4) (iii) of Regulation S-K, Registrant hereby agrees to
furnish to the SEC, upon its request, a copy of any instrument that
defines the rights of holders of each issue of long-term debt of
Registrant and its consolidated subsidiaries for which consolidated and
unconsolidated financial statements are required to be filed and that
authorizes a total amount of securities not in excess of ten percent of
the total assets of the Registrant on a consolidated
basis.
|
100
SIGNATURES
Pursuant to the
requirements of Section 13 or 15(d) of the Securities Act of 1934, the
Registrant has duly caused this report to be signed on its behalf by the
undersigned, thereunto duly authorized, on the 16th of March, 2010.
ENTERPRISE FINANCIAL
SERVICES CORP
| /s/ Peter F. Benoist | /s/ Frank H. Sanfilippo | |
| Peter F. Benoist | Frank H. Sanfilippo | |
| Chief Executive Officer | Chief Financial Officer |
Pursuant to the
requirements of the Securities Act of 1934, this Report on Form 10-K has been
signed by the following persons in the capacities indicated on the
16th of March, 2010.
| Signatures | Title | |
| /s/ Peter F. Benoist* | ||
| Peter F. Benoist | President and Chief Executive Officer and Director | |
| /s/ James J. Murphy, Jr.* | ||
| James J. Murphy, Jr. | Chairman of the Board of Directors | |
| /s/ Michael A. DeCola* | ||
| Michael A. DeCola | Director | |
| /s/ William H. Downey* | ||
| William H. Downey | Director | |
| /s/ Robert E. Guest, Jr.* | ||
| Robert E. Guest, Jr. | Director | |
| /s/ Lewis A. Levey* | ||
| Lewis A. Levey | Director | |
| /s/ Birch M. Mullins* | ||
| Birch M. Mullins | Director | |
| /s/ Brenda D. Newberry* | ||
| Brenda D. Newberry | Director | |
| /s/ Sandra A. Van Trease* | ||
| Sandra A. Van Trease | Director | |
| /s/ Henry D. Warshaw* | ||
| Henry D. Warshaw | Director | |
| *Signed by Power of Attorney. |
101