Attached files
| file | filename |
|---|---|
| EX-32.2 - EXHIBIT 32.2 - ENTERPRISE FINANCIAL SERVICES CORP | a20171231-ex322.htm |
| EX-10.1.8 - EXHIBIT 10.1.8 - ENTERPRISE FINANCIAL SERVICES CORP | a20171231-ex1018goodman.htm |
| EX-32.1 - EXHIBIT 32.1 - ENTERPRISE FINANCIAL SERVICES CORP | a20171231-ex321.htm |
| EX-31.2 - EXHIBIT 31.2 - ENTERPRISE FINANCIAL SERVICES CORP | a20171231-ex312.htm |
| EX-31.1 - EXHIBIT 31.1 - ENTERPRISE FINANCIAL SERVICES CORP | a20171231-ex311.htm |
| EX-24.1 - EXHIBIT 24.1 - ENTERPRISE FINANCIAL SERVICES CORP | a20171231-ex241.htm |
| EX-23.1 - EXHIBIT 23.1 - ENTERPRISE FINANCIAL SERVICES CORP | a20171231-ex231.htm |
| EX-21.1 - EXHIBIT 21.1 - ENTERPRISE FINANCIAL SERVICES CORP | a20171231-ex211.htm |
| EX-12.1 - EXHIBIT 12.1 - ENTERPRISE FINANCIAL SERVICES CORP | a20171231-ex121.htm |
| EX-10.1.7 - EXHIBIT 10.1.7 - ENTERPRISE FINANCIAL SERVICES CORP | a20171231-ex1017turner.htm |
| EX-10.2 - EXHIBIT 10.2 - ENTERPRISE FINANCIAL SERVICES CORP | a20171231-ex102.htm |
UNITED STATES
SECURITIES AND EXCHANGE COMMISSION
WASHINGTON, D. C. 20549
FORM 10-K
[X] | Annual Report Pursuant to Section 13 or 15(d) of the Securities and Exchange Act of 1934 For the fiscal year ended December 31, 2017. | |
[ ] | Transition Report Pursuant to Section 13 or 15(d) of the Securities Exchange Act of 1934 For the transition period from ______ to ______ | |
Commission file number 001-15373 | ||
ENTERPRISE FINANCIAL SERVICES CORP
Incorporated in the State of Delaware
I.R.S. Employer Identification # 43-1706259
Address: 150 North Meramec, Clayton, MO 63105
Telephone: (314) 725-5500
___________________
Securities registered pursuant to Section 12(b) of the Act:
(Title of class) | (Name of each exchange on which registered) |
Common Stock, par value $.01 per share | NASDAQ Global Select Market |
Securities registered pursuant to Section 12(g) of the Act:
None
Indicate by check mark if the registrant is a well-known seasoned issuer, as defined in Rule 405 of the Securities Act.
Yes [X] No [ ]
Indicate by check mark if the registrant is not required to file reports pursuant to Section 13 or Section 15(d) of the Act.
Yes [ ] No [X]
Indicate by check mark whether the registrant (1) has filed all reports required to be filed by Section 13 or 15(d) of the Securities Exchange Act of 1934 during the preceding 12 months (or for such shorter period that the registrant was required to file such reports), and (2) has been subject to such filing requirements for the past 90 days. Yes [X] No [ ]
Indicate by check mark whether the registrant has submitted electronically and posted on its corporate website, if any, every Interactive Data file required to be submitted and posted pursuant to Rule 405 of Regulation S-T (§ 232.405 of this chapter) during the preceding 12 months (or for such shorter period that the registrant was required to submit and post such files). Yes [X] No [ ]
Indicate by check mark if disclosure of delinquent filers pursuant to Item 405 of Regulation S-K (§ 229.405 of this chapter) is not contained herein, and will not be contained, to the best of registrant's knowledge, in definitive proxy or information statements incorporated by reference in Part III of this Form 10-K or any amendment to this Form 10-K. [X]
Indicate by check mark whether the registrant is a large accelerated filer, an accelerated filer, a non-accelerated filer, a smaller reporting company, or an emerging growth company. See the definitions of “large accelerated filer," "accelerated filer," "smaller reporting company" and "emerging growth company" in Rule 12b-2 of the Exchange Act. (Check one):
Large accelerated filer [X] | Accelerated filer [ ] | |||
Non-accelerated filer [ ] | (Do not check if a smaller reporting company) | Smaller reporting company [ ] | ||
Emerging growth company [ ] | ||||
If an emerging growth company, indicate by check mark if the registrant has elected to use the extended transition period for complying with any new or revised financial accounting standards provided pursuant to section 13(a) of the Exchange Act. [ ]
Indicate by check mark whether the registrant is a shell company (as defined in Rule 12b-2 of the Exchange Act).
Yes [ ] No [X]
The aggregate market value of the common stock held by non-affiliates of the Registrant was approximately $932,503,000 based on the closing price of the common stock of $40.80 as of the last business day of the registrant's most recently completed second fiscal quarter (June 30, 2017) as reported by the NASDAQ Global Select Market.
As of February 21, 2018, the Registrant had 23,162,169 shares of outstanding common stock.
DOCUMENTS INCORPORATED BY REFERENCE
Certain information required for Part III of this report is incorporated by reference to the Registrant's Proxy Statement for the 2018 Annual Meeting of Shareholders, which will be filed within 120 days of December 31, 2017.
ENTERPRISE FINANCIAL SERVICES CORP
2017 ANNUAL REPORT ON FORM 10-K
TABLE OF CONTENTS
Page | ||
PART I | ||
Item 1. | Business | |
Item 1A. | Risk Factors | |
Item 1B. | Unresolved Staff Comments | |
Item 2. | Properties | |
Item 3. | Legal Proceedings | |
Item 4. | Mine Safety Disclosures | |
PART II | ||
Item 5. | Market for Registrant's Common Equity, Related Stockholder Matters and Issuer Purchases of Equity Securities | |
Item 6. | Selected Financial Data | |
Item 7. | Management's Discussion and Analysis of Financial Condition and Results of Operations | |
Item 7A. | Quantitative and Qualitative Disclosures About Market Risk | |
Item 8. | Financial Statements and Supplementary Data | |
Item 9. | Changes in and Disagreements with Accountants on Accounting and Financial Disclosure | |
Item 9A. | Controls and Procedures | |
Item 9B. | Other Information | |
PART III | ||
Item 10. | Directors, Executive Officers, and Corporate Governance | |
Item 11. | Executive Compensation | |
Item 12. | Security Ownership of Certain Beneficial Owners, and Management and Related Stockholder Matters | |
Item 13. | Certain Relationships and Related Transactions, and Director Independence | |
Item 14. | Principal Accountant Fees and Services | |
PART IV | ||
Item 15. | Exhibits and Financial Statement Schedules | |
Item 16. | Form 10-K Summary | |
Signatures | ||
Safe Harbor Statement Under the Private Securities Litigation Reform Act of 1995
Some of the information in this report contains “forward-looking statements” within the meaning of and intended to be covered by the safe harbor provisions of the Private Securities Litigation Reform Act of 1995. Forward-looking statements typically are identified with use of terms such as “may,” “might,” “will, “should,” “expect,” “plan,” “anticipate,” “believe,” “estimate,” “predict,” “potential,” “could,” “continue” and the negative of these terms and similar words, although some forward-looking statements may be expressed differently. Forward-looking statements also include, but are not limited to, statements regarding plans, objectives, expectations or consequences of announced transactions, and statements about future performance, operations, products and services. The ability to predict results or the actual effect of future plans or strategies is inherently uncertain. You should be aware that actual results could differ materially from those contained in the forward-looking statements due to a number of factors, including, but not limited to: the ability to efficiently integrate acquisitions into our operations, retain the customers of these businesses and grow the acquired operations; credit risk; changes in the appraised valuation of real estate securing impaired loans; outcomes of litigation and other contingencies; exposure to general and local economic conditions; risks associated with rapid increases or decreases in prevailing interest rates; consolidation within the banking industry; competition from banks and other financial institutions; the ability to attract and retain relationship officers and other key personnel; burdens imposed by federal and state regulation; changes in regulatory requirements; changes in accounting regulation or standards applicable to banks; and other risks discussed under the caption “Risk Factors” in Item 1A of this Form 10-K, all of which could cause actual results to differ from those set forth in the forward-looking statements.
Readers are cautioned not to place undue reliance on forward-looking statements, which reflect management's analysis and expectations only as of the date of such statements. Forward-looking statements speak only as of the date they are made, and the Company does not intend, and undertakes no obligation, to publicly revise or update forward-looking statements after the date of this report, whether as a result of new information, future events or otherwise, except as required by federal securities law. You should understand that it is not possible to predict or identify all risk factors. Readers should carefully review all disclosures we file from time to time with the Securities and Exchange Commission which are available on the Company's website at www.enterprisebank.com under "Investor Relations."
PART 1
ITEM 1: BUSINESS
General
Enterprise Financial Services Corp (“we” or the “Company” or “Enterprise”), a Delaware corporation, is a financial holding company headquartered in Clayton, Missouri incorporated in December 1994. We are the holding company for Enterprise Bank & Trust (the “Bank”), a full service financial institution offering banking and wealth management services to individuals and corporate customers largely located in the St. Louis, Kansas City, and Phoenix metropolitan markets. Our executive offices are located at 150 North Meramec, Clayton, Missouri 63105, and our telephone number is (314) 725-5500.
Available Information
Various reports provided to the Securities and Exchange Commission (the "SEC"), including our annual reports, quarterly reports, current reports, and proxy statements, are available free of charge on our website at www.enterprisebank.com under "Investor Relations." These reports are made available as soon as reasonably practicable after they are electronically filed with or furnished to the SEC. Our filings with the SEC are also available on the SEC's website at www.sec.gov.
Business Strategy
Our stated mission is “Guiding people to a lifetime of financial success.” We have established an accompanying corporate vision, “To have a company where our associates are proud, our customers find easy to navigate, our investors value and our communities flourish.” These tenets are fundamental to our business strategies and operations.
Our business strategy is to generate shareholder returns by providing comprehensive financial services primarily to private businesses, their owner families, and other success-minded individuals. The Company has one segment for purposes of its financial reporting.
1
The Company offers a broad range of business and personal banking services including wealth management services. Lending services include commercial and industrial, commercial real estate, real estate construction and development, residential real estate, and consumer loans. A wide variety of deposit products and a complete suite of treasury management and international trade services complement our lending capabilities. Tax credit brokerage activities consist of the acquisition of Federal and State tax credits and the sale of these tax credits to clients. Enterprise Trust, a division of the Bank (“Enterprise Trust” or “Trust”), provides financial planning, estate planning, investment management, and trust services to businesses, individuals, institutions, retirement plans, and non-profit organizations.
Key components of our strategy include a focused and relationship-oriented distribution and sales approach, with an emphasis on growing fee income and niche businesses, while maintaining prudent credit and interest rate risk management, appropriate supporting technology, and controlled expense growth.
Building long-term client relationships - Our growth strategy is largely client relationship driven. We continuously seek to add clients who fit our target market of businesses, business owners, professionals, and associated relationships. Those relationships are maintained, cultivated, and expanded over time by trained, experienced banking officers and other professionals. We fund loan growth primarily with core deposits from our business and professional clients in addition to consumers in our branch market areas. This is supplemented by borrowing or other deposit sources, including advances from Federal Home Loan Bank of Des Moines (the “FHLB”), and brokered certificates of deposits.
Fee income business - We offer a broad range of Treasury Management products and services that benefit businesses ranging from large national clients to local merchants. Customized solutions and special product bundles are available to clients of all sizes. Responding to ever increasing needs for data/information security and improved functional efficiency, the Company continues to offer robust treasury systems that employ mobile technology and fraud detection/mitigation services. Enterprise Trust offers a wide range of fiduciary, investment management, and financial advisory services. We employ attorneys, certified financial planners, estate planning professionals, and other investment professionals. Enterprise Trust representatives assist clients in defining lifetime goals and designing plans to achieve them, consistent with the Company's long-term relationship strategy. The Company also offers card services including debit cards, credit cards, and merchant services, international banking, and tax credit businesses that generate fee income.
Specialized lending and product niches - We have focused an increasing amount of our lending activities in specialty markets where we believe our expertise and experience as a commercial lender provides advantages over other competitors. In addition, we have developed expertise in certain product niches. These specialty niche activities focus on the following areas:
• | Enterprise Value Lending/Senior Debt Financing. We support mid-market company mergers and acquisitions in many domestic markets. We market directly to targeted private equity firms and provide primarily senior debt financing to portfolio companies. |
• | Life Insurance Premium Finance. We specialize in financing high-end whole life insurance premiums utilized in high net worth estate planning, through relationships with boutique estate planners throughout the U.S. |
• | Tax Credit Related Lending. We are a secured lender on affordable housing projects funded through the use of Federal and State Low Income Housing tax credits. In addition, we provide leveraged and other loans on projects funded through the Department of the Treasury CDFI New Markets Tax Credit program. In prior years, we were selected to distribute New Markets Tax Credits. In this capacity, we have been responsible for allocating a total of $183 million of tax credits to clients and projects. |
• | Tax Credit Brokerage. We acquire 10-year streams of Missouri state tax credits from affordable housing development funds and sell the tax credits to clients and other individuals for tax planning purposes. |
• | Enterprise Aircraft Finance. Beginning in 2016, we acquired a unit specializing in financing and leasing solutions for the acquisition of owner-operator fixed and rotor wing aircraft. |
Capitalizing on technology - Our client technology product offerings include, but are not limited to, internet banking, mobile banking, treasury management products, remote deposit capture, check image, and statement and document
2
imaging. Additional service offerings currently supported by the Bank include controlled disbursements, repurchase agreements, and sweep investment accounts. Our treasury management suite of products blends technology and personal service, which we believe often creates a competitive advantage over our competition. Technology products are also extensively utilized within the organization by associates in all lines of business including operations and support, customer service, and financial reporting for internal management purposes and for external compliance.
Maintaining asset quality - The Company monitors asset quality through formal, ongoing, multiple-level reviews of loans in each market and specialized lending niche. These reviews are overseen by the Company's credit administration department. In addition, the loan portfolio is subject to ongoing monitoring by a loan review function that reports directly to the Credit Committee of the Bank's Board of Directors.
Expense management - The Company manages expenses carefully through detailed budgeting and expense approval processes. We measure the “efficiency ratio” as a benchmark for improvement. The efficiency ratio is equal to noninterest expense divided by total revenue (net interest income plus noninterest income).
Executive leadership - In February 2017, as part of an orderly succession and transition plan, the Company announced the resignation of Peter F. Benoist from the position of Chief Executive Officer ("CEO") and from the Company's board of directors. Concurrent with Mr. Benoist’s resignation, the Company announced that James B. Lally would succeed Mr. Benoist as CEO and as a member of the Board. The transition took place at the Company's 2017 annual meeting of stockholders on May 2, 2017.
Acquisitions and Divestitures
On February 10, 2017, the Company closed its acquisition of Jefferson County Bancshares, Inc. ("JCB"). JCB merged with and into the Company, and Eagle Bank and Trust Company of Missouri, JCB's wholly-owned subsidiary bank, merged with and into the Bank. As part of the acquisition, 3.3 million shares of the Company’s common stock were issued and approximately $29.3 million in cash was paid to JCB shareholders and holders of JCB stock options. The overall transaction had a value of approximately $171.0 million, including JCB’s common stock and stock options. The conversion of JCB's core systems was completed late in the second quarter of 2017.
Between December 2009 and August 2011, the Bank entered into four agreements with the Federal Deposit Insurance Corporation (“FDIC”) to acquire certain assets and assume certain liabilities of four failed banks: Valley Capital Bank, Home National Bank, Legacy Bank, and The First National Bank of Olathe. In conjunction with each of these, the Bank entered into loss share agreements, under which the FDIC agreed to reimburse the Bank for a percentage of losses on certain loans and other real estate acquired for the term of the agreement. In December 2015, the Bank successfully entered into an agreement with the FDIC for early termination of all existing loss share agreements. Since the termination, the Bank has fully recognized recoveries, losses, and expenses related to the assets formerly covered by the agreements, and the FDIC no longer shares in those amounts.
Subordinated Notes
On November 1, 2016, the Company issued $50 million of 4.75% fixed-to-floating rate subordinated notes with a maturity date of November 1, 2026. The subordinated notes initially bear interest at an annual rate of 4.75%, with interest payable semiannually. Beginning November 1, 2021, the interest rate resets quarterly to the three-month London Interbank Offered Rate (“LIBOR”) plus a spread of 338.7 basis points, payable quarterly. The Company used a portion of the proceeds from the issuance to pay the cash consideration at the closing of the acquisition of JCB. The remainder was for general corporate purposes.
Market Areas and Approach to Geographic Expansion
We operate in the St. Louis, Kansas City, and Phoenix metropolitan areas. The Company, as part of its expansion effort, plans to continue its strategy of operating branches with larger average deposits, and employing experienced staff who are compensated on the basis of performance and customer service.
St. Louis - As of December 31, 2017, we operated 19 banking facilities, and five limited service facilities in the St. Louis metropolitan area. The St. Louis market enjoys a stable, diverse economic base, and is ranked the 18th largest
3
metropolitan statistical area in the United States. It is an attractive market with nearly 132,000 privately held businesses and more than 68,000 households with investable assets of $1.0 million or more.
Kansas City - We conducted operations in seven banking facilities in the Kansas City market as of December 31, 2017. Kansas City is also an attractive private company market with over 104,000 privately held businesses and more than 49,000 households with investable assets of $1.0 million or more. It is the 29th largest metropolitan area in the U.S.
Phoenix - We operated two banking facilities in the Phoenix metropolitan area as of December 31, 2017. Phoenix is the nation's 12th largest metropolitan area, and has more than 232,000 privately held businesses and more than 96,000 households with investable assets over $1.0 million. We believe Phoenix is a dynamic growth market and offers attractive prospects for our business.
Competition
The Company and its subsidiaries operate in highly competitive markets. Our geographic markets are served by a number of large financial and bank holding companies with substantial capital resources and lending capacity. Many of the larger banks have established specialized units, which target private businesses and high net worth individuals. The St. Louis, Kansas City, and Phoenix markets have numerous small community banks. In addition to other financial holding companies and commercial banks, we compete with credit unions, thrifts, investment managers, brokerage firms, and other providers of financial services and products.
Supervision and Regulation
The following is a summary description of the relevant laws, rules, and regulations governing banks and financial holding companies. The description of, and references to, the statutes and regulations below are brief summaries and do not purport to be complete. The descriptions are qualified in their entirety by reference to the related statutes and regulations.
The regulatory and supervisory structure establishes a comprehensive framework of activities in which an institution can engage and is intended primarily for the protection of depositors, the deposit insurance funds and the banking system as a whole, rather than for the protection of shareholders or creditors. The regulatory structure also gives the regulatory authorities extensive discretion in connection with their supervisory and enforcement activities and examination policies, including policies concerning the establishment of deposit insurance assessment fees, classification of assets and establishment of adequate loan loss reserves for regulatory purposes.
Various legislation is from time to time introduced in Congress and Missouri's legislature. Such legislation may change applicable statutes and the operating environment in substantial and unpredictable ways. We cannot determine the ultimate effect that future legislation or implementing regulations would have upon our financial condition or upon our results of operations or the results of operations of any of our subsidiaries.
On July 21, 2010, the President signed into law the Dodd-Frank Wall Street Reform and Consumer Protection Act of 2010 ("Dodd-Frank Act"), which contains a comprehensive set of provisions designed to govern the practices and oversight of financial institutions and other participants in the financial markets. The Dodd-Frank Act made extensive changes in the regulation of financial institutions and their holding companies.
Uncertainty remains as to the ultimate impact of the Dodd-Frank Act, which could have a material adverse impact on the financial services industry as a whole and the Bank's business, results of operations, and financial condition. Many aspects of the Dodd-Frank Act have been implemented while other aspects remain subject to further rulemaking. These regulations will take effect over several years, making it difficult to anticipate the overall financial impact on the Company, its customers or the financial industry more generally. However, the Dodd-Frank Act has increased the regulatory burden, compliance costs and interest expense for the Company.
Financial Holding Company
The Company is a financial holding company registered under the Bank Holding Company Act of 1956, as amended (“BHCA”). As a financial holding company, the Company is subject to regulation and examination by the Federal Reserve, and is required to file periodic reports of its operations and such additional information as the Federal Reserve
4
may require. In order to remain a financial holding company, the Company must continue to be considered well managed and well capitalized by the Federal Reserve, and the Bank must continue to be considered well managed and well capitalized by the FDIC, and have at least a “satisfactory” rating under the Community Reinvestment Act. See “Liquidity and Capital Resources” in the Management Discussion and Analysis for more information on our capital adequacy, and “Bank Subsidiary - Community Reinvestment Act” below for more information on the Community Reinvestment Act.
Acquisitions: With certain limited exceptions, the BHCA requires every financial holding company or bank holding company to obtain the prior approval of the Federal Reserve before (i) acquiring substantially all the assets of any bank, (ii) acquiring direct or indirect ownership or control of any voting shares of any bank if, after such acquisition, it would own or control more than 5% of the voting shares of such bank (unless it already owns or controls the majority of such shares), or (iii) merging or consolidating with another bank holding company. Additionally, the BHCA provides that the Federal Reserve may not approve any of these transactions if it would result in or tend to create a monopoly, substantially lessen competition, or otherwise function as a restraint of trade, unless the anti-competitive effects of the proposed transaction are clearly outweighed by the public interest in meeting the convenience and needs of the community to be served. The Federal Reserve is also required to consider the financial and managerial resources and future prospects of the bank holding companies and banks concerned and the convenience and needs of the community to be served. The Federal Reserve’s consideration of financial resources generally focuses on capital adequacy, which is described below.
Change in Bank Control: Subject to various exceptions, the BHCA and the Change in Bank Control Act, together with related regulations, require Federal Reserve approval prior to any person or company acquiring “control” of a bank or financial holding company. Control is conclusively presumed to exist if an individual or company acquires 25% or more of any class of voting securities of the Company. Control is rebuttably presumed to exist if a person or company acquires 10% or more, but less than 25%, of any class of voting securities of the Company. The regulations provide a procedure for challenging rebuttable presumptions of control.
Permitted Activities: The BHCA has generally prohibited a bank holding company from engaging in activities other than banking or managing or controlling banks or other permissible subsidiaries and from acquiring or retaining direct or indirect control of any company engaged in any activities other than those determined by the Federal Reserve to be closely related to banking or managing or controlling banks as to be a proper incident thereto. Provisions of the Gramm-Leach-Bliley Act have expanded the permissible activities of a bank holding company that qualifies as a financial holding company. Under the regulations implementing the Gramm-Leach-Bliley Act, a financial holding company may engage in additional activities that are financial in nature or incidental or complementary to financial activities. Those activities include, among other activities, certain insurance, advisory and securities activities.
Support of Bank Subsidiaries: Under Federal Reserve policy, the Company is expected to act as a source of financial strength for the Bank and to commit resources to support the Bank. In addition, pursuant to the Dodd-Frank Act, this longstanding policy has been given the force of law, and additional regulations promulgated by the Federal Reserve to further implement the intent of the statute are possible. As in the past, such financial support from the Company may be required at times when, without this legal requirement, the Company may not be inclined to provide it.
Capital Adequacy: The Company is also subject to capital requirements applied on a consolidated basis, which are substantially similar to those required of the Bank (summarized below).
Dividend Restrictions: Under Federal Reserve policies, financial holding companies may pay cash dividends on common stock only out of income available over the past year if prospective earnings retention is consistent with the organization's expected future needs and financial condition and if the organization is not in danger of not meeting its minimum regulatory capital requirements. Federal Reserve policy also provides that financial holding companies should not maintain a level of cash dividends that undermines the financial holding company's ability to serve as a source of strength to its banking subsidiaries.
5
Bank Subsidiary
At December 31, 2017, Enterprise Bank & Trust was our only bank subsidiary. The Bank is a Missouri trust company with banking powers and is subject to supervision and regulation by the Missouri Division of Finance. In addition, as a Federal Reserve non-member bank, it is subject to supervision and regulation by the FDIC. The Bank is a member of the FHLB of Des Moines.
The Bank is subject to extensive federal and state regulatory oversight. The various regulatory authorities regulate or monitor all areas of the banking operations, including security devices and procedures, adequacy of capitalization and loss reserves, loans, investments, borrowings, deposits, mergers, issuance of securities, payment of dividends, interest rates payable on deposits, interest rates or fees chargeable on loans, establishment of branches, corporate reorganizations, maintenance of books and records, and adequacy of staff training to carry on safe lending and deposit gathering practices. The Bank must maintain certain capital ratios and is subject to limitations on aggregate investments in real estate, bank premises, low income housing projects, and furniture and fixtures. In connection with their supervision and regulation responsibilities, the Bank is subject to periodic examination by the FDIC and Missouri Division of Finance.
Capital Adequacy: The Bank is required to comply with the FDIC’s capital adequacy standards for insured banks. The FDIC has issued risk-based capital and leverage capital guidelines for measuring capital adequacy, and all applicable capital standards must be satisfied for the Bank to be considered in compliance with regulatory capital requirements.
On July 2, 2013, the Federal Reserve approved a final rule to establish a new comprehensive regulatory capital framework for all U.S. banking organizations. This regulatory capital framework, commonly referred to as Basel III, implements several changes to the U.S. regulatory capital framework required by the Dodd-Frank Act. The U.S. capital framework imposed higher minimum capital requirements, additional capital buffers above those minimum requirements, a more restrictive definition of capital and higher risk weights for various enumerated classifications of assets, the combined impact of which effectively results in substantially more demanding capital standards for U.S. banking organizations.
The Basel III final rule, effective January 1, 2015, established a new common equity tier 1 capital ("CET1") requirement, an increase in the tier 1 capital requirement from 4.0% to 6.0%, and maintains the current 8.0% total capital requirement. In addition to these minimum risk-based capital ratios, the Basel III final rule requires that all banking organizations maintain a "capital conservation buffer" consisting of CET1 capital in an amount equal to 2.5% of risk-weighted assets in order to avoid restrictions on their ability to make capital distributions and to pay certain discretionary bonus payments to executive officers. In order to avoid those restrictions, the capital conservation buffer, when fully implemented, will effectively increase the minimum CET1 capital, tier 1 capital, and total capital ratios for U.S. banking organizations to 7.0%, 8.5%, and 10.5%, respectively. Banking organizations with capital levels that fall within the buffer will be required to limit dividends, share repurchases or redemptions (unless replaced within the same calendar quarter by capital instruments of equal or higher quality), and discretionary bonus payments. The capital conservation buffer is being phased in over a five year period that began January 1, 2016.
As required by the Dodd-Frank Act, the Basel III final rule required capital instruments such as trust preferred securities and cumulative preferred shares to be phased-out of tier 1 capital by January 1, 2016, for banking organizations that had $15 billion or more in total consolidated assets as of December 31, 2009, and grandfathered as tier 1 capital such instruments issued by smaller entities prior to May 19, 2010 (provided they do not exceed 25% of tier 1 capital). The Company's trust preferred securities are grandfathered under this provision.
The Basel III final rule requires that goodwill and other intangible assets (other than mortgage servicing assets), net of associated deferred tax liabilities ("DTLs"), be deducted from CET1 capital. Additionally, deferred tax assets ("DTAs") that arise from net operating loss and tax credit carryforwards, net of associated DTLs and valuation allowances, are fully deducted from CET1 capital. However, DTAs arising from temporary differences that could not be realized through net operating loss carrybacks, along with mortgage servicing assets and "significant" (defined as greater than 10% of the issued and outstanding common stock of the unconsolidated financial institution) investments
6
in the common stock of unconsolidated "financial institutions" are partially includible in CET1 capital, subject to deductions defined in the final rule.
Prompt Corrective Action: The Bank’s capital categories are determined for the purpose of applying the “prompt corrective action” rules described below and may be taken into consideration by banking regulators in evaluating proposals for expansion or new activities. They are not necessarily an accurate representation of a bank's overall financial condition or prospects for other purposes. A failure to meet the capital guidelines could subject the Bank to a variety of enforcement actions under those rules, including the issuance of a capital directive, the termination of deposit insurance by the FDIC, a prohibition on the taking of brokered deposits, and other restrictions on its business. As described below, the FDIC also can impose other substantial restrictions on banks that fail to meet applicable capital requirements.
Federal law establishes a system of prompt corrective action to resolve the problems of undercapitalized banks. Under this system, the FDIC has established five capital categories (“well capitalized,” “adequately capitalized,” “undercapitalized,” “significantly undercapitalized,” and “critically undercapitalized”) and is required to take various mandatory supervisory actions, and is authorized to take other discretionary actions with respect to banks in the three undercapitalized categories. The severity of any such actions taken will depend upon the capital category in which a bank is placed. Generally, subject to a narrow exception, current federal law requires the FDIC to appoint a receiver or conservator for a bank that is critically undercapitalized.
Under the FDIC’s prompt corrective action rules, a bank that (1) has a total capital to risk-weighted assets ratio (the “Total Capital Ratio”) of 10.0% or greater, a tier 1 capital to risk-weighted assets ratio (the “Tier 1 Capital Ratio”) of 8.0% or greater, a CET1 capital to risk-weighted assets ratio (the "CET1 Capital Ratio") of 6.5% or greater, and a tier 1 capital to average assets (the “Leverage Ratio”) of 5.0% or greater, and (2) is not subject to any written agreement, order, capital directive, or prompt corrective action directive issued by the FDIC, is considered to be “well capitalized.” A bank with a Total Capital Ratio of 8.0% or greater, a Tier 1 Capital Ratio of 6.0% or greater, a CET1 Capital Ratio of 4.5% or greater, and a Leverage Ratio of 4.0% or greater, is considered to be “adequately capitalized.” A bank that has a Total Capital Ratio of less than 8.0%, a Tier 1 Capital Ratio of less than 6.0%, a CET1 Capital Ratio of less than 4.5%, or a Leverage Ratio of less than 4.0%, is considered to be “undercapitalized.” A bank that has a Total Capital Ratio of less than 6.0%, a Tier 1 Capital Ratio of less than 3.0%, a CET1 Capital Ratio of less than 3.0%, or a Leverage Ratio of less than 4.0%, is considered to be “significantly undercapitalized,” and a bank that has a tangible equity capital to total assets ratio equal to or less than 2.0% is deemed to be “critically undercapitalized.” A bank may be considered to be in a capitalization category lower than indicated by its actual capital position if it receives an unsatisfactory examination rating or is subject to a regulatory action that requires heightened levels of capital.
A bank that becomes “undercapitalized,” “significantly undercapitalized,” or “critically undercapitalized” is required to submit an acceptable capital restoration plan to the FDIC. An “undercapitalized” bank also is generally prohibited from increasing its average total assets, making acquisitions, establishing new branches, or engaging in any new line of business, except in accordance with an accepted capital restoration plan or with the approval of the FDIC. Also, the FDIC may treat an “undercapitalized” bank as being “significantly undercapitalized” if it determines that those actions are necessary to carry out the purpose of the law.
All of the Bank’s capital ratios were at levels that qualify it to be “well capitalized” for regulatory purposes as of December 31, 2017.
Consumer Financial Protection Bureau: The Dodd-Frank Act centralized responsibility for consumer financial protection including implementing, examining and enforcing compliance with federal consumer financial laws with Consumer Financial Protection Bureau (the "CFPB"). Depository institutions with less than $10 billion in assets, such as our Bank, will be subject to rules promulgated by the CFPB, but will continue to be examined and supervised by federal banking regulators for consumer compliance purposes.
The Bank is also subject to other laws and regulations intended to protect consumers in transactions with depository institutions, as well as other laws or regulations affecting customers of financial institutions generally. While the list set forth herein is not exhaustive, these laws and regulations include the Truth in Lending Act, the Truth in Savings
7
Act, the Electronic Funds Transfer Act, the Expedited Funds Availability Act, the Equal Credit Opportunity Act, the Fair Housing Act, the Real Estate Settlement and Procedures Act, the Fair Credit Reporting Act and the Federal Trade Commission Act, among others. These laws and regulations mandate certain disclosure requirements and regulate the manner in which financial institutions must deal with customers when taking deposits or making loans to such customers. The Bank must comply with the applicable provisions of these consumer protection laws and regulations as part of its ongoing customer relations.
UDAP and UDAAP: Banking regulatory agencies have increasingly used a general consumer protection statute to address "unethical" or otherwise "bad" business practices that may not necessarily fall directly under the purview of a specific banking or consumer finance law. The law of choice for enforcement against such business practices has been Section 5 of the Federal Trade Commission Act-the primary federal law that prohibits unfair or deceptive acts or practices and unfair methods of competition in or affecting commerce ("UDAP" or "FTC Act"). "Unjustified consumer injury" is the principal focus of the FTC Act. Moreover, the UDAP provisions have been expanded under the Dodd-Frank Act to apply to "unfair, deceptive or abusive acts or practices" ("UDAAP"), which has been delegated to the CFPB for supervision. The CFPB has brought a variety of enforcement actions for violations of UDAAP provisions and CFPB guidance continues to evolve.
Mortgage Reform: The CFPB has adopted final rules implementing minimum standards for the origination of residential mortgages, including standards regarding a customer's ability to repay, restricting variable rate lending by requiring the ability to repay variable-rate loans be determined by using the maximum rate that will apply during the first five years of a variable-rate loan term, and making more loans subject to provisions for higher cost loans, new disclosures, and certain other revisions. In addition, the Dodd-Frank Act allows borrowers to raise certain defenses to foreclosure if they receive any loan other than a "qualified mortgage" as defined by the CFPB.
Dividends by the Bank Subsidiary: Under Missouri law, the Bank may pay dividends to the Company only from a portion of its undivided profits and may not pay dividends if its capital is impaired. As an insured depository institution, federal law prohibits the Bank from making any capital distributions, including the payment of a cash dividend if it is “undercapitalized” or after making the distribution would become undercapitalized. If the FDIC believes that the Bank is engaged in, or about to engage in, an unsafe or unsound practice, the FDIC may require, after notice and hearing, that the bank cease and desist from that practice. The FDIC has indicated that paying dividends that deplete a depository institution’s capital base to an inadequate level would be an unsafe and unsound banking practice. The FDIC has issued policy statements that provide that insured banks generally should pay dividends only from their current operating earnings. The Bank’s payment of dividends also could be affected or limited by other factors, such as events or circumstances which lead the FDIC to require that it maintain capital in excess of regulatory guidelines.
Transactions with Affiliates and Insiders: The Bank is subject to the provisions of Regulation W promulgated by the Federal Reserve, which encompasses Sections 23A and 23B of the Federal Reserve Act. Regulation W places limits and conditions on the amount of loans or extensions of credit to, investments in, or certain other transactions with, affiliates and on the amount of advances to third parties collateralized by the securities or obligations of affiliates. Regulation W also prohibits, among other things, an institution from engaging in certain transactions with certain affiliates unless the transactions are on terms substantially the same, or at least as favorable to such institution or its subsidiaries, as those prevailing at the time for comparable transactions with nonaffiliated companies. Federal law also places restrictions on the Bank’s ability to extend credit to its executive officers, directors, principal shareholders and their related interests. These extensions of credit must be made on substantially the same terms, including interest rates and collateral, as those prevailing at the time for comparable transactions with unrelated third parties; and must not involve more than the normal risk of repayment or present other unfavorable features.
Community Reinvestment Act: The Community Reinvestment Act (“CRA”) requires that, in connection with examinations of financial institutions within its jurisdiction, the FDIC shall evaluate the record of the financial institutions in meeting the credit needs of their local communities, including low and moderate income neighborhoods, consistent with the safe and sound operation of those institutions. These factors are also considered in evaluating mergers, acquisitions, and applications to open a branch or facility. The Bank has a satisfactory rating under CRA.
8
USA PATRIOT Act: The Uniting and Strengthening America by Providing Appropriate Tools Required to Intercept and Obstruct Terrorism Act of 2001 (the "USA PATRIOT Act") requires each financial institution to: (i) establish an anti-money laundering program; (ii) establish due diligence policies, procedures and controls with respect to its private banking accounts and correspondent banking accounts involving foreign individuals and certain foreign banks; and (iii) implement certain due diligence policies, procedures and controls with regard to correspondent accounts in the United States for, or on behalf of, a foreign bank that does not have a physical presence in any country. In addition, the USA PATRIOT Act contains a provision encouraging cooperation among financial institutions, regulatory authorities and law enforcement authorities with respect to individuals, entities and organizations engaged in, or reasonably suspected of engaging in, terrorist acts or money laundering activities.
Commercial Real Estate Lending: The Bank’s lending operations may be subject to enhanced scrutiny by federal banking regulators based on its concentration of commercial real estate loans. On December 6, 2006, the federal banking regulators issued final guidance to remind financial institutions of the risk posed by commercial real estate (“CRE”) lending concentrations. CRE loans generally include land development, construction loans, and loans secured by multifamily property, and non-farm, nonresidential real property where the primary source of repayment is derived from rental income associated with the property. The guidance prescribes the following guidelines for its examiners to help identify institutions that are potentially exposed to significant CRE risk, including concentrations in certain types of CRE that may warrant greater supervisory scrutiny: total reported loans for construction, land development, and other land represent 100% or more of the institutions total capital; or total commercial real estate loans represent 300% or more of the institution’s total capital, and the outstanding balance of the institution’s commercial real estate loan portfolio has increased by 50% or more.
Volcker Rule: On December 10, 2013, the federal regulators adopted final regulations to implement the proprietary trading and private fund prohibitions of the Volcker Rule under the Dodd-Frank Act. Under the final regulations, which became effective July 21, 2015, banking entities are generally prohibited, subject to significant exceptions from: (i) short-term proprietary trading as principal in securities and other financial instruments, and (ii) sponsoring or acquiring or retaining an ownership interest in private equity and hedge funds.
Governmental Policies
The operations of the Company and its subsidiaries are affected not only by general economic conditions, but also by the policies of various regulatory authorities. In particular, the Federal Reserve Board (“FRB”) regulates monetary policy and interest rates in order to influence general economic conditions. These policies have a significant influence on overall growth and distribution of loans, investments and deposits and affect interest rates charged on loans or paid for deposits. FRB monetary policies have had a significant effect on the operating results of all financial institutions in the past and may continue to do so in the future.
The current U.S. administration has put in place changes to the financial services industry, including changes to policies and regulations that implement current federal law, including the Dodd-Frank Act, as well as a focus on reviewing and revising regulations promulgated during the prior administration. At this point we are unable to determine what impact potential policy changes might have on the Company or its subsidiaries.
Employees
As of December 31, 2017, we had 635 full-time equivalent employees. None of the Company's employees are covered by a collective bargaining agreement. Management believes that its relationship with its employees is good.
9
ITEM 1A: RISK FACTORS
An investment in our common shares is subject to risks inherent to our business. Before making an investment decision, you should carefully consider the risks and uncertainties described below together with all of the other information included or incorporated by reference in this report. The value of our common shares could decline due to any of these risks, and you could lose all or part of your investment.
Risks Relating to Our Business
Our allowance for loan losses may not be adequate to cover actual loan losses.
We maintain an allowance for loan losses, which is a reserve established through a provision for loan losses charged to expense, that represents management's estimate of probable losses within the existing portfolio of loans. The allowance, in the judgment of management, is sufficient to reserve for estimated loan losses and risks inherent in the loan portfolio. We continue to monitor the adequacy of our loan loss allowance and may need to increase it if economic conditions deteriorate. In addition, bank regulatory agencies periodically review our allowance for loan losses and may require an increase in the provision for loan losses or the recognition of further loan charge-offs, based on judgments that can differ somewhat from those of our own management. In addition, if charge-offs in future periods exceed the allowance for loan losses (i.e., if the loan allowance is inadequate), we may need additional loan loss provisions to increase the allowance for loan losses. Additional provisions to increase the allowance for loan losses, should they become necessary, would result in a decrease in net income and a reduction in capital, and may have a material adverse effect on our financial condition and results of operations.
An economic downturn could adversely affect our financial condition, results of operations or cash flows.
If the communities in which we operate do not grow, or if prevailing economic conditions locally or nationally are unfavorable, our business may not succeed. Unpredictable economic conditions may have an adverse effect on the quality of our loan portfolio and our financial performance. Economic recession or other economic problems in our market areas could have a material adverse impact on the quality of the loan portfolio and the demand for our products and services. Adverse changes in the economies in our market areas may have a material adverse effect on our financial condition, results of operations or cash flows. As a community bank, we bear increased risk of unfavorable local economic conditions. Moreover, we cannot give any assurance that we will benefit from any market growth or favorable economic conditions in our primary market areas even if they do occur.
Our loan portfolio is concentrated in certain markets which could result in increased credit risk.
A majority of our loans are to businesses and individuals in the St. Louis, Kansas City, and Phoenix metropolitan areas. The regional economic conditions in areas where we conduct our business have an impact on the demand for our products and services as well as the ability of our clients to repay loans, the value of the collateral securing loans, and the stability of our deposit funding sources. Consequently, a decline in local economic conditions may adversely affect our earnings.
There are material risks involved in commercial lending that could adversely affect our business.
Our business plan calls for continued efforts to increase our assets invested in commercial loans. Our credit-rated commercial loans include commercial and industrial loans to our privately-owned business clients along with loans to commercial borrowers that are secured by real estate (commercial property, multi-family residential property, 1 - 4 family residential property, and construction and land). Commercial loans generally involve a higher degree of credit risk than residential mortgage loans due, in part, to their larger average size and less readily-marketable collateral. In addition, unlike residential mortgage loans, commercial loans generally depend on the cash flow of the borrower’s business to service the debt. Adverse economic conditions or other factors affecting our target markets may have a greater adverse effect on us than on other financial institutions that have a more diversified client base. Increases in non-performing commercial loans could result in operating losses, impaired liquidity and erosion of our capital, and could have a material adverse effect on our financial condition and results of operations. Credit market tightening could adversely affect our commercial borrowers through declines in their business activities and adversely impact their overall liquidity through the diminished availability of other borrowing sources or otherwise.
10
Our loan portfolio includes loans secured by real estate, which could result in increased credit risk.
A portion of our portfolio is secured by real estate, and thus we face a high degree of risk from a downturn in our real estate markets. If real estate values would decline in our markets, our ability to recover on defaulted loans for which the primary reliance for repayment is on the real estate collateral by foreclosing and selling that real estate would then be diminished, and we would be more likely to suffer losses on defaulted loans.
Additionally, Kansas and Arizona have foreclosure laws that may hinder our ability to timely or fully recover on defaulted loans secured by property in their states. Kansas is a judicial foreclosure state, therefore all foreclosures must be processed through the Kansas state courts. Due to this process, it takes approximately one year for us to foreclose on real estate collateral located in the State of Kansas. Our ability to recover on defaulted loans secured by Kansas property may be delayed and our recovery efforts are lengthened due to this process. Arizona has an anti-deficiency statute with regards to certain types of residential mortgage loans. Our ability to recover on defaulted loans secured by residential mortgages may be limited to the fair value of the real estate securing the loan at the time of foreclosure.
Our commercial and industrial loans, enterprise value lending / senior debt financing transactions are underwritten based primarily on cash flow, profitability and enterprise value of the client and are not fully covered by the value of tangible assets or collateral of the client. Consequently, if any of these transactions becomes non-performing, we could suffer a loss of some or all of our value in the assets.
Cash flow lending involves lending money to a client based primarily on the expected cash flow, profitability and enterprise value of a client, with the value of any tangible assets as secondary protection. In some cases, these loans may have more leverage than traditional bank debt. In the case of our senior cash flow loans, we generally take a lien on substantially all of a client's assets, but the value of those assets is typically substantially less than the amount of money we advance to the client under a cash flow transaction. In addition, some of our cash flow loans may be viewed as stretch loans, meaning they may be at leverage multiples that exceed traditional accepted bank lending standards for senior cash flow loans. Thus, if a cash flow transaction becomes non-performing, our primary recourse to recover some or all of the principal of our loan or other debt product would be to force the sale of all or part of the company as a going concern. Additionally, we may obtain equity ownership in a borrower as a means to recover some or all of the principal of our loan. The risks inherent in cash flow lending include, among other things:
• | reduced use of or demand for the client's products or services and, thus, reduced cash flow of the client to service the loan and other debt product as well as reduced value of the client as a going concern; |
• | inability of the client to manage working capital, which could result in lower cash flow; |
• | inaccurate or fraudulent reporting of our client's positions or financial statements; |
• | economic downturns, political events, regulatory changes, litigation or acts of terrorism that affect the client's business, financial condition and prospects; and |
• | our client's poor management of their business. |
Additionally, many of our clients use the proceeds of our cash flow transactions to make acquisitions. Poorly executed or poorly conceived acquisitions can burden management, systems and the operations of the existing business, causing a decline in both the client's cash flow and the value of its business as a going concern. In addition, many acquisitions involve new management teams taking over day-to-day operations of a business. These new management teams may fail to execute at the same level as the former management team, which could reduce the cash flow of the client available to service the loan or other debt product, as well as reduce the value of the client as a going concern.
Widespread financial difficulties or downgrades in the financial strength or credit ratings of life insurance providers could lessen the value of the collateral securing our life insurance premium finance loans and impair our financial condition and liquidity.
One of the specialized products we offer is financing high-end whole life insurance premiums utilized in high net worth estate planning. These loans are primarily secured by the insurance policies financed by the loans, i.e., the obligations of the life insurance providers under those policies. Nationally Recognized Statistical Rating Organizations (“NRSROs”) such as Standard & Poor’s, Moody’s and A.M. Best evaluate the life insurance providers that are the payors on the life insurance policies that we finance. The value of our collateral could be materially impaired in the event there are widespread financial difficulties among life insurance providers or the NRSROs downgrade the financial strength ratings or credit ratings of the life insurance providers, indicating the NRSROs’ opinion that the life insurance
11
provider’s ability to meet policyholder obligations is impaired, or the ability of the life insurance provider to meet the terms of its debt obligations is impaired. The value of our collateral is also subject to the risk that a life insurance provider could become insolvent. In particular, if one or more large nationwide life insurance providers were to fail, the value of our portfolio could be significantly negatively impacted. A significant downgrade in the value of the collateral supporting our premium finance business could impair our ability to create liquidity for this business, which, in turn could negatively impact our ability to expand.
Our loan portfolio includes agricultural loans, and the ability of the borrower to repay may be affected by many factors outside of the borrower's control.
We engage in lending to agricultural businesses, including farms, for both real estate loans and operational loans. Any extended period of low commodity prices, drought conditions, significantly reduced yields on crops and/or reduced levels of government assistance to the agricultural industry could result in an increase in the level of problem agriculture loans and potentially result in additional provisions to increase our allowance for loan losses, and may have a material adverse effect on our financial condition and results of operations.
We engage in aircraft financing transactions, in which high-value collateral is susceptible to potential catastrophic loss. Consequently, if any of these transactions becomes non-performing, we could suffer a loss of some or all of our value in the assets.
In January 2016, we acquired an aircraft financing platform and the associated portfolio of aircraft loans. These transactions are secured by the aircraft financed by the loans. Aircraft as collateral presents unique risks: it is high-value, but susceptible to rapid movement across different locations and potential catastrophic loss. Although the loan documentation for these transactions includes insurance covenants and other provisions to protect the lender against risk of loss, there can be no assurance that, in the event of a catastrophic loss, the insurance proceeds would be sufficient to ensure our full recovery of the aircraft loan. Moreover, a relatively small number of non-performing aircraft loans could have a significant negative impact on the value of our portfolio. If we must make additional provisions to increase our allowance for loan losses, we could experience a decrease in net income and possibly a reduction in capital, which could have a material adverse effect on our financial condition and results of operations.
We may be obligated to indemnify certain counterparties in financing transactions we enter into pursuant to the New Markets Tax Credit Program.
We participate in and are an "Allocatee" of the New Markets Tax Credit Program of the U.S. Department of the Treasury Community Development Financial Institutions Fund. Through this program, we provide our allocation to certain projects, which in turn for an equity investment from an Investor in the project generate federal tax credits to those investors. This equity, coupled with any debt or equity from the project sponsor is in turn invested in a certified community development entity for a period of at least seven years. Community development entities must use this capital to make loans to, or other investments in, qualified businesses in low-income communities in accordance with New Markets Tax Credit Program criteria. Investors receive an overall tax credit equal to 39% of their total equity investment, credited at a rate of five percent in each of the first three years and six percent in each of the final four years. However, after the exhaustion of all cure periods and remedies, the entire credit is subject to recapture if the certified community development entity fails to maintain its certified status, or if substantially all of the equity investment proceeds associated with the tax credits we allocate are no longer continuously invested in a qualified business that meets the New Markets Tax Credit Program criteria, or if the equity investment is redeemed prior to the end of the minimum seven-year term. As part of these financing transactions, we as the parent to Enterprise Financial CDE, LLC ("CDE"), provide customary indemnities to the tax credit investors, which require us to indemnify and hold harmless the investors in the event a credit recapture event occurs, unless the recapture is a result of action or inaction of the investor. No assurance can be given that these counterparties will not call upon us to discharge these obligations in the circumstances under which they are owed. If this were to occur, the amount we may be required to pay a bank investor could be substantial and could have a material adverse effect on our results of operations and financial condition.
If we fail to comply with requirements of the federal New Markets Tax Credit program, the U.S. Department of the Treasury Community Development Financial Institutions Fund could seek any remedies available under its Allocation
12
Agreement with us, and we could suffer significant reputational harm and be subject to greater scrutiny from banking regulators.
Because we have been designated as an “Allocatee” under the New Markets Tax Credit Program, we are required to provide allocation fund qualifying projects under the New Markets Tax Credit Program, and we are responsible for monitoring those projects, ensuring their ongoing compliance with the requirements of the New Markets Tax Credit Program and satisfying the various recordkeeping and reporting requirements under the New Markets Tax Credit Program. If we default in our obligations under the New Markets Tax Credit Program, the U.S. Department of the Treasury may revoke our participation in any other CDFI Fund programs, reallocate the new market tax credits that were originally allocated to us, and take any other remedial actions that it is empowered to take under the Allocation Agreement they have entered into with us with respect to the New Markets Tax Credit Program, with the full range of such remedies being unknown. If we were to default under the New Markets Tax Credit Program, we could suffer negative publicity in the communities in which we operate, and we could face greater scrutiny from federal and state bank regulators, especially with regard to our compliance with the Community Reinvestment Act. These developments could have a material adverse impact on our reputation, business, financial condition, results of operations and liquidity.
We face potential risks from litigation brought against the Company or its subsidiaries.
We are involved in various lawsuits and legal proceedings. Pending or threatened litigation against the Company or the Bank, litigation-related costs and any legal liability as a result of an adverse determination with respect to one or more of these legal proceedings could have a material adverse effect on our business, cash flows, financial position or results of operations and/or could cause us significant reputational harm, including without limitation as a result of negative publicity the Company may face even if it prevails in such legal proceedings, which could adversely affect our business prospects.
Liquidity risk could impair our ability to fund operations and meet debt coverage obligations, and jeopardize our financial condition.
Liquidity is essential to our business. We are a holding company and depend on our subsidiaries for liquidity needs, including debt coverage requirements. An inability to raise funds through deposits, borrowings, the sale of investment securities and other sources could have a substantial material adverse effect on our liquidity. Our access to funding sources in amounts that are adequate to finance our activities could be impaired by factors that affect us specifically or the financial services industry in general. Factors that could detrimentally impact our access to liquidity sources include but are not limited to a decrease in the level of our business activity due to a market downturn, our failure to remain well capitalized, or adverse regulatory action against us. Our ability to acquire deposits or to borrow could also be impaired by factors that are not specific to us, such as a severe disruption of the financial markets or negative views and expectations about the prospects for the financial services industry as a whole.
Loss of customer deposits could increase our funding costs.
We rely on bank deposits to be a low cost and stable source of funding. We compete with banks and other financial services companies for deposits. If our competitors raise the rates they pay on deposits, our funding costs may increase, either because we raise our rates to avoid losing deposits or because we lose deposits and must rely on more expensive sources of funding. Higher funding costs could reduce our net interest margin and net interest income and could have a material adverse effect on our business, financial condition and results of operations.
Our utilization of brokered deposits could adversely affect our liquidity and results of operations.
Since our inception, we have utilized both brokered and non-brokered deposits as a source of funds to support our growing loan demand and other liquidity needs. As a bank regulatory supervisory matter, reliance upon brokered deposits as a significant source of funding is discouraged. Brokered deposits may not be as stable as other types of deposits, and, in the future, those depositors may not renew their deposits when they mature, or we may have to pay a higher rate of interest to keep those deposits or may have to replace them with other deposits or with funds from other sources. Additionally, if the Bank ceases to be categorized as “well capitalized” for bank regulatory purposes, it would not be able to accept, renew or roll over brokered deposits without a waiver from the FDIC. Our inability to maintain or replace these brokered deposits as they mature could adversely affect our liquidity and results of operations. Further, paying higher interests rates to maintain or replace these deposits could adversely affect our net interest margin and results of operations.
13
We may need to raise additional capital in the future, and such capital may not be available to us or may only be available on unfavorable terms.
We may need to raise additional capital in the future in order to support growth or manage adverse developments such as any additional provisions for loan losses, to maintain our capital ratios, or for other reasons. The condition of the financial markets may be such that we may not be able to obtain additional capital, or the additional capital may only be available on terms that are not attractive to us.
No assurance can be given that the subordinated notes will continue to qualify as Tier 2 capital.
We treat the 4.75% fixed-to-floating rate subordinated notes as “Tier 2 capital” under the Board of Governors of the Federal Reserve System (the “Federal Reserve Board”) regulatory rules and guidelines. If the subordinated notes are no longer qualified as Tier 2 capital, it could have an adverse effect on our capital requirements under the Federal Reserve Board rules and guidelines.
Our business is subject to interest rate risk and variations in interest rates may negatively affect our financial performance.
A substantial portion of our income is derived from the differential or “spread” between the interest earned on loans, investment securities, and other interest-earning assets, and the interest paid on deposits, borrowings, and other interest-bearing liabilities. Because of the differences in the maturities and repricing characteristics of our interest-earning assets and interest-bearing liabilities, changes in interest rates may not produce equivalent changes in interest income earned on interest-earning assets and interest paid on interest-bearing liabilities. Significant fluctuations in market interest rates could materially and adversely affect not only our net interest spread, but also our asset quality and loan origination volume, deposits, funding availability, and/or net income.
We face potential risk from changes in governmental monetary policies.
The Bank’s earnings are affected by domestic economic conditions and the monetary and fiscal policies of the United States government and its agencies. The Federal Reserve’s monetary policies have had, and are likely to continue to have, an important impact on the operating results of commercial banks through its power to implement national monetary policy in order, among other things, to curb inflation or combat a recession. The monetary policies of the Federal Reserve affect the levels of bank loans, investments, and deposits through its control over the issuance of United States government securities, its regulation of the discount rate applicable to member banks, and its influence over reserve requirements to which member banks are subject. The Bank cannot predict the nature or impact of future changes in monetary and fiscal policies.
The ability of our borrowers to repay their loans may be adversely affected by an increase in market interest rates which could result in increased credit losses. These increased credit losses, where the Bank has retained credit exposure, could decrease our assets, net income and cash available.
The loans we make to our borrowers typically bear interest at a variable or floating interest rate. When market interest rates increase, the amount of revenue borrowers need to service their debt also increases. Some borrowers may be unable to make their debt service payments. As a result, an increase in market interest rates will increase the risk of loan default. An increase in non-performing loans could result in a net loss of earnings from these loans, an increase in the provision for loan and covered loan losses, and an increase in loan charge-offs, all of which could have a material adverse effect on our business, financial condition and results of operations.
By engaging in derivative transactions, we are exposed to additional credit and market risk in our banking business.
We may use interest rate swaps to help manage our interest rate risk in our banking business from recorded financial assets and liabilities when they can be demonstrated to effectively hedge a designated asset or liability and the asset or liability exposes us to interest rate risk or risks inherent in client related derivatives. We may use other derivative financial instruments to help manage other economic risks, such as liquidity and credit risk, including exposures that arise from business activities that result in the receipt or payment of future known or uncertain cash amounts, the value of which are determined by interest rates. We also have derivatives that result from a service we provide to certain qualifying clients approved through our credit process, and therefore, these derivatives are not used to manage interest rate risk in our assets or liabilities. Hedging interest rate risk is a complex process, requiring sophisticated models and
14
routine monitoring. As a result of interest rate fluctuations, hedged assets and liabilities will appreciate or depreciate in market value. The effect of this unrealized appreciation or depreciation will generally be offset by income or loss on the derivative instruments that are linked to the hedged assets and liabilities. By engaging in derivative transactions, we are exposed to credit and market risk. If the counterparty fails to perform, credit risk exists to the extent of the fair value gain in the derivative. Market risk exists to the extent that interest rates change in ways that are significantly different from what we expected when we entered into the derivative transaction. The existence of credit and market risk associated with our derivative instruments could adversely affect our net interest income and, therefore, could have a material adverse effect on our business, financial condition, results of operations and future prospects.
If the Company incurs losses that erode its capital, it may become subject to enhanced regulation or supervisory action.
Under federal and state laws and regulations pertaining to the safety and soundness of insured depository institutions, the Missouri Division of Finance, the Federal Reserve Board, and the FDIC have the authority to compel or restrict certain actions if the Company's or the Bank's capital should fall below adequate capital standards as a result of future operating losses, or if its bank regulators determine that it has insufficient capital. Among other matters, the corrective actions include but are not limited to requiring affirmative action to correct any conditions resulting from any violation or practice; directing an increase in capital and the maintenance of specific minimum capital ratios; restricting the Bank's operations; limiting the rate of interest the bank may pay on brokered deposits; restricting the amount of distributions and dividends and payment of interest on its trust preferred securities; requiring the Bank to enter into informal or formal enforcement orders, including memoranda of understanding, written agreements and consent or cease and desist orders to take corrective action and enjoin unsafe and unsound practices; removing officers and directors and assessing civil monetary penalties; and taking possession of and closing and liquidating the Bank. These actions may limit the ability of the Bank or Company to execute its business plan and thus can lead to an adverse impact on the results of operations or financial position.
Changes in government regulation and supervision may increase our costs, or impact our ability to operate in certain lines of business.
Our operations are subject to extensive regulation by federal, state and local governmental authorities and are subject to various laws and judicial and administrative decisions imposing requirements and restrictions on part or all of our operations. Banking regulations are primarily intended to protect depositors' funds, federal deposit insurance funds and the banking system as a whole, not stockholders. Because our business is highly regulated, the laws, rules, regulations and supervisory guidance and policies applicable to us are subject to regular modification and change and could result in an adverse impact on our results of operations.
Any future increases in FDIC insurance premiums might adversely impact our earnings.
Over the past several years, the FDIC has adopted several rules which have resulted in a number of changes to the FDIC assessments, including modification of the assessment system and a special assessment. It is possible that the FDIC may impose special assessments in the future or further increase our annual assessment, which could adversely affect our earnings.
We may be adversely affected by the soundness of other financial institutions.
Financial services institutions are interrelated as a result of trading, clearing, counterparty or other relationships. We have exposure to different institutions and counterparties, and we execute transactions with various counterparties in the financial industry, including federal home loan banks, commercial banks, brokers and dealers, investment banks and other institutional clients. Defaults by financial services institutions, and even rumors or questions about one or more financial services institutions or the financial services industry in general, have led to market-wide liquidity problems in prior years and could lead to losses or defaults by us or by other institutions. Any such losses could materially and adversely affect our results of operations or financial position.
We face significant competition.
The financial services industry, including but not limited to, commercial banking, mortgage banking, consumer lending, and home equity lending, is highly competitive, and we encounter strong competition for deposits, loans, and other financial services in all of our market areas in each of our lines of business. Our principal competitors include other commercial banks, savings banks, savings and loan associations, mutual funds, money market funds, finance
15
companies, trust companies, insurers, credit unions, and mortgage companies among others. Many of our non-bank competitors are not subject to the same degree of regulation as us and have advantages over us in providing certain services. Many of our competitors are significantly larger than us and have greater access to capital and other resources. Also, our ability to compete effectively in our business is dependent on our ability to adapt successfully to regulatory and technological changes within the banking and financial services industry, generally. If we are unable to compete effectively, we will lose market share and our income from loans and other products may diminish.
Our ability to compete successfully depends on a number of factors, including, among other things:
• | the ability to develop, maintain, and build upon long-term client relationships based on top quality service and high ethical standards; |
• | the scope, relevance, and pricing of products and services, including technological innovations to those products and services, offered to meet client needs and demands; |
• | the rate at which we introduce new products and services relative to our competitors; |
• | client satisfaction with our level of service; and/or |
• | industry and general economic trends. |
Failure to perform in any of these areas could significantly weaken our competitive position, and could adversely affect our growth and profitability, which, in turn, could have a material adverse effect on our financial condition and results of operations.
We have engaged in and may continue to engage in further expansion through acquisitions, and these acquisitions present a number of risks related both to the acquisition transactions and to the integration of the acquired businesses.
The acquisition of other financial services companies or assets present risks to the Company in addition to those presented by the nature of the business acquired. Our earnings, financial condition, and prospects after a merger or acquisition depend in part on our ability to successfully integrate the operations of the acquired company. We may be unable to integrate operations successfully or to achieve expected results or cost savings.
Acquiring other banks or businesses involves various risks commonly associated with acquisitions, including, among other things:
• | potential exposure to unknown or contingent liabilities of the target company; |
• | exposure to potential asset quality issues of the target company; |
• | difficulty and expense of integrating the operations and personnel of the target company; |
• | potential disruption to our business; |
• | potential diversion of our management's time and attention; |
• | the possible loss of key employees and clients of the target company; |
• | difficulty in estimating the value of the target company; |
• | payment of a premium over book and market values that may dilute our tangible book value and earnings per share in the short- and long-term; |
• | inability to realize the expected revenue increases, cost savings, increases in geographic or product presence, and/or other projected benefits; and/or |
• | potential changes in banking or tax laws or regulations that may affect the target company. |
We periodically evaluate merger and acquisition opportunities and conduct due diligence activities related to possible transactions with other financial institutions and financial services companies. As a result, merger or acquisition discussions and, in some cases, negotiations may take place, and future mergers or acquisitions involving cash, debt or equity securities may occur at any time. In addition to the risks noted above, potential acquisitions may incur additional costs for diligence or break-up fees, even if the transaction is not consummated.
We may be unable to successfully integrate new business lines into our existing operations.
From time to time, we may implement other new lines of business or offer new products or services within existing lines of business. There can be substantial risks and uncertainties associated with these efforts, particularly in instances where the markets are not fully developed. Although we continue to expend substantial managerial, operating and financial resources as our business grows, we may be unable to successfully continue the integration of new business
16
lines, and price and profitability targets may not prove feasible. External factors such as compliance with regulations, competitive alternatives and shifting market preferences, may also impact the successful implementation of a new line of business or a new product or service. Furthermore, any new line of business and new product or service could have a significant impact on the effectiveness of our system of internal controls. Failure to successfully manage these risks in the development and implementation of new lines of business or new products or services could have a material adverse effect on our business, financial condition and results of operations.
We may not be able to maintain our historical rate of growth, which could have a material adverse effect on our ability to successfully implement our business strategy.
Successful growth requires that we follow adequate loan underwriting standards, balance loan and deposit growth without increasing interest rate risk or compressing our net interest margin, maintain adequate capital at all times, produce investment performance results competitive with our peers and benchmarks, further diversify our revenue sources, meet the expectations of our clients and hire and retain qualified employees. If we do not manage our growth successfully, then our business, results of operations or financial condition may be adversely affected.
We may not be able to attract and retain skilled people.
Our success depends, in large part, on our ability to attract and retain key people. Competition for the best people in most activities in which we are engaged can be intense, and we may not be able to hire or retain the people we want and/or need. Although we maintain employment agreements with certain key employees, and have incentive compensation plans aimed, in part, at long-term employee retention, the unexpected loss of services of one or more of our key personnel could still occur, and such events may have a material adverse impact on our business because of the loss of the employee's skills, knowledge of our market, and years of industry experience and the difficulty of promptly finding qualified replacement personnel.
Additionally, executive leadership transitions and succession planning can be inherently difficult to manage and may cause disruption to our business. Executive leadership transitions inherently cause some loss of institutional knowledge, which can negatively affect strategy and execution, and our results of operations and financial condition could suffer as a result. The loss of services of one or more members of senior management could have a material adverse effect on our business.
Loss of key employees may disrupt relationships with certain clients.
Our client relationships are critical to the success of our business, and loss of key employees with significant client relationships may lead to the loss of business if the clients follow that employee to a competitor. While we believe our relationships with our key personnel are strong, we cannot guarantee that all of our key personnel will remain with us, which could result in the loss of some of our clients and could have an adverse impact on our business, financial condition and results of operations.
We may incur impairments to goodwill.
As of December 31, 2017, we had $117.3 million recorded as goodwill. We evaluate our goodwill for impairment at least annually. Significant negative industry or economic trends, including the lack of recovery in the market price of our common stock, or reduced estimates of future cash flows or disruptions to our business, could result in impairments to goodwill. Our valuation methodology for assessing impairment requires management to make judgments and assumptions based on historical experience and to rely on projections of future operating performance. We operate in competitive environments and projections of future operating results and cash flows may vary significantly from actual results. If our analysis results in impairment to goodwill, we would be required to record an impairment charge to earnings in our financial statements during the period in which such impairment is determined to exist. Any such change could have a material adverse effect on our results of operations and stock price.
Financial deregulation measures proposed by the Trump administration and members of the U.S. Congress may create regulatory uncertainty for the financial sector and increase competition.
The Trump administration’s short-term legislative agenda may include certain deregulatory measures for the U.S. financial services industry including, but not limited to, changes to the Volcker Rule, the U.S. Risk Retention Rules, Basel III capital requirements, the FSOC’s authority, the role, responsibilities and enforcement strategies of the CFPB,
17
capital issues, and various aspects of the Dodd-Frank Act, and implementing regulations promulgated pursuant to the Dodd-Frank Act. Measures focused on deregulation of the U.S. financial services industry may have the effect of increasing competition for our credit-focused businesses or otherwise reducing investment opportunities. Increased competition from banks and other financial institutions in the credit markets could have the effect of reducing credit spreads, which may adversely affect the revenues of our credit and other businesses whose strategies including the provision of credit to borrowers. Determining the full extent of the impact on us of any such potential financial reform legislation, or whether any such particular proposal will become law, is highly speculative. However, any such changes may impose additional costs on us, require the attention of our senior management or result in limitations on the manner in which business is conducted.
The CFPB may reshape the consumer financial laws through rulemaking and enforcement of unfair, deceptive or abusive acts or practices, which may directly impact the business operations of depository institutions offering consumer financial products or services, including the Bank.
The Dodd-Frank Act represents a comprehensive overhaul of the financial services industry within the United States, establishes the new federal Consumer Financial Protection Bureau (the “CFPB”), and will require the CFPB and other federal agencies to implement many new rules.
The CFPB has broad powers to supervise and enforce consumer protection laws. The CFPB has broad rule-making authority for a wide range of consumer protection laws that apply to all banks, including the authority to prohibit unfair, deceptive or abusive acts and practices. In addition, the Dodd-Frank Act enhanced the regulation of mortgage banking and gave to the CFPB oversight of many of the core laws which regulate the mortgage industry and the authority to implement mortgage regulations. Any new regulations adopted by the CFPB may significantly impact consumer mortgage lending and servicing.
We are subject to numerous laws designed to protect consumers, including the Community Reinvestment Act and fair lending laws, and failure to comply with these laws could lead to a wide variety of sanctions.
The Community Reinvestment Act, the Equal Credit Opportunity Act, the Fair Housing Act and other fair lending laws and regulations impose nondiscriminatory lending requirements on financial institutions. The CFPB, the Department of Justice and other federal agencies are responsible for enforcing these laws and regulations. A successful regulatory challenge to an institution's performance under the Community Reinvestment Act or fair lending laws and regulations could result in a wide variety of sanctions, including damages and civil money penalties, injunctive relief, restrictions on mergers and acquisitions activity, restrictions on expansion, and restrictions on entering new business lines. Private parties may also have the ability to challenge an institution's performance under fair lending laws in private class action litigation. Such actions could have a material adverse effect on our business, financial condition, results of operations and future prospects.
We are subject to compliance with the Bank Secrecy Act and other anti-money laundering statutes and regulations, and failure to comply with these laws could lead to a wide variety of sanctions.
The Bank Secrecy Act, the USA PATRIOT Act of 2001, and other laws and regulations require financial institutions, among other duties, to institute and maintain an effective anti-money laundering program and file suspicious activity and currency transaction reports when appropriate. In addition to other bank regulatory agencies, the federal Financial Crimes Enforcement Network of the Department of the Treasury is authorized to impose significant civil money penalties for violations of those requirements and has recently engaged in coordinated enforcement efforts with the state and federal banking regulators, as well as the U.S. Department of Justice, CFPB, Drug Enforcement Administration, and Internal Revenue Service. We are also subject to increased scrutiny of compliance with the rules enforced by the Office of Foreign Assets Control of the Department of the Treasury regarding, among other things, the prohibition of transacting business with, and the need to freeze assets of, certain persons and organizations identified as a threat to the national security, foreign policy or economy of the United States. If our policies, procedures and systems are deemed deficient, we would be subject to liability, including fines and regulatory actions, which may include restrictions on our ability to pay dividends and the necessity to obtain regulatory approvals to proceed with certain aspects of our business plan, including any acquisition plans. Failure to maintain and implement adequate programs to combat money laundering and terrorist financing could also have serious reputational consequences for
18
us. Any of these results could have a material adverse effect on our business, financial condition, results of operations and future prospects.
Declines in asset values may result in impairment charges and adversely impact the value of our investments and our financial performance and capital.
We hold an investment securities portfolio that includes, but is not limited to, government securities and agency mortgage-backed securities. Factors beyond our control can significantly influence the fair value of securities in our portfolio and can cause potential adverse changes to the fair value of these securities. These factors include, but are not limited to, rating agency actions in respect to the securities, defaults by the issuer or with respect to the underlying securities, changes in market interest rates and instability in the capital markets. Any of these factors, among others, could cause other-than-temporary impairments and realized or unrealized losses in future periods and declines in other comprehensive income (loss), which could have a material adverse effect on our business, results of operations, financial condition and future prospects. The process for determining whether impairment of a security is other-than-temporary often requires complex, subjective judgments about whether there has been significant deterioration in the financial condition of the issuer, whether management has the intent or ability to hold a security for a period of time sufficient to allow for any anticipated recovery in fair value, the future financial performance and liquidity of the issuer and any collateral underlying the security and other relevant factors.
Our investment securities portfolio includes $12.9 million in capital stock of the FHLB of Des Moines as of December 31, 2017. This stock ownership is required for us to qualify for membership in the FHLB system, which enables us to borrow funds under the FHLB advance program. If the FHLB experiences a capital shortfall, it could suspend its quarterly cash dividend, and possibly require its members, including us, to make additional capital investments in the FHLB. If the FHLB were to cease operations, or if we were required to write-off our investment in the FHLB, our financial condition, and results of operations may be materially and adversely affected.
The Volcker Rule limits the permissible strategies for managing our investment portfolio.
On December 10, 2013, pursuant to the Dodd-Frank Act, federal banking and securities regulators issued final rules to implement Section 619 of the Dodd-Frank Act (the "Volcker Rule"). Generally, subject to a transition period and certain exceptions, the Volcker Rule restricts insured depository institutions and their affiliated companies from: (i) short-term proprietary trading as principal in securities and other financial instruments, and (ii) sponsoring or acquiring or retaining an ownership interest in private equity and hedge funds. After the transition period, the Volcker Rule prohibitions and restrictions will apply to banking entities, including the Company, unless an exception applies. The Volcker Rule limits or excludes us from holding certain investment securities, which we could otherwise use to diversify our assets and for asset/liability management.
We primarily invest in mortgage-backed obligations and such obligations have been, and are likely to continue to be, impacted by market dislocations, declining home values and prepayment risk, which may lead to volatility in cash flow and market risk and declines in the value of our investment portfolio.
Our investment portfolio largely consists of mortgage-backed obligations primarily secured by pools of mortgages on single-family residences. The value of mortgage-backed obligations in our investment portfolio may fluctuate for several reasons, including (i) delinquencies and defaults on the mortgages underlying such obligations, due in part to high unemployment rates, (ii) falling home prices, (iii) lack of a liquid market for such obligations, (iv) uncertainties in respect of government-sponsored enterprises such as the Federal National Mortgage Association (“Fannie Mae”) or the Federal Home Loan Mortgage Corporation (“Freddie Mac”), which guarantee such obligations, and (v) the expiration of government stimulus initiatives. Although home values had declined over the last several years, prices appear to have now leveled off. However, if the value of homes were to further materially decline, the fair value of the mortgage-backed obligations in which we invest may also decline. Any such decline in the fair value of mortgage-backed obligations, or perceived market uncertainty about their fair value, could adversely affect our financial position and results of operations. In addition, when we acquire a mortgage-backed security, we anticipate that the underlying mortgages will prepay at a projected rate, thereby generating an expected yield. Prepayment rates generally increase as interest rates fall and decrease when rates rise, but changes in prepayment rates are difficult to predict. In light of historically low interest rates, many of our mortgage-backed securities have a higher interest rate than prevailing market rates, resulting in a premium purchase price. In accordance with applicable accounting standards, we amortize the
19
premium over the expected life of the mortgage-backed security. If the mortgage loans securing the mortgage-backed security prepay more rapidly than anticipated, we would have to amortize the premium on an accelerated basis, which would thereby adversely affect our profitability.
A failure in or breach of our operational or security systems, or those of our third party service providers, including as a result of cyber attacks, could disrupt our business, result in unintentional disclosure or misuse of confidential or proprietary information, damage our reputation, increase our costs and adversely impact our earnings.
As a financial institution, our operations rely heavily on the secure processing, storage and transmission of confidential and other information on our computer systems and networks. Any failure, interruption or breach in security or operational integrity of these systems could result in failures or disruptions in our internet banking system, treasury management products, check and document imaging, remote deposit capture systems, general ledger, and other systems. The security and integrity of our systems could be threatened by a variety of interruptions or information security breaches, including those caused by computer hacking, cyber attacks, electronic fraudulent activity or attempted theft of financial assets. We cannot assure any such failures, interruption or security breaches will not occur, or if they do occur, that they will be adequately addressed. While we have certain protective policies and procedures in place, the nature and sophistication of the threats continue to evolve. We may be required to expend significant additional resources in the future to modify and enhance our protective measures. Additionally, we face the risk of operational disruption, failure, termination or capacity constraints of any of the third parties that facilitate our business activities, including exchanges, clearing agents, clearing houses or other financial intermediaries. Such parties could also be the source of an attack on, or breach of, our operational systems. Any failures, interruptions or security breaches in our information systems could damage our reputation, result in a loss of client business, result in a violation of privacy or other laws, or expose us to civil litigation, regulatory fines or losses not covered by insurance.
We rely on third-party vendors to provide key components of our business infrastructure.
We rely heavily on third-party service providers for much of our communications, information, operating and financial control systems technology, including relationship management, mobile banking, general ledger, investment, deposit, loan servicing and loan origination systems. While we have selected these third-party vendors carefully and perform ongoing monitoring, we do not control their actions. Any problems caused by these third parties, including as a result of inadequate or interrupted service, could adversely affect our ability to deliver products and services to our clients and otherwise conduct our business. Financial or operational difficulties of a third-party vendor could also hurt our operations if those difficulties interfere with the vendor’s ability to serve us, and replacing these third-party vendors could result in significant delay and expense. Accordingly, use of such third parties creates an unavoidable inherent risk to our business operations as well as reputational risk.
We are subject to environmental risks associated with owning real estate or collateral.
When a borrower defaults on a loan secured by real property, the Company may purchase the property in foreclosure or accept a deed to the property surrendered by the borrower. We may also take over the management of commercial properties whose owners have defaulted on loans. We may also own and lease premises where branches and other facilities are located. While we will have lending, foreclosure and facilities guidelines intended to exclude properties with an unreasonable risk of contamination, hazardous substances could exist on some of the properties that the Company may own, manage or occupy. We face the risk that environmental laws could force us to clean up the properties at the Company's expense. The cost of cleaning up or paying damages and penalties associated with environmental problems could increase our operating expenses. It may cost much more to clean a property than the property is worth. We could also be liable for pollution generated by a borrower's operations if the Company takes a role in managing those operations after a default. The Company may also find it difficult or impossible to sell contaminated properties.
Risks Relating to Our Common Stock
The price of our common stock may be volatile or may decline.
The trading price of our common stock may fluctuate widely as a result of a number of factors, many of which are outside our control. In addition, the stock market is subject to fluctuations in the share prices and trading volumes that affect the market prices of the shares of many companies. These broad market fluctuations could make it more difficult for you to resell your common stock when you want and at prices you find attractive.
20
Our stock price can fluctuate significantly in response to a variety of factors including, among other things:
• | actual or anticipated quarterly fluctuations in our operating results and financial condition; |
• | changes in revenue or earnings estimates or publication of research reports and recommendations by financial analysts; |
• | failure to meet analysts' revenue or earnings estimates; |
• | speculation in the press or investment community; |
• | strategic actions by us or our competitors, such as acquisitions or restructurings; |
• | actions by institutional stockholders; |
• | fluctuations in the stock prices and operating results of our competitors; |
• | general market conditions and, in particular, developments related to market conditions for the financial services industry; |
• | proposed or adopted regulatory changes or developments; |
• | anticipated or pending investigations, proceedings or litigation that involve or affect us; and/or |
• | domestic and international economic factors unrelated to our performance. |
The stock market and, in particular, the market for financial institution stocks, has historically experienced significant volatility. As a result, the market price of our common stock may be volatile. In addition, the trading volume in our common stock may fluctuate more than usual and cause significant price variations to occur. The trading price of the shares of our common stock and the value of our other securities will depend on many factors, which may change from time to time, including, without limitation, our financial condition, performance, creditworthiness and prospects, future sales of our equity or equity related securities, and other factors identified in this annual report and other reports by the Company. In some cases, the markets have produced downward pressure on stock prices and credit availability for certain issuers without regard to those issuers' underlying financial strength or operating results. A significant decline in our stock price could result in substantial losses for individual stockholders and could lead to costly and disruptive securities litigation.
The trading volume in our common stock is less than that of other larger financial institutions.
Although our common stock is listed for trading on the NASDAQ Global Select Market, its trading volume may be less than that of other, larger financial services companies. A public trading market having the desired characteristics of depth, liquidity and orderliness depends on the presence in the marketplace of willing buyers and sellers of our common stock at any given time, a factor over which we have no control. During any period of lower trading volume of our common stock, significant sales of shares of our common stock or the expectation of these sales could cause our common stock price to fall.
An investment in our common stock is not insured and you could lose the value of your entire investment.
An investment in our common stock is not a savings account, deposit or other obligation of our bank subsidiary, any non-bank subsidiary or any other bank, and such investment is not insured or guaranteed by the FDIC or any other governmental agency. As a result, if you acquire our common stock, you may lose some or all of your investment.
Our ability to pay dividends is limited by various statutes and regulations and depends primarily on the Bank's ability to distribute funds to us, and is also limited by various statutes and regulations.
The Company depends on payments from the Bank, including dividends, management fees and payments under tax sharing agreements, for substantially all of the Company's revenue. Federal and state regulations limit the amount of dividends and the amount of payments that the Bank may make to the Company under tax sharing agreements. In certain circumstances, the Missouri Division of Finance, FDIC, or Federal Reserve Board could restrict or prohibit the Bank from distributing dividends or making other payments to us. In the event that the Bank was restricted from paying dividends to the Company or making payments under the tax sharing agreement, the Company may not be able to service its debt, pay its other obligations or pay dividends on its common stock. If we are unable or determine not to pay dividends on our outstanding equity securities, the market price of such securities could be materially adversely affected.
There can be no assurance of any future dividends on our common stock.
Holders of our common stock are entitled to receive dividends only when, as and if declared by our board of directors. Although we have historically paid cash dividends on our common stock, we are not required to do so.
21
There may be future sales or other dilution of our equity, which may adversely affect the market price of our common stock.
We are not restricted from issuing additional common stock or preferred stock, including any securities that are convertible into or exchangeable for, or that represent the right to receive, common stock or preferred stock or any substantially similar securities. For example, we issued 3.3 million new shares of common stock in 2017 at the closing of the merger with JCB, which resulted in dilution to our shareholders.
In addition, to the extent awards to issue common stock under our employee equity compensation plans are exercised, or shares are issued, holders of our common stock could incur additional dilution. Further, if we sell additional equity or convertible debt securities, such sales could result in increased dilution to our stockholders. The market price of our common stock could decline as a result of sales of a large number of shares of common stock or preferred stock or similar securities in the market after an offering or the perception that such sales could occur.
Our outstanding debt securities, related to our trust preferred securities, restrict our ability to pay dividends on our capital stock.
We have outstanding subordinated debentures issued to statutory trust subsidiaries, which have issued and sold preferred securities in the Trusts to investors.
If we are unable to make payments on any of our subordinated debentures for more than 20 consecutive quarters, we would be in default under the governing agreements for such securities and the amounts due under such agreements would be immediately due and payable. Additionally, if for any interest payment period we do not pay interest in respect of the subordinated debentures (which will be used to make distributions on the trust preferred securities), or if for any interest payment period we do not pay interest in respect of the subordinated debentures, or if any other event of default occurs, then we generally will be prohibited from declaring or paying any dividends or other distributions, or redeeming, purchasing or acquiring, any of our capital securities, including the common stock, during the next succeeding interest payment period applicable to any of the subordinated debentures, or next succeeding interest payment period, as the case may be.
Moreover, any other financing agreements that we enter into in the future may limit our ability to pay cash dividends on our capital stock, including the common stock. In the event that our existing or future financing agreements restrict our ability to pay dividends in cash on the common stock, we may be unable to pay dividends in cash on the common stock unless we can refinance amounts outstanding under those agreements. In addition, if we are unable or determine not to pay interest on our subordinated debentures, the market price of our common stock could be materially or adversely affected.
Anti-takeover provisions could negatively impact our stockholders.
Provisions of Delaware law and of our certificate of incorporation, as amended, and bylaws, as well as various provisions of federal and Missouri state law applicable to bank and bank holding companies, could make it more difficult for a third party to acquire control of us or have the effect of discouraging a third party from attempting to acquire control of us. We are subject to Section 203 of the Delaware General Corporation Law, which would make it more difficult for another party to acquire us without the approval of our board of directors. Additionally, our certificate of incorporation, as amended, authorizes our board of directors to issue preferred stock which could be issued as a defensive measure in response to a takeover proposal. In the event of a proposed merger, tender offer or other attempt to gain control of the Company, our board of directors would have the ability to readily issue available shares of preferred stock as a method of discouraging, delaying or preventing a change in control of the Company. Such issuance could occur regardless of whether our stockholders favorably view the merger, tender offer or other attempt to gain control of the Company. These and other provisions could make it more difficult for a third party to acquire us even if an acquisition might be in the best interests of our stockholders. Although we have no present intention to issue any shares of our authorized preferred stock, there can be no assurance that the Company will not do so in the future.
22
ITEM 1B: UNRESOLVED STAFF COMMENTS
Not applicable.
ITEM 2: PROPERTIES
Our executive offices are located at 150 North Meramec, Clayton, Missouri, 63105. As of December 31, 2017, we had 19 banking locations, and five limited service facilities in the St. Louis metropolitan area, seven banking locations in the Kansas City metropolitan area, and two banking locations in the Phoenix metropolitan area. We own 16 of the facilities and lease the remainder. Most of the leases expire between 2018 and 2024 and include one or more renewal options of up to five years. One lease expires in 2029. All the leases are classified as operating leases. We believe all of our properties are in good condition.
ITEM 3: LEGAL PROCEEDINGS
The Company and its subsidiaries are, from time to time, parties to various legal proceedings arising out of their businesses. Management believes that there are no such proceedings pending or threatened against the Company or its subsidiaries which, if determined adversely, would have a material adverse effect on the business, consolidated financial condition, results of operations or cash flows of the Company or any of its subsidiaries.
ITEM 4: MINE SAFETY DISCLOSURES
Not applicable.
23
PART II
ITEM 5: MARKET FOR REGISTRANT'S COMMON EQUITY, RELATED STOCKHOLDER MATTERS AND ISSUER PURCHASES OF EQUITY SECURITIES
Common Stock Market Prices
The Company's common stock trades on the NASDAQ Global Select Market under the symbol “EFSC.” Below are the dividends declared by quarter along with the closing, high, and low sales prices for the common stock for the periods indicated, as reported by the NASDAQ Global Select Market. There may have been other transactions at prices not known to the Company. As of February 21, 2018, the Company had 422 common stock shareholders of record and a market price of $47.90 per share. The number of holders of record does not represent the actual number of beneficial owners of our common stock because securities dealers and others frequently hold shares in “street name” for the benefit of individual owners who have the right to vote shares.
2017 | 2016 | ||||||||||||||||||||||||||||||
4th Qtr | 3rd Qtr | 2nd Qtr | 1st Qtr | 4th Qtr | 3rd Qtr | 2nd Qtr | 1st Qtr | ||||||||||||||||||||||||
Closing Price | $ | 45.15 | $ | 42.35 | $ | 40.80 | $ | 42.40 | $ | 43.00 | $ | 31.25 | $ | 27.89 | $ | 27.04 | |||||||||||||||
High | 46.25 | 42.70 | 45.35 | 46.25 | 43.65 | 31.96 | 29.06 | 29.36 | |||||||||||||||||||||||
Low | 41.45 | 36.65 | 39.10 | 38.20 | 30.93 | 26.37 | 25.04 | 25.01 | |||||||||||||||||||||||
Cash dividends paid on common shares | 0.11 | 0.11 | 0.11 | 0.11 | 0.11 | 0.11 | 0.10 | 0.09 | |||||||||||||||||||||||
Dividends
The holders of shares of our common stock are entitled to receive dividends when declared by our Board of Directors out of funds legally available for the purpose of paying dividends. Our ability to pay dividends is substantially dependent upon the ability of our subsidiaries to pay cash dividends to us. Information on regulatory restrictions on our ability to pay dividends is set forth in Part I, Item 1 - Business - Supervision and Regulation - Financial Holding Company - Dividend Restrictions. The amount of dividends, if any, that may be declared by the Company also depends on many other factors, including future earnings, bank regulatory capital requirements and business conditions as they affect the Company and its subsidiaries. As a result, no assurance can be given that dividends will be paid in the future with respect to our common stock.
Issuer Purchases of Equity Securities
The following table provides information on repurchases by the Company of its common stock in each month of the quarter ended December 31, 2017.
Period | Total number of shares purchased (a) | Weighted-average price paid per share | Total number of shares purchased as part of publicly announced plans or programs | Maximum number of shares that may yet be purchased under the plans or programs (b) | |||||||||
October 1, 2017 through October 31, 2017 | — | $ | — | — | 1,384,327 | ||||||||
November 1, 2017 through November 30, 2017 | — | — | — | 1,384,327 | |||||||||
December 1, 2017 through December 31, 2017 | 128 | 44.50 | — | 1,384,327 | |||||||||
Total | 128 | $ | 44.50 | — | |||||||||
(a) Includes shares of the Company’s common stock withheld to satisfy tax withholding obligations upon the vesting of awards of restricted stock. These shares were purchased pursuant to the terms of the applicable plan and not pursuant to a publicly announced repurchase plan or program.
(b) In May 2015, the Company’s board of directors authorized the repurchase of up to two million shares of the Company’s common stock. The repurchases may be made in open market or privately negotiated transactions and the repurchase program will remain in effect until fully utilized or until modified, superseded or terminated. The timing and exact amount of common stock repurchases will depend on a number of factors including, among others, market and general economic conditions, economic capital and regulatory capital considerations, alternative uses of capital, the potential impact on our credit ratings, and contractual and regulatory limitations.
24
Performance Graph
The following Stock Performance Graph and related information should not be deemed “soliciting material” or to be “filed” with the SEC nor shall such performance be incorporated by reference into any future filings under the Securities Act of 1933 or Securities Exchange Act of 1934, each as amended, except to the extent that the Company specifically incorporates it by reference into such filing.
The following graph* compares the cumulative total shareholder return on the Company's common stock from December 31, 2012 through December 31, 2017. The graph compares the Company's common stock with the NASDAQ Composite, and the SNL $1B-$5B Bank Index, as well as the SNL $5B-$10B Bank Index as the Company's total assets exceeded $5 billion in 2017. The graph assumes an investment of $100.00 in the Company's common stock and each index on December 31, 2012 and reinvestment of all quarterly dividends. The investment is measured as of each subsequent fiscal year end. There is no assurance that the Company's common stock performance will continue in the future with the same or similar results as shown in the graph.
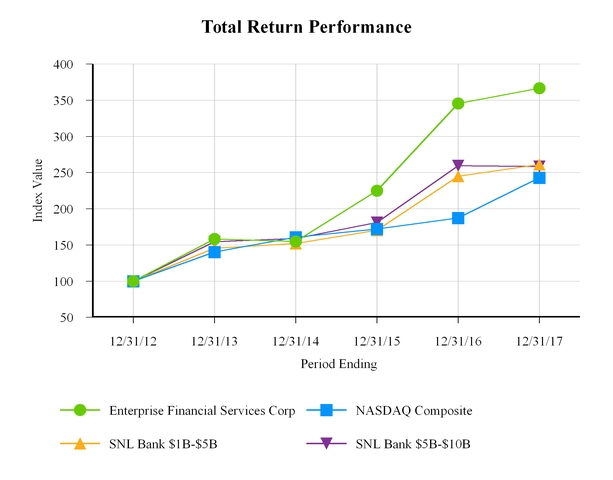
Period Ending December 31, | ||||||||||||
Index | 2012 | 2013 | 2014 | 2015 | 2016 | 2017 | ||||||
Enterprise Financial Services Corp | 100.00 | 158.27 | 154.67 | 224.72 | 345.34 | 366.42 | ||||||
NASDAQ Composite | 100.00 | 140.12 | 160.78 | 171.97 | 187.22 | 242.71 | ||||||
SNL Bank $1B-$5B | 100.00 | 145.41 | 152.04 | 170.20 | 244.85 | 261.04 | ||||||
SNL Bank $5B-$10B | 100.00 | 154.28 | 158.92 | 181.04 | 259.37 | 258.40 | ||||||
*Source: S&P Global Market Intelligence. Used with permission. All rights reserved.
25
ITEM 6: SELECTED FINANCIAL DATA
The following consolidated selected financial data is derived from the Company's audited financial statements as of and for the five years ended December 31, 2017. This information should be read in connection with our audited consolidated financial statements, related notes and “Management's Discussion and Analysis of Financial Condition and Results of Operations” appearing elsewhere in this report.
Years ended December 31, | |||||||||||||||||||
($ in thousands, except per share data) | 2017 | 2016 | 2015 | 2014 | 2013 | ||||||||||||||
EARNINGS SUMMARY: | |||||||||||||||||||
Interest income | $ | 202,539 | $ | 149,224 | $ | 132,779 | $ | 131,754 | $ | 153,289 | |||||||||
Interest expense | 25,235 | 13,729 | 12,369 | 14,386 | 18,137 | ||||||||||||||
Net interest income | 177,304 | 135,495 | 120,410 | 117,368 | 135,152 | ||||||||||||||
Provision (provision reversal) for portfolio loan losses | 10,764 | 5,551 | 4,872 | 4,409 | (642 | ) | |||||||||||||
Provision (provision reversal) for purchased credit impaired loan losses | (634 | ) | (1,946 | ) | (4,414 | ) | 1,083 | 4,974 | |||||||||||
Noninterest income | 34,394 | 29,059 | 20,675 | 16,631 | 9,899 | ||||||||||||||
Noninterest expense | 115,051 | 86,110 | 82,226 | 87,463 | 90,639 | ||||||||||||||
Income before income tax expense | 86,517 | 74,839 | 58,401 | 41,044 | 50,080 | ||||||||||||||
Income tax expense1 | 38,327 | 26,002 | 19,951 | 13,871 | 16,976 | ||||||||||||||
Net income1 | $ | 48,190 | $ | 48,837 | $ | 38,450 | $ | 27,173 | $ | 33,104 | |||||||||
PER SHARE DATA: | |||||||||||||||||||
Basic earnings per common share1 | $ | 2.10 | $ | 2.44 | $ | 1.92 | $ | 1.38 | $ | 1.78 | |||||||||
Diluted earnings per common share1 | 2.07 | 2.41 | 1.89 | 1.35 | 1.73 | ||||||||||||||
Cash dividends paid on common shares | 0.44 | 0.41 | 0.26 | 0.21 | 0.21 | ||||||||||||||
Book value per common share | 23.76 | 19.31 | 17.53 | 15.94 | 14.47 | ||||||||||||||
Tangible book value per common share | 18.20 | 17.69 | 15.86 | 14.20 | 12.62 | ||||||||||||||
BALANCE SHEET DATA: | |||||||||||||||||||
Ending balances: | |||||||||||||||||||
Portfolio loans | $ | 4,066,659 | $ | 3,118,392 | $ | 2,750,737 | $ | 2,433,916 | $ | 2,137,313 | |||||||||
Allowance for portfolio loan losses | 38,166 | 37,565 | 33,441 | 30,185 | 27,289 | ||||||||||||||
Non-core acquired loans, net of allowance for loan losses | 25,980 | 33,925 | 64,583 | 83,693 | 125,100 | ||||||||||||||
Goodwill | 117,345 | 30,334 | 30,334 | 30,334 | 30,334 | ||||||||||||||
Other intangible assets, net | 11,056 | 2,151 | 3,075 | 4,164 | 5,418 | ||||||||||||||
Total assets | 5,289,225 | 4,081,328 | 3,608,483 | 3,277,003 | 3,170,197 | ||||||||||||||
Deposits | 4,156,414 | 3,233,361 | 2,784,591 | 2,491,510 | 2,534,953 | ||||||||||||||
Subordinated debentures and notes | 118,105 | 105,540 | 56,807 | 56,807 | 62,581 | ||||||||||||||
FHLB advances | 172,743 | — | 110,000 | 144,000 | 50,000 | ||||||||||||||
Other borrowings | 253,674 | 276,980 | 270,326 | 239,883 | 214,331 | ||||||||||||||
Shareholders' equity | 548,573 | 387,098 | 350,829 | 316,241 | 279,705 | ||||||||||||||
Tangible common equity | 420,172 | 354,613 | 317,420 | 281,743 | 243,953 | ||||||||||||||
Average balances: | |||||||||||||||||||
Portfolio loans | $ | 3,810,055 | $ | 2,915,744 | $ | 2,520,734 | $ | 2,255,180 | $ | 2,097,920 | |||||||||
Non-core acquired loans | 35,761 | 55,992 | 87,940 | 119,504 | 168,662 | ||||||||||||||
Earning assets | 4,611,670 | 3,570,186 | 3,163,339 | 2,921,978 | 2,875,765 | ||||||||||||||
Total assets | 4,980,229 | 3,796,478 | 3,381,831 | 3,156,994 | 3,126,537 | ||||||||||||||
Interest-bearing liabilities | 3,396,382 | 2,634,700 | 2,344,861 | 2,209,188 | 2,237,111 | ||||||||||||||
Shareholders' equity | 532,306 | 371,587 | 335,095 | 301,756 | 259,106 | ||||||||||||||
Tangible common equity | 414,458 | 338,662 | 301,165 | 266,655 | 222,186 | ||||||||||||||
1Includes $12.1 million ($0.52 per share) deferred tax asset revaluation charge for 2017 due to U.S. corporate income tax reform. | |||||||||||||||||||
26
Years ended December 31, | ||||||||||||||
2017 | 2016 | 2015 | 2014 | 2013 | ||||||||||
SELECTED RATIOS: | ||||||||||||||
Return on average common equity | 9.05 | % | 13.14 | % | 11.47 | % | 9.01 | % | 12.78 | % | ||||
Return on average tangible common equity | 11.63 | 14.42 | 12.77 | 10.19 | 14.90 | |||||||||
Return on average assets | 0.97 | 1.29 | 1.14 | 0.86 | 1.06 | |||||||||
Efficiency ratio | 54.35 | 52.33 | 58.28 | 65.27 | 62.49 | |||||||||
Total loan yield (1) | 4.84 | 4.66 | 4.72 | 5.14 | 6.36 | |||||||||
Cost of interest-bearing liabilities | 0.74 | 0.52 | 0.53 | 0.65 | 0.81 | |||||||||
Net interest spread (1) | 3.69 | 3.71 | 3.72 | 3.91 | 4.60 | |||||||||
Net interest margin (1) | 3.88 | 3.84 | 3.86 | 4.07 | 4.78 | |||||||||
Nonperforming loans to total loans (2) | 0.39 | 0.48 | 0.33 | 0.91 | 0.98 | |||||||||
Nonperforming assets to total assets (2) (3) | 0.31 | 0.39 | 0.48 | 0.74 | 0.90 | |||||||||
Net charge-offs to average loans (2) | 0.27 | 0.05 | 0.06 | 0.07 | 0.31 | |||||||||
Allowance for loan losses to total loans (2) | 0.95 | 1.20 | 1.22 | 1.24 | 1.28 | |||||||||
Dividend payout ratio - basic | 21.27 | 16.81 | 13.68 | 15.37 | 11.92 | |||||||||
(1) Fully tax equivalent. | ||||||||||||||
(2) Amounts and ratios exclude purchased credit impaired ("PCI") loans and related assets, except for their inclusion in total assets. | ||||||||||||||
(3) Other real estate from PCI loans included in nonperforming assets beginning with the year ended December 31, 2015 due to termination of all existing FDIC loss share agreements. | ||||||||||||||
27
ITEM 7: MANAGEMENT’S DISCUSSION AND ANALYSIS OF FINANCIAL CONDITION AND
RESULTS OF OPERATIONS
Introduction
The objective of this section is to provide an overview of the results of operations and financial condition of the Company for the three years ended December 31, 2017. It should be read in conjunction with the Consolidated Financial Statements, Notes and other financial data presented elsewhere in this report, particularly the information regarding the Company's business operations described in Item 1.
Executive Summary
The Company closed its acquisition of Jefferson County Bancshares, Inc. ("JCB") on February 10, 2017. The results of operations of JCB are included in our consolidated results since this date. See Item 8, Note 2 - Acquisitions for more information.
The following table indicates a summary of the acquired assets and liabilities at fair value:
(in thousands) | |||
Assets acquired: | |||
Cash and cash equivalents | $ | 33,739 | |
Interest-bearing deposits | 1,715 | ||
Securities | 148,670 | ||
Portfolio loans, net | 674,811 | ||
Other real estate owned | 1,680 | ||
Other investments | 2,695 | ||
Fixed assets, net | 18,455 | ||
Accrued interest receivable | 2,794 | ||
Other intangible assets | 11,514 | ||
Deferred tax assets | 8,625 | ||
Other assets | 18,811 | ||
Total assets acquired | $ | 923,509 | |
Liabilities assumed: | |||
Deposits | $ | 765,168 | |
Other borrowings | 56,111 | ||
Trust preferred securities | 12,505 | ||
Accrued interest payable | 653 | ||
Other liabilities | 5,071 | ||
Total liabilities assumed | $ | 839,508 | |
Net assets acquired | $ | 84,001 | |
Consideration paid: | |||
Cash | $ | 29,283 | |
Common stock | 141,729 | ||
Total consideration paid | $ | 171,012 | |
Goodwill | $ | 87,011 | |
28
Below are highlights of our financial performance for the year ended December 31, 2017 as compared to the years ended December 31, 2016 and 2015.
($ in thousands, except per share data) | For the Years ended December 31, | ||||||||||
2017 | 2016 | 2015 | |||||||||
EARNINGS | |||||||||||
Total interest income | $ | 202,539 | $ | 149,224 | $ | 132,779 | |||||
Total interest expense | 25,235 | 13,729 | 12,369 | ||||||||
Net interest income | 177,304 | 135,495 | 120,410 | ||||||||
Provision for portfolio loans | 10,764 | 5,551 | 4,872 | ||||||||
Provision reversal for purchased credit impaired loans | (634 | ) | (1,946 | ) | (4,414 | ) | |||||
Net interest income after provision for loan losses | 167,174 | 131,890 | 119,952 | ||||||||
Total noninterest income | 34,394 | 29,059 | 20,675 | ||||||||
Total noninterest expense | 115,051 | 86,110 | 82,226 | ||||||||
Income before income tax expense | 86,517 | 74,839 | 58,401 | ||||||||
Income tax expense | 38,327 | 26,002 | 19,951 | ||||||||
Net income | $ | 48,190 | $ | 48,837 | $ | 38,450 | |||||
Basic earnings per share | $ | 2.10 | $ | 2.44 | $ | 1.92 | |||||
Diluted earnings per share | 2.07 | 2.41 | 1.89 | ||||||||
Return on average assets | 0.97 | % | 1.29 | % | 1.14 | % | |||||
Return on average common equity | 9.05 | % | 13.14 | % | 11.47 | % | |||||
Return on average tangible common equity | 11.63 | % | 14.42 | % | 12.77 | % | |||||
Net interest margin (fully tax equivalent) | 3.88 | % | 3.84 | % | 3.86 | % | |||||
Efficiency ratio | 54.35 | % | 52.33 | % | 58.28 | % | |||||
ASSET QUALITY (1) | |||||||||||
Net charge-offs | $ | 10,163 | $ | 1,427 | $ | 1,616 | |||||
Nonperforming loans | 15,687 | 14,905 | 9,100 | ||||||||
Classified assets | 73,239 | 93,452 | 67,761 | ||||||||
Nonperforming loans to total loans | 0.39 | % | 0.48 | % | 0.33 | % | |||||
Nonperforming assets to total assets (2) | 0.31 | % | 0.39 | % | 0.48 | % | |||||
Allowance for loan losses to total loans | 0.95 | % | 1.19 | % | 1.18 | % | |||||
Net charge-offs to average loans | 0.27 | % | 0.05 | % | 0.06 | % | |||||
(1) Excludes PCI loans and related assets, except for their inclusion in total assets. | |||||||||||
(2) Other real estate from PCI acquired loans included in nonperforming assets beginning with the year ended December 31, 2015 due to termination of all existing FDIC loss share agreements. | |||||||||||
Below are highlights of the Company's core performance measures, which we believe are important measures of financial performance, but are "non-GAAP financial measures." Generally, a non-GAAP financial measure is a measure of a company's financial performance, financial position, or cash flows that exclude (or include) amounts that are included in (or excluded from) the most directly comparable measure calculated and presented in accordance with generally accepted accounting principles in the U.S. ("GAAP"). The Company's core performance measures include contractual interest on non-core acquired loans, but exclude incremental accretion on these loans, and exclude the change in the FDIC loss share receivable, gain or loss on the sale of other real estate from non-core acquired loans, and expenses directly related to non-core acquired loans and other assets formerly covered under FDIC loss share agreements. Core performance measures also exclude certain other income and expense items, such as executive separation costs, merger related expenses, facilities charges, deferred tax asset revaluation associated with U.S. corporate income tax reform, and the gain or loss on sale of investment securities, which the Company believes are not indicative of or useful to measure the Company's operating performance on an ongoing basis. A reconciliation of
29
core performance measures has been included in this MD&A section under the caption "Use of Non-GAAP Financial Measures."
For the Years ended December 31, | |||||||||||
($ in thousands) | 2017 | 2016 | 2015 | ||||||||
CORE PERFORMANCE MEASURES (NON-GAAP) (1) | |||||||||||
Net interest income | $ | 169,586 | $ | 123,515 | $ | 107,618 | |||||
Provision for portfolio loan losses | 10,764 | 5,551 | 4,872 | ||||||||
Noninterest income | 34,378 | 26,787 | 25,575 | ||||||||
Noninterest expense | 107,960 | 82,217 | 77,472 | ||||||||
Income before income tax expense | 85,240 | 62,534 | 50,849 | ||||||||
Income tax expense | 25,328 | 21,297 | 17,058 | ||||||||
Net income | $ | 59,912 | $ | 41,237 | $ | 33,791 | |||||
Diluted earnings per share | $ | 2.58 | $ | 2.03 | $ | 1.66 | |||||
Return on average assets | 1.20 | % | 1.09 | % | 1.00 | % | |||||
Return on average common equity | 11.26 | % | 11.10 | % | 10.08 | % | |||||
Return on average tangible common equity | 14.46 | % | 12.18 | % | 11.22 | % | |||||
Net interest margin (fully tax equivalent) | 3.72 | % | 3.51 | % | 3.46 | % | |||||
Efficiency ratio | 52.93 | % | 54.70 | % | 58.17 | % | |||||
(1) A non-GAAP measure. A reconciliation has been included in this MD&A section under the caption "Use of Non-GAAP Financial Measures." | |||||||||||
The Company noted the following trends during 2017:
• | The Company reported net income of $48.2 million, or $2.07 per diluted share for 2017, compared to $48.8 million, or $2.41 per diluted share for 2016. Net income year over year increased from earnings of the acquisition of Jefferson County Bancshares, Inc. ("JCB") and organic growth coupled with net interest margin expansion. However, reported earnings declined from the prior year due to the deferred tax asset ("DTA") revaluation charge of $12.1 million, within income tax expense, due to U.S. corporate income tax reform. |
• | On a core basis1, net income was $59.9 million, or $2.58 per diluted share in 2017, compared to $41.2 million, or $2.03 per diluted share in 2016. Core earnings per share1 and net income1 for the year 2017 exclude negative impacts from the DTA revaluation associated with the U.S. corporate income tax reform of $0.52 per share ($12.1 million), and merger-related expenses of $0.18 (or $4.5 million after tax). These calculations also exclude income from non-core acquired loans of $0.20 per share ($5.4 million after tax). |
• | Net interest income for 2017 totaled $177.3 million, an increase of $41.8 million, or 31%, compared to $135.5 million for 2016. Core net interest income1 growth of $46.1 million, or 37%, was due to approximately 11 months of net interest income from the acquisition of JCB, organic growth in portfolio loan balances funded principally by core deposits1, and a 21 basis point expansion of core net interest margin1. Additionally, non-core acquired assets1 contributed $7.7 million to net interest income during 2017, but continued declining balances in this portfolio led to a $4.3 million decline from 2016 levels. This trend mitigated the impact of the expansion in core net interest margin1. |
• | Net interest margin increased four basis points to 3.88% during 2017, compared to 3.84% in 2016, largely due to core net interest margin1 expansion constricted by a reduction in incremental accretion on non-core acquired loans due to declining balances in this portfolio. Core net interest margin1, defined as net interest margin (fully tax equivalent), including contractual interest on non-core acquired loans, but excluding the incremental accretion on these loans, increased twenty-one basis points to 3.72% in 2017, from 3.51% in the prior year. The increase was largely due to the impact of interest rate increases on the Company's asset sensitive balance |
30
sheet. Specifically, the yield on portfolio loans increased 41 basis points to 4.63% from 4.22% due to the effect of increasing interest rates on the existing variable-rate loan portfolio and higher rates on newly originated loans. The increased cost of total deposits was limited to eight basis points and was 0.44% for 2017. The cost of total interest-bearing liabilities increased 22 basis points to 0.74%, which included the impact of the issuance of $50 million of 4.75% subordinated notes in November 2016.
• | Noninterest income increased $5.3 million, or 18%, to $34.4 million in 2017 compared to $29.1 million in 2016. This improvement was primarily due to higher income from deposit service charges, card services income, and wealth management revenue from the acquisition of JCB, and a growth in the client base. For 2017: |
◦ | Deposit service charges increased $2.4 million, or 28% |
◦ | Income from card services increased $2.3 million, or 74% |
◦ | Wealth management revenue increased $1.4 million, or 20% |
◦ | Other income increased $1.1 million, or 18% |
This income growth was partially offset by lower gains on the sale of other real estate, which declined $1.7 million from 2016.
• | Noninterest expenses totaled $115.1 million for 2017, an increase of $28.9 million, or 34%, compared to 2016. Excluding non-comparable items, such as merger related expenses ($6.5 million), core noninterest expense1 totaled $108.0 million, an increase of $25.7 million, or 31% from the prior year. The year-over-year increase primarily represents the additional operating and run-rate expenses associated with the JCB acquisition, as well as continued investments in underlying business growth. The Company's core efficiency ratio1 was 52.93% for 2017, compared to 54.70% for the prior year. The improvement reflects continuing efforts to leverage the Company's expense base through revenue growth and completion of the initiatives necessary to realize the expected cost savings from the JCB acquisition. |
• | As a result of changes to the U.S. corporate tax rate, a revaluation of the Company's DTA was completed in the fourth quarter, resulting in a $12.1 million charge to 2017 earnings. The effect of the charge on key performance measures is demonstrated in the table below: |
Full Year 2017 Effect | |
Diluted Earnings Per Share | $(0.52) |
Effective Income Tax Rate | 14.00% |
Return on Average Assets | (0.24)% |
Return on Average Common Tangible Equity | (2.92)% |
The resulting effective tax rate for the year was 44.3%. The revaluation expense is considered a non-core item and is not included in the Company's core numbers. The Company's core effective tax rate1 was 29.7% for the year ended December 31, 2017 compared to 34.1% for the prior year. The improvement in the core effective tax rate1 resulted primarily from the benefit of tax credit investments and other income tax planning initiatives. These decreases were partially offset by increased pre-tax earnings, which lessen the rate impact of permanent tax differences.
1Non-GAAP measures. A reconciliation has been included in this MD&A section under the caption "Use of Non-GAAP Financial Measures."
2017 Significant Transactions
During 2017, we completed the following significant transactions:
• | On February 10, 2017, the Company announced the completion of its acquisition of JCB which was merged with and into the Company, and Eagle Bank and Trust Company of Missouri, JCB's wholly-owned subsidiary, merged with and into the Bank. As part of the acquisition, 3.3 million shares of the Company’s |
31
common stock were issued and approximately $29.3 million in cash was paid to JCB shareholders and holders of JCB stock options. The overall transaction had a value of approximately $171.0 million, including JCB’s common stock and stock options.
• | The Company repurchased 429,955 of its common shares at a weighted-average share price of $38.69, pursuant to its publicly announced program. |
2016 Significant Transactions
During 2016, we completed the following significant transactions:
• | On October 10, 2016, the Company entered into a definitive merger agreement to acquire JCB headquartered in Jefferson County, Missouri. JCB is the parent holding company of Eagle Bank and Trust Company of Missouri. The transaction closed on February 10, 2017. |
• | On November 1, 2016, the Company issued $50 million aggregate principal amount of 4.75% fixed-to-floating rate subordinated notes with a maturity date of November 1, 2026. The subordinated notes will initially bear an annual interest rate of 4.75%, with interest payable semiannually. Beginning November 1, 2021, the interest rate resets quarterly to the three-month LIBOR plus a spread of 338.7 basis points, payable quarterly. The Company used a portion of the proceeds from the issuance to pay the cash consideration at the closing of the acquisition of JCB. Regulatory guidance allows for this subordinated debt to be treated as tier 2 regulatory capital for the first five years of its term, subject to certain limitations, and then phased out of tier 2 capital pro rata over the next five years. |
• | The Company repurchased 185,718 of its common shares at a weighted-average share price of $26.32 pursuant to its publicly announced program during the year ended December 31, 2016. The Company's Board authorized the repurchase plan in May of 2015, which allows the Company to repurchase up to two million common shares, representing approximately 10% of the Company’s then currently outstanding shares. Shares may be bought back in open market or privately negotiated transactions over an indeterminate time period based on market and business conditions. |
• | The Company's Board approved three consecutive increases in the Company's quarterly cash dividend to $0.11 per common share for the fourth quarter of 2016, up from $0.09 for the first quarter of 2016, expanding cash dividends paid for the year by 56%. |
2015 Significant Transactions
During 2015, we completed the following significant transactions:
• | The Company's Board approved three consecutive increases in the Company's quarterly cash dividend to $0.08 per common share for the fourth quarter of 2015, up from $0.0525 for the first quarter of 2015. |
• | The Company received a $65 million allocation of New Markets Tax Credits ("NMTC"), which is the fourth allocation of NMTC received since 2011, for a total of $183 million. |
• | On December 7, 2015, the Company successfully completed early termination of all existing loss share agreements with the FDIC, resulting in a pretax charge of $2.4 million, or $0.07 per diluted share. The Company's income has been positively impacted by no longer amortizing the FDIC loss share receivable or providing for further increases to the clawback liability, as well as recovering amounts greater than the carrying value of the formerly covered assets. The charge from the termination was entirely earned back in the first quarter of 2016. |
Balance sheet highlights
• | Loans - Loans totaled $4.1 billion at December 31, 2017, including $30.4 million of non-core acquired loans. Portfolio loans increased $948 million, or 30%, from December 31, 2016. Of this increase, $270 million, or 9%, |
32
was organic loan growth and $678 million was from the acquisition of JCB. See Item 8, Note 5 – Portfolio Loans for more information.
• | Deposits – Total deposits at December 31, 2017 were $4.2 billion, an increase of $923 million, or 29%, from December 31, 2016. The acquisition of JCB contributed $774 million of this increase. Core deposits, defined as total deposits excluding time deposits, were $3.6 billion at December 31, 2017, an increase of $817.4 million, or 29.6% largely due to the JCB acquisition ($636 million) and the continued progress across our regions and business lines. |
• | Asset quality – Nonperforming assets were $16.2 million at December 31, 2017, an increase of 2% compared to $15.9 million at December 31, 2016. Nonperforming assets represented 0.31% of total assets at December 31, 2017, compared to 0.39% of total assets at December 31, 2016. |
Provision for portfolio loan losses was $10.8 million in 2017, compared to $5.6 million in 2016. The Company experienced higher levels of charge-offs in 2017 in contrast to 2016, in addition to a reduction of recoveries in 2017 compared to 2016. See Item 8, Note 5 – Portfolio Loans, and Provision and Allowance for Loan Losses in this section for more information.
33
RESULTS OF OPERATIONS
Net Interest Income
Average Balance Sheet
Non-core acquired loans were those acquired from the FDIC and were previously covered by shared-loss agreements. These loans continue to be accounted for as purchased credit impaired loans. Approximately $44 million of loans acquired from JCB's portfolio are also accounted for as purchased credit impaired loans. However, all loans acquired from JCB are included in portfolio loans. The following table presents, for the periods indicated, certain information related to our average interest-earning assets and interest-bearing liabilities, as well as, the corresponding interest rates earned and paid, all on a tax equivalent basis.
For the Years ended December 31, | ||||||||||||||||||||||||||||||||
2017 | 2016 | 2015 | ||||||||||||||||||||||||||||||
($ in thousands) | Average Balance | Interest Income/Expense | Average Yield/ Rate | Average Balance | Interest Income/Expense | Average Yield/ Rate | Average Balance | Interest Income/Expense | Average Yield/ Rate | |||||||||||||||||||||||
Assets | ||||||||||||||||||||||||||||||||
Interest-earning assets: | ||||||||||||||||||||||||||||||||
Taxable portfolio loans (1) | $ | 3,774,484 | $ | 173,824 | 4.61 | % | $ | 2,881,071 | $ | 120,803 | 4.19 | % | $ | 2,486,369 | $ | 102,562 | 4.12 | % | ||||||||||||||
Tax-exempt portfolio loans (2) | 40,634 | 2,652 | 6.53 | 41,471 | 2,512 | 6.06 | 39,347 | 2,570 | 6.53 | |||||||||||||||||||||||
Non-core acquired loans - contractual | 35,761 | 2,273 | 6.36 | 55,992 | 3,403 | 6.08 | 87,940 | 5,426 | 6.17 | |||||||||||||||||||||||
Non-core acquired loans - incremental | 7,718 | 21.58 | 11,980 | 21.39 | 12,792 | 14.55 | ||||||||||||||||||||||||||
Total loans | 3,850,879 | 186,467 | 4.84 | 2,978,534 | 138,698 | 4.66 | 2,613,656 | 123,350 | 4.72 | |||||||||||||||||||||||
Taxable investments in debt and equity securities | 634,195 | 15,000 | 2.37 | 476,341 | 9,816 | 2.06 | 436,023 | 8,983 | 2.06 | |||||||||||||||||||||||
Non-taxable investments in debt and equity securities (2) | 47,219 | 2,078 | 4.40 | 48,157 | 2,106 | 4.37 | 44,738 | 1,966 | 4.39 | |||||||||||||||||||||||
Short-term investments | 79,377 | 804 | 1.01 | 67,154 | 370 | 0.55 | 68,922 | 211 | 0.31 | |||||||||||||||||||||||
Total securities and short-term investments | 760,791 | 17,882 | 2.35 | 591,652 | 12,292 | 2.08 | 549,683 | 11,160 | 2.03 | |||||||||||||||||||||||
Total interest-earning assets | 4,611,670 | 204,349 | 4.43 | 3,570,186 | 150,990 | 4.23 | 3,163,339 | 134,510 | 4.25 | |||||||||||||||||||||||
Noninterest-earning assets: | ||||||||||||||||||||||||||||||||
Cash and due from banks | 79,189 | 57,237 | 50,017 | |||||||||||||||||||||||||||||
Other assets | 333,185 | 213,698 | 212,710 | |||||||||||||||||||||||||||||
Allowance for loan losses | (43,815 | ) | (44,643 | ) | (44,235 | ) | ||||||||||||||||||||||||||
Total assets | $ | 4,980,229 | $ | 3,796,478 | $ | 3,381,831 | ||||||||||||||||||||||||||
Liabilities and Shareholders' Equity | ||||||||||||||||||||||||||||||||
Interest-bearing liabilities: | ||||||||||||||||||||||||||||||||
Interest-bearing transaction accounts | $ | 802,993 | $ | 2,195 | 0.27 | % | $ | 606,899 | $ | 1,370 | 0.23 | % | $ | 512,272 | $ | 1,149 | 0.22 | % | ||||||||||||||
Money market accounts | 1,286,796 | 8,708 | 0.68 | 1,075,055 | 4,439 | 0.41 | 949,814 | 2,993 | 0.32 | |||||||||||||||||||||||
Savings | 189,516 | 459 | 0.24 | 105,115 | 262 | 0.25 | 88,399 | 219 | 0.25 | |||||||||||||||||||||||
Certificates of deposit | 586,115 | 5,838 | 1.00 | 466,326 | 4,770 | 1.02 | 496,449 | 6,051 | 1.22 | |||||||||||||||||||||||
Total interest-bearing deposits | 2,865,420 | 17,200 | 0.60 | 2,253,395 | 10,841 | 0.48 | 2,046,934 | 10,412 | 0.51 | |||||||||||||||||||||||
Subordinated debentures and notes | 116,707 | 5,095 | 4.37 | 64,948 | 1,894 | 2.91 | 56,807 | 1,248 | 2.21 | |||||||||||||||||||||||
FHLB advances | 192,489 | 2,356 | 1.22 | 109,713 | 555 | 0.51 | 41,283 | 128 | 0.31 | |||||||||||||||||||||||
Other borrowed funds | 221,766 | 584 | 0.26 | 206,644 | 439 | 0.21 | 199,837 | 581 | 0.29 | |||||||||||||||||||||||
Total interest-bearing liabilities | 3,396,382 | 25,235 | 0.74 | 2,634,700 | 13,729 | 0.52 | 2,344,861 | 12,369 | 0.53 | |||||||||||||||||||||||
Noninterest bearing liabilities: | ||||||||||||||||||||||||||||||||
Demand deposits | 1,017,660 | 761,086 | 673,704 | |||||||||||||||||||||||||||||
Other liabilities | 33,881 | 29,105 | 28,171 | |||||||||||||||||||||||||||||
Total liabilities | 4,447,923 | 3,424,891 | 3,046,736 | |||||||||||||||||||||||||||||
Shareholders' equity | 532,306 | 371,587 | 335,095 | |||||||||||||||||||||||||||||
Total liabilities & shareholders' equity | $ | 4,980,229 | $ | 3,796,478 | $ | 3,381,831 | ||||||||||||||||||||||||||
Net interest income | $ | 179,114 | $ | 137,261 | $ | 122,141 | ||||||||||||||||||||||||||
Net interest spread | 3.69 | % | 3.71 | % | 3.72 | % | ||||||||||||||||||||||||||
Net interest margin (tax equivalent) | 3.88 | % | 3.84 | % | 3.86 | % | ||||||||||||||||||||||||||
Core net interest margin (3) | 3.72 | % | 3.51 | % | 3.46 | % | ||||||||||||||||||||||||||
(1) | Average balances include non-accrual loans. Loan fees, net of amortization of deferred loan origination fees and costs, included in interest income are approximately $3.4 million, $2.2 million, and $2.3 million for the years ended December 31, 2017, 2016, and 2015 respectively. |
34
(2) | Non-taxable income is presented on a fully tax-equivalent basis using a 38% tax rate. The tax-equivalent adjustments were $1.8 million for the years ended December 31, 2017 and 2016 respectively, and $1.7 million for the year ended December 31, 2015. |
(3) | A non-GAAP measure. A reconciliation has been included in this MD&A section under the caption "Use of Non-GAAP Financial Measures." |
Rate/Volume
The following table sets forth, on a tax-equivalent basis for the periods indicated, a summary of the changes in interest income and interest expense resulting from changes in yield/rates and volume.
2017 compared to 2016 | 2016 compared to 2015 | ||||||||||||||||||||||
Increase (decrease) due to | Increase (decrease) due to | ||||||||||||||||||||||
($ in thousands) | Volume1 | Rate2 | Net | Volume1 | Rate2 | Net | |||||||||||||||||
Interest earned on: | |||||||||||||||||||||||
Taxable portfolio loans | $ | 40,257 | $ | 12,764 | $ | 53,021 | $ | 16,524 | $ | 1,717 | $ | 18,241 | |||||||||||
Tax-exempt portfolio loans3 | (52 | ) | 192 | 140 | 135 | (193 | ) | (58 | ) | ||||||||||||||
Non-core acquired loans | (5,648 | ) | 256 | (5,392 | ) | (7,756 | ) | 4,921 | (2,835 | ) | |||||||||||||
Taxable investments in debt and equity securities | 3,586 | 1,598 | 5,184 | 831 | 2 | 833 | |||||||||||||||||
Non-taxable investments in debt and equity securities3 | (41 | ) | 13 | (28 | ) | 150 | (10 | ) | 140 | ||||||||||||||
Short-term investments | 77 | 357 | 434 | (5 | ) | 164 | 159 | ||||||||||||||||
Total interest-earning assets | 38,179 | 15,180 | 53,359 | 9,879 | 6,601 | 16,480 | |||||||||||||||||
Interest paid on: | |||||||||||||||||||||||
Interest-bearing transaction accounts | $ | 499 | $ | 326 | $ | 825 | $ | 214 | $ | 7 | $ | 221 | |||||||||||
Money market accounts | 1,006 | 3,263 | 4,269 | 431 | 1,015 | 1,446 | |||||||||||||||||
Savings | 204 | (7 | ) | 197 | 42 | 1 | 43 | ||||||||||||||||
Certificates of deposit | 1,196 | (128 | ) | 1,068 | (351 | ) | (930 | ) | (1,281 | ) | |||||||||||||
Subordinated debentures and notes | 1,976 | 1,225 | 3,201 | 199 | 447 | 646 | |||||||||||||||||
FHLB advances | 625 | 1,176 | 1,801 | 309 | 118 | 427 | |||||||||||||||||
Other borrowed funds | 34 | 111 | 145 | 19 | (161 | ) | (142 | ) | |||||||||||||||
Total interest-bearing liabilities | 5,540 | 5,966 | 11,506 | 863 | 497 | 1,360 | |||||||||||||||||
Net interest income | $ | 32,639 | $ | 9,214 | $ | 41,853 | $ | 9,016 | $ | 6,104 | $ | 15,120 | |||||||||||
1Change in volume multiplied by yield/rate of prior period. | |||||||||||||||||||||||
2Change in yield/rate multiplied by volume of prior period. | |||||||||||||||||||||||
3Nontaxable income is presented on a fully tax equivalent basis using a 38% tax rate. | |||||||||||||||||||||||
NOTE: The change in interest due to both rate and volume has been allocated to rate and volume changes in proportion to the relationship of the absolute dollar amounts of the change in each. | |||||||||||||||||||||||
Comparison of 2017 and 2016
Net interest income (on a tax equivalent basis) was $179.1 million for 2017, compared to $137.3 million for 2016, an increase of $41.9 million, or 30%. Total interest income increased $53.4 million and total interest expense increased $11.5 million. The tax-equivalent net interest margin was 3.88% for 2017, compared to 3.84% for the prior year period. The increase in net interest income was primarily due to the impact of rising interest rates which increased yields on variable rate loans and to an improved earning asset mix combined with the acquisition of JCB, partially offset by a decline in contributions from non-core acquired assets and higher rates on interest bearing liabilities.
Average interest-earning assets increased $1 billion, or 29%, to $4.6 billion for the year ended December 31, 2017. Average total loans increased $872 million, or 29%, to $3.9 billion for the year ended December 31, 2017, from $3.0 billion for the year ended December 31, 2016, largely due to the JCB acquisition along with organic loan growth. Average securities and short-term investments increased $169 million, or 29%, to $760.8 million for 2017 compared
35
to $591.7 million for 2016. Interest income on earning assets increased $38.2 million due to an increase in volume, which includes an offsetting $5.6 million decrease from the decline in non-core acquired loans as the balances continue to run off. Excluding non-core acquired loans, total interest income increased $43.8 million due to volume, primarily from portfolio loans. Interest income on earnings assets increased $15.2 million due to rising interest rates.
For the year ended December 31, 2017, average interest-bearing liabilities increased $762 million, or 29%, to $3.4 billion, compared to $2.6 billion for the year ended December 31, 2016. The increase in average interest-bearing liabilities resulted from a $612 million increase in average interest-bearing deposits, a $52 million increase in average subordinated debentures and notes, an $83 million increase in FHLB advances, and a $15 million increase in average other borrowed funds. Average interest-bearing deposits increased from the JCB acquisition, and our continued progress across our regions and business lines. The issuance of $50 million of subordinated notes on November 1, 2016 increased the average balance of subordinated debentures and notes for 2017 compared to 2016. Average other borrowed funds increased due to higher balances in customer repurchase agreements. For the year ended December 31, 2017, interest expense on interest-bearing liabilities increased $6.0 million due to higher rates from market conditions, and $5.5 million due to higher volumes, compared to the same period in 2016.
The Company continues to manage its balance sheet to grow core net income1 and expects to maintain core net interest margin1 over the coming quarters; however, pressure on funding costs could negate the expected trends in core net interest margin1.
Comparison of 2016 and 2015
Net interest income (on a tax equivalent basis) was $137.3 million for 2016, compared to $122.1 million for 2015, an increase of $15.1 million, or 12%. Total interest income increased $16.5 million and total interest expense increased $1.4 million.
Average interest-earning assets increased $406.8 million, or 13%, to $3.6 billion for the year ended December 31, 2016. Average loans increased $364.9 million, or 14%, to $3.0 billion for the year ended December 31, 2016, from $2.6 billion for the year ended December 31, 2015, largely due to strong portfolio growth in 2016, including growth in all major categories excluding non-core acquired loans. Average securities and short-term investments increased $42.0 million, to $591.7 million from 2015. Interest income on earning assets increased $9.9 million due to an increase in volume, which excludes an offsetting $7.8 million decrease from the decline in non-core acquired loans as the balances continue to run off. Excluding non-core acquired loans, total interest income increased $17.6 million due to volume, primarily from portfolio loans. Interest income on earnings assets increased $6.6 million due to changes in interest rates, largely from non-core acquired loans.
For the year ended December 31, 2016, average interest-bearing liabilities increased $289.8 million, or 12%, to $2.6 billion, compared to $2.3 billion for the year ended December 31, 2015. The increase in average interest-bearing liabilities resulted from a $142.0 million increase in average money market accounts and savings accounts, and a $94.6 million increase in interest-bearing transaction accounts. The significant increase in money market and saving accounts was due to the Company's enhanced focus on deposit gathering in both commercial and business banking. For the year ended December 31, 2016, interest expense on interest-bearing liabilities increased $0.6 million due to higher rates from market conditions, and $0.8 million due to higher volumes, including increased borrowings from the FHLB and the subordinated notes issuance, versus the same period in 2015.
1Non-GAAP measures. A reconciliation has been included in this MD&A section under the caption "Use of Non-GAAP Financial Measures."
36
Non-Core Acquired Assets Contribution
The following table illustrates the financial contribution of non-core acquired loans and other assets for the most recent three fiscal years:
For the Years ended December 31, | |||||||||||
($ in thousands) | 2017 | 2016 | 2015 | ||||||||
Accelerated cash flows and other incremental accretion | $ | 7,718 | $ | 11,980 | $ | 12,792 | |||||
Provision reversal for loan losses | 634 | 1,946 | 4,414 | ||||||||
Gain (loss) on sale of other real estate | (6 | ) | 1,565 | 107 | |||||||
Other income from other real estate | — | 621 | — | ||||||||
FDIC loss share termination1 | — | — | (2,436 | ) | |||||||
Change in FDIC loss share receivable | — | — | (5,030 | ) | |||||||
Change in FDIC clawback liability | — | — | (760 | ) | |||||||
Other expenses | (240 | ) | (1,094 | ) | (1,558 | ) | |||||
Non-core acquired assets income before income tax expense | $ | 8,106 | $ | 15,018 | $ | 7,529 | |||||
1On December 7, 2015, the Company entered into an agreement with the FDIC to terminate all existing loss share agreements associated with the assets and assumption of liabilities acquired in four FDIC-assisted transactions from 2009 through 2011. | |||||||||||
Non-core acquired loans contributed $5.0 million, $9.3 million, and $4.6 million of net income for the years ended December 31, 2017, 2016, and 2015, respectively. At December 31, 2017, the remaining accretable yield on the portfolio was estimated to be $10 million, and the non-accretable difference was $13 million. The Company estimates 2018 income from accelerated cash flows and other incremental accretion to be between $3 million and $5 million.
37
Noninterest Income
The following table presents a comparative summary of the major components of noninterest income:
Years ended December 31, | Change from | ||||||||||||||||||
($ in thousands) | 2017 | 2016 | 2015 | 2017 vs. 2016 | 2016 vs. 2015 | ||||||||||||||
Service charges on deposit accounts | $ | 11,043 | $ | 8,615 | $ | 7,923 | $ | 2,428 | $ | 692 | |||||||||
Wealth management revenue | 8,102 | 6,729 | 7,007 | 1,373 | (278 | ) | |||||||||||||
Card services revenue | 5,433 | 3,130 | 2,496 | 2,303 | 634 | ||||||||||||||
Gain on state tax credits, net | 2,581 | 2,647 | 2,720 | (66 | ) | (73 | ) | ||||||||||||
Gain on sale of other real estate - core | 98 | 272 | 35 | (174 | ) | 237 | |||||||||||||
Miscellaneous income - core | 7,121 | 5,394 | 5,394 | 1,727 | — | ||||||||||||||
Core noninterest income (1) | 34,378 | 26,787 | 25,575 | 7,591 | 1,212 | ||||||||||||||
Gain (loss) on sale of other real estate from non-core acquired loans | (6 | ) | 1,565 | 107 | (1,571 | ) | 1,458 | ||||||||||||
Other income from non-core acquired assets | — | 621 | — | (621 | ) | 621 | |||||||||||||
Gain on sale of investment securities | 22 | 86 | 23 | (64 | ) | 63 | |||||||||||||
Change in FDIC loss share receivable | — | — | (5,030 | ) | — | 5,030 | |||||||||||||
Total noninterest income | $ | 34,394 | $ | 29,059 | $ | 20,675 | $ | 5,335 | $ | 8,384 | |||||||||
(1) A non-GAAP measure. A reconciliation has been included in this MD&A section under the caption "Use of Non-GAAP Financial Measures." | |||||||||||||||||||
Noninterest income increased $5.3 million, or 18%, in 2017 compared to 2016. Core noninterest income1 increased $7.6 million, or 28%, in 2017. This improvement was primarily due to higher income from deposit service charges, wealth management revenue, and card services from the acquisition of JCB, as well as growth in the client base. This income growth was partially offset by lower gains on the sale of other real estate, which declined $1.7 million from 2016. Noninterest income increased $8.4 million, or 41%, in 2016 compared to 2015. The increase was largely due to an increase in the gain on sale of other real estate from non-core acquired loans of $1.5 million, and a decrease in the loss from the change in FDIC loss share receivable of $5.0 million.
The Company expects continued growth in fee income of 5% - 7% for 2018.
38
Noninterest Expense
The following table presents a comparative summary of the major components of noninterest expense:
Years ended December 31, | Change from | ||||||||||||||||||
($ in thousands) | 2017 | 2016 | 2015 | 2017 vs. 2016 | 2016 vs. 2015 | ||||||||||||||
Core expenses (1): | |||||||||||||||||||
Employee compensation and benefits - core | $ | 61,388 | $ | 48,932 | $ | 45,102 | $ | 12,456 | $ | 3,830 | |||||||||
Occupancy - core | 9,057 | 6,570 | 6,474 | 2,487 | 96 | ||||||||||||||
Data processing - core | 6,272 | 4,663 | 4,229 | 1,609 | 434 | ||||||||||||||
Professional fees - core | 3,779 | 2,614 | 3,401 | 1,165 | (787 | ) | |||||||||||||
FDIC and other insurance | 3,194 | 3,018 | 2,790 | 176 | 228 | ||||||||||||||
Loan, legal, and other real estate expense - core | 1,981 | 1,239 | 1,535 | 742 | (296 | ) | |||||||||||||
Other - core | 22,289 | 15,181 | 13,941 | 7,108 | 1,240 | ||||||||||||||
Core noninterest expense (1) | 107,960 | 82,217 | 77,472 | 25,743 | 4,745 | ||||||||||||||
Merger related expenses | 6,462 | 1,386 | — | 5,076 | 1,386 | ||||||||||||||
Facilities disposal charge | 389 | 1,040 | — | (651 | ) | 1,040 | |||||||||||||
Executive severance | — | 332 | — | (332 | ) | 332 | |||||||||||||
FDIC loss share termination | — | — | 2,436 | — | (2,436 | ) | |||||||||||||
FDIC clawback | — | — | 760 | — | (760 | ) | |||||||||||||
Other expenses related to non-core acquired assets | 240 | 1,094 | 1,558 | (854 | ) | (464 | ) | ||||||||||||
Other non-core expenses | — | 41 | — | (41 | ) | 41 | |||||||||||||
Total noninterest expense | $ | 115,051 | $ | 86,110 | $ | 82,226 | $ | 28,941 | $ | 3,884 | |||||||||
(1) A non-GAAP measure. A reconciliation has been included in this MD&A section under the caption "Use of Non-GAAP Financial Measures." | |||||||||||||||||||
Noninterest expenses increased $28.9 million, or 34%, in 2017 compared to the prior period. Excluding non-comparable items, core noninterest expenses1 increased $25.7 million, or 31%. This increase primarily represents the additional operating and run-rate expenses associated with JCB, as well as continued investments in underlying business growth. Other core noninterest expense includes $1.4 million of tax credit investment amortization. These investments have a corresponding and higher benefit in the Company's income tax expense line and were consistent with the Company's overall tax planning efforts. Noninterest expenses increased $3.9 million, or 5%, in 2016 compared to 2015, partially due to $1.4 million of merger related expenses for the JCB acquisition and $1.0 million for a facilities disposal charge from lease buyouts of two unused facilities.
The Company expects to continue to invest in revenue producing associates and other infrastructure that supports additional growth during 2018. These investments are expected to result in expense growth, at a rate of 35% - 45% of projected revenue growth for 2018, resulting in modest improvement to the Company's efficiency ratio.
Income Taxes
On December 22, 2017, the U.S. government enacted comprehensive tax legislation commonly referred to as the Tax Cuts and Jobs Act (the "Tax Act"). The Tax Act made broad and complex changes to the U.S. tax code, including, but not limited to, (1) reducing the U.S. federal corporate tax rate from 35% to 21%; (2) requiring companies to pay a one-time transition tax on certain unrepatriated earnings of foreign subsidiaries; (3) generally eliminating U.S. federal income taxes on dividends from foreign subsidiaries; (4) requiring a current inclusion in U.S. federal taxable income of certain earnings of controlled foreign corporations; (5) eliminating the corporate alternative minimum tax (AMT) and changing how existing AMT credits can be realized; (6) creating the base erosion anti-abuse tax (BEAT), a new
39
minimum tax; (7) creating a new limitation on deductible interest expense; and (8) changing rules related to uses and limitations of net operating loss carryforwards created in tax years beginning after December 31, 2017.
In connection with our initial analysis of the impact of the Tax Act, we have recorded a net tax expense of $12.1 million in the period ending December 31, 2017. This net expense represents a revaluation of the Company's DTA for the corporate tax rate reduction.
In 2017, the Company recorded income tax expense of $38.3 million on pre-tax income of $86.5 million, resulting in an effective tax rate of 44.3%. The Company's effective tax rate was significantly higher than 2016 due to the DTA revaluation charge of $12.1 million to income tax expense and increased pre-tax earnings. These increases reduced the savings impact of permanent items. The following items impacted the 2017 effective tax rate:
• | tax credit investments made in the year yielded $1.6 million of federal tax credits, and |
• | change in accounting standards resulted in $2.1 million of excess tax benefits on stock awards. |
As a result of the new 21% corporate federal income tax rate, the Company expects its effective tax rate in 2018 to be approximately 17% - 19% with a 2% -3% lower rate in the first quarter expected due to the effect of vesting of employee stock awards.
In 2016, the Company recorded income tax expense of $26.0 million on pre-tax income of $74.8 million, resulting in an effective tax rate of 34.7%. The Company's effective tax rate was slightly higher than 2015 as pre-tax income was significantly higher, reducing the savings impact of permanent items. The following items impacted the 2016 effective tax rate:
• | interest income on tax exempt mortgages and municipal bonds of $1.0 million, and |
• | decrease in the tax rate used for deferred tax assets of $0.3 million. |
In 2015, the Company recorded income tax expense of $20.0 million on pre-tax income of $58.4 million, resulting in an effective tax rate of 34.2%. The following items impacted the 2015 effective tax rate:
• | interest income on tax exempt mortgages and municipal bonds of $1.0 million, and |
• | release of reserves for uncertain tax positions due to remeasurement of $0.4 million. |
FINANCIAL CONDITION
Summary Balance Sheet
($ in thousands) | December 31, | % Increase (Decrease) | |||||||||||||||
2017 | 2016 | 2015 | 2017 vs. 2016 | 2016 vs. 2015 | |||||||||||||
Total cash and cash equivalents | $ | 153,323 | $ | 198,802 | $ | 94,157 | (22.88 | )% | 111.14 | % | |||||||
Securities | 715,131 | 541,260 | 495,484 | 32.12 | % | 9.24 | % | ||||||||||
Portfolio loans | 4,066,659 | 3,118,392 | 2,750,737 | 30.41 | % | 13.37 | % | ||||||||||
Non-core acquired loans | 30,391 | 39,769 | 74,758 | (23.58 | )% | (46.80 | )% | ||||||||||
Total assets | 5,289,225 | 4,081,328 | 3,608,483 | 29.60 | % | 13.10 | % | ||||||||||
Deposits | 4,156,414 | 3,233,361 | 2,784,591 | 28.55 | % | 16.12 | % | ||||||||||
Total liabilities | 4,740,652 | 3,694,230 | 3,257,654 | 28.33 | % | 13.40 | % | ||||||||||
Total shareholders' equity | 548,573 | 387,098 | 350,829 | 41.71 | % | 10.34 | % | ||||||||||
Assets
Loans by Type
The Company has a diversified loan portfolio, with no particular concentration of credit in any one economic sector; however, a substantial portion of the portfolio, including the C&I category, is secured by real estate. The ability of the Company's borrowers to honor their contractual obligations is partially dependent upon the local economy and its effect on the real estate market.
40
The following table sets forth the composition of the Company's loan portfolio by type of loans at the dates indicated:
December 31, | |||||||||||||||||||
($ in thousands) | 2017 | 2016 | 2015 | 2014 | 2013 | ||||||||||||||
Commercial and industrial | $ | 1,919,145 | $ | 1,632,714 | $ | 1,484,327 | $ | 1,264,487 | $ | 1,041,576 | |||||||||
Commercial real estate - investor owned | 769,275 | 544,808 | 428,064 | 396,751 | 437,688 | ||||||||||||||
Commercial real estate - owner occupied | 554,589 | 350,148 | 342,959 | 344,003 | 341,631 | ||||||||||||||
Construction and land development | 345,209 | 194,542 | 161,061 | 143,878 | 117,032 | ||||||||||||||
Residential real estate | 342,518 | 240,760 | 196,498 | 185,252 | 158,527 | ||||||||||||||
Consumer and other | 135,923 | 155,420 | 137,828 | 99,545 | 40,859 | ||||||||||||||
Portfolio loans | $ | 4,066,659 | $ | 3,118,392 | $ | 2,750,737 | $ | 2,433,916 | $ | 2,137,313 | |||||||||
Non-core acquired loans | 30,391 | 39,769 | 74,758 | 99,103 | 140,538 | ||||||||||||||
Total loans | $ | 4,097,050 | $ | 3,158,161 | $ | 2,825,495 | $ | 2,533,019 | $ | 2,277,851 | |||||||||
December 31, | |||||||||||||||||||
2017 | 2016 | 2015 | 2014 | 2013 | |||||||||||||||
Commercial and industrial | 47.2 | % | 52.4 | % | 54.0 | % | 52.0 | % | 48.7 | % | |||||||||
Commercial real estate - investor owned | 18.9 | % | 17.5 | % | 15.5 | % | 16.3 | % | 20.5 | % | |||||||||
Commercial real estate - owner occupied | 13.6 | % | 11.2 | % | 12.5 | % | 14.1 | % | 16.0 | % | |||||||||
Construction and land development | 8.5 | % | 6.2 | % | 5.9 | % | 5.9 | % | 5.5 | % | |||||||||
Residential real estate | 8.4 | % | 7.7 | % | 7.1 | % | 7.6 | % | 7.4 | % | |||||||||
Consumer and other | 3.4 | % | 5.0 | % | 5.0 | % | 4.1 | % | 1.9 | % | |||||||||
Portfolio loans | 100.0 | % | 100.0 | % | 100.0 | % | 100.0 | % | 100.0 | % | |||||||||
C&I loans are made based on the borrower's ability to generate cash flows for repayment from income sources, general credit strength, experience, and character, even though such loans may also be secured by real estate or other assets. The credit risk related to commercial loans is largely influenced by general economic conditions and the resulting impact on a borrower's operations.
Real estate loans are also based on the borrower's character, but more emphasis is placed on the estimated cash flows from the operation of the property, or the underlying collateral values, or both.
At December 31, 2017, $332.4 million, or 24%, of the commercial real estate loans were owner-occupied by commercial and industrial businesses where the primary source of repayment is dependent on sources other than the underlying collateral. Multifamily and other commercial properties on which income from the property is the primary source of repayment represent the balance of this category and are located within our St. Louis, Kansas City, and Phoenix markets. These loans are underwritten based on the cash flow coverage of the property, the Company's loan to value guidelines, and generally require either the limited or full guaranty of principal sponsors of the credit.
Real estate construction loans, relating to residential and commercial properties, represent financing secured by real estate under development for eventual sale or undeveloped ground. $74.5 million of these loans include the use of interest reserves and follow standard underwriting guidelines. Construction projects are monitored by the loan officer and a centralized independent loan disbursement function is employed.
Residential real estate loans include residential mortgages, which are loans that, due to size or other attributes, do not qualify for conventional home mortgages available for sale in the secondary market, second mortgages and home equity lines. Residential mortgage loans are usually limited to a maximum of 80% of collateral value.
41
Consumer and other loans represent loans to individuals, loans to state and political subdivisions, loans to nondepository financial institutions, and loans to purchase or are fully secured by investment securities. Credit risk is managed by thoroughly reviewing the creditworthiness of the borrowers prior to origination and thereafter.
The following table illustrates loan growth, including selected specialized lending detail, at December 31, 2017 and 2016:
December 31, | ||||||||||||||
($ in thousands) | 2017 | 2016 | Change | % Change | ||||||||||
Enterprise value lending | $ | 407,644 | $ | 388,798 | $ | 18,846 | 4.8 | % | ||||||
C&I - general | 911,790 | 794,451 | 117,339 | 14.8 | % | |||||||||
Life insurance premium financing | 364,876 | 305,779 | 59,097 | 19.3 | % | |||||||||
Tax credits | 234,835 | 143,686 | 91,149 | 63.4 | % | |||||||||
CRE, construction and land development | 1,669,073 | 1,089,498 | 579,575 | 53.2 | % | |||||||||
Residential real estate | 342,518 | 240,760 | 101,758 | 42.3 | % | |||||||||
Consumer and other | 135,923 | 155,420 | (19,497 | ) | (12.5 | )% | ||||||||
Portfolio loans | $ | 4,066,659 | $ | 3,118,392 | $ | 948,267 | 30.4 | % | ||||||
The Company continues to focus on originating high-quality C&I relationships as they typically have variable interest rates and allow for cross selling opportunities involving other banking products. For the period ending December 31, 2017, C&I loans increased $286 million, or 18% from 2016. C&I loan growth also supports our efforts to maintain the Company's asset sensitive interest rate risk position. Additionally, our specialized products, especially Enterprise value lending, Life insurance premium financing, and Tax credit financing/lending, consist of primarily C&I loans, and have contributed significantly to the Company's loan growth. These loans are sourced through relationships developed with wealth and estate planning firms and private equity funds, and are not bound geographically by our three markets with branch facilities. As a result, these specialized loan products offer opportunities to expand and diversify our overall geographic concentration by entering into new markets.
The Enterprise value lending portfolio comprised 21% of the C&I category as of December 31, 2017. This portfolio primarily consists of loans in the manufacturing sector. As of December 31, 2017, the average outstanding balance of individual loans in this category was $4.3 million. The largest relationships within this category were a $15.6 million relationship in the administrative and support services sector and a $14.0 million relationship in the trucking industry.
2018 portfolio loan growth is expected to be approximately 7% - 9%.
42
Following is a further breakdown of our loan categories at December 31, 2017 and 2016:
% of portfolio | |||||||||||||||||
2017 | 2016 | ||||||||||||||||
Portfolio Loans | Non-core Acquired Loans | Total Loans | Portfolio Loans | Non-core Acquired Loans | Total Loans | ||||||||||||
Non Real estate | |||||||||||||||||
Commercial and industrial | 47 | % | 9 | % | 47 | % | 52 | % | 9 | % | 52 | % | |||||
Consumer and other | 3 | % | — | % | 3 | % | 5 | % | — | % | 5 | % | |||||
Total Non Real estate | 50 | % | 9 | % | 50 | % | 57 | % | 9 | % | 57 | % | |||||
Real estate: | |||||||||||||||||
Commercial - investor owned | |||||||||||||||||
Retail | 6 | % | 10 | % | 6 | % | 4 | % | 8 | % | 4 | % | |||||
Commercial office | 6 | % | 7 | % | 6 | % | 6 | % | 11 | % | 6 | % | |||||
Multi-family housing | 2 | % | — | % | 2 | % | 2 | % | 1 | % | 2 | % | |||||
Industrial/ Warehouse | 3 | % | — | % | 3 | % | 3 | % | — | % | 3 | % | |||||
Other | 3 | % | — | % | 3 | % | 3 | % | — | % | 3 | % | |||||
Total | 20 | % | 17 | % | 20 | % | 18 | % | 20 | % | 18 | % | |||||
Commercial - owner occupied | |||||||||||||||||
Commercial and industrial | 8 | % | 30 | % | 8 | % | 9 | % | 29 | % | 9 | % | |||||
Other | 6 | % | 1 | % | 6 | % | 2 | % | 1 | % | 2 | % | |||||
Total | 14 | % | 31 | % | 14 | % | 11 | % | 30 | % | 11 | % | |||||
Construction and land development | 8 | % | 11 | % | 8 | % | 6 | % | 11 | % | 6 | % | |||||
Residential | |||||||||||||||||
Investor owned | 6 | % | 27 | % | 6 | % | 1 | % | 5 | % | 1 | % | |||||
Owner occupied | 2 | % | 5 | % | 2 | % | 7 | % | 25 | % | 7 | % | |||||
Total | 8 | % | 32 | % | 8 | % | 8 | % | 30 | % | 8 | % | |||||
Total Real estate | 50 | % | 91 | % | 50 | % | 43 | % | 91 | % | 43 | % | |||||
Total | 100 | % | 100 | % | 100 | % | 100 | % | 100 | % | 100 | % | |||||
The following descriptions focus on portfolio loans at December 31, 2017, and exclude non-core acquired loans.
The commercial and industrial category represents $1.9 billion, or 47%, of portfolio loans. This category includes $615.6 million in loans secured by accounts receivable, inventory and equipment, $407.6 million from the Enterprise value lending portfolio, and $364.9 million in Life insurance premium financing. These loans consist of over 1100 relationships with an average outstanding balance of $1.8 million. The largest loans within this category are a $22.7 million term loan secured by accounts receivable and inventory and a $19.5 million term loan secured by life insurance premium financing within the St. Louis region.
The largest loans within the investor owned commercial real estate portfolio are retail and commercial office permanent loans. The Company had $246.9 million of investor owned permanent loans secured by retail properties. There were 121 loan relationships in this category with an average outstanding loan balance of $2.0 million. The largest loans outstanding at year end were a $13.3 million loan secured by a multi-tenant retail center in Phoenix, an $11.9 million loan secured by commercial land in the St. Louis area, and an $11.0 million loan secured by a hotel in Pennsylvania.
43
The Company had $234.7 million of investor owned permanent loans secured by commercial office properties. There were 94 loan relationships with an average outstanding loan balance of $2.5 million. The largest loans outstanding at year end were a $20.2 million loan secured by a multi-tenant office building in the St. Louis area, a $17.4 million loan secured by a multi-tenant office condominium complex in Phoenix, and a $13.8 million loan secured by a multi-tenant office building in the Kansas City region.
The largest loans within the owner occupied commercial real estate portfolio are commercial and industrial loans. The Company had $318.2 million of owner occupied loans secured by commercial and industrial properties. There were 345 loan relationships in this category with an average outstanding loan balance of $0.9 million. The largest loans outstanding at year end were a $9.8 million loan secured by an industrial building in Texas, a $8.8 million loan secured by an office building in Kansas, and an $7.3 million loan secured multi-tenant office building in Arizona.
Significant loan concentrations are considered to exist for a financial institution when there are amounts loaned to numerous borrowers engaged in similar activities that would cause them to be similarly impacted by economic or other conditions. At December 31, 2017, no significant concentrations exceeding 10% of total loans existed in the Company's loan portfolio, except as described above.
44
Loans at December 31, 2017 mature or reprice as follows:
Loans Maturing or Repricing | ||||||||||||||||||
($ in thousands) | In One Year or Less | After One Through Five Years | After Five Years | Total | Percent of Total Loans | |||||||||||||
Fixed rate loans (1) (2) (3) | ||||||||||||||||||
Commercial and industrial | $ | 138,249 | $ | 269,487 | $ | 28,326 | $ | 436,062 | 11 | % | ||||||||
Real estate: | ||||||||||||||||||
Commercial | 164,010 | 719,158 | 86,202 | 969,370 | 24 | % | ||||||||||||
Construction and land development | 47,594 | 106,431 | 15,598 | 169,623 | 4 | % | ||||||||||||
Residential | 48,474 | 143,491 | 33,566 | 225,531 | 5 | % | ||||||||||||
Consumer and other | 12,969 | 30,202 | 22,450 | 65,621 | 2 | % | ||||||||||||
Non-core acquired loans | 8,859 | 8,013 | 1,027 | 17,899 | — | % | ||||||||||||
Total | $ | 420,155 | $ | 1,276,782 | $ | 187,169 | $ | 1,884,106 | 46 | % | ||||||||
Variable rate loans (1) (2) | ||||||||||||||||||
Commercial and industrial | $ | 1,431,681 | $ | 38,085 | $ | 13,317 | $ | 1,483,083 | 36 | % | ||||||||
Real estate: | ||||||||||||||||||
Commercial | 315,668 | 71,488 | 7,079 | 394,235 | 10 | % | ||||||||||||
Construction and land development | 124,150 | 11,695 | — | 135,845 | 3 | % | ||||||||||||
Residential | 91,691 | 23,057 | 2,239 | 116,987 | 3 | % | ||||||||||||
Consumer and other | 48,810 | 21,492 | — | 70,302 | 2 | % | ||||||||||||
Non-core acquired loans | 11,495 | 997 | — | 12,492 | — | % | ||||||||||||
Total | $ | 2,023,495 | $ | 166,814 | $ | 22,635 | $ | 2,212,944 | 54 | % | ||||||||
Loans (1) (2) | ||||||||||||||||||
Commercial and industrial | $ | 1,569,930 | $ | 307,572 | $ | 41,643 | $ | 1,919,145 | 47 | % | ||||||||
Real estate: | ||||||||||||||||||
Commercial | 479,678 | 790,646 | 93,281 | 1,363,605 | 33 | % | ||||||||||||
Construction and land development | 171,744 | 118,126 | 15,598 | 305,468 | 8 | % | ||||||||||||
Residential | 140,165 | 166,548 | 35,805 | 342,518 | 8 | % | ||||||||||||
Consumer and other | 61,779 | 51,694 | 22,450 | 135,923 | 3 | % | ||||||||||||
Non-core acquired loans | 20,354 | 9,010 | 1,027 | 30,391 | 1 | % | ||||||||||||
Total | $ | 2,443,650 | $ | 1,443,596 | $ | 209,804 | $ | 4,097,050 | 100 | % | ||||||||
(1) Loan balances are net of unearned loan fees. | ||||||||||||||||||
(2) Not adjusted for impact of interest rate swap agreements. | ||||||||||||||||||
(3) Fixed rate loans include variable rate loans with a rate floor that are currently accruing interest at the floor. | ||||||||||||||||||
Fixed rate loans comprise 46% of the loan portfolio at December 31, 2017, and 54% of the Company's loans are variable rate loans, most of which are based on the prime rate or the LIBOR. The prime rate increased three times throughout 2017. In December 2017, the Federal Reserve raised the targeted Fed Funds rate 25 basis points from 1.25% to 1.50% resulting in a prime rate of 4.50% compared to 3.75% in December 2016. Most loan originations have one to three year maturities. Management monitors this mix as part of its interest rate risk management. See "Interest Rate Risk" of this MD&A section.
Of the $479.7 million of commercial real estate loans maturing in one year or less, $288.9 million, or 60%, represent loans secured by non-owner occupied commercial properties.
45
Provision and Allowance for Loan Losses
The following table summarizes changes in the allowance for loan losses arising from loans charged off and recoveries on loans previously charged off, by loan category, and additions to the allowance charged to expense.
At December 31, | |||||||||||||||||||
($ in thousands) | 2017 | 2016 | 2015 | 2014 | 2013 | ||||||||||||||
Allowance for portfolio loans, at beginning of period | $ | 37,565 | $ | 33,441 | $ | 30,185 | $ | 27,289 | $ | 34,330 | |||||||||
Loans charged off: | |||||||||||||||||||
Commercial and industrial | (9,872 | ) | (2,303 | ) | (3,699 | ) | (3,738 | ) | (3,404 | ) | |||||||||
Real estate: | |||||||||||||||||||
Commercial | (207 | ) | (95 | ) | (702 | ) | (700 | ) | (4,991 | ) | |||||||||
Construction and land development | (254 | ) | — | (350 | ) | (905 | ) | (896 | ) | ||||||||||
Residential | (973 | ) | (25 | ) | (1,313 | ) | (48 | ) | (1,053 | ) | |||||||||
Consumer and other | (201 | ) | (1,912 | ) | (27 | ) | (165 | ) | (34 | ) | |||||||||
Total loans charged off | (11,507 | ) | (4,335 | ) | (6,091 | ) | (5,556 | ) | (10,378 | ) | |||||||||
Recoveries of loans previously charged off: | |||||||||||||||||||
Commercial and industrial | 545 | 674 | 1,796 | 1,768 | 1,776 | ||||||||||||||
Real estate: | |||||||||||||||||||
Commercial | 235 | 1,165 | 1,567 | 1,101 | 776 | ||||||||||||||
Construction and land development | 101 | 934 | 674 | 806 | 488 | ||||||||||||||
Residential | 390 | 123 | 337 | 334 | 939 | ||||||||||||||
Consumer and other | 73 | 12 | 101 | 34 | — | ||||||||||||||
Total recoveries of loans | 1,344 | 2,908 | 4,475 | 4,043 | 3,979 | ||||||||||||||
Net loan charge-offs | (10,163 | ) | (1,427 | ) | (1,616 | ) | (1,513 | ) | (6,399 | ) | |||||||||
Provision (provision reversal) for loan losses | 10,764 | 5,551 | 4,872 | 4,409 | (642 | ) | |||||||||||||
Allowance for portfolio loans, at end of period | $ | 38,166 | $ | 37,565 | $ | 33,441 | $ | 30,185 | $ | 27,289 | |||||||||
Allowance for PCI loans, at beginning of period | $ | 5,844 | $ | 10,175 | $ | 15,410 | $ | 15,438 | $ | 11,547 | |||||||||
Loans charged off | (248 | ) | (1,296 | ) | (25 | ) | (341 | ) | (522 | ) | |||||||||
Recoveries of loans | — | — | — | — | 114 | ||||||||||||||
Other | (551 | ) | (1,089 | ) | (796 | ) | (770 | ) | (675 | ) | |||||||||
Net loan charge-offs | (799 | ) | (2,385 | ) | (821 | ) | (1,111 | ) | (1,083 | ) | |||||||||
Provision (provision reversal) for loan losses | (634 | ) | (1,946 | ) | (4,414 | ) | 1,083 | 4,974 | |||||||||||
Allowance for PCI loans, at end of period | $ | 4,411 | $ | 5,844 | $ | 10,175 | $ | 15,410 | $ | 15,438 | |||||||||
Total allowance, at end of period | $ | 42,577 | $ | 43,409 | $ | 43,616 | $ | 45,595 | $ | 42,727 | |||||||||
Portfolio loans, average | $ | 3,810,055 | $ | 2,915,744 | $ | 2,520,734 | $ | 2,255,180 | $ | 2,097,920 | |||||||||
Portfolio loans, ending (1) | 4,022,896 | 3,118,392 | 2,750,737 | 2,433,916 | 2,137,313 | ||||||||||||||
Net charge-offs to average portfolio loans (1) | 0.27 | % | 0.05 | % | 0.06 | % | 0.07 | % | 0.31 | % | |||||||||
Allowance for portfolio loan losses to loans (1) | 0.95 | % | 1.20 | % | 1.22 | % | 1.24 | % | 1.28 | % | |||||||||
(1) Excludes PCI loans | |||||||||||||||||||
46
The following table is a summary of the allocation of the allowance for loan losses on portfolio loans for the five years ended December 31, 2017:
December 31, | |||||||||||||||||||||||||||||
2017 | 2016 | 2015 | 2014 | 2013 | |||||||||||||||||||||||||
($ in thousands) | Allowance | Percent by Category to Portfolio Loans | Allowance | Percent by Category to Portfolio Loans | Allowance | Percent by Category to Portfolio Loans | Allowance | Percent by Category to Portfolio Loans | Allowance | Percent by Category to Portfolio Loans | |||||||||||||||||||
Commercial and industrial | $ | 26,406 | 47.2 | % | $ | 26,996 | 52.4 | % | $ | 22,056 | 54.0 | % | $ | 16,983 | 52.0 | % | $ | 12,246 | 48.7 | % | |||||||||
Real estate: | |||||||||||||||||||||||||||||
Commercial | 7,198 | 33.5 | % | 6,310 | 28.7 | % | 6,453 | 28.0 | % | 7,517 | 30.4 | % | 10,696 | 36.5 | % | ||||||||||||||
Construction and land development | 1,487 | 7.6 | % | 1,304 | 6.2 | % | 1,704 | 5.9 | % | 1,715 | 5.9 | % | 2,136 | 5.5 | % | ||||||||||||||
Residential | 2,237 | 8.4 | % | 2,023 | 7.7 | % | 1,796 | 7.1 | % | 2,830 | 7.6 | % | 2,019 | 7.4 | % | ||||||||||||||
Consumer and other | 838 | 3.3 | % | 932 | 5.0 | % | 1,432 | 5.0 | % | 1,140 | 4.1 | % | 192 | 1.9 | % | ||||||||||||||
Total allowance | $ | 38,166 | 100.0 | % | $ | 37,565 | 100.0 | % | $ | 33,441 | 100.0 | % | $ | 30,185 | 100.0 | % | $ | 27,289 | 100.0 | % | |||||||||
The provision for loan losses on portfolio loans for the year ended December 31, 2017 was $10.8 million, compared to $5.6 million, and $4.9 million for the comparable 2016 and 2015 periods, respectively. The provision for loan losses for the years ended December 31, 2017 and 2016 was primarily to provide for net charge-offs incurred on impaired loans, as well as organic loan growth in the portfolio.
The allowance for portfolio loan losses was 0.95% of portfolio loans at December 31, 2017, compared to 1.20%, and 1.22%, at December 31, 2016 and 2015, respectively. Management believes the allowance for loan losses is adequate to absorb inherent losses in the loan portfolio.
For PCI loans, the Company remeasures contractual and expected cash flows periodically. When the re-measurement process results in a decrease in expected cash flows, typically due to an increase in expected credit losses, impairment is recorded through provision for loan losses. Similarly, when expected credit losses decrease in the re-measurement process, prior recorded impairment is reversed before the yield is increased prospectively. The provision reversal on PCI loans for the year ended December 31, 2017 was $0.6 million, compared to provision reversal of $1.9 million, and expense of $4.4 million for the comparable 2016 and 2015 periods, respectively.
Nonperforming assets
Nonperforming loans are defined as loans on non-accrual status, loans 90 days or more past due but still accruing interest, and restructured loans. Restructured loans involve the granting of a concession to a borrower due to their financial difficulty and include modification of terms of the loan, such as changes in payment schedule or interest rate. Nonperforming assets include nonperforming loans plus other real estate.
Nonperforming loans exclude PCI loans. PCI loans are accounted for on a pool basis, and the pools are considered to be performing. See Item 8, Note 5 – Loans for more information.
The Company's nonperforming loans meet the definition of “impaired loans” in accordance with U.S. GAAP.
47
The following table presents the categories of nonperforming assets as of the dates indicated:
December 31, | |||||||||||||||||||
($ in thousands) | 2017 | 2016 | 2015 | 2014 | 2013 | ||||||||||||||
Non-accrual loans | $ | 14,968 | $ | 12,585 | $ | 8,797 | $ | 20,892 | $ | 20,163 | |||||||||
Restructured loans | 719 | 2,320 | 303 | 1,352 | 677 | ||||||||||||||
Total nonperforming loans | 15,687 | 14,905 | 9,100 | 22,244 | 20,840 | ||||||||||||||
Other real estate (1) | 498 | 980 | 8,366 | 1,896 | 7,576 | ||||||||||||||
Total nonperforming assets (1) (2) | $ | 16,185 | $ | 15,885 | $ | 17,466 | $ | 24,140 | $ | 28,416 | |||||||||
Total assets | $ | 5,289,225 | $ | 4,081,328 | $ | 3,608,483 | $ | 3,277,003 | $ | 3,170,197 | |||||||||
Portfolio loans | 4,022,896 | 3,118,392 | 2,750,737 | 2,433,916 | 2,137,313 | ||||||||||||||
Nonperforming loans to total loans (2) | 0.39 | % | 0.48 | % | 0.34 | % | 0.91 | % | 0.98 | % | |||||||||
Nonperforming assets to total assets (1) (2) | 0.31 | % | 0.39 | % | 0.48 | % | 0.74 | % | 0.90 | % | |||||||||
Allowance for portfolio loans to nonperforming loans (2) | 243 | % | 252 | % | 367 | % | 136 | % | 131 | % | |||||||||
(1)The increase in other real estate included in nonperforming assets from 2014 to 2015 resulted from the reclassification of $5.1 million of other real estate previously covered under FDIC loss share agreements that were terminated in 2015. | |||||||||||||||||||
(2) Excludes PCI loans, except for their inclusion in total assets. | |||||||||||||||||||
Nonperforming loans
Nonperforming loans exclude PCI loans that are accounted for on a pool basis, as the pools are considered to be performing. See Item 8, Note 5 - Loans for more information on these loans.
Nonperforming loans based on loan type were as follows:
(in thousands) | December 31, 2017 | Number of loans | December 31, 2016 | Number of loans | |||||||||||||||
Commercial and industrial | $ | 12,665 | 81 | % | 10 | $ | 12,284 | 82 | % | 6 | |||||||||
Commercial real estate | 909 | 6 | % | 4 | 655 | 4 | % | 4 | |||||||||||
Construction and land development | 136 | 1 | % | 1 | 1,904 | 13 | % | 3 | |||||||||||
Residential real estate | 1,602 | 10 | % | 3 | 62 | 1 | % | 1 | |||||||||||
Consumer and other | 375 | 2 | % | 1 | — | — | % | — | |||||||||||
Total | $ | 15,687 | 100 | % | 19 | $ | 14,905 | 100 | % | 14 | |||||||||
48
The following table summarizes the changes in nonperforming loans:
Year ended December 31, | |||||||
(in thousands) | 2017 | 2016 | |||||
Nonperforming loans beginning of period | $ | 14,905 | $ | 9,100 | |||
Additions to nonaccrual loans | 19,092 | 18,853 | |||||
Additions to restructured loans | 676 | 2,320 | |||||
Charge-offs | (11,307 | ) | (4,092 | ) | |||
Other principal reductions | (7,396 | ) | (9,546 | ) | |||
Moved to other real estate | (283 | ) | (343 | ) | |||
Moved to performing | — | (1,387 | ) | ||||
Nonperforming loans end of period | $ | 15,687 | $ | 14,905 | |||
Nonperforming loans at December 31, 2017 increased $0.8 million, or 5%, when compared to December 31, 2016. Other principal reductions of $7.4 million includes $1.8 million of proceeds received from sales of collateral, $4.6 million of payments received from borrowers, and $1.0 million of proceeds from other loan settlements.
At December 31, 2017, nonperforming loans were comprised of primarily three relationships with the largest being a $5.4 million C&I relationship, which represented 34% of nonperforming loans. Approximately 42% of nonperforming loans were related to the Company's specialized lending products, 19% were located in the St. Louis market, and 37% were located in the Kansas City market. At December 31, 2017, there were two performing restructured loans, or one relationship, that were excluded from nonperforming loans in the amount of $1.5 million. Nonperforming loans represented 0.39% of portfolio loans at December 31, 2017, versus 0.48% at December 31, 2016.
At December 31, 2016, nonperforming loans were comprised of 11 relationships with the largest being a $9.8 million C&I relationship, which represented 66% of nonperforming loans. Approximately 91% of nonperforming loans were related to the Company's specialized lending products, 6% were located in the St. Louis market and 3% in the Kansas City market. At December 31, 2016, there were three performing restructured loans that were excluded from nonperforming loans in the amount of $1.9 million. Nonperforming loans represented 0.48% of portfolio loans at December 31, 2016, versus 0.34% at December 31, 2015.
Potential problem loans
Potential problem loans are unimpaired loans with a risk rating of 8-Substandard still accruing interest. See Item 8, Note 5 – Portfolio Loans for the definitions of risk ratings. Potential problem loans, which are not included in nonperforming loans, were $59.4 million, or 1.5%, of portfolio loans outstanding at December 31, 2017, compared to $77.6 million, or 2.5%, of portfolio loans outstanding at December 31, 2016. For these loans, payment of principal and interest is current and the loans are performing, however some doubts exist as to the borrower's ability to continue to comply with repayment terms. Potential problem loans include loans to companies that are characterized by significant losses or where downward trends in financial performance have been identified, or are in an industry that is experiencing significant difficulty.
Other real estate
Other real estate at December 31, 2017 was $0.5 million, compared to $1.0 million, at December 31, 2016. In 2015, $5.1 million of other real estate previously covered under FDIC loss share agreements was reclassified into other real estate due to termination of the Company's loss share agreements with the FDIC in the fourth quarter of 2015.
At December 31, 2017, other real estate was comprised of one commercial real estate property, or 45%, located in the Kansas City region, and one residential property, or 55%, located in the St. Louis region.
49
The following table summarizes the changes in other real estate:
Year ended December 31, | |||||||
(in thousands) | 2017 | 2016 | |||||
Other real estate, beginning of period | $ | 980 | $ | 8,366 | |||
Additions and expenses capitalized to prepare property for sale | 2,338 | 2,263 | |||||
Writedowns in value | (133 | ) | — | ||||
Sales | (2,687 | ) | (9,649 | ) | |||
Other real estate, end of period | $ | 498 | $ | 980 | |||
The writedowns in fair value were recorded in loan, legal, and other real estate expense. For the year ended December 31, 2017, the Company realized a net gain of $0.1 million compared to $1.8 million in 2016 on the sale of other real estate and recorded these gains as part of noninterest income.
Investments
At December 31, 2017, our portfolio of investment securities was $715 million, or 14%, of total assets. The portfolio is primarily comprised of agency mortgage-backed securities, obligations of U.S. Government-sponsored enterprises, as well as municipal bonds. The portfolio is comprised of both available for sale and held to maturity securities.
Other investments, at cost, per the consolidated balance sheets, primarily consist of the FHLB capital stock, common stock investments related to our trust preferred securities, and other investments in Small Business Investment Companies ("SBICs"). At December 31, 2017, of the $12.9 million in FHLB capital stock, $6.0 million is required for FHLB membership and $6.9 million is required to support our outstanding advances. Historically, it has been the FHLB's practice to automatically repurchase activity-based stock that became excess because of a member's reduction in advances. The FHLB has the discretion, but is not required, to repurchase any shares a member is not required to hold.
The table below sets forth the carrying value of investment securities held by the Company at the dates indicated:
December 31, | ||||||||||||||||||||
2017 | 2016 | 2015 | ||||||||||||||||||
($ in thousands) | Amount | % | Amount | % | Amount | % | ||||||||||||||
Obligations of U.S. Government sponsored enterprises | $ | 99,224 | 13.4 | % | $ | 107,660 | 19.4 | % | $ | 99,008 | 19.3 | % | ||||||||
Obligations of states and political subdivisions | 48,674 | 6.6 | % | 51,390 | 9.2 | % | 56,532 | 11.0 | % | |||||||||||
Agency mortgage-backed securities | 567,233 | 76.4 | % | 382,210 | 68.7 | % | 339,944 | 66.3 | % | |||||||||||
FHLB capital stock | 12,924 | 1.7 | % | 4,351 | 0.8 | % | 8,344 | 1.6 | % | |||||||||||
Other investments | 13,737 | 1.9 | % | 10,489 | 1.9 | % | 9,111 | 1.8 | % | |||||||||||
Total | $ | 741,792 | 100.0 | % | $ | 556,100 | 100.0 | % | $ | 512,939 | 100.0 | % | ||||||||
The Company had no securities classified as trading at December 31, 2017, 2016, or 2015.
50
The following table summarizes expected maturity and tax equivalent yield information on the investment portfolio at December 31, 2017:
Within 1 year | 1 to 5 years | 5 to 10 years | Over 10 years | No Stated Maturity | Total | ||||||||||||||||||||||||||||||
($ in thousands) | Amount | Yield | Amount | Yield | Amount | Yield | Amount | Yield | Amount | Yield | Amount | Yield | |||||||||||||||||||||||
Obligations of U.S. Government-sponsored enterprises | $ | — | — | % | $ | 99,224 | 1.84 | % | $ | — | — | % | $ | — | — | % | $ | — | — | % | $ | 99,224 | 1.84 | % | |||||||||||
Obligations of states and political subdivisions | 3,076 | 3.84 | % | 11,442 | 4.50 | % | 27,957 | 4.02 | % | 6,198 | 3.14 | % | — | — | % | 48,673 | 4.01 | % | |||||||||||||||||
Agency mortgage-backed securities | 3,072 | 3.21 | % | 336,943 | 2.63 | % | 219,774 | 2.84 | % | 7,445 | 1.82 | % | — | — | % | 567,234 | 2.70 | % | |||||||||||||||||
FHLB capital stock | — | — | % | — | — | % | — | — | % | — | — | % | 12,924 | 2.71 | % | 12,924 | 2.71 | % | |||||||||||||||||
Other investments | — | — | % | — | — | % | — | — | % | — | — | % | 13,737 | 0.63 | % | 13,737 | 0.63 | % | |||||||||||||||||
Total | $ | 6,148 | 3.53 | % | $ | 447,609 | 2.50 | % | $ | 247,731 | 2.97 | % | $ | 13,643 | 2.42 | % | $ | 26,661 | 1.64 | % | $ | 741,792 | 2.63 | % | |||||||||||
Yields on tax-exempt securities are computed on a taxable equivalent basis using a tax rate of 38%. Expected maturities will differ from contractual maturities, as borrowers may have the right to call or repay obligations with or without prepayment penalties.
Deposits
The following table shows the breakdown of the Company's deposits by type for the periods indicated:
For the Years ended December 31, | % Increase (decrease) | ||||||||||||||||
($ in thousands) | 2017 | 2016 | 2015 | 2017 vs. 2016 | 2016 vs. 2015 | ||||||||||||
Demand deposits | $ | 1,123,907 | $ | 866,756 | $ | 717,460 | 29.7 | % | 20.8 | % | |||||||
Interest-bearing transaction accounts | 915,653 | 731,539 | 564,420 | 25.2 | % | 29.6 | % | ||||||||||
Money market accounts | 1,342,931 | 1,050,472 | 1,053,662 | 27.8 | % | (0.3 | )% | ||||||||||
Savings | 195,150 | 111,435 | 92,861 | 75.1 | % | 20.0 | % | ||||||||||
Certificates of deposit: | |||||||||||||||||
Brokered | 115,306 | 117,145 | 39,573 | (1.6 | )% | 196.0 | % | ||||||||||
Other | 463,467 | 356,014 | 316,615 | 30.2 | % | 12.4 | % | ||||||||||
Total deposits | $4,156,414 | $3,233,361 | $2,784,591 | 28.5 | % | 16.1 | % | ||||||||||
Non-time deposits / Total deposits | 86 | % | 85 | % | 87 | % | |||||||||||
Demand deposits / Total deposits | 27 | % | 27 | % | 26 | % | |||||||||||
An increase in deposits from 2016 to 2017 occurred in all areas except brokered certificates of deposit which experienced a slight decline. Core deposits, defined as total deposits excluding time deposits, were $3.6 billion at December 31, 2017, an increase of $817 million, or 30%, from the prior year period. The increase in deposits reflects the acquisition of JCB, and continued progress across the Company's regions and business lines.
51
Maturities of certificates of deposit of $100,000 or more were as follows as of December 31, 2017:
(in thousands) | Total | ||
Three months or less | $ | 59,709 | |
Over three through six months | 52,990 | ||
Over six through twelve months | 94,658 | ||
Over twelve months | 94,359 | ||
Total | $ | 301,716 | |
Shareholders' equity
Shareholders' equity totaled $549 million at December 31, 2017, an increase of $161.5 million from December 31, 2016. Significant activity during the year ended December 31, 2017:
• | Issuance of 3.3 million shares of common stock for the JCB acquisition of $141.7 million, |
• | Repurchase of 429,555 shares of common stock at an average price of $38.69, or $16.6 million, pursuant to its publicly announced program, |
• | Dividends paid on common stock of $10.2 million, and |
• | Net income of $48.2 million. |
Liquidity and Capital Resources
Liquidity
The objective of liquidity management is to ensure we have the ability to generate sufficient cash or cash equivalents in a timely and cost-effective manner to meet our commitments as they become due. Typical demands on liquidity are changes in deposit levels, maturing time deposits which are not renewed, and fundings under credit commitments to customers. Funds are available from a number of sources, such as the core deposit base and loans and securities repayments and maturities.
Additionally, liquidity is provided from lines of credit with correspondent banks, the Federal Reserve and the FHLB, the ability to acquire large and brokered deposits, sales of the securities portfolio, and the ability to sell loan participations to other banks. These alternatives are an important part of our liquidity plan and provide flexibility and efficient execution of the asset-liability management strategy.
The Bank's Asset-Liability Management Committee oversees our liquidity position, the parameters of which are approved by the Bank's Board of Directors. Our liquidity position is monitored monthly by producing a liquidity report, which measures the amount of liquid versus non-liquid assets and liabilities. Our liquidity management framework includes measurement of several key elements, such as the loan to deposit ratio, a liquidity ratio, and a dependency ratio. The Company's liquidity framework also incorporates contingency planning to assess the nature and volatility of funding sources and to determine alternatives to these sources. While core deposits and loan and investment repayments are principal sources of liquidity, funding diversification is another key element of liquidity management and is achieved by strategically varying depositor types, terms, funding markets, and instruments.
For the year ended December 31, 2017, net cash used by investing activities was $312.4 million, versus net cash used of $358.1 million in 2016. The investing activities in 2017 primarily represents our normal business activity of making loans and investing in securities. Net cash provided by financing activities was $221.2 million in 2017, versus net cash provided of $380.2 million in 2016. The change in cash provided by financing activities was primarily due to larger increases in deposit accounts and the issuance of $50 million of subordinated notes both in 2016, partially offset by an increase in net proceeds from FHLB advances in 2017.
Strong capital ratios, credit quality and core earnings are essential to retaining cost-effective access to the wholesale funding markets. Deterioration in any of these factors could have a negative impact on the Company's ability to access these funding sources and, as a result, these factors are monitored on an ongoing basis as part of the liquidity management
52
process. The Bank is subject to regulations and, among other things, may be limited in its ability to pay dividends or transfer funds to the parent company. Accordingly, consolidated cash flows as presented in the consolidated statements of cash flows may not represent cash immediately available for the payment of cash dividends to the Company's shareholders or for other cash needs.
Parent Company liquidity
The parent company's liquidity is managed to provide the funds necessary to pay dividends to shareholders, service debt, invest in subsidiaries as necessary, and satisfy other operating requirements. The parent company's primary funding sources to meet its liquidity requirements are dividends and payments from the Bank and proceeds from the issuance of equity (i.e. stock option exercises, stock offerings). Another source of funding for the parent company includes the issuance of subordinated debentures and other debt instruments.
The Company has an effective shelf registration statement on Form S-3 registering up to $100 million of common stock, preferred stock, debt securities, and various other securities, including combinations of such securities. The Company's ability to offer securities pursuant to the registration statement depends on market conditions and the Company's continuing eligibility to use the Form S-3 under rules of the SEC.
On November 1, 2016, the Company issued $50 million aggregate principal amount of 4.75% fixed-to-floating rate subordinated notes with a maturity date of November 1, 2026, which initially bear an annual interest rate of 4.75%, with interest payable semiannually. Beginning November 1, 2021, the interest rate resets quarterly to the three-month LIBOR rate plus a spread of 338.7 basis points, payable quarterly.
The Company has a senior unsecured revolving credit agreement (the "Revolving Agreement") with another bank allowing for borrowings up to $20 million which is renewed through February 2019. The proceeds can be used for general corporate purposes. The Revolving Agreement is subject to ongoing compliance with a number of customary affirmative and negative covenants as well as specified financial covenants. As of December 31, 2017, there were no outstanding balances under the Revolving Agreement.
The Bank has historically provided a dividend to supplement the parent company's liquidity at the discretion of the Bank's management. The Bank paid dividends of $20.0 million, $7.5 million, and $10.0 million throughout 2017, 2016, and 2015, respectively. The parent company's cash balance as of December 31, 2017 was $10.0 million, a $42.3 million decrease from December 31, 2016, primarily due to cash used for the acquisition of JCB. Management believes the current level of cash at the holding company will be sufficient to meet all projected cash needs for at least the next year.
As of December 31, 2017, the Company had $69.2 million of outstanding subordinated debentures as part of 10 Trust Preferred Securities Pools. These securities are classified as debt but are included in regulatory capital and the related interest expense is tax-deductible, which makes them an attractive source of funding.
Regulations issued by the Federal Reserve Board under the Basel III regulatory capital reforms allow our currently outstanding trust preferred securities to retain tier 1 capital status.
Bank liquidity
The Bank has a variety of funding sources available to increase financial flexibility. In addition to amounts currently borrowed, at December 31, 2017, the Bank could borrow an additional $484.7 million from the FHLB of Des Moines under blanket loan pledges and has an additional $898.1 million available from the Federal Reserve Bank under a pledged loan agreement. The Bank has unsecured federal funds lines with five correspondent banks totaling $75.0 million.
Investment securities are another important tool to the Bank's liquidity objectives. Securities totaled $715.1 million at December 31, 2017, and included $500.0 million that was pledged as collateral for deposits of public institutions, treasury, loan notes, and other requirements. The remaining $215.1 million could be pledged or sold to enhance liquidity, if necessary.
53
In the normal course of business, the Bank enters into certain forms of off-balance sheet transactions, including unfunded loan commitments and letters of credit. These transactions are managed through the Bank's various risk management processes. Management considers both on-balance sheet and off-balance sheet transactions in its evaluation of the Company's liquidity. The Bank has $1.4 billion in unused commitments as of December 31, 2017. While this commitment level would exhaust the majority the Company's current liquidity resources, the nature of these commitments is such that the likelihood of funding them in the aggregate at any one time is low.
Capital Resources
The Company and the Bank are subject to various regulatory capital requirements administered by the Federal banking agencies. Failure to meet minimum capital requirements can initiate certain mandatory and possible additional discretionary actions by regulators that, if undertaken, could have a direct material effect on the financial statements. Under capital adequacy guidelines and the regulatory framework for prompt corrective action, the Company and its bank affiliate must meet specific capital guidelines that involve quantitative measures of assets, liabilities, and certain off-balance-sheet items as calculated under regulatory accounting practices. The banking affiliate’s capital amounts and classification are also subject to qualitative judgments by the regulators about components, risk weightings and other factors.
Quantitative measures established by regulation to ensure capital adequacy require the Company and the Bank to maintain minimum amounts and ratios (set forth in the following table) of total and tier 1 capital to risk-weighted assets, and of tier 1 capital to average assets. To be categorized as “well capitalized”, banks must maintain minimum total risk-based (10%), tier 1 risk-based (8%), common equity tier 1 risk-based (6.5%), and tier 1 leverage ratios (5%). As of December 31, 2017, and December 31, 2016, the Company and the Bank met all capital adequacy requirements to which they are subject.
The Bank met the definition of “well capitalized” at December 31, 2017, 2016, and 2015. Refer to Item 8 - Note 14 Regulatory Matters for a summary of our risk-based capital and leverage ratios.
The following table summarizes the Company's various capital ratios at the dates indicated:
($ in thousands) | For the Year ended December 31, | Well Capitalized | |||||||||||
2017 | 2016 | 2015 | Minimum % | ||||||||||
Total capital to risk weighted assets | 12.21 | % | 13.48 | % | 11.85 | % | 10.00% | ||||||
Tier 1 capital to risk weighted assets | 10.29 | % | 10.99 | % | 10.61 | % | 8.00% | ||||||
Common equity tier 1 capital to risk weighted assets | 8.88 | % | 9.52 | % | 9.05 | % | 6.50% | ||||||
Leverage ratio (Tier 1 capital to average assets) | 9.72 | % | 10.42 | % | 10.71 | % | 5.00% | ||||||
Tangible common equity to tangible assets1 | 8.14 | % | 8.76 | % | 8.88 | % | N/A | ||||||
Total risk-based capital | $ | 589,048 | $ | 506,349 | $ | 418,367 | |||||||
Tier 1 capital | 496,045 | 412,865 | 374,676 | ||||||||||
Common equity tier 1 capital | 428,398 | 357,729 | 319,553 | ||||||||||
1 Not a required regulatory capital ratio | |||||||||||||
The Company believes the tangible common equity and regulatory capital ratios are important measures of capital strength even though they are considered to be non-GAAP measures. The tables further within MD&A reconcile these ratios to U.S. GAAP.
54
Risk Management
Market risk arises from exposure to changes in interest rates and other relevant market rate or price risk. The Company faces market risk in the form of interest rate risk through transactions other than trading activities. Market risk from these activities, in the form of interest rate risk, is measured and managed through a number of methods. The Company uses financial modeling techniques to measure interest rate risk. These techniques measure the sensitivity of future earnings due to changing interest rate environments. Guidelines established by the Bank's Asset/Liability Management Committee and approved by the Bank's Board of Directors are used to monitor exposure of earnings at risk. General interest rate movements are used to develop sensitivity as management believes it has no primary exposure to a specific point on the yield curve. These limits are based on the Company's exposure to immediate and sustained parallel rate movements up to 400 basis points, either upward or downward.
Interest Rate Risk
Our interest rate risk management practices are aimed at optimizing net interest income, while guarding against deterioration that could be caused by certain interest rate scenarios. Interest rate sensitivity varies with different types of interest-earning assets and interest-bearing liabilities. We attempt to maintain interest-earning assets, comprised primarily of both loans and investments, and interest-bearing liabilities, comprised primarily of deposits, maturing or repricing in similar time horizons in order to manage any impact from market interest rate changes according to our risk tolerance. The Company uses an earnings simulation model to measure earnings sensitivity to changing rates.
The Company determines the sensitivity of its short-term future earnings to a hypothetical plus or minus 100 to 300 basis point parallel rate shock through the use of simulation modeling. The simulation of earnings includes the modeling of the balance sheet as an ongoing entity. Future business assumptions involving administered rate products, prepayments for future rate-sensitive balances, and the reinvestment of maturing assets and liabilities are included. These items are then modeled to project net interest income based on a hypothetical change in interest rates. The resulting net interest income for the next 12-month period is compared to the net interest income amount calculated using flat rates. This difference represents the Company's earnings sensitivity to a positive or negative 100 basis points parallel rate shock.
The following table summarizes the expected impact of interest rate shocks on net interest income (due to the current level of interest rates, the 200 and 300 basis point downward shock scenarios are not shown):
Rate Shock | Annual % change in net interest income |
+ 300 bp | 3.9% |
+ 200 bp | 2.7% |
+ 100 bp | 1.4% |
- 100 bp | -5.9% |
In addition to the rate shocks shown in the table above, the Company models net interest income under various dynamic interest rate scenarios. In general, changes in interest rates are positively correlated with changes in net interest income. The exception to this is a bear flattener scenario (short term rates move up more than long term rates), which results in a mild decrease in net interest income.
The Company occasionally uses interest rate derivative financial instruments as an asset/liability management tool to hedge mismatches in interest rate exposure indicated by the net interest income simulation described above. They are used to modify the Company's exposures to interest rate fluctuations and provide more stable spreads between loan yields and the rate on their funding sources. At December 31, 2017, the Company had no derivative contracts used to manage interest rate risk. Derivative financial instruments are also discussed in Item 8, Note 6 – Derivative Financial Instruments.
55
Contractual Obligations, Off-Balance Sheet Risk, and Contingent Liabilities
Through the normal course of operations, the Company has entered into certain contractual obligations and other commitments. Such obligations relate to funding of operations through deposits or debt issuances, as well as leases for premises and equipment. As a financial services provider, the Company routinely enters into commitments to extend credit. While contractual obligations represent future cash requirements of the Company, a significant portion of commitments to extend credit may expire without being drawn upon. Such commitments are subject to the same credit policies and approval process accorded to loans made by the Company.
The required contractual obligations and other commitments, excluding any contractual interest1, at December 31, 2017, were as follows:
Payments due by Period | |||||||||||||||||||
(in thousands) | Total | Less Than 1 Year | Over 1 Year Less than 3 Years | Over 3 Years Less than 5 Years | Over 5 Years | ||||||||||||||
Operating leases | $ | 22,498 | $ | 3,503 | $ | 6,895 | $ | 6,138 | $ | 5,962 | |||||||||
Certificates of deposit | 578,773 | 431,427 | 124,041 | 22,698 | 607 | ||||||||||||||
Subordinated debentures and notes | 119,241 | — | — | — | 119,241 | ||||||||||||||
Federal Home Loan Bank advances | 172,743 | 172,743 | — | — | — | ||||||||||||||
Commitments to extend credit | 1,298,424 | 592,747 | 364,437 | 71,700 | 269,540 | ||||||||||||||
Commitments - state tax credits | 23,744 | 20,402 | 3,342 | — | — | ||||||||||||||
Letters of credit | 73,790 | 49,080 | 24,685 | 25 | — | ||||||||||||||
SBICs (2) | 17,437 | 3,487 | 13,950 | — | — | ||||||||||||||
(1) Interest charges on related contractual obligations were excluded from reported amounts as the potential cash outflows would have corresponding cash inflows from interest-earning assets. | |||||||||||||||||||
(2) Represents the estimated timing of various capital raises for SBICs. | |||||||||||||||||||
As of December 31, 2017, we had liabilities associated with uncertain tax positions of $0.8 million. The table above does not include these liabilities due to the high degree of uncertainty regarding the future cash flows associated with these amounts.
The Company also enters into derivative contracts under which the Company either receives cash from or pays cash to counterparties depending on changes in interest rates. Derivative contracts are carried at fair value on the consolidated balance sheet with the fair value representing the net present value of expected future cash receipts or payments based on market interest rates as of the balance sheet date. The fair value of these contracts changes daily as market interest rates change.
56
CRITICAL ACCOUNTING POLICIES
The following accounting policies are considered most critical to the understanding of the Company's financial condition and results of operations. These critical accounting policies require management's most difficult, subjective and complex judgments about matters that are inherently uncertain. Because these estimates and judgments are based on current circumstances, they may change over time or prove to be inaccurate based on actual experiences. In the event that different assumptions or conditions were to prevail, and depending upon the severity of such changes, the possibility of a materially different financial condition and/or results of operations could reasonably be expected. The impact and any associated risks related to our critical accounting policies on our business operations are discussed throughout “Management's Discussion and Analysis of Financial Condition and Results of Operations,” where such policies affect our reported and expected financial results. For a detailed discussion on the application of these and other accounting policies, see Item 8, Note 1 – Summary of Significant Accounting Policies.
The Company has prepared all of the consolidated financial information in this report in accordance with U.S. GAAP. The Company makes estimates and assumptions that affect the reported amount of assets and liabilities, disclosure of contingent assets and liabilities at the date of the consolidated financial statements, and the reported amounts of revenue and expenses during the reporting period. Such estimates include the valuation of loans, goodwill, intangible assets, and other long-lived assets, along with assumptions used in the calculation of income taxes, among others. These estimates and assumptions are based on management's best estimates and judgment. Management evaluates its estimates and assumptions on an ongoing basis using historical experience and other factors, including the current economic environment, which management believes to be reasonable under the circumstances. We adjust such estimates and assumptions when facts and circumstances dictate. Decreased real estate values, volatile credit markets, and persistent high unemployment have combined to increase the uncertainty inherent in such estimates and assumptions. As future events and their effects cannot be determined with precision, actual results could differ significantly from these estimates. Changes in estimates resulting from continuing changes in the economic environment will be reflected in the financial statement in future periods. There can be no assurances that actual results will not differ from those estimates.
Acquisitions
Acquisitions and Business Combinations are accounted for using the acquisition method of accounting. The assets and liabilities of the acquired entities have been recorded at their estimated fair values at the date of acquisition. Goodwill represents the excess of the purchase price over the fair value of net assets acquired, including the amount assigned to identifiable intangible assets.
The purchase price allocation process requires an estimation of the fair values of the assets acquired and the liabilities assumed. When a business combination agreement provides for an adjustment to the cost of the combination contingent on future events, the Company includes an estimate of the acquisition-date fair value as part of the cost of the combination. To determine the fair values, the Company relies on third party valuations, such as appraisals, or internal valuations based on discounted cash flow analyses or other valuation techniques. The results of operations of the acquired business are included in the Company's consolidated financial statements from the respective date of acquisition. Merger-related costs are costs the Company incurs to effect a business combination. In 2017, the Company changed its presentation of Merger related expenses as a separate component of Noninterest expenses on the Condensed Consolidated Statements of Operations. Merger related expenses include costs directly related to merger or acquisition activity and include legal and professional fees, system consolidation and conversion costs, and compensation costs such as severance and retention incentives for employees impacted by acquisition activity. The Company accounts for merger-related costs as expenses in the periods in which the costs are incurred and the services are received.
Allowance for Loan Losses
The Company maintains an allowance for loan losses (“the allowance”), which is management's estimate of probable, inherent losses in the outstanding loan portfolio. The allowance is based on management's continuous review and evaluation of the loan portfolio. The review and evaluation combines several factors including: consideration of loan loss experience; trends in past due and nonperforming loans; changes in lending policies and procedures; existing business and economic conditions; the fair value of underlying collateral; changes in the nature and volume of the Company's loan portfolio; changes in the lending department of the Company; volume and severity of past due loans;
57
the quality of the loan review system; concentrations of credit and other qualitative and other factors which affect probable credit losses. Because current economic conditions can change and are difficult to predict, the anticipated amount of estimated loan losses, and therefore the adequacy of the allowance, could change significantly.
In determining the allowance and the related provision for loan losses for portfolio loans, three principal elements are considered:
1) | specific allocations based upon probable losses identified during a quarterly review of the loan portfolio, |
2) | allocations based principally on the Company's risk rating formulas, and |
3) | a qualitative adjustment based on other economic, environmental and portfolio factors. |
The first element reflects management's estimate of probable losses based upon a systematic review of specific loans considered to be impaired. These estimates are based upon discounted cash flows as estimated and used to assign loss or collateral exposure, if they are collateral dependent for collection.
The second element reflects the application of our loan rating system. Loans are rated and assigned a loss allocation factor for each category based on a loss migration analysis using the Company's loss experience over the last six years. The higher the rating assigned to a loan, the greater the loss allocation percentage applied. This element also incorporates an estimate of the loss emergence period, which is an estimate of the time between when a credit event occurs and when the charge-off of a loan occurs. The process is an estimate and is, therefore, imprecise. For example, if our estimate of the loss emergence period would have been increased/decreased by one quarter, it would have resulted in an increase of $2.5 million and a decrease of $2.6 million, respectively, in our allowance at December 31, 2017.
The qualitative adjustment is based on management's evaluation of conditions that are not directly reflected in the loss migration analysis and/or specific reserve. The evaluation of the inherent loss with respect to these conditions is subject to a higher degree of uncertainty because they may not be identified with specific problem credits. The conditions evaluated in connection with the qualitative or environmental adjustment include the following:
• | changes in lending policies and procedures; |
• | changes in business and economic conditions; |
• | changes in the nature and volume of our loan portfolio; |
• | changes in our lending department; |
• | changes in volume and/or severity of past due loans; |
• | changes in the quality of our loan review system; |
• | changes in the value of underlying collateral related to loans; |
• | existence and effect of concentrations of credit within our loan portfolio; and |
• | other external factors such as asset quality trends (including trends in nonperforming loans expected to result from existing conditions), and related allowance metrics of our peers. |
Executive management reviews these conditions quarterly based on discussion with our lending staff. Management then assigns a specified number of basis points of allowance to each factor above by loan category. To the extent that any of these conditions is evidenced by a specifically identifiable problem credit or loan category as of the evaluation date, management's estimate of the effect of such conditions may be reflected as a specific allowance, applicable to such credit or loan category.
The allocation of the allowance for loan losses by loan category is a result of the analysis above. The allocation methodology applied by the Company focuses on changes in the size and character of the loan portfolio, changes in levels of impaired and other nonperforming loans, the risk inherent in specific loans, concentrations of loans to specific borrowers or industries, existing economic conditions, and historical losses on each portfolio category.
Management believes the allowance for loan losses is adequate at December 31, 2017.
58
Purchased Credit Impaired ('PCI") Loans
PCI loans were acquired in a business combination or transaction that have evidence of deterioration of credit quality since origination and for which it is probable, at acquisition, that the Company will be unable to collect all contractually required payments receivable. PCI loans were initially recorded at fair value (as determined by the present value of expected future cash flows) with no valuation allowance. The difference between the undiscounted cash flows expected at acquisition and the investment in the loans, or the “accretable yield,” is recognized as interest income on a level-yield method over the life of the loans. Contractually required payments for interest and principal that exceed the undiscounted cash flows expected at acquisition, or the “nonaccretable difference,” are not recognized as a yield adjustment or as a loss accrual or a valuation allowance. The Company aggregates individual loans with common risk characteristics into pools of loans. Increases in expected cash flows subsequent to the initial investment are recognized prospectively through adjustment of the yield on the loans over their remaining lives. Decreases in expected cash flows due to an inability to collect contractual cash flows are recognized as impairment through the provision for loan losses account. Any allowance for loan loss on these pools reflect only losses incurred after the acquisition. Disposals of loans, including sales of loans, paydowns, payments in full or foreclosures result in the removal or reduction of the loan from the loan pool.
PCI loans are generally considered accruing and performing, as the loans accrete income over the estimated life of the loan, in circumstances where cash flows are reasonably estimable by management. Accordingly, PCI loans that could be contractually past due could be considered to be accruing and performing. If the timing and amount of future cash flows is not reasonably estimable or is less than the carrying value, the loans may be classified as nonaccrual loans and the purchase price discount on those loans is not recorded as interest income until the timing and amount of future cash flows can be reasonably estimable.
Allowance for Loan Losses on PCI Loans
The Company updates its cash flow projections for purchased credit-impaired loans on a periodic basis. Assumptions utilized in this process include projections related to probability of default, loss severity, prepayment, extensions and recovery lag. Projections related to probability of default and prepayment are calculated utilizing a loan migration analysis and management's assessment of loss exposure including the fair value of underlying collateral. The loan migration analysis is a matrix that specifies the probability of a loan pool transitioning into a particular delinquency or liquidation state given its current performance at the measurement date. Loss severity factors are based upon industry data and historical experience.
Any decreases in expected cash flows after the acquisition date and subsequent measurement periods are recognized by recording an impairment in allowance for loan losses through a provision for loan losses.
Goodwill and Other Intangible Assets
The Company completes a goodwill impairment test in the fourth quarter each year or whenever events or changes in circumstances indicate that the Company may not be able to recover the goodwill, or intangible assets, respective carrying amount. The impairment test involves the use of various estimates and assumptions. Management believes that the estimates and assumptions utilized are reasonable. However, the Company may incur impairment charges related to goodwill or intangible assets in the future due to changes in business prospects or other matters that could impact estimates and assumptions.
Goodwill is evaluated for impairment at the reporting unit level. Reporting units are defined as the same level as, or one level below, an operating segment. An operating segment is a component of a business for which separate financial information is available that management regularly evaluates in deciding how to allocate resources and assess performance. At December 31, 2017, the Company had one reporting unit and one operating segment.
Potential impairments to goodwill must first be identified by performing a qualitative assessment which evaluates relevant events or circumstances to determine whether it is more likely than not that the fair value of a reporting unit is less than its carrying amount. If this test indicates it is more likely than not that goodwill has been impaired, then a quantitative impairment test is completed. The quantitative impairment test calculates the fair value of the reporting unit and compares it with its carrying amount, including goodwill. If the carrying amount of goodwill exceeds its
59
implied fair market value, an impairment loss is recognized. That loss is equal to the carrying amount of goodwill that is in excess of its implied fair market value.
Intangible assets other than goodwill, such as core deposit intangibles, that are determined to have finite lives are amortized over their estimated remaining useful lives. These assets are reviewed for impairment whenever events or changes in circumstances indicate that the carrying amount of an asset may not be recoverable. Recoverability of assets to be held and used is measured by a comparison of the carrying amount of an asset to estimated undiscounted future cash flows expected to be generated by the asset. If the carrying amount of an asset exceeds its estimated future cash flows, an impairment charge is recognized by the amount by which the carrying amount of the asset exceeds the fair value of the asset.
In 2017, we performed both a qualitative and quantitative assessment to determine if our goodwill was impaired. At December 31, 2017 the Company had $117.3 million goodwill compared to $30.3 million at December 31, 2016 due to the acquisition of JCB. The 2017 annual impairment evaluation of goodwill and intangible balances did not identify any impairment.
Effects of New Accounting Pronouncements
See Item 8, Note 21 – New Authoritative Accounting Guidance for information on recent accounting pronouncements and their impact, if any, on our consolidated financial statements.
60
Use of Non-GAAP Financial Measures
The Company's accounting and reporting policies conform to generally accepted accounting principles in the U.S. ("GAAP") and the prevailing practices in the banking industry. However, the Company provides other financial measures, such as core net income and net interest margin, and other core performance measures, regulatory capital ratios, and the tangible common equity ratio, in this filing that are considered “non-GAAP financial measures.” Generally, a non-GAAP financial measure is a numerical measure of a company's financial performance, financial position, or cash flows that exclude (or include) amounts that are included in (or excluded from) the most directly comparable measure calculated and presented in accordance with GAAP.
The Company considers its core performance measures as important measures of financial performance, even though they are non-GAAP measures, as they provide supplemental information by which to evaluate the impact of non-core acquired loans and related income and expenses, the impact of certain non-comparable items, and the Company's operating performance on an ongoing basis. Core performance measures include contractual interest on non-core acquired loans, but exclude incremental accretion on these loans. Core performance measures also exclude the following:
• | the change in the FDIC loss share receivable, |
• | gain or loss on sale of other real estate from non-core acquired loans, |
• | expenses directly related to non-core acquired loans and other assets formerly covered under FDIC loss share agreements, and |
• | certain other income and expense items the Company believes to be not indicative of or useful to measure the Company's operating performance on an ongoing basis, such as: |
◦ | executive separation costs, |
◦ | merger related expenses, |
◦ | facilities charges, |
◦ | deferred tax asset revaluation due to U.S. corporate income tax reform, and |
◦ | the gain or loss on sale of investment securities. |
The Company believes that the tangible common equity ratio provides useful information to investors about the Company's capital strength, even though it is considered to be a non-GAAP financial measure, and is not part of the regulatory capital requirements to which the Company is subject.
The Company believes these non-GAAP measures and ratios, when taken together with the corresponding GAAP measures and ratios, provide meaningful supplemental information regarding the Company's performance and capital strength. The Company's management uses, and believes that investors benefit from referring to, these non-GAAP measures and ratios in assessing the Company's operating results and related trends and when forecasting future periods. However, these non-GAAP measures and ratios should be considered in addition to, and not as a substitute for or preferable to, ratios prepared in accordance with GAAP. The Company has provided a reconciliation of, where applicable, the most comparable GAAP financial measures and ratios to the non-GAAP financial measures and ratios, or a reconciliation of the non-GAAP calculation of the financial measure for the periods indicated.
61
Reconciliations of Non-GAAP Financial Measures
Core Performance Measures
For the Years ended | |||||||||||
($ in thousands, except per share data) | December 31, 2017 | December 31, 2016 | December 31, 2015 | ||||||||
Net interest income | $ | 177,304 | $ | 135,495 | $ | 120,410 | |||||
Less: Incremental accretion income | 7,718 | 11,980 | 12,792 | ||||||||
Core net interest income | 169,586 | 123,515 | 107,618 | ||||||||
Total noninterest income | 34,394 | 29,059 | 20,675 | ||||||||
Less: Gain on sale of other real estate from non-core acquired loans | (6 | ) | 1,565 | 107 | |||||||
Less: Other income from non-core acquired assets | — | 621 | — | ||||||||
Less: Gain on sale of investment securities | 22 | 86 | 23 | ||||||||
Less: Change in FDIC loss share receivable | — | — | (5,030 | ) | |||||||
Core noninterest income | 34,378 | 26,787 | 25,575 | ||||||||
Total core revenue | 203,964 | 150,302 | 133,193 | ||||||||
Provision for portfolio loan losses | 10,764 | 5,551 | 4,872 | ||||||||
Total noninterest expense | 115,051 | 86,110 | 82,226 | ||||||||
Less: Merger related expenses | 6,462 | 1,386 | — | ||||||||
Less: Other expenses related to non-core acquired loans | 240 | 1,094 | 1,558 | ||||||||
Less: Facilities disposal charge | 389 | 1,040 | — | ||||||||
Less: Executive severance | — | 332 | — | ||||||||
Less: FDIC loss share termination | — | — | 2,436 | ||||||||
Less: FDIC clawback | — | — | 760 | ||||||||
Less: Other non-core expenses | — | 41 | — | ||||||||
Core noninterest expense | 107,960 | 82,217 | 77,472 | ||||||||
Core income before income tax expense | 85,240 | 62,534 | 50,849 | ||||||||
Total income tax expense | 38,327 | 26,002 | 19,951 | ||||||||
Less: Income tax expense from deferred tax asset revaluation due to the U.S. corporate tax rate change | 12,117 | — | — | ||||||||
Less: Other non-core income tax expense1 | 882 | 4,705 | 2,893 | ||||||||
Core income tax expense | 25,328 | 21,297 | 17,058 | ||||||||
Core net income | $ | 59,912 | $ | 41,237 | $ | 33,791 | |||||
Core diluted earnings per share | $ | 2.58 | $ | 2.03 | $ | 1.66 | |||||
Core return on average assets | 1.20 | % | 1.09 | % | 1.00 | % | |||||
Core return on average common equity | 11.26 | % | 11.10 | % | 10.08 | % | |||||
Core return on average tangible common equity | 14.46 | % | 12.18 | % | 11.22 | % | |||||
Core efficiency ratio | 52.93 | % | 54.70 | % | 58.17 | % | |||||
1Other non-core income tax expense calculated at 38% of non-core pre-tax income plus an estimate of taxes payable related to non-deductible JCB acquistion costs. | |||||||||||
62
Net Interest Margin to Core Net Interest Margin (Fully tax equivalent)
($ in thousands) | For the Years ended December 31, | ||||||||||
2017 | 2016 | 2015 | |||||||||
Net interest income | $ | 179,114 | $ | 137,261 | $ | 122,141 | |||||
Less: Incremental accretion income | 7,718 | 11,980 | 12,792 | ||||||||
Core net interest income | $ | 171,396 | $ | 125,281 | $ | 109,349 | |||||
Average earning assets | $ | 4,611,671 | $ | 3,570,186 | $ | 3,163,339 | |||||
Reported net interest margin | 3.88 | % | 3.84 | % | 3.86 | % | |||||
Core net interest margin | 3.72 | % | 3.51 | % | 3.46 | % | |||||
Tangible Common Equity ratio
For the Years ended December 31, | |||||||||||
($ in thousands) | 2017 | 2016 | 2015 | ||||||||
Total shareholders' equity | $ | 548,573 | $ | 387,098 | $ | 350,829 | |||||
Less: Goodwill | 117,345 | 30,334 | 30,334 | ||||||||
Less: Intangible assets | 11,056 | 2,151 | 3,075 | ||||||||
Tangible common equity | $ | 420,172 | $ | 354,613 | $ | 317,420 | |||||
Total assets | $ | 5,289,225 | $ | 4,081,328 | $ | 3,608,483 | |||||
Less: Goodwill | 117,345 | 30,334 | 30,334 | ||||||||
Less: Intangible assets | 11,056 | 2,151 | 3,075 | ||||||||
Tangible assets | $ | 5,160,824 | $ | 4,048,843 | $ | 3,575,074 | |||||
Tangible common equity to tangible assets | 8.14 | % | 8.76 | % | 8.88 | % | |||||
63
Regulatory Capital to Risk-weighted Assets
For the Years ended December 31, | |||||||||||
($ in thousands) | 2017 | 2016 | 2015 | ||||||||
Total shareholders' equity | $ | 548,573 | $ | 387,098 | $ | 350,829 | |||||
Less: Goodwill | 117,345 | 30,334 | 30,334 | ||||||||
Less: Intangible assets, net of deferred tax liabilities | 6,661 | 800 | 759 | ||||||||
Less: Unrealized gains (losses) | (3,818 | ) | (1,741 | ) | 218 | ||||||
Plus: Other | 12 | 24 | 37 | ||||||||
Common equity tier 1 capital | 428,397 | 357,729 | 319,555 | ||||||||
Plus: Qualifying trust preferred securities | 67,600 | 55,100 | 55,100 | ||||||||
Plus: Other | 48 | 36 | 23 | ||||||||
Tier 1 capital | 496,045 | 412,865 | 374,678 | ||||||||
Plus: Tier 2 capital | 93,002 | 93,484 | 43,691 | ||||||||
Total risk-based capital | $ | 589,047 | $ | 506,349 | $ | 418,369 | |||||
Total risk weighted assets determined in accordance with prescribed regulatory requirements | $ | 4,822,695 | $ | 3,757,160 | $ | 3,530,521 | |||||
Common equity tier 1 to risk weighted assets | 8.88 | % | 9.52 | % | 9.05 | % | |||||
Tier 1 capital to risk-weighted assets | 10.29 | % | 10.99 | % | 10.61 | % | |||||
Total risk-based capital to risk-weighted assets | 12.21 | % | 13.48 | % | 11.85 | % | |||||
ITEM 7A: QUANTITATIVE AND QUALITATIVE DISCLOSURES ABOUT MARKET RISK
Please refer to “Risk Factors” included in Item 1A and “Risk Management” and "Interest Rate Risk" included in Management's Discussion and Analysis under Item 7.
64
ITEM 8: FINANCIAL STATEMENTS AND SUPPLEMENTARY DATA
Enterprise Financial Services Corp and Subsidiaries
Page Number | |
Report of Independent Registered Public Accounting Firm | |
Consolidated Balance Sheets at December 31, 2017 and 2016 | |
Consolidated Statements of Operations for the years ended December 31, 2017, 2016, and 2015 | |
Consolidated Statements of Comprehensive Income for the years ended December 31, 2017, 2016, and 2015 | |
Consolidated Statements of Shareholders' Equity for the years ended December 31, 2017, 2016, and 2015 | |
Consolidated Statements of Cash Flows for the years ended December 31, 2017, 2016, and 2015 | |
Notes to Consolidated Financial Statements | |
65
REPORT OF INDEPENDENT REGISTERED PUBLIC ACCOUNTING FIRM
To the shareholders and Board of Directors of
Enterprise Financial Services Corp
Opinion on the Financial Statements
We have audited the accompanying consolidated balance sheets of Enterprise Financial Services Corp and subsidiaries (the "Company") as of December 31, 2017 and 2016, and the related consolidated statements of operations, comprehensive income, shareholders' equity, and cash flows for each of the three years in the period ended December 31, 2017 and the related notes (collectively referred to as the "financial statements"). In our opinion, the consolidated financial statements present fairly, in all material respects, the financial position of the Company as of December 31, 2017 and 2016, and the results of its operations and its cash flows for each of the three years in the period ended December 31, 2017 in conformity with accounting principles generally accepted in the United States of America.
We have also audited, in accordance with the standards of the Public Company Accounting Oversight Board (United States) (PCAOB), the Company's internal control over financial reporting as of December 31, 2017, based on criteria established in Internal Control - Integrated Framework (2013) issued by the Committee of Sponsoring Organizations of the Treadway Commission and our report dated February 23, 2018, expressed an unqualified opinion on the Company's internal control over financial reporting.
Basis for Opinion
These consolidated financial statements are the responsibility of the Company's management. Our responsibility is to express an opinion on these consolidated financial statements based on our audits. We are a public accounting firm registered with the Public Company Accounting Oversight Board (United States) (PCAOB) and are required to be independent with respect to the Company in accordance with the U.S. federal securities laws and the applicable rules and regulations of the Securities and Exchange Commission and the PCAOB.
We conducted our audits in accordance with the standards of the PCAOB. Those standards require that we plan and perform the audit to obtain reasonable assurance about whether the financial statements are free of material misstatement whether due to error or fraud. Our audits included performing procedures to assess the risks of material misstatement of the financial statements, whether due to error or fraud, and performing procedures that respond to those risks. Such procedures included examining, on a test basis, evidence supporting the amounts and disclosures in the financial statements. Our audits also included assessing the accounting principles used and significant estimates made by management, as well as evaluating the overall presentation of the financial statements. We believe that our audits provide a reasonable basis for our opinion.
/s/ Deloitte & Touche LLP
St. Louis, Missouri
February 23, 2018
We have served as the Company's auditor since 2010.
66
REPORT OF INDEPENDENT REGISTERED PUBLIC ACCOUNTING FIRM
To the shareholders and Board of Directors of
Enterprise Financial Services Corp
Opinion on Internal Control over Financial Reporting
We have audited the internal control over financial reporting of Enterprise Financial Services Corp and subsidiaries (the "Company") as of December 31, 2017, based on criteria established in Internal Control - Integrated Framework (2013) issued by the Committee of Sponsoring Organizations of the Treadway Commission (COSO). In our opinion, the Company maintained, in all material respects, effective internal control over financial reporting as of December 31, 2017, based on the criteria established in Internal Control - Integrated Framework (2013) issued by COSO.
We have also audited, in accordance with the standards of the Public Company Accounting Oversight Board (United States) (PCAOB), the consolidated financial statements as of and for the year ended December 31, 2017 of the Company and our report dated February 23, 2018 expressed an unqualified opinion on those consolidated financial statements.
Basis for Opinion
The Company's management is responsible for maintaining effective internal control over financial reporting and for its assessment of the effectiveness of internal control over financial reporting, included in the accompanying Management's Assessment on Internal Control over Financial Reporting. Our responsibility is to express an opinion on the Company's internal control over financial reporting based on our audit. We are a public accounting firm registered with the PCAOB and are required to be independent with respect to the Company in accordance with the U.S. federal securities laws and the applicable rules and regulations of the Securities and Exchange Commission and the PCAOB.
We conducted our audit in accordance with the standards of the PCAOB. Those standards require that we plan and perform the audit to obtain reasonable assurance about whether effective internal control over financial reporting was maintained in all material respects. Our audit included obtaining an understanding of internal control over financial reporting, assessing the risk that a material weakness exists, testing and evaluating the design and operating effectiveness of internal control based on the assessed risk, and performing such other procedures as we considered necessary in the circumstances. We believe that our audit provides a reasonable basis for our opinion.
Definition and Limitations of Internal Control over Financial Reporting
A company's internal control over financial reporting is a process designed by, or under the supervision of, the company's principal executive and principal financial officers, or persons performing similar functions, and effected by the company's board of directors, management, and other personnel to provide reasonable assurance regarding the reliability of financial reporting and the preparation of financial statements for external purposes in accordance with generally accepted accounting principles. A company's internal control over financial reporting includes those policies and procedures that (1) pertain to the maintenance of records that, in reasonable detail, accurately and fairly reflect the transactions and dispositions of the assets of the company; (2) provide reasonable assurance that transactions are recorded as necessary to permit preparation of financial statements in accordance with generally accepted accounting principles, and that receipts and expenditures of the company are being made only in accordance with authorizations of management and directors of the company; and (3) provide reasonable assurance regarding prevention or timely detection of unauthorized acquisition, use, or disposition of the company's assets that could have a material effect on the financial statements.
67
Because of the inherent limitations, internal control over financial reporting may not prevent or detect misstatements. Also, projections of any evaluation of the effectiveness of the internal control over financial reporting to future periods are subject to the risk that the controls may become inadequate because of changes in conditions, or that the degree of compliance with the policies or procedures may deteriorate.
/s/ Deloitte & Touche LLP
St. Louis, Missouri
February 23, 2018
68
ENTERPRISE FINANCIAL SERVICES CORP AND SUBSIDIARIES
Consolidated Balance Sheets
As of December 31, 2017 and 2016
(in thousands, except share and per share data) | December 31, 2017 | December 31, 2016 | |||||
Assets | |||||||
Cash and due from banks | $ | 91,084 | $ | 54,288 | |||
Federal funds sold | 1,223 | 446 | |||||
Interest-bearing deposits (including $1,365 and $675 pledged as collateral, respectively) | 61,016 | 144,068 | |||||
Total cash and cash equivalents | 153,323 | 198,802 | |||||
Interest-bearing deposits greater than 90 days | 2,645 | 980 | |||||
Securities available for sale | 641,382 | 460,797 | |||||
Securities held to maturity | 73,749 | 80,463 | |||||
Loans held for sale | 3,155 | 9,562 | |||||
Loans | 4,097,050 | 3,158,161 | |||||
Less: Allowance for loan losses | 42,577 | 43,409 | |||||
Total loans, net | 4,054,473 | 3,114,752 | |||||
Other real estate | 498 | 980 | |||||
Other investments, at cost | 26,661 | 14,840 | |||||
Fixed assets, net | 32,618 | 14,910 | |||||
Accrued interest receivable | 14,069 | 11,117 | |||||
State tax credits, held for sale, including $400 and $3,585 carried at fair value, respectively | 43,468 | 38,071 | |||||
Goodwill | 117,345 | 30,334 | |||||
Intangible assets, net | 11,056 | 2,151 | |||||
Other assets | 114,783 | 103,569 | |||||
Total assets | $ | 5,289,225 | $ | 4,081,328 | |||
Liabilities and Shareholders' equity | |||||||
Demand deposits | $ | 1,123,907 | $ | 866,756 | |||
Interest-bearing transaction accounts | 915,653 | 731,539 | |||||
Money market accounts | 1,342,931 | 1,050,472 | |||||
Savings | 195,150 | 111,435 | |||||
Certificates of deposit: | |||||||
Brokered | 115,306 | 117,145 | |||||
Other | 463,467 | 356,014 | |||||
Total deposits | 4,156,414 | 3,233,361 | |||||
Subordinated debentures and notes (net of debt issuance cost of $1,136 and $1,267, respectively) | 118,105 | 105,540 | |||||
Federal Home Loan Bank advances | 172,743 | — | |||||
Other borrowings | 253,674 | 276,980 | |||||
Accrued interest payable | 1,730 | 1,105 | |||||
Other liabilities | 37,986 | 77,244 | |||||
Total liabilities | 4,740,652 | 3,694,230 | |||||
Shareholders' equity: | |||||||
Preferred stock, $0.01 par value; 5,000,000 shares authorized; 0 shares issued and outstanding | — | — | |||||
Common stock, $0.01 par value; 30,000,000 shares authorized; 23,781,112 and 20,306,353 shares issued, respectively | 238 | 203 | |||||
Treasury stock, at cost; 691,673 and 261,718 shares, respectively | (23,268 | ) | (6,632 | ) | |||
Additional paid in capital | 350,061 | 213,078 | |||||
Retained earnings | 225,360 | 182,190 | |||||
Accumulated other comprehensive loss | (3,818 | ) | (1,741 | ) | |||
Total shareholders' equity | 548,573 | 387,098 | |||||
Total liabilities and shareholders' equity | $ | 5,289,225 | $ | 4,081,328 | |||
See accompanying notes to consolidated financial statements.
69
ENTERPRISE FINANCIAL SERVICES CORP AND SUBSIDIARIES
Consolidated Statements of Operations
Years ended December 31, 2017, 2016, and 2015
Years ended December 31, | |||||||||||
(in thousands, except per share data) | 2017 | 2016 | 2015 | ||||||||
Interest income: | |||||||||||
Interest and fees on loans | 185,452 | 137,738 | 122,370 | ||||||||
Interest on debt securities: | |||||||||||
Taxable | 14,551 | 9,590 | 8,842 | ||||||||
Nontaxable | 1,283 | 1,300 | 1,215 | ||||||||
Interest on interest-bearing deposits | 804 | 370 | 211 | ||||||||
Dividends on equity securities | 449 | 226 | 141 | ||||||||
Total interest income | 202,539 | 149,224 | 132,779 | ||||||||
Interest expense: | |||||||||||
Interest-bearing transaction accounts | 2,195 | 1,370 | 1,149 | ||||||||
Money market accounts | 8,708 | 4,439 | 2,993 | ||||||||
Savings accounts | 459 | 262 | 219 | ||||||||
Certificates of deposit | 5,838 | 4,770 | 6,051 | ||||||||
Subordinated debentures and notes | 5,095 | 1,894 | 1,248 | ||||||||
Federal Home Loan Bank advances | 2,356 | 555 | 127 | ||||||||
Notes payable and other borrowings | 584 | 439 | 582 | ||||||||
Total interest expense | 25,235 | 13,729 | 12,369 | ||||||||
Net interest income | 177,304 | 135,495 | 120,410 | ||||||||
Provision for portfolio loan losses | 10,764 | 5,551 | 4,872 | ||||||||
Provision reversal for purchased credit impaired loan losses | (634 | ) | (1,946 | ) | (4,414 | ) | |||||
Net interest income after provision for loan losses | 167,174 | 131,890 | 119,952 | ||||||||
Noninterest income: | |||||||||||
Service charges on deposit accounts | 11,043 | 8,615 | 7,923 | ||||||||
Wealth management revenue | 8,102 | 6,729 | 7,007 | ||||||||
Card services revenue | 5,433 | 3,130 | 2,496 | ||||||||
Gain on state tax credits, net | 2,581 | 2,647 | 2,720 | ||||||||
Gain on sale of other real estate | 93 | 1,837 | 142 | ||||||||
Gain on sale of investment securities | 22 | 86 | 23 | ||||||||
Change in FDIC loss share receivable | — | — | (5,030 | ) | |||||||
Miscellaneous income | 7,120 | 6,015 | 5,394 | ||||||||
Total noninterest income | 34,394 | 29,059 | 20,675 | ||||||||
Noninterest expense: | |||||||||||
Employee compensation and benefits | 61,388 | 49,846 | 46,095 | ||||||||
Occupancy | 9,057 | 6,889 | 6,573 | ||||||||
Data processing | 6,272 | 4,723 | 4,339 | ||||||||
Professional fees | 3,813 | 3,825 | 3,465 | ||||||||
FDIC and other insurance | 3,194 | 3,018 | 2,790 | ||||||||
Loan legal and other real estate expense | 2,220 | 1,635 | 1,812 | ||||||||
FDIC loss share termination | — | — | 2,436 | ||||||||
FDIC clawback | — | — | 760 | ||||||||
Merger related expenses | 6,462 | 1,386 | — | ||||||||
Other | 22,645 | 14,788 | 13,956 | ||||||||
Total noninterest expense | 115,051 | 86,110 | 82,226 | ||||||||
Income before income tax expense | 86,517 | 74,839 | 58,401 | ||||||||
Income tax expense | 38,327 | 26,002 | 19,951 | ||||||||
Net income | $ | 48,190 | $ | 48,837 | $ | 38,450 | |||||
Earnings per common share | |||||||||||
Basic | $ | 2.10 | $ | 2.44 | $ | 1.92 | |||||
Diluted | 2.07 | 2.41 | 1.89 | ||||||||
See accompanying notes to consolidated financial statements.
70
ENTERPRISE FINANCIAL SERVICES CORP AND SUBSIDIARIES
Consolidated Statements of Comprehensive Income
Years ended December 31, 2017, 2016, and 2015
Years ended December 31, | |||||||||||
(in thousands) | 2017 | 2016 | 2015 | ||||||||
Net income | $ | 48,190 | $ | 48,837 | $ | 38,450 | |||||
Other comprehensive loss, net of tax: | |||||||||||
Unrealized losses on investment securities arising during the period, net of income tax benefit of $1,265, $1,168, and $899, respectively | (2,064 | ) | (1,906 | ) | (1,449 | ) | |||||
Less: Reclassification adjustment for realized gains on sale of securities available for sale included in net income, net of income tax expense of $9, $33, and $9, respectively | (13 | ) | (53 | ) | (14 | ) | |||||
Total other comprehensive loss | (2,077 | ) | (1,959 | ) | (1,463 | ) | |||||
Total comprehensive income | $ | 46,113 | $ | 46,878 | $ | 36,987 | |||||
See accompanying notes to consolidated financial statements.
71
ENTERPRISE FINANCIAL SERVICES CORP AND SUBSIDIARIES
Consolidated Statements of Shareholders’ Equity
Years ended December 31, 2017, 2016, and 2015
($ in thousands, except per share data) | Common Stock | Treasury Stock | Additional paid in capital | Retained earnings | Accumulated other comprehensive income (loss) | Total shareholders' equity | |||||||||||||||||
Balance December 31, 2014 | $ | 199 | $ | (1,743 | ) | $ | 207,731 | $ | 108,373 | $ | 1,681 | $ | 316,241 | ||||||||||
Net income | — | — | — | 38,450 | — | 38,450 | |||||||||||||||||
Other comprehensive loss | — | — | — | — | (1,463 | ) | (1,463 | ) | |||||||||||||||
Cash dividends paid on common shares, $0.2625 per share | — | — | — | (5,259 | ) | — | (5,259 | ) | |||||||||||||||
Issuance under equity compensation plans, 179,600 shares, net | 2 | — | (1,192 | ) | — | — | (1,190 | ) | |||||||||||||||
Share-based compensation | — | — | 3,601 | — | — | 3,601 | |||||||||||||||||
Excess tax benefit related to equity compensation plans | — | — | 449 | — | — | 449 | |||||||||||||||||
Balance December 31, 2015 | $ | 201 | $ | (1,743 | ) | $ | 210,589 | $ | 141,564 | $ | 218 | $ | 350,829 | ||||||||||
Net income | — | — | — | 48,837 | — | 48,837 | |||||||||||||||||
Other comprehensive loss | — | — | — | — | (1,959 | ) | (1,959 | ) | |||||||||||||||
Cash dividends paid on common shares, $0.41 per share | — | — | — | (8,211 | ) | — | (8,211 | ) | |||||||||||||||
Repurchase of common shares | — | (4,889 | ) | — | — | — | (4,889 | ) | |||||||||||||||
Issuance under equity compensation plans, 213,234 shares, net | 2 | — | (2,205 | ) | — | — | (2,203 | ) | |||||||||||||||
Share-based compensation | — | — | 3,367 | — | — | 3,367 | |||||||||||||||||
Excess tax benefit related to equity compensation plans | — | — | 1,327 | — | — | 1,327 | |||||||||||||||||
Balance December 31, 2016 | $ | 203 | $ | (6,632 | ) | $ | 213,078 | $ | 182,190 | $ | (1,741 | ) | $ | 387,098 | |||||||||
Net income | — | — | — | 48,190 | — | 48,190 | |||||||||||||||||
Other comprehensive loss | — | — | — | — | (2,077 | ) | (2,077 | ) | |||||||||||||||
Cash dividends paid on common shares, $0.44 per share | — | — | — | (10,249 | ) | — | (10,249 | ) | |||||||||||||||
Repurchase of common shares | — | (16,636 | ) | — | — | — | (16,636 | ) | |||||||||||||||
Issuance under equity compensation plans, 174,895 shares, net | 2 | — | (2,911 | ) | — | — | (2,909 | ) | |||||||||||||||
Shares issued in connection with acquisition of Jefferson County Bancshares, Inc., 3,299,865 shares, net | 33 | — | 141,696 | — | — | 141,729 | |||||||||||||||||
Share-based compensation | — | — | 3,427 | — | — | 3,427 | |||||||||||||||||
Reclassification for the adoption of share-based payment guidance | — | — | (5,229 | ) | 5,229 | — | — | ||||||||||||||||
Balance December 31, 2017 | $ | 238 | $ | (23,268 | ) | $ | 350,061 | $ | 225,360 | $ | (3,818 | ) | $ | 548,573 | |||||||||
See accompanying notes to consolidated financial statements.
72
ENTERPRISE FINANCIAL SERVICES CORP AND SUBSIDIARIES
Consolidated Statements of Cash Flows
Years ended December 31, 2017, 2016, and 2015
Years ended December 31, | |||||||||||
(in thousands) | 2017 | 2016 | 2015 | ||||||||
Cash flows from operating activities: | |||||||||||
Net income | $ | 48,190 | $ | 48,837 | $ | 38,450 | |||||
Adjustments to reconcile net income to net cash provided by operating activities: | |||||||||||
Depreciation | 3,281 | 2,428 | 2,022 | ||||||||
Provision for loan losses | 10,130 | 3,605 | 458 | ||||||||
Deferred income taxes | 21,105 | 7,263 | (5,763 | ) | |||||||
Net amortization of debt securities | 2,415 | 3,225 | 3,256 | ||||||||
Amortization of intangible assets | 2,609 | 924 | 1,089 | ||||||||
Gain on sale of investment securities | (22 | ) | (86 | ) | (23 | ) | |||||
Mortgage loans originated for sale | (138,949 | ) | (157,129 | ) | (135,721 | ) | |||||
Proceeds from mortgage loans sold | 145,836 | 154,993 | 133,552 | ||||||||
Gain on sale of other real estate | (93 | ) | (1,837 | ) | (142 | ) | |||||
Gain on state tax credits, net | (2,581 | ) | (2,647 | ) | (2,720 | ) | |||||
Excess tax benefit of share-based compensation | — | (1,327 | ) | (449 | ) | ||||||
Share-based compensation | 3,427 | 3,367 | 3,601 | ||||||||
Net accretion of loan discount and indemnification asset | (5,609 | ) | (11,057 | ) | (7,805 | ) | |||||
Changes in: | |||||||||||
Accrued interest receivable | (158 | ) | (2,718 | ) | (443 | ) | |||||
Accrued interest payable | (27 | ) | 476 | (214 | ) | ||||||
Other assets | 506 | (7,739 | ) | 10,457 | |||||||
Other liabilities | (44,269 | ) | 41,943 | 7,582 | |||||||
Net cash provided by operating activities | 45,791 | 82,521 | 47,187 | ||||||||
Cash flows from investing activities: | |||||||||||
Proceeds from JCB acquisition, net of cash purchase price | 4,456 | — | — | ||||||||
Net increase in loans | (270,090 | ) | (328,023 | ) | (290,326 | ) | |||||
Net cash proceeds received from FDIC loss share receivable | — | — | 2,275 | ||||||||
Proceeds from the termination of FDIC loss share agreements | — | — | 1,253 | ||||||||
Proceeds from the sale of debt securities, available for sale | 144,076 | 2,493 | 41,069 | ||||||||
Proceeds from the paydown or maturity of debt securities, available for sale | 143,949 | 63,502 | 53,733 | ||||||||
Proceeds from the paydown or maturity of debt securities, held to maturity | 6,510 | 3,655 | 2,284 | ||||||||
Proceeds from the redemption of other investments | 43,207 | 52,279 | 39,929 | ||||||||
Proceeds from the sale of state tax credits held for sale | 15,314 | 18,757 | 16,337 | ||||||||
Proceeds from the sale of other real estate | 2,779 | 11,346 | 7,378 | ||||||||
Payments for the purchase of: | |||||||||||
Available for sale debt securities | (325,393 | ) | (81,195 | ) | (152,044 | ) | |||||
Held to maturity debt securities | — | (40,529 | ) | — | |||||||
Other investments | (56,412 | ) | (49,645 | ) | (36,046 | ) | |||||
State tax credits held for sale | (18,294 | ) | (8,201 | ) | (20,981 | ) | |||||
Fixed assets | (2,546 | ) | (2,496 | ) | (2,111 | ) | |||||
Net cash used in investing activities | (312,444 | ) | (358,057 | ) | (337,250 | ) | |||||
73
Years ended December 31, | |||||||||||
(in thousands) | 2017 | 2016 | 2015 | ||||||||
Cash flows from financing activities: | |||||||||||
Net increase in noninterest-bearing deposit accounts | 96,681 | 149,296 | 74,530 | ||||||||
Net increase in interest-bearing deposit accounts | 61,204 | 299,474 | 218,551 | ||||||||
Proceeds from the issuance of subordinated notes | — | 48,733 | — | ||||||||
Proceeds from Federal Home Loan Bank advances | 1,716,500 | 1,357,000 | 945,900 | ||||||||
Repayments of Federal Home Loan Bank advances | (1,544,000 | ) | (1,467,000 | ) | (979,900 | ) | |||||
Proceeds from notes payable | 10,000 | — | — | ||||||||
Repayments of notes payable | (10,000 | ) | — | (5,700 | ) | ||||||
Net increase (decrease) in other borrowings | (79,417 | ) | 6,654 | 36,143 | |||||||
Cash dividends paid on common stock | (10,249 | ) | (8,211 | ) | (5,259 | ) | |||||
Excess tax benefit of share-based compensation | — | 1,327 | 449 | ||||||||
Repurchase of common stock | (16,636 | ) | (4,889 | ) | — | ||||||
Payments for the issuance of equity instruments, net | (2,909 | ) | (2,203 | ) | (1,190 | ) | |||||
Net cash provided by financing activities | 221,174 | 380,181 | 283,524 | ||||||||
Net increase (decrease) in cash and cash equivalents | (45,479 | ) | 104,645 | (6,539 | ) | ||||||
Cash and cash equivalents, beginning of period | 198,802 | 94,157 | 100,696 | ||||||||
Cash and cash equivalents, end of period | $ | 153,323 | $ | 198,802 | $ | 94,157 | |||||
Supplemental disclosures of cash flow information: | |||||||||||
Cash paid during the period for: | |||||||||||
Interest | $ | 24,610 | $ | 13,253 | $ | 12,583 | |||||
Income taxes | 12,449 | 26,039 | 15,763 | ||||||||
Noncash transactions: | |||||||||||
Transfer to other real estate owned in settlement of loans | $ | 564 | $ | 2,743 | $ | 8,248 | |||||
Sales of other real estate financed | — | 140 | — | ||||||||
Common shares issued in connection with JCB acquisition | 141,729 | — | — | ||||||||
See accompanying notes to consolidated financial statements.
74
ENTERPRISE FINANCIAL SERVICES CORP AND SUBSIDIARIES
Notes to Consolidated Financial Statements
NOTE 1 - SUMMARY OF SIGNIFICANT ACCOUNTING POLICIES
The significant accounting policies used by the Company in the preparation of the consolidated financial statements are summarized below.
Business and Consolidation
Enterprise Financial Services Corp and subsidiaries (the “Company” or “Enterprise”) is a financial holding company that provides a full range of banking and wealth management services to individuals and corporate customers primarily located in the St. Louis, Kansas City, and Phoenix metropolitan markets through its banking subsidiary, Enterprise Bank & Trust (the “Bank”). The consolidated financial statements include the accounts of the Company, and its subsidiaries, all of which are wholly owned. All intercompany accounts and transactions have been eliminated.
The Company is subject to competition from other financial and nonfinancial institutions providing financial services in the markets served by the Company's subsidiary. Additionally, the Company and its banking subsidiary are subject to the regulations of certain federal and state agencies and undergo periodic examinations by those regulatory agencies. The Company has one operating segment.
Use of Estimates
The consolidated financial statements of the Company have been prepared in conformity with U.S. generally accepted accounting principles (“U.S. GAAP”). In preparing the consolidated financial statements, management is required to make estimates and assumptions, which significantly affect the reported amounts in the consolidated financial statements. Such estimates include the valuation of loans, goodwill, intangible assets, indemnification assets, and other long-lived assets, along with assumptions used in the calculation of income taxes, among others. These estimates and assumptions are based on management's best estimates and judgment. Management evaluates its estimates and assumptions on an ongoing basis using experience and other factors, including the current economic environment, which management believes to be reasonable under the circumstances. Management adjusts such estimates and assumptions when facts and circumstances dictate. Decreased real estate values, volatile credit markets, and unemployment have combined to increase the uncertainty inherent in such estimates and assumptions. As future events and their effects cannot be determined with precision, actual results could differ significantly from these estimates. Changes in those estimates resulting from continuing changes in the economic environment will be reflected in the financial statements in future periods.
Cash Flow Information
For purposes of reporting cash flows, the Company considers cash and due from banks, interest-bearing deposits and federal funds sold that mature within 90 days of the balance sheet date to be cash and cash equivalents. At December 31, 2017 and 2016, approximately $17.5 million, and $18.2 million, respectively, of cash and due from banks represented required reserves on deposits maintained by the Company in accordance with Federal Reserve Bank requirements.
Investments
The Company has classified all investments in debt securities as available for sale or held to maturity.
Securities classified as available for sale are carried at fair value. Unrealized holding gains and losses for available for sale securities are excluded from earnings and reported as a net amount in a separate component of shareholders' equity until realized. All previous fair value adjustments included in the separate component of shareholders' equity are reversed upon sale.
Securities classified as held to maturity are carried at historical cost and adjusted for amortization of premiums and accretion of discounts.
75
Declines in the fair value of securities below their cost deemed to be other-than-temporary are reflected in operations as realized losses. In estimating other-than-temporary impairment losses, management systematically evaluates investment securities for other-than-temporary declines in fair value on a quarterly basis. This analysis requires management to consider various factors, which include (1) the present value of the cash flows expected to be collected compared to the amortized cost of the security, (2) duration and magnitude of the decline in value, (3) the financial condition of the issuer or issuers, (4) structure of the security, and (5) the intent to sell the security or whether it's more likely than not the Company would be required to sell the security before its anticipated recovery in market value.
Premiums and discounts are amortized or accreted over the expected lives of the respective securities as an adjustment to yield using the interest method. Dividend and interest income is recognized when earned. Realized gains and losses are included in earnings and are derived using the specific identification method for determining the cost of securities sold.
Loans Held for Sale
The Company provides long-term financing of one-to-four-family residential real estate by originating fixed and variable rate loans. Long-term fixed and variable rate loans are sold into the secondary market with limited recourse. Upon receipt of an application for a real estate loan, the Company determines whether the loan will be sold into the secondary market or retained in the Company's loan portfolio. The interest rates on the loans sold are locked with the buyer and the Company bears no interest rate risk related to these loans. Mortgage loans held for sale are carried at the lower of cost or fair value, which is determined on a specific identification method. The Company does not retain servicing on any loans sold, nor did the Company have any capitalized mortgage servicing rights at December 31, 2017 or 2016. Gains on the sale of loans held for sale are reported net of direct origination fees and costs in the Company's consolidated statements of operations.
Portfolio Loans
Loans are reported at the principal balance outstanding, net of unearned fees, costs, and premiums or discounts on acquired loans. Loan origination fees, direct origination costs, and premiums or discounts resulting from acquired loans are deferred and recognized over the lives of the related loans as a yield adjustment using the interest method.
Interest income on loans is accrued to income based on the principal amount outstanding. The recognition of interest income is discontinued when a loan becomes 90 days past due or a significant deterioration in the borrower's credit has occurred which, in management's judgment, negatively impacts the collectibility of the loan. Unpaid interest on such loans is reversed at the time the loan becomes uncollectible and subsequent interest payments received are applied to principal if any doubt exists as to the collectibility of such principal; otherwise, such receipts are recorded as interest income. Loans that have not been restructured are returned to accrual status when management believes full collectibility of principal and interest is expected. Non-accrual loans that have been restructured will remain in a non-accrual status until the borrower has made at least six months of consecutive contractual payments.
Purchased Credit Impaired ("PCI") Loans
PCI loans were acquired in a business combination or transaction, that have evidence of deterioration of credit quality since origination and for which it is probable, at acquisition, that the Company will be unable to collect all contractually required payments receivable. PCI loans were initially recorded at fair value (as determined by the present value of expected future cash flows) with no valuation allowance. The difference between the undiscounted cash flows expected at acquisition and the investment in the loans, or the “accretable yield,” is recognized as interest income on a level-yield method over the life of the loans. Contractually required payments for interest and principal that exceed the undiscounted cash flows expected at acquisition, or the “nonaccretable difference,” are not recognized as a yield adjustment or as a loss accrual or a valuation allowance. The Company aggregates individual loans with common risk characteristics into pools of loans. Increases in expected cash flows subsequent to the initial investment are recognized prospectively through adjustment of the yield on the loans over their remaining lives. Decreases in expected cash flows due to an inability to collect contractual cash flows are recognized as impairment through the provision for loan losses account. Any allowance for loan loss on these pools reflect only losses incurred after the acquisition. Disposals of loans, including sales of loans, paydowns, payments in full or foreclosures result in the removal or reduction of the loan from the loan pool.
76
PCI loans are generally considered accruing and performing, as the loans accrete income over the estimated life of the loan, in circumstances where cash flows are reasonably estimable by management. Accordingly, PCI loans that could be contractually past due could be considered to be accruing and performing. If the timing and amount of future cash flows is not reasonably estimable or is less than the carrying value, the loans may be classified as nonaccrual loans and the purchase price discount on those loans is not recorded as interest income until the timing and amount of future cash flows can be reasonably estimable.
Impaired Loans
Loans are considered “impaired” when it becomes probable that the Company will be unable to collect all amounts due according to the loan's contractual terms. Non-accrual loans, loans past due greater than 90 days and still accruing, unless adequately secured and in the process of collection, and restructured loans qualify as “impaired loans.” Restructured loans involve the granting of a concession to a borrower experiencing financial difficulty involving the modification of terms of the loan, such as changes in payment schedule or interest rate.
When measuring impairment, the expected future cash flows of an impaired loan are discounted at the loan's effective interest rate at origination. Alternatively, impairment can be measured by reference to an observable market price, if one exists, or the fair value of the collateral for a collateral-dependent loan. Interest income on impaired loans is not accrued but is recorded when cash is received and only if principal is considered to be fully collectible. Loans and leases, which are deemed uncollectible, are charged off to the allowance for loan losses, while recoveries of amounts previously charged off are credited to the allowance for loan losses.
Impaired loans exclude PCI loans, as described above. Although, if the timing and amount of future cash flows is not reasonably estimable, the loans may be classified as nonaccrual loans and the purchase price discount on those loans is not recorded as interest income until the timing and amount of future cash flows can be reasonably estimated. See Note 5 – Loans for more information on these loans.
Loans are generally placed on non-accrual status when contractually past due 90 days or more as to interest or principal payments. Additionally, whenever management becomes aware of facts or circumstances that may adversely impact the collectability of principal or interest on loans, it is management's practice to place such loans on non-accrual status immediately, rather than delaying such action until the loans become 90 days past due. Previously accrued and uncollected interest on such loans is reversed. Income is recorded only to the extent that a determination has been made that the principal balance of the loan is collectable and the interest payments are subsequently received in cash, or for a restructured loan, the borrower has made six consecutive contractual payments. If collectability of the principal is in doubt, payments received are applied to loan principal.
Loans past due 90 days or more but still accruing interest are also generally included in nonperforming loans. Loans past due 90 days or more but still accruing are classified as such where the underlying loans are both well secured (the collateral value is sufficient to cover principal and accrued interest) and are in the process of collection. At December 31, 2017, we did not have any loans past due greater than 90 days and not included in nonperforming loans.
Loan Charge-Offs
Loans are charged-off when the primary and secondary sources of repayment (cash flow, collateral, guarantors, etc.) are less than their carrying value.
Allowance For Loan Losses
The allowance for loan losses is increased by provision charged to expense and is available to absorb charge-offs, net of recoveries. Management utilizes a systematic, documented approach in determining the appropriate level of the allowance for loan losses. The level of the allowance reflects management's continuing evaluation of industry concentrations; specific credit risks; loan loss experience; current loan portfolio quality; present economic, political and regulatory conditions; and probable losses inherent in the current loan portfolio. The determination of the appropriate level of the allowance for loan losses inherently involves a degree of subjectivity and requires that the Company make significant estimates of current credit risks and future trends, all of which may undergo material changes. Changes in economic conditions affecting borrowers, new information regarding existing loans, identification
77
of additional problem loans and other factors, both within and outside of our control, may require an increase in the allowance for loan losses.
Management believes the allowance for loan losses is adequate to absorb inherent losses in the loan portfolio. While management uses available information to recognize losses on loans, future additions to the allowance may be necessary based on changes in economic conditions and other factors. In addition, various regulatory agencies, as an integral part of the examination process, periodically review the Bank's loan portfolio. Such agencies may require additions to the allowance for loan losses based on their judgments and interpretations of information available to them at the time of their examinations.
Allowance for Loan Losses on PCI Loans
The Company updates its cash flow projections for PCI loans on a periodic basis. Assumptions utilized in this process include projections related to probability of default, loss severity, prepayment, extensions and recovery lag. Projections related to probability of default and prepayment are calculated utilizing a loan migration analysis and management's assessment of loss exposure including the fair value of underlying collateral. The loan migration analysis is a matrix that specifies the probability of a loan pool transitioning into a particular delinquency or liquidation state given its current performance at the measurement date. Loss severity factors are based upon industry data and historical experience.
Any decreases in expected cash flows after the acquisition date and subsequent measurement periods are recognized by recording an impairment in allowance for loan losses.
Other Real Estate
Other real estate represents property acquired through foreclosure or deeded to the Company in lieu of foreclosure on loans on which the borrowers have defaulted on the payment of principal or interest. Other real estate is recorded on an individual asset basis at the lower of cost or fair value less estimated costs to sell. The fair value of other real estate is based upon estimates of future cash flows, market value of similar assets, if available, or independent appraisals. These estimates involve significant uncertainties and judgments. As a result, fair value estimates may not be realizable in a current sale or settlement of the other real estate. Subsequent reductions in fair value are expensed within noninterest expense.
Gains and losses resulting from the sale of other real estate are credited or charged to current period earnings. Costs of maintaining and operating other real estate are expensed as incurred, and expenditures to complete or improve other real estate properties are capitalized if the expenditures are expected to be recovered upon ultimate sale of the property.
Fixed Assets
Buildings, leasehold improvements, furniture, fixtures, equipment, and capitalized software are stated at cost less accumulated depreciation. All categories are computed using the straight-line method over their respective estimated useful lives. Furniture, fixtures and equipment is depreciated over three to ten years, buildings and leasehold improvements over ten to forty years, and capitalized software over three years based upon estimated lives or lease obligation periods.
State Tax Credits Held for Sale
The Company has purchased the rights to receive 10-year streams of state tax credits at agreed upon discount rates and sells such tax credits to its clients and others. All state tax credits purchased prior to 2009 are accounted for at fair value. All state tax credits purchased since 2009 are accounted for at cost. The Company elected not to account for the state tax credits purchased since 2009 at fair value in order to limit the volatility of the fair value changes in the Company's consolidated statements of operations.
Cash Surrender Value of Life Insurance
The Company has purchased bank-owned life insurance policies on certain bank officers. Bank-owned life insurance is recorded at its cash surrender value. Changes in the cash surrender values are included in noninterest income.
78
Federal Home Loan Bank Stock
The Bank, as a member of the Federal Home Loan Bank of Des Moines (“FHLB”), is required to maintain an investment in the capital stock of the FHLB. The stock is redeemable at par by the FHLB, and is, therefore, carried at cost and periodically evaluated for impairment. The Company records FHLB dividends in interest income.
Goodwill and Other Intangible Assets
The Company tests goodwill for impairment on an annual basis and whenever events or changes in circumstances indicate that the Company may not be able to recover the respective asset's carrying amount. The Company's annual test for impairment was performed in the fourth quarter of December 31, 2017. Such tests involve the use of estimates and assumptions. Core deposit intangibles are amortized using an accelerated method over an estimated useful life of approximately 10 years.
Potential impairments to goodwill must first be identified by performing a qualitative assessment which evaluates relevant events or circumstances to determine whether it is more likely than not that the fair value of a reporting unit is less than its carrying amount. If this test indicates it is more likely than not that goodwill has been impaired, then a quantitative impairment test is completed. The quantitative impairment test calculates the fair value of the reporting unit and compares it with its carrying amount, including goodwill. If the carrying amount of goodwill exceeds its implied fair market value, an impairment loss is recognized. That loss is equal to the carrying amount of goodwill that is in excess of its implied fair market value.
Impairment of Long-Lived Assets
Long-lived assets, such as fixed assets and purchased intangibles subject to amortization, are reviewed for impairment whenever events or changes in circumstances indicate that the carrying amount of an asset may not be recoverable. Recoverability of assets to be held and used is measured by a comparison of the carrying amount of an asset to estimated undiscounted future cash flows expected to be generated by the asset. If the carrying amount of an asset exceeds its estimated future cash flows, an impairment charge is recognized in the amount by which the carrying amount of the asset exceeds the fair value of the asset. Assets to be disposed of are separately presented in the balance sheet and reported at the lower of the carrying amount or fair value less costs to sell, and are no longer depreciated. The assets and liabilities of a disposal group classified as held for sale are presented separately in the appropriate asset and liability sections of the balance sheet.
Derivative Financial Instruments and Hedging Activities
The Company uses derivative financial instruments to assist in the management of interest rate sensitivity and to modify the repricing, maturity and option characteristics of certain assets and liabilities. In addition, the Company also offers an interest rate hedge program that includes interest rate swaps to assist its customers in managing their interest rate risk profile. In order to eliminate the interest rate risk associated with offering these products, the Company enters into derivative contracts with third parties to offset the customer contracts.
Derivative instruments are required to be measured at fair value and recognized as either assets or liabilities in the consolidated financial statements. Fair value represents the payment the Company would receive or pay if the item were sold or bought in a current transaction. The accounting for changes in fair value (gains or losses) of a hedged item is dependent on whether the related derivative is designated and qualifies for “hedge accounting.” The Company assigns derivatives to one of these categories at the purchase date: cash flow hedge, fair value hedge, or non-designated derivatives. An assessment of the expected and ongoing hedge effectiveness of any derivative designated a fair value hedge or cash flow hedge is performed as required by the accounting standards. Derivatives are included in other assets and other liabilities in the consolidated balance sheets. Generally, the only derivative instruments used by the Company have been interest rate swaps and interest rate caps.
The Company does not currently have derivative instruments designated as fair value or cash flow hedges. Certain derivative financial instruments are not designated as cash flow or as fair value hedges for accounting purposes. These non-designated derivatives are intended to provide interest rate protection on net interest income or noninterest income but do not meet hedge accounting treatment. Customer accommodation interest rate swap contracts are not designated as hedging instruments. Changes in the fair value of these instruments are recorded in interest income or noninterest income in the consolidated statements of income depending on the underlying hedged item.
79
Income Taxes
The Company and its subsidiaries file a consolidated federal income tax return. Deferred tax assets and liabilities are recognized for the estimated future tax consequences attributable to differences between the financial statement carrying amounts of existing assets and liabilities and their respective tax bases. Deferred tax assets and liabilities are measured using enacted tax rates in effect for the year in which those temporary differences are expected to be recovered or settled. We evaluated the need for deferred tax asset valuation allowances based on a more-likely-than-not standard. The ability to realize deferred tax assets depends on the ability to generate sufficient positive taxable income within the carryback or carryforward periods provided for in the laws for each applicable taxing jurisdiction. We consider the following possible sources of taxable income: future reversal patterns of existing taxable temporary differences, future taxable income exclusive of reversing temporary differences, taxable income in prior carryback years and the availability of qualified tax planning strategies. The assessment regarding whether a valuation allowance is required or should be adjusted depends on all available positive and negative factors including, but not limited to, nature, frequency, and severity of recent losses, duration of available carryforward periods, experience with tax attributes expiring unused and near and medium term financial outlook. Because of the complexity of tax laws and regulations, interpretation can be difficult and subject to legal judgment given specific facts and circumstances. It is possible that others, given the same information, may at any point in time reach different reasonable conclusions regarding the estimated amounts of accrued taxes.
The SEC staff issued SAB 118, which provides guidance on accounting for the tax effects of the Tax Cuts and Jobs Act of 2017 (“Tax Act”). SAB 118 provides a measurement period that should not extend beyond one year from the Tax Act enactment date for companies to complete the accounting under ASC 740. In accordance with SAB 118, a company must reflect the income tax effects of those aspects of the Act for which the accounting under ASC 740 is complete. To the extent that a company’s accounting for certain income tax effects of the Tax Act is incomplete but it is able to determine a reasonable estimate, it must record a provisional estimate in the financial statements. If a company cannot determine a provisional estimate to be included in the financial statements, it should continue to apply ASC 740 on the basis of the provisions of the tax laws that were in effect immediately before the enactment of the Tax Act. The Company has recorded amounts based on the information known and reasonable estimates used as of December 31, 2017, but are subject to change based on a number of factors. The Company will complete its analysis of certain tax positions at the time it files its tax returns for the year ended December 31, 2017 and will be able to conclude if any further adjustments to the provisional estimate of the impact recorded is required.
Stock-Based Compensation
Stock-based compensation is recognized as an expense for stock options, restricted stock awards, and restricted stock units granted to employees in return for employee service. Equity classified awards are measured at the grant date fair value using either an observable market value or a valuation methodology, and recognized over the requisite service period on a straight-line basis. Forfeitures are recorded as they occur. A description of the Company's stock-based employee compensation plan is described in Note 15 - Compensation Plans.
Acquisitions and Divestitures
Acquisitions and business combinations are accounted for using the acquisition method of accounting. The assets and liabilities of the acquired entities have been recorded at their estimated fair values at the date of acquisition. Goodwill represents the excess of the purchase price over the fair value of net assets acquired, including the amount assigned to identifiable intangible assets.
The purchase price allocation process requires an estimation of the fair values of the assets acquired and the liabilities assumed. When a business combination agreement provides for an adjustment to the cost of the combination contingent on future events, the Company includes an estimate of the acquisition-date fair value as part of the cost of the combination. To determine the fair values, the Company relies on third party valuations, such as appraisals, or internal valuations based on discounted cash flow analyses or other valuation techniques. The results of operations of the acquired business are included in the Company's consolidated financial statements from the date of acquisition. Merger-related costs are costs the Company incurs to effect a business combination. In 2017, the Company changed its presentation of Merger related expenses as a separate component of Noninterest expenses on the Condensed
80
Consolidated Statements of Operations. Merger related expenses include costs directly related to merger or acquisition activity and include legal and professional fees, system consolidation and conversion costs, and compensation costs such as severance and retention incentives for employees impacted by acquisition activity. The Company accounts for merger-related costs as expenses in the periods in which the costs are incurred and the services are received.
For divestitures, the Company measures an asset (disposal group) classified as held for sale at the lower of its carrying value at the date the asset is initially classified as held for sale or its fair value less costs to sell. The Company reports the results of operations of an entity or group of components that either has been disposed of or held for sale as discontinued operations only if the disposal of that component represents a strategic shift that has or will have a major effect on an entity's operations and financial results.
Any incremental direct costs incurred to transact the sale are allocated against the gain or loss on the sale. These costs would include items like legal fees, title transfer fees, broker fees, etc. Any goodwill and intangible assets associated with the portion of the reporting unit to be disposed of is included in the carrying amount of the business in determining the gain or loss on the sale.
Basic and Diluted Earnings Per Common Share
Basic earnings per common share data is calculated by dividing net income available to common shareholders by the weighted average number of common shares outstanding during the period. Common shares outstanding include common stock and restricted stock awards where recipients have satisfied the vesting terms. Diluted earnings per common share gives effect to all dilutive potential common shares outstanding during the period using the treasury stock method.
Consolidated Statement of Comprehensive Income
The Consolidated Statement of Comprehensive Income includes the amount and the related tax impact that have been reclassified from accumulated other comprehensive income to net income. The classification adjustment for unrealized loss/gain on sale of securities included in net income has been recorded through the gain on sale of investment securities line item, within noninterest income, in the Company's Consolidated Statements of Operations.
Reclassifications
Some items in the prior year financial statements were reclassified to conform to the current presentation. In 2017, the Company changed its presentation of loans on the face of the Consolidated Balance Sheets to combine originated loans with purchased loans. See Note 5 - Loans for more information. The Company also changed its presentation of the Noninterest Income section on the face of the Consolidated Statements of Operations to separate card services revenue from other service charges and fee income. The difference was reclassified into miscellaneous income. Merger related expenses were reclassified from other expenses to be a separate component of the Noninterest Expense section on the Consolidated Statements of Operations. Reclassifications had no effect on prior year net income or shareholders' equity.
81
NOTE 2 - ACQUISITIONS & DIVESTITURES
Acquisition of Jefferson County Bancshares, Inc.
On February 10, 2017, the Company closed its acquisition of 100% of Jefferson County Bancshares, Inc. ("JCB") and its wholly-owned subsidiary, Eagle Bank and Trust Company of Missouri. JCB operated 13 full service retail and commercial banking offices in the metropolitan St. Louis area and one in Perry County, Missouri.
JCB shareholders received, based on their election, cash consideration in an amount of $85.39 per share of JCB common stock or 2.75 shares of EFSC common stock per share of JCB common stock, subject to allocation and proration procedures. Aggregate consideration at closing was 3.3 million shares of EFSC common stock and $29.3 million cash paid to JCB shareholders and holders of JCB stock options. Based on EFSC’s closing stock price of $42.95 on February 10, 2017, the overall transaction had a value of $171.0 million, including JCB’s common stock and stock options. The Company also recognized $6.5 million and $1.4 million of merger related costs that were recorded in noninterest expense in the statement of operations for the years ended December 31, 2017 and 2016, respectively.
The acquisition of JCB has been accounted for as a business combination using the acquisition method of accounting which requires assets acquired and liabilities assumed to be recognized at fair value as of the acquisition date. Goodwill of $87.0 million arising from the acquisition consists largely of the synergies and economies of scale expected from combining the operations of JCB into Enterprise. The goodwill is assigned as part of the Company's Banking reporting unit. None of the goodwill recognized is expected to be deductible for income tax purposes.
82
The following table presents the assets acquired and liabilities assumed of JCB as of February 10, 2017, and their estimated fair values:
(in thousands) | As Recorded by JCB | Adjustments | As Recorded by EFSC | ||||||||
Assets acquired: | |||||||||||
Cash and cash equivalents | $ | 33,739 | $ | — | $ | 33,739 | |||||
Interest-bearing deposits | 1,715 | — | 1,715 | ||||||||
Securities | 148,670 | — | 148,670 | ||||||||
Portfolio loans, net | 685,905 | (11,094 | ) | (a) | 674,811 | ||||||
Other real estate owned | 6,762 | (5,082 | ) | (b) | 1,680 | ||||||
Other investments | 2,695 | — | 2,695 | ||||||||
Fixed assets, net | 21,780 | (3,325 | ) | (c) | 18,455 | ||||||
Accrued interest receivable | 2,794 | — | 2,794 | ||||||||
Goodwill | 7,806 | (7,806 | ) | (d) | — | ||||||
Other intangible assets | 25 | 11,489 | (e) | 11,514 | |||||||
Deferred tax assets | 4,634 | 3,991 | (f) | 8,625 | |||||||
Other assets | 19,107 | (296 | ) | (g) | 18,811 | ||||||
Total assets acquired | $ | 935,632 | $ | (12,123 | ) | $ | 923,509 | ||||
Liabilities assumed: | |||||||||||
Deposits | $ | 764,539 | $ | 629 | (h) | $ | 765,168 | ||||
Other borrowings | 55,430 | 681 | (i) | 56,111 | |||||||
Trust preferred securities | 12,887 | (382 | ) | (j) | 12,505 | ||||||
Accrued interest payable | 653 | — | 653 | ||||||||
Other liabilities | 5,006 | 65 | 5,071 | ||||||||
Total liabilities assumed | $ | 838,515 | $ | 993 | $ | 839,508 | |||||
Net assets acquired | $ | 97,117 | $ | (13,116 | ) | $ | 84,001 | ||||
Consideration paid: | |||||||||||
Cash | $ | 29,283 | |||||||||
Common stock | 141,729 | ||||||||||
Total consideration paid | $ | 171,012 | |||||||||
Goodwill | $ | 87,011 | |||||||||
(a) | Fair value adjustments based on the Company’s evaluation of the acquired loan portfolio, write-off of net deferred loan costs, reclassification from other real estate owned, and elimination of the allowance for loan losses recorded by JCB. The fair value discount recorded to the loan portfolio is $24.7 million, inclusive of the allowance for loan losses previously recorded by JCB. |
(b) | Fair value adjustment based on the Company’s evaluation of the acquired other real estate portfolio, and reclassification to portfolio loans. |
(c) | Fair value adjustments based on the Company’s evaluation of the acquired premises and equipment. |
(d) | Eliminate JCB’s recorded goodwill. |
(e) | Record the core deposit intangible asset on the acquired core deposit accounts. Amount to be amortized using a sum of years digits method over a 10 year useful life. |
(f) | Adjustment for deferred taxes at the acquisition date. |
(g) | Fair value adjustment based on evaluation of other assets. |
(h) | Fair value adjustment to time deposits based on current interest rates. |
83
(i) | Fair value adjustment to the FHLB advances based on current interest rates. |
(j) | Fair value adjustment based on the Company's evaluation of the trust preferred securities. |
The following table provides the unaudited pro forma information for the results of operations for the twelve months ended December 31, 2017 and 2016, as if the acquisition had occurred on January 1, 2016. The pro forma results combine the historical results of JCB with the Company’s Consolidated Statements of Income, adjusted for the impact of the application of the acquisition method of accounting including loan discount accretion, intangible assets amortization, and deposit and trust preferred securities premium accretion, net of taxes. The pro forma results have been prepared for comparative purposes only and are not necessarily indicative of the results that would have been obtained had the acquisition actually occurred on January 1, 2016. No assumptions have been applied to the pro forma results of operations regarding possible revenue enhancements, expense efficiencies or asset dispositions. Only the acquisition related expenses that have been incurred as of December 31, 2017 are included in net income in the table below.
Pro Forma | |||||||
Twelve months ended December 31, | |||||||
(in thousands, except per share data) | 2017 | 2016 | |||||
Total revenues (net interest income plus noninterest income) | $ | 213,910 | $ | 199,033 | |||
Net income | 47,227 | 56,994 | |||||
Diluted earnings per common share | 2.03 | 2.42 | |||||
NOTE 3 - EARNINGS PER SHARE
The following table presents a summary of per common share data and amounts for the periods indicated.
Years ended December 31, | |||||||||||
(in thousands, except per share data) | 2017 | 2016 | 2015 | ||||||||
Net income as reported | $ | 48,190 | $ | 48,837 | $ | 38,450 | |||||
Weighted average common shares outstanding | 22,953 | 20,003 | 19,984 | ||||||||
Additional dilutive common stock equivalents | 296 | 287 | 333 | ||||||||
Weighted average diluted common shares outstanding | 23,249 | 20,290 | 20,317 | ||||||||
Basic earnings per common share: | $ | 2.10 | $ | 2.44 | $ | 1.92 | |||||
Diluted earnings per common share: | $ | 2.07 | $ | 2.41 | $ | 1.89 | |||||
There were no common stock equivalents for fiscal years 2017, and 2016, and 0.1 million common stock equivalents for fiscal year 2015, which were excluded from the earnings per share calculation because their effect was anti-dilutive.
84
NOTE 4 - INVESTMENTS
The following table presents the amortized cost, gross unrealized gains and losses and fair value of securities available for sale and held to maturity:
December 31, 2017 | |||||||||||||||
(in thousands) | Amortized Cost | Gross Unrealized Gains | Gross Unrealized Losses | Fair Value | |||||||||||
Available for sale securities: | |||||||||||||||
Obligations of U.S. Government-sponsored enterprises | $ | 99,878 | $ | 6 | $ | (660 | ) | $ | 99,224 | ||||||
Obligations of states and political subdivisions | 34,181 | 674 | (213 | ) | 34,642 | ||||||||||
Agency mortgage-backed securities | 513,082 | 727 | (6,293 | ) | 507,516 | ||||||||||
Total securities available for sale | $ | 647,141 | $ | 1,407 | $ | (7,166 | ) | $ | 641,382 | ||||||
Held to maturity securities: | |||||||||||||||
Obligations of states and political subdivisions | $ | 14,031 | $ | 69 | $ | (46 | ) | $ | 14,054 | ||||||
Agency mortgage-backed securities | 59,718 | 16 | (330 | ) | 59,404 | ||||||||||
Total securities held to maturity | $ | 73,749 | $ | 85 | $ | (376 | ) | $ | 73,458 | ||||||
December 31, 2016 | |||||||||||||||
(in thousands) | Amortized Cost | Gross Unrealized Gains | Gross Unrealized Losses | Fair Value | |||||||||||
Available for sale securities: | |||||||||||||||
Obligations of U.S. Government-sponsored enterprises | $ | 107,312 | $ | 348 | $ | — | $ | 107,660 | |||||||
Obligations of states and political subdivisions | 36,486 | 630 | (485 | ) | 36,631 | ||||||||||
Agency mortgage-backed securities | 319,345 | 1,101 | (3,940 | ) | 316,506 | ||||||||||
Total securities available for sale | $ | 463,143 | $ | 2,079 | $ | (4,425 | ) | $ | 460,797 | ||||||
Held to maturity securities: | |||||||||||||||
Obligations of states and political subdivisions | $ | 14,759 | $ | 11 | $ | (242 | ) | $ | 14,528 | ||||||
Agency mortgage-backed securities | 65,704 | 45 | (638 | ) | 65,111 | ||||||||||
Total securities held to maturity | $ | 80,463 | $ | 56 | $ | (880 | ) | $ | 79,639 | ||||||
At December 31, 2017, and 2016, there were no holdings of securities of any one issuer in an amount greater than 10% of shareholders’ equity, other than the U.S. Government agencies and sponsored enterprises. The agency mortgage-backed securities are all issued by U.S. Government-sponsored enterprises. Securities having a fair value of $500.0 million and $407.3 million at December 31, 2017, and December 31, 2016, respectively, were pledged as collateral to secure deposits of public institutions and for other purposes as required by law or contract provisions.
85
The amortized cost and estimated fair value of debt securities at December 31, 2017, by contractual maturity, are shown below. Expected maturities may differ from contractual maturities because borrowers may have the right to call or prepay obligations with or without call or prepayment penalties. The weighted average life of the agency mortgage-backed securities is approximately 4 years.
Available for sale | Held to maturity | ||||||||||||||
(in thousands) | Amortized Cost | Estimated Fair Value | Amortized Cost | Estimated Fair Value | |||||||||||
Due in one year or less | $ | 3,060 | $ | 3,076 | $ | — | $ | — | |||||||
Due after one year through five years | 110,910 | 110,480 | 186 | 195 | |||||||||||
Due after five years through ten years | 14,573 | 14,980 | 12,977 | 12,981 | |||||||||||
Due after ten years | 5,516 | 5,330 | 868 | 878 | |||||||||||
Agency mortgage-backed securities | 513,082 | 507,516 | 59,718 | 59,404 | |||||||||||
$ | 647,141 | $ | 641,382 | $ | 73,749 | $ | 73,458 | ||||||||
The following table represents a summary of investment securities that had an unrealized loss:
December 31, 2017 | |||||||||||||||||||||||
Less than 12 months | 12 months or more | Total | |||||||||||||||||||||
(in thousands) | Fair Value | Unrealized Losses | Fair Value | Unrealized Losses | Fair Value | Unrealized Losses | |||||||||||||||||
Obligations of U.S. Government-sponsored enterprises | $ | 89,309 | $ | 660 | $ | — | $ | — | $ | 89,309 | $ | 660 | |||||||||||
Obligations of states and political subdivisions | 13,951 | 259 | — | — | 13,951 | 259 | |||||||||||||||||
Agency mortgage-backed securities | 469,655 | 6,034 | 12,229 | 589 | 481,884 | 6,623 | |||||||||||||||||
$ | 572,915 | $ | 6,953 | $ | 12,229 | $ | 589 | $ | 585,144 | $ | 7,542 | ||||||||||||
December 31, 2016 | |||||||||||||||||||||||
Less than 12 months | 12 months or more | Total | |||||||||||||||||||||
(in thousands) | Fair Value | Unrealized Losses | Fair Value | Unrealized Losses | Fair Value | Unrealized Losses | |||||||||||||||||
Obligations of states and political subdivisions | $ | 21,361 | $ | 408 | $ | 3,553 | $ | 320 | $ | 24,914 | $ | 728 | |||||||||||
Agency mortgage-backed securities | 267,734 | 4,084 | 12,883 | 493 | 280,617 | 4,577 | |||||||||||||||||
$ | 289,095 | $ | 4,492 | $ | 16,436 | $ | 813 | $ | 305,531 | $ | 5,305 | ||||||||||||
The unrealized losses at both December 31, 2017, and 2016, were primarily attributable to changes in market interest rates since the securities were purchased. Management systematically evaluates investment securities for other-than-temporary declines in fair value on a quarterly basis. This analysis requires management to consider various factors, which include among other considerations (1) the present value of the cash flows expected to be collected compared to the amortized cost of the security, (2) duration and magnitude of the decline in value, (3) the financial condition of the issuer or issuers, (4) structure of the security, and (5) the intent to sell the security or whether it is more likely than not that the Company would be required to sell the security before its anticipated recovery in market value. At December 31, 2017 and 2016, management performed its quarterly analysis of all securities with an unrealized loss and concluded no individual securities were other-than-temporarily impaired.
86
The gross gains and losses realized from sales of available for sale investment securities were as follows:
December 31, | |||||||||||
(in thousands) | 2017 | 2016 | 2015 | ||||||||
Gross gains realized | $ | 22 | $ | 86 | $ | 63 | |||||
Gross losses realized | — | — | (40 | ) | |||||||
Proceeds from sales | 144,076 | 2,493 | 41,069 | ||||||||
Other Investments, At Cost
At December 31, 2017, and 2016, other investments, at cost, totaled $26.7 million, and $14.8 million, respectively. As a member of the FHLB system administered by the Federal Housing Finance Agency, the Bank is required to maintain a minimum investment in capital stock with the FHLB Des Moines consisting of membership stock and activity-based stock. The FHLB capital stock of $12.9 million, and $4.4 million at December 31, 2017, and 2016, respectively, is recorded at cost, which represents redemption value, and is included in other investments in the consolidated balance sheets. The remaining amounts in other investments include various investments in SBICs and the Company's investment in unconsolidated trusts used to issue preferred securities to third parties (see Note 10 – Subordinated Debentures).
87
NOTE 5 - LOANS
The loan portfolio is comprised of loans originated by the Company and loans that were acquired in connection with the Company’s acquisitions. These loans are accounted for using the guidance in the Accounting Standards Codification (ASC) section 310-30 and 310-20. Loans accounted for using ASC 310-30 are sometimes referred to as purchased credit impaired, or PCI, loans.
The table below shows the loan portfolio composition including carrying value by segment of loans accounted for at amortized cost, which includes our originated loans, and loans accounted for as PCI.
(in thousands) | December 31, 2017 | December 31, 2016 | |||||
Loans accounted for at amortized cost | $ | 4,022,896 | $ | 3,118,392 | |||
Loans accounted for as PCI | 74,154 | 39,769 | |||||
Total loans | $ | 4,097,050 | $ | 3,158,161 | |||
The following tables refer to loans not accounted for as PCI loans.
Below is a summary of loans by category at December 31, 2017 and 2016:
(in thousands) | December 31, 2017 | December 31, 2016 | |||||
Commercial and industrial | $ | 1,918,720 | $ | 1,632,714 | |||
Real estate loans: | |||||||
Commercial - investor owned | 769,275 | 544,808 | |||||
Commercial - owner occupied | 554,589 | 350,148 | |||||
Construction and land development | 303,091 | 194,542 | |||||
Residential | 341,312 | 240,760 | |||||
Total real estate loans | 1,968,267 | 1,330,258 | |||||
Consumer and other | 137,234 | 156,182 | |||||
Loans, before unearned loan (fees) costs | 4,024,221 | 3,119,154 | |||||
Unearned loan (fees) costs, net | (1,325 | ) | (762 | ) | |||
Loans, including unearned loan fees | $ | 4,022,896 | $ | 3,118,392 | |||
Following is a summary of activity for the years ended December 31, 2017, 2016, and 2015 of loans to executive officers and directors, or to entities in which such individuals had beneficial interests as a shareholder, officer, or director. Such loans were made in the normal course of business on substantially the same terms, including interest rates and collateral, as those prevailing at the time for comparable transactions with other customers and did not involve more than the normal risk of collectibility.
(in thousands) | December 31, 2017 | December 31, 2016 | December 31, 2015 | ||||||||
Balance at beginning of year | $ | 15,406 | $ | 4,394 | $ | 13,513 | |||||
New loans and advances | 1,353 | 11,539 | 641 | ||||||||
Payments and other reductions | (11,410 | ) | (527 | ) | (9,760 | ) | |||||
Balance at end of year | $ | 5,349 | $ | 15,406 | $ | 4,394 | |||||
88
A summary of activity in the allowance for loan losses and the recorded investment in loans by class and category based on impairment method for the years ended indicated below is as follows:
(in thousands) | Commercial and industrial | CRE - investor owned | CRE - owner occupied | Construction and land development | Residential real estate | Consumer and other | Total | ||||||||||||||||||||
Balance at December 31, 2017 | |||||||||||||||||||||||||||
Allowance for loan losses: | |||||||||||||||||||||||||||
Balance, beginning of year | $ | 26,996 | $ | 3,420 | $ | 2,890 | $ | 1,304 | $ | 2,023 | $ | 932 | $ | 37,565 | |||||||||||||
Provision (provision reversal) | 8,737 | 456 | 404 | 336 | 797 | 34 | 10,764 | ||||||||||||||||||||
Losses charged off | (9,872 | ) | (117 | ) | (90 | ) | (254 | ) | (973 | ) | (201 | ) | (11,507 | ) | |||||||||||||
Recoveries | 545 | 131 | 104 | 101 | 390 | 73 | 1,344 | ||||||||||||||||||||
Balance, end of year | $ | 26,406 | $ | 3,890 | $ | 3,308 | $ | 1,487 | $ | 2,237 | $ | 838 | $ | 38,166 | |||||||||||||
Balance at December 31, 2016 | |||||||||||||||||||||||||||
Allowance for loan losses: | |||||||||||||||||||||||||||
Balance, beginning of year | $ | 22,056 | $ | 3,484 | $ | 2,969 | $ | 1,704 | $ | 1,796 | $ | 1,432 | $ | 33,441 | |||||||||||||
Provision (provision reversal) | 6,569 | (11 | ) | (1,202 | ) | (1,334 | ) | 129 | 1,400 | 5,551 | |||||||||||||||||
Losses charged off | (2,303 | ) | (95 | ) | — | — | (25 | ) | (1,912 | ) | (4,335 | ) | |||||||||||||||
Recoveries | 674 | 42 | 1,123 | 934 | 123 | 12 | 2,908 | ||||||||||||||||||||
Balance, end of year | $ | 26,996 | $ | 3,420 | $ | 2,890 | $ | 1,304 | $ | 2,023 | $ | 932 | $ | 37,565 | |||||||||||||
Balance at December 31, 2015 | |||||||||||||||||||||||||||
Allowance for loan losses: | |||||||||||||||||||||||||||
Balance, beginning of year | $ | 16,983 | $ | 4,382 | $ | 3,135 | $ | 1,715 | $ | 2,830 | $ | 1,140 | $ | 30,185 | |||||||||||||
Provision (provision reversal) | 6,976 | (303 | ) | (1,626 | ) | (335 | ) | (58 | ) | 218 | 4,872 | ||||||||||||||||
Losses charged off | (3,699 | ) | (664 | ) | (38 | ) | (350 | ) | (1,313 | ) | (27 | ) | (6,091 | ) | |||||||||||||
Recoveries | 1,796 | 69 | 1,498 | 674 | 337 | 101 | 4,475 | ||||||||||||||||||||
Balance, end of year | $ | 22,056 | $ | 3,484 | $ | 2,969 | $ | 1,704 | $ | 1,796 | $ | 1,432 | $ | 33,441 | |||||||||||||
(in thousands) | Commercial and industrial | CRE - investor owned | CRE - owner occupied | Construction and land development | Residential real estate | Consumer and other | Total | ||||||||||||||||||||
Balance December 31, 2017 | |||||||||||||||||||||||||||
Allowance for loan losses - Ending balance: | |||||||||||||||||||||||||||
Individually evaluated for impairment | $ | 2,508 | $ | — | $ | 71 | $ | — | $ | — | $ | — | $ | 2,579 | |||||||||||||
Collectively evaluated for impairment | 23,898 | 3,890 | 3,237 | 1,487 | 2,237 | 838 | 35,587 | ||||||||||||||||||||
Total | $ | 26,406 | $ | 3,890 | $ | 3,308 | $ | 1,487 | $ | 2,237 | $ | 838 | $ | 38,166 | |||||||||||||
Loans - Ending balance: | |||||||||||||||||||||||||||
Individually evaluated for impairment | $ | 12,665 | $ | 422 | $ | 1,975 | $ | 136 | $ | 1,602 | $ | 375 | $ | 17,175 | |||||||||||||
Collectively evaluated for impairment | 1,906,055 | 768,853 | 552,614 | 302,955 | 339,710 | 135,534 | 4,005,721 | ||||||||||||||||||||
Total | $ | 1,918,720 | $ | 769,275 | $ | 554,589 | $ | 303,091 | $ | 341,312 | $ | 135,909 | $ | 4,022,896 | |||||||||||||
Balance December 31, 2016 | |||||||||||||||||||||||||||
Allowance for loan losses - Ending balance: | |||||||||||||||||||||||||||
Individually evaluated for impairment | $ | 2,909 | $ | — | $ | — | $ | 155 | $ | — | $ | — | $ | 3,064 | |||||||||||||
Collectively evaluated for impairment | 24,087 | 3,420 | 2,890 | 1,149 | 2,023 | 932 | 34,501 | ||||||||||||||||||||
Total | $ | 26,996 | $ | 3,420 | $ | 2,890 | $ | 1,304 | $ | 2,023 | $ | 932 | $ | 37,565 | |||||||||||||
Loans - Ending balance: | |||||||||||||||||||||||||||
Individually evaluated for impairment | $ | 12,523 | $ | 430 | $ | 1,854 | $ | 1,903 | $ | 62 | $ | — | $ | 16,772 | |||||||||||||
Collectively evaluated for impairment | 1,620,191 | 544,378 | 348,294 | 192,639 | 240,698 | 155,420 | 3,101,620 | ||||||||||||||||||||
Total | $ | 1,632,714 | $ | 544,808 | $ | 350,148 | $ | 194,542 | $ | 240,760 | $ | 155,420 | $ | 3,118,392 | |||||||||||||
89
A summary of nonperforming loans individually evaluated for impairment by category at December 31, 2017 and 2016, and the income recognized on impaired loans is as follows:
December 31, 2017 | |||||||||||||||||||||||
(in thousands) | Unpaid Contractual Principal Balance | Recorded Investment With No Allowance | Recorded Investment With Allowance | Total Recorded Investment | Related Allowance | Average Recorded Investment | |||||||||||||||||
Commercial and industrial | $ | 20,750 | $ | 2,321 | $ | 10,344 | $ | 12,665 | $ | 2,508 | $ | 16,270 | |||||||||||
Real estate: | |||||||||||||||||||||||
Commercial - investor owned | 560 | 422 | — | 422 | — | 521 | |||||||||||||||||
Commercial - owner occupied | 487 | — | 487 | 487 | 71 | 490 | |||||||||||||||||
Construction and land development | 441 | 136 | — | 136 | — | 331 | |||||||||||||||||
Residential | 1,730 | 1,602 | — | 1,602 | — | 1,735 | |||||||||||||||||
Consumer and other | 375 | 375 | — | 375 | — | 375 | |||||||||||||||||
Total | $ | 24,343 | $ | 4,856 | $ | 10,831 | $ | 15,687 | $ | 2,579 | $ | 19,722 | |||||||||||
December 31, 2016 | |||||||||||||||||||||||
(in thousands) | Unpaid Contractual Principal Balance | Recorded Investment With No Allowance | Recorded Investment With Allowance | Total Recorded Investment | Related Allowance | Average Recorded Investment | |||||||||||||||||
Commercial and industrial | $ | 12,341 | $ | 566 | $ | 11,791 | $ | 12,357 | $ | 2,909 | $ | 4,489 | |||||||||||
Real estate: | |||||||||||||||||||||||
Commercial - investor owned | 525 | 435 | — | 435 | — | 668 | |||||||||||||||||
Commercial - owner occupied | 225 | 231 | — | 231 | — | 227 | |||||||||||||||||
Construction and land development | 1,904 | 1,947 | 359 | 2,306 | 155 | 1,918 | |||||||||||||||||
Residential | 62 | 62 | — | 62 | — | 64 | |||||||||||||||||
Consumer and other | — | — | — | — | — | — | |||||||||||||||||
Total | $ | 15,057 | $ | 3,241 | $ | 12,150 | $ | 15,391 | $ | 3,064 | $ | 7,366 | |||||||||||
December 31, | |||||||||||
(in thousands) | 2017 | 2016 | 2015 | ||||||||
Total interest income that would have been recognized under original terms on impaired loans | $ | 1,324 | $ | 1,079 | $ | 1,038 | |||||
Total cash received and recognized as interest income on impaired loans | 643 | 251 | 226 | ||||||||
Total interest income recognized on impaired loans still accruing | 63 | 155 | 36 | ||||||||
There were no loans over 90 days past due and still accruing interest at December 31, 2017 or 2016.
90
The recorded investment in nonperforming loans by category at December 31, 2017 and 2016, is as follows:
December 31, 2017 | |||||||||||
(in thousands) | Non-accrual | Restructured, not on non-accrual | Total | ||||||||
Commercial and industrial | $ | 11,946 | $ | 719 | $ | 12,665 | |||||
Real estate: | |||||||||||
Commercial - investor owned | 422 | — | 422 | ||||||||
Commercial - owner occupied | 487 | — | 487 | ||||||||
Construction and land development | 136 | — | 136 | ||||||||
Residential | 1,602 | — | 1,602 | ||||||||
Consumer and other | 375 | — | 375 | ||||||||
Total | $ | 14,968 | $ | 719 | $ | 15,687 | |||||
December 31, 2016 | |||||||||||
(in thousands) | Non-accrual | Restructured, not on non-accrual | Total | ||||||||
Commercial and industrial | $ | 10,046 | $ | 2,311 | $ | 12,357 | |||||
Real estate: | |||||||||||
Commercial - investor owned | 435 | — | 435 | ||||||||
Commercial - owner occupied | 231 | — | 231 | ||||||||
Construction and land development | 2,286 | 20 | 2,306 | ||||||||
Residential | 62 | — | 62 | ||||||||
Consumer and other | — | — | — | ||||||||
Total | $ | 13,060 | $ | 2,331 | $ | 15,391 | |||||
The recorded investment by category for the portfolio loans that have been restructured during the years ended December 31, 2017 and 2016, is as follows:
Year ended December 31, 2017 | Year ended December 31, 2016 | ||||||||||||||||||||
(in thousands, except for number of loans) | Number of Loans | Pre-Modification Outstanding Recorded Balance | Post-Modification Outstanding Recorded Balance | Number of Loans | Pre-Modification Outstanding Recorded Balance | Post-Modification Outstanding Recorded Balance | |||||||||||||||
Commercial and industrial | 1 | $ | 676 | $ | 676 | 4 | $ | 12,114 | $ | 12,114 | |||||||||||
Real estate: | |||||||||||||||||||||
Commercial - investor owned | — | — | — | 1 | 248 | 248 | |||||||||||||||
Commercial - owner occupied | — | — | — | 1 | 13 | 13 | |||||||||||||||
Construction and land development | — | — | — | 1 | 20 | 20 | |||||||||||||||
Residential | — | — | — | — | — | — | |||||||||||||||
Consumer and other | — | — | — | — | — | — | |||||||||||||||
Total | 1 | $ | 676 | $ | 676 | 7 | $ | 12,395 | $ | 12,395 | |||||||||||
The restructured portfolio loans primarily resulted from interest rate concessions and changing the terms of the loans. As of December 31, 2017, the Company allocated no specific reserves to loans that have been restructured.
91
Portfolio loans restructured that subsequently defaulted during the year ended December 31, 2017, and 2016, are as follows:
Year ended December 31, 2017 | Year ended December 31, 2016 | ||||||||||
(in thousands, except for number of loans) | Number of Loans | Recorded Balance | Number of Loans | Recorded Balance | |||||||
Commercial and industrial | 2 | 343 | — | — | |||||||
Real Estate: | |||||||||||
Residential | 1 | 5 | — | — | |||||||
Total | 3 | 348 | — | — | |||||||
The aging of the recorded investment in past due portfolio loans by portfolio class and category at December 31, 2017 and 2016 is shown below:
December 31, 2017 | |||||||||||||||||||
(in thousands) | 30-89 Days Past Due | 90 or More Days Past Due | Total Past Due | Current | Total | ||||||||||||||
Commercial and industrial | $ | 7,882 | $ | 1,770 | $ | 9,652 | $ | 1,909,068 | $ | 1,918,720 | |||||||||
Real estate: | |||||||||||||||||||
Commercial - investor owned | 934 | — | 934 | 768,341 | 769,275 | ||||||||||||||
Commercial - owner occupied | — | — | — | 554,589 | 554,589 | ||||||||||||||
Construction and land development | 76 | — | 76 | 303,015 | 303,091 | ||||||||||||||
Residential | 1,529 | 945 | 2,474 | 338,838 | 341,312 | ||||||||||||||
Consumer and other | 407 | — | 407 | 135,502 | 135,909 | ||||||||||||||
Total | $ | 10,828 | $ | 2,715 | $ | 13,543 | $ | 4,009,353 | $ | 4,022,896 | |||||||||
December 31, 2016 | |||||||||||||||||||
(in thousands) | 30-89 Days Past Due | 90 or More Days Past Due | Total Past Due | Current | Total | ||||||||||||||
Commercial and industrial | $ | 334 | $ | 171 | $ | 505 | $ | 1,632,209 | $ | 1,632,714 | |||||||||
Real estate: | |||||||||||||||||||
Commercial - investor owned | — | 175 | 175 | 544,633 | 544,808 | ||||||||||||||
Commercial - owner occupied | 212 | 225 | 437 | 349,711 | 350,148 | ||||||||||||||
Construction and land development | 355 | 1,528 | 1,883 | 192,659 | 194,542 | ||||||||||||||
Residential | 91 | — | 91 | 240,669 | 240,760 | ||||||||||||||
Consumer and other | 7 | — | 7 | 155,413 | 155,420 | ||||||||||||||
Total | $ | 999 | $ | 2,099 | $ | 3,098 | $ | 3,115,294 | $ | 3,118,392 | |||||||||
The Company categorizes loans into risk categories based on relevant information about the ability of borrowers to service their debt, such as current financial information, historical payment experience, credit documentation, and current economic factors among other factors. This analysis is performed on a quarterly basis. The Company uses the following definitions for risk ratings:
• | Grades 1, 2, and 3 – Includes loans to borrowers with a continuous record of strong earnings, sound balance sheet condition and capitalization, ample liquidity with solid cash flow, and whose management team has experience and depth within their industry. |
• | Grade 4 – Includes loans to borrowers with positive trends in profitability, satisfactory capitalization and balance sheet condition, and sufficient liquidity and cash flow. |
• | Grade 5 – Includes loans to borrowers that may display fluctuating trends in sales, profitability, capitalization, liquidity, and cash flow. |
92
• | Grade 6 – Includes loans to borrowers where an adverse change or perceived weakness has occurred, but may be correctable in the near future. Alternatively, this rating category may also include circumstances where the borrower is starting to reverse a negative trend or condition, or has recently been upgraded from a 7, 8, or 9 rating. |
• | Grade 7 – Watch credits are borrowers that have experienced financial setback of a nature that is not determined to be severe or influence ‘ongoing concern’ expectations. Although possible, no loss is anticipated, due to strong collateral and/or guarantor support. |
• | Grade 8 – Substandard credits will include those borrowers characterized by significant losses and sustained downward trends in balance sheet condition, liquidity, and cash flow. Repayment reliance may have shifted to secondary sources. Collateral exposure may exist and additional reserves may be warranted. |
• | Grade 9 – Doubtful credits include borrowers that may show deteriorating trends that are unlikely to be corrected. Collateral values may appear insufficient for full recovery, therefore requiring a partial charge-off, or debt renegotiation with the borrower. The borrower may have declared bankruptcy or bankruptcy is likely in the near term. All doubtful rated credits will be on non-accrual. |
The recorded investment by risk category of the loans by portfolio class and category at December 31, 2017 and December 31, 2016 is as follows:
December 31, 2017 | |||||||||||||||
(in thousands) | Pass (1-6) | Watch (7) | Substandard (8) | Total | |||||||||||
Commercial and industrial | $ | 1,769,102 | $ | 94,002 | $ | 55,616 | $ | 1,918,720 | |||||||
Real estate: | |||||||||||||||
Commercial - investor owned | 754,010 | 10,840 | 4,425 | 769,275 | |||||||||||
Commercial - owner occupied | 514,616 | 34,440 | 5,533 | 554,589 | |||||||||||
Construction and land development | 292,766 | 9,983 | 342 | 303,091 | |||||||||||
Residential | 329,742 | 3,648 | 7,922 | 341,312 | |||||||||||
Consumer and other | 134,704 | 10 | 1,195 | 135,909 | |||||||||||
Total | $ | 3,794,940 | $ | 152,923 | $ | 75,033 | $ | 4,022,896 | |||||||
December 31, 2016 | |||||||||||||||
(in thousands) | Pass (1-6) | Watch (7) | Substandard (8) | Total | |||||||||||
Commercial and industrial | $ | 1,499,114 | $ | 57,416 | $ | 76,184 | $ | 1,632,714 | |||||||
Real estate: | |||||||||||||||
Commercial - investor owned | 530,494 | 10,449 | 3,865 | 544,808 | |||||||||||
Commercial - owner occupied | 306,658 | 39,249 | 4,241 | 350,148 | |||||||||||
Construction and land development | 185,505 | 6,575 | 2,462 | 194,542 | |||||||||||
Residential | 233,479 | 2,997 | 4,284 | 240,760 | |||||||||||
Consumer and other | 153,984 | — | 1,436 | 155,420 | |||||||||||
Total | $ | 2,909,234 | $ | 116,686 | $ | 92,472 | $ | 3,118,392 | |||||||
93
Below is a summary of PCI loans by category at December 31, 2017 and 2016:
December 31, 2017 | December 31, 2016 | ||||||||
($ in thousands) | Weighted- Average Risk Rating1 | Recorded Investment PCI Loans | Weighted- Average Risk Rating1 | Recorded Investment PCI Loans | |||||
Commercial and industrial | 6.38 | $ | 3,212 | 5.87 | $ | 3,523 | |||
Real estate loans: | |||||||||
Commercial - investor owned | 7.36 | 42,887 | 6.95 | 8,162 | |||||
Commercial - owner occupied | 6.48 | 11,332 | 6.39 | 11,863 | |||||
Construction and land development | 5.99 | 5,883 | 5.80 | 4,365 | |||||
Residential | 5.99 | 10,781 | 5.64 | 11,792 | |||||
Total real estate loans | 70,883 | 36,182 | |||||||
Consumer and other | 2.84 | 59 | 1.64 | 64 | |||||
Purchased credit impaired loans | $ | 74,154 | $ | 39,769 | |||||
(1) Risk ratings are based on the borrower's contractual obligation, which is not reflective of the purchase discount. | |||||||||
The aging of the recorded investment in past due PCI loans by portfolio class and category at December 31, 2017 and 2016 is shown below:
December 31, 2017 | |||||||||||||||||||
(in thousands) | 30-89 Days Past Due | 90 or More Days Past Due | Total Past Due | Current | Total | ||||||||||||||
Commercial and industrial | $ | — | $ | — | $ | — | $ | 3,212 | $ | 3,212 | |||||||||
Real estate: | |||||||||||||||||||
Commercial - investor owned | — | 3,034 | 3,034 | 39,853 | 42,887 | ||||||||||||||
Commercial - owner occupied | — | 673 | 673 | 10,659 | 11,332 | ||||||||||||||
Construction and land development | — | — | — | 5,883 | 5,883 | ||||||||||||||
Residential | 328 | 255 | 583 | 10,198 | 10,781 | ||||||||||||||
Consumer and other | — | — | — | 59 | 59 | ||||||||||||||
Total | $ | 328 | $ | 3,962 | $ | 4,290 | $ | 69,864 | $ | 74,154 | |||||||||
December 31, 2016 | |||||||||||||||||||
(in thousands) | 30-89 Days Past Due | 90 or More Days Past Due | Total Past Due | Current | Total | ||||||||||||||
Commercial and industrial | $ | — | $ | — | $ | — | $ | 3,523 | $ | 3,523 | |||||||||
Real estate: | |||||||||||||||||||
Commercial - investor owned | — | — | — | 8,162 | 8,162 | ||||||||||||||
Commercial - owner occupied | — | — | — | 11,863 | 11,863 | ||||||||||||||
Construction and land development | — | — | — | 4,365 | 4,365 | ||||||||||||||
Residential | 169 | 51 | 220 | 11,572 | 11,792 | ||||||||||||||
Consumer and other | — | — | — | 64 | 64 | ||||||||||||||
Total | $ | 169 | $ | 51 | $ | 220 | $ | 39,549 | $ | 39,769 | |||||||||
94
The following table is a rollforward of PCI loans, net of the allowance for loan losses, for the years ended December 31, 2017 and 2016.
(in thousands) | Contractual Cashflows | Non-accretable Difference | Accretable Yield | Carrying Amount | |||||||||||
Balance January 1, 2017 | $ | 66,003 | $ | 18,902 | $ | 13,176 | $ | 33,925 | |||||||
Acquisitions | 68,763 | 14,296 | 5,312 | 49,155 | |||||||||||
Principal reductions and interest payments | (24,530 | ) | — | — | (24,530 | ) | |||||||||
Accretion of loan discount | — | — | (7,573 | ) | 7,573 | ||||||||||
Changes in contractual and expected cash flows due to remeasurement | 13,978 | (1,465 | ) | 5,486 | 9,957 | ||||||||||
Reductions due to disposals | (11,503 | ) | (2,727 | ) | (2,439 | ) | (6,337 | ) | |||||||
Balance December 31, 2017 | $ | 112,711 | $ | 29,006 | $ | 13,962 | $ | 69,743 | |||||||
Balance January 1, 2016 | $ | 116,689 | $ | 26,765 | $ | 25,341 | $ | 64,583 | |||||||
Principal reductions and interest payments | (25,669 | ) | — | — | (25,669 | ) | |||||||||
Accretion of loan discount | — | — | (6,155 | ) | 6,155 | ||||||||||
Changes in contractual and expected cash flows due to remeasurement | 11,718 | 766 | (1,500 | ) | 12,452 | ||||||||||
Reductions due to disposals | (36,735 | ) | (8,629 | ) | (4,510 | ) | (23,596 | ) | |||||||
Balance December 31, 2016 | $ | 66,003 | $ | 18,902 | $ | 13,176 | $ | 33,925 | |||||||
The accretable yield is recognized in interest income over the estimated life of the acquired loans using the effective
yield method.
Outstanding customer balances on PCI loans were $94.9 million and $54.6 million as of December 31, 2017, and December 31, 2016, respectively.
On December 7, 2015, the Company entered into an agreement to terminate all existing loss share agreements with the FDIC. Under the terms of the agreement, the FDIC made a net payment to the bank of $1.3 million. The agreement eliminated the FDIC clawback liability of $3.5 million and the FDIC loss share receivable of $7.2 million. Accordingly, a pretax charge of $2.4 million was recorded in 2015 as a separate component of noninterest expense.
95
NOTE 6 - DERIVATIVE FINANCIAL INSTRUMENTS
The Company is a party to various derivative financial instruments that are used in the normal course of business to meet the needs of its clients and as part of its risk management activities. These instruments include interest rate swaps and option contracts and foreign exchange forward contracts. The Company does not enter into derivative financial instruments for trading purposes.
Using derivative instruments can involve assuming counterparty credit risk to varying degrees. Counterparty credit risk relates to the loss the Company could incur if a counterparty were to default on a derivative contract. Notional amounts of derivative financial instruments do not represent credit risk, and are not recorded in the consolidated balance sheet. The overall credit risk and exposure to individual counterparties is monitored. The Company does not anticipate nonperformance by any counterparties. The amount of counterparty credit exposure is the unrealized gains in excess of collateral pledged, if any, on such derivative contracts along with the value of foreign exchange forward contracts. At December 31, 2017, the Company had $2.1 million of counterparty credit exposure on derivatives. This counterparty risk is considered as part of underwriting and on-going monitoring policies. At December 31, 2017 and 2016, the Company had pledged cash of $1.4 million and $0.7 million, respectively, as collateral in connection with interest rate swap agreements.
Hedging Instruments. At December 31, 2017, the Company had no outstanding hedging instruments used to manage risk. In the past, the Company entered into interest rate caps in order to economically hedge changes in fair value of certain state tax credits held for sale. See Note 18 – Fair Value Measurements for further discussion of the fair value of the state tax credits. The notional amount of the derivative instruments used to manage risk was $3.5 million at December 31, 2016.
Client-Related Derivative Instruments. The Company enters into interest rate swaps to allow customers to hedge changes in fair value of certain loans while maintaining a variable rate loan on its balance sheet. The Company also enters into foreign exchange forward contracts with clients, and enters into offsetting foreign exchange forward contracts with established financial institution counterparties. The table below summarizes the notional amounts and fair values of the client-related derivative instruments.
Asset Derivatives (Other Assets) | Liability Derivatives (Other Liabilities) | ||||||||||||||||||||||
Notional Amount | Fair Value | Fair Value | |||||||||||||||||||||
(in thousands) | December 31, 2017 | December 31, 2016 | December 31, 2017 | December 31, 2016 | December 31, 2017 | December 31, 2016 | |||||||||||||||||
Non-designated hedging instruments | |||||||||||||||||||||||
Interest rate swap contracts | $ | 394,852 | $ | 124,322 | $ | 2,061 | $ | 982 | $ | 2,061 | $ | 982 | |||||||||||
Foreign exchange forward contracts | 1,528 | 3,034 | 1,528 | 3,034 | 1,528 | 3,034 | |||||||||||||||||
Changes in the fair value of client-related derivative instruments are recognized currently in operations. For the years ended December 31, 2017 and 2016, the gains and losses offset each other due to the Company's hedging of the client swaps with other bank counterparties.
96
NOTE 7 - FIXED ASSETS
A summary of fixed assets at December 31, 2017 and 2016, is as follows:
December 31, | |||||||
(in thousands) | 2017 | 2016 | |||||
Land | $ | 7,263 | $ | 3,103 | |||
Buildings and leasehold improvements | 32,384 | 18,054 | |||||
Furniture, fixtures and equipment | 8,272 | 6,136 | |||||
Capitalized software | 1,305 | 1,305 | |||||
49,224 | 28,598 | ||||||
Less accumulated depreciation and amortization | 16,606 | 13,688 | |||||
Total fixed assets | $ | 32,618 | $ | 14,910 | |||
Depreciation and amortization of fixed assets included in noninterest expense amounted to $3.3 million, $2.4 million, and $2.0 million in 2017, 2016, and 2015, respectively.
The Company has facilities leased under agreements that expire in various years through 2029. The Company's rent expense totaled $3.3 million, $3.1 million, and $3.1 million in 2017, 2016, and 2015, respectively. Sublease rental income was $0.03 million, $0.1 million, and $0.1 million for 2017, 2016, and 2015, respectively. For leases which renew or are subject to periodic rental adjustments, the monthly rental payments will be adjusted based on current market conditions and rates of inflation.
The future aggregate minimum rental commitments (in thousands) required under the Company's equipment and facilities leases are shown below:
Year | Amount | ||
2018 | $ | 3,503 | |
2019 | 3,477 | ||
2020 | 3,418 | ||
2021 | 3,337 | ||
2022 | 2,801 | ||
Thereafter | 5,962 | ||
Total | $ | 22,498 | |
The Company has recorded a liability and corresponding expense for the difference between the net present value of future lease payments and its estimated sublease income on certain vacant branches. As of December 31, 2017, this liability was $2.0 million. The Company recorded expense for the estimated net lease liability of $0.4 million, $0.5 million, and $0.1 million in 2017, 2016, and 2015, respectively. The expense is recorded within other noninterest expense.
97
NOTE 8 - GOODWILL AND INTANGIBLE ASSETS
Goodwill increased to $117.3 million as of December 31, 2017, compared to $30.3 million as of December 31, 2016 due to the acquisition of JCB. The annual goodwill impairment evaluations in 2017, 2016, and 2015 did not identify any impairment.
The table below presents a summary of intangible assets:
(in thousands) | Years ended December 31, | ||||||
2017 | 2016 | ||||||
Gross core deposit intangible balance, beginning of year | $ | 9,060 | $ | 9,060 | |||
Additions | 11,514 | — | |||||
Gross core deposit intangible, end of period | 20,574 | 9,060 | |||||
Accumulated amortization | (9,518 | ) | (6,909 | ) | |||
Core deposit intangible, net, end of year | $ | 11,056 | $ | 2,151 | |||
Amortization expense on the core deposit intangibles was $2.6 million, $0.9 million, and $1.1 million for the years ended December 31, 2017, 2016, and 2015, respectively. The core deposit intangibles are being amortized over a 10 year period.
The following table reflects the expected amortization schedule for the core deposit intangible (in thousands) at December 31, 2017.
Year | Core Deposit Intangible | ||
2018 | $ | 2,504 | |
2019 | 2,129 | ||
2020 | 1,755 | ||
2021 | 1,381 | ||
2022 | 1,071 | ||
After 2022 | 2,216 | ||
$ | 11,056 | ||
NOTE 9 - MATURITY OF CERTIFICATES OF DEPOSIT
Following is a summary of certificates of deposit maturities at December 31, 2017:
(in thousands) | Brokered | Customer | Total | ||||||||
Less than 1 year | $ | 114,054 | $ | 317,373 | $ | 431,427 | |||||
Greater than 1 year and less than 2 years | 1,252 | 74,236 | 75,488 | ||||||||
Greater than 2 years and less than 3 years | — | 48,553 | 48,553 | ||||||||
Greater than 3 years and less than 4 years | — | 21,100 | 21,100 | ||||||||
Greater than 4 years and less than 5 years | — | 1,598 | 1,598 | ||||||||
Greater than 5 years | — | 607 | 607 | ||||||||
$ | 115,306 | $ | 463,467 | $ | 578,773 | ||||||
Certificates of deposit balances over the FDIC insurance limit of $250,000 were $148.0 million as of December 31, 2017.
98
NOTE 10 - SUBORDINATED DEBENTURES
The amounts and terms of each issuance of the Company's subordinated debentures at December 31, 2017 and 2016 were as follows:
Amount | Maturity Date | Call Date | Interest Rate | ||||||||||
(in thousands) | 2017 | 2016 | |||||||||||
EFSC Clayco Statutory Trust I | $ | 3,196 | $ | 3,196 | December 17, 2033 | December 17, 2008 | Floats @ 3MO LIBOR + 2.85% | ||||||
EFSC Capital Trust II | 5,155 | 5,155 | June 17, 2034 | June 17, 2009 | Floats @ 3MO LIBOR + 2.65% | ||||||||
EFSC Statutory Trust III | 11,341 | 11,341 | December 15, 2034 | December 15, 2009 | Floats @ 3MO LIBOR + 1.97% | ||||||||
EFSC Clayco Statutory Trust II | 4,124 | 4,124 | September 15, 2035 | September 15, 2010 | Floats @ 3MO LIBOR + 1.83% | ||||||||
EFSC Statutory Trust IV | 10,310 | 10,310 | December 15, 2035 | December 15, 2010 | Floats @ 3MO LIBOR + 1.44% | ||||||||
EFSC Statutory Trust V | 4,124 | 4,124 | September 15, 2036 | September 15, 2011 | Floats @ 3MO LIBOR + 1.60% | ||||||||
EFSC Capital Trust VI | 14,433 | 14,433 | March 30, 2037 | March 30, 2012 | Floats @ 3MO LIBOR + 1.60% | ||||||||
EFSC Capital Trust VII | 4,124 | 4,124 | December 15, 2037 | December 15, 2012 | Floats @ 3MO LIBOR + 2.25% | ||||||||
JEFFCO Stat Trust I (1) | 8,153 | — | February 22, 2031 | February 22, 2011 | Fixed @ 10.2% | ||||||||
JEFFCO Stat Trust II (1) | 4,281 | — | March 17, 2034 | March 17, 2009 | Floats @ 3MO LIBOR + 2.75% | ||||||||
Total trust preferred securities | 69,241 | 56,807 | |||||||||||
Fixed-to-floating rate subordinated notes | 50,000 | 50,000 | November 1, 2026 | November 1, 2021 | Fixed @ 4.75% until November 1, 2021, then floats @ 3MO LIBOR + 3.387% | ||||||||
Debt issuance costs | (1,136 | ) | (1,267 | ) | |||||||||
Total fixed-to-floating rate subordinated notes | 48,864 | 48,733 | |||||||||||
Total subordinated debentures and notes | $ | 118,105 | $ | 105,540 | |||||||||
(1) Purchase accounting adjustments are reflected in the balance and also impact the effective interest rate. | |||||||||||||
The Company has 10 unconsolidated statutory business trusts. These trusts issued preferred securities that were sold to third parties. The sole purpose of the trusts was to invest the proceeds in junior subordinated debentures of the Company that have terms identical to the trust preferred securities. The subordinated debentures, which are the sole assets of the trusts, are subordinate and junior in right of payment to all present and future senior and subordinated indebtedness and certain other financial conditions of the Company. The Company fully and unconditionally guarantees each trust's securities obligations. Under current regulations, the trust preferred securities are included in tier 1 capital for regulatory capital purposes, subject to certain limitations.
The trust preferred securities are redeemable in whole or in part on or after their respective call dates. Mandatory redemption dates may be shortened if certain conditions are met. The securities are classified as subordinated debentures in the Company's consolidated balance sheets. Interest on the subordinated debentures held by the trusts is recorded as interest expense in the Company's consolidated statements of operations. The Company's investment of $2.1 million at December 31, 2017, in these trusts is included in other investments in the consolidated balance sheets.
On November 1, 2016, the Company issued $50 million of fixed-to-floating rate subordinated notes. The notes initially bear a fixed annual interest rate of 4.75%, with interest payable semiannually in arrears on May 1 and November 1 of each year, commencing May 1, 2017. Commencing November 1, 2021, the interest rate on the notes resets quarterly to the three-month LIBOR rate plus a spread of 338.7 basis points, payable quarterly in arrears. On or after November 1, 2021, the Company will have the option to redeem the notes, in whole or in part, at a redemption price equal to 100% of the principal amount of the subordinated notes to be redeemed plus accrued interest, subject to applicable regulatory approval. The Company’s obligation to make payments of principal and interest on the notes is subordinate and junior in right of payment to all of its senior debt. Current regulatory guidance allows for this subordinated debt to be treated as tier 2 regulatory capital for the first five years of its term, subject to certain limitations, and then phased out of tier 2 capital pro rata over the next five years.
99
NOTE 11 - FEDERAL HOME LOAN BANK ADVANCES
FHLB advances are collateralized by 1-4 family residential real estate loans, business loans and certain commercial real estate loans. At December 31, 2017 and 2016, the carrying value of the loans pledged to the FHLB of Des Moines was $1.1 billion and $773.5 million, respectively. The secured line of credit had availability of approximately $484.7 million at December 31, 2017.
The Company also has an $12.9 million investment in the capital stock of the FHLB of Des Moines at December 31, 2017.
The following table summarizes the type, maturity, and rate of the Company's FHLB advances at December 31:
2017 | 2016 | |||||||||||
($ in thousands) | Term | Outstanding Balance | Weighted Rate | Outstanding Balance | Weighted Rate | |||||||
Non-amortizing fixed advance | Less than 1 year | $ | 172,743 | 1.56 | % | $ | — | — | % | |||
Non-amortizing fixed advance | Greater than 1 year | — | — | % | — | — | % | |||||
Total Federal Home Loan Bank Advances | $ | 172,743 | 1.56 | % | $ | — | — | % | ||||
At December 31, 2017, the Company used $18.1 million of collateral value to secure confirming letters of credit for public unit deposits and industrial development bonds.
NOTE 12 - OTHER BORROWINGS AND NOTES PAYABLE
A summary of other borrowings is as follows:
December 31, | |||||||
($ in thousands) | 2017 | 2016 | |||||
Securities sold under customer repurchase agreements | $ | 253,674 | $ | 276,980 | |||
Average balance during the year | $ | 220,807 | $ | 206,643 | |||
Maximum balance outstanding at any month-end | 253,674 | 276,980 | |||||
Average interest rate during the year | 0.21 | % | 0.19 | % | |||
Average interest rate at December 31 | 0.25 | % | 0.18 | % | |||
Federal Reserve Line
The Bank also has a line with the Federal Reserve Bank of St. Louis which provides additional liquidity to the Company. As of December 31, 2017, $898.1 million was available under this line. This line is secured by a pledge of certain eligible loans aggregating $1.1 billion. There were no amounts drawn on the Federal Reserve line of credit as of December 31, 2017.
Revolving Credit
In February 2016, the Company entered into a senior unsecured revolving credit agreement ("Revolving Agreement") with another bank allowing for borrowings up to $20 million. The proceeds can be used for general corporate purposes. The Revolving Agreement is subject to ongoing compliance with a number of customary affirmative and negative covenants as well as specified financial covenants.
100
A summary of the amounts drawn on the Revolving Agreement as of December 31, 2017, and 2016 is as follows:
December 31, | |||||||
($ in thousands) | 2017 | 2016 | |||||
Outstanding balance | $ | — | $ | — | |||
Average balance during the year | $ | 822 | $ | — | |||
Maximum balance outstanding at any month-end | 10,000 | — | |||||
Weighted average interest rate during the year | 3.50 | % | — | % | |||
Average interest rate at December 31 | — | % | — | % | |||
NOTE 13 - LITIGATION AND OTHER CONTINGENCIES
The Company and its subsidiaries are, from time to time, parties to various legal proceedings arising out of their businesses. Management believes that there are no such proceedings pending or threatened against the Company or its subsidiaries which, if determined adversely, would have a material adverse effect on the business, consolidated financial condition, results of operations or cash flows of the Company or any of its subsidiaries.
101
NOTE 14 - REGULATORY MATTERS
Quantitative measures established by regulation to ensure capital adequacy require the Bank to maintain minimum amounts and ratios (set forth in the following table) of total, tier 1, and common equity tier 1 capital to risk-weighted assets, and of tier 1 capital to average assets. Management believes, as of December 31, 2017 and 2016, that the Company met all capital adequacy requirements to which it is subject.
As of December 31, 2017 and 2016, the Bank was categorized as “well capitalized” under the regulatory framework for prompt corrective action. To be categorized as “well capitalized” the Bank must maintain minimum total risk-based capital, tier 1 risk-based capital, common equity tier 1 risk-based capital, and tier 1 leverage ratios as set forth in the table.
The actual capital amounts and ratios are presented in the table below:
Actual | For Capital Adequacy Purposes | To Be Well Capitalized Under Applicable Action Provisions | ||||||||||||||||||
($ in thousands) | Amount | Ratio | Amount | Ratio | Amount | Ratio | ||||||||||||||
As of December 31, 2017: | ||||||||||||||||||||
Total Capital (to Risk Weighted Assets) | ||||||||||||||||||||
Enterprise Financial Services Corp | $ | 589,047 | 12.21 | % | $ | 385,816 | 8.00 | % | $ | — | — | % | ||||||||
Enterprise Bank & Trust | 546,314 | 11.36 | 384,791 | 8.00 | 480,989 | 10.00 | ||||||||||||||
Tier 1 Capital (to Risk Weighted Assets) | ||||||||||||||||||||
Enterprise Financial Services Corp | 496,045 | 10.29 | 289,362 | 6.00 | — | — | ||||||||||||||
Enterprise Bank & Trust | 503,312 | 10.46 | 288,593 | 6.00 | 384,791 | 8.00 | ||||||||||||||
Common Equity Tier 1 Capital (to Risk Weighted Assets) | ||||||||||||||||||||
Enterprise Financial Services Corp | 428,397 | 8.88 | 217,021 | 4.50 | — | — | ||||||||||||||
Enterprise Bank & Trust | 503,264 | 10.46 | 216,445 | 4.50 | 312,643 | 6.50 | ||||||||||||||
Leverage Ratio (Tier 1 Capital to Average Assets) | ||||||||||||||||||||
Enterprise Financial Services Corp | 496,045 | 9.72 | 204,087 | 4.00 | — | — | ||||||||||||||
Enterprise Bank & Trust | 503,312 | 9.68 | 207,885 | 4.00 | 259,856 | 5.00 | ||||||||||||||
As of December 31, 2016: | ||||||||||||||||||||
Total Capital (to Risk Weighted Assets) | ||||||||||||||||||||
Enterprise Financial Services Corp | $ | 506,349 | 13.48 | % | $ | 300,573 | 8.00 | % | $ | — | — | % | ||||||||
Enterprise Bank & Trust | 430,981 | 11.53 | 298,982 | 8.00 | 373,728 | 10.00 | ||||||||||||||
Tier 1 Capital (to Risk Weighted Assets) | ||||||||||||||||||||
Enterprise Financial Services Corp | 412,865 | 10.99 | 225,430 | 6.00 | — | — | ||||||||||||||
Enterprise Bank & Trust | 387,497 | 10.37 | 224,237 | 6.00 | 298,982 | 8.00 | ||||||||||||||
Common Equity Tier 1 Capital (to Risk Weighted Assets) | ||||||||||||||||||||
Enterprise Financial Services Corp | 357,729 | 9.52 | 169,072 | 4.50 | — | — | ||||||||||||||
Enterprise Bank & Trust | 387,461 | 10.37 | 168,178 | 4.50 | 242,923 | 6.50 | ||||||||||||||
Leverage Ratio (Tier 1 Capital to Average Assets) | ||||||||||||||||||||
Enterprise Financial Services Corp | 412,865 | 10.42 | 158,480 | 4.00 | — | — | ||||||||||||||
Enterprise Bank & Trust | 387,497 | 9.81 | 157,933 | 4.00 | 197,417 | 5.00 | ||||||||||||||
102
NOTE 15 - COMPENSATION PLANS
The Company has adopted share-based compensation plans to reward and provide long-term incentive for directors and key employees of the Company. These plans provide for the granting of stock, stock options, stock-settled stock appreciation rights ("SSARs"), and restricted stock units (“RSUs”), and may contain performance terms as designated by the Company's Board of Directors upon the recommendation of the Compensation Committee of the Board. The Company uses authorized and unissued shares to satisfy share award exercises. At December 31, 2017, there were 86,082 shares available for grant under the various share-based compensation plans.
Total share-based compensation expense that was charged against income was $3.4 million, $3.4 million, and $3.6 million for the years ended December 31, 2017, 2016, and 2015 respectively. The total excess income tax benefit for share-based compensation arrangements was $2.1 million, $1.3 million, and $0.4 million for the years ended December 31, 2017, 2016, and 2015, respectively.
Employee Stock Options and Stock-settled Stock Appreciation Rights
In determining compensation cost for stock options and SSARs, the Black-Scholes option-pricing model is used to estimate the fair value on date of grant. There were no grants of employee stock options or SSARs during the years ended December 31, 2017, 2016, or 2015.
Stock options have been granted to key employees with exercise prices equal to the market price of the Company's common stock at the date of grant and 10-year contractual terms. Stock options have a vesting schedule of three to five years. The SSARs are subject to continued employment, have a 10-year contractual term and vest ratably over five years. Neither stock options nor SSARs carry voting or dividend rights until exercised. At December 31, 2017, there was no remaining unrecognized compensation expense related to stock options and SSARs and all outstanding awards are vested. Various information related to the stock options and SSARs is shown below.
(in thousands) | 2017 | 2016 | 2015 | ||||||||
Compensation expense | $ | — | $ | — | $ | 50 | |||||
Intrinsic value of option exercises on date of exercise | 3,156 | 1,156 | 74 | ||||||||
Cash received from the exercise of stock options | 91 | 87 | 126 | ||||||||
Following is a summary of the employee stock option and SSAR activity for 2017.
(in thousands, except share and per share data) | Shares | Weighted Average Exercise Price | Weighted Average Remaining Contractual Term | Aggregate Intrinsic Value | ||||||||
Outstanding at December 31, 2016 | 270,246 | $ | 18.85 | |||||||||
Granted | — | — | ||||||||||
Exercised | (164,116 | ) | 22.40 | |||||||||
Forfeited | — | — | ||||||||||
Outstanding at December 31, 2017 | 106,130 | $ | 13.37 | 1.9 years | $ | 3,373 | ||||||
Exercisable at December 31, 2017 | 106,130 | $ | 13.37 | 1.9 years | $ | 3,373 | ||||||
103
Restricted Stock Units
The Company awards nonvested stock, in the form of RSUs to employees and directors. RSUs generally are subject to continued employment and vest ratably over two to five years. Vesting is accelerated upon a change in control or the employee meeting certain retirement criteria. RSUs do not carry voting or dividend rights until vested. Sales of the units are restricted prior to vesting. Various information related to the RSUs is shown below.
($ in thousands) | 2017 | 2016 | 2015 | ||||||||
Compensation expense | $ | 898 | $ | 850 | $ | 725 | |||||
Total fair value at vesting date | 1,471 | 2,275 | 809 | ||||||||
Total unrecognized compensation cost for nonvested stock units | 837 | 1,084 | 942 | ||||||||
Expected years to recognize unearned compensation | 1.8 years | 1.6 years | 1.7 years | ||||||||
A summary of the status of the Company's RSU awards as of December 31, 2017 and changes during the year then ended is presented below.
Shares | Weighted Average Grant Date Fair Value | |||||
Outstanding at December 31, 2016 | 58,698 | $ | 23.06 | |||
Granted | 16,462 | 41.68 | ||||
Vested | (33,206 | ) | 18.48 | |||
Forfeited | (732 | ) | 14.48 | |||
Outstanding at December 31, 2017 | 41,222 | $ | 34.34 | |||
Stock Plan for Non-Management Directors
The Company has adopted a Stock Plan for Non-Management Directors, which provides for issuing up to 200,000 shares of common stock to non-management directors as compensation in lieu of cash. At December 31, 2017, there were 19,163 shares of stock available for issuance under the Stock Plan for Non-Management Directors.
Various information related to the Director Plan is shown below.
(in thousands, except share and per share data) | 2017 | 2016 | 2015 | ||||||||
Shares issued | 10,531 | 12,528 | 16,283 | ||||||||
Weighted average fair value | $ | 42.46 | $ | 31.25 | $ | 24.43 | |||||
Compensation expense | 397 | 407 | 373 | ||||||||
Employee Stock Issuance
Restricted stock was issued to certain key employees as part of their compensation. The restricted stock may be in the form of a one-time award or paid in pro rata installments. The stock is restricted for at least 2 years and upon issuance may be fully vested or vest over 5 years. The Company recognized $0.1 million, zero, and $0.2 million of stock-based compensation expense for the shares issued to the employees in 2017, 2016, and 2015, respectively. The Company issued zero shares in 2017 and 2016, and 14,110 shares in 2015.
Long-term incentives
The Company has entered into long-term incentive agreements with certain key employees. These awards are conditioned on certain performance criteria and market criteria measured against a group of peer banks over a 3 year period for each grant. The awards contain minimum (threshold), target, and maximum (exceptional) performance levels. In the event of a change in control, as defined in the plan, the awards will vest at a minimum of the target level. The amount of the awards are determined at the end of the 3 year vesting and performance period. In January 2018, the Company awarded 134,600 shares to employees upon completion of the 2015-2017 performance cycle. In February 2017, the Company awarded 118,519 shares to employees upon completion of the 2014-2016 performance cycle. In
104
January 2016, the Company awarded 159,094 shares to employees upon completion of the 2013-2015 performance cycle. Information related to the outstanding grants at December 31, 2017 is shown below:
(in thousands, except share and per share data) | 2016 - 2018 Cycle | 2017 - 2019 Cycle | |||||
Shares issuable at target | 87,758 | 55,203 | |||||
Maximum shares issuable | 107,955 | 68,263 | |||||
Unrecognized compensation cost | $ | 949 | $ | 1,792 | |||
Weighted average grant date fair value | 25.26 | 40.72 | |||||
The Company recorded $2.5 million, $2.5 million and $2.7 million of stock-based compensation expense for these awards during 2017, 2016 and 2015, respectively. In 2017 and 2016, this expense included an additional $0.3 million, and $0.2 million, respectively, related to modifications made for retiring executives. The modification allows for portions of outstanding performance awards to continue to vest as though employment had not terminated and will be paid based on actual performance as determined by the compensation committee following completion of the applicable performance period.
401(k) plans
The Company has a 401(k) savings plan which covers substantially all full-time employees over the age of 21. The amount charged to expense for the Company's contributions to the plan was $2.0 million, $1.7 million and $1.6 million for 2017, 2016, and 2015, respectively.
105
NOTE 16 - INCOME TAXES
The components of income tax expense for the years ended December 31 are as follows:
Years ended December 31, | |||||||||||
(in thousands) | 2017 | 2016 | 2015 | ||||||||
Current: | |||||||||||
Federal | $ | 15,845 | $ | 17,005 | $ | 22,916 | |||||
State and local | 1,377 | 1,734 | 2,798 | ||||||||
Total current | 17,222 | 18,739 | 25,714 | ||||||||
Deferred: | |||||||||||
Federal | 20,989 | 5,959 | (5,266 | ) | |||||||
State and local | 116 | 1,304 | (497 | ) | |||||||
Total deferred | 21,105 | 7,263 | (5,763 | ) | |||||||
Total income tax expense | $ | 38,327 | $ | 26,002 | $ | 19,951 | |||||
A reconciliation of expected income tax expense, computed by applying the statutory federal income tax rate in 2017, 2016, and 2015 to income before income taxes and the amounts reflected in the consolidated statements of operations is as follows:
Years ended December 31, | |||||||||||
(in thousands) | 2017 | 2016 | 2015 | ||||||||
Income tax expense at statutory rate | $ | 30,281 | $ | 26,194 | $ | 20,440 | |||||
Increase (reduction) in income tax resulting from: | |||||||||||
Tax-exempt income, net | (961 | ) | (945 | ) | (931 | ) | |||||
State and local income taxes, net | 1,676 | 1,673 | 1,414 | ||||||||
Bank-owned life insurance, net | (715 | ) | (544 | ) | (462 | ) | |||||
Non-deductible expenses | 407 | 263 | 259 | ||||||||
Change in estimated rate for deferred taxes | 12,117 | 302 | — | ||||||||
Tax benefits of LIHTC investments, net | (257 | ) | (181 | ) | (179 | ) | |||||
Excess tax benefits | (2,141 | ) | — | — | |||||||
Other federal tax benefits | (1,701 | ) | — | — | |||||||
Other, net | (379 | ) | (760 | ) | (590 | ) | |||||
Total income tax expense | $ | 38,327 | $ | 26,002 | $ | 19,951 | |||||
The net amount recognized as a component of tax expense for tax credits, other tax benefits, and amortization from low-income housing tax credit ("LIHTC") investments recognized per the table above was $0.3 million for the year ended December 31, 2017. The net amount recognized as a component of income tax expense per the table above was $0.2 million for the years ended December 31, 2016, and 2015. As of December 31, 2017 and 2016, the carrying value of the investments related to low-income housing tax credits was $1.3 million and $1.4 million, respectively. No impairment losses have been recognized from forfeiture or ineligibility of tax credits or other circumstances during the life of any of the investments. As of December 31, 2017, the Company has future capital commitments of $4.8 million related to low-income housing tax credit investments. The capital commitments are expected to be called between the years 2018 - 2020.
106
A net deferred income tax asset of $22.5 million and $33.8 million is included in other assets in the consolidated balance sheets at December 31, 2017 and 2016, respectively. The tax effect of temporary differences that gave rise to significant portions of the deferred tax assets and deferred tax liabilities is as follows:
Years ended December 31, | |||||||
(in thousands) | 2017 | 2016 | |||||
Deferred tax assets: | |||||||
Allowance for loan losses | $ | 10,516 | $ | 16,496 | |||
Basis difference on PCI assets, net | 5,748 | 5,551 | |||||
Basis difference on Other real estate | 694 | 317 | |||||
Deferred compensation | 2,719 | 4,217 | |||||
Goodwill and other intangible assets | 2,151 | 5,520 | |||||
Accrued compensation | 646 | 899 | |||||
Unrealized losses on securities available for sale | 1,490 | 1,019 | |||||
Other, net | 2,150 | 925 | |||||
Total deferred tax assets | 26,114 | 34,944 | |||||
Deferred tax liabilities: | |||||||
State tax credits held for sale, net of economic hedge | 26 | 376 | |||||
Core deposit intangibles | 2,731 | 817 | |||||
Other, net | 855 | — | |||||
Total deferred tax liabilities | 3,612 | 1,193 | |||||
Net deferred tax asset | $ | 22,502 | $ | 33,751 | |||
Deferred tax rate | 24.7 | % | 38.0 | % | |||
Net deferred tax assets for the year ended December 31, 2017, experienced an increase of $8.6 million from the acquisition of JCB, offset by a revaluation adjustment of $12.1 million due to our initial analysis of the impact of the Tax Act.
A valuation allowance is provided on deferred tax assets when it is more likely than not that some portion of the assets will not be realized. The Company did not have any valuation allowances for federal or state income taxes as of December 31, 2017 or 2016.
The Company and its subsidiaries file income tax returns in the federal jurisdiction and in nine states. The Company is no longer subject to federal, state or local income tax audits by tax authorities for years before 2014, with the exception of 2013 being an open year by one state taxing authority. The Company is not currently under audit by any taxing jurisdiction.
As of December 31, 2017, the gross amount of unrecognized tax benefits was $1.2 million and the total amount of net unrecognized tax benefits that would impact the effective tax rate, if recognized, was $0.8 million. As of December 31, 2016 and 2015, the total amount of the net unrecognized tax benefits that would impact the effective tax rate, if recognized, was $0.8 million and $0.9 million, respectively. The Company believes it is reasonably possible that the gross amount of unrecognized benefits will be reduced by approximately $0.3 million as a result of a lapse of statute of limitations in the next 12 months.
The Company recognizes interest and penalties related to uncertain tax positions in income tax expense and classifies such interest and penalties in the liability for unrecognized tax benefits. The amounts accrued for interest and penalties as of December 31, 2017, 2016, and 2015 were not significant.
107
The activity in the gross liability for unrecognized tax benefits was as follows:
(in thousands) | 2017 | 2016 | 2015 | ||||||||
Balance at beginning of year | $ | 1,180 | $ | 1,359 | $ | 1,884 | |||||
Additions based on tax positions related to the current year | 331 | 239 | 230 | ||||||||
Additions for tax positions of prior years | 41 | 39 | 46 | ||||||||
Reductions for tax positions of prior years | — | — | (437 | ) | |||||||
Settlements or lapse of statute of limitations | (308 | ) | (457 | ) | (364 | ) | |||||
Balance at end of year | $ | 1,244 | $ | 1,180 | $ | 1,359 | |||||
NOTE 17 - COMMITMENTS
The Company issues financial instruments in the normal course of the business of meeting the financing needs of its customers. These financial instruments include commitments to extend credit and standby letters of credit. These instruments may involve, to varying degrees, elements of credit and interest rate risk in excess of the amounts recognized in the consolidated balance sheets.
The Company’s extent of involvement and maximum potential exposure to credit loss in the event of nonperformance by the other party to the financial instrument for commitments to extend credit and standby letters of credit is not more than the contractual amount of these instruments.
The Company uses the same credit policies in making commitments and conditional obligations as it does for financial instruments included on its consolidated balance sheets.
The contractual amounts of off-balance-sheet financial instruments as of December 31, 2017, and December 31, 2016, are as follows:
(in thousands) | December 31, 2017 | December 31, 2016 | |||||
Commitments to extend credit | $ | 1,298,423 | $ | 1,075,170 | |||
Letters of credit | 73,790 | 78,954 | |||||
There was an insignificant amount of unadvanced commitments on impaired loans at December 31, 2017 and December 31, 2016. Other liabilities include approximately $0.4 million for estimated losses attributable to the unadvanced commitments.
Commitments to extend credit are agreements to lend to a customer as long as there is no violation of any condition established in the contract. Commitments usually have fixed expiration dates or other termination clauses, may have significant usage restrictions, and may require payment of a fee. Of the total commitments to extend credit at December 31, 2017, and December 31, 2016, $112.0 million and $89.7 million, respectively, represent fixed rate loan commitments. Since certain of the commitments may expire without being drawn upon or may be revoked, the total commitment amounts do not necessarily represent future cash obligations. The Company evaluates each customer’s credit worthiness on a case-by-case basis. The amount of collateral obtained, if deemed necessary by the Company upon extension of credit, is based on management’s credit evaluation of the borrower. Collateral held varies, but may include accounts receivable, inventory, premises and equipment, and real estate.
Letters of credit are conditional commitments issued by the Company to guarantee the performance of a customer to a third party. These letters of credit are issued to support contractual obligations of the Company’s customers. The credit risk involved in issuing letters of credit is essentially the same as the risk involved in extending loans to customers. The approximate remaining term of letters of credit range from 1 month to 3 years and 9 months at December 31, 2017.
108
NOTE 18 - FAIR VALUE MEASUREMENTS
The fair value of an asset or liability is the price that would be received to sell that asset or paid to transfer that liability in an orderly transaction occurring in the principal market (or most advantageous market in the absence of a principal market) for such asset or liability. In estimating fair value, the Company utilizes valuation techniques that are consistent with the market approach, the income approach and/or the cost approach. Such valuation techniques are consistently applied. Inputs to valuation techniques include the assumptions that market participants would use in pricing an asset or liability. ASC Topic 820, Fair Value Measurements and Disclosures, establishes a fair value hierarchy for valuation inputs that gives the highest priority to quoted prices in active markets for identical assets or liabilities and the lowest priority to unobservable inputs. The fair value hierarchy is as follows:
• | Level 1 Inputs - Unadjusted quoted prices in active markets for identical assets or liabilities that the reporting entity has the ability to access at the measurement date. |
• | Level 2 Inputs - Inputs other than quoted prices included in Level 1 that are observable for the asset or liability, either directly or indirectly. These might include quoted prices for similar assets or liabilities in active markets, quoted prices for identical or similar assets or liabilities in markets that are not active, inputs other than quoted prices that are observable for the asset or liability (such as interest rates, volatilities, prepayment speeds, credit risks, etc.) or inputs that are derived principally from or corroborated by market data by correlation or other means. |
• | Level 3 Inputs - Unobservable inputs for determining the fair values of assets or liabilities that reflect an entity's own assumptions about the assumptions that market participants would use in pricing the assets or liabilities. |
Fair value on a recurring basis
The following table summarizes financial instruments measured at fair value on a recurring basis as of December 31, 2017 and 2016, segregated by the level of the valuation inputs within the fair value hierarchy utilized to measure fair value.
December 31, 2017 | |||||||||||||||
(in thousands) | Quoted Prices in Active Markets for Identical Assets (Level 1) | Significant Other Observable Inputs (Level 2) | Significant Unobservable Inputs (Level 3) | Total Fair Value | |||||||||||
Assets | |||||||||||||||
Securities available for sale | |||||||||||||||
Obligations of U.S. Government-sponsored enterprises | $ | — | $ | 99,224 | $ | — | $ | 99,224 | |||||||
Obligations of states and political subdivisions | — | 34,642 | — | 34,642 | |||||||||||
Residential mortgage-backed securities | — | 507,516 | — | 507,516 | |||||||||||
Total securities available for sale | — | 641,382 | — | 641,382 | |||||||||||
State tax credits held for sale | — | — | 400 | 400 | |||||||||||
Derivative financial instruments | — | 3,589 | — | 3,589 | |||||||||||
Total assets | $ | — | $ | 644,971 | $ | 400 | $ | 645,371 | |||||||
Liabilities | |||||||||||||||
Derivative financial instruments | $ | — | $ | 3,589 | $ | — | $ | 3,589 | |||||||
Total liabilities | $ | — | $ | 3,589 | $ | — | $ | 3,589 | |||||||
109
December 31, 2016 | |||||||||||||||
(in thousands) | Quoted Prices in Active Markets for Identical Assets (Level 1) | Significant Other Observable Inputs (Level 2) | Significant Unobservable Inputs (Level 3) | Total Fair Value | |||||||||||
Assets | |||||||||||||||
Securities available for sale | |||||||||||||||
Obligations of U.S. Government-sponsored enterprises | $ | — | $ | 107,660 | $ | — | $ | 107,660 | |||||||
Obligations of states and political subdivisions | — | 33,542 | 3,089 | 36,631 | |||||||||||
Residential mortgage-backed securities | — | 316,506 | — | 316,506 | |||||||||||
Total securities available for sale | — | 457,708 | 3,089 | 460,797 | |||||||||||
State tax credits held for sale | — | — | 3,585 | 3,585 | |||||||||||
Derivative financial instruments | — | 4,016 | — | 4,016 | |||||||||||
Total assets | $ | — | $ | 461,724 | $ | 6,674 | $ | 468,398 | |||||||
Liabilities | |||||||||||||||
Derivative financial instruments | $ | — | $ | 4,016 | $ | — | $ | 4,016 | |||||||
Total liabilities | $ | — | $ | 4,016 | $ | — | $ | 4,016 | |||||||
• | Securities available for sale. Securities classified as available for sale are reported at fair value utilizing Level 2 and Level 3 inputs. Fair values for Level 2 securities are based upon dealer quotes, market spreads, the U.S. Treasury yield curve, trade execution data, market consensus prepayment speeds, credit information and the bond's terms and conditions at the security level. At December 31, 2017, there were no Level 3 Auction Rate Securities. Auction Rate Securities at December 31, 2017 were valued using a Level 2 pricing source similar to our other securities available for sale. |
• | State tax credits held for sale. At December 31, 2017, of the $43.5 million of state tax credits held for sale on the consolidated balance sheet, approximately $0.4 million were carried at fair value. The remaining $43.1 million of state tax credits were accounted for at cost. The Company elected not to account for the state tax credits purchased since 2010 at fair value in order to limit the volatility of the fair value changes in our consolidated statements of operations. |
The Company is not aware of an active market that exists for the 10-year streams of state tax credit financial instruments. However, the Company’s principal market for these tax credits consists of Missouri state residents who buy these credits and local and regional accounting firms who broker them. As such, the Company employed a discounted cash flow analysis (income approach) to determine the fair value.
The fair value measurement is calculated using an internal valuation model with market data including discounted cash flows based upon the terms and conditions of the tax credits. If the underlying project remains in compliance with the various federal and state rules governing the tax credit program, each project will generate about 10 years of tax credits. The inputs to the discounted cash flow calculation include: the amount of tax credits generated each year, the anticipated sale price of the tax credit, the timing of the sale and a discount rate. The discount rate is estimated using the LIBOR swap curve at a point equal to the remaining life in years of credits plus a 205 basis point spread. With the exception of the discount rate, the other inputs to the fair value calculation are observable and readily available. The discount rate is considered a Level 3 input because it is an “unobservable input” and is based on the Company’s assumptions. An increase in the discount rate utilized would generally result in a lower estimated fair value of the tax credits. Alternatively, a decrease in the discount rate utilized would generally result in a higher estimated fair value of the tax credits. Given the significance of this input to the fair value calculation, the state tax credit assets are reported as Level 3 assets.
110
• | Derivatives. Derivatives are reported at fair value utilizing Level 2 inputs. The Company obtains counterparty quotations to value its interest rate swaps and caps. In addition, the Company validates the counterparty quotations with third party valuation sources. Derivatives with negative fair values are included in Other liabilities in the consolidated balance sheets. Derivatives with positive fair value are included in Other assets in the consolidated balance sheets. |
Level 3 financial instruments
The following table presents the changes in Level 3 financial instruments measured at fair value on a recurring basis as of December 31, 2017 and 2016.
• | Purchases, sales, issuances and settlements. There were no Level 3 purchases during the years ended December 31, 2017 and 2016. |
• | Transfers in and/or out of Level 3. There was $3.1 million in Level 3 transfers to Level 2 for the year ending December 31, 2017 because more observable market data became available for the Auction Rate Securities. The Company's policy is to recognize transfers into or out of a level as of the end of a reporting period. As a result, the transfers occurred on June 30, 2017. There were no transfers in and/or out of Level 3 for the year ending 2016. |
Securities available for sale, at fair value | |||||||
Years ended December 31, | |||||||
(in thousands) | 2017 | 2016 | |||||
Beginning balance | $ | 3,089 | $ | 3,077 | |||
Total gains: | |||||||
Included in other comprehensive income | 4 | 12 | |||||
Transfer in and/or out of Level 3 | (3,093 | ) | — | ||||
Ending balance | $ | — | $ | 3,089 | |||
Change in unrealized gains relating to assets still held at the reporting date | $ | — | $ | 12 | |||
State tax credits held for sale, at fair value | |||||||
Years ended December 31, | |||||||
(in thousands) | 2017 | 2016 | |||||
Beginning balance | $ | 3,585 | $ | 5,941 | |||
Total gains: | |||||||
Included in earnings | 101 | 177 | |||||
Purchases, sales, issuances and settlements: | |||||||
Sales | (3,286 | ) | (2,533 | ) | |||
Ending balance | $ | 400 | $ | 3,585 | |||
Change in unrealized losses relating to assets still held at the reporting date | $ | (885 | ) | $ | (575 | ) | |
111
Fair value on a non-recurring basis
Certain financial assets and financial liabilities are measured at fair value on a non-recurring basis; that is, the instruments are not measured at fair value on an ongoing basis but are subject to fair value adjustments in certain circumstances (for example, when there is evidence of impairment).
• | Impaired loans. Impaired loans are included as Portfolio loans on the Company's consolidated balance sheets with amounts specifically reserved for credit impairment in the Allowance for loan losses. On a quarterly basis, fair value adjustments are recorded on impaired loans to account for (1) partial write-downs that are based on the current appraised or market-quoted value of the underlying collateral or (2) the full charge-off of the loan carrying value. In some cases, the properties for which market quotes or appraised values have been obtained are located in areas where comparable sales data is limited, outdated, or unavailable. In addition, the Company may adjust the valuations based on other relevant market conditions or information. Accordingly, fair value estimates, including those obtained from real estate brokers or other third-party consultants, for collateral-dependent impaired loans are classified in Level 3 of the valuation hierarchy. |
• | Other Real Estate. These assets are reported at the lower of the loan carrying amount at foreclosure or fair value. Fair value is based on third party appraisals of each property and the Company's judgment of other relevant market conditions. These are considered Level 3 inputs. |
The following table presents financial instruments and non-financial assets measured at fair value on a non-recurring basis as of December 31, 2017 and 2016.
December 31, 2017 | ||||||||||||||||||
(1) | (1) | (1) | (1) | |||||||||||||||
(in thousands) | Total Fair Value | Quoted Prices in Active Markets for Identical Assets (Level 1) | Significant Other Observable Inputs (Level 2) | Significant Unobservable Inputs (Level 3) | Total losses for the year ended December 31, 2017 | |||||||||||||
Impaired loans | $ | 3,200 | $ | — | $ | — | $ | 3,200 | $ | 6,599 | ||||||||
Other real estate | — | — | — | — | — | |||||||||||||
Total | $ | 3,200 | $ | — | $ | — | $ | 3,200 | $ | 6,599 | ||||||||
December 31, 2016 | ||||||||||||||||||
(1) | (1) | (1) | (1) | |||||||||||||||
(in thousands) | Total Fair Value | Quoted Prices in Active Markets for Identical Assets (Level 1) | Significant Other Observable Inputs (Level 2) | Significant Unobservable Inputs (Level 3) | Total losses for the year ended December 31, 2016 | |||||||||||||
Impaired loans | $ | 175 | $ | — | $ | — | $ | 175 | $ | 4,335 | ||||||||
Other real estate | — | — | — | — | 1 | |||||||||||||
Total | $ | 175 | $ | — | $ | — | $ | 175 | $ | 4,336 | ||||||||
(1) The amounts represent only balances measured at fair value during the period and still held as of the reporting date.
Impaired loans are reported at the fair value of the underlying collateral. Fair values for impaired loans are obtained from current appraisals by qualified licensed appraisers or independent valuation specialists. Other real estate owned is adjusted to fair value upon foreclosure of the underlying loan. Subsequently, foreclosed assets are carried at the lower of carrying value or fair value less costs to sell. Fair value of other real estate is based upon the current appraised values of the properties as determined by qualified licensed appraisers and the Company’s judgment of other relevant market conditions. Certain state tax credits are reported at cost.
112
Carrying amount and fair value at December 31, 2017 and 2016
Following is a summary of the carrying amounts and fair values of the Company’s financial instruments on the consolidated balance sheets at December 31, 2017 and 2016.
December 31, 2017 | December 31, 2016 | ||||||||||||||
(in thousands) | Carrying Amount | Estimated fair value | Carrying Amount | Estimated fair value | |||||||||||
Balance sheet assets | |||||||||||||||
Cash and due from banks | $ | 91,084 | $ | 91,084 | $ | 54,288 | $ | 54,288 | |||||||
Federal funds sold | 1,223 | 1,223 | 446 | 446 | |||||||||||
Interest-bearing deposits | 63,661 | 63,661 | 145,048 | 145,048 | |||||||||||
Securities available for sale | 641,382 | 641,382 | 460,797 | 460,797 | |||||||||||
Securities held to maturity | 73,749 | 73,458 | 80,463 | 79,639 | |||||||||||
Other investments, at cost | 26,661 | 26,661 | 14,840 | 14,840 | |||||||||||
Loans held for sale | 3,155 | 3,155 | 9,562 | 9,562 | |||||||||||
Derivative financial instruments | 3,589 | 3,589 | 4,016 | 4,016 | |||||||||||
Portfolio loans, net | 4,054,473 | 4,096,741 | 3,114,752 | 3,125,701 | |||||||||||
State tax credits, held for sale | 43,468 | 44,271 | 38,071 | 41,264 | |||||||||||
Accrued interest receivable | 14,069 | 14,069 | 11,117 | 11,117 | |||||||||||
Balance sheet liabilities | |||||||||||||||
Deposits | 4,156,414 | 4,153,323 | 3,233,361 | 3,232,414 | |||||||||||
Subordinated debentures and notes | 118,105 | 105,031 | 105,540 | 86,052 | |||||||||||
Federal Home Loan Bank advances | 172,743 | 172,893 | — | — | |||||||||||
Other borrowings | 253,674 | 253,530 | 276,980 | 276,905 | |||||||||||
Derivative financial instruments | 3,589 | 3,589 | 4,016 | 4,016 | |||||||||||
Accrued interest payable | 1,730 | 1,730 | 1,105 | 1,105 | |||||||||||
113
The following table presents the level in the fair value hierarchy for the estimated fair values of only the Company’s financial instruments that are not already on the consolidated balance sheets at fair value at December 31, 2017, and December 31, 2016.
Estimated Fair Value Measurement at Reporting Date Using | Balance at December 31, 2017 | ||||||||||||||
(in thousands) | Level 1 | Level 2 | Level 3 | ||||||||||||
Financial Assets: | |||||||||||||||
Securities held to maturity | $ | — | $ | 73,458 | $ | — | $ | 73,458 | |||||||
Portfolio loans, net | — | — | 4,096,741 | 4,096,741 | |||||||||||
State tax credits, held for sale | — | — | 43,871 | 43,871 | |||||||||||
Financial Liabilities: | |||||||||||||||
Deposits | 3,577,641 | — | 575,682 | 4,153,323 | |||||||||||
Subordinated debentures and notes | — | 105,031 | — | 105,031 | |||||||||||
Federal Home Loan Bank advances | — | 172,893 | — | 172,893 | |||||||||||
Other borrowings | — | 253,530 | — | 253,530 | |||||||||||
Estimated Fair Value Measurement at Reporting Date Using | Balance at December 31, 2016 | ||||||||||||||
(in thousands) | Level 1 | Level 2 | Level 3 | ||||||||||||
Financial Assets: | |||||||||||||||
Securities held to maturity | $ | — | $ | 79,639 | $ | — | $ | 79,639 | |||||||
Portfolio loans, net | — | — | 3,125,701 | 3,125,701 | |||||||||||
State tax credits, held for sale | — | — | 37,679 | 37,679 | |||||||||||
Financial Liabilities: | |||||||||||||||
Deposits | 2,760,202 | — | 472,212 | 3,232,414 | |||||||||||
Subordinated debentures and notes | — | 86,052 | — | 86,052 | |||||||||||
Federal Home Loan Bank advances | — | — | — | — | |||||||||||
Other borrowings | — | 276,905 | — | 276,905 | |||||||||||
The following methods and assumptions were used to estimate the fair value of each class of financial instruments for which it is practical to estimate such value:
Cash, Federal funds sold, and other short-term instruments
For cash and due from banks, federal funds purchased, interest-bearing deposits, and accrued interest receivable (payable), the carrying amount is a reasonable estimate of fair value, as such instruments reprice in a short time period (Level 1).
Securities available for sale and held to maturity
The Company obtains fair value measurements for debt instruments from an independent pricing service. The fair value measurements consider observable data that may include dealer quotes, market spreads, cash flows, the U.S. Treasury yield curve, live trading levels, trade execution data, market consensus prepayment speeds, credit information and the bond's terms and conditions (Level 2).
Other investments
Other investments, which primarily consists of membership stock in the FHLB, is reported at cost, which approximates fair value (Level 2).
Loans held for sale
These loans consist of mortgages that are sold on the secondary market generally within three months of origination. They are reported at cost, which approximates fair value (Level 2).
114
Portfolio loans, net
The fair value of adjustable-rate loans approximates cost. The fair value of fixed-rate loans is estimated by discounting the future cash flows using the current rates at which similar loans would be made to borrowers for the same remaining maturities. The fair value of the acquired loans are based on the present value of expected future cash flows (Level 3). The method of estimating fair value does not incorporate the exit-price concept of fair value prescribed by ASC Topic 820.
State tax credits held for sale
The fair value of state tax credits held for sale is calculated using an internal valuation model with unobservable market data as discussed in further detail above (Level 3).
Derivative financial instruments
The fair value of derivative financial instruments is based on quoted market prices by the counterparty and verified by the Company using public pricing information (Level 2).
Deposits
The fair value of demand deposits, interest-bearing transaction accounts, money market accounts and savings deposits is the amount payable on demand at the reporting date (Level 1). The fair value of fixed-maturity certificates of deposit is estimated by discounting the future cash flows using the rates currently offered for deposits of similar remaining maturities (Level 3).
Subordinated debentures and notes
Fair value of subordinated debentures and notes is based on discounting the future cash flows using rates currently offered for financial instruments of similar remaining maturities (Level 2).
Federal Home Loan Bank advances
The fair value of the FHLB advances is based on the discounted value of contractual cash flows. The discount rate is estimated using current rates on borrowed money with similar remaining maturities (Level 2).
Other borrowed funds
Other borrowed funds include customer repurchase agreements, federal funds purchased, notes payable, and secured borrowings related to loan participations. The fair value of federal funds purchased, customer repurchase agreements and notes payable are assumed to be equal to their carrying amount since they have an adjustable interest rate (Level 2).
Commitments to extend credit and letters of credit
The fair value of commitments to extend credit and letters of credit are estimated using the fees currently charged to enter into similar agreements, taking into account the remaining terms of the agreements, the likelihood of the counterparties drawing on such financial instruments, and the present creditworthiness of such counterparties (Level 2). The Company believes such commitments have been made on terms which are competitive in the markets in which it operates; however, no premium or discount is offered thereon and accordingly, the Company has not assigned a value to such instruments for purposes of this disclosure.
Limitations
Fair value estimates are made at a specific point in time, based on relevant market information and information about the financial instrument. These estimates are subjective in nature and involve uncertainties and matters of significant judgment, and therefore, cannot be determined with precision. Such estimates include the valuation of loans, goodwill, intangible assets, and other long-lived assets, along with assumptions used in the calculation of income taxes, among others. These estimates and assumptions are based on management's best estimates and judgment. Management evaluates its estimates and assumptions on an ongoing basis using experience and other factors, including the current economic environment, which management believes to be reasonable under the circumstances. We adjust such estimates and assumptions when facts and circumstances dictate. Decreasing real estate values, illiquid credit markets, volatile equity markets, and declines in consumer spending have combined to increase the uncertainty inherent in such estimates and assumptions. As future events and their effects cannot be determined with precision, actual results could differ
115
significantly from these estimates. Changes in estimates resulting from continuing changes in the economic environment will be reflected in the financial statement in future periods. In addition, these estimates do not reflect any premium or discount that could result from offering for sale at one time the Company's entire holdings of a particular financial instrument. Fair value estimates are based on existing on-balance and off-balance-sheet financial instruments without attempting to estimate the value of anticipated future business and the value of assets and liabilities that are not considered financial instruments. In addition, the tax ramifications related to the realization of the unrealized gains and losses can have a significant effect on fair value estimates and have not been considered in many of the estimates.
NOTE 19 - PARENT COMPANY ONLY CONDENSED FINANCIAL STATEMENTS
Condensed Balance Sheets
December 31, | |||||||
(in thousands) | 2017 | 2016 | |||||
Assets | |||||||
Cash | $ | 9,977 | $ | 52,245 | |||
Investment in Enterprise Bank & Trust | 623,439 | 416,831 | |||||
Investment in nonbank subsidiaries | 6,546 | 2,798 | |||||
Other assets | 28,741 | 22,111 | |||||
Total assets | $ | 668,703 | $ | 493,985 | |||
Liabilities and Shareholders' Equity | |||||||
Subordinated debentures and notes | $ | 118,105 | $ | 105,540 | |||
Accounts payable and other liabilities | 2,025 | 1,347 | |||||
Shareholders' equity | 548,573 | 387,098 | |||||
Total liabilities and shareholders' equity | $ | 668,703 | $ | 493,985 | |||
116
Condensed Statements of Operations
Years ended December 31, | |||||||||||
(in thousands) | 2017 | 2016 | 2015 | ||||||||
Income: | |||||||||||
Dividends from subsidiaries | $ | 20,000 | $ | 7,500 | $ | 10,000 | |||||
Other | 708 | 491 | 249 | ||||||||
Total income | 20,708 | 7,991 | 10,249 | ||||||||
Expenses: | |||||||||||
Interest expense-subordinated debentures and notes | 5,094 | 1,893 | 1,248 | ||||||||
Interest expense-notes payable | 89 | 53 | 144 | ||||||||
Other expenses | 5,486 | 5,526 | 3,823 | ||||||||
Total expenses | 10,669 | 7,472 | 5,215 | ||||||||
Income before taxes and equity in undistributed earnings of subsidiaries | 10,039 | 519 | 5,034 | ||||||||
Income tax benefit | 3,098 | 2,583 | 2,118 | ||||||||
Net income before equity in undistributed earnings of subsidiaries | 13,137 | 3,102 | 7,152 | ||||||||
Equity in undistributed earnings of subsidiaries | 35,053 | 45,735 | 31,298 | ||||||||
Net income and comprehensive income | $ | 48,190 | $ | 48,837 | $ | 38,450 | |||||
117
Condensed Statements of Cash Flows
Years Ended December 31, | |||||||||||
(in thousands) | 2017 | 2016 | 2015 | ||||||||
Cash flows from operating activities: | |||||||||||
Net income | $ | 48,190 | $ | 48,837 | $ | 38,450 | |||||
Adjustments to reconcile net income to net cash provided by (used in) operating activities: | |||||||||||
Share-based compensation | 3,427 | 3,367 | 3,601 | ||||||||
Net income of subsidiaries | (55,053 | ) | (53,235 | ) | (41,298 | ) | |||||
Dividends from subsidiaries | 20,000 | 7,500 | 10,000 | ||||||||
Excess tax expense of share-based compensation | — | (1,327 | ) | (449 | ) | ||||||
Other, net | (1,806 | ) | 1,848 | 848 | |||||||
Net cash provided by operating activities | 14,758 | 6,990 | 11,152 | ||||||||
Cash flows from investing activities: | |||||||||||
Cash contributions to subsidiaries | — | (250 | ) | — | |||||||
Cash paid for acquisitions, net of cash acquired | (25,187 | ) | — | — | |||||||
Purchases of other investments | (3,679 | ) | (2,435 | ) | (2,832 | ) | |||||
Proceeds from distributions on other investments | 1,634 | 1,151 | 880 | ||||||||
Net cash used by investing activities | (27,232 | ) | (1,534 | ) | (1,952 | ) | |||||
Cash flows from financing activities: | |||||||||||
Proceeds from issuance of subordinated notes | — | 48,733 | — | ||||||||
Proceeds from notes payable | 10,000 | — | — | ||||||||
Repayments of notes payable | (10,000 | ) | — | (5,700 | ) | ||||||
Cash dividends paid | (10,249 | ) | (8,211 | ) | (5,259 | ) | |||||
Excess tax benefit of share-based compensation | — | 1,327 | 449 | ||||||||
Payments for the repurchase of common stock | (16,636 | ) | (4,889 | ) | — | ||||||
Payments for the issuance of equity instruments, net | (2,909 | ) | (2,203 | ) | (1,190 | ) | |||||
Net cash provided (used) by financing activities | (29,794 | ) | 34,757 | (11,700 | ) | ||||||
Net increase (decrease) in cash and cash equivalents | (42,268 | ) | 40,213 | (2,500 | ) | ||||||
Cash and cash equivalents, beginning of year | 52,245 | 12,032 | 14,532 | ||||||||
Cash and cash equivalents, end of year | $ | 9,977 | $ | 52,245 | $ | 12,032 | |||||
Supplemental disclosures of cash flow information: | |||||||||||
Noncash transactions: | |||||||||||
Common shares issued in connection with JCB acquisition | $ | 141,729 | $ | — | $ | — | |||||
118
NOTE 20 - QUARTERLY CONDENSED FINANCIAL INFORMATION (Unaudited)
The following table presents unaudited quarterly financial information for the periods indicated:
2017 | |||||||||||||||
(in thousands, except per share data) | 4th Quarter | 3rd Quarter | 2nd Quarter | 1st Quarter | |||||||||||
Interest income | $ | 54,789 | $ | 52,468 | $ | 51,542 | $ | 43,740 | |||||||
Interest expense | 7,385 | 6,843 | 5,909 | 5,098 | |||||||||||
Net interest income | 47,404 | 45,625 | 45,633 | 38,642 | |||||||||||
Provision for portfolio loan losses | 3,186 | 2,422 | 3,623 | 1,533 | |||||||||||
Provision reversal for purchased credit impaired loan losses | (279 | ) | — | (207 | ) | (148 | ) | ||||||||
Net interest income after provision for loan losses | 44,497 | 43,203 | 42,217 | 37,257 | |||||||||||
Noninterest income | 11,112 | 8,372 | 7,934 | 6,976 | |||||||||||
Noninterest expense | 28,260 | 27,404 | 32,651 | 26,736 | |||||||||||
Income before income tax expense | 27,349 | 24,171 | 17,500 | 17,497 | |||||||||||
Income tax expense | 19,820 | 7,856 | 5,545 | 5,106 | |||||||||||
Net income | $ | 7,529 | $ | 16,315 | $ | 11,955 | $ | 12,391 | |||||||
Earnings per common share: | |||||||||||||||
Basic | $ | 0.33 | $ | 0.70 | $ | 0.51 | $ | 0.57 | |||||||
Diluted | 0.32 | 0.69 | 0.50 | 0.56 | |||||||||||
2016 | |||||||||||||||
(in thousands, except per share data) | 4th Quarter | 3rd Quarter | 2nd Quarter | 1st Quarter | |||||||||||
Interest income | $ | 39,438 | $ | 37,293 | $ | 37,033 | $ | 35,460 | |||||||
Interest expense | 3,984 | 3,463 | 3,250 | 3,032 | |||||||||||
Net interest income | 35,454 | 33,830 | 33,783 | 32,428 | |||||||||||
Provision for portfolio loan losses | 964 | 3,038 | 716 | 833 | |||||||||||
Provision reversal for purchased credit impaired loan losses | (343 | ) | (1,194 | ) | (336 | ) | (73 | ) | |||||||
Net interest income after provision for loan losses | 34,833 | 31,986 | 33,403 | 31,668 | |||||||||||
Noninterest income | 9,029 | 6,976 | 7,049 | 6,005 | |||||||||||
Noninterest expense | 23,181 | 20,814 | 21,353 | 20,762 | |||||||||||
Income before income tax expense | 20,681 | 18,148 | 19,099 | 16,911 | |||||||||||
Income tax expense | 7,053 | 6,316 | 6,747 | 5,886 | |||||||||||
Net income | $ | 13,628 | $ | 11,832 | $ | 12,352 | $ | 11,025 | |||||||
Earnings per common share: | |||||||||||||||
Basic | $ | 0.68 | $ | 0.59 | $ | 0.62 | $ | 0.55 | |||||||
Diluted | 0.67 | 0.59 | 0.61 | 0.54 | |||||||||||
119
NOTE 21 - NEW AUTHORITATIVE ACCOUNTING GUIDANCE
Financial Accounting Standards Board (the "FASB") Accounting Standards Update (the "ASU") 2018-02 "Income Statement - Reporting Comprehensive Income (Topic 220): Reclassification of Certain Tax Effects from Accumulated Other Comprehensive Income" In February 2018, the FASB issued ASU 2018-02, "Reclassification of Certain Tax Effects from Accumulated Other Comprehensive Income". The amendment allow a reclassification from accumulated other comprehensive income to retained earnings for stranded tax effects resulting from the Tax Cuts and Jobs Act. Entities will be able to early adopt the guidance in any interim or annual period for which financial statements have not yet been issued and apply it either (1) in the period of adoption or (2) retrospectively to each period in which the effect of the change in the federal income tax rate in the Tax Cuts and Jobs Act is recognized. It would also allow entities to elect to reclassify other stranded tax effects that relate to the Act but do not directly relate to the change in the federal rate (e.g., state taxes, changing from a worldwide tax system to a territorial system). Tax effects that are stranded in OCI for other reasons (e.g., prior changes in tax law, a change in valuation allowance) may not be reclassified. The Company plans to adopt this standard in the first quarter of 2018, and apply it to the same period. The adoption of this update will result in an increase to retained earnings of $0.8 million being reclassified from accumulated other comprehensive income.
FASB ASU 2017-12 "Derivatives and Hedging (Topic 815): Targeted Improvements to Accounting for Hedging Activities" In August 2017, the FASB issued ASU 2017-12, "Targeted Improvement to Accounting for Hedging Activities". The objective of ASU 2017-12 is to improve the financial reporting of hedging relationships by better aligning an entity's risk management activity with the economic objectives in undertaking those activities. In addition, the amendments in this update simplify the application of hedge accounting for preparers of financial statements, as well as improve the understandability of an entity's risk management activities being conveyed to financial statement users. The new guidance becomes effective for periods beginning after December 15, 2018, with early adoption being permitted. The Company elected early adoption of this standard as of January 1, 2018. The effect of this adoption will have a minimal impact on the Company's consolidated financial statements.
FASB ASU 2017-09 "Compensation - Stock Compensation (Topic 718): Scope of Modification Accounting" In May 2017, the FASB issued ASU 2017-09, "Compensation - Stock Compensation (Topic 718): Scope of Modification Accounting" which amends the scope of modification accounting for share-based payment awards. The amendments provide guidance on the types of changes to the terms or conditions of share-based payment awards to which an entity would be required to apply modification accounting with an intent to simplify the accounting under ASC 718. The amendments are effective for public business entities for annual periods beginning after December 15, 2017, including interim periods within those annual periods, with early adoption being permitted. The Company has evaluated the new guidance and does not expect it to have a material impact on the Company's consolidated financial statements.
FASB ASU 2017-08 "Receivables - Nonrefundable Fees and Other Costs (Subtopic 310-20), Premium Amortization on Purchased Callable Debt Securities" In March 2017, the FASB issued ASU 2017-08, "Receivables - Nonrefundable Fees and Other Costs (Subtopic 310-20)" which shortens the amortization period of certain callable debt securities held at a premium to the earliest call date. The amendments are effective for public business entities for annual periods beginning after December 15, 2018, including interim periods within those annual periods, with early adoption being permitted. The Company is currently evaluating the new guidance and has not determined the impact this standard may have on its financial statements.
FASB ASU 2016-13 "Financial Instruments - Credit Losses (Topic 326): Measurement of Credit Losses on Financial Instruments" In June 2016, the FASB issued ASU 2016-13, "Financial Instruments (Topic 326)" which changes the methodology for evaluating impairment of most financial instruments. The ASU replaces the currently used incurred loss model with a forward-looking expected loss model, which will generally result in a more timely recognition of losses. The guidance becomes effective for fiscal years beginning after December 15, 2019, including interim periods within those fiscal years. Early adoption is permitted for fiscal years beginning after December 15, 2018, including interim periods within those fiscal years. The Company is currently evaluating the new guidance and has not determined the impact this standard may have on its financial statements.
120
FASB ASU 2016-02 "Leases (Topic 842)" In February 2016, the FASB issued ASU 2016-02, "Leases (Topic 842)" which requires organizations that lease assets ("lessees") to recognize the assets and liabilities for the rights and obligations created by leases with terms of more than 12 months. The recognition, measurement, and presentation of expenses and cash flows arising from a lease by a lessee remains dependent on its classification as a finance or operating lease. The criteria for determining whether a lease is a finance or operating lease has not been significantly changed by this ASU. The ASU also requires additional disclosure of the amount, timing, and uncertainty of cash flows arising from leases, including qualitative and quantitative requirements. The guidance becomes effective for periods beginning after December 15, 2018, including interim periods therein. Early adoption will be permitted. The adoption of this standard will gross up the Company's Consolidated Balance Sheet and utilize capital, but it will have no impact on the Consolidated Statements of Operations.
FASB ASU 2016-01 "Financial Instruments-Overall (Subtopic 825-10): Recognition and Measurement of Financial Assets and Financial Liabilities" In January 2016, the FASB issued ASU 2016-01, "Financial Instruments-Overall (Subtopic 825-10): Recognition and Measurement of Financial Assets and Financial Liabilities." ASU 2016-01 requires equity investments to be measured at fair value through earnings, and eliminates the available-for-sale classification for equity securities with readily determinable fair values. For financial liabilities where the fair value option has been elected, changes in fair value due to instrument-specific credit risk must be recognized in other comprehensive income. When measuring the fair value of financial instruments at amortized cost, the exit price must be used for disclosure purposes. The ASU also requires that financial assets and liabilities be presented separately in the notes to the financial statements. This ASU becomes effective for fiscal years beginning after December 15, 2017, including interim periods therein. Early adoption is permitted with some exceptions. The Company has evaluated its applicable equity investments and determined that they primarily qualify for the measurement exception which allows those investments to be measured at their cost minus impairment. Any valuation adjustments will be recorded prospectively through net income, and the related disclosure will be included in the Notes to the Consolidated Financial Statements.
FASB ASU 2014-09, "Revenue from Contracts with Customers (Topic 606)" In May 2014, the FASB issued ASU 2014-09, “Revenue from Contracts with Customers”. The objective of ASU 2014-09 is to establish a single comprehensive model for entities to use in accounting for revenue arising from contracts with customers and will supersede most of the existing revenue recognition guidance, including industry-specific guidance. The core principle of ASU 2014-09 is that an entity recognizes revenue to depict the transfer of promised goods or services to customers in an amount that reflects the consideration to which the entity expects to be entitled in exchange for those goods or services. In applying the new guidance, an entity will (1) identify the contract(s) with a customer; (2) identify the performance obligations in the contract; (3) determine the transaction price; (4) allocate the transaction price to the contract’s performance obligations; and (5) recognize revenue when (or as) the entity satisfies a performance obligation. ASU 2014-09 applies to all contracts with customers except those that are within the scope of other topics in the FASB Accounting Standards Codification. In August 2015, the FASB issued ASU 2015-14, which defers the effective date of this guidance to annual reporting periods beginning after December 15, 2017 for public companies, and permits early adoption on a limited basis. The Company has conducted its initial assessment and is currently evaluating contracts to assess and quantify accounting methodology changes resulting from the adoption of ASU 2014-09. The majority of the Company’s revenues are derived from loans which are excluded from the new standard; therefore, the new guidance is not expected to have a material impact on the Company's consolidated financial position, results of operations or cash flows. The Company has decided upon the modified retrospective adoption method.
ITEM 9: CHANGES IN AND DISAGREEMENTS WITH ACCOUNTANTS ON ACCOUNTING AND FINANCIAL DISCLOSURE
None.
121
ITEM 9A: CONTROLS AND PROCEDURES
Evaluation of Disclosure Controls and Procedures
Our management, with the participation of our Chief Executive Officer and our Chief Financial Officer, evaluated the Company’s disclosure controls and procedures (as defined in Rule 13a-15(e) and 15d-15(e) under the Securities Exchange Act of 1934, as amended, the “Act”) as of December 31, 2017. Based upon this evaluation, our Chief Executive Officer and our Chief Financial Officer have concluded that as of December 31, 2017, such disclosure controls and procedures were effective to ensure that information required to be disclosed by the Company in the reports it files or submits under the Act is accumulated and communicated to the Company’s management (including the Chief Executive Officer and Chief Financial Officer) to allow timely decisions regarding required disclosure, and is recorded, processed, summarized and reported within the time periods specified in the SEC’s rules and forms.
Management's Assessment of Internal Control Over Financial Reporting
Management of the Company is responsible for establishing and maintaining adequate internal control over financial reporting (as defined in Rule 13a-15(e) and 15(d)-15(e) under the Securities Exchange Act of 1934, as amended, the “Act”). The Company’s internal control system is a process designed to provide reasonable assurance to the Company’s management and Board of Directors regarding the preparation and fair presentation of published financial statements.
The Company’s internal control over financial reporting includes policies and procedures that pertain to the maintenance of records that, in reasonable detail, accurately and fairly reflect transactions and dispositions of assets; provide reasonable assurances that transactions are recorded as necessary to permit preparation of financial statements in accordance with accounting principles generally accepted in the United States of America, and that receipts and expenditures are being made only in accordance with authorizations of management and the directors of the Company; and provide reasonable assurance regarding prevention or untimely detection of unauthorized acquisition, use or disposition of the Company’s assets that could have a material effect on the Company’s financial statements.
All internal control systems, no matter how well designed, have inherent limitations. Therefore, even those systems determined to be effective can provide only reasonable assurance with respect to financial reporting. Further, because of changes in conditions, the effectiveness of any system of internal control may vary over time. The design of any internal control system also factors in resource constraints and consideration for the benefit of the control relative to the cost of implementing the control. Because of these inherent limitations in any system of internal control, management cannot provide absolute assurance that all control issues and instances of fraud within the Company have been detected.
Management assessed the effectiveness of the Company’s internal control over financial reporting as of December 31, 2017. In making this assessment, management used the criteria set forth by the Internal Control - Integrated Framework (2013) issued by the Committee of Sponsoring Organizations of the Treadway Commission. Management has concluded that the Company maintained an effective system of internal control over financial reporting based on these criteria as of December 31, 2017.
The Company’s independent registered public accounting firm, Deloitte & Touche LLP, who audited the consolidated financial statements, has issued an audit report on the Company’s internal control over financial reporting as of December 31, 2017, and it is included herein.
Changes in Internal Control Over Financial Reporting
There have been no changes in the Company’s internal control over financial reporting (as defined in Rule 13a-15(f) and 15d-15(f) under the Act) that occurred during the Company’s quarter ended December 31, 2017 that have materially affected, or are reasonably likely to materially affect, the Company’s internal control over financial reporting.
ITEM 9B: OTHER INFORMATION
None.
122
PART III
ITEM 10: DIRECTORS, EXECUTIVE OFFICERS AND CORPORATE GOVERNANCE
The information required by this item is incorporated herein by reference to the Board and Committee Information and Executive Officer sections of the Company's Proxy Statement for its annual meeting to be held on Wednesday, May 2, 2018.
ITEM 11: EXECUTIVE COMPENSATION
The information required by this item is incorporated herein by reference to the Executive Compensation section of the Company's Proxy Statement for its annual meeting to be held on Wednesday, May 2, 2018.
ITEM 12: SECURITY OWNERSHIP OF CERTAIN BENEFICIAL OWNERS AND MANAGEMENT AND RELATED STOCKHOLDER MATTERS
The information required by this item is incorporated herein by reference to the Information Regarding Beneficial Ownership section of the Company's Proxy Statement for its annual meeting to be held on Wednesday, May 2, 2018.
ITEM 13: CERTAIN RELATIONSHIPS AND RELATED TRANSACTIONS AND DIRECTOR INDEPENDENCE
The information required by this item is incorporated herein by reference to the Related Person Transactions section of the Company's Proxy Statement for its annual meeting to be held on Wednesday, May 2, 2018.
ITEM 14: PRINCIPAL ACCOUNTANT FEES AND SERVICES
The information required by this item is incorporated by reference to the Fees Paid to Independent Registered Public Accounting Firm section of the Company's Proxy Statement for its annual meeting to be held on Wednesday, May 2, 2018.
123
PART IV
ITEM 15: EXHIBITS AND FINANCIAL STATEMENT SCHEDULES
(a) 1. Financial Statements
The consolidated financial statements of Enterprise Financial Services Corp and its subsidiaries and independent auditors' reports are included in Part II, Item 8, of this Form 10-K.
2. Financial Statement Schedules
All financial statement schedules have been omitted, as they are either inapplicable or included in the Notes to Consolidated Financial Statements.
3. Exhibits
No. Description
2.1 |
3.1 |
3.2 |
3.3 |
3.4 |
3.5 |
3.6 |
3.7 |
3.8 |
4.1 |
124
4.2 |
10.1.1* |
10.1.4* |
10.1.5* |
10.1.6* |
10.1.7* |
10.1.8* |
10.1.9* |
10.1.10* |
10.1.11* |
10.1.12* |
125
10.1.13* |
10.1.14* |
10.1.15* |
10.1.16* |
10.1.17* |
12.1 |
21.1 |
23.1 |
24.1 |
31.1 |
31.2 |
32.1 |
32.2 |
101 | Pursuant to Rule 405 of Regulation S-T, the following financial information from the Company's Annual Report on Form 10-K for the period ended December 31, 2017, is formatted in XBRL interactive data files: (i) Consolidated Balance Sheet at December 31, 2017 and December 31, 2016; (ii) Consolidated Statement of Income for the years ended December 31, 2017, 2016, and 2015; (iii) Consolidated Statement of Comprehensive Income for the years ended December 31, 2017, 2016, and 2015; (iv) Consolidated Statement of Changes in Equity for the years ended December 31, 2017, 2016, and 2015; (v) Consolidated Statement of Cash Flows for the years ended December 31, 2017, 2016, and 2015; and (vi) Notes to Financial Statements. |
* Management contract or compensatory plan or arrangement.
Note: In accordance with Item 601 (b) (4) (iii) of Regulation S-K, Registrant hereby agrees to furnish to the SEC, upon its request, a copy of any instrument that defines the rights of holders of each issue of long-term debt of Registrant and its consolidated subsidiaries for which consolidated and unconsolidated financial statements
126
are required to be filed and that authorizes a total amount of securities not in excess of ten percent of the total assets of the Registrant on a consolidated basis.
(b) The exhibits not incorporated by reference herein are filed herewith.
(c) The financial statement schedules are either included in the Notes to Consolidated Financial Statements or omitted if inapplicable.
ITEM 16: FORM 10-K SUMMARY
None.
127
SIGNATURES
Pursuant to the requirements of Section 13 or 15(d) of the Securities Act of 1934, the Registrant has duly caused this report to be signed on its behalf by the undersigned, thereunto duly authorized on February 23, 2018.
ENTERPRISE FINANCIAL SERVICES CORP
/s/ James B. Lally |
James B. Lally |
Chief Executive Officer |
128
Pursuant to the requirements of the Securities Act of 1934, this Report on Form 10-K has been signed by the following persons in the capacities indicated on February 23, 2018.
Signatures | Title | |
/s/ James B. Lally | Chief Executive Officer and Director (Principal Executive Officer) | |
James B. Lally | ||
/s/ Keene S. Turner | Executive Vice President and Chief Financial Officer (Principal Financial Officer) | |
Keene S. Turner | ||
/s/ Mark G. Ponder | Senior Vice President and Controller (Principal Accounting Officer) | |
Mark G. Ponder | ||
/s/ John S. Eulich* | ||
John S. Eulich | Chairman of the Board of Directors | |
/s/ John Q. Arnold* | ||
John Q. Arnold | Director | |
/s/ Michael A. DeCola* | ||
Michael A. DeCola | Director | |
/s/ Robert E. Guest, Jr.* | ||
Robert E. Guest, Jr. | Director | |
/s/ James M. Havel* | ||
James M. Havel | Director | |
/s/ Judith S. Heeter* | ||
Judith S. Heeter | Director | |
/s/ Michael R. Holmes* | ||
Michael R. Holmes | Director | |
/s/ Nevada A. Kent, IV* | ||
Nevada A. Kent, IV | Director | |
/s/ Michael T. Normile* | ||
Michael T. Normile | Director | |
/s/ Eloise E. Schmitz* | ||
Eloise E. Schmitz | Director | |
/s/ Sandra A. Van Trease* | ||
Sandra A. Van Trease | Director | |
*Signed by Power of Attorney.
129