Attached files
| file | filename |
|---|---|
| 8-K - 8-K - CURO Group Holdings Corp. | curo-20210416.htm |

Term Description ALL Allowance for loan losses CSO Credit services organization NCOs Net charge-offs POS Point-of-sale Revolving LOC Revolving Line of Credit SEC Securities and Exchange Commission Definitions of terms used throughout the Supplemental Financial Information Note: Amounts are now rounded in millions, which may cause immaterial rounding differences when compared to the historical presentation

Product US Canada Totals Product US Canada Totals Product US Canada Totals Open-End 31.1 32.0 63.1 Open-End 43.3 28.0 71.3 Open-End 29.6 17.6 47.2 Unsecured Installment 77.7 1.1 78.8 Unsecured Installment 134.0 1.7 135.7 Unsecured Installment 143.1 2.2 145.3 Secured Installment 16.8 - 16.8 Secured Installment 28.7 - 28.7 Secured Installment 29.5 - 29.5 Single-Pay 17.4 10.1 27.5 Single-Pay 30.2 19.7 49.9 Single-Pay 28.7 21.0 49.7 Ancillary 3.6 12.4 16.0 Ancillary 4.2 12.7 16.9 Ancillary 4.2 11.6 15.8 Total Revenue $146.6 $55.6 $202.2 Total Revenue $240.4 $62.1 $302.5 Total Revenue $235.1 $52.4 $287.5 Product US Canada Totals Product US Canada Totals Product US Canada Totals Open-End 30.4 28.3 58.7 Open-End 39.6 26.5 66.1 Open-End 27.6 12.7 40.3 Unsecured Installment 66.2 1.2 67.4 Unsecured Installment 135.5 1.7 137.2 Unsecured Installment 135.0 2.6 137.6 Secured Installment 16.7 - 16.7 Secured Installment 28.3 - 28.3 Secured Installment 28.6 - 28.6 Single-Pay 16.1 9.0 25.1 Single-Pay 29.1 20.2 49.3 Single-Pay 27.8 22.8 50.6 Ancillary 3.5 10.6 14.1 Ancillary 4.5 11.8 16.3 Ancillary 4.3 8.0 12.3 Total Revenue $132.9 $49.1 $182.0 Total Revenue $237.0 $60.2 $297.2 Total Revenue $223.3 $46.1 $269.4 Product US Canada Totals Product US Canada Totals Product US Canada Totals Open-End 30.9 25.8 56.7 Open-End 32.3 22.7 55.0 Open-End 23.3 4.0 27.3 Unsecured Installment 69.1 1.3 70.4 Unsecured Installment 120.5 1.6 122.1 Unsecured Installment 111.2 3.7 114.9 Secured Installment 19.4 - 19.4 Secured Installment 26.1 - 26.1 Secured Installment 25.8 - 25.8 Single-Pay 14.3 8.4 22.7 Single-Pay 26.4 19.1 45.5 Single-Pay 25.0 33.3 58.3 Ancillary 3.5 9.7 13.2 Ancillary 4.7 10.9 15.6 Ancillary 4.9 6.0 10.9 Total Revenue $137.2 $45.2 $182.4 Total Revenue $210.0 $54.3 $264.3 Total Revenue $190.2 $47.0 $237.2 Product US Canada Totals Product US Canada Totals Product US Canada Totals Open-End 42.0 29.0 71.0 Open-End 32.6 20.3 52.9 Open-End 25.8 1.4 27.2 Unsecured Installment 120.8 1.6 122.4 Unsecured Installment 134.0 1.8 135.8 Unsecured Installment 120.5 4.9 125.4 Secured Installment 26.3 - 26.3 Secured Installment 27.5 - 27.5 Secured Installment 26.9 - 26.9 Single-Pay 28.2 17.0 45.2 Single-Pay 27.2 19.6 46.8 Single-Pay 26.1 34.3 60.4 Ancillary 4.5 11.5 16.0 Ancillary 4.9 10.2 15.1 Ancillary 5.4 5.7 11.1 Total Revenue $221.8 $59.1 $280.9 Total Revenue $226.2 $51.9 $278.1 Total Revenue $204.7 $46.3 $251.0 (a) For all periods presented, the former U.K. segment (discontinued as of February 25, 2019) is excluded. Second Quarter Second Quarter Second Quarter First QuarterFirst QuarterFirst Quarter Revenue by Country and Product 2018 (a) Fourth Quarter Third QuarterThird QuarterThird Quarter Fourth Quarter 2020 Fourth Quarter 2019 (a) (in millions) Historical Presentation
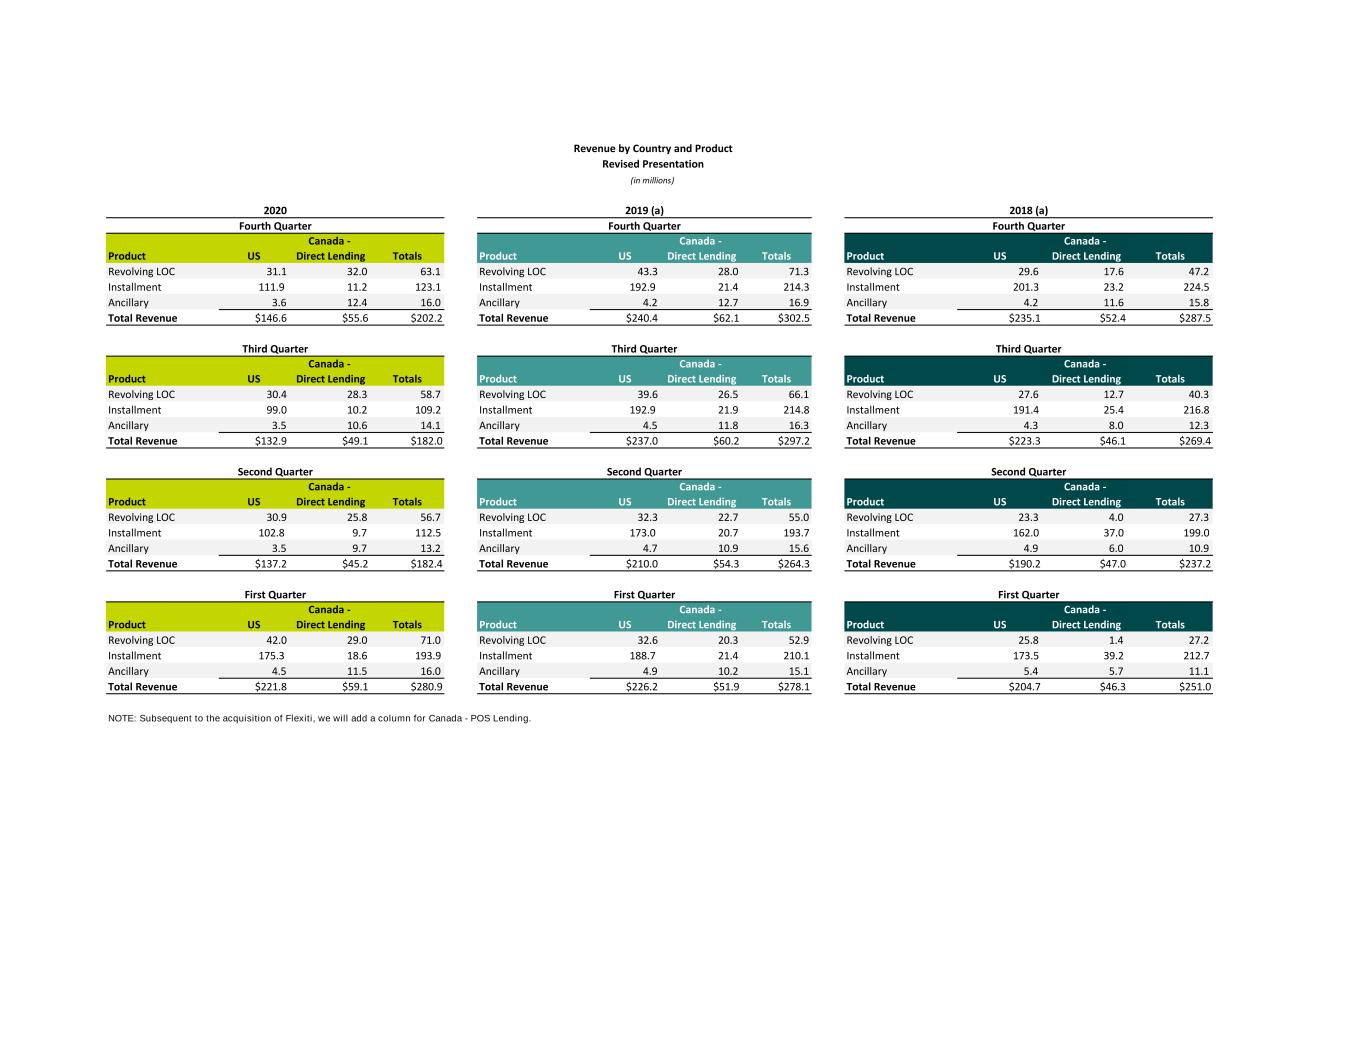
Product US Canada - Direct Lending Totals Product US Canada - Direct Lending Totals Product US Canada - Direct Lending Totals Revolving LOC 31.1 32.0 63.1 Revolving LOC 43.3 28.0 71.3 Revolving LOC 29.6 17.6 47.2 Installment 111.9 11.2 123.1 Installment 192.9 21.4 214.3 Installment 201.3 23.2 224.5 Ancillary 3.6 12.4 16.0 Ancillary 4.2 12.7 16.9 Ancillary 4.2 11.6 15.8 Total Revenue $146.6 $55.6 $202.2 Total Revenue $240.4 $62.1 $302.5 Total Revenue $235.1 $52.4 $287.5 Product US Canada - Direct Lending Totals Product US Canada - Direct Lending Totals Product US Canada - Direct Lending Totals Revolving LOC 30.4 28.3 58.7 Revolving LOC 39.6 26.5 66.1 Revolving LOC 27.6 12.7 40.3 Installment 99.0 10.2 109.2 Installment 192.9 21.9 214.8 Installment 191.4 25.4 216.8 Ancillary 3.5 10.6 14.1 Ancillary 4.5 11.8 16.3 Ancillary 4.3 8.0 12.3 Total Revenue $132.9 $49.1 $182.0 Total Revenue $237.0 $60.2 $297.2 Total Revenue $223.3 $46.1 $269.4 Product US Canada - Direct Lending Totals Product US Canada - Direct Lending Totals Product US Canada - Direct Lending Totals Revolving LOC 30.9 25.8 56.7 Revolving LOC 32.3 22.7 55.0 Revolving LOC 23.3 4.0 27.3 Installment 102.8 9.7 112.5 Installment 173.0 20.7 193.7 Installment 162.0 37.0 199.0 Ancillary 3.5 9.7 13.2 Ancillary 4.7 10.9 15.6 Ancillary 4.9 6.0 10.9 Total Revenue $137.2 $45.2 $182.4 Total Revenue $210.0 $54.3 $264.3 Total Revenue $190.2 $47.0 $237.2 Product US Canada - Direct Lending Totals Product US Canada - Direct Lending Totals Product US Canada - Direct Lending Totals Revolving LOC 42.0 29.0 71.0 Revolving LOC 32.6 20.3 52.9 Revolving LOC 25.8 1.4 27.2 Installment 175.3 18.6 193.9 Installment 188.7 21.4 210.1 Installment 173.5 39.2 212.7 Ancillary 4.5 11.5 16.0 Ancillary 4.9 10.2 15.1 Ancillary 5.4 5.7 11.1 Total Revenue $221.8 $59.1 $280.9 Total Revenue $226.2 $51.9 $278.1 Total Revenue $204.7 $46.3 $251.0 NOTE: Subsequent to the acquisition of Flexiti, we will add a column for Canada - POS Lending. Second Quarter Second Quarter Second Quarter First QuarterFirst QuarterFirst Quarter Revised Presentation Revenue by Country and Product 2018 (a) Fourth Quarter Third QuarterThird QuarterThird Quarter Fourth Quarter 2020 Fourth Quarter 2019 (a) (in millions)
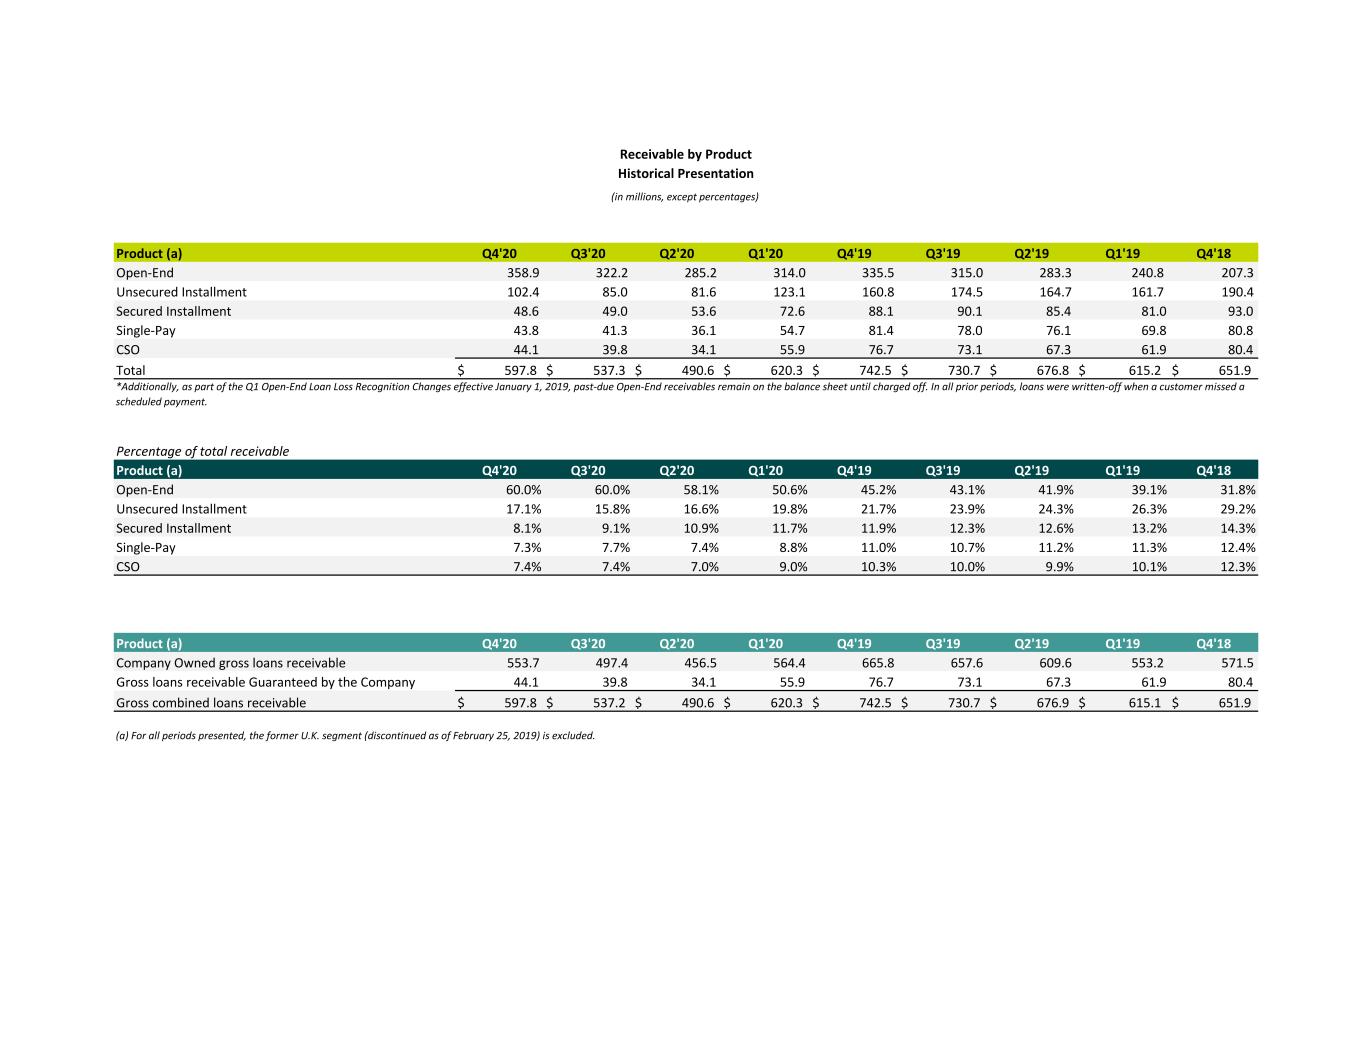
Product (a) Q4'20 Q3'20 Q2'20 Q1'20 Q4'19 Q3'19 Q2'19 Q1'19 Q4'18 Open-End 358.9 322.2 285.2 314.0 335.5 315.0 283.3 240.8 207.3 Unsecured Installment 102.4 85.0 81.6 123.1 160.8 174.5 164.7 161.7 190.4 Secured Installment 48.6 49.0 53.6 72.6 88.1 90.1 85.4 81.0 93.0 Single-Pay 43.8 41.3 36.1 54.7 81.4 78.0 76.1 69.8 80.8 CSO 44.1 39.8 34.1 55.9 76.7 73.1 67.3 61.9 80.4 Total $ 597.8 $ 537.3 $ 490.6 $ 620.3 $ 742.5 $ 730.7 $ 676.8 $ 615.2 $ 651.9 Percentage of total receivable Product (a) Q4'20 Q3'20 Q2'20 Q1'20 Q4'19 Q3'19 Q2'19 Q1'19 Q4'18 Open-End 60.0% 60.0% 58.1% 50.6% 45.2% 43.1% 41.9% 39.1% 31.8% Unsecured Installment 17.1% 15.8% 16.6% 19.8% 21.7% 23.9% 24.3% 26.3% 29.2% Secured Installment 8.1% 9.1% 10.9% 11.7% 11.9% 12.3% 12.6% 13.2% 14.3% Single-Pay 7.3% 7.7% 7.4% 8.8% 11.0% 10.7% 11.2% 11.3% 12.4% CSO 7.4% 7.4% 7.0% 9.0% 10.3% 10.0% 9.9% 10.1% 12.3% Product (a) Q4'20 Q3'20 Q2'20 Q1'20 Q4'19 Q3'19 Q2'19 Q1'19 Q4'18 Company Owned gross loans receivable 553.7 497.4 456.5 564.4 665.8 657.6 609.6 553.2 571.5 Gross loans receivable Guaranteed by the Company 44.1 39.8 34.1 55.9 76.7 73.1 67.3 61.9 80.4 Gross combined loans receivable $ 597.8 $ 537.2 $ 490.6 $ 620.3 $ 742.5 $ 730.7 $ 676.9 $ 615.1 $ 651.9 (in millions, except percentages) Receivable by Product (a) For all periods presented, the former U.K. segment (discontinued as of February 25, 2019) is excluded. Historical Presentation *Additionally, as part of the Q1 Open-End Loan Loss Recognition Changes effective January 1, 2019, past-due Open-End receivables remain on the balance sheet until charged off. In all prior periods, loans were written-off when a customer missed a scheduled payment.
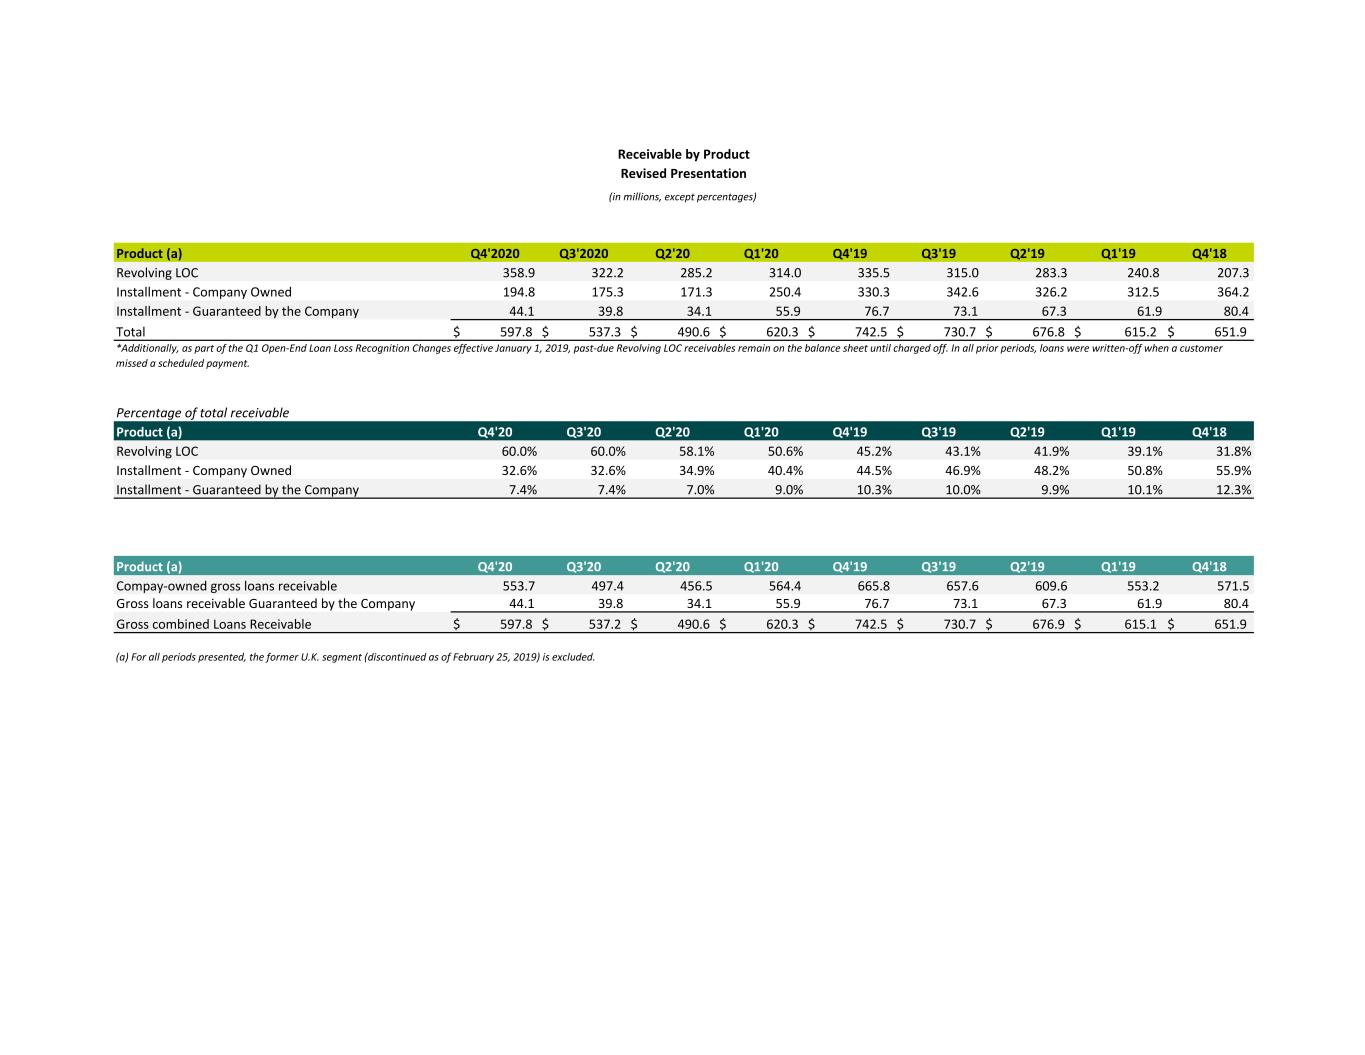
Product (a) Q4'2020 Q3'2020 Q2'20 Q1'20 Q4'19 Q3'19 Q2'19 Q1'19 Q4'18 Revolving LOC 358.9 322.2 285.2 314.0 335.5 315.0 283.3 240.8 207.3 Installment - Company Owned 194.8 175.3 171.3 250.4 330.3 342.6 326.2 312.5 364.2 Installment - Guaranteed by the Company 44.1 39.8 34.1 55.9 76.7 73.1 67.3 61.9 80.4 Total $ 597.8 $ 537.3 $ 490.6 $ 620.3 $ 742.5 $ 730.7 $ 676.8 $ 615.2 $ 651.9 Percentage of total receivable Product (a) Q4'20 Q3'20 Q2'20 Q1'20 Q4'19 Q3'19 Q2'19 Q1'19 Q4'18 Revolving LOC 60.0% 60.0% 58.1% 50.6% 45.2% 43.1% 41.9% 39.1% 31.8% Installment - Company Owned 32.6% 32.6% 34.9% 40.4% 44.5% 46.9% 48.2% 50.8% 55.9% Installment - Guaranteed by the Company 7.4% 7.4% 7.0% 9.0% 10.3% 10.0% 9.9% 10.1% 12.3% Product (a) Q4'20 Q3'20 Q2'20 Q1'20 Q4'19 Q3'19 Q2'19 Q1'19 Q4'18 Compay-owned gross loans receivable 553.7 497.4 456.5 564.4 665.8 657.6 609.6 553.2 571.5 Gross loans receivable Guaranteed by the Company 44.1 39.8 34.1 55.9 76.7 73.1 67.3 61.9 80.4 Gross combined Loans Receivable $ 597.8 $ 537.2 $ 490.6 $ 620.3 $ 742.5 $ 730.7 $ 676.9 $ 615.1 $ 651.9 (a) For all periods presented, the former U.K. segment (discontinued as of February 25, 2019) is excluded. (in millions, except percentages) Receivable by Product *Additionally, as part of the Q1 Open-End Loan Loss Recognition Changes effective January 1, 2019, past-due Revolving LOC receivables remain on the balance sheet until charged off. In all prior periods, loans were written-off when a customer missed a scheduled payment. Revised Presentation
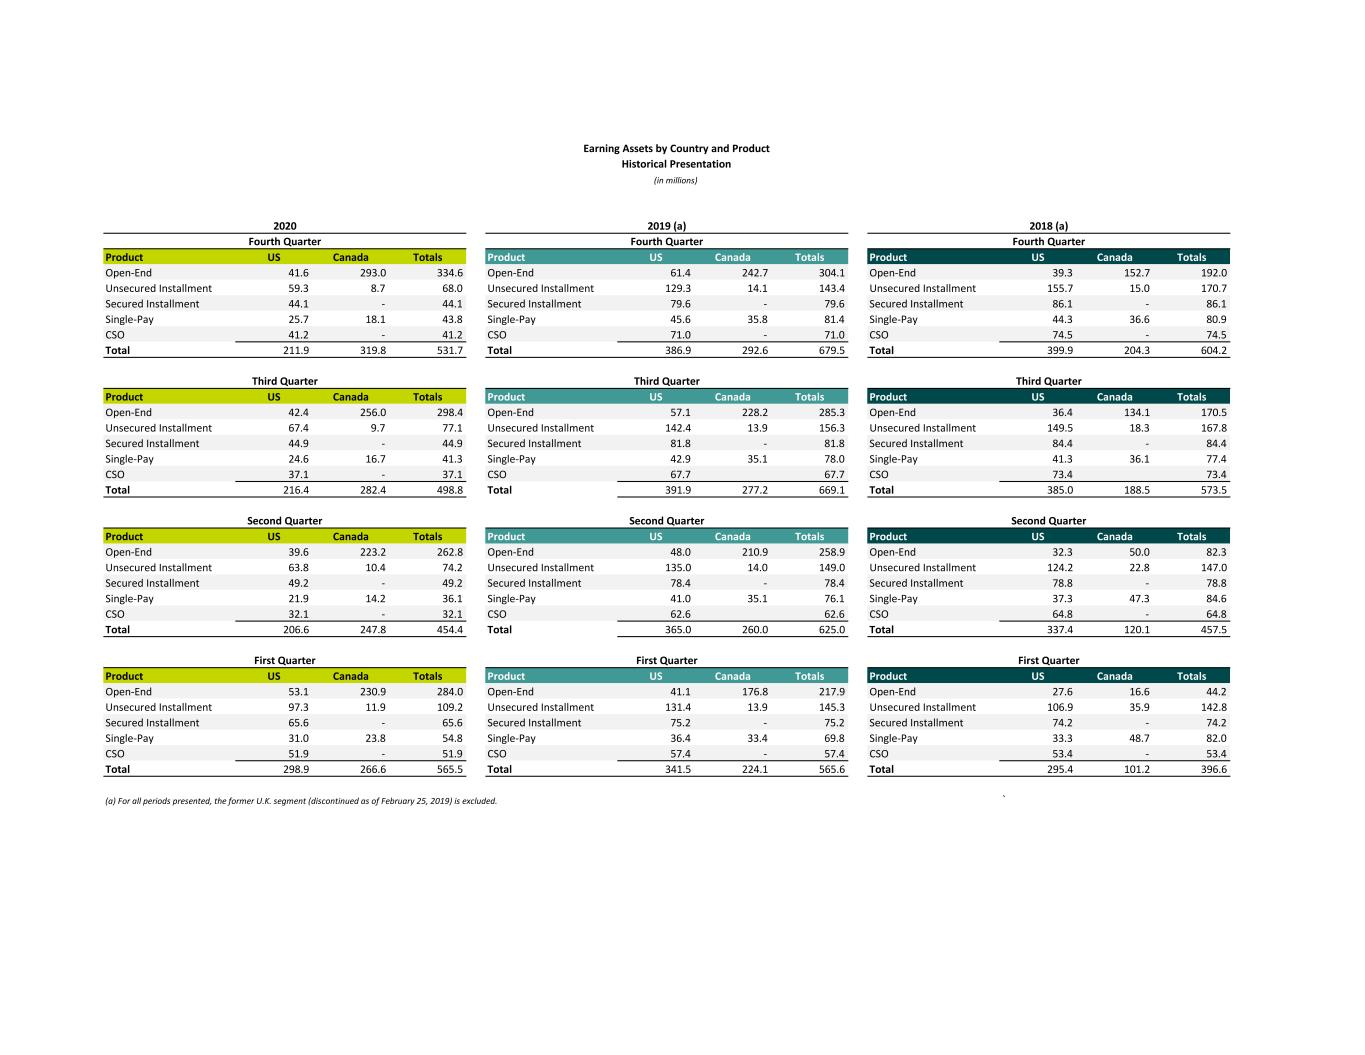
Product US Canada Totals Product US Canada Totals Product US Canada Totals Open-End 41.6 293.0 334.6 Open-End 61.4 242.7 304.1 Open-End 39.3 152.7 192.0 Unsecured Installment 59.3 8.7 68.0 Unsecured Installment 129.3 14.1 143.4 Unsecured Installment 155.7 15.0 170.7 Secured Installment 44.1 - 44.1 Secured Installment 79.6 - 79.6 Secured Installment 86.1 - 86.1 Single-Pay 25.7 18.1 43.8 Single-Pay 45.6 35.8 81.4 Single-Pay 44.3 36.6 80.9 CSO 41.2 - 41.2 CSO 71.0 - 71.0 CSO 74.5 - 74.5 Total 211.9 319.8 531.7 Total 386.9 292.6 679.5 Total 399.9 204.3 604.2 Product US Canada Totals Product US Canada Totals Product US Canada Totals Open-End 42.4 256.0 298.4 Open-End 57.1 228.2 285.3 Open-End 36.4 134.1 170.5 Unsecured Installment 67.4 9.7 77.1 Unsecured Installment 142.4 13.9 156.3 Unsecured Installment 149.5 18.3 167.8 Secured Installment 44.9 - 44.9 Secured Installment 81.8 - 81.8 Secured Installment 84.4 - 84.4 Single-Pay 24.6 16.7 41.3 Single-Pay 42.9 35.1 78.0 Single-Pay 41.3 36.1 77.4 CSO 37.1 - 37.1 CSO 67.7 67.7 CSO 73.4 73.4 Total 216.4 282.4 498.8 Total 391.9 277.2 669.1 Total 385.0 188.5 573.5 Product US Canada Totals Product US Canada Totals Product US Canada Totals Open-End 39.6 223.2 262.8 Open-End 48.0 210.9 258.9 Open-End 32.3 50.0 82.3 Unsecured Installment 63.8 10.4 74.2 Unsecured Installment 135.0 14.0 149.0 Unsecured Installment 124.2 22.8 147.0 Secured Installment 49.2 - 49.2 Secured Installment 78.4 - 78.4 Secured Installment 78.8 - 78.8 Single-Pay 21.9 14.2 36.1 Single-Pay 41.0 35.1 76.1 Single-Pay 37.3 47.3 84.6 CSO 32.1 - 32.1 CSO 62.6 62.6 CSO 64.8 - 64.8 Total 206.6 247.8 454.4 Total 365.0 260.0 625.0 Total 337.4 120.1 457.5 Product US Canada Totals Product US Canada Totals Product US Canada Totals Open-End 53.1 230.9 284.0 Open-End 41.1 176.8 217.9 Open-End 27.6 16.6 44.2 Unsecured Installment 97.3 11.9 109.2 Unsecured Installment 131.4 13.9 145.3 Unsecured Installment 106.9 35.9 142.8 Secured Installment 65.6 - 65.6 Secured Installment 75.2 - 75.2 Secured Installment 74.2 - 74.2 Single-Pay 31.0 23.8 54.8 Single-Pay 36.4 33.4 69.8 Single-Pay 33.3 48.7 82.0 CSO 51.9 - 51.9 CSO 57.4 - 57.4 CSO 53.4 - 53.4 Total 298.9 266.6 565.5 Total 341.5 224.1 565.6 Total 295.4 101.2 396.6 ` First QuarterFirst QuarterFirst Quarter (a) For all periods presented, the former U.K. segment (discontinued as of February 25, 2019) is excluded. Third QuarterThird QuarterThird Quarter Second Quarter Second Quarter Second Quarter Fourth Quarter 2020 Fourth Quarter 2019 (a) Earning Assets by Country and Product (in millions) 2018 (a) Fourth Quarter Historical Presentation
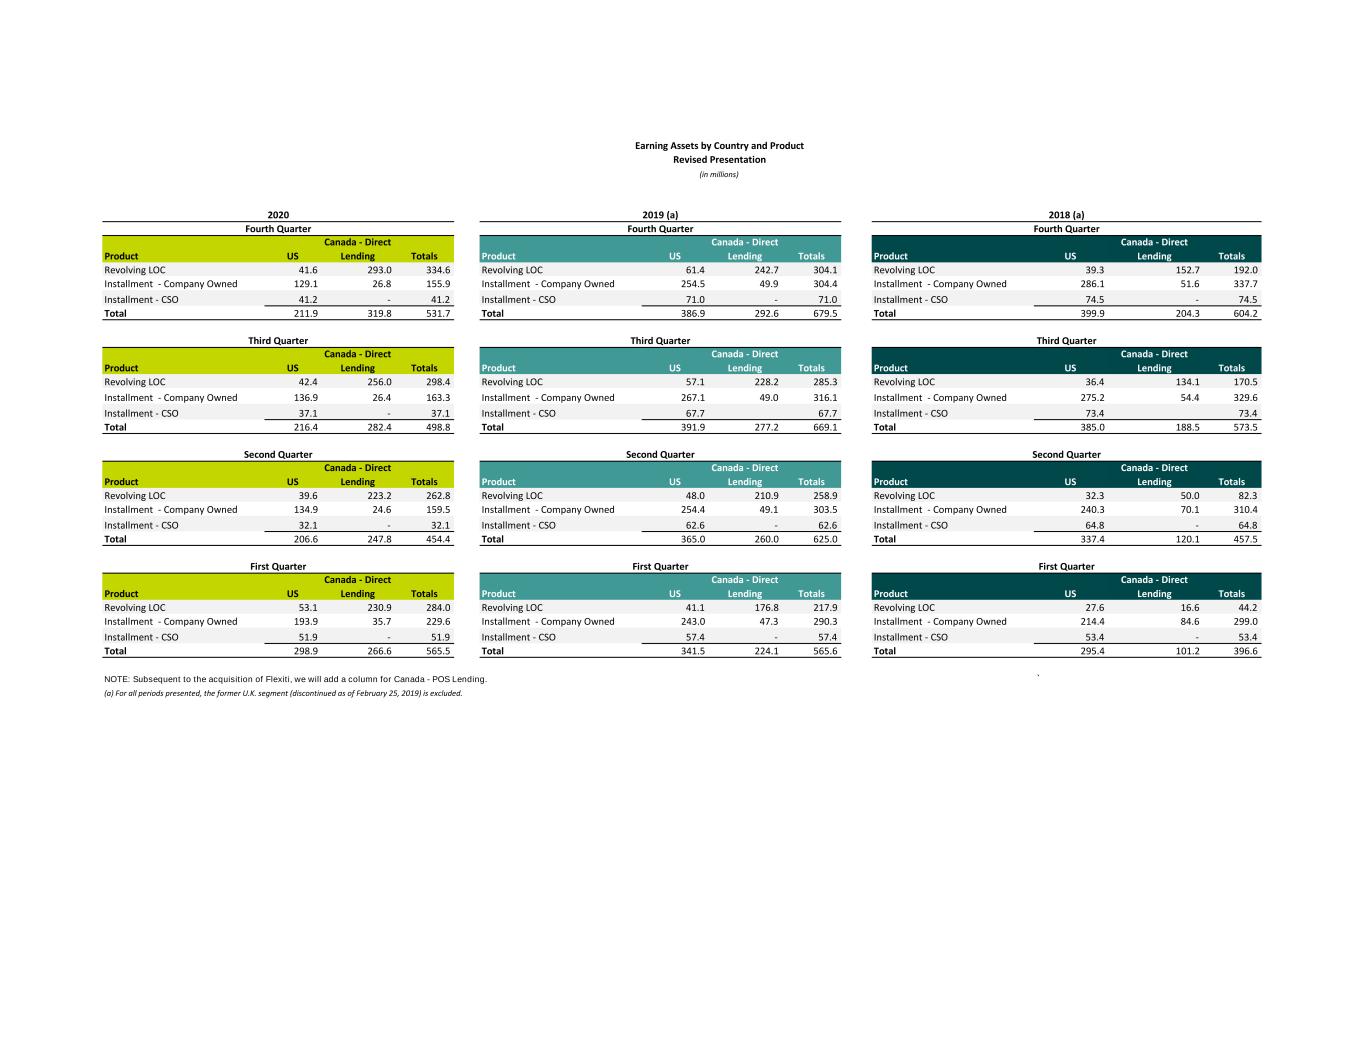
Product US Canada - Direct Lending Totals Product US Canada - Direct Lending Totals Product US Canada - Direct Lending Totals Revolving LOC 41.6 293.0 334.6 Revolving LOC 61.4 242.7 304.1 Revolving LOC 39.3 152.7 192.0 Installment - Company Owned 129.1 26.8 155.9 Installment - Company Owned 254.5 49.9 304.4 Installment - Company Owned 286.1 51.6 337.7 Installment - CSO 41.2 - 41.2 Installment - CSO 71.0 - 71.0 Installment - CSO 74.5 - 74.5 Total 211.9 319.8 531.7 Total 386.9 292.6 679.5 Total 399.9 204.3 604.2 Product US Canada - Direct Lending Totals Product US Canada - Direct Lending Totals Product US Canada - Direct Lending Totals Revolving LOC 42.4 256.0 298.4 Revolving LOC 57.1 228.2 285.3 Revolving LOC 36.4 134.1 170.5 Installment - Company Owned 136.9 26.4 163.3 Installment - Company Owned 267.1 49.0 316.1 Installment - Company Owned 275.2 54.4 329.6 Installment - CSO 37.1 - 37.1 Installment - CSO 67.7 67.7 Installment - CSO 73.4 73.4 Total 216.4 282.4 498.8 Total 391.9 277.2 669.1 Total 385.0 188.5 573.5 Product US Canada - Direct Lending Totals Product US Canada - Direct Lending Totals Product US Canada - Direct Lending Totals Revolving LOC 39.6 223.2 262.8 Revolving LOC 48.0 210.9 258.9 Revolving LOC 32.3 50.0 82.3 Installment - Company Owned 134.9 24.6 159.5 Installment - Company Owned 254.4 49.1 303.5 Installment - Company Owned 240.3 70.1 310.4 Installment - CSO 32.1 - 32.1 Installment - CSO 62.6 - 62.6 Installment - CSO 64.8 - 64.8 Total 206.6 247.8 454.4 Total 365.0 260.0 625.0 Total 337.4 120.1 457.5 Product US Canada - Direct Lending Totals Product US Canada - Direct Lending Totals Product US Canada - Direct Lending Totals Revolving LOC 53.1 230.9 284.0 Revolving LOC 41.1 176.8 217.9 Revolving LOC 27.6 16.6 44.2 Installment - Company Owned 193.9 35.7 229.6 Installment - Company Owned 243.0 47.3 290.3 Installment - Company Owned 214.4 84.6 299.0 Installment - CSO 51.9 - 51.9 Installment - CSO 57.4 - 57.4 Installment - CSO 53.4 - 53.4 Total 298.9 266.6 565.5 Total 341.5 224.1 565.6 Total 295.4 101.2 396.6 NOTE: Subsequent to the acquisition of Flexiti, we will add a column for Canada - POS Lending. ` Second Quarter Revised Presentation Fourth Quarter 2020 Fourth Quarter 2019 (a) (a) For all periods presented, the former U.K. segment (discontinued as of February 25, 2019) is excluded. Earning Assets by Country and Product (in millions) 2018 (a) Fourth Quarter First QuarterFirst QuarterFirst Quarter Third QuarterThird QuarterThird Quarter Second Quarter Second Quarter

Open-End loans: (a) Q1 2021 Q3 2020 Q2 2020 Q1 2020 Q4 2019 (b) Q3 2019 (b) Q2 2019 (b) Q1 2019 (b) Revenue $63.1 $58.7 $56.7 $71.0 $71.3 $66.1 $55.0 $52.9 Provision for losses 20.3 21.7 21.3 41.0 37.8 31.2 29.4 25.3 Net revenue $42.8 $37.0 $35.4 $30.0 $33.5 $34.9 $25.6 $27.6 NCOs $21.4 $18.2 $31.7 $37.1 $37.4 $28.2 $25.2 $(1.5) Open-End gross loan balances: Open-End gross loans receivable $358.9 $322.2 $285.2 $314.0 $335.5 $315.0 $283.3 $240.8 Average Open-End gross loans receivable (1) $340.6 $303.7 $299.6 $324.8 $325.2 $299.1 $262.1 $224.1 Open-End allowance for loan losses: Allowance for loan losses $52.0 $51.4 $47.3 $56.5 $55.1 $54.2 $51.7 $47.0 Open-End Allowance for loan losses as a percentage of Open-End gross loans receivable 14.5% 16.0% 16.6% 18.0% 16.4% 17.2% 18.2% 19.5% Open-End past-due balances: Open-End past-due gross loans receivable $37.8 $31.8 $31.2 $50.0 $50.1 $46.1 $35.4 $32.4 Past-due Open-End gross loans receivable - percentage 10.5% 9.9% 10.9% 15.9% 14.9% 14.6% 12.5% 13.5% Open-End ratios: NCO rate (2) 6.3% 6.0% 10.6% 11.4% 11.5% 9.4% 9.6% -0.7% Open End Loan Summary (in millions except percentages) (1) Average gross loans receivable calculated as average of beginning of quarter and end of quarter gross loans receivable. (2) We calculate NCO rate as NCOs divided by Average gross loans receivables. (b) NCOs were impacted by the Q1 2019 Open-End Loss Recognition Change. Refer to the Company's Form 10-K for the year ended December 31, 2019 filed with the SEC on March 9, 2020 for additional details. (a) For all periods presented, the former U.K. segment (discontinued as of February 25, 2019) is excluded. Historical Presentation

Unsecured Installment loans: (a) Q1 2021 Q3 2020 Q2 2020 Q1 2020 Q4 2019 Q3 2019 Q2 2019 Q1 2019 Revenue - Company Owned $36.4 $31.2 $33.4 $55.6 $63.4 $65.8 $59.8 $65.5 Provision for losses - Company Owned 16.5 9.6 12.6 26.2 33.2 31.9 33.5 33.8 Net revenue - Company Owned $19.9 $21.6 $20.8 $29.4 $30.2 $33.9 $26.3 $31.7 NCOs - Company Owned $11.3 $9.6 $23.1 $32.8 $35.7 $29.0 $32.0 $37.9 Revenue - Guaranteed by the Company (1) $42.4 $36.2 $37.0 $66.8 $72.2 $71.4 $62.3 $70.2 Provision for losses - Guaranteed by the Company (1) 22.5 14.9 11.4 26.3 34.9 36.7 28.3 27.4 Net revenue - Guaranteed by the Company (1) $19.9 $21.3 $25.6 $40.5 $37.3 $34.7 $34.0 $42.8 NCOs - Guaranteed by the Company (1) $21.5 $13.9 $15.4 $27.7 $34.5 $35.9 $27.5 $30.4 Unsecured Installment gross combined loans receivable: Company Owned $102.4 $85.0 $81.6 $123.1 $160.8 $174.5 $164.7 $161.7 Guaranteed by the Company (1) 43.2 38.8 33.1 54.1 74.3 70.7 65.1 59.7 Unsecured Installment gross combined loans receivable (1)(2) $145.6 $123.8 $114.7 $177.2 $235.1 $245.2 $229.8 $221.5 Average gross loans receivable: Average Unsecured Installment gross loans receivable - Company Owned (3) $93.7 $83.3 $102.4 $142.0 $167.6 $169.6 $163.2 $176.1 Average Unsecured Installment gross loans receivable - Guaranteed by the Company (1)(3) $41.0 $36.0 $43.6 $64.2 $72.5 $67.9 $62.4 $68.6 Allowance for loan losses and CSO liability for losses: Unsecured Installment Allowance for loan losses (4) $24.1 $18.9 $18.5 $29.0 $35.6 $38.1 $35.2 $33.7 Unsecured Installment CSO liability for losses (1)(4) $7.2 $6.1 $5.1 $9.1 $10.6 $10.2 $9.4 $8.6 Unsecured Installment Allowance for loan losses as a percentage of Unsecured Installment gross loans receivable 23.5 % 22.2 % 22.7 % 23.6 % 22.1 % 21.8 % 21.4 % 20.8 % Unsecured Installment CSO liability for losses as a percentage of Unsecured Installment gross loans Guaranteed by the Company (1) 16.7 % 15.7 % 15.4 % 16.8 % 14.3 % 14.4 % 14.4 % 14.4 % Unsecured Installment past-due balances: Unsecured Installment gross loans receivable - Company Owned $24.2 $17.9 $17.8 $35.0 $43.1 $46.5 $38.0 $40.8 Unsecured Installment gross loans - Guaranteed by the Company (1) $6.1 $6.0 $4.0 $9.2 $12.5 $11.8 $10.1 $8.0 Past-due Unsecured Installment Company Owned gross loans receivable -- percentage 23.6 % 21.1 % 21.8 % 28.4 % 26.8 % 26.6 % 23.1 % 25.2 % Past-due Unsecured Installment gross loans Guaranteed by the Company -- percentage (1) 14.1 % 15.5 % 12.1 % 17.0 % 16.8 % 16.7 % 15.5 % 13.3 % Unsecured Installment other information: Originations - Company Owned $66.5 $49.8 $24.4 $55.9 $87.1 $107.3 $102.8 $78.5 Originations - Guaranteed by the Company (1) $57.1 $51.4 $33.7 $64.8 $91.0 $89.6 $80.4 $68.9 Unsecured Installment ratios: NCO rate - Company Owned (5) 12.1 % 11.5 % 22.6 % 23.1 % 21.3 % 17.1 % 19.6 % 21.5 % NCO rate - Guaranteed by the Company (1)(5) 52.4 % 38.6 % 35.3 % 43.1 % 47.6 % 52.9 % 44.1 % 44.3 % Unsecured Installment Loan Summary (in millions except percentages) (1) Includes loans originated by third-party lenders through CSO programs, which are not included in the Condensed Consolidated Financial Statements. Historical Presentation (a) For all periods presented, the former U.K. segment (discontinued as of February 25, 2019) is excluded. (5) We calculate NCO rate as NCOs divided by Average gross loans receivables. (4) We report Allowance for loan losses as a contra-asset reducing gross loans receivable and the CSO liability for losses as a liability on the Condensed Consolidated Balance Sheets. (3) Average gross loans receivable calculated as average of beginning of quarter and end of quarter gross loans receivable. (2) Non-GAAP measure. For a description of each non-GAAP metric, see "Non-GAAP Financial Measures."

Secured Installment loans: (a) Q4 2020 Q3 2020 Q2 2020 Q1 2020 Q4 2019 Q3 2019 Q2 2019 Q1 2019 Revenue $16.8 $16.7 $19.4 $26.3 $28.7 $28.3 $26.1 $27.5 Provision for losses 4.0 3.3 7.2 9.7 11.5 8.8 7.8 7.1 Net revenue $12.8 $13.4 $12.2 $16.6 $17.2 $19.5 $18.3 $20.4 NCOs $4.1 $4.0 $9.1 $10.3 $11.5 $8.5 $7.6 $9.8 Secured Installment gross combined loan balances: Secured Installment gross combined loans receivable (1)(2) $49.6 $49.9 $54.6 $74.4 $90.4 $92.5 $87.7 $83.1 Average Secured Installment gross combined loans receivable (3) $49.7 $52.3 $64.5 $82.4 $91.4 $90.1 $85.4 $89.5 Secured Installment Allowance for loan losses and CSO liability for losses (4) $7.1 $7.2 $7.9 $9.8 $10.4 $10.4 $10.1 $9.9 Secured Installment Allowance for loan losses and CSO liability for losses as a percentage of Secured Installment gross combined loans receivable (1) 14.3% 14.4% 14.5% 13.2% 11.5% 11.2% 11.5% 11.9% Secured Installment past-due balances: Secured Installment past-due gross combined loans receivable (1)(2) $8.4 $7.7 $9.1 $15.6 $17.9 $17.6 $14.6 $13.9 Past-due Secured Installment gross combined loans receivable -- percentage (1) 16.9% 15.4% 16.7% 21.0% 19.8% 19.0% 16.6% 16.7% Secured Installment other information: Originations (2) $21.9 $19.2 $11.2 $21.0 $41.0 $46.0 $49.1 $33.5 Secured Installment ratios: NCO Rate (5) 8.2% 7.6% 14.1% 12.5% 12.6% 9.4% 8.9% 10.9% (4) We report Allowance for loan losses as a contra-asset reducing gross loans receivable and the CSO liability for losses as a liability on the Consolidated Balance Sheets. (5) We calculate NCO rate as NCOs divided by Average gross loans receivables. (a) For all periods presented, the former U.K. segment (discontinued as of February 25, 2019) is excluded. Secured Installment Loan Summary (in thousands except percentages) (1) Non-GAAP measure. For a description of each non-GAAP metric, see "Non-GAAP Financial Measures." (2) Includes loans originated by third-party lenders through CSO programs, which are not included in the Consolidated Financial Statements. (3) Average gross loans receivable calculated as average of beginning of quarter and end of quarter gross loans receivable. Historical Presentation
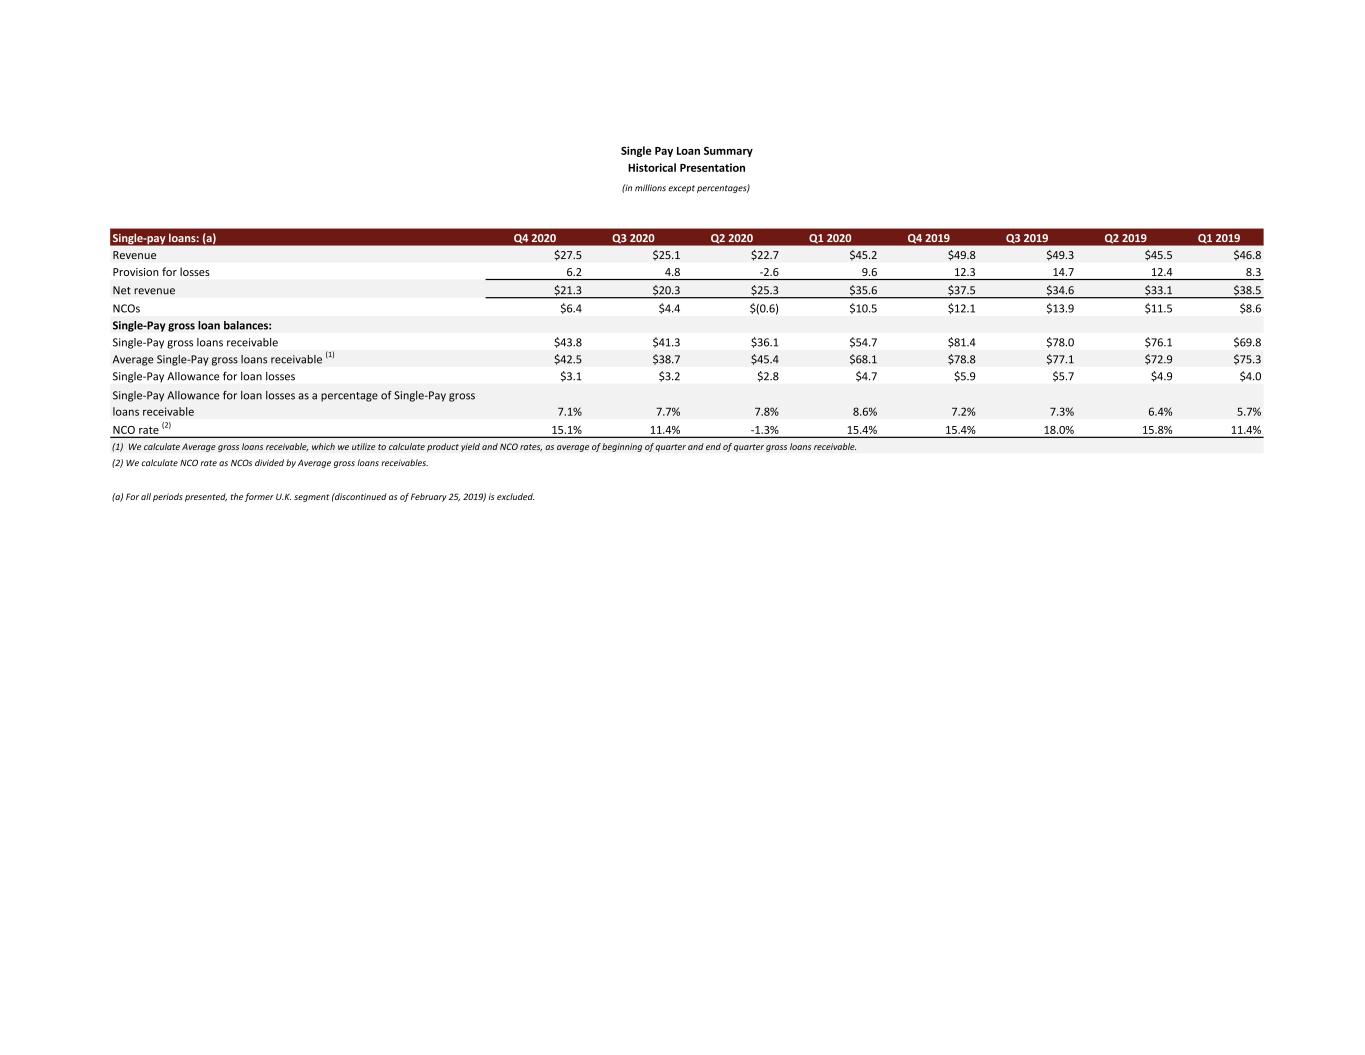
Single-pay loans: (a) Q4 2020 Q3 2020 Q2 2020 Q1 2020 Q4 2019 Q3 2019 Q2 2019 Q1 2019 Revenue $27.5 $25.1 $22.7 $45.2 $49.8 $49.3 $45.5 $46.8 Provision for losses 6.2 4.8 -2.6 9.6 12.3 14.7 12.4 8.3 Net revenue $21.3 $20.3 $25.3 $35.6 $37.5 $34.6 $33.1 $38.5 NCOs $6.4 $4.4 $(0.6) $10.5 $12.1 $13.9 $11.5 $8.6 Single-Pay gross loan balances: Single-Pay gross loans receivable $43.8 $41.3 $36.1 $54.7 $81.4 $78.0 $76.1 $69.8 Average Single-Pay gross loans receivable (1) $42.5 $38.7 $45.4 $68.1 $78.8 $77.1 $72.9 $75.3 Single-Pay Allowance for loan losses $3.1 $3.2 $2.8 $4.7 $5.9 $5.7 $4.9 $4.0 Single-Pay Allowance for loan losses as a percentage of Single-Pay gross loans receivable 7.1% 7.7% 7.8% 8.6% 7.2% 7.3% 6.4% 5.7% NCO rate (2) 15.1% 11.4% -1.3% 15.4% 15.4% 18.0% 15.8% 11.4% Single Pay Loan Summary (in millions except percentages) (2) We calculate NCO rate as NCOs divided by Average gross loans receivables. (1) We calculate Average gross loans receivable, which we utilize to calculate product yield and NCO rates, as average of beginning of quarter and end of quarter gross loans receivable. (a) For all periods presented, the former U.K. segment (discontinued as of February 25, 2019) is excluded. Historical Presentation
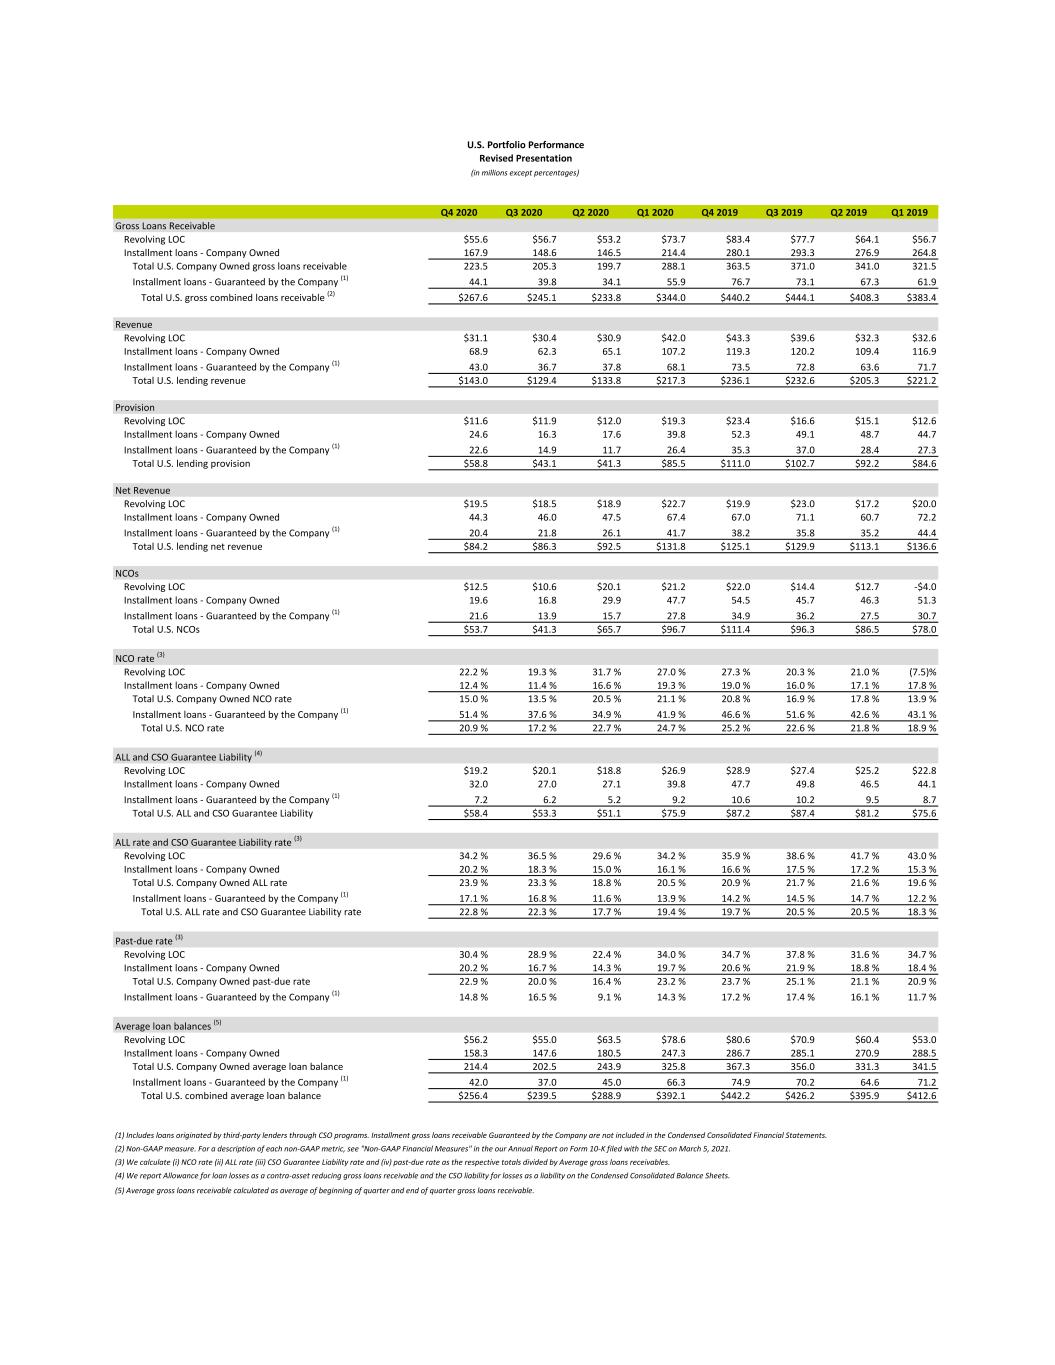
Q4 2020 Q3 2020 Q2 2020 Q1 2020 Q4 2019 Q3 2019 Q2 2019 Q1 2019 Gross Loans Receivable Revolving LOC $55.6 $56.7 $53.2 $73.7 $83.4 $77.7 $64.1 $56.7 Installment loans - Company Owned 167.9 148.6 146.5 214.4 280.1 293.3 276.9 264.8 Total U.S. Company Owned gross loans receivable 223.5 205.3 199.7 288.1 363.5 371.0 341.0 321.5 Installment loans - Guaranteed by the Company (1) 44.1 39.8 34.1 55.9 76.7 73.1 67.3 61.9 Total U.S. gross combined loans receivable (2) $267.6 $245.1 $233.8 $344.0 $440.2 $444.1 $408.3 $383.4 Revenue Revolving LOC $31.1 $30.4 $30.9 $42.0 $43.3 $39.6 $32.3 $32.6 Installment loans - Company Owned 68.9 62.3 65.1 107.2 119.3 120.2 109.4 116.9 Installment loans - Guaranteed by the Company (1) 43.0 36.7 37.8 68.1 73.5 72.8 63.6 71.7 Total U.S. lending revenue $143.0 $129.4 $133.8 $217.3 $236.1 $232.6 $205.3 $221.2 Provision Revolving LOC $11.6 $11.9 $12.0 $19.3 $23.4 $16.6 $15.1 $12.6 Installment loans - Company Owned 24.6 16.3 17.6 39.8 52.3 49.1 48.7 44.7 Installment loans - Guaranteed by the Company (1) 22.6 14.9 11.7 26.4 35.3 37.0 28.4 27.3 Total U.S. lending provision $58.8 $43.1 $41.3 $85.5 $111.0 $102.7 $92.2 $84.6 Net Revenue Revolving LOC $19.5 $18.5 $18.9 $22.7 $19.9 $23.0 $17.2 $20.0 Installment loans - Company Owned 44.3 46.0 47.5 67.4 67.0 71.1 60.7 72.2 Installment loans - Guaranteed by the Company (1) 20.4 21.8 26.1 41.7 38.2 35.8 35.2 44.4 Total U.S. lending net revenue $84.2 $86.3 $92.5 $131.8 $125.1 $129.9 $113.1 $136.6 NCOs Revolving LOC $12.5 $10.6 $20.1 $21.2 $22.0 $14.4 $12.7 -$4.0 Installment loans - Company Owned 19.6 16.8 29.9 47.7 54.5 45.7 46.3 51.3 Installment loans - Guaranteed by the Company (1) 21.6 13.9 15.7 27.8 34.9 36.2 27.5 30.7 Total U.S. NCOs $53.7 $41.3 $65.7 $96.7 $111.4 $96.3 $86.5 $78.0 NCO rate (3) Revolving LOC 22.2 % 19.3 % 31.7 % 27.0 % 27.3 % 20.3 % 21.0 % (7.5)% Installment loans - Company Owned 12.4 % 11.4 % 16.6 % 19.3 % 19.0 % 16.0 % 17.1 % 17.8 % Total U.S. Company Owned NCO rate 15.0 % 13.5 % 20.5 % 21.1 % 20.8 % 16.9 % 17.8 % 13.9 % Installment loans - Guaranteed by the Company (1) 51.4 % 37.6 % 34.9 % 41.9 % 46.6 % 51.6 % 42.6 % 43.1 % Total U.S. NCO rate 20.9 % 17.2 % 22.7 % 24.7 % 25.2 % 22.6 % 21.8 % 18.9 % ALL and CSO Guarantee Liability (4) Revolving LOC $19.2 $20.1 $18.8 $26.9 $28.9 $27.4 $25.2 $22.8 Installment loans - Company Owned 32.0 27.0 27.1 39.8 47.7 49.8 46.5 44.1 Installment loans - Guaranteed by the Company (1) 7.2 6.2 5.2 9.2 10.6 10.2 9.5 8.7 Total U.S. ALL and CSO Guarantee Liability $58.4 $53.3 $51.1 $75.9 $87.2 $87.4 $81.2 $75.6 ALL rate and CSO Guarantee Liability rate (3) Revolving LOC 34.2 % 36.5 % 29.6 % 34.2 % 35.9 % 38.6 % 41.7 % 43.0 % Installment loans - Company Owned 20.2 % 18.3 % 15.0 % 16.1 % 16.6 % 17.5 % 17.2 % 15.3 % Total U.S. Company Owned ALL rate 23.9 % 23.3 % 18.8 % 20.5 % 20.9 % 21.7 % 21.6 % 19.6 % Installment loans - Guaranteed by the Company (1) 17.1 % 16.8 % 11.6 % 13.9 % 14.2 % 14.5 % 14.7 % 12.2 % Total U.S. ALL rate and CSO Guarantee Liability rate 22.8 % 22.3 % 17.7 % 19.4 % 19.7 % 20.5 % 20.5 % 18.3 % Past-due rate (3) Revolving LOC 30.4 % 28.9 % 22.4 % 34.0 % 34.7 % 37.8 % 31.6 % 34.7 % Installment loans - Company Owned 20.2 % 16.7 % 14.3 % 19.7 % 20.6 % 21.9 % 18.8 % 18.4 % Total U.S. Company Owned past-due rate 22.9 % 20.0 % 16.4 % 23.2 % 23.7 % 25.1 % 21.1 % 20.9 % Installment loans - Guaranteed by the Company (1) 14.8 % 16.5 % 9.1 % 14.3 % 17.2 % 17.4 % 16.1 % 11.7 % Average loan balances (5) Revolving LOC $56.2 $55.0 $63.5 $78.6 $80.6 $70.9 $60.4 $53.0 Installment loans - Company Owned 158.3 147.6 180.5 247.3 286.7 285.1 270.9 288.5 Total U.S. Company Owned average loan balance 214.4 202.5 243.9 325.8 367.3 356.0 331.3 341.5 Installment loans - Guaranteed by the Company (1) 42.0 37.0 45.0 66.3 74.9 70.2 64.6 71.2 Total U.S. combined average loan balance $256.4 $239.5 $288.9 $392.1 $442.2 $426.2 $395.9 $412.6 U.S. Portfolio Performance Revised Presentation (1) Includes loans originated by third-party lenders through CSO programs. Installment gross loans receivable Guaranteed by the Company are not included in the Condensed Consolidated Financial Statements. (4) We report Allowance for loan losses as a contra-asset reducing gross loans receivable and the CSO liability for losses as a liability on the Condensed Consolidated Balance Sheets. (2) Non-GAAP measure. For a description of each non-GAAP metric, see "Non-GAAP Financial Measures" in the our Annual Report on Form 10-K filed with the SEC on March 5, 2021. (3) We calculate (i) NCO rate (ii) ALL rate (iii) CSO Guarantee Liability rate and (iv) past-due rate as the respective totals divided by Average gross loans receivables. (5) Average gross loans receivable calculated as average of beginning of quarter and end of quarter gross loans receivable. (in millions except percentages)
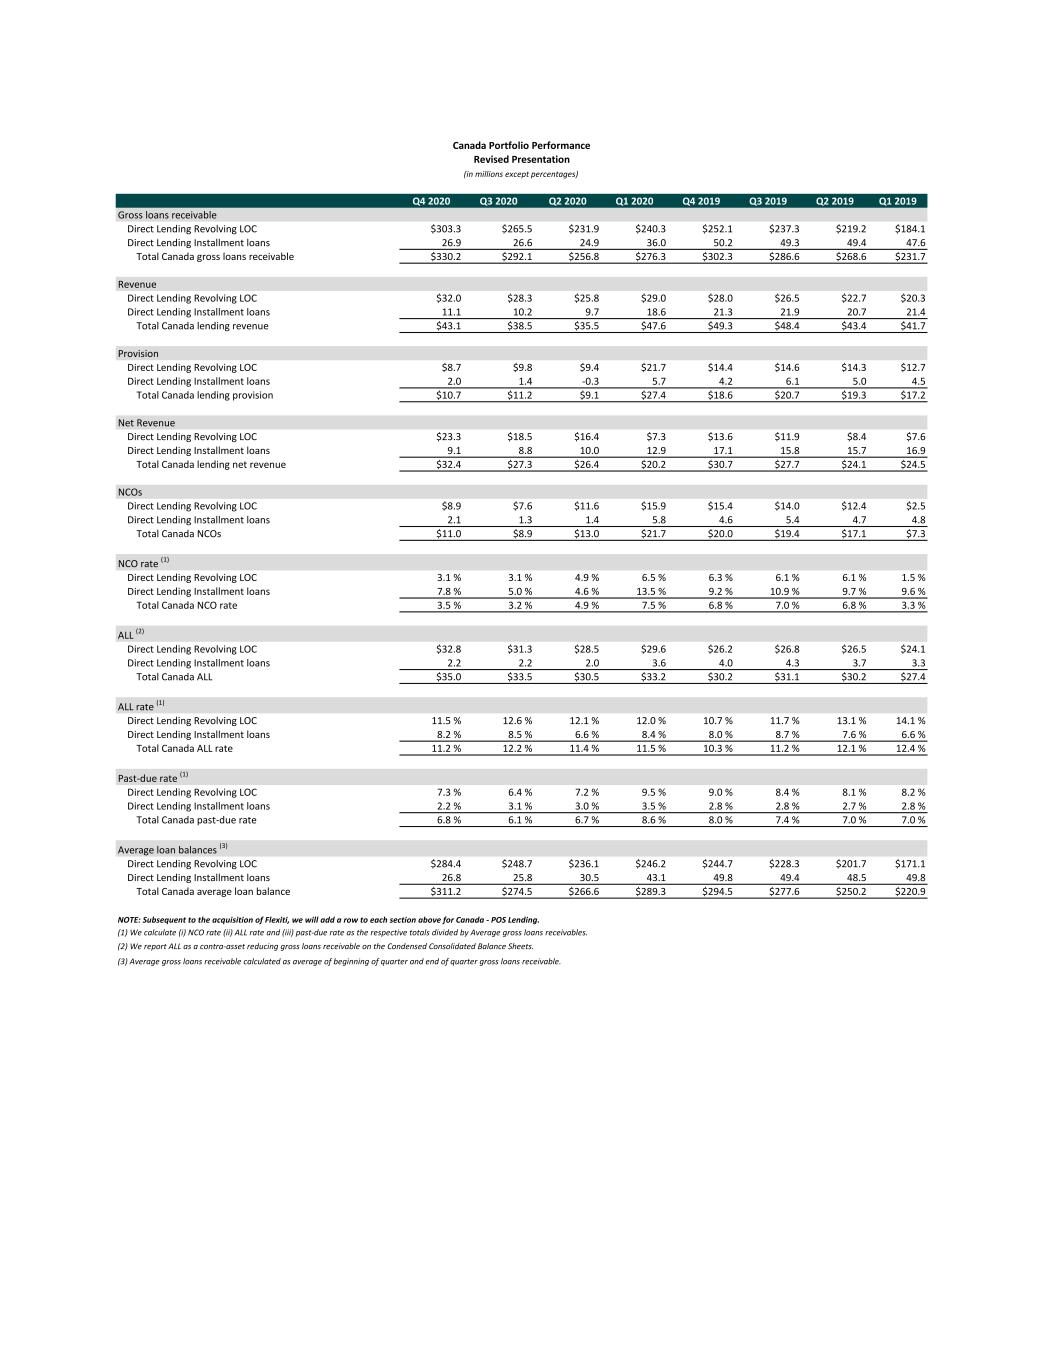
Q4 2020 Q3 2020 Q2 2020 Q1 2020 Q4 2019 Q3 2019 Q2 2019 Q1 2019 Gross loans receivable Direct Lending Revolving LOC $303.3 $265.5 $231.9 $240.3 $252.1 $237.3 $219.2 $184.1 Direct Lending Installment loans 26.9 26.6 24.9 36.0 50.2 49.3 49.4 47.6 Total Canada gross loans receivable $330.2 $292.1 $256.8 $276.3 $302.3 $286.6 $268.6 $231.7 Revenue Direct Lending Revolving LOC $32.0 $28.3 $25.8 $29.0 $28.0 $26.5 $22.7 $20.3 Direct Lending Installment loans 11.1 10.2 9.7 18.6 21.3 21.9 20.7 21.4 Total Canada lending revenue $43.1 $38.5 $35.5 $47.6 $49.3 $48.4 $43.4 $41.7 Provision Direct Lending Revolving LOC $8.7 $9.8 $9.4 $21.7 $14.4 $14.6 $14.3 $12.7 Direct Lending Installment loans 2.0 1.4 -0.3 5.7 4.2 6.1 5.0 4.5 Total Canada lending provision $10.7 $11.2 $9.1 $27.4 $18.6 $20.7 $19.3 $17.2 Net Revenue Direct Lending Revolving LOC $23.3 $18.5 $16.4 $7.3 $13.6 $11.9 $8.4 $7.6 Direct Lending Installment loans 9.1 8.8 10.0 12.9 17.1 15.8 15.7 16.9 Total Canada lending net revenue $32.4 $27.3 $26.4 $20.2 $30.7 $27.7 $24.1 $24.5 NCOs Direct Lending Revolving LOC $8.9 $7.6 $11.6 $15.9 $15.4 $14.0 $12.4 $2.5 Direct Lending Installment loans 2.1 1.3 1.4 5.8 4.6 5.4 4.7 4.8 Total Canada NCOs $11.0 $8.9 $13.0 $21.7 $20.0 $19.4 $17.1 $7.3 NCO rate (1) Direct Lending Revolving LOC 3.1 % 3.1 % 4.9 % 6.5 % 6.3 % 6.1 % 6.1 % 1.5 % Direct Lending Installment loans 7.8 % 5.0 % 4.6 % 13.5 % 9.2 % 10.9 % 9.7 % 9.6 % Total Canada NCO rate 3.5 % 3.2 % 4.9 % 7.5 % 6.8 % 7.0 % 6.8 % 3.3 % ALL (2) Direct Lending Revolving LOC $32.8 $31.3 $28.5 $29.6 $26.2 $26.8 $26.5 $24.1 Direct Lending Installment loans 2.2 2.2 2.0 3.6 4.0 4.3 3.7 3.3 Total Canada ALL $35.0 $33.5 $30.5 $33.2 $30.2 $31.1 $30.2 $27.4 ALL rate (1) Direct Lending Revolving LOC 11.5 % 12.6 % 12.1 % 12.0 % 10.7 % 11.7 % 13.1 % 14.1 % Direct Lending Installment loans 8.2 % 8.5 % 6.6 % 8.4 % 8.0 % 8.7 % 7.6 % 6.6 % Total Canada ALL rate 11.2 % 12.2 % 11.4 % 11.5 % 10.3 % 11.2 % 12.1 % 12.4 % Past-due rate (1) Direct Lending Revolving LOC 7.3 % 6.4 % 7.2 % 9.5 % 9.0 % 8.4 % 8.1 % 8.2 % Direct Lending Installment loans 2.2 % 3.1 % 3.0 % 3.5 % 2.8 % 2.8 % 2.7 % 2.8 % Total Canada past-due rate 6.8 % 6.1 % 6.7 % 8.6 % 8.0 % 7.4 % 7.0 % 7.0 % Average loan balances (3) Direct Lending Revolving LOC $284.4 $248.7 $236.1 $246.2 $244.7 $228.3 $201.7 $171.1 Direct Lending Installment loans 26.8 25.8 30.5 43.1 49.8 49.4 48.5 49.8 Total Canada average loan balance $311.2 $274.5 $266.6 $289.3 $294.5 $277.6 $250.2 $220.9 (3) Average gross loans receivable calculated as average of beginning of quarter and end of quarter gross loans receivable. (in millions except percentages) Canada Portfolio Performance NOTE: Subsequent to the acquisition of Flexiti, we will add a row to each section above for Canada - POS Lending. Revised Presentation (1) We calculate (i) NCO rate (ii) ALL rate and (iii) past-due rate as the respective totals divided by Average gross loans receivables. (2) We report ALL as a contra-asset reducing gross loans receivable on the Condensed Consolidated Balance Sheets.
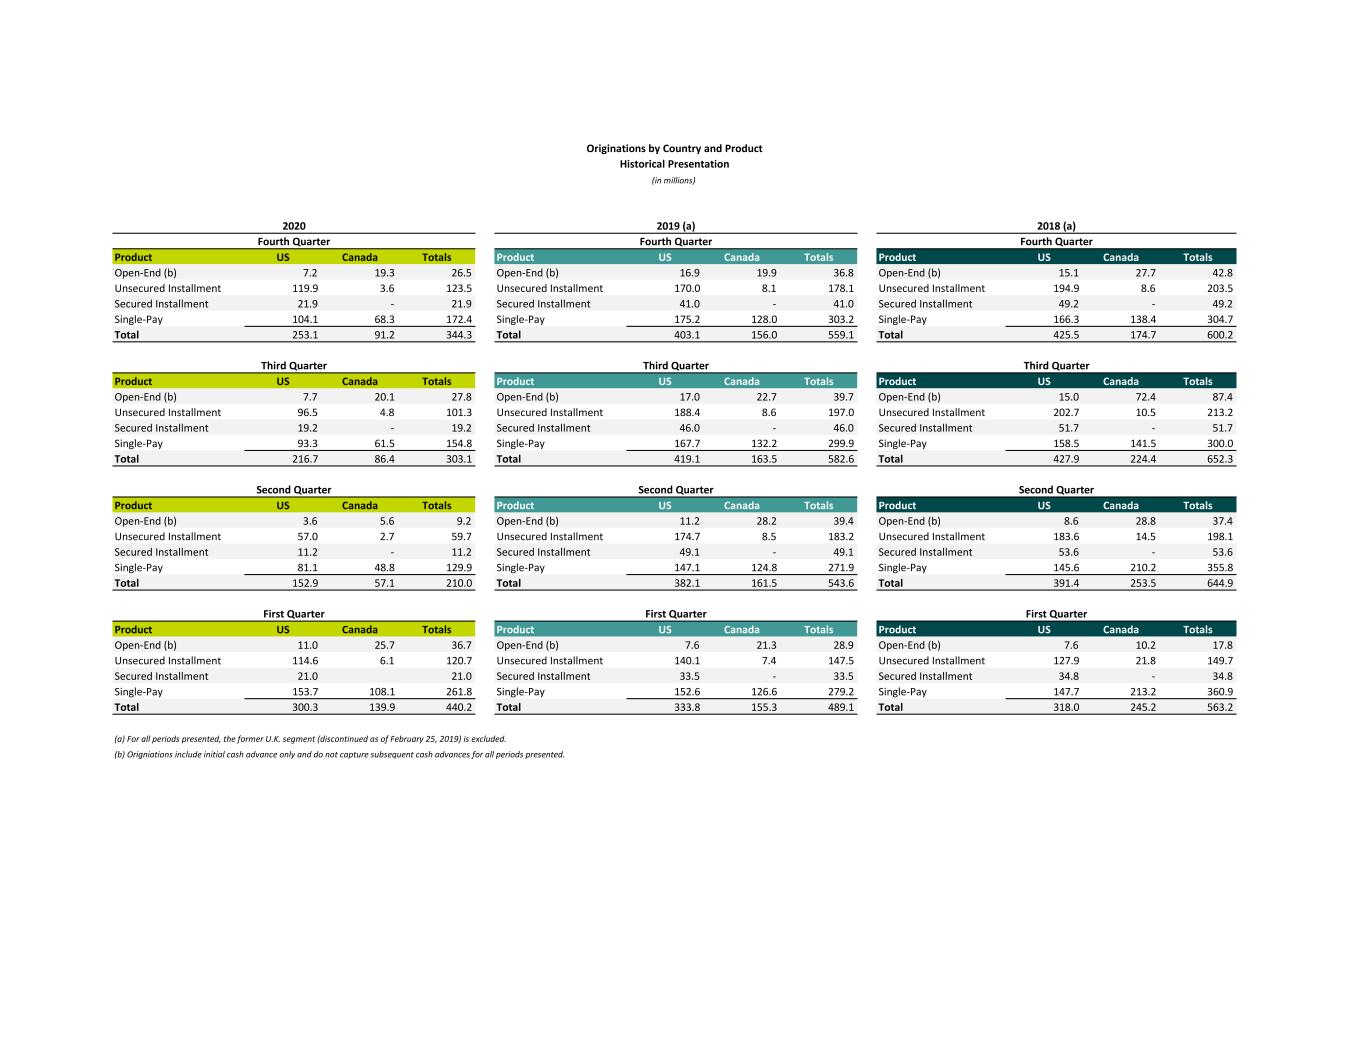
Product US Canada Totals Product US Canada Totals Product US Canada Totals Open-End (b) 7.2 19.3 26.5 Open-End (b) 16.9 19.9 36.8 Open-End (b) 15.1 27.7 42.8 Unsecured Installment 119.9 3.6 123.5 Unsecured Installment 170.0 8.1 178.1 Unsecured Installment 194.9 8.6 203.5 Secured Installment 21.9 - 21.9 Secured Installment 41.0 - 41.0 Secured Installment 49.2 - 49.2 Single-Pay 104.1 68.3 172.4 Single-Pay 175.2 128.0 303.2 Single-Pay 166.3 138.4 304.7 Total 253.1 91.2 344.3 Total 403.1 156.0 559.1 Total 425.5 174.7 600.2 Product US Canada Totals Product US Canada Totals Product US Canada Totals Open-End (b) 7.7 20.1 27.8 Open-End (b) 17.0 22.7 39.7 Open-End (b) 15.0 72.4 87.4 Unsecured Installment 96.5 4.8 101.3 Unsecured Installment 188.4 8.6 197.0 Unsecured Installment 202.7 10.5 213.2 Secured Installment 19.2 - 19.2 Secured Installment 46.0 - 46.0 Secured Installment 51.7 - 51.7 Single-Pay 93.3 61.5 154.8 Single-Pay 167.7 132.2 299.9 Single-Pay 158.5 141.5 300.0 Total 216.7 86.4 303.1 Total 419.1 163.5 582.6 Total 427.9 224.4 652.3 Product US Canada Totals Product US Canada Totals Product US Canada Totals Open-End (b) 3.6 5.6 9.2 Open-End (b) 11.2 28.2 39.4 Open-End (b) 8.6 28.8 37.4 Unsecured Installment 57.0 2.7 59.7 Unsecured Installment 174.7 8.5 183.2 Unsecured Installment 183.6 14.5 198.1 Secured Installment 11.2 - 11.2 Secured Installment 49.1 - 49.1 Secured Installment 53.6 - 53.6 Single-Pay 81.1 48.8 129.9 Single-Pay 147.1 124.8 271.9 Single-Pay 145.6 210.2 355.8 Total 152.9 57.1 210.0 Total 382.1 161.5 543.6 Total 391.4 253.5 644.9 Product US Canada Totals Product US Canada Totals Product US Canada Totals Open-End (b) 11.0 25.7 36.7 Open-End (b) 7.6 21.3 28.9 Open-End (b) 7.6 10.2 17.8 Unsecured Installment 114.6 6.1 120.7 Unsecured Installment 140.1 7.4 147.5 Unsecured Installment 127.9 21.8 149.7 Secured Installment 21.0 21.0 Secured Installment 33.5 - 33.5 Secured Installment 34.8 - 34.8 Single-Pay 153.7 108.1 261.8 Single-Pay 152.6 126.6 279.2 Single-Pay 147.7 213.2 360.9 Total 300.3 139.9 440.2 Total 333.8 155.3 489.1 Total 318.0 245.2 563.2 (a) For all periods presented, the former U.K. segment (discontinued as of February 25, 2019) is excluded. (b) Origniations include initial cash advance only and do not capture subsequent cash advances for all periods presented. Second QuarterSecond Quarter First Quarter First Quarter First Quarter Second Quarter Originations by Country and Product 2018 (a) Fourth Quarter Third QuarterThird QuarterThird Quarter Fourth Quarter 2020 Fourth Quarter 2019 (a) (in millions) Historical Presentation
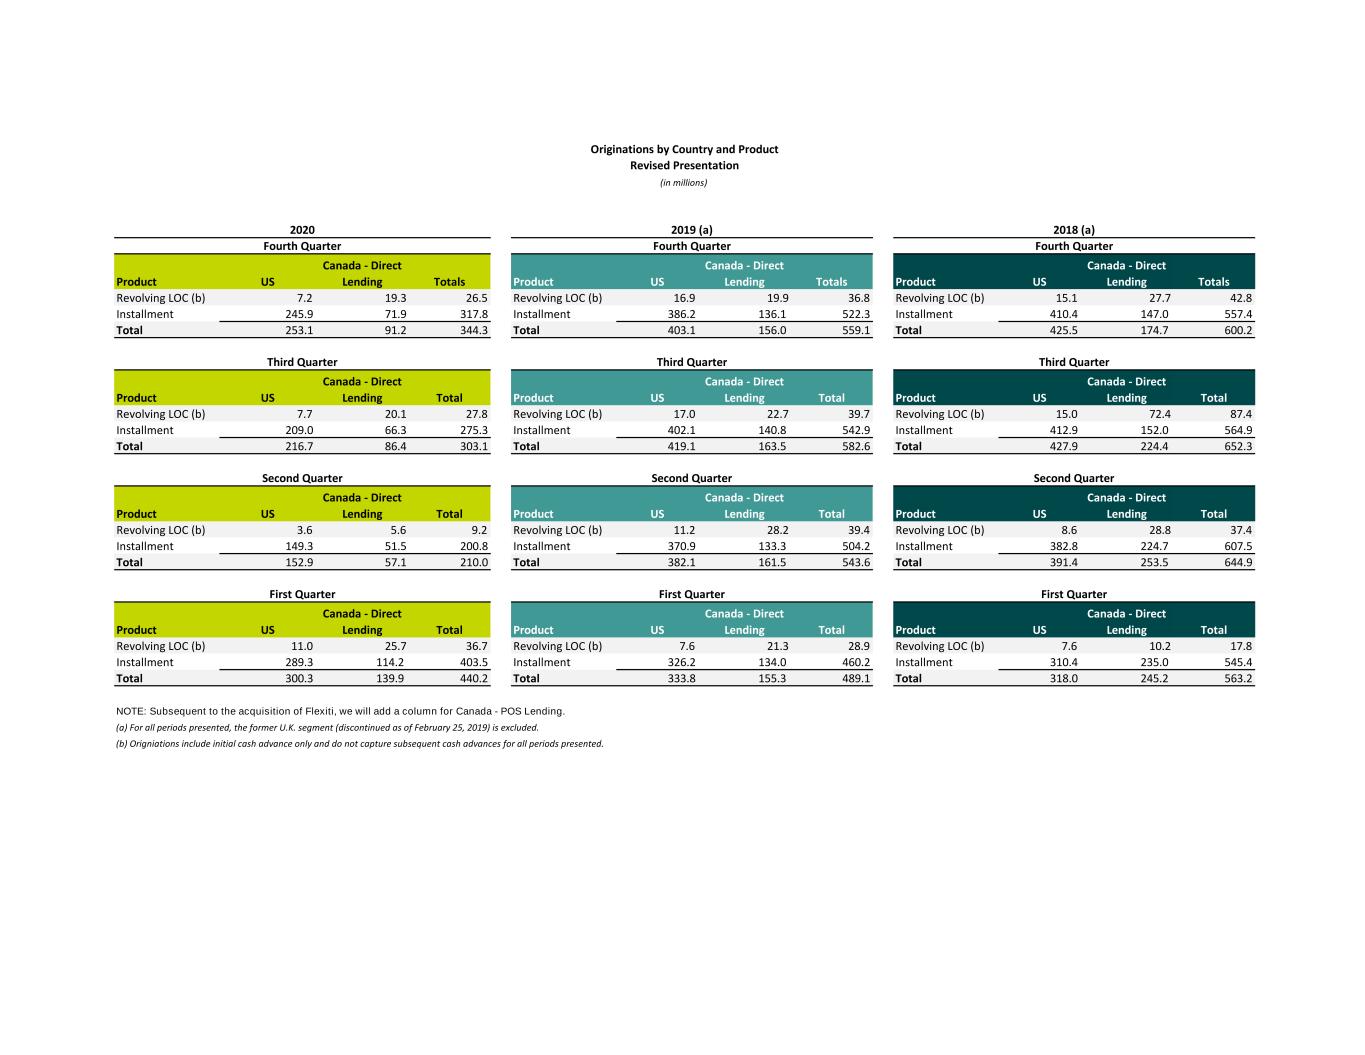
Product US Canada - Direct Lending Totals Product US Canada - Direct Lending Totals Product US Canada - Direct Lending Totals Revolving LOC (b) 7.2 19.3 26.5 Revolving LOC (b) 16.9 19.9 36.8 Revolving LOC (b) 15.1 27.7 42.8 Installment 245.9 71.9 317.8 Installment 386.2 136.1 522.3 Installment 410.4 147.0 557.4 Total 253.1 91.2 344.3 Total 403.1 156.0 559.1 Total 425.5 174.7 600.2 Product US Canada - Direct Lending Total Product US Canada - Direct Lending Total Product US Canada - Direct Lending Total Revolving LOC (b) 7.7 20.1 27.8 Revolving LOC (b) 17.0 22.7 39.7 Revolving LOC (b) 15.0 72.4 87.4 Installment 209.0 66.3 275.3 Installment 402.1 140.8 542.9 Installment 412.9 152.0 564.9 Total 216.7 86.4 303.1 Total 419.1 163.5 582.6 Total 427.9 224.4 652.3 Product US Canada - Direct Lending Total Product US Canada - Direct Lending Total Product US Canada - Direct Lending Total Revolving LOC (b) 3.6 5.6 9.2 Revolving LOC (b) 11.2 28.2 39.4 Revolving LOC (b) 8.6 28.8 37.4 Installment 149.3 51.5 200.8 Installment 370.9 133.3 504.2 Installment 382.8 224.7 607.5 Total 152.9 57.1 210.0 Total 382.1 161.5 543.6 Total 391.4 253.5 644.9 Product US Canada - Direct Lending Total Product US Canada - Direct Lending Total Product US Canada - Direct Lending Total Revolving LOC (b) 11.0 25.7 36.7 Revolving LOC (b) 7.6 21.3 28.9 Revolving LOC (b) 7.6 10.2 17.8 Installment 289.3 114.2 403.5 Installment 326.2 134.0 460.2 Installment 310.4 235.0 545.4 Total 300.3 139.9 440.2 Total 333.8 155.3 489.1 Total 318.0 245.2 563.2 NOTE: Subsequent to the acquisition of Flexiti, we will add a column for Canada - POS Lending. (b) Origniations include initial cash advance only and do not capture subsequent cash advances for all periods presented. First Quarter First Quarter (a) For all periods presented, the former U.K. segment (discontinued as of February 25, 2019) is excluded. Revised Presentation First Quarter Second Quarter Originations by Country and Product 2018 (a) Fourth Quarter Third QuarterThird QuarterThird Quarter Fourth Quarter 2020 Fourth Quarter 2019 (a) (in millions) Second QuarterSecond Quarter
