Attached files
| file | filename |
|---|---|
| EX-32.2 - EXHIBIT 32.2 - CURO Group Holdings Corp. | q22018ex-322cfo906cert2q.htm |
| EX-32 - EXHIBIT 32.1 - CURO Group Holdings Corp. | q22018ex-321ceo906cert2q.htm |
| EX-31.2 - EXHIBIT 31.2 - CURO Group Holdings Corp. | q22018ex-312cfo302cert2q.htm |
| EX-31.1 - EXHIBIT 31.1 - CURO Group Holdings Corp. | q22018ex-311ceo302cert2q.htm |
UNITED STATES
SECURITIES AND EXCHANGE COMMISSION
Washington, D.C. 20549
FORM 10-Q
x QUARTERLY REPORT PURSUANT TO SECTION 13 OR 15(d) OF THE SECURITIES EXCHANGE ACT OF 1934
For the quarterly period ended June 30, 2018
OR
☐ TRANSITION REPORT PURSUANT TO SECTION 13 OR 15(d) OF THE SECURITIES EXCHANGE ACT OF 1934
For the transition period from _________to__________
Commission File Number 1-38315
CURO GROUP HOLDINGS CORP.
(Exact name of registrant as specified in its charter)
Delaware | 90-0934597 | |
(State or other jurisdiction Of incorporation or organization) | (I.R.S. Employer Identification No.) | |
3527 North Ridge Road, Wichita, KS | 67205 | |
(Address of principal executive offices) | (Zip Code) | |
Registrant’s telephone number, including area code: (316) 425-1410
Former name, former address and former fiscal year, if changed since last report: No Changes
Indicate by check mark whether the registrant (1) has filed all reports required to be filed by Section 13 or 15(d) of the Securities Exchange Act of 1934 during the preceding 12 months (or for such shorter period that the registrant was required to file such reports), and (2) has been subject to such filing requirements for the past 90 days. Yes ☒ No ☐
Indicate by check mark whether the registrant has submitted electronically and posted on its corporate web site, if any, every Interactive Data File required to be submitted and posted pursuant to Rule 405 of Regulation S-T (§232.405 of this chapter) during the preceding 12 months (or for such shorter period that the registrant was required to submit and post such files). Yes ☒ No ☐
Indicate by check mark whether the registrant is a large accelerated filer, an accelerated filer, a non-accelerated filer, smaller reporting company, or an emerging growth company. See the definitions of “large accelerated filer,” “accelerated filer,” “smaller reporting company,” and “emerging growth company” in Rule 12b-2 of the Exchange Act.
Large accelerated filer | ☐ | Accelerated filer | ☐ | |
Non-accelerated filer | ☒ | (Do not check if a smaller reporting company) | ||
Smaller reporting company | ☐ | Emerging growth company | ☒ | |
If an emerging growth company, indicate by check mark if the registrant has elected not to use the extended transition period for complying with any new or revised financial accounting standards provided pursuant to Section 13(a) of the Exchange Act. ☐
Indicate by check mark whether the registrant is a shell company (as defined in Rule 12b-2 of the Act). Yes ☐ No ☒
At July 31, 2018 there were 45,770,551 shares of the registrant’s Common Stock, $0.001 par value per share, outstanding.
CURO GROUP HOLDINGS CORP. AND SUBSIDIARIES
FORM 10-Q
SECOND QUARTER ENDED JUNE 30, 2018
INDEX
Page | |||||||
Item 1. | Financial Statements (unaudited) | ||||||
June 30, 2018 and December 31, 2017 | |||||||
Three and six months ended June 30, 2018 and 2017 | |||||||
Three and six months ended June 30, 2018 and 2017 | |||||||
Six months ended June 30, 2018 and 2017 | |||||||
Item 2. | |||||||
Item 3. | |||||||
Item 4. | |||||||
Item 1. | |||||||
Item 1A. | |||||||
Item 2. | |||||||
Item 3. | |||||||
Item 4. | |||||||
Item 5. | |||||||
Item 6. | |||||||
2
PART I. FINANCIAL INFORMATION
ITEM 1. FINANCIAL STATEMENTS
CURO GROUP HOLDINGS CORP. AND SUBSIDIARIES
CONDENSED CONSOLIDATED BALANCE SHEETS
(in thousands, except share data)
June 30, 2018 | December 31, 2017 | ||||||
(Unaudited) | |||||||
ASSETS | |||||||
Cash | $ | 115,105 | $ | 162,374 | |||
Restricted cash (includes restricted cash of consolidated VIEs of $7,274 and $6,871 as of June 30, 2018 and December 31, 2017, respectively) | 12,448 | 12,117 | |||||
Gross loans receivable (includes loans of consolidated VIEs of $199,877 and $213,846 as of June 30, 2018 and December 31, 2017, respectively) | 444,627 | 432,837 | |||||
Less: allowance for loan losses (includes loans of consolidated VIEs of $28,545 and $46,140 as of June 30, 2018 and December 31, 2017, respectively) | (59,754 | ) | (69,568 | ) | |||
Loans receivable, net | 384,873 | 363,269 | |||||
Deferred income taxes | 3,697 | 772 | |||||
Income taxes receivable | 623 | 3,455 | |||||
Prepaid expenses and other | 36,297 | 42,512 | |||||
Property and equipment, net | 80,420 | 87,086 | |||||
Goodwill | 143,753 | 145,607 | |||||
Other intangibles, net of accumulated amortization of $42,382 and $41,156 as of June 30, 2018 and December 31, 2017, respectively) | 30,825 | 32,769 | |||||
Other | 12,809 | 9,770 | |||||
Total Assets | $ | 820,850 | $ | 859,731 | |||
LIABILITIES AND STOCKHOLDER’S EQUITY | |||||||
Accounts payable and accrued liabilities | $ | 53,557 | $ | 55,792 | |||
Deferred revenue | 10,548 | 11,984 | |||||
Income taxes payable | 5,475 | 4,120 | |||||
Accrued interest (includes accrued interest of consolidated VIEs of $1,237 and $1,266 as of June 30, 2018 and December 31, 2017, respectively) | 22,175 | 25,467 | |||||
Credit services organization guarantee liability | 11,619 | 17,795 | |||||
Deferred rent | 11,481 | 11,577 | |||||
Long-term debt (includes long-term debt and issuance costs of consolidated VIEs of $118,427 and $3,653 as of June 30, 2018 and $124,590 and $4,188 as of December 31, 2017, respectively) | 626,833 | 706,225 | |||||
Subordinated shareholder debt | 2,278 | 2,381 | |||||
Other long-term liabilities | 6,589 | 5,768 | |||||
Deferred tax liabilities | 17,446 | 11,486 | |||||
Total Liabilities | 768,001 | 852,595 | |||||
Commitments and contingencies | |||||||
Stockholder's Equity | |||||||
Preferred stock - $0.001 par value, 25,000,000 shares authorized; no shares were issued at either period end | — | — | |||||
Class A common stock - $0.001 par value; 225,000,000 shares authorized; 45,770,551 and 44,561,419 issued and outstanding as of June 30, 2018 and December 31, 2017, respectively) | 9 | 8 | |||||
Paid-in capital | 62,573 | 46,079 | |||||
Retained earnings | 43,254 | 3,988 | |||||
Accumulated other comprehensive loss | (52,987 | ) | (42,939 | ) | |||
Total Stockholders' Equity | 52,849 | 7,136 | |||||
Total Liabilities and Stockholders' Equity | $ | 820,850 | $ | 859,731 | |||
See accompanying Notes to Condensed Consolidated Financial Statements.
3
CURO GROUP HOLDINGS CORP. AND SUBSIDIARIES
CONDENSED CONSOLIDATED STATEMENTS OF INCOME
(in thousands, except per share data)
(unaudited)
Three Months Ended June 30, | Six Months Ended June 30, | ||||||||||||||
2018 | 2017 | 2018 | 2017 | ||||||||||||
Revenue | $ | 248,983 | $ | 216,944 | $ | 510,741 | $ | 441,524 | |||||||
Provision for losses | 91,986 | 65,446 | 173,017 | 127,182 | |||||||||||
Net revenue | 156,997 | 151,498 | 337,724 | 314,342 | |||||||||||
Cost of providing services | |||||||||||||||
Salaries and benefits | 26,907 | 26,300 | 53,826 | 52,733 | |||||||||||
Occupancy | 13,320 | 13,511 | 26,747 | 27,606 | |||||||||||
Office | 6,077 | 4,936 | 13,057 | 9,804 | |||||||||||
Other costs of providing services | 12,727 | 13,108 | 27,127 | 27,963 | |||||||||||
Advertising | 17,554 | 11,641 | 27,310 | 19,329 | |||||||||||
Total cost of providing services | 76,585 | 69,496 | 148,067 | 137,435 | |||||||||||
Gross margin | 80,412 | 82,002 | 189,657 | 176,907 | |||||||||||
Operating expense | |||||||||||||||
Corporate, district and other | 38,655 | 36,557 | 79,109 | 69,550 | |||||||||||
Interest expense | 20,465 | 18,484 | 42,814 | 41,850 | |||||||||||
Loss on extinguishment of debt | — | — | 11,683 | 12,458 | |||||||||||
Total operating expense | 59,120 | 55,041 | 133,606 | 123,858 | |||||||||||
Net income before income taxes | 21,292 | 26,961 | 56,051 | 53,049 | |||||||||||
Provision for income taxes | 5,317 | 10,619 | 16,784 | 20,069 | |||||||||||
Net income | $ | 15,975 | $ | 16,342 | $ | 39,267 | $ | 32,980 | |||||||
Weighted average common shares outstanding: | |||||||||||||||
Basic | 45,650 | 37,895 | 45,578 | 37,895 | |||||||||||
Diluted | 47,996 | 38,987 | 47,757 | 38,983 | |||||||||||
Net income per common share: | |||||||||||||||
Basic earnings per share | $ | 0.35 | $ | 0.43 | $ | 0.86 | $ | 0.87 | |||||||
Diluted earnings per share: | $ | 0.33 | $ | 0.42 | $ | 0.82 | $ | 0.85 | |||||||
See accompanying Notes to Condensed Consolidated Financial Statements.
4
CURO GROUP HOLDINGS CORP. AND SUBSIDIARIES
CONDENSED CONSOLIDATED STATEMENTS OF COMPREHENSIVE INCOME
(in thousands)
(unaudited)
Three Months Ended June 30, | Six Months Ended June 30, | ||||||||||||||
2018 | 2017 | 2018 | 2017 | ||||||||||||
Net income | $ | 15,975 | $ | 16,342 | $ | 39,267 | $ | 32,980 | |||||||
Other comprehensive income (loss): | |||||||||||||||
Cash flow hedges, net of $0 tax in all periods | (439 | ) | 375 | (385 | ) | 333 | |||||||||
Foreign currency translation adjustment, net of $0 tax in all periods | (6,752 | ) | 6,961 | (9,663 | ) | 9,751 | |||||||||
Other comprehensive income (loss) | (7,191 | ) | 7,336 | (10,048 | ) | 10,084 | |||||||||
Comprehensive income | $ | 8,784 | $ | 23,678 | $ | 29,219 | $ | 43,064 | |||||||
See accompanying Notes to Condensed Consolidated Financial Statements.
5
CURO GROUP HOLDINGS CORP. AND SUBSIDIARIES
CONDENSED CONSOLIDATED STATEMENTS OF CASH FLOWS
(in thousands)
(unaudited)
Six Months Ended June 30, | |||||||
2018 | 2017 | ||||||
Cash flows from operating activities | |||||||
Net income | $ | 39,267 | $ | 32,980 | |||
Adjustments to reconcile net income to net cash provided by operating activities: | |||||||
Depreciation and amortization | 9,259 | 9,330 | |||||
Provision for loan losses | 173,017 | 127,182 | |||||
Amortization of debt issuance costs | 2,493 | 1,702 | |||||
Amortization of bond discount/(premium) | (376 | ) | 424 | ||||
Deferred income tax benefit | 3,199 | (653 | ) | ||||
Loss on disposal of property and equipment | 517 | 244 | |||||
Loss on extinguishment of debt | 11,683 | 12,458 | |||||
Call premium payment from debt extinguishment | (9,300 | ) | — | ||||
Increase in cash surrender value of life insurance | (2,223 | ) | (679 | ) | |||
Share-based compensation expense | 4,023 | 219 | |||||
Changes in operating assets and liabilities: | |||||||
Loans receivable | (206,147 | ) | (150,450 | ) | |||
Prepaid expenses and other assets | 6,092 | 2,974 | |||||
Accounts payable and accrued liabilities | (2,292 | ) | (6,146 | ) | |||
Deferred revenue | (1,215 | ) | (698 | ) | |||
Income taxes payable | 26,727 | 3,780 | |||||
Income taxes receivable | (18,436 | ) | 3,200 | ||||
Deferred rent | (31 | ) | 31 | ||||
Accrued Interest | (3,284 | ) | — | ||||
Other liabilities | 922 | 13,876 | |||||
Net cash provided by operating activities | 33,895 | 49,774 | |||||
Cash flows from investing activities | |||||||
Purchase of property, equipment and software | (3,055 | ) | (6,828 | ) | |||
Cash paid for Cognical Holdings preferred shares | (958 | ) | (4,975 | ) | |||
Changes in restricted cash | (411 | ) | (4,437 | ) | |||
Net cash used in investing activities | (4,424 | ) | (16,240 | ) | |||
Cash flows from financing activities | |||||||
Net proceeds from issuance of common stock | 12,431 | — | |||||
Proceeds from exercise of stock options | 39 | — | |||||
Proceeds from Non-Recourse U.S. SPV facility | 13,000 | 41,130 | |||||
Payments on Non-Recourse U.S. SPV facility | (19,163 | ) | (25,142 | ) | |||
Proceeds from issuance of 12.00% Senior Secured Notes | — | 461,329 | |||||
Payments on 10.75% Senior Secured Notes | — | (426,034 | ) | ||||
Payments on 12.00% Senior Secured Notes | (77,500 | ) | — | ||||
Payments on 12.00% Senior Cash Pay Notes | — | (125,000 | ) | ||||
Debt issuance costs paid | (168 | ) | (14,002 | ) | |||
Proceeds from credit facilities | 18,798 | — | |||||
Payments on credit facilities | (18,798 | ) | — | ||||
Dividends paid to stockholders | — | (28,000 | ) | ||||
Net cash used in financing activities | (71,361 | ) | (115,719 | ) | |||
Effect of exchange rate changes on cash | (5,379 | ) | 2,440 | ||||
Net decrease in cash | (47,269 | ) | (79,745 | ) | |||
Cash at beginning of period | 162,374 | 193,525 | |||||
Cash at end of period | $ | 115,105 | $ | 113,780 | |||
6
CURO GROUP HOLDINGS CORP. AND SUBSIDIARIES
NOTES TO CONDENSED CONSOLIDATED FINANCIAL STATEMENTS
(unaudited)
NOTE 1 – SUMMARY OF SIGNIFICANT ACCOUNTING POLICIES AND NATURE OF OPERATIONS
Basis of Presentation
The terms “CURO," "we,” “our,” “us,” and the “Company,” refer to CURO Group Holdings Corp. and its directly and indirectly owned subsidiaries as a combined entity, except where otherwise stated. The term "CFTC" refers to CURO Financial Technologies Corp., a subsidiary of CURO, and its directly and indirectly owned subsidiaries as a consolidated entity, except where otherwise stated.
We have prepared the accompanying unaudited Condensed Consolidated Financial Statements in accordance with accounting principles generally accepted in the United States of America (“US GAAP”), and with the accounting policies described in our 2017 Annual Report on Form 10-K. Certain information and note disclosures normally included in our annual financial statements prepared in accordance with US GAAP have been condensed or omitted, although we believe that the disclosures are adequate to enable a reasonable understanding of the information presented.
The unaudited Condensed Consolidated Financial Statements and the accompanying notes reflect all adjustments, which are, in the opinion of management, necessary to present fairly our results of operations, financial position and cash flows for the periods presented. The adjustments consist solely of normal recurring adjustments. You should read the Condensed Consolidated Financial Statements in conjunction with the Consolidated Financial Statements and related Notes included in our 2017 Annual Report on Form 10-K. Interim results of operations are not necessarily indicative of results that may be expected for future interim periods or for the year ending December 31, 2018.
We completed our initial public offering ("IPO") in December 2017. Prior to our IPO we effected a 36-for-1 split of our common stock. We have retroactively adjusted all share and per share data for all periods presented to reflect the stock split as if the stock split had occurred at the beginning of the earliest period presented.
We qualify as an “emerging growth company” as defined in the Jumpstart Our Business Startups Act of 2012 (the "JOBS Act"). As an emerging growth company, we have elected to take advantage of specified reduced reporting and other requirements that are otherwise generally required of public companies.
Principles of Consolidation
The Condensed Consolidated Financial Statements include the accounts of CURO and its wholly-owned subsidiaries. We have eliminated intercompany transactions and balances in consolidation.
Use of Estimates
The preparation of Condensed Consolidated Financial Statements in conformity with US GAAP requires management to make estimates and assumptions that affect the reported amounts of assets and liabilities and the disclosure of contingent assets and liabilities at the date of the financial statements. Estimates also affect the reported amounts of revenues and expenses during the periods reported. Some of the significant estimates that we have made in the accompanying Condensed Consolidated Financial Statements include allowances for loan losses, certain assumptions related to goodwill and intangibles, accruals related to self-insurance, Credit Services Organization ("CSO") guarantee liability and estimated tax liabilities. Actual results may differ from those estimates.
Nature of Operations
We are a growth-oriented, technology-enabled, highly-diversified consumer finance company serving a wide range of underbanked consumers in the United States ("U.S."), Canada, and the United Kingdom ("U.K.").
7
CURO GROUP HOLDINGS CORP. AND SUBSIDIARIES
NOTES TO CONDENSED CONSOLIDATED FINANCIAL STATEMENTS (continued)
(unaudited)
Recently Adopted Accounting Pronouncements
In May 2017, the Financial Accounting Standards Board ("FASB") issued ASU 2017-09, Compensation - Stock Compensation (Topic 718): Scope of Modification Accounting ("ASU 2017-09"). Under modification accounting, an entity is required to re-value its equity awards each time there is a modification to the terms of the awards. The provisions in ASU 2017-09 provide guidance about which changes to the terms or conditions of a share-based payment award require an entity to account for the effects of a modification, unless certain conditions are met. The amendments in this update were effective for all entities for annual periods, and interim periods within those annual periods, beginning after December 15, 2017. ASU 2017-09 was effective for us as of January 1, 2018. The adoption of this amendment did not have a material impact on our Consolidated Financial Statements.
Recently Issued Accounting Pronouncements Not Yet Adopted
In February 2018, FASB issued ASU 2018-02, Income Statement - Reporting Comprehensive Income (Topic 220): Reclassification of Certain Tax Effects from Accumulated Other Comprehensive income ("ASU 2018-02"). Current US GAAP requires deferred tax liabilities and assets to be adjusted for the effect of a change in tax laws or rates with the effect included in income from continuing operations in the period the change is enacted, including items of other comprehensive income for which the related tax effects are presented in other comprehensive income (“stranded tax effects”). ASU 2018-02 allows, but does not require, companies to reclassify stranded tax effects caused by the Tax Cuts and Jobs Act of 2017 (the "2017 Tax Act") from accumulated other comprehensive income to retained earnings. Additionally, ASU 2018-02 requires new disclosures by all companies, whether they opt to do the reclassification or not. The provisions of ASU 2018-02 are effective for all entities for fiscal years beginning after December 15, 2018, and interim periods within those fiscal years. Early adoption is permitted. Companies should apply the proposed amendments either in the period of adoption or retrospectively to each period (or periods) in which the effect of the change in the U.S. federal corporate income tax rate in the 2017 Tax Act is recognized. We are currently assessing the impact adoption of ASU 2018-02 will have on our Consolidated Financial Statements.
In September 2017, FASB issued ASU 2017-13, Revenue Recognition (Topic 605), Revenue from Contracts with Customers (Topic 606), Leases (Topic 840), and Leases (Topic 842): Amendments to SEC Paragraphs Pursuant to the Staff Announcement at the July 20, 2017 EITF Meeting and Rescission of Prior SEC Staff Announcements and Observer Comments ("ASU 2017-13"). ASU 2017-13 amends the early adoption date option for public entities related to the adoption of ASU No. 2014-09 and ASU No. 2016-02. We are currently assessing the impact adoption of Topic 606 and Topic 842 will have on our Consolidated Financial Statements.
In January 2017, FASB issued ASU 2017-04, Intangibles - Goodwill and Other (Topic 350): Simplifying the Test for Goodwill Impairment ("ASU 2017-04"). ASU 2017-04 simplified the goodwill impairment test by eliminating Step 2 of the test which requires an entity to compute the implied fair value of goodwill. Instead, an entity should recognize an impairment charge for the amount by which the carrying amount exceeds the reporting unit's fair value, and is limited to the amount of total goodwill allocated to that reporting unit. Under ASU 2017-04, an entity still has the option to perform the qualitative assessment for a reporting unit to determine if the quantitative impairment test is necessary. The provisions of ASU 2017-04 are effective for a public entity's annual or interim goodwill impairment tests in fiscal years beginning after December 15, 2019 and effective for us, as an emerging growth company, in fiscal years beginning after December 15, 2021. We are currently assessing the impact adoption of ASU 2017-04 will have on our Consolidated Financial Statements.
In January 2017, FASB issued ASU 2017-01, Business Combinations (Topic 805): Clarifying the definition of a Business ("ASU 2017-01"). ASU 2017-01 narrows the definition of a business and provides a framework that gives an entity a basis for making reasonable judgments about whether a transaction involves an asset or a business and provides a screen to determine when a set (an integrated set of assets and activities) is not a business. The screen requires a determination that when substantially all of the fair value of the gross assets acquired is concentrated in a single identifiable asset or a group of similar identifiable assets, the set is not a business. If the screen is not met, ASU 2017-01 (i) requires that to be considered a business, a set must include, at a minimum, an input and a substantive process that together significantly contribute to the ability to create output and (ii) remove the evaluation of whether a market participant could replace missing elements. The amendments provide a framework to assist
8
CURO GROUP HOLDINGS CORP. AND SUBSIDIARIES
NOTES TO CONDENSED CONSOLIDATED FINANCIAL STATEMENTS (continued)
(unaudited)
entities in evaluating whether both an input and a substantive process are present. ASU 2017-01 is effective prospectively for public companies for annual periods beginning after December 15, 2017 including interim periods therein, and it will be effective for us, as an emerging growth company, for annual periods beginning after December 15, 2018 and interim periods beginning after December 15, 2019. We are currently assessing the impact adoption of ASU 2017-01 will have on our Consolidated Financial Statements.
In November 2016, FASB issued ASU 2016-18, Statement of Cash Flows (Topic 230): Restricted Cash ("ASU 2016-18"). ASU 2016-18 requires that a statement of cash flows explain the change during the period in the total of cash, cash equivalents, and amounts generally described as restricted cash or restricted cash equivalents. As a result, amounts generally described as restricted cash and restricted cash equivalents should be included with cash and cash equivalents when reconciling the beginning-of-period and end-of-period total amounts shown on the statement of cash flows. ASU 2016-18 is effective for public companies for fiscal years beginning after December 15, 2017 and interim periods therein, and it will be effective for us, as an emerging growth company, for fiscal years beginning after December 15, 2018 and interim periods beginning after December 15, 2019. The amendments should be applied using a retrospective transition method to each period presented. We are currently assessing the impact adoption of ASU 2016-18 will have on our Consolidated Financial Statements.
In August 2016, FASB issued ASU 2016-15, Statement of Cash Flows (Topic 230): Classification of Certain Cash Receipts and Cash Payments (a consensus of the Emerging Issues Task Force) (“ASU 2016-15”). The amendments in ASU 2016-15 provide guidance on eight specific cash flow issues, including debt prepayment or debt extinguishment costs, contingent consideration payments made after a business combination, distributions received from equity method investees and beneficial interests in securitization transactions. ASU 2016-15 is currently effective for public companies, and it will be effective for us, as an emerging growth company, for fiscal years beginning after December 15, 2018 and interim periods within fiscal years beginning after December 15, 2019. We are currently assessing the potential impact ASU 2016-15 will have on our Consolidated Statements of Cash Flows.
In June 2016, FASB issued ASU 2016-13, Financial Instruments - Credit Losses (Topic 326): Measurement of Credit Losses on Financial Instruments” ("ASU 2016-13"). This ASU modifies the impairment model to utilize an expected loss methodology in place of the currently used incurred loss methodology, which will result in the more timely recognition of losses. ASU 2016-13 will be effective for public companies for fiscal years beginning after December 15, 2019 and interim periods within those fiscal years, and it will be effective for us, as an emerging growth company, for fiscal years beginning after December 15, 2020 and interim periods within fiscal years beginning after December 15, 2021. We anticipate that ASU 2016-13 will impact our current process for measuring credit losses and are currently assessing the impact it will have on our Consolidated Financial Statements.
In February 2016, FASB issued its new lease accounting guidance in ASU No. 2016-02, Leases (Topic 842) (“ASU 2016-02”). ASU 2016-02 requires lessees to recognize the following for all leases (with the exception of short-term leases) at the commencement date: (i) a lease liability, which is a lessee’s obligation to make lease payment arising from a lease, measured on a discounted basis; and (ii) a right-of-use asset, which is an asset that represents the lessee’s right to use, or control the use of, a specified asset for the lease term. Under the new guidance, lessor accounting is largely unchanged and lessees will no longer be provided with a source of off-balance sheet financing. ASU 2016-02 will be effective for public companies for fiscal years beginning after December 15, 2018 and interim periods within those fiscal years, and it will be effective for us, as an emerging growth company, for fiscal years beginning after December 15, 2019 and interim periods within fiscal years beginning after December 15, 2020. Early adoption is permitted. Lessees (for capital and operating leases) and lessors (for sales-type, direct financing, and operating leases) must apply a modified retrospective transition approach for leases existing at, or entered into after, the beginning of the earliest comparative period presented in the financial statements. The modified retrospective approach would not require any transition accounting for leases that expired before the earliest comparative period presented. Lessees and lessors may not apply a full retrospective transition approach. We expect ASU 2016-02 will have an impact on our balance sheet with recognition of right-of-use assets which were previously operating leases. We are currently assessing the full impact ASU 2016-02 will have on our Consolidated Financial Statements and expect an estimate of impact in the second half of 2018.
9
CURO GROUP HOLDINGS CORP. AND SUBSIDIARIES
NOTES TO CONDENSED CONSOLIDATED FINANCIAL STATEMENTS (continued)
(unaudited)
In January 2016, FASB issued ASU No. 2016-01, Financial Instruments-Overall (Subtopic 825-10): Recognition and Measurement of Financial Assets and Financial Liabilities (“ASU 2016-01”) which requires (i) equity investments (except those accounted for under the equity method of accounting, or those that result in consolidation of the investee) to be measured at fair value with changes in fair value recognized in net income, (ii) public entities to use the exit price notion when measuring the fair value of financial instruments for disclosure purposes and (iii) separate presentation of financial assets and financial liabilities by measurement category and form of financial asset (i.e., securities or loans and receivables). ASU 2016-01 eliminates the requirement to disclose the method(s) and significant assumptions used to estimate the fair value that is required to be disclosed for financial instruments measured at amortized cost. ASU 2016-01 is currently effective for public companies, and it will be effective for us, as an emerging growth company, for fiscal years beginning after December 15, 2018 and interim periods within fiscal years beginning after December 15, 2019. We are currently assessing the impact this ASU will have on our Consolidated Financial Statements.
In November 2015, FASB issued ASU No. 2015-17, Income Taxes (Topic 740): Balance Sheet Classification of Deferred Taxes (“ASU 2015-17”). ASU 2015-07 eliminates the requirement for organizations to present deferred tax liabilities and assets as current and noncurrent in a classified balance sheet. Instead, organizations will be required to classify all deferred tax assets and liabilities as noncurrent. ASU 2015-17 is currently effective for public companies, and it will be effective for us, as an emerging growth company, for fiscal years beginning after December 15, 2017 and interim periods within fiscal years beginning after December 15, 2018. We do not expect that adoption of this amendment will have a material impact on our Consolidated Financial Statements.
In August 2015, FASB issued ASU 2015-14, Revenue from Contracts with Customers (Topic 606) (“ASU 2015-14”), which deferred the effect date of ASU 2014-09, Revenue from Contracts with Customers (Topic 606) (“ASU 2014-09”), for public companies to fiscal years beginning after December 15, 2017 and interim periods within those fiscal years, and it will be effective for us, as an emerging growth company, for fiscal years beginning after December 15, 2018 and interim periods within fiscal years beginning after December 15, 2019. If we are no longer an emerging growth company as of December 31, 2018, we must adopt the provision of this standard retroactively as of January 1, 2018. In May 2014, FASB issued ASU 2014-09 which amended the existing accounting standards for revenue recognition. ASU 2014-09 establishes principles for recognizing revenue upon the transfer of promised goods or services to customers, in an amount that reflects the expected consideration received in exchange for those goods or services. We do not expect that adoption of ASU 2014-09 will have a material impact on our Consolidated Financial Statements.
NOTE 2 - VARIABLE INTEREST ENTITIES
We hold a credit facility whereby we sell certain loan receivables to wholly-owned, bankruptcy-remote special purpose subsidiaries ("VIEs") and we incur additional debt through the Non-Recourse U.S. SPV facility (See Note 5 - Long-Term Debt for further discussion) that is collateralized by these underlying loan receivables.
We have determined that we are the primary beneficiary of the VIEs and are required to consolidate them. We include the assets and liabilities related to the VIEs in our Consolidated Financial Statements and we account for them as secured borrowings. We parenthetically disclose on our Consolidated Balance Sheets the VIEs’ assets that can only be used to settle the VIEs' obligations and liabilities if the VIEs’ creditors have no recourse against our general credit.
10
CURO GROUP HOLDINGS CORP. AND SUBSIDIARIES
NOTES TO CONDENSED CONSOLIDATED FINANCIAL STATEMENTS (continued)
(unaudited)
The carrying amounts of consolidated VIEs' assets and liabilities associated with our special purpose subsidiaries were as follows:
(in thousands) | June 30, 2018 | December 31, 2017 | |||||
Assets | |||||||
Restricted Cash | $ | 7,274 | $ | 6,871 | |||
Loans receivable less allowance for loan losses | 171,332 | 167,706 | |||||
Total Assets | $ | 178,606 | $ | 174,577 | |||
Liabilities | |||||||
Accounts payable and accrued liabilities | $ | 14 | $ | 12 | |||
Accrued interest | 1,237 | 1,266 | |||||
Long-term debt | 114,774 | 120,402 | |||||
Total Liabilities | $ | 116,025 | $ | 121,680 | |||
NOTE 3 – LOANS RECEIVABLE AND REVENUE
The following table summarizes revenue by product for the periods indicated:
Three Months Ended June 30, | Six Months Ended June 30, | ||||||||||||||
(in thousands) | 2018 | 2017 | 2018 | 2017 | |||||||||||
Unsecured Installment | $ | 123,473 | $ | 105,149 | $ | 256,419 | $ | 214,580 | |||||||
Secured Installment | 25,777 | 23,173 | 52,633 | 46,842 | |||||||||||
Open-End | 27,222 | 15,805 | 54,445 | 33,712 | |||||||||||
Single-Pay | 61,602 | 63,241 | 125,307 | 127,031 | |||||||||||
Ancillary | 10,909 | 9,576 | 21,937 | 19,359 | |||||||||||
Total revenue | $ | 248,983 | $ | 216,944 | $ | 510,741 | $ | 441,524 | |||||||
The following tables summarize Loans receivable by product and the related delinquent loans receivable at June 30, 2018:
June 30, 2018 | ||||||||||||||||
(in thousands) | Single-Pay | Unsecured Installment | Secured Installment | Open-End | Total | |||||||||||
Current loans receivable | $ | 89,574 | $ | 139,142 | $ | 69,788 | $ | 91,034 | $ | 389,538 | ||||||
Delinquent loans receivable | — | 40,272 | 14,817 | — | 55,089 | |||||||||||
Total loans receivable | 89,574 | 179,414 | 84,605 | 91,034 | 444,627 | |||||||||||
Less: allowance for losses | (4,372 | ) | (35,279 | ) | (10,386 | ) | (9,717 | ) | (59,754 | ) | ||||||
Loans receivable, net | $ | 85,202 | $ | 144,135 | $ | 74,219 | $ | 81,317 | $ | 384,873 | ||||||
June 30, 2018 | ||||||||||
(in thousands) | Unsecured Installment | Secured Installment | Total | |||||||
Delinquent loans receivable | ||||||||||
0-30 days past due | $ | 17,052 | $ | 7,551 | $ | 24,603 | ||||
31-60 days past due | 11,886 | 3,892 | 15,778 | |||||||
61-90 days past due | 11,334 | 3,374 | 14,708 | |||||||
Total delinquent loans receivable | $ | 40,272 | $ | 14,817 | $ | 55,089 | ||||
11
CURO GROUP HOLDINGS CORP. AND SUBSIDIARIES
NOTES TO CONDENSED CONSOLIDATED FINANCIAL STATEMENTS (continued)
(unaudited)
The following tables summarize Loans receivable by product and the related delinquent loans receivable at December 31, 2017:
December 31, 2017 | ||||||||||||||||
(in thousands) | Single-Pay | Unsecured Installment | Secured Installment | Open-End | Total | |||||||||||
Current loans receivable | $ | 99,400 | $ | 151,343 | $ | 73,165 | $ | 47,949 | $ | 371,857 | ||||||
Delinquent loans receivable | — | 44,963 | 16,017 | — | 60,980 | |||||||||||
Total loans receivable | 99,400 | 196,306 | 89,182 | 47,949 | 432,837 | |||||||||||
Less: allowance for losses | (5,916 | ) | (43,754 | ) | (13,472 | ) | (6,426 | ) | (69,568 | ) | ||||||
Loans receivable, net | $ | 93,484 | $ | 152,552 | $ | 75,710 | $ | 41,523 | $ | 363,269 | ||||||
December 31, 2017 | ||||||||||
(in thousands) | Unsecured Installment | Secured Installment | Total | |||||||
Delinquent loans receivable | ||||||||||
0-30 days past due | $ | 18,358 | $ | 8,116 | $ | 26,474 | ||||
31-60 days past due | 12,836 | 3,628 | 16,464 | |||||||
61-90 days past due | 13,769 | 4,273 | 18,042 | |||||||
Total delinquent loans receivable | $ | 44,963 | $ | 16,017 | $ | 60,980 | ||||
The following tables summarize loans guaranteed by us under our CSO programs and the related delinquent receivables at June 30, 2018:
June 30, 2018 | ||||||||||
(in thousands) | Unsecured Installment | Secured Installment | Total | |||||||
Current loans receivable guaranteed by the Company | $ | 56,055 | $ | 2,379 | $ | 58,434 | ||||
Delinquent loans receivable guaranteed by the Company | 10,318 | 428 | 10,746 | |||||||
Total loans receivable guaranteed by the Company | 66,373 | 2,807 | 69,180 | |||||||
Less: CSO guarantee liability | (11,193 | ) | (426 | ) | (11,619 | ) | ||||
Loans receivable guaranteed by the Company, net | $ | 55,180 | $ | 2,381 | $ | 57,561 | ||||
June 30, 2018 | ||||||||||
(in thousands) | Unsecured Installment | Secured Installment | Total | |||||||
Delinquent loans receivable | ||||||||||
0-30 days past due | $ | 8,835 | $ | 362 | $ | 9,197 | ||||
31-60 days past due | 1,043 | 39 | 1,082 | |||||||
61-90 days past due | 440 | 27 | 467 | |||||||
Total delinquent loans receivable | $ | 10,318 | $ | 428 | $ | 10,746 | ||||
12
CURO GROUP HOLDINGS CORP. AND SUBSIDIARIES
NOTES TO CONDENSED CONSOLIDATED FINANCIAL STATEMENTS (continued)
(unaudited)
The following tables summarize loans guaranteed by us under our CSO programs and the related delinquent receivables at December 31, 2017:
December 31, 2017 | ||||||||||
(in thousands) | Unsecured Installment | Secured Installment | Total | |||||||
Current loans receivable guaranteed by the Company | $ | 62,676 | $ | 3,098 | $ | 65,774 | ||||
Delinquent loans receivable guaranteed by the Company | 12,480 | 537 | 13,017 | |||||||
Total loans receivable guaranteed by the Company | 75,156 | 3,635 | 78,791 | |||||||
Less: CSO guarantee liability | (17,073 | ) | (722 | ) | (17,795 | ) | ||||
Loans receivable guaranteed by the Company, net | $ | 58,083 | $ | 2,913 | $ | 60,996 | ||||
December 31, 2017 | ||||||||||
(in thousands) | Unsecured Installment | Secured Installment | Total | |||||||
Delinquent loans receivable | ||||||||||
0-30 days past due | $ | 10,477 | $ | 459 | $ | 10,936 | ||||
31-60 days past due | 1,364 | 41 | 1,405 | |||||||
61-90 days past due | 639 | 37 | 676 | |||||||
Total delinquent loans receivable | $ | 12,480 | $ | 537 | $ | 13,017 | ||||
13
CURO GROUP HOLDINGS CORP. AND SUBSIDIARIES
NOTES TO CONDENSED CONSOLIDATED FINANCIAL STATEMENTS (continued)
(unaudited)
The following table summarizes activity in the allowance for loan losses during the three months ended June 30, 2018:
Three Months Ended June 30, 2018 | ||||||||||||||||||
(in thousands) | Single-Pay | Unsecured Installment | Secured Installment | Open-End | Other | Total | ||||||||||||
Balance, beginning of period | $ | 4,485 | $ | 37,916 | $ | 11,639 | $ | 6,846 | $ | — | $ | 60,886 | ||||||
Charge-offs | (44,817 | ) | (36,102 | ) | (11,082 | ) | (23,807 | ) | (593 | ) | (116,401 | ) | ||||||
Recoveries | 30,274 | 6,368 | 2,296 | 11,883 | 40 | 50,861 | ||||||||||||
Net charge-offs | (14,543 | ) | (29,734 | ) | (8,786 | ) | (11,924 | ) | (553 | ) | (65,540 | ) | ||||||
Provision for losses | 14,527 | 27,434 | 7,533 | 14,848 | 553 | 64,895 | ||||||||||||
Effect of foreign currency translation | (97 | ) | (337 | ) | — | (53 | ) | — | (487 | ) | ||||||||
Balance, end of period | $ | 4,372 | $ | 35,279 | $ | 10,386 | $ | 9,717 | $ | — | $ | 59,754 | ||||||
Allowance for loan losses as a percentage of gross loan receivables | 4.9 | % | 19.7 | % | 12.3 | % | 10.7 | % | N/A | 13.4 | % | |||||||
The following table summarizes activity in the CSO guarantee liability during the three months ended June 30, 2018:
Three Months Ended June 30, 2018 | |||||||||
(in thousands) | Unsecured Installment | Secured Installment | Total | ||||||
Balance, beginning of period | $ | 9,886 | $ | 526 | $ | 10,412 | |||
Charge-offs | (33,017 | ) | (993 | ) | (34,010 | ) | |||
Recoveries | 7,350 | 776 | 8,126 | ||||||
Net charge-offs | (25,667 | ) | (217 | ) | (25,884 | ) | |||
Provision for losses | 26,974 | 117 | 27,091 | ||||||
Balance, end of period | $ | 11,193 | $ | 426 | $ | 11,619 | |||
The following table summarizes activity in the allowance for loan losses and the CSO guarantee liability, in total, during the three months ended June 30, 2018:
Three Months Ended June 30, 2018 | ||||||||||||||||||
(in thousands) | Single-Pay | Unsecured Installment | Secured Installment | Open-End | Other | Total | ||||||||||||
Balance, beginning of period | $ | 4,485 | $ | 47,802 | $ | 12,165 | $ | 6,846 | $ | — | $ | 71,298 | ||||||
Charge-offs | (44,817 | ) | (69,119 | ) | (12,075 | ) | (23,807 | ) | (593 | ) | (150,411 | ) | ||||||
Recoveries | 30,274 | 13,718 | 3,072 | 11,883 | 40 | 58,987 | ||||||||||||
Net charge-offs | (14,543 | ) | (55,401 | ) | (9,003 | ) | (11,924 | ) | (553 | ) | (91,424 | ) | ||||||
Provision for losses | 14,527 | 54,408 | 7,650 | 14,848 | 553 | 91,986 | ||||||||||||
Effect of foreign currency translation | (97 | ) | (337 | ) | — | (53 | ) | — | (487 | ) | ||||||||
Balance, end of period | $ | 4,372 | $ | 46,472 | $ | 10,812 | $ | 9,717 | $ | — | $ | 71,373 | ||||||
14
CURO GROUP HOLDINGS CORP. AND SUBSIDIARIES
NOTES TO CONDENSED CONSOLIDATED FINANCIAL STATEMENTS (continued)
(unaudited)
The following table summarizes activity in the allowance for loan losses during the three months ended June 30, 2017:
Three Months Ended June 30, 2017 | ||||||||||||||||||
(in thousands) | Single-Pay | Unsecured Installment | Secured Installment | Open-End | Other | Total | ||||||||||||
Balance, beginning of period | $ | 4,719 | $ | 42,040 | $ | 20,270 | $ | 4,572 | $ | — | $ | 71,601 | ||||||
Charge-offs | (44,020 | ) | (24,574 | ) | (6,941 | ) | (8,447 | ) | (1,261 | ) | (85,243 | ) | ||||||
Recoveries | 30,190 | 5,716 | 1,787 | 4,104 | 777 | 42,574 | ||||||||||||
Net charge-offs | (13,830 | ) | (18,858 | ) | (5,154 | ) | (4,343 | ) | (484 | ) | (42,669 | ) | ||||||
Provision for losses | 14,284 | 17,845 | 4,081 | 4,298 | 484 | 40,992 | ||||||||||||
Effect of foreign currency translation | 140 | 379 | (1 | ) | (4 | ) | — | 514 | ||||||||||
Balance, end of period | $ | 5,313 | $ | 41,406 | $ | 19,196 | $ | 4,523 | $ | — | $ | 70,438 | ||||||
Allowance for loan losses as a percentage of gross loan receivables | 5.8 | % | 26.5 | % | 25.2 | % | 16.9 | % | N/A | 20.1 | % | |||||||
The following table summarizes activity in the CSO guarantee liability during the three months ended June 30, 2017:
Three Months Ended June 30, 2017 | ||||||||||||
(in thousands) | Single-Pay | Unsecured Installment | Secured Installment | Total | ||||||||
Balance, beginning of period | $ | 14 | $ | 18,482 | $ | 1,287 | $ | 19,783 | ||||
Charge-offs | (373 | ) | (33,166 | ) | (2,141 | ) | (35,680 | ) | ||||
Recoveries | 354 | 5,857 | 814 | 7,025 | ||||||||
Net charge-offs | (19 | ) | (27,309 | ) | (1,327 | ) | (28,655 | ) | ||||
Provision for losses | 5 | 23,575 | 874 | 24,454 | ||||||||
Balance, end of period | $ | — | $ | 14,748 | $ | 834 | $ | 15,582 | ||||
The following table summarizes activity in the allowance for loan losses and the CSO guarantee liability, in total, during the three months ended June 30, 2017:
Three Months Ended June 30, 2017 | ||||||||||||||||||
(in thousands) | Single-Pay | Unsecured Installment | Secured Installment | Open-End | Other | Total | ||||||||||||
Balance, beginning of period | $ | 4,733 | $ | 60,522 | $ | 21,557 | $ | 4,572 | $ | — | $ | 91,384 | ||||||
Charge-offs | (44,393 | ) | (57,740 | ) | (9,082 | ) | (8,447 | ) | (1,261 | ) | (120,923 | ) | ||||||
Recoveries | 30,544 | 11,573 | 2,601 | 4,104 | 777 | 49,599 | ||||||||||||
Net charge-offs | (13,849 | ) | (46,167 | ) | (6,481 | ) | (4,343 | ) | (484 | ) | (71,324 | ) | ||||||
Provision for losses | 14,289 | 41,420 | 4,955 | 4,298 | 484 | 65,446 | ||||||||||||
Effect of foreign currency translation | 140 | 379 | (1 | ) | (4 | ) | — | 514 | ||||||||||
Balance, end of period | $ | 5,313 | $ | 56,154 | $ | 20,030 | $ | 4,523 | $ | — | $ | 86,020 | ||||||
15
CURO GROUP HOLDINGS CORP. AND SUBSIDIARIES
NOTES TO CONDENSED CONSOLIDATED FINANCIAL STATEMENTS (continued)
(unaudited)
The following table summarizes activity in the allowance for loan losses during the six months ended June 30, 2018:
Six Months Ended June 30, 2018 | ||||||||||||||||||
(in thousands) | Single-Pay | Unsecured Installment | Secured Installment | Open-End | Other | Total | ||||||||||||
Balance, beginning of period | $ | 5,916 | $ | 43,754 | $ | 13,472 | $ | 6,426 | $ | — | $ | 69,568 | ||||||
Charge-offs | (92,524 | ) | (75,479 | ) | (22,567 | ) | (44,156 | ) | (1,268 | ) | (235,994 | ) | ||||||
Recoveries | 65,283 | 12,335 | 5,162 | 21,260 | 87 | 104,127 | ||||||||||||
Net charge-offs | (27,241 | ) | (63,144 | ) | (17,405 | ) | (22,896 | ) | (1,181 | ) | (131,867 | ) | ||||||
Provision for losses | 25,829 | 54,911 | 14,319 | 26,276 | 1,181 | 122,516 | ||||||||||||
Effect of foreign currency translation | (132 | ) | (242 | ) | — | (89 | ) | — | (463 | ) | ||||||||
Balance, end of period | $ | 4,372 | $ | 35,279 | $ | 10,386 | $ | 9,717 | $ | — | $ | 59,754 | ||||||
Allowance for loan losses as a percentage of gross loan receivables | 4.9 | % | 19.7 | % | 12.3 | % | 10.7 | % | N/A | 13.4 | % | |||||||
The following table summarizes activity in the CSO guarantee liability during the six months ended June 30, 2018:
Six Months Ended June 30, 2018 | |||||||||
(in thousands) | Unsecured Installment | Secured Installment | Total | ||||||
Balance, beginning of period | $ | 17,073 | $ | 722 | $ | 17,795 | |||
Charge-offs | (74,736 | ) | (2,212 | ) | (76,948 | ) | |||
Recoveries | 18,326 | 1,945 | 20,271 | ||||||
Net charge-offs | (56,410 | ) | (267 | ) | (56,677 | ) | |||
Provision for losses | 50,530 | (29 | ) | 50,501 | |||||
Balance, end of period | $ | 11,193 | $ | 426 | $ | 11,619 | |||
The following table summarizes activity in the allowance for loan losses and the CSO guarantee liability, in total, during the six months ended June 30, 2018:
Six Months Ended June 30, 2018 | ||||||||||||||||||
(in thousands) | Single-Pay | Unsecured Installment | Secured Installment | Open-End | Other | Total | ||||||||||||
Balance, beginning of period | $ | 5,916 | $ | 60,827 | $ | 14,194 | $ | 6,426 | $ | — | $ | 87,363 | ||||||
Charge-offs | (92,524 | ) | (150,215 | ) | (24,779 | ) | (44,156 | ) | (1,268 | ) | (312,942 | ) | ||||||
Recoveries | 65,283 | 30,661 | 7,107 | 21,260 | 87 | 124,398 | ||||||||||||
Net charge-offs | (27,241 | ) | (119,554 | ) | (17,672 | ) | (22,896 | ) | (1,181 | ) | (188,544 | ) | ||||||
Provision for losses | 25,829 | 105,441 | 14,290 | 26,276 | 1,181 | 173,017 | ||||||||||||
Effect of foreign currency translation | (132 | ) | (242 | ) | — | (89 | ) | — | (463 | ) | ||||||||
Balance, end of period | $ | 4,372 | $ | 46,472 | $ | 10,812 | $ | 9,717 | $ | — | $ | 71,373 | ||||||
16
CURO GROUP HOLDINGS CORP. AND SUBSIDIARIES
NOTES TO CONDENSED CONSOLIDATED FINANCIAL STATEMENTS (continued)
(unaudited)
The following table summarizes activity in the allowance for loan losses during the six months ended June 30, 2017:
Six Months Ended June 30, 2017 | ||||||||||||||||||
(in thousands) | Single-Pay | Unsecured Installment | Secured Installment | Open-End | Other | Total | ||||||||||||
Balance, beginning of period | $ | 5,501 | $ | 17,775 | $ | 10,737 | $ | 5,179 | $ | — | $ | 39,192 | ||||||
Charge-offs | (88,905 | ) | (24,574 | ) | (6,941 | ) | (17,676 | ) | (2,400 | ) | (140,496 | ) | ||||||
Recoveries | 63,341 | 10,634 | 4,815 | 9,457 | 1,529 | 89,776 | ||||||||||||
Net charge-offs | (25,564 | ) | (13,940 | ) | (2,126 | ) | (8,219 | ) | (871 | ) | (50,720 | ) | ||||||
Provision for losses | 25,178 | 37,154 | 10,585 | 7,563 | 871 | 81,351 | ||||||||||||
Effect of foreign currency translation | 198 | 417 | — | — | — | 615 | ||||||||||||
Balance, end of period | $ | 5,313 | $ | 41,406 | $ | 19,196 | $ | 4,523 | $ | — | $ | 70,438 | ||||||
Allowance for loan losses as a percentage of gross loan receivables | 5.8 | % | 26.5 | % | 25.2 | % | 16.9 | % | N/A | 20.1 | % | |||||||
The following table summarizes activity in the CSO guarantee liability during the six months ended June 30, 2017:
Six Months Ended June 30, 2017 | ||||||||||||
(in thousands) | Single-Pay | Unsecured Installment | Secured Installment | Total | ||||||||
Balance, beginning of period | $ | 274 | $ | 15,630 | $ | 1,148 | $ | 17,052 | ||||
Charge-offs | (1,886 | ) | (61,122 | ) | (5,303 | ) | (68,311 | ) | ||||
Recoveries | 1,102 | 16,725 | 3,183 | 21,010 | ||||||||
Net charge-offs | (784 | ) | (44,397 | ) | (2,120 | ) | (47,301 | ) | ||||
Provision for losses | 510 | 43,515 | 1,806 | 45,831 | ||||||||
Balance, end of period | $ | — | $ | 14,748 | $ | 834 | $ | 15,582 | ||||
The following table summarizes activity in the allowance for loan losses and the CSO guarantee liability, in total, during the six months ended June 30, 2017:
Six Months Ended June 30, 2017 | ||||||||||||||||||
(in thousands) | Single-Pay | Unsecured Installment | Secured Installment | Open-End | Other | Total | ||||||||||||
Balance, beginning of period | $ | 5,775 | $ | 33,405 | $ | 11,885 | $ | 5,179 | $ | — | $ | 56,244 | ||||||
Charge-offs | (90,791 | ) | (85,696 | ) | (12,244 | ) | (17,676 | ) | (2,400 | ) | (208,807 | ) | ||||||
Recoveries | 64,443 | 27,359 | 7,998 | 9,457 | 1,529 | 110,786 | ||||||||||||
Net charge-offs | (26,348 | ) | (58,337 | ) | (4,246 | ) | (8,219 | ) | (871 | ) | (98,021 | ) | ||||||
Provision for losses | 25,688 | 80,669 | 12,391 | 7,563 | 871 | 127,182 | ||||||||||||
Effect of foreign currency translation | 198 | 417 | — | — | — | 615 | ||||||||||||
Balance, end of period | $ | 5,313 | $ | 56,154 | $ | 20,030 | $ | 4,523 | $ | — | $ | 86,020 | ||||||
NOTE 4 – CREDIT SERVICES ORGANIZATION
The CSO fee receivable amounts under our CSO programs were $11.4 million and $14.5 million at June 30, 2018 and December 31, 2017, respectively. As noted, we bear the risk of loss through our guarantee to purchase any defaulted customer loans from the lenders. The terms of these loans range from three to 18 months. As of June 30, 2018 and December 31, 2017, the maximum amount payable under all such guarantees was $58.7 million and $65.2 million, respectively. Our guarantee liability was $11.6 million and $17.8 million at June 30, 2018 and December 31, 2017, respectively.
17
CURO GROUP HOLDINGS CORP. AND SUBSIDIARIES
NOTES TO CONDENSED CONSOLIDATED FINANCIAL STATEMENTS (continued)
(unaudited)
We have placed $15.2 million and $17.9 million in collateral accounts for the lenders at June 30, 2018 and December 31, 2017, respectively, which is reflected in "Prepaid expenses and other" in the Condensed Consolidated Balance Sheets. The balances required to be maintained in these collateral accounts vary based upon lender but are typically based on a percentage of the outstanding loan balances held by the lender. The percentage of outstanding loan balances required for collateral is defined within the terms agreed to between us and each such lender.
NOTE 5 – LONG-TERM DEBT
Long-term debt consisted of the following:
(in thousands) | June 30, 2018 | December 31, 2017 | ||||||
2017 Senior Secured Notes (due 2022) | $ | 512,136 | $ | 585,823 | ||||
Non-Recourse U.S. SPV Facility | 114,697 | 120,402 | ||||||
Senior Revolver | — | — | ||||||
Cash Money Revolving Credit Facility | — | — | ||||||
Long-term debt | $ | 626,833 | $ | 706,225 | ||||
Senior Secured Notes
In February and November 2017, CFTC issued $470.0 million and $135.0 million, respectively, of 12.00% Senior Secured Notes due March 1, 2022 ("Senior Secured Notes"). The February issuance refinanced similar notes that were nearing maturity, and the extinguishment of the existing notes resulted in a pretax loss of $12.5 million during the six months ended June 30, 2017. In connection with these Senior Secured Notes we capitalized financing costs of approximately $18.3 million, the balance of which is included in the Condensed Consolidated Balance Sheets as a component of Long-term debt and is being amortized over the term of the Senior Secured Notes and included as a component of interest expense.
On February 5, 2018 CFTC issued a notice of redemption for $77.5 million of its Senior Secured Notes (the transaction whereby the Senior Secured Notes were partially redeemed, the “Redemption”). The Redemption occurred on March 7, 2018 at a price equal to 112.00% of the principal amount of the Senior Secured Notes redeemed, plus accrued and unpaid interest paid thereon, to the date of Redemption. The Redemption price and the amortization of a corresponding portion of the capitalized financing costs resulted in a loss on Redemption of $11.7 million. Following the Redemption, $527.5 million of the original outstanding principal amount of the Senior Secured Notes remain outstanding. CFTC conducted the Redemption pursuant to the Indenture governing the Senior Secured Notes (the “Indenture”), dated as of February 15, 2017, by and among CFTC, the guarantors party thereto and TMI Trust Company, as trustee and collateral agent. Consistent with the terms of the Indenture, CFTC used a portion of the cash proceeds from our IPO to redeem such Senior Secured Notes.
Subject to the provisions of its Senior Secured Notes, CFTC is required to make an offer to purchase the maximum principal amount of Senior Secured Notes that may be redeemed with 50% of its Excess Cash Flow (as defined in the agreement) within 125 days after the end of each fiscal year commencing with the fiscal year ended December 31, 2017. CFTC is not required to make an offer unless its Excess Cash Flow exceeds $5.0 million (with lesser amounts being carried forward for purposes of determining whether the $5.0 million threshold has been met for any future period). Upon completion of each Excess Cash Flow offer, the Excess Cash Flow amount is reset at zero.
On April 5, 2018, CFTC initiated an offer to purchase up to $37.7 million of its Senior Secured Notes at par, which represented 50% of its Excess Cash Flow for the fiscal year ended December 31, 2017. The offer expired on May 2, 2018 and did not result in the tender of any Senior Secured Notes. According to the terms of the Indenture, the Excess Cash Flow amount has been reset at zero.
As of June 30, 2018, CFTC was in full compliance with the covenants and other provisions of the Senior Secured Notes.
18
CURO GROUP HOLDINGS CORP. AND SUBSIDIARIES
NOTES TO CONDENSED CONSOLIDATED FINANCIAL STATEMENTS (continued)
(unaudited)
Non-Recourse U.S. SPV Facility
In November 2016, CURO Receivables Finance I, LLC, a Delaware limited liability company (the “SPV Borrower”) and a wholly-owned subsidiary, entered into a five-year revolving credit facility with Victory Park Management, LLC and certain other lenders that provides an $80.0 million term loan and $70.0 million revolving borrowing capacity that can expand over time (“Non-Recourse U.S. SPV Facility”). As of June 30, 2018, the SPV Borrower was in full compliance with the covenants and other provisions of the Non-Recourse U.S. SPV Facility.
Senior Revolver
In September 2017, CFTC and CURO Intermediate Holdings Corp. entered into a $25.0 million Senior Secured Revolving Loan Facility with BayCoast Bank (the “Senior Revolver”). The terms of the Senior Revolver generally conform to the related provisions in the Indenture dated February 15, 2017 for our Senior Secured Notes and complements our other financing sources, while providing seasonal short-term liquidity. In February 2018, the Senior Revolver capacity was increased to $29.0 million as permitted by the Indenture to the Senior Secured Notes based upon consolidated tangible assets. The Senior Revolver is now syndicated with participation by a second bank.
There is $29.0 million maximum availability under the Senior Revolver, including up to $5.0 million of standby letters of credit, for a one-year term, renewable for successive terms following annual review. The Senior Revolver was undrawn at June 30, 2018 and December 31, 2017. As of June 30, 2018, CFTC and CURO Intermediate Holdings Corp. were in full compliance with the covenants and other provisions of the Senior Revolver.
Cash Money Revolving Credit Facility
Cash Money Cheque Cashing, Inc., one of our Canadian subsidiaries, maintains a C$7.3 million revolving credit facility with Royal Bank of Canada (the "Cash Money Revolving Credit Facility"), which provides short-term liquidity required to meet the working capital needs of our Canadian operations. Aggregate draws under this facility are limited to the lesser of: (i) the borrowing base, which is defined as a percentage of cash, deposits in transit and accounts receivable, and (ii) C$7.3 million. As of December 31, 2017, the borrowing capacity under our revolving credit facility was reduced by C$0.3 million in stand-by-letters of credit.
The Cash Money Revolving Credit Facility is collateralized by substantially all of Cash Money’s assets and contains various covenants that include, among other things, that the aggregate borrowings outstanding under the facility not exceed the borrowing base, restrictions on the encumbrance of assets and the creation of indebtedness. Borrowings under the Cash Money Revolving Credit Facility bear interest (per annum) at the prime rate of a Canadian chartered bank plus 1.95%. The Cash Money Revolving Credit Facility was undrawn at June 30, 2018 and December 31, 2017.
In July 2018 the Cash Money Revolving Credit Facility capacity was increased from C$7.3 million to C$10.0 million.
NOTE 6 – SHARE-BASED COMPENSATION
On November 8, 2017, our stockholders approved a new incentive plan (“2017 Incentive Plan”). The 2017 Incentive Plan provides for the issuance of up to 5.0 million shares, subject to certain adjustment provisions, for the granting of stock options, restricted stock awards, restricted stock units (“RSUs”), stock appreciation rights, performance awards and other awards that may be settled in or based upon our common stock. Awards may be granted to certain of our officers, employees, consultants and directors. The 2017 Incentive Plan provides that shares of common stock subject to awards granted become available for issuance if such awards expire, terminate, are canceled for any reason, or are forfeited by the recipient.
RSUs are typically valued at the date of grant based on the value of our common stock and are expensed using the straight-line method over the service period. Grants of RSUs do not confer full stockholder rights such as voting rights and cash dividends, but provide for additional dividend equivalent RSU awards in lieu of cash dividends.
19
CURO GROUP HOLDINGS CORP. AND SUBSIDIARIES
NOTES TO CONDENSED CONSOLIDATED FINANCIAL STATEMENTS (continued)
(unaudited)
Unvested shares of restricted stock units may be forfeited upon termination of employment depending on the circumstances of the termination, or failure to achieve the required performance condition, if applicable.
A summary of the status of restricted stock units as of June 30, 2018 and changes during the six months ended June 30, 2018 is presented in the following table:
Units | Weighted Average Grant Date Fair Value | |||||
December 31, 2017 | 1,516,241 | $ | 14.00 | |||
Granted | 90,372 | 17.46 | ||||
Vested | (49,994 | ) | 14.20 | |||
Forfeited | — | — | ||||
June 30, 2018 | 1,556,619 | $ | 14.19 | |||
Share-based compensation expense during the three months ended June 30, 2018 and 2017, which includes compensation costs from stock options and RSUs, was $2.2 million and $0.1 million, respectively, and during the six months ended June 30, 2018 and 2017 was $4.0 million and $0.2 million, respectively, and is included in the Condensed Consolidated Statements of Income as a component of "Corporate, district and other" expense. The increased expense during the six months ended June 30, 2018 is primarily due to grants of RSUs in December 2017, as further disclosed in our 2017 Annual Report on Form 10-K.
As of June 30, 2018, there was $18.4 million of unrecognized compensation cost related to share-based awards, which we will recognize over a weighted-average period of 2.4 years.
NOTE 7 – INCOME TAXES
Our effective tax rate was 25.0% and 39.4% during the three months ended June 30, 2018 and 2017, respectively. Our effective tax rate was 29.9% and 37.8% during the six months ended June 30, 2018 and 2017, respectively.
On December 22, 2017, the 2017 Tax Act became law, which enacted various changes to the U.S. corporate tax law. Some of the most significant provisions affecting us include a reduced U.S. corporate income tax rate from 35% to 21% effective in 2018, a one-time “deemed repatriation” tax on unremitted earnings accumulated in non-U.S. jurisdictions and reported on the 2017 corporate income tax return, and a 2018 and forward minimum tax on global intangible low-taxed income ("GILTI"). At 2017 year-end, we recorded an estimated provisional deemed repatriation tax of $8.1 million. Subsequently, the IRS issued additional guidance regarding the calculation of the deemed repatriation tax and we recorded an additional accrual of $1.2 million during the period ended March 31, 2018, increasing the effective tax rate by 2.1% for the six months ended June 30, 2018. In 2018, we recorded an estimated GILTI tax of $0.6 million increasing the effective tax rate by 1.1% for the six months ended June 30, 2018. Additionally, we have not recorded a tax benefit for losses in the UK resulting in an increase of 2.4% and 2.5% to the effective tax rate during the six months ended June 30, 2018 and 2017, respectively.
As of June 30, 2018, we estimated and provided U.S. net tax of $9.9 million on our cumulative undistributed non-U.S. earnings as part of the 2017 repatriation tax provision and the 2018 GILTI tax in the 2017 Tax Act. We intend to reinvest our foreign earnings indefinitely in our non-U.S. operations and therefore have not provided for any non-U.S. withholding tax that would be assessed on dividend distributions. If the earnings of $165.8 million were distributed to the U.S., we would be subject to estimated Canadian withholding taxes of approximately $8.3 million. In the event the earnings were distributed to the U.S., we would adjust our income tax provision for the period and would determine the amount of foreign tax credit that would be available.
20
CURO GROUP HOLDINGS CORP. AND SUBSIDIARIES
NOTES TO CONDENSED CONSOLIDATED FINANCIAL STATEMENTS (continued)
(unaudited)
NOTE 8 – FINANCIAL INSTRUMENTS
Fair value is defined as the price that would be received to sell an asset or paid to transfer a liability in an orderly transaction between market participants. We are required to use valuation techniques that are consistent with the market approach, income approach, and/or cost approach. Inputs to valuation techniques refer to the assumptions that market participants would use in pricing the asset or liability based on market data obtained from independent sources, or unobservable, meaning those that reflect our own estimate about the assumptions market participants would use in pricing the asset or liability based on the best information available in the circumstances. Accounting standards establish a three-level fair value hierarchy based upon the assumptions (inputs) used to price assets or liabilities. The hierarchy requires us to maximize the use of observable inputs and minimize the use of unobservable inputs.
The three levels of inputs used to measure fair value are listed below.
Level 1 – Inputs are quoted prices in active markets for identical assets or liabilities.
Level 2 – Inputs include quoted market prices for similar assets or liabilities in active markets, quoted prices for identical or similar assets or liabilities in markets that are not active, inputs other than quoted prices that are observable for the asset or liability and inputs that are derived principally from or corroborated by observable market data by correlation or other means (market corroborated inputs).
Level 3 – Unobservable inputs reflecting our own judgments about the assumptions market participants would use in pricing the asset or liability since limited market data exists. We develop these inputs based on the best information available, including our own data.
Financial Assets and Liabilities Not Measured at Fair Value
The table below presents the carrying amounts and estimated fair values of assets and liabilities that were not recorded at fair value on the Condensed Consolidated Balance Sheets at June 30, 2018.
Estimated Fair Value | |||||||||||||||
(dollars in thousands) | Carrying Value June 30, 2018 | Level 1 | Level 2 | Level 3 | June 30, 2018 | ||||||||||
Financial assets: | |||||||||||||||
Cash | $ | 115,105 | $ | 115,105 | $ | — | $ | — | $ | 115,105 | |||||
Restricted cash | 12,448 | 12,448 | — | — | 12,448 | ||||||||||
Loans receivable, net | 384,873 | — | — | 384,873 | 384,873 | ||||||||||
Investment in Cognical | 6,600 | — | — | 6,600 | 6,600 | ||||||||||
Financial liabilities: | |||||||||||||||
Credit services organization guarantee liability | $ | 11,619 | $ | — | $ | — | $ | 11,619 | $ | 11,619 | |||||
Senior secured notes | 512,136 | — | — | 553,308 | 553,308 | ||||||||||
Non-Recourse U.S. SPV facility | 114,697 | — | — | 118,427 | 118,427 | ||||||||||
21
CURO GROUP HOLDINGS CORP. AND SUBSIDIARIES
NOTES TO CONDENSED CONSOLIDATED FINANCIAL STATEMENTS (continued)
(unaudited)
The table below presents the carrying amounts and estimated fair values of assets and liabilities that were not recorded at fair value on the Condensed Consolidated Balance Sheets at December 31, 2017.
Estimated Fair Value | |||||||||||||||
(dollars in thousands) | Carrying Value December 31, 2017 | Level 1 | Level 2 | Level 3 | December 31, 2017 | ||||||||||
Financial assets: | |||||||||||||||
Cash | $ | 162,374 | $ | 162,374 | $ | — | $ | — | $ | 162,374 | |||||
Restricted cash | 12,117 | 12,117 | — | — | 12,117 | ||||||||||
Loans receivable, net | 363,269 | — | — | 363,269 | 363,269 | ||||||||||
Investment in Cognical | 5,600 | — | — | 5,600 | 5,600 | ||||||||||
Financial liabilities: | |||||||||||||||
Credit services organization guarantee liability | 17,795 | — | — | 17,795 | 17,795 | ||||||||||
2017 Senior Secured notes | 585,823 | — | — | 663,475 | 663,475 | ||||||||||
Non-Recourse U.S. SPV facility | 120,402 | — | — | 124,590 | 124,590 | ||||||||||
Loans receivable are carried on the Condensed Consolidated Balance Sheets net of the allowance for estimated loan losses, which we calculate primarily based upon models that back-test subsequent collections history for each type of loan product. The unobservable inputs used to calculate the carrying value include additional quantitative factors, such as current default trends and changes to the portfolio mix are also considered in evaluating the accuracy of the models, as well as additional qualitative factors such as the impact of new loan products, changes to underwriting criteria or lending policies, new store development or entrance into new markets, changes in jurisdictional regulations or laws, recent credit trends and general economic conditions. Loans have terms ranging up to 60 months. The carrying value of loans receivable approximates the fair value.
In connection with our CSO programs, we guarantee consumer loan payment obligations to unrelated third-party lenders for loans that we arrange for consumers on the third-party lenders’ behalf. We are required to purchase from the lender defaulted loans we have guaranteed. The estimated fair value of the guarantee liability related to CSO loans we have guaranteed was $11.6 million and $17.8 million as of June 30, 2018 and December 31, 2017, respectively. We record the initial measurement of this guarantee liability at fair value using Level 3 inputs with subsequent measurement of the liability measured as a contingent loss. The unobservable inputs used to calculate fair value include the nature of the loan products, the creditworthiness of the borrowers in the customer base, our historical loan default history for similar loans, industry loan default history, historical collection rates on similar products, current default trends, past-due account roll rates, changes to underwriting criteria or lending policies, new store development or entrance into new markets, changes in jurisdictional regulations or laws, recent credit trends and general economic conditions.
The fair value of our Senior Secured Notes was based on broker quotations. The fair value of the Non-Recourse U.S. SPV facility was based on the cash needed for final settlement.
Derivative Financial Instrument
We seek to minimize risks from foreign currency rate fluctuations on anticipated transactions in the ordinary course of business through the use of cash flow hedges. During the six months ended June 30, 2018, we entered into a series of cash flow hedges in which the hedging instruments were forwards to purchase £7.9 million. These contracts will complete in the three months ended September 30, 2018.
We performed an assessment that determined all critical terms of the hedging instrument and the hedged transaction match and, as such, have qualitatively concluded that changes in the hedge instrument’s intrinsic value will completely offset the change in the expected cash flows based on changes in the spot rate. Since the effectiveness of this hedge
22
CURO GROUP HOLDINGS CORP. AND SUBSIDIARIES
NOTES TO CONDENSED CONSOLIDATED FINANCIAL STATEMENTS (continued)
(unaudited)
is assessed based on changes in the hedge instrument’s intrinsic value, the change in the time value of the contract would be excluded from the assessment of hedge effectiveness. We recorded changes in the hedge instrument’s intrinsic value, to the extent that they were effective as a hedge, in "Other comprehensive income." As of June 30, 2018 we have recorded an unrealized loss of $0.4 million in "Other comprehensive income" associated with this hedge.
Foreign Currency Forward Contract
On June 29, 2018, we entered into a forward contract that is not designated to receive hedge accounting treatment. The purpose of this forward contract is to reduce income statement volatility resulting from our foreign currency denominated assets and liabilities in Canada and to protect the cash required to settle those items. The forward contract is recorded at fair value on the balance sheet with changes in the fair value being recorded in the income statement. As of June 30, 2018, the forward contract did not have a fair value and did not impact the Condensed Consolidated Financial Statements.
Purchase of Cognical Holdings Inc. Preferred Shares
During the three months ended March 31, 2018, we purchased 560,872 additional preferred shares of Cognical Holdings, Inc. ("Cognical") for $1.0 million. As a result of this transaction, along with share purchases during 2017, we currently own 10.4% of the equity of Cognical. We record these purchases in "Other assets" on our Consolidated Balance Sheets.
NOTE 9 – STOCKHOLDERS' EQUITY
In connection with our IPO in December 2017, the underwriters had a 30-day option to purchase up to an additional 1.0 million shares at the initial public offering prices, less the underwriting discount to over-allotments, if any. The underwriters exercised this option and purchased 1.0 million shares on January 5, 2018. The exercise of this option provided additional proceeds to us of $13.1 million.
NOTE 10 – EARNINGS PER SHARE
The following presents the computation of basic earnings per share (in thousands, except per share amounts):
Three Months Ended June 30, | Six Months Ended June 30, | ||||||||||||||
2018 | 2017 | 2018 | 2017 | ||||||||||||
Basic: (1) | |||||||||||||||
Net income | $ | 15,975 | $ | 16,342 | $ | 39,267 | $ | 32,980 | |||||||
Weight average common shares | 45,650 | 37,895 | 45,578 | 37,895 | |||||||||||
Basic earnings per share | $ | 0.35 | $ | 0.43 | $ | 0.86 | $ | 0.87 | |||||||
(1) We have adjusted the share and per share information to reflect the 36-to-1 split of our common stock, which occurred In November 2017. | |||||||||||||||
23
CURO GROUP HOLDINGS CORP. AND SUBSIDIARIES
NOTES TO CONDENSED CONSOLIDATED FINANCIAL STATEMENTS (continued)
(unaudited)
The following computation reconciles the differences between the basic and diluted earnings per share presentations (in thousands, except per share amounts):
Three Months Ended June 30, | Six Months Ended June 30, | ||||||||||||||
2018 | 2017 | 2018 | 2017 | ||||||||||||
Diluted: (1) | |||||||||||||||
Net income | $ | 15,975 | $ | 16,342 | $ | 39,267 | $ | 32,980 | |||||||
Weighted average common shares - basic | 45,650 | 37,895 | 45,578 | 37,895 | |||||||||||
Dilutive effect of stock options and restricted stock units | 2,346 | 1,092 | 2,179 | 1,088 | |||||||||||
Weighted average common shares - diluted | 47,996 | 38,987 | 47,757 | 38,983 | |||||||||||
Diluted earnings per share | $ | 0.33 | $ | 0.42 | $ | 0.82 | $ | 0.85 | |||||||
(1) We have adjusted the share and per share information to reflect the 36-to-1 split of our common stock, which occurred in November 2017. | |||||||||||||||
Potential common shares that would have the effect of increasing diluted earnings per share or decreasing diluted loss per share are considered to be anti-dilutive and as such, we do not include these shares in calculating "Diluted earnings per share." For the three and six months ended June 30, 2018 and 2017, there were no potential common shares excluded from the calculation of diluted earnings per share because their effect was anti-dilutive.
NOTE 11 – SUPPLEMENTAL CASH FLOW INFORMATION
The following table provides supplemental cash flow information:
Six Months Ended June 30, | |||||||
(dollars in thousands) | 2018 | 2017 | |||||
Cash paid for: | |||||||
Interest | $ | 44,250 | $ | 25,788 | |||
Income taxes | 11,621 | 14,594 | |||||
Non-cash investing activities: | |||||||
Property and equipment accrued in accounts payable | $ | 595 | $ | 40 | |||
NOTE 12 – SEGMENT REPORTING
We prepare segment information on the same basis that our chief operating decision maker reviews financial information for operational decision making purposes. We have three reportable operating segments: the U.S., Canada and the U.K.
The segment performance measure below is based on gross margin. In management’s evaluation of performance, certain costs, such as corporate expenses, district expenses and interest expense, are not allocated by segment. Accordingly the following reporting segment results do not include such allocated costs. There are no intersegment revenues, and we determined the amounts below in accordance with the same accounting principles used in our Condensed Consolidated Financial Statements.
24
CURO GROUP HOLDINGS CORP. AND SUBSIDIARIES
NOTES TO CONDENSED CONSOLIDATED FINANCIAL STATEMENTS (continued)
(unaudited)
The following table illustrates summarized financial information concerning our reportable segments.
Three Months Ended June 30, | Six Months Ended June 30, | ||||||||||||||
(dollars in thousands) | 2018 | 2017 | 2018 | 2017 | |||||||||||
Revenues by segment: | |||||||||||||||
U.S. | $ | 190,126 | $ | 163,764 | $ | 394,719 | $ | 338,086 | |||||||
Canada | 47,043 | 43,595 | 93,293 | 85,161 | |||||||||||
U.K. | 11,814 | 9,585 | 22,729 | 18,277 | |||||||||||
Consolidated revenue | $ | 248,983 | $ | 216,944 | $ | 510,741 | $ | 441,524 | |||||||
Gross margin by segment: | |||||||||||||||
U.S. | $ | 64,048 | $ | 63,119 | $ | 155,392 | $ | 140,251 | |||||||
Canada | 13,300 | 15,962 | 27,802 | 30,262 | |||||||||||
U.K. | 3,064 | 2,921 | 6,463 | 6,394 | |||||||||||
Consolidated gross margin | $ | 80,412 | $ | 82,002 | $ | 189,657 | $ | 176,907 | |||||||
Expenditures for long-lived assets by segment: | |||||||||||||||
U.S. | $ | 1,195 | $ | 2,976 | $ | 1,983 | $ | 4,648 | |||||||
Canada | 220 | 61 | 974 | 1,352 | |||||||||||
U.K. | 31 | 698 | 98 | 828 | |||||||||||
Consolidated expenditures for long-lived assets | $ | 1,446 | $ | 3,735 | $ | 3,055 | $ | 6,828 | |||||||
The following table provides the proportion of gross loans receivable by segment:
(dollars in thousands) | June 30, 2018 | December 31, 2017 | |||||
U.S. | $ | 298,546 | $ | 308,696 | |||
Canada | 122,042 | 104,551 | |||||
U.K. | 24,039 | 19,590 | |||||
Total gross loans receivable | $ | 444,627 | $ | 432,837 | |||
The following table illustrates our net long-lived assets, comprised of property and equipment by geographic region. These amounts are aggregated on a legal entity basis and do not necessarily reflect where the asset is physically located:
(dollars in thousands) | June 30, 2018 | December 31, 2017 | |||||
U.S. | $ | 49,087 | $ | 52,627 | |||
Canada | 29,957 | 32,924 | |||||
U.K. | 1,376 | 1,535 | |||||
Total net long-lived assets | $ | 80,420 | $ | 87,086 | |||
Our chief operating decision maker does not review assets by segment for purposes of allocating resources or
decision-making purposes; therefore, total assets by segment are not disclosed.
NOTE 13 – CONTINGENT LIABILITIES
Harrison, et al v. Principal Investments, Inc. et al
During the period relevant to this class action litigation, we pursued in excess of 16,000 claims in the limited actions and jurisdiction court in Clark County, Nevada, seeking payment of loans on which customers had defaulted. We utilized outside counsel to file these debt collection lawsuits. On Scene Mediations, a process serving company, was employed to serve the summons and petitions in the majority of these cases. In an unrelated matter, the principal
25
CURO GROUP HOLDINGS CORP. AND SUBSIDIARIES
NOTES TO CONDENSED CONSOLIDATED FINANCIAL STATEMENTS (continued)
(unaudited)
of On Scene Mediations was convicted of multiple accounts of perjury and filing false affidavits to obtain judgments on behalf of a Las Vegas collection agency. In September 2010, we were sued by four former customers in a proposed class action suit filed in the District Court in Clark County, Nevada. The plaintiffs in this case claimed that they, and others in the proposed class, were not properly served notice of the debt collection lawsuits by the Company.
On June 7, 2017, the parties reached a settlement in this matter and we accrued approximately $2.3 million as a result of this settlement. On October 30, 2017, the District Court in Clark County, Nevada, issued final approval of the class settlement. We paid the approved settlement amount and released the related liability.
Reimbursement Offer; Possible Changes in Payment Practices
During 2017, it was determined that a limited universe of borrowers may have incurred bank overdraft or non-sufficient funds fees because of possible confusion about certain electronic payments we initiated on their loans. As a result, we decided to reimburse such fees through payments or credits against outstanding loan balances, subject to per-customer dollar limitations, upon receipt of (i) claims from potentially affected borrowers stating that they were in fact confused by our practices and (ii) bank statements from such borrowers showing that fees for which reimbursement is sought were incurred at a time that such borrowers might reasonably have been confused about our practices. As of June 30, 2018, net of payments made, a liability of $1.8 million remains for this matter.
Additionally, in June 2018, we discontinued the use of secondary payment cards for affected borrowers referenced above who did not explicitly reauthorize the use of secondary payment cards. For those borrowers, in the event we were not able to obtain payment through the bank account or payment card listed on the borrower’s application, we will need to rely exclusively on other collection methods such as delinquency notices and/or collection calls. The discontinuation for affected borrowers of our current use of secondary cards will increase collections costs and reduce collections effectiveness.
City of Austin
We were cited on July 5, 2016 by the City of Austin, Texas for alleged violations of the Austin ordinance addressing products offered by CSOs. The Austin ordinance regulates aspects of products offered under our Credit Access Business programs, including loan sizes and repayment terms. We believe that: (i) the Austin ordinance (like its counterparts elsewhere in the state) conflicts with Texas state law and (ii) our product in any event complies with the ordinance, when the ordinance is properly construed. The Austin Municipal Court agreed with our position that the ordinance conflicts with Texas law and, accordingly, did not address our second argument. In September 2017, the Travis County Court reversed the Municipal Court’s decision and remanded the case for further proceedings. We do not anticipate having a final determination of the lawfulness of our CAB program under the Austin ordinance (and similar ordinances in other Texas cities) in the near future. A final adverse decision could potentially result in material monetary liability in Austin and elsewhere in Texas, and would force us to restructure the loans we originate in Austin and elsewhere in Texas.
Other Legal Matters
We are also a defendant in certain routine litigation matters encountered in the ordinary course of our business. Certain of these matters may be covered to an extent by insurance. In the opinion of management, based upon the advice of legal counsel, the likelihood is remote that the impact of any pending legal proceedings and claims, either individually or in the aggregate, would have a material adverse effect on our Consolidated Financial Statements.
26
CURO GROUP HOLDINGS CORP. AND SUBSIDIARIES
NOTES TO CONDENSED CONSOLIDATED FINANCIAL STATEMENTS (continued)
(unaudited)
NOTE 14 – CONDENSED CONSOLIDATING FINANCIAL INFORMATION
In February 2017, CFTC issued $470.0 million aggregate principal amount Senior Secured Notes, the proceeds of which were used together with available cash, to (i) redeem the outstanding 10.75% Senior Secured Notes due 2018 of our wholly owned subsidiary, CURO Intermediate, (ii) redeem the outstanding 12.00% Senior Cash Pay Notes due 2017 and (iii) pay fees, expenses, premiums and accrued interest in connection with the offering. CFTC sold the Senior Secured Notes to qualified institutional buyers under Rule 144A of the Securities Act of 1933, as amended (the “Securities Act”); or outside the U.S. to non-U.S. persons in compliance with Regulation S of the Securities Act.
In November 2017, CFTC issued $135.0 million aggregate principal amount of additional Senior Secured Notes in a private offering exempt from the registration requirements of the Securities Act (the "Additional Notes Offering"). CFTC used the proceeds from the Additional Notes Offering, together with available cash, to (i) pay a cash dividend, in an amount of $140.0 million to us, CFTC’s sole stockholder, and ultimately our stockholders and (ii) pay fees, expenses, premiums and accrued interest in connection with the Additional Notes Offering. CFTC received the consent of the holders of a majority of the outstanding principal amount of the current Senior Secured Notes to a one-time waiver with respect to the restrictions contained in Section 5.07(a) of the indenture governing the Senior Secured Notes to permit the dividend.
On March 7, 2018, CFTC redeemed $77.5 million of the Senior Secured Notes at a price equal to 112.00% of the principal amount plus accrued and unpaid interest to the date of redemption. Following the redemption, $527.5 million of the original outstanding principal amount of the Senior Secured Notes remain outstanding. The redemption was conducted pursuant to the indenture governing the Senior Secured Notes, dated as of February 15, 2017, by and among CFTC, the guarantors party thereto and TMI Trust Company, as trustee and collateral agent. Consistent with the terms of the indenture, CFTC used a portion of the cash proceeds from our IPO, to redeem such Senior Secured Notes. See Note 5, "Long-Term Debt," for additional details.
The following condensed consolidating financing information, which has been prepared in accordance with the requirements for presentation of Rule 3-10(d) of Regulation S-X promulgated under the Securities Act, presents the condensed consolidating financial information separately for:
(i) | CFTC as the issuer of the Senior Secured Notes; |
(ii) | CURO Intermediate as the issuer of the 10.75% senior secured notes that were redeemed in February 2017; |
(iii) | Our subsidiary guarantors, which are comprised of our domestic subsidiaries, excluding CFTC, SPV, and CURO Intermediate (the “Subsidiary Guarantors”), on a consolidated basis, which are 100% owned by CURO, and which are guarantors of the Senior Secured Notes issued in February 2017 and the 10.75% senior secured notes redeemed in February 2017; |
(iv) | Our other subsidiaries on a consolidated basis, which are not guarantors of the Senior Secured Notes (the “Subsidiary Non-Guarantors”) |
(v) | Consolidating and eliminating entries representing adjustments to: |
a. | eliminate intercompany transactions between or among us, the Subsidiary Guarantors and the Subsidiary Non-Guarantors; and |
b. | eliminate the investments in our subsidiaries; |
(vi) | Us and our subsidiaries on a consolidated basis. |
27
CURO GROUP HOLDINGS CORP. AND SUBSIDIARIES
NOTES TO CONDENSED CONSOLIDATED FINANCIAL STATEMENTS (continued)
(unaudited)
Condensed Consolidating Balance Sheets
June 30, 2018 | ||||||||||||||||||||||||||||||
(dollars in thousands) | CFTC | CURO Intermediate | Subsidiary Guarantors | Subsidiary Non-Guarantors | SPV Subs | Eliminations | CFTC Consolidated | CURO | Eliminations | CURO Consolidated | ||||||||||||||||||||
Assets: | ||||||||||||||||||||||||||||||
Cash | $ | — | $ | — | $ | 69,013 | $ | 46,092 | $ | — | $ | — | $ | 115,105 | $ | — | $ | — | $ | 115,105 | ||||||||||
Restricted cash | — | — | 1,679 | 3,495 | 7,274 | — | 12,448 | — | — | 12,448 | ||||||||||||||||||||
Loans receivable, net | — | — | 81,387 | 132,154 | 171,332 | — | 384,873 | — | — | 384,873 | ||||||||||||||||||||
Deferred income taxes | — | — | — | 3,697 | — | — | 3,697 | — | — | 3,697 | ||||||||||||||||||||
Income taxes receivable | — | — | — | 623 | — | — | 623 | — | — | 623 | ||||||||||||||||||||
Prepaid expenses and other | — | — | 32,921 | 3,376 | — | — | 36,297 | — | — | 36,297 | ||||||||||||||||||||
Property and equipment, net | — | — | 49,087 | 31,333 | — | — | 80,420 | — | — | 80,420 | ||||||||||||||||||||
Goodwill | — | — | 91,131 | 52,622 | — | — | 143,753 | — | — | 143,753 | ||||||||||||||||||||
Other intangibles, net | 15 | — | 4,582 | 26,228 | — | — | 30,825 | — | — | 30,825 | ||||||||||||||||||||
Intercompany receivable | — | 38,781 | 42,511 | (20,439 | ) | — | (60,853 | ) | — | — | — | — | ||||||||||||||||||
Investment in subsidiaries | 53,213 | 1,016,398 | — | — | — | (1,069,611 | ) | — | (52,249 | ) | 52,249 | — | ||||||||||||||||||
Other | 6,608 | — | 5,230 | 971 | — | — | 12,809 | — | — | 12,809 | ||||||||||||||||||||
Total assets | $ | 59,836 | $ | 1,055,179 | $ | 377,541 | $ | 280,152 | $ | 178,606 | $ | (1,130,464 | ) | $ | 820,850 | $ | (52,249 | ) | $ | 52,249 | $ | 820,850 | ||||||||
Liabilities and Stockholder's equity: | ||||||||||||||||||||||||||||||
Accounts payable and accrued liabilities | $ | 2,334 | $ | 9 | $ | 35,755 | $ | 15,288 | $ | 14 | $ | — | $ | 53,400 | $ | 157 | $ | — | $ | 53,557 | ||||||||||
Deferred revenue | — | — | 5,488 | 5,081 | (21 | ) | — | 10,548 | — | — | 10,548 | |||||||||||||||||||
Income taxes payable | (64,622 | ) | 96,958 | (22,534 | ) | — | — | — | 9,802 | (4,327 | ) | — | 5,475 | |||||||||||||||||
Accrued interest | 20,946 | — | — | (8 | ) | 1,237 | — | 22,175 | — | — | 22,175 | |||||||||||||||||||
Payable to CURO Holdings Corp. | 38,847 | — | 62,081 | — | — | — | 100,928 | (100,928 | ) | — | — | |||||||||||||||||||
CSO guarantee liability | — | — | 11,619 | — | — | — | 11,619 | — | — | 11,619 | ||||||||||||||||||||
Deferred rent | — | — | 9,772 | 1,709 | — | — | 11,481 | — | — | 11,481 | ||||||||||||||||||||
Long-term debt (excluding current maturities) | 512,135 | — | — | (76 | ) | 114,774 | — | 626,833 | — | — | 626,833 | |||||||||||||||||||
Subordinated shareholder debt | — | — | — | 2,278 | — | — | 2,278 | — | — | 2,278 | ||||||||||||||||||||
Intercompany payable | (395,121 | ) | 895,349 | (347,983 | ) | 60,853 | (152,245 | ) | (60,853 | ) | — | — | — | — | ||||||||||||||||
Other long-term liabilities | — | — | 5,095 | 1,494 | — | — | 6,589 | — | — | 6,589 | ||||||||||||||||||||
Deferred tax liabilities | (2,434 | ) | 9,650 | 2,534 | 7,696 | — | — | 17,446 | — | — | 17,446 | |||||||||||||||||||
Total liabilities | 112,085 | 1,001,966 | (238,173 | ) | 94,315 | (36,241 | ) | (60,853 | ) | 873,099 | (105,098 | ) | — | 768,001 | ||||||||||||||||
Stockholder’s equity | (52,249 | ) | 53,213 | 615,714 | 185,837 | 214,847 | (1,069,611 | ) | (52,249 | ) | 52,849 | 52,249 | 52,849 | |||||||||||||||||
Total liabilities and stockholder’s equity | $ | 59,836 | $ | 1,055,179 | $ | 377,541 | $ | 280,152 | $ | 178,606 | $ | (1,130,464 | ) | $ | 820,850 | $ | (52,249 | ) | $ | 52,249 | $ | 820,850 | ||||||||
28
CURO GROUP HOLDINGS CORP. AND SUBSIDIARIES
NOTES TO CONDENSED CONSOLIDATED FINANCIAL STATEMENTS (continued)
(unaudited)
December 31, 2017 | ||||||||||||||||||||||||||||||
(dollars in thousands) | CFTC | CURO Intermediate | Subsidiary Guarantors | Subsidiary Non-Guarantors | SPV Subs | Eliminations | CFTC Consolidated | CURO | Eliminations | CURO Consolidated | ||||||||||||||||||||
Assets: | ||||||||||||||||||||||||||||||
Cash | $ | — | $ | — | $ | 117,379 | $ | 44,915 | $ | — | $ | — | $ | 162,294 | $ | 80 | $ | — | $ | 162,374 | ||||||||||
Restricted cash | — | — | 1,677 | 3,569 | 6,871 | — | 12,117 | — | — | 12,117 | ||||||||||||||||||||
Loans receivable, net | — | — | 84,912 | 110,651 | 167,706 | — | 363,269 | — | — | 363,269 | ||||||||||||||||||||
Deferred income taxes | — | 2,154 | (4,646 | ) | 3,502 | — | — | 1,010 | (238 | ) | — | 772 | ||||||||||||||||||
Income taxes receivable | — | — | — | — | — | — | — | 3,455 | — | 3,455 | ||||||||||||||||||||
Prepaid expenses and other | — | — | 38,277 | 3,353 | — | — | 41,630 | 882 | — | 42,512 | ||||||||||||||||||||
Property and equipment, net | — | — | 52,627 | 34,459 | — | — | 87,086 | — | — | 87,086 | ||||||||||||||||||||
Goodwill | — | — | 91,131 | 54,476 | — | — | 145,607 | — | — | 145,607 | ||||||||||||||||||||
Other intangibles, net | 16 | — | 5,418 | 27,335 | — | — | 32,769 | — | — | 32,769 | ||||||||||||||||||||
Intercompany receivable | — | 37,877 | 33,062 | (30,588 | ) | — | (40,351 | ) | — | — | — | — | ||||||||||||||||||
Investment in subsidiaries | (14,504 | ) | 899,371 | — | — | — | (884,867 | ) | — | (84,889 | ) | 84,889 | — | |||||||||||||||||
Other | 5,713 | — | 3,017 | 1,040 | — | — | 9,770 | — | — | 9,770 | ||||||||||||||||||||
Total assets | $ | (8,775 | ) | $ | 939,402 | $ | 422,854 | $ | 252,712 | $ | 174,577 | $ | (925,218 | ) | $ | 855,552 | $ | (80,710 | ) | $ | 84,889 | $ | 859,731 | |||||||
Liabilities and Stockholder's equity: | ||||||||||||||||||||||||||||||
Accounts payable and accrued liabilities | $ | 2,606 | $ | 13 | $ | 35,753 | $ | 15,954 | $ | 12 | $ | — | $ | 54,338 | $ | 1,454 | $ | — | $ | 55,792 | ||||||||||
Deferred revenue | — | — | 6,529 | 5,455 | — | — | 11,984 | — | — | 11,984 | ||||||||||||||||||||
Income taxes payable | (49,738 | ) | 70,231 | (18,450 | ) | 2,077 | — | — | 4,120 | — | — | 4,120 | ||||||||||||||||||
Accrued interest | 24,201 | — | — | — | 1,266 | — | 25,467 | — | — | 25,467 | ||||||||||||||||||||
Payable to CURO Holdings Corp. | 184,348 | — | (95,048 | ) | — | — | — | 89,300 | (89,300 | ) | — | — | ||||||||||||||||||
CSO guarantee liability | — | — | 17,795 | — | — | — | 17,795 | — | — | 17,795 | ||||||||||||||||||||
Deferred rent | — | — | 9,896 | 1,681 | — | — | 11,577 | — | — | 11,577 | ||||||||||||||||||||
Long-term debt | 585,823 | — | — | — | 120,402 | — | 706,225 | — | — | 706,225 | ||||||||||||||||||||
Subordinated shareholder debt | — | — | — | 2,381 | — | — | 2,381 | — | — | 2,381 | ||||||||||||||||||||
Intercompany payable | (668,536 | ) | 876,869 | (124,332 | ) | 40,351 | (84,001 | ) | (40,351 | ) | — | — | — | — | ||||||||||||||||
Other long-term liabilities | — | — | 3,969 | 1,799 | — | — | 5,768 | — | — | 5,768 | ||||||||||||||||||||
Deferred tax liabilities | (2,590 | ) | 6,793 | (143 | ) | 7,426 | — | — | 11,486 | — | — | 11,486 | ||||||||||||||||||
Total liabilities | 76,114 | 953,906 | (164,031 | ) | 77,124 | 37,679 | (40,351 | ) | 940,441 | (87,846 | ) | — | 852,595 | |||||||||||||||||
Stockholder’s equity | (84,889 | ) | (14,504 | ) | 586,885 | 175,588 | 136,898 | (884,867 | ) | (84,889 | ) | 7,136 | 84,889 | 7,136 | ||||||||||||||||
Total liabilities and stockholder’s equity | $ | (8,775 | ) | $ | 939,402 | $ | 422,854 | $ | 252,712 | $ | 174,577 | $ | (925,218 | ) | $ | 855,552 | $ | (80,710 | ) | $ | 84,889 | $ | 859,731 | |||||||
29
CURO GROUP HOLDINGS CORP. AND SUBSIDIARIES
NOTES TO CONDENSED CONSOLIDATED FINANCIAL STATEMENTS (continued)
(unaudited)
Condensed Consolidating Statements of Income
Three Months Ended June 30, 2018 | ||||||||||||||||||||||||||||||
(dollars in thousands) | CFTC | CURO Intermediate | Subsidiary Guarantors | Subsidiary Non-Guarantors | SPV Subs | Eliminations | CFTC Consolidated | CURO | Eliminations | CURO Consolidated | ||||||||||||||||||||
Revenue | $ | — | $ | — | $ | 118,034 | $ | 58,857 | $ | 72,092 | $ | 248,983 | $ | — | $ | — | $ | 248,983 | ||||||||||||
Provision for losses | — | — | 46,320 | 19,999 | 25,667 | 91,986 | — | — | 91,986 | |||||||||||||||||||||
Net revenue | — | — | 71,714 | 38,858 | 46,425 | — | 156,997 | — | — | 156,997 | ||||||||||||||||||||
Cost of providing services: | ||||||||||||||||||||||||||||||
Salaries and benefits | — | — | 18,070 | 8,837 | — | — | 26,907 | — | — | 26,907 | ||||||||||||||||||||
Occupancy | — | — | 7,643 | 5,677 | — | — | 13,320 | — | — | 13,320 | ||||||||||||||||||||
Office | — | — | 4,247 | 1,830 | — | — | 6,077 | — | — | 6,077 | ||||||||||||||||||||
Other costs of providing services | — | — | 11,254 | 1,007 | 466 | — | 12,727 | — | — | 12,727 | ||||||||||||||||||||
Advertising | — | — | 12,409 | 5,145 | — | — | 17,554 | — | — | 17,554 | ||||||||||||||||||||
Total cost of providing services | — | — | 53,623 | 22,496 | 466 | — | 76,585 | — | — | 76,585 | ||||||||||||||||||||
Gross margin | — | — | 18,091 | 16,362 | 45,959 | — | 80,412 | — | — | 80,412 | ||||||||||||||||||||
Operating (income) expense: | ||||||||||||||||||||||||||||||
Corporate, district and other | 458 | 18 | 25,383 | 10,434 | 46 | — | 36,339 | 2,316 | — | 38,655 | ||||||||||||||||||||
Intercompany management fee | — | — | (6,920 | ) | 3,281 | 3,639 | — | — | — | — | — | |||||||||||||||||||
Interest expense | 16,585 | — | (60 | ) | — | 3,940 | — | 20,465 | — | — | 20,465 | |||||||||||||||||||
Loss on extinguishment of debt | — | — | — | — | — | — | — | — | — | — | ||||||||||||||||||||
Intercompany interest (income) expense | — | (904 | ) | (180 | ) | 1,084 | — | — | — | — | — | — | ||||||||||||||||||
Total operating expense | 17,043 | (886 | ) | 18,223 | 14,799 | 7,625 | — | 56,804 | 2,316 | — | 59,120 | |||||||||||||||||||
Net income (loss) before income taxes | (17,043 | ) | 886 | (132 | ) | 1,563 | 38,334 | — | 23,608 | (2,316 | ) | — | 21,292 | |||||||||||||||||
Provision for income tax expense (benefit) | (5,418 | ) | 13,668 | (4,458 | ) | 2,101 | — | — | 5,893 | (576 | ) | — | 5,317 | |||||||||||||||||
Net income (loss) | (11,625 | ) | (12,782 | ) | 4,326 | (538 | ) | 38,334 | — | 17,715 | (1,740 | ) | — | 15,975 | ||||||||||||||||
Equity in net income (loss) of subsidiaries: | ||||||||||||||||||||||||||||||
CFTC | — | — | — | — | — | — | — | 17,715 | (17,715 | ) | — | |||||||||||||||||||
CURO Intermediate | (12,782 | ) | — | — | — | — | 12,782 | — | — | — | — | |||||||||||||||||||
Guarantor Subsidiaries | 4,326 | — | — | — | — | (4,326 | ) | — | — | — | — | |||||||||||||||||||
Non-Guarantor Subsidiaries | (538 | ) | — | — | — | — | 538 | — | — | — | — | |||||||||||||||||||
SPV Subs | 38,334 | — | — | — | — | (38,334 | ) | — | — | — | — | |||||||||||||||||||
Net income (loss) attributable to CURO | $ | 17,715 | $ | (12,782 | ) | $ | 4,326 | $ | (538 | ) | $ | 38,334 | $ | (29,340 | ) | $ | 17,715 | $ | 15,975 | $ | (17,715 | ) | $ | 15,975 | ||||||
30
CURO GROUP HOLDINGS CORP. AND SUBSIDIARIES
NOTES TO CONDENSED CONSOLIDATED FINANCIAL STATEMENTS (continued)
(unaudited)
Three Months Ended June 30, 2017 | ||||||||||||||||||||||||||||||
(dollars in thousands) | CFTC | CURO Intermediate | Subsidiary Guarantors | Subsidiary Non-Guarantors | SPV Subs | Eliminations | CFTC Consolidated | CURO | Eliminations | CURO Consolidated | ||||||||||||||||||||
Revenue | $ | — | $ | — | $ | 102,189 | $ | 53,180 | $ | 61,575 | $ | — | $ | 216,944 | $ | — | $ | — | $ | 216,944 | ||||||||||
Provision for losses | — | — | 36,079 | 13,489 | 15,878 | — | 65,446 | — | — | 65,446 | ||||||||||||||||||||
Net revenue | — | — | 66,110 | 39,691 | 45,697 | — | 151,498 | — | — | 151,498 | ||||||||||||||||||||
Cost of providing services: | ||||||||||||||||||||||||||||||
Salaries and benefits | — | — | 17,736 | 8,564 | — | — | 26,300 | — | — | 26,300 | ||||||||||||||||||||
Occupancy | — | — | 7,791 | 5,720 | — | — | 13,511 | — | — | 13,511 | ||||||||||||||||||||
Office | — | — | 3,721 | 1,215 | — | — | 4,936 | — | — | 4,936 | ||||||||||||||||||||
Other store operating expenses | — | — | 11,513 | 1,566 | 29 | — | 13,108 | — | — | 13,108 | ||||||||||||||||||||
Advertising | — | — | 7,898 | 3,743 | — | — | 11,641 | — | — | 11,641 | ||||||||||||||||||||
Total cost of providing services | — | — | 48,659 | 20,808 | 29 | — | 69,496 | — | — | 69,496 | ||||||||||||||||||||
Gross Margin | — | — | 17,451 | 18,883 | 45,668 | — | 82,002 | — | — | 82,002 | ||||||||||||||||||||
Operating (income) expense: | ||||||||||||||||||||||||||||||
Corporate, district and other | 2,447 | (78 | ) | 21,484 | 8,563 | 4,067 | — | 36,483 | 74 | — | 36,557 | |||||||||||||||||||
Intercompany management fee | — | — | (3,865 | ) | 3,865 | — | — | — | — | — | — | |||||||||||||||||||
Interest expense | 15,174 | — | — | 61 | 3,249 | — | 18,484 | — | — | 18,484 | ||||||||||||||||||||
Intercompany interest (income) expense | — | (1,042 | ) | 1,691 | 1,207 | (1,856 | ) | — | — | — | — | — | ||||||||||||||||||
Total operating expense | 17,621 | (1,120 | ) | 19,310 | 13,696 | 5,460 | — | 54,967 | 74 | — | 55,041 | |||||||||||||||||||
Net (loss) income before income taxes | (17,621 | ) | 1,120 | (1,859 | ) | 5,187 | 40,208 | — | 27,035 | (74 | ) | — | 26,961 | |||||||||||||||||
Provision for income tax (benefit) expense | (6,166 | ) | 17,560 | (3,072 | ) | 2,389 | — | — | 10,711 | (92 | ) | — | 10,619 | |||||||||||||||||
Net income (loss) | (11,455 | ) | (16,440 | ) | 1,213 | 2,798 | 40,208 | — | 16,324 | 18 | — | 16,342 | ||||||||||||||||||
Equity in net income (loss) of subsidiaries: | ||||||||||||||||||||||||||||||
CFTC | — | — | — | — | — | — | — | 16,324 | (16,324 | ) | — | |||||||||||||||||||
CURO Intermediate | (16,440 | ) | — | — | — | — | 16,440 | — | — | — | — | |||||||||||||||||||
Guarantor Subsidiaries | 1,213 | — | — | — | — | (1,213 | ) | — | — | — | — | |||||||||||||||||||
Non-Guarantor Subsidiaries | 2,798 | — | — | — | — | (2,798 | ) | — | — | — | — | |||||||||||||||||||
SPV Subs | 40,208 | — | — | — | — | (40,208 | ) | — | — | — | — | |||||||||||||||||||
Net income (loss) attributable to CURO | $ | 16,324 | $ | (16,440 | ) | $ | 1,213 | $ | 2,798 | $ | 40,208 | $ | (27,779 | ) | $ | 16,324 | $ | 16,342 | $ | (16,324 | ) | $ | 16,342 | |||||||
31
CURO GROUP HOLDINGS CORP. AND SUBSIDIARIES
NOTES TO CONDENSED CONSOLIDATED FINANCIAL STATEMENTS (continued)
(unaudited)
Six Months Ended June 30, 2018 | ||||||||||||||||||||||||||||||
(dollars in thousands) | CFTC | CURO Intermediate | Subsidiary Guarantors | Subsidiary Non-Guarantors | SPV Subs | Eliminations | CFTC Consolidated | CURO | Eliminations | CURO Consolidated | ||||||||||||||||||||
Revenue | $ | — | $ | — | $ | 246,442 | $ | 116,022 | $ | 148,277 | $ | 510,741 | $ | — | $ | — | $ | 510,741 | ||||||||||||
Provision for losses | — | — | 82,089 | 36,697 | 54,231 | 173,017 | — | — | 173,017 | |||||||||||||||||||||
Net revenue | — | — | 164,353 | 79,325 | 94,046 | — | 337,724 | — | — | 337,724 | ||||||||||||||||||||
Cost of providing services: | ||||||||||||||||||||||||||||||
Salaries and benefits | — | — | 36,089 | 17,737 | — | — | 53,826 | — | — | 53,826 | ||||||||||||||||||||
Occupancy | — | — | 15,289 | 11,458 | — | — | 26,747 | — | — | 26,747 | ||||||||||||||||||||
Office | — | — | 9,830 | 3,227 | — | — | 13,057 | — | — | 13,057 | ||||||||||||||||||||
Other costs of providing services | — | — | 23,284 | 2,896 | 947 | — | 27,127 | — | — | 27,127 | ||||||||||||||||||||
Advertising | — | — | 17,568 | 9,742 | — | — | 27,310 | — | — | 27,310 | ||||||||||||||||||||
Total cost of providing services | — | — | 102,060 | 45,060 | 947 | — | 148,067 | — | — | 148,067 | ||||||||||||||||||||
Gross margin | — | — | 62,293 | 34,265 | 93,099 | — | 189,657 | — | — | 189,657 | ||||||||||||||||||||
Operating (income) expense: | ||||||||||||||||||||||||||||||
Corporate, district and other | 906 | 25 | 53,375 | 20,356 | 76 | — | 74,738 | 4,371 | — | 79,109 | ||||||||||||||||||||
Intercompany management fee | — | — | (13,822 | ) | 6,775 | 7,047 | — | — | — | — | — | |||||||||||||||||||
Interest expense | 34,907 | — | (172 | ) | 52 | 8,027 | — | 42,814 | — | — | 42,814 | |||||||||||||||||||
Loss on extinguishment of debt | 11,683 | — | — | — | — | — | 11,683 | — | — | 11,683 | ||||||||||||||||||||
Intercompany interest (income) expense | — | (1,784 | ) | (259 | ) | 2,043 | — | — | — | — | — | — | ||||||||||||||||||
Total operating expense | 47,496 | (1,759 | ) | 39,122 | 29,226 | 15,150 | — | 129,235 | 4,371 | — | 133,606 | |||||||||||||||||||
Net income (loss) before income taxes | (47,496 | ) | 1,759 | 23,171 | 5,039 | 77,949 | — | 60,422 | (4,371 | ) | — | 56,051 | ||||||||||||||||||
Provision for income tax expense (benefit) | (12,259 | ) | 32,165 | (6,043 | ) | 4,030 | — | — | 17,893 | (1,109 | ) | — | 16,784 | |||||||||||||||||
Net income (loss) | (35,237 | ) | (30,406 | ) | 29,214 | 1,009 | 77,949 | — | 42,529 | (3,262 | ) | — | 39,267 | |||||||||||||||||
Equity in net income (loss) of subsidiaries: | ||||||||||||||||||||||||||||||
CFTC | — | — | — | — | — | — | — | 42,529 | (42,529 | ) | — | |||||||||||||||||||
CURO Intermediate | (30,406 | ) | — | — | — | — | 30,406 | — | — | — | — | |||||||||||||||||||
Guarantor Subsidiaries | 29,214 | — | — | — | — | (29,214 | ) | — | — | — | — | |||||||||||||||||||
Non-Guarantor Subsidiaries | 1,009 | — | — | — | — | (1,009 | ) | — | — | — | — | |||||||||||||||||||
SPV Subs | 77,949 | — | — | — | — | (77,949 | ) | — | — | — | — | |||||||||||||||||||
Net income (loss) attributable to CURO | $ | 42,529 | $ | (30,406 | ) | $ | 29,214 | $ | 1,009 | $ | 77,949 | $ | (77,766 | ) | $ | 42,529 | $ | 39,267 | $ | (42,529 | ) | $ | 39,267 | |||||||
32
CURO GROUP HOLDINGS CORP. AND SUBSIDIARIES
NOTES TO CONDENSED CONSOLIDATED FINANCIAL STATEMENTS (continued)
(unaudited)
Six Months Ended June 30, 2017 | ||||||||||||||||||||||||||||||
(dollars in thousands) | CFTC | CURO Intermediate | Subsidiary Guarantors | Subsidiary Non-Guarantors | SPV Subs | Eliminations | CFTC Consolidated | CURO | Eliminations | CURO Consolidated | ||||||||||||||||||||
Revenue | $ | — | $ | — | $ | 214,312 | $ | 103,438 | $ | 123,774 | $ | — | $ | 441,524 | $ | — | $ | — | $ | 441,524 | ||||||||||
Provision for losses | — | — | 64,136 | 26,030 | 37,016 | — | 127,182 | — | — | 127,182 | ||||||||||||||||||||
Net revenue | — | — | 150,176 | 77,408 | 86,758 | — | 314,342 | — | — | 314,342 | ||||||||||||||||||||
Cost of providing services: | ||||||||||||||||||||||||||||||
Salaries and benefits | — | — | 35,589 | 17,144 | — | — | 52,733 | — | — | 52,733 | ||||||||||||||||||||
Occupancy | — | — | 15,936 | 11,670 | — | — | 27,606 | — | — | 27,606 | ||||||||||||||||||||
Office | — | — | 7,486 | 2,318 | — | — | 9,804 | — | — | 9,804 | ||||||||||||||||||||
Other store operating expenses | — | — | 25,015 | 2,884 | 64 | — | 27,963 | — | — | 27,963 | ||||||||||||||||||||
Advertising | — | — | 12,592 | 6,737 | — | — | 19,329 | — | — | 19,329 | ||||||||||||||||||||
Total cost of providing services | — | — | 96,618 | 40,753 | 64 | — | 137,435 | — | — | 137,435 | ||||||||||||||||||||
Gross Margin | — | — | 53,558 | 36,655 | 86,694 | — | 176,907 | — | — | 176,907 | ||||||||||||||||||||
Operating (income) expense: | ||||||||||||||||||||||||||||||
Corporate, district and other | 2,977 | (70 | ) | 43,787 | 16,507 | 4,181 | — | 67,382 | 2,168 | — | 69,550 | |||||||||||||||||||
Intercompany management fee | — | — | (6,809 | ) | 6,809 | — | — | — | — | — | — | |||||||||||||||||||
Interest expense | 22,456 | 9,613 | 1 | 82 | 6,388 | — | 38,540 | 3,310 | — | 41,850 | ||||||||||||||||||||
Intercompany interest (income) expense | — | (2,190 | ) | (330 | ) | 2,520 | — | — | — | — | — | — | ||||||||||||||||||
Loss on extinguishment of debt | — | 11,884 | — | — | — | — | 11,884 | 574 | — | 12,458 | ||||||||||||||||||||
Total operating expense | 25,433 | 19,237 | 36,649 | 25,918 | 10,569 | — | 117,806 | 6,052 | — | 123,858 | ||||||||||||||||||||
Net (loss) income before income taxes | (25,433 | ) | (19,237 | ) | 16,909 | 10,737 | 76,125 | — | 59,101 | (6,052 | ) | — | 53,049 | |||||||||||||||||
Provision for income tax (benefit) expense | (10,126 | ) | 34,172 | (6,047 | ) | 4,433 | — | — | 22,432 | (2,363 | ) | — | 20,069 | |||||||||||||||||
Net income (loss) | (15,307 | ) | (53,409 | ) | 22,956 | 6,304 | 76,125 | — | 36,669 | (3,689 | ) | — | 32,980 | |||||||||||||||||
Equity in net income (loss) of subsidiaries: | ||||||||||||||||||||||||||||||
CFTC | — | — | — | — | — | — | — | 36,669 | (36,669 | ) | — | |||||||||||||||||||
CURO Intermediate | (53,409 | ) | — | — | — | — | 53,409 | — | — | — | — | |||||||||||||||||||
Guarantor Subsidiaries | 22,956 | — | — | — | — | (22,956 | ) | — | — | — | — | |||||||||||||||||||
Non-Guarantor Subsidiaries | 6,304 | — | — | — | — | (6,304 | ) | — | — | — | — | |||||||||||||||||||
SPV Subs | 76,125 | — | — | — | — | (76,125 | ) | — | — | — | — | |||||||||||||||||||
Net income (loss) attributable to CURO | $ | 36,669 | $ | (53,409 | ) | $ | 22,956 | $ | 6,304 | $ | 76,125 | $ | (51,976 | ) | $ | 36,669 | $ | 32,980 | $ | (36,669 | ) | $ | 32,980 | |||||||
33
CURO GROUP HOLDINGS CORP. AND SUBSIDIARIES
NOTES TO CONDENSED CONSOLIDATED FINANCIAL STATEMENTS (continued)
(unaudited)
Condensed Consolidating Statements of Cash Flows
Six Months Ended June 30, 2018 | ||||||||||||||||||||||||||||||
(dollars in thousands) | CFTC | CURO Intermediate | Subsidiary Guarantors | Subsidiary Non-Guarantors | SPV Subs | Eliminations | CFTC Consolidated | CURO | Eliminations | CURO Consolidated | ||||||||||||||||||||
Cash flows from operating activities | ||||||||||||||||||||||||||||||
Net cash provided (used) | $ | 78,548 | $ | — | $ | (46,381 | ) | $ | 4,174 | $ | 6,566 | $ | 3,538 | $ | 46,445 | $ | (12,550 | ) | $ | — | $ | 33,895 | ||||||||
Cash flows from investing activities: | ||||||||||||||||||||||||||||||
Purchase of property, equipment and software | — | — | (1,983 | ) | (1,072 | ) | — | — | (3,055 | ) | — | — | (3,055 | ) | ||||||||||||||||
Cash paid for Cognical Holdings preferred shares | (958 | ) | — | — | — | — | — | (958 | ) | — | — | (958 | ) | |||||||||||||||||
Change in restricted cash | — | — | (2 | ) | (6 | ) | (403 | ) | — | (411 | ) | — | — | (411 | ) | |||||||||||||||
Net cash used | (958 | ) | — | (1,985 | ) | (1,078 | ) | (403 | ) | — | (4,424 | ) | — | — | (4,424 | ) | ||||||||||||||
Cash flows from financing activities: | ||||||||||||||||||||||||||||||
Proceeds from Non-Recourse U.S. SPV facility | — | — | — | — | 13,000 | — | 13,000 | — | — | 13,000 | ||||||||||||||||||||
Payments on Non-Recourse U.S. SPV facility | — | — | — | — | (19,163 | ) | — | (19,163 | ) | — | — | (19,163 | ) | |||||||||||||||||
Proceeds from revolving credit facilities | 10,000 | — | — | 8,798 | — | — | 18,798 | — | — | 18,798 | ||||||||||||||||||||
Payments on revolving credit facilities | (10,000 | ) | — | — | (8,798 | ) | — | — | (18,798 | ) | — | — | (18,798 | ) | ||||||||||||||||
Proceeds from issuance of common stock | — | — | — | — | — | — | — | 12,431 | — | 12,431 | ||||||||||||||||||||
Proceeds from exercise of stock options | — | — | — | — | — | — | — | 39 | — | 39 | ||||||||||||||||||||
Payments on 12.00% Senior Secured Notes | (77,500 | ) | — | — | — | — | — | (77,500 | ) | — | — | (77,500 | ) | |||||||||||||||||
Debt issuance costs paid | (90 | ) | — | — | (78 | ) | — | — | (168 | ) | — | — | (168 | ) | ||||||||||||||||
Net cash provided (used) | (77,590 | ) | — | — | (78 | ) | (6,163 | ) | — | (83,831 | ) | 12,470 | — | (71,361 | ) | |||||||||||||||
Effect of exchange rate changes on cash | — | — | — | (1,841 | ) | — | (3,538 | ) | (5,379 | ) | — | — | (5,379 | ) | ||||||||||||||||
Net increase (decrease) in cash | — | — | (48,366 | ) | 1,177 | — | — | (47,189 | ) | (80 | ) | — | (47,269 | ) | ||||||||||||||||
Cash at beginning of period | — | — | 117,379 | 44,915 | — | — | 162,294 | 80 | — | 162,374 | ||||||||||||||||||||
Cash at end of period | $ | — | $ | — | $ | 69,013 | $ | 46,092 | $ | — | $ | — | $ | 115,105 | $ | — | $ | — | $ | 115,105 | ||||||||||
34
CURO GROUP HOLDINGS CORP. AND SUBSIDIARIES
NOTES TO CONDENSED CONSOLIDATED FINANCIAL STATEMENTS (continued)
(unaudited)
Six Months Ended June 30, 2017 | ||||||||||||||||||||||||||||||
(dollars in thousands) | CFTC | CURO Intermediate | Subsidiary Guarantors | Subsidiary Non-Guarantors | SPV Subs | Eliminations | CFTC Consolidated | CURO | Eliminations | CURO Consolidated | ||||||||||||||||||||
Cash flows from operating activities | ||||||||||||||||||||||||||||||
Net cash (used) provided | $ | (284,269 | ) | $ | 424,080 | $ | (55,496 | ) | $ | (17,605 | ) | $ | (11,422 | ) | $ | (431 | ) | $ | 54,857 | $ | (5,083 | ) | $ | — | $ | 49,774 | ||||
Cash flows from investing activities: | ||||||||||||||||||||||||||||||
Purchase of property, equipment and software | — | — | (4,648 | ) | (2,180 | ) | — | — | (6,828 | ) | — | — | (6,828 | ) | ||||||||||||||||
Cash paid for Cognical investment | (4,975 | ) | — | — | — | — | — | (4,975 | ) | — | — | (4,975 | ) | |||||||||||||||||
Change in restricted cash | — | — | 8 | 121 | (4,566 | ) | — | (4,437 | ) | — | — | (4,437 | ) | |||||||||||||||||
Net cash used | (4,975 | ) | — | (4,640 | ) | (2,059 | ) | (4,566 | ) | — | (16,240 | ) | — | — | (16,240 | ) | ||||||||||||||
Cash flows from financing activities: | ||||||||||||||||||||||||||||||
Proceeds from Non-Recourse U.S. SPV facility and ABL facility | — | — | — | — | 41,130 | — | 41,130 | — | — | 41,130 | ||||||||||||||||||||
Payments on Non-Recourse U.S. SPV facility and ABL facility | — | — | — | — | (25,142 | ) | — | (25,142 | ) | — | — | (25,142 | ) | |||||||||||||||||
Proceeds from issuance of 12.00% Senior Secured Notes | 461,329 | — | — | — | — | — | 461,329 | — | — | 461,329 | ||||||||||||||||||||
Payments on 10.75% Senior Secured Notes | — | (426,034 | ) | — | — | — | — | (426,034 | ) | — | — | (426,034 | ) | |||||||||||||||||
Payments on 12.00% Senior Cash Pay Notes | — | — | — | — | — | — | — | (125,000 | ) | — | (125,000 | ) | ||||||||||||||||||
Dividends (paid) received | (158,083 | ) | — | — | — | — | — | (158,083 | ) | 130,083 | — | (28,000 | ) | |||||||||||||||||
Debt issuance costs paid | (14,002 | ) | — | — | — | — | — | (14,002 | ) | — | — | (14,002 | ) | |||||||||||||||||
Net cash provided (used) | 289,244 | (426,034 | ) | — | — | 15,988 | — | (120,802 | ) | 5,083 | — | (115,719 | ) | |||||||||||||||||
Effect of exchange rate changes on cash | — | — | — | 2,009 | — | 431 | 2,440 | — | — | 2,440 | ||||||||||||||||||||
Net decrease in cash | — | (1,954 | ) | (60,136 | ) | (17,655 | ) | — | — | (79,745 | ) | — | — | (79,745 | ) | |||||||||||||||
Cash at beginning of period | — | 1,954 | 127,712 | 63,779 | — | — | 193,445 | 80 | — | 193,525 | ||||||||||||||||||||
Cash at end of period | $ | — | $ | — | $ | 67,576 | $ | 46,124 | $ | — | $ | — | $ | 113,700 | $ | 80 | $ | — | $ | 113,780 | ||||||||||
35
ITEM 2. MANAGEMENT'S DISCUSSION AND ANALYSIS OF FINANCIAL CONDITION AND RESULTS OF OPERATIONS
Forward Looking Statements
The following discussion of financial condition, results of operations, liquidity and capital resources, and certain factors that may affect future results, including economic and industry-wide factors, should be read in conjunction with our Condensed Consolidated Financial Statements and accompanying notes included herein. This Management’s Discussion and Analysis of Financial Condition and Results of Operations contains forward-looking statements. The matters discussed in these forward-looking statements are subject to risk, uncertainties, and other factors that could cause actual results to differ materially from those made, projected or implied in the forward-looking statements. Except as required by applicable law and regulations, we undertake no obligation to update any forward-looking statements or other statements we may make in the following discussion or elsewhere in this document even though these statements may be affected by events or circumstances occurring after the forward-looking statements or other statements were made. Please see the sections titled "Cautionary Statement Regarding Forward-Looking Statements” and “Risk Factors” in our 2017 Annual Report on Form 10-K for a discussion of the uncertainties, risks and assumptions associated with these statements.
Overview
We are a growth-oriented, technology-enabled, highly-diversified consumer finance company serving a wide range of underbanked consumers in the United States ("U.S."), Canada and the United Kingdom ("U.K.") and are a market leader in our industry based on revenues.
History
The CURO business was founded in 1997 to meet the growing needs of consumers looking for access to credit. The Company set out to offer a variety of convenient, easily-accessible financial and loan services and over its 20 years of operations, expanded across the U.S., Canada and the U.K.
CURO Financial Technologies Corp. ("CFTC") (then known as Speedy Cash Holdings Corp.), was incorporated in Delaware on July 16, 2008. On September 10, 2008, our founders sold or otherwise contributed all of the outstanding equity of the various operating entities that comprised the CURO business to a wholly-owned subsidiary of CFTC in connection with an investment in CFTC by Friedman Fleischer & Lowe Capital Partners II, L.P. and its affiliated funds. CURO Group Holdings Corp. (then known as Speedy Group Holdings Corp.) was incorporated in Delaware on February 7, 2013 as the parent company of CFTC. On May 11, 2016, we changed the name of Speedy Group Holdings Corp. to CURO Group Holdings Corp. We similarly changed the names of some of its subsidiaries.
Our growth has been fueled by acquisitions in the U.S., Canada and the U.K., as well as organically, including the launch of new brands. Recent brand launches include the March 2016 launch of LendDirect, an online installment loan brand in Alberta, Canada, that is now offered in four provinces, and the June 2017 launch of Avio Credit, an online Installment and Open-End Loan brand in the U.S. market that is currently available in eleven states.
Recent Developments
In April 2018, we announced that we expect to begin offering U.S. consumers a new line of credit product through a relationship with MetaBank® ("Meta"), a wholly-owned subsidiary of Meta Financial Group, Inc. CURO and Meta are currently developing the pilot launch. Under the program partnership agreement, Meta may hold up to $350.0 million of product receivables on its balance sheet for the first three years of the relationship, although there can be no assurance as to the level of success in selling this credit product.
On May 21, 2018, certain of our stockholders sold shares of our common stock pursuant to an underwritten public offering, at a price to the public of $23.00 per share. The underwriters subsequently exercised their option to purchase additional shares of our common stock from certain of these selling stockholders, which together
36
with the May offering, totaled more than 5.5 million shares. We did not sell any shares in the offering and did not receive any proceeds from the sale of the shares offered by the selling stockholders in the offering.
Revenue by Product and Segment and Related Loan Portfolio Performance
Revenue by Product
The following table summarizes revenue by product, including CSO fees, for the periods indicated:
Three Months Ended | ||||||||||||||||||||||||||
June 30, 2018 | June 30, 2017 | |||||||||||||||||||||||||
(in thousands) | U.S. | Canada | U.K. | Total | U.S. | Canada | U.K. | Total | ||||||||||||||||||
Unsecured Installment | $ | 111,244 | $ | 3,692 | $ | 8,537 | $ | 123,473 | $ | 94,897 | $ | 4,223 | $ | 6,029 | $ | 105,149 | ||||||||||
Secured Installment | 25,777 | — | — | 25,777 | 23,173 | — | — | 23,173 | ||||||||||||||||||
Open-End | 23,261 | 3,961 | — | 27,222 | 15,805 | — | — | 15,805 | ||||||||||||||||||
Single-Pay | 24,978 | 33,347 | 3,277 | 61,602 | 24,881 | 34,947 | 3,413 | 63,241 | ||||||||||||||||||
Ancillary | 4,866 | 6,043 | — | 10,909 | 5,008 | 4,425 | 143 | 9,576 | ||||||||||||||||||
Total revenue | $ | 190,126 | $ | 47,043 | $ | 11,814 | $ | 248,983 | $ | 163,764 | $ | 43,595 | $ | 9,585 | $ | 216,944 | ||||||||||
During the three months ended June 30, 2018, total lending revenue (excluding revenues from ancillary products) grew $30.7 million, or 14.8%, to $238.1 million, compared to the prior year period, predominantly driven by growth in Installment and Open-End loans. Geographically, revenue in the U.S., Canada and the U.K. grew 16.1%, 7.9% and 23.3%, respectively. From a product perspective, Unsecured Installment revenues rose 17.4% and Secured Installment revenues rose 11.2% driven by related loan growth. Single-Pay revenues were affected primarily by regulatory changes in Canada (rate changes in Alberta, Ontario and British Columbia) and continued product shift from Single-Pay to Installment and Open-End loans in all countries. Open-End revenues rose 72.2% on organic growth in the U.S. and the introduction of Open-End products in Virginia and Canada. Open-End adoption in Canada accelerated this quarter as related loan balances grew $34.3 million sequentially from the first quarter. Even with the accelerated Open-End growth, Single-Pay balances in Canada only shrank sequentially by $1.4 million. Ancillary revenues increased 13.9% versus the same quarter a year ago primarily due to non-lending revenue in Canada.
The following table summarizes revenue by product, including CSO fees, for the periods indicated:
Six Months Ended | ||||||||||||||||||||||||||
June 30, 2018 | June 30, 2017 | |||||||||||||||||||||||||
(in thousands) | U.S. | Canada | U.K. | Total | U.S. | Canada | U.K. | Total | ||||||||||||||||||
Unsecured Installment | $ | 231,720 | $ | 8,595 | $ | 16,104 | $ | 256,419 | $ | 195,651 | $ | 7,643 | $ | 11,286 | $ | 214,580 | ||||||||||
Secured Installment | 52,633 | — | — | 52,633 | 46,842 | — | — | 46,842 | ||||||||||||||||||
Open-End | 49,095 | 5,350 | — | 54,445 | 33,712 | — | — | 33,712 | ||||||||||||||||||
Single-Pay | 51,043 | 67,639 | 6,625 | 125,307 | 51,208 | 69,126 | 6,697 | 127,031 | ||||||||||||||||||
Ancillary | 10,228 | 11,709 | — | 21,937 | 10,673 | 8,392 | 294 | 19,359 | ||||||||||||||||||
Total revenue | $ | 394,719 | $ | 93,293 | $ | 22,729 | $ | 510,741 | $ | 338,086 | $ | 85,161 | $ | 18,277 | $ | 441,524 | ||||||||||
During the six months ended June 30, 2018, total lending revenue (excluding revenues from ancillary products) grew $66.6 million, or 15.8%, to $488.8 million, compared to the prior year period, predominantly driven by growth in Installment loans in all three countries and Open-End loans in the U.S. and Canada. Geographically, revenue in the U.S., Canada and U.K. grew 16.8%, 9.5% and 24.4%, respectively. From a product perspective, Unsecured Installment revenues rose 19.5% and Secured Installment revenues rose 12.4% because of loan growth. Single-Pay revenues and combined loans receivable were affected primarily by regulatory changes in Canada (rate changes in Alberta, Ontario and British Columbia) and continued product shift from Single-Pay to Installment and Open-End loans in all countries. Open-End revenues rose 61.5% on organic growth in the U.S. and the introduction of Open-End products in Virginia and Canada. Earning assets for our Open-End product in Canada, which we began offering in the fourth quarter of 2017, was $50.0 million as of June 30, 2018. Ancillary revenues increased 13.3% versus the same quarter a year ago primarily due to non-lending revenue in Canada.
37
The following charts present revenue composition, including CSO fees, of the products and services that we currently offer for the three months ended June 30, 2018 and 2017:
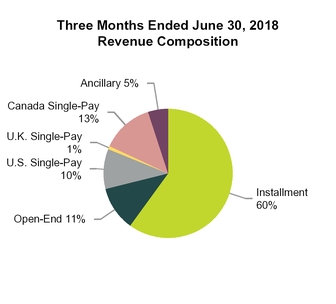
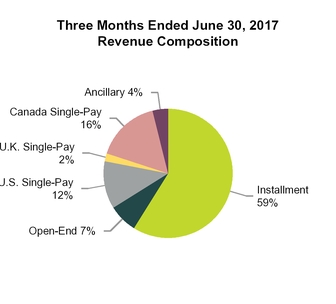
For the three months ended June 30, 2018 and 2017, revenue generated through our online channel was 43% and 36%, respectively, of consolidated revenue.
The following charts present revenue composition, including CSO fees, of the products and services that we currently offer for the six months ended June 30, 2018 and 2017:
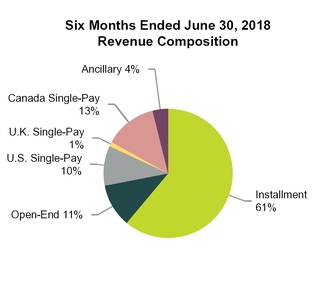
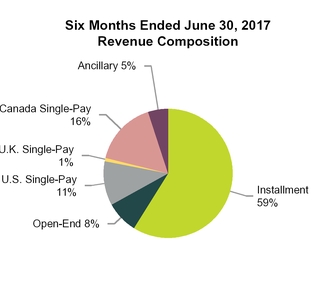
For the six months ended June 30, 2018 and 2017, revenue generated through our online channel was 43% and 36%, respectively, of consolidated revenue.
38
Loan Volume and Portfolio Performance Analysis
Unsecured Installment Loans
Unsecured Installment revenue and gross combined loans receivable increased from the prior year quarter due to growth in the United States, primarily in California, and growth in the United Kingdom. Gross combined Unsecured Installment Loan balances grew $31.4 million, or 14.6%, compared to June 30, 2017, but the comparisons are affected by mix shift in Canada from Installment to Open-End. As expected, Canadian Installment loan balances declined by $19.4 million while Open-End balances in Canada grew by $51.3 million year-over-year.
Because of the aforementioned effects of the Q1 Loss Recognition Change on the first half of 2017, we utilize sequential trends in analyzing net charge-off rates and allowance levels. Net charge-off rates for Company-owned Unsecured Installment loans improved 488 basis points sequentially compared to the first quarter of 2018. Similarly, net charge-off rates for Unsecured Installment loans Guaranteed by the Company improved nearly 2,000 basis points versus last quarter. First-pay default rates ("FPDs") reflect the number of payments made by customers compared to the number of payments scheduled to be paid during a period. First-pay default metrics cited in this Quarterly Report on Form 10-Q are calculated based on originations from January through May of 2017 and 2018. FPDs for Company Owned Unsecured Installment loans were stable overall to the same periods last year but improved for California which is the largest portion of the portfolio. FPDs for Unsecured Installment loans Guaranteed by the Company improved by an average of nearly 140 basis points, or 8%.The improvement in net charge-off rates, FPDs and the related underlying improvement in cumulative loss development trends in open vintages resulted in lower required allowance coverage for Unsecured installment, primarily due to: (i) loan growth proportionally being driven by the extension of more credit to our best customers, (ii) tightening of credit scoring and approval rates during first quarter’s U.S. income tax refund season and (iii) continuing improvement in scoring models.
39
2018 | 2017 | |||||||||||||||
(dollars in thousands, unaudited) | Second Quarter | First Quarter | Fourth Quarter | Third Quarter | Second Quarter | |||||||||||
Unsecured Installment loans: | ||||||||||||||||
Revenue - Company Owned | $ | 63,404 | $ | 66,004 | $ | 67,800 | $ | 61,653 | $ | 52,550 | ||||||
Provision for losses - Company Owned | 27,434 | 27,477 | 29,917 | 29,079 | 17,845 | |||||||||||
Net revenue - Company Owned | $ | 35,970 | $ | 38,527 | $ | 37,883 | $ | 32,574 | $ | 34,705 | ||||||
Net charge-offs - Company Owned | $ | 29,734 | $ | 33,410 | $ | 32,894 | $ | 23,858 | $ | 18,858 | ||||||
Revenue - Guaranteed by the Company | $ | 60,069 | $ | 66,942 | $ | 69,078 | $ | 67,132 | $ | 52,599 | ||||||
Provision for losses - Guaranteed by the Company | 26,974 | 23,556 | 32,915 | 36,212 | 23,575 | |||||||||||
Net revenue - Guaranteed by the Company | $ | 33,095 | $ | 43,386 | $ | 36,163 | $ | 30,920 | $ | 29,024 | ||||||
Net charge-offs - Guaranteed by the Company | $ | 25,667 | $ | 30,743 | $ | 31,898 | $ | 34,904 | $ | 27,309 | ||||||
Unsecured Installment gross combined loans receivable: | ||||||||||||||||
Company Owned | $ | 179,414 | $ | 171,432 | $ | 196,306 | $ | 181,831 | $ | 156,075 | ||||||
Guaranteed by the Company(1)(2) | 66,351 | 54,332 | 75,156 | 67,438 | 58,289 | |||||||||||
Unsecured Installment gross combined loans receivable(1)(2) | $ | 245,765 | $ | 225,764 | $ | 271,462 | $ | 249,269 | $ | 214,364 | ||||||
Unsecured Installment Allowance for loan losses(3) | $ | 35,277 | $ | 37,916 | $ | 43,755 | $ | 46,938 | $ | 41,406 | ||||||
Unsecured Installment CSO guarantee liability(3) | $ | 11,193 | $ | 9,886 | $ | 17,072 | $ | 16,056 | $ | 14,748 | ||||||
Unsecured Installment Allowance for loan losses as a percentage of Unsecured Installment gross loans receivable | 19.7 | % | 22.1 | % | 22.3 | % | 25.8 | % | 26.5 | % | ||||||
Unsecured Installment CSO guarantee liability as a percentage of Unsecured Installment gross loans guaranteed by the Company | 16.9 | % | 18.2 | % | 22.7 | % | 23.8 | % | 25.3 | % | ||||||
Unsecured Installment past-due balances: | ||||||||||||||||
Unsecured Installment gross loans receivable | $ | 40,272 | $ | 39,273 | $ | 44,963 | $ | 41,353 | $ | 33,534 | ||||||
Unsecured Installment gross loans guaranteed by the Company | $ | 10,319 | $ | 8,410 | $ | 12,480 | $ | 10,462 | $ | 8,204 | ||||||
Past-due Unsecured Installment gross loans receivable -- percentage(2) | 22.4 | % | 22.9 | % | 22.9 | % | 22.7 | % | 21.5 | % | ||||||
Past-due Unsecured Installment gross loans guaranteed by the Company -- percentage(2) | 15.6 | % | 15.5 | % | 16.6 | % | 15.5 | % | 14.1 | % | ||||||
Unsecured Installment other information: | ||||||||||||||||
Originations - Company Owned | $ | 128,146 | $ | 99,418 | $ | 135,284 | $ | 137,618 | $ | 119,636 | ||||||
Originations - Guaranteed by the Company(1) | $ | 84,082 | $ | 60,593 | $ | 82,326 | $ | 83,680 | $ | 68,338 | ||||||
Unsecured Installment ratios: | ||||||||||||||||
Provision as a percentage of originations - Company Owned | 21.4 | % | 27.6 | % | 22.1 | % | 21.1 | % | 14.9 | % | ||||||
Provision as a percentage of gross loans receivable - Company Owned | 15.3 | % | 16.0 | % | 15.2 | % | 16.0 | % | 11.4 | % | ||||||
Provision as a percentage of originations - Guaranteed by the Company | 32.1 | % | 38.9 | % | 40.0 | % | 43.3 | % | 34.5 | % | ||||||
Provision as a percentage of gross loans receivable - Guaranteed by the Company | 40.7 | % | 43.4 | % | 43.8 | % | 53.7 | % | 40.4 | % | ||||||
(1) Includes loans originated by third-party lenders through CSO programs, which are not included in our consolidated financial statements. | ||||||||||||||||
(2) Non-GAAP measure. | ||||||||||||||||
(3) Allowance for loan losses is reported as a contra-asset reducing gross loans receivable while the CSO guarantee liability is reported as a liability on our Condensed Consolidated Balance Sheets. | ||||||||||||||||
40
Secured Installment Loans
Secured Installment gross combined loans receivable balances as of June 30, 2018 increased by $7.4 million, or 9.2%, compared to June 30, 2017, primarily due to growth in Arizona, while related revenue grew 11.2%.
Secured Installment Allowance for loan losses and CSO guarantee liability as a percentage of Secured Installment gross loans receivable improved from the first quarter of 2018 from 14.7% to 12.4%. For the three months ended June 30, 2018, delinquency rates of 17.4% and net charge offs of $9.0 million were consistent with the first quarter delinquency rates of 17.9% and net charge offs of $8.7 million. Net charge off rates for Secured Installment rose 282 basis points sequentially versus the first quarter of 2018. FPDs have improved an average of nearly 200 basis points, or 11.9%, versus the same periods last year. The lower required Allowance for loan losses and CSO guarantee liability as a percentage of gross combined loans receivable is largely due to origination mix and modest improvement in vintage cumulative loss development.
2018 | 2017 | |||||||||||||||
(dollars in thousands, unaudited) | Second Quarter | First Quarter | Fourth Quarter | Third Quarter | Second Quarter | |||||||||||
Secured Installment loans: | ||||||||||||||||
Revenue | $ | 25,777 | $ | 26,856 | $ | 27,732 | $ | 26,407 | $ | 23,173 | ||||||
Provision for losses | 7,650 | 6,640 | 10,051 | 6,512 | 4,955 | |||||||||||
Net revenue | $ | 18,127 | $ | 20,216 | $ | 17,681 | $ | 19,895 | $ | 18,218 | ||||||
Net charge-offs | $ | 9,003 | $ | 8,669 | $ | 10,802 | $ | 11,597 | $ | 6,481 | ||||||
Secured Installment gross combined loan balances: | ||||||||||||||||
Secured Installment gross combined loans receivable(1)(2) | $ | 87,434 | $ | 82,534 | $ | 92,817 | $ | 88,730 | $ | 80,077 | ||||||
Secured Installment Allowance for loan losses and CSO guarantee liability(3) | $ | 10,812 | $ | 12,165 | $ | 14,194 | $ | 14,945 | $ | 20,030 | ||||||
Secured Installment Allowance for loan losses and CSO guarantee liability as a percentage of Secured Installment gross combined loans receivable | 12.4 | % | 14.7 | % | 15.3 | % | 16.8 | % | 25.0 | % | ||||||
Secured Installment past-due balances: | ||||||||||||||||
Secured Installment past-due gross loans receivable and gross loans guaranteed by the Company | $ | 15,246 | $ | 14,756 | $ | 16,554 | $ | 15,265 | $ | 12,630 | ||||||
Past-due Secured Installment gross loans receivable and gross loans guaranteed by the Company -- percentage(2) | 17.4 | % | 17.9 | % | 17.8 | % | 17.2 | % | 15.8 | % | ||||||
Secured Installment other information: | ||||||||||||||||
Originations(1) | $ | 53,597 | $ | 34,750 | $ | 48,577 | $ | 52,526 | $ | 45,596 | ||||||
Secured Installment ratios: | ||||||||||||||||
Provision as a percentage of originations | 14.3 | % | 19.1 | % | 20.7 | % | 12.4 | % | 10.9 | % | ||||||
Provision as a percentage of gross combined loans receivable | 8.7 | % | 8.0 | % | 10.8 | % | 7.3 | % | 6.2 | % | ||||||
(1) Includes loans originated by third-party lenders through CSO programs, which are not included in our consolidated financial statements. | ||||||||||||||||
(2) Non-GAAP measure. | ||||||||||||||||
(3) Allowance for loan losses is reported as a contra-asset reducing gross loans receivable while the CSO guarantee liability is reported as a liability on our Condensed Consolidated Balance Sheets. | ||||||||||||||||
41
Open-End Loans
Open-End loan balances as of June 30, 2018 increased by $64.3 million, or 240.0% compared to June 30, 2017 from year-over-year growth in Kansas and Tennessee of 26.9% and 20.6%, respectively, the third quarter of 2017 launch of Open-End in Virginia, conversion of most of Alberta's Unsecured Installment loans to Open-End loans and the launch of Open-End loans in Ontario. Open-End adoption in Canada accelerated this quarter as related loan balances grew $34.3 million sequentially from the first quarter.
The Open-End Allowance for loan losses as a percentage of Open-End gross loans receivable declined year-over-year and sequentially, primarily due to geographic mix and seasoning of the U.S. portfolio. At June 30, 2018, Canadian Open-End gross loans receivable comprised 56.4% of the total, compared to none at the end of the prior year quarter. FPDs for the U.S. Open-End portfolio have improved an average of approximately 50 basis points, or 2%, versus the same periods a year ago primarily because of seasoning and scoring improvements in mature states, and are improving sequentially as the Virginia new market portfolio seasons.
2018 | 2017 | |||||||||||||||
(dollars in thousands, unaudited) | Second Quarter | First Quarter | Fourth Quarter | Third Quarter | Second Quarter | |||||||||||
Open-End loans: | ||||||||||||||||
Revenue | $ | 27,222 | $ | 27,223 | $ | 21,154 | $ | 18,630 | $ | 15,805 | ||||||
Provision for losses | 14,848 | 11,428 | 8,334 | 6,348 | 4,298 | |||||||||||
Net revenue | $ | 12,374 | $ | 15,795 | $ | 12,820 | $ | 12,282 | $ | 11,507 | ||||||
Net charge-offs | $ | 11,924 | $ | 10,972 | $ | 6,799 | $ | 5,991 | $ | 4,343 | ||||||
Open-End gross loan balances: | ||||||||||||||||
Open-End gross loans receivable | $ | 91,033 | $ | 51,564 | $ | 47,949 | $ | 32,133 | $ | 26,771 | ||||||
Allowance for loan losses | $ | 9,717 | $ | 6,846 | $ | 6,426 | $ | 4,880 | $ | 4,523 | ||||||
Open-End Allowance for loan losses as a percentage of Open-End gross loans receivable | 10.7 | % | 13.3 | % | 13.4 | % | 15.2 | % | 16.9 | % | ||||||
Open-End ratios: | ||||||||||||||||
Provision as a percentage of gross loans receivable | 16.3 | % | 22.2 | % | 17.4 | % | 19.8 | % | 16.1 | % | ||||||
42
Single-Pay
Single-Pay revenue and loans receivable during the three months ended June 30, 2018 declined slightly year-over-year, primarily due to regulatory changes in Canada (rate changes in Alberta, Ontario and British Columbia) and continued product shift from Single-Pay to Installment and Open-End loans in all countries compared to the three months ended June 30, 2017. Even with the aforementioned accelerated Open-End growth in Canada, Single-Pay balances in Canada only shrank sequentially by $1.4 million. Provision for losses and Net charge-offs were consistent for the quarter and Single Pay Allowance for loan losses as a percentage of gross loans receivable remained consistent sequentially.
2018 | 2017 | |||||||||||||||
(dollars in thousands, unaudited) | Second Quarter | First Quarter | Fourth Quarter | Third Quarter | Second Quarter | |||||||||||
Single-pay loans: | ||||||||||||||||
Revenue | $ | 61,602 | $ | 63,705 | $ | 70,868 | $ | 70,895 | $ | 63,241 | ||||||
Provision for losses | 14,527 | 11,302 | 17,952 | 20,632 | 14,289 | |||||||||||
Net revenue | $ | 47,075 | $ | 52,403 | $ | 52,916 | $ | 50,263 | $ | 48,952 | ||||||
Net charge-offs | $ | 14,543 | $ | 12,698 | $ | 17,362 | $ | 20,515 | $ | 13,849 | ||||||
Single-Pay gross loan balances: | ||||||||||||||||
Single-Pay gross loans receivable | $ | 89,575 | $ | 87,075 | $ | 99,400 | $ | 94,476 | $ | 91,230 | ||||||
Single-Pay Allowance for loan losses | $ | 4,372 | $ | 4,485 | $ | 5,915 | $ | 5,342 | $ | 5,313 | ||||||
Single-Pay Allowance for loan losses as a percentage of Single-Pay gross loans receivable | 4.9 | % | 5.2 | % | 6.0 | % | 5.7 | % | 5.8 | % | ||||||
Gross Combined Loans Receivable
The following table summarizes Company Owned gross loans receivable, a GAAP balance sheet measure, and reconciles it to gross combined loans receivable, a non-GAAP measure including loans originated by third-party lenders through CSO programs, which are not included in our Condensed Consolidated Financial Statements but from which we earn revenue and for which we provide a guarantee to the lender. Management believes this analysis provides investors with important information needed to evaluate overall lending performance.
Three Months Ended | |||||||||||||||
(in millions) | June 30, 2018 | March 31, 2018 | December 31, 2017 | September 30, 2017 | June 30, 2017 | ||||||||||
Company Owned gross loans receivable | $ | 444.6 | $ | 389.8 | $ | 432.8 | $ | 393.4 | $ | 350.3 | |||||
Gross loans receivable Guaranteed by the Company | 69.2 | 57.1 | 78.8 | 71.2 | 62.1 | ||||||||||
Gross combined loans receivable | $ | 513.8 | $ | 446.9 | $ | 511.6 | $ | 464.6 | $ | 412.4 | |||||
43
Gross combined loans receivable by product are presented below:
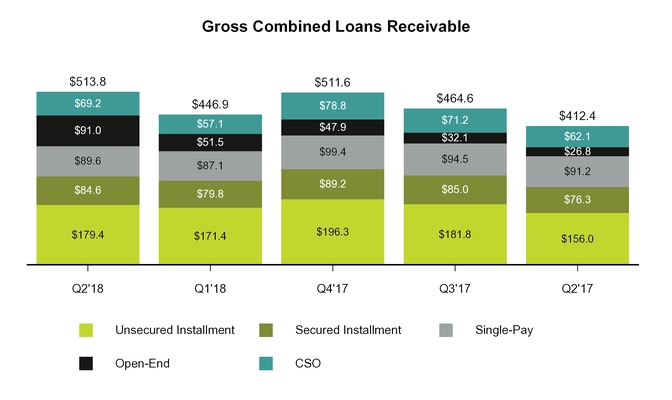
Gross combined loans receivable increased $101.4 million, or 24.6%, to $513.8 million as of June 30, 2018 compared to $412.4 million as of June 30, 2017. Geographically, gross combined loans receivable grew 23.6%, 33.8% and 36.0%, respectively in the U.S., Canada and U.K.
44
Results of Operations - CURO Group Consolidated Operations
Condensed Consolidated Statements of Income
(Unaudited)
(in thousands) | Three Months Ended June 30, | Six Months Ended June 30, | |||||||||||||||||||||
2018 | 2017 | Change $ | Change % | 2018 | 2017 | Change $ | Change % | ||||||||||||||||
Revenue | $ | 248,983 | $ | 216,944 | $ | 32,039 | 14.8 | % | $ | 510,741 | $ | 441,524 | $ | 69,217 | 15.7 | % | |||||||
Provision for losses | 91,986 | 65,446 | 26,540 | 40.6 | % | 173,017 | 127,182 | 45,835 | 36.0 | % | |||||||||||||
Net revenue | 156,997 | 151,498 | 5,499 | 3.6 | % | 337,724 | 314,342 | 23,382 | 7.4 | % | |||||||||||||
Advertising costs | 17,554 | 11,641 | 5,913 | 50.8 | % | 27,310 | 19,329 | 7,981 | 41.3 | % | |||||||||||||
Non-advertising costs of providing services | 59,031 | 57,855 | 1,176 | 2.0 | % | 120,757 | 118,106 | 2,651 | 2.2 | % | |||||||||||||
Total cost of providing services | 76,585 | 69,496 | 7,089 | 10.2 | % | 148,067 | 137,435 | 10,632 | 7.7 | % | |||||||||||||
Gross margin | 80,412 | 82,002 | (1,590 | ) | (1.9 | )% | 189,657 | 176,907 | 12,750 | 7.2 | % | ||||||||||||
Operating (income) expense | |||||||||||||||||||||||
Corporate, district and other | 38,655 | 36,557 | 2,098 | 5.7 | % | 79,109 | 69,550 | 9,559 | 13.7 | % | |||||||||||||
Interest expense | 20,465 | 18,484 | 1,981 | 10.7 | % | 42,814 | 41,850 | 964 | 2.3 | % | |||||||||||||
Loss on extinguishment of debt | — | — | — | # | 11,683 | 12,458 | (775 | ) | (6.2 | )% | |||||||||||||
Total operating expense | 59,120 | 55,041 | 4,079 | 7.4 | % | 133,606 | 123,858 | 9,748 | 7.9 | % | |||||||||||||
Net income before income taxes | 21,292 | 26,961 | (5,669 | ) | (21.0 | )% | 56,051 | 53,049 | 3,002 | 5.7 | % | ||||||||||||
Provision for income taxes | 5,317 | 10,619 | (5,302 | ) | (49.9 | )% | 16,784 | 20,069 | (3,285 | ) | (16.4 | )% | |||||||||||
Net income | $ | 15,975 | $ | 16,342 | $ | (367 | ) | (2.2 | )% | $ | 39,267 | $ | 32,980 | $ | 6,287 | 19.1 | % | ||||||
# - Variance greater than 100% or not meaningful. | |||||||||||||||||||||||
For the three months ended June 30, 2018 and 2017
Revenue and Net Revenue
Revenue increased $32.0 million, or 14.8%, to $249.0 million for the three months ended June 30, 2018 from $216.9 million for the three months ended June 30, 2017. U.S. revenue increased 16.1% on volume growth. Canadian revenue increased 7.9% as volume growth offset regulatory impacts on rates and product mix. U.K. revenue increased by 23.3%.
Provision for losses increased $26.5 million, or 40.6%, to $92.0 million for the three months ended June 30, 2018 from $65.4 million for the three months ended June 30, 2017. Refer to "--Segment Analysis" below for further explanations on the provision for losses.
Cost of Providing Services
The total cost of providing services increased $7.1 million, or 10.2%, to $76.6 million in the three months ended June 30, 2018, compared to $69.5 million in the three months ended June 30, 2017 primarily because of increased customer acquisition spend analyzed further in "--Segment Analysis" below.
Operating Expenses
Corporate, district and other expense increased $2.1 million, or 5.7% primarily related to increased headcount and $1.0 million of additional share-based compensation expense.
Provision for Income Taxes
The effective tax rate for the three months ended June 30, 2018 was 25.0% compared to 39.4% for the three months ended June 30, 2017. As a result of the Tax Cuts and Jobs Act of 2017 ("2017 Tax Act"), the corporate income tax rate for the U.S. decreased from 35% to 21%, effective in 2018. No tax benefit is recognized for losses in the U.K.
45
For the six months ended June 30, 2018 and 2017
Revenue and Net Revenue
Revenue increased $69.2 million, or 15.7%, to $510.7 million for the six months ended June 30, 2018 from $441.5 million for the six months ended June 30, 2017. U.S. revenue increased 16.8% on volume growth. Canadian revenue increased 9.5% as volume growth offset regulatory impacts on rates and product mix. U.K. revenue increased by 24.4%.
Provision for losses increased $45.8 million, or 36.0%, to $173.0 million for the six months ended June 30, 2018 from $127.2 million for the six months ended June 30, 2017. Refer to "--Segment Analysis" below for further explanations on the provision for losses.
Cost of Providing Services
The total cost of providing services increased $10.6 million, or 7.7%, to $148.1 million in the six months ended June 30, 2018, compared to $137.4 million in the six months ended June 30, 2017, primarily because of higher customer acquisition spend.
Operating Expenses
Corporate, district and other expense increased $9.6 million, or 13.7%, primarily due to $5.1 million in additional compensation expense related to increased collections activity, online customer support and technology headcount and $2.7 million of additional share-based compensation expense.
Provision for Income Taxes
The effective tax rate for the six months ended June 30, 2018 was 29.9% compared to 37.8% for the six months ended June 30, 2017. As a result of the 2017 Tax Act, the federal corporate income tax rate for the U.S. decreased from 35% to 21%, effective in 2018. The provision for income tax as of June 30, 2018 includes an additional accrual of $1.2 million for adjustments to estimates of the tax on prior years' foreign repatriation and an estimated Global Intangible Low-Taxed Income ("GILTI") tax of $0.6 million. The $1.2 million additional provision on prior years' foreign repatriation was the result of additional interpretative guidance from the IRS issued during the first quarter of 2018 while the GILTI provision is a new, continuous requirement under the 2017 Tax Act.
46
Segment Analysis
We report financial results for three reportable segments: the U.S., Canada and the U.K. Following is a recap of results of operations for the segment and period indicated:
U.S. Segment Results | Three Months Ended June 30, | ||||||||||
(dollars in thousands) | 2018 | 2017 | Change $ | Change % | |||||||
Revenue | $ | 190,126 | $ | 163,764 | $ | 26,362 | 16.1 | % | |||
Provision for losses | 71,987 | 51,958 | 20,029 | 38.5 | % | ||||||
Net revenue | 118,139 | 111,806 | 6,333 | 5.7 | % | ||||||
Advertising costs | 12,409 | 7,897 | 4,512 | 57.1 | % | ||||||
Non-advertising costs of providing services | 41,682 | 40,790 | 892 | 2.2 | % | ||||||
Total cost of providing services | 54,091 | 48,687 | 5,404 | 11.1 | % | ||||||
Gross margin | 64,048 | 63,119 | 929 | 1.5 | % | ||||||
Corporate, district and other | 28,221 | 27,993 | 228 | 0.8 | % | ||||||
Interest expense | 20,465 | 18,423 | 2,042 | 11.1 | % | ||||||
Total operating expense | 48,686 | 46,416 | 2,270 | 4.9 | % | ||||||
Segment operating income | 15,362 | 16,703 | (1,341 | ) | (8.0 | )% | |||||
Interest expense | 20,465 | 18,423 | 2,042 | 11.1 | % | ||||||
Depreciation and amortization | 3,379 | 3,393 | (14 | ) | (0.4 | )% | |||||
EBITDA | 39,206 | 38,519 | 687 | 1.8 | % | ||||||
Legal settlement cost | — | 1,950 | (1,950 | ) | |||||||
Other adjustments | (66 | ) | (20 | ) | (46 | ) | |||||
Transaction related costs | — | 146 | (146 | ) | |||||||
Share-based cash and non-cash compensation | 2,181 | 1,176 | 1,005 | ||||||||
Adjusted EBITDA | $ | 41,321 | $ | 41,771 | $ | (450 | ) | (1.1 | )% | ||
U.S. Segment Results - For the three months ended June 30, 2018 and 2017
Second quarter U.S. revenues increased by $26.4 million or 16.1% to $190.1 million.
U.S revenue growth was driven by a $64.2 million, or 21.1%, increase in gross combined loans receivable to $367.7 million at June 30, 2018 compared to $303.6 million at June 30, 2017. We experienced volume growth primarily from Unsecured Installment receivables, which increased year-over-year $44.0 million, or 27.6%. Secured Installment receivables increased from the prior year period by $7.4 million or 9.2%, and Open-End receivables increased $12.9 million, or 48.3% compared to the prior year period. Open-End growth was driven by year-over-year expansion in Kansas and Tennessee of 26.9% and 20.6%, respectively, and the 2017 third quarter launch of Open-End in Virginia.
The increase of $20.0 million, or 38.5%, in provision for losses was primarily driven by the increase in combined loans receivable and the aforementioned 2017 Q1 Loss Recognition Change.
U.S. cost of providing services for the three months ended June 30, 2018 were $54.1 million, an increase of $5.4 million, or 11.1% compared to $48.7 million for the three months ended June 30, 2017, primarily due to $4.5 million, or 57.1%, higher advertising costs. Advertising for the U.S. online channel comprised $3.4 million of the year-over-year increase, $2.6 million of which related to our new Avio installment loans. U.S. store advertising rose 22.2% year-over-year. Advertising as a percentage of revenue was 6.5% and in the range we expected given the ramping of Avio and mix shift to online.
Corporate, district and other operating expenses remained consistent with the same period in the prior year. Interest expense increased $2.0 million, resulting from interest on the additional 12.00% Senior Secured Notes issued in November 2017.
47
U.S. Segment Results | Six Months Ended June 30, | ||||||||||
(dollars in thousands) | 2018 | 2017 | Change $ | Change % | |||||||
Revenue | $ | 394,719 | $ | 338,086 | $ | 56,633 | 16.8 | % | |||
Provision for losses | 136,320 | 101,152 | 35,168 | 34.8 | % | ||||||
Net revenue | 258,399 | 236,934 | 21,465 | 9.1 | % | ||||||
Advertising costs | 17,568 | 12,591 | 4,977 | 39.5 | % | ||||||
Non-advertising costs of providing services | 85,439 | 84,091 | 1,348 | 1.6 | % | ||||||
Total cost of providing services | 103,007 | 96,682 | 6,325 | 6.5 | % | ||||||
Gross margin | 155,392 | 140,252 | 15,140 | 10.8 | % | ||||||
Corporate, district and other | 58,753 | 53,042 | 5,711 | 10.8 | % | ||||||
Interest expense | 42,762 | 41,768 | 994 | 2.4 | % | ||||||
Gain on extinguishment of debt | 11,683 | 12,458 | (775 | ) | (6.2 | )% | |||||
Total operating expense | 113,198 | 107,268 | 5,930 | 5.5 | % | ||||||
Segment operating income | 42,194 | 32,984 | 9,210 | 27.9 | % | ||||||
Interest expense | 42,762 | 41,768 | 994 | 2.4 | % | ||||||
Depreciation and amortization | 6,786 | 6,753 | 33 | 0.5 | % | ||||||
EBITDA | 91,742 | 81,505 | 10,237 | 12.6 | % | ||||||
Gain on extinguishment of debt | 11,683 | 12,458 | (775 | ) | |||||||
Legal settlement cost | — | 1,950 | (1,950 | ) | |||||||
Other adjustments | (125 | ) | (14 | ) | (111 | ) | |||||
Transaction related costs | — | 2,400 | (2,400 | ) | |||||||
Share-based cash and non-cash compensation | 4,023 | 1,302 | 2,721 | ||||||||
Adjusted EBITDA | $ | 107,323 | $ | 99,601 | $ | 7,722 | 7.8 | % | |||
U.S. Segment Results - For the six months ended June 30, 2018 and 2017
U.S. revenues increased by $56.6 million, or 16.8%, to $394.7 million for the six months ended June 30, 2018.
U.S revenue growth was driven by a $64.2 million, or 21.1%, increase in gross combined loans receivable to $367.7 million at June 30, 2018 compared to $303.6 million in the prior year period. We experienced volume growth primarily from Unsecured Installment receivables, which increased year-over-year $44.0 million, or 27.6%. Secured Installment receivables increased from the prior year period by $7.4 million, or 9.2%, and Open-End receivables increased $12.9 million, or 48.3%, compared to the prior year period. Open-End growth was driven by year-over-year expansion in Kansas and Tennessee of 26.9% and 20.6%, respectively, and the 2017 third quarter launch of Open-End in Virginia.
The increase of $35.2 million, or 34.8%, in provision for losses was primarily driven by the increase in combined loans receivable as previously discussed.
U.S. cost of providing services were $103.0 million, an increase of $6.3 million, or 6.5%, compared to $96.7 million for the six months ended June 30, 2017. The increase is primarily due to $5.0 million, or 39.5%, higher advertising costs.
The $5.7 million increase of corporate, district and other operating expenses includes $4.0 million of additional compensation expense, primarily due to increased collections, online customer support and technology headcount and $2.7 million of additional share-based compensation expense.
48
Canada Segment Results | Three Months Ended June 30, | ||||||||||
(dollars in thousands) | 2018 | 2017 | Change $ | Change % | |||||||
Revenue | $ | 47,043 | $ | 43,595 | $ | 3,448 | 7.9 | % | |||
Provision for losses | 14,360 | 10,300 | 4,060 | 39.4 | % | ||||||
Net revenue | 32,683 | 33,295 | (612 | ) | (1.8 | )% | |||||
Advertising costs | 2,704 | 2,264 | 440 | 19.4 | % | ||||||
Non-advertising costs of providing services | 16,679 | 15,069 | 1,610 | 10.7 | % | ||||||
Total cost of providing services | 19,383 | 17,333 | 2,050 | 11.8 | % | ||||||
Gross margin | 13,300 | 15,962 | (2,662 | ) | (16.7 | )% | |||||
Corporate, district and other | 4,759 | 4,372 | 387 | 8.9 | % | ||||||
Interest expense | 7 | 53 | (46 | ) | (86.8 | )% | |||||
Total operating expense | 4,766 | 4,425 | 341 | 7.7 | % | ||||||
Segment operating income | 8,534 | 11,537 | (3,003 | ) | (26.0 | )% | |||||
Interest expense | 7 | 53 | (46 | ) | (86.8 | )% | |||||
Depreciation and amortization | 1,091 | 1,100 | (9 | ) | (0.8 | )% | |||||
EBITDA | 9,632 | 12,690 | (3,058 | ) | (24.1 | )% | |||||
Other adjustments | 157 | (158 | ) | 315 | |||||||
Adjusted EBITDA | $ | 9,789 | $ | 12,532 | $ | (2,743 | ) | (21.9 | )% | ||
Canada Segment Results - For the three months ended June 30, 2018 and 2017
Canada revenue improved $3.4 million, or 7.9%, to $47.0 million for the three months ended June 30, 2018 from $43.6 million in the prior year period. On a constant currency basis, revenue was up $1.6 million, or 3.6%. Revenue growth in Canada was impacted by the product transition from Single-Pay loans to Unsecured Installment and Open-End loans and the impact of regulatory rate changes in Alberta, Ontario and British Columbia.
Single-Pay revenue decreased $1.6 million, or 4.6%, to $33.3 million for the three months ended June 30, 2018 and Single-Pay ending receivables decreased $1.1 million, or 2.2%, to $47.3 million from $48.4 million in the prior year period due to mix shift in Ontario where we launched Open-End loans in the fourth quarter of 2017.
Canadian non-Single-Pay revenue increased $5.0 million, or 58.4%, to $13.7 million compared to $8.6 million the same quarter a year ago on $31.9 million, or 74.5%, growth in related loan balances. The increase was primarily related to the launch of Open-End products in Alberta and Ontario in the fourth quarter of 2017.
The provision for losses increased $4.1 million, or 39.4%, to $14.4 million for the three months ended June 30, 2018 compared to $10.3 million in the prior year period, because of upfront provisioning on relative loan volumes (total Open-End and Installment loans grew sequentially by $20.9 million this second quarter compared to $10.9 million in the second quarter of 2017), and mix shift from Single-Pay loans to Unsecured Installment and Open-End loans. On a constant currency basis, provision for losses increased $3.5 million, or 33.7%.
The cost of providing services in Canada increased $2.1 million, or 11.8%, to $19.4 million for the three months ended June 30, 2018, compared to $17.3 million in the prior year period. Advertising rose 19.4% due to increased spend for online and stores to support the ramp up of our LendDirect brand. The increase in non-advertising cost of providing services was due primarily to an increase in salary expense and occupancy expense from higher store counts. We have opened seven LendDirect stores since the second quarter of 2017. On a constant currency basis, cost of providing services increased $1.3 million, or 7.3%.
Canada operating expenses remained relatively flat to the same period in the prior year. Total operating expense increased to $4.8 million in the three months ended June 30, 2018, from $4.4 million in the prior year period.
49
Canada Segment Results | Six Months Ended June 30, | ||||||||||
(dollars in thousands) | 2018 | 2017 | Change $ | Change % | |||||||
Revenue | $ | 93,293 | $ | 85,161 | $ | 8,132 | 9.5 | % | |||
Provision for losses | 26,910 | 20,528 | 6,382 | 31.1 | % | ||||||
Net revenue | 66,383 | 64,633 | 1,750 | 2.7 | % | ||||||
Advertising costs | 5,430 | 4,045 | 1,385 | 34.2 | % | ||||||
Non-advertising costs of providing services | 33,151 | 30,326 | 2,825 | 9.3 | % | ||||||
Total cost of providing services | 38,581 | 34,371 | 4,210 | 12.2 | % | ||||||
Gross margin | 27,802 | 30,262 | (2,460 | ) | (8.1 | )% | |||||
Corporate, district and other | 9,656 | 7,747 | 1,909 | 24.6 | % | ||||||
Interest expense | 64 | 82 | (18 | ) | (22.0 | )% | |||||
Total operating expense | 9,720 | 7,829 | 1,891 | 24.2 | % | ||||||
Segment operating income | 18,082 | 22,433 | (4,351 | ) | (19.4 | )% | |||||
Interest expense | 64 | 82 | (18 | ) | (22.0 | )% | |||||
Depreciation and amortization | 2,219 | 2,219 | — | — | % | ||||||
EBITDA | 20,365 | 24,734 | (4,369 | ) | (17.7 | )% | |||||
Other adjustments | 173 | (472 | ) | 645 | |||||||
Adjusted EBITDA | $ | 20,538 | $ | 24,262 | $ | (3,724 | ) | (15.3 | )% | ||
Canada Segment Results - For the six months ended June 30, 2018 and 2017
Canada revenue improved $8.1 million, or 9.5%, to $93.3 million for the six months ended June 30, 2018 from $85.2 million in the prior year period. On a constant currency basis, revenue was up $4.2 million, or 4.9%. Revenue growth in Canada was impacted by the product transition from Single-Pay loans to Unsecured Installment and Open-End loans and the impact of regulatory rate changes in Alberta, Ontario and British Columbia.
Single-Pay revenue decreased $1.5 million, or 2.2%, to $67.6 million for the six months ended June 30, 2018 on related Single-Pay ending receivables decrease of $1.1 million, or 2.2%, to $47.3 million from $48.4 million in the prior year period due to mix shift in Ontario where we launched Open-End loans in the fourth quarter of 2017.
Canadian non-Single-Pay revenue increased $9.6 million, or 60.0%, to $25.7 million compared to $16.0 million the same period a year ago on $31.9 million, or 74.5%, growth in related loan balances. The increase was primarily related to the launch of Open-End products in Alberta and Ontario in the fourth quarter of 2017.
The provision for losses increased $6.4 million, or 31.1%, to $26.9 million for the six months ended June 30, 2018 compared to $20.5 million in the prior year period, because of relative loan volumes and mix shift from Single-Pay loans to Unsecured Installment and Open-End loans. On a constant currency basis, provision for losses increased $5.3 million, or 25.6%.
The cost of providing services in Canada increased $4.2 million, or 12.2%, to $38.6 million for the six months ended June 30, 2018, compared to $34.4 million in the prior year period. The increase was due primarily to $1.4 million, or 34.2%, higher advertising costs compared to the prior year period and an increase in occupancy expense from higher store counts. We have opened seven LendDirect stores since the second quarter of 2017. On a constant currency basis, cost of providing services increased $2.6 million, or 7.5%.
Operating expenses increased $1.9 million, or 24.2%, to $9.7 million in the six months ended June 30, 2018, from $7.8 million in the prior year period, due to increased collections and customer support payroll expenses from seasonality, increased volumes, expansion of the LendDirect business and product shifts from Single-Pay loans to Unsecured Installment and Open-End loans. On a constant currency basis, operating expenses increased $1.5 million, or 19.0%.
50
U.K. Segment Results | Three Months Ended June 30, | ||||||||||
(dollars in thousands) | 2018 | 2017 | Change $ | Change % | |||||||
Revenue | $ | 11,814 | $ | 9,585 | $ | 2,229 | 23.3 | % | |||
Provision for losses | 5,639 | 3,188 | 2,451 | 76.9 | % | ||||||
Net revenue | 6,175 | 6,397 | (222 | ) | (3.5 | )% | |||||
Advertising costs | 2,441 | 1,479 | 962 | 65.0 | % | ||||||
Non-advertising costs of providing services | 670 | 1,997 | (1,327 | ) | (66.4 | )% | |||||
Total cost of providing services | 3,111 | 3,476 | (365 | ) | (10.5 | )% | |||||
Gross margin | 3,064 | 2,921 | 143 | 4.9 | % | ||||||
Corporate, district and other | 5,675 | 4,192 | 1,483 | 35.4 | % | ||||||
Interest income | (7 | ) | 9 | 16 | # | ||||||
Total operating expense | 5,668 | 4,201 | 1,467 | 34.9 | % | ||||||
Segment operating loss | (2,604 | ) | (1,280 | ) | (1,324 | ) | (103.4 | )% | |||
Interest income | (7 | ) | 9 | 16 | # | ||||||
Depreciation and amortization | 128 | 182 | (54 | ) | (29.7 | )% | |||||
EBITDA | (2,483 | ) | (1,089 | ) | (1,394 | ) | (128.0 | )% | |||
Other adjustments | (6 | ) | (12 | ) | 6 | ||||||
Adjusted EBITDA | $ | (2,489 | ) | $ | (1,101 | ) | $ | (1,388 | ) | (126.1 | )% |
# - Variance greater than 100% or not meaningful | |||||||||||
U.K. Segment Results - For the three months ended June 30, 2018 and 2017
U.K. revenue improved $2.2 million, or 23.3%, to $11.8 million for the three months ended June 30, 2018 from $9.6 million in the prior year period. On a constant currency basis, revenue was up $1.5 million, or 16.0%. Provision for losses increased $2.5 million, and on a constant currency basis, increased $2.1 million, or 66.0%, due to upfront provisioning on volume growth and the high percentage of new customers in the origination mix. Installment loans in the U.K. grew sequentially by $3.7 million in the second quarter compared to $1.9 million in the second quarter of 2017.
The cost of providing services in the U.K. decreased $0.4 million, or 10.5%, for the three months ended June 30, 2018 compared to prior year period due to reduction in costs related to the completion of store closures in the third quarter of 2017, partially offset by higher customer acquisition spend. On a constant currency basis, the cost of providing services decreased $0.6 million, or 16.4%.
Corporate, district and other expenses increased $1.5 million, or 35.4%, to $5.7 million for the three months ended June 30, 2018 compared to the prior year period. This increase includes costs related to customer redress pursuant to a complaint resolution process for all lenders in the U.K. The cost in the second quarter of 2018 to administer the complaint resolution process and the direct customer redress paid or accrued totaled $1.4 million, an increase of $0.9 million compared to the prior year period. On a constant currency basis, corporate, district and other expenses increased $1.2 million, or 27.6%.
51
U.K. Segment Results | Six Months Ended June 30, | ||||||||||
(dollars in thousands) | 2018 | 2017 | Change $ | Change % | |||||||
Revenue | $ | 22,729 | $ | 18,277 | $ | 4,452 | 24.4 | % | |||
Provision for losses | 9,787 | 5,502 | 4,285 | 77.9 | % | ||||||
Net revenue | 12,942 | 12,775 | 167 | 1.3 | % | ||||||
Advertising costs | 4,312 | 2,692 | 1,620 | 60.2 | % | ||||||
Non-advertising costs of providing services | 2,167 | 3,689 | (1,522 | ) | (41.3 | )% | |||||
Total cost of providing services | 6,479 | 6,381 | 98 | 1.5 | % | ||||||
Gross margin | 6,463 | 6,394 | 69 | 1.1 | % | ||||||
Corporate, district and other | 10,700 | 8,761 | 1,939 | 22.1 | % | ||||||
Interest income | (12 | ) | 1 | 13 | # | ||||||
Total operating expense | 10,688 | 8,762 | 1,926 | 22.0 | % | ||||||
Segment operating loss | (4,225 | ) | (2,368 | ) | (1,857 | ) | 78.4 | % | |||
Interest income | (12 | ) | 1 | 13 | # | ||||||
Depreciation and amortization | 254 | 357 | (103 | ) | (28.9 | )% | |||||
EBITDA | (3,983 | ) | (2,010 | ) | (1,973 | ) | 98.2 | % | |||
Other adjustments | (42 | ) | (18 | ) | (24 | ) | |||||
Adjusted EBITDA | $ | (4,025 | ) | $ | (2,028 | ) | $ | (1,997 | ) | 98.5 | % |
# - Variance greater than 100% or not meaningful | |||||||||||
U.K. Segment Results - For the six months ended June 30, 2018 and 2017
U.K. revenue improved $4.5 million, or 24.4%, to $22.7 million for the six months ended June 30, 2018 from $18.3 million in the prior year period. On a constant currency basis, revenue was up $2.5 million, or 13.9%. Provision for losses increased $4.3 million, and, on a constant currency basis, increased $3.5 million, or 62.9%, due to volume growth.
The cost of providing services in the U.K. increased $0.1 million, or 1.5%, for the six months ended June 30, 2018 compared to prior year period due to higher customer acquisition spend offset by a lower cost basis upon completion of store closures in the third quarter of 2017. On a constant currency basis, the cost of providing services decreased $0.5 million, or 7.4%.
Corporate, district and other expenses increased $1.9 million, or 22.1%, to $10.7 million for the six months ended June 30, 2018 compared to the prior year period. This increase includes costs related to customer redress pursuant to a complaint resolution process for all lenders in the U.K. The cost in the six months ended June 30, 2018 to administer the complaint resolution process and the direct customer redress paid or accrued totaled $2.9 million, an increase of $2.0 million compared to the prior year period. On a constant currency basis, corporate, district and other expenses increased $1.0 million, or 12.0%.
Supplemental Non-GAAP Financial Information
Non-GAAP Financial Measures
In addition to the financial information prepared in conformity with U.S. GAAP, we provide certain “non-GAAP financial measures” as defined under SEC rules, including:
• | Adjusted Net Income and Adjusted Earnings Per Share, or the Adjusted Earnings Measures (net income plus or minus gain (loss) on extinguishment of debt, restructuring and other costs, goodwill and intangible asset impairments, transaction-related costs, share-based compensation, intangible asset amortization and cumulative tax effect of adjustments, on a total and per share basis); |
• | EBITDA (earnings before interest, income taxes, depreciation and amortization); |
• | Adjusted EBITDA (EBITDA plus or minus certain non-cash and other adjusting items); and |
• | Gross Combined Loans Receivable (includes loans originated by third-party lenders through CSO programs which are not included in our consolidated financial statements). |
52
We believe that presentation of non-GAAP financial information is meaningful and useful in understanding the activities and business metrics of our operations. We believe that these non-GAAP financial measures reflect an additional way of viewing aspects of our business that, when viewed with its GAAP results, provide a more complete understanding of factors and trends affecting our business.
We believe that investors regularly rely on non-GAAP financial measures to assess operating performance and that such measures may highlight trends in our business that may not otherwise be apparent when relying on financial measures calculated in accordance with GAAP. We believe that the adjustments shown below are useful to investors in order to allow them to compare our financial results during the periods shown without the effect of each of these income or expense items. In addition, we believe that Adjusted Net Income, EBITDA and Adjusted EBITDA are frequently used by securities analysts, investors and other interested parties in the evaluation of public companies in our industry, many of which present Adjusted Net Income, EBITDA and/or Adjusted EBITDA when reporting their results.
We provide non-GAAP financial information for informational purposes and to enhance understanding of our GAAP consolidated financial statements. Adjusted Net Income, EBITDA, Adjusted EBITDA and Gross Combined Loans Receivable should not be considered as alternatives to income from continuing operations or any other performance measure derived in accordance with U.S. GAAP, or as an alternative to cash flows from operating activities or any other liquidity measure derived in accordance with U.S. GAAP. Rather, these measures should be considered in addition to results prepared in accordance with U.S. GAAP, but should not be considered a substitute for, or superior to, U.S. GAAP results. This non-GAAP financial information may be determined or calculated differently by other companies, limiting the usefulness of those measures for comparative purposes.
Description and Reconciliations of Non-GAAP Financial Measures
Adjusted Earnings Measures, EBITDA and Adjusted EBITDA have limitations as analytical tools, and you should not consider these measures in isolation or as a substitute for analysis of our income or cash flows as reported under U.S. GAAP. Some of these limitations are:
• | they do not include our cash expenditures or future requirements for capital expenditures or contractual commitments; |
• | they do not include changes in, or cash requirements for our working capital needs; |
• | they do not include the interest expense, or the cash requirements necessary to service interest or principal payments on our debt; |
• | depreciation and amortization are non-cash expense items reported in our statements of cash flows; and |
• | other companies in our industry may calculate these measures differently, limiting their usefulness as comparative measures. |
As noted above, Gross Combined Loans Receivable includes loans originated by third-party lenders through CSO programs which are not included in the consolidated financial statements but from which we earn revenue and for which we provide a guarantee to the lender. Management believes this analysis provides investors with important information needed to evaluate overall lending performance.
We evaluate our stores based on revenue per store, net charge-offs at each store and EBITDA per store, with consideration given to the length of time a store has been open and its geographic location. We monitor newer stores for their progress to profitability and their rate of revenue growth.
We believe Adjusted Earnings Measures, EBITDA and Adjusted EBITDA are used by investors to analyze operating performance and evaluate our ability to incur and service debt and our capacity for making capital expenditures. Adjusted EBITDA is also useful to investors to help assess our estimated enterprise value. The computation of Adjusted EBITDA as presented below may differ from the computation of similarly-titled measures provided by other companies.
53
Reconciliation of Net Income and Diluted Earnings per Share to Adjusted Net Income and Adjusted Diluted Earnings per Share, non-GAAP measures
Three Months Ended June 30, | Change | |||||||||||
(in thousands except per share data) | 2018 | 2017 | $ | % | ||||||||
Net income | $ | 15,975 | $ | 16,342 | $ | (367 | ) | (2.2 | )% | |||
Adjustments: | ||||||||||||
Loss on extinguishment of debt(1) | — | — | ||||||||||
Legal settlement costs(7) | — | 1,950 | ||||||||||
Transaction related costs(2) | — | 146 | ||||||||||
Share-based compensation(3) | 2,181 | 1,180 | ||||||||||
Intangible asset amortization | 655 | 590 | ||||||||||
Impact of tax law changes(6) | — | — | ||||||||||
Cumulative tax effect of adjustments | (709 | ) | (1,523 | ) | ||||||||
Adjusted Net Income | $ | 18,102 | $ | 18,685 | $ | (583 | ) | (3.1 | )% | |||
Net income | $ | 15,975 | $ | 16,342 | ||||||||
Diluted Weighted Average Shares Outstanding (4) | 47,996 | 38,987 | ||||||||||
Diluted Earnings per Share (4) | $ | 0.33 | $ | 0.42 | $ | (0.09 | ) | (21.4 | )% | |||
Per Share impact of adjustments to Net Income (4) | 0.05 | 0.06 | ||||||||||
Adjusted Diluted Earnings per Share (4) | $ | 0.38 | $ | 0.48 | $ | (0.10 | ) | (20.8 | )% | |||
Six Months Ended June 30, | Change | |||||||||||
(in thousands except per share data) | 2018 | 2017 | $ | % | ||||||||
Net income | $ | 39,267 | $ | 32,980 | $ | 6,287 | 19.1 | % | ||||
Adjustments: | ||||||||||||
Loss on extinguishment of debt(1) | 11,683 | 12,458 | ||||||||||
Legal settlement costs(7) | — | 1,950 | ||||||||||
Transaction related costs(2) | — | 2,400 | ||||||||||
Share-based compensation(3) | 4,023 | 1,306 | ||||||||||
Intangible asset amortization | 1,331 | 1,173 | ||||||||||
Impact of tax law changes(6) | 1,800 | — | ||||||||||
Cumulative tax effect of adjustments | (4,401 | ) | (7,105 | ) | ||||||||
Adjusted Net Income | $ | 53,703 | $ | 45,162 | $ | 8,541 | 18.9 | % | ||||
Net income | $ | 39,267 | $ | 32,980 | ||||||||
Diluted Weighted Average Shares Outstanding (4) | 47,757 | 38,983 | ||||||||||
Diluted Earnings per Share (4) | $ | 0.82 | $ | 0.85 | $ | (0.03 | ) | (3.5 | )% | |||
Per Share impact of adjustments to Net Income (4) | 0.31 | 0.31 | ||||||||||
Adjusted Diluted Earnings per Share (4) | $ | 1.13 | $ | 1.16 | $ | (0.03 | ) | (2.6 | )% | |||
54
Reconciliation of Net income to EBITDA and Adjusted EBITDA, non-GAAP measures
Three Months Ended June 30, | Change | |||||||||||
(dollars in thousands) | 2018 | 2017 | $ | % | ||||||||
Net income | $ | 15,975 | $ | 16,342 | $ | (367 | ) | (2.2 | )% | |||
Provision for income taxes | 5,317 | 10,619 | (5,302 | ) | (49.9 | )% | ||||||
Interest expense | 20,465 | 18,484 | 1,981 | 10.7 | % | |||||||
Depreciation and amortization | 4,598 | 4,676 | (78 | ) | (1.7 | )% | ||||||
EBITDA | 46,355 | 50,121 | $ | (3,766 | ) | (7.5 | )% | |||||
Loss on extinguishment of debt(1) | — | — | ||||||||||
Legal Settlement costs(7) | — | 1,950 | ||||||||||
Transaction related costs(2) | — | 146 | ||||||||||
Share-based compensation(3) | 2,181 | 1,180 | ||||||||||
Other adjustments(5) | 85 | (201 | ) | |||||||||
Adjusted EBITDA | 48,621 | 53,196 | (4,575 | ) | (8.6 | )% | ||||||
Adjusted EBITDA Margin | 19.5 | % | 24.5 | % | ||||||||
Six Months Ended June 30, | Change | |||||||||||
(dollars in thousands) | 2018 | 2017 | $ | % | ||||||||
Net income | $ | 39,267 | $ | 32,980 | $ | 6,287 | 19.1 | % | ||||
Provision for income taxes | 16,784 | 20,069 | (3,285 | ) | (16.4 | )% | ||||||
Interest expense | 42,814 | 41,850 | 964 | 2.3 | % | |||||||
Depreciation and amortization | 9,259 | 9,330 | (71 | ) | (0.8 | )% | ||||||
EBITDA | 108,124 | 104,229 | $ | 3,895 | 3.7 | % | ||||||
Loss on extinguishment of debt(1) | 11,683 | 12,458 | ||||||||||
Legal settlement costs | — | 1,950 | ||||||||||
Transaction related costs(2) | — | 2,400 | ||||||||||
Share-based compensation(3) | 4,023 | 1,306 | ||||||||||
Other adjustments(5) | 6 | (515 | ) | |||||||||
Adjusted EBITDA | 123,836 | 121,828 | 2,008 | 1.6 | % | |||||||
Adjusted EBITDA Margin | 24.2 | % | 27.6 | % | ||||||||
(1) For the six months ended June 30, 2018, the $11.7 million loss from the extinguishment of debt was due to the redemption of CFTC's 12.00% Senior Secured Notes due 2022. For the six months ended June 30, 2017, the $12.5 million loss from extinguishment of debt was due to the redemption of CURO Intermediate Holding Corp's 10.75% Senior Secured Notes due 2018 and the 12.00% Senior Cash Pay Notes due 2017. | ||||||||||||
(2) Transaction-related costs include professional fees paid in connection with potential transactions and the original issuance of $470.0 million of Senior Secured Notes due 2022 in the first quarter of 2017. | ||||||||||||
(3) The Company approved the adoption of a share-based compensation plans during 2010 and 2017 for key members of its senior management team. The estimated fair value of share-based awards is recognized as non-cash compensation expense on a straight-line basis over the vesting period. | ||||||||||||
(4) The share and per share information have been adjusted to give effect to the 36-to-1 split of the Company's common stock that occurred during the fourth quarter of 2017. | ||||||||||||
(5) Other adjustments include deferred rent and the intercompany foreign exchange impact. Deferred rent represents the non-cash component of rent expense. Rent expense is recognized ratably on a straight-line basis over the lease term. | ||||||||||||
(6) As a result of the 2017 Tax Act, which became law on December 22, 2017, we provided an estimate of the new repatriation tax as of December 31, 2017. Subsequent to further guidance published in the first quarter of 2018, we booked additional tax expense of $1.2 million for the 2017 repatriation tax. Additionally, the 2017 Tax Act provided for a new GILTI tax starting in 2018 and we estimated and provided tax expense of $0.6 million as of June 30, 2018. | ||||||||||||
(7) Legal settlement cost for the three and six months ended June 30, 2017 includes $2.0 million for the settlement of the Harrison, et. al. v. Principal Investment Inc. et al. For more information, see Note 18 -- "Contingent Liabilities" of the Notes to the Consolidated Financial Statements included in the Company's Form 10-K filed with the SEC on March 13, 2018. | ||||||||||||
55
Currency Information
We operate in the U.S., Canada and the U.K. and report our consolidated results in U.S. dollars.
Changes in our reported revenues and net income include the effect of changes in currency exchange rates. All balance sheet accounts are translated into U.S. dollars at the currency exchange rate in effect at the end of each period. The income statement is translated at the average rates of exchange for the period. Currency translation adjustments are recorded as a component of Accumulated Other Comprehensive Income in Stockholders’ Equity.
Constant Currency Analysis
In the three months ended June 30, 2018 and 2017, approximately 23.6% and 24.5%, respectively, of our revenues were originated in currencies other than the U.S. Dollar. As a result, changes in our reported results include the impacts of changes in foreign currency exchange rates for the Canadian Dollar and the British Pound Sterling.
Three Months Ended June 30, 2018 and 2017
Average Exchange Rates | ||||||||||||
Three Months Ended June 30, | Change | |||||||||||
2018 | 2017 | $ | % | |||||||||
Canadian Dollar | $ | 0.7749 | $ | 0.7434 | $0.0315 | 4.2 | % | |||||
British Pound Sterling | $ | 1.3610 | $ | 1.2784 | $0.0826 | 6.5 | % | |||||
Six Months Ended June 30, 2018 and 2017
Average Exchange Rates | ||||||||||||
Six Months Ended June 30, | Change | |||||||||||
2018 | 2017 | $ | % | |||||||||
Canadian Dollar | $ | 0.7831 | $ | 0.7495 | $0.0336 | 4.5 | % | |||||
British Pound Sterling | $ | 1.3763 | $ | 1.2587 | $0.1176 | 9.3 | % | |||||
The following constant currency analysis removes the impact of the fluctuation in foreign exchange rates and utilizes constant currency results in our analysis of segment performance. Our constant currency assessment assumes foreign exchange rates in the current fiscal periods remained the same as in the prior fiscal periods. All conversion rates below are based on the U.S. Dollar equivalent to one of the applicable foreign currencies. We believe that the constant currency assessment below is a useful measure in assessing the comparable growth and profitability of our operations.
The revenues and gross margin below during the three months ended June 30, 2018 were calculated using the actual average exchange rate during the three months ended June 30, 2017.
Three Months Ended June 30, | Change | |||||||||||||||
(dollars in thousands) | 2018 | 2017 | $ | % | ||||||||||||
Revenues – constant currency basis: | ||||||||||||||||
Canada | $ | 45,146 | $ | 43,595 | $ | 1,551 | 3.6 | % | ||||||||
United Kingdom | 11,115 | 9,585 | 1,530 | 16.0 | % | |||||||||||
Gross margin - constant currency basis: | ||||||||||||||||
Canada | 12,777 | 15,962 | (3,185 | ) | (20.0 | )% | ||||||||||
United Kingdom | 2,915 | 2,921 | (6 | ) | (0.2 | )% | ||||||||||
56
The revenues and gross margin below during the six months ended June 30, 2018 were calculated using the actual average exchange rate during the six months ended June 30, 2017.
Six Months Ended June 30, | Change | |||||||||||||||
(dollars in thousands) | 2018 | 2017 | $ | % | ||||||||||||
Revenues – constant currency basis: | ||||||||||||||||
Canada | $ | 89,343 | $ | 85,161 | $ | 4,182 | 4.9 | % | ||||||||
United Kingdom | 20,818 | 18,277 | 2,541 | 13.9 | % | |||||||||||
Gross margin - constant currency basis: | ||||||||||||||||
Canada | 26,630 | 30,262 | (3,632 | ) | (12.0 | )% | ||||||||||
United Kingdom | 5,946 | 6,394 | (448 | ) | (7.0 | )% | ||||||||||
LIQUIDITY AND CAPITAL RESOURCES
Our principal sources of liquidity to fund the loans we make to our customers are cash provided by operations, our Senior Revolver (defined below), funds from third party lenders under our CSO programs, and our Non-Recourse U.S. SPV Facility, which finances the originations of eligible U.S. Unsecured and Secured Installment Loans at an advance rate of 80%. In 2017, we issued our 12.00% Senior Secured Notes due March 1, 2022 ("Senior Secured Notes") to refinance similar notes that were nearing maturity and to pay dividends to our stockholders. As of June 30, 2018, we were in compliance with all financial ratios, covenants and other requirements set forth in our debt agreements. We anticipate that our primary use of cash will be to fund growth in our working capital, finance capital expenditures and meet our debt obligations. Our level of cash flow provided by operating activities typically experiences some seasonal fluctuation related to our levels of net income and changes in working capital levels, particularly loans receivable.
Unexpected changes in our financial condition or other unforeseen factors may result in our inability to obtain third-party financing or could increase our borrowing costs in the future. We have the ability to adjust our volume of lending to consumers which would reduce cash outflow requirements while increasing cash inflows through loan repayments to the extent we experience any short-term or long-term funding shortfalls. We may also sell or securitize our assets, draw on our available revolving credit facility or line of credit, enter into additional refinancing agreements and reduce our capital spending in order to generate additional liquidity. We believe our cash on hand and available borrowings provide us with sufficient liquidity for at least the next 12 months.
Borrowings
Our long-term debt consisted of the following as of June 30, 2018 and December 31, 2017 (net of deferred financing costs):
June 30, | December 31, | |||||||
(dollars in thousands) | 2018 | 2017 | ||||||
2017 Senior Secured Notes (due 2022) | $ | 512,136 | $ | 585,823 | ||||
Non-Recourse U.S. SPV Facility | 114,697 | 120,402 | ||||||
Senior Revolver | — | — | ||||||
Cash Money Revolving Credit Facility | — | — | ||||||
Long-term debt | $ | 626,833 | $ | 706,225 | ||||
57
Available Credit Facilities and Other Resources
12.00% Senior Secured Notes
In February and November 2017, CFTC issued $470.0 million and $135.0 million, respectively, of Senior Secured Notes. Interest on the Senior Secured Notes is payable semiannually, in arrears, on March 1 and September 1 of each year, beginning on September 1, 2017. The February issuance refinanced similar notes that were nearing maturity. The extinguishment of the existing notes resulted in a pretax loss of $11.7 million during the six months ended June 30, 2017. In connection with these 2017 debt issuances we capitalized financing costs of approximately $18.3 million, the balance of which is included in the Condensed Consolidated Balance Sheets as a component of Long-Term Debt, and is being amortized over the term of the Senior Secured Notes and included as a component of interest expense.
On March 7, 2018, CFTC redeemed $77.5 million of its Senior Secured Notes (the transaction whereby the Senior Secured Notes were partially redeemed, the “Redemption”) at a price equal to 112.00% of the principal amount of the Senior Secured Notes redeemed, plus accrued and unpaid interest paid thereon to the date of Redemption. Following the Redemption, $527.5 million of the original outstanding principal amount of the Senior Secured Notes remain outstanding. The Redemption was conducted pursuant to the Indenture governing the Senior Secured Notes (the “Indenture”), dated as of February 15, 2017, by and among CFTC, the guarantors party thereto and TMI Trust Company, as trustee and collateral agent. Consistent with the terms of the Indenture, CFTC used a portion of the cash proceeds from our initial public offering, completed in December 2017, to redeem such Senior Secured Notes.
Non-Recourse U.S. SPV Facility
In November 2016, CURO Receivables Finance I, LLC, a Delaware limited liability company (the “SPV Borrower”) and a wholly-owned subsidiary, entered into a five-year revolving credit facility with Victory Park Management, LLC and certain other lenders that provides an $80.0 million term loan and $70.0 million of revolving borrowing capacity that can expand time (“Non-Recourse U.S. SPV Facility”).
Senior Revolver
In September 2017, we closed a $25.0 million Senior Secured Revolving Loan Facility (the "Senior Revolver"). In February 2018, the Senior Revolver capacity was increased to $29.0 million as permitted by the Indenture to the Senior Secured Notes based upon consolidated tangible assets. The Senior Revolver is now syndicated with participation by a second bank. The negative covenants of the Senior Revolver generally conform to the related provisions in the Indenture for our 12.00% Senior Secured Notes. We believe this facility complements our other financing sources, while providing seasonal short-term liquidity. Under the Senior Revolver, there is $29.0 million maximum availability, including up to $5.0 million of standby letters of credit, for a one-year term, renewable for successive terms following annual review. The Senior Revolver accrues interest at the one-month LIBOR (which may not be negative) plus 5.00% per annum and is repayable on demand. The terms of the Senior Revolver require that the outstanding balance be reduced to $0 for at least 30 consecutive days in each calendar year. The Senior Revolver is guaranteed by all subsidiaries of CURO that guarantee our 12.00% Senior Secured Notes and is secured by a lien on substantially all assets of CURO and the guarantor subsidiaries that is senior to the lien securing our 12.00% Senior Secured Notes. The Senior Revolver was undrawn at June 30, 2018.
Cash Money Revolving Credit Facility
Cash Money Cheque Cashing, Inc., one of our Canadian subsidiaries, maintains a C$7.3 million revolving credit facility with Royal Bank of Canada. The Cash Money Revolving Credit Facility provides short-term liquidity required to meet the working capital needs of our Canadian operations. Aggregate draws under the revolving credit facility are limited to the lesser of: (i) the borrowing base, which is defined as a percentage of cash, deposits in transit and accounts receivable, and (ii) C$7.3 million. As of December 31, 2017, the borrowing capacity under our revolving credit facility was reduced by C$0.3 million in stand-by-letters of credit.
58
The Cash Money Revolving Credit Facility is collateralized by substantially all of Cash Money’s assets and contains various covenants that include, among other things, that the aggregate borrowings outstanding under the facility not exceed the borrowing base, restrictions on the encumbrance of assets and the creation of indebtedness. Borrowings under the Cash Money Revolving Credit Facility bear interest (per annum) at the prime rate of a Canadian chartered bank plus 1.95%. The Cash Money Revolving Credit Facility was undrawn at June 30, 2018 and December 31, 2017.
Cash Flows
The following highlights our cash flow activity and the sources and uses of funding during the periods indicated:
Six Months Ended June 30, | ||||||||
(dollars in thousands) | 2018 | 2017 | ||||||
Net cash provided by operating activities | $ | 33,895 | $ | 49,774 | ||||
Net cash used in investing activities | (4,424 | ) | (16,240 | ) | ||||
Net cash used in financing activities | (71,361 | ) | (115,719 | ) | ||||
Operating activities
Net cash provided by operating activities for the six months ended June 30, 2018 was $33.9 million. Contributing to current year net cash provided by operating activities were net income of $39.3 million and non-cash expenses of $192.3 million. Major components of non-cash expenses include depreciation and amortization, provision for loan losses and loss on debt extinguishment. Contributions from net income and non-cash expenses were offset by changes in our operating assets and liabilities of $197.7 million. Our loans receivable change represented $206.1 million of the total change in operating assets and liabilities.
Net cash provided by operating activities for the six months ended June 30, 2017 was $49.8 million. Contributing to net cash provided by operating activities were net income of $33.0 million, and non-cash expenses, such as depreciation and amortization, the provision for loan losses, and a loss on debt extinguishment for a total of $150.2 million, partially offset by changes in our operating assets and liabilities of $133.4 million. The most significant change within operating assets and liabilities was a $150.5 million increase in loans receivable, net of provision for losses.
Loans receivable will fluctuate from period to period depending on the timing of loan issuances and collections. A seasonal decline in consumer loans receivable typically takes place during the first quarter of the year and is driven by income tax refunds in the United States. Typically, customers will use the proceeds from income tax refunds to pay outstanding loan balances, resulting in an increase of our net cash balances and a decrease of our consumer loans receivable balances. Consumer loans receivable balances typically reflect growth during the remainder of the year.
Investing activities
Net cash used in investing activities for the six months ended June 30, 2018 was $4.4 million. We used cash to purchase approximately $3.1 million of property and equipment, including software licenses, and to purchase $1.0 million of Cognical Holdings preferred shares. Additionally, the increase in restricted cash of $0.4 million was primarily attributable to our Non-Recourse U.S. SPV Facility.
Net cash used in investing activities for the six months ended June 30, 2017 was $16.2 million. Restricted cash increased by approximately $4.4 million primarily attributable to our Non-Recourse U.S. SPV Facility. Additionally, we purchased approximately $6.8 million of property and equipment, including software licenses, and $5.0 million of Cognical Holdings preferred shares.
59
Financing activities
Net cash used in financing activities for the six months ended June 30, 2018 was $71.4 million. We redeemed $77.5 million of our 12.00% Senior Secured Notes for $86.8 million (which included $9.3 million of call premium). The underwriters from our 2017 initial public offering exercised their option on January 5, 2018 and acquired one million shares of our common stock, providing net proceeds of $12.4 million as of June 30, 2018. We also had net borrowings of $6.2 million from our U.S. SPV Facility.
Net cash used in financing activities for the six months ended June 30, 2017 was $115.7 million. During this period, CFTC extinguished its 10.75% Senior Secured Notes for $426.0 million (which included $8.9 million of call premium) and extinguished our Senior Cash Pay Notes for $125.0 million. We also paid a dividend of $28.0 million to our stockholders in May 2017. These payments were partially financed by proceeds of $447.6 million (net of $14.0 million of debt issuance costs and $8.5 million of discount on notes issued) from the issuance of our 12.00% Senior Secured Notes due 2022. We had net borrowings of $16.0 million from our U.S. SPV Facility and our ABL Facility.
Contractual Obligations
There have been no significant developments with respect to our contractual obligations since December 31, 2017, as described in our Annual Report on Form 10-K.
Regulatory Environment and Compliance
There have been no significant developments with respect to our regulatory environment and compliance since December 31, 2017, as described in our Annual Report on Form 10-K, other than the following:
Recent developments regarding the CFPB Rule
The CFPB adopted a new rule applicable to payday vehicle title, and certain high-cost installment loans in November 2017 (the "CFPB Rule"), with most provisions currently scheduled to become effective in August 2019. In January 2018, the CFPB announced that it intends to engage in a rulemaking process to reconsider the CFPB Rule pursuant to the Administrative Procedure Act ("APA"). On April 9, 2018, the Community Financial Services Association of America ("CFSA") and the Consumer Service Alliance of Texas ("CSAT") filed a lawsuit against the CFPB in the U.S. District Court for the Western District of Texas, Austin Division, seeking to invalidate the CFPB Rule. The lawsuit alleges that the rule violates the APA because it exceeds the CFPB's statutory authority and is arbitrary, capricious and unsupported by substantial evidence. The lawsuit also argues that the CFPB’s structure is unconstitutional under the Constitution’s separation of powers because the agency’s powers are concentrated in a single, unchecked Director who is improperly insulated from both presidential supervision and congressional appropriation, and hence unaccountable to the American people. On May 31, 2018, CFSA together with CSAT and CFPB filed a joint motion to effectively stay the litigation between the parties and stay the compliance date of the CFPB Rule. On June 12, 2018, the judge granted the motion to stay the litigation but denied the motion to stay the compliance date of the CFPB Rule. On June 22, 2018, CFSA and CSAT filed a motion for reconsideration to stay the compliance date of the CFPB Rule. The court has not yet ruled on such motion for reconsideration. It is impossible to predict whether and when the CFPB Rule will go into effect and, if so, whether and how it might be modified.
California legislative activity
Three bills were introduced in the California Assembly which would have directly impacted the products currently offered by us. Assembly Bill 2500 as introduced would have imposed a 36% APR cap on all consumer loans between $2,500 and $5,000 and, a 24% APR cap on all consumer loans between $5,000 and $10,000. Assembly Bill 2953 would have imposed a 36% APR cap on all auto title loans. Assembly Bill 3010 as introduced would have limited borrowers to one outstanding payday loan at a time across all lenders using a common database to enforce the one loan restriction.
60
Assembly Bill 2500 did not pass out of the Assembly by the May 31, 2018 deadline. Assembly Bills 2953 and 3010 advanced to the Senate but did not pass out of the Senate Banking and Insurance Committee by the June 30, 2018 deadline. As a result, activity for all three bills has concluded for this legislative session. California represented 18.2% and 18.0%, respectively, of our consolidated revenues for the three and six months ended June 30, 2018.
Ohio legislative activity
House Bill 123 was first introduced in March of 2017. As initially introduced, the bill would significantly limit the permissible fees and charges on short term loans and eliminate the CSO arrangement. In late July 2018, the Ohio legislature passed House Bill 123 and the Governor signed the bill into law on July 30, 2018. The bill is effective in 90 days and, certain sections apply to loans made 180 calendar days after the effective date. As a result, loan product changes will occur on or near May 1, 2019.
Ohio revenue for the trailing twelve months ended June 30, 2018, was $20.1 million. After loss provisions and direct costs, state-level contribution from Ohio was immaterial.
ITEM 3. QUANTITATIVE AND QUALITATIVE DISCLOSURES ABOUT MARKET RISK
For quantitative and qualitative disclosures about our market risks, see "Quantitative and Qualitative Disclosures about Market Risk" in our 2017 Annual Report on Form 10-K. There have been no material changes to the amounts presented therein except for the following:
Foreign Currency Exchange Rate Risk
As foreign currency exchange rates change, translation of the financial results of the U.K. and Canadian operations into U.S. Dollars will be impacted. Our operations in Canada and the U.K. represent a significant portion of our total operations, and as a result, a material change in foreign currency exchange rates in either country could have a significant impact on our consolidated financial position, results of operations or cash flows. From time to time, we may elect to purchase financial instruments as hedges against foreign exchange rate risks with the objective of protecting our results of operations in the U.K. and/or Canada against foreign currency fluctuations. We typically hedge anticipated cash flows between our foreign subsidiaries and domestic subsidiaries.
During the six months ended June 30, 2018, we entered into a series of cash flow hedges in which the hedging instruments were forwards to purchase GBP 7.9 million. These contracts will complete during the three months ended September 30, 2018.
We performed an assessment that determined all critical terms of the hedging instrument and the hedged transaction match and, as such, have qualitatively concluded that changes in the hedge instrument’s intrinsic value will completely offset the change in the expected cash flows based on changes in the spot rate. Since the effectiveness of this hedge is assessed based on changes in the hedge instrument’s intrinsic value, the change in the time value of the contract would be excluded from the assessment of hedge effectiveness. We recorded changes in the hedge instrument’s intrinsic value, to the extent that they were effective as a hedge, in "Other comprehensive income."
61
ITEM 4. CONTROLS AND PROCEDURES
Disclosure controls and procedures
We maintain disclosure controls and procedures designed to ensure that information required to be disclosed in the reports we file or submit under the Securities Exchange Act of 1934 (the “Exchange Act”) is recorded, processed, summarized and reported within the time periods specified in the SEC’s rules and forms, including without limitation, controls and procedures designed to ensure that information required to be disclosed in reports we file under the Exchange Act is accumulated and communicated to our management, including the Chief Executive Officer and Chief Financial Officer, as appropriate to allow timely decisions regarding required disclosure. Any controls and procedures, no matter how well designed and operated, can provide only reasonable assurance of achieving the desired control objective and management necessarily applies its judgment in evaluating the cost-benefit relationship of possible controls and procedures. Based on an evaluation of our disclosure controls and procedures as of the end of the period covered by this report conducted by our management, with the participation of the Chief Executive Officer and Chief Financial Officer, the Chief Executive Officer and Chief Financial Officer concluded that these controls and procedures were effective as of June 30, 2018.
Internal control over financial reporting
There were no changes in our internal control over financial reporting (as defined in Rules 13a-15(e) and 15d-15(e) under the Exchange Act) during the three months ended June 30, 2018, that have materially affected, or are reasonably likely to materially affect, our internal control over financial reporting.
PART 2. OTHER INFORMATION
ITEM 1. LEGAL PROCEEDINGS
The information required by this item is included in Note 13 - Contingent Liabilities of the Notes to the Condensed Consolidated Financial Statements in this Quarterly Report and is incorporated herein by reference.
ITEM 1A. RISK FACTORS
There were no material changes to our risk factors as described in our Annual Report on Form 10-K for the year ended December 31, 2017 other than the following:
The CFPB promulgated new rules applicable to our loans that could have a material adverse effect on our business and results of operations.
In January 2018, the CFPB announced that it intends to engage in a rulemaking process to reconsider the CFPB Rule pursuant to the Administrative Procedure Act ("APA"). On April 9 2018, the Community Financial Services Association of America ("CFSA") and the Consumer Service Alliance of Texas filed a lawsuit against the CFPB in the U.S. District Court for the Western District of Texas, Austin Division, seeking to invalidate the CFPB Rule. The lawsuit alleges that the rule violates the APA because it exceeds the CFPB’s statutory authority and is arbitrary, capricious and unsupported by substantial evidence. The lawsuit also argues that the CFPB’s structure is unconstitutional under the Constitution’s separation of powers because the agency’s powers are concentrated in a single, unchecked Director who is improperly insulated from both presidential supervision and congressional appropriation, and hence unaccountable to the American people. On May 31, 2018, CFSA together with CSAT and CFPB filed a joint motion to effectively stay the litigation between the parties and stay the compliance date of the CFPB Rule. On June 12, 2018, the judge granted the motion to stay the litigation but denied the motion to stay the compliance date of the CFPB Rule. On June 22, 2018, CFSA and CSAT filed a motion for reconsideration to stay the compliance date of the CFPB Rule. The court has not yet ruled on such motion for reconsideration. It is impossible to predict whether and when the CFPB Rule will go into effect and, if so, whether and how it might be modified.
62
ITEM 2. UNREGISTERED SALES OF EQUITY SECURITIES AND USE OF PROCEEDS
None.
ITEM 3. DEFAULTS UPON SENIOR SECURITIES
None.
ITEM 4. MINE SAFETY DISCLOSURES
None.
ITEM 5. OTHER INFORMATION
(a) Disclosure of Unreported 8-K Information
None.
(b) Material Changes to Director Nominee Procedures
None.
ITEM 6. EXHIBITS
Exhibit no. | Exhibit Description | |
3.1 | ||
3.2 | ||
31.1 | ||
31.2 | ||
32.1 | ||
32.2 | ||
101 | The following unaudited financial information from the Company's Quarterly Report on Form 10-Q for the period ended June 30, 2018, filed with the SEC on August 1, 2018, formatted in Extensible Business Reporting Language (“XBRL”) includes: (i) Condensed Consolidated Balance Sheets at June 30, 2018 and December 31, 2017, (ii) Condensed Consolidated Statements of Income for the quarter ended June 30, 2018 and 2017, (iii) Condensed Consolidated Statements of Comprehensive Income for the quarter ended June 30, 2018 and 2017, (iv) Condensed Consolidated Statements of Cash Flows for the quarter ended June 30, 2018 and 2017, and (v) Notes to Condensed Consolidated Financial Statements* | |
* | Filed herewith. | |
** | Furnished herewith. | |
63
SIGNATURE
Pursuant to the requirements of Section 13 or 15(d) of the Securities Exchange Act of 1934, the Company has duly caused this report to be signed on its behalf by the undersigned, thereunto duly authorized.
Dated: August 2, 2018 CURO Group Holdings Corp.
By: | /s/ ROGER DEAN | |
Roger Dean | ||
Executive Vice-President and Chief Financial Officer | ||
64