Attached files
| file | filename |
|---|---|
| 8-K - UMH PROPERTIES, INC. | form8k.htm |
Exhibit 99

Certain information in this Supplemental Information Package contains Non-GAAP financial measures. These Non-GAAP financial measures are REIT industry financial measures that are not calculated in accordance with accounting principles generally accepted in the United States of America. Please see page 15 for a definition of these Non-GAAP financial measures and page 7 for the reconciliation of certain captions in the Supplemental Information Package to the statement of operations as reported in the Company’s filings with the SEC on Form 10-Q.
| UMH Properties, Inc. | Third Quarter FY 2020 Supplemental Information | 2 |
(dollars in thousands except per share amounts) (unaudited)
| Three Months Ended | Nine Months Ended | |||||||||||||||
| 9/30/2020 | 9/30/2019 | 9/30/2020 | 9/30/2019 | |||||||||||||
| Operating Information | ||||||||||||||||
| Number of Communities | 124 | 122 | ||||||||||||||
| Number of Sites | 23,428 | 23,009 | ||||||||||||||
| Rental and Related Income | $ | 36,358 | $ | 32,948 | $ | 105,767 | $ | 94,980 | ||||||||
| Community Operating Expenses | $ | 16,245 | $ | 15,772 | $ | 47,191 | $ | 45,886 | ||||||||
| Community NOI | $ | 20,113 | $ | 17,176 | $ | 58,576 | $ | 49,094 | ||||||||
| Expense Ratio | 44.7 | % | 47.5 | % | 44.6 | % | 47.8 | % | ||||||||
| Sales of Manufactured Homes | $ | 6,765 | $ | 4,382 | $ | 15,013 | $ | 13,867 | ||||||||
| Number of Homes Sold | 108 | 71 | 252 | 230 | ||||||||||||
| Number of Rentals Added | 317 | 432 | 684 | 768 | ||||||||||||
| Net Income (Loss) (1) | $ | (1,767 | ) | $ | 12,433 | $ | (18,190 | ) | $ | 24,219 | ||||||
| Net Income (Loss) Attributable to Common Shareholders (1)(2) | $ | (12,747 | ) | $ | 5,622 | $ | (45,350 | ) | $ | 5,999 | ||||||
| Adjusted EBITDA | $ | 20,081 | $ | 17,078 | $ | 58,145 | $ | 49,319 | ||||||||
| FFO Attributable to Common Shareholders | $ | 4,515 | $ | 5,805 | $ | 17,739 | $ | 17,567 | ||||||||
| Normalized FFO Attributable to Common Shareholders | $ | 7,386 | $ | 6,011 | $ | 20,610 | $ | 18,148 | ||||||||
| Shares Outstanding and Per Share Data | ||||||||||||||||
| Weighted Average Shares Outstanding | ||||||||||||||||
| Basic | 41,421 | 40,513 | 41,275 | 39,592 | ||||||||||||
| Diluted | 41,421 | 40,754 | 41,275 | 39,830 | ||||||||||||
| Net Income (Loss) Attributable to Common Shareholders per Share (1)(2) – Basic and Diluted | $ | (0.31 | ) | $ | 0.14 | $ | (1.10 | ) | $ | 0.15 | ||||||
| FFO per Share(2) – Basic and Diluted | $ | 0.11 | $ | 0.14 | $ | 0.43 | $ | 0.44 | ||||||||
| Normalized FFO per Share – Basic and Diluted | $ | 0.18 | $ | 0.15 | $ | 0.50 | $ | 0.46 | ||||||||
| Dividends per Common Share | $ | 0.18 | $ | 0.18 | $ | 0.54 | $ | 0.54 | ||||||||
| Balance Sheet | ||||||||||||||||
| Total Assets | $ | 1,094,744 | $ | 1,010,152 | ||||||||||||
| Total Liabilities | $ | 629,801 | $ | 473,518 | ||||||||||||
| Market Capitalization | ||||||||||||||||
| Total Debt, Net of Unamortized Debt Issuance Costs | $ | 506,959 | $ | 451,965 | ||||||||||||
| Equity Market Capitalization | $ | 563,626 | $ | 574,617 | ||||||||||||
| Series B Preferred Stock | $ | -0- | $ | 95,030 | ||||||||||||
| Series C Preferred Stock | $ | 247,100 | $ | 243,750 | ||||||||||||
| Series D Preferred Stock | $ | 135,589 | $ | 50,000 | ||||||||||||
| Total Market Capitalization | $ | 1,453,274 | $ | 1,415,362 | ||||||||||||
| (1) | Includes increase (decrease) in fair value of marketable securities. | |
| (2) | Includes charge associated with redemption of preferred stock. |
| UMH Properties, Inc. | Third Quarter FY 2020 Supplemental Information | 3 |
(in thousands except per share amounts)
| September 30, | December 31, | |||||||
| 2020 | 2019 | |||||||
| (unaudited) | ||||||||
| ASSETS | ||||||||
| Investment Property and Equipment | ||||||||
| Land | $ | 73,436 | $ | 72,459 | ||||
| Site and Land Improvements | 639,519 | 618,041 | ||||||
| Buildings and Improvements | 27,584 | 27,380 | ||||||
| Rental Homes and Accessories | 338,887 | 297,401 | ||||||
| Total Investment Property | 1,079,426 | 1,015,281 | ||||||
| Equipment and Vehicles | 22,030 | 21,145 | ||||||
| Total Investment Property and Equipment | 1,101,456 | 1,036,426 | ||||||
| Accumulated Depreciation | (262,524 | ) | (232,783 | ) | ||||
| Net Investment Property and Equipment | 838,932 | 803,643 | ||||||
| Other Assets | ||||||||
| Cash and Cash Equivalents | 54,666 | 12,902 | ||||||
| Marketable Securities at Fair Value | 85,161 | 116,186 | ||||||
| Inventory of Manufactured Homes | 27,063 | 31,967 | ||||||
| Notes and Other Receivables, net | 44,603 | 37,995 | ||||||
| Prepaid Expenses and Other Assets | 19,355 | 10,762 | ||||||
| Land Development Costs | 24,964 | 11,998 | ||||||
| Total Other Assets | 255,812 | 221,810 | ||||||
| TOTAL ASSETS | $ | 1,094,744 | $ | 1,025,453 | ||||
| LIABILITIES AND SHAREHOLDERS’ EQUITY | ||||||||
| Liabilities | ||||||||
| Mortgages Payable, net of Unamortized Debt Issuance Costs | $ | 472,376 | $ | 373,658 | ||||
| Other Liabilities | ||||||||
| Accounts Payable | 5,746 | 4,572 | ||||||
| Loans Payable, net of Unamortized Debt Issuance Costs | 34,583 | 83,686 | ||||||
| Series B Preferred Stock Called for Redemption | 95,017 | -0- | ||||||
| Accrued Liabilities and Deposits | 14,682 | 10,575 | ||||||
| Tenant Security Deposits | 7,397 | 6,623 | ||||||
| Total Other Liabilities | 157,425 | 105,456 | ||||||
| Total Liabilities | 629,801 | 479,114 | ||||||
| COMMITMENTS AND CONTINGENCIES | ||||||||
| Shareholders’ Equity: | ||||||||
| Series B – 8.0% Cumulative Redeemable Preferred Stock, par value $0.10 per share; 4,000 shares authorized; 3,801 shares issued and outstanding as of December 31, 2019 | -0- | 95,030 | ||||||
| Series C – 6.75% Cumulative Redeemable Preferred Stock, par value $0.10 per share; 13,750 shares authorized; 9,884 and 9,750 issued and outstanding as of September 30, 2020 and December 31, 2019, respectively | 247,100 | 243,750 | ||||||
| Series D – 6.375% Cumulative Redeemable Preferred Stock, par value $0.10 per share; 9,300 and 6,000 shares authorized; 5,424 and 2,651 shares issued and outstanding as of September 30, 2020 and December 31, 2019, respectively | 135,589 | 66,268 | ||||||
| Common Stock – $0.10 par value per share: 140,364 and 123,664 shares authorized; 41,627 and 41,130 shares issued and outstanding as of September 30, 2020 and December 31, 2019, respectively | 4,163 | 4,113 | ||||||
| Excess Stock – $0.10 par value per share: 3,000 shares authorized; no shares issued or outstanding as of September 30, 2020 and December 31, 2019 | -0- | -0- | ||||||
| Additional Paid-In Capital | 103,455 | 162,542 | ||||||
| Undistributed Income (Accumulated Deficit) | (25,364 | ) | (25,364 | ) | ||||
| Total Shareholders’ Equity | 464,943 | 546,339 | ||||||
| TOTAL LIABILITIES AND SHAREHOLDERS’ EQUITY | $ | 1,094,744 | $ | 1,025,453 | ||||
| UMH Properties, Inc. | Third Quarter FY 2020 Supplemental Information | 4 |
Consolidated Statements of Income (Loss)
(in thousands) (unaudited)
| Three Months Ended | Nine Months Ended | |||||||||||||||
| 9/30/2020 | 9/30/2019 | 9/30/2020 | 9/30/2019 | |||||||||||||
| INCOME: | ||||||||||||||||
| Rental and Related Income | $ | 36,358 | $ | 32,948 | $ | 105,767 | $ | 94,980 | ||||||||
| Sales of Manufactured Homes | 6,765 | 4,382 | 15,013 | 13,867 | ||||||||||||
| TOTAL INCOME | 43,123 | 37,330 | 120,780 | 108,847 | ||||||||||||
| EXPENSES: | ||||||||||||||||
| Community Operating Expenses | 16,245 | 15,772 | 47,191 | 45,886 | ||||||||||||
| Cost of Sales of Manufactured Homes | 4,695 | 3,271 | 10,713 | 10,117 | ||||||||||||
| Selling Expenses | 1,381 | 1,375 | 3,757 | 3,803 | ||||||||||||
| General and Administrative Expenses | 2,934 | 2,579 | 8,262 | 7,910 | ||||||||||||
| Depreciation Expense | 10,492 | 9,390 | 30,991 | 27,010 | ||||||||||||
| TOTAL EXPENSES | 35,747 | 32,387 | 100,914 | 94,726 | ||||||||||||
| OTHER INCOME (EXPENSE): | ||||||||||||||||
| Interest Income | 736 | 650 | 2,144 | 1,787 | ||||||||||||
| Dividend Income | 1,183 | 1,858 | 4,481 | 5,734 | ||||||||||||
| Increase (Decrease) in Fair Value of Marketable Securities | (6,739 | ) | 9,234 | (31,921 | ) | 15,478 | ||||||||||
| Other Income | 232 | 171 | 561 | 424 | ||||||||||||
| Interest Expense | (4,524 | ) | (4,396 | ) | (13,144 | ) | (13,289 | ) | ||||||||
| TOTAL OTHER INCOME (EXPENSE) | (9,112 | ) | 7,517 | (37,879 | ) | 10,134 | ||||||||||
| Income (Loss) before Loss on Sales of Investment Property and Equipment | (1,736 | ) | 12,460 | (18,013 | ) | 24,255 | ||||||||||
| Loss on Sales of Investment Property and Equipment | (31 | ) | (27 | ) | (177 | ) | (36 | ) | ||||||||
| NET INCOME (LOSS) | (1,767 | ) | 12,433 | (18,190 | ) | 24,219 | ||||||||||
| Less: Preferred Dividends | (8,109 | ) | (6,811 | ) | (24,289 | ) | (18,220 | ) | ||||||||
| Less: Redemption of Preferred Stock | (2,871 | ) | -0- | (2,871 | ) | -0- | ||||||||||
| NET INCOME (LOSS) ATTRIBUTABLE TO COMMON SHAREHOLDERS | $ | (12,747 | ) | $ | 5,622 | $ | (45,350 | ) | $ | 5,999 | ||||||
| UMH Properties, Inc. | Third Quarter FY 2020 Supplemental Information | 5 |
Consolidated Statements of Cash Flows
(in thousands) (unaudited)
| Nine Months Ended | ||||||||
| 9/30/2020 | 9/30/2019 | |||||||
| CASH FLOWS FROM OPERATING ACTIVITIES: | ||||||||
| Net Income (Loss) | $ | (18,190 | ) | $ | 24,219 | |||
| Non-Cash Items Included in Net Income (Loss): | ||||||||
| Depreciation | 30,991 | 27,010 | ||||||
| Amortization of Financing Costs | 654 | 559 | ||||||
| Stock Compensation Expense | 1,104 | 1,492 | ||||||
| Provision for Uncollectible Notes and Other Receivables | 1,056 | 972 | ||||||
| (Increase) Decrease in Fair Value of Marketable Securities | 31,921 | (15,478 | ) | |||||
| Loss on Sales of Investment Property and Equipment | 177 | 36 | ||||||
| Changes in Operating Assets and Liabilities: | ||||||||
| Inventory of Manufactured Homes | 4,904 | (6,812 | ) | |||||
| Notes and Other Receivables | (7,664 | ) | (6,748 | ) | ||||
| Prepaid Expenses and Other Assets | (666 | ) | (3,814 | ) | ||||
| Accounts Payable | 1,174 | 1,142 | ||||||
| Accrued Liabilities and Deposits | 4,106 | 2,529 | ||||||
| Tenant Security Deposits | 774 | 755 | ||||||
| Net Cash Provided by Operating Activities | 50,341 | 25,862 | ||||||
| CASH FLOWS FROM INVESTING ACTIVITIES: | ||||||||
| Purchase of Manufactured Home Communities, net of Mortgages assumed | (6,274 | ) | (37,308 | ) | ||||
| Purchase of Investment Property and Equipment | (59,427 | ) | (49,344 | ) | ||||
| Proceeds from Sales of Investment Property and Equipment | 1,919 | 2,129 | ||||||
| Additions to Land Development Costs | (12,966 | ) | (13,731 | ) | ||||
| Purchase of Marketable Securities | (896 | ) | (1,364 | ) | ||||
| Net Cash Used in Investing Activities | (77,644 | ) | (99,618 | ) | ||||
| CASH FLOWS FROM FINANCING ACTIVITIES: | ||||||||
| Proceeds from Mortgages, net of mortgages assumed | 105,984 | 44,850 | ||||||
| Net Payments from Short Term Borrowings | (49,191 | ) | (31,576 | ) | ||||
| Principal Payments of Mortgages | (6,579 | ) | (19,567 | ) | ||||
| Financing Costs on Debt | (3,927 | ) | (787 | ) | ||||
| Proceeds from At-The-Market Preferred Equity Program, net of Offering Costs | 71,473 | -0- | ||||||
| Proceeds from Issuance of Preferred Stock, net of Offering Costs | -0- | 96,688 | ||||||
| Proceeds from At-The-Market Common Stock Program, net of Offering Costs | 1,477 | -0- | ||||||
| Proceeds from Issuance of Common Stock in the DRIP, net of Dividend Reinvestments | 3,225 | 23,579 | ||||||
| Repurchase of Preferred Stock, net | (12 | ) | (237 | ) | ||||
| Repurchase of Common Stock, net | (1,830 | ) | -0- | |||||
| Proceeds from Exercise of Stock Options | 622 | 764 | ||||||
| Preferred Dividends Paid | (24,289 | ) | (18,745 | ) | ||||
| Common Dividends Paid, net of Dividend Reinvestments | (19,959 | ) | (15,823 | ) | ||||
| Net Cash Provided by Financing Activities | 76,994 | 79,146 | ||||||
| NET INCREASE IN CASH, CASH EQUIVALENTS AND RESTRICTED CASH | 49,691 | 5,390 | ||||||
| CASH, CASH EQUIVALENTS AND RESTRICTED CASH AT BEGINNING OF PERIOD | 18,996 | 12,777 | ||||||
| CASH, CASH EQUIVALENTS AND RESTRICTED CASH AT END OF PERIOD | $ | 68,687 | 18,167 | |||||
| UMH Properties, Inc. | Third Quarter FY 2020 Supplemental Information | 6 |
Reconciliation of Net Income (Loss) to Adjusted EBITDA and Net Income (Loss) Attributable to Common Shareholders to FFO and Normalized FFO
(in thousands except footnotes) (unaudited)
| Three Months Ended | Nine Months Ended | |||||||||||||||
| 9/30/2020 | 9/30/2019 | 9/30/2020 | 9/30/2019 | |||||||||||||
| Reconciliation of Net Income (Loss) to Adjusted EBITDA | ||||||||||||||||
| Net Income (Loss) | $ | (1,767 | ) | $ | 12,433 | $ | (18,190 | ) | $ | 24,219 | ||||||
| Interest Expense | 4,524 | 4,396 | 13,144 | 13,289 | ||||||||||||
| Franchise Taxes | 93 | 93 | 279 | 279 | ||||||||||||
| Depreciation Expense | 10,492 | 9,390 | 30,991 | 27,010 | ||||||||||||
| (Increase) Decrease in Fair Value of Marketable Securities | 6,739 | (9,234 | ) | 31,921 | (15,478 | ) | ||||||||||
| Adjusted EBITDA | $ | 20,081 | $ | 17,078 | $ | 58,145 | $ | 49,319 | ||||||||
| Reconciliation of Net Income (Loss) Attributable to Common Shareholders to Funds from Operations | ||||||||||||||||
| Net Income (Loss) Attributable to Common Shareholders | $ | (12,747 | ) | $ | 5,622 | $ | (45,350 | ) | $ | 5,999 | ||||||
| Depreciation Expense | 10,492 | 9,390 | 30,991 | 27,010 | ||||||||||||
| Loss on Sales of Property and Equipment | 31 | 27 | 177 | 36 | ||||||||||||
| (Increase) Decrease in Fair Value of Marketable Securities | 6,739 | (9,234 | ) | 31,921 | (15,478 | ) | ||||||||||
| Funds from Operations (“FFO”) | 4,515 | 5,805 | 17,739 | 17,567 | ||||||||||||
| Adjustments: | ||||||||||||||||
| Redemption of Preferred Stock | 2,871 | -0- | 2,871 | -0- | ||||||||||||
| Non-Recurring Expenses (1) | -0- | 206 | -0- | 581 | ||||||||||||
| Normalized Funds from Operations (“Normalized FFO”) | $ | 7,386 | $ | 6,011 | $ | 20,610 | $ | 18,148 | ||||||||
(1) Consists of utility billing dispute over a prior 10-year period ($375,000), emergency windstorm tree removal expenses in two adjacent communities ($126,000) and costs associated with acquisitions not completed ($80,000) in 2019.
| UMH Properties, Inc. | Third Quarter FY 2020 Supplemental Information | 7 |
Market Capitalization, Debt and Coverage Ratios
(in thousands except per share amounts) (unaudited)
| Nine Months Ended | Year Ended | |||||||||||
| 9/30/2020 | 9/30/2019 | 12/31/2019 | ||||||||||
| Shares Outstanding | 41,627 | 40,811 | 41,130 | |||||||||
| Market Price Per Share | $ | 13.54 | $ | 14.08 | $ | 15.73 | ||||||
| Equity Market Capitalization | $ | 563,626 | $ | 574,617 | $ | 646,976 | ||||||
| Total Debt | 506,959 | 451,965 | 457,344 | |||||||||
| Preferred | 382,689 | 388,780 | 405,048 | |||||||||
| Total Market Capitalization | $ | 1,453,274 | $ | 1,415,362 | $ | 1,509,368 | ||||||
| Total Debt | $ | 506,959 | $ | 451,965 | $ | 457,344 | ||||||
| Less: Cash and Cash Equivalents | (54,666 | ) | (11,111 | ) | (12,902 | ) | ||||||
| Net Debt | 452,293 | 440,854 | 444,442 | |||||||||
| Less: Marketable Securities at Fair Value (“Securities”) | (85,161 | ) | (116,437 | ) | (116,186 | ) | ||||||
| Net Debt Less Securities | $ | 367,132 | $ | 324,417 | $ | 328,256 | ||||||
| Interest Expense | $ | 13,144 | $ | 13,289 | $ | 17,805 | ||||||
| Capitalized Interest | 896 | 1,017 | 1,498 | |||||||||
| Preferred Dividends | 24,289 | 18,220 | 25,184 | |||||||||
| Total Fixed Charges | $ | 38,329 | $ | 32,526 | $ | 44,487 | ||||||
| Adjusted EBITDA | $ | 58,145 | $ | 49,319 | $ | 67,681 | ||||||
| Debt and Coverage Ratios | ||||||||||||
| Net Debt / Total Market Capitalization | 31.1 | % | 31.1 | % | 29.4 | % | ||||||
| Net Debt Plus Preferred / Total Market Capitalization | 57.5 | % | 58.6 | % | 56.3 | % | ||||||
| Net Debt Less Securities / Total Market Capitalization | 25.3 | % | 22.9 | % | 21.7 | % | ||||||
| Net Debt Less Securities Plus Preferred / Total Market Capitalization | 51.6 | % | 50.4 | % | 48.6 | % | ||||||
| Interest Coverage | 4.1 | x | 3.4 | x | 3.5 | x | ||||||
| Fixed Charge Coverage | 1.5 | x | 1.5 | x | 1.5 | x | ||||||
| Net Debt / Adjusted EBITDA | 5.8 | x | 6.7 | x | 6.6 | x | ||||||
| Net Debt Less Securities / Adjusted EBITDA | 4.7 | x | 4.9 | x | 4.9 | x | ||||||
| Net Debt Plus Preferred / Adjusted EBITDA | 10.8 | x | 12.6 | x | 12.6 | x | ||||||
| Net Debt Less Securities Plus Preferred / Adjusted EBITDA | 9.7 | x | 10.8 | x | 10.8 | x | ||||||
| UMH Properties, Inc. | Third Quarter FY 2020 Supplemental Information | 8 |
(in thousands) (unaudited)
| Nine Months Ended | Year Ended | |||||||||||
| 9/30/2020 | 9/30/2019 | 12/31/2019 | ||||||||||
| Debt Outstanding | ||||||||||||
| Mortgages Payable: | ||||||||||||
| Fixed Rate Mortgages | $ | 479,124 | $ | 379,102 | $ | 377,045 | ||||||
| Unamortized Debt Issuance Costs | (6,748 | ) | (3,618 | ) | (3,387 | ) | ||||||
| Mortgages, Net of Unamortized Debt Issuance Costs | $ | 472,376 | $ | 375,484 | $ | 373,658 | ||||||
| Loans Payable: | ||||||||||||
| Unsecured Line of Credit | $ | 15,000 | $ | 5,000 | $ | 15,000 | ||||||
| Other Loans Payable | 19,853 | 71,841 | 69,044 | |||||||||
| Total Loans Before Unamortized Debt Issuance Costs | 34,853 | 76,841 | 84,044 | |||||||||
| Unamortized Debt Issuance Costs | (270 | ) | (360 | ) | (358 | ) | ||||||
| Loans, Net of Unamortized Debt Issuance Costs | $ | 34,583 | $ | 76,481 | $ | 83,686 | ||||||
| Total Debt, Net of Unamortized Debt Issuance Costs | $ | 506,959 | $ | 451,965 | $ | 457,344 | ||||||
| % Fixed/Floating | ||||||||||||
| Fixed | 93.4 | % | 84.5 | % | 82.2 | % | ||||||
| Floating | 6.6 | % | 15.5 | % | 17.8 | % | ||||||
| Total | 100.0 | % | 100.0 | % | 100.0 | % | ||||||
| Weighted Average Interest Rates (1) | ||||||||||||
| Mortgages Payable | 3.81 | % | 4.14 | % | 4.14 | % | ||||||
| Loans Payable | 3.06 | % | 3.82 | % | 3.69 | % | ||||||
| Total Average | 3.76 | % | 4.09 | % | 4.06 | % | ||||||
| Weighted Average Maturity (Years) | ||||||||||||
| Mortgages Payable | 6.3 | 6.2 | 6.0 | |||||||||
(1) Weighted average interest rates do not include the effect of unamortized debt issuance costs.
| UMH Properties, Inc. | Third Quarter FY 2020 Supplemental Information | 9 |
(in thousands) (unaudited)
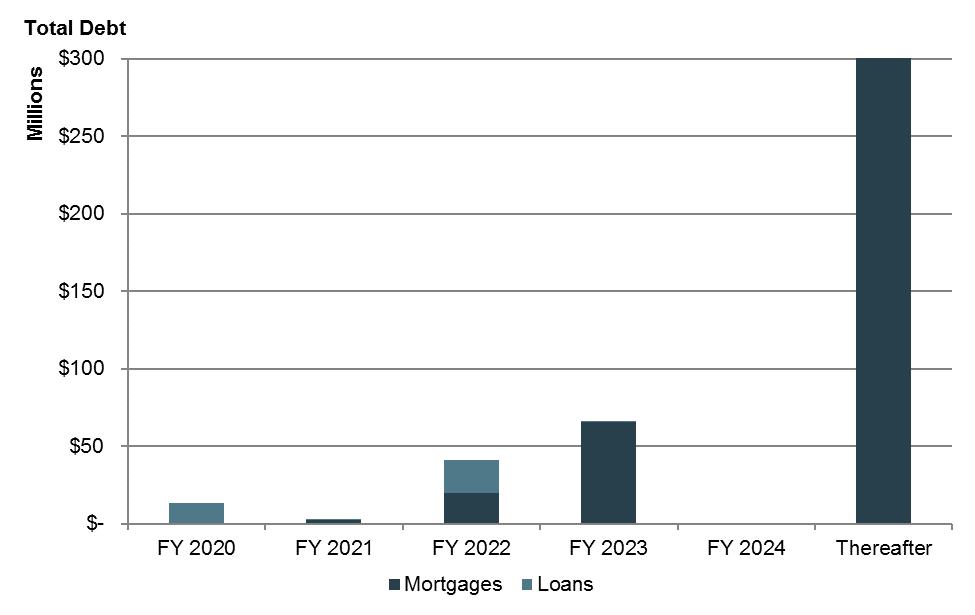
As of 9/30/20:
| Fiscal Year Ended | Mortgages | Loans | Total | % of Total | ||||||||||||
| 2020 | $ | -0- | $ | 13,079 | $ | 13,079 | 2.5 | % | ||||||||
| 2021 | 2,088 | 117 | 2,205 | 0.4 | % | |||||||||||
| 2022 | 19,520 | 21,568 | (1) | 41,088 | 8.0 | % | ||||||||||
| 2023 | 65,673 | 89 | 65,762 | 12.8 | % | |||||||||||
| 2024 | -0- | -0- | -0- | 0.0 | % | |||||||||||
| Thereafter | 391,843 | -0- | 391,843 | 76.3 | % | |||||||||||
| Total Debt Before Unamortized Debt Issuance Cost | 479,124 | 34,853 | 513,977 | 100.0 | % | |||||||||||
| Unamortized Debt Issuance Cost | 6,748 | 270 | 7,018 | |||||||||||||
| Total Debt, Net of Unamortized Debt Issuance Costs | $ | 472,376 | $ | 34,583 | $ | 506,959 | ||||||||||
(1) Includes $15 million balance outstanding on the Company’s Line of Credit due November 2022, with an additional one-year option.
| UMH Properties, Inc. | Third Quarter FY 2020 Supplemental Information | 10 |
Securities Portfolio Performance
(in thousands)
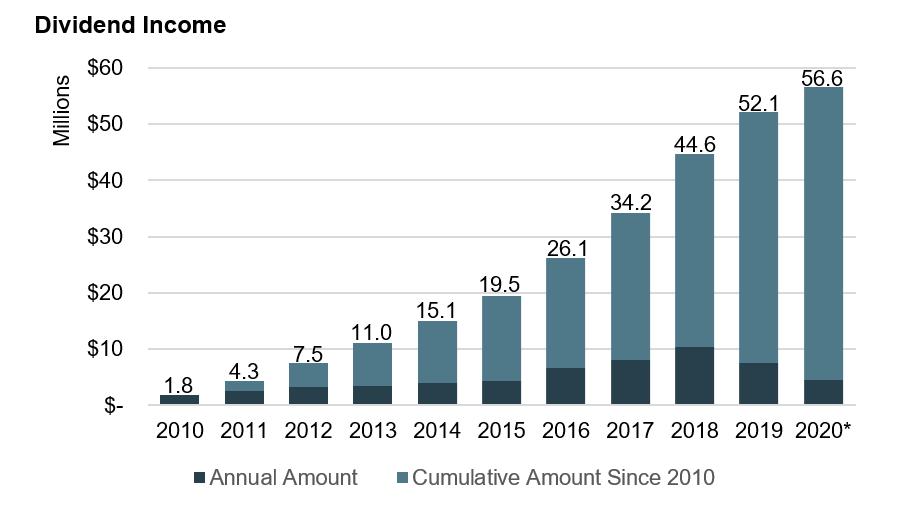
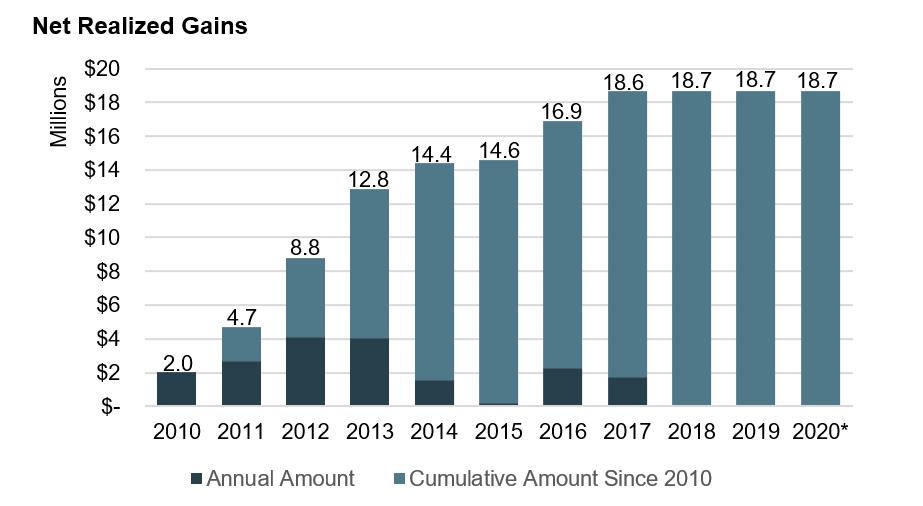
| Year Ended | Securities Available for Sale | Dividend Income | Net Realized Gain on Sale of Securities | Net Realized Gain on Sale of Securities & Dividend Income | ||||||||||||
| 2010 | $ | 28,757 | $ | 1,763 | $ | 2,028 | $ | 3,791 | ||||||||
| 2011 | 43,298 | 2,512 | 2,693 | 5,205 | ||||||||||||
| 2012 | 57,325 | 3,244 | 4,093 | 7,337 | ||||||||||||
| 2013 | 59,255 | 3,481 | 4,056 | 7,537 | ||||||||||||
| 2014 | 63,556 | 4,066 | 1,543 | 5,609 | ||||||||||||
| 2015 | 75,011 | 4,399 | 204 | 4,603 | ||||||||||||
| 2016 | 108,755 | 6,636 | 2,285 | 8,921 | ||||||||||||
| 2017 | 132,964 | 8,135 | 1,747 | 9,882 | ||||||||||||
| 2018 | 99,596 | 10,367 | 20 | 10,387 | ||||||||||||
| 2019 | 116,186 | 7,535 | -0- | 7,535 | ||||||||||||
| 2020* | 85,161 | 4,481 | -0- | 4,481 | ||||||||||||
| $ | 56,619 | $ | 18,669 | $ | 75,288 | |||||||||||
*For the nine months ended September 30, 2020.
| UMH Properties, Inc. | Third Quarter FY 2020 Supplemental Information | 11 |
(unaudited)
| 9/30/2020 | 9/30/2019 | % Change | ||||||||||
| Communities | 124 | 122 | 1.6 | % | ||||||||
| Developed Sites | 23,428 | 23,009 | 1.8 | % | ||||||||
| Occupied | 19,907 | 18,963 | 5.0 | % | ||||||||
| Occupancy % | 85.0 | % | 82.4 | % | 260 bps | |||||||
| Total Rentals | 8,078 | 7,280 | 11.0 | % | ||||||||
| Occupied Rentals | 7,707 | 6,724 | 14.6 | % | ||||||||
| Rental Occupancy % | 95.4 | % | 92.4 | % | 300 bps | |||||||
| Monthly Rent Per Site | $ | 455 | $ | 443 | 2.7 | % | ||||||
| Monthly Rent Per Home Rental Including Site | $ | 781 | $ | 760 | 2.8 | % | ||||||
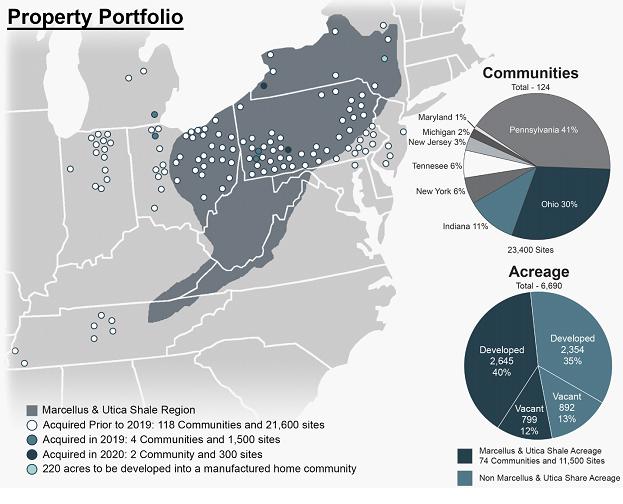
| State | Number | Total Acreage | Developed Acreage | Vacant Acreage | Total Sites | Occupied Sites | Occupancy Percentage | Monthly Rent Per Site | Total Rentals | Occupied Rentals | Rental Occupancy Percentage | Monthly Rent Per Home Rental | ||||||||||||||||||||||||||||||||||||
| (1) | (1) | (2) | ||||||||||||||||||||||||||||||||||||||||||||||
| Indiana | 14 | 1,104 | 870 | 234 | 3,997 | 3,411 | 85.3 | % | $ | 410 | 1,630 | 1,534 | 94.1 | % | $ | 777 | ||||||||||||||||||||||||||||||||
| Maryland | 1 | 77 | 10 | 67 | 62 | 59 | 95.2 | % | $ | 540 | -0- | -0- | N/A | N/A | ||||||||||||||||||||||||||||||||||
| Michigan | 3 | 153 | 153 | -0- | 740 | 622 | 84.1 | % | $ | 449 | 264 | 242 | 91.7 | % | $ | 782 | ||||||||||||||||||||||||||||||||
| New Jersey | 4 | 349 | 187 | 162 | 1,006 | 963 | 95.7 | % | $ | 641 | 45 | 45 | 100.0 | % | $ | 949 | ||||||||||||||||||||||||||||||||
| New York | 8 | 638 | 329 | 309 | 1,339 | 1,139 | 85.1 | % | $ | 544 | 431 | 415 | 96.3 | % | $ | 912 | ||||||||||||||||||||||||||||||||
| Ohio | 36 | 1,781 | 1,315 | 466 | 6,727 | 5,555 | 82.6 | % | $ | 407 | 2,359 | 2,272 | 96.3 | % | $ | 724 | ||||||||||||||||||||||||||||||||
| Pennsylvania | 51 | 2,175 | 1,814 | 361 | 7,781 | 6,514 | 83.7 | % | $ | 473 | 2,511 | 2,399 | 95.5 | % | $ | 801 | ||||||||||||||||||||||||||||||||
| Tennessee | 7 | 413 | 321 | 92 | 1,776 | 1,644 | 92.6 | % | $ | 466 | 838 | 800 | 95.5 | % | $ | 809 | ||||||||||||||||||||||||||||||||
| Total as of | ||||||||||||||||||||||||||||||||||||||||||||||||
| September 30, 2020 | 124 | 6,690 | 4,999 | 1,691 | 23,428 | 19,907 | 85.0 | % | $ | 455 | 8,078 | 7,707 | 95.4 | % | $ | 781 | ||||||||||||||||||||||||||||||||
| (1) Total and Vacant Acreage of 220 for the Mountain View Estates property is included in the above summary. |
| (2) Includes home and site rent charges. |
| UMH Properties, Inc. | Third Quarter FY 2020 Supplemental Information | 12 |
(dollars in thousands except footnotes) (unaudited)
| For Three Months Ended | For Nine Months Ended | |||||||||||||||||||||||||||||||
| 9/30/2020 | 9/30/2019 | Change | %
Change | 9/30/2020 | 9/30/2019 | Change | %
Change | |||||||||||||||||||||||||
| Community Net Operating Income | ||||||||||||||||||||||||||||||||
| Rental and Related Income | $ | 34,631 | $ | 31,900 | $ | 2,731 | 8.6 | % | $ | 101,040 | $ | 93,748 | $ | 7,292 | 7.8 | % | ||||||||||||||||
| Community Operating Expenses (1) | 14,821 | 14,357 | 464 | 3.2 | % | 43,025 | 42,734 | 291 | 0.7 | % | ||||||||||||||||||||||
| Community NOI | $ | 19,810 | $ | 17,543 | $ | 2,267 | 12.9 | % | $ | 58,015 | $ | 51,014 | $ | 7,001 | 13.7 | % | ||||||||||||||||
| As of | ||||||||||||
| 9/30/2020 | 9/30/2019 | Change | ||||||||||
| Total Sites | 21,525 | 21,495 | 0.1 | % | ||||||||
| Occupied Sites | 18,704 | 17,998 | 706 sites, 3.9 | % | ||||||||
| Occupancy % | 86.9 | % | 83.7 | % | 320 bps | |||||||
| Number of Properties | 118 | 118 | N/A | |||||||||
| Total Rentals | 7,762 | 7,048 | 10.1 | % | ||||||||
| Occupied Rentals | 7,430 | 6,576 | 13.0 | % | ||||||||
| Rental Occupancy | 95.7 | % | 93.3 | % | 240 bps | |||||||
| Monthly Rent Per Site | $ | 458 | $ | 445 | 2.9 | % | ||||||
| Monthly Rent Per Home Including Site | $ | 781 | $ | 759 | 2.9 | % | ||||||
Same Property includes all properties owned as of January 1, 2019, with the exception of Memphis Blues.
(1) Excludes a one-time settlement of a utility billing dispute of $375,000 over a prior ten-year period and tree removal costs of $126,000 at two adjacent communities for the nine months ended September 30, 2019.
| UMH Properties, Inc. | Third Quarter FY 2020 Supplemental Information | 13 |
(dollars in thousands)
At Acquisition:
| Year of Acquisition | Number of Communities | Sites | Occupied Sites | Occupancy % | Purchase Price | Price Per Site | Total Acres | |||||||||||||||||||||
| 2017 | 11 | 1,997 | 1,333 | 67 | % | $ | 63,290 | $ | 32 | 602 | ||||||||||||||||||
| 2018 | 6 | 1,615 | 1,271 | 79 | % | $ | 59,093 | $ | 37 | 494 | ||||||||||||||||||
| 2019 | 4 | 1,495 | 935 | 62 | % | $ | 56,237 | $ | 38 | 247 | ||||||||||||||||||
| 2020 | 2 | 310 | 197 | 64 | % | $ | 7,840 | $ | 25 | 48 | ||||||||||||||||||
| 2020 Acquisitions | ||||||||||||||||||||
| Community | Date of Acquisition | State | Number
of Sites | Purchase Price | Number of Acres | Occupancy | ||||||||||||||
| Camelot Woods | July 24, 2020 | PA | 147 | $ | 3,340 | 27 | 56 | % | ||||||||||||
| Lake Erie Estates | September 21, 2020 | NY | 163 | 4,500 | 21 | 71 | % | |||||||||||||
| Total 2020 to Date | 310 | $ | 7,840 | 48 | 64 | % | ||||||||||||||
| UMH Properties, Inc. | Third Quarter FY 2020 Supplemental Information | 14 |
Investors and analysts following the real estate industry utilize funds from operations available to common shareholders (“FFO”), normalized funds from operations available to common shareholders (“Normalized FFO”), community NOI, same property NOI, and earnings before interest, taxes, depreciation, amortization and acquisition costs (“Adjusted EBITDA”), variously defined, as supplemental performance measures. While the Company believes net income (loss) available to common shareholders, as defined by accounting principles generally accepted in the United States of America (U.S. GAAP), is the most appropriate measure, it considers Community NOI, Same Property NOI, Adjusted EBITDA, FFO and Normalized FFO, given their wide use by and relevance to investors and analysts, appropriate supplemental performance measures. FFO, reflecting the assumption that real estate asset values rise or fall with market conditions, principally adjusts for the effects of U.S. GAAP depreciation and amortization of real estate assets. FFO also adjusts for the effects of the change in the fair value of marketable securities and costs associated with the redemption of preferred stock. Normalized FFO reflects the same assumptions as FFO except that it also adjusts for gains and losses realized on marketable securities investments and certain one-time charges. Community NOI and Same Property NOI provides a measure of rental operations and does not factor in depreciation and amortization and non-property specific expenses such as general and administrative expenses. Adjusted EBITDA provides a tool to further evaluate the ability to incur and service debt and to fund dividends and other cash needs. In addition, Community NOI, Same Property NOI, Adjusted EBITDA, FFO and Normalized FFO are commonly used in various ratios, pricing multiples, yields and returns and valuation of calculations used to measure financial position, performance and value.
As used herein, the Company calculates FFO, as defined by The National Association of Real Estate Investment Trusts (“NAREIT”), to be equal to net income (loss) applicable to common shareholders, as defined by U.S. GAAP, excluding extraordinary items as defined by U.S. GAAP, gains or losses from sales of previously depreciated real estate assets, impairment charges related to depreciable real estate assets, and the change in the fair value of marketable securities plus certain non-cash items such as real estate asset depreciation and amortization. Included in the NAREIT FFO White Paper - 2018 Restatement, is an option pertaining to assets incidental to our main business in the calculation of NAREIT FFO to make an election to include or exclude gains and losses on the sale of these assets, such as marketable equity securities, and include or exclude mark-to-market changes in the value recognized on these marketable equity securities. In conjunction with the adoption of the FFO White Paper - 2018 Restatement, for all periods presented, we have elected to exclude the change in the fair value of marketable securities from our FFO calculation. Prior to the adoption of the FFO White Paper – 2018 Restatement, we utilized Core Funds from Operations (Core FFO), which we defined as FFO, excluding the change in the fair value of marketable securities. NAREIT created FFO as a non-GAAP supplemental measure of REIT operating performance.
Normalized FFO is calculated as FFO excluding gains and losses realized on marketable securities investments and certain one-time charges.
Normalized FFO per Diluted Common Share is calculated using diluted weighted shares outstanding of 41.8 million and 41.6 million shares for the three and nine months ended September 30, 2020, respectively, and 40.8 million and 39.8 million for the three and nine months ended September 30, 2019, respectively. Common stock equivalents resulting from stock options in the amount of 426,000 and 348,000 shares for the three and nine months ended September 30, 2020, respectively, and 240,000 and 238,000 shares for the three and nine months ended September 30, 2019, respectively, are included in the diluted weighted shares outstanding. Common stock equivalents for the three and nine months ended September 30, 2020 were excluded from the computation of the Diluted Net Income (Loss) per Share as their effect would be anti-dilutive.
Community NOI is calculated as rental and related income less community operating expenses such as real estate taxes, repairs and maintenance, community salaries, utilities, insurance and other expenses. Community NOI excludes realized gains (losses) on securities transactions.
Same Property NOI is calculated as Community NOI, using all properties owned as of January 1, 2019, with the exception of Memphis Blues.
Adjusted EBITDA is calculated as net income (loss) plus interest expense, franchise taxes, depreciation, and the change in the fair value of marketable securities.
Community NOI, Same Property NOI, Adjusted EBITDA, FFO and Normalized FFO do not represent cash generated from operating activities in accordance with U.S. GAAP and are not necessarily indicative of cash available to fund cash needs, including the repayment of principal on debt and payment of dividends and distributions. Community NOI, Same Property NOI, Adjusted EBITDA, FFO and Normalized FFO should not be considered as substitutes for net loss applicable to common shareholders (calculated in accordance with U.S. GAAP) as a measure of results of operations, or cash flows (calculated in accordance with U.S. GAAP) as a measure of liquidity. Community NOI, Same Property NOI, Adjusted EBITDA, FFO and Normalized FFO as currently calculated by the Company may not be comparable to similarly titled, but variously calculated, measures of other REITs.
| UMH Properties, Inc. | Third Quarter FY 2020 Supplemental Information | 15 |
Press Release Dated November 4, 2020
| FOR IMMEDIATE RELEASE | November 4, 2020 |
| Contact: Nelli Madden | |
| 732-577-9997 |
UMH
PROPERTIES, INC. REPORTS RESULTS FOR THE THIRD QUARTER ENDED
SEPTEMBER 30, 2020
FREEHOLD, NJ, November 4, 2020........ UMH Properties, Inc. (NYSE:UMH) reported Total Income for the quarter ended September 30, 2020 of $43.1 million as compared to $37.3 million for the quarter ended September 30, 2019, representing an increase of 16%. Net Loss Attributable to Common Shareholders amounted to $12.8 million or $0.31 per diluted share for the quarter ended September 30, 2020 as compared to Net Income of $5.6 million or $0.14 per diluted share for the quarter ended September 30, 2019. This decrease was due to the change in fair value of our marketable securities. During the quarter, the securities portfolio experienced an unrealized loss of $6.7 million as compared to an unrealized gain of $9.2 million in the prior year period. In addition, the Company called for redemption of all 3.8 million issued and outstanding shares of its 8.0% Series B Preferred Stock and recognized a preferred share redemption charge of $2.9 million related to the original issuance costs.
Funds from Operations Attributable to Common Shareholders (“FFO”), was $4.5 million or $0.11 per diluted share for the quarter ended September 30, 2020 as compared to $5.8 million or $0.14 per diluted share for the quarter ended September 30, 2019. This decrease in FFO is due to the redemption charge of $2.9 million on the Series B Preferred Stock. Normalized Funds from Operations Attributable to Common Shareholders (“Normalized FFO”), was $7.4 million or $0.18 per diluted share for the quarter ended September 30, 2020, as compared to $6.0 million or $0.15 per diluted share for the quarter ended September 30, 2019.
A summary of significant financial information for the three and nine months ended September 30, 2020 and 2019 is as follows (in thousands except per share amounts):
| For the Three Months Ended | ||||||||
| September 30, | ||||||||
| 2020 | 2019 | |||||||
| Total Income | $ | 43,123 | $ | 37,330 | ||||
| Total Expenses | $ | 35,747 | $ | 32,387 | ||||
| Increase (Decrease) in Fair Value of Marketable Securities | $ | (6,739 | ) | $ | 9,234 | |||
| Net Income (Loss) Attributable to Common Shareholders | $ | (12,747 | ) | $ | 5,622 | |||
| Net Income (Loss) Attributable to Common Shareholders per Diluted Common Share | $ | (0.31 | ) | $ | 0.14 | |||
| FFO (1) | $ | 4,515 | $ | 5,805 | ||||
| FFO (1) per Diluted Common Share | $ | 0.11 | $ | 0.14 | ||||
| Normalized FFO (1) | $ | 7,386 | $ | 6,011 | ||||
| Normalized FFO (1) per Diluted Common Share | $ | 0.18 | $ | 0.15 | ||||
| Diluted Weighted Average Shares Outstanding | 41,421 | 40,754 | ||||||
| UMH Properties, Inc. | Third Quarter FY 2020 Supplemental Information | 16 |
| For the Nine Months Ended | ||||||||
| September 30, | ||||||||
| 2020 | 2019 | |||||||
| Total Income | $ | 120,780 | $ | 108,847 | ||||
| Total Expenses | $ | 100,914 | $ | 94,726 | ||||
| Increase (Decrease) in Fair Value of Marketable Securities | $ | (31,921 | ) | $ | 15,478 | |||
| Net Income (Loss) Attributable to Common Shareholders | $ | (42,350 | ) | $ | 5,999 | |||
| Net Income (Loss) Attributable to Common Shareholders per Diluted Common Share | $ | (1.10 | ) | $ | 0.15 | |||
| FFO (1) | $ | 17,739 | $ | 17,567 | ||||
| FFO (1) per Diluted Common Share | $ | 0.43 | $ | 0.44 | ||||
| Normalized FFO (1) | $ | 20,610 | $ | 18,148 | ||||
| Normalized FFO (1) per Diluted Common Share | $ | 0.50 | $ | 0.46 | ||||
| Diluted Weighted Average Shares Outstanding | 41,275 | 39,830 | ||||||
A summary of significant balance sheet information as of September 30, 2020 and December 31, 2019 is as follows (in thousands):
| September 30, 2020 | December 31, 2019 | |||||||
| Gross Real Estate Investments | $ | 1,079,426 | $ | 1,015,281 | ||||
| Marketable Securities at Fair Value | $ | 85,161 | $ | 116,186 | ||||
| Total Assets | $ | 1,094,744 | $ | 1,025,453 | ||||
| Mortgages Payable, net | $ | 472,376 | $ | 373,658 | ||||
| Loans Payable, net | $ | 34,583 | $ | 83,686 | ||||
| Total Shareholders’ Equity | $ | 464,943 | $ | 546,339 | ||||
Samuel A. Landy, President and CEO, commented on the results of the third quarter of 2020.
“We are pleased to announce another solid quarter of operating results. During the quarter, we:
| ● | Increased Rental and Related Income by 10%; | |
| ● | Increased Community Net Operating Income (“NOI”) by 17%; | |
| ● | Improved our Operating Expense ratio by 280 basis points to 44.7%; | |
| ● | Increased Same Property NOI by 13%; | |
| ● | Increased Same Property Occupancy by 706 sites from 83.7% to 86.9% or 320 basis points; | |
| ● | Increased our rental home portfolio by 684 homes to approximately 8,100 total rental homes, representing an increase of 9% from yearend 2019; | |
| ● | Increased rental home occupancy by 310 basis points from 92.3% at yearend 2019 to 95.4% at quarter end; | |
| ● | Increased Sales of Manufactured Homes by 54%; | |
| ● | Acquired two communities containing approximately 310 homesites for a total cost of approximately $7.8 million; | |
| ● | Completed the financing of 28 unencumbered communities with Fannie Mae for proceeds of approximately $106 million, with a maturity of 10 years and a 30-year amortization at a fixed rate of 2.62%; | |
| ● | Sold 117,000 shares of Common Stock at a weighted average price of $14.54 per share, generating gross proceeds of $1.7 million and net proceeds of $1.5 million, after offering expenses; |
| UMH Properties, Inc. | Third Quarter FY 2020 Supplemental Information | 17 |
| ● | Sold 134,000 shares of Series C Preferred Stock at a weighted average price of $24.96 per share and 213,000 shares of Series D Preferred Stock at a weighted average price of $24.78 per share, generating total gross proceeds of $8.6 million and total net proceeds of $8.3 million, after offering expenses; | |
| ● | Reduced the weighted average interest rate on our mortgages payable from 4.1% to 3.8% year over year; | |
| ● | Reduced our Net Debt to Adjusted EBITDA from 6.6x at year end to 5.8x at quarter end; | |
| ● | Subsequent to quarter end, sold 583,000 shares of Series D Preferred Stock at a weighted average price of $24.78 per share through the New Preferred ATM Program, generating gross proceeds of $14.4 million and net proceeds of $14.2 million, after offering expenses; and, | |
| ● | Subsequent to quarter end, redeemed all 3.8 million issued and outstanding shares of our 8.0% Series B Cumulative Redeemable Preferred Stock for $96.1 million.” |
Mr. Landy further stated, “UMH continues to achieve excellent results despite the COVID-19 pandemic. Normalized FFO for the quarter increased to $0.18 per share representing an increase of 20% over the prior year period.”
“This FFO growth was driven by solid fundamental performance in our core business. Same property occupancy increased 320 basis points to 86.9%. Year over year, we added almost 700 rental homes to our same property portfolio, increasing rental home occupancy to 95.4%. Our improved occupancy paired with reduced expenses resulted in same property NOI growth of 13%. This is the fourth quarter in a row that we have reported double digit same property NOI growth.”
“Our sales results also contributed to our FFO growth. Sales for the quarter were up 54% generating a net profit of $640,000 for the quarter. We continue to experience pent up sales demand.”
“UMH also had a busy quarter on the acquisition front. During the quarter, we closed on the acquisition of two communities containing 310 homesites, with a weighted average occupancy rate of 64%, for approximately $7.8 million. These communities are located in markets where we have experienced excellent demand for both sales and rental units. We anticipate strong returns at these value-add communities as we are able to execute on our long-term business plan.”
“Most importantly, we pioneered two loan products which will allow us to reduce our cost of capital going forward. We closed on the financing of some of our free and clear communities generating proceeds of $106 million at an interest rate of 2.62%. These communities did not previously qualify for GSE financing because of their rental home percentages. The access to low cost debt on properties with significant percentages of rental homes solidifies our business plan. Subsequent to quarter end, we used a portion of this capital to redeem our $95 million of Series B 8% Preferred stock. This redemption will generate over $5 million, or approximately $0.12 per share, of additional FFO annually.
“We also entered into a line of credit utilizing our rental homes and the income derived from them as collateral. The rate on this line is WSJ prime + 25 basis points. Access to low cost debt on rental homes previously did not exist.”
“UMH continues to make strides in all aspects of our business plan. We are pleased that we covered our $0.18 dividend purely on our current operations. The successes that we have had on the financing front will further improve our FFO metrics in 2021.”
UMH Properties, Inc. will host its Third Quarter 2020 Financial Results Webcast and Conference Call on Thursday, November 5, 2020 at 10:00 a.m. Eastern Time. Senior management will discuss the results, current market conditions and future outlook on the call.
| UMH Properties, Inc. | Third Quarter FY 2020 Supplemental Information | 18 |
The Company’s 2020 third quarter financial results being released herein will be available on the Company’s website at www.umh.reit in the “Financial Information and Filings” section.
To participate in the webcast, select the microphone icon found on the homepage www.umh.reit to access the call. Interested parties can also participate via conference call by calling toll free 877-513-1898 (domestically) or 412-902-4147 (internationally).
The replay of the conference call will be available at 12:00 p.m. Eastern Time on Thursday, November 5, 2020. It will be available until February 1, 2021 and can be accessed by dialing toll free 877-344-7529 (domestically) and 412-317-0088 (internationally) and entering the passcode 10147928. A transcript of the call and the webcast replay will be available at the Company’s website, www.umh.reit.
UMH Properties, Inc., which was organized in 1968, is a public equity REIT that owns and operates 124 manufactured home communities containing approximately 23,400 developed homesites. These communities are located in New Jersey, New York, Ohio, Pennsylvania, Tennessee, Indiana, Michigan and Maryland. In addition, the Company owns a portfolio of REIT securities.
Certain statements included in this press release which are not historical facts may be deemed forward-looking statements within the meaning of the Private Securities Litigation Reform Act of 1995. Any such forward-looking statements are based on the Company’s current expectations and involve various risks and uncertainties. Although the Company believes the expectations reflected in any forward-looking statements are based on reasonable assumptions, the Company can provide no assurance those expectations will be achieved. The risks and uncertainties that could cause actual results or events to differ materially from expectations are contained in the Company’s annual report on Form 10-K and described from time to time in the Company’s other filings with the SEC. The Company undertakes no obligation to publicly update or revise any forward-looking statements whether as a result of new information, future events, or otherwise.
Note:
| (1) | Non-GAAP Information: We assess and measure our overall operating results based upon an industry performance measure referred to as Funds from Operations Attributable to Common Shareholders (“FFO”), which management believes is a useful indicator of our operating performance. FFO is used by industry analysts and investors as a supplemental operating performance measure of a REIT. FFO, as defined by The National Association of Real Estate Investment Trusts (“NAREIT”), represents net income (loss) attributable to common shareholders, as defined by accounting principles generally accepted in the United States of America (“U.S. GAAP”), excluding extraordinary items, as defined under U.S. GAAP, gains or losses from sales of previously depreciated real estate assets, impairment charges related to depreciable real estate assets, and the change in the fair value of marketable securities plus certain non-cash items such as real estate asset depreciation and amortization. Included in the NAREIT FFO White Paper - 2018 Restatement, is an option pertaining to assets incidental to our main business in the calculation of NAREIT FFO to make an election to include or exclude gains and losses on the sale of these assets, such as marketable equity securities and include or exclude mark-to-market changes in the value recognized on these marketable equity securities. In conjunction with the adoption of the FFO White Paper - 2018 Restatement, for all periods presented, we have elected to exclude the change in the fair value of marketable securities from our FFO calculation. Prior to the adoption of the FFO White Paper – 2018 Restatement, we utilized Core Funds from Operations (Core FFO), which we defined as FFO, excluding the change in the fair value of marketable securities. NAREIT created FFO as a non-U.S. GAAP supplemental measure of REIT operating performance. We define Normalized Funds from Operations Attributable to Common Shareholders (“Normalized FFO”), as FFO, excluding gains and losses realized on marketable securities investments and certain one-time charges. FFO and Normalized FFO should be considered as supplemental measures of operating performance used by REITs. FFO and Normalized FFO exclude historical cost depreciation as an expense and may facilitate the comparison of REITs which have a different cost basis. However, other REITs may use different methodologies to calculate FFO and Normalized FFO and, accordingly, our FFO and Normalized FFO may not be comparable to all other REITs. The items excluded from FFO and Normalized FFO are significant components in understanding the Company’s financial performance. | |
| FFO and Normalized FFO (i) do not represent Cash Flow from Operations as defined by U.S. GAAP; (ii) should not be considered as alternatives to net income (loss) as a measure of operating performance or to cash flows from operating, investing and financing activities; and (iii) are not alternatives to cash flow as a measure of liquidity. |
| UMH Properties, Inc. | Third Quarter FY 2020 Supplemental Information | 19 |
The reconciliation of the Company’s U.S. GAAP net loss to the Company’s FFO and Normalized FFO for the three and nine months ended September 30, 2020 and 2019 are calculated as follows (in thousands except footnotes):
| Three Months Ended | Nine Months Ended | |||||||||||||||
| 9/30/20 | 9/30/19 | 9/30/20 | 9/30/19 | |||||||||||||
| Net Income (Loss) Attributable to Common Shareholders | $ | (12,747 | ) | $ | 5,622 | $ | (45,350 | ) | $ | 5,999 | ||||||
| Depreciation Expense | 10,492 | 9,390 | 30,991 | 27,010 | ||||||||||||
| Loss on Sales of Depreciable Assets | 31 | 27 | 177 | 36 | ||||||||||||
| (Increase) Decrease in Fair Value of Marketable Securities (2) | 6,739 | (9,234 | ) | 31,921 | (15,478 | ) | ||||||||||
| FFO Attributable to Common Shareholders | 4,515 | 5,805 | 17,739 | 17,567 | ||||||||||||
| Redemption of Preferred Stock | 2,871 | -0- | 2,871 | -0- | ||||||||||||
| Non-Recurring Other Expense (3) | -0- | 206 | -0- | 581 | ||||||||||||
| Normalized FFO Attributable to Common Shareholders | $ | 7,386 | $ | 6,011 | $ | 20,610 | $ | 18,148 | ||||||||
The diluted weighted shares outstanding used in the calculation of FFO per Diluted Common Share and Normalized FFO per Diluted Common Share were 41.8 million and 41.6 million shares for the three and nine months ended September 30, 2020, respectively, and 40.8 million and 39.8 million shares for the three and nine months ended September 30, 2019, respectively. Common stock equivalents resulting from stock options in the amount of 426,000 and 348,000 shares for the three and nine months ended September 30, 2020, respectively, and 240,000 and 238,000 shares for the three and nine months ended September 30, 2019, respectively, are included in the diluted weighted shares outstanding. Common stock equivalents for the three and nine months ended September 30, 2020 were excluded from the computation of the Diluted Net Income (Loss) per Share as their effect would be anti-dilutive.
The following are the cash flows provided (used) by operating, investing and financing activities for the nine months ended September 30, 2020 and 2019 (in thousands):
| 2020 | 2019 | |||||||
| Operating Activities | $ | 50,341 | $ | 25,862 | ||||
| Investing Activities | (77,644 | ) | (99,618 | ) | ||||
| Financing Activities | 76,994 | 79,146 | ||||||
| (2) | Represents change in unrealized gain (loss) in marketable securities which is included in the Consolidated Statements of Income (Loss). (Increase) Decrease in Fair Value of Marketable Securities, if any, were previously recorded in Core FFO. | |
| (3) | Consists of utility billing dispute over a prior 10-year period ($376,000), emergency windstorm tree removal expenses in two adjacent communities ($126,000) and costs associated with acquisitions not completed ($80,00) in 2019. |
# # # #

| UMH Properties, Inc. | Third Quarter FY 2020 Supplemental Information | 20 |