Attached files
| file | filename |
|---|---|
| EX-32 - UMH PROPERTIES, INC. | ex32.htm |
| EX-31.2 - UMH PROPERTIES, INC. | ex31-2.htm |
| EX-31.1 - UMH PROPERTIES, INC. | ex31-1.htm |
| EX-23 - UMH PROPERTIES, INC. | ex23.htm |
| EX-21 - UMH PROPERTIES, INC. | ex21.htm |
| EX-12 - UMH PROPERTIES, INC. | ex12.htm |
UNITED STATES
SECURITIES AND EXCHANGE COMMISSION
Washington, D.C. 20549
FORM 10-K
| [X] | ANNUAL REPORT PURSUANT TO SECTION 13 OR 15 (d) OF THE SECURITIES EXCHANGE ACT OF 1934 |
| For the fiscal year ended December 31, 2017 |
| [ ] | TRANSITION REPORT PURSUANT TO SECTION 13 OR 15 (d) OF THE SECURITIES EXCHANGE ACT OF 1934 |
| For the transition period to |
Commission File Number 001-12690
UMH Properties, Inc.
(Exact name of registrant as specified in its charter)
| Maryland | 22-1890929 | |
| (State
or other jurisdiction of incorporation or organization) |
(I.R.S.
Employer identification number) |
| 3499 Route 9, Suite 3C, Freehold, New Jersey | 07728 | |
| (Address of principal executive offices) | (Zip code) |
Registrant’s telephone number, including area code (732) 577-9997
Securities registered pursuant to Section 12(b) of the Act:
Common Stock $.10 par value-New York Stock Exchange
8.0% Series B Cumulative Redeemable Preferred Stock $.10 par value per share, $25 liquidation value per share – New York Stock Exchange
6.75% Series C Cumulative Redeemable Preferred Stock $.10 par value per share, $25 liquidation value per share – New York Stock Exchange
6.375% Series D Cumulative Redeemable Preferred Stock $.10 par value per share, $25 liquidation value per share – New York Stock Exchange
Securities registered pursuant to Section 12(g) of the Act: None
Indicate by check mark if the registrant is a well-known seasoned issuer, as defined in Rule 405 of the Securities Act. [ ] Yes [X] No
Indicate by check mark if the registrant is not required to file reports pursuant to Section 13 or Section 15(d) of the Act. [ ] Yes [X] No
Indicate by check mark whether the registrant (1) has filed all reports required to be filed by Section 13 or 15(d) of the Securities Exchange Act of 1934 during the preceding 12 months (or for such shorter period that the registrant was required to file such reports), and (2) has been subject to such filing requirements for the past 90 days. [X] Yes [ ] No
Indicate by check mark whether the registrant has submitted electronically and posted on its corporate website, if any, every Interactive Data File required to be submitted and posted pursuant to Rule 405 of Regulation S-T (§232.405 of this chapter) during the preceding 12 months (or for such shorter period that the registrant was required to submit and post such files). [X] Yes No [ ]
Indicate by check if disclosure of delinquent filers pursuant to Item 405 of Regulation S-K is not contained herein, and will not be contained, to the best of registrant’s knowledge, in definitive proxy or information statements incorporated by reference in Part III of this Form 10-K or any amendment to this Form 10-K [X].
Indicate by check mark whether the registrant is a large accelerated filer, an accelerated filer, a non-accelerated filer, a smaller reporting company, or emerging growth company. See the definitions of “large accelerated filer,” “accelerated filer,” “smaller reporting company,” and “emerging growth company” in Rule 12b-2 of the Exchange Act.
| Large accelerated filer | [ ] | Accelerated filer | [X] | ||||
| Non-accelerated filer | [ ] | (Do not check if a smaller | Smaller reporting company | [ ] | |||
| reporting company) | Emerging growth company | [ ] | |||||
If an emerging growth company, indicate by check mark if the registrant has elected not to use the extended transition period for complying with any new or revised financial accounting standards provided pursuant to Section 13(a) of the Exchange Act. [ ]
Indicate by check mark whether the registrant is a shell company (as defined in Rule 12b-2 of the Act). [ ] Yes [X] No
Based upon the assumption that directors and executive officers of the registrant are not affiliates of the registrant, the aggregate market value of the voting stock of the registrant held by nonaffiliates of the registrant at June 30, 2017 was $570,225,929. Presuming that such directors and executive officers are affiliates of the registrant, the aggregate market value of the voting stock of the registrant held by nonaffiliates of the registrant at June 30, 2017 was $522,718,594.
The number of shares outstanding of issuer’s common stock as of February 28, 2018 was 36,070,968 shares.
Documents Incorporated by Reference:
-Part III incorporates certain information by reference from the Registrant’s proxy statement for the 2018 annual meeting of stockholders, which will be filed no later than 120 days after the close of the Registrant’s fiscal year ended December 31, 2017.
-Exhibits incorporated by reference are listed in Part IV; Item 15 (a) (3).
TABLE OF CONTENTS
| -2- |
General Development of Business
UMH Properties, Inc. (“UMH”), together with its predecessors and consolidated subsidiaries, are referred to herein as “we”, “us”, “our”, or “the Company”, unless the context requires otherwise.
UMH is a self-administered and self-managed qualified real estate investment trust (“REIT”) under Sections 856-860 of the Internal Revenue Code (the “Code”). The Company had elected REIT status effective January 1, 1992 and intends to maintain its qualification as a REIT in the future. As a qualified REIT, with limited exceptions, the Company will not be taxed under Federal and certain state income tax laws at the corporate level on taxable income that it distributes to its shareholders. For special tax provisions applicable to REITs, refer to Sections 856-860 of the Code.
The Company was incorporated in the state of New Jersey in 1968. On September 29, 2003, the Company changed its state of incorporation from New Jersey to Maryland by merging with and into a Maryland corporation.
Narrative Description of Business
The Company’s primary business is the ownership and operation of manufactured home communities – leasing manufactured homesites to private manufactured home owners. The Company also leases homes to residents, and through its wholly-owned taxable REIT subsidiary, UMH Sales and Finance, Inc. (“S&F”), conducts manufactured home sales in its communities.
As of December 31, 2017, the Company owns and operates 112 manufactured home communities containing approximately 20,000 developed homesites. These communities are located in New Jersey, New York, Ohio, Pennsylvania, Tennessee, Indiana, Michigan and Maryland.
A manufactured home community is designed to accommodate detached, single-family manufactured homes. These manufactured homes are produced off-site by manufacturers and installed on sites within the communities. These homes may be improved with the addition of features constructed on-site, including garages, screened rooms and carports. Manufactured homes are available in a variety of designs and floor plans, offering many amenities and custom options. Each manufactured home owner leases the site on which the home is located from the Company. The Company owns the underlying land, utility connections, streets, lighting, driveways, common area amenities and other capital improvements and are responsible for enforcement of community guidelines and maintenance.
Manufactured homes are accepted by the public as a viable and economically attractive alternative to common stick-built single-family housing. The affordability of the modern manufactured home makes it a very attractive housing alternative. Depending on the region of the country, construction cost per square foot for a new manufactured home averages anywhere from 10 to 50 percent less than a comparable site-built home, excluding the cost of land. This is due to a number of factors, including volume purchase discounts and inventory control of construction materials and control of all aspects of the construction process, which is generally a more efficient and stream-lined process as compared to a site-built home.
Modern residential land lease communities are similar to typical residential subdivisions containing central entrances, paved well-lit streets, curbs and gutters. Generally, modern manufactured home communities contain buildings for recreation, green areas, and other common area facilities, all of which are the property of the community owner. In addition to such general improvements, certain manufactured home communities include recreational improvements such as swimming pools, tennis courts and playgrounds. Municipal water and sewer services are available in some manufactured home communities, while other communities supply these facilities on-site.
Typically, our leases are on an annual or month-to-month basis, renewable upon the consent of both parties. The community manager interviews prospective residents, collects rent and finance payments, ensures compliance with community regulations, maintains public areas and community facilities and is responsible for the overall appearance of the community. The homeowner is responsible for the maintenance of the home and leased site. As a result, our capital expenditures tend to be less significant relative to multi-family rental apartments. Manufactured home communities produce predictable income streams and provide protection from inflation due to the ability to annually increase rents.
| -3- |
Many of our communities compete with other manufactured home community properties located in the same or nearby markets that are owned and operated by other companies in our business. We generally monitor the rental rates and other terms being offered by our competitors and consider this information as a factor in determining our own rental rates. In addition to competing with other manufactured home community properties, our communities also compete with alternative forms of housing (such as apartments and single-family homes).
In connection with the operation of its communities, UMH also leases homes to prospective tenants. As of December 31, 2017, UMH owned a total of 5,600 rental homes, representing approximately 28% of its developed homesites. These rental homes are owned by the Company and rented to residents. The Company engages in the rental of manufactured homes primarily in areas where the communities have existing vacancies. The rental homes produce income from both the home and the site which might otherwise be non-income producing. The Company sells the rental homes when the opportunity arises.
Inherent in the operation of a manufactured home community is the development, redevelopment, and expansion of our communities. The Company sells and finances the sale of manufactured homes in our communities through S&F. S&F was established to potentially enhance the value of our communities. The home sales business is operated like other homebuilders with sales centers, model homes, an inventory of completed homes and the ability to supply custom designed homes based upon the requirements of the new homeowners.
Investment and Other Policies
The Company may invest in improved and unimproved real property and may develop unimproved real property. Such properties may be located throughout the United States, but the Company has concentrated on the Northeast. Since 2010, we have tripled the size of our property portfolio from 28 communities with approximately 6,800 developed homesites to 112 communities with over 20,000 developed homesites. We are focused on acquiring communities with significant upside potential and leveraging our expertise to build long-term capital appreciation.
The Company seeks to finance acquisitions with the most appropriate available source of capital, including purchase money mortgages or other financing, which may be first liens, wraparound mortgages or subordinated indebtedness, sales of investments, and issuance of additional equity securities. In connection with its ongoing activities, the Company may issue notes, mortgages or other senior securities. The Company intends to use both secured and unsecured lines of credit.
The Company may issue securities for property; however, this has not occurred to date. The Company may repurchase or reacquire its shares from time to time if, in the opinion of the Board of Directors, such acquisition is advantageous to the Company. No shares were repurchased or reacquired during 2017 and, as of December 31, 2017, the Company does not own any of its own shares.
The Company also owns a portfolio of marketable REIT securities, which the Company generally limits to no more than approximately 20% of its undepreciated assets (which is the Company’s total assets excluding accumulated depreciation). These liquid real estate holdings provide diversification, additional liquidity and income, and serves as a proxy for real estate when more favorable risk adjusted returns are not available. The Company, from time to time, may purchase these securities on margin when the interest and dividend yields exceed the cost of funds. As of December 31, 2017, the Company had borrowings of $37,157,467 under its margin line at 2.0% interest. The REIT securities portfolio is subject to risk arising from adverse changes in market rates and prices, primarily interest rate risk and market price risk relating to equity securities. From time to time, the Company may use derivative instruments to mitigate interest rate risk; however, this has not occurred during any periods presented. At December 31, 2017 and 2016, the Company had $132,964,276 and $108,755,172, respectively, of securities available for sale. Included in these securities are Preferred Stock of $5,377,522 and $13,028,200 at December 31, 2017 and 2016, respectively. The realized net gain on securities available for sale at December 31, 2017 and 2016 amounted to $1,747,528 and $2,285,301, respectively. The unrealized net gain on securities available for sale at December 31, 2017 and 2016 amounted to $11,519,582 and $16,717,171, respectively.
| -4- |
Regulations, Insurance and Property Maintenance and Improvement
Manufactured home communities are subject to various laws, ordinances and regulations, including regulations relating to recreational facilities such as swimming pools, clubhouses and other common areas, and regulations relating to operating water and wastewater treatment facilities at certain of our communities. We believe that each community has all material operating permits and approvals.
Our properties are insured against risks that may cause property damage and business interruption including events such as fire, business interruption, general liability and if applicable, flood. Our insurance policies contain deductible requirements, coverage limits and particular exclusions. It is the policy of the Company to maintain adequate insurance coverage on all of our properties; and, in the opinion of management, all of our properties are adequately insured. We also obtain title insurance insuring fee title to the properties in an aggregate amount which we believe to be adequate.
It is the policy of the Company to properly maintain, modernize, expand and make improvements to its properties when required. The Company anticipates that renovation expenditures with respect to its present properties during 2018 will be approximately $10 million.
Number of Employees
As of February 28, 2018, the Company had approximately 340 employees, including Officers. During the year, the Company hires approximately 50 part-time and full-time temporary employees as grounds keepers, lifeguards, and for emergency repairs.
Segment Reporting and Financial Information
Management views the Company as a single segment based on its method of internal reporting in addition to its allocation of capital and resources. For required financial information related to our operations and assets, please refer to our consolidated financial statements, including the notes thereto, included in Item 8 “Financial Statements and Supplementary Data” in this Annual Report.
Available Information
Additional information about the Company can be found on the Company’s website which is located at www.umh.reit. Information contained on or hyperlinked from our website is not incorporated by reference into and should not be considered part of this Annual Report on Form 10-K or our other filings with the Securities and Exchange Commission (“SEC”). The Company makes available, free of charge, on or through its website, annual reports on Form 10-K, quarterly reports on Form 10-Q, current reports on Form 8-K and amendments to those reports filed or furnished pursuant to Section 13(a) or 15(d) of the Securities Exchange Act of 1934, as amended, as soon as reasonably practicable after we electronically file such material with, or furnish it to, the SEC. You can also read and copy any materials the Company files with the SEC at its Public Reference Room at 100 F Street, NE, Washington, DC 20549 (1-800-SEC-0330). The SEC maintains an Internet site (http://www.sec.gov) that contains reports, proxy and information statements, and other information regarding issuers that file electronically with the SEC.
Our business faces many risks. The following risk factors may not be the only risks we face but address what we believe may be the material risks concerning our business at this time. If any of the risks discussed in this report were to occur, our business, prospects, financial condition, results of operation and our ability to service our debt and make distributions to our shareholders could be materially and adversely affected and the market price per share of our stock could decline significantly. Some statements in this report, including statements in the following risk factors, constitute forward-looking statements. Please refer to the section entitled “Cautionary Statement Regarding Forward-Looking Statements.”
| -5- |
General economic conditions and the concentration of our properties in New Jersey, New York, Ohio, Pennsylvania, Tennessee, Indiana, Michigan and Maryland may affect our ability to generate sufficient revenue. The market and economic conditions in our current markets may significantly affect manufactured home occupancy or rental rates. Occupancy and rental rates, in turn, may significantly affect our revenues, and if our communities do not generate revenues sufficient to meet our operating expenses, including debt service and capital expenditures, our cash flow and ability to pay or refinance our debt obligations could be adversely affected. As a result of the geographic concentration of our properties in New Jersey, New York, Ohio, Pennsylvania, Tennessee, Indiana, Michigan and Maryland, we are exposed to the risks of downturns in the local economy or other local real estate market conditions which could adversely affect occupancy rates, rental rates, and property values in these markets.
Other factors that may affect general economic conditions or local real estate conditions include:
| ● | the national and local economic climate, including that of the energy-market dependent Marcellus and Utica Shale regions, may be adversely impacted by, among other factors, plant closings, and industry slowdowns; | |
| ● | local real estate market conditions such as the oversupply of manufactured homesites or a reduction in demand for manufactured homesites in an area; | |
| ● | the number of repossessed homes in a particular market; | |
| ● | the lack of an established dealer network; | |
| ● | the rental market which may limit the extent to which rents may be increased to meet increased expenses without decreasing occupancy rates; | |
| ● | the safety, convenience and attractiveness of our properties and the neighborhoods where they are located; | |
| ● | zoning or other regulatory restrictions; | |
| ● | competition from other available manufactured home communities and alternative forms of housing (such as apartment buildings and single-family homes); | |
| ● | our ability to provide adequate management, maintenance and insurance; | |
| ● | increased operating costs, including insurance premiums, real estate taxes and utilities; and | |
| ● | the enactment of rent control laws or laws taxing the owners of manufactured homes. |
Our income would also be adversely affected if tenants were unable to pay rent or if sites were unable to be rented on favorable terms. If we were unable to promptly relet or renew the leases for a significant number of sites, or if the rental rates upon such renewal or reletting were significantly lower than expected rates, then our business and results of operations could be adversely affected. In addition, certain expenditures associated with each property (such as real estate taxes and maintenance costs) generally are not reduced when circumstances cause a reduction in income from the property.
| -6- |
We may be unable to compete with our larger competitors for acquisitions, which may increase prices for communities. The real estate business is highly competitive. We compete for manufactured home community investments with numerous other real estate entities, such as individuals, corporations, REITs and other enterprises engaged in real estate activities. In many cases, the competing concerns may be larger and better financed than we are, making it difficult for us to secure new manufactured home community investments. Competition among private and institutional purchasers of manufactured home community investments has resulted in increases in the purchase price paid for manufactured home communities and consequently higher fixed costs. To the extent we are unable to effectively compete in the marketplace, our business may be adversely affected.
We may not be able to integrate or finance our acquisitions and our acquisitions may not perform as expected. We acquire and intend to continue to acquire manufactured home communities on a select basis. Our acquisition activities and their success are subject to risks, including the following:
| ● | if we enter into an acquisition agreement for a property, it is usually subject to customary conditions to closing, including completion of due diligence investigations to our satisfaction, which may not be satisfied; | |
| ● | we may be unable to finance acquisitions on favorable terms; | |
| ● | acquired properties may fail to perform as expected; | |
| ● | the actual costs of repositioning or redeveloping acquired properties may be higher than our estimates; | |
| ● | acquired properties may be located in new markets where we face risks associated with a lack of market knowledge or understanding of the local economy, lack of business relationships in the area and unfamiliarity with local governmental and permitting procedures; and | |
| ● | we may be unable to quickly and efficiently integrate new acquisitions, particularly acquisitions of portfolios of properties, into our existing operations. |
If any of the above were to occur, our business and results of operations could be adversely affected.
In addition, we may acquire properties subject to liabilities and without any recourse, or with only limited recourse, with respect to unknown liabilities. As a result, if a liability were to be asserted against us based upon ownership of those properties, we might have to pay substantial sums to settle it, which could adversely affect our cash flow.
We may be unable to accurately estimate and anticipate costs and timing associated with expansion activities. We periodically consider expansion of communities. Our expansion activities are subject to risks such as: construction costs exceeding original estimates, construction and lease-up interruptions resulting in increased construction costs, and lower than anticipated occupancy and rental rates causing a property to be unprofitable or less profitable than prior to the expansion.
We may be unable to sell properties when appropriate because real estate investments are illiquid. Real estate investments generally cannot be sold quickly and, therefore, will tend to limit our ability to vary our property portfolio promptly in response to changes in economic or other conditions. In addition, the Code limits our ability to sell our properties. The inability to respond promptly to changes in the performance of our property portfolio could adversely affect our financial condition and ability to service our debt and make distributions to our stockholders.
Our ability to sell manufactured homes may be affected by various factors, which may in turn adversely affect our profitability. S&F operates in the manufactured home market offering homes for sale to tenants and prospective tenants of our communities. The market for the sale of manufactured homes may be adversely affected by the following factors:
| ● | downturns in economic conditions which adversely impact the housing market; | |
| ● | an oversupply of, or a reduced demand for, manufactured homes; |
| -7- |
| ● | the ability of manufactured home manufacturers to adapt to change in the economic climate and the availability of units from these manufacturers; | |
| ● | the difficulty facing potential purchasers in obtaining affordable financing as a result of heightened lending criteria; and | |
| ● | an increase or decrease in the rate of manufactured home repossessions which provide aggressively priced competition to new manufactured home sales. |
Any of the above listed factors could adversely impact our rate of manufactured home sales, which would result in a decrease in profitability.
Licensing laws and compliance could affect our profitability. We are subject to the Secure and Fair Enforcement for Mortgage Licensing Act of 2008 (“SAFE Act”), which requires that we obtain appropriate licenses pursuant to the Nationwide Mortgage Licensing System & Registry in each state where we conduct business. There are extensive federal and state requirements mandated by the SAFE Act and other laws pertaining to financing, including the Dodd-Frank Wall Street Reform and Consumer Protection Act (“Dodd-Frank Act”), and there can be no assurance that we will obtain or renew our SAFE Act licenses, which could result in fees and penalties and have an adverse impact on our ability to continue with our home financing activities.
Costs associated with taxes and regulatory compliance may reduce our revenue. We are subject to significant regulation that inhibits our activities and may increase our costs. Local zoning and use laws, environmental statutes and other governmental requirements may restrict expansion, rehabilitation and reconstruction activities. These regulations may prevent us from taking advantage of economic opportunities. Legislation such as the Americans with Disabilities Act may require us to modify our properties at a substantial cost and noncompliance could result in the imposition of fines or an award of damages to private litigants. Future legislation may impose additional requirements. We cannot predict what requirements may be enacted or amended or what costs we will incur to comply with such requirements. Costs resulting from changes in real estate laws, income taxes, service or other taxes may adversely affect our funds from operations and our ability to pay or refinance our debt. Similarly, changes in laws increasing the potential liability for environmental conditions existing on properties or increasing the restrictions on discharges or other conditions may result in significant unanticipated expenditures, which would adversely affect our business and results of operations.
Laws and regulations also govern the provision of utility services. Such laws regulate, for example, how and to what extent owners or operators of property can charge renters for provision of utilities. Such laws can also regulate the operations and performance of utility systems and may impose fines and penalties on real property owners or operators who fail to comply with these requirements. The laws and regulations may also require capital investment to maintain compliance.
Rent control legislation may harm our ability to increase rents. State and local rent control laws in certain jurisdictions may limit our ability to increase rents and to recover increases in operating expenses and the costs of capital improvements. Currently, rent control affects only two of our manufactured home communities, both of which are in New Jersey, and has resulted in slower growth of earnings from these properties. However, we may purchase additional properties in markets that are either subject to rent control or in which rent-limiting legislation exists or may be enacted.
| -8- |
Environmental liabilities could affect our profitability. Under various federal, state and local laws, ordinances and regulations, an owner or operator of real estate is liable for the costs of removal or remediation of certain hazardous substances at, on, under or in such property, as well as certain other potential costs relating to hazardous or toxic substances. Such laws often impose such liability without regard to whether the owner knew of, or was responsible for, the presence of such hazardous substances. A conveyance of the property, therefore, does not relieve the owner or operator from liability. As a current or former owner and operator of real estate, we may be required by law to investigate and clean up hazardous substances released at or from the properties we currently own or operate or have in the past owned or operated. We may also be liable to the government or to third parties for property damage, investigation costs and cleanup costs. In addition, some environmental laws create a lien on the contaminated site in favor of the government for damages and costs the government incurs in connection with the contamination. Contamination may adversely affect our ability to sell or lease real estate or to borrow using the real estate as collateral. Persons who arrange for the disposal or treatment of hazardous substances also may be liable for the costs of removal or remediation of such substances at a disposal or treatment facility owned or operated by another person. In addition, certain environmental laws impose liability for the management and disposal of asbestos-containing materials and for the release of such materials into the air. These laws may provide for third parties to seek recovery from owners or operators of real properties for personal injury associated with asbestos-containing materials. In connection with the ownership, operation, management, and development of real properties, we may be considered an owner or operator of such properties and, therefore, are potentially liable for removal or remediation costs, and also may be liable for governmental fines and injuries to persons and property. When we arrange for the treatment or disposal of hazardous substances at landfills or other facilities owned by other persons, we may be liable for the removal or remediation costs at such facilities. We are not aware of any environmental liabilities relating to our investment properties which would have a material adverse effect on our business, assets, or results of operations. However, we cannot assure you that environmental liabilities will not arise in the future and that such liabilities will not have a material adverse effect on our business, assets or results of operation.
Of the 112 manufactured home communities we currently operate, forty-two have their own wastewater treatment facility or water distribution system, or both. At these locations, we are subject to compliance with monthly, quarterly and yearly testing for contaminants as outlined by the individual state’s Department of Environmental Protection Agencies. Currently, we are not subject to radon or asbestos monitoring requirements.
Additionally, in connection with the management of the properties or upon acquisition or financing of a property, the Company authorizes the preparation of Phase I or similar environmental reports (which involves general inspections without soil sampling or ground water analysis) completed by independent environmental consultants. Based upon such environmental reports and the Company’s ongoing review of its properties, as of the date of this Annual Report, the Company is not aware of any environmental condition with respect to any of its properties which it believes would be reasonably likely to have a material adverse effect on its financial condition and/or results of operations. However, these reports cannot reflect conditions arising after the studies were completed, and no assurances can be given that existing environmental studies reveal all environmental liabilities, that any prior owner or operator of a property or neighboring owner or operator did not create any material environmental condition not known to us, or that a material environmental condition does not otherwise exist as to any one or more properties.
Some of our properties are subject to potential natural or other disasters. Certain of our manufactured home communities are located in areas that may be subject to natural disasters, including our manufactured home communities in flood plains or in areas that may be adversely affected by tornados, as well as our manufactured home communities in coastal regions that may be adversely affected by increases in sea levels or in the frequency or severity of hurricanes, tropical storms or other severe weather conditions. The occurrence of natural disasters may delay redevelopment or development projects, increase investment costs to repair or replace damaged properties, increase future property insurance costs and negatively impact the tenant demand for lease space. To the extent insurance is unavailable to us or is unavailable on acceptable terms, or our insurance is not adequate to cover losses from these events, our financial condition and results of operations could be adversely affected.
Actions by our competitors may decrease or prevent increases in the occupancy and rental rates of our properties which could adversely affect our business. We compete with other owners and operators of manufactured home community properties, some of which own properties similar to ours in the same submarkets in which our properties are located. The number of competitive manufactured home community properties in a particular area could have a material adverse effect on our ability to attract tenants, lease sites and maintain or increase rents charged at our properties or at any newly acquired properties. In addition, other forms of multi-family residential properties, such as private and federally funded or assisted multi-family housing projects and single-family housing, provide housing alternatives to potential tenants of manufactured home communities. If our competitors offer housing at rental rates below current market rates or below the rental rates we currently charge our tenants, we may lose potential tenants, and we may be pressured to reduce our rental rates below those we currently charge in order to retain tenants when our tenants’ leases expire. As a result, our financial condition, cash flow, cash available for distribution, and ability to satisfy our debt service obligations could be materially adversely affected.
| -9- |
Losses in excess of our insurance coverage or uninsured losses could adversely affect our cash flow. We generally maintain insurance policies related to our business, including casualty, general liability and other policies covering business operations, employees and assets. However, we may be required to bear all losses that are not adequately covered by insurance. In addition, there are certain losses that are not generally insured because it is not economically feasible to insure against them, including losses due to riots, acts of war or other catastrophic events. If an uninsured loss or a loss in excess of insured limits occurs with respect to one or more of our properties, then we could lose the capital we invested in the properties, as well as the anticipated profits and cash flow from the properties and, in the case of debt which is with recourse to us, we would remain obligated for any mortgage debt or other financial obligations related to the properties. Although we believe that our insurance programs are adequate, no assurance can be given that we will not incur losses in excess of its insurance coverage, or that we will be able to obtain insurance in the future at acceptable levels and reasonable cost.
Our investments are concentrated in the manufactured housing/residential sector and our business would be adversely affected by an economic downturn in that sector. Our investments in real estate assets are primarily concentrated in the manufactured housing/residential sector. This concentration may expose us to the risk of economic downturns in this sector to a greater extent than if our business activities included a more significant portion of other sectors of the real estate industry.
We face risks generally associated with our debt. We finance a portion of our investments in properties and marketable securities through debt. We are subject to the risks normally associated with debt financing, including the risk that our cash flow will be insufficient to meet required payments of principal and interest. In addition, debt creates other risks, including:
| ● | rising interest rates on our variable rate debt; | |
| ● | inability to repay or refinance existing debt as it matures, which may result in forced disposition of assets on disadvantageous terms; | |
| ● | refinancing terms less favorable than the terms of existing debt; and | |
| ● | failure to meet required payments of principal and/or interest. |
We mortgage our properties, which subjects us to the risk of foreclosure in the event of non-payment. We mortgage many of our properties to secure payment of indebtedness. If we are unable to meet mortgage payments, then the property could be foreclosed upon or transferred to the mortgagee with a consequent loss of income and asset value. A foreclosure of one or more of our properties could adversely affect our financial condition, results of operations, cash flow, ability to service debt and make distributions and the market price of our preferred and common stock and any other securities we issue.
We face risks related to “balloon payments” and refinancings. Certain of our mortgages will have significant outstanding principal balances on their maturity dates, commonly known as “balloon payments.” There can be no assurance that we will be able to refinance the debt on favorable terms or at all. To the extent we cannot refinance debt on favorable terms or at all, we may be forced to dispose of properties on disadvantageous terms or pay higher interest rates, either of which would have an adverse impact on our financial performance and ability to service debt and make distributions.
We face risks associated with our dependence on external sources of capital. In order to qualify as a REIT, we are required each year to distribute to our stockholders at least 90% of our REIT taxable income, and we are subject to tax on our income to the extent it is not distributed. Because of this distribution requirement, we may not be able to fund all future capital needs from cash retained from operations. As a result, to fund capital needs, we rely on third-party sources of capital, which we may not be able to obtain on favorable terms, if at all. Our access to third-party sources of capital depends upon a number of factors, including (i) general market conditions; (ii) the market’s perception of our growth potential; (iii) our current and potential future earnings and cash distributions; and (iv) the market price of our preferred and common stock. Additional debt financing may substantially increase our debt-to-total capitalization ratio. Additional equity issuance may dilute the holdings of our current stockholders.
| -10- |
We may become more highly leveraged, resulting in increased risk of default on our obligations and an increase in debt service requirements which could adversely affect our financial condition and results of operations and our ability to pay distributions. We have incurred, and may continue to incur, indebtedness in furtherance of our activities. Our governing documents do not limit the amount of indebtedness we may incur. Accordingly, our Board of Directors may vote to incur additional debt and would do so, for example, if it were necessary to maintain our status as a REIT. We could therefore become more highly leveraged, resulting in an increased risk of default on our obligations and in an increase in debt service requirements, which could adversely affect our financial condition and results of operations and our ability to pay distributions to stockholders.
Fluctuations in interest rates could materially affect our financial results. Because a portion of our debt bears interest at variable rates, increases in interest rates could materially increase our interest expense. If the United States Federal Reserve increases short-term interest rates, this may have a significant upward impact on shorter-term interest rates, including the interest rates that our variable rate debt is based upon. Potential future increases in interest rates and credit spreads may increase our interest expense and therefore negatively affect our financial condition and results of operations, and reduce our access to the debt or equity capital markets.
Covenants in our credit agreements could limit our flexibility and adversely affect our financial condition. The terms of our various credit agreements and other indebtedness require us to comply with a number of customary financial and other covenants, such as maintaining debt service coverage and leverage ratios and maintaining insurance coverage. These covenants may limit our flexibility in our operations, and breaches of these covenants could result in defaults under the instruments governing the applicable indebtedness even if we had satisfied our payment obligations. If we were to default under our credit agreements, our financial condition would be adversely affected.
A change in the United States government policy with regard to Fannie Mae and Freddie Mac could impact our financial condition. Fannie Mae and Freddie Mac are a major source of financing for the manufactured housing real estate sector. We depend frequently on Fannie Mae and Freddie Mac to finance growth by purchasing or guaranteeing manufactured housing community loans. We do not know when or if Fannie Mae or Freddie Mac will restrict their support of lending to our real estate sector or to us in particular. A decision by the government to eliminate Fannie Mae or Freddie Mac, or reduce their acquisitions or guarantees of our mortgage loans, may adversely affect interest rates, capital availability and our ability to refinance our existing mortgage obligations as they come due and obtain additional long-term financing for the acquisition of additional communities on favorable terms or at all.
We face risks associated with the financing of home sales to customers in our manufactured home communities. To produce new rental revenue and to upgrade our communities, we sell homes to customers in our communities at competitive prices and finance these home sales through S&F. We allow banks and outside finance companies the first opportunity to finance these sales. We are subject to the following risks in financing these homes:
| ● | the borrowers may default on these loans and not be able to make debt service payments or pay principal when due; | |
| ● | the default rates may be higher than we anticipate; | |
| ● | demand for consumer financing may not be as great as we anticipate or may decline; | |
| ● | the value of property securing the installment notes receivable may be less than the amounts owed; and | |
| ● | interest rates payable on the installment notes receivable may be lower than our cost of funds. |
Additionally, there are many regulations pertaining to our home sales and financing activities. There are significant consumer protection laws and the regulatory framework may change in a manner which may adversely affect our operating results. The regulatory environment and associated consumer finance laws create a risk of greater liability from our home sales and financing activities and could subject us to additional litigation. We are also dependent on licenses granted by state and other regulatory authorities, which may be withdrawn or which may not be renewed and which could have an adverse impact on our ability to continue with our home sales and financing activities.
| -11- |
Risks Related to our Status as a REIT
If our leases are not respected as true leases for federal income tax purposes, we would fail to qualify as a REIT. To qualify as a REIT, we must, among other things, satisfy two gross income tests, under which specified percentages of our gross income must be passive income, such as rent. For the rent paid pursuant to our leases, to qualify for purposes of the gross income tests, the leases must be respected as true leases for federal income tax purposes and not be treated as service contracts, joint ventures or some other type of arrangement. We believe that our leases will be respected as true leases for federal income tax purposes. However, there can be no assurance that the Internal Revenue Service (“IRS”) will agree with this view. If the leases are not respected as true leases for federal income tax purposes, we would not be able to satisfy either of the two gross income tests applicable to REITs, and we could lose our REIT status.
Failure to make required distributions would subject us to additional tax. In order to qualify as a REIT, we must, among other requirements, distribute, each year, to our stockholders at least 90% of our taxable income, excluding net capital gains. To the extent that we satisfy the 90% distribution requirement, but distribute less than 100% of our taxable income, we will be subject to federal corporate income tax on our undistributed income. In addition, we will incur a 4% nondeductible excise tax on the amount, if any, by which our distributions (or deemed distributions) in any year are less than the sum of:
| ● | 85% of our ordinary income for that year; | |
| ● | 95% of our capital gain net earnings for that year; and | |
| ● | 100% of our undistributed taxable income from prior years. |
To the extent we pay out in excess of 100% of our taxable income for any tax year, we may be able to carry forward such excess to subsequent years to reduce our required distributions for purposes of the 4% nondeductible excise tax in such subsequent years. We intend to pay out our income to our stockholders in a manner intended to satisfy the 90% distribution requirement. Differences in timing between the recognition of income and the related cash receipts or the effect of required debt amortization payments could require us to borrow money or sell assets to pay out enough of our taxable income to satisfy the 90% distribution requirement and to avoid corporate income tax.
We may not have sufficient cash available from operations to pay distributions to our stockholders, and, therefore, distributions may be made from borrowings. The actual amount and timing of distributions to our stockholders will be determined by our Board of Directors in its discretion and typically will depend on the amount of cash available for distribution, which will depend on items such as current and projected cash requirements, limitations on distributions imposed by law on our financing arrangements and tax considerations. As a result, we may not have sufficient cash available from operations to pay distributions as required to maintain our status as a REIT. Therefore, we may need to borrow funds to make sufficient cash distributions in order to maintain our status as a REIT, which may cause us to incur additional interest expense as a result of an increase in borrowed funds for the purpose of paying distributions.
We may be required to pay a penalty tax upon the sale of a property. The federal income tax provisions applicable to REITs provide that any gain realized by a REIT on the sale of property held as inventory or other property held primarily for sale to customers in the ordinary course of business is treated as income from a “prohibited transaction” that is subject to a 100% penalty tax. Under current law, unless a sale of real property qualifies for a safe harbor, the question of whether the sale of real estate or other property constitutes the sale of property held primarily for sale to customers is generally a question of the facts and circumstances regarding a particular transaction. We intend that we and our subsidiaries will hold the interests in the real estate for investment with a view to long-term appreciation, engage in the business of acquiring and owning real estate, and make occasional sales as are consistent with our investment objectives. We do not intend to engage in prohibited transactions. We cannot assure you, however, that we will only make sales that satisfy the requirements of the safe harbors or that the IRS will not successfully assert that one or more of such sales are prohibited transactions.
| -12- |
We may be adversely affected if we fail to qualify as a REIT. If we fail to qualify as a REIT, we will not be allowed to deduct distributions to shareholders in computing our taxable income and will be subject to federal income tax at regular corporate rates and possibly increased state and local taxes. In addition, we might be barred from qualification as a REIT for the four years following disqualification. The additional tax incurred at regular corporate rates would reduce significantly the cash flow available for distribution to shareholders and for debt service. Furthermore, we would no longer be required to make any distributions to our shareholders as a condition to REIT qualification. Any distributions to shareholders would be taxable as ordinary income to the extent of our current and accumulated earnings and profits, although such dividend distributions to non-corporate shareholders would be subject to a top federal income tax rate of 20% (and potentially a Medicare tax of 3.8%), provided applicable requirements of the Code are satisfied. Furthermore, corporate shareholders may be eligible for the dividends received deduction on the distributions, subject to limitations under the Code. Additionally, if we fail to qualify as a REIT, non-corporate stockholders would no longer be able to deduct up to 20% of our dividends (other than capital gain dividends and dividends treated as qualified dividend income), as would otherwise generally be permitted for taxable years beginning after December 31, 2017 and before January 1, 2026.
To qualify as a REIT, we must comply with certain highly technical and complex requirements. We cannot be certain we have complied, and will always be able to comply, with the requirements to qualify as a REIT because there are few judicial and administrative interpretations of these provisions. In addition, facts and circumstances that may be beyond our control may affect our ability to continue to qualify as a REIT. We cannot assure you that new legislation, regulations, administrative interpretations or court decisions will not change the tax laws significantly with respect to our qualification as a REIT or with respect to the Federal income tax consequences of qualification. We believe that we have qualified as a REIT since our inception and intend to continue to qualify as a REIT. However, we cannot assure you that we are qualified or will remain qualified.
There is a risk of changes in the tax law applicable to REITs. Because the IRS, the United States Treasury Department and Congress frequently review federal income tax legislation, we cannot predict whether, when or to what extent new federal tax laws, regulations, interpretations or rulings will be adopted. Numerous changes to the U.S. federal income tax laws are proposed on a regular basis. Any of such legislative action may prospectively or retroactively modify our tax treatment and, therefore, may adversely affect taxation of us and/or our investors. Additionally, the REIT rules are constantly under review by persons involved in the legislative process and by the IRS and the U.S. Treasury Department, which may result in revisions to regulations and interpretations in addition to statutory changes. If enacted, certain proposed changes could have an adverse impact on our business and financial results.
The recently enacted Tax Cuts and Jobs Act of 2017 (the “Tax Act”), has significantly changed the U.S. federal income taxation of U.S. businesses and their owners, including REITs and their shareholders. Changes made by the Tax Act that could affect us and our shareholders include:
| ● | temporarily reducing individual U.S. federal income tax rates on ordinary income; the highest individual U.S. federal income tax rate has been reduced from 39.6% to 37% for taxable years beginning after December 31, 2017 and before January 1, 2026; | |
| ● | permanently eliminating the progressive corporate tax rate structure, with a maximum corporate tax rate of 35%, and replacing it with a flat corporate tax rate of 21%; | |
| ● | permitting a deduction for certain pass-through business income, including dividends received by our shareholders from us that are not designated by us as capital gain dividends or qualified dividend income, which will allow individuals, trusts, and estates to deduct up to 20% of such amounts for taxable years beginning after December 31, 2017 and before January 1, 2026; | |
| ● | reducing the highest rate of withholding with respect to our distributions to non-U.S. stockholders that are treated as attributable to gains from the sale or exchange of U.S. real property interests from 35% to 21%; |
| -13- |
| ● | limiting our deduction for net operating losses to 80% of REIT taxable income (prior to the application of the dividends paid deduction); | |
| ● | generally limiting the deduction for net business interest expense in excess of 30% of a business’s adjusted taxable income except for taxpayers that engage in certain real estate businesses and elect out of this rule (provided that such electing taxpayers must use an alternative depreciation system for certain property); and | |
| ● | eliminating the corporate alternative minimum tax. |
Many of these changes are effective immediately, without any transition periods or grandfathering for existing transactions. The Tax Act is unclear in many respects and could be subject to potential amendments and technical corrections, as well as interpretations and implementing regulations by the United States Treasury Department and the IRS, any of which could lessen or increase certain adverse impacts of the Tax Act. In addition, it is unclear how these U.S. federal income tax changes will affect state and local taxation, which often uses federal taxable income as a starting point for computing state and local tax liabilities.
While some of the changes made by the Tax Act may adversely affect us, other changes may be beneficial on a going forward basis. We continue to work with our tax advisors and auditors to determine the full impact that the recent tax legislation as a whole will have on us. You are urged to consult with your tax advisor with respect to the status of legislative, regulatory, judicial or administrative developments and proposals and their potential effect on an investment in our securities.
We may be unable to comply with the strict income distribution requirements applicable to REITs. To maintain qualification as a REIT under the Code, a REIT must annually distribute to its stockholders at least 90% of its REIT taxable income, excluding the dividends paid deduction and net capital gains. This requirement limits our ability to accumulate capital. We may not have sufficient cash or other liquid assets to meet the distribution requirements. Difficulties in meeting the distribution requirements might arise due to competing demands for our funds or to timing differences between tax reporting and cash receipts and disbursements, because income may have to be reported before cash is received, because expenses may have to be paid before a deduction is allowed, because deductions may be disallowed or limited or because the IRS may make a determination that adjusts reported income. In those situations, we might be required to borrow funds or sell properties on adverse terms in order to meet the distribution requirements and interest and penalties could apply which could adversely affect our financial condition. If we fail to make a required distribution, we could cease to be taxed as a REIT.
If we were considered to have actually or constructively paid a “preferential dividend” to certain of our stockholders, our status as a REIT could be adversely affected. In order to qualify as a REIT, we must distribute annually to our stockholders at least 90% of our REIT taxable income (which does not equal net income as calculated in accordance with accounting principles generally accepted in the United States of America (“GAAP”)), determined without regard to the deduction for dividends paid and excluding net capital gain. For distributions to be counted as satisfying the annual distribution requirements for REITs, and to provide us with a REIT level tax deduction, the distributions for REIT years beginning prior to January 1, 2015 must not be “preferential dividends.” A dividend is not a preferential dividend if the distribution is pro rata among all outstanding shares of stock within a particular class, and in accordance with the preferences among different classes of stock as set forth in a REIT’s organizational documents. There is no de minimis exception with respect to preferential dividends; therefore, if the IRS were to take the position that we inadvertently paid a preferential dividend, for a REIT year beginning prior to January 1, 2015, we may be deemed to have failed the 90% distribution test, and our status as a REIT could be terminated for the year in which such determination is made if we were unable to cure such failure. While we believe that our operations have been structured in such a manner that we will not be treated as inadvertently having paid preferential dividends for a REIT year beginning prior to January 1, 2015, we can provide no assurance to this effect.
Notwithstanding our status as a REIT, we are subject to various federal, state and local taxes on our income and property. For example, we will be taxed at regular corporate rates on any undistributed taxable income, including undistributed net capital gains; provided, however, that properly designated undistributed capital gains will effectively avoid taxation at the stockholder level. We may be subject to other Federal income taxes and may also have to pay some state income or franchise taxes because not all states treat REITs in the same manner as they are treated for Federal income tax purposes.
| -14- |
We may not be able to obtain adequate cash to fund our business. Our business requires access to adequate cash to finance our operations, distributions, capital expenditures, debt service obligations, development and redevelopment costs and property acquisition costs, if any. We expect to generate the cash to be used for these purposes primarily with operating cash flow, borrowings under secured and unsecured loans, proceeds from sales of strategically identified assets and, when market conditions permit, through the issuance of debt and equity securities from time to time. We may not be able to generate sufficient cash to fund our business, particularly if we are unable to renew leases, lease vacant space or re-lease space as leases expire according to our expectations.
We are dependent on key personnel. Our executive and other senior officers have a significant role in our success. Our ability to retain our management group or to attract suitable replacements should any members of the management group leave is dependent on the competitive nature of the employment market. The loss of services from key members of the management group or a limitation in their availability could adversely affect our financial condition and cash flow. Further, such a loss could be negatively perceived in the capital markets.
We may amend our business policies without stockholder approval. Our Board of Directors determines our growth, investment, financing, capitalization, borrowing, REIT status, operations and distributions policies. Although our Board of Directors has no present intention to change or reverse any of these policies, they may be amended or revised without notice to stockholders. Accordingly, stockholders may not have control over changes in our policies. We cannot assure you that changes in our policies will serve fully the interests of all stockholders.
The market value of our preferred and common stock could decrease based on our performance and market perception and conditions. The market value of our preferred and common stock may be based primarily upon the market’s perception of our growth potential and current and future cash dividends, and may be secondarily based upon the real estate market value of our underlying assets. The market price of our preferred and common stock is influenced by their respective distributions relative to market interest rates. Rising interest rates may lead potential buyers of our stock to expect a higher distribution rate, which would adversely affect the market price of our stock. In addition, rising interest rates would result in increased expense, thereby adversely affecting cash flow and our ability to service our indebtedness and pay distributions.
There are restrictions on the transfer of our capital stock. To maintain our qualification as a REIT under the Code, no more than 50% in value of our outstanding capital stock may be owned, actually or by attribution, by five or fewer individuals, as defined in the Code to also include certain entities, during the last half of a taxable year. Accordingly, our charter contains provisions restricting the transfer of our capital stock. These restrictions may discourage a tender offer or other transaction, or a change in management or of control of us that might involve a premium price for our common stock or preferred stock or that our shareholders otherwise believe to be in their best interests, and may result in the transfer of shares acquired in excess of the restrictions to a trust for the benefit of a charitable beneficiary and, as a result, the forfeiture by the acquirer of the benefits of owning the additional shares.
Our earnings are dependent, in part, upon the performance of our investment portfolio. As permitted by the Code, we invest in and own securities of other REITs, which we generally limit to no more than approximately 20% of our undepreciated assets. To the extent that the value of those investments declines or those investments do not provide a return, our earnings and cash flow could be adversely affected.
We are subject to restrictions that may impede our ability to effect a change in control. Certain provisions contained in our charter and bylaws and certain provisions of Maryland law may have the effect of discouraging a third party from making an acquisition proposal for us and thereby inhibit a change in control. These provisions include the following:
| -15- |
| ● | Our charter provides for three classes of directors with the term of office of one class expiring each year, commonly referred to as a “staggered board.” By preventing common stockholders from voting on the election of more than one class of directors at any annual meeting of stockholders, this provision may have the effect of keeping the current members of our Board of Directors in control for a longer period of time than stockholders may desire. | |
| ● | Our charter generally limits any holder from acquiring more than 9.8% (in value or in number, whichever is more restrictive) of our outstanding equity stock (defined as all of our classes of capital stock, except our excess stock). While this provision is intended to assure our ability to remain a qualified REIT for Federal income tax purposes, the ownership limit may also limit the opportunity for stockholders to receive a premium for their shares of common stock that might otherwise exist if an investor was attempting to assemble a block of shares in excess of 9.8% of the outstanding shares of equity stock or otherwise effect a change in control. | |
| ● | The request of stockholders entitled to cast at least a majority of all votes entitled to be cast at such meeting is necessary for stockholders to call a special meeting. We also require advance notice by common stockholders for the nomination of directors or proposals of business to be considered at a meeting of stockholders. | |
| ● | Our Board of Directors may authorize and cause us to issue securities without shareholder approval. Under our charter, the board has the power to classify and reclassify any of our unissued shares of capital stock into shares of capital stock with such preferences, rights, powers and restrictions as the Board of Directors may determine. | |
| ● | “Business combination” provisions that provide that, unless exempted, a Maryland corporation may not engage in certain business combinations, including mergers, dispositions of 10 percent or more of its assets, certain issuances of shares of stock and other specified transactions, with an “interested shareholder” or an affiliate of an interested shareholder for five years after the most recent date on which the interested shareholder became an interested shareholder, and thereafter unless specified criteria are met. An interested shareholder is defined generally as any person who beneficially owns 10% or more of the voting power of our shares or an affiliate thereof or an affiliate or associate of ours who was the beneficial owner, directly or indirectly, of 10% or more of the voting power of our then outstanding voting stock at any time within the two-year period immediately prior to the date in question. In our charter, we have expressly elected that the Maryland Business Combination Act not govern or apply to any transaction with our affiliated company, Monmouth Real Estate Investment Corporation (“MREIC”), a Maryland corporation. | |
| ● | The duties of directors of a Maryland corporation do not require them to, among other things (a) accept, recommend or respond to any proposal by a person seeking to acquire control of the corporation, (b) authorize the corporation to redeem any rights under, or modify or render inapplicable, any shareholders rights plan, (c) make a determination under the Maryland Business Combination Act or the Maryland Control Share Acquisition Act to exempt any person or transaction from the requirements of those provisions, or (d) act or fail to act solely because of the effect of the act or failure to act may have on an acquisition or potential acquisition of control of the corporation or the amount or type of consideration that may be offered or paid to the shareholders in an acquisition. |
We cannot assure you that we will be able to pay distributions regularly. Our ability to pay distributions in the future is dependent on our ability to operate profitably and to generate cash from our operations and the operations of our subsidiaries and is subject to limitations under our financing arrangements and Maryland law. Under the Maryland General Corporation Law, (“MGCL”), a Maryland corporation generally may not make a distribution if, after giving effect to the distribution, the corporation would not be able to pay its debts as the debts became due in the usual course of business, or the corporation’s total assets would be less than the sum of its total liabilities plus, unless the charter permits otherwise, the amount that would be needed if the corporation were to be dissolved at the time of the distribution to satisfy the preferential rights upon dissolution of stockholders whose preferential rights on dissolution are superior to those receiving the distribution. Accordingly, we cannot guarantee that we will be able to pay distributions on a regular quarterly basis in the future.
| -16- |
Dividends on our capital stock do not qualify for the reduced tax rates available for some dividends. Income from “qualified dividends” payable to U.S. stockholders that are individuals, trusts and estates are generally subject to tax at preferential rates. Dividends payable by REITs, however, generally are not eligible for the preferential tax rates applicable to qualified dividend income. Although these rules do not adversely affect our taxation or the dividends payable by us, to the extent that the preferential rates continue to apply to regular corporate qualified dividends, investors who are individuals, trusts and estates may perceive an investment in us to be relatively less attractive than an investment in the stock of a non-REIT corporation that pays dividends, which could materially and adversely affect the value of the shares of, and per share trading price of, our capital stock. It should be noted that the recently enacted Tax Act provides for a deduction from income for individuals, trusts and estates up to 20% of certain REIT dividends, which reduces the effective tax rate on such dividends below the effective tax rate on interest, though the deduction is generally not as favorable as the preferential rate on qualified dividends. The deduction for certain REIT dividends, unlike the favorable rate for qualified dividends, expires after 2025.
We are subject to risks arising from litigation. We may become involved in litigation. Litigation can be costly, and the results of litigation are often difficult to predict. We may not have adequate insurance coverage or contractual protection to cover costs and liability in the event we are sued, and to the extent we resort to litigation to enforce our rights, we may incur significant costs and ultimately be unsuccessful or unable to recover amounts we believe are owed to us. We may have little or no control of the timing of litigation, which presents challenges to our strategic planning.
Future terrorist attacks and military conflicts could have a material adverse effect on general economic conditions, consumer confidence and market liquidity. Among other things, it is possible that interest rates may be affected by these events. An increase in interest rates may increase our costs of borrowing, leading to a reduction in our earnings. Terrorist acts affecting our properties could also result in significant damages to, or loss of, our properties. Additionally, we may be unable to obtain adequate insurance coverage on acceptable economic terms for losses resulting from acts of terrorism. Our lenders may require that we carry terrorism insurance even if we do not believe this insurance is necessary or cost effective. Should an act of terrorism result in an uninsured loss or a loss in excess of insured limits, we could lose capital invested in a property, as well as the anticipated future revenues from a property, while remaining obligated for any mortgage indebtedness or other financial obligations related to the property. Any loss of these types would adversely affect our financial condition.
Disruptions in the financial markets could affect our ability to obtain financing on reasonable terms and have other adverse effects on us and the market price of our capital stock. Over the last several years, the U.S. stock and credit markets have experienced significant price volatility, dislocations and liquidity disruptions, which have caused market prices of many stocks and debt securities to fluctuate substantially and the spreads on prospective debt financing to widen considerably. Continued uncertainty in the stock and credit markets may negatively impact our ability to access additional financing at reasonable terms, which may negatively affect our ability to acquire properties and otherwise pursue our investment strategy. A prolonged downturn in the stock or credit markets may cause us to seek alternative sources of potentially less attractive financing, and may require us to adjust our investment strategy accordingly. These types of events in the stock and credit markets may make it more difficult or costly for us to raise capital through the issuance of the common stock, preferred stock or debt securities. The potential disruptions in the financial markets may have a material adverse effect on the market value of the common stock and preferred stock, or the economy in general. In addition, the national and local economic climate, including that of the energy-market dependent Marcellus and Utica Shale regions, may be adversely impacted by, among other factors, plant closings and industry slowdowns, which may have a material adverse effect on the return we receive on our properties and investments, as well as other unknown adverse effects on us.
We may be adversely impacted by volatility in foreign financial markets. During the last few years, the financial crisis in Europe (including financial difficulties at several large European banks) has led to increased price volatility, dislocations and liquidity disruptions. Adding to the European credit crisis, in June 2016, voters in the United Kingdom elected to withdraw from the European Union in a national referendum. The referendum has created significant uncertainty about the future relationship between the United Kingdom and the European Union and has continued to have a material adverse effect on global economic conditions and the stability of global financial markets and could significantly reduce global market liquidity and restrict the ability of key market participants to operate in certain financial markets.
| -17- |
Security breaches and other disruptions could compromise our information and expose us to liability, which would cause our business and reputation to suffer. In the ordinary course of our business, we collect and store sensitive data, including our business information and the personal information of our residents and our employees, in our facility and on our network. Despite our security measures, our information technology and infrastructure may be vulnerable to attacks by hackers or breached due to employee error, malfeasance or other disruptions. Any such breach could compromise our network and the information stored there could be accessed, publicly disclosed, lost or stolen. Any such access, disclosure or other loss of information could result in legal claims or proceedings, disrupt our operations, damage our reputation, and cause a loss of confidence, which could adversely affect our business.
We face risks relating to expanding use of social media mediums. The use of social media could cause us to suffer brand damage or information leakage. Negative posts or comments about us or our properties on any social networking website could damage our, or our properties’ reputations. In addition, employees or others might disclose non-public sensitive information relating to our business through external media channels. The continuing evolution of social media may present us with new challenges and risks.
Item 1B – Unresolved Staff Comments
None.
UMH Properties, Inc. is engaged in the ownership and operation of manufactured home communities located in New Jersey, New York, Ohio, Pennsylvania, Tennessee, Indiana, Michigan and Maryland. As of December 31, 2017, the Company owns 112 manufactured home communities containing approximately 20,000 developed sites. The rents collectible from the land ultimately depend on the value of the home and land. Therefore, fewer but more expensive homes can actually produce the same or greater rents. There is a long-term trend toward larger manufactured homes. Manufactured home communities designed for older manufactured homes must be modified to accommodate modern, wider and longer manufactured homes. These changes may decrease the number of homes that may be accommodated in a manufactured home community. For this reason, the number of developed sites operated by the Company is subject to change, and the number of developed sites listed is always an approximate number. The following table sets forth certain information concerning the Company’s real estate investments as of December 31, 2017.
| Number of | Sites | Approximate | ||||||||||||||||||||||
| Developed | Occupied | Occupancy | Acreage | Additional | Monthly Rent Per | |||||||||||||||||||
| Name of Community | Sites | at 12/31/17 | Percentage | Developed | Acreage | Site at 12/31/17 | ||||||||||||||||||
| Allentown | 434 | 390 | 90 | % | 76 | -0- | $ | 458 | ||||||||||||||||
| 4912 Raleigh-Millington Road | ||||||||||||||||||||||||
| Memphis, TN 38128 | ||||||||||||||||||||||||
| Arbor Estates | 230 | 217 | 94 | % | 31 | -0- | $ | 672 | ||||||||||||||||
| 1081 North Easton Road | ||||||||||||||||||||||||
| Doylestown, PA 18902 | ||||||||||||||||||||||||
| Auburn Estates | 42 | 42 | 100 | % | 13 | -0- | $ | 380 | ||||||||||||||||
| 919 Hostetler Road | ||||||||||||||||||||||||
| Orrville, OH 44667 | ||||||||||||||||||||||||
| Birchwood Farms | 143 | 118 | 83 | % | 28 | -0- | $ | 421 | ||||||||||||||||
| 8057 Birchwood Drive | ||||||||||||||||||||||||
| Birch Run, MI 48415 | ||||||||||||||||||||||||
| Boardwalk | 195 | 185 | 95 | % | 45 | -0- | $ | 355 | ||||||||||||||||
| 2105 Osolo Road | ||||||||||||||||||||||||
| Elkhart, IN 46514 | ||||||||||||||||||||||||
| Broadmore Estates | 389 | 345 | 89 | % | 93 | 19 | $ | 423 | ||||||||||||||||
| 148 Broadmore Estates | ||||||||||||||||||||||||
| Goshen, IN 46528 | ||||||||||||||||||||||||
| Brookside Village | 170 | 137 | 81 | % | 37 | 2 | $ | 425 | ||||||||||||||||
| 89 Valley Drive | ||||||||||||||||||||||||
| Berwick, PA 18603 | ||||||||||||||||||||||||
| Brookview Village | 134 | 120 | 90 | % | 52 | 22 | $ | 501 | ||||||||||||||||
| 2025 Route 9N, Lot 137 | ||||||||||||||||||||||||
| Greenfield Center, NY 12833 | ||||||||||||||||||||||||
| Candlewick Court | 211 | 141 | 67 | % | 40 | -0- | $ | 440 | ||||||||||||||||
| 1800 Candlewick Drive | ||||||||||||||||||||||||
| Owosso, MI 48867 | ||||||||||||||||||||||||
| Carsons | 131 | 98 | 75 | % | 14 | 4 | $ | 379 | ||||||||||||||||
| 649 North Franklin St. Lot 105 | ||||||||||||||||||||||||
| Chambersburg, PA 17201 | ||||||||||||||||||||||||
| Catalina | 463 | 249 | 54 | % | 75 | 26 | $ | 411 | ||||||||||||||||
| 6501 Germantown Road | ||||||||||||||||||||||||
| Middletown, OH 45042 | ||||||||||||||||||||||||
| Cedarcrest | 283 | 272 | 96 | % | 71 | 30 | $ | 605 | ||||||||||||||||
| 1976 North East Avenue | ||||||||||||||||||||||||
| Vineland, NJ 08360-- | ||||||||||||||||||||||||
| Chambersburg I & II | 99 | 76 | 77 | % | 11 | -0- | $ | 383 | ||||||||||||||||
| 5368 Philadelphia Ave Lot 34 | ||||||||||||||||||||||||
| Chambersburg, PA 17201 | ||||||||||||||||||||||||
| Chelsea | 84 | 78 | 93 | % | 12 | -0- | $ | 439 | ||||||||||||||||
| 459 Chelsea Lane | ||||||||||||||||||||||||
| Sayre, PA 18840 | ||||||||||||||||||||||||
| Cinnamon Woods | 63 | 58 | 92 | % | 10 | 67 | $ | 480 | ||||||||||||||||
| 70 Curry Avenue | ||||||||||||||||||||||||
| Conowingo, MD 21918 | ||||||||||||||||||||||||
| City View | 57 | 53 | 93 | % | 20 | 2 | $ | 306 | ||||||||||||||||
| 110 Fort Granville Lot C5 | ||||||||||||||||||||||||
| Lewistown, PA 17044 | ||||||||||||||||||||||||
| Clinton Mobile Home Resort | 116 | 114 | 98 | % | 23 | 1 | $ | 389 | ||||||||||||||||
| 60 N State Route 101 | ||||||||||||||||||||||||
| Tiffin, OH 44883 | ||||||||||||||||||||||||
| Collingwood | 103 | 89 | 86 | % | 20 | -0- | $ | 436 | ||||||||||||||||
| 358 Chambers Road Lot 001 | ||||||||||||||||||||||||
| Horseheads, NY 14845 | ||||||||||||||||||||||||
| -18- |
| Number of | Sites | Approximate | ||||||||||||||||||||||
| Developed | Occupied | Occupancy | Acreage | Additional | Monthly Rent Per | |||||||||||||||||||
| Name of Community | Sites | at 12/31/17 | Percentage | Developed | Acreage | Site at 12/31/17 | ||||||||||||||||||
| Colonial Heights | 158 | 124 | 78 | % | 31 | 1 | $ | 308 | ||||||||||||||||
| 917 Two Ridge Road | ||||||||||||||||||||||||
| Wintersville, OH 43953 | ||||||||||||||||||||||||
| Countryside Estates | 161 | 122 | 76 | % | 36 | 28 | $ | 327 | ||||||||||||||||
| 1500 East Fuson Road | ||||||||||||||||||||||||
| Muncie, IN 47302 | ||||||||||||||||||||||||
| Countryside Estates | 143 | 129 | 90 | % | 27 | -0- | $ | 307 | ||||||||||||||||
| 6605 State Route 5 | ||||||||||||||||||||||||
| Ravenna, OH 44266 | ||||||||||||||||||||||||
| Countryside Village | 347 | 331 | 95 | % | 89 | 63 | $ | 362 | ||||||||||||||||
| 200 Early Road | ||||||||||||||||||||||||
| Columbia, TN 38401 | ||||||||||||||||||||||||
| Cranberry Village | 188 | 176 | 94 | % | 36 | -0- | $ | 579 | ||||||||||||||||
| 100 Treesdale Drive | ||||||||||||||||||||||||
| Cranberry Township, PA 16066 | ||||||||||||||||||||||||
| Crestview | 97 | 73 | 75 | % | 19 | -0- | $ | 404 | ||||||||||||||||
| 459 Chelsea Lane | ||||||||||||||||||||||||
| Sayre, PA 18840 | ||||||||||||||||||||||||
| Cross Keys Village | 132 | 111 | 84 | % | 21 | 2 | $ | 413 | ||||||||||||||||
| 259 Brown Swiss Circle | ||||||||||||||||||||||||
| Duncansville, PA 16635 | ||||||||||||||||||||||||
| Crossroads Village | 41 | 25 | 61 | % | 9 | -0- | $ | 370 | ||||||||||||||||
| 549 Chicory Lane | ||||||||||||||||||||||||
| Mount Pleasant, PA 15666 | ||||||||||||||||||||||||
| Dallas Mobile Home Community | 146 | 116 | 79 | % | 21 | -0- | $ | 288 | ||||||||||||||||
| 1104 N 4th Street | ||||||||||||||||||||||||
| Toronto, OH 43964 | ||||||||||||||||||||||||
| Deer Meadows | 98 | 88 | 90 | % | 22 | 8 | $ | 303 | ||||||||||||||||
| 1291 Springfield Road | ||||||||||||||||||||||||
| New Springfield, OH 44443 | ||||||||||||||||||||||||
| D & R Village | 235 | 211 | 90 | % | 44 | -0- | $ | 567 | ||||||||||||||||
| 430 Route 146 Lot 65A | ||||||||||||||||||||||||
| Clifton Park, NY 12065 | ||||||||||||||||||||||||
| Evergreen Estates | 55 | 53 | 96 | % | 10 | 3 | $ | 332 | ||||||||||||||||
| 425 Medina Street | ||||||||||||||||||||||||
| Lodi, OH 44254 | ||||||||||||||||||||||||
| Evergreen Manor | 67 | 50 | 75 | % | 7 | -0- | $ | 312 | ||||||||||||||||
| 26041 Aurora Avenue | ||||||||||||||||||||||||
| Bedford, OH 44146 | ||||||||||||||||||||||||
| Evergreen Village | 50 | 47 | 94 | % | 10 | 4 | $ | 335 | ||||||||||||||||
| 9249 State Route 44 | ||||||||||||||||||||||||
| Mantua, OH 44255 | ||||||||||||||||||||||||
| -19- |
| Number of | Sites | Approximate | ||||||||||||||||||||||
| Developed | Occupied | Occupancy | Acreage | Additional | Monthly Rent Per | |||||||||||||||||||
| Name of Community | Sites | at 12/31/17 | Percentage | Developed | Acreage | Site at 12/31/17 | ||||||||||||||||||
| Fairview Manor | 317 | 300 | 95 | % | 66 | 132 | $ | 616 | ||||||||||||||||
| 2110 Mays Landing Road | ||||||||||||||||||||||||
| Millville, NJ 08332 | ||||||||||||||||||||||||
| Forest Creek | 167 | 163 | 98 | % | 37 | -0- | $ | 451 | ||||||||||||||||
| 855 E. Mishawaka Road | ||||||||||||||||||||||||
| Elkhart, IN 46517 | ||||||||||||||||||||||||
| Forest Park Village | 248 | 212 | 85 | % | 79 | -0- | $ | 510 | ||||||||||||||||
| 102 Holly Drive | ||||||||||||||||||||||||
| Cranberry Township, PA 16066 | ||||||||||||||||||||||||
| Fox Chapel Village | 122 | 88 | 72 | % | 23 | 2 | $ | 350 | ||||||||||||||||
| 7 Greene Drive | ||||||||||||||||||||||||
| Cheswick, PA 15024 | ||||||||||||||||||||||||
| Frieden Manor | 193 | 175 | 91 | % | 42 | 22 | $ | 448 | ||||||||||||||||
| 102 Frieden Manor | ||||||||||||||||||||||||
| Schuylkill Haven, PA 17972 | ||||||||||||||||||||||||
| Green Acres | 24 | 24 | 100 | % | 6 | -0- | $ | 400 | ||||||||||||||||
| 4496 Sycamore Grove Road | ||||||||||||||||||||||||
| Chambersburg, PA 17201 | ||||||||||||||||||||||||
| Gregory Courts | 39 | 32 | 82 | % | 9 | -0- | $ | 607 | ||||||||||||||||
| 1 Mark Lane | ||||||||||||||||||||||||
| Honey Brook, PA 19344 | ||||||||||||||||||||||||
| Hayden Heights | 115 | 114 | 99 | % | 19 | -0- | $ | 364 | ||||||||||||||||
| 5501 Cosgray Road | ||||||||||||||||||||||||
| Dublin, OH 43016 | ||||||||||||||||||||||||
| Heather Highlands | 405 | 276 | 68 | % | 79 | -0- | $ | 422 | ||||||||||||||||
| 109 Main Street | ||||||||||||||||||||||||
| Inkerman, PA 18640 | ||||||||||||||||||||||||
| High View Acres | 158 | 125 | 79 | % | 43 | -0- | $ | 370 | ||||||||||||||||
| 399 Blue Jay Lane | ||||||||||||||||||||||||
| Apollo, PA 15613 | ||||||||||||||||||||||||
| Highland | 246 | 222 | 90 | % | 42 | -0- | $ | 365 | ||||||||||||||||
| 1875 Osolo Road | ||||||||||||||||||||||||
| Elkhart, IN 46514 | ||||||||||||||||||||||||
| Highland Estates | 318 | 310 | 97 | % | 98 | 65 | $ | 544 | ||||||||||||||||
| 60 Old Route 22 | ||||||||||||||||||||||||
| Kutztown, PA 19530 | ||||||||||||||||||||||||
| Hillcrest Crossing | 201 | 98 | 49 | % | 60 | 16 | $ | 300 | ||||||||||||||||
| 100 Lorraine Drive | ||||||||||||||||||||||||
| Lower Burrell, PA 15068 | ||||||||||||||||||||||||
| Hillcrest Estates | 222 | 146 | 66 | % | 46 | 45 | $ | 400 | ||||||||||||||||
| 14200 Industrial Parkway | ||||||||||||||||||||||||
| Marysville, OH 43040 | ||||||||||||||||||||||||
| -20- |
| Number of | Sites | Approximate | ||||||||||||||||||||||
| Developed | Occupied | Occupancy | Acreage | Additional | Monthly Rent Per | |||||||||||||||||||
| Name of Community | Sites | at 12/31/17 | Percentage | Developed | Acreage | Site at 12/31/17 | ||||||||||||||||||
| Hillside Estates | 90 | 75 | 83 | % | 29 | 20 | $ | 328 | ||||||||||||||||
| 1033 Marguerite Lake Road | ||||||||||||||||||||||||
| Greensburg, PA 15601 | ||||||||||||||||||||||||
| Holiday Village | 266 | 254 | 95 | % | 36 | 29 | $ | 486 | ||||||||||||||||
| 201 Grizzard Avenue | ||||||||||||||||||||||||
| Nashville, TN 37207 | ||||||||||||||||||||||||
| Holiday Village | 326 | 258 | 79 | % | 53 | 2 | $ | 439 | ||||||||||||||||
| 1350 Co Road 3 | ||||||||||||||||||||||||
| Elkhart, IN 46514 | ||||||||||||||||||||||||
| Holly Acres Estates | 153 | 137 | 90 | % | 30 | 9 | $ | 355 | ||||||||||||||||
| 7240 Holly Dale Drive | ||||||||||||||||||||||||
| Erie, PA 16509 | ||||||||||||||||||||||||
| Hudson Estates | 162 | 143 | 88 | % | 19 | -0- | $ | 281 | ||||||||||||||||
| 100 Keenan Road | ||||||||||||||||||||||||
| Peninsula, OH 44264 | ||||||||||||||||||||||||
| Huntingdon Pointe | 64 | 60 | 94 | % | 42 | 7 | $ | 265 | ||||||||||||||||
| 240 Tee Drive | ||||||||||||||||||||||||
| Tarrs, PA 15688 | ||||||||||||||||||||||||
| Independence Park | 92 | 86 | 93 | % | 36 | 15 | $ | 346 | ||||||||||||||||
| 355 Route 30 | ||||||||||||||||||||||||
| Clinton, PA 15026 | ||||||||||||||||||||||||
| Kinnebrook | 237 | 225 | 95 | % | 66 | 8 | $ | 565 | ||||||||||||||||
| 351 State Route 17B | ||||||||||||||||||||||||
| Monticello, NY 12701 | ||||||||||||||||||||||||
| Lake Sherman Village | 237 | 223 | 94 | % | 54 | 43 | $ | 425 | ||||||||||||||||
| 7227 Beth Avenue, SW | ||||||||||||||||||||||||
| Navarre, OH 44662 | ||||||||||||||||||||||||
| Lakeview Meadows | 81 | 53 | 65 | % | 21 | 32 | $ | 332 | ||||||||||||||||
| 11900 Duff Road, Lot 58 | ||||||||||||||||||||||||
| Lakeview, OH 43331 | ||||||||||||||||||||||||
| Laurel Woods | 207 | 161 | 78 | % | 43 | -0- | $ | 383 | ||||||||||||||||
| 1943 St. Joseph Street | ||||||||||||||||||||||||
| Cresson, PA 16630 | ||||||||||||||||||||||||
| Little Chippewa | 62 | 55 | 89 | % | 13 | -0- | $ | 348 | ||||||||||||||||
| 11563 Back Massillon Road | ||||||||||||||||||||||||
| Orrville, OH 44667 | ||||||||||||||||||||||||
| Maple Manor | 316 | 244 | 77 | % | 71 | -0- | $ | 374 | ||||||||||||||||
| 18 Williams Street | ||||||||||||||||||||||||
| Taylor, PA 18517 | ||||||||||||||||||||||||
| Marysville Estates | 304 | 149 | 49 | % | 58 | -0- | $ | 374 | ||||||||||||||||
| 506 North Main Street | ||||||||||||||||||||||||
| Marysville, OH 43040 | ||||||||||||||||||||||||
| -21- |
| Number of | Sites | Approximate | ||||||||||||||||||||||
| Developed | Occupied | Occupancy | Acreage | Additional | Monthly Rent Per | |||||||||||||||||||
| Name of Community | Sites | at 12/31/17 | Percentage | Developed | Acreage | Site at 12/31/17 | ||||||||||||||||||
| Meadowood | 123 | 109 | 89 | % | 20 | -0- | $ | 384 | ||||||||||||||||
| 9555 Struthers Road | ||||||||||||||||||||||||
| New Middletown, OH 44442 | ||||||||||||||||||||||||
| Meadows | 335 | 175 | 52 | % | 61 | -0- | $ | 390 | ||||||||||||||||
| 11 Meadows | ||||||||||||||||||||||||
| Nappanee, IN 46550 | ||||||||||||||||||||||||
| Melrose Village | 292 | 266 | 91 | % | 71 | -0- | $ | 337 | ||||||||||||||||
| 4400 Melrose Drive, Lot 301 | ||||||||||||||||||||||||
| Wooster, OH 44691 | ||||||||||||||||||||||||
| Melrose West | 30 | 29 | 97 | % | 27 | 3 | $ | 341 | ||||||||||||||||
| 4455 Cleveland Road | ||||||||||||||||||||||||
| Wooster, OH 44691 | ||||||||||||||||||||||||
| Memphis Blues (1) | 144 | 25 | 17 | % | 22 | -0- | $ | 400 | ||||||||||||||||
| 1401 Memphis Blues Avenue | ||||||||||||||||||||||||
| Memphis, TN 38127 | ||||||||||||||||||||||||
| Monroe Valley | 44 | 43 | 98 | % | 11 | -0- | $ | 483 | ||||||||||||||||
| 1 Sunflower Drive | ||||||||||||||||||||||||
| Ephrata, PA 17522 | ||||||||||||||||||||||||
| Moosic Heights | 149 | 129 | 87 | % | 35 | -0- | $ | 395 | ||||||||||||||||
| 118 1st Street | ||||||||||||||||||||||||
| Avoca, PA 18641 | ||||||||||||||||||||||||
| Mount Pleasant Village | 115 | 109 | 95 | % | 19 | -0- | $ | 315 | ||||||||||||||||
| 549 Chicory Lane | ||||||||||||||||||||||||
| Mount Pleasant, PA 15666 | ||||||||||||||||||||||||
| Mountaintop | 39 | 38 | 97 | % | 11 | 2 | $ | 556 | ||||||||||||||||
| 1 Sunflower Drive | ||||||||||||||||||||||||
| Ephrata, PA 17522 | ||||||||||||||||||||||||
| Mountain View (2) | -0- | -0- | N/A | -0- | 220 | $ | -0- | |||||||||||||||||
| Van Dyke Street | ||||||||||||||||||||||||
| Coxsackie, NY 12501 | ||||||||||||||||||||||||
| Oak Ridge Estates | 204 | 199 | 98 | % | 40 | -0- | $ | 450 | ||||||||||||||||
| 1201 Country Road 15 (Apt B) | ||||||||||||||||||||||||
| Elkhart, IN 46514 | ||||||||||||||||||||||||
| Oakwood Lake Village | 79 | 65 | 82 | % | 40 | -0- | $ | 428 | ||||||||||||||||
| 308 Gruver Lake | ||||||||||||||||||||||||
| Tunkhannock, PA 18657 | ||||||||||||||||||||||||
| Olmsted Falls | 125 | 115 | 92 | % | 15 | -0- | $ | 396 | ||||||||||||||||
| 26875 Bagley Road | ||||||||||||||||||||||||
| Olmsted Falls, OH 44138 | ||||||||||||||||||||||||
| Oxford Village | 224 | 218 | 97 | % | 59 | 2 | $ | 654 | ||||||||||||||||
| 2 Dolinger Drive | ||||||||||||||||||||||||
| West Grove, PA 19390 | ||||||||||||||||||||||||
| -22- |
| Number of | Sites | Approximate | ||||||||||||||||||||||
| Developed | Occupied | Occupancy | Acreage | Additional | Monthly Rent Per | |||||||||||||||||||
| Name of Community | Sites | at 12/31/17 | Percentage | Developed | Acreage | Site at 12/31/17 | ||||||||||||||||||
| Parke Place | 363 | 305 | 84 | % | 79 | 30 | $ | 355 | ||||||||||||||||
| 2331 Osolo Road | ||||||||||||||||||||||||
| Elkhart, IN 46514 | ||||||||||||||||||||||||
| Pine Ridge Village/Pine Manor | 174 | 165 | 95 | % | 50 | 30 | $ | 543 | ||||||||||||||||
| 100 Oriole Drive | ||||||||||||||||||||||||
| Carlisle, PA 17013 | ||||||||||||||||||||||||
| Pine Valley Estates | 212 | 144 | 68 | % | 38 | -0- | $ | 365 | ||||||||||||||||
| 1283 Sugar Hollow Road | ||||||||||||||||||||||||
| Apollo, PA 15613 | ||||||||||||||||||||||||
| Pleasant View Estates | 110 | 81 | 74 | % | 21 | 9 | $ | 367 | ||||||||||||||||
| 6020 Fort Jenkins Lane | ||||||||||||||||||||||||
| Bloomsburg, PA 17815 | ||||||||||||||||||||||||
| Port Royal Village | 466 | 274 | 59 | % | 101 | -0- | $ | 435 | ||||||||||||||||
| 485 Patterson Lane | ||||||||||||||||||||||||
| Belle Vernon, PA 15012 | ||||||||||||||||||||||||
| River Valley Estates | 232 | 174 | 75 | % | 60 | -0- | $ | 361 | ||||||||||||||||
| 2066 Victory Road | ||||||||||||||||||||||||
| Marion, OH 43302 | ||||||||||||||||||||||||
| Rolling Hills Estates | 89 | 81 | 91 | % | 31 | 1 | $ | 357 | ||||||||||||||||
| 14 Tip Top Circle | ||||||||||||||||||||||||
| Carlisle, PA 17015 | ||||||||||||||||||||||||
| Rostraver Estates | 66 | 61 | 92 | % | 17 | 66 | $ | 416 | ||||||||||||||||
| 1198 Rostraver Road | ||||||||||||||||||||||||
| Belle Vernon, PA 15012 | ||||||||||||||||||||||||
| Sandy Valley Estates | 364 | 243 | 67 | % | 102 | 10 | $ | 387 | ||||||||||||||||
| 11461 State Route 800 N.E. | ||||||||||||||||||||||||
| Magnolia, OH 44643 | ||||||||||||||||||||||||
| Shady Hills | 211 | 196 | 93 | % | 25 | -0- | $ | 466 | ||||||||||||||||
| 1508 Dickerson Road #L1 | ||||||||||||||||||||||||
| Nashville, TN 37207 | ||||||||||||||||||||||||
| Somerset Estates/Whispering Pines | 249 | 192 | 78 | % | 74 | 24 | $ | 359/$448 | ||||||||||||||||
| 1873 Husband Road | ||||||||||||||||||||||||
| Somerset, PA 15501 | ||||||||||||||||||||||||
| Southern Terrace | 118 | 117 | 99 | % | 26 | 4 | $ | 330 | ||||||||||||||||
| 1229 State Route 164 | ||||||||||||||||||||||||
| Columbiana, OH 44408 | ||||||||||||||||||||||||
| Southwind Village (3) | 249 | 243 | 98 | % | 36 | -0- | $ | 400-$741 | ||||||||||||||||
| 435 E. Veterans Highway | ||||||||||||||||||||||||
| Jackson, NJ 08527 | ||||||||||||||||||||||||
| Spreading Oaks Village | 148 | 126 | 85 | % | 37 | 24 | $ | 376 | ||||||||||||||||
| 7140-29 Selby Road | ||||||||||||||||||||||||
| Athens, OH 45701 | ||||||||||||||||||||||||
| -23- |
| Number of | Sites | Approximate | ||||||||||||||||||||||
| Developed | Occupied | Occupancy | Acreage | Additional | Monthly Rent Per | |||||||||||||||||||
| Name of Community | Sites | at 12/31/17 | Percentage | Developed | Acreage | Site at 12/31/17 | ||||||||||||||||||
| Springfield Meadows | 124 | 102 | 82 | % | 43 | 77 | $ | 339 | ||||||||||||||||
| 4100 Troy Road | ||||||||||||||||||||||||
| Springfield, OH 45502 | ||||||||||||||||||||||||
| Suburban Estates | 200 | 184 | 92 | % | 36 | -0- | $ | 381 | ||||||||||||||||
| 33 Maruca Drive | ||||||||||||||||||||||||
| Greensburg, PA 15601 | ||||||||||||||||||||||||
| Summit Estates | 141 | 131 | 93 | % | 25 | 1 | $ | 325 | ||||||||||||||||
| 3305 Summit Road | ||||||||||||||||||||||||
| Ravenna, OH 44266 | ||||||||||||||||||||||||
| Sunny Acres | 207 | 190 | 92 | % | 55 | 3 | $ | 369 | ||||||||||||||||
| 272 Nicole Lane | ||||||||||||||||||||||||
| Somerset, PA 15501 | ||||||||||||||||||||||||
| Sunnyside | 65 | 54 | 83 | % | 8 | -0- | $ | 638 | ||||||||||||||||
| 2901 West Ridge Pike | ||||||||||||||||||||||||
| Eagleville, PA 19403 | ||||||||||||||||||||||||
| Trailmont | 128 | 120 | 94 | % | 32 | -0- | $ | 508 | ||||||||||||||||
| 512 Hillcrest Road | ||||||||||||||||||||||||
| Goodlettsville, TN 37072 | ||||||||||||||||||||||||
| Twin Oaks I & II | 141 | 136 | 96 | % | 21 | -0- | $ | 453 | ||||||||||||||||
| 27216 Cook Road Lot 1-A | ||||||||||||||||||||||||
| Olmsted Township, OH 44138 | ||||||||||||||||||||||||
| Twin Pines | 238 | 198 | 83 | % | 48 | 2 | $ | 420 | ||||||||||||||||
| 2011 West Wilden Avenue | ||||||||||||||||||||||||
| Goshen, IN 46528 | ||||||||||||||||||||||||
| Valley High | 74 | 63 | 85 | % | 13 | 16 | $ | 342 | ||||||||||||||||
| 32 Valley High Lane | ||||||||||||||||||||||||
| Ruffs Dale, PA 15679 | ||||||||||||||||||||||||
| Valley Hills | 272 | 257 | 94 | % | 66 | 67 | $ | 318 | ||||||||||||||||
| 4364 Sandy Lake Road | ||||||||||||||||||||||||
| Ravenna, OH 44266 | ||||||||||||||||||||||||
| Valley Stream | 162 | 107 | 66 | % | 37 | 6 | $ | 319 | ||||||||||||||||
| 60 Valley Stream | ||||||||||||||||||||||||
| Mountaintop, PA 18707 | ||||||||||||||||||||||||
| Valley View I | 104 | 95 | 91 | % | 19 | -0- | $ | 490 | ||||||||||||||||
| 1 Sunflower Drive | ||||||||||||||||||||||||
| Ephrata, PA 17522 | ||||||||||||||||||||||||
| Valley View II | 43 | 43 | 100 | % | 7 | -0- | $ | 507 | ||||||||||||||||
| 1 Sunflower Drive | ||||||||||||||||||||||||
| Ephrata, PA 17522 | ||||||||||||||||||||||||
| Valley View – Honey Brook | 147 | 129 | 88 | % | 28 | 13 | $ | 595 | ||||||||||||||||
| 1 Mark Lane | ||||||||||||||||||||||||
| Honey Brook, PA 19344 | ||||||||||||||||||||||||
| -24- |
| Number of | Sites | Approximate | ||||||||||||||||||||||
| Developed | Occupied | Occupancy | Acreage | Additional | Monthly Rent Per | |||||||||||||||||||
| Name of Community | Sites | at 12/31/17 | Percentage | Developed | Acreage | Site at 12/31/17 | ||||||||||||||||||
| Voyager Estates | 259 | 150 | 58 | % | 72 | 20 | $ | 339 | ||||||||||||||||
| 1002 Satellite Drive | ||||||||||||||||||||||||
| West Newton, PA 15089 | ||||||||||||||||||||||||
| Waterfalls Village | 198 | 158 | 80 | % | 35 | -0- | $ | 539 | ||||||||||||||||
| 3450 Howard Road Lot 21 | ||||||||||||||||||||||||
| Hamburg, NY 14075 | ||||||||||||||||||||||||
| Wayside | 84 | 63 | 75 | % | 16 | 5 | $ | 290 | ||||||||||||||||
| 11900 Duff Road, Lot 58 | ||||||||||||||||||||||||
| Lakeview, OH 43331 | ||||||||||||||||||||||||
| Weatherly Estates | 270 | 260 | 96 | % | 41 | -0- | $ | 461 | ||||||||||||||||
| 271 Weatherly Drive | ||||||||||||||||||||||||
| Lebanon, TN 37087 | ||||||||||||||||||||||||
| Wellington Estates | 207 | 116 | 56 | % | 46 | 1 | $ | 285 | ||||||||||||||||
| 58 Tanner Street | ||||||||||||||||||||||||
| Export, PA 15632 | ||||||||||||||||||||||||
| Woodland Manor | 148 | 86 | 58 | % | 77 | -0- | $ | 362 | ||||||||||||||||
| 338 County Route 11, Lot 165 | ||||||||||||||||||||||||
| West Monroe, NY 13167 | ||||||||||||||||||||||||
| Woodlawn Village (3) | 156 | 144 | 92 | % | 14 | -0- | $ | 602-$700 | ||||||||||||||||
| 265 Route 35 | ||||||||||||||||||||||||
| Eatontown, NJ 07724 | ||||||||||||||||||||||||
| Woods Edge | 597 | 325 | 54 | % | 151 | 50 | $ | 369 | ||||||||||||||||
| 1670 East 650 North | ||||||||||||||||||||||||
| West Lafayette, IN 47906 | ||||||||||||||||||||||||
| Wood Valley | 160 | 88 | 55 | % | 31 | 56 | $ | 322 | ||||||||||||||||
| 2 West Street | ||||||||||||||||||||||||
| Caledonia, OH 43314 | ||||||||||||||||||||||||
| Worthington Arms | 224 | 187 | 83 | % | 36 | -0- | $ | 515 | ||||||||||||||||
| 5277 Columbus Pike | ||||||||||||||||||||||||
| Lewis Center, OH 43035 | ||||||||||||||||||||||||
| Youngstown Estates | 89 | 54 | 61 | % | 14 | 59 | $ | 350 | ||||||||||||||||
| 999 Balmer Road | ||||||||||||||||||||||||
| Youngstown, NY 14174 | ||||||||||||||||||||||||
| Total | 20,029 | 16,208 | 81.4 | %(4) | 4,372 | 1,530 | $ | 428 | (5) | |||||||||||||||
| (1) | Community was closed due to an unusual flooding throughout the region in May 2011. We are currently working on the redevelopment of this community. |
| (2) | We are currently seeking site plan approvals for approximately 220 sites for this property. |
| (3) | Community subject to local rent control laws. |
| (4) | Does not include sites at Memphis Blues. |
| (5) | Weighted average monthly rent per site. |
| -25- |
The Company also has approximately 1,400 additional sites at its properties in various stages of engineering/construction. Due to the difficulties involved in the approval and construction process, it is difficult to predict the number of sites which will be completed in a given year.
Significant Properties
The Company operates manufactured home properties with an approximate cost of $764,439,000. These properties consist of 112 separate manufactured home communities and related improvements. No single community constitutes more than 10% of the total assets of the Company. Our larger properties consist of: Woods Edge with 597 developed sites, Port Royal Village with 466 developed sites, Catalina with 463 developed sites, Allentown with 434 developed sites and Heather Highlands with 405 developed sites.
Mortgages on Properties
The Company has mortgages on many of its properties. The maturity dates of these mortgages range from the years 2018 to 2027, with a weighted average term of 6.9 years. Interest rates vary from fixed rates ranging from 3.71% to 6.5% and a variable rate of prime plus 1.0%. The weighted average interest rate on our mortgages, not including the effect of unamortized debt issuance costs, was approximately 4.2% and 4.3% at December 31, 2017 and 2016, respectively. The aggregate balances of these mortgages, net of unamortized debt issuance costs, total $304,895,117 and $293,025,592 at December 31, 2017 and 2016, respectively. (For additional information, see Part IV, Item 15(a) (1) (vi), Note 5 of the Notes to Consolidated Financial Statements – Loans and Mortgages Payable).
The Company is subject to claims and litigation in the ordinary course of business. For additional information about legal proceedings, see Part IV, Item 15(a)(1)(vi), Note 12 of the Notes to Consolidated Financial Statements – Commitments, Contingencies and Legal Matters.
Item 4 – Mine Safety Disclosures
Not Applicable.
Item 5 – Market for Registrant’s Common Equity, Related Stockholder Matters and Issuer Purchases of Equity Securities
Market Information
Since March 2, 2012, the Company’s common and preferred shares are traded on the New York Stock Exchange (“NYSE”), under the symbol “UMH”. Previously, the Company’s common and preferred shares were traded on the NYSE Amex. The per share range of high and low quotes for the Company’s common stock and distributions paid to common shareholders for each quarter of the last two years are as follows:
| 2017 | 2016 | |||||||||||||||||||||||
| High | Low | Distribution | High | Low | Distribution | |||||||||||||||||||
| First Quarter | $ | 15.35 | $ | 13.65 | $ | 0.18 | $ | 10.79 | $ | 9.00 | $ | 0.18 | ||||||||||||
| Second Quarter | 17.90 | 14.84 | 0.18 | 11.26 | 9.53 | 0.18 | ||||||||||||||||||
| Third Quarter | 17.29 | 14.25 | 0.18 | 12.70 | 11.07 | 0.18 | ||||||||||||||||||
| Fourth Quarter | 16.06 | 14.02 | 0.18 | 15.50 | 11.28 | 0.18 | ||||||||||||||||||
| $ | 0.72 | $ | 0.72 | |||||||||||||||||||||
On February 28, 2018, the closing price of the Company’s stock was $11.68.
| -26- |
Shareholder Information
As of February 28, 2018, there were approximately 1,018 registered shareholders of the Company’s common stock based on the number of record owners.
Distributions and Dividends
We have historically paid regular quarterly distributions to holders of our common stock. In addition, we are obligated to make distributions to holders of our preferred stock. For the years ended December 31, 2017 and 2016, total distributions paid by the Company for common stock amounted to $23,639,397 or $0.72 per share (for income tax purposes, all was characterized as return of capital) and $20,018,822 or $0.72 per share (for income tax purposes, $0.09549 characterized as ordinary income, $0.01425 characterized as capital gains and $0.61026 characterized as return of capital), respectively.
It is the Company’s intention to continue making comparable quarterly distributions to holders of our common stock. On January 25, 2018, the Board of Directors declared a cash dividend of $0.18 per share to be paid on March 15, 2018 to common shareholders of record as of the close of business on February 15, 2018. Future dividend policy is dependent on the Company’s earnings, capital requirements, REIT requirements, financial condition, availability and cost of bank financing and other factors considered relevant by the Board of Directors.
Recent Sales of Unregistered Securities
None.
Issuer Purchases of Equity Securities
On January 25, 2018, the Board of Directors reaffirmed its Share Repurchase Program (the “Repurchase Program”) that authorizes the Company to purchase up to $10,000,000 in the aggregate of the Company’s common stock. The Repurchase Program was originally created in June 2008 and is intended to be implemented through purchases made from time to time using a variety of methods, which may include open market purchases, privately negotiated transactions or block trades, or by any combination of such methods, in accordance with applicable insider trading and other securities laws and regulations. The size, scope and timing of any purchases will be based on business, market and other conditions and factors, including price, regulatory and contractual requirements or consents, and capital availability. The Repurchase Program does not require the Company to acquire any particular amount of common stock, and the Repurchase Program may be suspended, modified or discontinued at any time at the Company’s discretion without prior notice. There have been no purchases under the Repurchase Program to date.
Securities Authorized for Issuance Under Equity Compensation Plans
On June 13, 2013, the shareholders approved and ratified the Company’s 2013 Stock Option and Stock Award Plan (the “2013 Plan”) authorizing the grant to officers and key employees of options to purchase up to 3,000,000 shares of common stock. The 2013 Plan replaced the Company’s 2003 Stock Option and Award Plan, as amended, which, pursuant to its terms, terminated in 2013. The outstanding options under the 2003 Stock Option and Award Plan, as amended, remain outstanding until exercised, forfeited or expired. See Note 6 of the Notes to the Consolidated Financial Statements for a description of the plans. See Item 12 – Security Ownership of Certain Beneficial Owners and Management and Related Matters for a table of beneficial ownership of the Company’s common stock.
The following table summarizes information, as of December 31, 2017, relating to equity compensation plans of the Company (including individual compensation arrangements) pursuant to which equity securities of the Company are authorized for issuance:
| -27- |
| Plan Category | Number
of Securities to be Issued Upon Exercise of Outstanding Options, Warrants and Rights (a) | Weighted
Average Exercise Price of Outstanding Options, Warrants and Rights | Number
of Securities Remaining Available for Future Issuance under Equity Compensation Plans (excluding Securities reflected in column (a)) | |||||||||
| Equity Compensation Plans
Approved by Security Holders | 1,778,100 | $ | 11.60 | 613,500 | ||||||||
| Equity Compensation
Plans not Approved by Security Holders |
N/A |
N/A |
N/A | |||||||||
| Total | 1,778,100 | $ | 11.60 | 613,500 | ||||||||
Comparative Stock Performance
The following line graph compares the total return of the Company’s common stock for the last five years to the FTSE NAREIT All REITs Index published by the National Association of Real Estate Investment Trusts (“NAREIT”) and to the S&P 500 Index for the same period. The graph assumes a $100 investment in our common stock and in each of the indexes listed below on December 31, 2012 and the reinvestment of all dividends. The total return reflects stock price appreciation and dividend reinvestment for all three comparative indices. The information herein has been obtained from sources believed to be reliable, but neither its accuracy nor its completeness is guaranteed. Our stock performance shown in the graph below is not indicative of future stock performance.
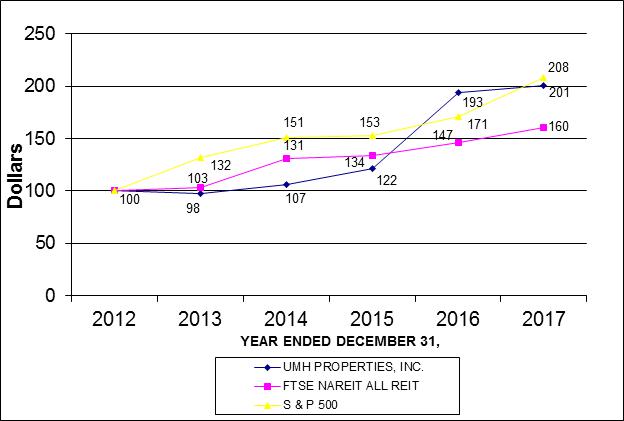
| -28- |
Item 6 – Selected Financial Data
The following table sets forth selected financial and other information for the Company as of and for each of the years in the five year period ended December 31, 2017. The historical financial data has been derived from our historical financial statements. This following information should be read in conjunction with “Management’s Discussion and Analysis of Financial Condition and Results of Operations,” and the Consolidated Financial Statements and Notes thereto included elsewhere herein.
| 2017 | 2016 (1) | 2015 (1) | 2014 (1) | 2013 (1) | ||||||||||||||||
| Operating Data: | ||||||||||||||||||||
| Rental and Related Income | $ | 101,801,425 | $ | 90,679,557 | $ | 74,762,548 | $ | 63,886,010 | $ | 53,477,893 | ||||||||||
| Sales of Manufactured Homes | 10,846,494 | 8,534,272 | 6,754,123 | 7,545,923 | 8,727,214 | |||||||||||||||
| Total Income | 112,647,919 | 99,213,829 | 81,516,671 | 71,431,933 | 62,205,107 | |||||||||||||||
| Community Operating Expenses | 47,846,565 | 42,638,333 | 37,049,462 | 33,592,327 | 29,140,920 | |||||||||||||||
| Community NOI (2) | 53,954,860 | 48,041,224 | 37,713,086 | 30,293,683 | 24,336,973 | |||||||||||||||
| Total Expenses | 96,616,337 | 83,255,514 | 72,076,546 | 64,521,158 | 58,009,654 | |||||||||||||||
| Interest Income | 2,006,880 | 1,584,585 | 1,819,567 | 2,098,974 | 2,186,387 | |||||||||||||||
| Dividend Income | 8,134,898 | 6,636,126 | 4,399,181 | 4,065,986 | 3,481,514 | |||||||||||||||
| Gain on Sales of Securities, net | 1,747,528 | 2,285,301 | 204,230 | 1,542,589 | 4,055,812 | |||||||||||||||
| Interest Expense | 15,876,972 | 15,432,364 | 14,074,446 | 10,716,722 | 8,312,197 | |||||||||||||||
| Net Income | 12,668,034 | 11,534,559 | 2,144,205 | 4,237,803 | 5,836,823 | |||||||||||||||
| Net Loss Attributable to Common Shareholders | (7,679,265 | ) | (2,568,873 | ) | (6,122,993 | ) | (3,318,785 | ) | (1,719,765 | ) | ||||||||||
| Net Loss Attributable to Common Shareholders Per Share | ||||||||||||||||||||
| Basic and Diluted | (0.24 | ) | (0.10 | ) | (0.24 | ) | (0.15 | ) | (0.09 | ) | ||||||||||
| Cash Flow Data: | ||||||||||||||||||||
| Net Cash Provided
(Used) by: Operating Activities | $ | 41,341,162 | $ | 29,353,412 | $ | 25,708,212 | $ | 24,326,461 | $ | 11,238,088 | ||||||||||
| Investing Activities | (152,919,761 | ) | (77,567,390 | ) | (148,674,626 | ) | (56,033,767 | ) | (110,365,339 | ) | ||||||||||
| Financing Activities | 130,604,097 | 45,894,673 | 121,419,519 | 32,174,955 | 95,706,570 | |||||||||||||||
| Balance Sheet Data: | ||||||||||||||||||||
| Total Investment Property | $ | 764,438,633 | $ | 640,216,767 | $ | 577,709,074 | $ | 448,164,459 | $ | 365,824,412 | ||||||||||
| Total Assets | 823,881,326 | 680,444,818 | 600,317,390 | 476,040,197 | 405,851,968 | |||||||||||||||
| Mortgages Payable,
net of unamortized debt issuance costs | 304,895,117 | 293,025,592 | 283,049,802 | 180,752,425 | 158,715,407 | |||||||||||||||
| Loans Payable, net of unamortized debt issuance costs | 84,704,487 | 58,285,385 | 57,862,206 | 77,128,880 | 48,915,527 | |||||||||||||||
| Series A 8.25%
Cumulative Redeemable Preferred Stock | -0- | 91,595,000 | 91,595,000 | 91,595,000 | 91,595,000 | |||||||||||||||
| Series B 8.0%
Cumulative Redeemable Preferred Stock | 95,030,000 | 95,030,000 | 45,030,000 | -0- | -0- | |||||||||||||||
| Series C 6.75%
Cumulative Redeemable Preferred Stock | 143,750,000 | -0- | -0- | -0- | -0- | |||||||||||||||
| Total Shareholders’ Equity | 421,215,464 | 317,031,967 | 246,238,425 | 208,827,105 | 190,585,737 | |||||||||||||||
| Other Information: | ||||||||||||||||||||
| Average Number of Shares Outstanding | ||||||||||||||||||||
| Basic and Diluted | 32,675,650 | 27,808,895 | 25,932,626 | 22,496,103 | 18,724,321 | |||||||||||||||
| Funds from Operations (2) | $ | 19,959,411 | $ | 20,647,390 | $ | 12,834,786 | $ | 11,837,322 | $ | 9,943,156 | ||||||||||
| Core Funds from Operations (2) | $ | 23,461,898 | $ | 20,731,742 | $ | 14,267,036 | $ | 12,320,844 | $ | 11,398,698 | ||||||||||
| Normalized Funds from Operations (2) | $ | 21,714,370 | $ | 18,446,441 | $ | 14,187,806 | $ | 10,778,255 | $ | 7,342,886 | ||||||||||
| Cash Dividends Per Common Share | $ | 0.72 | $ | 0.72 | $ | 0.72 | $ | 0.72 | $ | 0.72 | ||||||||||
| (1) | Financial information has been revised to reflect certain reclassifications in prior periods to conform to the current period presentation. | |
| (2) | Refer to Item 7, Supplemental Measures, contained in this Form 10-K for information regarding the presentation of community NOI, and for the presentation and reconciliation of funds from operations, core funds from operations and normalized funds from operations to net loss attributable to common shareholders. |
| -29- |
Item 7 – Management’s Discussion and Analysis of Financial Condition and Results of Operations
Cautionary Statement Regarding Forward-Looking Statements
Statements contained in this Form 10-K, that are not historical facts are forward-looking statements within the meaning of Section 27A of the Securities Act of 1933, as amended (the “Securities Act”), and Section 21E of the Securities Exchange Act of 1934, as amended (the “Exchange Act”). Forward-looking statements provide our current expectations or forecasts of future events. Forward-looking statements include statements about the Company’s expectations, beliefs, intentions, plans, objectives, goals, strategies, future events, performance and underlying assumptions and other statements that are not historical facts. Forward-looking statements can be identified by their use of forward-looking words, such as “may,” “will,” “anticipate,” “expect,” “believe,” “intend,” “plan,” “should,” “seek” or comparable terms, or the negative use of those words, but the absence of these words does not necessarily mean that a statement is not forward-looking.
The forward-looking statements are based on our beliefs, assumptions and expectations of our future performance, taking into account all information currently available to us. Forward-looking statements are not predictions of future events. These beliefs, assumptions and expectations can change as a result of many possible events or factors, not all of which are known to us. Some of these factors are described below and under the headings “Business”, “Risk Factors” and “Management’s Discussion and Analysis of Financial Condition and Results of Operations”. These and other risks, uncertainties and factors could cause our actual results to differ materially from those included in any forward-looking statements we make. Any forward-looking statement speaks only as of the date on which it is made. New risks and uncertainties arise over time, and it is not possible for us to predict those events or how they may affect us. Except as required by law, we are not obligated to, and do not intend to, update or revise any forward-looking statements, whether as a result of new information, future events or otherwise. Important factors that could cause actual results to differ materially from our expectations include, among others:
| ● | changes in the real estate market conditions and general economic conditions; | |
| ● | the inherent risks associated with owning real estate, including local real estate market conditions, governing laws and regulations affecting manufactured housing communities and illiquidity of real estate investments; | |
| ● | increased competition in the geographic areas in which we own and operate manufactured housing communities; | |
| ● | our ability to continue to identify, negotiate and acquire manufactured housing communities and/or vacant land which may be developed into manufactured housing communities on terms favorable to us; | |
| ● | our ability to maintain rental rates and occupancy levels; | |
| ● | changes in market rates of interest; | |
| ● | our ability to repay debt financing obligations; | |
| ● | our ability to refinance amounts outstanding under our credit facilities at maturity on terms favorable to us; | |
| ● | our ability to comply with certain debt covenants; | |
| ● | our ability to integrate acquired properties and operations into existing operations; | |
| ● | the availability of other debt and equity financing alternatives; | |
| ● | continued ability to access the debt or equity markets; | |
| ● | the loss of any member of our management team; | |
| ● | our ability to maintain internal controls and processes to ensure all transactions are accounted for properly, all relevant disclosures and filings are timely made in accordance with all rules and regulations, and any potential fraud or embezzlement is thwarted or detected; | |
| ● | the ability of manufactured home buyers to obtain financing; | |
| ● | the level of repossessions by manufactured home lenders; | |
| ● | market conditions affecting our investment securities; | |
| ● | changes in federal or state tax rules or regulations that could have adverse tax consequences; | |
| ● | our ability to qualify as a REIT for federal income tax purposes; and | |
| ● | those risks and uncertainties referenced under the heading “Risk Factors” contained in this Form 10-K and the Company’s filings with the Securities and Exchange Commission. |
| -30- |
You should not place undue reliance on these forward-looking statements, as events described or implied in such statements may not occur. The forward-looking statements contained in this Form 10-K speak only as of the date hereof and the Company expressly disclaims any obligation to publicly update or revise any forward-looking statements whether as a result of new information, future events, or otherwise.
2017 Accomplishments
| ● | Increased Rental and Related Income by 12.3%; | |
| ● | Increased Community Net Operating Income (“NOI”) by 12.3%; | |
| ● | Increased Same Property NOI by 7.6%; | |
| ● | Increased Same Property Occupancy by 150 basis points from 81.2% to 82.7%; | |
| ● | Increased home sales by 27.1%; | |
| ● | Acquired 11 communities containing approximately 2,000 homesites for a total cost of $63.3 million, including our first community in Maryland, bringing our total property portfolio to 112 manufactured home communities with over 20,000 developed homesites; | |
| ● | Completed Phase I of a redevelopment community, Memphis Blues, our first all rental community; | |
| ● | Increased our rental home portfolio by 948 homes to approximately 5,600 total rental homes, representing an increase of 20.3%; | |
| ● | Increased rental home occupancy by 150 basis points from 91.5% to 93.0%; | |
| ● | Reduced the weighted average interest rate on our mortgage debt from 4.3% to 4.2%; | |
| ● | Reduced the weighted average interest rate on our total debt from 4.1% to 4.0%; | |
| ● | Issued 5,750,000 shares of a new 6.75% Series C Cumulative Redeemable Preferred Stock, for net proceeds after deducting the underwriting discount and other estimated offering expenses, of approximately $139 million; | |
| ● | Redeemed our high coupon 8.25% Series A Preferred Stock, resulting in $1.4 million in annual preferred dividend savings; | |
| ● | Issued 1,400,000 shares of our common stock raising net proceeds of $22.5 million, in conjunction with our inclusion in the MSCI REIT Index; | |
| ● | Raised $60.4 million through our Dividend Reinvestment and Stock Purchase Plan; | |
| ● | Reduced our Net Debt to Total Market Capitalization from 35.4% to 31.7% and our Net Debt Less Securities to Total Market Capitalization from 24.3% to 20.2%; and, | |
| ● | Increased our total market capitalization to $1.2 billion, representing an increase of 18%. |
Overview
The following discussion and analysis of the consolidated financial condition and results of operations should be read in conjunction with “Selected Financial Data” and the historical Consolidated Financial Statements and Notes thereto included elsewhere in this Form 10-K.
The Company is a self-administered, self-managed, REIT with headquarters in Freehold, New Jersey. The Company’s primary business is the ownership and operation of manufactured home communities, which includes leasing manufactured home spaces on an annual or month-to-month basis to residential manufactured home owners. The Company also leases homes to residents and, through its taxable REIT subsidiary, S&F, sells and finances homes to residents and prospective residents of our communities.
Our communities are located in New Jersey, New York, Ohio, Pennsylvania, Tennessee, Indiana, Michigan and Maryland. UMH has continued to execute our growth strategy of purchasing well-located communities in our target markets, including the energy-rich Marcellus and Utica shale regions. During the year ended December 31, 2017, we purchased eleven manufactured home communities, for an aggregate purchase price of $63,290,000. These acquisitions added approximately 2,000 developed homesites to our portfolio, bringing our total to 112 communities containing approximately 20,000 developed homesites.
| -31- |
The Company earns income from the operation of its manufactured home communities, leasing of manufactured homesites, the rental of manufactured homes, the sale and finance of manufactured homes, the brokering of home sales, and from appreciation in the values of the manufactured home communities and vacant land owned by the Company. The Company also invests in securities of other REITs which the Company generally limits to no more than approximately 20% of its undepreciated assets.
Occupancy in our properties, as well as our ability to increase rental rates, directly affects revenues. In 2017, total income increased 13.5% from the prior year and Community NOI (as defined below) increased 12.3% from the prior year, primarily due to the acquisition and rental programs in 2016 and 2017. Overall occupancy increased from 81.0% at December 31, 2016 to 81.4% at December 31, 2017. Same property occupancy, which includes communities owned and operated as of January 1, 2016, increased from 81.2% at December 31, 2016 to 82.7% at December 31, 2017. Overall occupancy includes communities acquired in 2017 at a weighted average occupancy of 67%.
Sales of manufactured homes are getting stronger and have increased by approximately 27%. Our sales operations have been impacted by limited chattel financing options available in our industry. This has affected the ability of homebuyers to qualify for manufactured home loans. We are optimistic that future regulatory changes may increase our consumer’s ability to qualify for loans to purchase homes which should result in increased demand. Demand for housing remains healthy, due to improvements in the economy, sustained wage and job growth and favorable interest rates. Conventional single-family home prices continue their rise supported by low inventories and increasing sales. As household formation strengthens and for-sale inventory remains limited, a large share of housing demand will be looking at alternative forms of housing. Our property type offers substantial comparative value that should result in increased demand.
The macro-economic environment and current housing fundamentals continue to favor home rentals. Rental homes in a manufactured home community allow the resident to obtain the efficiencies of factory-built housing and the amenities of community living for less than the cost of other forms of affordable housing. We continue to see increased demand for rental homes. During 2017, our portfolio of rental homes increased by 948 homes. Occupied rental homes represent approximately 32.2% of total occupied sites. Occupancy in rental homes continues to be strong and is at 93.0% as of December 31, 2017. We compare favorably with other types of rental housing, including apartments, and we will continue to allocate capital to rental home purchases, as demand dictates.
Revenues also include interest and dividend income and realized gain on securities transactions, net. The Company holds a portfolio of marketable securities of other REITs with a fair value of $132,964,276 at December 31, 2017. The Company generally limits its marketable securities investments to no more than approximately 20% of its undepreciated assets. The REIT securities portfolio provides the Company with additional diversification, liquidity and income, and serves as a proxy for real estate when more favorable risk adjusted returns are not available. As of December 31, 2017, the Company’s portfolio consisted of 4% REIT preferred stocks and 96% REIT common stocks.
The Company invests in these REIT securities and, from time to time, may use margin debt when an adequate yield spread can be obtained. As of December 31, 2017, the Company has borrowings of $37,157,467 under its margin line at 2.0% interest. The Company’s weighted average yield on the securities portfolio was approximately 7.4% at December 31, 2017. The Company realized a net gain of $1,747,528 on sale of securities in 2017 as compared to a net gain of $2,285,301 during 2016. At December 31, 2017, the Company had unrealized gains of $11,519,582 in its REIT securities portfolio. The dividends received from our securities investments continue to meet our expectations. It is our intent to hold these securities for investment on a long-term basis.
The Company continues to strengthen its balance sheet. During 2017, the Company raised approximately $60.4 million in new capital through the Dividend Reinvestment and Stock Purchase Plan (“DRIP”). The Company also issued 1,400,000 shares of our common stock, raising net proceeds of $22.5 million, in conjunction with our inclusion in the MSCI REIT Index. This capital was used for general corporate purposes, which included purchase of manufactured homes for sale or lease to customers, expansion of its existing communities, acquisitions of additional properties, and repayment of indebtedness on a short-term basis.
The Company also reduced its cost of capital in 2017 by issuing 5,750,000 shares of a new 6.75% Series C Cumulative Redeemable Preferred Stock (“Series C Preferred Stock”) for net proceeds of $139.0 million, and redeeming all of the 3,663,800 outstanding shares of its 8.25% Series A Cumulative Redeemable Preferred Stock (“Series A Preferred Stock”). This 150 basis point reduction will result in $1.4 million in annual preferred dividend savings going forward. Subsequent to yearend, UMH issued and sold 2,000,000 shares of a new 6.375% Series D Cumulative Redeemable Preferred Stock (Series D Preferred Stock), raising net proceeds from the offering after expenses of approximately $48.1 million.
| -32- |
At December 31, 2017, the Company had approximately $23.2 million in cash and cash equivalents and $15 million available on our credit facility, with an additional $75 million potentially available pursuant to an accordion feature. We also had $26.3 million available on our revolving lines of credit for the financing of home sales and the purchase of inventory. In addition, we held approximately $133.0 million in marketable REIT securities encumbered by $37.2 million in margin loans. In general, the Company may borrow up to 50% of the value of the marketable securities.
The Company intends to continue to increase its real estate investments. Our business plan includes acquiring communities that yield in excess of our cost of funds and then making physical improvements, including adding rental homes onto otherwise vacant sites. In 2016 and 2017, we have added a total of fourteen manufactured home communities to our portfolio, encompassing approximately 2,300 developed sites. These manufactured home communities were acquired with an average occupancy rate of 68%. The Company will utilize the rental home program to increase occupancy rates and improve operating results at these communities. There is no guarantee that any additional opportunities will materialize or that the Company will be able to take advantage of such opportunities. The growth of our real estate portfolio depends on the availability of suitable properties which meet the Company’s investment criteria and appropriate financing. Competition in the market areas in which the Company operates is significant and affects acquisitions, occupancy levels, rental rates and operating expenses of certain properties.
See PART I, Item 1- Business and Item 1A – Risk Factors for a more complete discussion of the economic and industry-wide factors relevant to the Company, the Company’s lines of business and principal products and services, and the opportunities, challenges and risks on which the Company is focused.
Acquisitions
| Community | Date of Acquisition | State | Number of Sites | Purchase Price | Number of Acres | Occupancy at Acquisition | ||||||||||||||
| Acquisitions in 2017 | ||||||||||||||||||||
| Hillcrest Estates and Marysville Estates | January 20, 2017 | OH | 532 | $ | 9,588,000 | 149 | 57 | % | ||||||||||||
| Boardwalk and Parke Place | January 20, 2017 | IN | 559 | 24,437,000 | 155 | 77 | % | |||||||||||||
| Hillcrest Crossing | January 24, 2017 | PA | 200 | 2,485,000 | 78 | 40 | % | |||||||||||||
| Cinnamon Woods | May 31, 2017 | MD | 63 | 4,000,000 | 79 | 92 | % | |||||||||||||
| Pennsylvania 5 Community Portfolio | December 22, 2017 | PA | 643 | 22,780,000 | 141 | 72 | % | |||||||||||||
| Total 2017 | 1,997 | $ | 63,290,000 | 602 | 67 | % | ||||||||||||||
| Acquisitions in 2016 | ||||||||||||||||||||
| Lakeview Meadows and Wayside | September 1, 2016 | OH | 165 | $ | 2,954,000 | 98 | 64 | % | ||||||||||||
| Springfield Meadows | December 19, 2016 | OH | 124 | 4,323,000 | 121 | 82 | % | |||||||||||||
| Total 2016 | 289 | $ | 7,277,000 | 219 | 74 | % | ||||||||||||||
| -33- |
Supplemental Measures
In addition to the results reported in accordance with GAAP, management’s discussion and analysis of financial condition and results of operations include certain non-GAAP financial measures that in management’s view of the business we believe are meaningful as they allow the investor the ability to understand key operating details of our business both with and without regard to certain accounting conventions or items that may not always be indicative of recurring annual cash flow of the portfolio. These non-GAAP financial measures as determined and presented by us may not be comparable to related or similarly titled measures reported by other companies, and include Community Net Operating Income (“Community NOI”), Funds from Operations (“FFO”), Core Funds from Operations (“Core FFO”) and Normalized Funds from Operations (“Normalized FFO”).
We define Community NOI as rental and related income less community operating expenses such as real estate taxes, repairs and maintenance, community salaries, utilities, insurance and other expenses. We believe that Community NOI is helpful to investors and analysts as a direct measure of the actual operating results of our manufactured home communities, rather than our Company overall. Community NOI should not be considered a substitute for the reported results prepared in accordance with GAAP. Community NOI should not be considered as an alternative to net income (loss) as an indicator of our financial performance, or to cash flows as a measure of liquidity; nor is it indicative of funds available for our cash needs, including our ability to make cash distributions.
The Company’s Community NOI is calculated as follows:
| 2017 | 2016 | 2015 | 2014 | 2013 | ||||||||||||||||
| Rental and Related Income | $ | 101,801,425 | $ | 90,679,557 | $ | 74,762,548 | $ | 63,886,010 | $ | 53,477,893 | ||||||||||
| Community Operating Expenses | (47,846,565 | ) | (42,638,333 | ) | (37,049,462 | ) | (33,592,327 | ) | (29,140,920 | ) | ||||||||||
| Community NOI | $ | 53,954,860 | $ | 48,041,224 | $ | 37,713,086 | $ | 30,293,683 | $ | 24,336,973 | ||||||||||
We also assess and measure our overall operating results based upon an industry performance measure referred to as FFO, which management believes is a useful indicator of our operating performance. FFO is used by industry analysts and investors as a supplemental operating performance measure of a REIT. FFO, as defined by NAREIT, represents net income (loss) attributable to common shareholders, as defined by GAAP, excluding extraordinary items, as defined under GAAP, gains or losses from sales of previously depreciated real estate assets, impairment charges related to depreciable real estate assets, plus certain non-cash items such as real estate asset depreciation and amortization. NAREIT created FFO as a non-GAAP supplemental measure of REIT operating performance. We define Core FFO as FFO plus acquisition costs and costs of early extinguishment of debt. We define Normalized FFO as Core FFO excluding gains and losses realized on securities investments and certain non-recurring charges. FFO, Core FFO and Normalized FFO should be considered as supplemental measures of operating performance used by REITs. FFO, Core FFO and Normalized FFO exclude historical cost depreciation as an expense and may facilitate the comparison of REITs which have a different cost basis. The items excluded from FFO, Core FFO and Normalized FFO are significant components in understanding the Company’s financial performance.
FFO, Core FFO and Normalized FFO (i) do not represent Cash Flow from Operations as defined by GAAP; (ii) should not be considered as an alternative to net income (loss) as a measure of operating performance or to cash flows from operating, investing and financing activities; and (iii) are not alternatives to cash flow as a measure of liquidity. FFO, Core FFO and Normalized FFO, as calculated by the Company, may not be comparable to similarly titled measures reported by other REITs.
| -34- |
The Company’s FFO, Core FFO and Normalized FFO are calculated as follows:
| 2017 | 2016 | 2015 | 2014 | 2013 | ||||||||||||||||
| Net Income (Loss) Attributable
to Common Shareholders | $ | (7,679,265 | ) | $ | (2,568,873 | ) | $ | (6,122,993 | ) | $ | (3,318,785 | ) | $ | (1,719,765 | ) | |||||
| Depreciation Expense | 27,557,746 | 23,214,100 | 18,877,511 | 15,163,420 | 11,681,724 | |||||||||||||||
| (Gain) Loss
on Sales of Depreciable Assets | 80,930 | 2,163 | 80,268 | (7,313 | ) | (18,803 | ) | |||||||||||||
| FFO | 19,959,411 | 20,647,390 | 12,834,786 | 11,837,322 | 9,943,156 | |||||||||||||||
| Adjustments: | ||||||||||||||||||||
| Acquisition Costs | -0- | 79,231 | 957,219 | 483,522 | 1,455,542 | |||||||||||||||
| Early Extinguishment of Debt (1) | -0- | 5,121 | 475,031 | -0- | -0- | |||||||||||||||
| Redemption of Preferred Stock | 3,502,487 | -0- | -0- | -0- | -0- | |||||||||||||||
| Core FFO | 23,461,898 | 20,731,742 | 14,267,036 | 12,320,844 | 11,398,698 | |||||||||||||||
| Adjustments: | ||||||||||||||||||||
| Gain on Sales of Securities, net | (1,747,528 | ) | (2,285,301 | ) | (204,230 | ) | (1,542,589 | ) | (4,055,812 | ) | ||||||||||
| Settlement of Memphis Mobile | ||||||||||||||||||||
| City Litigation (2) | -0- | -0- | 125,000 | -0- | -0- | |||||||||||||||
| Normalized FFO | $ | 21,714,370 | $ | 18,446,441 | $ | 14,187,806 | $ | 10,778,255 | $ | 7,342,886 | ||||||||||
| (1) | Included in Interest Expense on the Consolidated Statements of Income (Loss). | |
| (2) | Included in Community Operating Expenses on the Consolidated Statements of Income (Loss). |
Results of Operations
2017 vs. 2016
Rental and related income increased from $90,679,557 for the year ended December 31, 2016 to $101,801,425 for the year ended December 31, 2017, or 12%. This increase was due to the acquisitions during 2016 and 2017, as well as an increase in rental rates, same property occupancy and additional rental homes. During 2017, the Company raised rental rates by 3% to 4% at most communities. Rent increases vary depending on overall market conditions and demand. Occupancy, as well as the ability to increase rental rates, directly affects revenues. The Company has been acquiring communities with vacant sites that can potentially be occupied and earn income in the future. Overall occupancy has increased from 81.0% at December 31, 2016 to 81.4% at December 31, 2017. Overall occupancy includes communities acquired in 2017 and 2016, which had a weighted average occupancy of 67% and 74%, respectively, at the time of acquisition. Same property occupancy has increased from 81.2% at December 31, 2016 to 82.7% at December 31, 2017. The overall and same property occupancy rates is exclusive of the sites at Memphis Blues, which is under redevelopment due to a flood in 2011. Demand for rental homes continues to be strong. As of December 31, 2017, we had approximately 5,600 rental homes with an occupancy of 93.0%. We continue to evaluate the demand for rental homes and will invest in additional homes as demand dictates. Vacant sites allow for future revenue growth.
Community operating expenses increased from $42,638,333 for the year ended December 31, 2016 to $47,846,565 for the year ended December 31, 2017, or 12%. This increase was due to the acquisitions during 2016 and 2017.
Community NOI increased from $48,041,224 for the year ended December 31, 2016 to $53,954,860 for the year ended December 31, 2017, or 12%. This increase was primarily due to the acquisitions during 2016 and 2017 and an increase in rental rates, occupancy and rental homes. The Operating Expense Ratio (defined as Community Operating Expenses divided by Rental and Related Income) was 47.0% for both the years ended December 31, 2017 and 2016. Many acquisitions have deferred maintenance requiring higher than normal expenditures in the first few years of ownership. Because most of the community expenses are fixed costs, as occupancy rates continue to increase, these expense ratios will continue to improve. Because of the Company’s ability to increase its rental rates annually, increasing costs due to inflation and changing prices have generally not had a material effect on revenues and income from continuing operations.
| -35- |
Sales of manufactured homes increased from $8,534,272 for the year ended December 31, 2016 to $10,846,494 for the year ended December 31, 2017, or 27%. The total number of homes sold was 222 homes in 2017 as compared to 170 homes in 2016. There were 74 new homes sold in 2017 as compared to 61 in 2016. The Company’s average sales price was $48,858 and $50,202 for the years ended December 31, 2017 and 2016, respectively. Cost of sales of manufactured homes increased from $6,466,520 for the year ended December 31, 2016 to $8,471,190 for the year ended December 31, 2017, or 31%. The gross profit percentage was 22% and 24% for 2017 and 2016, respectively. Selling expenses remained relatively stable at $3,095,155 for the year ended December 31, 2017 as compared to $2,852,405 for the year ended December 31, 2016. Loss from the sales operations (defined as sales of manufactured homes less cost of sales of manufactured homes less selling expenses less interest on the financing of inventory) decreased from $1,444,076 for the year ended December 31, 2016 to $1,147,501 for the year ended December 31, 2017, an improvement of 21%. The losses on sales include selling expenses of approximately $3.1 million for the year ended December 31, 2017. Many of these costs, such as rent, salaries, and to an extent, advertising and promotion, are fixed. Sales of manufactured homes have not yet returned to pre-recession levels. The U.S. homeownership rate was 64.2% in the fourth quarter of 2017, according to the U.S. Census. This is down from 69.2% at its peak at the end of 2004. The conventional single-family housing market has strengthened and conventional home prices continue their rise. The inherent affordability of our property type becomes more and more apparent which should result in increased demand. The Company continues to be optimistic about future sales and rental prospects given the fundamental need for affordable housing. The Company believes that sales of new homes produces new rental revenue and is an investment in the upgrading of our communities.
General and Administrative Expenses increased from $8,004,925 for the year ended December 31, 2016 to $9,645,681 for the year ended December 31, 2017, or 21%. This increase was primarily due to an increase in personnel and personnel costs, as headcount increased in connection with the Company's growth, and an increase in non-cash stock compensation expense. Stock compensation expense increased from $1,064,678 for the year ended December 31, 2016 to $1,314,491 for the year ended December 31, 2017. These increases were primarily due to the increase in our stock price during the year, which increased the fair value of options granted. The weighted-average fair value of options granted increased from $0.81 per share for the year ended December 31, 2016 to $1.81 for the year ended December 31, 2017. Additionally, the Founder and Chairman of the Board was granted a discretionary stock option award of 100,000 shares, as well as 1,100 shares of restricted stock. Although these awards are usually recognized over the vesting period, the entire compensation cost of approximately $201,000 was recognized at the time of grant since he is of retirement age. General and Administrative expenses as a percentage of gross revenue (Total Income plus Interest, Dividend and Other Income) remains in line at 7.8% and 7.4% at December 31, 2017 and 2016, respectively.
Acquisition Costs amounted to $-0- for the year ended December 31, 2017 and $79,231 for the year ended December 31, 2016. As a result of the adoption of Accounting Standards Update 2017-01 “Business Combinations (Topic 805) Clarifying the Definition of a Business” prospectively as of January 1, 2017, we account for our property acquisitions as acquisitions of assets and no longer account for our property acquisitions as business combinations. In an acquisition of assets, certain acquisition costs are capitalized to real estate investments as part of the purchase price as opposed to being expensed as Acquisition Costs under the previous accounting treatment for business combinations.
Depreciation expense increased from $23,214,100 for the year ended December 31, 2016 to $27,557,746 for the year ended December 31, 2017, or 19%. This increase was primarily due to the acquisitions and the increase in rental homes during 2016 and 2017.
Interest income increased from $1,584,585 for the year ended December 31, 2016 to $2,006,880 for the year ended December 31, 2017, or 27%. This increase was primarily due to an increase in the average balance of notes receivable from $18.3 million for the year ended December 31, 2016 to $21.2 million for the year ended December 31, 2017.
Dividend income increased from $6,636,126 for the year ended December 31, 2016 to $8,134,898 for the year ended December 31, 2017, or 23%. This increase was due to an increase in the average balance of securities from $91.9 million for the year ended December 31, 2016 to $120.9 million for the year ended December 31, 2017. The dividends received from our securities investments were at a weighted average yield of 7.4% and 6.8% as of December 31, 2017 and 2016, respectively.
| -36- |
Realized gain on sales of securities, net consists of the following:
| Year Ended December 31, | ||||||||
| 2017 | 2016 | |||||||
| Gross realized gains | $ | 1,749,034 | $ | 2,287,454 | ||||
| Gross realized losses | (1,506 | ) | (2,153 | ) | ||||
| Total Gain on Securities Transactions, net | $ | 1,747,528 | $ | 2,285,301 | ||||
The Company had an accumulated net unrealized gain on its securities portfolio of $11,519,582 as of December 31, 2017.
Other income increased from $504,759 at December 31, 2016 to $705,048 at December 31, 2017. The increase is mainly due to an upfront oil and gas bonus payment of $251,680 that the Company received at one of its communities.
Interest expense remained relatively stable for the year ended December 31, 2017 as compared to the year ended December 31, 2016. During the year, we obtained 3 new mortgage loans, and assumed 1 loan in conjunction with an acquisition, totaling $47 million. The average balance of mortgages payable was approximately $299 million during 2017 as compared to approximately $288 million during 2016. The weighted average interest rate on its mortgages, not including the effect of unamortized debt issuance costs, was 4.2% at December 31, 2017 as compared to 4.3% at December 31, 2016.
2016 vs. 2015
Rental and related income increased from $74,762,548 for the year ended December 31, 2015 to $90,679,557 for the year ended December 31, 2016, or 21%. This increase was due to the acquisitions during 2015 and 2016, as well as an increase in rental rates, same property occupancy and additional rental homes. During 2016, the Company raised rental rates by 3% to 5% at most communities. Rent increases vary depending on overall market conditions and demand. Occupancy, as well as the ability to increase rental rates, directly affects revenues. The Company has been acquiring communities with vacant sites that can potentially be occupied and earn income in the future. Occupancy has increased from 79.5% at December 31, 2015 to 81.0% at December 31, 2016. The overall occupancy rate is exclusive of 156 vacant sites at Memphis Blues caused by the 2011 flood. Same property occupancy has increased from 82.9% at December 31, 2015 to 84.8% at December 31, 2016. Demand for rental homes continues to be strong. As of December 31, 2016, we had approximately 4,700 rental homes with an occupancy of 91.5%. We continue to evaluate the demand for rental homes and will invest in additional homes as demand dictates. Vacant sites allow for future revenue growth.
Community operating expenses increased from $37,049,462 for the year ended December 31, 2015 to $42,638,333 for the year ended December 31, 2016, or 15%. This increase was due to the acquisitions during 2015 and 2016.
Community NOI increased from $37,713,086 for the year ended December 31, 2015 to $48,041,224 for the year ended December 31, 2016, or 27%. This increase was primarily due to the acquisitions during 2015 and 2016 and an increase in rental rates, occupancy and rental homes. The Company has also been reducing its Operating Expense Ratio (defined as Community Operating Expenses divided by Rental and Related Income). The Operating Expense Ratio decreased from 49.6% for the year ended December 31, 2015 to 47.0% for the year ended December 31, 2016, a decrease of 260 basis points. Many acquisitions have deferred maintenance requiring higher than normal expenditures in the first two years of ownership. Because most of the community expenses are fixed costs, as occupancy rates continue to increase, these expense ratios will continue to improve. Because of the Company’s ability to increase its rental rates annually, increasing costs due to inflation and changing prices have generally not had a material effect on revenues and income from continuing operations.
| -37- |
Sales of manufactured homes increased from $6,754,123 for the year ended December 31, 2015 to $8,534,272 for the year ended December 31, 2016, or 26%. The total number of homes sold was 170 homes in 2016 as compared to 135 homes in 2015. There were 61 new homes sold in 2016 as compared to 65 in 2015. The Company’s average sales price was $50,202 and $50,031 for the years ended December 31, 2016 and 2015, respectively. Cost of sales of manufactured homes increased from $5,058,350 for the year ended December 31, 2015 to $6,466,520 for the year ended December 31, 2016, or 28%. The gross profit percentage was 24% and 25% for 2016 and 2015, respectively. Selling expenses remained relatively stable at $2,852,405 for the year ended December 31, 2016 as compared to $2,788,360 for the year ended December 31, 2015. Loss from the sales operations (defined as sales of manufactured homes less cost of sales of manufactured homes less selling expenses less interest on the financing of inventory) decreased from $1,851,780 for the year ended December 31, 2015 to $1,444,076 for the year ended December 31, 2016, an improvement of 22%. The losses on sales include selling expenses of approximately $2.9 million for the year ended December 31, 2016. Many of these costs, such as rent, salaries, and to an extent, advertising and promotion, are fixed. Sales of manufactured homes have not yet returned to pre-recession levels. The U.S. homeownership rate fell to 63.7% in the fourth quarter of 2016, according to the U.S. Census. This is down from 69.2% at its peak at the end of 2004. The conventional single-family housing market is gradually strengthening. However, our sales continue to be negatively impacted as a result of the inability of our customers to sell their current homes, limited wage growth, new licensing laws and government regulations. The Company continues to be optimistic about future sales and rental prospects given the fundamental need for affordable housing. The Company believes that sales of new homes produces new rental revenue and is an investment in the upgrading of our communities.
General and Administrative Expenses increased from $7,345,644 for the year ended December 31, 2015 to $8,004,925 for the year ended December 31, 2016, or 9%. This increase was primarily due to an increase in personnel and personnel costs and the issuance of restricted stock and stock options to one employee of retirement age. The entire compensation cost of $312,400 for this employee was recognized at the time of grant. General and Administrative expenses as a percentage of gross revenue (Total Income plus Interest, Dividend and Other Income) improved from 8.3% in 2015 to 7.4% in 2016.
Acquisition costs, relating to the transaction, due diligence and other related costs associated with the acquisitions of communities, decreased from $957,219 for the year ended December 31, 2015 to $79,231 for the year ended December 31, 2016, or 92%. This decrease was due to the decrease in acquisitions in 2016 with an aggregate purchase price of $7,277,000 as compared to 2015 with an aggregate purchase price of $81,217,000.
Depreciation expense increased from $18,877,511 for the year ended December 31, 2015 to $23,214,100 for the year ended December 31, 2016, or 23%. This increase was primarily due to the acquisitions and the increase in rental homes during 2015 and 2016.
Interest income decreased from $1,819,567 for the year ended December 31, 2015 to $1,584,585 for the year ended December 31, 2016, or 13%. This decrease was primarily due to a decrease in the average balance of notes receivable from $19.5 million for the year ended December 31, 2015 to $18.3 million for the year ended December 31, 2016.
Dividend income increased from $4,399,181 for the year ended December 31, 2015 to $6,636,126 for the year ended December 31, 2016, or 51%. This increase was due to an increase in the average balance of securities from $69,283,611 for the year ended December 31, 2015 to $91,883,216 for the year ended December 31, 2016. The dividends received from our securities investments were at a weighted average yield of 6.8% and 7.7% as of December 31, 2016 and 2015, respectively.
| -38- |
Realized gain on sales of securities, net consists of the following:
| Year Ended December 31, | ||||||||
| 2016 | 2015 | |||||||
| Gross realized gains | $ | 2,287,454 | $ | 208,200 | ||||
| Gross realized losses | (2,153 | ) | (3,970 | ) | ||||
| Total Realized Gain on Sales of Securities, net | $ | 2,285,301 | $ | 204,230 | ||||
The Company had an accumulated net unrealized gain on its securities portfolio of $16,717,171 as of December 31, 2016.
Other income remained relatively stable for the year ended December 31, 2016 as compared to the year ended December 31, 2015.
Interest expense increased from $14,074,446 for the year ended December 31, 2015 to $15,432,364 for the year ended December 31, 2016, or 10%. This increase was primarily due to the new mortgage loans for the community acquisitions as well as additional community financings/refinancings in 2016. During the year, we obtained 4 new mortgage loans totaling $32 million. The average balance of mortgages payable was approximately $288 million during 2016 as compared to approximately $235 million during 2015. The increase in interest expense was partially offset by the decrease in the weighted average interest rate on its mortgages which was 4.3%, not including the effect of unamortized debt issuance costs, at December 31, 2016 as compared to 4.5% at December 31, 2015.
Liquidity and Capital Resources
The Company operates as a REIT deriving its income primarily from real estate rental operations. The Company’s principal liquidity demands have historically been, and are expected to continue to be, payments of expenses relating to real estate operations, acquisitions, capital improvements, development and expansions of properties, debt service, purchases of manufactured homes, investment in debt and equity securities of other REITs, financing of manufactured home sales and distribution requirements. The Company’s ability to generate cash adequate to meet these demands is dependent primarily on income from its real estate investments and securities portfolio, the sale of real estate investments and securities, financing and refinancing of mortgage debt, leveraging of real estate investments, availability of bank borrowings, proceeds from the DRIP, and access to the capital markets.
The Company intends to operate its existing properties from the cash flows generated by the properties. However, the Company’s expenses are affected by various factors, including inflation. Increases in operating expenses raise the breakeven point for a property and, to the extent that they cannot be passed on through higher rents, reduce the amount of available cash flow which can adversely affect the market value of the property.
The Company continues to strengthen its capital and liquidity positions. The Company has a DRIP in which participants can purchase stock from the Company at a price of approximately 95% of market. During 2017, amounts received, including dividends reinvested of $2.9 million, totaled $60.4 million. The Company also issued 1,400,000 shares of its common stock in a registered direct placement, raising net proceeds of $22.5 million and 5,750,000 shares of its Series C Preferred Stock in an underwritten registered public offering, raising net proceeds of approximately $139 million. The net proceeds from the issuance of the Series C Preferred Stock were primarily used to redeem all of the 3,663,800 outstanding shares of the Company’s Series A Preferred Stock. This 150 basis point reduction will result in $1.4 million in annual preferred dividend savings going forward. Subsequent to yearend, UMH issued and sold 2,000,000 shares of a new Series D Preferred Stock, raising net proceeds of approximately $48.1 million.
On March 28, 2017, the Company entered into an amended and restated credit agreement to renew and expand its existing unsecured revolving credit facility. The new facility provides for an increase from $35 million in available borrowings to $50 million in available borrowings with a $75 million accordion feature, bringing the total potential availability up to $125 million, subject to certain conditions. As of December 31, 2017, $15 million was available on this credit facility. Subsequent to yearend, UMH repaid $20 million of the facility, resulting in an availability of $35 million, with an additional $75 million potentially available pursuant to an accordion feature.
| -39- |
The Company has the ability to finance home sales, inventory purchases and rental home purchases. The Company has a $10 million revolving line of credit for the financing of homes, of which $4 million was utilized at December 31, 2017, and revolving credit facilities totaling $28.5 million to finance inventory purchases, of which $2.2 million was utilized at December 31, 2017.
During 2017, the Company closed on three mortgage loans with gross proceeds of $44.4 million. These loans have a weighted average interest rate of 4.28%, a weighted average maturity of 10 years and were secured by 9 communities. We also paid off three maturing mortgage loans of approximately $27.8 million, with a weighted average interest rate of 5.55%, secured by 17 communities. In conjunction with an acquisition, the Company also assumed a $2.4 million 6.35% mortgage loan which matures on February 1, 2023.
As of December 31, 2017, the Company had $23.2 million of cash and cash equivalents and securities available for sale of $133.0 million encumbered by $37.2 million in margin loans. The Company owns 112 communities of which 43 are unencumbered. As of December 31, 2017, the Company had one mortgage due in 2018, which was paid off subsequent to yearend. The Company’s marketable securities and non-mortgaged properties provide us with additional liquidity. The Company believes that cash on hand, funds generated from operations, the DRIP and capital market, the funds available on the lines of credit, together with the ability to finance and refinance its properties will provide sufficient funds to adequately meet its obligations over the next several years.
The Company’s focus is on real estate investments. The Company has historically financed purchases of real estate primarily through mortgages. During 2017, total investment property increased 19% or $124.2 million. The Company made acquisitions of eleven manufactured home communities totaling approximately 2,000 developed sites at an aggregate purchase price of $63.3 million. These acquisitions were funded through new mortgages, the use of our unsecured credit facility and the issuance of preferred stock. See Note 3 of the Notes to Consolidated Financial Statements for additional information on our acquisitions and Note 5 of the Notes to Consolidated Financial Statements for related debt transactions. The Company continues to evaluate acquisition opportunities. The funds for these acquisitions may come from bank borrowings, proceeds from the DRIP, and private placements or public offerings of common or preferred stock. To the extent that funds or appropriate properties are not available, fewer acquisitions will be made.
The Company also invests in rental homes and as of December 31, 2017 the Company owns approximately 5,600 rental homes, or approximately 28% of our total homesites. During 2017, our rental home portfolio increased by 948 homes or $44.1 million. The Company markets these rental homes for sale to existing residents. The Company estimates that in 2018 it will purchase approximately 800 manufactured homes to use as rental units for a total cost, including setup, of approximately $32 million. Rental home rates on new homes range from $700-$1,200 per month, including lot rent, depending on size, location and market conditions. During 2017, the Company also invested approximately $18 million in other improvements to our communities.
Additionally, the Company invests in marketable debt and equity securities of other REITs. The REIT securities portfolio provides the Company with additional liquidity and income and serves as a proxy for real estate when more favorable risk adjusted returns are not available. The Company generally limits its marketable securities investments to no more than approximately 20% of its undepreciated assets. During 2017, the securities portfolio increased 22% or $24.2 million primarily due to purchases of $45.1 million, partially offset by sales of securities with a cost of $15.7 million and a decrease in the net unrealized gain of $5.2 million. The Company recognized gains on sales of securities of $1.7 million in addition to the dividend income earned of $8.1 million. The Company from time to time may purchase these securities on margin when there is an adequate yield spread. At December 31, 2017, $37.2 million was outstanding on the margin loan at a 2.0% interest rate.
| -40- |
The following table summarizes cash flow activity for the years ended December 31, 2017, 2016 and 2015:
| 2017 | 2016 | 2015 | ||||||||||
| Net Cash Provided by Operating Activities | $ | 41,341,162 | $ | 29,353,412 | $ | 25,708,212 | ||||||
| Net Cash Used by Investing Activities | (152,919,761 | ) | (77,567,390 | ) | (148,674,626 | ) | ||||||
| Net Cash Provided by Financing Activities | 130,604,097 | 45,894,673 | 121,419,519 | |||||||||
| Net Increase
(Decrease) in Cash and Cash Equivalents | $ | 19,025,498 | $ | (2,319,305 | ) | $ | (1,546,895 | ) | ||||
Net cash provided by operating activities increased by $12.0 million and $3.6 million in 2017 and 2016, respectively. The overall increases were primarily due to the increases in income from operations generated from acquisitions and increased rental homes.
Net cash used by investing activities increased by $75.4 million in 2017 primarily due to an increase in acquisitions of manufactured home communities and an increase in our REIT securities portfolio. Net cash used by investing activities decreased by $71.1 million in 2016 primarily due to a decrease in acquisitions of manufactured home communities.
Net cash provided by financing activities increased by $84.7 million in 2017 to $130.6 million. The Company received $60.4 million, including dividends reinvested, through the DRIP, issued 1,400,000 shares of its common stock in a registered direct placement, raising net proceeds of $22.5 million, and issued 5,750,000 shares of its Series C Preferred Stock in an underwritten registered public offering, raising net proceeds of approximately $139 million. $91.6 million of the net proceeds from the issuance of the Series C Preferred Stock was used to redeem all of the 3,663,800 outstanding shares of the Series A Preferred Stock. During 2017, the Company also distributed to our common shareholders a total of $23.6 million, including dividends reinvested. It is anticipated, although no assurances can be given, that the level of participation in the DRIP in 2018 will be comparable to 2017. In addition, the Company also paid $16.7 million in preferred dividends.
Net cash provided by financing activities decreased by $75.5 million in 2016 to $45.9 million primarily due to the financing/refinancing of 4 communities for $32 million in 2016 as compared to 21 communities for $139 million in 2015.
Cash flows were primarily used for purchases of manufactured home communities, capital improvements, payment of dividends, purchases of securities available for sale, purchase of inventory and rental homes, loans to customers for the sales of manufactured homes, and expansion of existing communities. The Company meets maturing mortgage obligations by using a combination of cash flow and refinancing. The dividend payments were primarily made from cash flow from operations.
Cash flows used for capital improvements include amounts needed to meet environmental and regulatory requirements in connection with the manufactured home communities that provide water or sewer service. Excluding expansions and rental home purchases, the Company is budgeting approximately $10 million in capital improvements for 2018.
The Company’s significant commitments and contractual obligations relate to its mortgages and loans payable, acquisitions of manufactured home communities, retirement benefits, and the lease on its corporate offices as described in Note 8 to the Consolidated Financial Statements.
The Company has 1,500 acres of undeveloped land which it could develop over the next several years. The Company continues to analyze the best use of its vacant land.
As of December 31, 2017, the Company had total assets of $823.9 million and total liabilities of $402.7 million. The Company believes that it has the ability to meet its obligations and to generate funds for new investments.
| -41- |
Off-Balance Sheet Arrangements and Contractual Obligations
The Company has not executed any material off-balance sheet arrangements.
The following is a summary of the Company’s contractual obligations as of December 31, 2017:
Contractual Obligations |
Total | Less than 1 year |
1-3 years |
3-5 years | More than 5 years | |||||||||||||||
| Mortgages Payable | $ | 308,460,786 | $ | 6,744,175 | $ | 26,971,684 | $ | 34,268,639 | $ | 240,476,288 | ||||||||||
| Interest on Mortgages Payable | 83,015,560 | 13,127,126 | 24,582,494 | 21,895,995 | 23,409,945 | |||||||||||||||
| Loans Payable | 84,765,824 | 2,776,329 | 44,033,478 | 656,348 | 37,299,669 | |||||||||||||||
| Interest on Loans Payable | 9,841,734 | 2,602,684 | 4,613,783 | 1,760,062 | 865,205 | |||||||||||||||
| Operating Lease Obligations | 945,440 | 214,800 | 435,280 | 295,360 | -0- | |||||||||||||||
| Retirement Benefits | 450,000 | -0- | -0- | -0- | 450,000 | |||||||||||||||
| Total | $ | 487,479,344 | $ | 25,965,114 | $ | 100,636,719 | $ | 58,876,404 | $ | 302,501,107 | ||||||||||
Mortgages payable represents the principal amounts outstanding based on scheduled payments. The interest rates on these mortgages vary from fixed rates ranging from 3.71% to 6.5% and a variable rate of Prime plus 1.0%. The weighted average interest rate, not including the effect of unamortized debt issuance costs, was approximately 4.2% at December 31, 2017. As of December 31, 2017, the weighted average loan maturity of the mortgage payable is 6.9 years.
Loans payable represents $35,000,000 outstanding on the Company’s unsecured line of credit with an interest rate ranging from LIBOR plus 1.75% to 2.50% or Prime plus 0.75% to 1.50%, based on the Company’s overall leverage (interest rate of 3.36% as of December 31, 2017); $37,157,467 outstanding on its margin line with an interest rate of 2.0% at December 31, 2017; $2,239,315 outstanding on the Company’s revolving credit agreements to finance inventory with interest rates ranging from prime with a minimum of 6% to Prime plus 2% with a minimum of 8% after 18 months (weighted average interest rate of 6.74% as of December 31, 2017); $421,930 loans outstanding for the finance of rental homes with an interest rate of 6.99% at December 31, 2017; $3,969,329 outstanding on its commercial term loan with an interest rate of 4.625% at December 31, 2017; $4,000,000 outstanding on the Company’s revolving line of credit secured by eligible notes receivables with an interest rate of prime plus 50 basis points (interest rate of 4.75% as of December 31, 2017); and $1,977,783 outstanding on its automotive loans with a weighted average interest rate of 4.05%.
Operating lease obligations represent a lease with a related party for the Company’s corporate offices. On May 1, 2015, the Company renewed this lease for additional space and for an additional seven-year term with monthly lease payments of $14,900 through April 30, 2020 and $15,300 through April 30, 2022. On July 1, 2017, the Company entered into a lease for additional office space adjacent to its existing corporate office space requiring monthly lease payments of $1,275 through April 30, 2020 and $1,310 through April 30, 2022. On February 14, 2018, the Company entered into a lease for additional office space adjacent to its existing corporate office space requiring monthly lease payments of $1,800 through April 30, 2020 and $1,850 through April 30, 2022. The Company is also responsible for its proportionate share of real estate taxes and common area maintenance. Mr. Eugene W. Landy, the Founder and Chairman of the Board of the Company, owns a 24% interest in the entity that is the landlord of the property where the Company’s corporate office space is located. Management believes that the aforesaid rent is no more than what the Company would pay for comparable space elsewhere.
Retirement benefits of $450,000 represent the total future amount to be paid, on an undiscounted basis, relating to the Company’s Founder and Chairman. These benefits are based upon his specific employment agreement. The agreement does not require the Company to separately fund the obligation and therefore will be paid from the general assets of the Company. The Company has accrued these benefits on a present value basis over the term of the agreement (See Note 8 of the Notes to Consolidated Financial Statements).
| -42- |
Critical Accounting Policies and Estimates
The discussion and analysis of the Company’s financial condition and results of operations are based upon the Company’s consolidated financial statements, which have been prepared in accordance with GAAP. The preparation of these consolidated financial statements requires management to make estimates and judgments that affect the reported amounts of assets and liabilities, revenues and expenses, and related disclosure of contingent assets and liabilities at the date of the Company’s consolidated financial statements. Actual results may differ from these estimates under different assumptions or conditions.
Significant accounting policies are defined as those that involve significant judgment and potentially could result in materially different results under different assumptions and conditions. Management believes the following critical accounting policies are affected by our more significant judgments and estimates used in the preparation of the Company’s consolidated financial statements. For a detailed description of these and other accounting policies, see Note 2 of the Notes to Consolidated Financial Statements included in this Form 10-K.
Real Estate Investments
The Company applies Financial Accounting Standards Board (“FASB”) Accounting Standards Codification (“ASC”) 360-10, Property, Plant & Equipment (“ASC 360-10”) to measure impairment in real estate investments. Rental properties are individually evaluated for impairment when conditions exist which may indicate that it is probable that the sum of expected future cash flows (on an undiscounted basis without interest) from a rental property is less than the carrying value under its historical net cost basis. These expected future cash flows consider factors such as future operating income, trends and prospects as well as the effects of leasing demand, competition and other factors. Upon determination that a permanent impairment has occurred, rental properties are reduced to their fair value. For properties to be disposed of, an impairment loss is recognized when the fair value of the property, less the estimated cost to sell, is less than the carrying amount of the property measured at the time there is a commitment to sell the property and/or it is actively being marketed for sale. A property to be disposed of is reported at the lower of its carrying amount or its estimated fair value, less its cost to sell. Subsequent to the date that a property is held for disposition, depreciation expense is not recorded.
Upon acquisition of a property, the Company applies ASC 805, Business Combinations (“ASC 805”) and allocates the purchase price of the property based upon the fair value of the assets acquired, which generally consist of land, site and land improvements, buildings and improvements and rental homes. The Company allocates the purchase price of an acquired property generally determined by internal evaluation as well as third-party appraisal of the property obtained in conjunction with the purchase.
In January 2017, the FASB issued Accounting Standards Update (“ASU”) 2017-01, “Business Combinations (Topic 805), Clarifying the Definition of a Business”. ASU 2017-01 seeks to clarify the definition of a business with the objective of adding guidance to assist entities with evaluating whether transactions should be accounted for as acquisitions (or disposals) of assets or businesses. The definition of a business affects many areas of accounting including acquisitions, disposals, intangible assets and consolidation. The adoption of ASU 2017-01 is effective for annual periods beginning after December 15, 2017, including interim periods within those periods. The amendments should be applied prospectively on or after the effective dates. Early adoption is permitted. The Company adopted this standard effective January 1, 2017, on a prospective basis. The Company evaluated its acquisitions and has determined that its acquisitions of manufactured home communities during 2017 should be accounted for as acquisitions of assets. As such, transaction costs, such as broker fees, transfer taxes, legal, accounting, valuation, and other professional and consulting fees, related to acquisitions are capitalized as part of the cost of the acquisitions, which is then subject to a purchase price allocation based on relative fair value.
The Company conducted a comprehensive review of all real estate asset classes in accordance with ASC 360-10-35-21, which indicates that asset values should be analyzed whenever events or changes in circumstances indicate that the carrying value of a property may not be fully recoverable. The process entailed the analysis of property for instances where the net book value exceeds the estimated fair value. In accordance with ASC 360-10-35-17, an impairment loss shall be recognized if the carrying amount of a long-lived asset is not recoverable and exceeds its fair value. The Company utilizes the experience and knowledge of its internal valuation team to derive certain assumptions used to determine an operating property’s cash flow. Such assumptions include lease-up rates, rental rates, rental growth rates, and capital expenditures. The Company reviewed its operating properties in light of the requirements of ASC 360-10 and determined that, as of December 31, 2017, the undiscounted cash flows over the holding period for these properties were in excess of their carrying values and, therefore, no impairment charges were required.
| -43- |
Securities Available for Sale
Investments in non-real estate assets consist primarily of marketable securities. The Company individually reviews and evaluates our marketable securities for impairment on a quarterly basis or when events or circumstances that may indicate possible impairment occur. The Company considers, among other things, credit aspects of the issuer, amount of decline in fair value over cost and length of time in a continuous loss position. The Company has developed a general policy of evaluating whether an unrealized loss is other than temporary. On a quarterly basis, the Company makes an initial review of every individual security in its portfolio. If the security is impaired, the Company first determines our intent and ability to hold this investment for a period of time sufficient to allow for any anticipated recovery in market value. Next, the Company determines the length of time and the extent of the impairment. Barring other factors, including the downgrading of the security or the cessation of dividends, if the fair value of the security is below cost by less than 20% for less than 6 months and the Company has the intent and ability to hold the security, the security is deemed to not be other than temporarily impaired. Otherwise, the Company reviews additional information to determine whether the impairment is other than temporary. The Company discusses and analyzes any relevant information known about the security, such as:
| a. | Whether the decline is attributable to adverse conditions related to the security or to specific conditions in an industry or in a geographic area. | |
| b. | Any downgrading of the security by a rating agency. | |
| c. | Whether the financial condition of the issuer has deteriorated. | |
| d. | Status of dividends – Whether dividends have been reduced or eliminated, or scheduled interest payments have not been made. | |
| e. | Analysis of the underlying assets (including NAV analysis) using independent analysis or recent transactions. |
The Company generally holds REIT securities long-term and has the ability and intent to hold securities to recovery. If a decline in fair value is determined to be other than temporary, an impairment charge is recognized in earnings and the cost basis of the individual security is written down to fair value as the new cost basis.
The Company’s securities consist primarily of common and preferred stock of other REITs. These securities are all publicly-traded and purchased on the open market, through private transactions or through dividend reinvestment plans. These securities are classified among three categories: Held-to-maturity, trading and available-for-sale. As of December 31, 2017 and 2016, the Company’s securities are all classified as available-for-sale and are carried at fair value based upon quoted market prices. Gains or losses on the sale of securities are based on average cost and are accounted for on a trade date basis. Unrealized holding gains and losses are excluded from earnings and reported as a separate component of Shareholders’ Equity until realized. The change in net unrealized holding gains and losses are reflected as comprehensive income (loss). On January 1, 2018, the Company adopted ASU 2016-01, “Financial Instruments – Overall: Recognition and Measurement of Financial Assets and Financial Liabilities”. Upon adoption of ASU 2016-01, the Company anticipates that these securities will continue to be measured at fair value; however, the change in the unrealized net holding gains and losses will be recognized through net income.
Other
Estimates are used when accounting for the allowance for doubtful accounts for our rents and loans receivable, potentially excess and obsolete inventory and contingent liabilities, among others. These estimates are susceptible to change and actual results could differ from these estimates. The effects of changes in these estimates are recognized in the period they are determined.
Recent Accounting Pronouncements
See Note 2 of the Notes to Consolidated Financial Statements.
| -44- |
Item 7A – Quantitative and Qualitative Disclosures about Market Risk
Market risk is the risk of loss from adverse changes in market prices and interest rates. The Company’s principal market risk exposure is interest rate risk. The Company’s future income, cash flows and fair values relevant to financial instruments are dependent upon prevalent market interest rates. Many factors, including governmental monetary and tax policies, domestic and international economic and political considerations and other factors that are beyond the Company’s control contribute to interest rate risk. The Company mitigates this risk by maintaining prudent amounts of leverage, minimizing capital costs and interest expense while continuously evaluating all available debt and equity resources and following established risk management policies and procedures, which include the periodic use of derivatives. The Company’s primary strategy in entering into derivative contracts is to minimize the variability that changes in interest rates could have on its future cash flows. The Company generally employs derivative instruments that effectively convert a portion of its variable rate debt to fixed rate debt. The Company does not enter into derivative instruments for speculative purposes.
The following table sets forth information as of December 31, 2017, concerning the Company’s mortgages payable, including principal cash flow by scheduled maturity, weighted average interest rates and estimated fair value.
| Fixed Rate | Weighted Average Fixed | Variable Rate | Total | |||||||||||||
| Carrying Value | Interest Rate | Carrying Value | Long-Term Debt | |||||||||||||
| 2018 | $ | -0- | N/A | $ | 16,606 | $ | 16,606 | |||||||||
| 2019 | 2,633,665 | 5.68 | % | -0- | 2,633,665 | |||||||||||
| 2020 | 12,144,422 | 5.94 | % | -0- | 12,144,422 | |||||||||||
| 2021 | 2,194,312 | 6.50 | % | -0- | 2,194,312 | |||||||||||
| 2022 | 20,904,217 | 4.42 | % | -0- | 20,904,217 | |||||||||||
| Thereafter | 270,567,564 | 4.12 | % | -0- | 270,567,564 | |||||||||||
| Total | $ | 308,444,180 | 4.24 | %(1) | $ | 16,606 | $ | 308,460,786 | ||||||||
| Estimated Fair Value | $ | 303,741,677 | $ | 16,606 | $ | 303,758,283 | ||||||||||
| (1) | Weighted average interest rate, not including the effect of unamortized debt issuance costs. The weighted average interest rate, including the effect of unamortized debt issuance costs, at December 31, 2017 was 4.29%. |
The Company’s variable rate mortgage totals approximately $17,000 as of December 31, 2017. Interest rates on this mortgage is Prime plus 1%. If prime increased or decreased by 1.0%, the Company believes its interest expense would not be materially impacted based on the balance of the variable rate long-term debt outstanding at December 31, 2017.
On March 28, 2017, the Company entered into an amended and restated credit agreement to renew and expand its existing unsecured revolving credit facility. The new unsecured revolving credit facility (the “Facility”) was syndicated with BMO Capital Markets (“BMO”), as sole lead arranger and sole book runner, with Bank of Montreal as administrative agent. The Facility provides for an increase from $35 million in available borrowings to $50 million in available borrowings with a $75 million accordion feature, bringing the total potential availability up to $125 million, subject to certain conditions. The maturity date of the Facility is March 27, 2020, with a one year extension option. Borrowings will bear interest at the Company’s option of LIBOR plus 1.75% to 2.50% or BMO’s prime lending rate plus 0.75% to 1.50%, based on the Company’s overall leverage. Based on the Company’s current leverage ratio, borrowings under the Facility will bear interest at LIBOR plus 2% or at BMO’s prime lending rate plus 1%. The amount outstanding under this Facility was $35 million at December 31, 2017.
The Company also has approximately $6.2 million in variable rate debt. This debt primarily consists of approximately $2.2 million outstanding on our inventory financing lines with interest rates ranging from prime with a minimum of 6% to Prime plus 2% with a minimum of 8% after 18 months (weighted average interest rate of 6.74% as of December 31, 2017) and $4 million outstanding on our revolving line of credit to finance home sales with an interest rate of prime plus 50 basis points (interest rate of 4.75% as of December 31, 2017). The carrying value of the Company’s variable rate debt approximates fair value at December 31, 2017. Additionally, at December 31, 2017, the Company has fixed rate debt consisting of $4 million outstanding on its commercial term loan with an interest rate of 4.625%, approximately $400,000 loan outstanding for the financing of rental homes with an interest rate of 6.99% and approximately $2 million outstanding on its automotive loans with a weighted average interest rate of 4.05%.
| -45- |
The Company invests in equity securities of other REITs and is primarily exposed to market price risk from adverse changes in market rates and conditions. The Company generally limits its marketable securities investments to no more than approximately 20% of its undepreciated assets. All securities are classified as available for sale and are carried at fair value.
The Company obtains margin loans secured by its marketable securities. The interest rate on the margin account is the bank’s margin rate and was 2.0% at December 31, 2017 and 2016. There was $37.2 million outstanding on the margin loans as of December 31, 2017. As of December 31, 2017, the value of marketable securities was $133 million. In general, the Company may borrow up to 50% of the value of the marketable securities.
Item 8 – Financial Statements and Supplementary Data
The financial statements and supplementary data listed in Part IV, Item 15(a)(1) are incorporated herein by reference and filed as part of this report.
The following is the Unaudited Selected Quarterly Financial Data:
SELECTED QUARTERLY FINANCIAL DATA (UNAUDITED)
THREE MONTHS ENDED
| 2017 | March 31 | June 30 | September 30 | December 31 | ||||||||||||
| Total Income | $ | 26,448,549 | $ | 28,817,848 | $ | 28,684,937 | $ | 28,696,585 | ||||||||
| Total Expenses | 22,485,487 | 24,858,243 | 24,704,729 | 24,567,878 | ||||||||||||
| Other Income (Expense) | (1,653,136 | ) | (383,472 | ) | (699,309 | ) | (546,701 | ) | ||||||||
| Net Income | 2,285,546 | 3,589,871 | 3,262,001 | 3,530,616 | ||||||||||||
| Net Loss Attributable to Common Shareholders | (1,504,201 | ) | (199,876 | ) | (5,179,423 | ) | (795,765 | ) | ||||||||
| Net Loss Attributable to Common Shareholders per Share – Basic and Diluted | (0.05 | ) | (0.01 | ) | (0.15 | ) | (0.03 | ) | ||||||||
| 2016 | March 31 | June 30 | September 30 | December 31 | ||||||||||||
| Total Income | $ | 23,504,374 | $ | 25,210,707 | $ | 25,355,051 | $ | 25,143,697 | ||||||||
| Total Expenses | 19,876,382 | 21,176,977 | 21,567,389 | 20,634,766 | ||||||||||||
| Other Income (Expense) | (1,743,611 | ) | (937,242 | ) | (587,077 | ) | (1,153,663 | ) | ||||||||
| Net Income | 1,906,469 | 3,051,462 | 3,200,013 | 3,376,615 | ||||||||||||
| Net Loss Attributable to Common Shareholders | (883,278 | ) | (682,729 | ) | (589,734 | ) | (413,132 | ) | ||||||||
| Net Loss Attributable to Common Shareholders per Share – Basic and Diluted | (0.03 | ) | (0.03 | ) | (0.02 | ) | (0.02 | ) | ||||||||
Item 9 – Changes in and Disagreements with Accountants on Accounting and Financial Disclosure
There were no changes in, or any disagreements with, the Company’s independent registered public accounting firm on accounting principles and practices or financial disclosure during the years ended December 31, 2017 and 2016.
| -46- |
Item 9A – Controls and Procedures
Disclosure Controls and Procedures
Management, with the participation of the Chief Executive Officer and Chief Financial Officer, has evaluated the effectiveness of our disclosure controls and procedures (as defined in Securities Exchange Act of 1934 Rule 13a-15(e) and 15d-15(e)) as of the end of the period covered by this report. Based on that evaluation, our Chief Executive Officer and Chief Financial Officer concluded that our disclosure controls and procedures were effective to give reasonable assurances to the timely collection, evaluation and disclosure of information that would potentially be subject to disclosure under the Securities Exchange Act of 1934, as amended, and the rules and regulations promulgated thereunder as of December 31, 2017.
Internal Control over Financial Reporting
(a) Management’s Annual Report on Internal Control over Financial Reporting
Management of the Company is responsible for establishing and maintaining effective internal control over financial reporting (as defined in Rules 13a-15(f) and 15d-15(f) under the Exchange Act). The Company’s internal control system was designed to provide reasonable assurance regarding the reliability of financial reporting and the preparation of consolidated financial statements for external purposes in accordance with GAAP. Because of its inherent limitations, including the possibility of collusion or improper management override of controls, internal control over financial reporting may not prevent or detect misstatements. Also, projections of any evaluation of effectiveness to future periods are subject to the risk that controls may become inadequate because of changes in conditions, or that the degree of compliance with the policies or procedures may deteriorate.
Management assessed the Company’s internal control over financial reporting as of December 31, 2017. This assessment was based on criteria for effective internal control over financial reporting established in Internal Control — Integrated Framework issued by the Committee of Sponsoring Organizations of the Treadway Commission (“COSO”) (2013 framework). Based on this assessment, management has concluded that the Company’s internal control over financial reporting was effective as of December 31, 2017.
PKF O’Connor Davies, LLP, the Company’s independent registered public accounting firm, has issued their report on their audit of the Company’s internal control over financial reporting, a copy of which is included herein.
| -47- |
(b) Attestation Report of the Independent Registered Public Accounting Firm
Report of Independent Registered Public Accounting Firm
To the Board of Directors and Shareholders of
UMH Properties, Inc.
Opinion on Internal Control over Financial Reporting
We have audited UMH Properties, Inc.’s (the “Company”) internal control over financial reporting as of December 31, 2017, based on criteria established in Internal Control–Integrated Framework (2013) issued by the Committee of Sponsoring Organizations of the Treadway Commission (COSO). In our opinion, the Company maintained, in all material respects, effective internal control over financial reporting as of December 31, 2017, based on criteria established in Internal Control–Integrated Framework (2013) issued by COSO.
We have also audited, in accordance with the standards of the Public Company Accounting Oversight Board (United States) (“PCAOB”), the consolidated balance sheets of the Company as of December 31, 2017 and 2016, and the related consolidated statements of income (loss), comprehensive income (loss), shareholders’ equity and cash flows for each of the three years in the period ended December 31, 2017, and our report dated March 8, 2018, expressed an unqualified opinion thereon.
Basis for Opinion
The Company’s management is responsible for maintaining effective internal control over financial reporting, and for its assessment of the effectiveness of internal control over financial reporting, included in the accompanying Management’s Annual Report on Internal Control. Our responsibility is to express an opinion on the Company’s internal control over financial reporting based on our audit. We are a public accounting firm registered with the PCAOB and are required to be independent with respect to the Company in accordance with the U.S. federal securities laws and the applicable rules and regulations of the Securities and Exchange Commission and the PCAOB.
We conducted our audit in accordance with the standards of the PCAOB. Those standards require that we plan and perform the audit to obtain reasonable assurance about whether effective internal control over financial reporting was maintained in all material respects. Our audit of internal control over financial reporting included obtaining an understanding of internal control over financial reporting, assessing the risk that a material weakness exists, and testing and evaluating the design and operating effectiveness of internal control based on the assessed risk. Our audit also included performing such other procedures as we considered necessary in the circumstances. We believe that our audit provides a reasonable basis for our opinion.
Definition and Limitations of Internal Control over Financial Reporting
A company’s internal control over financial reporting is a process designed to provide reasonable assurance regarding the reliability of financial reporting and the preparation of financial statements for external purposes in accordance with generally accepted accounting principles. A company’s internal control over financial reporting includes those policies and procedures that (1) pertain to the maintenance of records that, in reasonable detail, accurately and fairly reflect the transactions and dispositions of the assets of the company; (2) provide reasonable assurance that transactions are recorded as necessary to permit preparation of financial statements in accordance with generally accepted accounting principles, and that receipts and expenditures of the company are being made only in accordance with authorizations of management and directors of the company; and (3) provide reasonable assurance regarding prevention or timely detection of unauthorized acquisition, use, or disposition of the company’s assets that could have a material effect on the financial statements.
| -48- |
Because of its inherent limitations, internal control over financial reporting may not prevent or detect misstatements. Also, projections of any evaluation of effectiveness to future periods are subject to the risk that controls may become inadequate because of changes in conditions, or that the degree of compliance with the policies or procedures may deteriorate.
| /s/ PKF O’Connor Davies, LLP |
March 8, 2018
New York, New York
(c) Changes in Internal Control over Financial Reporting
There have been no changes to our internal control over financial reporting during the quarter ended December 31, 2017 that have materially affected, or are reasonably likely to materially affect, our internal controls over financial reporting.
| -49- |
The following is a summary of additional material United States federal income tax considerations with respect to UMH Properties, Inc.
Additional United States Federal Income Tax Considerations
The Tax Cuts and Jobs Act
On December 22, 2017, H.R. 1, informally titled the Tax Cuts and Jobs Act (the “Tax Act” or the “Act”) was signed into law. The Tax Act makes major changes to the Code, including a number of provisions of the Code that may directly or indirectly affect the taxation of REITs and their shareholders. The most significant of these provisions are described below. The individual and collective impact of these changes on REITs and their shareholders is uncertain, and may not become evident for some period of time. While the changes in the Tax Act generally appear to be favorable with respect to REITs, the extensive changes to non-REIT provisions in the Code may have unanticipated effects on us or our stockholders. Moreover, Congressional leaders have recognized that the process of adopting extensive tax legislation in a short amount of time without hearings and substantial time for review is likely to have led to drafting errors, issues needing clarification and unintended consequences that may or may not be revised in subsequent tax legislation. At this point, it is not clear when Congress will address these issues or when the Internal Revenue Service will be able to issue administrative guidance on the changes made in the Tax Act. Prospective investors should consult their tax advisors regarding the implications of the Tax Act on their investment.
Revised Individual Tax Rates and Deductions
The Tax Act creates seven income tax brackets for individuals ranging from 10 percent to 37 percent that generally apply at higher thresholds than current law. For example, the highest 37 percent rate applied to joint return filer incomes above $600,000, instead of the highest 39.6 percent rate that applies to incomes above $470,700 under pre-Tax Act law. The maximum 20 percent rate that applies to long-term capital gains and qualified dividend income is unchanged, as is the 3.8 percent tax on net investment income.
The Act also eliminates personal exemptions, but nearly doubles the standard deduction for most individuals (e.g. the standard deduction for joint return filers rises from $12,700 in 2017 to $24,000 upon the Act’s effectiveness). The Act also eliminates many itemized deductions, limits individual deductions for state and local income, property and sales taxes (other than those paid in a trade or business) to $10,000 collectively for joint return filers (with a special provision to prevent 2017 deductions for prepayment of 2018 state or local income taxes), and limits the amount of new acquisition indebtedness on principal or second residences for which mortgage interest deductions are available to $750,000. Interest deductions on home equity debt are eliminated. Charitable deductions are generally preserved. The phaseout of itemized deductions based on income is eliminated.
The Tax Act does not eliminate the individual alternative minimum tax, but it raises the exemption and exemption phaseout threshold for application of the tax.
These individual income tax changes are generally effective beginning in 2018, but without further legislation, they will expire, or sunset, after 2025.
Pass-Through Business Income Tax Rate Lowered through Deduction
Under the Tax Act, individuals, trusts, and estates generally may deduct 20 percent of “qualified business income” (generally, domestic trade or business income other than certain investment items) of a partnership, S corporation, or sole proprietorship. In addition, “qualified REIT dividends” (i.e., REIT dividends other than capital gain dividends and portions of REIT dividends designated as qualified dividend income eligible for capital gain tax rates) and certain other income items are eligible for the deduction by the taxpayer. The overall deduction is limited to 20 percent of the sum of the taxpayer’s taxable income (less net capital gain) and certain cooperative dividends, subject to further limitations based on taxable income. In addition, for taxpayers with taxable income above a certain threshold (e.g., $315,000 for joint return filers), the deduction for each trade or business is generally limited to no more than the greater of: (i) 50 percent of the taxpayer’s proportionate share of total wages from a partnership, S corporation or sole proprietorship, or (ii) 25 percent of the taxpayer’s proportionate share of such total wages plus 2.5 percent of the unadjusted basis of acquired tangible depreciable property that is used to produce qualified business income and satisfies certain other requirements. The deduction for qualified REIT dividends is not subject to these wage and basis limitations. The deduction, if allowed in full, equates to a maximum 29.6 percent tax rate on domestic qualified business income of partnerships, S corporations, or sole proprietorships, and a maximum 29.6 percent tax rate on REIT dividends. As with the other individual income tax changes, the deduction provisions are effective beginning in 2018. Without further legislation, the deduction sunsets after 2025.
| -50- |
Net Operating Loss Modifications
Net operating loss (“NOL”) provisions are modified by the Tax Act. The Act limits the NOL deduction to 80 percent of taxable income (before the deduction). It also generally eliminates NOL carrybacks for individuals and non-REIT corporations (NOL carrybacks did not apply to REITs under prior law) but allows indefinite NOL carryforwards. The new NOL rules apply beginning in 2018.
Corporate Tax Rate Lowered to 21 percent; Elimination of Corporate Alternative Minimum Tax
The Tax Act reduces the 35 percent maximum corporate income tax rate to a flat 21 percent corporate rate and reduces the dividends-received deduction for certain corporate subsidiaries. The Act also permanently eliminates the corporate alternative minimum tax. These provisions are effective beginning in 2018.
Limitations on Interest Deductibility; Real Property Trades or Businesses Can Elect Out Subject to Longer Asset Cost Recovery Periods
The Tax Act limits a taxpayer’s net interest expense deduction to 30 percent of the sum of adjusted taxable income, business interest, and certain other amounts. Adjusted taxable income does not include items of income or expense not allocable to a trade or business, business interest or expense, the new deduction for qualified business income, NOLs, and for years prior to 2022, deductions for depreciation, amortization, or depletion. For partnerships, the interest deduction limit is applied at the partnership level, subject to certain adjustments to the partners for the unused deduction limitation at the partnership level. The Act allows a real property trade or business to elect out of this interest limit so long as it uses a 40-year recovery period for nonresidential real property, a 30-year recovery period for residential rental property, and a 20-year recovery period for related improvements described below. Disallowed interest expense is carried forward indefinitely (subject to special rules for partnerships). The interest deduction limit applies beginning in 2018.
Maintains Cost Recovery Period for Buildings; Reduced Cost Recovery Periods for Tenant Improvements; Increased Expensing for Equipment
For taxpayers that do not use the Act’s real property trade or business exception to the business interest deduction limits, the Act maintains the current 39-year and 27.5-year straight line recovery periods for nonresidential real property and residential rental property, respectively, and provides that tenant improvements for such taxpayers are subject to a general 15-year recovery period. Also, the Act temporarily allows 100 percent expensing of certain new or used tangible property through 2022, phasing out at 20 percent for each following year (with an election available for 50 percent expensing of such property if placed in service during the first taxable year ending after September 27, 2017). The changes apply, generally, to property acquired after September 27, 2017 and placed in service after September 27, 2017.
Like Kind Exchanges Retained for Real Property, but Eliminated for Most Personal Property
The Tax Act continues the deferral of gain from the like kind exchange of real property, but provides that foreign real property is no longer “like kind” to domestic real property. Furthermore, the Act eliminates like kind exchanges for personal property. These changes are effective generally for exchanges completed after December 31, 2017, with a transition rule allowing such exchanges where one part of the exchange is completed on or prior to December 31, 2017.
| -51- |
Technical Terminations of Partnerships
For tax years beginning after January 1, 2018, the Tax Act permanently repeals the technical termination rule for partnerships. The technical termination rule provided that a partnership (or limited liability company (“LLC”) taxed as a partnership) terminated for tax purposes (and a new partnership is deemed to be created) if there was a sale or exchange of 50 percent or more of the total interest in the partnership (or LLC) capital and profits in a 12-month period.
International Provisions: Modified Territorial Tax Regime
The Act moves the United States from a worldwide to a modified territorial tax system, with provisions included to prevent corporate base erosion.
Accrual of Income
Under the Tax Act, the Company generally will be required to take certain amounts in income no later than the time such amounts are reflected on certain financial statements. The application of this rule may require the accrual of income earlier than would be the case under the general tax rules, although the precise application of this rule is unclear at this time. This rule generally will be effective for tax years beginning after December 31, 2017. To the extent that this rule requires the accrual of income earlier than under the general tax rules, it could increase our “phantom income,” which may make it more likely that we could be required to borrow funds or take other action to satisfy the REIT distribution requirements for the taxable year in which this “phantom income” is recognized.
Other Provisions
The Tax Act makes other significant changes to the Code. These changes include provisions limiting the ability to offset dividend and interest income with partnership or S corporation net active business losses. These provisions are effective beginning in 2018, but without further legislation, sunset after 2025.
| -52- |
Item 10 – Directors, Executive Officers and Corporate Governance
The Company will file its definitive Proxy Statement for its 2018 Annual Meeting of Stockholders within the period required under the applicable rules of the Securities and Exchange Commission. Additional information required by this Item is included under the captions “ELECTION OF DIRECTORS” and “CERTAIN RELATIONSHIPS AND RELATED TRANSACTIONS” of such Proxy Statement and is incorporated herein by reference.
The following are the Directors and Executive Officers of the Company as of December 31, 2017:
Name |
Age |
Present Position with the Company; Business Experience During Past Five Years; Other Directorships |
Director Since |
Class Type (1) | ||||
| Jeffrey A. Carus | 54 | Independent Director (2). Founder and Managing Partner of JAC Partners, LLC (2009 to present); Founder and Managing Member of JAC Management, LLC (1998 to present); Principal of Advalurem Group (2012-2014); Prior affiliations with CW Capital and Credit Suisse. Mr. Carus’ extensive experience in real estate finance and investment is the primary reason, among others, why Mr. Carus serves on our Board.
|
2011 | II | ||||
| Anna T. Chew | 59 | Vice President and Chief Financial Officer (1995 to present), Controller (1991 to 1995) and Director. Certified Public Accountant; Interim Chief Financial Officer (March 2012 to July 2012), Treasurer (2010 to 2013), Chief Financial Officer (1991 to 2010) and Director (1993 to 2004, and 2007 to 2017) of Monmouth Real Estate Investment Corporation, an affiliated company. Ms. Chew’s extensive public accounting, finance and real estate industry experience is the primary reason, among others, why Ms. Chew serves on our Board. | 1995 | III | ||||
| Matthew I. Hirsch | 58 | Presiding Independent Director (2). Attorney at Law (1985 to present) Law Office of Matthew I. Hirsch. Adjunct Professor of Law, Delaware Law School of Widener University (1993 to present); Director (2000 to present) of Monmouth Real Estate Investment Corporation, an affiliated company. Mr. Hirsch’s experience with real estate transactions, legal issues relating to real estate and the real estate industry is the primary reason, among others, why Mr. Hirsch serves on our Board.
|
2013 | II | ||||
| Craig Koster | 42 | General Counsel and Secretary (2015 to present), In-house Counsel (2012 to 2014). Attorney at Law (2001 to present); Assistant Corporation Counsel at the New York City Law Department (2007 to 2012). | N/A | N/A |
| -53- |
| Name | Age | Present Position with the Company; Business Experience During Past Five Years; Other Directorships |
Director Since |
Class Type (1) | ||||
| Eugene W. Landy | 84 | Founder (1968), Chairman of the Board (1995 to present), President and Chief Executive Officer (1968 to 1995), and Director. Attorney at Law; Founder, Chairman of the Board and Director (1968 to present), President and Chief Executive Officer (1968 to 2013) of Monmouth Real Estate Investment Corporation, an affiliated company. As our founder and Chairman, Mr. Landy’s unparalleled experience in real estate investing is the primary reason, among others, why Mr. Landy serves on our Board. | 1968 | III | ||||
| Michael P. Landy | 55 | Director. Executive Vice President (2010 to 2012), Vice President – Investments (2001 to 2010). President and Chief Executive Officer (2013 to present), Chief Operating Officer (2011 to 2013), Executive Vice President (2009 to 2010), Executive Vice President – Investments (2006 to 2009), Vice President – Investments (2001 to 2006) and Director (2007 to present) of Monmouth Real Estate Investment Corporation, an affiliated company; Member of New York University’s REIT Center Board of Advisors (2013 to present). Mr. Landy’s extensive experience in real estate finance, investment, capital markets and operations management is the primary reason, among others, why Mr. Landy serves on our Board.
|
2011 | I | ||||
| Samuel A. Landy | 57 | President and Chief Executive Officer (1995 to present), Vice President (1991-1995) and Director. Attorney at Law; Director (1989 to present) of Monmouth Real Estate Investment Corporation, an affiliated company. Mr. Landy’s role as our President and Chief Executive Officer and his extensive experience in real estate investment, operations management and REIT leadership is the primary reason, among others, why Mr. Landy serves on our Board. | 1992
|
III | ||||
| Stuart D. Levy | 48 | Independent Director (2). Vice President in the Real Estate Finance Group at Helaba-Landesbank Hessen-Thuringen (2006 to present). Mr. Levy’s extensive real estate background is the primary reason, among others, why Mr. Levy serves on our Board. | 2011 | III | ||||
| James E. Mitchell | 77 | Independent Director (2). Attorney at Law; General Partner, Mitchell Partners, L.P. (1979 to present); President, Mitchell Capital Management, Inc. (1987 to present); Director (2017 to present) of Aztec Land and Cattle Co., Ltd. Mr. Mitchell’s extensive experience in real estate investment is the primary reason, among others, why Mr. Mitchell serves on our Board. | 2001
|
I | ||||
| Kenneth K. Quigley, Jr. | 59 | Independent Director (2). Attorney at Law; President of Curry College (1996 to present); Director of Randolph Bancorp (2013 to present); Director of Central Bancorp (2010 to 2011). Mr. Quigley’s management, governance, law, accounting, finance and REIT experience is the primary reason, among others, why Mr. Quigley serves on our Board. | 2016 | II |
| -54- |
| Name | Age | Present Position with the Company; Business Experience During Past Five Years; Other Directorships |
Director Since |
Class Type (1) | ||||
| Brett Taft | 28 | Vice President (2016 to present), Vice President -Acquisition and Property Integration (2013 to 2016). Member of the Board of Directors for CentraState Healthcare Foundation (2017 to present). | N/A | N/A | ||||
| Stephen B. Wolgin | 63 | Independent Director (2). Managing Director of U.S. Real Estate Advisors, Inc., a real estate advisory services group based in New Jersey (2000 to present); Director (2003 to present) of Monmouth Real Estate Investment Corporation, an affiliated company; Prior Partner with the Logan Equity Distressed Fund (2007 to 2017); Prior affiliations with J.P. Morgan, Odyssey Associates, The Prudential Realty Group, Standard & Poor’s Corporation, and Grubb and Ellis. Mr. Wolgin’s extensive experience as a real estate and finance consultant and experience in the real estate industry are the primary reasons, among others, why Mr. Wolgin serves on our Board. | 2007 | I |
| (1) | Class I, II and III Directors have terms expiring at the annual meetings of the Company’s shareholders to be held in 2019, 2020 and 2018, respectively, and when their respective successors are duly elected and qualify. | |
| (2) | Independent within the meaning of applicable New York Stock Exchange listing standards and SEC rules. |
All officers serve at the pleasure of the Board of Directors, subject to the rights, if any, of any officer under any employment contract. Officers are elected by the Board of Directors annually and as may be appropriate to fill a vacancy in an office.
Family Relationships
There are no family relationships between any of the directors or executive officers of the Company, with the exception of Samuel A. Landy and Michael P. Landy, who are the sons of the Company’s Founder, Eugene W. Landy, who is the Chairman of the Board and a Director of the Company.
Audit Committee
The Company has a separately-designated standing audit committee established in accordance with section 3(a)(58)(A) of the Exchange Act (15 U.S.C. 78c(a)(58)(A)). The members of the audit committee are Jeffrey A. Carus, Stuart D. Levy, Kenneth K. Quigley, Jr. and Stephen B. Wolgin (Chairman). The Company’s Board of Directors has determined that Mr. Carus, Mr. Levy, Mr. Quigley and Mr. Wolgin are audit committee financial experts and that all members of the audit committee are independent as required by the listing standards of the NYSE. The audit committee operates under the Audit Committee Charter which is available on the Company’s website at www.umh.reit. The charter is reviewed annually for adequacy.
Compensation Committee
The Company has a separately-designated standing compensation committee, consisting of four of our independent directors. The members of the compensation committee are Jeffrey A. Carus (Chairman), Stuart D. Levy, James E. Mitchell, and Stephen B. Wolgin. The Company’s Board of Directors has determined that all members of the compensation committee are independent as required by the listing standards of the NYSE. The compensation committee operates under the Compensation Committee Charter which is available on the Company’s website at www.umh.reit. The charter is reviewed annually for adequacy. The role of the compensation committee is discussed in greater detail below in the section on Executive Compensation.
| -55- |
Nominating and Corporate Governance Committee
The Company has a separately-designated standing nominating and corporate governance committee, consisting of four of our independent directors. The members of the nominating and corporate governance committee are Matthew I. Hirsch, Stuart D. Levy, James E. Mitchell, and Stephen B. Wolgin (Chairman). The Company’s Board of Directors has determined that all members of the nominating and corporate governance committee are independent as required by the listing standards of the NYSE. The nominating and corporate governance committee operates under the Nominating and Corporate Governance Committee Charter which is available on the Company’s website at www.umh.reit. The charter is reviewed annually for adequacy. Among its other responsibilities, the nominating and corporate governance committee identifies and evaluates candidates to be nominated as directors, which may include candidates put forward by shareholders. Qualifications for directors include, but are not limited to, a candidate’s judgment, skill, experience with businesses and organizations comparable to the Company, the interplay of the candidate’s experience with the experience of other Board members, the candidate’s independence according to the rules of the New York Stock Exchange, diversity, and the extent to which the candidate would be a desirable addition to the Board of Directors and any of its committees.
Section 16(a) Beneficial Ownership Reporting Compliance
There have been no delinquent filers pursuant to Item 405 of regulation S-K, to the best of management’s knowledge.
Code of Ethics
The Company has adopted the Code of Business Conduct and Ethics applicable to its Chief Executive Officer and Chief Financial Officer, as well as the Company’s other officers, directors and employees (the “Code of Ethics”). The Code of Ethics can be found at the Company’s website at www.umh.reit. The Code of Ethics is also available in print to any person without charge who requests a copy by writing or telephoning us at the following address and telephone number: UMH Properties, Inc., Attention: Stockholder Relations, 3499 Route 9 North, Suite 3-C, Juniper Business Plaza, Freehold, New Jersey 07728, (732) 577-9997. The Company will satisfy any disclosure requirements under Item 5.05(c) of Form 8-K regarding a waiver from any provision of the Code of Ethics for principal officers or directors by disclosing the nature of such amendment of waiver on our website.
Corporate Governance Materials
Our Corporate Governance Guidelines and Code of Business Conduct and Ethics and the charters for the Audit Committee, Compensation Committee and Nominating and Corporate Governance Committee are published on the Corporate Governance section on our website at www.umh.reit. The other information contained on, or available through, our website is not included as a part of, or incorporated by reference into, this Form 10-K.)
Item 11 – Executive Compensation
The Company will file its definitive Proxy Statement for its 2018 Annual Meeting of Stockholders within the period required under the applicable rules of the Securities and Exchange Commission. Additional information required by this Item is included under the caption “ELECTION OF DIRECTORS”, “EXECUTIVE COMPENSATION” and “CERTAIN RELATIONSHIPS AND RELATED TRANSACTIONS” of such Proxy Statement and is incorporated herein by reference.
| -56- |
The following table highlights important aspects of our executive compensation program, which promote good governance and serve the interests of our shareholders.
| Highlights | ||
| Cash bonus program for CEO and CFO tied to objective financial performance goals | ||
| Total executive compensation for our CEO is below the 25th percentile in the REIT industry based upon the 2017 NAREIT Compensation Survey. | ||
| Robust stock ownership guidelines and anti-hedging policy: | ||
● |
CEO: 6x base salary | |
| ● | Directors: 3x annual cash fee | |
| ● | Directors, officers and employees are prohibited from the purchase or sale of puts, calls, options or other derivative securities, and from hedging or monetization transactions, such as forward sale contracts, in which the shareholder continues to own the underlying Company security without all the risks or rewards of ownership | |
| No excessive perquisites or other benefits | ||
| No repricing or buyout of stock options | ||
No excise tax gross-ups
| ||
Compensation Discussion and Analysis
Overview of Compensation Program
The Compensation Committee (for purposes of this analysis, the “Committee”) of the Board has been appointed to discharge the Board’s responsibilities relating to the compensation of the Company’s executive officers and directors. The Committee has the overall responsibility for approving and evaluating the executive compensation plans, policies and programs of the Company, and does not delegate this responsibility to any other person(s). The Committee’s primary objectives include serving as an independent and objective party to review such compensation plans, policies and programs. The Committee has not retained or obtained the advice of a compensation committee consultant for determining or recommending the amount of executive or director compensation.
Throughout this report, the individuals who served as the Company’s chief executive officer and chief financial officer during 2017, as well as certain other individuals included in the Summary Compensation Table presented below in Item 11 of this report, are sometimes referred to in this report as the “named executive officers.”
Compensation Philosophy and Objectives
The Committee believes that a well-designed compensation program should align the interests of the named executive officers with the interests of the shareholders, and that a significant part of the executives’ compensation, over the long term, should be dependent upon the value created for shareholders. In addition, all executives should be held accountable through their compensation for the performance of the Company, and compensation levels should also reflect the executive’s individual performance in an effort to encourage increased individual contributions to the Company’s performance. The compensation philosophy, as reflected in the Company’s employment agreements with its executives and the overall compensation program, is designed to motivate executives to focus on operating results and create long-term shareholder value by:
| -57- |
| ● | establishing a plan that attracts, retains and motivates executives through compensation that is competitive with comparable publicly-traded REITs; | |
| ● | rewarding executives for individual accomplishments and achievements; | |
| ● | linking a portion of executives’ compensation to the achievement of the Company’s business plan by using measurements of the Company’s operating results and shareholder return; and | |
| ● | building a pay-for-performance program that encourages and rewards successful initiatives within a team environment. |
The salaries and bonuses in the Company’s executive employment agreements are consistent with the Committee’s philosophy and objectives.
The Committee believes that each of the above factors is important when determining compensation levels for named executive officers. The Committee reviews and approves the employment contracts for the Chairman of the Board, the President and Chief Executive Officer, and the Vice President and Chief Financial Officer, as well as other named executive officers, and reviews and approves the performance goals and objectives applicable to their performance-based compensation. The Committee annually evaluates performance of the named executive officers in light of those goals and objectives. The Committee considers the Company’s performance, relative stockholder return, the total compensation provided to comparable officers at similarly-situated companies, and compensation given to named executive officers in prior years.
The Committee believes executive compensation packages provided by the Company to its named executive officers should include both base salaries and annual bonus awards that reward corporate and individual performance, as well as give incentives to executives to meet or exceed established goals. As a result, an important portion of the Company’s compensation program is comprised of discretionary bonuses and equity awards as determined by the Committee in recognition of individual accomplishments and achievements, as well as overall Company performance.
The Committee uses the Residential Sector of the Real Estate Compensation Survey (the “Survey”), produced under the guidance of NAREIT, as a guide to setting compensation levels. Participant company data is not presented in a manner that specifically identifies any named individual or company. The Survey details compensation by position type and company size with statistical salary and bonus information for each position. The Company’s salaries, bonus amounts and long-term compensation awards are compared to the ranges presented for reasonableness.
Role of Executive Officers in Compensation Decisions
The Committee makes all final compensation decisions for the Company’s named executive officers. The Chairman of the Board and the President and Chief Executive Officer annually review the performance of the other named executive officers and then present their conclusions and recommendations to the Committee with respect to base salary adjustments, annual cash bonuses, stock options and restricted stock awards. The Committee exercises its own discretion in modifying any recommended adjustments or awards, but does consider the recommendations from management who work closely with the other named executive officers.
Role of Grants of Stock Options and Restricted Stock in Compensation Analysis
The Committee views the grant of stock options and restricted stock awards as a form of long-term compensation. The Committee believes that such grants promote the Company’s goal of retaining key employees, and align the key employees’ interests with those of the Company’s shareholders from a long-term perspective. The number of options or shares of restricted stock granted to each employee, and the performance or time-based vesting criteria associated with each grant, is determined by consideration of various factors including, but not limited to, the employee’s contribution, title, responsibilities and years of service. The Committee takes outstanding awards of stock options and restricted stock into account in making its compensation determinations.
| -58- |
Role of Employment Agreements in Determining Executive Compensation
Most of the Company’s currently employed named executive officers are parties to employment agreements. These agreements provide for base salaries, bonuses and customary fringe benefits. The employment agreements also provide for certain severance benefits in the event the named executive officer’s employment is terminated. Such severance benefits are designed to alleviate the financial impact of termination of employment, with the intent of providing for a stable work environment. Other key elements of the Company’s compensation program for the named executive officers are stock options, restricted stock awards and other benefits. Each of these is addressed separately below. In determining initial compensation, as incorporated into the employment agreements, the Committee considers all elements of a named executive officer’s total compensation package in comparison to current market practices and other benefits. In reviewing and setting compensation for the named executive officers, the Committee takes the terms of the employment agreements into consideration.
Shareholder Advisory Vote
One way to determine if the Company’s compensation program reflects the interests of shareholders is through their non-binding advisory vote on our executive compensation practices. At the Annual Meeting of Shareholders held on June 15, 2017, the Company’s shareholders approved by their advisory vote the compensation of the named executive officers.
Base Salaries
Base salaries are the principal fixed component of a named executive officer’s compensation, and are paid for ongoing day-to-day job responsibilities throughout the year. In order to compete for and retain talented executives who are critical to the Company’s long-term success, the Committee has determined that the base salaries of named executive officers should approximate those of executives of other equity REITs that compete with the Company for employees, investors and business, while also taking into account the named executive officers’ performance and tenure and the Company’s performance relative to its peer companies within the REIT industry using the Survey described above.
Bonuses
Performance-based Cash Bonus Awards
In addition to the provisions for base salaries under the terms of their employment agreements and discretionary cash bonuses awarded by the Committee in recognition of individual accomplishments and achievements, the President and Chief Executive Officer and the Vice President and Chief Financial Officer are entitled to receive annual cash bonuses for each year during the terms of each respective agreement. These bonuses are based on the achievement of certain performance goals set by the Committee as described below.
| -59- |
For the President and Chief Executive Officer:
| Increase same store occupancy | 0.75 | % | 1.00 | % | 1.25 | % | ||||||
| Bonus | $ | 48,800 | $ | 97,600 | $ | 122,000 | ||||||
| Increase same store revenue | 3 | % | 4 | % | 5 | % | ||||||
| Bonus | $ | 48,800 | $ | 97,600 | $ | 146,400 | ||||||
| Increase same store rental units | 400 units | 500 units | 600 units | |||||||||
| Bonus | $ | 97,600 | $ | 97,600 | $ | 122,000 | ||||||
| Increase same store sales profit | Breakeven | Up to $500,000 | Over $500,000 | |||||||||
| Bonus | $ | 48,800 | $ | 48,800 plus 10% of profit | $ | 98,800
plus 12% of profit over $500,000 | ||||||
| Reduce and or maintain same store operating costs as a percentage of revenue | 50 | % | 50 | % | 50 | % | ||||||
| Bonus | $ | 97,600 | $ | 97,600 | $ | 97,600 | ||||||
| Reduce and or maintain administrative expense as a percentage of total operating revenue | 10 | % | 10 | % | 10 | % | ||||||
| Bonus | $ | 97,600 | $ | 97,600 | $ | 97,600 | ||||||
| Maximum Bonus Potential | $ | 744,400 |
For the Vice President and Chief Financial Officer:
| Increase same store occupancy | 0.75 | % | 1.00 | % | 1.25 | % | ||||||
| Bonus | $ | 37,200 | $ | 74,400 | $ | 93,500 | ||||||
| Increase same store revenue | 3 | % | 4 | % | 5 | % | ||||||
| Bonus | $ | 37,200 | $ | 74,400 | $ | 112,700 | ||||||
| Increase same store rental units | 400 units | 500 units | 625 units | |||||||||
| Bonus | $ | 74,400 | $ | 74,400 | $ | 93,500 | ||||||
| Increase same store sales profit | Breakeven | Up to $500,000 | Over $500,000 | |||||||||
| Bonus | $ | 37,200 | $ | 37,200 plus 10% of profit | $ | 87,200 plus 12% of profit over $500,000 | ||||||
| Reduce and or maintain same store operating costs as a percentage of revenue | 50 | % | 50 | % | 50 | % | ||||||
| Bonus | $ | 74,400 | $ | 74,400 | $ | 74,400 | ||||||
| Reduce and or maintain administrative expense as a percentage of total operating revenue | 10 | % | 10 | % | 10 | % | ||||||
| Bonus | $ | 74,400 | $ | 74,400 | $ | 74,400 | ||||||
| Maximum Bonus Potential | $ | 595,700 |
| -60- |
Discretionary Cash Bonus Awards
The Committee also considers discretionary cash bonuses for the named executive officers. Discretionary cash bonuses awarded to the other named executive officers are based on recommendations made by the Chairman of the Board and the President and Chief Executive Officer, which are then considered and approved by the Committee in its discretion. The Company believes that short-term rewards in the form of cash bonuses to senior executives generally should reflect short-term results and should take into consideration both the profitability and performance of the Company and the performance of the individual, which may include comparing such individual’s performance to the preceding year, reviewing the breadth and nature of the senior executives’ responsibilities and valuing special contributions by each such individual. In evaluating performance of the Company annually for purposes of discretionary cash bonuses, the Committee considers a variety of factors, including, among others, FFO, Core FFO, Normalized FFO, net income, growth in asset size, occupancy and total return to shareholders. The Company considers FFO to be an important measure of an equity REIT’s operating performance and has adopted the definition suggested by NAREIT, which defines FFO to mean net income computed in accordance with U.S. GAAP, excluding gains or losses from sales of property, plus real estate related depreciation and amortization. The company defines Core FFO as FFO plus acquisition costs and costs of early extinguishment of debt. The Company defines Normalized FFO as Core FFO excluding gains and losses realized on securities investments and certain non-recurring charges. The Company considers FFO, Core FFO and Normalized FFO to be meaningful, additional measures of operating performance primarily because they exclude the assumption that the value of its real estate assets diminishes predictably over time and because industry analysts have accepted these as performance measures.
Other factors considered include the employee’s title and years of service. The employee’s title generally reflects the employee’s responsibilities and the employee’s years of service may be considered in determining the level of discretionary cash bonus in comparison to base salary. The Committee has declined to use specific performance formulas with respect to the other named executive officers, believing that with respect to Company performance, such formulas do not adequately account for many factors, including, among others, the relative performance of the Company compared to its competitors during variations in the economic cycle, and that with respect to individual performance, such formulas are not a substitute for the subjective evaluation by the Committee of a wide range of management and leadership skills of each of the senior executives.
In setting discretionary bonuses for 2017, the Committee considered the performance of the Chairman of the Board, the President and Chief Executive Officer and the Vice President and Chief Financial Officer, and received the recommendations from the Chairman of the Board and the President and Chief Executive Officer for the discretionary cash bonuses to be awarded to the other named executive officers. The Committee also considered management’s report on the Company’s 2017 achievements in financial performance, strategic growth and financial position, and the role of each named executive officer in delivering these achievements. The factors that were considered included the following progress that was made by the Company due to the efforts of management:
| ● | Increased Rental and Related Income by 12.3%; | |
| ● | Increased Community Net Operating Income (“NOI”) by 12.3%; | |
| ● | Increased Same Property NOI by 7.6%; | |
| ● | Increased Same Property Occupancy by 150 basis points from 81.2% to 82.7%; | |
| ● | Increased home sales by 27.1%; | |
| ● | Acquired 11 communities containing approximately 2,000 home sites for a total cost of $63.3 million, including our first community in Maryland, bringing our total property portfolio to 112 manufactured home communities with over 20,000 developed homesites; | |
| ● | Completed Phase I of a redevelopment community, Memphis Blues, our first all rental community; | |
| ● | Increased our rental home portfolio by 948 homes to approximately 5,600 total rental homes, representing an increase of 20.3%; | |
| ● | Increased rental home occupancy by 150 basis points from 91.5% to 93.0%; | |
| ● | Reduced the weighted average interest rate on our mortgage debt from 4.3% to 4.2%; | |
| ● | Reduced the weighted average interest rate on our total debt from 4.1% to 4.0%; | |
| ● | Issued 5,750,000 shares of a new 6.75% Series C Cumulative Redeemable Preferred Stock, for net proceeds after deducting the underwriting discount and other estimated offering expenses, of approximately $139 million; | |
| ● | Redeemed our high coupon 8.25% Series A Preferred Stock, resulting in $1.4 million in annual preferred dividend savings; | |
| ● | Issued 1,400,000 shares of our common stock raising net proceeds of $22.5 million, in conjunction with our inclusion in the MSCI REIT Index; | |
| ● | Raised $60.4 million through our Dividend Reinvestment and Stock Purchase Plan; | |
| ● | Reduced our Net Debt to Total Market Capitalization from 35.4% to 31.7% and our Net Debt Less Securities to Total Market Capitalization from 24.3% to 20.2%; | |
| ● | Increased our total market capitalization to $1.2 billion, representing an increase of 18%; |
| -61- |
| ● | Managed general and administrative costs to an appropriate level; and | |
| ● | Maintained cash distributions to shareholders. |
After considering the Company’s 2017 achievements in financial performance, strategic growth and financial position, as outlined above, as well as the individual performance of the named executive officers, the Committee established the individual discretionary cash bonuses for the named executive officers based on the Company’s overall performance and the named executive officers’ individual contributions to these accomplishments.
Long-Term Equity Incentive Compensation
Stock Options and Restricted Stock Awards
The employment agreements for the President and Chief Executive Officer and the Vice President and Chief Financial Officer provides for the grant of restricted stock awards, based on the following:
| President and Chief Executive Officer | ||||
| Achievement of any of the performance goals previously stated | 12,500 | |||
| Discretion of the Compensation Committee | 12,500 | |||
| Vice President and Chief Financial Officer | ||||
| Achievement of any of the performance goals previously stated | 10,000 | |||
| Discretion of the Compensation Committee | 10,000 |
Stock options and restricted stock awards to the other named executive officers are based on recommendations made by the Chairman of the Board and the President and Chief Executive Officer. In making its decisions, the Committee does not use an established formula or focus on a specific performance target. The Committee recognizes that often outside forces beyond the control of management, such as economic conditions, changing real estate markets and other factors, may contribute to less favorable near term results even when sound strategic decisions have been made by the senior executives to position the Company for longer term profitability. Thus, the Committee also attempts to identify whether the senior executives are exercising the kind of judgment and making the types of decisions that will lead to future growth and enhanced asset value, even if the same are difficult to measure on a current basis. For example, in determining appropriate stock option and restricted stock awards, the Compensation Committee considers, among other matters, whether the senior executives have executed strategies that will provide adequate funding or appropriate borrowing capacity for future growth, whether acquisition strategies have been developed to ensure a future stream of reliable and increasing revenues for the Company, whether the selection of properties evidence appropriate risk management, including risks associated with real estate markets, and whether the administration of staff size and compensation appropriately balances the current and projected operating requirements of the Company with the need to effectively control overhead costs, while continuing to grow the Company.
In 2017, the Compensation Committee received the recommendations from the Chairman of the Board and the President and Chief Executive Officer for specific stock options and restricted stock to be awarded. After considering the recommendations of the Chairman of the Board and the President and Chief Executive Officer and the achievements made by the Company as described above, the Committee allocated the individual awards to the named executive officers based on the named executive officers’ individual contributions to these accomplishments. Other factors considered in this allocation included the named executive officers’ responsibilities and years of service. In addition, the awards were compared to each named officers’ total compensation and compared with comparable REITs using the Survey described above as a guide for setting total compensation.
Other Personal Benefits
The Company’s employment agreements provide the named executive officers with other personal benefits that the Company and the Committee believe are reasonable and consistent with its overall compensation program to better enable the Company to attract and retain superior employees for key positions. The Committee periodically reviews the levels of other personal benefits provided to the named executive officers.
| -62- |
The named executive officers are provided the following benefits under the terms of their employment agreements: an allotted number of paid vacation weeks; eligibility for the executives, spouses and dependents in all Company sponsored employee benefits plans, including 401(k) plan, group health, accident, and life insurance, on such terms no less favorable than applicable to any other executive; use of an automobile; and, supplemental disability insurance, at the Company’s cost, as agreed to by the Company and the named executive officer. Attributed costs of the personal benefits described above for the named executive officers for the fiscal year ended December 31, 2017, are included in “All Other Compensation” of the Summary Compensation Table provided below under Item 11 of this report.
Payments upon Termination or Change in Control
In addition, the employment agreements of certain named executive officers each contain provisions relating to change in control events and severance upon termination. These change in control and severance terms are designed to promote stability and continuity of senior management. Information regarding these provisions is included in “Employment Agreements” provided below in Item 11 of this report. There are no other agreements or arrangements governing change in control payments.
Evaluation
Mr. Eugene Landy is employed under an amended employment agreement with the Company. His base compensation under his amended contract was increased in 2014 to $250,000 per year. Mr. Eugene Landy also received bonuses totaling $34,615 primarily based on performance, including growth of the Company. Additionally, Mr. Eugene Landy received $57,000 in director’s fees and fringe benefits. In recognition of Mr. Eugene Landy’s contributions to the Company over the last five decades and, in particular, over the last year, the Compensation Committee approved and granted a stock option award of 100,000 shares. This stock option has a grant date fair value of $1.84 per share, for a total grant date fair value of $184,000.
The Committee also reviewed the progress made by Mr. Samuel A. Landy, President and Chief Executive Officer and Ms. Anna T. Chew, Vice President and Chief Financial Officer, as well as their contributions toward the progress that the Company has made discussed under “Bonuses” above. Mr. Samuel Landy is employed under an employment agreement with the Company. His base compensation under this contract was $488,000 for 2017. In evaluating Mr. Samuel Landy’s eligibility for annual performance-based and discretionary bonuses, stock options and restricted stock awards, the Compensation Committee used the bonus schedule included in Mr. Samuel Landy’s employment agreement as a guide.
Ms. Chew is employed under an employment agreement with the Company. Her base compensation under this contract is $371,000 for 2017. In evaluating Ms. Chew’s eligibility for annual performance-based and discretionary bonuses, stock options and restricted stock awards, the Compensation Committee used the bonus schedule included in Ms. Chew’s employment agreement as a guide.
All named executive officers were awarded their respective compensation based on their respective employment agreements and the many contributions that they have made towards the Company’s achievements. The Committee also considered and approved the recommendations of the Chairman of the Board and the President and Chief Executive Officer concerning the other named executives’ annual salaries, bonuses, stock option and restricted stock grants and fringe benefits.
In addition to its determination of the executive’s individual performance levels for 2017, the Committee also compared the executive’s total compensation for 2017 to that of similarly-situated personnel in the REIT industry using the Survey described above. The Company’s salary and bonus amounts were compared to the ranges presented for reasonableness.
| -63- |
Ownership Guidelines
In order to encourage the President and Chief Executive Officer and our directors to retain investments in the Company and help further align their interests with the interests of our shareholders, the Committee has adopted stock ownership guidelines as follows:
President and Chief Executive Officer – six times base salary
Directors – three times annual cash fee
For purposes of determining compliance with these ownership guidelines (other than the holding period for vested equity compensation), the value of stock holdings will be calculated based on the closing price of a share of the Company’s common stock on the last trading day of the Company’s year, which was $14.90 on December 29, 2017. Shares owned by a director or officer include: shares owned outright by the director or officer or by his or her immediate family members residing in the same household; shares held in trust or under a similar arrangement for the economic benefit of the director or officer; restricted or unrestricted stock issued as part of the director or officer’s compensation, whether or not vested; shares acquired upon option exercise that the director or executive officer continues to own; and shares held for the director or executive officer’s account in a 401(k) or other retirement plan.
Risk Management
The Committee has assessed our compensation program for the purpose of viewing and considering any risks presented by our compensation policies and practices that are likely to have a material adverse effect on us. As part of that assessment, management reviewed the primary elements of our compensation program, including base salary, annual bonus opportunities, equity compensation and severance arrangements. Management’s risk assessment included a review of the overall design of each primary element of our compensation program, and an analysis of the various design features, controls and approval rights in place with respect to compensation paid to management and other employees that mitigate potential risks to us that could arise from our compensation program. Following the assessment, management determined that our compensation policies and practices did not create risks that were reasonably likely to have a material adverse effect on us and reported the results of the assessment to the Committee.
Compensation Committee Report
The Compensation Committee of the Board has reviewed and discussed the Compensation Discussion and Analysis required by Item 402(b) of Regulation S-K with management and, based on such review and discussions, the Compensation Committee recommended to the Board that the Compensation Discussion and Analysis be included in this report.
| Compensation Committee: | |
| Jeffrey A. Carus (Chairman) | |
| Stuart D. Levy | |
| James E. Mitchell | |
| Stephen B. Wolgin | |
| -64- |
Summary Compensation Table
The following Summary Compensation Table shows compensation paid by the Company for services rendered during 2017, 2016 and 2015 to the named executive officers. There were no other executive officers whose aggregate cash compensation exceeded $100,000:
Name and Principal Position | Year | Salary | Bonus | Restricted Stock Awards (4) | Option Awards (5) | Non-equity Incentive Plan Compensation | Change in Pension Value and Nonqualified Deferred Compensation Earnings | All Other Compensation | Total | |||||||||||||||||||||||||||
| Eugene W. Landy | 2017 | $ | 250,000 | $ | 34,615 | $ | 16,907 | $ | 184,000 | $ | -0- | $ | -0- | $ | 107,000 | (1) | $ | 592,522 | ||||||||||||||||||
| Chairman of the | 2016 | 250,000 | 34,615 | 231,400 | 81,000 | -0- | -0- | 49,500 | (1) | 646,515 | ||||||||||||||||||||||||||
| Board | 2015 | 250,000 | 134,615 | 9,120 | 93,000 | -0- | -0- | 47,000 | (1) | 533,735 | ||||||||||||||||||||||||||
| Samuel A. Landy | 2017 | 488,000 | 18,769 | 392,907 | 169,500 | 567,600 | -0- | 67,600 | (2) | 1,704,376 | ||||||||||||||||||||||||||
| President and Chief | 2016 | 473,000 | 18,192 | 219,825 | 40,500 | 552,000 | -0- | 60,100 | (2) | 1,363,617 | ||||||||||||||||||||||||||
| Executive Officer | 2015 | 460,000 | 19,356 | 252,370 | 46,500 | 70,847 | -0- | 57,400 | (2) | 906,473 | ||||||||||||||||||||||||||
| Anna T. Chew | 2017 | 371,000 | 14,269 | 317,707 | 107,500 | 435,300 | -0- | 67,600 | (2) | 1,313,376 | ||||||||||||||||||||||||||
| Vice President and | 2016 | 360,000 | 13,846 | 175,860 | 40,500 | 422,000 | -0- | 60,100 | (2) | 1,072,306 | ||||||||||||||||||||||||||
| Chief Financial Officer | 2015 | 349,000 | 39,660 | 9,120 | 46,500 | -0- | -0- | 57,400 | (2) | 501,680 | ||||||||||||||||||||||||||
| Craig Koster | 2017 | 215,000 | 33,269 | -0- | 36,800 | -0- | -0- | 8,851 | (3) | 293,920 | ||||||||||||||||||||||||||
| General Counsel | 2016 | 171,171 | 31,584 | -0- | 16,200 | -0- | -0- | 7,350 | (3) | 226,305 | ||||||||||||||||||||||||||
| 2015 | 152,769 | 30,985 | -0- | 18,600 | -0- | -0- | 5,868 | (3) | 208,222 | |||||||||||||||||||||||||||
| Brett Taft | 2017 | 172,000 | 56,615 | -0- | 36,800 | -0- | -0- | 8,764 | (3) | 274,179 | ||||||||||||||||||||||||||
| Vice President | 2016 | 138,000 | 55,308 | -0- | 16,200 | -0- | -0- | 4,225 | (3) | 213,733 | ||||||||||||||||||||||||||
| 2015 | 115,000 | 14,223 | -0- | 18,600 | -0- | -0- | 3,289 | (3) | 151,112 | |||||||||||||||||||||||||||
| (1) | Represents Director’s annual board cash retainer of $41,000, $33,500 and $31,000 for 2017, 2016 and 2015, respectively, Director’s meeting fees of $16,000, $16,000 and $16,000 for 2017, 2016 and 2015, respectively, and additional retirement benefit of $50,000 in 2017. | |
| (2) | Represents Director’s annual board cash retainer of $41,000, $33,500 and $31,000 for 2017, 2016 and 2015, respectively, Director’s meeting fees of $16,000, $16,000 and $16,000 for 2017, 2016 and 2015, respectively, and fringe benefits and discretionary contributions by the Company to the Company’s 401(k) Plan allocated to an account of the named executive officer. | |
| (3) | Represents discretionary contributions by the Company to the Company’s 401(k) Plan allocated to an account of the named executive officer. | |
| (4) | The grant date fair values were established based on the number of shares granted and the share prices as follows: 2017, 4/4/17- $15.04, 9/27/17- $15.37 (see table below for details); 2016, 4/5/16 - $9.77, 9/14/16 - $11.57 and 2015, 2/5/15 - $9.73, 9/14/15 - $9.12. Such shares vest over five years. | |
| (5) | The fair value of the stock options granted were established using the Black-Scholes stock option valuation model. See Note 6 of the Notes to the Consolidated Financial Statements for assumptions used in the model. The actual value of the options will depend upon the performance of the Company during the period of time the options are outstanding and the price of the Company’s common stock on the date of exercise. |
Pay Ratio
The following is a reasonable estimate, prepared under applicable SEC rules, of the ratio of the annual total compensation of our President and Chief Executive Officer to the median of the annual total compensation of our other employees. The median of the annual total cash compensation of all employees (other than our President and Chief Executive Officer) is $35,760 at December 29, 2017. The President and Chief Executive Officer’s total cash compensation as an employee for 2017, which includes salary, bonus and non-equity incentive plan compensation, as disclosed in the summary compensation table above, total $1,074,369. We determined our median employee based on total direct compensation, which we calculated as annual base pay and the value of annual cash incentive awards paid in 2017. We did not include any contractors or other non-employee workers in our employee population. We annualized base pay for any full-time and part-time employees who was an employee of the Company as of December 29, 2017. For 2017, the ratio of the annual total compensation of our President and Chief Executive Officer to the median of the annual total compensation of our other employees was 30 to 1. Given the different methodologies that various companies use to determine an estimate of their pay ratio, our estimated ratio should not be used as a basis for comparison between companies.
| -65- |
Equity Compensation Plan Information
On June 13, 2013, the shareholders approved and ratified the Company’s 2013 Stock Option and Stock Award Plan (the “2013 Plan”) authorizing the grant of stock options or restricted stock awards to Directors, officers and key employees. The maximum number of shares that may be issued under the 2013 Plan is 3,000,000 shares of common stock. If and to the extent that an award made under the 2013 Plan is forfeited, terminated, expires or is canceled unexercised, the number of shares associated with the forfeited, terminated, expired or canceled portion of the award shall again become available for additional awards under the 2013 Plan. The 2013 Plan replaced the Company’s 2003 Stock Option and Award Plan, as amended, which, pursuant to its terms, terminated in 2013. The outstanding options under the 2003 Stock Option and Award Plan, as amended, remain outstanding until exercised, forfeited or expired. Not more than 200,000 shares of the Company’s common stock may be granted as options in any one fiscal year to a participant under the 2013 Plan. In general, each option may be exercised only after one year of continued service with the Company. The maximum number of shares underlying restricted stock awards that may be granted in any one fiscal year to a participant is 100,000 shares.
Grants of Plan-Based Awards
The following table sets forth, for the named executive officers in the Summary Compensation Table, information regarding individual grants of restricted stock and stock options made under the 2013 Plan during the year ended December 31, 2017:
| Name | Grant Date | Number
of Shares of Restricted Stock (1) | Number
of Shares Underlying Options (2) | Exercise
Price of Option Award or Fair Value Per Share at Grant Date of Restricted Stock Award | Grant
Date Fair Value (3) | |||||||||||||
| Eugene W. Landy | 4/04/2017 | -0- | 100,000 | $ | 15.04 | $ | 184,000 | |||||||||||
| 9/27/2017 | 1,100 | -0- | 15.37 | 16,907 | ||||||||||||||
| Samuel A. Landy | 1/19/2017 | -0- | 50,000 | 14.25 | 77,500 | |||||||||||||
| 4/04/2017 | -0- | 50,000 | 15.04 | 92,000 | ||||||||||||||
| 4/04/2017 | 25,000 | -0- | 15.04 | 376,000 | ||||||||||||||
| 9/27/2017 | 1,100 | -0- | 15.37 | 16,907 | ||||||||||||||
| Anna T. Chew | 1/19/2017 | -0- | 10,000 | 14.25 | 15,500 | |||||||||||||
| 4/04/2017 | -0- | 50,000 | 15.04 | 92,000 | ||||||||||||||
| 4/04/2017 | 20,000 | -0- | 15.04 | 300,800 | ||||||||||||||
| 9/27/2017 | 1,100 | -0- | 15.37 | 16,907 | ||||||||||||||
| Craig Koster | 4/04/2017 | -0- | 20,000 | 15.04 | 36,800 | |||||||||||||
| Brett Taft | 4/04/2017 | -0- | 20,000 | 15.04 | 36,800 | |||||||||||||
| -66- |
| (1) | Restricted stock awards granted during fiscal year 2017 vest 20% per year over a five-year period, and all dividends earned are reinvested in restricted stock. Restricted stock awards of 1,100 shares to Eugene W. Landy, Samuel A. Landy and Anna T. Chew represents compensation for their service as a director. These awards also vest over a five-year period, except for 100 shares which vests over a three-month period. | |
| (2) | These options are exercisable and vest after 1 year and expire 10 years from grant date. | |
| (3) | The values of the shares underlying options were established using the Black-Scholes stock option valuation model. The following assumptions were used in the model: expected volatility of 26.30%; risk-free interest rate of 2.36%; dividend yield of 5.74%; expected life of the options of ten years; and forfeitures of $-0. The actual value of the options will depend upon the performance of the Company during the period of time the options are outstanding and the price of the Company’s common stock on the date of exercise. The value of the shares of restricted stock was based on the closing price of the shares on the grant date. |
Narrative Disclosure to Summary Compensation Table and Grants of Plan-Based Awards Table
Our executive compensation policies and practices, pursuant to which the compensation set forth in the Summary Compensation Table and the Grants of Plan-Based Awards Table was paid or awarded to our named executive officers, are described above under “Compensation Discussion and Analysis” and below under “Employment Agreements.”
Option Exercises and Stock Vested
The following table sets forth summary information concerning option exercises and vesting of restricted stock awards for each of the named executive officers during the year ended December 31, 2017:
| Option Awards | Restricted Stock Awards | |||||||||||||||
| Number of Shares Acquired | Value Realized | Number of Shares Acquired | Value Realized | |||||||||||||
| on Exercise | on Exercise | on Vesting | on Vesting | |||||||||||||
| Name | (#) | ($) (1) | (#) | ($) (1) | ||||||||||||
| Eugene W. Landy | -0- | $ | -0- | 7,773 | $ | 123,209 | ||||||||||
| Samuel A. Landy | 125,000 | 643,203 | 24,660 | 357,441 | ||||||||||||
| Anna T. Chew | 50,000 | 278,500 | 7,395 | 113,644 | ||||||||||||
| Craig Koster | 12,500 | 63,913 | -0- | -0- | ||||||||||||
| Brett Taft | -0- | -0- | -0- | -0- | ||||||||||||
(1) Value realized based on the closing price of the shares on the NYSE as of the date of exercise/vesting.
| -67- |
Outstanding Equity Awards at Fiscal Year-End
The following table sets forth for the named executive officers in the Summary Compensation Table, information regarding stock options and restricted stock outstanding at December 31, 2017:
| Option Awards (1) | Restricted Stock Awards (2) | |||||||||||||||||||||
| Name | Number
of Securities Underlying Unexercised Options Exercisable | Number
of Securities Underlying Unexercised Options UnExercisable | Option
Exercise Price | Option Expiration Date | Number
of Shares that have not Vested | Market
Value of Shares that have not Vested | ||||||||||||||||
| Eugene W. Landy | 18,734 | $ | 279,137 | |||||||||||||||||||
| Eugene W. Landy | 100,000 | -0- | $ | 10.08 | 06/26/21 | |||||||||||||||||
| Eugene W. Landy | 100,000 | -0- | $ | 9.85 | 06/11/22 | |||||||||||||||||
| Eugene W. Landy | 100,000 | -0- | $ | 9.82 | 06/24/23 | |||||||||||||||||
| Eugene W. Landy | 100,000 | -0- | $ | 9.77 | 04/05/24 | |||||||||||||||||
| Eugene W. Landy | -0- | 100,000 | $ | 15.04 | 04/04/27 | |||||||||||||||||
| Samuel A. Landy | 78,728 | $ | 1,173,048 | |||||||||||||||||||
| Samuel A. Landy | 50,000 | -0- | $ | 9.82 | 06/24/23 | |||||||||||||||||
| Samuel A. Landy | 50,000 | -0- | $ | 9.77 | 04/05/24 | |||||||||||||||||
| Samuel A. Landy | -0- | 50,000 | $ | 14.25 | 01/19/27 | |||||||||||||||||
| Samuel A. Landy | -0- | 50,000 | $ | 15.04 | 04/04/27 | |||||||||||||||||
| Anna T. Chew | 38,277 | $ | 570,326 | |||||||||||||||||||
| Anna T. Chew | 50,000 | -0- | $ | 10.08 | 06/26/21 | |||||||||||||||||
| Anna T. Chew | 20,000 | -0- | $ | 9.85 | 06/11/22 | |||||||||||||||||
| Anna T. Chew | 50,000 | -0- | $ | 9.82 | 06/24/23 | |||||||||||||||||
| Anna T. Chew | -0- | 10,000 | $ | 14.25 | 01/19/27 | |||||||||||||||||
| Anna T. Chew | -0- | 50,000 | $ | 15.04 | 04/04/27 | |||||||||||||||||
| Craig Koster | -0- | $ | -0- | |||||||||||||||||||
| Craig Koster | 5,000 | -0- | $ | 10.08 | 06/26/21 | |||||||||||||||||
| Craig Koster | 5,000 | -0- | $ | 9.85 | 06/11/22 | |||||||||||||||||
| Craig Koster | 20,000 | -0- | $ | 9.77 | 04/05/24 | |||||||||||||||||
| Craig Koster | -0- | 20,000 | $ | 15.04 | 04/04/27 | |||||||||||||||||
| Brett Taft | -0- | $ | -0- | |||||||||||||||||||
| Brett Taft | 4,000 | -0- | $ | 11.29 | 08/29/20 | |||||||||||||||||
| Brett Taft | 10,000 | -0- | $ | 10.08 | 06/26/21 | |||||||||||||||||
| Brett Taft | 12,000 | -0- | $ | 9.85 | 06/11/22 | |||||||||||||||||
| Brett Taft | 20,000 | -0- | $ | 9.77 | 04/05/24 | |||||||||||||||||
| Brett Taft | -0- | 20,000 | $ | 15.04 | 04/04/27 | |||||||||||||||||
| (1) | Stock options vest 1 year from the date of grant. | |
| (2) | Restricted stock awards vest over 5 years, 20% per year, from the date of grant. The following is the vesting schedule for the shares that have not yet vested: Mr. Eugene Landy – 4,689 shares, 4,689 shares, 4,691 shares, 4,462 shares and 203 shares in 2018, 2019, 2020, 2021 and 2022, respectively; Mr. Samuel Landy – 23,186 shares, 23,187 shares, 16,633 shares, 10,338 shares, and 5,384 shares in 2018, 2019, 2020, 2021 and 2022 respectively; and Ms. Anna Chew, – 8,538 shares, 8,539 shares, 8,540 shares, 8,313 shares and 4,347 shares in 2018, 2019, 2020, 2021 and 2022, respectively. Market value is based on the closing price of our common stock on December 31, 2017 of $14.90. |
Employment Agreements
The Company has an Employment Agreement with Mr. Eugene W. Landy, Founder and Chairman of the Board. Under this agreement, Mr. Landy receives an annual base compensation of $250,000 (as amended) plus bonuses and customary fringe benefits, including health insurance, participation in the Company’s 401(k) Plan, stock options, five weeks’ vacation and use of an automobile. Additionally, there may be bonuses voted by the Board of Directors. The Employment Agreement is terminable by either party at any time subject to certain notice requirements. The Employment Agreement provides for aggregate severance payments of $450,000, payable to Mr. Eugene Landy upon the termination of his employment for any reason in increments of $150,000 on severance and $150,000 on the first and second anniversaries of severance. In the event of disability, Mr. Landy’s compensation will continue for a period of three years, payable monthly. He is entitled to receive a pension of $50,000 a year through 2017. In the event of death, Mr. Landy’s designated beneficiary will receive $450,000, $100,000 thirty days after death and the balance one year after death. The Employment Agreement automatically renews each year for successive one-year periods. On April 14, 2008, the Company executed a Second Amendment to the Employment Agreement with Mr. Landy (the “Second Amendment”). The Second Amendment provides that in the event of a change in control, Eugene W. Landy shall receive a lump sum payment of $1,200,000, provided the sale price of the Company is at least $16 per share of common stock. A change of control shall be defined as the consummation of a reorganization, merger, share exchange, consolidation, or sale or disposition of all or substantially all of the assets of the Company. This change of control provision shall not apply to any combination between the Company and MREIC. Payment shall be made simultaneously with the closing of the transaction, and only in the event that the transaction closes.
| -68- |
Effective as of January 1, 2015, the Company and Mr. Samuel A. Landy entered into an amended and restated three-year Employment Agreement. The employment agreement is renewed automatically for a new three-year term as of the first day of each calendar quarter after the effective date unless otherwise terminated. Under the agreement, Mr. Landy is entitled to receive an annual base salary of $460,000 for 2015, $473,000 for 2016 and $488,000 for 2017. For calendar years after 2017, Mr. Landy’s base salary will be set by the Compensation Committee of the Company’s Board of Directors but will be no less than his base salary for the preceding year. Mr. Landy will be eligible for annual cash bonuses based on the Company’s achievement of certain performance objectives specified in the Employment Agreement as determined by the Compensation Committee. Mr. Landy will also be entitled to equity awards of up to 25,000 shares of restricted stock each year based on achievement of performance objectives as determined by the Compensation Committee. If Mr. Landy’s employment is terminated for any reason, either involuntarily or voluntarily, including the death of Mr. Landy or termination for cause, Mr. Landy shall be entitled to the base salary plus base target bonuses due under the Employment Agreement for the remaining term of the Employment Agreement. The Employment Agreement also provides that, upon a change of control of the Company, the Employment Agreement will automatically renew for three years from the date of the change of control. Additionally or alternatively, if a change of control occurs, Mr. Landy shall have the right to terminate the Employment Agreement and continue to receive the base salary plus base target bonuses and restricted stock awards he would have been entitled to receive during the remaining term of the Employment Agreement. In addition, provided that Mr. Landy is actively employed by the Company as of the consummation of a change of control, Mr. Landy shall be entitled to a transaction bonus consistent with the terms of the Company’s Executive Management Transaction Bonus Plan, which shall be approved by the Compensation Committee. The Employment Agreement entitles Mr. Landy to customary fringe benefits, including vacation, life insurance and health benefits, the use of an automobile, and the right to participate in the Company’s 401(k) retirement plan. Mr. Landy is currently negotiating a new employment agreement.
Effective as of January 1, 2015, the Company and Ms. Anna T. Chew, its Chief Financial Officer, entered into an amended and restated three-year Employment Agreement. The employment agreement is renewed automatically for a new three-year term as of the first day of each calendar quarter after the effective date unless otherwise terminated. Under the agreement, Ms. Chew is entitled to receive an annual base salary of $349,000 for 2015, $360,000 for 2016 and $371,000 for 2017. For calendar years after 2017, Ms. Chew’s base salary will be set by the Compensation Committee of the Company’s Board of Directors but will be no less than her base salary for the preceding year. Ms. Chew will be eligible for annual cash bonuses based on the Company’s achievement of certain performance objectives specified in the Employment Agreement as determined by the Compensation Committee. Ms. Chew will also be entitled to equity awards of up to 20,000 shares of restricted stock each year based on achievement of performance objectives as determined by the Compensation Committee. Under the Employment Agreement, if Ms. Chew’s employment is terminated for any reason, either involuntarily or voluntarily, including the death of Ms. Chew or termination for cause, Ms. Chew shall be entitled to the base salary plus base target bonuses due under the Employment Agreement for the remaining term of the Employment Agreement. The Employment Agreement also provides that, upon a change of control of the Company, the Employment Agreement will automatically renew for three years from the date of the change of control. Additionally or alternatively, if a change of control occurs, Ms. Chew shall have the right to terminate the Employment Agreement and continue to receive the base salary plus base target bonuses and restricted stock awards she would have been entitled to receive during the remaining term of the Employment Agreement. In addition, provided that Ms. Chew is actively employed by the Company as of the consummation of a change of control, Ms. Chew shall be entitled to a transaction bonus consistent with the terms of the Company’s Executive Management Transaction Bonus Plan, which shall be approved by the Compensation Committee. The Employment Agreement entitles Ms. Chew to customary fringe benefits, including vacation, life insurance and health benefits, the use of an automobile, and the right to participate in the Company’s 401(k) retirement plan. Ms. Chew is currently negotiating a new employment agreement.
| -69- |
Potential Payments upon Termination of Employment or Change-in-Control
Under the terms of the employment agreements of the named executive officers, such named executive officers are entitled to receive the following estimated payments and benefits upon a termination of employment or voluntary resignation (with or without a change-in-control). These disclosed amounts are estimates only and do not necessarily reflect the actual amounts that would be paid to the named executive officers, which would only be known at the time that they become eligible for payment and would only be payable if a termination of employment, or voluntary resignation, were to occur. The table below reflects the amount that could be payable under the various arrangements assuming that the termination of employment had occurred at December 31, 2017. Each of the employees named in the table below have restricted stock awards and/or stock option awards which are listed in the “Outstanding Equity Awards at Fiscal Year End” table previously disclosed. Restricted Stock Awards vest upon the termination of an employee due to death or disability. In addition, restricted stock awards vest on the date of an involuntary termination of employment with the Company if the employee has met the definition of Retirement. If the termination of employment is for any other reason, including voluntary resignation, termination not for cause or good reason resignation, termination for cause, or termination not for cause or good reason (after a change in control), the restricted stock awards are forfeited. Regarding the stock option awards, if the termination is for any reason other than a termination for cause, the stock option awards may be exercised until three months after the termination of employment. If the termination is for cause, the stock option awards are forfeited.
| Voluntary Resignation on 12/31/17 | Termination Not
for Cause or
Good Reason
on 12/31/17 | Termination for
Cause on 12/31/17 | Termination
Not for
Cause or Good
Reason (After
a Change- in-Control)
on 12/31/17 | Disability
or Death on 12/31/17 | ||||||||||||||||
| Eugene W. Landy | $ | 450,000 | (1) | $ | 450,000 | (1) | $ | 450,000 | (1) | $ | 1,650,000 | (2) | $ | 750,000 | (3) | |||||
| Samuel A. Landy | 2,781,600 | (4) | 2,781,600 | (4) | 2,781,600 | (4) | 2,781,600 | (4) | 2,781,600 | (4) | ||||||||||
| Anna T. Chew | 2,117,400 | (4) | 2,117,400 | (4) | 2,117,400 | (4) | 2,117,400 | (4) | 2,117,400 | (4) |
| (1) | Consists of severance payments of $450,000, payable $150,000 per year for three years. | |
| (2) | Mr. Landy shall receive a lump-sum payment of $1,200,000 in the event of a change in control, provided that the sale price of the Company is at least $16 per share of common stock. In addition, if Mr. Landy’s employment agreement is terminated, he receives severance payments of $450,000, payable $150,000 per year for three years. | |
| (3) | In the event of a disability, as defined in the agreement, Mr. Landy shall receive disability payments equal to his base salary for a period of three years. He has a death benefit of $450,000 payable to Mr. Landy’s beneficiary. | |
| (4) | The respective employment agreements provide for the base salaries plus base target bonuses due for the remaining terms of the agreements. The respective employment agreements also provide for death benefits of the same amount. |
The Company retains the discretion to compensate any officer upon any future termination of employment or change-in control.
Director Compensation
During 2017, directors received fees in cash of $4,000 for each Board meeting attended and $500 for each Board phone meeting attended, and an additional fixed annual fee of $41,000 payable quarterly. Directors appointed to board committees receive $1,200 paid in cash for each committee meeting attended. Effective September 27, 2017, the annual directors’ fee increased from $41,000 to $45,100, with the increase of $4,100 payable as restricted stock (minimum 100 shares), with a three-month vesting period. In addition, on September 27, 2017, the Directors received a one-time bonus of 1,000 shares of the Company’s restricted stock, which vests over five years.
| -70- |
The table below sets forth a summary of director compensation for the year ended December 31, 2017:
| Director | Annual Board Cash Retainer | Meeting Fees | Committee Fees | Restricted Stock Awards (5) | Total Fees | |||||||||||||||
| Jeffrey A. Carus (1) (3) | $ | 41,000 | $ | 16,000 | $ | 7,700 | $ | 16,907 | $ | 81,607 | ||||||||||
| Matthew I. Hirsch (2) (4) | 41,000 | 16,000 | 1,200 | 16,907 | 75,107 | |||||||||||||||
| Michael P. Landy | 41,000 | 16,000 | -0- | 16,907 | 73,907 | |||||||||||||||
| Stuart Levy (1) (2) (3) | 41,000 | 16,000 | 8,900 | 16,907 | 82,807 | |||||||||||||||
| James E. Mitchell (1)(2) | 41,000 | 16,000 | 7,700 | 16,907 | 81,607 | |||||||||||||||
| Kenneth K. Quigley, Jr. (3) | 41,000 | 16,000 | 1,200 | 16,907 | 75,107 | |||||||||||||||
| Stephen B. Wolgin (1) (2) (3) | 41,000 | 16,000 | 8,900 | 16,907 | 82,807 | |||||||||||||||
| $ | 287,000 | $ | 112,000 | $ | 35,600 | $ | 118,349 | $ | 552,949 | |||||||||||
| (1) | Mr. Carus (Chairman of the Compensation Committee), Mr. Levy, Mr. Mitchell and Mr. Wolgin are the current members of the Compensation Committee. | |
| (2) | Mr. Hirsch, Mr. Levy, Mr. Mitchell and Mr. Wolgin (Chairman of the Nominating Committee) are the current members of the Nominating committee. | |
| (3) | Mr. Carus, Mr. Levy, Mr. Quigley, Jr. and Mr. Wolgin (Chairman of the Audit Committee) are the current members of the Audit committee. | |
| (4) | Mr. Hirsch is the Presiding Director whose role is to preside over the executive sessions of the non-management directors. | |
| (5) | Represents a grant of 1,000 shares of restricted common stock to each director, which vests 20% per year over a five-year period, and 100 shares of restricted common stock to each director, which vests over a three-month period. The value of the shares of restricted stock was based on the closing price of the shares on the grant date. |
As of December 31, 2017, the aggregate number of unvested restricted shares of stock held by each director was as follows: Mr. Carus – 1,700; Mr. Hirsch – 1,700; Mr. M. Landy – 1,700; Mr. Levy – 1,700; Mr. Mitchell - 1,700; Mr. Quigley, Jr. – 1,013; and Mr. Wolgin – 1,700.
Mr. Eugene W. Landy, Mr. Samuel A. Landy and Ms. Anna T. Chew are named executive employees of the Company. As such, their director compensation is included in the Summary Compensation Table.
Pension Benefits and Nonqualified Deferred Compensation Plans
Except as provided in the specific agreements previously described, the Company has no pension or other post-retirement plans in effect for Officers, Directors or employees or a nonqualified deferred compensation plan. Payments made during 2017 for Mr. Eugene W. Landy amounted to $50,000. The Company’s employees may elect to participate in the Company’s 401(k) Plan.
| -71- |
Compensation Committee Interlocks and Insider Participation
The Compensation Committee consisted of Mr. Carus (Chairman), Mr. Levy, Mr. Mitchell and Mr. Wolgin. No member of the Compensation Committee is a current or former officer or employee of the Company. In 2017, none of our executive officers served on the compensation committee of any entity, or board of directors of any entity that did not have a compensation committee, that had one or more of its executive officers serving on our Compensation Committee. The members of the Compensation Committee did not otherwise have any relationships requiring related-party disclosure in this Form 10-K.
Item 12 – Security Ownership of Certain Beneficial Owners and Management and Related Stockholder Matters
The Company will file its definitive Proxy Statement for its 2018 Annual Meeting of Stockholders within the period required under the applicable rules of the Securities and Exchange Commission. Additional information required by this Item is included under the caption “ELECTION OF DIRECTORS” and “SECURITY OWNERSHIP OF CERTAIN BENEFICIAL OWNERS AND MANAGEMENT” of such Proxy Statement and is incorporated herein by reference.
The following table lists information with respect to the beneficial ownership of the Company’s common stock (“Shares”) as of December 31, 2017 by:
| ● | each person known by the Company to beneficially own more than five percent of the Company’s outstanding Shares; | |
| ● | the Company’s directors; | |
| ● | the Company’s executive officers; and | |
| ● | all of the Company’s executive officers and directors as a group. |
Unless otherwise indicated, the person or persons named below have sole voting and investment power over the shares indicated and that person’s address is c/o UMH Properties, Inc., Juniper Business Plaza, 3499 Route 9 North, Suite 3-C, Freehold, New Jersey 07728. In determining the number and percentage of Shares beneficially owned by each person, Shares that may be acquired by that person under options exercisable within 60 days of December 31, 2017 are deemed beneficially owned by that person and are deemed outstanding for purposes of determining the total number of outstanding Shares for that person and are not deemed outstanding for that purpose for all other shareholders.
| -72- |
| Name
and Address of Beneficial Owner | Amount
and Nature of Beneficial Ownership (1) | Percentage of Shares Outstanding (2) | ||||||
| The
Vanguard Group 100 Vanguard Blvd. Malvern, PA 19355 | 3,664,208 | (3) | 10.33 | % | ||||
| BlackRock,
Inc. 55 East 52nd Street New York, NY 10055 | 2,443,772 | (4) | 6.89 | % | ||||
| Boulegeris
Investments, Inc. 3400 Peachtree Rd. NE Suite 1049 Atlanta, GA 30326-1107 | 1,801,335 | (5) | 5.08 | % | ||||
| Jeffrey A. Carus | 6,272 | (6) | * | |||||
| Anna T. Chew | 420,518 | (7) | 1.18 | % | ||||
| Matthew I. Hirsch | 16,821 | (8) | * | |||||
| Craig Koster | 34,456 | (9) | * | |||||
| Eugene W. Landy | 1,571,727 | (10) | 4.38 | % | ||||
| Samuel A. Landy | 717,888 | (11) | 2.01 | % | ||||
| Michael P. Landy | 339,688 | (12) | * | |||||
| Stuart Levy | 3,694 | (13) | * | |||||
| James E. Mitchell | 230,208 | (14) | * | |||||
| Kenneth K. Quigley, Jr. | 4,528 | (15) | * | |||||
| Brett Taft | 46,155 | (16) | * | |||||
| Stephen B. Wolgin | 26,925 | (17) | * | |||||
| UMH Properties, Inc. 401(k) Plan (UMH 401(k) Plan) | 333,972 | (18) | * | |||||
| Directors and Officers as a group | 3,752,852 | 10.35 | % | |||||
| *Less than 1% | ||||||||
| (1) | Except as indicated in the footnotes to this table and pursuant to applicable community property laws, the Company believes that the persons named in the table have sole voting and investment power with respect to all Shares listed. Except as indicated in the footnotes to this table, none of the shares have been pledged as collateral. | |
| (2) | Based on the number of Shares outstanding on December 31, 2017 which was 35,488,068 Shares. | |
| (3) | Based on Schedule 13G as of December 31, 2017, filed by The Vanguard Group, the company owns 3,664,208 Shares. This filing with the SEC by The Vanguard Group indicates that Vanguard has sole voting power for 57,226 Shares and sole dispositive power for 3,588,232 Shares. Vanguard also has shared voting power for 21,900 Shares and shared dispositive power for 75,976 Shares. |
| -73- |
| (4) | Based on Schedule 13F as of December 31, 2017, filed by BlackRock, Inc, the company owns 2,443,772 Shares. This filing with the SEC by BlackRock, Inc indicates that BlackRock has sole voting power for 2,357,248 Shares. | |
| (5) | Based on Schedule 13G as of December 31, 2017, filed by Boulegeris Investments, Inc., the company owns 1,801,335 Shares. This filing with the SEC by Boulegeris Investments, Inc. indicates that Boulegeris Investments has sole dispositive power for 1,801,335 Shares. | |
| (6) | Includes (a) 261 Shares in custodial accounts for Mr. Carus’ minor children under the NJ Uniform Transfers to Minors Act which he disclaims any beneficial interest but has power to vote; and (b) 1,700 shares of unvested restricted stock. | |
| (7) | Includes (a) 290,518 Shares owned jointly with Ms. Chew’s husband; (b) 130,000 Shares issuable upon exercise of stock options; and (c) 38,277 shares of unvested restricted stock. Excludes 33,233 Shares held in the UMH 401(k) Plan. Ms. Chew is a co-trustee of the UMH 401(k) Plan and has shared voting power over the Common Shares held by the UMH 401(k) Plan. She, however, disclaims beneficial ownership of all of the Shares held by the UMH 401(k) Plan, except for the 33,233 Shares held by the UMH 401(k) Plan for her benefit. See Note 18 below for information regarding Shares held by the UMH 401(k) Plan. Excludes 50,000 Shares issuable upon the exercise of a stock option, which stock option is not exercisable until April 4, 2018. | |
| (8) | Includes (a) 16,821 Shares owned jointly with Mr. Hirsch’s wife; (b) 3,082 Shares owned by Mr. Hirsch’s wife; and (c) 1,700 shares of unvested restricted stock. | |
| (9) | Includes 30,000 Shares issuable upon exercise of stock options. Excludes 2,291 Shares held in the UMH 401(k) Plan. See Note 18 below for information regarding Shares held by the UMH 401(k) Plan. Excludes 20,000 Shares issuable upon the exercise of a stock option, which stock option is not exercisable until April 4, 2018. | |
| (10) | Includes (a) 99,872 Shares owned by Mr. Eugene Landy’s wife; (b) 172,608 Shares held by Landy Investments, Ltd. for which Mr. Landy has power to vote; (c) 66,913 Shares held in the Landy & Landy Employees’ Profit Sharing Plan of which Mr. Landy is a Trustee with power to vote; (d) 57,561 Shares held in the Landy & Landy Employees’ Pension Plan of which Mr. Landy is a Trustee with power to vote; (e) 97,880 Shares held in the Eugene W. Landy and Gloria Landy Family Foundation, a charitable trust for which Mr. Landy has power to vote; (f) 23,670 Shares held in Windsor Industrial Park Associates for which Mr. Landy has power to vote; (g) 31,752 Shares held in Juniper Plaza Associates for which Mr. Landy has power to vote; (h) 400,000 Shares issuable upon exercise of stock options (i) 384,250 Shares pledged in a margin account; (j) 277,559 Shares pledged as security for loans; and (k) 18,734 shares of unvested restricted stock. Excludes 100,000 Shares issuable upon the exercise of a stock option, which stock option is not exercisable until April 4, 2018. | |
| (11) | Includes (a) 42,725 Shares owned with Mr. Samuel Landy’s wife; (b) 6,221 Shares in the Samuel Landy Limited Partnership; (c) 48,000 Shares in the EWL Grandchildren Fund LLC of which Mr. Landy is a co-manager; (d) 150,000 Shares issuable upon exercise of stock options; (e) 98,400 Shares pledged in a margin account; (f) 336,282 Shares pledged as security for loans; and (g) 78,728 shares of unvested restricted stock. Excludes 75,133 Shares held in the UMH 401(k) Plan. Mr. Landy is a co-trustee of the UMH 401(k) Plan and has shared voting power over the Common Shares held by the UMH 401(k) Plan. He, however, disclaims beneficial ownership of all of the Common Shares held by the UMH 401(k) Plan, except for the 75,133 Shares held by the UMH 401(k) Plan for his benefit. See Note 18 below for information regarding Shares held by the UMH 401(k) Plan. Excludes 50,000 Shares issuable upon the exercise of a stock option, which stock option is not exercisable until April 4, 2018. | |
| (12) | Includes (a) 15,801 Shares owned by Mr. Michael Landy’s wife; (b) 58,402 Shares in custodial accounts for Mr. Landy’s children under the NJ Uniform Transfers to Minors Act in which he disclaims any beneficial interest but has power to vote; (c) 48,000 Shares in the EWL Grandchildren Fund LLC of which Mr. Landy is a co-manager; (d) 81,500 Shares pledged in a margin account; (e) 55,000 Shares pledged as security for loans; and (f) 1,700 shares of unvested restricted stock. Excludes 27,435 Shares held in the UMH 401(k) Plan. See Note 18 below for information regarding Shares held by the UMH 401(k) Plan. | |
| (13) | Includes 1,700 shares of unvested restricted stock. | |
| (14) | Includes (a) 177,097 Shares held by Mitchell Partners in which Mr. Mitchell has a beneficial interest; and (b) 1,700 shares of unvested restricted stock. In addition to the Common Shares reported, Mr. Mitchell also holds 8,000 of the Preferred B Shares and 3,000 of the Preferred C Shares. | |
| (15) | Includes 1,013 shares of unvested restricted stock. | |
| (16) | Includes 46,000 Shares issuable upon exercise of stock options. Excludes 1,665 Shares held in the UMH 401(k) Plan. See Note 18 below for information regarding Shares held by the UMH 401(k) Plan. Excludes 20,000 Shares issuable upon the exercise of a stock option, which stock option is not exercisable until April 4, 2018. | |
| (17) | Includes (a) 1,373 Shares owned by Mr. Wolgin’s wife; and (b) 1,700 shares of unvested restricted stock. | |
| (18) | Includes 333,972 Shares held by the UMH 401(k) Plan. Ms. Anna T. Chew and Mr. Samuel A. Landy share voting power over the Shares held by the UMH 401(k) Plan. |
Item 13 – Certain Relationships and Related Transactions, and Director Independence
The Company will file its definitive Proxy Statement for its 2018 Annual Meeting of Stockholders within the period required under the applicable rules of the Securities and Exchange Commission. Additional information required by this Item is included under the caption “ELECTION OF DIRECTORS” and “CERTAIN RELATIONSHIPS AND RELATED TRANSACTIONS” of such Proxy Statement and is incorporated herein by reference.
| -74- |
Certain relationships and related party transactions are incorporated herein by reference to Part IV, Item 15(a)(1)(vi), Note 8 of the Notes to Consolidated Financial Statements – Related Party Transactions.
No director, executive officer, or any immediate family member of such director or executive officer may enter into any transaction or arrangement with the Company without the prior approval of the Board of Directors. If any such transaction or arrangement is proposed, the Board of Directors will appoint a Business Judgment Committee consisting of independent directors who are also independent of the transaction or arrangement. This Committee will recommend to the Board of Directors approval or disapproval of the transaction or arrangement. In determining whether to approve such a transaction or arrangement, the Business Judgment Committee will take into account, among other factors, whether the transaction was on terms no less favorable to the Company than terms generally available to third parties and the extent of the executive officer’s or director’s involvement in such transaction or arrangement. While the Company does not have specific written standards for approving such related party transactions, such transactions are only approved if it is in the best interest of the Company and its shareholders. Additionally, the Company’s Code of Business Conduct and Ethics, which is found at the Company’s website at www.umh.reit, requires all directors, officers and employees to notify and report a potential or apparent conflict of interest, to the General Counsel, Board of Directors, or other executive officer or supervisor, as appropriate. Further, to identify related party transactions, the Company submits and requires our directors and executive officers to complete director and officer questionnaires identifying any transactions with the Company in which the director, executive officer or their immediate family members have an interest.
See identification and other information relating to independent directors under Item 10 and committee members under Item 11.
Item 14 – Principal Accounting Fees and Services
The Company will file its definitive Proxy Statement for its 2018 Annual Meeting of Stockholders within the period required under the applicable rules of the Securities and Exchange Commission. Additional information required by this Item is included under the caption “FEES BILLED BY INDEPENDENT REGISTERED PUBLIC ACCOUNTING FIRM” of such Proxy Statement and is incorporated herein by reference.
PKF O’Connor Davies, LLP served as the Company’s independent registered public accounting firm for the years ended December 31, 2017 and 2016. The following are fees billed by and accrued to PKF O’Connor Davies, LLP in connection with services rendered:
| 2017 | 2016 | |||||||
| Audit Fees | $ | 192,100 | $ | 185,700 | ||||
| Audit Related Fees | 18,575 | 25,870 | ||||||
| Tax Fees | 67,000 | 65,500 | ||||||
| All other fees | -0- | -0- | ||||||
| Total Fees | $ | 277,675 | $ | 277,070 | ||||
Audit fees include professional services rendered for the audit of the Company’s annual financial statements, management’s assessment of internal controls, and reviews of financial statements included in the Company’s quarterly reports on Form 10-Q.
Audit related fees include services that are normally provided by the Company’s independent auditors in connection with statutory and regulatory filings, such as consents and assistance with and review of documents filed with the Securities and Exchange Commission.
Tax fees include professional services rendered for the preparation of the Company’s federal and state corporate tax returns and supporting schedules as may be required by the Internal Revenue Service and applicable state taxing authorities. Tax fees also include other work directly affecting or supporting the payment of taxes, including planning and research of various tax issues.
| -75- |
All of the services performed by PKF O’Connor Davies, LLP for the Company during fiscal 2017, including audit fees, audit-related fees, tax fees and all other fees described above, were either expressly pre-approved by the Audit Committee or were pre-approved in accordance with the Audit Committee Pre-Approval Policy, and the Audit Committee was provided with regular updates as to the nature of such services and fees paid for such services.
Audit Committee Pre-Approval Policy
The Audit Committee has adopted a policy for the pre-approval of audit and permitted non-audit services provided by the Company’s independent registered public accounting firm. The policy requires that all services provided by our principal independent registered public accounting firm to the Company, including audit services, audit-related services, tax services and other services, must be pre-approved by the Audit Committee, and all have been so pre-approved. The pre-approval requirements do not prohibit day-to-day normal tax consulting services, which matters will not exceed $10,000 in the aggregate.
The Audit Committee has determined that the provision of the non-audit services described above is compatible with maintaining PKF O’Connor Davies, LLP’s independence.
| -76- |
Item 15 – Exhibits, Financial Statement Schedules
| Page(s) | |||
| (a) (1) | The following Financial Statements are filed as part of this report. | ||
| (i) | Report of Independent Registered Public Accounting Firm | 82 | |
| (ii) | Consolidated Balance Sheets as of December 31, 2017 and 2016 | 83-84 | |
| (iii) | Consolidated Statements of Income (Loss) for the years ended December 31, 2017, 2016 and 2015 | 85-86 | |
| (iv) | 87 | ||
| (iv) | Consolidated Statements of Shareholders’ Equity for the years ended December 31, 2017, 2016 and 2015 | 88-89 | |
| (v) | Consolidated Statements of Cash Flows for the years ended December 31, 2017, 2016 and 2015 |
90 | |
| (vi) | Notes to Consolidated Financial Statements | 91-120 | |
| (a) (2) | The following Financial Statement Schedule is filed as part of this report: | ||
| (i) | Schedule III – Real Estate and Accumulated Depreciation as of December 31, 2017 | 121-130 |
All other schedules are omitted for the reason that they are not required, are not applicable, or the required information is set forth in the consolidated financial statements or notes thereto.
| -77- |
| (a) (3) | The Exhibits set forth in the following index of Exhibits are filed as part of this Report. |
| -78- |
| -79- |
| -80- |
| Exhibit No. | Description | |
| (31.2) | * | Certification of Chief Financial Officer pursuant to 18 U.S.C. Section 1350 as adopted pursuant to Section 302 of the Sarbanes-Oxley Act of 2002. |
| (32) | * | Certification of Chief Executive Officer and Chief Financial Officer pursuant to 18 U.S.C. Section 1350 as adopted pursuant to Section 906 of the Sarbanes-Oxley Act of 2002. |
| (99) | Audit Committee Charter, as amended January 16, 2008 (incorporated by reference to the Company’s 2011 Definitive Proxy Statement (DEF 14A) as filed with the Securities and Exchange Commission on May 2, 2011, Registration No. 001-12690). | |
| (101) | Interactive Data File | |
| 101.INS | ++ | XBRL Instance Document |
| 101.SCH | ++ | XBRL Taxonomy Extension Schema Document |
| 101.CAL | ++ | XBRL Taxonomy Extension Calculation Document |
| 101.LAB | ++ | XBRL Taxonomy Extension Label Linkbase Document |
| 101.PRE | ++ | XBRL Taxonomy Extension Presentation Linkbase Document |
| 101.DEF | ++ | XBRL Taxonomy Extension Definition Linkbase Document |
| * | Filed herewith. | |
| + | Denotes a management contract or compensatory plan or arrangement. | |
| ++ | Pursuant to Rule 406T of Regulation S-T, this interactive date file is deemed not “filed” or part of a registration statement or prospectus for purposes of Section 11 or 12 of the Securities Act, is deemed not “filed” for purposes of Section 18 of the Exchange Act, and otherwise is not subject to liability under these sections. |
Not applicable
| -81- |
REPORT OF INDEPENDENT REGISTERED PUBLIC ACCOUNTING FIRM
To the Board of Directors and Shareholders of
UMH Properties, Inc.
Opinion on the Financial Statements
We have audited the accompanying consolidated balance sheets of UMH Properties, Inc. and subsidiaries (the “Company”) as of December 31, 2017 and 2016, and the related consolidated statements of income (loss), comprehensive income (loss), shareholders’ equity, and cash flows for each of the three years in the in the period ended December 31, 2017, and the related notes and schedule listed in the Index at Item 15(a)(2)(i) (collectively referred to as the “financial statements”). In our opinion, the financial statements present fairly, in all material respects, the financial position of the Company as of December 31, 2017 and 2016, and the results of its operations and its cash flows for each of the three years in the period ended December 31, 2017, in conformity with accounting principles generally accepted in the United States of America.
We have also audited, in accordance with the standards of the Public Company Accounting Oversight Board (United States) (“PCAOB”), the Company’s internal control over financial reporting as of December 31, 2017, based on criteria established in Internal Control–Integrated Framework (2013) issued by the Committee of Sponsoring Organizations of the Treadway Commission (COSO), and our report dated March 8, 2018, expressed an unqualified opinion.
Basis for Opinion
These financial statements are the responsibility of the Company’s management. Our responsibility is to express an opinion on the Company’s financial statements based on our audits. We are a public accounting firm registered with the PCAOB and are required to be independent with respect to the Company in accordance with the U.S. federal securities laws and the applicable rules and regulations of the Securities and Exchange Commission and the PCAOB.
We conducted our audits in accordance with the standards of the PCAOB. Those standards require that we plan and perform the audit to obtain reasonable assurance about whether the financial statements are free of material misstatement, whether due to error or fraud. Our audits included performing procedures to assess the risks of material misstatement of the financial statements, whether due to error or fraud, and performing procedures that respond to those risks. Such procedures included examining, on a test basis, evidence regarding the amounts and disclosures in the financial statements. Our audits also included evaluating the accounting principles used and significant estimates made by management, as well as evaluating the overall presentation of the financial statements. We believe that our audits provide a reasonable basis for our opinion.
| /s/ PKF O’Connor Davies, LLP |
We have served as the Company’s auditor since 2008.
March 8, 2018
New York, New York
| -82- |
UMH PROPERTIES, INC. AND SUBSIDIARIES
AS OF DECEMBER 31, 2017 and 2016
| 2017 | 2016 | |||||||
| -ASSETS- | ||||||||
| Investment Property and Equipment | ||||||||
| Land | $ | 61,239,644 | $ | 47,476,314 | ||||
| Site and Land Improvements | 463,242,075 | 398,776,390 | ||||||
| Buildings and Improvements | 22,963,926 | 21,101,836 | ||||||
| Rental Homes and Accessories | 216,992,988 | 172,862,227 | ||||||
| Total Investment Property | 764,438,633 | 640,216,767 | ||||||
| Equipment and Vehicles | 16,874,760 | 14,986,196 | ||||||
| Total Investment Property and Equipment | 781,313,393 | 655,202,963 | ||||||
| Accumulated Depreciation | (166,444,512 | ) | (140,255,603 | ) | ||||
| Net Investment Property and Equipment | 614,868,881 | 514,947,360 | ||||||
| Other Assets | ||||||||
| Cash and Cash Equivalents | 23,242,090 | 4,216,592 | ||||||
| Securities Available for Sale at Fair Value | 132,964,276 | 108,755,172 | ||||||
| Inventory of Manufactured Homes | 17,569,365 | 17,424,574 | ||||||
| Notes and Other Receivables, net | 25,451,053 | 20,323,191 | ||||||
| Prepaid Expenses and Other Assets | 3,457,083 | 4,497,937 | ||||||
| Land Development Costs | 6,328,578 | 10,279,992 | ||||||
| Total Other Assets | 209,012,445 | 165,497,458 | ||||||
| TOTAL ASSETS | $ | 823,881,326 | $ | 680,444,818 | ||||
See Accompanying Notes to Consolidated Financial Statements
| -83- |
UMH PROPERTIES, INC. AND SUBSIDIARIES
CONSOLIDATED BALANCE SHEETS (CONTINUED)
AS OF DECEMBER 31, 2017 and 2016
| 2017 | 2016 | |||||||
| - LIABILITIES AND SHAREHOLDERS’ EQUITY - | ||||||||
| LIABILITIES: | ||||||||
| Mortgages Payable, net of unamortized debt issuance costs | $ | 304,895,117 | $ | 293,025,592 | ||||
| Other Liabilities: | ||||||||
| Accounts Payable | 2,960,739 | 2,962,037 | ||||||
| Loans Payable, net of unamortized debt issuance costs | 84,704,487 | 58,285,385 | ||||||
| Accrued Liabilities and Deposits | 4,977,886 | 4,820,142 | ||||||
| Tenant Security Deposits | 5,127,633 | 4,319,695 | ||||||
| Total Other Liabilities | 97,770,745 | 70,387,259 | ||||||
| Total Liabilities | 402,665,862 | 363,412,851 | ||||||
| Commitments and Contingencies | ||||||||
| Shareholders’ Equity: | ||||||||
| Series A –
8.25% Cumulative Redeemable Preferred Stock, par value $0.10 per share, -0- and 3,663,800 shares authorized, issued and outstanding as of December 31, 2017 and 2016, respectively | -0- | 91,595,000 | ||||||
| Series B –
8.0% Cumulative Redeemable Preferred Stock, par value $0.10 per share, 4,000,000 shares authorized; 3,801,200 shares issued and outstanding as of December 31, 2017 and 2016, respectively | 95,030,000 | 95,030,000 | ||||||
| Series C –
6.75% Cumulative Redeemable Preferred Stock, par value $0.10 per share, 5,750,000 and -0- shares authorized, issued and outstanding as of December 31, 2017 and 2016, respectively | 143,750,000 | -0- | ||||||
| Common Stock - $0.10 par value per share, 113,663,800 and 75,000,000 shares authorized; 35,488,068 and 29,388,811 shares issued and outstanding as of December 31, 2017 and 2016, respectively | 3,548,807 | 2,938,881 | ||||||
| Excess Stock - $0.10 par value per
share, 3,000,000 shares authorized; no shares issued or outstanding as of December 31, 2017 and 2016, respectively | -0- | -0- | ||||||
| Additional Paid-In Capital | 168,034,868 | 111,422,691 | ||||||
| Accumulated Other Comprehensive Income | 11,519,582 | 16,713,188 | ||||||
| Accumulated Deficit | (667,793 | ) | (667,793 | ) | ||||
| Total Shareholders’ Equity | 421,215,464 | 317,031,967 | ||||||
| TOTAL LIABILITIES AND SHAREHOLDERS’ EQUITY | $ | 823,881,326 | $ | 680,444,818 | ||||
See Accompanying Notes to Consolidated Financial Statements
| -84- |
UMH PROPERTIES, INC. AND SUBSIDIARIES
CONSOLIDATED STATEMENTS OF INCOME (LOSS)
FOR THE YEARS ENDED DECEMBER 31, 2017, 2016 AND 2015
| 2017 | 2016 | 2015 | ||||||||||
| INCOME: | ||||||||||||
| Rental and Related Income | $ | 101,801,425 | $ | 90,679,557 | $ | 74,762,548 | ||||||
| Sales of Manufactured Homes | 10,846,494 | 8,534,272 | 6,754,123 | |||||||||
| Total Income | 112,647,919 | 99,213,829 | 81,516,671 | |||||||||
| EXPENSES: | ||||||||||||
| Community Operating Expenses | 47,846,565 | 42,638,333 | 37,049,462 | |||||||||
| Cost of Sales of Manufactured Homes | 8,471,190 | 6,466,520 | 5,058,350 | |||||||||
| Selling Expenses | 3,095,155 | 2,852,405 | 2,788,360 | |||||||||
| General and Administrative Expenses | 9,645,681 | 8,004,925 | 7,345,644 | |||||||||
| Acquisition Costs | -0- | 79,231 | 957,219 | |||||||||
| Depreciation Expense | 27,557,746 | 23,214,100 | 18,877,511 | |||||||||
| Total Expenses | 96,616,337 | 83,255,514 | 72,076,546 | |||||||||
| OTHER INCOME (EXPENSE): | ||||||||||||
| Interest Income | 2,006,880 | 1,584,585 | 1,819,567 | |||||||||
| Dividend Income | 8,134,898 | 6,636,126 | 4,399,181 | |||||||||
| Gain on Sales of Securities, net | 1,747,528 | 2,285,301 | 204,230 | |||||||||
| Other Income | 705,048 | 504,759 | 435,816 | |||||||||
| Interest Expense | (15,876,972 | ) | (15,432,364 | ) | (14,074,446 | ) | ||||||
Total Other Income (Expense) | (3,282,618 | ) | (4,421,593 | ) | (7,215,652 | ) | ||||||
| Income Before Loss
on Sales of Investment Property and Equipment | 12,748,964 | 11,536,722 | 2,224,473 | |||||||||
| Loss on Sales of Investment Property and Equipment | (80,930 | ) | (2,163 | ) | (80,268 | ) | ||||||
| Net Income | 12,668,034 | 11,534,559 | 2,144,205 | |||||||||
| Less: Preferred Dividends | (16,844,812 | ) | (14,103,432 | ) | (8,267,198 | ) | ||||||
| Less: Redemption of Preferred Stock | (3,502,487 | ) | -0- | -0- | ||||||||
| Net Loss Attributable to Common Shareholders | $ | (7,679,265 | ) | $ | (2,568,873 | ) | $ | (6,122,993 | ) | |||
See Accompanying Notes to Consolidated Financial Statements
| -85- |
UMH PROPERTIES, INC. AND SUBSIDIARIES
CONSOLIDATED STATEMENTS OF INCOME (LOSS) (CONTINUED)
FOR THE YEARS ENDED DECEMBER 31, 2017, 2016 AND 2015
| 2017 | 2016 | 2015 | ||||||||||
| Basic and Diluted Income (Loss) Per Share: | ||||||||||||
| Net Income | $ | 0.39 | $ | 0.41 | $ | 0.08 | ||||||
| Less: Preferred Dividends | (0.52 | ) | (0.51 | ) | (0.32 | ) | ||||||
| Less: Redemption of Preferred Stock | (0.11 | ) | -0- | -0- | ||||||||
| Net Loss Attributable to Common Shareholders | $ | (0.24 | ) | $ | (0.10 | ) | $ | (0.24 | ) | |||
| Weighted Average Common Shares Outstanding: | ||||||||||||
| Basic and Diluted | 32,675,650 | 27,808,895 | 25,932,626 | |||||||||
See Accompanying Notes to Consolidated Financial Statements
| -86- |
UMH PROPERTIES, INC. AND SUBSIDIARIES
CONSOLIDATED STATEMENTS OF COMPREHENSIVE INCOME (LOSS)
FOR THE YEARS ENDED DECEMBER 31, 2017, 2016 AND 2015
| 2017 | 2016 | 2015 | ||||||||||
| Net Income | $ | 12,668,034 | $ | 11,534,559 | $ | 2,144,205 | ||||||
| Other Comprehensive Income (Loss): | ||||||||||||
| Unrealized Holding Gains (Losses) Arising During the Year | (3,450,061 | ) | 21,057,498 | (6,930,717 | ) | |||||||
| Reclassification Adjustment for Net Gains Realized in Income | (1,747,528 | ) | (2,285,301 | ) | (204,230 | ) | ||||||
| Change in Fair Value of Interest Rate Swap Agreements | 3,983 | (2,283 | ) | 37,985 | ||||||||
| Comprehensive Income (Loss) | 7,474,428 | 30,304,473 | (4,952,757 | ) | ||||||||
| Less: Preferred Dividends | (16,844,812 | ) | (14,103,432 | ) | (8,267,198 | ) | ||||||
| Less: Redemption of Preferred Stock | (3,502,487 | ) | -0- | -0- | ||||||||
| Comprehensive Income (Loss) Attributable to Common Shareholders | $ | (12,872,871 | ) | $ | 16,201,041 | $ | (13,219,955 | ) | ||||
See Accompanying Notes to the Consolidated Financial Statements
| -87- |
UMH PROPERTIES, INC. AND SUBSIDIARIES
CONSOLIDATED STATEMENTS OF SHAREHOLDERS’ EQUITY
FOR THE YEARS ENDED DECEMBER 31, 2017, 2016 and 2015
| Preferred | Preferred | Preferred | ||||||||||||||||||
| Common Stock Issued | Stock | Stock | Stock | |||||||||||||||||
| Number | Amount | Series A | Series B | Series C | ||||||||||||||||
| Balance December 31, 2014 | 24,372,083 | $ | 2,437,208 | $ | 91,595,000 | $ | -0- | $ | -0- | |||||||||||
| Common Stock Issued with the DRIP* | 2,657,255 | 265,726 | -0- | -0- | -0- | |||||||||||||||
| Common Stock Issued through Restricted Stock Awards | 35,000 | 3,500 | -0- | -0- | -0- | |||||||||||||||
| Common Stock Issued through Stock Options | 22,500 | 2,250 | -0- | -0- | -0- | |||||||||||||||
| Preferred Stock Issued through Registered Direct Placement, net | -0- | -0- | -0- | 45,030,000 | -0- | |||||||||||||||
| Distributions | -0- | -0- | -0- | -0- | -0- | |||||||||||||||
| Stock Compensation Expense | -0- | -0- | -0- | -0- | -0- | |||||||||||||||
| Net Income | -0- | -0- | -0- | -0- | -0- | |||||||||||||||
| Unrealized Net Holding Loss on Securities Available for Sale Net of Reclassification Adjustment | -0- | -0- | -0- | -0- | -0- | |||||||||||||||
| Interest Rate Swaps | -0- | -0- | -0- | -0- | -0- | |||||||||||||||
| Balance December 31, 2015 | 27,086,838 | 2,708,684 | 91,595,000 | 45,030,000 | -0- | |||||||||||||||
| Common Stock Issued with the DRIP* | 1,966,133 | 196,613 | -0- | -0- | -0- | |||||||||||||||
| Common Stock Issued through Restricted Stock Awards | 60,500 | 6,050 | -0- | -0- | -0- | |||||||||||||||
| Common Stock Issued through Stock Options | 277,500 | 27,750 | -0- | -0- | -0- | |||||||||||||||
| Cancellation of Shares due to Restricted Stock Forfeitures | (2,160 | ) | (216 | ) | -0- | -0- | -0- | |||||||||||||
| Preferred Stock Issued through Registered Direct Placement, net | -0- | -0- | -0- | 50,000,000 | -0- | |||||||||||||||
| Distributions | -0- | -0- | -0- | -0- | -0- | |||||||||||||||
| Stock Compensation Expense | -0- | -0- | -0- | -0- | -0- | |||||||||||||||
| Net Income | -0- | -0- | -0- | -0- | -0- | |||||||||||||||
| Unrealized Net Holding Gain on Securities Available for Sale Net of Reclassification Adjustment | -0- | -0- | -0- | -0- | -0- | |||||||||||||||
| Interest Rate Swaps | -0- | -0- | -0- | -0- | -0- | |||||||||||||||
| Balance December 31, 2016 | 29,388,811 | 2,938,881 | 91,595,000 | 95,030,000 | -0- | |||||||||||||||
| Common Stock Issued with the DRIP* | 4,095,357 | 409,536 | -0- | -0- | -0- | |||||||||||||||
| Common Stock Issued through Restricted Stock Awards | 56,000 | 5,600 | -0- | -0- | -0- | |||||||||||||||
| Common Stock Issued through Stock Options | 547,900 | 54,790 | -0- | -0- | -0- | |||||||||||||||
| Common Stock Issued through Registered Direct Placement, net | 1,400,000 | 140,000 | -0- | -0- | -0- | |||||||||||||||
| Preferred Stock Issued through Underwritten Registered Public Offering, net | -0- | -0- | -0- | -0- | 143,750,000 | |||||||||||||||
| Preferred Stock Called for Redemption | -0- | -0- | (91,595,000 | ) | -0- | -0- | ||||||||||||||
| Distributions | -0- | -0- | -0- | -0- | -0- | |||||||||||||||
| Stock Compensation Expense | -0- | -0- | -0- | -0- | -0- | |||||||||||||||
| Net Income | -0- | -0- | -0- | -0- | -0- | |||||||||||||||
| Unrealized Net Holding Gain on Securities Available for Sale, Net of Reclassification Adjustment | -0- | -0- | -0- | -0- | -0- | |||||||||||||||
| Interest Rate Swaps | -0- | -0- | -0- | -0- | -0- | |||||||||||||||
| Balance December 31, 2017 | 35,488,068 | $ | 3,548,807 | $ | -0- | $ | 95,030,000 | $ | 143,750,000 | |||||||||||
*Dividend Reinvestment and Stock Purchase Plan
See Accompanying Notes to Consolidated Financial Statements
| -88- |
UMH PROPERTIES, INC. AND SUBSIDIARIES
CONSOLIDATED STATEMENTS OF SHAREHOLDERS’ EQUITY, CONTINUED
FOR THE YEARS ENDED DECEMBER 31, 2017, 2016 and 2015
| Accumulated | Undistributed | |||||||||||||||
| Additional | Other | Income | Total | |||||||||||||
| Paid-In | Comprehensive | (Accumulated | Shareholders’ | |||||||||||||
| Capital | Income (Loss) | Deficit) | Equity | |||||||||||||
| Balance December 31, 2014 | $ | 110,422,454 | $ | 5,040,236 | $ | (667,793 | ) | $ | 208,827,105 | |||||||
| Common Stock Issued with the DRIP* | 24,334,092 | -0- | -0- | 24,599,818 | ||||||||||||
| Common Stock Issued through Restricted Stock Awards | (3,500 | ) | -0- | -0- | -0- | |||||||||||
| Common Stock Issued through Stock Options | 167,825 | -0- | -0- | 170,075 | ||||||||||||
| Preferred Stock Issued through Registered Direct Placement, net | (1,987,876 | ) | -0- | -0- | 43,042,124 | |||||||||||
| Distributions | (24,159,503 | ) | -0- | (2,144,205 | ) | (26,303,708 | ) | |||||||||
| Stock Compensation Expense | 855,768 | -0- | -0- | 855,768 | ||||||||||||
| Net Income | -0- | -0- | 2,144,205 | 2,144,205 | ||||||||||||
| Unrealized Net Holding Loss on Securities Available for Sale Net of Reclassification Adjustment | -0- | (7,134,947 | ) | -0- | (7,134,947 | ) | ||||||||||
| Interest Rate Swaps | -0- | 37,985 | -0- | 37,985 | ||||||||||||
| Balance December 31, 2015 | 109,629,260 | (2,056,726 | ) | (667,793 | ) | 246,238,425 | ||||||||||
| Common Stock Issued with the DRIP* | 22,204,332 | -0- | -0- | 22,400,945 | ||||||||||||
| Common Stock Issued through Restricted Stock Awards | (6,050 | ) | -0- | -0- | -0- | |||||||||||
| Common Stock Issued through Stock Options | 2,457,310 | -0- | -0- | 2,485,060 | ||||||||||||
| Cancellation of Shares Due to Restricted Stock Forfeitures | 216 | -0- | -0- | -0- | ||||||||||||
| Preferred Stock Issued through Registered Direct Placement, net | (879,147 | ) | -0- | -0- | 49,120,853 | |||||||||||
| Distributions | (23,047,908 | ) | -0- | (11,534,559 | ) | (34,582,467 | ) | |||||||||
| Stock Compensation Expense | 1,064,678 | -0- | -0- | 1,064,678 | ||||||||||||
| Net Income | -0- | -0- | 11,534,559 | 11,534,559 | ||||||||||||
| Unrealized Net Holding Gain on Securities Available for Sale Net of Reclassification Adjustment | -0- | 18,772,197 | -0- | 18,772,197 | ||||||||||||
| Interest Rate Swaps | -0- | (2,283 | ) | -0- | (2,283 | ) | ||||||||||
| Balance December 31, 2016 | 111,422,691 | 16,713,188 | (667,793 | ) | 317,031,967 | |||||||||||
| Common Stock Issued with the DRIP* | 59,955,654 | -0- | -0- | 60,365,190 | ||||||||||||
| Common Stock Issued through Restricted Stock Awards | (5,600 | ) | -0- | -0- | -0- | |||||||||||
| Common Stock Issued through Stock Options | 5,380,844 | -0- | -0- | 5,435,634 | ||||||||||||
| Common Stock Issued through Registered Direct Placement, net | 22,378,238 | -0- | -0- | 22,518,238 | ||||||||||||
| Preferred Stock Issued through Underwritten Registered Public Offering, net | (4,774,153 | ) | -0- | -0- | 138,975,847 | |||||||||||
| Preferred Stock Called for Redemption | 3,488,159 | -0- | (3,488,159 | ) | (91,595,000 | ) | ||||||||||
| Distributions | (31,125,456 | ) | -0- | (9,179,875 | ) | (40,305,331 | ) | |||||||||
| Stock Compensation Expense | 1,314,491 | -0- | -0- | 1,314,491 | ||||||||||||
| Net Income | -0- | -0- | 12,668,034 | 12,668,034 | ||||||||||||
| Unrealized Net Holding Gain on Securities Available for Sale, Net of Reclassification Adjustment | -0- | (5,197,589 | ) | -0- | (5,197,589 | ) | ||||||||||
| Interest Rate Swaps | -0- | 3,983 | -0- | 3,983 | ||||||||||||
| Balance December 31, 2017 | $ | 168,034,868 | $ | 11,519,582 | $ | (667,793 | ) | $ | 421,215,464 | |||||||
*Dividend Reinvestment and Stock Purchase Plan.
See Accompanying Notes to Consolidated Financial Statements
| -89- |
UMH PROPERTIES, INC. AND SUBSIDIARIES
CONSOLIDATED STATEMENTS OF CASH FLOWS
FOR THE YEARS ENDED DECEMBER 31, 2017, 2016 and 2015
| 2017 | 2016 | 2015 | ||||||||||
| CASH FLOWS FROM OPERATING ACTIVITIES: | ||||||||||||
| Net Income | $ | 12,668,034 | $ | 11,534,559 | $ | 2,144,205 | ||||||
| Non-cash items included in Net Income: | ||||||||||||
| Depreciation | 27,557,746 | 23,214,100 | 18,877,511 | |||||||||
| Amortization of Financing Costs | 660,910 | 733,485 | 829,017 | |||||||||
| Stock Compensation Expense | 1,314,491 | 1,064,678 | 855,768 | |||||||||
| Provision for Uncollectible Notes and Other Receivables | (1,273,535 | ) | 909,397 | 1,123,926 | ||||||||
| Gain on Sales of Securities, net | (1,747,528 | ) | (2,285,301 | ) | (204,230 | ) | ||||||
| Loss on Sales of Investment Property & Equipment | 80,930 | 2,163 | 80,268 | |||||||||
| Changes in Operating Assets and Liabilities: | ||||||||||||
| Inventory of Manufactured Homes | (144,791 | ) | (3,113,164 | ) | (2,004,695 | ) | ||||||
| Notes and Other Receivables, net of Notes Acquired with Acquisitions | 215,684 | (1,204,014 | ) | 840,066 | ||||||||
| Prepaid Expenses and Other Assets | 1,040,854 | (435,124 | ) | (706,779 | ) | |||||||
| Accounts Payable | (1,298 | ) | 145,747 | 991,997 | ||||||||
| Accrued Liabilities and Deposits | 161,727 | (1,878,719 | ) | 1,976,958 | ||||||||
| Tenant Security Deposits | 807,938 | 665,605 | 904,200 | |||||||||
| Net Cash Provided by Operating Activities | 41,341,162 | 29,353,412 | 25,708,212 | |||||||||
| CASH FLOWS FROM INVESTING ACTIVITIES: | ||||||||||||
| Purchase of Manufactured Home Communities, net of mortgages assumed | (61,669,247 | ) | (4,081,798 | ) | (78,926,525 | ) | ||||||
| Purchase of Investment Property and Equipment | (62,009,984 | ) | (58,184,812 | ) | (51,218,338 | ) | ||||||
| Proceeds from Sales of Investment Property and Equipment | 2,299,670 | 1,114,503 | 777,394 | |||||||||
| Additions to Land Development Costs | (3,881,035 | ) | (3,728,869 | ) | (921,141 | ) | ||||||
| Purchase of Securities Available for Sale | (45,075,311 | ) | (27,518,151 | ) | (23,019,035 | ) | ||||||
| Proceeds from Sales of Securities Available for Sale | 17,416,146 | 14,831,737 | 4,633,019 | |||||||||
| Net Cash Used in Investing Activities | (152,919,761 | ) | (77,567,390 | ) | (148,674,626 | ) | ||||||
| CASH FLOWS FROM FINANCING ACTIVITIES: | ||||||||||||
| Proceeds from Mortgages, net of mortgages assumed | 44,420,000 | 31,804,000 | 139,432,000 | |||||||||
| Net Proceeds (Payments) from Short Term Borrowings | 26,401,635 | 406,935 | (19,452,727 | ) | ||||||||
| Principal Payments of Mortgages and Loans | (34,970,645 | ) | (25,072,315 | ) | (37,756,234 | ) | ||||||
| Financing Costs on Debt | (641,471 | ) | (668,338 | ) | (2,311,829 | ) | ||||||
| Proceeds from Issuance of Preferred Stock, net of offering costs | 138,975,847 | 49,120,853 | 43,042,124 | |||||||||
| Redemption of 8.25% Series A Preferred Stock | (91,595,000 | ) | -0- | -0- | ||||||||
| Proceeds from Registered Direct Placement of Common Stock, net of offering costs | 22,518,238 | -0- | -0- | |||||||||
| Proceeds from Issuance of Common Stock in the DRIP, net of Dividend Reinvestments | 57,506,016 | 20,012,393 | 22,593,531 | |||||||||
| Proceeds from Exercise of Stock Options | 5,435,634 | 2,485,060 | 170,075 | |||||||||
| Preferred Dividends Paid | (16,665,934 | ) | (14,563,645 | ) | (7,556,588 | ) | ||||||
| Common Dividends Paid, net of Dividend Reinvestments | (20,780,223 | ) | (17,630,270 | ) | (16,740,833 | ) | ||||||
| Net Cash Provided by Financing Activities | 130,604,097 | 45,894,673 | 121,419,519 | |||||||||
| Net Increase (Decrease) in Cash and Cash Equivalents | 19,025,498 | (2,319,305 | ) | (1,546,895 | ) | |||||||
| Cash and Cash Equivalents at Beginning of Year | 4,216,592 | 6,535,897 | 8,082,792 | |||||||||
| CASH AND CASH EQUIVALENTS AT END OF YEAR | $ | 23,242,090 | $ | 4,216,592 | $ | 6,535,897 | ||||||
See Accompanying Notes to Consolidated Financial Statements
| -90- |
UMH PROPERTIES, INC. AND SUBSIDIARIES
NOTES TO CONSOLIDATED FINANCIAL STATEMENTS
December 31, 2017 and 2016
NOTE 1 – ORGANIZATION
UMH Properties, Inc., a Maryland corporation, and its subsidiaries (the “Company”) operates as a real estate investment trust (“REIT”) deriving its income primarily from real estate rental operations. The Company, through its wholly-owned taxable subsidiary, UMH Sales and Finance, Inc. (“S&F”), also sells manufactured homes to residents and prospective residents in our communities. Inherent in the operations of manufactured home communities are site vacancies. S&F was established to fill these vacancies and enhance the value of the communities. The Company also owns a portfolio of REIT securities which the Company generally limits to no more than approximately 20% of its undepreciated assets (which is the Company’s total assets excluding accumulated depreciation). Management views the Company as a single segment based on its method of internal reporting in addition to its allocation of capital and resources.
NOTE 2 – SUMMARY OF SIGNIFICANT ACCOUNTING POLICIES
Description of the Business
As of December 31, 2017, the Company owns and operates 112 manufactured home communities containing approximately 20,000 developed sites. These communities are located in New Jersey, New York, Ohio, Pennsylvania, Tennessee, Indiana, Michigan and Maryland.
These manufactured home communities are listed by trade names as follows:
| MANUFACTURED HOME COMMUNITY | LOCATION | |
| Allentown | Memphis, Tennessee | |
| Arbor Estates | Doylestown, Pennsylvania | |
| Auburn Estates | Orrville, Ohio | |
| Birchwood Farms | Birch Run, Michigan | |
| Boardwalk | Elkhart, Indiana | |
| Broadmore Estates | Goshen, Indiana | |
| Brookside Village | Berwick, Pennsylvania | |
| Brookview Village | Greenfield Center, New York | |
| Candlewick Court | Owosso, Michigan | |
| Carsons | Chambersburg, Pennsylvania | |
| Catalina | Middletown, Ohio | |
| Cedarcrest Village | Vineland, New Jersey | |
| Chambersburg I & II | Chambersburg, Pennsylvania | |
| Chelsea | Sayre, Pennsylvania | |
| Cinnamon Woods | Conowingo, Maryland | |
| City View | Lewistown, Pennsylvania | |
| Clinton Mobile Home Resort | Tiffin, Ohio | |
| Collingwood | Horseheads, New York | |
| Colonial Heights | Wintersville, Ohio | |
| Countryside Estates | Muncie, Indiana | |
| Countryside Estates | Ravenna, Ohio | |
| Countryside Village | Columbia, Tennessee | |
| Cranberry Village | Cranberry Township, Pennsylvania | |
| Crestview | Sayre, Pennsylvania | |
| Cross Keys Village | Duncansville, Pennsylvania | |
| Crossroads Village | Mount Pleasant, Pennsylvania | |
| Dallas Mobile Home Community | Toronto, Ohio | |
| Deer Meadows | New Springfield, Ohio | |
| D & R Village | Clifton Park, New York | |
| Evergreen Estates | Lodi, Ohio |
| -91- |
| MANUFACTURED HOME COMMUNITY | LOCATION | |
| Evergreen Manor | Bedford, Ohio | |
| Evergreen Village | Mantua, Ohio | |
| Fairview Manor | Millville, New Jersey | |
| Forest Creek | Elkhart, Indiana | |
| Forest Park Village | Cranberry Township, Pennsylvania | |
| Fox Chapel Village | Cheswick, Pennsylvania | |
| Frieden Manor | Schuylkill Haven, Pennsylvania | |
| Green Acres | Chambersburg, Pennsylvania | |
| Gregory Courts | Honey Brook, Pennsylvania | |
| Hayden Heights | Dublin, Ohio | |
| Heather Highlands | Inkerman, Pennsylvania | |
| High View Acres | Washington, Pennsylvania | |
| Highland | Elkhart, Indiana | |
| Highland Estates | Kutztown, Pennsylvania | |
| Hillcrest Crossing | Lower Burrell, Pennsylvania | |
| Hillcrest | Marysville, Ohio | |
| Hillside Estates | Greensburg, Pennsylvania | |
| Holiday Village | Nashville, Tennessee | |
| Holiday Village | Elkhart, Indiana | |
| Holly Acres Estates | Erie, Pennsylvania | |
| Hudson Estates | Peninsula, Ohio | |
| Huntingdon Pointe | Tarrs, Pennsylvania | |
| Independence Park | Clinton, Pennsylvania | |
| Kinnebrook | Monticello, New York | |
| Lake Sherman Village | Navarre, Ohio | |
| Lakeview Meadows | Lakeview, Ohio | |
| Laurel Woods | Cresson, Pennsylvania | |
| Little Chippewa | Orrville, Ohio | |
| Maple Manor | Taylor, Pennsylvania | |
| Marysville Estates | Marysville, Ohio | |
| Meadowood | New Middletown, Ohio | |
| Meadows | Nappanee, Indiana | |
| Melrose Village | Wooster, Ohio | |
| Melrose West | Wooster, Ohio | |
| Memphis Blues | Memphis, Tennessee | |
| Monroe Valley | Ephrata, Pennsylvania | |
| Moosic Heights | Avoca, Pennsylvania | |
| Mount Pleasant Village | Mount Pleasant, Pennsylvania | |
| Mountaintop | Ephrata, Pennsylvania | |
| Oak Ridge Estates | Elkhart, Indiana | |
| Oakwood Lake Village | Tunkhannock, Pennsylvania | |
| Olmsted Falls | Olmsted Falls, Ohio | |
| Oxford Village | West Grove, Pennsylvania | |
| Parke Place | Elkhart, Indiana | |
| Pine Ridge Village/Pine Manor | Carlisle, Pennsylvania | |
| Pine Valley Estates | Apollo, Pennsylvania | |
| Pleasant View Estates | Bloomsburg, Pennsylvania | |
| Port Royal Village | Belle Vernon, Pennsylvania | |
| River Valley Estates | Marion, Ohio | |
| Rolling Hills Estates | Carlisle, Pennsylvania | |
| Rostraver Estates | Belle Vernon, Pennsylvania | |
| Sandy Valley Estates | Magnolia, Ohio | |
| Shady Hills | Nashville, Tennessee | |
| Somerset Estates/Whispering Pines | Somerset, Pennsylvania | |
| Southern Terrace | Columbiana, Ohio | |
| Southwind Village | Jackson, New Jersey |
| -92- |
| MANUFACTURED HOME COMMUNITY | LOCATION | |
| Spreading Oaks Village | Athens, Ohio | |
| Springfield Meadows | Springfield, Ohio | |
| Suburban Estates | Greensburg, Pennsylvania | |
| Summit Estates | Ravenna, Ohio | |
| Sunny Acres | Somerset, Pennsylvania | |
| Sunnyside | Eagleville, Pennsylvania | |
| Trailmont | Goodlettsville, Tennessee | |
| Twin Oaks I & II | Olmsted Falls, Ohio | |
| Twin Pines | Goshen, Indiana | |
| Valley High | Ruffs Dale, Pennsylvania | |
| Valley Hills | Ravenna, Ohio | |
| Valley Stream | Mountaintop, Pennsylvania | |
| Valley View I | Ephrata, Pennsylvania | |
| Valley View II | Ephrata, Pennsylvania | |
| Valley View Honeybrook | Honey Brook, Pennsylvania | |
| Voyager Estates | West Newton, Pennsylvania | |
| Waterfalls Village | Hamburg, New York | |
| Wayside | Lakeview, Ohio | |
| Weatherly Estates | Lebanon, Tennessee | |
| Wellington Estates | Export, Pennsylvania | |
| Woodland Manor | West Monroe, New York | |
| Woodlawn Village | Eatontown, New Jersey | |
| Woods Edge | West Lafayette, Indiana | |
| Wood Valley | Caledonia, Ohio | |
| Worthington Arms | Lewis Center, Ohio | |
| Youngstown Estates | Youngstown, New York |
Basis of Presentation and Principles of Consolidation
The Company prepares its financial statements under the accrual basis of accounting, in conformity with accounting principles generally accepted in the United States of America (“GAAP”). The Company’s subsidiaries are all 100% wholly-owned. The consolidated financial statements of the Company include all of these subsidiaries. All intercompany transactions and balances have been eliminated in consolidation. The Company does not have a majority or minority interest in any other company, either consolidated or unconsolidated.
Use of Estimates
In preparing the consolidated financial statements in accordance with U.S. GAAP, management is required to make estimates and assumptions that affect the reported amounts of assets and liabilities, as well as contingent assets and liabilities as of the dates of the consolidated balance sheets and revenue and expenses for the years then ended. These estimates and assumptions include the allowance for doubtful accounts, valuation of inventory, depreciation, valuation of securities, reserves and accruals, and stock compensation expense. Actual results could differ from these estimates and assumptions.
Investment Property and Equipment and Depreciation
Property and equipment are carried at cost less accumulated depreciation. Depreciation for Sites and Buildings is computed principally on the straight-line method over the estimated useful lives of the assets (ranging from 15 to 27.5 years). Depreciation of Improvements to Sites and Buildings, Rental Homes and Equipment and Vehicles is computed principally on the straight-line method over the estimated useful lives of the assets (ranging from 3 to 27.5 years). Land Development Costs are not depreciated until they are put in use, at which time they are capitalized as Site and Land Improvements. Interest Expense pertaining to Land Development Costs are capitalized. Maintenance and Repairs are charged to expense as incurred and improvements are capitalized. The costs and related accumulated depreciation of property sold or otherwise disposed of are removed from the financial statements and any gain or loss is reflected in the current year’s results of operations.
| -93- |
The Company applies Financial Accounting Standards Board (“FASB”) Accounting Standards Codification (“ASC”) 360-10, Property, Plant & Equipment (“ASC 360-10”) to measure impairment in real estate investments. Rental properties are individually evaluated for impairment when conditions exist which may indicate that it is probable that the sum of expected future cash flows (on an undiscounted basis without interest) from a rental property is less than the carrying value under its historical net cost basis. These expected future cash flows consider factors such as future operating income, trends and prospects as well as the effects of leasing demand, competition and other factors. Upon determination that a permanent impairment has occurred, rental properties are reduced to their fair value. For properties to be disposed of, an impairment loss is recognized when the fair value of the property, less the estimated cost to sell, is less than the carrying amount of the property measured at the time there is a commitment to sell the property and/or it is actively being marketed for sale. A property to be disposed of is reported at the lower of its carrying amount or its estimated fair value, less its cost to sell. Subsequent to the date that a property is held for disposition, depreciation expense is not recorded.
The Company conducted a comprehensive review of all real estate asset classes in accordance with ASC 360-10-35-21. The process entailed the analysis of property for instances where the net book value exceeded the estimated fair value. The Company utilizes the experience and knowledge of its internal valuation team to derive certain assumptions used to determine an operating property’s cash flow. Such assumptions include lease-up rates, rental rates, rental growth rates, and capital expenditures. The Company reviewed its operating properties in light of the requirements of ASC 360-10 and determined that, as of December 31, 2017, the undiscounted cash flows over the expected holding period for these properties were in excess of their carrying values and, therefore, no impairment charges were required.
Acquisitions
The Company accounts for acquisitions in accordance with ASC 805, Business Combinations (“ASC 805”) and allocates the purchase price of the property based upon the fair value of the assets acquired, which generally consist of land, site and land improvements, buildings and improvements and rental homes. The Company allocates the purchase price of an acquired property generally determined by internal evaluation as well as third-party appraisal of the property obtained in conjunction with the purchase.
Effective January 1, 2017, the Company adopted Accounting Standards Update (“ASU”) 2017-01, “Business Combinations (Topic 805), Clarifying the Definition of a Business”. The Company evaluated its acquisitions and has determined that its acquisitions of manufactured home communities during 2017 should be accounted for as acquisitions of assets. As such, transaction costs, such as broker fees, transfer taxes, legal, accounting, valuation, and other professional and consulting fees, related to acquisitions are capitalized as part of the cost of the acquisitions, which is then subject to a purchase price allocation based on relative fair value. See “Recently Adopted Accounting Pronouncements” below for additional information regarding the adoption of this ASU.
Cash and Cash Equivalents
Cash and cash equivalents include all cash and investments with an original maturity of three months or less. The Company maintains its cash in bank accounts in amounts that may exceed federally insured limits. The Company has not experienced any losses in these accounts in the past. The fair value of cash and cash equivalents approximates their current carrying amounts since all such items are short-term in nature.
Securities Available for Sale
Investments in securities available for sale primarily consist of marketable common and preferred stock securities of other REITs, which the Company generally limits to no more than approximately 20% of its undepreciated assets. These marketable securities are all publicly-traded and purchased on the open market, through private transactions or through dividend reinvestment plans. These securities may be classified among three categories: held-to-maturity, trading, and available-for-sale. The Company normally holds REIT securities on a long term basis and has the ability and intent to hold securities to recovery, therefore as of December 31, 2017 and 2016, the Company’s securities are all classified as available-for-sale and are carried at fair value based upon quoted market prices in active markets. Gains or losses on the sale of securities are based on average cost and are accounted for on a trade date basis. Unrealized holding gains and losses are excluded from earnings and reported as a separate component of Shareholders’ Equity until realized. The change in the unrealized net holding gains (losses) is reflected in the Company’s Comprehensive Income (loss).
| -94- |
On January 1, 2018, the Company adopted ASU 2016-01, “Financial Instruments – Overall: Recognition and Measurement of Financial Assets and Financial Liabilities”. Upon adoption of ASU 2016-01, the Company anticipates that these securities will continue to be measured at fair value; however, the change in the unrealized net holding gains and losses will be recognized through net income. See “Recently Adopted Accounting Pronouncements” below for additional information regarding the adoption of this ASU.
The Company individually reviews and evaluates our marketable securities for impairment on a quarterly basis or when events or circumstances occur. The Company considers, among other things, credit aspects of the issuer, amount of decline in fair value over cost and length of time in a continuous loss position. The Company has developed a general policy of evaluating whether an unrealized loss is other than temporary. On a quarterly basis, the Company makes an initial review of every individual security in its portfolio. If the security is impaired, the Company first determines our intent and ability to hold this investment for a period of time sufficient to allow for any anticipated recovery in market value. Next, the Company determines the length of time and the extent of the impairment. Barring other factors, including the downgrading of the security or the cessation of dividends, if the fair value of the security is below cost by less than 20% for less than 6 months and the Company has the intent and ability to hold the security, the security is deemed to be temporarily impaired. Otherwise, the Company reviews additional information to determine whether the impairment is other than temporary. The Company discusses and analyzes any relevant information known about the security, such as:
| a. | Whether the decline is attributable to adverse conditions related to the security or to specific conditions in an industry or in a geographic area. | |
| b. | Any downgrading of the security by a rating agency. | |
| c. | Whether the financial condition of the issuer has deteriorated. | |
| d. | Status of dividends – Whether dividends have been reduced or eliminated, or scheduled interest payments have not been made. | |
| e. | Analysis of the underlying assets (including NAV analysis) using independent analysis or recent transactions. |
The Company normally holds REIT securities long term and has the ability and intent to hold securities to recovery. If a decline in fair value is determined to be other than temporary, an impairment charge is recognized in earnings and the cost basis of the individual security is written down to fair value as the new cost basis.
Inventory of Manufactured Homes
Inventory of manufactured homes is valued at the lower of cost or net realizable value and is determined by the specific identification method. All inventory is considered finished goods.
Accounts and Notes Receivables
The Company’s accounts, notes and other receivables are stated at their outstanding balance reduced by an allowance for uncollectible accounts. The Company evaluates the recoverability of its receivables whenever events occur or there are changes in circumstances such that management believes it is probable that it will be unable to collect all amounts due according to the contractual terms of the notes receivable or lease agreements. The collectability of notes receivable is measured based on the present value of the expected future cash flow discounted at the notes receivable effective interest rate or the fair value of the collateral if the notes receivable is collateral dependent. Total notes receivables at December 31, 2017 and 2016 was $24,066,567 and $18,361,298, respectively. At December 31, 2017 and 2016, the reserves for uncollectible accounts, notes and other receivables were $1,206,767 and $1,138,282, respectively. For the years ended December 31, 2017, 2016 and 2015, the provisions for uncollectible notes and other receivables were $1,273,535, $909,397 and $1,123,926, respectively. Charge-offs and other adjustments related to repossessed homes for the years ended December 31, 2017, 2016 and 2015 amounted to $1,205,050, $811,530 and $1,151,976, respectively.
The Company’s notes receivable primarily consists of installment loans collateralized by manufactured homes with principal and interest payable monthly. The average interest rate on these loans is approximately 9.0% and the average maturity is approximately 12 years.
| -95- |
Unamortized Financing Costs
Costs incurred in connection with obtaining mortgages and other financings and refinancings are deferred and presented in the balance sheet as a direct deduction from the carrying amount of that debt liability. These costs are amortized on a straight-line basis over the term of the related obligations, and included as a component of interest expense. Unamortized costs are charged to expense upon prepayment of the obligation. Upon amendment of the line of credit or refinancing of mortgage debt, unamortized deferred financing fees are accounted for in accordance with ASC 470-50-40, Modifications and Extinguishments. As of December 31, 2017 and 2016, accumulated amortization amounted to $3,746,862 and $3,085,952, respectively. The Company estimates that aggregate amortization expense will be approximately $571,000 for 2018, $544,000 for 2019, $508,000 for 2020, $501,000 for 2021 and $445,000 for 2022.
Derivative Instruments and Hedging Activities
In the normal course of business, the Company is exposed to financial market risks, including interest rate risk on our variable rate debt. We attempt to limit these risks by following established risk management policies, procedures and strategies, including the use of derivative financial instruments. The Company’s primary strategy in entering into derivative contracts is to minimize the variability that changes in interest rates could have on its future cash flows. The Company generally employs derivative instruments that effectively convert a portion of its variable rate debt to fixed rate debt. The Company does not enter into derivative instruments for speculative purposes. The Company had entered into various interest rate swap agreements that have had the effect of fixing interest rates relative to specific mortgage loans. As of December 31, 2017, these agreements have expired and the Company no longer had any interest rate swap agreements in effect.
Revenue Recognition
The Company derives its income primarily from the rental of manufactured homesites. The Company also owns approximately 5,600 rental units which are rented to residents. Rental and related income is recognized on the accrual basis over the term of the lease, which is typically one year or less.
Sale of manufactured homes is recognized on the full accrual basis when certain criteria are met. These criteria include the following: (a) initial and continuing payment by the buyer must be adequate: (b) the receivable, if any, is not subject to future subordination; (c) the benefits and risks of ownership are substantially transferred to the buyer; and (d) the Company does not have a substantial continued involvement with the home after the sale. Alternatively, when the foregoing criteria are not met, the Company recognizes gains by the installment method. Interest income on loans receivable is not accrued when, in the opinion of management, the collection of such interest appears doubtful.
Net Income (Loss) Per Share
Basic net income (loss) per share is calculated by dividing net income (loss) by the weighted average number of common shares outstanding during the period (32,675,650, 27,808,895 and 25,932,626 in 2017, 2016 and 2015, respectively). Diluted net income (loss) per share is calculated by dividing net income (loss) by the weighted average number of common shares outstanding plus the weighted average number of net shares that would be issued upon exercise of stock options pursuant to the treasury stock method. For the years ended December 31, 2017, 2016 and 2015, employee stock options to purchase 1,778,100, 1,760,000 and 1,560,500, respectively, shares of common stock were excluded from the computation of Diluted Net Income (Loss) per Share as their effect would be anti-dilutive.
Stock Compensation Plan
The Company accounts for awards of stock options and restricted stock in accordance with ASC 718-10, Compensation-Stock Compensation. ASC 718-10 requires that compensation cost for all stock awards be calculated and amortized over the service period (generally equal to the vesting period). The compensation cost for stock option grants is determined using option pricing models, intended to estimate the fair value of the awards at the grant date less estimated forfeitures. The compensation expense for restricted stock is recognized based on the fair value of the restricted stock awards less estimated forfeitures. The fair value of restricted stock awards is equal to the fair value of the Company’s stock on the grant date. Compensation costs, which is included in General and Administrative Expenses, of $1,314,491, $1,064,678 and $855,768 have been recognized in 2017, 2016 and 2015, respectively. During 2017, 2016 and 2015, compensation costs included a one-time charge of $200,907, $312,400, and $102,000, respectively, for restricted stock and stock option grants awarded to one participant who is of retirement age and therefore the entire amount of measured compensation cost has been recognized at grant date. Included in Note 6 to these consolidated financial statements are the assumptions and methodology used to calculate the fair value of stock options and restricted stock awards.
| -96- |
Income Tax
The Company has elected to be taxed as a REIT under the applicable provisions of Sections 856 to 860 of the Internal Revenue Code. Under such provisions, the Company will not be taxed on that portion of its income which is distributed to shareholders, provided it distributes at least 90% of its taxable income, has at least 75% of its assets in real estate investments and meets certain other requirements for qualification as a REIT. The Company has and intends to continue to distribute all of its income currently, and therefore no provision has been made for income or excise taxes. If the Company fails to qualify as a REIT in any taxable year, it will be subject to federal income taxes at regular corporate rates and may not be able to qualify as a REIT for four subsequent taxable years. The Company is also subject to certain state and local income, excise or franchise taxes. In addition, the Company has a taxable REIT Subsidiary (“TRS”) which is subject to federal and state income taxes at regular corporate tax rates (See Note 11).
The Company follows the provisions of ASC Topic 740, Income Taxes, that, among other things, defines a recognition threshold and measurement attribute for the financial statement recognition and measurement of a tax position taken or expected to be taken in a tax return. ASC Topic 740 also provides guidance on de-recognition, classification, interest and penalties, accounting in interim periods, disclosure, and transition. Based on its evaluation, the Company determined that it has no uncertain tax positions and no unrecognized tax benefits as of December 31, 2017. The Company records interest and penalties relating to unrecognized tax benefits, if any, as interest expense. As of December 31, 2017, the tax years 2014 through and including 2017 remain open to examination by the Internal Revenue Service. There are currently no federal tax examinations in progress.
Comprehensive Income (Loss)
Comprehensive income (loss) is comprised of net income and other comprehensive income (loss). Other comprehensive income (loss) consists of the change in unrealized gains or losses on securities available for sale and the change in the fair value of derivatives.
Reclassifications
Certain amounts in the consolidated financial statements for the prior years have been reclassified to conform to the financial statement presentation for the current year.
Recently Adopted Accounting Pronouncements
Adopted 2017
In January 2017, the FASB issued ASU 2017-01, “Business Combinations (Topic 805), Clarifying the Definition of a Business.” ASU 2017-01 seeks to clarify the definition of a business with the objective of adding guidance to assist entities with evaluating whether transactions should be accounted for as acquisitions (or disposals) of assets or businesses. The definition of a business affects many areas of accounting including acquisitions, disposals, intangible assets and consolidation. The adoption of ASU 2017-01 is effective for annual periods beginning after December 15, 2017, including interim periods within those periods. The amendments should be applied prospectively on or after the effective dates. Early adoption is permitted. The Company adopted this standard effective January 1, 2017, on a prospective basis. The Company evaluated its acquisitions and has determined that its acquisitions of manufactured home communities during 2017 should be accounted for as acquisitions of assets. As such, transaction costs of approximately $798,000 have been capitalized as part of the cost of the acquisitions, which is then subject to a purchase price allocation based on relative fair value.
In March 2016, the FASB issued ASU 2016-09, “Compensation—Stock Compensation.” ASU 2016-09 simplifies several aspects of the accounting for employee share-based payment transactions, including the accounting for income taxes, forfeitures, and statutory tax withholding requirements, as well as classification in the statement of cash flows. ASU 2016-09 is effective for annual reporting periods, including interim reporting periods within those periods, beginning after December 15, 2016. The Company adopted this standard effective January 1, 2017, and it did not have a material impact on our financial position, results of operations or cash flows.
| -97- |
In July 2015, the FASB issued ASU No. 2015-11, “Simplifying the Measurement of Inventory.” ASU 2015-11 applies to inventory that is measured using first-in, first-out (“FIFO”) or average cost. An entity should measure inventory within the scope of ASU 2015-11 at the lower of cost and net realizable value. Net realizable value is the estimated selling prices in the ordinary course of business, less reasonable predictable costs of completion, disposal and transportation. The amendments in ASU 2015-11 more closely align the measurement of inventory in GAAP with the measurement of inventory in International Financial Reporting Standards (“IFRS”). The Company adopted this standard effective January 1, 2017, and it did not have a material impact on our financial position, results of operations or cash flows.
Adopted 2018
In May 2017, the FASB issued ASU No. 2017-09, “Compensation - Stock Compensation (Topic 718): Scope of Modification Accounting.” ASU 2017-09 clarifies which changes to the terms or conditions of a share based payment award are subject to the guidance on modification accounting under FASB Accounting Standards Codification Topic 718. Entities would apply the modification accounting guidance unless the value, vesting requirements and classification of a share based payment award are the same immediately before and after a change to the terms or conditions of the award. ASU No. 2017-09 is effective for fiscal years beginning after December 15, 2017, including interim periods within those fiscal years. The Company adopted this standard effective January 1, 2018, and it did not have a material impact on our financial position, results of operations or cash flows.
In February 2017, the FASB issued ASU No. 2017-05, “Other Income-Gains and Losses from the Derecognition of Nonfinancial Assets.” ASU 2017-05 provides guidance for recognizing gains and losses from the transfer of nonfinancial assets and in-substance non-financial assets in contracts with non-customers, unless other specific guidance applies. The standard requires a company to derecognize nonfinancial assets once it transfers control of a distinct nonfinancial asset or distinct in substance nonfinancial asset. Additionally, when a company transfers its controlling interest in a nonfinancial asset, but retains a noncontrolling ownership interest, the company is required to measure any non-controlling interest it receives or retains at fair value. The guidance requires companies to recognize a full gain or loss on the transaction. As a result of the new guidance, the guidance specific to real estate sales in ASC 360-20 will be eliminated. As such, sales and partial sales of real estate assets will now be subject to the same derecognition model as all other nonfinancial assets. The guidance is effective for annual periods beginning after December 15, 2017, including interim periods within that reporting period. The Company adopted this standard effective January 1, 2018, and it did not have a material impact on our financial position, results of operations or cash flows.
In August 2016, the FASB issued ASU No. 2016-15, “Statement of Cash Flows (Topic 230), Classification of Certain Cash Receipts and Cash Payments.” ASU 2016-15 will make eight targeted changes to how cash receipts and cash payments are presented and classified in the statement of cash flows. ASU 2016-15 is effective for annual reporting periods, including interim reporting periods within those periods, beginning after December 15, 2017. Early adoption is permitted. The Company believes that the adoption of this standard will not have a material impact on our financial position, results of operations or cash flows. The Company adopted this standard effective January 1, 2018, and it did not have a material impact on our financial position, results of operations or cash flows.
In January 2016, the FASB issued ASU 2016-01, “Financial Instruments – Overall: Recognition and Measurement of Financial Assets and Financial Liabilities.” ASU 2016-01 requires equity investments (except those accounted for under the equity method of accounting, or those that result in consolidation of the investee) to be measured at fair value with changes in fair value recognized in net income, requires public business entities to use the exit price notion when measuring the fair value of financial instruments for disclosure purposes, requires separate presentation of financial assets and financial liabilities by measurement category and form of financial asset, and eliminates the requirement for public business entities to disclose the method(s) and significant assumptions used to estimate the fair value that is required to be disclosed for financial instruments measured at amortized cost. ASU 2016-01 is effective for annual reporting periods, including interim reporting periods within those periods, beginning after December 15, 2017, and early adoption is permitted. The Company adopted this standard effective January 1, 2018. The Company previously classified its marketable securities as available-for-sale and carried at fair value with unrealized holding gains and losses excluded from earnings and reported as a separate component of Shareholders’ Equity until realized. The change in the unrealized net holding gains (losses) was reflected in the Company’s Comprehensive Income (loss). Upon adoption, these securities will continue to be measured at fair value; however, the change in the unrealized net holding gains and losses will be recognized through net income. Unrealized net holding gains of $11,519,582, as of January 1, 2018, were reclassed to beginning retained earnings.
| -98- |
In May 2014, the FASB issued ASU 2014-09 “Revenue from Contracts with Customers (Topic 606)”. The objective of this amendment is to establish a single comprehensive model for entities to use in accounting for revenue arising from contracts with customers and will supersede most of the existing revenue recognition guidance, including industry-specific guidance. The core principle is that a company should recognize revenue to depict the transfer of promised goods or services to customers in an amount that reflects the consideration to which the entity expects to be entitled in exchange for those goods or services. In applying this amendment, companies will perform a five-step analysis of transactions to determine when and how revenue is recognized. This amendment applies to all contracts with customers except those that are within the scope of other topics in the FASB ASC. An entity should apply the amendments using either the full retrospective approach or retrospectively with a cumulative effect of initially applying the amendments recognized at the date of initial application. In July 2015, the FASB issued ASU 2015-14 which deferred the effective date of ASU 2014-09 by one year to annual reporting periods beginning after December 15, 2017, including interim periods within that reporting period. The Company adopted this standard effective January 1, 2018 using the modified retrospective approach.
Our primary source of revenue is generated from lease agreements for our sites and homes. The lease component of these agreements will be accounted for under ASC 840 “Leases,” and the non-lease components under ASC 605 “Revenue Recognition.” Sales of manufactured homes is recognized under ASC 605 “Revenue Recognition” since these homes are not permanent fixtures or improvements to the underlying real estate. Interest income and dividend income is presented separately but is not in the scope of ASU 2014-09. Other income is recognized under ASC 605 “Revenue Recognition” and primarily consists of brokerage commissions for arranging for the sale of a home by a third party, service and marketing agreements with cable providers, and in 2017 include an upfront oil and gas bonus payment.The adoption of this standard did not have a material impact on our financial position, results of operations or cash flows.
Other Recent Accounting Pronouncements
In June 2016, the FASB issued ASU No. 2016-13, “Financial Instruments – Credit Losses (Topic 326): Measurement of Credit Losses on Financial Instruments.” ASU 2016-13 requires that entities use a new forward looking “expected loss” model that generally will result in the earlier recognition of allowance for credit losses. The measurement of expected credit losses is based upon historical experience, current conditions, and reasonable and supportable forecasts that affect the collectability of the reported amount. ASU No. 2016-13 is effective for annual reporting periods, including interim reporting periods within those periods, beginning after December 15, 2019. The Company is currently evaluating the potential impact this standard may have on the consolidated financial statements.
In February 2016, the FASB issued ASU 2016-02, “Leases.” ASU 2016-02 amends the existing accounting standards for lease accounting, including requiring lessees to recognize most leases on their balance sheets and making targeted changes to lessor accounting. The standard requires a modified retrospective transition approach for all leases existing at, or entered into after, the date of initial application, with an option to use certain transition relief. ASU 2016-02 will be effective for annual reporting periods beginning after December 15, 2018. Early adoption is permitted. The Company is currently evaluating the potential impact this standard may have on the consolidated financial statements and the timing of adoption.
Management does not believe that any other recently issued, but not yet effective accounting pronouncements, if adopted, would have a material effect on the accompanying Consolidated Financial Statements.
| -99- |
NOTE 3 – INVESTMENT PROPERTY AND EQUIPMENT
Acquisitions in 2017
On January 20, 2017, the Company acquired two manufactured home communities, Hillcrest Estates and Marysville Estates, located in Ohio, for approximately $9,588,000. These all-age communities contain a total of 532 developed homesites that are situated on approximately 149 total acres. At the date of acquisition, the average occupancy for these communities was approximately 57%.
On January 20, 2017, the Company also acquired two manufactured home communities located in Indiana for approximately $24,437,000. This acquisition consists of Boardwalk, an age restricted community containing 195 homesites, and Parke Place, an all-age community containing 364 homesites. These communities are situated on approximately 155 total acres. At the date of acquisition, the average occupancy for these communities was approximately 77%. In conjunction with this acquisition, the Company obtained a 10-year, $14,250,000 mortgage with an interest rate of 4.56% and a 30-year amortization (See Note 5).
On January 24, 2017, the Company acquired Hillcrest Crossing, a manufactured home community located in Pennsylvania, for approximately $2,485,000. This all-age community contains a total of 200 developed homesites that are situated on approximately 78 total acres. At the date of acquisition, the occupancy for this community was approximately 40%.
On May 31, 2017, the Company acquired Cinnamon Woods, a manufactured home community located in Maryland, for $4,000,000. This age restricted community contains a total of 63 developed homesites that are situated on approximately 79 total acres, of which approximately 61 acres are available for expansion. At the date of acquisition, the occupancy for this community was approximately 92%.
On December 22, 2017, the Company acquired five communities located in Pennsylvania for approximately $22,780,000. This acquisition consists of three all-age communities and two age-restricted communities containing a total of 643 developed homesites. These communities are situated on approximately 141 acres. At the date of acquisition, the average occupancy for these communities was approximately 72%. In conjunction with this acquisition, the Company assumed a mortgage loan with a balance of approximately $2,418,000. The interest rate on this mortgage is fixed at 6.35%. This mortgage matures on January 1, 2023 (See Note 5).
Acquisitions in 2016
On September 1, 2016, the Company acquired two manufactured home communities, Lakeview Meadows and Wayside, located in Ohio for approximately $2,954,000. These all-age communities contain a total of 165 developed homesites that are situated on approximately 71 total acres. At the date of acquisition, the average occupancy for these communities was approximately 64%.
On December 19, 2016, the Company acquired Springfield Meadows, a manufactured home community located in Springfield, Ohio, for approximately $4,323,000. This all-age community contains a total of 124 developed homesites that are situated on approximately 121 total acres. At the date of acquisition, the average occupancy for this community was approximately 82%. In conjunction with this acquisition, the Company assumed a mortgage loan with a balance of approximately $3,195,000. The interest rate on this mortgage is fixed at 4.83%. This mortgage matures on October 6, 2025.
These acquisitions have been accounted for utilizing the acquisition method of accounting in accordance with ASC 805, Business Combinations, and accordingly, the result of the acquired assets are included in the statements of income (loss) from the dates of acquisition. The allocations of the fair value of the assets acquired is subject to further adjustment as final costs and valuations are determined.
| -100- |
The following table summarizes the estimated fair value of the assets acquired, including transactions costs of approximately $798,000 and -0- for the years ended December 31, 2017 and 2016, respectively:
| Fair Value at Acquisition Date | ||||||||
| 2017 Acquisitions | 2016 Acquisitions | |||||||
| Assets Acquired: | ||||||||
| Land | $ | 13,601,000 | $ | 2,000,000 | ||||
| Depreciable Property | 46,416,000 | 5,277,000 | ||||||
| Notes Receivable and Other | 4,070,000 | -0- | ||||||
| Total Assets Acquired | $ | 64,087,000 | $ | 7,277,000 | ||||
Total Income, Community Net Operating Income (“Community NOI”)* and Net Income (Loss) for communities acquired in 2017 and 2016, which are included in our Consolidated Statements of Income (Loss) for the years ended December 31, 2017 and 2016, are as follows:
| 2017 Acquisitions | 2016 Acquisitions | |||||||||||
| 2017 | 2017 | 2016 | ||||||||||
| Total Income | $ | 4,732,307 | $ | 980,968 | $ | 172,050 | ||||||
| Community NOI * | $ | 2,398,652 | $ | 354,416 | $ | 103,578 | ||||||
| Net Income (Loss) | $ | 211,468 | $ | (242,682 | ) | $ | 3,051 | |||||
*Community NOI is defined as rental and related income less community operating expenses.
See Note 5 for additional information relating to Loans and Mortgages Payable and Note 16 for the Unaudited Pro Forma Financial Information relating to these acquisitions.
Accumulated Depreciation
The following is a summary of accumulated depreciation by major classes of assets:
| December 31, 2017 | December 31, 2016 | |||||||
| Site and Land Improvements | $ | 114,617,282 | $ | 99,161,090 | ||||
| Buildings and Improvements | 5,779,146 | 4,947,543 | ||||||
| Rental Homes and Accessories | 33,621,420 | 24,906,990 | ||||||
| Equipment and Vehicles | 12,426,664 | 11,239,980 | ||||||
| Total Accumulated Depreciation | $ | 166,444,512 | $ | 140,255,603 | ||||
Other
Many oil and gas companies compete for the opportunity to drill for oil and gas. Successful bidders pay an upfront purchase price (“bonus payment”). In May 2017, the Company received a bonus payment of $251,680 for the right to allow an oil and gas company to drill at one of its communities. The bonus payment is not refundable and the Company has no further obligations related to it. Therefore, this bonus payment received by the Company is considered earned by the Company and has been recorded as Other Income in the accompanying Consolidated Statements of Income. In addition to this upfront bonus payment, the Company entered into an agreement (“Lease”) whereby the oil and gas company may remove the oil and gas from the property, provided that it pays the Company an 18% royalty fee based on the amount of the oil and gas removed. The term of the Lease is for five years.
| -101- |
NOTE 4 – SECURITIES AVAILABLE FOR SALE
The Company’s securities available for sale consist of common and preferred stock of other REITs. The Company does not own more than 10% of the outstanding shares of any of these securities, nor does it have controlling financial interest.
As of December 31, 2017 and 2016, the Company’s securities are all classified as available-for-sale. See Note 13 for Fair Value Measurements.
The following is a listing of securities available for sale at December 31, 2017:
| Interest | Number | Market | ||||||||||||||||
| Series | Rate | of Shares | Cost | Value | ||||||||||||||
| Equity Securities: | ||||||||||||||||||
| Preferred Stock: | ||||||||||||||||||
| CBL & Associates Properties, Inc. | D | 7.375 | % | 2,000 | $ | 50,269 | $ | 43,720 | ||||||||||
| CBL & Associates Properties, Inc. | E | 6.625 | % | 62,724 | 1,487,145 | 1,383,064 | ||||||||||||
| Cedar Realty Trust, Inc. | B | 7.250 | % | 18,269 | 422,544 | 458,755 | ||||||||||||
| Cedar Realty Trust, Inc. | C | 6.500 | % | 20,000 | 494,407 | 500,800 | ||||||||||||
| Colony Northstar, Inc. | I | 7.150 | % | 20,000 | 500,000 | 503,600 | ||||||||||||
| Investors Real Estate Trust | C | 6.625 | % | 20,000 | 500,000 | 520,308 | ||||||||||||
| Pennsylvania Real Estate Investment Trust | B | 7.375 | % | 40,000 | 1,000,000 | 1,007,200 | ||||||||||||
| Pennsylvania Real Estate Investment Trust | D | 6.875 | % | 20,000 | 498,207 | 502,200 | ||||||||||||
| Urstadt Biddle Properties, Inc. | G | 6.750 | % | 5,000 | 125,000 | 131,000 | ||||||||||||
| Urstadt Biddle Properties, Inc. | H | 6.250 | % | 12,500 | 312,500 | 326,875 | ||||||||||||
| Total Preferred Stock | 5,390,072 | 5,377,522 | ||||||||||||||||
| Common Stock: | ||||||||||||||||||
| CBL & Associates Properties, Inc. | 1,500,000 | 16,157,749 | 8,490,000 | |||||||||||||||
| Franklin Street Properties Corporation | 150,000 | 1,659,118 | 1,611,000 | |||||||||||||||
| Government Properties Income Trust | 1,020,000 | 19,430,983 | 18,910,800 | |||||||||||||||
| Kimco Realty Corporation | 750,000 | 14,475,908 | 13,612,500 | |||||||||||||||
| Monmouth Real Estate Investment Corporation (1) | 2,335,930 | 20,698,562 | 41,579,558 | |||||||||||||||
| Pennsylvania Real Estate Investment Trust | 150,000 | 1,602,636 | 1,783,500 | |||||||||||||||
| Select Income Real Estate Investment Trust | 775,000 | 18,649,691 | 19,475,750 | |||||||||||||||
| Senior Housing Properties Trust | 160,911 | 2,739,069 | 3,081,446 | |||||||||||||||
| Tanger Factory Outlet | 120,000 | 2,941,621 | 3,181,200 | |||||||||||||||
| Urstadt Biddle Properties, Inc. | 100,000 | 2,048,516 | 2,174,000 | |||||||||||||||
| Vereit, Inc. | 1,300,000 | 11,253,514 | 10,127,000 | |||||||||||||||
| Washington Prime Group | 500,000 | 4,397,255 | 3,560,000 | |||||||||||||||
| Total Common Stock | 116,054,622 | 127,586,754 | ||||||||||||||||
| Total Securities Available for Sale | $ | 121,444,694 | $ | 132,964,276 | ||||||||||||||
(1) Related entity – See Note 8.
| -102- |
The following is a listing of securities available for sale at December 31, 2016:
| Interest | Number | Market | ||||||||||||||||
| Series | Rate | of Shares | Cost | Value | ||||||||||||||
| Equity Securities: | ||||||||||||||||||
| Preferred Stock: | ||||||||||||||||||
| Ashford Hospitality Trust, Inc. | A | 8.550 | % | 10,000 | $ | 251,205 | $ | 253,800 | ||||||||||
| CBL & Associates Properties, Inc. | D | 7.375 | % | 2,000 | 50,269 | 48,900 | ||||||||||||
| CBL & Associates Properties, Inc. | E | 6.625 | % | 62,724 | 1,487,145 | 1,440,789 | ||||||||||||
| Cedar Realty Trust, Inc. | B | 7.250 | % | 58,577 | 1,411,846 | 1,426,126 | ||||||||||||
| Chesapeake Lodging Trust | A | 7.750 | % | 20,000 | 500,000 | 507,806 | ||||||||||||
| Corporate Office Properties Trust | L | 7.375 | % | 26,000 | 650,330 | 656,760 | ||||||||||||
| Kilroy Realty Corporation | G | 6.875 | % | 34,948 | 844,770 | 885,932 | ||||||||||||
| LaSalle Hotel Properties | H | 7.500 | % | 40,000 | 982,589 | 1,002,000 | ||||||||||||
| Pennsylvania Real Estate Investment Trust | A | 8.250 | % | 68,800 | 1,720,885 | 1,739,952 | ||||||||||||
| Pennsylvania Real Estate Investment Trust | B | 7.375 | % | 40,000 | 1,000,000 | 1,000,000 | ||||||||||||
| Retail Properties of America, Inc. | A | 7.000 | % | 20,000 | 481,949 | 500,000 | ||||||||||||
| Stag Industrial, Inc. | B | 6.625 | % | 20,100 | 470,007 | 501,495 | ||||||||||||
| Summit Hotel Properties, Inc. | B | 7.875 | % | 20,000 | 500,000 | 514,780 | ||||||||||||
| Sun Communities, Inc. | A | 7.125 | % | 45,000 | 1,117,377 | 1,133,550 | ||||||||||||
| Terreno Realty Corporation | A | 7.750 | % | 20,300 | 507,791 | 512,575 | ||||||||||||
| Urstadt Biddle Properties, Inc. | F | 7.125 | % | 30,421 | 756,304 | 775,735 | ||||||||||||
| Urstadt Biddle Properties, Inc. | G | 6.750 | % | 5,000 | 125,000 | 128,000 | ||||||||||||
| Total Preferred Stock | 12,857,467 | 13,028,200 | ||||||||||||||||
| Common Stock: | ||||||||||||||||||
| CBL & Associates Properties, Inc. | 1,000,000 | 11,785,016 | 11,500,000 | |||||||||||||||
| Cousins Properties, Inc. | 105,950 | 820,348 | 901,635 | |||||||||||||||
| Gladstone Commercial Corporation | 180,000 | 3,199,933 | 3,618,000 | |||||||||||||||
| Government Properties Income Trust | 810,000 | 15,520,076 | 15,442,650 | |||||||||||||||
| Monmouth Real Estate Investment Corporation (1) | 2,237,588 | 19,231,411 | 34,100,835 | |||||||||||||||
| Nobility Homes Inc. | 20,000 | 158,200 | 315,000 | |||||||||||||||
| Parkway Properties Inc. | 33,243 | 628,819 | 739,657 | |||||||||||||||
| Select Income Real Estate Investment Trust | 740,000 | 17,802,516 | 18,648,000 | |||||||||||||||
| Senior Housing Properties Trust | 220,911 | 3,760,406 | 4,181,845 | |||||||||||||||
| Urstadt Biddle Properties, Inc. | 85,000 | 1,761,151 | 2,049,350 | |||||||||||||||
| Vereit, Inc. | 500,000 | 4,512,658 | 4,230,000 | |||||||||||||||
| Total Common Stock | 79,180,534 | 95,726,972 | ||||||||||||||||
| Total Securities Available for Sale | $ | 92,038,001 | $ | 108,755,172 | ||||||||||||||
(1) Related entity – See Note 8.
| -103- |
As of December 31, 2017, the Company held eight securities that the Company determined were temporarily impaired investments. The Company considers many factors in determining whether a security is other than temporarily impaired, including the nature of the security and the cause, severity and duration of the impairment. The following is a summary of temporarily impaired securities at December 31, 2017:
| Less than 12 Months | 12 Months or Longer | |||||||||||||||
| Fair Value | Unrealized Loss | Fair Value | Unrealized Loss | |||||||||||||
| Preferred Stock | $ | 1,383,064 | $ | (104,080 | ) | $ | 43,720 | $ | (6,549 | ) | ||||||
| Common Stock | 56,311,300 | (11,063,227 | ) | -0- | -0- | |||||||||||
| Total | $ | 57,694,364 | $ | (11,167,307 | ) | $ | 43,720 | $ | (6,549 | ) | ||||||
The following is a summary of the range of the losses:
Number of Individual Securities | Fair Value | Unrealized Loss | Range of Loss | |||||||||||
| 2 | $ | 20,521,800 | $ | (568,302 | ) | 3 | % | |||||||
| 3 | 25,122,564 | (2,094,002 | ) | 6-10 | % | |||||||||
| 1 | 43,720 | (6,549 | ) | 13 | % | |||||||||
| 1 | 3,560,000 | (837,254 | ) | 19 | % | |||||||||
| 1 | 8,490,000 | (7,667,749 | ) | 47 | % | |||||||||
| 8 | $ | 57,738,084 | $ | (11,173,856 | ) | |||||||||
The Company normally holds REIT securities long term and has the ability and intent to hold securities to recovery. As of December 31, 2017, 2016 and 2015, the securities portfolio had net unrealized holding gains (losses) of $11,519,582, $16,717,171 and $(2,055,027), respectively.
During the years ended December 31, 2017, 2016 and 2015, the Company received proceeds of $17,416,146, $14,831,737 and $4,633,019, on sales or redemptions of securities available for sale, respectively. The Company recorded the following Gain (Loss) on Sale of Securities, net:
| 2017 | 2016 | 2015 | ||||||||||
| Gross realized gains | $ | 1,749,034 | $ | 2,287,454 | $ | 208,200 | ||||||
| Gross realized losses | (1,506 | ) | (2,153 | ) | (3,970 | ) | ||||||
| Total Realized Gain on Sales of Securities, net | $ | 1,747,528 | $ | 2,285,301 | $ | 204,230 | ||||||
The Company had margin loan balances of $37,157,467 and $22,727,458 at December 31, 2017 and 2016, respectively, which were collateralized by the Company’s securities portfolio.
NOTE 5 – LOANS AND MORTGAGES PAYABLE
Loans Payable
The Company may purchase securities on margin. The interest rates charged on the margin loans at December 31, 2017 and 2016 was 2.0%. These margin loans are due on demand. At December 31, 2017 and 2016, the margin loans amounted to $37,157,467 and $22,727,458, respectively, and are collateralized by the Company’s securities portfolio. The Company must maintain a coverage ratio of approximately 2 times.
The Company has revolving credit agreements totaling $28,500,000 with 21st Mortgage Corporation (“21st Mortgage”), Customers Bank and Northpoint Commercial Finance to finance inventory purchases. Interest rates on these agreements range from prime with a minimum of 6% to Prime plus 2% with a minimum of 8% after 18 months. As of December 31, 2017 and 2016, the total amount outstanding on these lines was $2,239,315 and $6,314,352, respectively, with a weighted average interest rate of 6.74% and 5.9%, respectively.
| -104- |
In June 2017, the Company entered into an amended and restated revolving line of credit with OceanFirst Bank (“OceanFirst Line”), secured by the Company’s eligible notes receivable. The maximum availability on the OceanFirst Line is $10 million. Interest was reduced from prime plus 50 basis points to prime plus 25 basis points. The new maturity date is June 1, 2020. As of December 31, 2017 and 2016, the amount outstanding on this revolving line of credit was $4 million, and the interest rate was 4.75% and 4.25%, respectively.
The Company has an agreement with 21st Mortgage to finance the Company’s purchase of rental units. These loans are at an interest rate of 6.99%, with an origination fee of 2% on new units and 3% on existing units. These loans will have a 10 year term from the date of the borrowing. The amount outstanding on this loan was $421,930 and $467,101, as of December 31, 2017 and 2016, respectively.
The Company has a $4,000,000 loan from Two River Community Bank, secured by 1,000,000 shares of Monmouth Real Estate Investment Corporation common stock. This loan is at an interest rate of 4.625%, with interest only payments through October 2017, and matures on October 30, 2019. The amount outstanding on this loan was $3,969,329 and $4,000,000 as of December 31, 2017 and 2016, respectively. The Company also has $1,977,783 in automotive loans with a weighted average interest rate of 4.05%.
Unsecured Lines of Credit
On March 28, 2017, the Company entered into an amended and restated credit agreement to renew and expand its existing unsecured revolving credit facility. The new unsecured revolving credit facility (the “Facility”) was syndicated with BMO Capital Markets (“BMO”), as sole lead arranger and sole book runner, with Bank of Montreal as administrative agent. The Facility provides for an increase from $35 million in available borrowings to $50 million in available borrowings with a $75 million accordion feature, bringing the total potential availability up to $125 million, subject to certain conditions. The maturity date of the Facility is March 27, 2020, with a one year extension option. Borrowings will bear interest at the Company’s option of LIBOR plus 1.75% to 2.50% or BMO’s prime lending rate plus 0.75% to 1.50%, based on the Company’s overall leverage. Based on the Company’s current leverage ratio, borrowings under the Facility will bear interest at LIBOR plus 2% or at BMO’s prime lending rate plus 1%. The amount outstanding under this Facility was $35 million at December 31, 2017.
The aggregate principal payments of all loans payable, including the Credit Facility, are scheduled as follows:
| Year Ended December 31, | ||||
| 2018 | $ | 2,776,329 | ||
| 2019 | 4,506,895 | |||
| 2020 | 39,526,583 | |||
| 2021 | 420,131 | |||
| 2022 | 236,217 | |||
| Thereafter | 37,299,669 | |||
| Total Loans Payable | 84,765,824 | |||
| Unamortized Debt Issuance Costs | (61,337 | ) | ||
| Total Loans Payable, net of Unamortized Debt Issuance Costs | $ | 84,704,487 | ||
Mortgages Payable
Mortgages Payable represents the principal amounts outstanding as of December 31, 2017, net of unamortized debt issuance costs. Interest is payable on these mortgages at fixed rates ranging from 3.71% to 6.5% and a variable rate of prime plus 1.0%. The weighted average interest rate as of December 31, 2017 was 4.3%, compared to 4.4% as of December 31, 2016, including the effect of unamortized debt issuance costs. The weighted average interest rate as of December 31, 2017 was 4.2%, compared to 4.3% as of December 31, 2016, not including the effect of unamortized debt issuance costs. The weighted average loan maturity of the Mortgage Notes Payable was 6.9 years at December 31, 2017 and 2016.
| -105- |
The following is a summary of mortgages payable at December 31, 2017 and 2016:
| At December 31, 2017 | Balance at December 31, | |||||||||||||
| Property | Due Date | Interest Rate | 2017 | 2016 | ||||||||||
| Allentown | 10/01/25 | 4.06 | % | $ | 13,390,559 | $ | 13,637,719 | |||||||
| Brookview Village | 04/01/25 | 3.92 | % | 2,778,698 | 2,832,889 | |||||||||
| Candlewick Court | 09/01/25 | 4.10 | % | 4,468,826 | 4,551,134 | |||||||||
| Catalina | 08/19/25 | 4.20 | % | 5,533,771 | 5,739,657 | |||||||||
| Cedarcrest | 04/01/25 | 3.71 | % | 12,024,840 | 12,268,266 | |||||||||
| Clinton Mobile Home Resort | 10/01/25 | 4.06 | % | 3,514,421 | 3,579,289 | |||||||||
| Cranberry Village | 04/01/25 | 3.92 | % | 7,620,974 | 7,769,600 | |||||||||
| D & R Village | 03/01/25 | 3.85 | % | 7,685,346 | 7,837,828 | |||||||||
| Fairview Manor | 11/01/26 | 3.85 | % | 16,010,749 | 16,299,292 | |||||||||
| Forest Park Village | 09/01/25 | 4.10 | % | 8,332,848 | 8,486,324 | |||||||||
| Hayden Heights | 04/01/25 | 3.92 | % | 2,094,009 | 2,134,846 | |||||||||
| Heather Highlands | 08/28/18 | Prime + 1.0 | % | 16,606 | 354,529 | |||||||||
| Highland Estates | 06/01/27 | 4.12 | % | 16,640,165 | 9,035,246 | |||||||||
| Holiday Village | 09/01/25 | 4.10 | % | 7,929,646 | 8,075,696 | |||||||||
| Holiday Village- IN | 11/01/25 | 3.96 | % | 8,514,837 | 8,674,151 | |||||||||
| Holly Acres Estates | 10/05/21 | 6.50 | % | 2,194,312 | 2,228,629 | |||||||||
| Kinnebrook Village | 04/01/25 | 3.92 | % | 4,048,226 | 4,127,176 | |||||||||
| Lake Sherman Village | 09/01/25 | 4.10 | % | 5,510,432 | 5,611,924 | |||||||||
| Olmsted Falls | 04/01/25 | 3.98 | % | 2,093,269 | 2,133,656 | |||||||||
| Oxford Village | 01/01/20 | 5.94 | % | 6,751,511 | 6,963,586 | |||||||||
| Shady Hills | 04/01/25 | 3.92 | % | 4,992,527 | 5,089,892 | |||||||||
| Somerset Estates and Whispering Pines | 02/26/19 | 4.89 | % | 217,770 | 395,886 | |||||||||
| Springfield Meadows | 10/06/25 | 4.83 | % | 3,141,199 | 3,191,381 | |||||||||
| Suburban Estates | 10/01/25 | 4.06 | % | 5,583,084 | 5,686,136 | |||||||||
| Sunny Acres | 10/01/25 | 4.06 | % | 6,214,642 | 6,329,351 | |||||||||
| Southwind Village | 01/01/20 | 5.94 | % | 5,392,911 | 5,562,311 | |||||||||
| Trailmont | 04/01/25 | 3.92 | % | 3,328,351 | 3,393,262 | |||||||||
| Twin Oaks | 12/01/19 | 5.75 | % | 2,415,894 | 2,494,084 | |||||||||
| Valley Hills | 06/01/26 | 4.32 | % | 3,408,438 | 3,466,014 | |||||||||
| Waterfalls | 06/01/26 | 4.38 | % | 4,639,515 | 4,716,994 | |||||||||
| Weatherly Estates | 04/01/25 | 3.92 | % | 8,121,177 | 8,279,558 | |||||||||
| Wellington Estates | 01/01/23 | 6.35 | % | 2,414,621 | -0- | |||||||||
| Woods Edge | 01/07/26 | 4.30 | % | 6,728,792 | 6,969,958 | |||||||||
| Worthington Arms | 09/01/25 | 4.10 | % | 9,342,775 | 9,514,851 | |||||||||
| Various (2 properties) | 02/01/27 | 4.56 | % | 14,049,088 | -0- | |||||||||
| Various (4 properties) | 07/01/23 | 4.975 | % | 8,079,960 | 8,226,015 | |||||||||
| Various (5 properties) | 01/01/22 | 4.25 | % | 13,749,838 | 14,072,987 | |||||||||
| Various (5 properties) | 12/06/22 | 4.75 | % | 7,154,380 | 7,294,460 | |||||||||
| Various (5 properties) | 02/01/18 | 6.83 | % | -0- | 8,818,862 | |||||||||
| Various (6 properties) | 08/01/27 | 4.18 | % | 13,296,207 | -0- | |||||||||
| Various (11 properties) | 08/01/17 | LIBOR + 3.0 | % | -0- | 10,625,352 | |||||||||
| Various (13 properties) | 03/01/23 | 4.065 | % | 49,035,572 | 50,095,192 | |||||||||
| Total Mortgages Payable | 308,460,786 | 296,563,983 | ||||||||||||
| Unamortized Debt Issuance Costs | (3,565,669 | ) | (3,538,391 | ) | ||||||||||
| Total Mortgages Payable, net of Unamortized Debt Issuance Costs | $ | 304,895,117 | $ | 293,025,592 | ||||||||||
At December 31, 2017 and 2016, mortgages were collateralized by real property with a carrying value of $538,249,737 and $488,623,061, respectively, before accumulated depreciation and amortization. Interest costs amounting to $500,859, $359,906 and $277,944 were capitalized during 2017, 2016 and 2015, respectively, in connection with the Company’s expansion program.
| -106- |
Recent Transactions
During the year ended December 31, 2017
On January 20, 2017, the Company obtained a $14,250,000 Federal Home Loan Mortgage Corporation (“Freddie Mac”) mortgage through Wells Fargo Bank, N.A. (“Wells Fargo”) on Boardwalk and Parke Place in connection with the Company’s acquisition of these communities. This mortgage is at a fixed rate of 4.56% and matures on February 1, 2027. Principal repayments are based on a 30-year amortization schedule.
On May 31, 2017, the Company obtained a $16,800,000 Freddie Mac mortgage through Wells Fargo on Highland Estates. This mortgage is at a fixed rate of 4.12% and matures on June 1, 2027. Principal repayments are based on a 30-year amortization schedule. Proceeds from this mortgage was used to repay the existing $9,000,000 mortgage with an interest rate of 6.175%.
On August 28, 2017, the Company obtained a $13,370,000 mortgage loan on six communities from Sun National Bank. This mortgage is at a fixed rate of 4.18% and matures on August 1, 2027. Principal repayments are based on a 30-year amortization schedule. Proceeds from this mortgage was used to repay the existing $10,000,000 mortgage, secured by eleven communities with an interest rate of LIBOR plus 3%, which was fixed at 3.89% with an interest rate swap.
On December 22, 2017, the Company assumed a mortgage loan with a balance of approximately $2,418,000, in conjunction with its acquisition of Wellington Estates. The interest rate on this mortgage is fixed at 6.35%. This mortgage matures on January 1, 2023.
During the year ended December 31, 2016
On January 7, 2016, the Company obtained a $7,200,000 mortgage loan on Woods Edge from OceanFirst Bank. This mortgage is at a fixed rate of 4.3% and matures on January 7, 2026. The interest rate will be reset after five years to the rate the Federal Home Loan Bank of New York charges to its members plus 2.5%.
On May 2, 2016, the Company obtained a $4,760,000 Federal Home Loan Mortgage Corporation (“Freddie Mac”) mortgage through Wells Fargo Bank, N.A. (“Wells Fargo”) on Waterfalls Village with an interest rate that is fixed at 4.38%. The Company also obtained a $3,498,000 Freddie Mac mortgage through Wells Fargo on Valley Hills with an interest rate that is fixed at 4.32%. These mortgages mature on June 1, 2026, with principal repayments based on a 30-year amortization schedule. Proceeds from these mortgages were used to repay existing mortgages on three communities with an average interest rate of 6.66%.
On October 31, 2016, the Company obtained a $16,346,000 Freddie Mac mortgage through Wells Fargo on Fairview Manor. The interest rate on this mortgage is fixed at 3.85%. This mortgage matures November 1, 2026, with principal repayments based on a 30-year amortization schedule. Proceeds from this mortgage were used to repay the existing mortgage with a principal balance of approximately $9,700,000 and an interest rate of 5.785%.
On December 19, 2016, the Company assumed a mortgage loan with a balance of approximately $3,195,000, in conjunction with its acquisition of Springfield Meadows. The interest rate on this mortgage is fixed at 4.83%. This mortgage matures on October 6, 2025.
The aggregate principal payments of all mortgages payable are scheduled as follows:
| Year Ended December 31, | ||||
| 2018 | $ | 6,744,175 | ||
| 2019 | 20,418,685 | |||
| 2020 | 6,552,999 | |||
| 2021 | 21,209,912 | |||
| 2022 | 13,058,727 | |||
| Thereafter | 240,476,288 | |||
| Total | $ | 308,460,786 | ||
| -107- |
NOTE 6 – STOCK COMPENSATION PLAN
On June 13, 2013, the shareholders approved and ratified the Company’s 2013 Stock Option and Stock Award Plan (the “2013 Plan”) authorizing the grant of stock options or restricted stock awards to directors, officers and key employees of options to purchase up to 3,000,000 shares of common stock. The option price shall not be below the fair market value at date of grant. If and to the extent that an award made under the 2013 Plan is forfeited, terminated, expires or is canceled unexercised, the number of shares associated with the forfeited, terminated, expired or canceled portion of the award shall again become available for additional awards under the 2013 Plan. The 2013 Plan replaced the Company’s 2003 Stock Option Plan (the “2003 Plan”), which, pursuant to its terms, terminated in 2013. The outstanding options under the 2003 Stock Option and Award Plan, as amended, remain outstanding until exercised, forfeited or expired. Not more than 200,000 shares of the Company’s common stock may be granted as options in any one fiscal year to a participant under the 2013 Plan. In general, each option may be exercised only after one year of continued service with the Company. The maximum number of shares underlying restricted stock awards that may be granted in any one fiscal year to a participant is 100,000 shares.
The Compensation Committee determines the recipients of restricted stock awards; the number of restricted shares to be awarded; the length of the restricted period of the award; the restrictions applicable to the award including, without limitation, the employment or retirement status of the participant; rules governing forfeiture and restrictions applicable to any sale, assignment, transfer, pledge or other encumbrance of the restricted stock during the restricted period; and the eligibility to share in dividends and other distributions paid to the Company’s stockholders during the restricted period.
Unless otherwise provided for in an underlying restricted stock award agreement, if a participant’s status as an employee or director of the Company is terminated by reason of death or disability, the restrictions will lapse on such date. Unless otherwise provided for in an underlying restricted stock award agreement, the Plan provides that if an individual’s status as an employee or director is terminated by reason of retirement following an involuntary termination (other than for “cause” as defined in the 2013 Plan), the restrictions will generally lapse, unless the restricted stock award is intended to constitute “performance based” compensation for purposes of Section 162(m) of the Internal Revenue Code. If a participant’s status as an employee or director terminates for any other reason, the Plan provides that a participant will generally forfeit any outstanding restricted stock awards, unless otherwise indicated in the applicable award agreement. Shares of restricted stock that are forfeited become available again for issuance under the 2013 Plan. The Compensation Committee has the authority to accelerate the time at which the restrictions may lapse whenever it considers that such action is in the best interests of the Company and of its stockholders, whether by reason of changes in tax laws, a “change in control” as defined in the 2013 Plan or otherwise.
The Company accounts for stock options and restricted stock in accordance with ASC 718-10, Compensation-Stock Compensation. ASC 718-10 requires that compensation cost for all stock awards be calculated and amortized over the service period (generally equal to the vesting period).
Stock Options
During the year ended December 31, 2017, thirty-four employees were granted options to purchase a total of 576,000 shares. During the year ended December 31, 2016, thirty-four employees were granted options to purchase a total of 527,000 shares. During the year ended December 31, 2015, twenty-four employees were granted options to purchase a total of 425,000 shares. The fair value of these options for the years ended December 31, 2017, 2016 and 2015 was approximately $1,042,000, $425,000 and $393,000, respectively, based on assumptions noted below and is being amortized over the 1-year vesting period. The remaining unamortized stock option expense was $191,360 as of December 31, 2017, which will be expensed in 2018.
The Company calculates the fair value of each option grant on the grant date using the Black-Scholes option-pricing model which requires the Company to provide certain inputs, as follows:
| ● | The assumed dividend yield is based on the Company’s expectation of an annual dividend rate for regular dividends over the estimated life of the option. | |
| ● | Expected volatility is based on the historical volatility of the Company’s stock over a period relevant to the related stock option grant. |
| -108- |
| ● | The risk-free interest rate utilized is the interest rate on U.S. Government Bonds and Notes having the same life as the estimated life of the Company’s option awards. | |
| ● | Expected life of the options granted is estimated based on historical data reflecting actual hold periods. | |
| ● | Estimated forfeiture is based on historical data reflecting actual forfeitures. |
The fair value of each option grant is estimated on the date of grant using the Black-Scholes option pricing model with the following weighted average assumptions used for grants in the following years:
| 2017 | 2016 | 2015 | ||||||||||
| Dividend yield | 5.80 | % | 7.32 | % | 7.37 | % | ||||||
| Expected volatility | 26.30 | % | 26.30 | % | 27.17 | % | ||||||
| Risk-free interest rate | 2.37 | % | 1.49 | % | 2.12 | % | ||||||
| Expected lives | 10 | 8 | 8 | |||||||||
| Estimated forfeitures | -0- | -0- | -0- | |||||||||
During the year ended December 31, 2017, options to twenty seven employees to purchase a total of 547,900 shares were exercised. During the year ended December 31, 2016, options to twenty employees to purchase a total of 277,500 shares were exercised. During the year ended December 31, 2015, options to five employees to purchase a total of 22,500 shares were exercised. During the year ended December 31, 2017, options to one employee to purchase a total of 10,000 shares were forfeited. During the year ended December 31, 2016, options to one employee to purchase a total of 50,000 shares expired. During the year ended December 31, 2015, options to sixteen employees to purchase a total of 143,000 shares expired or were forfeited.
A summary of the status of the Company’s stock option plans as of December 31, 2017, 2016 and 2015 and changes during the years then ended are as follows:
| 2017 | 2016 | 2015 | ||||||||||||||||||||||
| Weighted- | Weighted- | Weighted- | ||||||||||||||||||||||
| Average | Average | Average | ||||||||||||||||||||||
| Exercise | Exercise | Exercise | ||||||||||||||||||||||
| Shares | Price | Shares | Price | Shares | Price | |||||||||||||||||||
| Outstanding at beginning of year | 1,760,000 | $ | 9.97 | 1,560,500 | $ | 9.92 | 1,301,000 | $ | 10.34 | |||||||||||||||
| Granted | 576,000 | 14.96 | 527,000 | 9.77 | 425,000 | 9.82 | ||||||||||||||||||
| Exercised | (547,900 | ) | 9.92 | (277,500 | ) | 8.96 | (22,500 | ) | 7.56 | |||||||||||||||
| Forfeited | (10,000 | ) | 9.77 | -0- | -0- | (37,000 | ) | 10.63 | ||||||||||||||||
| Expired | -0- | -0- | (50,000 | ) | 11.97 | (106,000 | ) | 14.84 | ||||||||||||||||
| Outstanding at end of year | 1,778,100 | 11.60 | 1,760,000 | 9.97 | 1,560,500 | 9.92 | ||||||||||||||||||
| Options exercisable at end of year | 1,202,100 | 1,233,000 | 1,135,500 | |||||||||||||||||||||
| Weighted average fair value of options granted during the year | $ | 1.81 | $ | 0.81 | $ | 0.93 | ||||||||||||||||||
| -109- |
The following is a summary of stock options outstanding as of December 31, 2017:
Date of Grant | Number of Employees | Number
of Shares |
Option Price | Expiration Date | ||||||||||
| 07/27/10 | 4 | 34,000 | 11.40 | 07/27/18 | ||||||||||
| 07/05/11 | 4 | 34,000 | 11.16 | 07/05/19 | ||||||||||
| 08/29/12 | 6 | 44,000 | 11.29 | 08/29/20 | ||||||||||
| 06/26/13 | 10 | 232,100 | 10.08 | 06/26/21 | ||||||||||
| 06/11/14 | 11 | 175,000 | 9.85 | 06/11/22 | ||||||||||
| 06/24/15 | 12 | 303,000 | 9.82 | 06/24/23 | ||||||||||
| 04/05/16 | 21 | 380,000 | 9.77 | 04/05/24 | ||||||||||
| 01/19/17 | 2 | 60,000 | * | 14.25 | 01/19/27 | |||||||||
| 04/04/17 | 34 | 516,000 | * | 15.04 | 04/04/27 | |||||||||
| 1,778,100 | ||||||||||||||
* Unexercisable
The aggregate intrinsic value is calculated as the difference between the exercise price of the underlying awards and the quoted price of the Company’s common stock for the options that were in-the-money. The aggregate intrinsic value of options outstanding as of December 31, 2017, 2016 and 2015 was $5,935,112, $8,939,488 and $669,098, respectively, of which $5,896,112, $6,156,928 and $541,598 relate to options exercisable. The intrinsic value of options exercised in 2017, 2016 and 2015 was $3,030,119, $1,018,730 and $62,230, respectively, determined as of the date of option exercise. The weighted average remaining contractual term of the above options was 6.8, 5.6 and 5.4 years as of December 31, 2017, 2016 and 2015, respectively. For the years ended December 31, 2017, 2016 and 2015, amounts charged to stock compensation expense relating to stock option grants, which is included in General and Administrative Expenses, totaled $928,977, $463,864 and $365,560, respectively.
Restricted Stock
On April 4, 2017, the Company awarded 45,000 shares of restricted stock to two participants. On September 27, 2017, the Company awarded 11,000 shares of restricted stock to ten participants. On April 5, 2016, the Company awarded 40,500 shares of restricted stock to two participants. On September 14, 2016, the Company awarded 20,000 shares of restricted stock to one participant. On February 5, 2015, the Company awarded 25,000 shares of restricted stock to one participant. On September 16, 2015, the Company awarded 10,000 shares to ten participants. The grant date fair value of restricted stock grants awarded to participants was $845,870, $627,085 and $334,450 for the years ended December 31, 2017, 2016 and 2015, respectively. These grants vest in equal installments over five years. As of December 31, 2017, there remained a total of $1,147,859 of unrecognized restricted stock compensation related to outstanding non-vested restricted stock grants awarded and outstanding at that date. Restricted stock compensation is expected to be expensed over a remaining weighted average period of 3.7 years. For the years ended December 31, 2017, 2016 and 2015, amounts charged to stock compensation expense related to restricted stock grants, which is included in General and Administrative Expenses, totaled $385,514, $600,814 and $490,208, respectively.
| -110- |
A summary of the status of the Company’s non-vested restricted stock awards as of December 31, 2017, 2016 and 2015, and changes during the year ended December 31, 2017, 2016 and 2015 are presented below:
| 2017 | 2016 | 2015 | ||||||||||||||||||||||
| Weighted- | Weighted- | Weighted- | ||||||||||||||||||||||
| Average | Average | Average | ||||||||||||||||||||||
| Grant Date | Grant Date | Grant Date | ||||||||||||||||||||||
| Shares | Fair Value | Shares | Fair Value | Shares | Fair Value | |||||||||||||||||||
| Non-vested at beginning of year | 133,315 | $ | 10.04 | 121,242 | $ | 9.83 | 137,346 | $ | 10.37 | |||||||||||||||
| Granted | 56,000 | 15.10 | 60,500 | 10.37 | 35,000 | 9.56 | ||||||||||||||||||
| Dividend Reinvested Shares | 6,867 | 14.83 | 8,430 | 10.82 | 10,736 | 9.09 | ||||||||||||||||||
| Forfeited | -0- | -0- | (2,160 | ) | 9.83 | -0- | -0- | |||||||||||||||||
| Vested | (49,229 | ) | 10.67 | (54,697 | ) | 10.07 | (61,840 | ) | 9.63 | |||||||||||||||
| Non-vested at end of year | 146,953 | $ | 11.98 | 133,315 | $ | 10.04 | 121,242 | $ | 9.83 | |||||||||||||||
As of December 31, 2017, there were 613,500 shares available for grant as stock options or restricted stock under the 2013 Plan.
NOTE 7 – 401(k) PLAN
All full-time employees who are over 21 years old are eligible for the Company’s 401(k) Plan (“Plan”). Under this Plan, an employee may elect to defer his/her compensation, subject to certain maximum amounts, and have it contributed to the Plan. Employer contributions to the Plan are at the discretion of the Company. During 2017, 2016 and 2015, the Company made matching contributions to the Plan of up to 100% of the first 3% of employee salary and 50% of the next 2% of employee salary. The total expense relating to the Plan, including matching contributions amounted to $330,020, $245,057 and $167,971 in 2017, 2016 and 2015, respectively.
NOTE 8 – RELATED PARTY TRANSACTIONS AND OTHER MATTERS
Transactions with Monmouth Real Estate Investment Corporation
There are five Directors of the Company who are also Directors and shareholders of Monmouth Real Estate Investment Corporation (“MREIC”). The Company holds common stock of MREIC in its securities portfolio. As of December 31, 2017, the Company owns a total of 2,335,930 shares of MREIC common stock, representing 3.0% of the total shares outstanding at December 31, 2017 (See Note 4). The Company shares 1 officer (Chairman of the Board) with MREIC.
Employment Agreements and Compensation
The Company has three year employment agreements with Mr. Eugene W. Landy, Mr. Samuel A. Landy and Ms. Anna T. Chew. The agreements provide for base compensation aggregating approximating $1 million. In addition, the agreements call for incentive bonuses, and an extension of services and severance payments upon certain future events, such as a change in control. Mr. Samuel A. Landy and Ms. Anna T. Chew are currently negotiating a new employment agreement.
Other Matters
Mr. Eugene W. Landy, the Founder and Chairman of the Board of the Company, owns a 24% interest in the entity that is the landlord of the property where the Company’s corporate office space is located. The Company is also responsible for its proportionate share of real estate taxes and common area maintenance. On May 1, 2015, the Company renewed this lease for additional space and an additional seven-year term with monthly lease payments of $14,900 through April 30, 2020 and $15,300 through April 30, 2022. On July 1, 2017, the Company entered into a lease for additional office space adjacent to its existing corporate office space requiring monthly lease payments of $1,275 through April 30, 2020 and $1,310 through April 30, 2022. On February 14, 2018, the Company entered into a lease for additional office space adjacent to its existing corporate office space requiring monthly lease payments of $1,800 through April 30, 2020 and $1,850 through April 30, 2022. Management believes that the aforesaid rents are no more than what the Company would pay for comparable space elsewhere.
| -111- |
NOTE 9 – SHAREHOLDERS’ EQUITY
Common Stock
The Company has a Dividend Reinvestment and Stock Purchase Plan (“DRIP”), as amended. Under the terms of the DRIP, shareholders who participate may reinvest all or part of their dividends in additional shares of the Company at a discounted price (approximately 95% of market value) directly from the Company, from authorized but unissued shares of the Company common stock. Shareholders may also purchase additional shares at this discounted price by making optional cash payments monthly. Optional cash payments must be not less than $500 per payment nor more than $1,000 unless a request for waiver has been accepted by the Company.
Amounts received in connection with the DRIP for the years ended December 31, 2017, 2016 and 2015 were as follows:
| 2017 | 2016 | 2015 | ||||||||||
| Amounts Received | $ | 60,365,190 | $ | 22,400,945 | $ | 24,599,818 | ||||||
| Less: Dividends Reinvested | (2,859,174 | ) | (2,388,552 | ) | (2,006,287 | ) | ||||||
| Amounts Received, net | $ | 57,506,016 | $ | 20,012,393 | $ | 22,593,531 | ||||||
| Number of Shares Issued | 4,095,357 | 1,966,133 | 2,657,255 | |||||||||
On June 5, 2017, the Company issued and sold 1,400,000 shares of its Common Stock in a registered direct placement at a sale price of $16.60 per share. The Company received net proceeds from the offering after expenses of approximately $22.5 million and used the net proceeds for general corporate purposes, which included purchase of manufactured homes for sale or lease to customers, expansion of its existing communities, acquisitions of additional properties and repayment of indebtedness on a short-term basis.
Preferred Stock
8.25% Series A Cumulative Redeemable Preferred Stock
On August 31, 2017, the Company redeemed all 3,663,800 issued and outstanding shares of its 8.25% Series A Cumulative Redeemable Preferred Stock, Liquidation Preference $25.00 per share (“Series A Preferred Stock”) at a redemption price of $25.00 per share, totaling $91,595,000. Unpaid dividends on the Series A Preferred Stock accruing for the period from June 1, 2017 through the redemption date, totaling $1,889,147 (or $0.515625 per share) were paid on September 15, 2017 to holders of record as of the August 15, 2017 record date previously established by the Company’s Board of Directors and accordingly such dividends were not included in the redemption price. The Company recognized a deemed dividend of $3,502,000 on the Consolidated Statement of Income for the year ended December 31, 2017, which represents the difference between the redemption value and the carrying value net of original deferred issuance costs.
8.0% Series B Cumulative Redeemable Preferred Stock
On October 20, 2015, the Company issued and sold 1,801,200 shares of its 8.0% Series B Cumulative Redeemable Preferred Stock (“Series B Preferred Stock”) in a registered direct placement at a sale price of $25.00 per share. The Company received net proceeds from the offering of approximately $43 million, after deducting offering related expenses. Dividends on the Series B Preferred Stock are cumulative from October 20, 2015 at an annual rate of $2.00 per share and will be payable quarterly in arrears at March 15, June 15, September 15, and December 15. The first quarterly dividend payment date for the Series B Preferred Stock was payable March 15, 2016 and was for the dividend period from October 20, 2015 to February 29, 2016. A portion of the dividend to be paid on March 15, 2016, covering the period October 20, 2015 to December 31, 2016, amounting to $710,610 is included in the computation of net loss attributable to common shareholders in the accompanying consolidated financial statements for the year ended December 31, 2016.
| -112- |
The Series B Preferred Stock, par value $0.10, has no maturity and will remain outstanding indefinitely unless redeemed or otherwise repurchased. Except in limited circumstances relating to the Company’s qualification as a REIT, and as described below, the Series B Preferred Stock is not redeemable prior to October 20, 2020. On and after October 20, 2020, the Series B Preferred Stock will be redeemable at the Company’s option for cash, in whole or, from time to time, in part, at a price per share equal to $25.00, plus all accrued and unpaid dividends (whether or not declared) to the date of redemption.
Upon the occurrence of a Delisting Event or Change of Control, as defined in the Prospectus of the Preferred Offering, each holder of the Series B Preferred Stock will have the right to convert all or part of the shares of the Series B Preferred Stock held, unless the Company elects to redeem the Series B Preferred Stock.
Holders of the Series B Preferred Stock generally have no voting rights, except if the Company fails to pay dividends for six or more quarterly periods, whether or not consecutive, or with respect to certain specified events.
In conjunction with the issuance of the Company’s Series B Preferred Stock, the Company filed with the Maryland State Department of Assessments and Taxation (the “Maryland SDAT”), an amendment to the Company’s charter to increase the authorized number of shares of the Company’s common stock by 22,000,000 shares. As a result of this amendment, the Company’s total authorized shares were increased from 48,663,800 shares (classified as 42,000,000 shares of common stock, 3,663,800 shares of 8.25% Series A Cumulative Redeemable Preferred Stock and 3,000,000 shares of excess stock) to 70,663,800 shares (classified as 64,000,000 shares of common stock, 3,663,800 shares of 8.25% Series A Cumulative Redeemable Preferred Stock and 3,000,000 shares of excess stock). Immediately following this amendment, the Company filed with the Maryland SDAT Articles Supplementary setting forth the rights, preferences and terms of the Series B Preferred Stock and reclassifying 2,000,000 shares of Common Stock as shares of Series B Preferred Stock. After the reclassification, the Company’s authorized stock consisted of 62,000,000 shares of common stock, 3,663,800 shares of 8.25% Series A Cumulative Redeemable Preferred Stock, 2,000,000 shares of 8% Series B Cumulative Redeemable Preferred Stock and 3,000,000 shares of excess stock.
On April 5, 2016, the Company issued an additional 2,000,000 shares of its Series B Preferred Stock in a registered direct placement at a sale price of $25.50 per share, including accrued dividends. The Company received net proceeds from the offering after expenses of approximately $49.1 million and used the net proceeds for general corporate purposes, which included purchase of manufactured homes for sale or lease to customers, expansion of its existing communities, acquisitions of additional properties and repayment of indebtedness on a short-term basis.
In conjunction with the issuance of the Company’s Series B Preferred Stock, on April 4, 2016, the Company filed with the Maryland SDAT an amendment to the Company’s charter to increase the authorized number of shares of the Company’s common stock by 11,000,000 shares. As a result of this amendment, the Company’s total authorized shares were increased from 70,663,800 shares (classified as 62,000,000 shares of common stock, 3,663,800 shares of Series A Preferred stock, 2,000,000 shares of Series B Preferred stock and 3,000,000 shares of excess stock) to 81,663,800 shares (classified as 73,000,000 shares of common stock, 3,663,800 shares of Series A Preferred stock, 2,000,000 shares of Series B Preferred stock and 3,000,000 shares of excess stock). Immediately following this amendment, the Company filed with the Maryland SDAT Articles Supplementary reclassifying 2,000,000 shares of Common Stock as shares of Series B Preferred stock. After the reclassification, the Company’s authorized stock consisted of 71,000,000 shares of common stock, 3,663,800 shares of Series A Preferred stock, 4,000,000 shares of Series B Preferred stock and 3,000,000 shares of excess stock.
On August 11, 2016, the Company filed with the Maryland SDAT a further amendment to the Company’s charter to increase the authorized number of shares of the Company’s common stock by 4,000,000 shares. As a result of this amendment, the Company’s total authorized shares were increased from 81,663,800 shares (classified as 71,000,000 shares of common stock, 3,663,800 shares of Series A Preferred stock, 4,000,000 shares of Series B Preferred stock and 3,000,000 shares of excess stock) to 85,663,800 shares (classified as 75,000,000 shares of common stock, 3,663,800 shares of Series A Preferred stock, 4,000,000 shares of Series B Preferred stock and 3,000,000 shares of excess stock). Additionally, on June 2, 2017, the Company filed with the Maryland SDAT a further amendment to the Company’s charter to increase the authorized number of shares of the Company’s common stock by 10,000,000 shares
| -113- |
6.75% Series C Cumulative Redeemable Preferred Stock
On July 26, 2017, the Company issued 5,000,000 shares of its new 6.75% Series C Cumulative Redeemable Preferred Stock, Liquidation Preference $25.00 per share (“Series C Preferred Stock”) at an offering price of $25.00 per share in an underwritten registered public offering. The Company received net proceeds from the sale of these 5,000,000 shares, after deducting the underwriting discount and other estimated offering expenses, of approximately $120,800,000. On August 2, 2017, the Company issued an additional 750,000 shares of Series C Preferred Stock pursuant to the underwriters’ exercise of their overallotment option and received additional net proceeds of approximately $18,200,000.
The Company used a portion of the net proceeds from the sale of Series C Preferred Stock to redeem all of the 3,663,800 outstanding shares of our Series A Preferred Stock. The balance of the offering proceeds will be used for general corporate purposes, which may include purchase of manufactured homes for sale or lease to customers, expansion of our existing communities, potential acquisitions of additional properties and possible repayment of indebtedness on a short-term basis.
Dividends on the Series C Preferred shares are cumulative from July 26, 2017 at an annual rate of $1.6875 per share and will be payable quarterly in arrears on March 15, June 15, September 15, and December 15. The first quarterly dividend on the Series C Preferred was payable September 15, 2017 and amounted to $970,312 or $0.16875 per share for the dividend period from July 26, 2017 to August 31, 2017.
The Series C Preferred Stock, par value $0.10 per share, has no maturity and will remain outstanding indefinitely unless redeemed or otherwise repurchased. Except in limited circumstances relating to the Company’s qualification as a REIT, and as described below, the Series C Preferred Stock is not redeemable prior to July 26, 2022. On and after July 26, 2022, the Series C Preferred Stock will be redeemable at the Company’s option for cash, in whole or, from time to time, in part, at a price per share equal to $25.00, plus all accrued and unpaid dividends (whether or not declared) to the date of redemption. The Series C Preferred Stock ranks on a parity with the Company’s Series B Preferred Stock with respect to dividend rights and rights upon liquidation, dissolution or winding up.
Upon the occurrence of a Delisting Event or Change of Control, each as defined in the Prospectus pursuant to which the shares of Series C Preferred Stock were offered, each holder of the Series C Preferred Stock will have the right to convert all or part of the shares of the Series C Preferred Stock held into common stock of the Company, unless the Company elects to redeem the Series C Preferred Stock.
Holders of the Series C Preferred Stock generally have no voting rights, except if the Company fails to pay dividends for nine or more quarterly periods, whether or not consecutive, or with respect to certain specified events.
In conjunction with the issuance of the Company’s Series C Preferred, the Company filed with the Maryland SDAT, an amendment to the Company’s charter to increase the authorized number of shares of the Company’s common stock by 30,750,000 shares. As a result of this amendment, the Company’s total authorized shares were increased from 95,663,800 shares (classified as 85,000,000 shares of Common Stock, 3,663,800 shares of Series A Preferred, 4,000,000 shares of Series B Preferred and 3,000,000 shares of excess stock) to 126,413,800 shares (classified as 115,750,000 shares of Common Stock, 3,663,800 shares of Series A Preferred, 4,000,000 shares of Series B Preferred and 3,000,000 shares of excess stock). Immediately following this amendment, the Company filed with the Maryland SDAT Articles Supplementary setting forth the rights, preferences and terms of the Series C Preferred and reclassifying 5,750,000 shares of Common Stock as shares of Series C Preferred. After the reclassification, the Company’s authorized stock consisted of 110,000,000 shares of Common Stock, 3,663,800 shares of Series A Preferred, 4,000,000 shares of Series B Preferred, 5,750,000 shares of Series C Preferred and 3,000,000 shares of excess stock. Additionally, upon the redemption on August 31, 2017 of all 3,663,800 outstanding shares of the Series A Preferred, the authorized shares of Series A Preferred automatically converted to authorized Common Stock, which increased our authorized Common Stock to 113,663,800 shares.
Issuer Purchases of Equity Securities
On January 25, 2018, the Board of Directors reaffirmed its Share Repurchase Program (the “Repurchase Program”) that authorizes the Company to purchase up to $10,000,000 in the aggregate of the Company’s common stock. The Repurchase Program was originally created in June 2008 and is intended to be implemented through purchases made from time to time using a variety of methods, which may include open market purchases, privately negotiated transactions or block trades, or by any combination of such methods, in accordance with applicable insider trading and other securities laws and regulations. The size, scope and timing of any purchases will be based on business, market and other conditions and factors, including price, regulatory and contractual requirements or consents, and capital availability. The Repurchase Program does not require the Company to acquire any particular amount of common stock, and the Repurchase Program may be suspended, modified or discontinued at any time at the Company’s discretion without prior notice. There have been no purchases under the Repurchase Program to date.
| -114- |
NOTE 10 – DISTRIBUTIONS
Common Stock
The following cash distributions, including dividends reinvested, were paid to common shareholders during the three years ended December 31, 2017, 2016 and 2015:
| 2017 | 2016 | 2015 | ||||||||||||||||||||||
| Quarter Ended | Amount | Per Share | Amount | Per Share | Amount | Per Share | ||||||||||||||||||
| March 31 | $ | 5,416,827 | $ | 0.18 | $ | 4,879,009 | $ | 0.18 | $ | 4,481,730 | $ | 0.18 | ||||||||||||
| June 30 | 5,700,036 | 0.18 | 4,903,286 | 0.18 | 4,633,318 | 0.18 | ||||||||||||||||||
| September 30 | 6,188,961 | 0.18 | 5,031,818 | 0.18 | 4,767,312 | 0.18 | ||||||||||||||||||
| December 31 | 6,333,573 | 0.18 | 5,204,709 | 0.18 | 4,864,760 | 0.18 | ||||||||||||||||||
| $ | 23,639,397 | $ | 0.72 | $ | 20,018,822 | $ | 0.72 | $ | 18,747,120 | $ | 0.72 | |||||||||||||
These amounts do not include the discount on shares purchased through the Company’s DRIP.
On January 25, 2018, the Company declared a cash dividend of $0.18 per share to be paid on March 15, 2018 to shareholders of record as of the close of business on February 15, 2018.
Preferred Stock
The following dividends were paid to holders of our Series A Preferred Stock during the year ended December 31, 2017, 2016 and 2015:
| Declaration Date | Record Date | Payment Date | Dividend | Dividend per Share | ||||||||
| 1/19/2017 | 2/15/2017 | 3/15/2017 | $ | 1,889,147 | $ | 0.515625 | ||||||
| 4/3/2017 | 5/15/2017 | 6/15/2017 | 1,889,147 | 0.515625 | ||||||||
| 7/3/2017 | 8/15/2017 | 9/15/2017 | 1,889,147 | 0.515625 | ||||||||
| $ | 5,667,441 | $ | 1.546875 | |||||||||
| 1/15/2016 | 2/16/2016 | 3/15/2016 | $ | 1,889,147 | $ | 0.515625 | ||||||
| 4/4/2016 | 5/16/2016 | 6/15/2016 | 1,889,147 | 0.515625 | ||||||||
| 7/1/2016 | 8/15/2016 | 9/15/2016 | 1,889,147 | 0.515625 | ||||||||
| 10/3/2016 | 11/17/2016 | 12/15/2016 | 1,889,147 | 0.515625 | ||||||||
| $ | 7,556,588 | $ | 2.0625 |
| -115- |
| Declaration Date | Record Date | Payment Date | Dividend | Dividend per Share | ||||||||
| 1/15/2015 | 2/17/2015 | 3/16/2015 | $ | 1,889,147 | $ | 0.515625 | ||||||
| 4/1/2015 | 5/15/2015 | 6/16/2015 | 1,889,147 | 0.515625 | ||||||||
| 7/1/2015 | 8/15/2015 | 9/15/2015 | 1,889,147 | 0.515625 | ||||||||
| 10/1/2015 | 11/17/2015 | 12/15/2015 | 1,889,147 | 0.515625 | ||||||||
| $ | 7,556,588 | $ | 2.0625 | |||||||||
The following dividends were paid to holders of our Series B Preferred Stock during the year ended December 31, 2017 and 2016:
| Declaration Date | Record Date | Payment Date | Dividend | Dividend per Share | ||||||||
| 1/19/2017 | 2/15/2017 | 3/15/2017 | $ | 1,900,600 | $ | 0.50 | ||||||
| 4/3/2017 | 5/15/2017 | 6/15/2017 | 1,900,600 | 0.50 | ||||||||
| 7/3/2017 | 8/15/2017 | 9/15/2017 | 1,900,600 | 0.50 | ||||||||
| 10/2/2017 | 11/15/2017 | 12/15/2017 | 1,900,600 | 0.50 | ||||||||
| $ | 7,602,400 | $ | 2.00 | |||||||||
| 1/15/2016 | 2/16/2016 | 3/15/2016 | $ | 1,305,257 | $ | 0.72466 | ||||||
| 4/4/2016 | 5/16/2016 | 6/15/2016 | 1,900,600 | 0.50 | ||||||||
| 7/1/2016 | 8/15/2016 | 9/15/2016 | 1,900,600 | 0.50 | ||||||||
| 10/3/2016 | 11/17/2016 | 12/15/2016 | 1,900,600 | 0.50 | ||||||||
| $ | 7,007,057 | $ | 2.22466 | |||||||||
On January 25, 2018, the Board of Directors declared a quarterly dividend of $0.50 per share for the period from December 1, 2017 through February 28, 2018, on the Company’s Series B Preferred Stock payable March 15, 2018 to shareholders of record as of the close of business on February 15, 2018.
The following dividends were paid to holders of our Series C Preferred Stock during the year ended December 31, 2017:
| Declaration Date | Record Date | Payment Date | Dividend | Dividend per Share | ||||||||
| 7/3/2017 | 8/15/2017 | 9/15/2017 | $ | 970,313 | $ | 0.168750 | ||||||
| 10/2/2017 | 11/15/2017 | 12/15/2017 | 2,425,781 | 0.421875 | ||||||||
| $ | 3,396,094 | $ | 0.590625 | |||||||||
On January 25, 2018, the Board of Directors declared a quarterly dividend of $0.421875 per share for the period from December 1, 2017 through February 28, 2018, on the Company’s Series C Preferred Stock payable March 15, 2018 to shareholders of record as of the close of business on February 15, 2018.
| -116- |
NOTE 11 – FEDERAL INCOME TAXES
Characterization of Distributions
The following table characterizes the distributions paid per common share for the years ended December 31, 2017, 2016 and 2015:
| 2017 | 2016 | 2015 | ||||||||||||||||||||||
| Amount | Percent | Amount | Percent | Amount | Percent | |||||||||||||||||||
| Ordinary income | $ | 0.00000 | 0.00 | % | $ | 0.09549 | 13.26 | % | $ | 0.00000 | 0.00 | % | ||||||||||||
| Capital gains | 0.00000 | 0.00 | % | 0.01425 | 1.98 | % | 0.00000 | 0.00 | % | |||||||||||||||
| Return of capital | 0.72000 | 100.00 | % | 0.61026 | 84.76 | % | 0.72000 | 100.00 | % | |||||||||||||||
| $ | 0.72 | 100 | % | $ | 0.72 | 100 | % | $ | 0.72 | 100 | % | |||||||||||||
For the year ended December 31, 2017, total distributions paid by the Company for its Series A Preferred Stock, amounted to $5,667,441 or $1.546875 per share (for income tax purposes, $0.494148 characterized as ordinary income, $0.138204 characterized as capital gains and $0.914523 characterized as return or capital). For the year ended December 31, 2016, total distributions paid by the Company for its Series A Preferred Stock, amounted to $7,556,588 or $2.0625 per share (for income tax purposes, $1.79472 characterized as ordinary income and $0.26778 characterized as capital gains). For the year ended December 31, 2015, total distributions paid by the Company for preferred stock, amounted to $7,556,588 or $2.0625 per share (for income tax purposes, $1.36264 characterized as ordinary income, $0.03439 characterized as capital gains and $0.66547 characterized as a return of capital).
For the year ended December 31, 2017, total distributions paid by the Company for its Series B preferred stock, amounted to $7,602,400 or $2.00 per share (for income tax purposes, $0.638896 characterized as ordinary income, $0.178688 characterized as capital gains and $1.182416 characterized as return or capital). For the year ended December 31, 2016, total distributions paid by the Company for its Series B preferred stock, amounted to $7,007,057 or $2.22466 per share (for income tax purposes, $1.93582 characterized as ordinary income and $0.28884 characterized as capital gains).
For the year ended December 31, 2017, total distributions paid by the Company for its Series C preferred stock, amounted to $3,396,094 or $0.590625 per share (for income tax purposes, $0.188674 characterized as ordinary income, $0.052769 characterized as capital gains and $0.349182 characterized as return or capital).
In addition to the above, taxable income from non-REIT activities conducted by S&F, a Taxable REIT Subsidiary (“TRS”), is subject to federal, state and local income taxes. Deferred income taxes pertaining to S&F are accounted for using the asset and liability method. Under this method, deferred income taxes are recognized for temporary differences between the financial reporting bases of assets and liabilities and their respective tax bases and for operating loss and tax credit carryforwards based on enacted tax rates expected to be in effect when such amounts are realized or settled. However, deferred tax assets are recognized only to the extent that it is more likely than not that they will be realized based on consideration of available evidence, including tax planning strategies and other factors. For the years ended December 31, 2017, 2016 and 2015, S&F had operating losses for financial reporting purposes of $2,066,587, $2,307,104 and $3,550,961, respectively. Therefore, a valuation allowance has been established against any deferred tax assets relating to S&F. For the years ended December 31, 2017, 2016 and 2015, S&F recorded $0, $5,000 and $15,000, respectively, in federal, state and franchise taxes.
NOTE 12 – COMMITMENTS, CONTINGENCIES AND LEGAL MATTERS
The Company is subject to claims and litigation in the ordinary course of business. Management does not believe that any such claim or litigation will have a material adverse effect on the business, assets, or results of operations of the Company.
Included in the Company’s Community Operating Expenses for the year ended December 31, 2016 is $125,000 for the settlement of the Memphis Mobile City lawsuit. The Company is redeveloping this community and has completed Phase I in 2017. Once fully developed, the community will contain a total of 144 developed homesites.
| -117- |
In November 2013, the Company entered into an agreement with 21st Mortgage under which 21st Mortgage can provide financing for home purchasers in the Company’s communities. The Company does not receive referral fees or other cash compensation under the agreement. If 21st Mortgage makes loans to purchasers and those purchasers default on their loans and 21st Mortgage repossesses the homes securing such loans, the Company has agreed to purchase from 21st Mortgage each such repossessed home for a price equal to 80% to 95% of the amount under each such loan, subject to certain adjustments. This agreement may be terminated by either party with 30 days written notice. As of December 31, 2017, the total loan balance was approximately $3 million. Additionally, 21st Mortgage previously made loans to purchasers in certain communities we acquired. In conjunction with these acquisitions, the Company has agreed to purchase from 21st Mortgage each repossessed home, if those purchasers default on their loans. The purchase price ranges from 55% to 100% of the amount under each such loan, subject to certain adjustments. As of December 31, 2017, the total loan balance was approximately $3.6 million. Although this agreement is still active, this program is not being utilized by the Company’s new customers as a source of financing.
S&F entered into a Chattel Loan Origination, Sale and Servicing Agreement (“COP Program”) with Triad Financial Services, effective January 1, 2016. Neither the Company, nor S&F, receive referral fees or other cash compensation under the agreement. Customer loan applications are initially submitted to Triad for consideration by Triad’s portfolio of outside lenders. If a loan application does not meet the criteria for outside financing, the application is then considered for financing under the COP Program. If the loan is approved under the COP Program, then it is originated by Triad, assigned to S&F and then assigned by S&F to the Company. Included in Notes and Other Receivables is approximately $8,437,000 of loans that the Company acquired under the COP Program as of December 31, 2017.
NOTE 13 - FAIR VALUE MEASUREMENTS
The Company follows ASC 825, Fair Value Measurements, for financial assets and liabilities recognized at fair value on a recurring basis. The Company measures certain financial assets and liabilities at fair value on a recurring basis, including securities available for sale. The fair value of these certain financial assets and liabilities was determined using the following inputs at December 31, 2017 and 2016:
| Fair Value Measurements at Reporting Date Using | ||||||||||||||||
| Total | Quoted Prices in Active Markets for Identical Assets (Level 1) | Significant Other Observable Inputs (Level 2) | Significant Unobservable Inputs (Level 3) | |||||||||||||
| December 31, 2017: | ||||||||||||||||
| Equity Securities - Preferred Stock | $ | 5,377,522 | $ | 5,377,522 | $ | -0- | $ | -0- | ||||||||
| Equity Securities - Common Stock | 127,586,754 | 127,586,754 | -0- | -0- | ||||||||||||
| Interest Rate Swap (1) | -0- | -0- | -0- | -0- | ||||||||||||
| Total | $ | 132,964,276 | $ | 132,964,276 | $ | -0- | $ | -0- | ||||||||
| December 31, 2016: | ||||||||||||||||
| Equity Securities - Preferred Stock | $ | 13,028,200 | $ | 13,028,200 | $ | -0- | $ | -0- | ||||||||
| Equity Securities - Common Stock | 95,726,972 | 95,726,972 | -0- | -0- | ||||||||||||
| Interest Rate Swap (1) | (3,983 | ) | -0- | (3,983 | ) | -0- | ||||||||||
| Total | $ | 108,751,189 | $ | 108,755,172 | $ | (3,983 | ) | $ | -0- | |||||||
| (1) | Included in accrued liabilities and deposits |
In addition to the Company’s investment in Securities Available for Sale at Fair Value, the Company is required to disclose certain information about fair values of its other financial instruments, as defined in ASC 825-10, Financial Instruments. Estimates of fair value are made at a specific point in time, based upon, where available, relevant market prices and information about the financial instrument. Such estimates do not include any premium or discount that could result from offering for sale at one time the Company’s entire holdings of a particular financial instrument. All of the Company’s securities available for sale have quoted market prices. However, for a portion of the Company’s other financial instruments, no quoted market value exists. Therefore, estimates of fair value are necessarily based on a number of significant assumptions (many of which involve events outside the control of management). Such assumptions include assessments of current economic conditions, perceived risks associated with these financial instruments and their counterparties, future expected loss experience and other factors. Given the uncertainties surrounding these assumptions, the reported fair values represent estimates only and, therefore, cannot be compared to the historical accounting model. Use of different assumptions or methodologies is likely to result in significantly different fair value estimates.
| -118- |
The fair value of cash and cash equivalents and notes receivables approximates their current carrying amounts since all such items are short-term in nature. The fair value of securities available for sale is primarily based upon quoted market values. The fair value of variable rate mortgages payable and loans payable approximate their current carrying amounts since such amounts payable are at approximately a weighted average current market rate of interest. The estimated fair value of fixed rate mortgage notes payable is based on discounting the future cash flows at a year-end risk adjusted borrowing rate currently available to the Company for issuance of debt with similar terms and remaining maturities. These fair value measurements fall within level 2 of the fair value hierarchy. As of December 31, 2017, the fair and carrying value of fixed rate mortgages payable amounted to $303,741,677 and $308,444,180, respectively. As of December 31, 2016, the fair and carrying value of fixed rate mortgages payable amounted to $282,369,069 and $285,584,102, respectively. Prior to 2017, if the Company acquired a property that was considered an acquisition of a business, the Company was required to fair value all of the acquired assets and liabilities, including intangible assets and liabilities (See Note 1). Those fair value measurements fell within level 3 of the fair value hierarchy.
NOTE 14 – SUPPLEMENTAL CASH FLOW INFORMATION
Cash paid for interest during the years ended December 31, 2017, 2016 and 2015 was $15,656,251, $15,058,016 and $12,497,858, respectively.
During the years ended December 31, 2017 and 2016, the Company assumed mortgages totaling $2,418,198 and $3,195,202, respectively for the acquisition of communities.
During the years ended December 31, 2017, 2016 and 2015, land development costs of $7,832,450, $170,925 and $60,857, respectively were transferred to investment property and equipment and placed in service.
During the years ended December 31, 2017, 2016 and 2015, the Company had dividend reinvestments of $2,859,174, $2,388,552 and $2,006,287, respectively which required no cash transfers.
NOTE 15 – SUBSEQUENT EVENTS
On January 22, 2018, the Company issued 2,000,000 shares of its new 6.375% Series D Cumulative Redeemable Preferred Stock (“Series D Preferred Stock”) at an offering price of $25.00 per share in an underwritten registered public offering. The Company received net proceeds from the sale of these 2,000,000 shares, after deducting the underwriting discount and other estimated offering expenses, of approximately $48.1 million and plans to use the net proceeds of the offering for general corporate purposes, which may include the purchase of manufactured homes for sale or lease to customers, expansion of its existing communities, potential acquisitions of additional properties and possible repayment of indebtedness on a short-term basis.
In conjunction with the issuance of the Company’s Series D Preferred Stock, the Company filed with the Maryland SDAT Articles Supplementary setting forth the rights, preferences and terms of the Series D Preferred Stock and reclassifying 2,300,000 shares of Common Stock as shares of Series D Preferred Stock. After the reclassification, the Company’s authorized stock consists of 111,363,800 shares of Common Stock, 4,000,000 shares of Series B Preferred Stock, 5,750,000 shares of Series C Preferred Stock, 2,300,000 shares of Series D Preferred Stock and 3,000,000 shares of excess stock.
| -119- |
NOTE 16 – PRO FORMA FINANCIAL INFORMATION (UNAUDITED)
The following unaudited pro forma condensed financial information reflects the 2017 and 2016 acquisitions that have closed. This information has been prepared utilizing the historical financial statements of the Company and the effect of additional revenue and expenses from the properties acquired during 2017 and 2016 assuming that the acquisitions had occurred as of January 1, 2016, after giving effect to certain adjustments including (a) rental and related income; (b) community operating expenses; (c) interest expense resulting from the assumed increase in mortgages and loans payable related to the new acquisitions and (d) depreciation expense related to the new acquisitions. The unaudited pro forma condensed financial information is not indicative of the results of operations that would have been achieved had the acquisitions reflected herein been consummated on the dates indicated or that will be achieved in the future.
| For the years ended December 31, | ||||||||
| 2017 | 2016 | |||||||
| Rental and Related Income | $ | 103,618,000 | $ | 98,019,000 | ||||
| Community Operating Expenses | 48,051,000 | 45,690,000 | ||||||
| Net Loss Attributable to Common Shareholders | (8,418,000 | ) | (3,432,000 | ) | ||||
| Net Loss Attributable to Common Shareholders per Share: | ||||||||
| Basic and Diluted | (0.26 | ) | (0.12 | ) | ||||
NOTE 17 – SELECTED QUARTERLY FINANCIAL DATA (UNAUDITED)
SELECTED QUARTERLY FINANCIAL DATA (UNAUDITED)
THREE MONTHS ENDED
| 2017 | March 31 | June 30 | September 30 | December 31 | ||||||||||||
| Total Income | $ | 26,448,549 | $ | 28,817,848 | $ | 28,684,937 | $ | 28,696,585 | ||||||||
| Total Expenses | 22,485,487 | 24,858,243 | 24,704,729 | 24,567,878 | ||||||||||||
| Other Income (Expense) | (1,653,136 | ) | (383,472 | ) | (699,309 | ) | (546,701 | ) | ||||||||
| Net Income | 2,285,546 | 3,589,871 | 3,262,001 | 3,530,616 | ||||||||||||
| Net Loss Attributable to Common Shareholders | (1,504,201 | ) | (199,876 | ) | (5,179,423 | ) | (795,765 | ) | ||||||||
| Net Loss Attributable to Common Shareholders per Share – Basic and Diluted | (0.05 | ) | (0.01 | ) | (0.15 | ) | (0.03 | ) | ||||||||
| 2016 | March 31 | June 30 | September 30 | December 31 | ||||||||||||
| Total Income | $ | 23,504,374 | $ | 25,210,707 | $ | 25,355,051 | $ | 25,143,697 | ||||||||
| Total Expenses | 19,876,382 | 21,176,977 | 21,567,389 | 20,634,766 | ||||||||||||
| Other Income (Expense) | (1,743,611 | ) | (937,242 | ) | (587,077 | ) | (1,153,663 | ) | ||||||||
| Net Income | 1,906,469 | 3,051,462 | 3,200,013 | 3,376,615 | ||||||||||||
| Net Loss Attributable to Common Shareholders | (883,278 | ) | (682,729 | ) | (589,734 | ) | (413,132 | ) | ||||||||
| Net Loss Attributable to Common Shareholders per Share – Basic and Diluted | (0.03 | ) | (0.03 | ) | (0.02 | ) | (0.02 | ) | ||||||||
| -120- |
UMH PROPERTIES, INC.
REAL ESTATE AND ACCUMULATED DEPRECIATION
DECEMBER 31, 2017
| Column A | Column B | Column C | Column D | |||||||||||||||
| Description | Initial Cost | |||||||||||||||||
| Site, Land | ||||||||||||||||||
| & Building | Capitalization | |||||||||||||||||
| Improvements | Subsequent to | |||||||||||||||||
| Name | Location | Encumbrances | Land | and Rental Homes | Acquisition | |||||||||||||
| Allentown | Memphis, TN | $ | 13,390,559 | $ | 250,000 | $ | 2,569,101 | $ | 10,425,033 | |||||||||
| Arbor Estates | Doylestown, PA | (1) | 2,650,000 | 8,266,000 | 1,260,944 | |||||||||||||
| Auburn Estates | Orrville, OH | (4) | 114,000 | 1,174,000 | 507,470 | |||||||||||||
| Birchwood Farms | Birch Run, MI | (1) | 70,000 | 2,797,000 | 2,449,356 | |||||||||||||
| Boardwalk | Elkhart, IN | 14,049,088 | (6) | 1,796,000 | 4,767,792 | (17,029 | ) | |||||||||||
| Broadmore Estates | Goshen, IN | 49,035,572 | (1) | 1,120,000 | 11,136,000 | 8,249,474 | ||||||||||||
| Brookside | Berwick, PA | (3) | 372,000 | 4,776,000 | 1,640,711 | |||||||||||||
| Brookview | Greenfield Ctr, NY | 2,778,698 | 37,500 | 232,547 | 7,262,982 | |||||||||||||
| Candlewick Court | Owosso, MI | 4,468,826 | 159,200 | 7,087,221 | 3,049,600 | |||||||||||||
| Carsons | Chambersburg, PA | -0- | 176,000 | 2,411,000 | 1,259,274 | |||||||||||||
| Catalina | Middletown, OH | 5,533,771 | 1,008,000 | 11,734,640 | 2,927,665 | |||||||||||||
| Cedarcrest | Vineland, NJ | 12,024,840 | 320,000 | 1,866,323 | 2,528,003 | |||||||||||||
| Chambersburg | Chambersburg, PA | -0- | 108,000 | 2,397,000 | 606,548 | |||||||||||||
| Chelsea | Sayre, PA | (2) | 124,000 | 2,049,000 | 1,112,180 | |||||||||||||
| Cinnamon Woods | Conowingo, MD | -0- | 1,884,000 | 2,116,000 | 218,001 | |||||||||||||
| City View | Lewistown, PA | -0- | 137,000 | 613,000 | 1,332,531 | |||||||||||||
| Clinton | Tiffin, OH | 3,514,421 | 142,000 | 3,301,800 | 233,583 | |||||||||||||
| Collingwood | Horseheads, NY | -0- | 196,000 | 2,317,500 | 1,376,360 | |||||||||||||
| Colonial Heights | Wintersville, OH | (1) | 67,000 | 2,383,000 | 4,202,660 | |||||||||||||
| Countryside Estates | Muncie, IN | -0- | 174,000 | 1,926,000 | 3,527,990 | |||||||||||||
| Countryside Estates | Ravenna, OH | -0- | 205,000 | 2,895,997 | 3,820,768 | |||||||||||||
| Countryside Village | Columbia, TN | -0- | 394,000 | 6,916,500 | 8,044,110 | |||||||||||||
| Cranberry | Cranberry Twp, PA | 7,620,974 | 181,930 | 1,922,931 | 3,981,410 | |||||||||||||
| Crestview | Athens, PA | -0- | 188,000 | 2,258,000 | 1,306,840 | |||||||||||||
| Cross Keys | Duncansville, PA | -0- | 60,774 | 378,093 | 3,598,385 | |||||||||||||
| Crossroads Village | Mount Pleasant, PA | -0- | 183,000 | 1,403,400 | 24,370 | |||||||||||||
| D&R | Clifton Park, NY | 7,685,346 | 391,724 | 704,021 | 3,213,228 | |||||||||||||
| Dallas Mobile Home | Toronto,OH | -0- | 275,600 | 2,728,503 | 1,295,277 | |||||||||||||
| Deer Meadows | New Springfield,OH | -0- | 226,000 | 2,299,275 | 2,148,907 | |||||||||||||
| Evergreen Estates | Lodi,OH | -0- | 99,000 | 1,121,300 | 462,148 | |||||||||||||
| Evergreen Manor | Bedford, OH | -0- | 49,000 | 2,372,258 | 895,208 | |||||||||||||
| Evergreen Village | Mantua, OH | -0- | 105,000 | 1,277,001 | 865,356 | |||||||||||||
| Fairview Manor | Millville, NJ | 16,010,749 | 216,000 | 1,166,517 | 9,694,617 | |||||||||||||
| Forest Creek | Elkhart, IN | (1) | 440,000 | 7,004,000 | 1,790,506 | |||||||||||||
| Forest Park | Cranberry Twp, PA | 8,332,848 | 75,000 | 977,225 | 7,537,662 | |||||||||||||
| Fox Chapel Village | Cheswick, PA | -0- | 372,000 | 4,081,700 | 72,515 | |||||||||||||
| Frieden Manor | Schuylkill Haven, PA | 13,296,207 | (2) | 643,000 | 5,293,500 | 1,992,141 | ||||||||||||
| Green Acres | Chambersburg, PA | -0- | 63,000 | 584,000 | 111,538 | |||||||||||||
| Gregory Courts | Honey Brook, PA | (1) | 370,000 | 1,220,000 | 427,354 | |||||||||||||
| Hayden Heights | Dublin,OH | 2,094,009 | 248,100 | 2,147,700 | 571,620 | |||||||||||||
| Heather Highlands | Inkerman, PA | 16,606 | 572,500 | 2,151,569 | 10,427,038 | |||||||||||||
| High View Acres | Apollo, PA | -0- | 825,000 | 4,263,500 | 93,912 | |||||||||||||
| Highland | Elkhart, IN | (1) | 510,000 | 7,084,000 | 3,505,739 | |||||||||||||
| Highland Estates | Kutztown, PA | 16,640,165 | 145,000 | 1,695,041 | 12,095,649 | |||||||||||||
| Hillcrest Crossing | Lower Burrell, PA | -0- | 961,000 | 1,463,825 | 1,924,330 | |||||||||||||
| Hillcrest Estates | Marysville, OH | -0- | 1,277,000 | 3,033,500 | 511,855 | |||||||||||||
| Hillside Estates | Greenburg,PA | (5) | 483,600 | 2,678,525 | 1,932,865 | |||||||||||||
| Holiday Village | Nashville, TN | 7,929,646 | 1,632,000 | 5,618,000 | 6,903,835 | |||||||||||||
| Holiday Village | Elkhart, IN | 8,514,837 | 490,600 | 13,808,269 | 3,740,161 | |||||||||||||
| Holly Acres | Erie, PA | 2,194,312 | 194,000 | 3,591,000 | 605,914 | |||||||||||||
| Hudson Estates | Peninsula, OH | -0- | 141,000 | 3,515,878 | 4,614,404 | |||||||||||||
| Huntingdon Pointe | Tarrs, PA | -0- | 399,000 | 865,450 | 801,695 | |||||||||||||
| -121- |
UMH PROPERTIES, INC.
SCHEDULE III
REAL ESTATE AND ACCUMULATED DEPRECIATION
DECEMBER 31, 2017
| Column A | Column B | Column C | Column D | |||||||||||||||
| Description | Initial Cost | |||||||||||||||||
| Site, Land | ||||||||||||||||||
| & Building | Capitalization | |||||||||||||||||
| Improvements | Subsequent to | |||||||||||||||||
| Name | Location | Encumbrances | Land | and Rental Homes | Acquisition | |||||||||||||
| Independence Park | Clinton, PA | $ | 8,079,960 | (5) | $ | 686,400 | $ | 2,783,633 | $ | 2,544,627 | ||||||||
| Kinnebrook | Monticello, NY | 4,048,226 | 235,600 | 1,402,572 | 12,811,315 | |||||||||||||
| Lake Sherman | Navarre, OH | 5,510,432 | 290,000 | 1,457,673 | 9,854,641 | |||||||||||||
| Lakeview Meadows | Lakeview, OH | -0- | 574,000 | 1,103,600 | 848,061 | |||||||||||||
| Laurel Woods | Cresson, PA | -0- | 432,700 | 2,070,426 | 3,453,562 | |||||||||||||
| Little Chippewa | Orrville, OH | (4) | 113,000 | 1,135,000 | 1,488,980 | |||||||||||||
| Maple Manor | Taylor, PA | 13,749,838 | (3) | 674,000 | 9,432,800 | 4,722,874 | ||||||||||||
| Marysville Estates | Marysville, OH | -0- | 810,000 | 4,555,800 | 654,373 | |||||||||||||
| Meadowood | New Middletown, OH | (1) | 152,000 | 3,191,000 | 2,584,707 | |||||||||||||
| Meadows | Nappanee, IN | -0- | 548,600 | 6,720,900 | 2,515,755 | |||||||||||||
| Melrose Village | Wooster, OH | 7,154,380 | (4) | 767,000 | 5,429,000 | 4,336,425 | ||||||||||||
| Melrose West | Wooster, OH | (4) | 94,000 | 1,040,000 | 52,182 | |||||||||||||
| Memphis Blues | Memphis, TN | -0- | 78,435 | 810,477 | 4,681,136 | |||||||||||||
| Monroe Valley | Jonestown, PA | (2) | 114,000 | 994,000 | 432,570 | |||||||||||||
| Moosic Heights | Avoca, PA | (3) | 330,000 | 3,794,100 | 2,075,353 | |||||||||||||
| Mount Pleasant Village | Mount Pleasant, PA | -0- | 280,000 | 3,501,600 | 68,354 | |||||||||||||
| Mountaintop | Narvon, PA | (2) | 134,000 | 1,665,000 | 601,666 | |||||||||||||
| Oak Ridge | Elkhart, IN | (1) | 500,000 | 7,524,000 | 1,777,443 | |||||||||||||
| Oakwood Lake | Tunkhannock, PA | (3) | 379,000 | 1,639,000 | 830,332 | |||||||||||||
| Olmsted Falls | Olmsted Falls, OH | 2,093,269 | 569,000 | 3,031,000 | 1,311,829 | |||||||||||||
| Oxford | West Grove, PA | 6,751,511 | 175,000 | 990,515 | 2,169,652 | |||||||||||||
| Parke Place | Elkhart, IN | (6) | 4,317,000 | 10,340,950 | 1,135,827 | |||||||||||||
| Pine Ridge/Pine Manor | Carlisle, PA | -0- | 37,540 | 198,321 | 9,387,272 | |||||||||||||
| Pine Valley | Apollo, PA | -0- | 670,000 | 1,336,600 | 5,379,401 | |||||||||||||
| Pleasant View | Bloomsburg, PA | (3) | 282,000 | 2,174,800 | 1,304,424 | |||||||||||||
| Port Royal | Belle Vernon, PA | -0- | 150,000 | 2,491,796 | 11,934,453 | |||||||||||||
| River Valley | Marion, OH | -0- | 236,000 | 785,293 | 6,438,539 | |||||||||||||
| Rolling Hills Estates | Carlisle, PA | -0- | 301,000 | 1,419,013 | 1,451,304 | |||||||||||||
| Rostraver Estates | Belle Veron, PA | - | (5) | 813,600 | 2,203,506 | 1,695,206 | ||||||||||||
| Sandy Valley | Magnolia, OH | -0- | 270,000 | 1,941,430 | 7,839,672 | |||||||||||||
| Shady Hills | Nashville, TN | 4,992,527 | 337,000 | 3,379,000 | 3,914,330 | |||||||||||||
| Somerset/Whispering | Somerset, PA | 217,770 | 1,485,000 | 2,050,400 | 7,100,994 | |||||||||||||
| Southern Terrace | Columbiana, OH | (1) | 63,000 | 3,387,000 | 442,707 | |||||||||||||
| Southwind | Jackson, NJ | 5,392,911 | 100,095 | 602,820 | 2,675,258 | |||||||||||||
| Spreading Oaks | Athens, OH | -0- | 67,000 | 1,326,800 | 3,108,808 | |||||||||||||
| Springfield Meadows | Springfield, OH | 3,141,199 | 1,230,000 | 3,092,706 | 282,931 | |||||||||||||
| Suburban Estates | Greensburg, PA | 5,583,084 | 299,000 | 5,837,272 | 2,650,335 | |||||||||||||
| Summit Estates | Ravenna, OH | -0- | 198,000 | 2,779,260 | 2,699,446 | |||||||||||||
| Sunny Acres | Somerset, PA | 6,214,642 | 287,000 | 6,113,528 | 1,385,661 | |||||||||||||
| Sunnyside | Eagleville, PA | (1) | 450,000 | 2,674,000 | 334,695 | |||||||||||||
| Trailmont | Goodlettsville, TN | 3,328,351 | 411,000 | 1,867,000 | 3,579,237 | |||||||||||||
| Twin Oaks | Olmsted Falls, OH | 2,415,894 | 823,000 | 3,527,000 | 1,677,396 | |||||||||||||
| Twin Pines | Goshen, IN | (1) | 650,000 | 6,307,000 | 3,038,527 | |||||||||||||
| Valley High | Ruffs Dale, PA | (5) | 284,000 | 2,266,750 | 1,240,667 | |||||||||||||
| Valley Hills | Ravenna, OH | 3,408,438 | 996,000 | 6,542,178 | 6,523,105 | |||||||||||||
| Valley Stream | Mountaintop, PA | -0- | 323,000 | 3,190,550 | 650,910 | |||||||||||||
| Valley View HB | Honeybrook, PA | (1) | 1,380,000 | 5,348,000 | 1,566,922 | |||||||||||||
| Valley View I | Ephrata, PA | (2) | 191,000 | 4,359,000 | 988,314 | |||||||||||||
| Valley View II | Ephrata, PA | (2) | 72,000 | 1,746,000 | 4,909 | |||||||||||||
| Voyager Estates | West Newton, PA | -0- | 742,000 | 3,142,725 | 1,977,981 | |||||||||||||
| Waterfalls | Hamburg, NY | 4,639,515 | 424,000 | 3,812,000 | 3,637,198 | |||||||||||||
| Wayside | Bellefontaine, OH | -0- | 196,000 | 1,080,050 | 158,681 | |||||||||||||
| Weatherly Estates | Lebanon, TN | 8,121,177 | 1,184,000 | 4,034,480 | 4,515,367 | |||||||||||||
| Wellington Estates | Export, PA | 2,414,621 | 896,000 | 6,179,000 | 123,037 | |||||||||||||
| -122- |
UMH PROPERTIES, INC.
SCHEDULE III
REAL ESTATE AND ACCUMULATED DEPRECIATION
DECEMBER 31, 2017
| Column A | Column B | Column C | Column D | |||||||||||||||
| Description | Initial Cost | |||||||||||||||||
| Site, Land | ||||||||||||||||||
| & Building | Capitalization | |||||||||||||||||
| Improvements | Subsequent to | |||||||||||||||||
| Name | Location | Encumbrances | Land | and Rental Homes | Acquisition | |||||||||||||
| Wood Valley | Caledonia, OH | $ | -0- | $ | 260,000 | $ | 1,753,206 | $ | 4,267,484 | |||||||||
| Woodland Manor | West Monroe, NY | -0- | 77,000 | 841,000 | 2,852,704 | |||||||||||||
| Woodlawn | Eatontown, NJ | -0- | 157,421 | 280,749 | 1,481,724 | |||||||||||||
| Woods Edge | West Lafayette, IN | 6,728,792 | 1,808,100 | 13,321,318 | 2,345,912 | |||||||||||||
| Worthington Arms | Lewis Center, OH | 9,342,775 | 436,800 | 12,705,530 | 1,472,783 | |||||||||||||
| Youngstown Estates | Youngstown, NY | (4) | 269,000 | 1,606,000 | 1,053,026 | |||||||||||||
| $ | 308,460,786 | $ | 54,431,819 | $ | 376,757,529 | $ | 327,297,677 | |||||||||||
| -123- |
UMH PROPERTIES, INC.
SCHEDULE III
REAL ESTATE AND ACCUMULATED DEPRECIATION
DECEMBER 31, 2017
| Column A | Column E (6) (7) | Column F | ||||||||||||||||
| Description | Gross Amount at Which Carried at 12/31/17 | |||||||||||||||||
| Site, Land | ||||||||||||||||||
| & Building | ||||||||||||||||||
| Improvements | Accumulated | |||||||||||||||||
| Name | Location | Land | and Rental Homes | Total | Depreciation | |||||||||||||
| Allentown | Memphis, TN | $ | 480,000 | $ | 12,764,134 | $ | 13,244,134 | $ | 5,622,205 | |||||||||
| Arbor Estates | Doylestown, PA | 2,650,000 | 9,526,944 | 12,176,944 | 1,574,520 | |||||||||||||
| Auburn Estates | Orrville, OH | 114,000 | 1,681,470 | 1,795,470 | 225,416 | |||||||||||||
| Birchwood Farms | Birch Run, MI | 70,000 | 5,246,356 | 5,316,356 | 864,289 | |||||||||||||
| Boardwalk | Elkhart, IN | 1,796,000 | 4,750,763 | 6,546,763 | 173,168 | |||||||||||||
| Broadmore Estates | Goshen, IN | 1,120,000 | 19,385,474 | 20,505,474 | 3,012,157 | |||||||||||||
| Brookside | Berwick, PA | 372,000 | 6,416,711 | 6,788,711 | 1,392,564 | |||||||||||||
| Brookview | Greenfield Ctr, NY | 122,865 | 7,410,164 | 7,533,029 | 2,357,656 | |||||||||||||
| Candlewick Court | Owosso, MI | 159,200 | 10,136,821 | 10,296,021 | 877,845 | |||||||||||||
| Carsons | Chambersburg, PA | 176,000 | 3,670,274 | 3,846,274 | 591,483 | |||||||||||||
| Catalina | Middletown, OH | 1,008,000 | 14,662,305 | 15,670,305 | 1,364,525 | |||||||||||||
| Cedarcrest | Vineland, NJ | 408,206 | 4,306,120 | 4,714,326 | 2,795,731 | |||||||||||||
| Chambersburg | Chambersburg, PA | 108,000 | 3,003,548 | 3,111,548 | 535,412 | |||||||||||||
| Chelsea | Sayre, PA | 124,000 | 3,161,180 | 3,285,180 | 501,859 | |||||||||||||
| Cinnamon Woods | Conowingo, MD | 1,884,000 | 2,334,001 | 4,218,001 | 56,761 | |||||||||||||
| City View | Lewistown, PA | 137,000 | 1,945,531 | 2,082,531 | 321,674 | |||||||||||||
| Clinton | Tiffin, OH | 142,000 | 3,535,383 | 3,677,383 | 793,776 | |||||||||||||
| Collingwood | Horseheads, NY | 196,000 | 3,693,860 | 3,889,860 | 625,100 | |||||||||||||
| Colonial Heights | Wintersville, OH | 67,000 | 6,585,660 | 6,652,660 | 1,039,768 | |||||||||||||
| Countryside Estates | Muncie, IN | 174,000 | 5,453,990 | 5,627,990 | 755,613 | |||||||||||||
| Countryside Estates | Ravenna, OH | 205,000 | 6,716,765 | 6,921,765 | 688,791 | |||||||||||||
| Countryside Village | Columbia, TN | 609,000 | 14,745,610 | 15,354,610 | 2,916,765 | |||||||||||||
| Cranberry | Cranberry Twp, PA | 181,930 | 5,904,341 | 6,086,271 | 2,885,885 | |||||||||||||
| Crestview | Athens, PA | 361,500 | 3,391,340 | 3,752,840 | 552,142 | |||||||||||||
| Cross Keys | Duncansville, PA | 60,774 | 3,976,478 | 4,037,252 | 1,294,428 | |||||||||||||
| Crossroads Village | Mount Pleasant, PA | 183,000 | 1,427,770 | 1,610,770 | 5,012 | |||||||||||||
| D&R | Clifton Park, NY | 391,724 | 3,917,249 | 4,308,973 | 2,045,833 | |||||||||||||
| Dallas Mobile Home | Toronto,OH | 275,600 | 4,023,780 | 4,299,380 | 448,086 | |||||||||||||
| Deer Meadows | New Springfield,OH | 226,000 | 4,448,182 | 4,674,182 | 452,414 | |||||||||||||
| Evergreen Estates | Lodi,OH | 119,000 | 1,563,448 | 1,682,448 | 188,683 | |||||||||||||
| Evergreen Manor | Bedford, OH | 49,000 | 3,267,466 | 3,316,466 | 371,934 | |||||||||||||
| Evergreen Village | Mantua, OH | 105,000 | 2,142,357 | 2,247,357 | 251,789 | |||||||||||||
| Fairview Manor | Millville, NJ | 2,534,892 | 8,542,242 | 11,077,134 | 5,005,204 | |||||||||||||
| Forest Creek | Elkhart, IN | 440,000 | 8,794,506 | 9,234,506 | 1,735,122 | |||||||||||||
| Forest Park | Cranberry Twp, PA | 75,000 | 8,514,887 | 8,589,887 | 3,169,111 | |||||||||||||
| Fox Chapel Village | Cheswick, PA | 372,000 | 4,154,215 | 4,526,215 | 14,381 | |||||||||||||
| Frieden Manor | Schuylkill Haven, PA | 643,000 | 7,285,641 | 7,928,641 | 1,314,625 | |||||||||||||
| Green Acres | Chambersburg, PA | 63,000 | 695,538 | 758,538 | 125,691 | |||||||||||||
| Gregory Courts | Honey Brook, PA | 370,000 | 1,647,354 | 2,017,354 | 261,779 | |||||||||||||
| Hayden Heights | Dublin,OH | 248,100 | 2,719,320 | 2,967,420 | 335,477 | |||||||||||||
| Heather Highlands | Inkerman, PA | 572,500 | 12,578,607 | 13,151,107 | 4,959,606 | |||||||||||||
| High View Acres | Apollo, PA | 825,000 | 4,357,412 | 5,182,412 | 14,045 | |||||||||||||
| Highland | Elkhart, IN | 510,000 | 10,589,739 | 11,099,739 | 1,715,882 | |||||||||||||
| Highland Estates | Kutztown, PA | 404,239 | 13,531,451 | 13,935,690 | 6,693,393 | |||||||||||||
| Hillcrest Crossing | Lower Burrell, PA | 961,000 | 3,388,155 | 4,349,155 | 82,876 | |||||||||||||
| Hillcrest Estates | Marysville, OH | 1,277,000 | 3,545,355 | 4,822,355 | 133,643 | |||||||||||||
| Hillside Estates | Greenburg,PA | 483,600 | 4,611,390 | 5,094,990 | 486,796 | |||||||||||||
| Holiday Village | Nashville, TN | 1,632,000 | 12,521,835 | 14,153,835 | 1,811,334 | |||||||||||||
| Holiday Village | Elkhart, IN | 490,600 | 17,548,430 | 18,039,030 | 1,375,999 | |||||||||||||
| Holly Acres | Erie, PA | 194,000 | 4,196,914 | 4,390,914 | 420,405 | |||||||||||||
| Hudson Estates | Peninsula, OH | 141,000 | 8,130,282 | 8,271,282 | 823,582 | |||||||||||||
| Huntingdon Pointe | Tarrs, PA | 399,000 | 1,667,145 | 2,066,145 | 121,362 | |||||||||||||
| -124- |
UMH PROPERTIES, INC.
SCHEDULE III
REAL ESTATE AND ACCUMULATED DEPRECIATION
DECEMBER 31, 2017
| Column A | Column E (6) (7) | Column F | ||||||||||||||||
| Description | Gross Amount at Which Carried at 12/31/17 | |||||||||||||||||
| Site, Land | ||||||||||||||||||
| & Building | ||||||||||||||||||
| Improvements | Accumulated | |||||||||||||||||
| Name | Location | Land | and Rental Homes | Total | Depreciation | |||||||||||||
| Independence Park | Clinton, PA | $ | 686,400 | $ | 5,328,260 | $ | 6,014,660 | $ | 510,057 | |||||||||
| Kinnebrook | Monticello, NY | 352,972 | 14,096,515 | 14,449,487 | 4,936,134 | |||||||||||||
| Lake Sherman | Navarre, OH | 290,000 | 11,312,314 | 11,602,314 | 3,918,732 | |||||||||||||
| Lakeview Meadows | Lakeview, OH | 725,663 | 1,799,998 | 2,525,661 | 90,514 | |||||||||||||
| Laurel Woods | Cresson, PA | 432,700 | 5,523,988 | 5,956,688 | 2,048,960 | |||||||||||||
| Little Chippewa | Orrville, OH | 113,000 | 2,623,980 | 2,736,980 | 275,603 | |||||||||||||
| Maple Manor | Taylor, PA | 674,000 | 14,155,674 | 14,829,674 | 3,015,890 | |||||||||||||
| Marysville Estates | Marysville, OH | 820,668 | 5,199,505 | 6,020,173 | 199,348 | |||||||||||||
| Meadowood | New Middletown, OH | 152,000 | 5,775,707 | 5,927,707 | 981,658 | |||||||||||||
| Meadows | Nappanee, IN | 548,600 | 9,236,655 | 9,785,255 | 758,790 | |||||||||||||
| Melrose Village | Wooster, OH | 767,000 | 9,765,425 | 10,532,425 | 1,217,325 | |||||||||||||
| Melrose West | Wooster, OH | 94,000 | 1,092,182 | 1,186,182 | 159,710 | |||||||||||||
| Memphis Blues | Memphis, TN | 335,935 | 5,234,113 | 5,570,048 | 1,328,193 | |||||||||||||
| Monroe Valley | Jonestown, PA | 114,000 | 1,426,570 | 1,540,570 | 248,809 | |||||||||||||
| Moosic Heights | Avoca, PA | 330,000 | 5,869,453 | 6,199,453 | 1,183,142 | |||||||||||||
| Mount Pleasant Village | Mount Pleasant, PA | 280,000 | 3,569,954 | 3,849,954 | 13,071 | |||||||||||||
| Mountaintop | Narvon, PA | 134,000 | 2,266,666 | 2,400,666 | 402,704 | |||||||||||||
| Oak Ridge | Elkhart, IN | 500,000 | 9,301,443 | 9,801,443 | 1,845,852 | |||||||||||||
| Oakwood Lake | Tunkhannock, PA | 379,000 | 2,469,332 | 2,848,332 | 537,890 | |||||||||||||
| Olmsted Falls | Olmsted Falls, OH | 569,000 | 4,342,829 | 4,911,829 | 719,715 | |||||||||||||
| Oxford | West Grove, PA | 155,000 | 3,180,167 | 3,335,167 | 2,042,718 | |||||||||||||
| Parke Place | Elkhart, IN | 4,317,000 | 11,476,777 | 15,793,777 | 452,565 | |||||||||||||
| Pine Ridge/Pine Manor | Carlisle, PA | 145,472 | 9,477,661 | 9,623,133 | 3,024,777 | |||||||||||||
| Pine Valley | Apollo, PA | 732,089 | 6,653,912 | 7,386,001 | 2,630,313 | |||||||||||||
| Pleasant View | Bloomsburg, PA | 282,000 | 3,479,224 | 3,761,224 | 708,447 | |||||||||||||
| Port Royal | Belle Vernon, PA | 505,000 | 14,071,249 | 14,576,249 | 6,482,162 | |||||||||||||
| River Valley | Marion, OH | 236,000 | 7,223,832 | 7,459,832 | 3,379,144 | |||||||||||||
| Rolling Hills Estates | Carlisle, PA | 301,000 | 2,870,317 | 3,171,317 | 571,963 | |||||||||||||
| Rostraver Estates | Belle Veron, PA | 813,600 | 3,898,712 | 4,712,312 | 431,257 | |||||||||||||
| Sandy Valley | Magnolia, OH | 270,000 | 9,781,102 | 10,051,102 | 4,648,644 | |||||||||||||
| Shady Hills | Nashville, TN | 337,000 | 7,293,330 | 7,630,330 | 1,347,505 | |||||||||||||
| Somerset/Whispering | Somerset, PA | 1,488,600 | 9,147,794 | 10,636,394 | 3,159,972 | |||||||||||||
| Southern Terrace | Columbiana, OH | 63,000 | 3,829,707 | 3,892,707 | 708,693 | |||||||||||||
| Southwind | Jackson, NJ | 100,095 | 3,278,078 | 3,378,173 | 1,972,762 | |||||||||||||
| Spreading Oaks | Athens, OH | 67,000 | 4,435,608 | 4,502,608 | 1,666,426 | |||||||||||||
| Springfield Meadows | Springfield, OH | 1,230,000 | 3,375,637 | 4,605,637 | 130,146 | |||||||||||||
| Suburban Estates | Greensburg, PA | 299,000 | 8,487,607 | 8,786,607 | 1,849,609 | |||||||||||||
| Summit Estates | Ravenna, OH | 198,000 | 5,478,706 | 5,676,706 | 568,575 | |||||||||||||
| Sunny Acres | Somerset, PA | 287,000 | 7,499,189 | 7,786,189 | 1,842,783 | |||||||||||||
| Sunnyside | Eagleville, PA | 450,000 | 3,008,695 | 3,458,695 | 493,012 | |||||||||||||
| Trailmont | Goodlettsville, TN | 411,000 | 5,446,237 | 5,857,237 | 1,008,889 | |||||||||||||
| Twin Oaks | Olmsted Falls, OH | 998,000 | 5,029,396 | 6,027,396 | 898,732 | |||||||||||||
| Twin Pines | Goshen, IN | 650,000 | 9,345,527 | 9,995,527 | 1,555,867 | |||||||||||||
| Valley High | Ruffs Dale, PA | 284,000 | 3,507,417 | 3,791,417 | 383,503 | |||||||||||||
| Valley Hills | Ravenna, OH | 996,000 | 13,065,283 | 14,061,283 | 1,478,494 | |||||||||||||
| Valley Stream | Mountaintop, PA | 323,000 | 3,841,460 | 4,164,460 | 357,886 | |||||||||||||
| Valley View HB | Honeybrook, PA | 1,380,000 | 6,914,922 | 8,294,922 | 1,198,477 | |||||||||||||
| Valley View I | Ephrata, PA | 191,000 | 5,347,314 | 5,538,314 | 1,008,023 | |||||||||||||
| Valley View II | Ephrata, PA | 72,000 | 1,750,909 | 1,822,909 | 345,020 | |||||||||||||
| Voyager Estates | West Newton, PA | 742,000 | 5,120,706 | 5,862,706 | 452,882 | |||||||||||||
| Waterfalls | Hamburg, NY | 424,000 | 7,449,198 | 7,873,198 | 3,665,333 | |||||||||||||
| Wayside | Bellefontaine, OH | 196,000 | 1,238,731 | 1,434,731 | 68,070 | |||||||||||||
| Weatherly Estates | Lebanon, TN | 1,184,000 | 8,549,847 | 9,733,847 | 3,067,077 | |||||||||||||
| -125- |
UMH PROPER UMH PROPERTIES, INC.
SCHEDULE III
REAL ESTATE AND ACCUMULATED DEPRECIATION
DECEMBER 31, 2017
| Column A | Column E (6) (7) | Column F | ||||||||||||||||
| Description | Gross Amount at Which Carried at 12/31/17 | |||||||||||||||||
| Site, Land | ||||||||||||||||||
| & Building | ||||||||||||||||||
| Improvements | Accumulated | |||||||||||||||||
| Name | Location | Land | and Rental Homes | Total | Depreciation | |||||||||||||
| Wellington Estates | Export, PA | $ | 896,000 | $ | 6,302,037 | $ | 7,198,037 | $ | 22,981 | |||||||||
| Wood Valley | Caledonia, OH | 260,000 | 6,020,690 | 6,280,690 | 2,764,346 | |||||||||||||
| Woodland Manor | West Monroe, NY | 77,000 | 3,693,704 | 3,770,704 | 1,008,380 | |||||||||||||
| Woodlawn | Eatontown, NJ | 135,420 | 1,784,474 | 1,919,894 | 800,823 | |||||||||||||
| Woods Edge | West Lafayette, IN | 1,808,100 | 15,667,230 | 17,475,330 | 1,296,996 | |||||||||||||
| Worthington Arms | Lewis Center, OH | 436,800 | 14,178,313 | 14,615,113 | 1,225,567 | |||||||||||||
| Youngstown Estates | Youngstown, NY | 269,000 | 2,659,026 | 2,928,026 | 297,404 | |||||||||||||
| $ | 59,020,844 | $ | 699,466,181 | $ | 758,487,025 | $ | 153,591,917 | |||||||||||
| -126- |
UMH PROPERTIES, INC.
SCHEDULE III
REAL ESTATE AND ACCUMULATED DEPRECIATION
DECEMBER 31, 2017
| Column A | Column G | Column H | Column I | |||||
| Description | ||||||||
| Date of | Date | Depreciable | ||||||
| Name | Location | Construction | Acquired | Life | ||||
| Allentown | Memphis, TN | prior to 1980 | 1986 | 5 to 27.5 | ||||
| Arbor Estates | Doylestown, PA | 1959 | 2013 | 5 to 27.5 | ||||
| Auburn Estates | Orrville, OH | 1971/1985/1995 | 2013 | 5 to 27.5 | ||||
| Birchwood Farms | Birch Run, MI | 1976-1977 | 2013 | 5 to 27.5 | ||||
| Boardwalk | Elkhart, IN | 1995-1996 | 2017 | 5 to 27.5 | ||||
| Broadmore Estates | Goshen, IN | 1950/1990 | 2013 | 5 to 27.5 | ||||
| Brookside | Berwick, PA | 1973-1976 | 2010 | 5 to 27.5 | ||||
| Brookview | Greenfield Ctr, NY | prior to 1970 | 1977 | 5 to 27.5 | ||||
| Candlewick Court | Owosso, MI | 1975 | 2015 | 5 to 27.5 | ||||
| Carsons | Chambersburg, PA | 1963 | 2012 | 5 to 27.5 | ||||
| Catalina | Middletown, OH | 1968-1976 | 2015 | 5 to 27.5 | ||||
| Cedarcrest | Vineland, NJ | 1973 | 1986 | 5 to 27.5 | ||||
| Chambersburg | Chambersburg, PA | 1955 | 2012 | 5 to 27.5 | ||||
| Chelsea | Sayre, PA | 1972 | 2012 | 5 to 27.5 | ||||
| Cinnamon Woods | Conowingo, MD | 2005 | 2017 | 5 to 27.5 | ||||
| City View | Lewistown, PA | prior to 1980 | 2011 | 5 to 27.5 | ||||
| Clinton | Tiffin, OH | 1968/1987 | 2011 | 5 to 27.5 | ||||
| Collingwood | Horseheads, NY | 1970 | 2012 | 5 to 27.5 | ||||
| Colonial Heights | Wintersville, OH | 1972 | 2012 | 5 to 27.5 | ||||
| Countryside Estates | Muncie, IN | 1996 | 2012 | 5 to 27.5 | ||||
| Countryside Estates | Ravenna, OH | 1972 | 2014 | 5 to 27.5 | ||||
| Countryside Village | Columbia, TN | 1988/1992 | 2011 | 5 to 27.5 | ||||
| Cranberry | Cranberry Twp, PA | 1974 | 1986 | 5 to 27.5 | ||||
| Crestview | Athens, PA | 1964 | 2012 | 5 to 27.5 | ||||
| Cross Keys | Duncansville, PA | 1961 | 1979 | 5 to 27.5 | ||||
| Crossroads Village | Mount Pleasant, PA | 1955/2004 | 2017 | 5 to 27.5 | ||||
| D&R | Clifton Park, NY | 1972 | 1978 | 5 to 27.5 | ||||
| Dallas Mobile Home | Toronto,OH | 1950-1957 | 2014 | 5 to 27.5 | ||||
| Deer Meadows | New Springfield,OH | 1973 | 2014 | 5 to 27.5 | ||||
| Evergreen Estates | Lodi,OH | 1965 | 2014 | 5 to 27.5 | ||||
| Evergreen Manor | Bedford, OH | 1960 | 2014 | 5 to 27.5 | ||||
| Evergreen Village | Mantua, OH | 1960 | 2014 | 5 to 27.5 | ||||
| Fairview Manor | Millville, NJ | prior to 1980 | 1985 | 5 to 27.5 | ||||
| Forest Creek | Elkhart, IN | 1996-1997 | 2013 | 5 to 27.5 | ||||
| Forest Park | Cranberry Twp, PA | prior to 1980 | 1982 | 5 to 27.5 | ||||
| Fox Chapel Village | Cheswick, PA | 1975 | 2017 | 5 to 27.5 | ||||
| Frieden Manor | Schuylkill Haven, PA | 1969 | 2012 | 5 to 27.5 | ||||
| Green Acres | Chambersburg, PA | 1978 | 2012 | 5 to 27.5 | ||||
| Gregory Courts | Honey Brook, PA | 1970 | 2013 | 5 to 27.5 | ||||
| Hayden Heights | Dublin,OH | 1973 | 2014 | 5 to 27.5 | ||||
| Heather Highlands | Inkerman, PA | 1970 | 1992 | 5 to 27.5 | ||||
| High View Acres | Apollo, PA | 1984 | 2017 | 5 to 27.5 | ||||
| Highland | Elkhart, IN | 1969 | 2013 | 5 to 27.5 | ||||
| Highland Estates | Kutztown, PA | 1971 | 1979 | 5 to 27.5 | ||||
| Hillcrest Crossing | Lower Burrell, PA | 1971 | 2017 | 5 to 27.5 | ||||
| Hillcrest Estates | Marysville, OH | 1995 | 2017 | 5 to 27.5 | ||||
| Hillside Estates | Greenburg,PA | 1980 | 2014 | 5 to 27.5 | ||||
| Holiday Village | Nashville, TN | 1967 | 2013 | 5 to 27.5 | ||||
| Holiday Village | Elkhart, IN | 1966 | 2015 | 5 to 27.5 | ||||
| Holly Acres | Erie, PA | 1977/2007 | 2015 | 5 to 27.5 | ||||
| Hudson Estates | Peninsula, OH | 1956 | 2014 | 5 to 27.5 | ||||
| Huntingdon Pointe | Tarrs, PA | 2000 | 2015 | 5 to 27.5 | ||||
| -127- |
UMH PROPERTIES, INC.
SCHEDULE III
REAL ESTATE AND ACCUMULATED DEPRECIATION
DECEMBER 31, 2017
| Column A | Column G | Column H | Column I | |||||
| Description | ||||||||
| Date of | Date | Depreciable | ||||||
| Name | Location | Construction | Acquired | Life | ||||
| Independence Park | Clinton, PA | 1987 | 2014 | 5 to 27.5 | ||||
| Kinnebrook | Monticello, NY | 1972 | 1988 | 5 to 27.5 | ||||
| Lake Sherman | Navarre, OH | prior to 1980 | 1987 | 5 to 27.5 | ||||
| Lakeview Meadows | Lakeview, OH | 1995 | 2016 | 5 to 27.5 | ||||
| Laurel Woods | Cresson, PA | prior to 1980 | 2001 | 5 to 27.5 | ||||
| Little Chippewa | Orrville, OH | 1968 | 2013 | 5 to 27.5 | ||||
| Maple Manor | Taylor, PA | 1972 | 2010 | 5 to 27.5 | ||||
| Marysville Estates | Marysville, OH | 1960s to 2015 | 2017 | 5 to 27.5 | ||||
| Meadowood | New Middletown, OH | 1957 | 2012 | 5 to 27.5 | ||||
| Meadows | Nappanee, IN | 1965-1973 | 2015 | 5 to 27.5 | ||||
| Melrose Village | Wooster, OH | 1970-1978 | 2013 | 5 to 27.5 | ||||
| Melrose West | Wooster, OH | 1995 | 2013 | 5 to 27.5 | ||||
| Memphis Blues | Memphis, TN | 1955 | 1985 | 5 to 27.5 | ||||
| Monroe Valley | Jonestown, PA | 1969 | 2012 | 5 to 27.5 | ||||
| Moosic Heights | Avoca, PA | 1972 | 2010 | 5 to 27.5 | ||||
| Mount Pleasant Village | Mount Pleasant, PA | 1977-1986 | 2017 | 5 to 27.5 | ||||
| Mountaintop | Narvon, PA | 1972 | 2012 | 5 to 27.5 | ||||
| Oak Ridge | Elkhart, IN | 1990 | 2013 | 5 to 27.5 | ||||
| Oakwood Lake | Tunkhannock, PA | 1972 | 2010 | 5 to 27.5 | ||||
| Olmsted Falls | Olmsted Falls, OH | 1953/1970 | 2012 | 5 to 27.5 | ||||
| Oxford | West Grove, PA | 1971 | 1974 | 5 to 27.5 | ||||
| Parke Place | Elkhart, IN | 1995-1996 | 2017 | 5 to 27.5 | ||||
| Pine Ridge/Pine Manor | Carlisle, PA | 1961 | 1969 | 5 to 27.5 | ||||
| Pine Valley | Apollo, PA | prior to 1980 | 1995 | 5 to 27.5 | ||||
| Pleasant View | Bloomsburg, PA | 1960’s | 2010 | 5 to 27.5 | ||||
| Port Royal | Belle Vernon, PA | 1973 | 1983 | 5 to 27.5 | ||||
| River Valley | Marion, OH | 1950 | 1986 | 5 to 27.5 | ||||
| Rolling Hills Estates | Carlisle, PA | 1972-1975 | 2013 | 5 to 27.5 | ||||
| Rostraver Estates | Belle Veron, PA | 1970 | 2014 | 5 to 27.5 | ||||
| Sandy Valley | Magnolia, OH | prior to 1980 | 1985 | 5 to 27.5 | ||||
| Shady Hills | Nashville, TN | 1954 | 2011 | 5 to 27.5 | ||||
| Somerset/Whispering | Somerset, PA | prior to 1980 | 2004 | 5 to 27.5 | ||||
| Southern Terrace | Columbiana, OH | 1983 | 2012 | 5 to 27.5 | ||||
| Southwind | Jackson, NJ | 1969 | 1969 | 5 to 27.5 | ||||
| Spreading Oaks | Athens, OH | prior to 1980 | 1996 | 5 to 27.5 | ||||
| Springfield Meadows | Springfield, OH | 1970 | 2016 | 5 to 27.5 | ||||
| Suburban Estates | Greensburg, PA | 1968/1980 | 2010 | 5 to 27.5 | ||||
| Summit Estates | Ravenna, OH | 1969 | 2014 | 5 to 27.5 | ||||
| Sunny Acres | Somerset, PA | 1970 | 2010 | 5 to 27.5 | ||||
| Sunnyside | Eagleville, PA | 1960 | 2013 | 5 to 27.5 | ||||
| Trailmont | Goodlettsville, TN | 1964 | 2011 | 5 to 27.5 | ||||
| Twin Oaks | Olmsted Falls, OH | 1952/1997 | 2012 | 5 to 27.5 | ||||
| Twin Pines | Goshen, IN | 1956/1990 | 2013 | 5 to 27.5 | ||||
| Valley High | Ruffs Dale, PA | 1974 | 2014 | 5 to 27.5 | ||||
| Valley Hills | Ravenna, OH | 1960-1970 | 2014 | 5 to 27.5 | ||||
| Valley Stream | Mountaintop, PA | 1970 | 2015 | 5 to 27.5 | ||||
| Valley View HB | Honeybrook, PA | 1970 | 2013 | 5 to 27.5 | ||||
| Valley View I | Ephrata, PA | 1961 | 2012 | 5 to 27.5 | ||||
| Valley View II | Ephrata, PA | 1999 | 2012 | 5 to 27.5 | ||||
| Voyager Estates | West Newton, PA | 1968 | 2015 | 5 to 27.5 | ||||
| Waterfalls | Hamburg, NY | prior to 1980 | 1997 | 5 to 27.5 | ||||
| -128- |
UMH PROPERTIES, INC.
SCHEDULE III
REAL ESTATE AND ACCUMULATED DEPRECIATION
DECEMBER 31, 2017
| Column A | Column G | Column H | Column I | |||||
| Description | ||||||||
| Date of | Date | Depreciable | ||||||
| Name | Location | Construction | Acquired | Life | ||||
| Wayside | Bellefontaine, OH | 1960’s | 2016 | 5 to 27.5 | ||||
| Weatherly Estates | Lebanon, TN | 1997 | 2006 | 5 to 27.5 | ||||
| Wellington Estate | Export, PA | 1970/1996 | 2017 | 5 to 27.5 | ||||
| Wood Valley | Caledonia, OH | prior to 1980 | 1996 | 5 to 27.5 | ||||
| Woodland Manor | West Monroe, NY | prior to 1980 | 2003 | 5 to 27.5 | ||||
| Woodlawn | Eatontown, NJ | 1964 | 1978 | 5 to 27.5 | ||||
| Woods Edge | West Lafayette, IN | 1974 | 2015 | 5 to 27.5 | ||||
| Worthington Arms | Lewis Center, OH | 1968 | 2015 | 5 to 27.5 | ||||
| Youngstown Estates | Youngstown, NY | 1963 | 2013 | 5 to 27.5 | ||||
| -129- |
UMH PROPERTIES, INC.
SCHEDULE III
REAL ESTATE AND ACCUMULATED DEPRECIATION
DECEMBER 31, 2017
| (1) | Represents one mortgage note payable secured by thirteen properties. |
| (2) | Represents one mortgage note payable secured by six properties. |
| (3) | Represents one mortgage note payable secured by five properties. |
| (4) | Represents one mortgage note payable secured by five properties. |
| (5) | Represents one mortgage note payable secured by four properties. |
| (6) | Represents one mortgage note payable secured by two properties. |
| (7) | Reconciliation |
| /———-FIXED ASSETS————/ | ||||||||||||
| 12/31/17 | 12/31/16 | 12/31/15 | ||||||||||
| Balance – Beginning of Year | $ | 636,576,955 | $ | 574,283,574 | $ | 444,908,976 | ||||||
| Additions: | ||||||||||||
| Acquisitions | 59,308,067 | 7,276,356 | 82,276,902 | |||||||||
| Improvements | 65,458,396 | 56,417,927 | 48,263,233 | |||||||||
| Total Additions | 124,766,463 | 63,694,283 | 130,540,135 | |||||||||
| Deletions | (2,856,393 | ) | (1,400,902 | ) | (1,165,537 | ) | ||||||
| Balance – End of Year | $ | 758,487,025 | $ | 636,576,955 | $ | 574,283,574 | ||||||
| /——ACCUMULATED DEPRECIATION——/ | ||||||||||||
| 12/31/17 | 12/31/16 | 12/31/15 | ||||||||||
| Balance – Beginning of Year | $ | 128,780,501 | $ | 107,453,972 | $ | 90,277,082 | ||||||
| Additions: | ||||||||||||
| Depreciation | 25,307,453 | 21,625,264 | 17,481,811 | |||||||||
| Total Additions | 25,307,453 | 21,625,264 | 17,481,811 | |||||||||
| Deletions | (496,037 | ) | (298,735 | ) | (304,921 | ) | ||||||
| Balance – End of Year | $ | 153,591,917 | $ | 128,780,501 | $ | 107,453,972 | ||||||
| (8) | The aggregate cost for Federal tax purposes approximates historical cost. |
| -130- |
Pursuant to the requirements of Section 13 or 15(d) of the Securities and Exchange Act of 1934, as amended, the Registrant has duly caused this report to be signed on its behalf by the undersigned, thereunto duly authorized.
| UMH PROPERTIES, INC. | ||
| BY: | /s/ Samuel A. Landy | |
| SAMUEL A. LANDY | ||
President, Chief Executive Officer and Director (Principal Executive Officer) | ||
| BY: | /s/ Anna T. Chew | |
| ANNA T. CHEW | ||
| Vice President, Chief Financial and Accounting Officer, Treasurer and Director | ||
| (Principal Financial and Accounting Officer) | ||
Dated: March 8, 2018
Pursuant to the requirements of the Securities and Exchange Act of 1934, as amended, this report has been duly signed below by the following persons on behalf of the Registrant and in the capacities and on the dates indicated.
| Title | Date | |||
| /s/ Eugene W. Landy | Chairman of the Board | March 8, 2018 | ||
| EUGENE W. LANDY | ||||
| /s/ Samuel A. Landy | President, Chief Executive Officer and Director | March 8, 2018 | ||
| SAMUEL A. LANDY | ||||
| /s/ Anna T. Chew | Vice President, Chief Financial and Accounting | March 8, 2018 | ||
| ANNA T. CHEW |
Officer, Treasurer and Director |
|||
| /s/ Jeffrey A. Carus | Director | March 8, 2018 | ||
| JEFFREY A. CARUS | ||||
| /s/ Matthew Hirsch | Director | March 8, 2018 | ||
| MATTHEW HIRSCH | ||||
| /s/ Michael P. Landy | Director | March 8, 2018 | ||
| MICHAEL P. LANDY | ||||
| /s/ Stuart Levy | Director | March 8, 2018 | ||
| STUART LEVY | ||||
| /s/ James E. Mitchell | Director | March 8, 2018 | ||
| JAMES E. MITCHELL | ||||
| /s/ Kenneth K. Quigley, Jr. | Director | March 8, 2018 | ||
| KENNETH K. QUIGLEY | ||||
| /s/ Stephen B. Wolgin | Director | March 8, 2018 | ||
| STEPHEN B. WOLGIN |
| -131- |