Attached files
| file | filename |
|---|---|
| EX-99.1 - PRESS RELEASE - ENTERPRISE FINANCIAL SERVICES CORP | exhibit991pressrelease.htm |
| 8-K - 8-K - ENTERPRISE FINANCIAL SERVICES CORP | efsc-20200820.htm |
EXHIBIT 99.2 Enterprise Financial Services Corp Strategic Combination with Seacoast Commerce Banc Holdings August 2020
Forward-Looking Statements Certain statements contained in this investor presentation may be considered forward-looking statements regarding Enterprise Financial Services Corp (“EFSC”), including its wholly-owned subsidiary Enterprise Bank & Trust (“EB&T”), Seacoast Commerce Banc Holdings (“SCBH”), including its wholly-owned subsidiary Seacoast Commerce Bank (“SCB”), and EFSC’s proposed acquisition of SCBH and SCB. These forward- looking statements may include: statements regarding the acquisition, the consideration payable in connection with the acquisition, and the ability of the parties to consummate the acquisition. Forward-looking statements are typically identified by words such as “believe,” “expect,” “anticipate,” “intend,” “outlook,” “estimate,” “forecast,” “project,” “pro forma” and other similar words and expressions. Forward-looking statements are subject to numerous assumptions, risks and uncertainties, which change over time. Forward-looking statements speak only as of the date they are made. Because forward-looking statements are subject to assumptions and uncertainties, actual results or future events could differ, possibly materially, from those that EFSC anticipated in its forward-looking statements and future results could differ materially from historical performance. Factors that could cause or contribute to such differences include, but are not limited to, the possibility: that expected benefits of the acquisition may not materialize in the timeframe expected or at all, or may be more costly to achieve; that the acquisition may not be timely completed, if at all; the occurrence of any event, change or other circumstances that could give rise to the right of one or both of the parties to terminate the definitive transaction agreement; the outcome of any legal proceedings that may be instituted against EFSC or SCBH; that prior to the completion of the acquisition or thereafter, EFSC’s and SCBH’s respective businesses may not perform as expected due to transaction-related uncertainty or other factors; that the parties are unable to successfully implement integration strategies; that required regulatory, SCBH shareholder or other approvals are not obtained or other closing conditions are not satisfied in a timely manner or at all; adverse regulatory conditions may be imposed in connection with regulatory approvals of the acquisition; reputational risks and the reaction of the companies’ employees or customers to the transaction; diversion of management time on acquisition-related issues; that the COVID-19 pandemic, including uncertainty and volatility in financial, commodities and other markets, and disruptions to banking and other financial activity, could harm Enterprise and Seacoast's business, financial position and results of operations, and could adversely affect the timing and anticipated benefits of the proposed acquisition; and those factors and risks referenced from time to time in EFSC’s filings with the Securities and Exchange Commission (the “SEC”), including in EFSC’s Annual Report on Form 10-K for the fiscal year ended December 31, 2019, its Quarterly Reports on Form 10-Q for the periods ended March 31, 2020 and June 30, 2020, and its other filings with the SEC. For any forward- looking statements made in this communication or in any documents, EFSC claims the protection of the safe harbor for forward-looking statements contained in the Private Securities Litigation Reform Act of 1995. Annualized, pro forma, projected and estimated numbers in this document are used for illustrative purposes only, are not forecasts and may not reflect actual results. Except to the extent required by applicable law or regulation, each of EFSC and SCBH disclaims any obligation to revise or publicly release any revision or update to any of the forward-looking statements included herein to reflect events or circumstances that occur after the date on which such statements were made. 2
Additional Information Additional Information About the Merger and Where to Find It This document does not constitute an offer to sell or the solicitation of an offer to buy any securities or a solicitation of any vote or approval. In connection with the proposed acquisition transaction, EFSC will file with the SEC a Registration Statement on Form S-4 that will include a proxy statement of SCBH, and a prospectus of EFSC, which are jointly referred to as the proxy statement/prospectus, as well as other relevant documents concerning the proposed transaction. SHAREHOLDERS OF SCBH ARE URGED TO READ THE REGISTRATION STATEMENT AND ANY OTHER RELEVANT DOCUMENTS FILED WITH THE SEC, INCLUDING THE PROXY STATEMENT/PROSPECTUS THAT WILL BE PART OF THE REGISTRATION STATEMENT, AS WELL AS ANY AMENDMENTS OR SUPPLEMENTS TO THOSE DOCUMENTS, WHEN THEY BECOME AVAILABLE, BECAUSE THEY WILL CONTAIN IMPORTANT INFORMATION ABOUT THE PROPOSED ACQUISITION AND RELATED MATTERS. The final proxy statement/prospectus will be mailed to SCBH’s shareholders. Investors and security holders will be able to obtain the documents, and any other documents EFSC has filed with the SEC, free of charge at the SEC’s website, www.sec.gov. In addition, documents filed with the SEC by EFSC will be available free of charge by (1) accessing EFSC’s website at www.enterprisebank.com under the “Investor Relations” link, (2) writing EFSC at 150 North Meramec, Clayton, Missouri 63105, Attention: Investor Relations, or (3) writing SCBH at 11939 Rancho Bernardo Road, Suite 200, San Diego, CA 92128, Attention: Chief Financial Officer. EFSC and SCBH and certain of their directors and executive officers may be deemed to be participants in the solicitation of proxies from the shareholders of SCBH in connection with the proposed merger. Information about the directors and executive officers of EFSC is set forth in the proxy statement for EFSC’s 2020 annual meeting of shareholders, as filed with the SEC on a Schedule 14A on March 25, 2020, and as amended by supplements to the proxy statement filed with the SEC on March 25, 2020 and April 15, 2020. Additional information regarding the interests of those participants and other persons who may be deemed participants in the transaction may be obtained by reading the proxy statement/prospectus regarding the proposed acquisition when it becomes available. Free copies of this document may be obtained as described in the preceding paragraph. 3
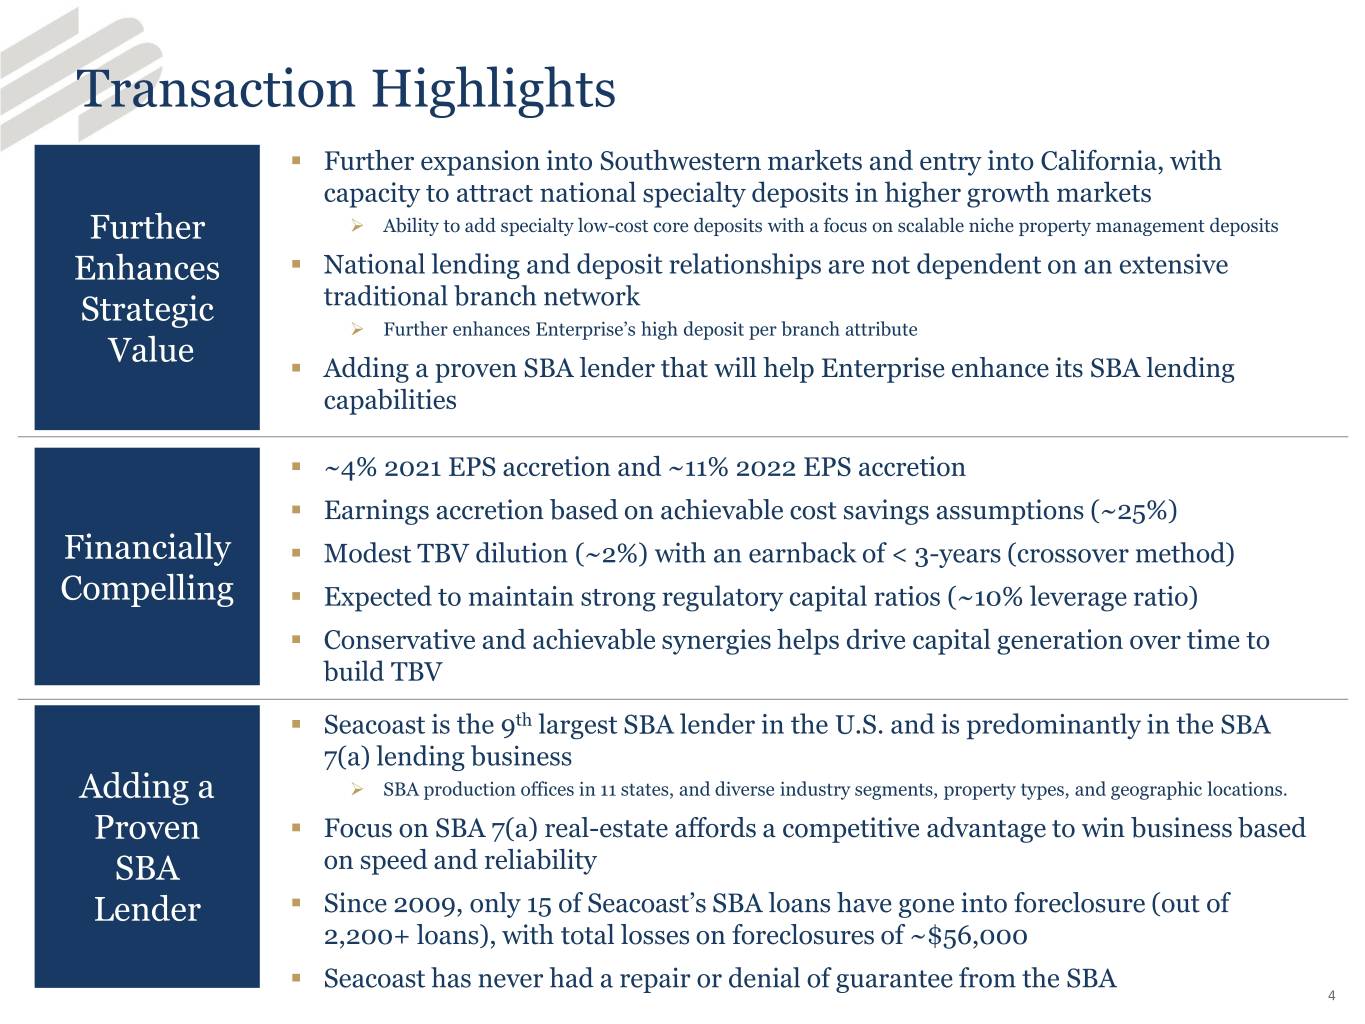
Transaction Highlights ▪ Further expansion into Southwestern markets and entry into California, with capacity to attract national specialty deposits in higher growth markets Further ➢ Ability to add specialty low-cost core deposits with a focus on scalable niche property management deposits Enhances ▪ National lending and deposit relationships are not dependent on an extensive Strategic traditional branch network ➢ Further enhances Enterprise’s high deposit per branch attribute Value ▪ Adding a proven SBA lender that will help Enterprise enhance its SBA lending capabilities ▪ ~4% 2021 EPS accretion and ~11% 2022 EPS accretion ▪ Earnings accretion based on achievable cost savings assumptions (~25%) Financially ▪ Modest TBV dilution (~2%) with an earnback of < 3-years (crossover method) Compelling ▪ Expected to maintain strong regulatory capital ratios (~10% leverage ratio) ▪ Conservative and achievable synergies helps drive capital generation over time to build TBV ▪ Seacoast is the 9th largest SBA lender in the U.S. and is predominantly in the SBA 7(a) lending business Adding a ➢ SBA production offices in 11 states, and diverse industry segments, property types, and geographic locations. Proven ▪ Focus on SBA 7(a) real-estate affords a competitive advantage to win business based SBA on speed and reliability Lender ▪ Since 2009, only 15 of Seacoast’s SBA loans have gone into foreclosure (out of 2,200+ loans), with total losses on foreclosures of ~$56,000 ▪ Seacoast has never had a repair or denial of guarantee from the SBA 4
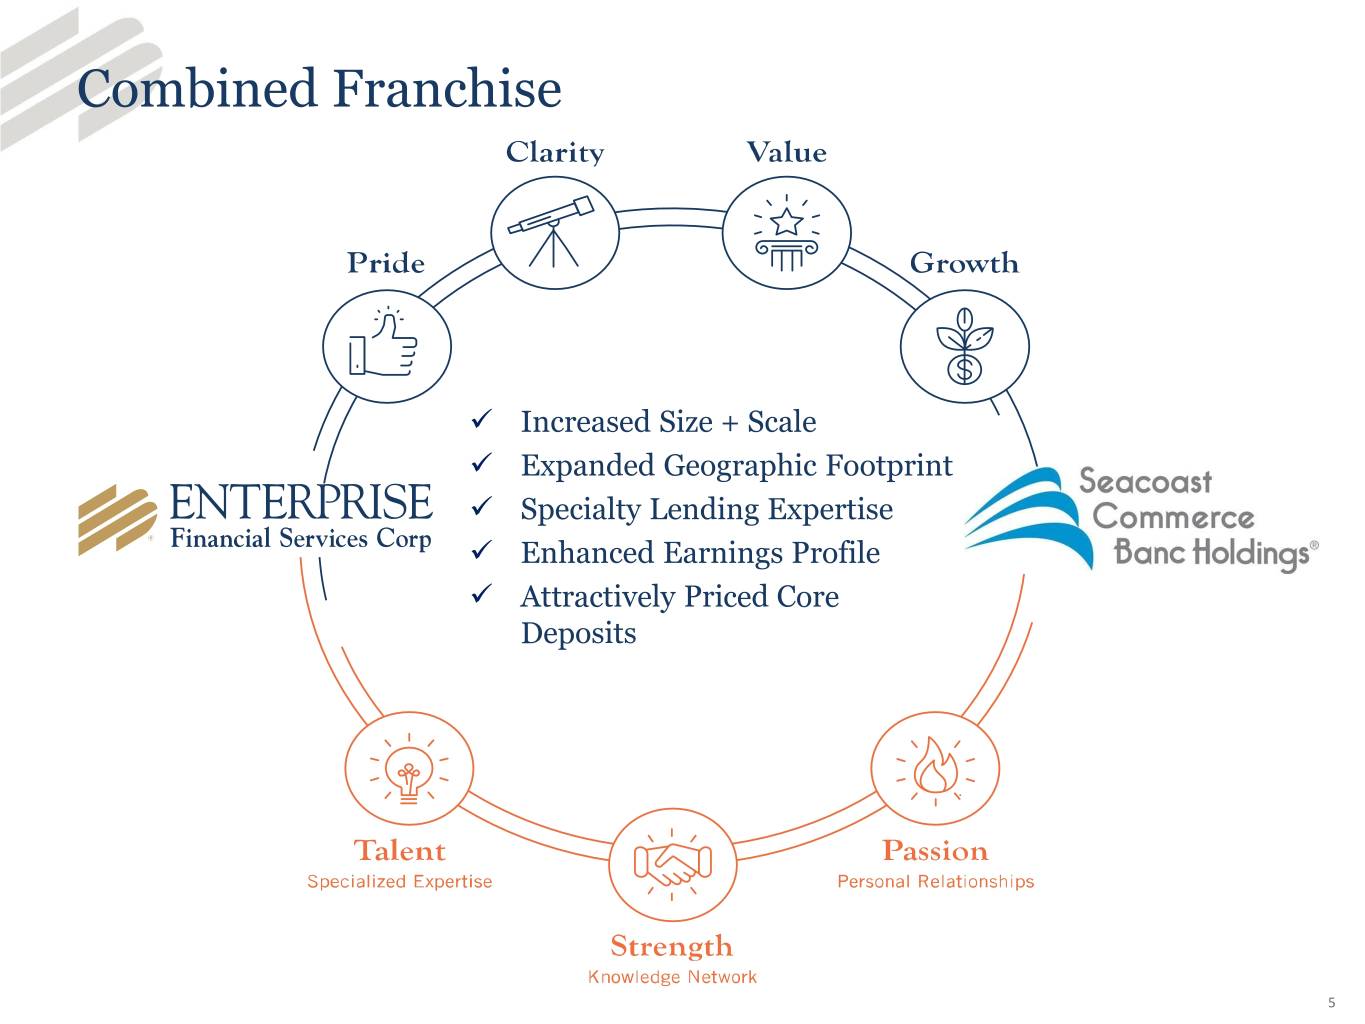
Combined Franchise ✓ Increased Size + Scale ✓ Expanded Geographic Footprint ✓ Specialty Lending Expertise ✓ Enhanced Earnings Profile ✓ Attractively Priced Core Deposits 5
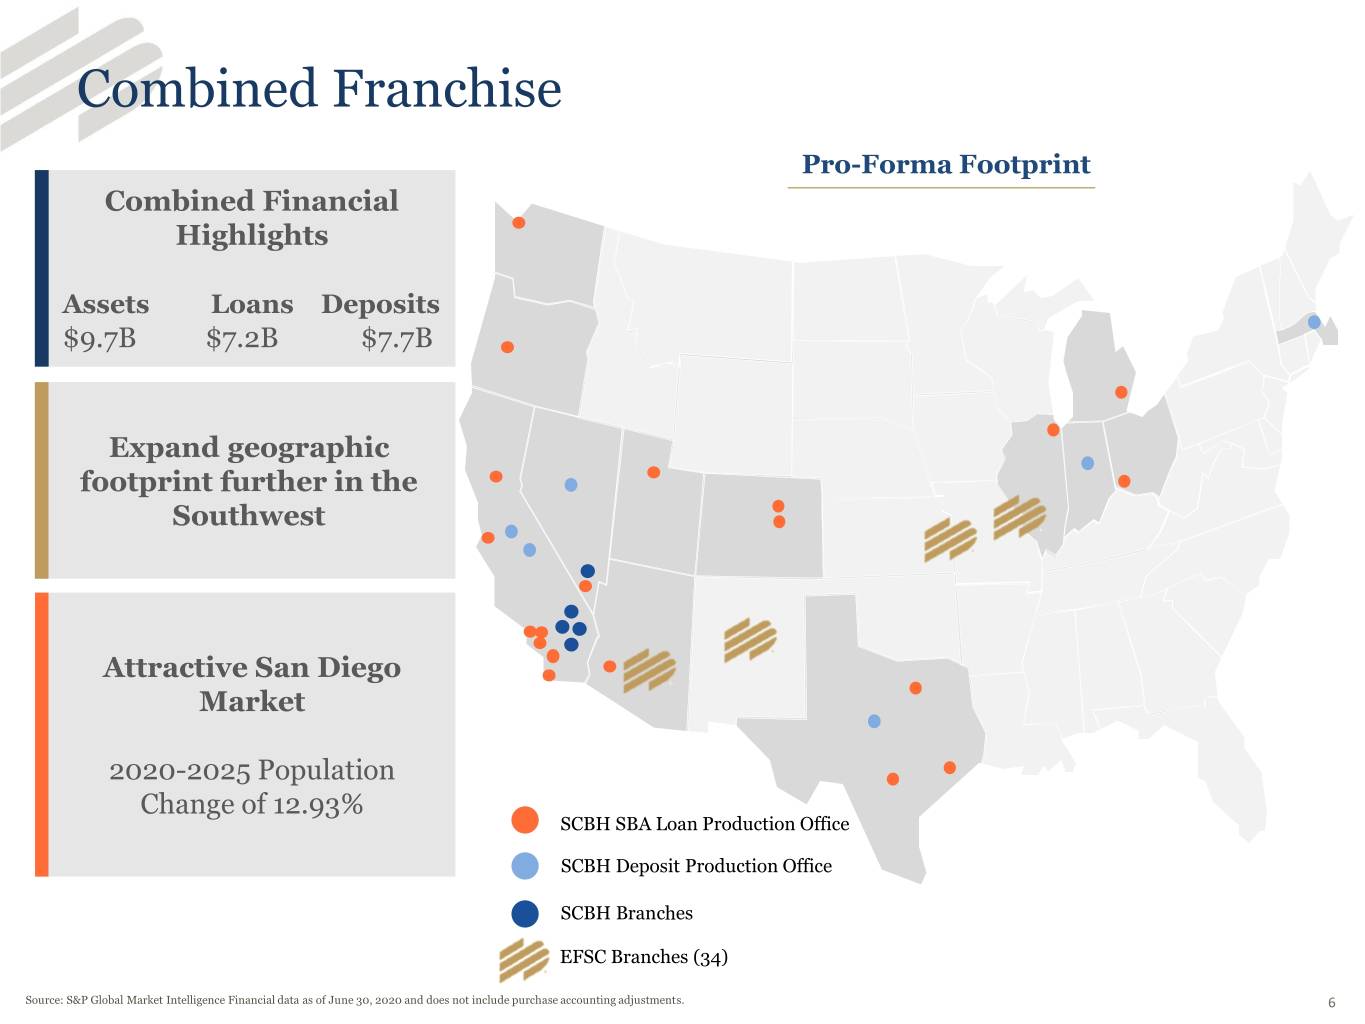
Combined Franchise Pro-Forma Footprint Combined Financial Highlights Assets Loans Deposits $9.7B $7.2B $7.7B Expand geographic footprint further in the Southwest Attractive San Diego Market 2020-2025 Population Change of 12.93% SCBH SBA Loan Production Office SCBH Deposit Production Office SCBH Branches EFSC Branches (34) Source: S&P Global Market Intelligence Financial data as of June 30, 2020 and does not include purchase accounting adjustments. 6
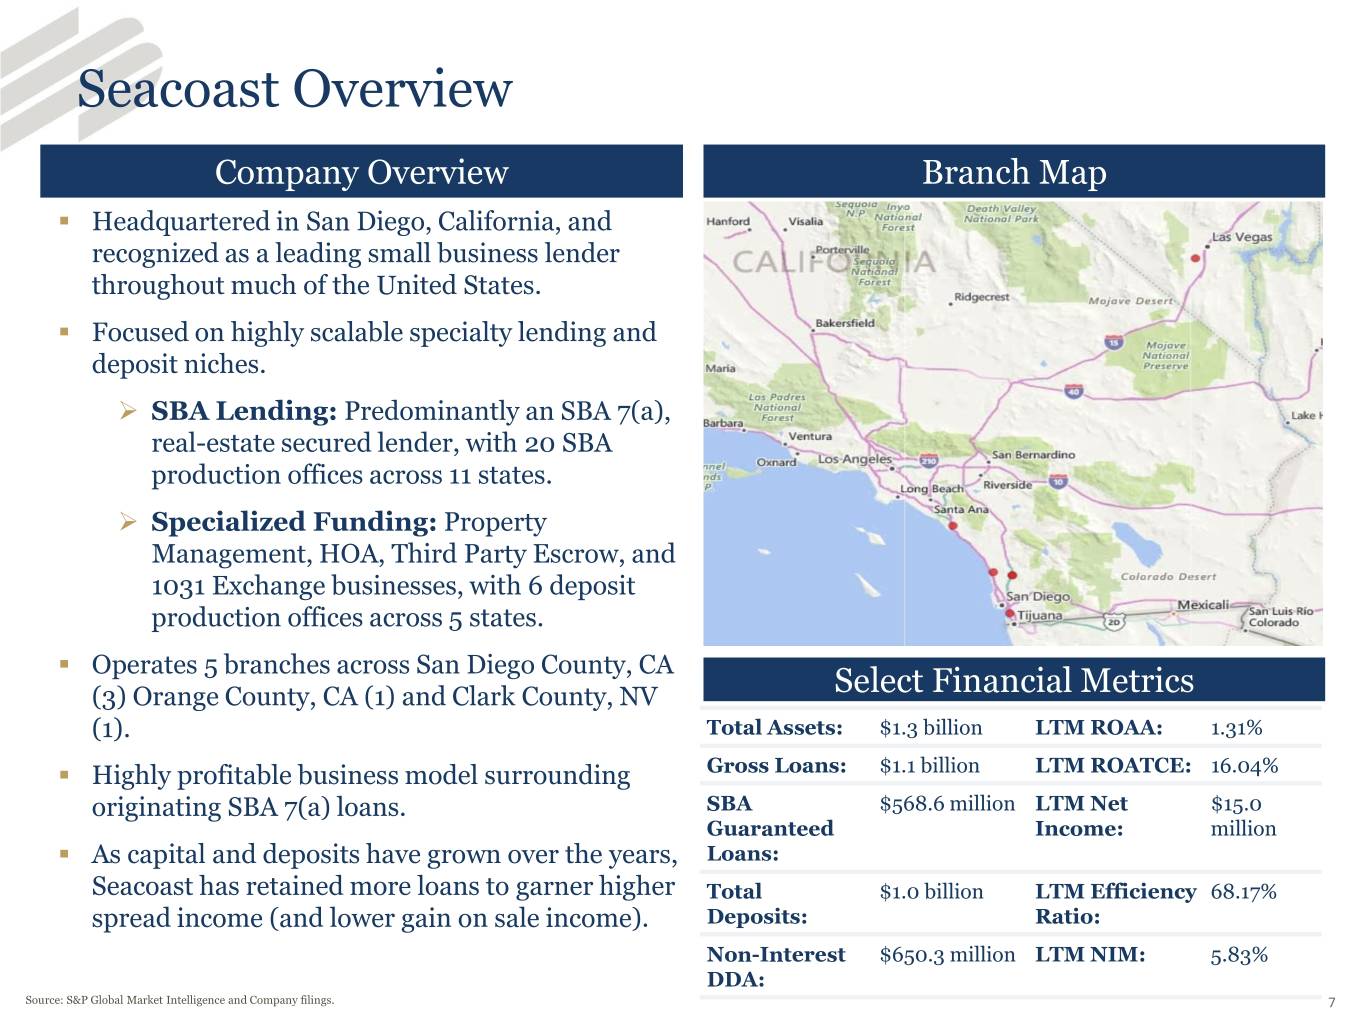
Seacoast Overview Company Overview Branch Map ▪ Headquartered in San Diego, California, and recognized as a leading small business lender throughout much of the United States. ▪ Focused on highly scalable specialty lending and deposit niches. ➢ SBA Lending: Predominantly an SBA 7(a), real-estate secured lender, with 20 SBA production offices across 11 states. ➢ Specialized Funding: Property Management, HOA, Third Party Escrow, and 1031 Exchange businesses, with 6 deposit production offices across 5 states. ▪ Operates 5 branches across San Diego County, CA (3) Orange County, CA (1) and Clark County, NV Select Financial Metrics (1). Total Assets: $1.3 billion LTM ROAA: 1.31% ▪ Highly profitable business model surrounding Gross Loans: $1.1 billion LTM ROATCE: 16.04% originating SBA 7(a) loans. SBA $568.6 million LTM Net $15.0 Guaranteed Income: million ▪ As capital and deposits have grown over the years, Loans: Seacoast has retained more loans to garner higher Total $1.0 billion LTM Efficiency 68.17% spread income (and lower gain on sale income). Deposits: Ratio: Non-Interest $650.3 million LTM NIM: 5.83% DDA: Source: S&P Global Market Intelligence and Company filings. 7

Seacoast’s Deposit Franchise Total Deposits by Type ($mm) Compound Annual Growth Rate Property Management 53% Homeowners Association 27% 1031 Exchange 23% Branch Deposits 7% $1,200.0 Total Deposits 21% $1,041.1 $958.4 $1,000.0 $808.8 $289.1 $253.2 $800.0 $720.9 $167.4 $112.3 $600.0 $510.2 $239.0 $315.0 $463.3 $151.6 $172.4 $68.0 $362.1 $50.0 $80.5 $400.0 $133.0 $174.8 $186.6 $28.0 $107.0 $153.4 $86.0 $49.0 $122.0 $130.0 $200.0 $376.5 $294.2 $279.6 $283.6 $199.1 $184.3 $179.2 $- 2014 2015 2016 2017 2018 2019 Jun-20 Branch Deposits 1031 Exchange Homeowners Association Property Management Source: S&P Global Market Intelligence and Company filings. Note for 1031 Exchange Deposits in 2017, the balances were intentionally reduced pending Tax Reform resolution. 8
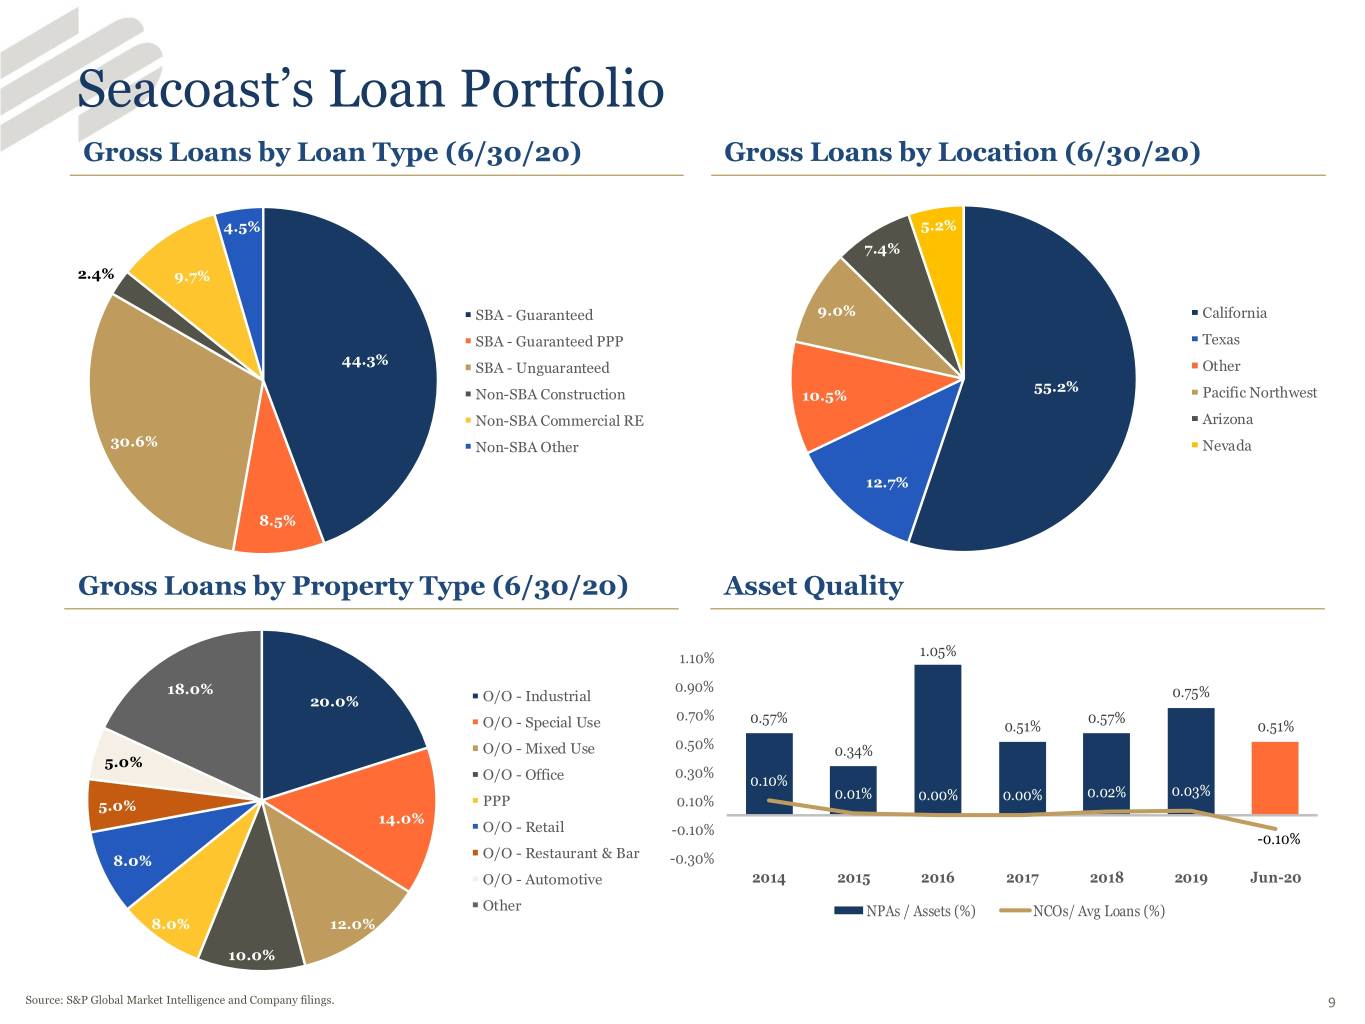
Seacoast’s Loan Portfolio Gross Loans by Loan Type (6/30/20) Gross Loans by Location (6/30/20) 4.5% 5.2% 7.4% 2.4% 9.7% SBA - Guaranteed 9.0% California SBA - Guaranteed PPP Texas 44.3% SBA - Unguaranteed Other 55.2% Non-SBA Construction 10.5% Pacific Northwest Non-SBA Commercial RE Arizona 30.6% Non-SBA Other Nevada 12.7% 8.5% Gross Loans by Property Type (6/30/20) Asset Quality 1.10% 1.05% 18.0% 0.90% 0.75% 20.0% O/O - Industrial 0.70% 0.57% 0.57% O/O - Special Use 0.51% 0.51% O/O - Mixed Use 0.50% 0.34% 5.0% 0.30% O/O - Office 0.10% 0.01% 0.00% 0.00% 0.02% 0.03% 5.0% PPP 0.10% 14.0% O/O - Retail -0.10% -0.10% O/O - Restaurant & Bar 8.0% -0.30% O/O - Automotive 2014 2015 2016 2017 2018 2019 Jun-20 Other NPAs / Assets (%) NCOs/ Avg Loans (%) 8.0% 12.0% 10.0% Source: S&P Global Market Intelligence and Company filings. 9
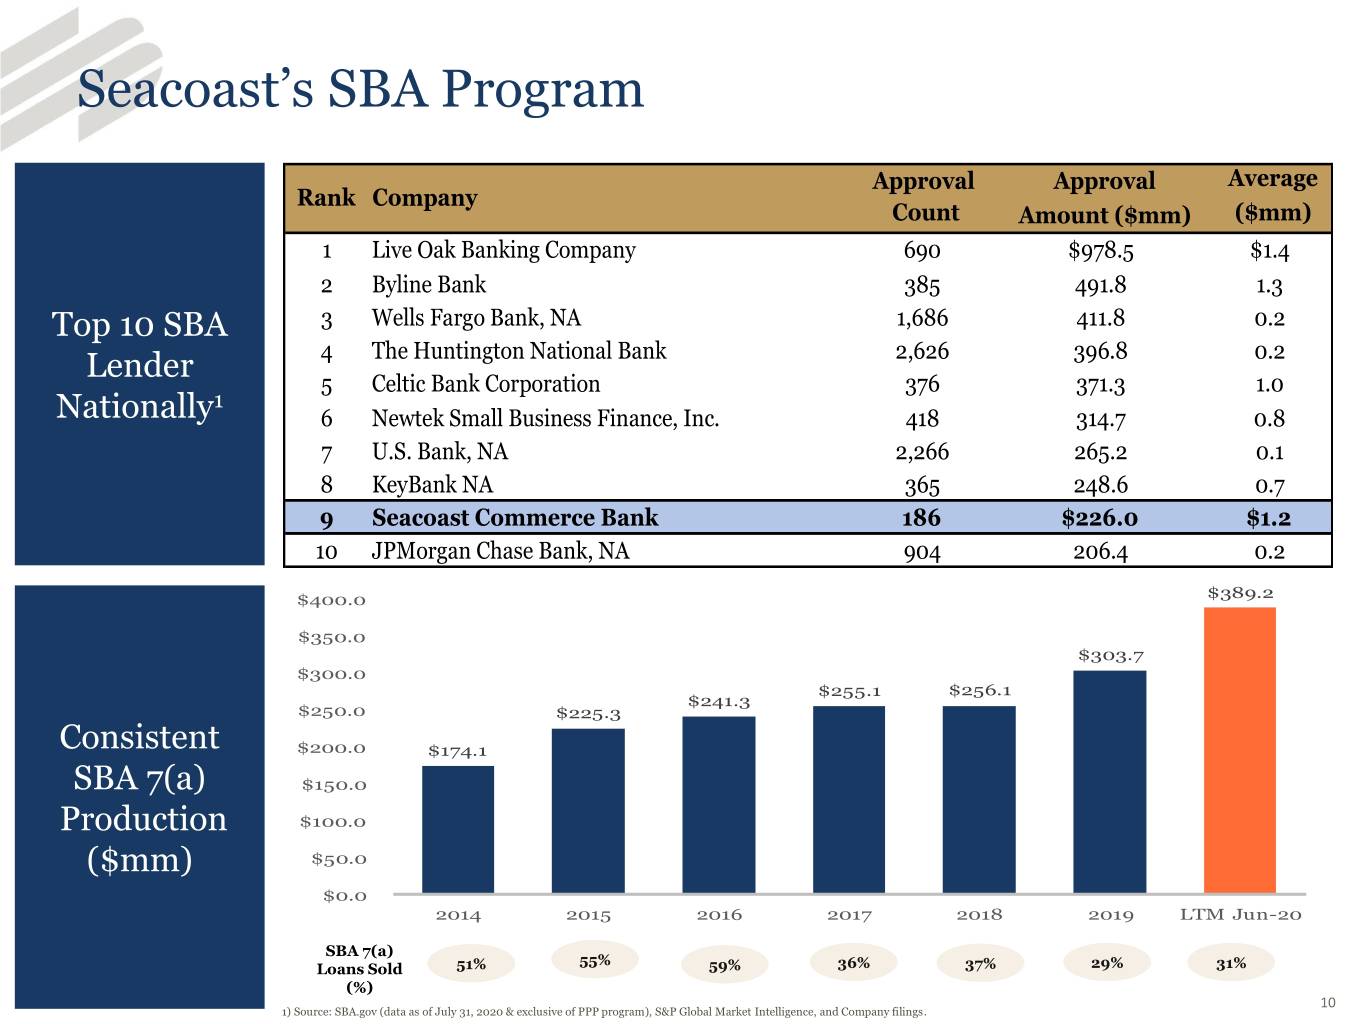
Seacoast’s SBA Program Approval Approval Average Rank Company Count Amount ($mm) ($mm) 1 Live Oak Banking Company 690 $978.5 $1.4 2 Byline Bank 385 491.8 1.3 Top 10 SBA 3 Wells Fargo Bank, NA 1,686 411.8 0.2 Lender 4 The Huntington National Bank 2,626 396.8 0.2 5 Celtic Bank Corporation 376 371.3 1.0 1 Nationally 6 Newtek Small Business Finance, Inc. 418 314.7 0.8 7 U.S. Bank, NA 2,266 265.2 0.1 8 KeyBank NA 365 248.6 0.7 9 Seacoast Commerce Bank 186 $226.0 $1.2 10 JPMorgan Chase Bank, NA 904 206.4 0.2 $400.0 $389.2 $350.0 $303.7 $300.0 $255.1 $256.1 $241.3 $250.0 $225.3 Consistent $200.0 $174.1 SBA 7(a) $150.0 Production $100.0 ($mm) $50.0 $0.0 2014 2015 2016 2017 2018 2019 LTM Jun-20 SBA 7(a) 55% 55% Loans Sold 51% 3659%% 37% 36% 29% 37% 29% 31% (%) 10 1) Source: SBA.gov (data as of July 31, 2020 & exclusive of PPP program), S&P Global Market Intelligence, and Company filings.
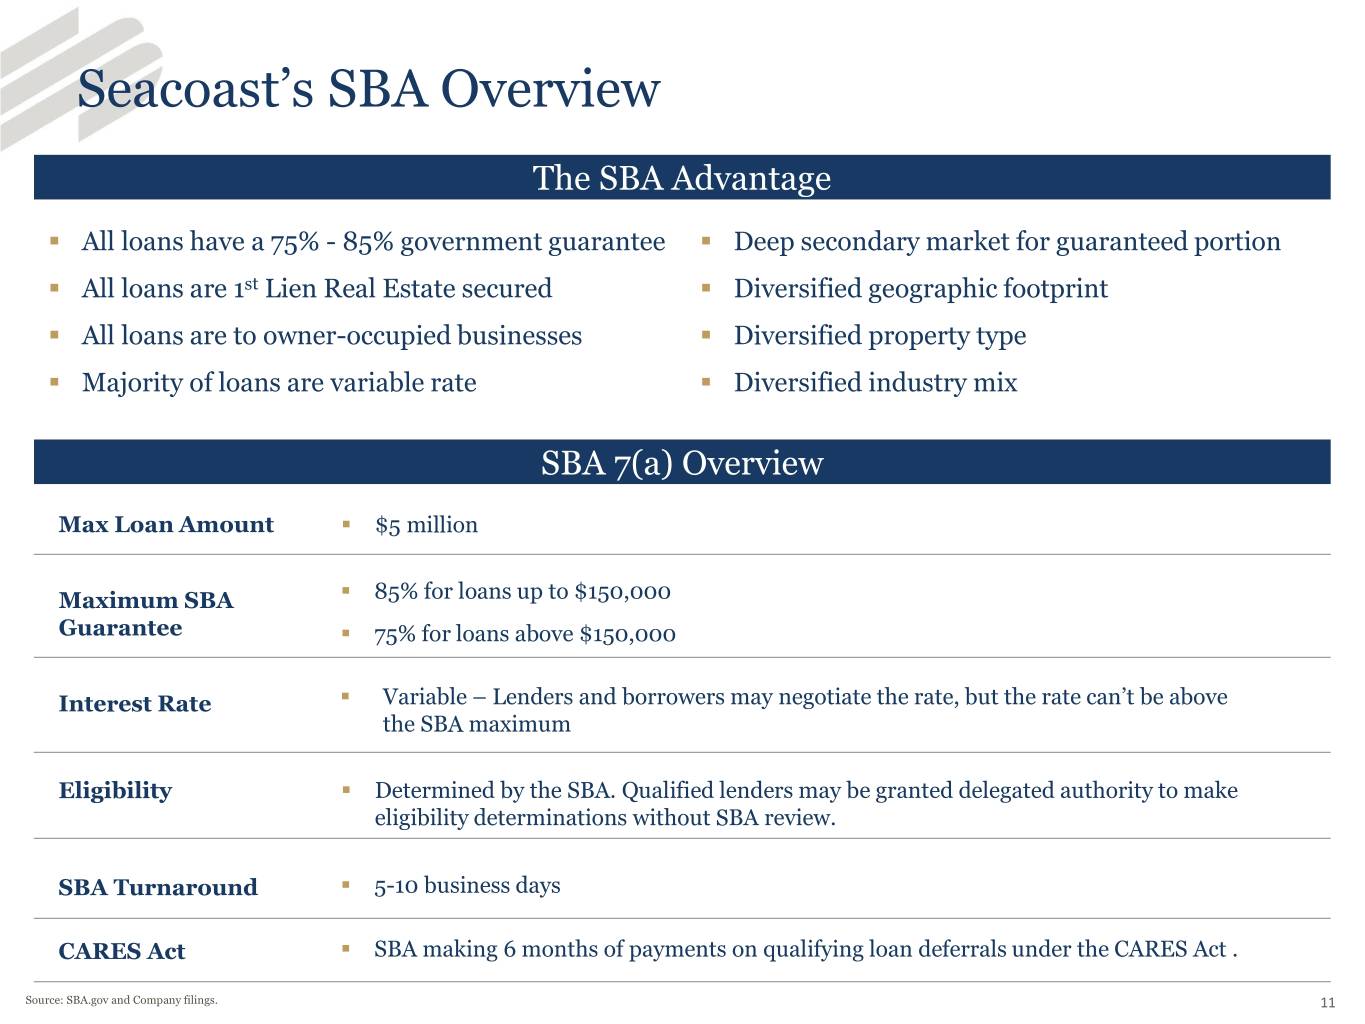
Seacoast’s SBA Overview The SBA Advantage ▪ All loans have a 75% - 85% government guarantee ▪ Deep secondary market for guaranteed portion ▪ All loans are 1st Lien Real Estate secured ▪ Diversified geographic footprint ▪ All loans are to owner-occupied businesses ▪ Diversified property type ▪ Majority of loans are variable rate ▪ Diversified industry mix SBA 7(a) Overview Max Loan Amount ▪ $5 million Maximum SBA ▪ 85% for loans up to $150,000 Guarantee ▪ 75% for loans above $150,000 Interest Rate ▪ Variable – Lenders and borrowers may negotiate the rate, but the rate can’t be above the SBA maximum Eligibility ▪ Determined by the SBA. Qualified lenders may be granted delegated authority to make eligibility determinations without SBA review. SBA Turnaround ▪ 5-10 business days CARES Act ▪ SBA making 6 months of payments on qualifying loan deferrals under the CARES Act . Source: SBA.gov and Company filings. 11

Seacoast’s Financial Performance Highlights Net Income ($mm) ROATCE $16.0 $14.6 $15.0 20.00% 18.77% 18.16% 17.42% 17.04% 16.73% $14.0 $12.9 18.00% 16.57% 16.04% 16.00% $12.0 14.00% $10.0 $8.1 12.00% $8.0 $6.9 10.00% $5.8 8.00% $6.0 $4.3 6.00% $4.0 4.00% $2.0 2.00% $0.0 0.00% 2014 2015 2016 2017* 2018 2019 LTM Jun- 2014 2015 2016 2017* 2018 2019 LTM Jun-20 20 ROAA Efficiency Ratio 1.35% 1.34% 73.00% 1.31% 1.30% 72.00% 71.74% 1.30% 1.27% 1.27% 71.00% 70.22% 69.88% 1.25% 70.00% 1.22% 69.17% 1.21% 68.91% 69.00% 1.20% 68.01% 68.17% 68.00% 1.15% 67.00% 1.10% 66.00% 2014 2015 2016 2017* 2018 2019 LTM Jun- 2014 2015 2016 2017 2018 2019 LTM Jun-20 20 Source: S&P Global Market Intelligence and Company filings. * Excludes one-time merger expenses and DTA write-downs. 12
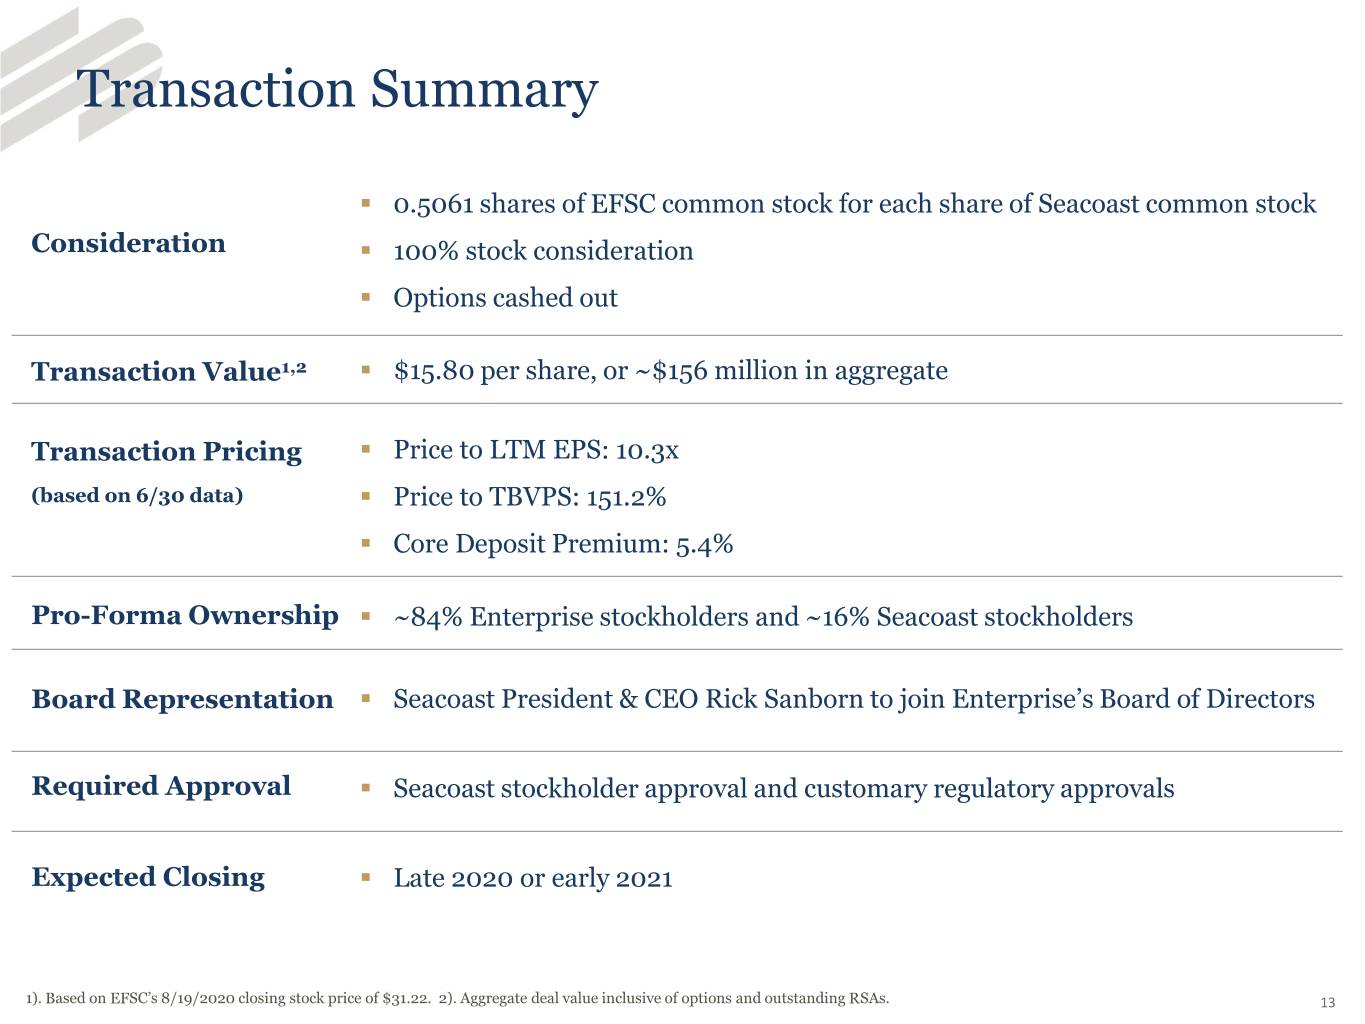
Transaction Summary ▪ 0.5061 shares of EFSC common stock for each share of Seacoast common stock Consideration ▪ 100% stock consideration ▪ Options cashed out Transaction Value1,2 ▪ $15.80 per share, or ~$156 million in aggregate Transaction Pricing ▪ Price to LTM EPS: 10.3x (based on 6/30 data) ▪ Price to TBVPS: 151.2% ▪ Core Deposit Premium: 5.4% Pro-Forma Ownership ▪ ~84% Enterprise stockholders and ~16% Seacoast stockholders Board Representation ▪ Seacoast President & CEO Rick Sanborn to join Enterprise’s Board of Directors Required Approval ▪ Seacoast stockholder approval and customary regulatory approvals Expected Closing ▪ Late 2020 or early 2021 1). Based on EFSC’s 8/19/2020 closing stock price of $31.22. 2). Aggregate deal value inclusive of options and outstanding RSAs. 13

Key Transaction Assumptions Cost Savings ▪ ~25% of Seacoast’s noninterest expense; 85% realized in 2021, 100% thereafter Under CECL, loans are separated into non-purchase credit deteriorated (non-PCD) and purchase credit deteriorated (PCD). ▪ Gross Credit Mark: ~$9.5 million Credit Mark ➢ Loan Non-PCD Credit Mark: ~$8.6 million, accreted back into income over life of loans & CECL ➢ Assumptions Loan PCD Credit Mark: ~$0.9 million ▪ “Day 2” CECL Reserve: ~$8.6 million (1.0x Non-PCD mark, assumed at time zero) ▪ $18.1 million total (credit marks + CECL): ~3.5% of $521.6 million loans held for investment as of 6/30/20 (SBA unguaranteed portion and non-SBA loans) ▪ Loan FMV: ~$34.0 million mark-up on loans held for sale ($568.6 million as of 6/30/20, Other FMV SBA guaranteed portion) Adjustments ▪ Loan Interest Rate: ~$3.7 million mark-up Core Deposit ▪ 0.23% of non-time deposits, amortized using sum-of-years digits over 10 years Intangible Merger ▪ ~$17.9 million in pre-tax, one-time expenses Expenses ▪ Fully reflected in pro forma tangible book value at closing Earnings ▪ Enterprise: Median consensus estimates 2021 and 2022 Estimates ▪ Seacoast: Management forecast 2021 and 2022 14

Appendix
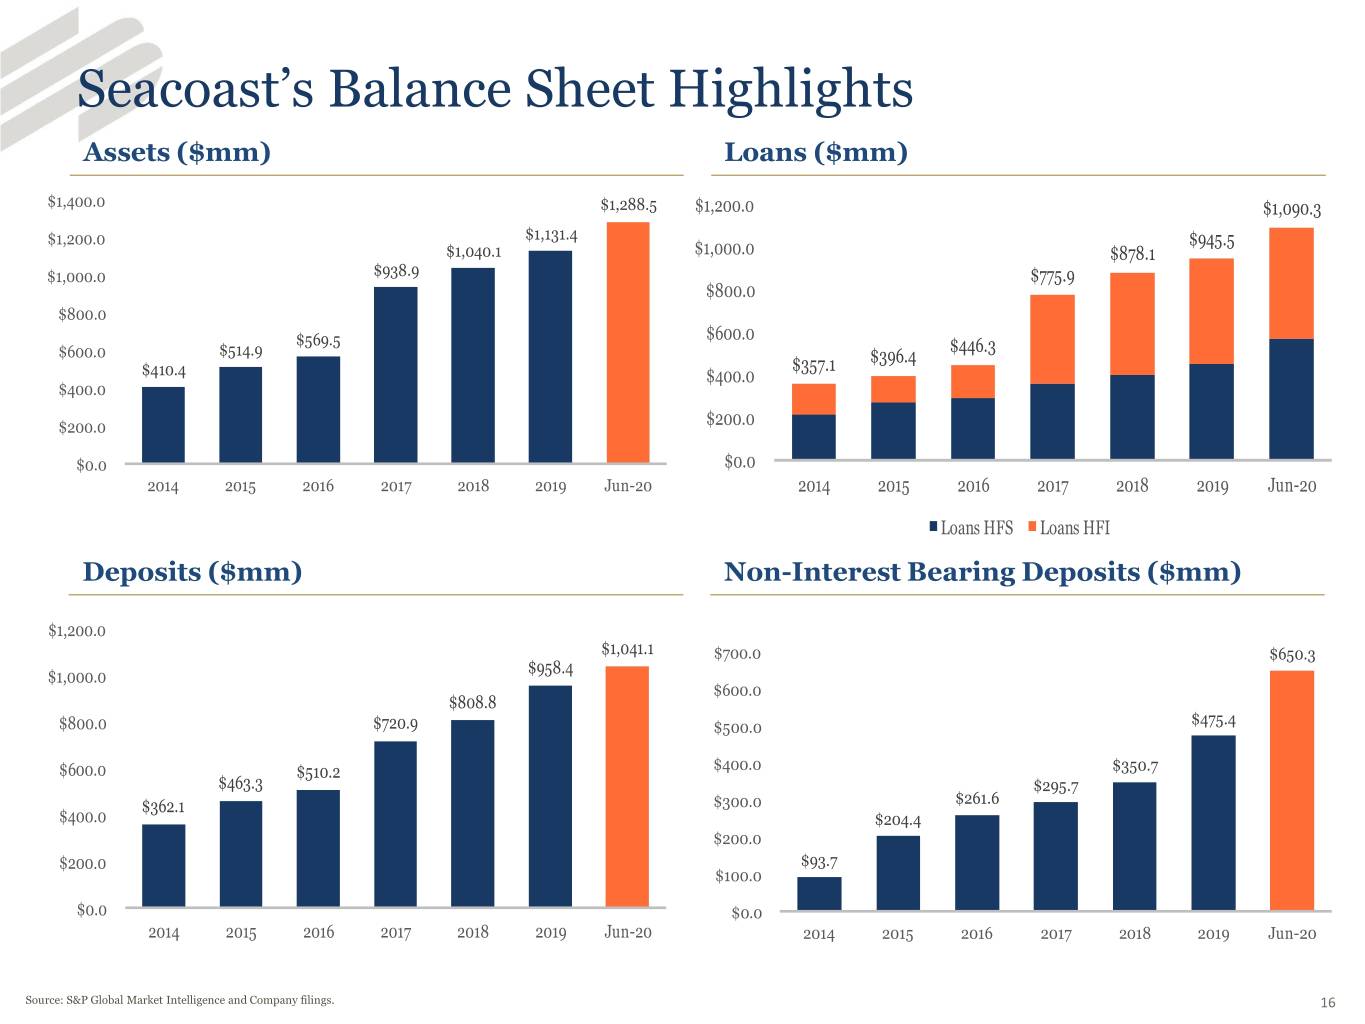
Seacoast’s Balance Sheet Highlights Assets ($mm) Loans ($mm) $1,400.0 $1,288.5 $1,200.0 $1,090.3 $1,200.0 $1,131.4 $945.5 $1,040.1 $1,000.0 $878.1 $1,000.0 $938.9 $775.9 $800.0 $800.0 $569.5 $600.0 $600.0 $514.9 $446.3 $357.1 $396.4 $410.4 $400.0 $400.0 $200.0 $200.0 $0.0 $0.0 2014 2015 2016 2017 2018 2019 Jun-20 2014 2015 2016 2017 2018 2019 Jun-20 Loans HFS Loans HFI Deposits ($mm) Non-Interest Bearing Deposits ($mm) $1,200.0 $1,041.1 $700.0 $650.3 $958.4 $1,000.0 $600.0 $808.8 $800.0 $720.9 $500.0 $475.4 $600.0 $510.2 $400.0 $350.7 $463.3 $295.7 $362.1 $300.0 $261.6 $400.0 $204.4 $200.0 $200.0 $93.7 $100.0 $0.0 $0.0 2014 2015 2016 2017 2018 2019 Jun-20 2014 2015 2016 2017 2018 2019 Jun-20 Source: S&P Global Market Intelligence and Company filings. 16
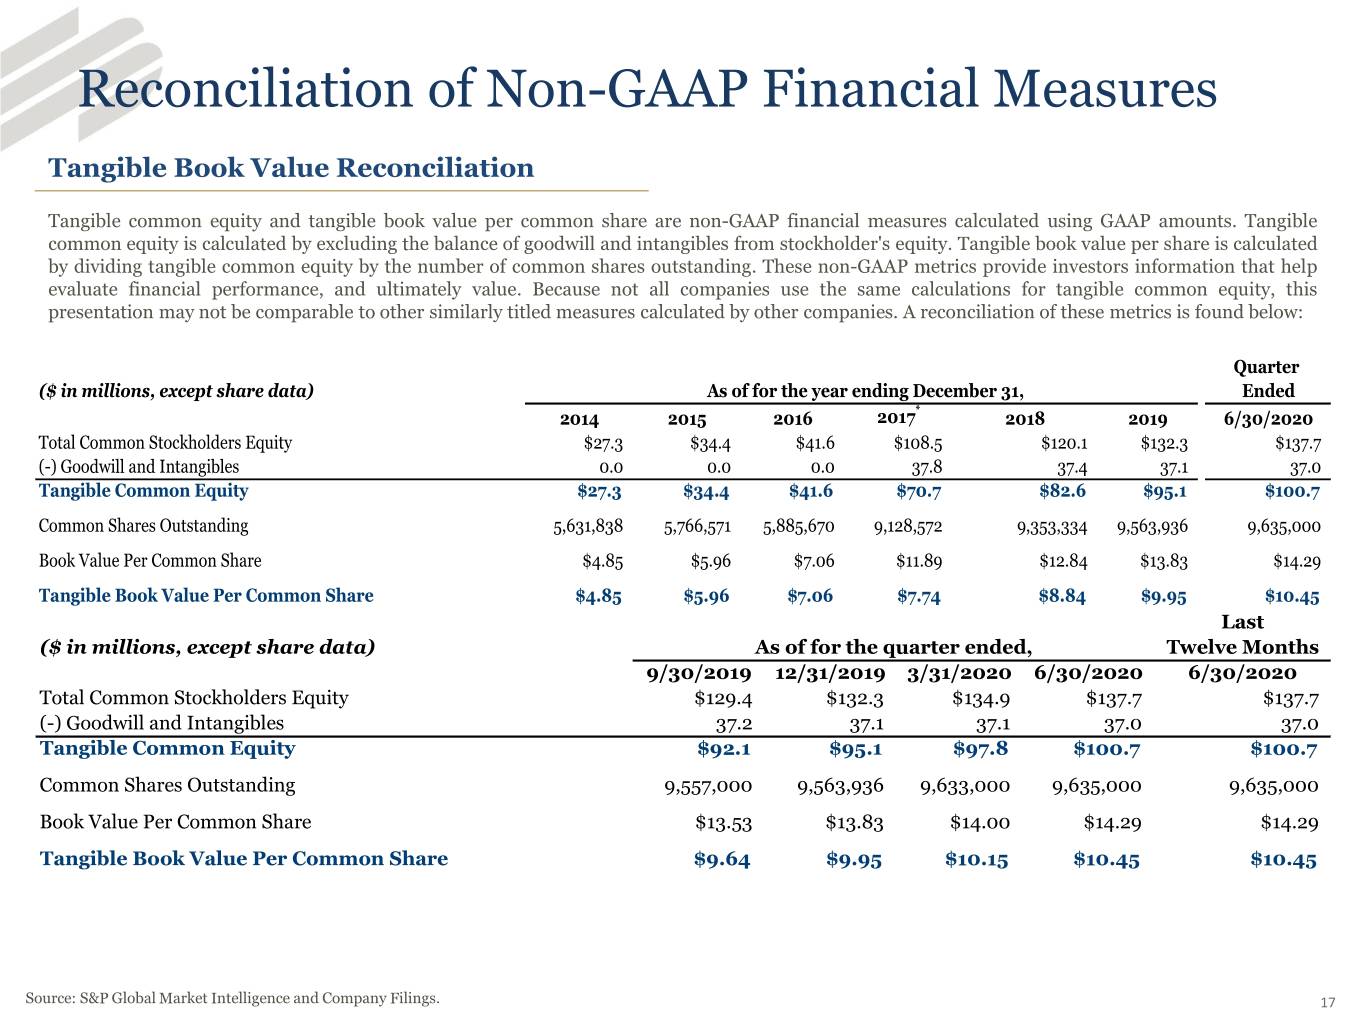
Reconciliation of Non-GAAP Financial Measures Tangible Book Value Reconciliation Tangible common equity and tangible book value per common share are non-GAAP financial measures calculated using GAAP amounts. Tangible common equity is calculated by excluding the balance of goodwill and intangibles from stockholder's equity. Tangible book value per share is calculated by dividing tangible common equity by the number of common shares outstanding. These non-GAAP metrics provide investors information that help evaluate financial performance, and ultimately value. Because not all companies use the same calculations for tangible common equity, this presentation may not be comparable to other similarly titled measures calculated by other companies. A reconciliation of these metrics is found below: Quarter ($ in millions, except share data) As of for the year ending December 31, Ended 2014 2015 2016 2017* 2018 2019 6/30/2020 Total Common Stockholders Equity $27.3 $34.4 $41.6 $108.5 $120.1 $132.3 $137.7 (-) Goodwill and Intangibles 0.0 0.0 0.0 37.8 37.4 37.1 37.0 Tangible Common Equity $27.3 $34.4 $41.6 $70.7 $82.6 $95.1 $100.7 Common Shares Outstanding 5,631,838 5,766,571 5,885,670 9,128,572 9,353,334 9,563,936 9,635,000 Book Value Per Common Share $4.85 $5.96 $7.06 $11.89 $12.84 $13.83 $14.29 Tangible Book Value Per Common Share $4.85 $5.96 $7.06 $7.74 $8.84 $9.95 $10.45 Last ($ in millions, except share data) As of for the quarter ended, Twelve Months 9/30/2019 12/31/2019 3/31/2020 6/30/2020 6/30/2020 Total Common Stockholders Equity $129.4 $132.3 $134.9 $137.7 $137.7 (-) Goodwill and Intangibles 37.2 37.1 37.1 37.0 37.0 Tangible Common Equity $92.1 $95.1 $97.8 $100.7 $100.7 Common Shares Outstanding 9,557,000 9,563,936 9,633,000 9,635,000 9,635,000 Book Value Per Common Share $13.53 $13.83 $14.00 $14.29 $14.29 Tangible Book Value Per Common Share $9.64 $9.95 $10.15 $10.45 $10.45 Source: S&P Global Market Intelligence and Company Filings. 17
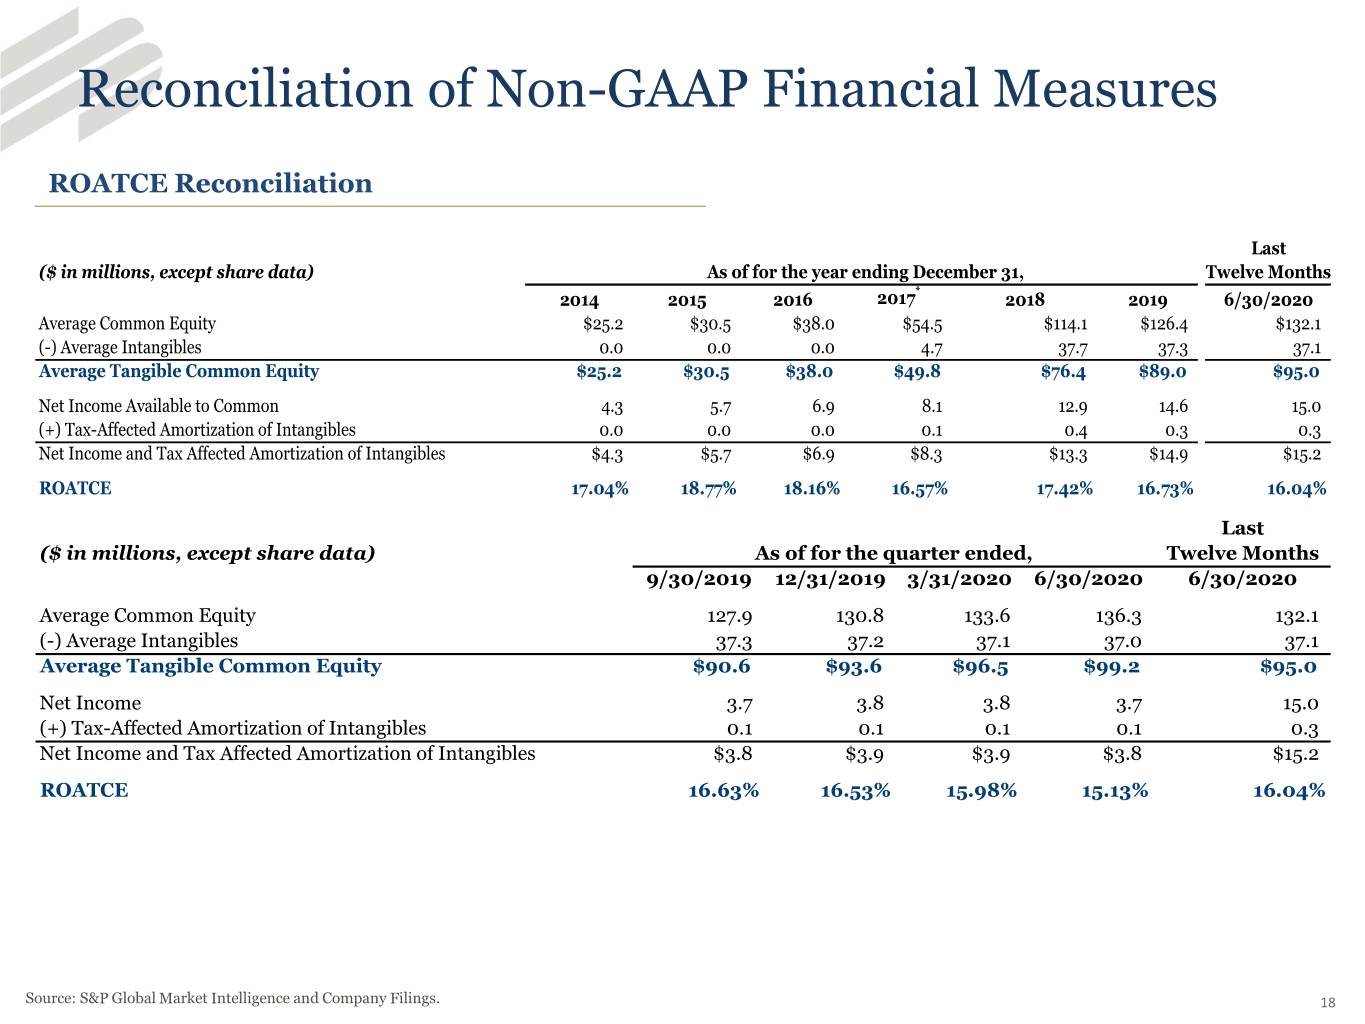
Reconciliation of Non-GAAP Financial Measures ROATCE Reconciliation Last ($ in millions, except share data) As of for the year ending December 31, Twelve Months 2014 2015 2016 2017* 2018 2019 6/30/2020 Average Common Equity $25.2 $30.5 $38.0 $54.5 $114.1 $126.4 $132.1 (-) Average Intangibles 0.0 0.0 0.0 4.7 37.7 37.3 37.1 Average Tangible Common Equity $25.2 $30.5 $38.0 $49.8 $76.4 $89.0 $95.0 Net Income Available to Common 4.3 5.7 6.9 8.1 12.9 14.6 15.0 (+) Tax-Affected Amortization of Intangibles 0.0 0.0 0.0 0.1 0.4 0.3 0.3 Net Income and Tax Affected Amortization of Intangibles $4.3 $5.7 $6.9 $8.3 $13.3 $14.9 $15.2 ROATCE 17.04% 18.77% 18.16% 16.57% 17.42% 16.73% 16.04% Last ($ in millions, except share data) As of for the quarter ended, Twelve Months 9/30/2019 12/31/2019 3/31/2020 6/30/2020 6/30/2020 Average Common Equity 127.9 130.8 133.6 136.3 132.1 (-) Average Intangibles 37.3 37.2 37.1 37.0 37.1 Average Tangible Common Equity $90.6 $93.6 $96.5 $99.2 $95.0 Net Income 3.7 3.8 3.8 3.7 15.0 (+) Tax-Affected Amortization of Intangibles 0.1 0.1 0.1 0.1 0.3 Net Income and Tax Affected Amortization of Intangibles $3.8 $3.9 $3.9 $3.8 $15.2 ROATCE 16.63% 16.53% 15.98% 15.13% 16.04% Source: S&P Global Market Intelligence and Company Filings. 18

19
