Attached files
| file | filename |
|---|---|
| EX-32.2 - EX-32.2 - Blackstone Real Estate Income Trust, Inc. | breit-ex322_7.htm |
| EX-32.1 - EX-32.1 - Blackstone Real Estate Income Trust, Inc. | breit-ex321_6.htm |
| EX-31.2 - EX-31.2 - Blackstone Real Estate Income Trust, Inc. | breit-ex312_8.htm |
| EX-31.1 - EX-31.1 - Blackstone Real Estate Income Trust, Inc. | breit-ex311_9.htm |
UNITED STATES
SECURITIES AND EXCHANGE COMMISSION
WASHINGTON, D.C. 20549
FORM 10-Q
|
☒ |
QUARTERLY REPORT PURSUANT TO SECTION 13 OR 15(d) OF THE SECURITIES EXCHANGE ACT OF 1934 |
FOR THE QUARTERLY PERIOD ENDED JUNE 30, 2020
OR
|
☐ |
TRANSITION REPORT PURSUANT TO SECTION 13 OR 15(d) OF THE SECURITIES EXCHANGE ACT OF 1934 |
FOR THE TRANSITION PERIOD FROM TO
Commission File Number: 000-55931

Blackstone Real Estate Income Trust, Inc.
(Exact name of Registrant as specified in its charter)
|
|
|
|
Maryland |
81-0696966 |
|
(State or other jurisdiction of incorporation or organization) 345 Park Avenue New York, NY (Address of principal executive offices) |
(I.R.S. Employer Identification No.)
10154 (Zip Code) |
Registrant’s telephone number, including area code: (212) 583-5000
Securities registered pursuant to Section 12(b) of the Act: None
|
Title of each class |
|
Trading Symbol(s) |
|
Name of each exchange on which registered |
|
|
|
|
|
|
|
|
|
|
|
|
Indicate by check mark whether the registrant (1) has filed all reports required to be filed by Section 13 or 15(d) of the Securities Exchange Act of 1934 during the preceding 12 months (or for such shorter period that the registrant was required to file such reports), and (2) has been subject to such filing requirements for the past 90 days. Yes ☒ No ☐
Indicate by check mark whether the registrant has submitted electronically every Interactive Data File required to be submitted pursuant to Rule 405 of Regulation S-T (§232.405 of this chapter) during the preceding 12 months (or for such shorter period that the registrant was required to submit such files). Yes ☒ No ☐
Indicate by check mark whether the registrant is a large accelerated filer, an accelerated filer, a non-accelerated filer, smaller reporting company, or an emerging growth company. See the definitions of “large accelerated filer,” “accelerated filer,” “smaller reporting company,” and “emerging growth company” in Rule 12b-2 of the Exchange Act.
|
Large accelerated filer |
|
☐ |
|
Accelerated filer |
|
☐ |
|
|
|
|
|
|||
|
Non-accelerated filer |
|
☒ |
|
Smaller reporting company |
|
☐ |
|
|
|
|
|
|
|
|
|
Emerging growth company |
|
☐ |
|
|
|
|
If an emerging growth company, indicate by check mark if the registrant has elected not to use the extended transition period for complying with any new or revised financial accounting standards provided pursuant to Section 13(a) of the Exchange Act. Yes ☐ No ☐
Indicate by check mark whether the registrant is a shell company (as defined in Rule 12b-2 of the Exchange Act). Yes ☐ No ☒
As of August 13, 2020, the issuer had the following shares outstanding: 653,497,937 shares of Class S common stock, 847,695,707 shares of Class I common stock, 44,940,025 shares of Class T common stock, and 106,976,165 shares of Class D common stock.
|
PART I. |
1 |
|
|
|
|
|
|
ITEM 1. |
1 |
|
|
|
|
|
|
|
Condensed Consolidated Financial Statements (Unaudited): |
|
|
|
|
|
|
|
Condensed Consolidated Balance Sheets as of June 30, 2020 and December 31, 2019 |
1 |
|
|
|
|
|
|
2 |
|
|
|
|
|
|
|
3 |
|
|
|
|
|
|
|
Condensed Consolidated Statements of Cash Flows for the Six Months Ended June 30, 2020 and 2019 |
5 |
|
|
|
|
|
|
7 |
|
|
|
|
|
|
ITEM 2. |
MANAGEMENT’S DISCUSSION AND ANALYSIS OF FINANCIAL CONDITION AND RESULTS OF OPERATIONS |
29 |
|
|
|
|
|
ITEM 3. |
52 |
|
|
|
|
|
|
ITEM 4. |
52 |
|
|
|
|
|
|
PART II. |
53 |
|
|
|
|
|
|
ITEM 1. |
53 |
|
|
|
|
|
|
ITEM 1A. |
53 |
|
|
|
|
|
|
ITEM 2. |
54 |
|
|
|
|
|
|
ITEM 3. |
55 |
|
|
|
|
|
|
ITEM 4. |
55 |
|
|
|
|
|
|
ITEM 5. |
55 |
|
|
|
|
|
|
ITEM 6. |
56 |
|
|
|
|
|
|
57 |
||
Blackstone Real Estate Income Trust, Inc.
Condensed Consolidated Balance Sheets (Unaudited)
(in thousands, except per share data)
|
|
|
June 30, 2020 |
|
|
December 31, 2019 |
|
||
|
Assets |
|
|
|
|
|
|
|
|
|
Investments in real estate, net |
|
$ |
28,939,611 |
|
|
$ |
26,326,868 |
|
|
Investments in unconsolidated entities |
|
|
811,827 |
|
|
|
— |
|
|
Investments in real estate debt |
|
|
4,649,372 |
|
|
|
4,523,260 |
|
|
Cash and cash equivalents |
|
|
263,067 |
|
|
|
204,269 |
|
|
Restricted cash |
|
|
459,819 |
|
|
|
905,433 |
|
|
Other assets |
|
|
1,504,803 |
|
|
|
1,079,993 |
|
|
Total assets |
|
$ |
36,628,499 |
|
|
$ |
33,039,823 |
|
|
|
|
|
|
|
|
|
|
|
|
Liabilities and Equity |
|
|
|
|
|
|
|
|
|
Mortgage notes, term loans, and secured revolving credit facilities, net |
|
$ |
17,846,882 |
|
|
$ |
16,929,659 |
|
|
Secured financings on investments in real estate debt |
|
|
2,369,685 |
|
|
|
3,092,137 |
|
|
Unsecured revolving credit facilities |
|
|
— |
|
|
|
— |
|
|
Due to affiliates |
|
|
613,055 |
|
|
|
690,143 |
|
|
Accounts payable, accrued expenses, and other liabilities |
|
|
1,207,711 |
|
|
|
1,692,087 |
|
|
Total liabilities |
|
|
22,037,333 |
|
|
|
22,404,026 |
|
|
|
|
|
|
|
|
|
|
|
|
Commitments and contingencies |
|
|
— |
|
|
|
— |
|
|
Redeemable non-controlling interests |
|
|
21,653 |
|
|
|
21,149 |
|
|
|
|
|
|
|
|
|
|
|
|
Equity |
|
|
|
|
|
|
|
|
|
Preferred stock, $0.01 par value per share, 100,000 shares authorized; no shares issued and outstanding as of June 30, 2020 and December 31, 2019 |
|
|
— |
|
|
|
— |
|
|
Common stock — Class S shares, $0.01 par value per share, 3,000,000 shares authorized; 632,208 and 530,813 shares issued and outstanding as of June 30, 2020 and December 31, 2019, respectively |
|
|
6,322 |
|
|
|
5,308 |
|
|
Common stock — Class I shares, $0.01 par value per share, 6,000,000 shares authorized; 820,813 and 474,279 shares issued and outstanding as of June 30, 2020 and December 31, 2019, respectively |
|
|
8,200 |
|
|
|
4,743 |
|
|
Common stock — Class T shares, $0.01 par value per share, 500,000 shares authorized; 43,957 and 39,767 shares issued and outstanding as of June 30, 2020 and December 31, 2019, respectively |
|
|
440 |
|
|
|
398 |
|
|
Common stock — Class D shares, $0.01 par value per share, 500,000 shares authorized; 103,162 and 84,657 shares issued and outstanding as of June 30, 2020 and December 31, 2019, respectively |
|
|
1,032 |
|
|
|
847 |
|
|
Additional paid-in capital |
|
|
16,952,056 |
|
|
|
11,716,721 |
|
|
Accumulated deficit and cumulative distributions |
|
|
(2,749,989 |
) |
|
|
(1,422,885 |
) |
|
Total stockholders' equity |
|
|
14,218,061 |
|
|
|
10,305,132 |
|
|
Non-controlling interests attributable to third party joint ventures |
|
|
159,459 |
|
|
|
157,795 |
|
|
Non-controlling interests attributable to BREIT OP unitholders |
|
|
191,993 |
|
|
|
151,721 |
|
|
Total equity |
|
|
14,569,513 |
|
|
|
10,614,648 |
|
|
Total liabilities and equity |
|
$ |
36,628,499 |
|
|
$ |
33,039,823 |
|
See accompanying notes to condensed consolidated financial statements.
1
Blackstone Real Estate Income Trust, Inc.
Condensed Consolidated Statements of Operations (Unaudited)
(in thousands, except per share data)
|
|
|
|
|
|
|
|
|
|
|
|
|||||
|
|
Three Months Ended June 30, |
|
|
Six Months Ended June 30, |
|
||||||||||
|
|
2020 |
|
|
2019 |
|
|
2020 |
|
|
2019 |
|
||||
|
Revenues |
|
|
|
|
|
|
|
|
|
|
|
|
|
|
|
|
Rental revenue |
$ |
553,717 |
|
|
$ |
247,672 |
|
|
$ |
1,085,812 |
|
|
$ |
459,869 |
|
|
Hotel revenue |
|
21,781 |
|
|
|
94,351 |
|
|
|
149,253 |
|
|
|
169,617 |
|
|
Other revenue |
|
17,249 |
|
|
|
12,285 |
|
|
|
32,564 |
|
|
|
21,913 |
|
|
Total revenues |
|
592,747 |
|
|
|
354,308 |
|
|
|
1,267,629 |
|
|
|
651,399 |
|
|
Expenses |
|
|
|
|
|
|
|
|
|
|
|
|
|
|
|
|
Rental property operating |
|
187,035 |
|
|
|
101,211 |
|
|
|
355,423 |
|
|
|
189,022 |
|
|
Hotel operating |
|
44,523 |
|
|
|
63,197 |
|
|
|
143,829 |
|
|
|
114,517 |
|
|
General and administrative |
|
6,913 |
|
|
|
4,878 |
|
|
|
13,595 |
|
|
|
8,059 |
|
|
Management fee |
|
53,423 |
|
|
|
22,487 |
|
|
|
102,925 |
|
|
|
39,664 |
|
|
Performance participation allocation |
|
— |
|
|
|
29,898 |
|
|
|
— |
|
|
|
50,061 |
|
|
Impairment of investments in real estate |
|
6,126 |
|
|
|
— |
|
|
|
6,126 |
|
|
|
— |
|
|
Depreciation and amortization |
|
347,352 |
|
|
|
161,854 |
|
|
|
676,157 |
|
|
|
301,333 |
|
|
Total expenses |
|
645,372 |
|
|
|
383,525 |
|
|
|
1,298,055 |
|
|
|
702,656 |
|
|
Other income (expense) |
|
|
|
|
|
|
|
|
|
|
|
|
|
|
|
|
Income from unconsolidated entities |
|
25,336 |
|
|
|
— |
|
|
|
38,605 |
|
|
|
— |
|
|
Income (loss) from investments in real estate debt |
|
492,889 |
|
|
|
51,784 |
|
|
|
(523,258 |
) |
|
|
113,467 |
|
|
Net gains on dispositions of real estate |
|
— |
|
|
|
29,686 |
|
|
|
371 |
|
|
|
29,686 |
|
|
Interest income |
|
233 |
|
|
|
303 |
|
|
|
1,980 |
|
|
|
497 |
|
|
Interest expense |
|
(176,579 |
) |
|
|
(103,279 |
) |
|
|
(365,083 |
) |
|
|
(194,866 |
) |
|
Loss on extinguishment of debt |
|
— |
|
|
|
— |
|
|
|
(1,237 |
) |
|
|
— |
|
|
Other income (expense) |
|
29,078 |
|
|
|
(2,061 |
) |
|
|
(19,770 |
) |
|
|
(407 |
) |
|
Total other income (expense) |
|
370,957 |
|
|
|
(23,567 |
) |
|
|
(868,392 |
) |
|
|
(51,623 |
) |
|
Net income (loss) |
$ |
318,332 |
|
|
$ |
(52,784 |
) |
|
$ |
(898,818 |
) |
|
$ |
(102,880 |
) |
|
Net loss attributable to non-controlling interests in third party joint ventures |
$ |
966 |
|
|
$ |
970 |
|
|
$ |
1,203 |
|
|
$ |
3,006 |
|
|
Net (income) loss attributable to non-controlling interests in BREIT OP |
|
(4,859 |
) |
|
|
1,110 |
|
|
|
11,967 |
|
|
|
2,324 |
|
|
Net income (loss) attributable to BREIT stockholders |
$ |
314,439 |
|
|
$ |
(50,704 |
) |
|
$ |
(885,648 |
) |
|
$ |
(97,550 |
) |
|
Net income (loss) per share of common stock — basic and diluted |
$ |
0.20 |
|
|
$ |
(0.08 |
) |
|
$ |
(0.59 |
) |
|
$ |
(0.17 |
) |
|
Weighted-average shares of common stock outstanding, basic and diluted |
|
1,585,584 |
|
|
|
631,745 |
|
|
|
1,492,549 |
|
|
|
560,647 |
|
See accompanying notes to condensed consolidated financial statements.
2
Blackstone Real Estate Income Trust, Inc.
Condensed Consolidated Statements of Changes in Equity (Unaudited)
(in thousands, except per share data)
|
|
|
|
|
|
|
|
|
|
|
|
|
|
|
|
|
|
|
|
|
|
|
|
|
|
|
|
|
|
|
Non- |
|
|
Non- |
|
|
|
|
|
||
|
|
|
|
|
|
|
|
|
|
|
|
|
|
|
|
|
|
|
|
|
|
|
|
|
|
|
|
|
|
|
controlling |
|
|
controlling |
|
|
|
|
|
||
|
|
|
Par Value |
|
|
|
|
|
|
Accumulated |
|
|
|
|
|
|
Interests |
|
|
Interests |
|
|
|
|
|
||||||||||||||||
|
|
|
Common |
|
|
Common |
|
|
Common |
|
|
Common |
|
|
Additional |
|
|
Deficit and |
|
|
Total |
|
|
Attributable |
|
|
Attributable |
|
|
|
|
|
|||||||||
|
|
|
Stock |
|
|
Stock |
|
|
Stock |
|
|
Stock |
|
|
Paid-in |
|
|
Cumulative |
|
|
Stockholders' |
|
|
to Third Party |
|
|
to BREIT OP |
|
|
Total |
|
||||||||||
|
|
|
Class S |
|
|
Class I |
|
|
Class T |
|
|
Class D |
|
|
Capital |
|
|
Distributions |
|
|
Equity |
|
|
Joint Ventures |
|
|
Unitholders |
|
|
Equity |
|
||||||||||
|
Balance at March 31, 2020 |
|
$ |
6,111 |
|
|
$ |
7,830 |
|
|
$ |
439 |
|
|
$ |
964 |
|
|
$ |
16,278,758 |
|
|
$ |
(2,830,046 |
) |
|
$ |
13,464,056 |
|
|
$ |
161,305 |
|
|
$ |
190,241 |
|
|
$ |
13,815,602 |
|
|
Common stock issued |
|
|
258 |
|
|
|
474 |
|
|
|
12 |
|
|
|
73 |
|
|
|
875,751 |
|
|
|
— |
|
|
|
876,568 |
|
|
|
— |
|
|
|
— |
|
|
|
876,568 |
|
|
Offering costs |
|
|
— |
|
|
|
— |
|
|
|
— |
|
|
|
— |
|
|
|
(28,581 |
) |
|
|
— |
|
|
|
(28,581 |
) |
|
|
— |
|
|
|
— |
|
|
|
(28,581 |
) |
|
Distribution reinvestment |
|
|
54 |
|
|
|
51 |
|
|
|
3 |
|
|
|
8 |
|
|
|
123,128 |
|
|
|
— |
|
|
|
123,244 |
|
|
|
— |
|
|
|
— |
|
|
|
123,244 |
|
|
Common stock/units repurchased |
|
|
(101 |
) |
|
|
(156 |
) |
|
|
(14 |
) |
|
|
(13 |
) |
|
|
(297,305 |
) |
|
|
— |
|
|
|
(297,589 |
) |
|
|
— |
|
|
|
(1,420 |
) |
|
|
(299,009 |
) |
|
Amortization of compensation awards |
|
|
— |
|
|
|
1 |
|
|
|
— |
|
|
|
— |
|
|
|
99 |
|
|
|
— |
|
|
|
100 |
|
|
|
— |
|
|
|
500 |
|
|
|
600 |
|
|
Net income (loss) ($310 loss allocated to redeemable non-controlling interests) |
|
|
— |
|
|
|
— |
|
|
|
— |
|
|
|
— |
|
|
|
— |
|
|
|
314,439 |
|
|
|
314,439 |
|
|
|
(651 |
) |
|
|
4,854 |
|
|
|
318,642 |
|
|
Distributions declared on common stock ($0.1577 gross per share) |
|
|
— |
|
|
|
— |
|
|
|
— |
|
|
|
— |
|
|
|
— |
|
|
|
(234,382 |
) |
|
|
(234,382 |
) |
|
|
— |
|
|
|
— |
|
|
|
(234,382 |
) |
|
Contributions from non-controlling interests |
|
|
— |
|
|
|
— |
|
|
|
— |
|
|
|
— |
|
|
|
— |
|
|
|
— |
|
|
|
— |
|
|
|
1,916 |
|
|
|
1,257 |
|
|
|
3,173 |
|
|
Distributions to non-controlling interests |
|
|
— |
|
|
|
— |
|
|
|
— |
|
|
|
— |
|
|
|
— |
|
|
|
— |
|
|
|
— |
|
|
|
(3,111 |
) |
|
|
(3,439 |
) |
|
|
(6,550 |
) |
|
Allocation to redeemable non-controlling interests |
|
|
— |
|
|
|
— |
|
|
|
— |
|
|
|
— |
|
|
|
206 |
|
|
|
— |
|
|
|
206 |
|
|
|
— |
|
|
|
— |
|
|
|
206 |
|
|
Balance at June 30, 2020 |
|
$ |
6,322 |
|
|
$ |
8,200 |
|
|
$ |
440 |
|
|
$ |
1,032 |
|
|
$ |
16,952,056 |
|
|
$ |
(2,749,989 |
) |
|
$ |
14,218,061 |
|
|
$ |
159,459 |
|
|
$ |
191,993 |
|
|
$ |
14,569,513 |
|
|
|
|
|
|
|
|
|
|
|
|
|
|
|
|
|
|
|
|
|
|
|
|
|
|
|
|
|
|
|
|
|
|
|
|
|
|
|
|
|
|
|
|
|
|
|
|
|
|
|
|
|
|
|
|
|
|
|
|
|
|
|
|
|
|
|
|
|
|
|
|
|
|
|
|
|
|
|
|
|
|
|
|
|
|
|
|
|
|
|
|
|
|
|
|
|
|
|
|
|
|
|
|
|
|
|
|
|
|
|
|
|
|
|
|
|
|
|
|
|
|
|
|
|
|
|
|
|
|
|
|
|
|
|
|
|
|
|
|
|
|
|
|
|
|
|
|
|
|
|
|
|
|
|
|
|
|
Non- |
|
|
Non- |
|
|
|
|
|
||
|
|
|
|
|
|
|
|
|
|
|
|
|
|
|
|
|
|
|
|
|
|
|
|
|
|
|
|
|
|
|
controlling |
|
|
controlling |
|
|
|
|
|
||
|
|
|
Par Value |
|
|
|
|
|
|
Accumulated |
|
|
|
|
|
|
Interests |
|
|
Interests |
|
|
|
|
|
||||||||||||||||
|
|
|
Common |
|
|
Common |
|
|
Common |
|
|
Common |
|
|
Additional |
|
|
Deficit and |
|
|
Total |
|
|
Attributable |
|
|
Attributable |
|
|
|
|
|
|||||||||
|
|
|
Stock |
|
|
Stock |
|
|
Stock |
|
|
Stock |
|
|
Paid-in |
|
|
Cumulative |
|
|
Stockholders' |
|
|
to Third Party |
|
|
to BREIT OP |
|
|
Total |
|
||||||||||
|
|
|
Class S |
|
|
Class I |
|
|
Class T |
|
|
Class D |
|
|
Capital |
|
|
Distributions |
|
|
Equity |
|
|
Joint Ventures |
|
|
Unitholders |
|
|
Equity |
|
||||||||||
|
Balance at March 31, 2019 |
|
$ |
3,190 |
|
|
$ |
1,322 |
|
|
$ |
267 |
|
|
$ |
381 |
|
|
$ |
5,115,490 |
|
|
$ |
(703,936 |
) |
|
$ |
4,416,714 |
|
|
$ |
77,173 |
|
|
$ |
97,817 |
|
|
$ |
4,591,704 |
|
|
Common stock issued |
|
|
610 |
|
|
|
986 |
|
|
|
51 |
|
|
|
146 |
|
|
|
1,965,318 |
|
|
|
— |
|
|
|
1,967,111 |
|
|
|
— |
|
|
|
— |
|
|
|
1,967,111 |
|
|
Offering costs |
|
|
— |
|
|
|
— |
|
|
|
— |
|
|
|
— |
|
|
|
(103,027 |
) |
|
|
— |
|
|
|
(103,027 |
) |
|
|
— |
|
|
|
— |
|
|
|
(103,027 |
) |
|
Distribution reinvestment |
|
|
28 |
|
|
|
14 |
|
|
|
2 |
|
|
|
3 |
|
|
|
51,813 |
|
|
|
— |
|
|
|
51,860 |
|
|
|
— |
|
|
|
— |
|
|
|
51,860 |
|
|
Common stock/units repurchased |
|
|
(16 |
) |
|
|
(37 |
) |
|
|
(1 |
) |
|
|
(1 |
) |
|
|
(60,032 |
) |
|
|
— |
|
|
|
(60,087 |
) |
|
|
— |
|
|
|
(70 |
) |
|
|
(60,157 |
) |
|
Amortization of compensation awards |
|
|
— |
|
|
|
1 |
|
|
|
— |
|
|
|
— |
|
|
|
99 |
|
|
|
— |
|
|
|
100 |
|
|
|
— |
|
|
|
500 |
|
|
|
600 |
|
|
Net loss ($74 allocated to redeemable non-controlling interests) |
|
|
— |
|
|
|
— |
|
|
|
— |
|
|
|
— |
|
|
|
— |
|
|
|
(50,704 |
) |
|
|
(50,704 |
) |
|
|
(970 |
) |
|
|
(1,036 |
) |
|
|
(52,710 |
) |
|
Distributions declared on common stock ($0.1588 gross per share) |
|
|
— |
|
|
|
— |
|
|
|
— |
|
|
|
— |
|
|
|
— |
|
|
|
(90,871 |
) |
|
|
(90,871 |
) |
|
|
— |
|
|
|
— |
|
|
|
(90,871 |
) |
|
Contributions from non-controlling interests |
|
|
— |
|
|
|
— |
|
|
|
— |
|
|
|
— |
|
|
|
— |
|
|
|
— |
|
|
|
— |
|
|
|
41,049 |
|
|
|
36,749 |
|
|
|
77,798 |
|
|
Distributions to non-controlling interests |
|
|
— |
|
|
|
— |
|
|
|
— |
|
|
|
— |
|
|
|
— |
|
|
|
— |
|
|
|
— |
|
|
|
(3,527 |
) |
|
|
(2,045 |
) |
|
|
(5,572 |
) |
|
Allocation to redeemable non-controlling interests |
|
|
— |
|
|
|
— |
|
|
|
— |
|
|
|
— |
|
|
|
(361 |
) |
|
|
— |
|
|
|
(361 |
) |
|
|
— |
|
|
|
— |
|
|
|
(361 |
) |
|
Balance at June 30, 2019 |
|
$ |
3,812 |
|
|
$ |
2,286 |
|
|
$ |
319 |
|
|
$ |
529 |
|
|
$ |
6,969,300 |
|
|
$ |
(845,511 |
) |
|
$ |
6,130,735 |
|
|
$ |
113,725 |
|
|
$ |
131,915 |
|
|
$ |
6,376,375 |
|
See accompanying notes to condensed consolidated financial statements.
3
Blackstone Real Estate Income Trust, Inc.
Condensed Consolidated Statements of Changes in Equity (Unaudited)
(in thousands, except per share data)
|
|
|
|
|
|
|
|
|
|
|
|
|
|
|
|
|
|
|
|
|
|
|
|
|
|
|
|
|
|
|
Non- |
|
|
Non- |
|
|
|
|
|
||
|
|
|
|
|
|
|
|
|
|
|
|
|
|
|
|
|
|
|
|
|
|
|
|
|
|
|
|
|
|
|
controlling |
|
|
controlling |
|
|
|
|
|
||
|
|
|
Par Value |
|
|
|
|
|
|
Accumulated |
|
|
|
|
|
|
Interests |
|
|
Interests |
|
|
|
|
|
||||||||||||||||
|
|
|
Common |
|
|
Common |
|
|
Common |
|
|
Common |
|
|
Additional |
|
|
Deficit and |
|
|
Total |
|
|
Attributable |
|
|
Attributable |
|
|
|
|
|
|||||||||
|
|
|
Stock |
|
|
Stock |
|
|
Stock |
|
|
Stock |
|
|
Paid-in |
|
|
Cumulative |
|
|
Stockholders' |
|
|
to Third Party |
|
|
to BREIT OP |
|
|
Total |
|
||||||||||
|
|
|
Class S |
|
|
Class I |
|
|
Class T |
|
|
Class D |
|
|
Capital |
|
|
Distributions |
|
|
Equity |
|
|
Joint Ventures |
|
|
Unitholders |
|
|
Equity |
|
||||||||||
|
Balance at December 31, 2019 |
|
$ |
5,308 |
|
|
$ |
4,743 |
|
|
$ |
398 |
|
|
$ |
847 |
|
|
$ |
11,716,721 |
|
|
$ |
(1,422,885 |
) |
|
$ |
10,305,132 |
|
|
$ |
157,795 |
|
|
$ |
151,721 |
|
|
$ |
10,614,648 |
|
|
Common stock issued |
|
|
1,243 |
|
|
|
3,713 |
|
|
|
60 |
|
|
|
214 |
|
|
|
5,946,595 |
|
|
|
— |
|
|
|
5,951,825 |
|
|
|
— |
|
|
|
— |
|
|
|
5,951,825 |
|
|
Offering costs |
|
|
— |
|
|
|
— |
|
|
|
— |
|
|
|
— |
|
|
|
(126,380 |
) |
|
|
— |
|
|
|
(126,380 |
) |
|
|
— |
|
|
|
— |
|
|
|
(126,380 |
) |
|
Distribution reinvestment |
|
|
99 |
|
|
|
88 |
|
|
|
6 |
|
|
|
15 |
|
|
|
227,958 |
|
|
|
— |
|
|
|
228,166 |
|
|
|
— |
|
|
|
— |
|
|
|
228,166 |
|
|
Common stock/units repurchased |
|
|
(328 |
) |
|
|
(346 |
) |
|
|
(24 |
) |
|
|
(44 |
) |
|
|
(812,734 |
) |
|
|
— |
|
|
|
(813,476 |
) |
|
|
— |
|
|
|
(1,755 |
) |
|
|
(815,231 |
) |
|
Amortization of compensation awards |
|
|
— |
|
|
|
2 |
|
|
|
— |
|
|
|
— |
|
|
|
198 |
|
|
|
— |
|
|
|
200 |
|
|
|
— |
|
|
|
1,000 |
|
|
|
1,200 |
|
|
Net loss ($1,010 allocated to redeemable non-controlling interests) |
|
|
— |
|
|
|
— |
|
|
|
— |
|
|
|
— |
|
|
|
— |
|
|
|
(885,648 |
) |
|
|
(885,648 |
) |
|
|
(208 |
) |
|
|
(11,952 |
) |
|
|
(897,808 |
) |
|
Distributions declared on common stock ($0.3169 gross per share) |
|
|
— |
|
|
|
— |
|
|
|
— |
|
|
|
— |
|
|
|
— |
|
|
|
(441,456 |
) |
|
|
(441,456 |
) |
|
|
— |
|
|
|
— |
|
|
|
(441,456 |
) |
|
Contributions from non-controlling interests |
|
|
— |
|
|
|
— |
|
|
|
— |
|
|
|
— |
|
|
|
— |
|
|
|
— |
|
|
|
— |
|
|
|
11,171 |
|
|
|
59,893 |
|
|
|
71,064 |
|
|
Distributions to non-controlling interests |
|
|
— |
|
|
|
— |
|
|
|
— |
|
|
|
— |
|
|
|
— |
|
|
|
— |
|
|
|
— |
|
|
|
(9,299 |
) |
|
|
(6,914 |
) |
|
|
(16,213 |
) |
|
Allocation to redeemable non-controlling interests |
|
|
— |
|
|
|
— |
|
|
|
— |
|
|
|
— |
|
|
|
(302 |
) |
|
|
— |
|
|
|
(302 |
) |
|
|
— |
|
|
|
— |
|
|
|
(302 |
) |
|
Balance at June 30, 2020 |
|
$ |
6,322 |
|
|
$ |
8,200 |
|
|
$ |
440 |
|
|
$ |
1,032 |
|
|
$ |
16,952,056 |
|
|
$ |
(2,749,989 |
) |
|
$ |
14,218,061 |
|
|
$ |
159,459 |
|
|
$ |
191,993 |
|
|
$ |
14,569,513 |
|
|
|
|
|
|
|
|
|
|
|
|
|
|
|
|
|
|
|
|
|
|
|
|
|
|
|
|
|
|
|
|
|
|
|
|
|
|
|
|
|
|
|
|
|
|
|
|
|
|
|
|
|
|
|
|
|
|
|
|
|
|
|
|
|
|
|
|
|
|
|
|
|
|
|
|
|
|
|
|
|
|
|
|
|
|
|
|
|
|
|
|
|
|
|
|
|
|
|
|
|
|
|
|
|
|
|
|
|
|
|
|
|
|
|
|
|
|
|
|
|
|
|
|
|
|
|
|
|
|
|
|
|
|
|
|
|
|
|
|
|
|
|
|
|
|
|
|
|
|
|
|
|
|
|
|
|
|
Non- |
|
|
Non- |
|
|
|
|
|
||
|
|
|
|
|
|
|
|
|
|
|
|
|
|
|
|
|
|
|
|
|
|
|
|
|
|
|
|
|
|
|
controlling |
|
|
controlling |
|
|
|
|
|
||
|
|
|
Par Value |
|
|
|
|
|
|
Accumulated |
|
|
|
|
|
|
Interests |
|
|
Interests |
|
|
|
|
|
||||||||||||||||
|
|
|
Common |
|
|
Common |
|
|
Common |
|
|
Common |
|
|
Additional |
|
|
Deficit and |
|
|
Total |
|
|
Attributable |
|
|
Attributable |
|
|
|
|
|
|||||||||
|
|
|
Stock |
|
|
Stock |
|
|
Stock |
|
|
Stock |
|
|
Paid-in |
|
|
Cumulative |
|
|
Stockholders' |
|
|
to Third Party |
|
|
to BREIT OP |
|
|
Total |
|
||||||||||
|
|
|
Class S |
|
|
Class I |
|
|
Class T |
|
|
Class D |
|
|
Capital |
|
|
Distributions |
|
|
Equity |
|
|
Joint Ventures |
|
|
Unitholders |
|
|
Equity |
|
||||||||||
|
Balance at December 31, 2018 |
|
$ |
2,770 |
|
|
$ |
1,083 |
|
|
$ |
233 |
|
|
$ |
304 |
|
|
$ |
4,327,444 |
|
|
$ |
(587,548 |
) |
|
$ |
3,744,286 |
|
|
$ |
75,592 |
|
|
$ |
95,076 |
|
|
$ |
3,914,954 |
|
|
Common stock issued |
|
|
1,024 |
|
|
|
1,231 |
|
|
|
89 |
|
|
|
221 |
|
|
|
2,808,665 |
|
|
|
— |
|
|
|
2,811,230 |
|
|
|
— |
|
|
|
— |
|
|
|
2,811,230 |
|
|
Offering costs |
|
|
— |
|
|
|
— |
|
|
|
— |
|
|
|
— |
|
|
|
(153,874 |
) |
|
|
— |
|
|
|
(153,874 |
) |
|
|
— |
|
|
|
— |
|
|
|
(153,874 |
) |
|
Distribution reinvestment |
|
|
52 |
|
|
|
25 |
|
|
|
4 |
|
|
|
5 |
|
|
|
93,808 |
|
|
|
— |
|
|
|
93,894 |
|
|
|
— |
|
|
|
— |
|
|
|
93,894 |
|
|
Common stock/units repurchased |
|
|
(34 |
) |
|
|
(55 |
) |
|
|
(7 |
) |
|
|
(1 |
) |
|
|
(105,500 |
) |
|
|
— |
|
|
|
(105,597 |
) |
|
|
— |
|
|
|
(70 |
) |
|
|
(105,667 |
) |
|
Amortization of compensation awards |
|
|
— |
|
|
|
2 |
|
|
|
— |
|
|
|
— |
|
|
|
198 |
|
|
|
— |
|
|
|
200 |
|
|
|
— |
|
|
|
1,000 |
|
|
|
1,200 |
|
|
Net loss ($351 allocated to redeemable non-controlling interests) |
|
|
— |
|
|
|
— |
|
|
|
— |
|
|
|
— |
|
|
|
— |
|
|
|
(97,550 |
) |
|
|
(97,550 |
) |
|
|
(3,006 |
) |
|
|
(1,973 |
) |
|
|
(102,529 |
) |
|
Distributions declared on common stock ($0.3170 gross per share) |
|
|
— |
|
|
|
— |
|
|
|
— |
|
|
|
— |
|
|
|
— |
|
|
|
(160,413 |
) |
|
|
(160,413 |
) |
|
|
— |
|
|
|
— |
|
|
|
(160,413 |
) |
|
Contributions from non-controlling interests |
|
|
— |
|
|
|
— |
|
|
|
— |
|
|
|
— |
|
|
|
— |
|
|
|
— |
|
|
|
— |
|
|
|
45,943 |
|
|
|
41,463 |
|
|
|
87,406 |
|
|
Distributions to non-controlling interests |
|
|
— |
|
|
|
— |
|
|
|
— |
|
|
|
— |
|
|
|
— |
|
|
|
— |
|
|
|
— |
|
|
|
(4,804 |
) |
|
|
(3,581 |
) |
|
|
(8,385 |
) |
|
Allocation to redeemable non-controlling interests |
|
|
— |
|
|
|
— |
|
|
|
— |
|
|
|
— |
|
|
|
(1,441 |
) |
|
|
— |
|
|
|
(1,441 |
) |
|
|
— |
|
|
|
— |
|
|
|
(1,441 |
) |
|
Balance at June 30, 2019 |
|
$ |
3,812 |
|
|
$ |
2,286 |
|
|
$ |
319 |
|
|
$ |
529 |
|
|
$ |
6,969,300 |
|
|
$ |
(845,511 |
) |
|
$ |
6,130,735 |
|
|
$ |
113,725 |
|
|
$ |
131,915 |
|
|
$ |
6,376,375 |
|
|
|
|
|
|
|
|
|
|
|
|
|
|
|
|
|
|
|
|
|
|
|
|
|
|
|
|
|
|
|
|
|
|
|
|
|
|
|
|
|
|
|
See accompanying notes to condensed consolidated financial statements.
4
Blackstone Real Estate Income Trust, Inc.
Condensed Consolidated Statements of Cash Flows (Unaudited)
(in thousands)
|
|
|
Six Months Ended June 30, |
|
|||||
|
|
|
2020 |
|
|
2019 |
|
||
|
Cash flows from operating activities: |
|
|
|
|
|
|
|
|
|
Net loss |
|
$ |
(898,818 |
) |
|
$ |
(102,880 |
) |
|
Adjustments to reconcile net loss to net cash provided by operating activities: |
|
|
|
|
|
|
|
|
|
Management fee |
|
|
102,925 |
|
|
|
39,664 |
|
|
Performance participation allocation |
|
|
— |
|
|
|
50,061 |
|
|
Depreciation and amortization |
|
|
676,157 |
|
|
|
301,333 |
|
|
Impairment of investments in real estate |
|
|
6,126 |
|
|
|
— |
|
|
Net gains on dispositions of real estate |
|
|
(371 |
) |
|
|
(29,686 |
) |
|
Loss on extinguishment of debt |
|
|
1,237 |
|
|
|
— |
|
|
Unrealized (gain) loss on changes in fair value of financial instruments |
|
|
648,455 |
|
|
|
(45,492 |
) |
|
Income from unconsolidated entities |
|
|
(38,605 |
) |
|
|
— |
|
|
Distributions from unconsolidated entities |
|
|
35,091 |
|
|
|
— |
|
|
Other items |
|
|
(23,964 |
) |
|
|
3,677 |
|
|
Change in assets and liabilities: |
|
|
|
|
|
|
|
|
|
(Increase) / decrease in other assets |
|
|
(36,825 |
) |
|
|
(37,401 |
) |
|
Increase / (decrease) in due to affiliates |
|
|
5,775 |
|
|
|
(709 |
) |
|
Increase / (decrease) in accounts payable, accrued expenses, and other liabilities |
|
|
7,612 |
|
|
|
14,902 |
|
|
Net cash provided by operating activities |
|
|
484,795 |
|
|
|
193,469 |
|
|
Cash flows from investing activities: |
|
|
|
|
|
|
|
|
|
Acquisitions of real estate |
|
|
(2,939,159 |
) |
|
|
(3,763,487 |
) |
|
Capital improvements to real estate |
|
|
(144,293 |
) |
|
|
(67,091 |
) |
|
Proceeds from disposition of real estate |
|
|
4,488 |
|
|
|
44,293 |
|
|
Pre-acquisition costs |
|
|
(11,671 |
) |
|
|
(3,407 |
) |
|
Investment in unconsolidated entities |
|
|
(808,312 |
) |
|
|
— |
|
|
Purchase of investments in real estate debt |
|
|
(874,326 |
) |
|
|
(1,296,050 |
) |
|
Proceeds from settlement of investments in real estate debt |
|
|
200,533 |
|
|
|
276,205 |
|
|
Purchase of real estate-related equity securities |
|
|
(463,695 |
) |
|
|
— |
|
|
Sale of real estate-related equity securities |
|
|
102,932 |
|
|
|
— |
|
|
Net cash used in investing activities |
|
|
(4,933,503 |
) |
|
|
(4,809,537 |
) |
|
Cash flows from financing activities: |
|
|
|
|
|
|
|
|
|
Proceeds from issuance of common stock |
|
|
5,047,278 |
|
|
|
2,596,552 |
|
|
Offering costs paid |
|
|
(48,008 |
) |
|
|
(33,045 |
) |
|
Subscriptions received in advance |
|
|
175,886 |
|
|
|
402,493 |
|
|
Repurchase of common stock |
|
|
(720,157 |
) |
|
|
(53,638 |
) |
|
Repurchase of management fee shares |
|
|
(76,631 |
) |
|
|
(49,871 |
) |
|
Redemption of redeemable non-controlling interest |
|
|
(83,625 |
) |
|
|
(25,407 |
) |
|
Redemption of affiliate service provider incentive compensation awards |
|
|
(1,755 |
) |
|
|
(70 |
) |
|
Borrowings from mortgage notes, term loans, and secured revolving credit facilities |
|
|
6,108,651 |
|
|
|
4,111,058 |
|
|
Repayments from mortgage notes, term loans, and secured revolving credit facilities |
|
|
(5,400,290 |
) |
|
|
(2,942,083 |
) |
|
Borrowings under repurchase agreements |
|
|
1,490,542 |
|
|
|
927,475 |
|
|
Settlement of repurchase agreements |
|
|
(2,216,689 |
) |
|
|
(194,064 |
) |
|
Borrowings from affiliate line of credit |
|
|
175,000 |
|
|
|
1,466,000 |
|
|
Repayments on affiliate line of credit |
|
|
(175,000 |
) |
|
|
(1,466,000 |
) |
|
Borrowings from unsecured credit facilities |
|
|
130,000 |
|
|
|
240,000 |
|
|
Repayments on unsecured credit facilities |
|
|
(130,000 |
) |
|
|
— |
|
|
Payment of deferred financing costs |
|
|
(31,354 |
) |
|
|
(22,839 |
) |
|
Contributions from non-controlling interests |
|
|
22,017 |
|
|
|
43,443 |
|
|
Distributions to non-controlling interests |
|
|
(14,251 |
) |
|
|
(8,778 |
) |
|
Distributions |
|
|
(189,722 |
) |
|
|
(53,941 |
) |
|
Net cash provided by financing activities |
|
|
4,061,892 |
|
|
|
4,937,285 |
|
|
Net change in cash and cash equivalents and restricted cash |
|
|
(386,816 |
) |
|
|
321,217 |
|
|
Cash and cash equivalents and restricted cash, beginning of period |
|
|
1,109,702 |
|
|
|
306,613 |
|
|
Cash and cash equivalents and restricted cash, end of period |
|
$ |
722,886 |
|
|
$ |
627,830 |
|
|
|
|
|
|
|
|
|
|
|
|
Reconciliation of cash and cash equivalents and restricted cash to the condensed consolidated balance sheets: |
|
|
|
|
|
|
|
|
|
Cash and cash equivalents |
|
$ |
263,067 |
|
|
$ |
150,062 |
|
|
Restricted cash |
|
|
459,819 |
|
|
|
477,768 |
|
|
Total cash and cash equivalents and restricted cash |
|
$ |
722,886 |
|
|
$ |
627,830 |
|
5
|
|
|
|
|
|
|
|
|
|
|
Assumption of mortgage notes in conjunction with acquisitions of real estate |
|
$ |
224,123 |
|
|
$ |
385,450 |
|
|
Assumption of other liabilities in conjunction with acquisitions of real estate |
|
$ |
1,482 |
|
|
$ |
25,847 |
|
|
Issuance of BREIT OP units as consideration for acquisitions of real estate |
|
$ |
— |
|
|
$ |
36,749 |
|
|
Recognition of financing lease liability |
|
$ |
— |
|
|
$ |
56,008 |
|
|
Accrued pre-acquisition costs |
|
$ |
— |
|
|
$ |
1,217 |
|
|
Contributions from non-controlling interests |
|
$ |
— |
|
|
$ |
2,520 |
|
|
Accrued capital expenditures and acquisition related costs |
|
$ |
6,920 |
|
|
$ |
3,406 |
|
|
Accrued distributions |
|
$ |
23,814 |
|
|
$ |
12,783 |
|
|
Accrued stockholder servicing fee due to affiliate |
|
$ |
79,593 |
|
|
$ |
121,421 |
|
|
Redeemable non-controlling interest issued as settlement of performance participation allocation |
|
$ |
141,396 |
|
|
$ |
37,484 |
|
|
Exchange of redeemable non-controlling interest for Class I shares |
|
$ |
9,228 |
|
|
$ |
11,620 |
|
|
Exchange of redeemable non-controlling interest for Class I or Class B units |
|
$ |
48,543 |
|
|
$ |
— |
|
|
Allocation to redeemable non-controlling interest |
|
$ |
302 |
|
|
$ |
1,441 |
|
|
Distribution reinvestment |
|
$ |
228,166 |
|
|
$ |
93,894 |
|
|
Accrued common stock repurchases |
|
$ |
52,096 |
|
|
$ |
2,088 |
|
|
Accrued common stock repurchases due to affiliate |
|
$ |
17,762 |
|
|
$ |
— |
|
|
Issuance of BREIT OP units as settlement of affiliate incentive compensation awards |
|
$ |
— |
|
|
$ |
4,714 |
|
|
Payable for investments in real estate debt |
|
$ |
1,487 |
|
|
$ |
129,317 |
|
See accompanying notes to condensed consolidated financial statements.
6
Blackstone Real Estate Income Trust, Inc.
Notes to Condensed Consolidated Financial Statements
(Unaudited)
1. Organization and Business Purpose
Blackstone Real Estate Income Trust, Inc. (“BREIT” or the “Company”) invests primarily in stabilized income-oriented commercial real estate in the United States and, to a lesser extent, in real estate debt. The Company is the sole general partner of BREIT Operating Partnership, L.P., a Delaware limited partnership (“BREIT OP”). BREIT Special Limited Partner L.P. (the “Special Limited Partner”), a wholly-owned subsidiary of The Blackstone Group Inc. (together with its affiliates, “Blackstone”), owns a special limited partner interest in BREIT OP. Substantially all of the Company’s business is conducted through BREIT OP. The Company and BREIT OP are externally managed by BX REIT Advisors L.L.C. (the “Adviser”). The Adviser is part of the real estate group of Blackstone, a leading global investment manager, which serves as the Company’s sponsor. The Company was formed on November 16, 2015 as a Maryland corporation and qualifies as a real estate investment trust (“REIT”) for U.S. federal income tax purposes.
As of June 30, 2020, the Company had received net proceeds of $18.5 billion from selling shares in the Offering, as defined below, and selling unregistered shares of the Company’s common stock. The Company had registered with the Securities and Exchange Commission (the “SEC”) an offering of up to $5.0 billion in shares of common stock (the “Initial Offering”) and accepted gross offering proceeds of $4.9 billion during the period January 1, 2017 to January 1, 2019. The Company subsequently registered with the SEC a follow-on offering of up to $12.0 billion in shares of common stock, consisting of up to $10.0 billion in shares in its primary offering and up to $2.0 billion in shares pursuant to its distribution reinvestment plan (the “Current Offering” and with the Initial Offering, the “Offering”). The Company intends to sell any combination of four classes of shares of its common stock, with a dollar value up to the maximum aggregate amount of the Current Offering. The share classes have different upfront selling commissions, dealer manager fees and ongoing stockholder servicing fees. The Company intends to continue selling shares on a monthly basis.
As of June 30, 2020, the Company owned 1,171 properties and had 217 positions in real estate debt investments. The Company currently operates in eight reportable segments: Multifamily, Industrial, Net Lease, Hotel, Retail, Office and Other Properties, and Investments in Real Estate Debt. Multifamily includes various forms of rental housing including apartments, student housing and manufactured housing. Other Properties includes self-storage properties. Net Lease includes the real estate assets of The Bellagio Las Vegas (“Bellagio”) and the unconsolidated interest in the MGM Grand and Mandalay Bay joint venture, as further described in Note 4 – Investments in Unconsolidated Entities. Financial results by segment are reported in Note 14 — Segment Reporting.
2. Summary of Significant Accounting Policies
Basis of Presentation
The accompanying unaudited condensed consolidated financial statements have been prepared in accordance with accounting principles generally accepted in the United States of America (“GAAP”) for interim financial information and the instructions to Form 10-Q and Rule 10-01 of Regulation S-X. The condensed consolidated financial statements, including the condensed notes thereto, are unaudited and exclude some of the disclosures required in audited financial statements. Management believes it has made all necessary adjustments, consisting of only normal recurring items, so that the condensed consolidated financial statements are presented fairly and that estimates made in preparing its condensed consolidated financial statements are reasonable and prudent. The accompanying unaudited condensed consolidated interim financial statements should be read in conjunction with the audited consolidated financial statements included in the Company’s Annual Report on Form 10-K for the fiscal year ended December 31, 2019 filed with the SEC.
The preparation of the financial statements in conformity with GAAP requires management to make estimates and assumptions that affect the reported amounts of assets and liabilities and disclosures of contingent assets and liabilities at the date of the balance sheet. During the first quarter of 2020, there was a global outbreak of a novel coronavirus, or COVID-19, which has spread to over 200 countries and territories, including the United States, has spread to every state in the United States, and continues to spread. The World Health Organization has designated COVID-19 as a pandemic, and numerous countries, including the United States, have declared national emergencies with respect to COVID-19. The global impact of the outbreak has been rapidly evolving, and as cases of COVID-19 have continued to be identified in additional countries, many countries have reacted by instituting quarantines and restrictions on travel, closing financial markets and/or restricting trading and limiting operations of non-essential offices, retail centers, hotels and other businesses. Such actions have created disruption in global supply chains, increased rates of unemployment, and adversely impacted many industries. The outbreak could have a continued adverse impact on economic and market conditions and has triggered a period of global economic slowdown. The rapid development and fluidity of this situation precludes any prediction as to the ultimate adverse impact of COVID-19 on economic and market conditions. The Company believes the estimates and assumptions underlying the GAAP condensed consolidated financial statements are reasonable and supportable based on the information available as of June 30, 2020, however uncertainty over the ultimate impact COVID-19 will have on the global economy generally, and the
7
Company’s business in particular, makes any estimates and assumptions as of June 30, 2020 inherently less certain than they would be absent the current and potential impacts of COVID-19. Actual results may ultimately differ materially from those estimates.
The accompanying condensed consolidated financial statements include the accounts of the Company, the Company’s subsidiaries and joint ventures in which the Company has a controlling interest. For consolidated joint ventures, the non-controlling partner’s share of the assets, liabilities and operations of the joint ventures is included in non-controlling interests as equity of the Company. The non-controlling partner’s interest is generally computed as the joint venture partner’s ownership percentage. Certain of the joint ventures formed by the Company provide the other partner a profits interest based on certain internal rate of return hurdles being achieved. Any profits interest due to the other partner is reported within non-controlling interests. All intercompany balances and transactions have been eliminated in consolidation.
The Company consolidates partially owned entities in which it has a controlling financial interest. In determining whether the Company has a controlling financial interest in a partially owned entity and the requirement to consolidate the accounts of that entity, the Company considers whether the entity is a variable interest entity (“VIE”) and whether it is the primary beneficiary. The Company is the primary beneficiary of a VIE when it has (i) the power to direct the most significant activities impacting the economic performance of the VIE and (ii) the obligation to absorb losses or receive benefits significant to the VIE. BREIT OP and each of the Company’s joint ventures are considered to be a VIE. The Company consolidates these entities, excluding its equity method investment, because it has the ability to direct the most significant activities of the entities such as purchases, dispositions, financings, budgets, and overall operating plans.
As of June 30, 2020, the total assets and liabilities of the Company’s consolidated VIEs, excluding BREIT OP, were $11.3 billion and $8.0 billion, respectively, compared to $9.5 billion and $6.6 billion as of December 31, 2019. Such amounts are included on the Company’s Condensed Consolidated Balance Sheets.
Certain of the Company’s joint ventures are accounted for under the equity method of accounting as the requirements for consolidation are not met. Investments in unconsolidated entities are initially recorded at cost and subsequently adjusted for the Company’s pro-rata share of net income, contributions, and distributions. The Company’s investments in unconsolidated entities are periodically assessed for impairment and an impairment loss is recorded when the fair value of the investment falls below the carrying value and such decline is determined to be other-than-temporary.
As of June 30, 2020, the Company’s investment in the joint venture which owns the real estate of the MGM Grand and Mandalay Bay is not consolidated. Refer to Note 4 for additional details on the Company’s investments in unconsolidated entities.
The Company reclassified dead deal costs, which primarily consisted of a forfeited investment deposit, during the three months ended March 31, 2020, from General and Administrative Expenses to Other Income (Expense) on the Condensed Consolidated Statements of Operations. Such reclassification had no effect on Total Revenues or Net Loss on the Condensed Consolidated Statements of Operations or classification in the Condensed Consolidated Statements of Cash Flows.
Fair Value Measurements
Under normal market conditions, the fair value of an investment is the amount that would be received to sell an asset or transfer a liability in an orderly transaction between market participants at the measurement date (i.e., the exit price). Additionally, there is a hierarchal framework that prioritizes and ranks the level of market price observability used in measuring investments at fair value. Market price observability is impacted by a number of factors, including the type of investment and the characteristics specific to the investment and the state of the marketplace, including the existence and transparency of transactions between market participants. Investments with readily available actively quoted prices or for which fair value can be measured from actively quoted prices generally will have a higher degree of market price observability and a lesser degree of judgment used in measuring fair value.
Investments measured and reported at fair value are classified and disclosed in one of the following levels within the fair value hierarchy:
Level 1 — quoted prices are available in active markets for identical investments as of the measurement date. The Company does not adjust the quoted price for these investments.
Level 2 — quoted prices are available in markets that are not active or model inputs are based on inputs that are either directly or indirectly observable as of the measurement date.
Level 3 — pricing inputs are unobservable and include instances where there is minimal, if any, market activity for the investment. These inputs require significant judgment or estimation by management or third parties when determining fair value and generally
8
represent anything that does not meet the criteria of Levels 1 and 2. Due to the inherent uncertainty of these estimates, these values may differ materially from the values that would have been used had a ready market for these investments existed.
Valuation of assets measured at fair value
The Company’s investments in real estate debt are reported at fair value. As of June 30, 2020 and December 31, 2019, the Company’s investments in real estate debt consisted of commercial mortgage-backed securities (“CMBS”), residential mortgage-backed securities (“RMBS”), which are mortgage-related fixed income securities, corporate bonds, and term private mezzanine loans of real estate-related companies. The Company determines the fair value of its investments in real estate debt by generally utilizing third-party pricing service providers and broker-dealer quotations on the basis of last available bid price.
In determining the fair value of a particular investment, pricing service providers may use broker-dealer quotations, reported trades or valuation estimates from their internal pricing models to determine the reported price. The pricing service providers’ internal models for securities such as real estate debt generally consider the attributes applicable to a particular class of the security (e.g., credit rating, seniority), current market data, and estimated cash flows for each class and incorporate deal collateral performance such as prepayment speeds and default rates, as available.
Certain of the Company’s investments in real estate debt, such as mortgages or mezzanine loans, are unlikely to have readily available market quotations. In such cases, the Company will generally determine the initial value based on the acquisition price of such investment if acquired by the Company or the par value of such investment if originated by the Company. Following the initial measurement, the Company will determine fair value by utilizing or reviewing certain of the following (i) market yield data, (ii) discounted cash flow modeling, (iii) collateral asset performance, (iv) local or macro real estate performance, (v) capital market conditions, (vi) debt yield or loan-to-value ratios and (vii) borrower financial condition and performance.
As of June 30, 2020 and December 31, 2019, the Company’s $4.6 billion and $4.5 billion, respectively, of investments in real estate debt were classified as Level 2.
The Company’s investments in equity securities of public real estate-related companies are classified as trading securities and reported at fair value. As such, the resulting unrealized gains and losses are recorded as a component of Other Income (Expense) on the Company’s Condensed Consolidated Statements of Operations. In determining the fair value of public equity securities, the Company utilizes the closing price of such securities in the principal market in which the security trades. As of June 30, 2020 the Company’s $348.3 million of equity securities were classified as Level 1 and recorded as a component of Other Assets on the Company’s Condensed Consolidated Balance Sheets. The Company did not own equity securities as of December 31, 2019.
Valuation of assets measured at fair value on a nonrecurring basis
Certain of the Company’s assets are not measured at fair value on an ongoing basis but are subject to fair value adjustments, such as when there is evidence of impairment, and therefore measured at fair value on a nonrecurring basis. The Company reviews its real estate properties for impairment each quarter or when there is an event of change in circumstances that could indicate the carrying amount of the real estate value may not be recoverable.
As part of the Company’s quarterly impairment review procedures, one of the Company’s hotel assets was deemed to be impaired, resulting in a $6.1 million impairment charge during the three months ended June 30, 2020. Refer to Note 3 for additional details of the impairment.
The Company estimated the fair value of the impaired property using a discounted cash flow analysis that utilized Level 3 inputs. The key assumptions were the discount rate (8.7%) and the exit capitalization rate (5.7%). There are inherent uncertainties in making these estimates such as macroeconomic conditions.
Valuation of liabilities not measured at fair value
As of June 30, 2020, the fair value of the Company’s mortgage notes, term loans, and secured revolving credit facilities, repurchase agreements, and unsecured revolving credit facilities was approximately $89.6 million below carrying value. As of December 31, 2019, the fair value of the Company’s mortgage notes, term loans, and secured revolving credit facilities, repurchase agreements, and unsecured revolving credit facilities was approximately $54.9 million above carrying value. Fair value of the Company’s indebtedness is estimated by modeling the cash flows required by the Company’s debt agreements and discounting them back to the present value using the appropriate discount rate. Additionally, the Company considers current market rates and conditions by evaluating similar borrowing agreements with comparable loan-to-value ratios and credit profiles. The inputs used in determining the fair value of the Company’s indebtedness are considered Level 3.
9
Recent Accounting Pronouncements
In April 2020, the Financial Accounting Standards Board (“FASB”) staff issued a question and answer document (the “Lease Modification Q&A”) focused on the application of lease accounting guidance to lease concessions provided as a result of the COVID-19 pandemic. In accordance with the Lease Modification Q&A, the Company has made a policy election to not account for concessions as a lease modification if the total cash flows after the lease concessions are substantially the same, or less than, the cash flows in the original lease. The Company has granted concessions to certain tenants to defer rental payments until a later date. The Company continued to recognize rental revenue for such tenants during the period, while also considering any necessary bad debt reserves. As of July 31, 2020, the Company has granted $6.1 million of rental deferral requests. However, if in the future, a concession is granted that modifies the terms and significantly alters the cash flows of the original lease, the Company will account for the changes as a lease modification.
In March 2020, the FASB issued Accounting Standards Update (“ASU”) 2020-04 “Reference Rate Reform (Topic 848): Facilitation of the Effects of Reference Rate Reform on Financial Reporting”. ASU 2020-04 provides optional expedients and exceptions to GAAP requirements for modifications on debt instruments, leases, derivatives, and other contracts, related to the expected market transition from LIBOR, and certain other floating rate benchmark indices, or collectively, IBORs, to alternative reference rates. ASU 2020-04 generally considers contract modifications related to reference rate reform to be an event that does not require contract remeasurement at the modification date nor a reassessment of a previous accounting determination. The guidance in ASU 2020-04 is optional and may be elected over time, through December 31, 2022, as reference rate reform activities occur. Once ASU 2020-04 is elected, the guidance must be applied prospectively for all eligible contract modifications. The Company has not adopted any of the optional expedients or exceptions as of June 30, 2020, but will continue to evaluate the possible adoption of any such expedients or exceptions during the effective period as circumstances evolve.
3. Investments in Real Estate
Investments in real estate, net consisted of the following ($ in thousands):
|
|
|
June 30, 2020 |
|
|
December 31, 2019 |
|
||
|
Building and building improvements |
|
$ |
23,146,835 |
|
|
$ |
20,950,147 |
|
|
Land and land improvements |
|
|
6,486,661 |
|
|
|
5,639,678 |
|
|
Furniture, fixtures and equipment |
|
|
441,627 |
|
|
|
377,645 |
|
|
Right of use asset - operating leases(1) |
|
|
114,535 |
|
|
|
114,011 |
|
|
Right of use asset - financing leases(1) |
|
|
56,008 |
|
|
|
56,008 |
|
|
Total |
|
|
30,245,666 |
|
|
|
27,137,489 |
|
|
Accumulated depreciation and amortization |
|
|
(1,306,055 |
) |
|
|
(810,621 |
) |
|
Investments in real estate, net |
|
$ |
28,939,611 |
|
|
$ |
26,326,868 |
|
|
(1) |
Refer to Note 13 for additional details on the Company’s leases. |
Acquisitions
During the six months ended June 30, 2020, the Company acquired interests in 12 real estate investments for $3.2 billion, which were comprised of 77 industrial, 32 multifamily, six retail and two self-storage properties categorized as other.
The following table provides further details of the properties acquired during the six months ended June 30, 2020 ($ in thousands):
|
Segments |
|
Number of Transactions |
|
|
Number of Properties |
|
|
Sq. Feet (in thousands)/ Units/ Keys |
|
Purchase Price(1) |
|
|||
|
Multifamily properties |
|
|
6 |
|
|
|
32 |
|
|
12,110 units |
|
$ |
2,019,239 |
|
|
Industrial properties |
|
|
4 |
|
|
|
77 |
|
|
11,129 sq. ft. |
|
|
849,599 |
|
|
Retail properties |
|
|
1 |
|
|
|
6 |
|
|
689 sq. ft. |
|
|
287,392 |
|
|
Other properties |
|
|
1 |
|
|
|
2 |
|
|
111 sq. ft. |
|
|
13,236 |
|
|
|
|
|
12 |
|
|
|
117 |
|
|
|
|
$ |
3,169,466 |
|
|
(1) |
Purchase price is inclusive of acquisition related costs. |
10
The following table summarizes the purchase price allocation for the properties acquired during the six months ended June 30, 2020 ($ in thousands):
|
|
|
Amount |
|
|
|
Building and building improvements |
|
$ |
2,127,042 |
|
|
Land and land improvements |
|
|
843,275 |
|
|
Furniture, fixtures and equipment |
|
|
42,364 |
|
|
In-place lease intangibles |
|
|
169,515 |
|
|
Above-market lease intangibles |
|
|
6,915 |
|
|
Below-market lease intangibles |
|
|
(20,194 |
) |
|
Other |
|
|
549 |
|
|
Total purchase price |
|
|
3,169,466 |
|
|
Assumed mortgage notes(1) |
|
|
224,123 |
|
|
Net purchase price |
|
$ |
2,945,343 |
|
|
(1) |
Refer to Note 6 for additional details on the Company’s mortgage notes. |
The weighted-average amortization periods for the acquired in-place lease intangibles, above-market lease intangibles and below-market lease intangibles of the properties acquired during the six months ended June 30, 2020 were three, seven and four years, respectively.
Impairment
The Company reviews its real estate investments for impairment each quarter or when there is an event or change in circumstances that indicates an impaired value. If the GAAP depreciated cost basis of a real estate investment exceeds the undiscounted cash flows of such real estate investment, the investment is considered impaired and the GAAP depreciated cost basis is reduced to the fair value of the investment. During the three months ended June 30, 2020, the Company recognized a $6.1 million impairment charge on one of its hotel properties. The impairment charge was a result of updates to the undiscounted cash flow assumptions to account for a decrease in occupancy and future cash flows as a result of the COVID-19 pandemic. If the effects of the COVID-19 pandemic cause economic and market conditions to continue to deteriorate or if the Company’s expected holding period for assets change, subsequent tests for impairment could result in additional impairment charges in the future. Certain investments within the Company’s portfolio, specifically its hotel assets, are more susceptible to future impairment considerations due to the significant declines in occupancy as a result of extended closures, decreases in travel and uncertainty around future cash flows. The Company can provide no assurance that material impairment charges with respect to the Company’s investments in real estate and unconsolidated entities will not occur during the remaining quarters in 2020 or future periods. Accordingly, the Company will continue to monitor circumstances and events in future periods to determine whether any additional impairment charges are warranted.
Dispositions
On January 30, 2020, the Company sold a 61,000 square foot industrial property. Net proceeds from the sale were $4.5 million, which resulted in a realized gain of $0.4 million recorded as Net Gains on Dispositions of Real Estate on the Company’s Condensed Consolidated Statements of Operations.
On June 6, 2019, the Company sold the parking garage attached to the Hyatt Place San Jose Downtown property to a third party. The sale included a four story, 261 space, parking structure and land parcel. The sale did not include the attached Hyatt Place San Jose Downtown hotel or the additional land parcels under the hotel. Net proceeds from the sale were $44.3 million, which resulted in a realized gain of $29.7 million recorded as Net Gains on Dispositions of Real Estate on the Company’s Condensed Consolidated Statements of Operations.
Properties Held for Sale
As of June 30, 2020, five multifamily properties were classified as held for sale. Such properties were sold in July 2020 for $170.0 million resulting in a net gain of $32.3 million. As of December 31, 2019, six properties were classified as held for sale. One property was sold in January 2020 as disclosed above. The held for sale assets and liabilities are components of Other Assets and Other Liabilities, respectively, on the Condensed Consolidated Balance Sheets.
11
The following table is a summary of the assets and liabilities of the Company’s properties classified as held for sale ($ in thousands):
|
Assets: |
|
June 30, 2020 |
|
December 31, 2019 |
|
||
|
Investments in real estate, net |
|
$ |
135,296 |
|
$ |
141,344 |
|
|
Other assets |
|
|
1,405 |
|
|
2,035 |
|
|
Total assets |
|
$ |
136,701 |
|
$ |
143,379 |
|
|
|
|
|
|
|
|
|
|
|
Liabilities: |
|
|
|
|
|
|
|
|
Mortgage notes |
|
$ |
102,718 |
|
$ |
104,314 |
|
|
Other liabilities |
|
|
2,715 |
|
|
4,097 |
|
|
Total liabilities |
|
$ |
105,433 |
|
$ |
108,411 |
|
4. Investments in Unconsolidated Entities
On February 14, 2020, the Company closed a transaction to form a new joint venture with MGM Growth Properties LLC (“MGP”) to acquire the Las Vegas real estate assets of the MGM Grand and Mandalay Bay for $4.6 billion (the “BREIT MGP JV”). MGP owns 50.1% of the joint venture, and the Company owns 49.9%. At closing, the joint venture entered into a long-term triple net master lease agreement with MGM Resorts International (“MGM”), which provides the joint venture with a full corporate guarantee of rent payments by MGM. The lease has an initial annual rent of $292.0 million with an initial term of 30 years with two 10-year extension options for MGM. The lease agreement provides that the rent will escalate 2% annually for the first 15 years and then the greater of (i) 2% or (ii) the increase in the consumer price index during the prior year, subject to a cap of 3%. As of June 30, 2020, the Company did not consolidate the joint venture.
The following table provides a summarized balance sheet of the BREIT MGP JV along with a reconciliation to the Company’s equity investment in unconsolidated entities ($ in thousands):
|
|
|
|
|
|
|
|
|
June 30, 2020 |
|
|
|
Total assets |
|
$ |
4,609,419 |
|
|
Total liabilities |
|
|
(3,001,469 |
) |
|
Total equity of BREIT MGP JV |
|
|
1,607,950 |
|
|
|
|
|
|
|
|
MGP's share |
|
|
805,583 |
|
|
BREIT's share |
|
|
802,367 |
|
|
BREIT outside basis |
|
|
9,460 |
|
|
BREIT net investment in BREIT MGP JV |
|
$ |
811,827 |
|
The following table provides summarized operating data of the BREIT MGP JV along with a reconciliation to the Company’s income from unconsolidated entities ($ in thousands):
|
|
|
Three Months Ended June 30, 2020 |
|
Six Months Ended June 30, 2020 |
|
||
|
Total revenue |
|
$ |
98,681 |
|
$ |
149,118 |
|
|
Net income of BREIT MGP JV |
|
|
50,847 |
|
|
77,479 |
|
|
|
|
|
|
|
|
|
|
|
MGP's share |
|
|
25,474 |
|
|
38,817 |
|
|
BREIT's share |
|
|
25,373 |
|
|
38,662 |
|
|
Amortization of BREIT outside basis |
|
|
(37 |
) |
|
(57 |
) |
|
BREIT net income from BREIT MGP JV |
|
$ |
25,336 |
|
$ |
38,605 |
|
12
5. Investments in Real Estate Debt
The following tables detail the Company’s investments in real estate debt ($ in thousands):
|
|
|
June 30, 2020 |
|
||||||||||||||||
|
Type of Security/Loan |
|
Number of Positions |
|
Weighted Average Coupon(1) |
|
|
Weighted Average Maturity Date(2) |
|
Face Amount/ Notional(3) |
|
|
Cost Basis |
|
Fair Value |
|
||||
|
CMBS - floating |
|
|
125 |
|
L+2.7% |
|
|
2/5/2025 |
|
$ |
3,130,665 |
|
|
$ |
3,121,193 |
|
$ |
2,723,768 |
|
|
CMBS - fixed |
|
|
50 |
|
4.1% |
|
|
8/19/2027 |
|
|
912,705 |
|
|
|
889,144 |
|
|
795,728 |
|
|
Corporate bonds |
|
|
13 |
|
5.1% |
|
|
1/2/2027 |
|
|
252,492 |
|
|
|
251,713 |
|
|
237,723 |
|
|
CMBS - zero coupon |
|
|
4 |
|
N/A |
|
|
1/30/2027 |
|
|
236,090 |
|
|
|
132,318 |
|
|
138,741 |
|
|
RMBS - fixed |
|
|
10 |
|
4.4% |
|
|
12/6/2031 |
|
|
26,141 |
|
|
|
26,315 |
|
|
24,084 |
|
|
CMBS - interest only |
|
|
5 |
|
2.3% |
|
|
10/1/2026 |
|
|
2,259,760 |
|
|
|
21,691 |
|
|
21,680 |
|
|
Total real estate securities |
|
|
207 |
|
3.1% |
|
|
11/5/2025 |
|
N/M |
|
|
|
4,442,374 |
|
|
3,941,724 |
|
|
|
Term loans |
|
|
9 |
|
L+3.0% |
|
|
3/11/2022 |
|
|
604,158 |
|
|
|
591,497 |
|
|
591,264 |
|
|
Mezzanine loans |
|
|
1 |
|
L+6.9% |
|
|
12/15/2024 |
|
|
134,750 |
|
|
|
134,251 |
|
|
116,384 |
|
|
Total real estate loans |
|
|
10 |
|
L+3.7% |
|
|
8/24/2022 |
|
|
738,908 |
|
|
|
725,748 |
|
|
707,648 |
|
|
Total investments in real estate debt |
|
|
217 |
|
3.2% |
|
|
5/11/2025 |
|
N/M |
|
|
$ |
5,168,122 |
|
$ |
4,649,372 |
|
|
|
|
|
December 31, 2019 |
|
|||||||||||||||||
|
Type of Security/Loan |
|
Number of Positions |
|
Weighted Average Coupon(1) |
|
|
Weighted Average Maturity Date(2) |
|
Face Amount/ Notional(3) |
|
|
Cost Basis |
|
|
Fair Value |
|
||||
|
CMBS - floating |
|
|
122 |
|
L+2.7% |
|
|
1/29/2025 |
|
$ |
2,907,080 |
|
|
$ |
2,899,556 |
|
|
$ |
2,906,952 |
|
|
CMBS - fixed |
|
|
43 |
|
4.2% |
|
|
6/26/2027 |
|
|
850,738 |
|
|
|
829,403 |
|
|
|
831,970 |
|
|
Corporate bonds |
|
|
12 |
|
5.2% |
|
|
2/16/2027 |
|
|
276,302 |
|
|
|
276,496 |
|
|
|
288,111 |
|
|
CMBS - zero coupon |
|
|
4 |
|
N/A |
|
|
12/30/2026 |
|
|
236,090 |
|
|
|
127,219 |
|
|
|
136,027 |
|
|
RMBS - fixed |
|
|
9 |
|
4.3% |
|
|
7/9/2028 |
|
|
29,315 |
|
|
|
29,506 |
|
|
|
29,448 |
|
|
CMBS - interest only |
|
|
5 |
|
2.3% |
|
|
10/2/2026 |
|
|
2,261,480 |
|
|
|
23,564 |
|
|
|
23,547 |
|
|
Total real estate securities |
|
|
195 |
|
4.2% |
|
|
10/15/2025 |
|
N/M |
|
|
|
4,185,744 |
|
|
|
4,216,055 |
|
|
|
Term loans |
|
|
7 |
|
L+2.9% |
|
|
8/30/2024 |
|
|
175,239 |
|
|
|
173,466 |
|
|
|
173,129 |
|
|
Mezzanine loans |
|
|
1 |
|
L+6.9% |
|
|
12/15/2024 |
|
|
134,750 |
|
|
|
134,078 |
|
|
|
134,076 |
|
|
Total real estate loans |
|
|
8 |
|
L+4.6% |
|
|
10/16/2024 |
|
|
309,989 |
|
|
|
307,544 |
|
|
|
307,205 |
|
|
Total investments in real estate debt |
|
|
203 |
|
4.4% |
|
|
9/21/2025 |
|
N/M |
|
|
$ |
4,493,288 |
|
|
$ |
4,523,260 |
|
|
|
(1) |
The term “L” refers to the relevant floating benchmark rates, which include USD LIBOR, GBP LIBOR and EURIBOR, as applicable to each security and loan. |
|
(2) |
Weighted average maturity date is based on the fully extended maturity date of the instrument or, in the case of CMBS and RMBS, the underlying collateral. |
|
(3) |
Represents notional amount for interest only positions. |
The following table details the collateral type of the properties securing the Company’s investments in real estate debt ($ in thousands):
|
|
|
June 30, 2020 |
|
|
December 31, 2019 |
|
||||||||||||||||||||||||
|
Collateral(1) |
|
Number of Positions |
|
|
Cost Basis |
|
|
Fair Value |
|
|
Percentage Based on Fair Value |
|
|
Number of Positions |
|
|
Cost Basis |
|
|
Fair Value |
|
|
Percentage Based on Fair Value |
|
||||||
|
Hospitality |
|
|
76 |
|
|
$ |
2,201,498 |
|
|
$ |
1,872,878 |
|
|
41% |
|
|
|
75 |
|
|
$ |
2,252,556 |
|
|
$ |
2,259,102 |
|
|
50% |
|
|
Multifamily |
|
|
66 |
|
|
|
983,314 |
|
|
|
983,030 |
|
|
21% |
|
|
|
61 |
|
|
|
596,184 |
|
|
|
613,470 |
|
|
14% |
|
|
Office |
|
|
38 |
|
|
|
779,106 |
|
|
|
701,185 |
|
|
15% |
|
|
|
37 |
|
|
|
793,782 |
|
|
|
794,881 |
|
|
18% |
|
|
Industrial |
|
|
18 |
|
|
|
636,938 |
|
|
|
597,508 |
|
|
13% |
|
|
|
14 |
|
|
|
375,975 |
|
|
|
378,147 |
|
|
8% |
|
|
Diversified |
|
|
13 |
|
|
|
311,689 |
|
|
|
284,412 |
|
|
6% |
|
|
|
10 |
|
|
|
219,215 |
|
|
|
219,798 |
|
|
5% |
|
|
Other |
|
|
5 |
|
|
|
238,202 |
|
|
|
194,729 |
|
|
4% |
|
|
|
5 |
|
|
|
238,202 |
|
|
|
240,558 |
|
|
5% |
|
|
Retail |
|
|
1 |
|
|
|
17,375 |
|
|
|
15,630 |
|
|
—% |
|
|
|
1 |
|
|
|
17,374 |
|
|
|
17,304 |
|
|
—% |
|
|
Total |
|
|
217 |
|
|
$ |
5,168,122 |
|
|
$ |
4,649,372 |
|
|
100% |
|
|
|
203 |
|
|
$ |
4,493,288 |
|
|
$ |
4,523,260 |
|
|
100% |
|
|
(1) |
Multifamily investments in real estate debt are collateralized by various forms of rental housing including single-family homes and apartments. |
13
The following table details the credit rating of the Company’s investments in real estate debt ($ in thousands):
|
|
|
June 30, 2020 |
|
December 31, 2019 |
|
|||||||||||||||||||
|
Credit Rating |
|
Number of Positions |
|
|
Cost Basis |
|
Fair Value |
|
Percentage Based on Fair Value |
|
Number of Positions |
|
Cost Basis |
|
Fair Value |
|
Percentage Based on Fair Value |
|
||||||
|
BB |
|
|
77 |
|
|
$ |
1,618,201 |
|
$ |
1,424,508 |
|
31% |
|
|
72 |
|
$ |
1,598,930 |
|
$ |
1,610,643 |
|
36% |
|
|
Not rated |
|
|
37 |
|
|
|
1,181,728 |
|
|
1,120,701 |
|
24% |
|
|
33 |
|
|
764,941 |
|
|
773,791 |
|
17% |
|
|
B |
|
|
43 |
|
|
|
1,179,950 |
|
|
1,047,446 |
|
23% |
|
|
40 |
|
|
906,609 |
|
|
909,587 |
|
20% |
|
|
BBB |
|
|
46 |
|
|
|
838,409 |
|
|
739,296 |
|
16% |
|
|
45 |
|
|
885,891 |
|
|
891,272 |
|
20% |
|
|
A |
|
|
8 |
|
|
|
304,669 |
|
|
278,945 |
|
6% |
|
|
10 |
|
|
319,031 |
|
|
320,140 |
|
7% |
|
|
CCC |
|
|
3 |
|
|
|
35,624 |
|
|
28,941 |
|
—% |
|
|
— |
|
|
— |
|
|
— |
|
—% |
|
|
AAA |
|
|
2 |
|
|
|
8,713 |
|
|
8,708 |
|
—% |
|
|
2 |
|
|
9,554 |
|
|
9,550 |
|
—% |
|
|
AA |
|
|
1 |
|
|
|
828 |
|
|
827 |
|
—% |
|
|
1 |
|
|
8,332 |
|
|
8,277 |
|
—% |
|
|
Total |
|
|
217 |
|
|
$ |
5,168,122 |
|
$ |
4,649,372 |
|
100% |
|
|
203 |
|
$ |
4,493,288 |
|
$ |
4,523,260 |
|
100% |
|
The Company’s investments in real estate debt included CMBS and loans collateralized by properties owned by Blackstone-advised investment vehicles and CMBS collateralized by loans originated or acquired by Blackstone-advised investment vehicles. The following table details the Company’s affiliate investments in real estate debt ($ in thousands):
|
|
|
Fair Value |
|
Interest Income |
|
||||||||||||||
|
|
|
June 30, |
|
December 31, |
|
Three Months Ended June 30, |
|
Six Months Ended June 30, |
|
||||||||||
|
|
|
2020 |
|
2019 |
|
2020 |
|
2019 |
|
2020 |
|
2019 |
|
||||||
|
CMBS collateralized by properties |
|
$ |
1,485,509 |
|
$ |
1,418,056 |
|
$ |
14,197 |
|
$ |
12,290 |
|
$ |
31,013 |
|
$ |
24,370 |
|
|
Loans collateralized by properties |
|
|
509,919 |
|
|
134,076 |
|
|
3,683 |
|
|
— |
|
|
6,900 |
|
|
— |
|
|
CMBS collateralized by loans |
|
|
132,640 |
|
|
155,978 |
|
|
1,369 |
|
|
2,090 |
|
|
2,957 |
|
|
4,187 |
|
|
Total |
|
$ |
2,128,068 |
|
$ |
1,708,110 |
|
$ |
19,249 |
|
$ |
14,380 |
|
$ |
40,870 |
|
$ |
28,557 |
|
For additional information regarding the Company’s investments in affiliated CMBS, see Note 5 to the consolidated financial statements in the Company’s Annual Report on Form 10-K for the year ended December 31, 2019. The terms and conditions of such affiliated CMBS held as of June 30, 2020 are consistent with the terms described in such Note.
As of June 30, 2020 and December 31, 2019, the Company’s investments in real estate debt also included $166.7 million and $186.8 million, respectively, of CMBS collateralized by pools of commercial real estate debt, a portion of which included certain of the Company’s mortgage notes. The Company recognized $2.5 million and $5.1 million of interest income related to such CMBS during the three and six months ended June 30, 2020, respectively. The Company recognized $1.7 million and $3.3 million of interest income related to such CMBS during the three and six months ended June 30, 2019, respectively.
During the three and six months ended June 30, 2020, the Company recorded a net unrealized gain of $466.4 million and a net unrealized loss of $548.7 million, respectively, related to investments in real estate debt. During the three and six months ended June 30, 2019, the Company recorded a net unrealized gain of $20.8 million and $51.8 million, respectively, related to investments in real estate debt. Such unrealized gains and losses were recorded as a component of Income from Investments in Real Estate Debt on the Company’s Condensed Consolidated Statements of Operations. The unrealized gains recognized during the three months ended June 30, 2020 were the result of a partial recovery in pricing across the Company’s real estate debt portfolio from the significant declines in March 2020. The COVID-19 pandemic caused significant market pricing and liquidity dislocation in March 2020, causing a broad-based market decline impacting the unrealized value of certain of the Company’s investments in real estate debt.
During the three and six months ended June 30, 2020, the Company recognized a net realized loss of $5.0 million and $4.7 million, respectively, due to the sale or paydowns of certain of the Company’s investments in real estate debt. During the three and six months ended June 30, 2019, the Company sold two CMBS positions for approximately the cost basis of such securities.
14
6. Mortgage Notes, Term Loans, and Secured Revolving Credit Facilities
The following table is a summary of the mortgage notes, term loans, and secured revolving credit facilities secured by the Company’s properties ($ in thousands):
|
|
|
|
|
|
|
|
|
|
|
|
|
|
|
Principal Balance Outstanding(3) |
|
|||||
|
Indebtedness |
|
Weighted Average Interest Rate(1) |
|
|
Weighted Average Maturity Date(2) |
|
|
Maximum Facility Size |
|
|
June 30, 2020 |
|
|
December 31, 2019 |
|
|||||
|
Fixed rate loans: |
|
|
|
|
|
|
|
|
|
|
|
|
|
|
|
|
|
|
|
|
|
Fixed rate mortgages |
|
3.8% |
|
|
7/8/2027 |
|
|
N/A |
|
|
$ |
12,758,220 |
|
|
$ |
12,424,717 |
|
|||
|
Mezzanine loan |
|
|
— |
|
|
|
— |
|
|
|
|
|
|
|
— |
|
|
|
195,878 |
|
|
Total fixed rate loans |
|
3.8% |
|
|
7/8/2027 |
|
|
|
|
|
|
|
12,758,220 |
|
|
|
12,620,595 |
|
||
|
Variable rate loans: |
|
|
|
|
|
|
|
|
|
|
|
|
|
|
|
|
|
|
|
|
|
Floating rate mortgages |
|
L+1.8% |
|
|
1/25/2026 |
|
|
N/A |
|
|
|
3,288,657 |
|
|
|
1,826,435 |
|
|||
|
Variable rate term loans |
|
L+1.7% |
|
|
2/11/2024 |
|
|
N/A |
|
|
|
1,639,495 |
|
|
|
1,533,561 |
|
|||
|
Variable rate secured revolving credit facilities |
|
L+1.5% |
|
|
10/9/2026 |
|
|
$ |
2,339,495 |
|
|
|
150,000 |
|
|
|
1,063,837 |
|
||
|
Variable rate mezzanine loans |
|
L+4.3% |
|
|
4/9/2025 |
|
|
N/A |
|
|
|
142,200 |
|
|
|
— |
|
|||
|
Total variable rate loans |
|
L+1.8% |
|
|
6/14/2025 |
|
|
|
|
|
|
|
5,220,352 |
|
|
|
4,423,833 |
|
||
|
Total loans secured by the Company's properties |
|
3.3% |
|
|
12/1/2026 |
|
|
|
|
|
|
|
17,978,572 |
|
|
|
17,044,428 |
|
||
|
Premium on assumed debt, net |
|
|
|
|
|
|
|
|
|
|
|
|
|
|
10,056 |
|
|
|
10,794 |
|
|
Deferred financing costs, net |
|
|
|
|
|
|
|
|
|
|
|
|
|
|
(141,746 |
) |
|
|
(125,563 |
) |
|
Mortgage notes, term loans, and secured revolving credit facilities, net |
|
|
|
|
|
|
|
|
|
|
$ |
17,846,882 |
|
|
$ |
16,929,659 |
|
|||
|
(1) |
The term “L” refers to the one-month LIBOR. |
|
(2) |
For loans where the Company, at its sole discretion, has extension options, the maximum maturity date has been assumed. |
|
(3) |
The majority of the Company’s mortgages contain yield or spread maintenance provisions. |
The following table presents the future principal payments due under the Company’s mortgage notes, term loans, and secured revolving credit facilities as of June 30, 2020 ($ in thousands):
|
Year |
|
Amount |
|
|
|
2020 (remaining) |
|
$ |
8,948 |
|
|
2021 |
|
|
49,102 |
|
|
2022 |
|
|
553,686 |
|
|
2023 |
|
|
495,687 |
|
|
2024 |
|
|
3,027,908 |
|
|
2025 |
|
|
3,675,156 |
|
|
Thereafter |
|
|
10,168,085 |
|
|
Total |
|
$ |
17,978,572 |
|
On March 9, 2020, the Company paid off the mezzanine loan collateralized by certain of the Company’s industrial properties at carrying value. As such, the amortization of related deferred financing costs was accelerated resulting in a realized loss of $0.9 million recorded on the Company’s Condensed Consolidated Statements of Operations.
The Company is subject to various financial and operational covenants pursuant to certain of the executed mortgage notes, term loans, and secured revolving credit facilities agreements. These covenants require the Company, to maintain certain financial ratios, which may include leverage, debt yield, and debt service coverage, among others. As of June 30, 2020, the Company believes it was in compliance with all of its loan covenants. The Company’s continued compliance with these covenants depends on many factors and could be impacted by current or future economic conditions associated with the COVID-19 pandemic.
7. Secured Financings on Investments in Real Estate Debt
The Company has entered into master repurchase agreements with Citigroup Global Markets Inc. (the “Citi MRA”), Royal Bank of Canada (the “RBC MRA”), Bank of America Merrill Lynch (the “BAML MRA”), Morgan Stanley Bank, N.A. (the “MS MRA”), MUFG Securities EMEA PLC (the “MUFG MRA”), HSBC Bank USA, National Association (the “HSBC MRA”), and Barclays Bank PLC (the “Barclays MRA”) to provide the Company with additional financing capacity secured by certain of the Company’s investments in real estate debt. The terms of the Citi MRA, RBC MRA, BAML MRA, MS MRA, MUFG MRA, and HSBC MRA provide the lenders the ability to determine the size and terms of the financing provided based upon the particular collateral pledged by the Company from time-to-time and may require us to provide additional margin in the form of cash, securities or other forms of collateral should the market value of the pledged collateral decline. The Barclays MRA has a maximum facility size of $750.0 million
15
and repurchase agreements under the Barclays MRA have longer dated maturity compared to the Company’s other master repurchase agreements. Additionally, the Barclays MRA contains specific spread and advance rate provisions based on the rating of the underlying investments in real estate debt. The Company is in compliance with all financial covenants of the Barclays MRA.
During April 2020, the Company entered into an asset-specific Total Return Swap (“TRS”) and sale of a financial asset, collectively accounted for as a secured financing with Deutsche Bank (the “DB Secured Financing”) in the amount of $252.7 million. The DB Secured Financing is secured by one of the Company’s term loans and bears interest equal to the three-month EURIBOR plus 1.80% per annum. Additionally, as part of the DB Secured Financing, the Company is responsible for providing in cash, the equivalent of any decline in value on the underlying collateral.
The following tables are a summary of the Company’s secured financings on investments in real estate debt ($ in thousands):
|
|
|
June 30, 2020 |
||||||||||||
|
Indebtedness |
|
Weighted Average Maturity Date(1) |
|
Security Interests |
|
Collateral Assets(2) |
|
|
Outstanding Balance |
|
|
Prepayment Provisions |
||
|
RBC MRA |
|
3/17/2021 |
|
CMBS/Corporate bonds |
|
$ |
1,689,690 |
|
|
$ |
1,171,687 |
|
|
None |
|
Barclays MRA |
|
9/29/2021 |
|
CMBS |
|
|
1,088,259 |
|
|
|
750,000 |
|
|
None |
|
DB Secured Financing |
|
4/2/2022 |
|
Term Loan |
|
|
393,535 |
|
|
|
252,727 |
|
|
None |
|
Citi MRA |
|
2/23/2021 |
|
CMBS/RMBS |
|
|
300,248 |
|
|
|
195,271 |
|
|
None |
|
|
|
|
|
|
|
$ |
3,471,732 |
|
|
$ |
2,369,685 |
|
|
|
|
|
|
December 31, 2019 |
||||||||||||
|
Indebtedness |
|
Weighted Average Maturity Date(1) |
|
Security Interests |
|
Collateral Assets(2) |
|
|
Outstanding Balance |
|
|
Prepayment Provisions |
||
|
RBC MRA |
|
6/23/2020 |
|
CMBS/Corporate bonds |
|
$ |
1,980,951 |
|
|
$ |
1,561,642 |
|
|
None |
|
Barclays MRA |
|
9/29/2021 |
|
CMBS |
|
|
981,652 |
|
|
|
750,000 |
|
|
None |
|
MS MRA |
|
2/1/2020 |
|
CMBS |
|
|
636,734 |
|
|
|
508,510 |
|
|
None |
|
Citi MRA |
|
1/14/2020 |
|
CMBS/Corporate bonds |
|
|
266,406 |
|
|
|
205,762 |
|
|
None |
|
MUFG MRA |
|
4/30/2020 |
|
CMBS |
|
|
86,332 |
|
|
|
62,561 |
|
|
None |
|
BAML MRA |
|
1/24/2020 |
|
CMBS/Corporate bonds |
|
|
4,807 |
|
|
|
3,662 |
|
|
None |
|
|
|
|
|
|
|
$ |
3,956,882 |
|
|
$ |
3,092,137 |
|
|
|
|
(1) |
Subsequent to June 30, 2020, the Company rolled its repurchase agreement contracts expiring in July 2020 into new contracts. |
|
(2) |
Represents the fair value of the Company’s investments in real estate debt that serve as collateral. |
The weighted average interest rate of the Company’s secured financings was 1.5% (L+1.4%) and 3.0% (L + 1.3%) as of June 30, 2020 and December 31, 2019, respectively. The term “L” refers to the relevant floating benchmark rates, which include USD LIBOR, GBP LIBOR and EURIBOR, as applicable to each secured financing.
8. Unsecured Revolving Credit Facilities
The Company is party to an unsecured line of credit with multiple banks. The line of credit expires on February 22, 2023 and may be extended for one year. Interest under the line of credit is determined based on one-month U.S. dollar-denominated LIBOR plus 2.5%. As of June 30, 2020, the capacity of the unsecured line of credit was $1.3 billion. As of June 30, 2020, the Company had a $30.0 million letter of credit outstanding, which reduced the available capacity of the unsecured line of credit. There were no other outstanding borrowings on the line of credit as of June 30, 2020.
The Company also maintains a $150.0 million unsecured line of credit with an affiliate of Blackstone of which there was no outstanding balance as of June 30, 2020. For additional information regarding the affiliate line of credit, see Note 8 to the consolidated financial statements in the Company’s Annual Report on Form 10-K for the year ended December 31, 2019.
16
Due to Affiliates
The following table details the components of due to affiliates ($ in thousands):
|
|
|
June 30, 2020 |
|
December 31, 2019 |
|
||
|
Accrued stockholder servicing fee(1) |
|
$ |
558,132 |
|
$ |
478,539 |
|
|
Accrued management fee |
|
|
18,207 |
|
|
13,873 |
|
|
Accrued affiliate service provider expenses |
|
|
11,629 |
|
|
6,037 |
|
|
Advanced organization and offering costs |
|
|
5,113 |
|
|
6,136 |
|
|
Performance participation allocation |
|
|
— |
|
|
141,396 |
|
|
Other |
|
|
19,974 |
|
|
44,162 |
|
|
Total |
|
$ |
613,055 |
|
$ |
690,143 |
|
|
(1) |
The Company accrues the full amount of the future stockholder servicing fees payable to the Dealer Manager for Class S, Class T, and Class D shares up to the 8.75% of gross proceeds limit at the time such shares are sold. The Dealer Manager has entered into agreements with the selected dealers distributing the Company’s shares in the Offering, which provide, among other things, for the re-allowance of the full amount of the selling commissions and dealer manager fee and all or a portion of the stockholder servicing fees received by the Dealer Manager to such selected dealers. |
Management Fee
The Adviser is entitled to an annual management fee equal to 1.25% of the Company’s NAV, payable monthly, as compensation for the services it provides to the Company. The management fee can be paid, at the Adviser’s election, in cash, shares of common stock, or BREIT OP units. The Adviser has elected to receive the management fee in shares of the Company’s common stock to date. During the three and six months ended June 30, 2020, the Company incurred management fees of $53.4 million and $102.9 million, respectively. During the three and six months ended June 30, 2019, the Company incurred management fees of $22.5 million and $39.7 million, respectively.
During the six months ended June 30, 2020 and 2019, the Company issued 7,822,791 and 2,870,390, respectively, unregistered Class I shares to the Adviser as payment for management fees. The Company also had a payable of $18.2 million and $13.9 million related to the management fees as of June 30, 2020 and December 31, 2019, respectively, which is included in Due to Affiliates on the Company’s Condensed Consolidated Balance Sheets. During July 2020, the Adviser was issued 1,700,028 unregistered Class I shares as payment for the $18.2 million management fees accrued as of June 30, 2020. The shares issued to the Adviser for payment of the management fee were issued at the applicable NAV per share at the end of each month for which the fee was earned. During the six months ended June 30, 2020, the Adviser submitted 4,985,753 Class I shares for repurchase resulting in a total repurchase of $52.3 million. During the six months ended June 30, 2019, the Adviser submitted 4,574,431 Class I shares for repurchase resulting in a total repurchase of $49.9 million.
Accrued affiliate service provider expenses and incentive compensation awards
For further details on the Company’s relationships with its affiliated service providers, see Note 11 to the consolidated financial statements in the Company’s Annual Report on Form 10-K for the year ended December 31, 2019. The Company issued incentive compensation awards to certain employees of affiliate portfolio company service providers on January 1, 2020 that entitles them to receive an allocation of total return over a certain hurdle amount, as determined by the Company (the “2020 Awards”). The Company has determined the value of the 2020 Awards to be zero. Additionally, the Company issued similar incentive compensation awards to certain employees of affiliate portfolio company service providers on January 1, 2019 (the “2019 Awards”). The value of the 2019 Awards at January 1, 2019 was $8.0 million and will be amortized over the four year service period. As of June 30, 2020, the total unrecognized compensation cost relating to the portfolio company incentive compensation awards was $5.0 million and is expected to be recognized over a period of 2.5 years from June 30, 2020. None of Blackstone, the Adviser, or the affiliate portfolio company service providers receive any incentive compensation from the aforementioned arrangements.
17
The following tables detail the amounts incurred for affiliate service providers during the three and six months ended June 30, 2020 and 2019 ($ in thousands):
|
|
|
Affiliate Service |
|
|
Affiliate Service Provider |
|
|
Capitalized Transaction |
|
|||||||||||||||
|
|
|
Provider Expenses |
|
|
Incentive Compensation Awards |
|
|
Support Services |
|
|||||||||||||||
|
|
|
Three Months Ended June 30, |
|
|
Three Months Ended June 30, |
|
|
Three Months Ended June 30, |
|
|||||||||||||||
|
|
|
2020 |
|
|
2019 |
|
|
2020 |
|
|
2019 |
|
|
2020 |
|
|
2019 |
|
||||||
|
Link Industrial Properties L.L.C. |
|
$ |
13,691 |
|
|
$ |
3,112 |
|
|
$ |
260 |
|
|
$ |
285 |
|
|
$ |
39 |
|
|
$ |
1,000 |
|
|
LivCor, L.L.C. |
|
|
6,689 |
|
|
|
4,398 |
|
|
|
77 |
|
|
|
13 |
|
|
|
701 |
|
|
|
563 |
|
|
BRE Hotels and Resorts LLC |
|
|
4,326 |
|
|
|
1,087 |
|
|
|
156 |
|
|
|
194 |
|
|
|
— |
|
|
|
— |
|
|
ShopCore Properties TRS Management LLC |
|
|
1,356 |
|
|
|
299 |
|
|
|
7 |
|
|
|
8 |
|
|
|
— |
|
|
|
— |
|
|
Revantage Corporate Services, L.L.C. |
|
|
469 |
|
|
|
274 |
|
|
|
— |
|
|
|
— |
|
|
|
— |
|
|
|
— |
|
|
Equity Office Management, L.L.C. |
|
|
150 |
|
|
|
— |
|
|
|
— |
|
|
|
— |
|
|
|
— |
|
|
|
— |
|
|
Gateway Industrial Properties L.L.C. |
|
|
— |
|
|
|
429 |
|
|
|
— |
|
|
|
— |
|
|
|
— |
|
|
|
— |
|
|
Total |
|
$ |
26,681 |
|
|
$ |
9,599 |
|
|
$ |
500 |
|
|
$ |
500 |
|
|
$ |
740 |
|
|
$ |
1,563 |
|
|
|
|
|
|
|
|
|
|
|
|
|
|
|
|
|
|
|
|
|
|
|
|
|
|
|
|
|
|
|
|
|
|
|
|
|
|
|||||||||||||||
|
|
|
Affiliate Service |
|
|
Affiliate Service Provider |
|
|
Capitalized Transaction |
|
|||||||||||||||
|
|
|
Provider Expenses |
|
|
Incentive Compensation Awards |
|
|
Support Services |
|
|||||||||||||||
|
|
|
Six Months Ended June 30, |
|
|
Six Months Ended June 30, |
|
|
Six Months Ended June 30, |
|
|||||||||||||||
|
|
|
2020 |
|
|
2019 |
|
|
2020 |
|
|
2019 |
|
|
2020 |
|
|
2019 |
|
||||||
|
Link Industrial Properties L.L.C. |
|
$ |
26,022 |
|
|
$ |
3,112 |
|
|
$ |
521 |
|
|
$ |
285 |
|
|
$ |
553 |
|
|
$ |
1,000 |
|
|
LivCor, L.L.C. |
|
|
12,324 |
|
|
|
8,426 |
|
|
|
154 |
|
|
|
154 |
|
|
|
1,761 |
|
|
|
921 |
|
|
BRE Hotels and Resorts LLC |
|
|
7,649 |
|
|
|
1,741 |
|
|
|
312 |
|
|
|
312 |
|
|
|
— |
|
|
|
— |
|
|
ShopCore Properties TRS Management LLC |
|
|
2,121 |
|
|
|
701 |
|
|
|
13 |
|
|
|
13 |
|
|
|
315 |
|
|
|
15 |
|
|
Revantage Corporate Services, L.L.C. |
|
|
957 |
|
|
|
533 |
|
|
|
— |
|
|
|
— |
|
|
|
— |
|
|
|
— |
|
|
Equity Office Management, L.L.C. |
|
|
295 |
|
|
|
— |
|
|
|
— |
|
|
|
— |
|
|
|
— |
|
|
|
— |
|
|
Gateway Industrial Properties L.L.C. |
|
|
— |
|
|
|
2,524 |
|
|
|
— |
|
|
|
236 |
|
|
|
— |
|
|
|
27 |
|
|
Total |
|
$ |
49,368 |
|
|
$ |
17,037 |
|
|
$ |
1,000 |
|
|
$ |
1,000 |
|
|
$ |
2,629 |
|
|
$ |
1,963 |
|
Affiliate service provider expenses and incentive compensation awards are included as a component of Rental Property Operating and Hotel Operating expense, as applicable, in the Company’s Condensed Consolidated Statements of Operations. Transaction support service fees were capitalized to Investments in Real Estate on the Company’s Condensed Consolidated Balance Sheets. Neither Blackstone nor the Adviser receives any fees from the aforementioned arrangements.
Performance Participation Allocation
The Special Limited Partner holds a performance participation interest in BREIT OP that entitles it to receive an allocation of BREIT OP’s total return to its capital account. Total return is defined as distributions paid or accrued plus the change in NAV. Under the BREIT OP agreement, the annual total return will be allocated solely to the Special Limited Partner after the other unit holders have received a total return of 5% (after recouping any loss carryforward amount) and such allocation will continue until the allocation between the Special Limited Partner and all other unit holders is equal to 12.5% and 87.5%, respectively. Thereafter, the Special Limited Partner will receive an allocation of 12.5% of the annual total return. The allocation of the performance participation interest is ultimately determined at the end of each calendar year and will be paid in cash or Class I units of BREIT OP, at the election of the Special Limited Partner. During the three and six months ended June 30, 2020, the Company recognized no Performance Participation Allocation expense in the Company’s Condensed Consolidated Statements of Operations as the performance hurdle of 5% was not achieved as of June 30, 2020. During the three and six months ended June 30, 2019, the Company recognized $29.9 million and $50.1 million, respectively, of Performance Participation Allocation expense as the performance hurdle was achieved as of June 30, 2019.
In January 2020, the Company issued approximately 11.7 million Class I units and 0.7 million Class B units in BREIT OP to the Special Limited Partner as payment for the 2019 performance participation allocation. Such units were issued at the NAV per unit as of December 31, 2019. Subsequent to the Class I and Class B units being issued, 7.3 million of such units were redeemed for $83.6 million and 0.8 million of such units were exchanged for unregistered Class I shares in the Company. As of June 30, 2020, Blackstone and its employees, including the Company’s executive officers, continue to own an aggregate of $174.3 million worth of shares of the Company and Class I and Class B units in BREIT OP. The remaining Class I units held by the Special Limited Partner are included in Redeemable Non-Controlling Interest on the Company’s Condensed Consolidated Balance Sheets.
Other
As of June 30, 2020, and December 31, 2019, the Company had $17.8 million and $42.1 million, respectively, of accrued repurchases of Class I shares due to the Adviser. Additionally, as of June 30, 2020 and December 31, 2019, the Adviser had advanced $2.2 million
18
and $2.0 million, respectively, of expenses on the Company’s behalf for general corporate expenses provided by unaffiliated third parties.
Affiliate Title Service Provider
During the six months ended June 30, 2020, the Company paid Lexington National Land Services $2.4 million for title services related to 15 investments and such costs were capitalized to Investments in Real Estate or recorded as deferred financing costs, which is a reduction to Mortgage Notes, Term Loans, and Secured Revolving Credit Facilities on the Company’s Condensed Consolidated Balance Sheets. For additional information regarding this affiliate relationship, see Note 11 to the consolidated financial statements in the Company’s Annual Report on Form 10-K for the year ended December 31, 2019.
Other
As of June 30, 2020 and December 31, 2019, the Company had a receivable of $3.9 million and $3.6 million, respectively, from Livcor, L.L.C. and such amounts are included in Other Assets on the Company’s Condensed Consolidated Balance Sheets.
10. Other Assets and Other Liabilities
The following table summarizes the components of other assets ($ in thousands):
|
|
|
June 30, 2020 |
|
|
December 31, 2019 |
|
||
|
Real estate intangibles, net |
|
$ |
669,006 |
|
|
$ |
665,342 |
|
|
Equity securities |
|
|
348,261 |
|
|
|
— |
|
|
Held for sale assets |
|
|
136,701 |
|
|
|
143,379 |
|
|
Receivables |
|
|
115,377 |
|
|
|
101,106 |
|
|
Straight-line rent receivable |
|
|
99,963 |
|
|
|
38,287 |
|
|
Deferred leasing costs, net |
|
|
37,381 |
|
|
|
28,792 |
|
|
Prepaid expenses |
|
|
32,997 |
|
|
|
28,334 |
|
|
Deferred financing costs, net |
|
|
26,988 |
|
|
|
28,494 |
|
|
Pre-acquisition costs |
|
|
782 |
|
|
|
9,861 |
|
|
Other |
|
|
37,347 |
|
|
|
36,398 |
|
|
Total |
|
$ |
1,504,803 |
|
|
$ |
1,079,993 |
|
The following table summarizes the components of accounts payable, accrued expenses, and other liabilities ($ in thousands):
|
|
|
June 30, 2020 |
|
|
December 31, 2019 |
|
||
|
Subscriptions received in advance |
|
$ |
175,886 |
|
|
$ |
796,729 |
|
|
Intangible liabilities, net |
|
|
139,501 |
|
|
|
136,954 |
|
|
Real estate taxes payable |
|
|
130,246 |
|
|
|
100,767 |
|
|
Accounts payable and accrued expenses |
|
|
113,341 |
|
|
|
126,565 |
|
|
Held for sale liabilities |
|
|
105,433 |
|
|
|
108,411 |
|
|
Right of use lease liability - operating leases |
|
|
84,250 |
|
|
|
82,880 |
|
|
Distribution payable |
|
|
80,024 |
|
|
|
56,210 |
|
|
Prepaid rental income |
|
|
76,265 |
|
|
|
87,479 |
|
|
Right of use lease liability - financing leases |
|
|
57,245 |
|
|
|
56,758 |
|
|
Repurchases payable |
|
|
52,096 |
|
|
|
11,021 |
|
|
Tenant security deposits |
|
|
50,023 |
|
|
|
46,533 |
|
|
Accrued interest expense |
|
|
47,105 |
|
|
|
50,279 |
|
|
Other |
|
|
96,296 |
|
|
|
31,501 |
|
|
Total |
|
$ |
1,207,711 |
|
|
$ |
1,692,087 |
|
19
The gross carrying amount and accumulated amortization of the Company’s intangible assets and liabilities consisted of the following ($ in thousands):
|
|
|
June 30, 2020 |
|
|
December 31, 2019 |
|
||
|
Intangible assets: |
|
|
|
|
|
|
|
|
|
In-place lease intangibles |
|
$ |
947,570 |
|
|
$ |
811,254 |
|
|
Above-market lease intangibles |
|
|
49,374 |
|
|
|
42,483 |
|
|
Other |
|
|
26,400 |
|
|
|
26,400 |
|
|
Total intangible assets |
|
|
1,023,344 |
|
|
|
880,137 |
|
|
Accumulated amortization: |
|
|
|
|
|
|
|
|
|
In-place lease amortization |
|
|
(330,876 |
) |
|
|
(200,629 |
) |
|
Above-market lease amortization |
|
|
(15,715 |
) |
|
|
(10,977 |
) |
|
Other |
|
|
(7,747 |
) |
|
|
(3,189 |
) |
|
Total accumulated amortization |
|
|
(354,338 |
) |
|
|
(214,795 |
) |
|
Intangible assets, net |
|
$ |
669,006 |
|
|
$ |
665,342 |
|
|
Intangible liabilities: |
|
|
|
|
|
|
|
|
|
Below-market lease intangibles |
|
$ |
187,081 |
|
|
$ |
167,032 |
|
|
Total intangible liabilities |
|
|
187,081 |
|
|
|
167,032 |
|
|
Accumulated amortization: |
|
|
|
|
|
|
|
|
|
Below-market lease amortization |
|
|
(47,580 |
) |
|
|
(30,078 |
) |
|
Total accumulated amortization |
|
|
(47,580 |
) |
|
|
(30,078 |
) |
|
Intangible liabilities, net |
|
$ |
139,501 |
|
|
$ |
136,954 |
|
The estimated future amortization on the Company’s intangibles for each of the next five years and thereafter as of June 30, 2020 is as follows ($ in thousands):
|
|
|
In-place Lease Intangibles |
|
|
Above-market Lease Intangibles |
|
|
Below-market Lease Intangibles |
|
|||
|
2020 (remaining) |
|
$ |
158,031 |
|
|
$ |
5,894 |
|
|
$ |
(21,330 |
) |
|
2021 |
|
|
149,522 |
|
|
|
9,226 |
|
|
|
(32,103 |
) |
|
2022 |
|
|
99,404 |
|
|
|
6,038 |
|
|
|
(24,581 |
) |
|
2023 |
|
|
62,413 |
|
|
|
3,360 |
|
|
|
(19,790 |
) |
|
2024 |
|
|
46,367 |
|
|
|
2,767 |
|
|
|
(15,413 |
) |
|
2025 |
|
|
35,925 |
|
|
|
2,079 |
|
|
|
(11,775 |
) |
|
Thereafter |
|
|
65,032 |
|
|
|
4,295 |
|
|
|
(14,509 |
) |
|
|
|
$ |
616,694 |
|
|
$ |
33,659 |
|
|
$ |
(139,501 |
) |
12. Equity and Redeemable Non-controlling Interest
Authorized Capital
As of June 30, 2020, the Company had the authority to issue 10,100,000,000 shares, consisting of the following:
|
Classification |
|
Number of Shares (in thousands) |
|
|
Par Value |
|
||
|
Preferred Stock |
|
|
100,000 |
|
|
$ |
0.01 |
|
|
Class S Shares |
|
|
3,000,000 |
|
|
$ |
0.01 |
|
|
Class I Shares |
|
|
6,000,000 |
|
|
$ |
0.01 |
|
|
Class T Shares |
|
|
500,000 |
|
|
$ |
0.01 |
|
|
Class D Shares |
|
|
500,000 |
|
|
$ |
0.01 |
|
|
Total |
|
|
10,100,000 |
|
|
|
|
|
20
The following tables detail the movement in the Company’s outstanding shares of common stock (in thousands):
|
|
|
Three Months Ended June 30, 2020 |
|
|||||||||||||||||
|
|
|
Class S |
|
|
Class I |
|
|
Class T |
|
|
Class D |
|
|
Total |
|
|||||
|
March 31, 2020 |
|
|
611,149 |
|
|
|
783,816 |
|
|
|
43,898 |
|
|
|
96,382 |
|
|
|
1,535,245 |
|
|
Common stock issued |
|
|
25,770 |
|
|
|
47,450 |
|
|
|
1,177 |
|
|
|
7,329 |
|
|
|
81,726 |
|
|
Distribution reinvestment |
|
|
5,433 |
|
|
|
5,132 |
|
|
|
352 |
|
|
|
844 |
|
|
|
11,761 |
|
|
Common stock repurchased |
|
|
(10,144 |
) |
|
|
(15,585 |
) |
|
|
(1,470 |
) |
|
|
(1,393 |
) |
|
|
(28,592 |
) |
|
June 30, 2020 |
|
|
632,208 |
|
|
|
820,813 |
|
|
|
43,957 |
|
|
|
103,162 |
|
|
|
1,600,140 |
|
|
|
|
Six Months Ended June 30, 2020 |
|
|||||||||||||||||
|
|
|
Class S |
|
|
Class I |
|
|
Class T |
|
|
Class D |
|
|
Total |
|
|||||
|
December 31, 2019 |
|
|
530,813 |
|
|
|
474,279 |
|
|
|
39,767 |
|
|
|
84,657 |
|
|
|
1,129,516 |
|
|
Common stock issued |
|
|
124,298 |
|
|
|
372,282 |
|
|
|
5,988 |
|
|
|
21,438 |
|
|
|
524,006 |
|
|
Distribution reinvestment |
|
|
9,931 |
|
|
|
8,820 |
|
|
|
649 |
|
|
|
1,531 |
|
|
|
20,931 |
|
|
Common stock repurchased |
|
|
(32,834 |
) |
|
|
(34,568 |
) |
|
|
(2,447 |
) |
|
|
(4,464 |
) |
|
|
(74,313 |
) |
|
June 30, 2020 |
|
|
632,208 |
|
|
|
820,813 |
|
|
|
43,957 |
|
|
|
103,162 |
|
|
|
1,600,140 |
|
Share and Unit Repurchases
For the three months ended June 30, 2020, the Company repurchased 28,591,683 shares of common stock and 136,023 BREIT OP units representing a total of $299.1 million. For the six months ended June 30, 2020, the Company repurchased 74,312,521 shares of common stock and 7,470,443 BREIT OP units representing a total of $898.9 million. The Company had no unfulfilled repurchase requests during the three or six months ended June 30, 2020.
Distributions
The Company generally intends to distribute substantially all of its taxable income, which does not necessarily equal net income as calculated in accordance with GAAP, to its stockholders each year to comply with the REIT provisions of the Internal Revenue Code.
Each class of common stock receives the same gross distribution per share. The net distribution varies for each class based on the applicable stockholder servicing fee, which is deducted from the monthly distribution per share and paid directly to the applicable distributor.
The following tables detail the aggregate distributions declared for each applicable class of common stock for the three and six months ended June 30, 2020:
|
|
|
Three Months Ended June 30, 2020 |
|
||||||||||
|
|
|
Class S |
|
Class I |
|
Class T |
|
Class D |
|
||||
|
Aggregate gross distributions declared per share of common stock |
|
$ |
0.1577 |
|
$ |
0.1577 |
|
$ |
0.1577 |
|
$ |
0.1577 |
|
|
Stockholder servicing fee per share of common stock |
|
|
(0.0224 |
) |
|
— |
|
|
(0.0221 |
) |
|
(0.0065 |
) |
|
Net distributions declared per share of common stock |
|
$ |
0.1353 |
|
$ |
0.1577 |
|
$ |
0.1356 |
|
$ |
0.1512 |
|
|
|
|
Six Months Ended June 30, 2020 |
|
||||||||||
|
|
|
Class S |
|
Class I |
|
Class T |
|
Class D |
|
||||
|
Aggregate gross distributions declared per share of common stock |
|
$ |
0.3169 |
|
$ |
0.3169 |
|
$ |
0.3169 |
|
$ |
0.3169 |
|
|
Stockholder servicing fee per share of common stock |
|
|
(0.0463 |
) |
|
— |
|
|
(0.0457 |
) |
|
(0.0135 |
) |
|
Net distributions declared per share of common stock |
|
$ |
0.2706 |
|
$ |
0.3169 |
|
$ |
0.2712 |
|
$ |
0.3034 |
|
Redeemable Non-controlling Interest
In connection with its performance participation interest, the Special Limited Partner holds Class I units in BREIT OP. See Note 9 for further details of the Special Limited Partner’s performance participation interest. Because the Special Limited Partner has the ability to redeem its Class I units for Class I shares in the Company or cash, at the election of the Special Limited Partner, the Company has classified these Class I units as Redeemable Non-controlling Interest in mezzanine equity on the Company’s Condensed Consolidated Balance Sheets.
21
The following table summarizes the redeemable non-controlling interest activity related to the Special Limited Partner for the six months ended June 30, 2020 ($ in thousands):
|
|
|
Amount |
|
|
|
December 31, 2019 |
|
$ |
272 |
|
|
Settlement of 2019 performance participation allocation |
|
|
141,396 |
|
|
Repurchases |
|
|
(83,625 |
) |
|
Conversion to Class I and Class B units |
|
|
(48,543 |
) |
|
Conversion to Class I shares |
|
|
(9,228 |
) |
|
GAAP income allocation |
|
|
(15 |
) |
|
Distributions |
|
|
(6 |
) |
|
Fair value allocation |
|
|
4 |
|
|
June 30, 2020 |
|
$ |
255 |
|
In addition to the Special Limited Partner’s interest noted above, certain of the Company’s third party joint ventures also have a redeemable non-controlling interest in such joint ventures. As of June 30, 2020, $21.4 million related to such third party joint ventures was included in Redeemable Non-controlling Interests on the Company’s Condensed Consolidated Balance Sheets.
The Redeemable Non-controlling Interests are recorded at the greater of their carrying amount, adjusted for their share of the allocation of income or loss and distributions, or their redemption value, which is equivalent to fair value, of such interests at the end of each measurement period. Accordingly, the Company recorded an allocation adjustment of $0.2 million and $(0.3) million during the three and six months ended June 30, 2020, respectively, between Additional Paid-in Capital and Redeemable Non-controlling Interest.
13. Leases
Lessee
Certain of the Company’s investments in real estate are subject to ground leases. The Company’s ground leases are classified as either operating leases or financing leases based on the characteristics of each lease. As of June 30, 2020, the Company had 15 ground leases classified as operating and two ground leases classified as financing. Each of the Company’s ground leases were acquired as part of the acquisition of real estate and no incremental costs were incurred for such ground leases. The Company’s ground leases are non-cancelable, and two of the Company’s operating leases contain renewal options for additional 99 and 10 year terms.
The following table presents the future lease payments due under the Company’s ground leases as of June 30, 2020 ($ in thousands):
|
|
|
Operating Leases |
|
|
Financing Leases |
|
||
|
2020 (remaining) |
|
$ |
1,991 |
|
|
$ |
1,518 |
|
|
2021 |
|
|
3,982 |
|
|
|
3,081 |
|
|
2022 |
|
|
4,093 |
|
|
|
3,174 |
|
|
2023 |
|
|
4,132 |
|
|
|
3,269 |
|
|
2024 |
|
|
4,183 |
|
|
|
3,367 |
|
|
2025 |
|
|
4,423 |
|
|
|
3,468 |
|
|
Thereafter |
|
|
599,932 |
|
|
|
327,054 |
|
|
Total undiscounted future lease payments |
|
|
622,736 |
|
|
|
344,931 |
|
|
Difference between undiscounted cash flows and discounted cash flows |
|
|
(538,486 |
) |
|
|
(287,686 |
) |
|
Total lease liability |
|
$ |
84,250 |
|
|
$ |
57,245 |
|
The Company utilized its incremental borrowing rate, which was between 5% and 7%, to determine its lease liabilities. As of June 30, 2020, the weighted average remaining lease term of the Company’s operating leases and financing leases was 56 years and 76 years, respectively.
Payments under the Company’s ground leases primarily contain fixed payment components that may include periodic increases fixed to an index or periodic fixed percentage escalations. One of the Company’s ground leases contains a variable component based on a percentage of revenue.
22
The following table summarizes the fixed and variable components of the Company’s operating leases ($ in thousands):
|
|
|
Three Months Ended June 30, |
|
|
Six Months Ended June 30, |
|
||||||||||
|
|
|
2020 |
|
|
2019 |
|
|
2020 |
|
|
2019 |
|
||||
|
Fixed ground rent expense |
|
$ |
1,014 |
|
|
$ |
359 |
|
|
$ |
2,026 |
|
|
$ |
718 |
|
|
Variable ground rent expense |
|
|
1 |
|
|
|
3 |
|
|
|
18 |
|
|
|
21 |
|
|
Total cash portion of ground rent expense |
|
|
1,015 |
|
|
|
362 |
|
|
|
2,044 |
|
|
|
739 |
|
|
Non-cash ground rent expense |
|
|
1,691 |
|
|
|
1,092 |
|
|
|
3,434 |
|
|
|
2,184 |
|
|
Total operating lease costs |
|
$ |
2,706 |
|
|
$ |
1,454 |
|
|
$ |
5,478 |
|
|
$ |
2,923 |
|
The following table summarizes the fixed and variable components of the Company’s financing leases ($ in thousands):
|
|
|
Three Months Ended June 30, |
|
|
Six Months Ended June 30, |
|
||||||||||
|
|
|
2020 |
|
|
2019 |
|
|
2020 |
|
|
2019 |
|
||||
|
Interest on lease liabilities |
|
$ |
737 |
|
|
$ |
739 |
|
|
$ |
1,474 |
|
|
$ |
754 |
|
|
Amortization of right-of-use assets |
|
|
257 |
|
|
|
261 |
|
|
|
509 |
|
|
|
261 |
|
|
Total financing lease costs |
|
$ |
994 |
|
|
$ |
1,000 |
|
|
$ |
1,983 |
|
|
$ |
1,015 |
|
Lessor
The Company’s rental revenue primarily consists of rent earned from operating leases at the Company’s multifamily, industrial, retail, office, net lease and other properties. Leases at the Company’s industrial, retail, and office properties generally include a fixed base rent and certain leases also contain a variable component. The variable component of the Company’s operating leases at its industrial, retail, and office properties primarily consist of the reimbursement of operating expenses such as real estate taxes, insurance, and common area maintenance costs. Rental revenue earned from leases at the Company’s multifamily properties primarily consist of a fixed base rent and certain leases contain a variable component that allows for the pass-through of certain operating expenses such as utilities. During the six months ended June 30, 2020, the Company changed its presentation for the payment of leasing commissions in the Condensed Consolidated Statement of Cash Flows to investing activities from operating activities to better align with how the Company assesses its overall investments in its properties. The Company does not believe the change in presentation to be material as the Company had $12.4 million of leasing commissions during the six months ended June 30, 2020.
Rental revenue from the Company’s lease at the Bellagio consists of a fixed annual rent that escalates annually throughout the term of the lease and the tenant is generally responsible for all property-related expenses, including taxes, insurance and maintenance. The Company assessed the classification of the Bellagio lease and determined the lease was an operating lease. The Company’s assessment included the consideration of the present value of the lease payments over the lease term and the residual value of the assets under the lease.
Leases at the Company’s industrial, retail, office, and net lease properties are generally longer term and may contain extension and termination options at the lessee’s election. Leases at the Company’s multifamily and other properties are short term in nature, generally not greater than 12 months in length.
The following table details the components of operating lease income from leases in which the Company is the lessor ($ in thousands):
|
|
|
Three Months Ended June 30, |
|
|
Six Months Ended June 30, |
|
||||||||||
|
|
|
2020 |
|
|
2019 |
|
|
2020 |
|
|
2019 |
|
||||
|
Fixed lease payments |
|
$ |
506,046 |
|
|
$ |
223,882 |
|
|
$ |
983,331 |
|
|
$ |
412,737 |
|
|
Variable lease payments |
|
|
47,671 |
|
|
|
23,790 |
|
|
|
102,481 |
|
|
|
47,132 |
|
|
Rental revenue |
|
$ |
553,717 |
|
|
$ |
247,672 |
|
|
$ |
1,085,812 |
|
|
$ |
459,869 |
|
As a result of COVID-19, the Company increased the reserve for bad debt expense in the amount of $16.3 million for the three months ended June 30, 2020. The bad debt reserve represents the amount of rental revenue the Company anticipates it will not be able to collect from its tenants.
23
The following table presents the undiscounted future minimum rents the Company expects to receive for its industrial, net lease, retail and office properties as of June 30, 2020 ($ in thousands). Leases at the Company’s multifamily and self-storage properties are short term, generally 12 months or less, and are therefore not included.
|
Year |
|
Future Minimum Rents |
|
|
|
2020 (remaining) |
|
$ |
604,117 |
|
|
2021 |
|
|
846,801 |
|
|
2022 |
|
|
755,552 |
|
|
2023 |
|
|
655,273 |
|
|
2024 |
|
|
574,971 |
|
|
2025 |
|
|
527,166 |
|
|
Thereafter |
|
|
9,051,241 |
|
|
Total |
|
$ |
13,015,121 |
|
14. Segment Reporting
The Company operates in eight reportable segments: Multifamily, Industrial, Net Lease, Hotel, Retail, Office, and Other properties and Real Estate Debt. The Company allocates resources and evaluates results based on the performance of each segment individually. The Company believes that Segment Net Operating Income is the key performance metric that captures the unique operating characteristics of each segment.
The following table sets forth the total assets by segment ($ in thousands):
|
|
|
June 30, 2020 |
|
|
December 31, 2019 |
|
||
|
Multifamily |
|
$ |
11,537,484 |
|
|
$ |
9,695,916 |
|
|
Industrial |
|
|
11,188,957 |
|
|
|
10,564,172 |
|
|
Net lease |
|
|
5,059,427 |
|
|
|
4,271,196 |
|
|
Hotel |
|
|
2,357,585 |
|
|
|
2,427,554 |
|
|
Retail |
|
|
714,678 |
|
|
|
419,198 |
|
|
Office |
|
|
133,277 |
|
|
|
138,912 |
|
|
Other properties |
|
|
155,485 |
|
|
|
145,411 |
|
|
Investments in real estate debt |
|
|
5,254,130 |
|
|
|
4,565,385 |
|
|
Other (Corporate) |
|
|
227,476 |
|
|
|
812,079 |
|
|
Total assets |
|
$ |
36,628,499 |
|
|
$ |
33,039,823 |
|
24
The following table sets forth the financial results by segment for the three months ended June 30, 2020 ($ in thousands):
|
|
|
|
|
|
|
|
|
|
|
|
|
|
|
|
|
|
|
|
|
|
|
|
Investments in |
|
|
|
|
|
|
|
|
|
|
|
|
|
|
Net |
|
|
|
|
|
|
|
|
|
|
Other |
|
Real Estate |
|
|
|
|
|||
|
|
|
Multifamily |
|
Industrial |
|
Lease |
|
Hotel |
|
Retail |
|
Office |
|
Properties |
|
Debt |
|
Total |
|
|||||||||
|
Revenues: |
|
|
|
|
|
|
|
|
|
|
|
|
|
|
|
|
|
|
|
|
|
|
|
|
|
|
|
|
|
Rental revenue |
|
$ |
241,793 |
|
$ |
209,583 |
|
$ |
82,794 |
|
$ |
— |
|
$ |
12,679 |
|
$ |
2,971 |
|
$ |
3,897 |
|
$ |
— |
|
$ |
553,717 |
|
|
Hotel revenue |
|
|
— |
|
|
— |
|
|
— |
|
|
21,781 |
|
|
— |
|
|
— |
|
|
— |
|
|
— |
|
|
21,781 |
|
|
Other revenue |
|
|
14,007 |
|
|
1,157 |
|
|
— |
|
|
1,263 |
|
|
228 |
|
|
130 |
|
|
464 |
|
|
— |
|
|
17,249 |
|
|
Total revenues |
|
|
255,800 |
|
|
210,740 |
|
|
82,794 |
|
|
23,044 |
|
|
12,907 |
|
|
3,101 |
|
|
4,361 |
|
|
— |
|
|
592,747 |
|
|
Expenses: |
|
|
|
|
|
|
|
|
|
|
|
|
|
|
|
|
|
|
|
|
|
|
|
|
|
|
|
|
|
Rental property operating |
|
|
115,236 |
|
|
64,048 |
|
|
13 |
|
|
— |
|
|
4,331 |
|
|
1,066 |
|
|
2,341 |
|
|
— |
|
|
187,035 |
|
|
Hotel operating |
|
|
— |
|
|
— |
|
|
— |
|
|
44,523 |
|
|
— |
|
|
— |
|
|
— |
|
|
— |
|
|
44,523 |
|
|
Total expenses |
|
|
115,236 |
|
|
64,048 |
|
|
13 |
|
|
44,523 |
|
|
4,331 |
|
|
1,066 |
|
|
2,341 |
|
|
— |
|
|
231,558 |
|
|
Income from unconsolidated entities |
|
|
— |
|
|
— |
|
|
25,336 |
|
|
— |
|
|
— |
|
|
— |
|
|
— |
|
|
— |
|
|
25,336 |
|
|
Income from investments in real estate debt |
|
|
— |
|
|
— |
|
|
— |
|
|
— |
|
|
— |
|
|
— |
|
|
— |
|
|
492,889 |
|
|
492,889 |
|
|
Segment net operating income (loss) |
|
$ |
140,564 |
|
$ |
146,692 |
|
$ |
108,117 |
|
$ |
(21,479 |
) |
$ |
8,576 |
|
$ |
2,035 |
|
$ |
2,020 |
|
$ |
492,889 |
|
$ |
879,414 |
|
|
|
|
|
|
|
|
|
|
|
|
|
|
|
|
|
|
|
|
|
|
|
|
|
|
|
|
|
|
|
|
Depreciation and amortization |
|
$ |
(145,595 |
) |
$ |
(138,798 |
) |
$ |
(29,040 |
) |
$ |
(22,753 |
) |
$ |
(8,174 |
) |
$ |
(1,540 |
) |
$ |
(1,452 |
) |
$ |
— |
|
$ |
(347,352 |
) |
|
|
|
|
|
|
|
|
|
|
|
|
|
|
|
|
|
|
|
|
|
|
|
|
|
|
|
|
|
|
|
General and administrative |
|
|
|
|
|
|
|
|
|
|
|
|
|
|
|
|
|
|
|
|
|
|
|
|
|
|
(6,913 |
) |
|
Management fee |
|
|
|
|
|
|
|
|
|
|
|
|
|
|
|
|
|
|
|
|
|
|
|
|
|
|
(53,423 |
) |
|
Performance participation allocation |
|
|
|
|
|
|
|
|
|
|
|
|
|
|
|
|
|
|
|
|
|
|
|
|
|
|
— |
|
|
Impairment of investments in real estate |
|
|
|
|
|
|
|
|
|
|
|
|
|
|
|
|
|
|
|
|
|
|
|
|
|
|
(6,126 |
) |
|
Net gains on dispositions of real estate |
|
|
|
|
|
|
|
|
|
|
|
|
|
|
|
|
|
|
|
|
|
|
|
|
|
|
— |
|
|
Interest income |
|
|
|
|
|
|
|
|
|
|
|
|
|
|
|
|
|
|
|
|
|
|
|
|
|
|
233 |
|
|
Interest expense |
|
|
|
|
|
|
|
|
|
|
|
|
|
|
|
|
|
|
|
|
|
|
|
|
|
|
(176,579 |
) |
|
Loss on extinguishment of debt |
|
|
|
|
|
|
|
|
|
|
|
|
|
|
|
|
|
|
|
|
|
|
|
|
|
|
— |
|
|
Other income (expense) |
|
|
|
|
|
|
|
|
|
|
|
|
|
|
|
|
|
|
|
|
|
|
|
|
|
|
29,078 |
|
|
Net income |
|
|
|
|
|
|
|
|
|
|
|
|
|
|
|
|
|
|
|
|
|
|
|
|
|
$ |
318,332 |
|
|
Net loss attributable to non-controlling interests in third party joint ventures |
|
|
|
|
|
|
|
|
|
|
|
|
|
$ |
966 |
|
||||||||||||
|
Net income attributable to non-controlling interests in BREIT OP |
|
|
|
|
|
|
|
|
|
|
|
|
|
|
(4,859 |
) |
||||||||||||
|
Net income attributable to BREIT stockholders |
|
|
|
|
$ |
314,439 |
|
|||||||||||||||||||||
25
The following table sets forth the financial results by segment for the three months ended June 30, 2019 ($ in thousands):
|
|
|
Multifamily |
|
Industrial |
|
Hotel |
|
Retail |
|
Investments in Real Estate Debt |
|
Total |
|
||||||
|
Revenues: |
|
|
|
|
|
|
|
|
|
|
|
|
|
|
|
|
|
|
|
|
Rental revenue |
|
$ |
159,243 |
|
$ |
85,368 |
|
$ |
— |
|
$ |
3,061 |
|
$ |
— |
|
$ |
247,672 |
|
|
Hotel revenue |
|
|
— |
|
|
— |
|
|
94,351 |
|
|
— |
|
|
— |
|
|
94,351 |
|
|
Other revenue |
|
|
9,038 |
|
|
95 |
|
|
3,075 |
|
|
77 |
|
|
— |
|
|
12,285 |
|
|
Total revenues |
|
|
168,281 |
|
|
85,463 |
|
|
97,426 |
|
|
3,138 |
|
|
— |
|
|
354,308 |
|
|
Expenses: |
|
|
|
|
|
|
|
|
|
|
|
|
|
|
|
|
|
|
|
|
Rental property operating |
|
|
73,772 |
|
|
26,196 |
|
|
— |
|
|
1,243 |
|
|
— |
|
|
101,211 |
|
|
Hotel operating |
|
|
— |
|
|
— |
|
|
63,197 |
|
|
— |
|
|
— |
|
|
63,197 |
|
|
Total expenses |
|
|
73,772 |
|
|
26,196 |
|
|
63,197 |
|
|
1,243 |
|
|
— |
|
|
164,408 |
|
|
Income (loss) from investments in real estate debt |
|
— |
|
|
— |
|
|
— |
|
|
— |
|
|
51,784 |
|
|
51,784 |
|
|
|
Segment net operating income |
|
$ |
94,509 |
|
$ |
59,267 |
|
$ |
34,229 |
|
$ |
1,895 |
|
$ |
51,784 |
|
$ |
241,684 |
|
|
|
|
|
|
|
|
|
|
|
|
|
|
|
|
|
|
|
|
|
|
|
Depreciation and amortization |
|
$ |
(96,631 |
) |
$ |
(47,403 |
) |
$ |
(16,257 |
) |
$ |
(1,563 |
) |
$ |
— |
|
$ |
(161,854 |
) |
|
|
|
|
|
|
|
|
|
|
|
|
|
|
|
|
|
|
|
|
|
|
General and administrative |
|
|
|
|
|
|
|
|
|
|
|
|
|
|
|
|
|
(4,878 |
) |
|
Management fee |
|
|
|
|
|
|
|
|
|
|
|
|
|
|
|
|
|
(22,487 |
) |
|
Performance participation allocation |
|
|
|
|
|
|
|
|
|
|
|
|
|
|
|
|
|
(29,898 |
) |
|
Net gains on dispositions of real estate |
|
|
|
|
|
|
|
|
|
|
|
|
|
|
|
|
|
29,686 |
|
|
Interest income |
|
|
|
|
|
|
|
|
|
|
|
|
|
|
|
|
|
303 |
|
|
Interest expense |
|
|
|
|
|
|
|
|
|
|
|
|
|
|
|
|
|
(103,279 |
) |
|
Other income (expense) |
|
|
|
|
|
|
|
|
|
|
|
|
|
|
|
|
|
(2,061 |
) |
|
Net loss |
|
|
|
|
|
|
|
|
|
|
|
|
|
|
|
|
$ |
(52,784 |
) |
|
Net loss attributable to non-controlling interests in third party joint ventures |
|
|
|
|
|
|
|
$ |
970 |
|
|||||||||
|
Net loss attributable to non-controlling interests in BREIT OP |
|
|
|
|
|
|
|
|
|
|
|
1,110 |
|
||||||
|
Net loss attributable to BREIT stockholders |
|
|
|
|
|
|
|
|
|
|
$ |
(50,704 |
) |
||||||
26
The following table sets forth the financial results by segment for the six months ended June 30, 2020 ($ in thousands):
|
|
|
|
|
|
|
|
|
|
|
|
|
|
|
|
|
|
|
|
|
|
|
|
Investments in |
|
|
|
|
|
|
|
|
|
|
|
|
|
|
Net |
|
|
|
|
|
|
|
|
|
|
Other |
|
Real Estate |
|
|
|
|
|||
|
|
|
Multifamily |
|
Industrial |
|
Lease |
|
Hotel |
|
Retail |
|
Office |
|
Properties |
|
Debt |
|
Total |
|
|||||||||
|
Revenues: |
|
|
|
|
|
|
|
|
|
|
|
|
|
|
|
|
|
|
|
|
|
|
|
|
|
|
|
|
|
Rental revenue |
|
$ |
468,912 |
|
$ |
410,980 |
|
$ |
165,589 |
|
$ |
— |
|
$ |
26,922 |
|
$ |
5,948 |
|
$ |
7,461 |
|
$ |
— |
|
$ |
1,085,812 |
|
|
Hotel revenue |
|
|
— |
|
|
— |
|
|
— |
|
|
149,253 |
|
|
— |
|
|
— |
|
|
— |
|
|
— |
|
|
149,253 |
|
|
Other revenue |
|
|
26,092 |
|
|
1,998 |
|
|
— |
|
|
2,837 |
|
|
506 |
|
|
220 |
|
|
911 |
|
|
— |
|
|
32,564 |
|
|
Total revenues |
|
|
495,004 |
|
|
412,978 |
|
|
165,589 |
|
|
152,090 |
|
|
27,428 |
|
|
6,168 |
|
|
8,372 |
|
|
— |
|
|
1,267,629 |
|
|
Expenses: |
|
|
|
|
|
|
|
|
|
|
|
|
|
|
|
|
|
|
|
|
|
|
|
|
|
|
|
|
|
Rental property operating |
|
|
219,796 |
|
|
121,218 |
|
|
114 |
|
|
— |
|
|
7,751 |
|
|
2,101 |
|
|
4,443 |
|
|
— |
|
|
355,423 |
|
|
Hotel operating |
|
|
— |
|
|
— |
|
|
|
|
|
143,829 |
|
|
— |
|
|
— |
|
|
— |
|
|
— |
|
|
143,829 |
|
|
Total expenses |
|
|
219,796 |
|
|
121,218 |
|
|
114 |
|
|
143,829 |
|
|
7,751 |
|
|
2,101 |
|
|
4,443 |
|
|
— |
|
|
499,252 |
|
|
Income from unconsolidated entities |
|
|
— |
|
|
— |
|
|
38,605 |
|
|
— |
|
|
— |
|
|
— |
|
|
— |
|
|
— |
|
|
38,605 |
|
|
Income (loss) from investments in real estate debt |
|
|
— |
|
|
— |
|
|
— |
|
|
— |
|
|
— |
|
|
— |
|
|
— |
|
|
(523,258 |
) |
|
(523,258 |
) |
|
Segment net operating income (loss) |
|
$ |
275,208 |
|
$ |
291,760 |
|
$ |
204,080 |
|
$ |
8,261 |
|
$ |
19,677 |
|
$ |
4,067 |
|
$ |
3,929 |
|
$ |
(523,258 |
) |
$ |
283,724 |
|
|
|
|
|
|
|
|
|
|
|
|
|
|
|
|
|
|
|
|
|
|
|
|
|
|
|
|
|
|
|
|
Depreciation and amortization |
|
$ |
(272,921 |
) |
$ |
(276,922 |
) |
$ |
(57,195 |
) |
$ |
(45,546 |
) |
$ |
(16,809 |
) |
$ |
(3,083 |
) |
$ |
(3,681 |
) |
$ |
— |
|
$ |
(676,157 |
) |
|
|
|
|
|
|
|
|
|
|
|
|
|
|
|
|
|
|
|
|
|
|
|
|
|
|
|
|
|
|
|
General and administrative |
|
|
|
|
|
|
|
|
|
|
|
|
|
|
|
|
|
|
|
|
|
|
|
|
|
|
(13,595 |
) |
|
Management fee |
|
|
|
|
|
|
|
|
|
|
|
|
|
|
|
|
|
|
|
|
|
|
|
|
|
|
(102,925 |
) |
|
Performance participation allocation |
|
|
|
|
|
|
|
|
|
|
|
|
|
|
|
|
|
|
|
|
|
|
|
|
|
|
— |
|
|
Impairment of investments in real estate |
|
|
|
|
|
|
|
|
|
|
|
|
|
|
|
|
|
|
|
|
|
|
|
|
|
|
(6,126 |
) |
|
Net gains on dispositions of real estate |
|
|
|
|
|
|
|
|
|
|
|
|
|
|
|
|
|
|
|
|
|
|
|
|
|
|
371 |
|
|
Interest income |
|
|
|
|
|
|
|
|
|
|
|
|
|
|
|
|
|
|
|
|
|
|
|
|
|
|
1,980 |
|
|
Interest expense |
|
|
|
|
|
|
|
|
|
|
|
|
|
|
|
|
|
|
|
|
|
|
|
|
|
|
(365,083 |
) |
|
Loss on extinguishment of debt |
|
|
|
|
|
|
|
|
|
|
|
|
|
|
|
|
|
|
|
|
|
|
|
|
|
|
(1,237 |
) |
|
Other income (expense) |
|
|
|
|
|
|
|
|
|
|
|
|
|
|
|
|
|
|
|
|
|
|
|
|
|
|
(19,770 |
) |
|
Net loss |
|
|
|
|
|
|
|
|
|
|
|
|
|
|
|
|
|
|
|
|
|
|
|
|
|
$ |
(898,818 |
) |
|
Net loss attributable to non-controlling interests in third party joint ventures |
|
|
|
|
$ |
1,203 |
|
|||||||||||||||||||||
|
Net loss attributable to non-controlling interests in BREIT OP |
|
|
|
|
|
11,967 |
|
|||||||||||||||||||||
|
Net loss attributable to BREIT stockholders |
|
|
|
|
$ |
(885,648 |
) |
|||||||||||||||||||||
27
The following table sets forth the financial results by segment for the six months ended June 30, 2019 ($ in thousands):
|
|
|
Multifamily |
|
Industrial |
|
Hotel |
|
Retail |
|
Investments in Real Estate Debt |
|
Total |
|
||||||
|
Revenues: |
|
|
|
|
|
|
|
|
|
|
|
|
|
|
|
|
|
|
|
|
Rental revenue |
|
$ |
287,141 |
|
$ |
166,669 |
|
$ |
— |
|
$ |
6,059 |
|
$ |
— |
|
$ |
459,869 |
|
|
Hotel revenue |
|
|
— |
|
|
— |
|
|
169,617 |
|
|
— |
|
|
— |
|
|
169,617 |
|
|
Other revenue |
|
|
16,649 |
|
|
312 |
|
|
4,802 |
|
|
150 |
|
|
— |
|
|
21,913 |
|
|
Total revenues |
|
|
303,790 |
|
|
166,981 |
|
|
174,419 |
|
|
6,209 |
|
|
— |
|
|
651,399 |
|
|
Expenses: |
|
|
|
|
|
|
|
|
|
|
|
|
|
|
|
|
|
|
|
|
Rental property operating |
|
|
135,596 |
|
|
51,057 |
|
|
— |
|
|
2,369 |
|
|
— |
|
|
189,022 |
|
|
Hotel operating |
|
|
— |
|
|
— |
|
|
114,517 |
|
|
— |
|
|
— |
|
|
114,517 |
|
|
Total expenses |
|
|
135,596 |
|
|
51,057 |
|
|
114,517 |
|
|
2,369 |
|
|
— |
|
|
303,539 |
|
|
Income (loss) from investments in real estate debt |
|
— |
|
|
— |
|
|
— |
|
|
— |
|
|
113,467 |
|
|
113,467 |
|
|
|
Segment net operating income |
|
$ |
168,194 |
|
$ |
115,924 |
|
$ |
59,902 |
|
$ |
3,840 |
|
$ |
113,467 |
|
$ |
461,327 |
|
|
|
|
|
|
|
|
|
|
|
|
|
|
|
|
|
|
|
|
|
|
|
Depreciation and amortization |
|
$ |
(175,165 |
) |
$ |
(92,425 |
) |
$ |
(30,683 |
) |
$ |
(3,060 |
) |
$ |
— |
|
$ |
(301,333 |
) |
|
|
|
|
|
|
|
|
|
|
|
|
|
|
|
|
|
|
|
|
|
|
General and administrative |
|
|
|
|
|
|
|
|
|
|
|
|
|
|
|
|
|
(8,059 |
) |
|
Management fee |
|
|
|
|
|
|
|
|
|
|
|
|
|
|
|
|
|
(39,664 |
) |
|
Performance participation allocation |
|
|
|
|
|
|
|
|
|
|
|
|
|
|
|
|
|
(50,061 |
) |
|
Net gains on dispositions of real estate |
|
|
|
|
|
|
|
|
|
|
|
|
|
|
|
|
|
29,686 |
|
|
Interest income |
|
|
|
|
|
|
|
|
|
|
|
|
|
|
|
|
|
497 |
|
|
Interest expense |
|
|
|
|
|
|
|
|
|
|
|
|
|
|
|
|
|
(194,866 |
) |
|
Other income (expense) |
|
|
|
|
|
|
|
|
|
|
|
|
|
|
|
|
|
(407 |
) |
|
Net loss |
|
|
|
|
|
|
|
|
|
|
|
|
|
|
|
|
$ |
(102,880 |
) |
|
Net loss attributable to non-controlling interests in third party joint ventures |
|
|
|
|
|
|
|
$ |
3,006 |
|
|||||||||
|
Net loss attributable to non-controlling interests in BREIT OP |
|
|
|
|
|
|
|
|
|
|
|
2,324 |
|
||||||
|
Net loss attributable to BREIT stockholders |
|
|
|
|
|
|
|
|
|
|
$ |
(97,550 |
) |
||||||
15. Commitments and Contingencies
From time to time, the Company may be involved in various claims and legal actions arising in the ordinary course of business. As of June 30, 2020 and December 31, 2019, the Company was not involved in any material legal proceedings.
16. Subsequent Events
Acquisitions
Subsequent to June 30, 2020, the Company acquired an aggregate of $72.0 million of real estate, exclusive of closing costs, across two separate transactions.
Subsequent to June 30, 2020, the Company purchased an aggregate of $167.2 million of investments in real estate debt.
Proceeds from the Issuance of Common Stock
Subsequent to June 30, 2020, the Company had received net proceeds of $677.6 million from the issuance of its common stock.
28
References herein to “Blackstone Real Estate Income Trust,” “BREIT,” the “Company,” “we,” “us,” or “our” refer to Blackstone Real Estate Income Trust, Inc. and its subsidiaries unless the context specifically requires otherwise.
The following discussion should be read in conjunction with the unaudited condensed consolidated financial statements and notes thereto appearing elsewhere in this quarterly report on Form 10-Q.
Forward-Looking Statements
This quarterly report on Form 10-Q contains forward-looking statements within the meaning of the federal securities laws and the Private Securities Litigation Reform Act of 1995. These forward-looking statements can be identified by the use of forward-looking terminology such as “may,” “will,” “expect,” “intend,” “anticipate,” “estimate,” “believe,” “continue” or other similar words or the negatives thereof. These may include our financial projections and estimates and their underlying assumptions, statements about plans, objectives and expectations with respect to future operations, statements with respect to acquisitions and statements regarding future performance. Such forward-looking statements are inherently uncertain and there are or may be important factors that could cause actual outcomes or results to differ materially from those indicated in such statements. We believe these factors also include but are not limited to those described under the section entitled “Risk Factors” in our prospectus and our Annual Report on form 10-K for the year ended December 31, 2019, which are accessible on the SEC’s website at www.sec.gov. These factors should not be construed as exhaustive and should be read in conjunction with the other cautionary statements that are included in this document (or our prospectus and other filings). Except as otherwise required by federal securities laws, we undertake no obligation to publicly update or revise any forward-looking statements, whether as a result of new information, future developments or otherwise.
Overview
BREIT invests primarily in stabilized income-oriented commercial real estate in the United States and, to a lesser extent, real estate debt. We are the sole general partner of BREIT Operating Partnership L.P. (“BREIT OP”), a Delaware limited partnership, and we own all or substantially all of our assets through BREIT OP. We are externally managed by BX REIT Advisors L.L.C. (the “Adviser”). The Adviser is part of the real estate group of The Blackstone Group Inc. (“Blackstone”), a leading investment manager, which serves as our sponsor. We currently operate our business in eight reportable segments: Multifamily, Industrial, Net Lease, Hotel, Retail, Office and Other Properties, and Investments in Real Estate Debt. Multifamily includes various forms of rental housing including apartments, student housing and manufactured housing. Other includes self-storage properties. Net Lease includes the real estate assets of The Bellagio Las Vegas (“Bellagio”) and the unconsolidated interest in the MGM Grand and Mandalay Bay joint venture.
BREIT is a public unlisted, perpetual life real estate investment trust (“REIT”) that qualifies as a REIT under the Internal Revenue Code of 1986, as amended (the “Code”) for U.S. federal income tax. We generally will not be subject to U.S. federal income taxes on our taxable income to the extent we annually distribute all of our net taxable income to stockholders and maintain our qualification as a REIT.
We had registered with the Securities and Exchange Commission (the “SEC”) an offering of up to $5.0 billion in shares of common stock (the “Initial Offering”) and accepted aggregate gross offering proceeds of $4.9 billion during the period January 1, 2017 to January 1, 2019. We subsequently registered with the SEC a follow-on offering of up to $12.0 billion in shares of common stock (in any combination of purchases of Class S, Class I, Class T, and Class D shares of our common stock), consisting of up to $10.0 billion in shares in our primary offering and up to $2.0 billion in shares pursuant to our distribution reinvestment plan, which we began using to offer shares of our common stock in January 2019 (the “Current Offering” and with the Initial Offering, the “Offering”). The share classes have different upfront selling commissions and ongoing stockholder servicing fees.
As of August 13, 2020, we had received net proceeds of $19.2 billion from the Offering and the sale of unregistered shares of our common stock. We have contributed the net proceeds to BREIT OP in exchange for a corresponding number of Class S, Class I, Class T, and Class D units. BREIT OP has primarily used the net proceeds to make investments in real estate and real estate debt as further described below under “— Portfolio”. We intend to continue selling shares on a monthly basis.
Recent Developments
The global outbreak of a novel coronavirus, or COVID-19, that began in the first quarter of 2020 continues to spread and at this point has spread to over 200 countries and territories, including the United States, where it has spread to every state in the United States. The World Health Organization has designated COVID-19 as a pandemic, and numerous countries, including the United States, have
29
declared national emergencies with respect to COVID-19. The United States and other countries have reacted to the COVID-19 outbreak with unprecedented government intervention, including interest rate cuts and economic stimulus. The global impact of the outbreak has been rapidly evolving, and as cases of COVID-19 have continued to be identified in additional countries, many countries have reacted by instituting quarantines and restrictions on travel, closing financial markets and/or restricting trading, and limiting operations of non-essential offices, retail centers, hotels, and other businesses. Such actions have created disruption in global supply chains, increased rates of unemployment and adversely impacted many industries. The outbreak could have a continued adverse impact on economic and market conditions and has triggered a period of global economic slowdown.
The outbreak of COVID-19 and its impact on the current financial, economic and capital markets environment, and future developments in these and other areas present uncertainty and risk with respect to our financial condition and results of operations. We expect that these impacts are likely to continue to some extent as the outbreak persists and potentially even longer. The rapid development and fluidity of this situation precludes any prediction as to the ultimate adverse impact of COVID-19 on economic and market conditions, and, as a result, present material uncertainty and risk with respect to us and the performance of our investments. The full extent of the impact and effects of COVID-19 will depend on future developments, including, among other factors, the duration and spread of the outbreak, along with related travel advisories, quarantines and restrictions, the recovery time of the disrupted supply chains and industries, the impact of labor market interruptions, the impact of government interventions, and uncertainty with respect to the duration of the global economic slowdown. For additional discussion with respect to the potential impact of the COVID-19 pandemic on our liquidity and capital resources, see “Liquidity and Capital Resources” below.
In accordance with local government guidance and social distancing recommendations, the vast majority of the employees of our Adviser have been working remotely since mid-March 2020. The Adviser’s technology infrastructure has proven to be robust and capable of supporting this model. The Adviser has implemented rigorous protocols for remote work, including increased cadence of group calls and updates, and frequent communication across leadership and working levels. The Adviser is leveraging technology to ensure its teams stay connected and productive, and that its culture remains strong even in these unusual circumstances. The Adviser continues to operate across investment, asset management and corporate support functions.
Impact of COVID-19 - Results of Operations
Beginning in April 2020, rent collections at our real estate assets were adversely impacted by COVID-19. As of July 31, 2020, rent collections for revenue recognized during the three months ended June 30, 2020 at our multifamily, industrial, net lease, retail and office properties were an average of 1.0% lower compared to a typical quarter. Based on rent collections and other factors, we reserved $16.3 million of bad debt expense for the three months ended June 30, 2020. We continue to monitor rent collections, noting July rent collections for our multifamily, industrial, net lease, retail and office properties were 1.8% lower compared to a typical month.
Certain of our tenants impacted by the COVID-19 pandemic have requested rental assistance. As a result, we have granted $6.1 million of rent deferral, representing 0.9% of total rental revenue for the period from April 1, 2020 through July 31, 2020. It is expected that the deferred rent will generally be paid back over a period of three to twelve months.
Beginning in March 2020 and continuing through the end of the second quarter, our hotel segment experienced a material decrease in occupancy, ADR, and RevPAR due to the full closure of our two full-service hotels and our select service property located in Hawaii. In addition, certain of our select service hotels in common markets have consolidated operations into a single property. These conditions impacted the performance of our hotel assets beginning in March 2020 with the most significant decline in performance during April and May as these hotels remained closed or were impacted by reduced capacity as quarantines and travel restrictions were in place. Although we have begun to see a modest rebound in our hotel portfolio in June 2020 as certain states began easing quarantines and travel restrictions, hotel performance continues to be significantly below historical levels. While our select service property located in Hawaii remains closed, our full-service hotels re-opened ahead of expectations during June and July. Since the end of the quarter, we continue to see a modest rebound in our hotel performance. See “—Results of Operations – Same Property Results of Operations”. Additionally, during the three months ended June 30, 2020, we recorded a $6.1 million GAAP impairment loss on one of our hotel properties. The impairment charge aligns the GAAP carrying value of the hotel with the fair value already recorded within the June 30, 2020 Net Asset Value. For additional information see “—Portfolio – Impact of COVID-19 – Impairment Analysis” below.
The COVID-19 pandemic caused significant market pricing and liquidity dislocation in March 2020, causing a broad-based market decline across securities including commercial mortgage-backed securities (“CMBS”). Although there has been a partial recovery in pricing of these securities during the second quarter, the pandemic continues to have a significant impact on our investments in real estate debt, which consist mostly of single asset, single borrower CMBS with assets and borrowers that the Adviser believes to be of high quality. See “—Results of Operations – Income (Loss) on Investments in Real Estate Debt”.
For additional discussion with respect to the potential impact of the COVID-19 pandemic on our NAV and liquidity and capital resources see “—Impact of COVID-19 on Our NAV” and “—Liquidity and Capital Resources” below.
30
Please refer to Item 1A. Risk Factors in our Annual Report on Form 10-K for the year ended December 31, 2019 and our prospectus dated April 21, 2020 and filed with the SEC, as supplemented, for additional disclosure relating to material trends or uncertainties that may impact our business.
Q2 2020 Highlights
Operating Results:
|
|
• |
Declared monthly net distributions totaling $234.4 million for the three months ended June 30, 2020, resulting in quarterly average annualized distribution rates of 5.1% for Class S, 6.0% for Class I, 5.2% for Class T, and 5.8% for Class D. The annualized distribution rate is calculated as the current month’s distribution annualized and divided by the prior month’s net asset value, which is inclusive of all fees and expenses. Management believes the annualized distribution rate is a useful measure of the overall investment performance of our shares. |
|
|
• |
Year-to-date total return through June 30, 2020, without upfront selling commissions, was -4.0% for Class S, -3.7% for Class I, -3.9% for Class T, and -3.5% for Class D shares. Year-to-date total return through June 30, 2020 assuming full upfront selling commissions was -7.2% for Class S, -7.1% for Class T, and -4.9% for Class D shares. Total return is calculated as the change in NAV per share during the respective periods plus any distributions per share declared in the period and assumes such distributions are reinvested in accordance with our distribution reinvestment plan. Management believes total return is a useful measure of the overall investment performance of our shares. |
|
|
• |
Inception-to-date total return through June 30, 2020 without upfront selling commissions of 6.9% for Class S, 7.7% for Class I, 6.8% for Class T, and 7.7% for Class D shares. Inception-to-date total return through June 30, 2020 assuming maximum upfront selling commissions of 5.8% for Class S, 5.7% for Class T shares and 7.1% for Class D. Total return is calculated as the change in NAV per share during the respective periods plus any distributions per share declared in the period and assumes any distributions are reinvested in accordance with our distribution reinvestment plan. Management believes total return is a useful measure of the overall investment performance of our shares. |
Investments:
|
|
• |
Acquired three industrial and ten multifamily properties across four transactions with a total purchase price of $481.6 million, inclusive of closing costs, during the three months ended June 30, 2020. The acquisitions are consistent with our strategy of acquiring diversified, income-producing, commercial real estate assets concentrated in high growth markets across the U.S. |
|
|
• |
Made five investments in real estate debt with a total cost basis of $3.7 million consisting of CMBS and residential mortgage-backed securities (“RMBS”). |
Capital Activity and Financings:
|
|
• |
Raised $944.7 million of proceeds during the three months ended June 30, 2020 from the sale of our common stock. Repurchased $299.1 million of our common stock during the three months ended June 30, 2020. |
|
|
• |
Continued our strategy of obtaining revolving credit capacity by adding an additional $75.5 million of revolving credit capacity. |
|
|
• |
Closed or assumed an aggregate $304.5 million in property-level financing, paid down $544.3 million on our existing revolving credit facilities and reduced the financings secured by our investments in real estate debt by $146.6 million during the three months ended June 30, 2020. |
Overall Portfolio:
|
|
• |
Our 1,171 properties as of June 30, 2020 consisted of Multifamily (38% based on fair value), Industrial (36%), Net Lease (16%), Hotel (6%), Retail (2%), Office (1%), and Other (1%), and our portfolio of real estate was concentrated in the following regions: West (42%), South (32%), East (15%), and Midwest (11%). |
|
|
• |
Investments in real estate debt as of June 30, 2020 were diversified by credit rating — BB (31% based on fair value), Not Rated (24%), B (23%), BBB (16%), A (6%), CCC (<1%), AAA (<1%), and AA (<1%) and collateral backing — Hospitality (41%), Multifamily (21%), Office (15%), Industrial (13%), Diversified (6%), Other (4%), and Retail (<1%). |
31
Summary of Portfolio
The following chart outlines the allocation of our investments in real estate(1) and real estate debt based on fair value as of June 30, 2020:
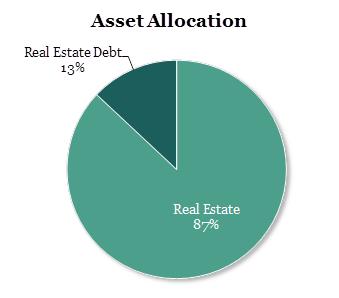
Real Estate Investments
The following charts further describe the diversification of our investments in real estate(1) based on fair value as of June 30, 2020:
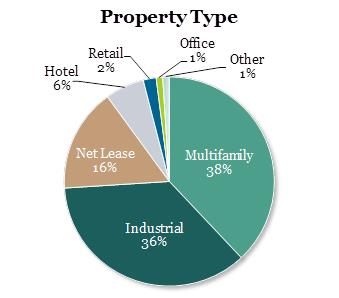
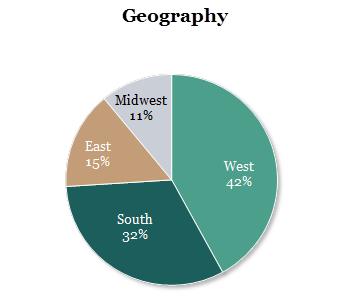
|
|
(1 |
) Investments in real estate includes our direct property investments, unconsolidated investments, and equity in public and private real estate-related companies. “Geography” weighting is measured as the asset value of real estate properties, excluding the value of any third party interests in such real estate properties, and unconsolidated investments for each geographical category (South, East, West, Midwest) against the total asset value of all (i) real estate properties, excluding the value of any third party interests in such real estate properties, and (ii) unconsolidated investments. |
32
The following map identifies the top markets of our portfolio composition in real properties based on fair value as of June 30, 2020:
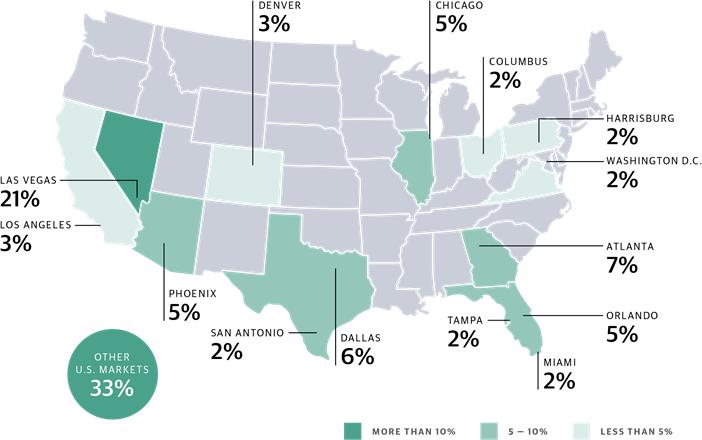
As of June 30, 2020, we had acquired 1,171 properties resulting in a diversified portfolio of income producing assets primarily consisting of Multifamily and Industrial properties, and to a lesser extent Net Lease, Hotel, Retail, Office and Other properties, concentrated in growth markets across the U.S. The following table provides a summary of our portfolio as of June 30, 2020:
|
Segment |
|
Number of Properties |
|
|
Sq. Feet (in thousands)/ Units/Keys |
|
Occupancy Rate(1) |
|
|
Average Effective Annual Base Rent Per Leased Square Foot/Units/Keys(2) |
|
|
Gross Asset Value(3) ($ in thousands) |
|
|
Segment Revenue(4) |
|
|
Percentage of Total Revenues |
|
|||||
|
Multifamily(5) |
|
|
231 |
|
|
74,708 units |
|
93% |
|
|
$ |
14,039 |
|
|
$ |
12,697,070 |
|
|
$ |
495,004 |
|
|
38% |
|
|
|
Industrial |
|
|
841 |
|
|
137,990 sq. ft. |
|
94% |
|
|
$ |
4.90 |
|
|
|
11,873,886 |
|
|
|
412,978 |
|
|
32% |
|
|
|
Net lease |
|
|
3 |
|
|
24,748 sq. ft. |
|
N/A |
|
|
N/A |
|
|
|
5,123,047 |
|
|
|
204,194 |
|
|
16% |
|
||
|
Hotel |
|
|
59 |
|
|
9,968 keys |
|
60% |
|
|
$159.95/$95.62 |
|
|
|
2,106,112 |
|
|
|
152,090 |
|
|
12% |
|
||
|
Retail |
|
|
13 |
|
|
1,933 sq. ft. |
|
97% |
|
|
$ |
23.07 |
|
|
|
691,126 |
|
|
|
27,428 |
|
|
2% |
|
|
|
Office |
|
|
1 |
|
|
228 sq. ft. |
|
95% |
|
|
$ |
29.05 |
|
|
|
126,661 |
|
|
|
6,168 |
|
|
0% |
|
|
|
Other |
|
|
23 |
|
|
1,458 sq. ft. |
|
90% |
|
|
$ |
11.24 |
|
|
|
173,663 |
|
|
|
8,372 |
|
|
0% |
|
|
|
Total |
|
|
1,171 |
|
|
|
|
|
|
|
|
|
|
|
|
$ |
32,791,565 |
|
|
$ |
1,306,234 |
|
|
100% |
|
|
(1) |
The occupancy rate for our industrial, retail and office investments includes all leased square footage as of June 30, 2020. The occupancy rate for our self-storage and manufactured housing investments includes occupied square footage and occupied units, respectively, as of June 30, 2020. The occupancy rate for our student housing and other multifamily investments is defined as the percentage of actual rent divided by gross potential rent (defined as actual rent for occupied units and market rent for vacant units) for the six months ended June 30, 2020. The occupancy rate for our hotel investments includes paid occupied rooms for the 12 months ended June 30, 2020. Hotels owned less than 12 months are excluded from the average occupancy rate calculation. |
33
|
Average Daily Rate (“ADR”) and Revenue Per Available Room (“RevPAR”), respectively, for the 12 months ended June 30, 2020. Hotels owned less than 12 months are excluded from the ADR and RevPAR calculations. |
|
(3) |
Based on fair value as of June 30, 2020. |
|
(4) |
Segment revenue is presented for the six months ended June 30, 2020. Net lease segment revenue includes income from unconsolidated entities. |
|
(5) |
Multifamily includes various forms of rental housing such as apartments, manufactured and student housing. Multifamily units include manufactured housing sites and student housing beds. |
Real Estate
The following table provides information regarding our portfolio of real properties as of June 30, 2020:
|
Segment and Investment |
|
Number of Properties |
|
|
Location |
|
Acquisition Date |
|
Ownership Interest(1) |
|
Sq. Feet (in thousands)/ Units/Keys(2) |
|
Occupancy Rate(3) |
|
|||
|
Multifamily: |
|
|
|
|
|
|
|
|
|
|
|
|
|
|
|
|
|
|
Sonora Canyon Apartments |
|
|
1 |
|
|
Mesa, AZ |
|
Feb. 2017 |
|
100% |
|
388 units |
|
95% |
|
||
|
TA Multifamily Portfolio |
|
|
6 |
|
|
Various |
|
April 2017 |
|
100% |
|
2,514 units |
|
93% |
|
||
|
Emory Point |
|
|
1 |
|
|
Atlanta, GA |
|
May 2017 |
|
100% |
|
750 units |
|
88% |
|
||
|
Nevada West Multifamily |
|
|
3 |
|
|
Las Vegas, NV |
|
May 2017 |
|
100% |
|
972 units |
|
94% |
|
||
|
Mountain Gate & Trails Multifamily |
|
|
2 |
|
|
Las Vegas, NV |
|
June 2017 |
|
100% |
|
539 units |
|
94% |
|
||
|
Elysian West Multifamily |
|
|
1 |
|
|
Las Vegas, NV |
|
July 2017 |
|
100% |
|
466 units |
|
93% |
|
||
|
Harbor 5 Multifamily |
|
|
5 |
|
|
Dallas, TX |
|
Aug. 2017 |
|
100% |
|
1,192 units |
|
96% |
|
||
|
Gilbert Multifamily |
|
|
2 |
|
|
Gilbert, AZ |
|
Sept. 2017 |
|
90% |
|
748 units |
|
93% |
|
||
|
Domain & GreenVue Multifamily |
|
|
2 |
|
|
Dallas, TX |
|
Sept. 2017 |
|
100% |
|
803 units |
|
95% |
|
||
|
ACG II Multifamily |
|
|
4 |
|
|
Various |
|
Sept. 2017 |
|
94% |
|
932 units |
|
93% |
|
||
|
Olympus Multifamily |
|
|
3 |
|
|
Jacksonville, FL |
|
Nov. 2017 |
|
95% |
|
1,032 units |
|
94% |
|
||
|
Amberglen West Multifamily |
|
|
1 |
|
|
Hillsboro, OR |
|
Nov. 2017 |
|
100% |
|
396 units |
|
91% |
|
||
|
Aston Multifamily Portfolio |
|
|
20 |
|
|
Various |
|
Various |
|
90% |
|
4,584 units |
|
95% |
|
||
|
Talavera and Flamingo Multifamily |
|
|
2 |
|
|
Las Vegas, NV |
|
Dec. 2017 |
|
100% |
|
674 units |
|
95% |
|
||
|
Walden Pond & Montair Multifamily Portfolio |
|
|
2 |
|
|
Everett, WA & Thornton, CO |
|
Dec. 2017 |
|
95% |
|
635 units |
|
95% |
|
||
|
Signature at Kendall Multifamily |
|
|
1 |
|
|
Miami, FL |
|
Dec. 2017 |
|
100% |
|
546 units |
|
95% |
|
||
|
The Boulevard |
|
|
1 |
|
|
Phoenix, AZ |
|
April 2018 |
|
100% |
|
294 units |
|
93% |
|
||
|
Blue Hills Multifamily |
|
|
1 |
|
|
Boston, MA |
|
May 2018 |
|
100% |
|
472 units |
|
93% |
|
||
|
Wave Multifamily Portfolio |
|
|
6 |
|
|
Various |
|
May 2018 |
|
100% |
|
2,199 units |
|
95% |
|
||
|
ACG III Multifamily |
|
|
2 |
|
|
Gresham, OR & Turlock, CA |
|
May 2018 |
|
95% |
|
475 units |
|
95% |
|
||
|
Carroll Florida Multifamily |
|
|
2 |
|
|
Jacksonville & Orlando, FL |
|
May 2018 |
|
100% |
|
716 units |
|
93% |
|
||
|
Solis at Flamingo |
|
|
1 |
|
|
Las Vegas, NV |
|
June 2018 |
|
95% |
|
524 units |
|
96% |
|
||
|
Velaire at Aspera |
|
|
1 |
|
|
Phoenix, AZ |
|
July 2018 |
|
100% |
|
286 units |
|
92% |
|
||
|
Coyote Multifamily Portfolio |
|
|
6 |
|
|
Phoenix, AZ |
|
Aug. 2018 |
|
100% |
|
1,752 units |
|
94% |
|
||
|
Avanti Apartments |
|
|
1 |
|
|
Las Vegas, NV |
|
Dec. 2018 |
|
100% |
|
414 units |
|
96% |
|
||
|
Gilbert Heritage Apartments |
|
|
1 |
|
|
Phoenix, AZ |
|
Feb. 2019 |
|
90% |
|
256 units |
|
93% |
|
||
|
Roman Multifamily Portfolio |
|
|
14 |
|
|
Various |
|
Feb. 2019 |
|
100% |
|
3,743 units |
|
95% |
|
||
|
Elevation Plaza Del Rio |
|
|
1 |
|
|
Phoenix, AZ |
|
April 2019 |
|
90% |
|
333 units |
|
95% |
|
||
|
Courtney at Universal Multifamily |
|
|
1 |
|
|
Orlando, FL |
|
April 2019 |
|
100% |
|
355 units |
|
93% |
|
||
|
Citymark Multifamily 2-Pack |
|
|
2 |
|
|
Various |
|
April 2019 |
|
95% |
|
608 units |
|
97% |
|
||
|
Tri-Cities Multifamily 2-Pack |
|
|
2 |
|
|
Richland & Kennewick, WA |
|
April 2019 |
|
95% |
|
428 units |
|
95% |
|
||
|
Raider Multifamily Portfolio |
|
|
4 |
|
|
Las Vegas, NV |
|
Various |
|
100% |
|
1,514 units |
|
92% |
|
||
|
Bridge II Multifamily Portfolio |
|
|
6 |
|
|
Various |
|
Various |
|
100% |
|
2,363 units |
|
95% |
|
||
|
Miami Doral 2-Pack |
|
|
2 |
|
|
Miami, FL |
|
May 2019 |
|
100% |
|
720 units |
|
91% |
|
||
|
Davis Multifamily 2-Pack |
|
|
2 |
|
|
Various |
|
May 2019 |
|
100% |
|
454 units |
|
96% |
|
||
|
Slate Savannah |
|
|
1 |
|
|
Savannah, GA |
|
May 2019 |
|
90% |
|
272 units |
|
93% |
|
||
|
Amara at MetroWest |
|
|
1 |
|
|
Orlando, FL |
|
May 2019 |
|
95% |
|
411 units |
|
94% |
|
||
|
Colorado 3-Pack |
|
|
3 |
|
|
Denver & Fort Collins, CO |
|
May 2019 |
|
100% |
|
855 units |
|
95% |
|
||
|
Edge Las Vegas |
|
|
1 |
|
|
Las Vegas, NV |
|
June 2019 |
|
95% |
|
296 units |
|
93% |
|
||
|
ACG IV Multifamily |
|
|
2 |
|
|
Various |
|
June 2019 |
|
95% |
|
606 units |
|
94% |
|
||
|
Perimeter Multifamily 3-Pack |
|
|
3 |
|
|
Atlanta, GA |
|
June 2019 |
|
100% |
|
691 units |
|
92% |
|
||
|
Anson at the Lakes |
|
|
1 |
|
|
Charlotte, NC |
|
June 2019 |
|
100% |
|
694 units |
|
94% |
|
||
|
San Valiente Multifamily |
|
|
1 |
|
|
Phoenix, AZ |
|
July 2019 |
|
95% |
|
604 units |
|
96% |
|
||
|
Edgewater at the Cove |
|
|
1 |
|
|
Oregon City, OR |
|
Aug. 2019 |
|
100% |
|
244 units |
|
92% |
|
||
34
|
Segment and Investment |
|
Number of Properties |
|
|
Location |
|
Acquisition Date |
|
Ownership Interest(1) |
|
Sq. Feet (in thousands)/ Units/Keys(2) |
|
Occupancy Rate(3) |
|
|||
|
Haven 124 Multifamily |
|
|
1 |
|
|
Denver, CO |
|
Sept. 2019 |
|
100% |
|
562 units |
|
94% |
|
||
|
Villages at McCullers Walk Multifamily |
|
|
1 |
|
|
Raleigh, NC |
|
Oct. 2019 |
|
100% |
|
412 units |
|
94% |
|
||
|
Canopy at Citrus Park Multifamily |
|
|
1 |
|
|
Largo, FL |
|
Oct. 2019 |
|
90% |
|
318 units |
|
94% |
|
||
|
Ridge Multifamily Portfolio |
|
|
4 |
|
|
Las Vegas, NV |
|
Oct. 2019 |
|
90% |
|
1,220 units |
|
93% |
|
||
|
Charleston on 66th Multifamily |
|
|
1 |
|
|
Tampa, FL |
|
Nov. 2019 |
|
95% |
|
258 units |
|
93% |
|
||
|
Evolve at Timber Creek Multifamily |
|
|
1 |
|
|
Garner, NC |
|
Nov. 2019 |
|
100% |
|
304 units |
|
90% |
|
||
|
Solis at Towne Center Multifamily |
|
|
1 |
|
|
Glendale, AZ |
|
Nov. 2019 |
|
100% |
|
240 units |
|
93% |
|
||
|
Arches at Hidden Creek Multifamily |
|
|
1 |
|
|
Chandler, AZ |
|
Nov. 2019 |
|
98% |
|
432 units |
|
96% |
|
||
|
Terra Multifamily |
|
|
1 |
|
|
Austin, TX |
|
Dec. 2019 |
|
100% |
|
372 units |
|
95% |
|
||
|
Arium Multifamily Portfolio |
|
|
5 |
|
|
Various |
|
Dec. 2019 |
|
100% |
|
1,684 units |
|
92% |
|
||
|
Easton Gardens Multifamily |
|
|
1 |
|
|
Columbus, OH |
|
Feb. 2020 |
|
95% |
|
1,064 units |
|
92% |
|
||
|
Acorn Multifamily Portfolio |
|
|
21 |
|
|
Various |
|
Feb. & May 2020 |
|
98% |
|
8,309 units |
|
93% |
|
||
|
Indigo West Multifamily |
|
|
1 |
|
|
Orlando, FL |
|
March 2020 |
|
100% |
|
456 units |
|
96% |
|
||
|
Highroads MH |
|
|
3 |
|
|
Phoenix, AZ |
|
April 2018 |
|
99% |
|
265 units |
|
94% |
|
||
|
Evergreen Minari MH |
|
|
2 |
|
|
Phoenix, AZ |
|
June 2018 |
|
99% |
|
115 units |
|
95% |
|
||
|
Southwest MH |
|
|
14 |
|
|
Various |
|
June 2018 |
|
99% |
|
3,065 units |
|
77% |
|
||
|
Hidden Springs MH |
|
|
1 |
|
|
Desert Hot Springs, CA |
|
July 2018 |
|
99% |
|
317 units |
|
86% |
|
||
|
SVPAC MH |
|
|
2 |
|
|
Phoenix, AZ |
|
July 2018 |
|
99% |
|
234 units |
|
93% |
|
||
|
Royal Vegas MH |
|
|
1 |
|
|
Las Vegas, NV |
|
Oct. 2018 |
|
99% |
|
176 units |
|
71% |
|
||
|
Riverest MH |
|
|
1 |
|
|
Tavares, FL |
|
Dec. 2018 |
|
99% |
|
130 units |
|
85% |
|
||
|
Angler MH Portfolio |
|
|
5 |
|
|
Phoenix, AZ |
|
April 2019 |
|
99% |
|
940 units |
|
83% |
|
||
|
Florida MH 4-Pack |
|
|
4 |
|
|
Various |
|
April & July 2019 |
|
99% |
|
795 units |
|
76% |
|
||
|
Impala MH |
|
|
3 |
|
|
Phoenix & Chandler, AZ |
|
July 2019 |
|
99% |
|
333 units |
|
98% |
|
||
|
Clearwater MH |
|
|
1 |
|
|
Clearwater, FL |
|
March 2020 |
|
99% |
|
88 units |
|
100% |
|
||
|
Legacy MH Portfolio |
|
|
7 |
|
|
Various |
|
April 2020 |
|
99% |
|
1,896 units |
|
84% |
|
||
|
May Manor MH |
|
|
1 |
|
|
Lakeland, FL |
|
June 2020 |
|
99% |
|
297 units |
|
85% |
|
||
|
EdR Student Housing Portfolio |
|
|
20 |
|
|
Various |
|
Sept. 2018 |
|
95% |
|
10,676 units |
|
95% |
|
||
|
Total Multifamily |
|
|
231 |
|
|
|
|
|
|
|
|
|
74,708 units |
|
|
|
|
|
|
|
|
|
|
|
|
|
|
|
|
|
|
|
|
|
|
|
|
Industrial: |
|
|
|
|
|
|
|
|
|
|
|
|
|
|
|
|
|
|
Stockton Industrial Park |
|
|
1 |
|
|
Stockton, CA |
|
Feb. 2017 |
|
100% |
|
878 sq. ft. |
|
86% |
|
||
|
HS Industrial Portfolio |
|
|
36 |
|
|
Various |
|
April 2017 |
|
100% |
|
5,838 sq. ft. |
|
93% |
|
||
|
Fairfield Industrial Portfolio |
|
|
11 |
|
|
Fairfield, NJ |
|
Sept. 2017 |
|
100% |
|
578 sq. ft. |
|
100% |
|
||
|
Southeast Industrial Portfolio |
|
|
5 |
|
|
Various |
|
Nov. 2017 |
|
100% |
|
1,927 sq. ft. |
|
97% |
|
||
|
Kraft Chicago Industrial Portfolio |
|
|
3 |
|
|
Aurora, IL |
|
Jan. 2018 |
|
100% |
|
1,693 sq. ft. |
|
100% |
|
||
|
Canyon Industrial Portfolio |
|
|
145 |
|
|
Various |
|
March 2018 |
|
100% |
|
21,174 sq. ft. |
|
94% |
|
||
|
HP Cold Storage Industrial Portfolio |
|
|
6 |
|
|
Various |
|
May 2018 |
|
100% |
|
2,252 sq. ft. |
|
100% |
|
||
|
Meridian Industrial Portfolio |
|
|
106 |
|
|
Various |
|
Nov. 2018 |
|
99% |
|
14,011 sq. ft. |
|
92% |
|
||
|
Stockton Distribution Center |
|
|
1 |
|
|
Stockton, CA |
|
Dec. 2018 |
|
100% |
|
987 sq. ft. |
|
100% |
|
||
|
Summit Industrial Portfolio |
|
|
8 |
|
|
Atlanta, GA |
|
Dec. 2018 |
|
100% |
|
631 sq. ft. |
|
97% |
|
||
|
4500 Westport Drive |
|
|
1 |
|
|
Harrisburg, PA |
|
Jan. 2019 |
|
100% |
|
179 sq. ft. |
|
100% |
|
||
|
Morgan Savannah |
|
|
1 |
|
|
Savannah, GA |
|
April 2019 |
|
100% |
|
357 sq. ft. |
|
100% |
|
||
|
Minneapolis Industrial Portfolio |
|
|
34 |
|
|
Minneapolis, MN |
|
April 2019 |
|
100% |
|
2,460 sq. ft. |
|
93% |
|
||
|
Atlanta Industrial Portfolio |
|
|
61 |
|
|
Atlanta, GA |
|
May 2019 |
|
100% |
|
3,779 sq. ft. |
|
90% |
|
||
|
D.C. Powered Shell Warehouse Portfolio |
|
|
9 |
|
|
Ashburn & Manassas, VA |
|
June 2019 |
|
90% |
|
1,471 sq. ft. |
|
100% |
|
||
|
Patriot Park |
|
|
2 |
|
|
Durham, NC |
|
Sept. 2019 |
|
100% |
|
323 sq. ft. |
|
90% |
|
||
|
Denali Industrial Portfolio |
|
|
18 |
|
|
Various |
|
Sept. 2019 |
|
100% |
|
4,098 sq. ft. |
|
98% |
|
||
|
Jupiter 12 Industrial Portfolio |
|
|
315 |
|
|
Various |
|
Sept. 2019 |
|
100% |
|
63,965 sq. ft. |
|
94% |
|
||
|
2201 Main Street |
|
|
1 |
|
|
San Diego, CA |
|
Oct. 2019 |
|
100% |
|
260 sq. ft. |
|
N/A |
|
||
|
Triangle Industrial Portfolio |
|
|
37 |
|
|
Greensboro, NC |
|
Jan. 2020 |
|
100% |
|
2,783 sq. ft. |
|
89% |
|
||
|
Midwest Industrial Portfolio |
|
|
27 |
|
|
Various |
|
Feb. 2020 |
|
100% |
|
5,940 sq. ft. |
|
93% |
|
||
|
Pancal Industrial Portfolio |
|
|
12 |
|
|
Various |
|
Feb. & April 2020 |
|
100% |
|
2,109 sq. ft. |
|
98% |
|
||
|
Grainger Distribution Center |
|
|
1 |
|
|
Jacksonville, FL |
|
March 2020 |
|
100% |
|
297 sq. ft. |
|
100% |
|
||
|
Total Industrial |
|
|
841 |
|
|
|
|
|
|
|
|
|
137,990 sq. ft. |
|
|
|
|
|
|
|
|
|
|
|
|
|
|
|
|
|
|
|
|
|
|
|
|
Net Lease: |
|
|
|
|
|
|
|
|
|
|
|
|
|
|
|
|
|
|
Bellagio |
|
|
1 |
|
|
Las Vegas, NV |
|
Nov. 2019 |
|
95% |
|
8,507 sq. ft. |
|
N/A |
|
||
|
MGM Grand |
|
|
1 |
|
|
Las Vegas, NV |
|
Feb. 2020 |
|
49.9% |
|
6,917 sq. ft. |
|
N/A |
|
||
|
Mandalay Bay |
|
|
1 |
|
|
Las Vegas, NV |
|
Feb. 2020 |
|
49.9% |
|
9,324 sq. ft. |
|
N/A |
|
||
|
Total Net Lease |
|
|
3 |
|
|
|
|
|
|
|
|
|
24,748 sq. ft. |
|
|
|
|
|
|
|
|
|
|
|
|
|
|
|
|
|
|
|
|
|
|
|
|
Hotel: |
|
|
|
|
|
|
|
|
|
|
|
|
|
|
|
|
|
|
Hyatt Place UC Davis |
|
|
1 |
|
|
Davis, CA |
|
Jan. 2017 |
|
100% |
|
127 keys |
|
62% |
|
||
|
Hyatt Place San Jose Downtown |
|
|
1 |
|
|
San Jose, CA |
|
June 2017 |
|
100% |
|
240 keys |
|
60% |
|
||
|
Florida Select-Service 4-Pack |
|
|
4 |
|
|
Tampa & Orlando, FL |
|
July 2017 |
|
100% |
|
476 keys |
|
63% |
|
||
|
Hyatt House Downtown Atlanta |
|
|
1 |
|
|
Atlanta, GA |
|
Aug. 2017 |
|
100% |
|
150 keys |
|
63% |
|
||
|
Boston/Worcester Select-Service 3-Pack |
|
|
3 |
|
|
Boston & Worcester, MA |
|
Oct. 2017 |
|
100% |
|
374 keys |
|
59% |
|
||
|
Henderson Select-Service 2-Pack |
|
|
2 |
|
|
Henderson, NV |
|
May 2018 |
|
100% |
|
228 keys |
|
66% |
|
||
|
Orlando Select-Service 2-Pack |
|
|
2 |
|
|
Orlando, FL |
|
May 2018 |
|
100% |
|
254 keys |
|
72% |
|
||
35
|
Segment and Investment |
|
Number of Properties |
|
|
Location |
|
Acquisition Date |
|
Ownership Interest(1) |
|
Sq. Feet (in thousands)/ Units/Keys(2) |
|
Occupancy Rate(3) |
|
|||
|
Corporex Select Service Portfolio |
|
|
5 |
|
|
Various |
|
Aug. 2018 |
|
100% |
|
601 keys |
|
59% |
|
||
|
JW Marriott San Antonio Hill Country Resort |
|
|
1 |
|
|
San Antonio, TX |
|
Aug. 2018 |
|
100% |
|
1,002 keys |
|
50% |
|
||
|
Hampton Inn & Suites Federal Way |
|
|
1 |
|
|
Seattle, WA |
|
Oct. 2018 |
|
100% |
|
142 keys |
|
61% |
|
||
|
Staybridge Suites Reno |
|
|
1 |
|
|
Reno, NV |
|
Nov. 2018 |
|
100% |
|
94 keys |
|
70% |
|
||
|
Salt Lake City Select Service 3 Pack |
|
|
3 |
|
|
Salt Lake City, UT |
|
Nov. 2018 |
|
60% |
|
454 keys |
|
63% |
|
||
|
Courtyard Kona |
|
|
1 |
|
|
Kailua-Kona, HI |
|
March 2019 |
|
100% |
|
452 keys |
|
63% |
|
||
|
Raven Select Service Portfolio |
|
|
21 |
|
|
Various |
|
June 2019 |
|
100% |
|
2,555 keys |
|
N/A |
|
||
|
Urban 2-Pack |
|
|
2 |
|
|
Chicago, IL & Arlington, VA |
|
July 2019 |
|
100% |
|
636 keys |
|
N/A |
|
||
|
Hyatt Regency Atlanta |
|
|
1 |
|
|
Atlanta, GA |
|
Sept. 2019 |
|
100% |
|
1,260 keys |
|
N/A |
|
||
|
RHW Portfolio |
|
|
9 |
|
|
Various |
|
Nov. 2019 |
|
100% |
|
923 keys |
|
N/A |
|
||
|
Total Hotel |
|
|
59 |
|
|
|
|
|
|
|
|
|
9,968 keys |
|
|
|
|
|
|
|
|
|
|
|
|
|
|
|
|
|
|
|
|
|
|
|
|
Retail: |
|
|
|
|
|
|
|
|
|
|
|
|
|
|
|
|
|
|
Bakers Centre |
|
|
1 |
|
|
Philadelphia, PA |
|
March 2017 |
|
100% |
|
237 sq. ft. |
|
99% |
|
||
|
Plaza Del Sol Retail |
|
|
1 |
|
|
Burbank, CA |
|
Oct. 2017 |
|
100% |
|
166 sq. ft. |
|
100% |
|
||
|
Vista Center |
|
|
1 |
|
|
Miami, FL |
|
Aug. 2018 |
|
100% |
|
91 sq. ft. |
|
92% |
|
||
|
El Paseo Simi Valley |
|
|
1 |
|
|
Simi Valley, CA |
|
June 2019 |
|
100% |
|
109 sq. ft. |
|
97% |
|
||
|
Towne Center East |
|
|
1 |
|
|
Signal Hill, CA |
|
Sept. 2019 |
|
100% |
|
163 sq. ft. |
|
100% |
|
||
|
Plaza Pacoima |
|
|
1 |
|
|
Pacoima, CA |
|
Oct. 2019 |
|
100% |
|
204 sq. ft. |
|
100% |
|
||
|
Canarsie Plaza |
|
|
1 |
|
|
Brooklyn, NY |
|
Dec. 2019 |
|
100% |
|
274 sq. ft. |
|
98% |
|
||
|
SoCal Grocery Portfolio |
|
|
6 |
|
|
Various |
|
Jan. 2020 |
|
100% |
|
689 sq. ft. |
|
94% |
|
||
|
Total Retail |
|
|
13 |
|
|
|
|
|
|
|
|
|
1,933 sq. ft. |
|
|
|
|
|
|
|
|
|
|
|
|
|
|
|
|
|
|
|
|
|
|
|
|
Office: |
|
|
|
|
|
|
|
|
|
|
|
|
|
|
|
|
|
|
EmeryTech Office |
|
|
1 |
|
|
Emeryville, CA |
|
Oct. 2019 |
|
100% |
|
228 sq. ft. |
|
95% |
|
||
|
Total Office |
|
|
1 |
|
|
|
|
|
|
|
|
|
228 sq. ft. |
|
|
|
|
|
|
|
|
|
|
|
|
|
|
|
|
|
|
|
|
|
|
|
|
Other: |
|
|
|
|
|
|
|
|
|
|
|
|
|
|
|
|
|
|
East Coast Storage Portfolio |
|
|
21 |
|
|
Various |
|
Aug. 2019 |
|
97% |
|
1,347 sq. ft. |
|
90% |
|
||
|
Phoenix Storage 2-Pack |
|
|
2 |
|
|
Phoenix, AZ |
|
March 2020 |
|
97% |
|
111 sq. ft. |
|
92% |
|
||
|
Total Other |
|
|
23 |
|
|
|
|
|
|
|
|
|
1,458 sq. ft. |
|
|
|
|
|
|
|
|
|
|
|
|
|
|
|
|
|
|
|
|
|
|
|
|
Total Investments in Real Estate |
|
|
1,171 |
|
|
|
|
|
|
|
|
|
|
|
|
|
|
|
(1) |
Certain of the joint venture agreements entered into by the Company provide the seller or the other partner a profits interest based on certain internal rate of return hurdles being achieved. Such investments are consolidated by us and any profits interest due to the other partner is reported within non-controlling interests. The table includes properties owned by an unconsolidated entity. |
|
(2) |
Multifamily includes various forms of rental housing such as apartments, student housing and manufactured housing. Multifamily units include manufactured housing sites and student housing beds. |
|
(3) |
The occupancy rate for our industrial, retail and office investments includes all leased square footage as of June 30, 2020. The occupancy rate for our self-storage and manufactured housing investments includes occupied square footage and occupied units, respectively, as of June 30, 2020. The occupancy rate for our student housing and other multifamily investments is defined as the percentage of actual rent divided by gross potential rent (defined as actual rent for occupied units and market rent for vacant units) for the three months ended June 30, 2020. The occupancy rate for our hotel investments is the average occupancy rate for the 12 months ended June 30, 2020. The occupancy rate for hotels owned less than 12 months is not included. |
Subsequent to June 30, 2020, we acquired an aggregate of $72.0 million of real estate, exclusive of closing costs, across two separate transactions.
Impact of COVID-19 – Impairment Analysis
We review our real estate investments for impairment each quarter or when there is an event or change in circumstances that indicates an impaired value. If the GAAP depreciated cost basis of a real estate investment exceeds the undiscounted cash flows of such real estate investment, the investment is considered impaired and the GAAP depreciated cost basis is reduced to the fair value of the investment. During the three months ended June 30, 2020, we recognized a $6.1 million impairment charge on a GAAP basis at one of our hotel properties. The GAAP impairment charge was a result of updates to the undiscounted cash flow assumptions to account for a decrease in occupancy and future cash flows as a result of the COVID-19 pandemic. The impairment charge aligns the GAAP carrying value of the hotel with the fair value already recorded within the June 30, 2020 Net Asset Value. If the effects of the COVID-19 pandemic cause economic and market conditions to continue to deteriorate or if our expected holding period for assets changes, subsequent tests for impairment could result in additional impairment charges in the future. Certain investments within our portfolio, specifically our hotel assets, are more susceptible to future impairment considerations due to the significant declines in occupancy as a result of extended closures and uncertainty around future cash flows. We can provide no assurance that material impairment charges
36
with respect to our investments in real estate and unconsolidated entities will not occur during the remaining quarters in 2020 or future periods. Accordingly, we will continue to monitor circumstances and events in future periods to determine whether any additional impairment charges are warranted.
Lease Expirations
The following schedule details the expiring leases at our consolidated industrial, net lease, retail, and office properties by annualized base rent and square footage as of June 30, 2020 ($ and square feet data in thousands). The table below excludes our multifamily and self-storage properties as substantially all leases at such properties expire within 12 months:
|
Year |
|
Number of Expiring Leases |
|
Annualized Base Rent(1) |
|
% of Total Annualized Base Rent Expiring |
|
Square Feet |
|
% of Total Square Feet Expiring |
|
|||
|
2020 (remaining) |
|
|
216 |
|
$ |
38,615 |
|
4% |
|
|
6,131 |
|
5% |
|
|
2021 |
|
|
485 |
|
|
114,024 |
|
11% |
|
|
20,913 |
|
15% |
|
|
2022 |
|
|
525 |
|
|
122,804 |
|
12% |
|
|
21,107 |
|
16% |
|
|
2023 |
|
|
429 |
|
|
135,691 |
|
13% |
|
|
22,277 |
|
16% |
|
|
2024 |
|
|
350 |
|
|
81,823 |
|
8% |
|
|
13,513 |
|
10% |
|
|
2025 |
|
|
232 |
|
|
61,167 |
|
6% |
|
|
9,933 |
|
7% |
|
|
2026 |
|
|
100 |
|
|
68,276 |
|
7% |
|
|
14,099 |
|
10% |
|
|
2027 |
|
|
84 |
|
|
51,433 |
|
5% |
|
|
7,861 |
|
6% |
|
|
2028 |
|
|
62 |
|
|
32,710 |
|
3% |
|
|
4,032 |
|
3% |
|
|
2029 |
|
|
51 |
|
|
31,316 |
|
3% |
|
|
4,027 |
|
3% |
|
|
Thereafter |
|
|
62 |
|
|
291,246 |
|
28% |
|
|
12,084 |
|
9% |
|
|
Total |
|
|
2,596 |
|
$ |
1,029,105 |
|
100% |
|
|
135,977 |
|
100% |
|
|
(1) |
Annualized base rent is determined from the annualized June 30, 2020 base rent per leased square foot of the applicable year and excludes tenant recoveries, straight-line rent and above-market and below-market lease amortization. |
Investments in Real Estate Debt
The following charts further describe the diversification of our investments in real estate debt by credit rating and collateral type based on fair value as of June 30, 2020:
|
|
|
|
|
|
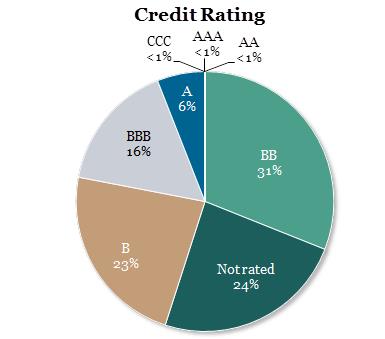
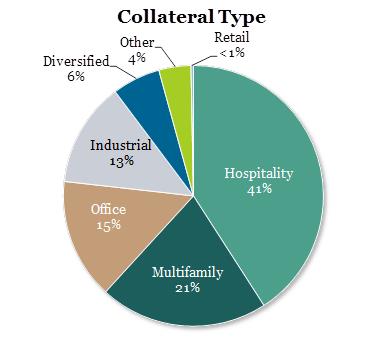
37
Subsequent to June 30, 2020, we purchased an aggregate of $167.2 million of real estate debt.
As of June 30, 2020, our investments in real estate debt consisted of 184 investments in CMBS, 13 corporate bond investments, 10 loans, and 10 investments in RMBS. The following table details our investments in real estate debt as of June 30, 2020 ($ in thousands):
|
|
|
June 30, 2020 |
|
||||||||||||||||
|
Type of Security/Loan |
|
Number of Positions |
|
Weighted Average Coupon(1) |
|
|
Weighted Average Maturity Date(2) |
|
Face Amount/ Notional(3) |
|
|
Cost Basis |
|
Fair Value |
|
||||
|
CMBS - floating |
|
|
125 |
|
L+2.7% |
|
|
2/5/2025 |
|
$ |
3,130,665 |
|
|
$ |
3,121,193 |
|
$ |
2,723,768 |
|
|
CMBS - fixed |
|
|
50 |
|
4.1% |
|
|
8/19/2027 |
|
|
912,705 |
|
|
|
889,144 |
|
|
795,728 |
|
|
Corporate bonds |
|
|
13 |
|
5.1% |
|
|
1/2/2027 |
|
|
252,492 |
|
|
|
251,713 |
|
|
237,723 |
|
|
CMBS - zero coupon |
|
|
4 |
|
N/A |
|
|
1/30/2027 |
|
|
236,090 |
|
|
|
132,318 |
|
|
138,741 |
|
|
RMBS - fixed |
|
|
10 |
|
4.4% |
|
|
12/6/2031 |
|
|
26,141 |
|
|
|
26,315 |
|
|
24,084 |
|
|
CMBS - interest only |
|
|
5 |
|
2.3% |
|
|
10/1/2026 |
|
|
2,259,760 |
|
|
|
21,691 |
|
|
21,680 |
|
|
Total real estate securities |
|
|
207 |
|
3.1% |
|
|
11/5/2025 |
|
N/M |
|
|
|
4,442,374 |
|
|
3,941,724 |
|
|
|
Term loans |
|
|
9 |
|
L+3.0% |
|
|
3/11/2022 |
|
|
604,158 |
|
|
|
591,497 |
|
|
591,264 |
|
|
Mezzanine loans |
|
|
1 |
|
L+6.9% |
|
|
12/15/2024 |
|
|
134,750 |
|
|
|
134,251 |
|
|
116,384 |
|
|
Total real estate loans |
|
|
10 |
|
L+3.7% |
|
|
8/24/2022 |
|
|
738,908 |
|
|
|
725,748 |
|
|
707,648 |
|
|
Total investments in real estate debt |
|
|
217 |
|
3.2% |
|
|
5/11/2025 |
|
N/M |
|
|
$ |
5,168,122 |
|
$ |
4,649,372 |
|
|
|
(1) |
The term “L” refers to the relevant floating benchmark rates, which include USD LIBOR, GBP LIBOR and EURIBOR, as applicable to each security and loan. |
|
(2) |
Weighted average maturity date is based on the fully extended maturity date of the instrument or, in the case of CMBS and RMBS, the underlying collateral. |
|
(3) |
Represents notional amount for CMBS interest only positions. |
Affiliate Service Providers
For details regarding our affiliate service providers, see Note 12 to our condensed consolidated financial statements included herein and Note 11 to the consolidated finance statements included in our Annual Report on form 10-K for the year ended December 31, 2019.
38
The following table sets forth information regarding our consolidated results of operations ($ in thousands):
|
|
|
Three Months Ended June 30, |
|
|
2020 vs. 2019 |
|
|
Six Months Ended June 30, |
|
|
2020 vs. 2019 |
|
||||||||||||
|
|
|
2020 |
|
|
2019 |
|
|
$ |
|
|
2020 |
|
|
2019 |
|
|
$ |
|
||||||
|
Revenues |
|
|
|
|
|
|
|
|
|
|
|
|
|
|
|
|
|
|
|
|
|
|
|
|
|
Rental revenue |
|
$ |
553,717 |
|
|
$ |
247,672 |
|
|
$ |
306,045 |
|
|
$ |
1,085,812 |
|
|
$ |
459,869 |
|
|
$ |
625,943 |
|
|
Hotel revenue |
|
|
21,781 |
|
|
|
94,351 |
|
|
|
(72,570 |
) |
|
|
149,253 |
|
|
|
169,617 |
|
|
|
(20,364 |
) |
|
Other revenue |
|
|
17,249 |
|
|
|
12,285 |
|
|
|
4,964 |
|
|
|
32,564 |
|
|
|
21,913 |
|
|
|
10,651 |
|
|
Total revenues |
|
|
592,747 |
|
|
|
354,308 |
|
|
|
238,439 |
|
|
|
1,267,629 |
|
|
|
651,399 |
|
|
|
616,230 |
|
|
Expenses |
|
|
|
|
|
|
|
|
|
|
|
|
|
|
|
|
|
|
|
|
|
|
|
|
|
Rental property operating |
|
|
187,035 |
|
|
|
101,211 |
|
|
|
85,824 |
|
|
|
355,423 |
|
|
|
189,022 |
|
|
|
166,401 |
|
|
Hotel operating |
|
|
44,523 |
|
|
|
63,197 |
|
|
|
(18,674 |
) |
|
|
143,829 |
|
|
|
114,517 |
|
|
|
29,312 |
|
|
General and administrative |
|
|
6,913 |
|
|
|
4,878 |
|
|
|
2,035 |
|
|
|
13,595 |
|
|
|
8,059 |
|
|
|
5,536 |
|
|
Management fee |
|
|
53,423 |
|
|
|
22,487 |
|
|
|
30,936 |
|
|
|
102,925 |
|
|
|
39,664 |
|
|
|
63,261 |
|
|
Performance participation allocation |
|
|
— |
|
|
|
29,898 |
|
|
|
(29,898 |
) |
|
|
— |
|
|
|
50,061 |
|
|
|
(50,061 |
) |
|
Impairment of investments in real estate |
|
|
6,126 |
|
|
|
— |
|
|
|
6,126 |
|
|
|
6,126 |
|
|
|
— |
|
|
|
6,126 |
|
|
Depreciation and amortization |
|
|
347,352 |
|
|
|
161,854 |
|
|
|
185,498 |
|
|
|
676,157 |
|
|
|
301,333 |
|
|
|
374,824 |
|
|
Total expenses |
|
|
645,372 |
|
|
|
383,525 |
|
|
|
261,847 |
|
|
|
1,298,055 |
|
|
|
702,656 |
|
|
|
595,399 |
|
|
Other income (expense) |
|
|
|
|
|
|
|
|
|
|
|
|
|
|
|
|
|
|
|
|
|
|
|
|
|
Income from unconsolidated entities |
|
|
25,336 |
|
|
|
— |
|
|
|
25,336 |
|
|
|
38,605 |
|
|
|
— |
|
|
|
38,605 |
|
|
Income (loss) from investments in real estate debt |
|
|
492,889 |
|
|
|
51,784 |
|
|
|
441,105 |
|
|
|
(523,258 |
) |
|
|
113,467 |
|
|
|
(636,725 |
) |
|
Net gains on dispositions of real estate |
|
|
— |
|
|
|
29,686 |
|
|
|
(29,686 |
) |
|
|
371 |
|
|
|
29,686 |
|
|
|
(29,315 |
) |
|
Interest income |
|
|
233 |
|
|
|
303 |
|
|
|
(70 |
) |
|
|
1,980 |
|
|
|
497 |
|
|
|
1,483 |
|
|
Interest expense |
|
|
(176,579 |
) |
|
|
(103,279 |
) |
|
|
(73,300 |
) |
|
|
(365,083 |
) |
|
|
(194,866 |
) |
|
|
(170,217 |
) |
|
Loss on extinguishment of debt |
|
|
— |
|
|
|
— |
|
|
|
— |
|
|
|
(1,237 |
) |
|
|
— |
|
|
|
(1,237 |
) |
|
Other income (expense) |
|
|
29,078 |
|
|
|
(2,061 |
) |
|
|
31,139 |
|
|
|
(19,770 |
) |
|
|
(407 |
) |
|
|
(19,363 |
) |
|
Total other income (expense) |
|
|
370,957 |
|
|
|
(23,567 |
) |
|
|
394,524 |
|
|
|
(868,392 |
) |
|
|
(51,623 |
) |
|
|
(816,769 |
) |
|
Net income (loss) |
|
$ |
318,332 |
|
|
$ |
(52,784 |
) |
|
$ |
371,116 |
|
|
$ |
(898,818 |
) |
|
$ |
(102,880 |
) |
|
$ |
(795,938 |
) |
|
Net loss attributable to non-controlling interests in third party joint ventures |
|
$ |
966 |
|
|
$ |
970 |
|
|
$ |
(4 |
) |
|
$ |
1,203 |
|
|
$ |
3,006 |
|
|
$ |
(1,803 |
) |
|
Net (income) loss attributable to non-controlling interests in BREIT OP |
|
|
(4,859 |
) |
|
|
1,110 |
|
|
|
(5,969 |
) |
|
|
11,967 |
|
|
|
2,324 |
|
|
|
9,643 |
|
|
Net income (loss) attributable to BREIT stockholders |
|
$ |
314,439 |
|
|
$ |
(50,704 |
) |
|
$ |
365,143 |
|
|
$ |
(885,648 |
) |
|
$ |
(97,550 |
) |
|
$ |
(788,098 |
) |
|
Net income (loss) per share of common stock — basic and diluted |
|
$ |
0.20 |
|
|
$ |
(0.08 |
) |
|
$ |
0.28 |
|
|
$ |
(0.59 |
) |
|
$ |
(0.17 |
) |
|
$ |
(0.42 |
) |
Revenues, Rental Property Operating and Hotel Operating Expenses
Due to the significant amount of acquisitions of real estate and investments in real estate debt we have made since June 30, 2019, our revenues and operating expenses for the three and six months ended June 30, 2020 and 2019 are not comparable. Additionally, as discussed in the recent developments section, our portfolio has been impacted by COVID-19. See below for a discussion of the properties in our portfolio that were owned for both the full three and six months ended June 30, 2020 and 2019.
General and Administrative Expenses
During the three and six months ended June 30, 2020, general and administrative expenses increased $2.0 million and $5.5 million, respectively, compared to the corresponding periods in 2019. The increase is primarily due to various corporate level expenses related to the increased size of our portfolio.
Management Fee
During the three and six months ended June 30, 2020, the management fee increased $30.9 million and $63.3 million, respectively, compared to the corresponding periods in 2019. The increase was primarily due to the $9.5 billion growth of our NAV from June 30, 2019 to June 30, 2020.
39
Performance Participation Allocation
During the three and six months ended June 30, 2020, the unrealized performance participation allocation was zero due to the performance hurdle not being achieved. For the three and six months ended June 30, 2019 the performance participation allocation accrual was $29.9 million and $50.1 million, respectively.
Impairment of Real Estate
During the three and six months ended June 30, 2020, the Company recognized a $6.1 million impairment charge on one of its hotel properties. We did not recognize any impairment during the corresponding periods in 2019. For additional information see “—Portfolio – Impact of COVID-19 – Impairment Analysis” above.
Depreciation and Amortization
During the three and six months ended June 30, 2020, depreciation and amortization increased $185.5 million and $374.8 million, respectively, compared to the corresponding periods in 2019. The increase was driven by the growth in our portfolio, which increased from 652 properties as of June 30, 2019 to 1,171 properties as of June 30, 2020.
Income from Unconsolidated Entities
During the three and six months ended June 30, 2020, we recorded $25.3 million and $38.6 million, respectively, of income from unconsolidated entities related to our unconsolidated interest in the MGM Grand and Mandalay Bay joint venture. We did not have any unconsolidated investments during the corresponding periods in 2019.
Income (Loss) from Investments in Real Estate Debt
During the three months ended June 30, 2020, income from our investments in real estate debt increased $441.1 million compared to the corresponding period in 2019. The increase was primarily attributable to $466.4 million of unrealized gains during the three months ended June 30, 2020 compared to $20.8 million of unrealized gains during the corresponding period in 2019. During the six months ended June 30, 2020, income from our investments in real estate debt decreased $636.7 million compared to the corresponding period in 2019. This decrease is primarily attributable to $548.7 million of unrealized losses during the six months ended June 30, 2020 compared to $51.8 million of unrealized gains during the corresponding period in 2019. Although we saw a partial recovery in pricing across securities in the second quarter of 2020, the COVID-19 pandemic caused significant market pricing and liquidity dislocation in March 2020, causing a broad-based market decline impacting the unrealized value of certain of our investments in real estate debt.
Net Gains on Dispositions of Real Estate
During the three and six months ended June 30, 2020, net gains on dispositions of real estate decreased $29.7 million and $29.3 million, respectively, as compared to the corresponding periods in 2019. During the three months ended June 30, 2019, we recorded $29.7 million of a gain from the disposition of real estate related to the sale of the parking garage attached to the Hyatt Place San Jose Downtown property. During the three months ended March 31, 2020, we recorded $0.4 million of a gain from the disposition of an industrial property from the HS Industrial Portfolio.
Interest Expense
During the three and six months ended June 30, 2020, interest expense increased $73.3 million and $170.2 million, respectively, compared to the corresponding periods in 2019. The increase was primarily due to the growth in our real estate portfolio and investments in real estate debt and the related indebtedness of such investments.
Other Income (Expense)
During the three months ended June 30, 2020, other income (expense) increased $31.1 million compared to the corresponding period in 2019. The increase was primarily due to $12.7 million of realized gains on our investments in equity securities, $11.9 million of unrealized gains on our investments in equity securities and $5.0 million of dividends earned on our investments in equity securities. During the six months ended June 30, 2020, other income (expense) decreased $19.4 million compared to the corresponding period in 2019. The decrease was primarily due to a $20.8 million forfeited deposit related to a transaction we decided not to pursue and $25.2 million of unrealized losses on our investments in equity securities, partially offset by $12.7 million of realized gains on our investments in equity securities, $8.0 million of income earned from the forfeiture of a deposit on a portfolio of properties whereby the purchase and sale agreement was terminated by the potential buyer, and $8.2 million of dividends earned on our investments in equity securities.
40
Same Property Results of Operations
We evaluate our consolidated results of operations on a same property basis, which allows us to analyze our property operating results excluding acquisitions during the periods under comparison. Properties in our portfolio are considered same property if they were owned for the full periods presented, otherwise they are considered non-same property. Recently developed properties that have not achieved stabilized occupancy (defined as 90% or greater for properties other than hotels) and properties held for sale are excluded from same property results and are considered non-same property. We do not consider our investments in real estate debt segment to be same property.
For the three months ended June 30, 2020 and 2019, our same property portfolio consisted of 323 industrial, 129 multifamily, 26 hotel, and three retail properties. For the six months ended June 30, 2020 and 2019, our same property portfolio consisted of 322 industrial, 100 multifamily, 25 hotel, and three retail properties.
Same property operating results are measured by calculating same property net operating income (“NOI”). Same property NOI is a supplemental non-GAAP disclosure of our operating results that we believe is meaningful as it enables management to evaluate the impact of occupancy, rents, leasing activity, and other controllable property operating results at our real estate. We define same property NOI as operating revenues less operating expenses, which exclude (i) impairment of investments in real estate (ii) depreciation and amortization, (iii) interest expense, and (iv) other non-property related revenue and expense items such as (a) general and administrative expenses, (b) management fee, (c) performance participation allocation, (d) affiliate incentive compensation awards, (e) income from unconsolidated entities, (f) income (loss) from investments in real estate debt, (g) net gains on dispositions of real estate, (h) interest income, (i) loss on extinguishment of debt, and (j) other income (expense).
Our same property NOI may not be comparable to that of other REITs and should not be considered to be more relevant or accurate in evaluating our operating performance than the current GAAP methodology used in calculating net income (loss).
The following table reconciles GAAP net income (loss) attributable to BREIT stockholders to same property NOI for the three and six months ended June 30, 2020 and 2019 ($ in thousands):
|
|
|
|
|
|
|
|
|
|
|
|
|
|
|
|
|
|
|
|
|
|
|
|
Three Months Ended June 30, |
|
2020 vs. 2019 |
|
Six Months Ended June 30, |
|
2020 vs. 2019 |
|
||||||||||
|
|
|
2020 |
|
2019 |
|
$ |
|
2020 |
|
2019 |
|
$ |
|
||||||
|
Net income (loss) attributable to BREIT stockholders |
|
$ |
314,439 |
|
$ |
(50,704 |
) |
$ |
365,143 |
|
$ |
(885,648 |
) |
$ |
(97,550 |
) |
$ |
(788,098 |
) |
|
Adjustments to reconcile to same property NOI |
|
|
|
|
|
|
|
|
|
|
|
|
|
|
|
|
|
|
|
|
General and administrative |
|
|
6,913 |
|
|
4,878 |
|
|
2,035 |
|
|
13,595 |
|
|
8,059 |
|
|
5,536 |
|
|
Management fee |
|
|
53,423 |
|
|
22,487 |
|
|
30,936 |
|
|
102,925 |
|
|
39,664 |
|
|
63,261 |
|
|
Performance participation allocation |
|
|
— |
|
|
29,898 |
|
|
(29,898 |
) |
|
— |
|
|
50,061 |
|
|
(50,061 |
) |
|
Affiliate incentive compensation awards |
|
|
500 |
|
|
500 |
|
|
— |
|
|
1,000 |
|
|
1,000 |
|
|
— |
|
|
Impairment of investments in real estate |
|
|
6,126 |
|
|
— |
|
|
6,126 |
|
|
6,126 |
|
|
— |
|
|
6,126 |
|
|
Depreciation and amortization |
|
|
347,352 |
|
|
161,854 |
|
|
185,498 |
|
|
676,157 |
|
|
301,333 |
|
|
374,824 |
|
|
Income from unconsolidated entities |
|
|
(25,336 |
) |
|
— |
|
|
(25,336 |
) |
|
(38,605 |
) |
|
— |
|
|
(38,605 |
) |
|
(Income) loss from investments in real estate debt |
|
|
(492,889 |
) |
|
(51,784 |
) |
|
(441,105 |
) |
|
523,258 |
|
|
(113,467 |
) |
|
636,725 |
|
|
Net gains on dispositions of real estate |
|
|
— |
|
|
(29,686 |
) |
|
29,686 |
|
|
(371 |
) |
|
(29,686 |
) |
|
29,315 |
|
|
Interest income |
|
|
(233 |
) |
|
(303 |
) |
|
70 |
|
|
(1,980 |
) |
|
(497 |
) |
|
(1,483 |
) |
|
Interest expense |
|
|
176,579 |
|
|
103,279 |
|
|
73,300 |
|
|
365,083 |
|
|
194,866 |
|
|
170,217 |
|
|
Loss on extinguishment of debt |
|
|
— |
|
|
— |
|
|
- |
|
|
1,237 |
|
|
— |
|
|
1,237 |
|
|
Other income (expense) |
|
|
(29,078 |
) |
|
2,061 |
|
|
(31,139 |
) |
|
19,770 |
|
|
407 |
|
|
19,363 |
|
|
Net loss attributable to non-controlling interests in third party joint ventures |
|
(966 |
) |
|
(970 |
) |
|
4 |
|
|
(1,203 |
) |
|
(3,006 |
) |
|
1,803 |
|
|
|
Net income (loss) attributable to non-controlling interests in BREIT OP |
|
|
4,859 |
|
|
(1,110 |
) |
|
5,969 |
|
|
(11,967 |
) |
|
(2,324 |
) |
|
(9,643 |
) |
|
NOI |
|
|
361,689 |
|
|
190,400 |
|
|
171,289 |
|
|
769,377 |
|
|
348,860 |
|
|
420,517 |
|
|
Non-same property NOI |
|
|
229,637 |
|
|
15,124 |
|
|
214,513 |
|
|
496,790 |
|
|
34,751 |
|
|
462,039 |
|
|
Same property NOI |
|
$ |
132,052 |
|
$ |
175,276 |
|
$ |
(43,224 |
) |
$ |
272,587 |
|
$ |
314,109 |
|
$ |
(41,522 |
) |
41
The following table details the components of same property NOI for the three months ended June 30, 2020 and 2019 ($ in thousands):
|
|
|
Three Months Ended June 30, |
|
|
2020 vs. 2019 |
|
||||||||||
|
|
|
2020 |
|
|
2019 |
|
|
$ |
|
|
% |
|
||||
|
Same property NOI |
|
|
|
|
|
|
|
|
|
|
|
|
|
|
|
|
|
Rental revenue |
|
$ |
214,154 |
|
|
$ |
215,365 |
|
|
$ |
(1,211 |
) |
|
(1)% |
|
|
|
Hotel revenue |
|
|
10,182 |
|
|
|
92,197 |
|
|
|
(82,015 |
) |
|
(89)% |
|
|
|
Other revenue |
|
|
9,572 |
|
|
|
11,015 |
|
|
|
(1,443 |
) |
|
(13)% |
|
|
|
Total revenues |
|
|
233,908 |
|
|
|
318,577 |
|
|
|
(84,669 |
) |
|
(27)% |
|
|
|
|
|
|
|
|
|
|
|
|
|
|
|
|
|
|
|
|
|
Rental property operating |
|
|
81,319 |
|
|
|
82,383 |
|
|
|
(1,064 |
) |
|
(1)% |
|
|
|
Hotel operating |
|
|
20,537 |
|
|
|
60,918 |
|
|
|
(40,381 |
) |
|
(66)% |
|
|
|
Total expenses |
|
|
101,856 |
|
|
|
143,301 |
|
|
|
(41,445 |
) |
|
(29)% |
|
|
|
Same property NOI |
|
$ |
132,052 |
|
|
$ |
175,276 |
|
|
$ |
(43,224 |
) |
|
(25)% |
|
|
Same Property – Rental Revenue
Same property rental revenue decreased $1.2 million for the three months ended June 30, 2020 compared to the corresponding period in 2019. The decrease was due to a $8.0 million increase in our bad debt reserve, primarily as a result of COVID-19, partially offset by a $4.6 million increase in base rental revenue and a $2.2 million increase in tenant reimbursement income. Our bad debt reserve represents the amount of rental revenue we anticipate we will not be able to collect from our tenants.
The following table details the changes in base rental revenue period over period ($ in thousands):
|
|
|
|
|
|
|
|
|
2020 vs. 2019 |
|
|||||||
|
|
|
|
|
|
|
|
|
|
|
|
|
|
|
Change in Average |
|
|
|
|
|
|
|
|
|
|
|
|
|
|
|
|
|
Effective Annual |
|
|
|
|
|
Three Months Ended June 30, |
|
Change in Base |
|
Change in |
|
Base Rent Per Leased |
|
|||||||
|
|
|
2020 |
|
2019 |
|
Rental Revenue |
|
Occupancy Rate |
|
Square Foot/Unit(1) |
|
|||||
|
Multifamily |
|
$ |
133,081 |
|
$ |
129,953 |
|
$ |
3,128 |
|
—% |
|
+3% |
|
||
|
Industrial |
|
|
63,598 |
|
|
62,195 |
|
|
1,403 |
|
(1)% |
|
+4% |
|
||
|
Retail |
|
|
2,469 |
|
|
2,391 |
|
|
78 |
|
+2% |
|
+1% |
|
||
|
Total base rental revenue |
|
$ |
199,148 |
|
$ |
194,539 |
|
$ |
4,609 |
|
|
|
|
|
|
|
|
(1) |
The annualized base rent per leased square foot or unit for the three months ended June 30, 2020 and 2019 includes straight-line rent and above-market and below-market lease amortization. |
Same Property – Hotel Revenue
Same property hotel revenue decreased $82.0 million for the three months ended June 30, 2020 compared to the corresponding period in 2019. ADR for the hotels in our same property portfolio decreased from $170 to $100 while occupancy decreased 64% and RevPAR decreased from $142 to $19 during the three months ended June 30, 2020 compared to the corresponding period in 2019. The decrease can be attributed to the closure of our full-service hotel in San Antonio, Texas from March 26, 2020 through June 15, 2020 and significantly reduced occupancy at our select-service hotels as a result of the COVID-19 pandemic.
Same Property – Other Revenue
Same property other revenue decreased $1.4 million for the three months ended June 30, 2020 compared to the corresponding period in 2019. The decrease was primarily due to decreased golf course revenues during the closure of our full-service hotel in San Antonio, Texas from March 26, 2020 through June 15, 2020 as a result of the COVID-19 pandemic.
Same Property – Rental Property Operating Expenses
Same property rental property operating expenses decreased $1.1 million during the three months ended June 30, 2020, compared to the corresponding period in 2019. The decrease in rental property operating expenses for the three months ended June 30, 2020 was primarily the result of a decrease in general operating expenses at our student housing properties due to students leaving campus during the COVID-19 pandemic.
42
Same Property – Hotel Operating Expenses
Same property hotel operating expenses decreased $40.4 million during the three months ended June 30, 2020, compared to the corresponding period in 2019. The decrease in hotel operating expenses was primarily the result of closures of our full-service hotel in San Antonio, Texas from March 26, 2020 through June 15, 2020 and reduced occupancy at our select-service hotels as a result of the COVID-19 pandemic.
The following table details the components of same property NOI for the six months ended June 30, 2020 and 2019 ($ in thousands):
|
|
|
Six Months Ended June 30, |
|
|
2020 vs. 2019 |
|
||||||||||
|
|
|
2020 |
|
|
2019 |
|
|
$ |
|
|
% |
|
||||
|
Same property NOI |
|
|
|
|
|
|
|
|
|
|
|
|
|
|
|
|
|
Rental revenue |
|
$ |
394,653 |
|
|
$ |
390,415 |
|
|
$ |
4,238 |
|
|
1% |
|
|
|
Hotel revenue |
|
|
72,896 |
|
|
|
158,621 |
|
|
|
(85,725 |
) |
|
(54)% |
|
|
|
Other revenue |
|
|
17,077 |
|
|
|
18,840 |
|
|
|
(1,763 |
) |
|
(9)% |
|
|
|
Total revenues |
|
|
484,626 |
|
|
|
567,876 |
|
|
|
(83,250 |
) |
|
(15)% |
|
|
|
|
|
|
|
|
|
|
|
|
|
|
|
|
|
|
|
|
|
Rental property operating |
|
|
144,864 |
|
|
|
148,157 |
|
|
|
(3,293 |
) |
|
(2)% |
|
|
|
Hotel operating |
|
|
67,175 |
|
|
|
105,610 |
|
|
|
(38,435 |
) |
|
(36)% |
|
|
|
Total expenses |
|
|
212,039 |
|
|
|
253,767 |
|
|
|
(41,728 |
) |
|
(16)% |
|
|
|
Same property NOI |
|
$ |
272,587 |
|
|
$ |
314,109 |
|
|
$ |
(41,522 |
) |
|
(13)% |
|
|
Same Property – Rental Revenue
Same property rental revenue increased $4.2 million for the six months ended June 30, 2020 compared to the corresponding period in 2019. The increase was due to a $10.9 million increase in base rental revenue and a $0.6 million increase in tenant reimbursement income partially offset by a $7.3 million increase in bad debt expense, primarily a result of COVID-19.
The following table details the changes in base rental revenue period over period ($ in thousands):
|
|
|
|
|
|
|
|
|
2020 vs. 2019 |
|
|||||||
|
|
|
|
|
|
|
|
|
|
|
|
|
|
|
Change in Average |
|
|
|
|
|
|
|
|
|
|
|
|
|
|
|
|
|
Effective Annual |
|
|
|
|
|
Six Months Ended June 30, |
|
Change in Base |
|
Change in |
|
Base Rent Per Leased |
|
|||||||
|
|
|
2020 |
|
2019 |
|
Rental Revenue |
|
Occupancy Rate |
|
Square Foot/Unit(1) |
|
|||||
|
Multifamily |
|
$ |
227,695 |
|
$ |
219,491 |
|
$ |
8,204 |
|
—% |
|
+3% |
|
||
|
Industrial |
|
|
126,725 |
|
|
124,153 |
|
|
2,572 |
|
(1)% |
|
+4% |
|
||
|
Retail |
|
|
4,953 |
|
|
4,800 |
|
|
153 |
|
+1% |
|
+2% |
|
||
|
Total base rental revenue |
|
$ |
359,373 |
|
$ |
348,444 |
|
$ |
10,929 |
|
|
|
|
|
|
|
|
(1) |
The annualized base rent per leased square foot or unit for the six months ended June 30, 2020 and 2019 includes straight-line rent and above-market and below-market lease amortization. |
Same Property – Hotel Revenue
Same property hotel revenue decreased $85.7 million for the six months ended June 30, 2020 compared to the corresponding period in 2019. ADR for the hotels in our same property portfolio decreased from $172 to $150 while occupancy decreased 38% and RevPAR decreased from $137 to $62 during the six months ended June 30, 2020 compared to the corresponding period in 2019. The decreases can be attributed to the closure of our full-service hotel in San Antonio, Texas from March 26, 2020 through June 15, 2020 and significantly reduced occupancy at our select-service hotels as a result of the COVID-19 pandemic.
Same Property – Other Revenue
Same property other revenue decreased $1.8 million for the six months ended June 30, 2020 compared to the corresponding period in 2019. The decrease in other revenue was due to decreased golf course revenues during the closure of our full-service hotel in San Antonio, Texas from March 26, 2020 through June 15, 2020 as a result of the COVID-19 pandemic.
43
Same Property – Rental Property Operating Expenses
Same property rental property operating expenses decreased $3.3 million during the six months ended June 30, 2020, compared to the corresponding period in 2019. The decrease in rental property operating expenses for the six months ended June 30, 2020 was primarily the result of a decrease in general operating expenses due to students at our student housing properties leaving campus during the COVID-19 pandemic and decreased general operating expenses at our industrial and retail properties.
Same Property – Hotel Operating Expenses
Same property hotel operating expenses decreased $38.4 million during the six months ended June 30, 2020, compared to the corresponding period in 2019. The decrease in hotel operating expenses was primarily the result of closures of our full-service hotel in San Antonio, Texas from March 26, 2020 through June 15, 2020 and reduced occupancy at our select-service hotels as a result of the COVID-19 pandemic.
Non-same Property NOI
Due to our substantial fundraising and continued deployment of the net proceeds raised into new property acquisitions, non-same property NOI is not comparable period over period. We expect the non-same property NOI variance period over period to continue as we raise more proceeds from selling shares of our common stock and invest in additional new property acquisitions. Additionally, as discussed in the recent developments section, our portfolio has been impacted by COVID-19.
Funds from Operations, Adjusted Funds from Operations and Funds Available for Distribution
We believe funds from operations (“FFO”) is a meaningful supplemental non-GAAP operating metric. Our condensed consolidated financial statements are presented under historical cost accounting which, among other things, requires depreciation of real estate investments to be calculated on a straight-line basis. As a result, our operating results imply that the value of our real estate investments will decrease evenly over a set time period. However, we believe that the value of real estate investments will fluctuate over time based on market conditions and as such, depreciation under historical cost accounting may be less informative. FFO is a standard REIT industry metric defined by the National Associational of Real Estate Investment Trusts (“NAREIT”). FFO, as defined by NAREIT and presented below, is calculated as net income or loss (computed in accordance with accounting principles generally accepted in the United States of America (“GAAP”)), excluding (i) gains or losses from sales of depreciable real property, (ii) impairment write-downs on depreciable real property, plus (iii) real estate-related depreciation and amortization, and (iv) similar adjustments for non-controlling interests and unconsolidated entities.
We also believe that adjusted FFO (“AFFO”) is a meaningful non-GAAP supplemental disclosure of our operating results. AFFO further adjusts FFO in order for our operating results to reflect the specific characteristics of our business by adjusting for items we believe are not related to our core operations. Our adjustments to FFO to arrive at AFFO include removing the impact of (i) straight-line rental income and expense, (ii) amortization of above- and below-market lease intangibles, (iii) amortization of mortgage premium/discount, (iv) unrealized (gains) losses on financial instruments, (v) forfeited investment deposits (vi) amortization of restricted stock awards, (vii) non-cash performance participation allocation or other non-cash incentive compensation even if repurchased by us, (viii) gain or loss on involuntary conversion, (ix) realized (gains) losses on extinguishment of debt, and (x) similar adjustments for non-controlling interests and unconsolidated entities.
We also believe funds available for distribution (“FAD”) is an additional meaningful non-GAAP supplemental disclosure that provides useful information for considering our operating results and certain other items relative to the amount of our distributions by removing the impact of certain non-cash items from our operating results. FAD is calculated as AFFO excluding (i) realized gains (losses) on investments in real estate debt and (ii) management fee paid in shares or BREIT OP units even if repurchased by us, and including deductions for (iii) recurring tenant improvements, leasing commissions, and other capital projects, (iv) stockholder servicing fees paid during the period, and (v) similar adjustments for non-controlling interests and unconsolidated entities. FAD is not indicative of cash available to fund our cash needs and does not represent cash flows from operating activities in accordance with GAAP, as it excludes adjustments for working capital items and actual cash receipts from interest income recognized on investments in real estate debt. Cash flows from operating activities in accordance with GAAP would generally be adjusted for such items. Furthermore, FAD is adjusted for stockholder servicing fees and recurring tenant improvements, leasing commissions, and other capital expenditures, which are not considered when determining cash flows from operating activities in accordance with GAAP.
44
The following table presents a reconciliation of FFO, AFFO and FAD to net loss attributable to BREIT stockholders ($ in thousands):
|
|
|
Three Months Ended June 30, |
|
|
Six Months Ended June 30, |
|
||||||||||
|
|
|
2020 |
|
|
2019 |
|
|
2020 |
|
|
2019 |
|
||||
|
Net income (loss) attributable to BREIT stockholders |
|
$ |
314,439 |
|
|
$ |
(50,704 |
) |
|
$ |
(885,648 |
) |
|
$ |
(97,550 |
) |
|
Adjustments to arrive at FFO: |
|
|
|
|
|
|
|
|
|
|
|
|
|
|
|
|
|
Real estate depreciation and amortization |
|
|
357,924 |
|
|
|
161,854 |
|
|
|
692,046 |
|
|
|
301,333 |
|
|
Impairment of investments in real estate |
|
|
6,126 |
|
|
|
— |
|
|
|
6,126 |
|
|
|
— |
|
|
Net gains on dispositions of real estate |
|
|
— |
|
|
|
(29,686 |
) |
|
|
(371 |
) |
|
|
(29,686 |
) |
|
Amount attributable to non-controlling interests for above adjustments |
|
|
(10,746 |
) |
|
|
(5,431 |
) |
|
|
(21,562 |
) |
|
|
(12,629 |
) |
|
FFO attributable to BREIT stockholders |
|
|
667,743 |
|
|
|
76,033 |
|
|
|
(209,409 |
) |
|
|
161,468 |
|
|
Adjustments to arrive at AFFO: |
|
|
|
|
|
|
|
|
|
|
|
|
|
|
|
|
|
Straight-line rental income and expense |
|
|
(41,814 |
) |
|
|
(1,537 |
) |
|
|
(76,988 |
) |
|
|
(3,728 |
) |
|
Amortization of above- and below-market lease intangibles |
|
|
(4,386 |
) |
|
|
(2,007 |
) |
|
|
(8,104 |
) |
|
|
(3,722 |
) |
|
Amortization of mortgage premium/discount |
|
|
(342 |
) |
|
|
15 |
|
|
|
(572 |
) |
|
|
(3 |
) |
|
Unrealized (gains) losses on financial instruments |
|
(455,939 |
) |
|
|
(15,489 |
) |
|
|
648,455 |
|
|
|
(45,492 |
) |
|
|
Net forfeited investment deposits |
|
|
— |
|
|
|
— |
|
|
|
12,750 |
|
|
|
— |
|
|
Amortization of restricted stock awards |
|
|
100 |
|
|
|
100 |
|
|
|
200 |
|
|
|
200 |
|
|
Non-cash performance participation allocation |
|
|
— |
|
|
|
29,898 |
|
|
|
— |
|
|
|
50,061 |
|
|
Non-cash incentive compensation awards to affiliated service providers |
|
|
500 |
|
|
|
500 |
|
|
|
1,000 |
|
|
|
1,000 |
|
|
Gain on involuntary conversion |
|
|
(180 |
) |
|
|
(75 |
) |
|
|
(180 |
) |
|
|
(1,389 |
) |
|
Loss on extinguishment of debt |
|
|
— |
|
|
|
— |
|
|
|
1,237 |
|
|
|
— |
|
|
Amount attributable to non-controlling interests for above adjustments |
|
|
8,397 |
|
|
|
(265 |
) |
|
|
(5,028 |
) |
|
|
84 |
|
|
AFFO attributable to BREIT stockholders |
|
|
174,079 |
|
|
|
87,173 |
|
|
|
363,361 |
|
|
|
158,479 |
|
|
Adjustments to arrive at FAD: |
|
|
|
|
|
|
|
|
|
|
|
|
|
|
|
|
|
Management fee paid in shares |
|
|
53,423 |
|
|
|
22,487 |
|
|
|
102,925 |
|
|
|
39,664 |
|
|
Recurring tenant improvements, leasing commissions and other capital expenditures (1) |
|
|
(30,132 |
) |
|
|
(11,587 |
) |
|
|
(53,749 |
) |
|
|
(20,835 |
) |
|
Stockholder servicing fees |
|
|
(15,644 |
) |
|
|
(9,449 |
) |
|
|
(31,068 |
) |
|
|
(17,207 |
) |
|
Realized (gains) losses on financial instruments |
|
|
(13,342 |
) |
|
|
40 |
|
|
|
(11,977 |
) |
|
|
25 |
|
|
Amount attributable to non-controlling interests for above adjustments |
|
|
(85 |
) |
|
|
(226 |
) |
|
|
(518 |
) |
|
|
(437 |
) |
|
FAD attributable to BREIT stockholders |
|
$ |
168,299 |
|
|
$ |
88,438 |
|
|
$ |
368,974 |
|
|
$ |
159,689 |
|
|
(1) |
Recurring tenant improvements and leasing commissions are generally related to second-generation leases and other capital expenditures required to maintain our investments. Other capital expenditures exclude underwritten tenant improvements, leasing commissions and capital expenditures in conjunction with acquisitions and projects that we believe will enhance the value of our investments. |
FFO, AFFO, and FAD should not be considered to be more relevant or accurate than the GAAP methodology in calculating net income (loss) or in evaluating our operating performance. In addition, FFO, AFFO, and FAD should not be considered as alternatives to net income (loss) as indications of our performance or as alternatives to cash flows from operating activities as indications of our liquidity, but rather should be reviewed in conjunction with these and other GAAP measurements. Further, FFO, AFFO, and FAD are not intended to be used as liquidity measures indicative of cash flow available to fund our cash needs, including our ability to make distributions to our stockholders.
Impact of COVID-19 on Our NAV
For the quarter ending June 30, 2020, BREIT’s Class S NAV per share increased $0.28, from $10.46 as of March 31, 2020 to $10.74 as of June 30, 2020. BREIT’s Class I NAV per share increased from $10.44 to $10.71, BREIT’s Class D NAV per share increased from $10.31 to $10.60 and BREIT’s Class T NAV per share increased from $10.27 to $10.56. This price movement was driven by (i) increases in the valuation of our industrial, multifamily and hospitality properties, (ii) mark-to-market increases in our real estate debt portfolio as pricing across securities, including CMBS, partially recovered from significant declines in March and (iii) execution of a binding agreement to opportunistically sell a select service hotel at a significant mark up to our cost basis and prior carrying value.
For more information on our Net Asset Value Calculation and Valuation Guidelines please refer to our prospectus. Please also refer to Item 1A Risk Factors in our Annual Report on Form 10-K for the year ended December 31, 2019 and our prospectus dated April 21, 2020 and filed with the SEC, as supplemented for additional disclosure relating to material trends or uncertainties that may impact our business.
45
The purchase price per share for each class of our common stock will generally equal our prior month’s NAV per share, as determined monthly, plus applicable selling commissions and dealer manager fees. Our NAV for each class of shares is based on the net asset values of our investments (including investments in real estate debt), the addition of any other assets (such as cash on hand) and the deduction of any liabilities, including the allocation/accrual of any performance participation, and any stockholder servicing fees applicable to such class of shares.
Our total NAV presented in the following tables includes the NAV of our Class S, Class T, Class D, and Class I common stockholders, as well as partnership interests of BREIT OP held by parties other than us. The following table provides a breakdown of the major components of our total NAV as of June 30, 2020 ($ and shares/units in thousands):
|
Components of NAV |
|
June 30, 2020 |
|
|
|
Investments in real estate |
|
$ |
31,936,085 |
|
|
Investments in real estate debt |
|
|
4,649,372 |
|
|
Investments in unconsolidated entities |
|
|
855,480 |
|
|
Cash and cash equivalents |
|
|
240,801 |
|
|
Restricted cash |
|
|
459,819 |
|
|
Other assets |
|
|
559,163 |
|
|
Mortgage notes, term loans, and revolving credit facilities, net |
|
|
(17,859,991 |
) |
|
Secured financings on investments in real estate debt |
|
|
(2,369,685 |
) |
|
Subscriptions received in advance |
|
|
(175,886 |
) |
|
Other liabilities |
|
|
(658,402 |
) |
|
Accrued performance participation allocation |
|
|
— |
|
|
Management fee payable |
|
|
(18,207 |
) |
|
Accrued stockholder servicing fees (1) |
|
|
(5,320 |
) |
|
Non-controlling interests in joint ventures |
|
|
(237,776 |
) |
|
Net Asset Value |
|
$ |
17,375,453 |
|
|
Number of outstanding shares/units |
|
|
1,622,011 |
|
|
(1) |
Stockholder servicing fees only apply to Class S, Class T, and Class D shares. See Reconciliation of Stockholders’ Equity to NAV below for an explanation of the difference between the $5.3 million accrued for purposes of our NAV and the $552.8 million accrued under U.S. GAAP. |
The following table provides a breakdown of our total NAV and NAV per share by share class as of June 30, 2020 ($ and shares in thousands, except per share data):
|
NAV Per Share |
|
Class S Shares |
|
Class I Shares |
|
Class T Shares |
|
Class D Shares |
|
Third-party Operating Partnership Units (1) |
|
Total |
|
||||||
|
Monthly NAV |
|
$ |
6,792,362 |
|
$ |
8,790,866 |
|
$ |
463,994 |
|
$ |
1,093,994 |
|
$ |
234,237 |
|
$ |
17,375,453 |
|
|
Number of outstanding shares/units |
|
|
632,208 |
|
|
820,813 |
|
|
43,957 |
|
|
103,162 |
|
|
21,871 |
|
|
1,622,011 |
|
|
NAV Per Share/Unit as of June 30, 2020 |
|
$ |
10.7439 |
|
$ |
10.7100 |
|
$ |
10.5557 |
|
$ |
10.6047 |
|
$ |
10.7100 |
|
|
|
|
|
(1) |
Includes the partnership interests of BREIT OP held by the Special Limited Partner, Class B unitholders, and other BREIT OP interests held by parties other than the Company. |
Set forth below are the weighted averages of the key assumptions in the discounted cash flow methodology used in the June 30, 2020 valuations, based on property types. Once we own more than one office property we will include the key assumptions for such property type.
|
Property Type |
|
Discount Rate |
|
Exit Capitalization Rate |
|
|
Multifamily |
|
7.5% |
|
5.2% |
|
|
Industrial |
|
7.2% |
|
5.7% |
|
|
Net Lease |
|
7.6% |
|
6.7% |
|
|
Hotel |
|
9.2% |
|
9.4% |
|
|
Retail |
|
7.7% |
|
6.1% |
|
|
Other |
|
7.3% |
|
6.8% |
|
46
These assumptions are determined by the Adviser and reviewed by our independent valuation advisor. A change in these assumptions would impact the calculation of the value of our property investments. For example, assuming all other factors remain unchanged, the changes listed below would result in the following effects on our investment values:
|
Input |
|
Hypothetical Change |
Multifamily Investment Values |
|
Industrial Investment Values |
|
Net Lease Investment Values |
|
Hotel Investment Values |
|
Retail Investment Values |
|
Other Investment Values |
|
|
Discount Rate |
|
0.25% decrease |
+1.9% |
|
+1.7% |
|
+1.8% |
|
+1.9% |
|
+1.8% |
|
+1.8% |
|
|
(weighted average) |
|
0.25% increase |
(1.8%) |
|
(2.1%) |
|
(1.7%) |
|
(1.9%) |
|
(1.8%) |
|
(1.7%) |
|
|
Exit Capitalization Rate |
|
0.25% decrease |
+3.0% |
|
+2.7% |
|
+2.1% |
|
+1.6% |
|
+2.6% |
|
+2.1% |
|
|
(weighted average) |
|
0.25% increase |
(2.8%) |
|
(3.0%) |
|
(1.9%) |
|
(1.5%) |
|
(2.4%) |
|
(1.9%) |
|
The following table reconciles stockholders’ equity and BREIT OP partners’ capital per our condensed consolidated balance sheet to our NAV ($ in thousands):
|
|
June 30, 2020 |
|
|
|
Stockholders’ equity |
$ |
14,218,061 |
|
|
Non-controlling interests attributable to BREIT OP |
|
191,993 |
|
|
Redeemable non-controlling interest |
|
255 |
|
|
Total partners' capital of BREIT OP under U.S. GAAP |
|
14,410,309 |
|
|
Adjustments: |
|
|
|
|
Accrued stockholder servicing fee |
|
552,812 |
|
|
Organization and offering costs |
|
5,113 |
|
|
Unrealized net real estate and debt appreciation |
|
423,439 |
|
|
Accumulated depreciation and amortization |
|
1,983,780 |
|
|
NAV |
$ |
17,375,453 |
|
The following details the adjustments to reconcile GAAP stockholders’ equity and total partners’ capital of BREIT OP to our NAV:
|
|
- |
Accrued stockholder servicing fee represents the accrual for the full cost of the stockholder servicing fee for Class S, Class T, and Class D shares. Under GAAP, we accrued the full cost of the stockholder servicing fee payable over the life of each share (assuming such share remains outstanding the length of time required to pay the maximum stockholder servicing fee) as an offering cost at the time we sold the Class S, Class T, and Class D shares. Refer to Note 2 to the consolidated financial statements in our Annual Report on Form 10-K for the year ended December 31, 2019 for further details of the GAAP treatment regarding the stockholder servicing fee. For purposes of NAV we recognize the stockholder servicing fee as a reduction of NAV on a monthly basis when such fee is paid. |
|
|
- |
The Adviser agreed to advance certain organization and offering costs on our behalf through December 31, 2017. Such costs are being reimbursed to the Adviser pro-rata basis over 60 months beginning January 1, 2018. Under GAAP, organization costs are expensed as incurred and offering costs are charged to equity as such amounts are incurred. For NAV, such costs will be recognized as a reduction to NAV as they are reimbursed ratably over 60 months. |
|
|
- |
Under GAAP, the affiliate incentive compensation awards are valued as of grant date and compensation expense is recognized over the service period on a straight-line basis with an offset to equity resulting in no impact to Stockholders’ Equity. For purposes of NAV, we value the awards based on the performance of the applicable period and deduct such value from NAV. |
|
|
- |
Our investments in real estate are presented under historical cost in our GAAP consolidated financial statements. Additionally, our mortgage notes, term loans, secured and unsecured revolving credit facilities, and repurchase agreements (“Debt”) are presented at their carrying value in our consolidated GAAP financial statements. As such, any increases or decreases in the fair market value of our investments in real estate or our Debt are not included in our GAAP results. For purposes of determining our NAV, our investments in real estate and our Debt are recorded at fair value. |
|
|
- |
In addition, we depreciate our investments in real estate and amortize certain other assets and liabilities in accordance with GAAP. Such depreciation and amortization is not recorded for purposes of determining our NAV. |
47
Beginning March 31, 2017, we declared monthly distributions for each class of our common stock which are generally paid 20 days after month-end. We have paid distributions consecutively each month since such time. Each class of our common stock received the same gross distribution per share, which was $0.3169 per share for the six months ended June 30, 2020. The net distribution varies for each class based on the applicable stockholder servicing fee, which is deducted from the monthly distribution per share and paid directly to the applicable distributor. The table below details the net distribution for each of our share classes for the six months ended June 30, 2020:
|
|
|
Class S Shares |
|
|
Class I Shares |
|
|
Class T Shares |
|
|
Class D Shares |
|
||||
|
January 31, 2020 |
|
$ |
0.0451 |
|
|
$ |
0.0534 |
|
|
$ |
0.0452 |
|
|
$ |
0.0510 |
|
|
February 28, 2020 |
|
|
0.0451 |
|
|
|
0.0529 |
|
|
|
0.0452 |
|
|
|
0.0506 |
|
|
March 31, 2020 |
|
|
0.0451 |
|
|
|
0.0529 |
|
|
|
0.0452 |
|
|
|
0.0506 |
|
|
April 30, 2020 |
|
|
0.0451 |
|
|
|
0.0524 |
|
|
|
0.0452 |
|
|
|
0.0503 |
|
|
May 31, 2020 |
|
|
0.0451 |
|
|
|
0.0527 |
|
|
|
0.0452 |
|
|
|
0.0505 |
|
|
June 30, 2020 |
|
|
0.0451 |
|
|
|
0.0526 |
|
|
|
0.0452 |
|
|
|
0.0504 |
|
|
Total |
|
$ |
0.2706 |
|
|
$ |
0.3169 |
|
|
$ |
0.2712 |
|
|
$ |
0.3034 |
|
The following tables summarize our distributions declared during the three and six months ended June 30, 2020 and 2019 ($ in thousands):
|
|
|
Three Months Ended June 30, 2020 |
|
|
Three Months Ended June 30, 2019 |
|
||||||||||
|
|
|
Amount |
|
|
Percentage |
|
|
Amount |
|
|
Percentage |
|
||||
|
Distributions |
|
|
|
|
|
|
|
|
|
|
|
|
|
|
|
|
|
Payable in cash |
|
$ |
109,258 |
|
|
|
47 |
% |
|
$ |
33,812 |
|
|
|
37 |
% |
|
Reinvested in shares |
|
|
125,124 |
|
|
|
53 |
% |
|
|
57,059 |
|
|
|
63 |
% |
|
Total distributions |
|
$ |
234,382 |
|
|
|
100 |
% |
|
$ |
90,871 |
|
|
|
100 |
% |
|
Sources of Distributions |
|
|
|
|
|
|
|
|
|
|
|
|
|
|
|
|
|
Cash flows from operating activities |
|
$ |
234,382 |
|
|
|
100 |
% |
|
$ |
90,871 |
|
|
|
100 |
% |
|
Offering proceeds |
|
|
— |
|
|
|
— |
% |
|
|
— |
|
|
|
— |
% |
|
Total sources of distributions |
|
$ |
234,382 |
|
|
|
100 |
% |
|
$ |
90,871 |
|
|
|
100 |
% |
|
|
|
|
|
|
|
|
|
|
|
|
|
|
|
|
|
|
|
Cash flows from operating activities |
|
$ |
275,756 |
|
|
|
|
|
|
$ |
120,433 |
|
|
|
|
|
|
Funds from Operations |
|
$ |
667,743 |
|
|
|
|
|
|
$ |
76,033 |
|
|
|
|
|
|
Adjusted Funds from Operations |
|
$ |
174,079 |
|
|
|
|
|
|
$ |
87,173 |
|
|
|
|
|
|
Funds Available for Distribution |
|
$ |
168,299 |
|
|
|
|
|
|
$ |
88,438 |
|
|
|
|
|
|
|
|
|
|
|
|
|
|
|
|
|
|
|
|
|
|
|
|
|
|
|
|
|
|
|
|
|
|
|
|
|
|
|
|
|
|
|
|
Six Months Ended June 30, 2020 |
|
|
Six Months Ended June 30, 2019 |
|
||||||||||
|
|
|
Amount |
|
|
Percentage |
|
|
Amount |
|
|
Percentage |
|
||||
|
Distributions |
|
|
|
|
|
|
|
|
|
|
|
|
|
|
|
|
|
Payable in cash |
|
$ |
203,198 |
|
|
|
46 |
% |
|
$ |
58,780 |
|
|
|
37 |
% |
|
Reinvested in shares |
|
|
238,258 |
|
|
|
54 |
% |
|
|
101,633 |
|
|
|
63 |
% |
|
Total distributions |
|
$ |
441,456 |
|
|
|
100 |
% |
|
$ |
160,413 |
|
|
|
100 |
% |
|
Sources of Distributions |
|
|
|
|
|
|
|
|
|
|
|
|
|
|
|
|
|
Cash flows from operating activities |
|
$ |
441,456 |
|
|
|
100 |
% |
|
$ |
160,413 |
|
|
|
100 |
% |
|
Offering proceeds |
|
|
— |
|
|
|
— |
% |
|
|
— |
|
|
|
— |
% |
|
Total sources of distributions |
|
$ |
441,456 |
|
|
|
100 |
% |
|
$ |
160,413 |
|
|
|
100 |
% |
|
|
|
|
|
|
|
|
|
|
|
|
|
|
|
|
|
|
|
Cash flows from operating activities |
|
$ |
484,795 |
|
|
|
|
|
|
$ |
193,469 |
|
|
|
|
|
|
Funds from Operations |
|
$ |
(209,409 |
) |
|
|
|
|
|
$ |
161,468 |
|
|
|
|
|
|
Adjusted Funds from Operations |
|
$ |
363,361 |
|
|
|
|
|
|
$ |
158,479 |
|
|
|
|
|
|
Funds Available for Distribution |
|
$ |
368,974 |
|
|
|
|
|
|
$ |
159,689 |
|
|
|
|
|
48
Through June 30, 2020, our distributions have been funded entirely from cash flows from operations.
Liquidity and Capital Resources
The global outbreak of COVID-19 continues to adversely impact global commercial activity and has contributed to significant volatility in financial markets. While the long-term impact of COVID-19 to our business is not yet fully known, we believe we are well positioned from a liquidity perspective with $3.9 billion of immediate liquidity as of August 13, 2020, made up of $3.4 billion of undrawn line of credit capacity and $0.5 billion of cash on hand.
Our primary needs for liquidity and capital resources are to fund our investments, make distributions to our stockholders, repurchase shares of our common stock pursuant to our share repurchase plan, operating expenses, capital expenditures, margin calls under our reverse repurchase agreements, and to pay debt service on our outstanding indebtedness we may incur. Our operating expenses include, among other things, fees and expenses related to managing our properties and other investments, the management fee we pay to the Adviser (to the extent the Adviser elects to receive the management fee in cash), the performance participation allocation that BREIT OP pays to the Special Limited Partner (to the extent the Special Limited Partner elects to receive the performance participation allocation in cash), and general corporate expenses. We do not have any office or personnel expenses as we do not have any employees.
Our cash needs for acquisitions and other capital investments will be funded primarily from the sale of shares of our common stock and through the assumption or incurrence of debt. During the second quarter, we experienced a decline in net proceeds received from the sale of shares of our common stock compared to recent quarters as a result of COVID-19. However, subsequent to June 30, 2020, we have started to see an increase in net proceeds received from the sale of shares of our common stock compared to the second quarter. In addition, in March 2020 we experienced an elevated level of repurchases under our repurchase plan. We continue to believe that our current liquidity position is sufficient to meet our expected investment activity. Other potential future sources of capital include secured or unsecured financings from banks or other lenders and proceeds from the sale of assets. If necessary, we may use financings or other sources of capital in the event of unforeseen significant capital expenditures.
As of June 30, 2020, our indebtedness included loans secured by our properties, master repurchase agreements with Barclays Bank PLC (the “Barclays MRA”), Royal Bank of Canada (the “RBC MRA”), and Citigroup Global Markets Inc. (the “Citi MRA”) secured by our investments in real estate debt, and unsecured lines of credit.
During April 2020, we entered into an asset-specific Total Return Swap (“TRS”) and sale of a financial asset, collectively accounted for as a secured financing with Deutsche Bank (the “DB Secured Financing”) in the amount of $252.7 million. The DB Secured Financing is secured by one of our term loans and bears interest equal to the three-month EURIBOR plus 1.80% per annum. Additionally, as part of the DB Secured Financing, we are responsible for providing in cash, the equivalent of any decline in value on the underlying collateral.
49
The following table is a summary of our indebtedness as of June 30, 2020 ($ in thousands):
|
|
|
|
|
|
|
|
|
|
|
|
|
|
|
Principal Balance as of |
|
|||||
|
Indebtedness |
|
Weighted Average Interest Rate(1) |
|
|
Weighted Average Maturity Date(2)(3) |
|
|
Maximum Facility Size |
|
|
June 30, 2020 |
|
|
December 31, 2019 |
|
|||||
|
Fixed rate loans: |
|
|
|
|
|
|
|
|
|
|
|
|
|
|
|
|
|
|
|
|
|
Fixed rate mortgages |
|
3.8% |
|
|
7/8/2027 |
|
|
N/A |
|
|
$ |
12,758,220 |
|
|
$ |
12,424,717 |
|
|||
|
Mezzanine loan |
|
|
— |
|
|
|
— |
|
|
|
|
|
|
|
— |
|
|
|
195,878 |
|
|
Total fixed rate loans |
|
3.78% |
|
|
7/8/2027 |
|
|
|
|
|
|
|
12,758,220 |
|
|
|
12,620,595 |
|
||
|
Variable rate loans: |
|
|
|
|
|
|
|
|
|
|
|
|
|
|
|
|
|
|
|
|
|
Floating rate mortgages |
|
L+1.8% |
|
|
1/25/2026 |
|
|
N/A |
|
|
|
3,288,657 |
|
|
|
1,826,435 |
|
|||
|
Variable rate term loans |
|
L+1.7% |
|
|
2/11/2024 |
|
|
N/A |
|
|
|
1,639,495 |
|
|
|
1,533,561 |
|
|||
|
Variable rate secured revolving credit facilities |
|
L+1.5% |
|
|
10/9/2026 |
|
|
$ |
2,339,495 |
|
|
|
150,000 |
|
|
|
1,063,837 |
|
||
|
Variable rate mezzanine loans |
|
L+4.3% |
|
|
4/9/2025 |
|
|
N/A |
|
|
|
142,200 |
|
|
|
— |
|
|||
|
Total variable rate loans |
|
L+1.8% |
|
|
6/14/2025 |
|
|
|
|
|
|
|
5,220,352 |
|
|
|
4,423,833 |
|
||
|
Total loans secured by our properties |
|
3.3% |
|
|
12/1/2026 |
|
|
|
|
|
|
|
17,978,572 |
|
|
|
17,044,428 |
|
||
|
|
|
|
|
|
|
|
|
|
|
|
|
|
|
|
|
|
|
|
|
|
|
Secured financings on investments in real estate debt: |
|
|
|
|
|
|
|
|
|
|
|
|
|
|
|
|
|
|||
|
Barclays MRA |
|
|
|
|
|
9/29/2021 |
|
|
|
750,000 |
|
|
|
750,000 |
|
|
|
750,000 |
|
|
|
Other MRAs(4) |
|
|
|
|
|
3/14/2021 |
|
|
N/A |
|
|
|
1,366,958 |
|
|
|
2,342,137 |
|
||
|
DB Secured Financing |
|
|
|
|
|
4/2/2022 |
|
|
N/A |
|
|
|
252,727 |
|
|
|
— |
|
||
|
Total secured financings on investments real estate debt(5) |
1.5% |
|
|
|
|
|
|
|
|
|
|
|
2,369,685 |
|
|
|
3,092,137 |
|
||
|
|
|
|
|
|
|
|
|
|
|
|
|
|
|
|
|
|
|
|
|
|
|
Unsecured loans: |
|
|
|
|
|
|
|
|
|
|
|
|
|
|
|
|
|
|
|
|
|
Unsecured variable rate revolving credit facility |
|
L+2.5% |
|
|
2/22/2023 |
|
|
|
1,275,000 |
|
|
|
— |
|
|
|
— |
|
||
|
Affiliate line of credit |
|
L+2.5% |
|
|
1/22/2021 |
|
|
|
150,000 |
|
|
|
— |
|
|
|
— |
|
||
|
Total unsecured loans |
|
|
|
|
|
|
|
|
|
|
1,425,000 |
|
|
|
— |
|
|
|
— |
|
|
|
|
|
|
|
|
|
|
|
|
|
|
|
|
|
|
|
|
|
|
|
|
Total indebtedness |
|
|
|
|
|
|
|
|
|
|
|
|
|
$ |
20,348,257 |
|
|
$ |
20,136,565 |
|
|
(1) |
The term “L” refers to the one-month LIBOR with respect to loans secured by our properties and unsecured loans. |
|
(2) |
For loans where we, at our sole discretion, have extension options, the maximum maturity date has been assumed. |
|
(3) |
Subsequent to quarter end, we rolled our repurchase agreement contracts expiring in July 2020 into new contracts. |
|
(4) |
Includes RBC MRA and Citi MRA. |
|
(5) |
Weighted average interest rate based on L+1.4%, whereby “L” refers to the relevant floating benchmark rates, which include USD LIBOR, GBP LIBOR and EURIBOR, as applicable to each secured financing. |
As of August 13, 2020, we had received net proceeds of $8.6 billion from selling an aggregate of 771,254,474 shares of our common stock in the Current Offering (consisting of 406,147,616 Class S shares, 259,250,685 Class I shares, 25,839,042 Class T shares, and 80,017,131 Class D shares).
Cash Flows
The following table provides a breakdown of the net change in our cash and cash equivalents and restricted cash ($ in thousands):
|
|
|
Six Months Ended June 30, |
|
|||||
|
|
|
2020 |
|
|
2019 |
|
||
|
Cash flows provided by operating activities |
|
$ |
484,795 |
|
|
$ |
193,469 |
|
|
Cash flows used in investing activities |
|
|
(4,933,503 |
) |
|
|
(4,809,537 |
) |
|
Cash flows provided by financing activities |
|
|
4,061,892 |
|
|
|
4,937,285 |
|
|
Net increase (decrease) in cash and cash equivalents and restricted cash |
|
$ |
(386,816 |
) |
|
$ |
321,217 |
|
Cash flows provided by operating activities increased $0.3 billion during the six months ended June 30, 2020 compared to the corresponding period in the 2019 due to increased cash flows from the operations of the investments in real estate and income on our investments in real estate debt.
Cash flows used in investing activities increased $0.1 billion during the six months ended June 30, 2020 compared to the corresponding period in 2019 primarily due to an increase of $0.8 billion investment in unconsolidated entities, a net increase of $0.4 billion related to our investments in real estate-related equity securities, offset by a decrease of $0.8 billion in the acquisition of real estate investments and a net decrease in the investments in real estate debt of $0.3 billion.
50
Cash flows provided by financing activities decreased $0.9 billion during the six months ended June 30, 2020 compared to the corresponding period in 2019 primarily due to a net decrease in borrowings of $2.2 billion, an increase of $0.7 billion in repurchases of common stock, a net decrease of $0.2 billion in subscriptions received in advance, a $0.1 billion increase in distributions and $0.1 billion increase in redemption of redeemable non-controlling interest. The decrease was partially offset by a net increase of $2.4 billion from the issuance of our common stock.
Critical Accounting Policies
The preparation of the financial statements in accordance with GAAP involves significant judgments and assumptions and requires estimates about matters that are inherently uncertain. These judgments will affect our reported amounts of assets and liabilities and our disclosure of contingent assets and liabilities at the dates of the financial statements and the reported amounts of revenue and expenses during the reporting periods. With different estimates or assumptions, materially different amounts could be reported in our condensed consolidated financial statements. We consider our accounting policies over investments in real estate and lease intangibles, investments in real estate debt, and revenue recognition to be our critical accounting policies. See Note 2 to the consolidated financial statements in our Annual Report on Form 10-K for the year ended December 31, 2019 for further descriptions of such accounting policies.
Recent Accounting Pronouncements
See Note 2 — “Summary of Significant Accounting Policies” to our condensed consolidated financial statements in this quarterly report on Form 10-Q for a discussion concerning recent accounting pronouncements.
Off-Balance Sheet Arrangements
We currently have no off-balance sheet arrangements that are reasonably likely to have a material current or future effect on our financial condition, changes in financial condition, revenues or expenses, results of operations, liquidity, capital expenditures or capital resources.
Contractual Obligations
The following table aggregates our contractual obligations and commitments with payments due subsequent to June 30, 2020 ($ in thousands).
|
Obligations |
|
Total |
|
|
Less than 1 year |
|
|
1-3 years |
|
|
3-5 years |
|
|
More than 5 years |
|
|||||
|
Indebtedness (1) |
|
$ |
24,341,801 |
|
|
$ |
2,151,715 |
|
|
$ |
2,929,647 |
|
|
$ |
7,138,236 |
|
|
$ |
12,122,203 |
|
|
Ground leases |
|
|
967,667 |
|
|
|
6,966 |
|
|
|
14,512 |
|
|
|
15,181 |
|
|
|
931,008 |
|
|
Organizational and offering costs |
|
|
5,113 |
|
|
|
2,045 |
|
|
|
3,068 |
|
|
|
— |
|
|
|
— |
|
|
Other |
|
|
13,122 |
|
|
|
3,789 |
|
|
|
7,076 |
|
|
|
2,257 |
|
|
|
— |
|
|
Total |
|
$ |
25,327,703 |
|
|
$ |
2,164,515 |
|
|
$ |
2,954,303 |
|
|
$ |
7,155,674 |
|
|
$ |
13,053,211 |
|
|
(1) |
The allocation of our indebtedness includes both principal and interest payments based on the current maturity date and interest rates in effect at June 30, 2020. |
51
ITEM 3.QUANTITATIVE AND QUALITATIVE DISCLOSURES ABOUT MARKET RISK
Indebtedness
We are exposed to interest rate risk with respect to our variable-rate indebtedness, whereas an increase in interest rates would directly result in higher interest expense costs. We seek to manage our exposure to interest rate risk by utilizing a mix of fixed and floating rate financings with staggered maturities and through interest rate protection agreements to fix or cap a portion of our variable rate debt. As of June 30, 2020, the outstanding principal balance of our variable rate indebtedness was $7.6 billion and consisted of mortgage notes, term loans, secured and unsecured revolving credit facilities, and repurchase agreements.
Certain of our mortgage notes, term loans, secured and unsecured revolving credit facilities and repurchase agreements are variable rate and indexed to one-month U.S. Dollar denominated LIBOR, three-month U.S. Dollar denominated LIBOR, three-month GBP denominated LIBOR, three-month Euro denominated LIBOR or six-month Euro denominated LIBOR (collectively, the “Reference Rates”). For the three and six months ended June 30, 2020, a 10% increase in the Reference Rates would have resulted in increased interest expense of $0.6 million and $2.4 million, respectively.
Certain jurisdictions are currently reforming or phasing out their Interbank Offered Rates, or IBORS, including, without limitation, the London Interbank Offered Rate and Euro Interbank Offered Rate. The timing of the anticipated reforms or phase-outs vary by jurisdiction, with most of the reforms or phase-outs currently scheduled to take effect at the end of calendar year 2021. We are evaluating the operational impact of such changes on existing transactions and contractual arrangements and managing transition efforts. Refer to “Part I. Item 1A. Risk Factors — Risks Related to Debt Financing — Changes to, or the elimination of, LIBOR may adversely affect interest expense related to borrowings under our credit facilities and real estate-related investments” of our Annual Report on Form 10-K for the year ended December 31, 2019.
Investments in Real Estate Debt
As of June 30, 2020, we held $4.6 billion of investments in real estate debt. Our investments in real estate debt are primarily floating-rate and indexed to the Reference Rates and as such, exposed to interest rate risk. Our net income will increase or decrease depending on interest rate movements. While we cannot predict factors which may or may not affect interest rates, for the three and six months ended June 30, 2020, a 10% increase or decrease in the Reference Rates would have resulted in an increase or decrease to income from investments in real estate debt of $0.1 million and $0.3 million, respectively.
We may also be exposed to market risk with respect to our investments in real estate debt due to changes in the fair value of our investments. We seek to manage our exposure to market risk with respect to our investments in real estate debt by making investments in securities backed by different types of collateral and varying credit ratings. The fair value of our investments may fluctuate, thus the amount we will realize upon any sale of our investments in real estate debt is unknown. As of June 30, 2020, the fair value at which we may sell our investments in real estate debt is not known, but a 10% change in the fair value of our investments in real estate debt may result in a change in the carrying value of our investments in real estate debt of $464.9 million.
Evaluation of Disclosure Controls and Procedures
An evaluation of the effectiveness of the design and operation of our “disclosure controls and procedures” (as defined in Rule 13a-15(e) under the Securities Exchange Act of 1934, as amended (the “Exchange Act”)), as of the end of the period covered by this quarterly report on Form 10-Q was made under the supervision and with the participation of our management, including our Chief Executive Officer (“CEO”) and Chief Financial Officer (“CFO”). Based upon this evaluation, our CEO and CFO have concluded that as of the end of the period covered by this report our disclosure controls and procedures (a) were effective to ensure that information required to be disclosed by us in reports filed or submitted under the Exchange Act is recorded, processed, summarized and reported within the time periods specified by SEC rules and forms and (b) included, without limitation, controls and procedures designed to ensure that information required to be disclosed by us in reports filed or submitted under the Exchange Act is accumulated and communicated to our management, including our CEO and CFO, as appropriate to allow timely decisions regarding required disclosure.
Changes in Internal Controls over Financial Reporting
There have been no changes in our “internal control over financial reporting” (as defined in Rule 13a-15(f) of the Exchange Act) that occurred during the period covered by this quarterly report on Form 10-Q that have materially affected, or are reasonably likely to materially affect, our internal control over financial reporting.
52
From time to time, we may be involved in various claims and legal actions arising in the ordinary course of business. As of June 30, 2020, we were not involved in any material legal proceedings.
For information regarding factors that could affect our results of operations, financial condition and liquidity, see the risk factors discussed in Part I, Item 1A. “Risk Factors” in our Annual Report on Form 10-K for the year ended December 31, 2019 and under the heading “Risk Factors” in our prospectus dated April 21, 2020.
53
Unregistered Sales of Equity Securities
During the three months ended June 30, 2020, we sold equity securities that were not registered under the Securities Act as described below. As described in Note 12 to our condensed consolidated financial statements, the Adviser is entitled to an annual management fee payable monthly in cash, shares of common stock, or BREIT OP Units, in each case at the Adviser's election. For the three months ended June 30, 2020, the Adviser elected to receive its management fee in Class I shares and we issued 3,354,544 unregistered Class I shares to the Adviser in satisfaction of the management fee for April and May 2020. Additionally, we issued 1,700,028 unregistered Class I shares to the Adviser in July 2020 in satisfaction of the June 2020 management fee.
We have also sold Class I shares to feeder vehicles primarily created to hold Class I shares that offers interests in such feeder vehicles to non-U.S. persons. The offer and sale of Class I shares to the feeder vehicles was exempt from the registration provisions of the Securities Act, by virtue of Section 4(a)(2) and Regulation S thereunder. During the three months ended June 30, 2020, we received $0.3 billion from selling 27.3 million unregistered Class I shares to such vehicles. We intend to use the net proceeds from such sales for the purposes set forth in the prospectus for our Current Offering and in a manner within the investment guidelines approved by our board of directors, who serve as fiduciaries to our stockholders.
Share Repurchases
Under our share repurchase plan, to the extent we choose to repurchase shares in any particular month, we will only repurchase shares as of the opening of the last calendar day of that month (each such date, a “Repurchase Date”). Repurchases will be made at the transaction price in effect on the Repurchase Date (which will generally be equal to our prior month’s NAV per share), except that shares that have not been outstanding for at least one year will be repurchased at 95% of the transaction price (an “Early Repurchase Deduction”) subject to certain limited exceptions. Settlements of share repurchases will generally be made within three business days of the Repurchase Date. The Early Repurchase Deduction will not apply to shares acquired through our distribution reinvestment plan.
The aggregate NAV of total repurchases of Class S shares, Class I shares, Class T shares and Class D shares (including repurchases at certain non-U.S. investor access funds primarily created to hold shares of the Company but excluding any Early Repurchase Deduction applicable to the repurchased shares) is limited to no more than 2% of our aggregate NAV per month based on the aggregate NAV of the prior month and no more than 5% of our aggregate NAV per calendar quarter based on the average of the aggregate NAV per month over the prior three months.
In the event that we determine to repurchase some but not all of the shares submitted for repurchase during any month, shares submitted for repurchase during such month will be repurchased on a pro rata basis. All unsatisfied repurchase requests must be resubmitted after the start of the next month or quarter, or upon the recommencement of the share repurchase plan, as applicable.
Should repurchase requests, in our judgment, place an undue burden on our liquidity, adversely affect our operations or risk having an adverse impact on the Company as a whole, or should we otherwise determine that investing our liquid assets in real properties or other investments rather than repurchasing our shares is in the best interests of the Company as a whole, then we may choose to repurchase fewer shares in any particular month than have been requested to be repurchased, or none at all. Further, our board of directors may make exceptions to, modify, suspend or terminate our share repurchase plan if it deems such action to be in our best interest and the best interest of our stockholders. Material modifications, including any amendment to the 2% monthly or 5% quarterly limitations on repurchases, to and suspensions of the share repurchase plan will be promptly disclosed to stockholders in a prospectus supplement (or post-effective amendment if required by the Securities Act) or special or periodic report filed by us. Material modifications will also be disclosed on our website. In addition, we may determine to suspend the share repurchase plan due to regulatory changes, changes in law or if we become aware of undisclosed material information that we believe should be publicly disclosed before shares are repurchased. Once the share repurchase plan is suspended, our board of directors must affirmatively authorize the recommencement of the plan before stockholder requests will be considered again.
If the transaction price for the applicable month is not made available by the tenth business day prior to the last business day of the month (or is changed after such date), then no repurchase requests will be accepted for such month and stockholders who wish to have their shares repurchased the following month must resubmit their repurchase requests.
54
During the three months ended June 30, 2020, we repurchased shares of our common stock in the following amounts, which represented all of the share repurchase requests received for the same period.
|
Month of: |
|
Total Number of Shares Repurchased(1)(2) |
|
|
Repurchases as a Percentage of NAV(2) |
|
|
Average Price Paid per Share |
|
|
Total Number of Shares Repurchased as Part of Publicly Announced Plans or Programs |
|
|
Maximum Number of Shares Pending Repurchase Pursuant to Publicly Announced Plans or Programs(3) |
|
|||||
|
April 2020 |
|
|
10,155,068 |
|
|
|
0.7 |
% |
|
$ |
10.35 |
|
|
|
10,155,068 |
|
|
|
— |
|
|
May 2020 |
|
|
11,803,139 |
|
|
|
0.8 |
% |
|
|
10.40 |
|
|
|
8,501,557 |
|
|
|
— |
|
|
June 2020 |
|
|
6,633,476 |
|
|
|
0.4 |
% |
|
|
10.53 |
|
|
|
4,949,304 |
|
|
|
— |
|
|
Total |
|
|
28,591,683 |
|
|
N/M |
|
|
$ |
10.41 |
|
|
|
23,605,929 |
|
|
|
— |
|
|
|
(1) |
Includes 4,985,753 Class I common shares previously issued to the Adviser as payment for the management fee. The shares were repurchased at the then current transaction price resulting in a total repurchase of $52.3 million. As of June 30, 2020, the Adviser owned 5,172,387 of our Class I common shares. |
|
(2) |
Represents aggregate NAV of the shares repurchased under our share repurchase plan over aggregate NAV of all shares outstanding, in each case, based on the NAV as of the last calendar day of the prior month. |
|
(3) |
All repurchase requests under our share repurchase plan were satisfied. |
The Special Limited Partner continues to hold 23,788 Class I units in BREIT OP. The redemption of Class I units, Class B units and shares held by the Adviser acquired as payment of the Adviser’s management fee are not considered part of our share repurchase plan.
None.
Not applicable.
Not applicable.
55
|
|
|
|
|
|
|
|
|
31.1* |
|
|
|
|
|
|
|
31.2* |
|
|
|
|
|
|
|
32.1 + |
|
|
|
|
|
|
|
32.2 + |
|
|
|
|
|
|
|
101.INS |
|
XBRL Instance Document |
|
|
|
|
|
101.SCH |
|
XBRL Taxonomy Extension Schema Document |
|
|
|
|
|
101.SCH |
|
XBRL Taxonomy Extension Calculation Linkbase Document |
|
|
|
|
|
101.LAB |
|
XBRL Taxonomy Extension Label Linkbase Document |
|
|
|
|
|
101.PRE |
|
XBRL Taxonomy Extension Presentation Linkbase Document |
|
|
|
|
|
101.DEF |
|
XBRL Taxonomy Extension Definition Linkbase Document |
|
* |
Filed herewith. |
|
+ |
This exhibit shall not be deemed “filed” for purposes of Section 18 of the Exchange Act or otherwise subject to the liability of that Section. Such exhibit shall not be deemed incorporated into any filing under the Securities Act or the Exchange Act. |
The agreements and other documents filed as exhibits to this report are not intended to provide factual information or other disclosure other than with respect to the terms of the agreements or other documents themselves, and you should not rely on them for that purpose. In particular, any representations and warranties made by us in these agreements or other documents were made solely within the specific context of the relevant agreement or document and may not describe the actual state of affairs as of the date they were made or at any other time.
56
Pursuant to the requirements of the Securities Exchange Act of 1934, the registrant has duly caused this report to be signed on its behalf by the undersigned thereunto duly authorized.
|
|
|
BLACKSTONE REAL ESTATE INCOME TRUST, INC. |
|
|
|
|
|
August 13, 2020 |
|
/s/ Frank Cohen |
|
Date |
|
Frank Cohen |
|
|
|
Chief Executive Officer |
|
|
|
(Principal Executive Officer) |
|
|
|
|
|
August 13, 2020 |
|
/s/ Paul D. Quinlan |
|
Date |
|
Paul D. Quinlan |
|
|
|
Chief Financial Officer and Treasurer |
|
|
|
(Principal Financial Officer) |
|
|
|
|
|
August 13, 2020 |
|
/s/ Paul Kolodziej |
|
Date |
|
Paul Kolodziej |
|
|
|
Chief Accounting Officer |
|
|
|
(Principal Accounting Officer) |
57