Attached files
| file | filename |
|---|---|
| EX-32.2 - EX-32.2 - Blackstone Real Estate Income Trust, Inc. | breit-ex322_519.htm |
| EX-32.1 - EX-32.1 - Blackstone Real Estate Income Trust, Inc. | breit-ex321_520.htm |
| EX-31.2 - EX-31.2 - Blackstone Real Estate Income Trust, Inc. | breit-ex312_521.htm |
| EX-31.1 - EX-31.1 - Blackstone Real Estate Income Trust, Inc. | breit-ex311_522.htm |
UNITED STATES
SECURITIES AND EXCHANGE COMMISSION
WASHINGTON, D.C. 20549
FORM 10-Q
(Mark One)
|
☒ |
QUARTERLY REPORT PURSUANT TO SECTION 13 OR 15(d) OF THE SECURITIES EXCHANGE ACT OF 1934 |
FOR THE QUARTERLY PERIOD ENDED MARCH 31, 2018
OR
|
☐ |
TRANSITION REPORT PURSUANT TO SECTION 13 OR 15(d) OF THE SECURITIES EXCHANGE ACT OF 1934 |
FOR THE TRANSITION PERIOD FROM TO
Commission File Number: 000-55931

Blackstone Real Estate Income Trust, Inc.
(Exact name of Registrant as specified in its charter)
|
|
|
|
Maryland |
81-0696966 |
|
(State or other jurisdiction of incorporation or organization) |
(I.R.S. Employer Identification No.) |
345 Park Avenue
New York, New York 10154
(Address of principal executive offices) (Zip Code)
(212) 583-5000
(Registrant’s telephone number, including area code)
Indicate by check mark whether the Registrant (1) has filed all reports required to be filed by Section 13 or 15(d) of the Securities Exchange Act of 1934 during the preceding 12 months (or for such shorter period that the Registrant was required to file such reports), and (2) has been subject to such filing requirements for the past 90 days. Yes ☒ No ☐
Indicate by check mark whether the registrant has submitted electronically and posted on its corporate Website, if any, every Interactive Data File required to be submitted and posted pursuant to Rule 405 of Regulation S-T (§232.405 of this chapter) during the preceding 12 months (or for such shorter period that the registrant was required to submit and post such files). Yes ☒ No ☐
Indicate by check mark whether the Registrant is a large accelerated filer, an accelerated filer, a non-accelerated filer, smaller reporting company, or an emerging growth company. See the definitions of “large accelerated filer,” “accelerated filer,” “smaller reporting company,” and “emerging growth company” in Rule 12b-2 of the Exchange Act.
|
Large accelerated filer |
☐ |
|
Accelerated filer |
☐ |
|
Non-accelerated filer |
☒ |
(Do not check if a smaller reporting company) |
Smaller reporting company |
☐ |
|
|
|
|
Emerging growth company |
☒ |
If an emerging growth company, indicate by check mark if the registrant has elected not to use the extended transition period for complying with any new or revised financial accounting standards provided pursuant to Section 13(a) of the Exchange Act. Yes ☒ No ☐
Indicate by check mark whether the Registrant is a shell company (as defined in Rule 12b-2 of the Exchange Act. Yes ☐ No ☒
As of May 11, 2018, the issuer had the following shares outstanding: 189,759,390 shares of Class S common stock, 13,250,755 shares of Class T common stock, 9,402,143 shares of Class D common stock, and 59,217,575 shares of Class I common stock.
|
PART I. |
1 |
|
|
|
|
|
|
ITEM 1. |
1 |
|
|
|
|
|
|
|
Consolidated Financial Statements (Unaudited): |
|
|
|
|
|
|
|
Consolidated Balance Sheets as of March 31, 2018 and December 31, 2017 |
1 |
|
|
|
|
|
|
Consolidated Statements of Operations for the Three Months Ended March 31, 2018 and 2017 |
2 |
|
|
|
|
|
|
Consolidated Statement of Changes in Equity for the Three Months Ended March 31, 2018 and 2017 |
3 |
|
|
|
|
|
|
Consolidated Statements of Cash Flows for the Three Months Ended March 31, 2018 and 2017 |
4 |
|
|
|
|
|
|
5 |
|
|
|
|
|
|
ITEM 2. |
MANAGEMENT’S DISCUSSION AND ANALYSIS OF FINANCIAL CONDITION AND RESULTS OF OPERATIONS |
18 |
|
|
|
|
|
ITEM 3. |
31 |
|
|
|
|
|
|
ITEM 4. |
31 |
|
|
|
|
|
|
PART II. |
32 |
|
|
|
|
|
|
ITEM 1. |
32 |
|
|
|
|
|
|
ITEM 1A. |
32 |
|
|
|
|
|
|
ITEM 2. |
33 |
|
|
|
|
|
|
ITEM 3. |
34 |
|
|
|
|
|
|
ITEM 4. |
34 |
|
|
|
|
|
|
ITEM 5. |
34 |
|
|
|
|
|
|
ITEM 6. |
35 |
|
|
|
|
|
|
36 |
||
Blackstone Real Estate Income Trust, Inc.
Consolidated Balance Sheets (Unaudited)
(in thousands, except share and per share data)
|
|
|
March 31, 2018 |
|
|
December 31, 2017 |
|
||
|
Assets |
|
|
|
|
|
|
|
|
|
Investments in real estate, net |
|
$ |
5,390,674 |
|
|
$ |
3,406,555 |
|
|
Investments in real estate-related securities |
|
|
1,061,465 |
|
|
|
915,742 |
|
|
Cash and cash equivalents |
|
|
51,034 |
|
|
|
31,166 |
|
|
Restricted cash |
|
|
182,634 |
|
|
|
126,563 |
|
|
Other assets |
|
|
260,069 |
|
|
|
145,282 |
|
|
Total assets |
|
$ |
6,945,876 |
|
|
$ |
4,625,308 |
|
|
Liabilities and Equity |
|
|
|
|
|
|
|
|
|
Mortgage notes, term loans, and revolving credit facilities, net |
|
$ |
3,654,397 |
|
|
$ |
2,111,291 |
|
|
Repurchase agreements |
|
|
810,278 |
|
|
|
682,848 |
|
|
Affiliate line of credit |
|
|
— |
|
|
|
5,374 |
|
|
Due to affiliates |
|
|
153,170 |
|
|
|
133,071 |
|
|
Accounts payable, accrued expenses, and other liabilities |
|
|
302,519 |
|
|
|
182,835 |
|
|
Total liabilities |
|
|
4,920,364 |
|
|
|
3,115,419 |
|
|
|
|
|
|
|
|
|
|
|
|
Commitments and contingencies |
|
|
— |
|
|
|
— |
|
|
Redeemable non-controlling interest |
|
|
17,479 |
|
|
|
250 |
|
|
|
|
|
|
|
|
|
|
|
|
Equity |
|
|
|
|
|
|
|
|
|
Preferred stock, $0.01 par value per share, 100,000,000 shares authorized; no shares issued and outstanding as of March 31, 2018 and December 31, 2017 |
|
|
— |
|
|
|
— |
|
|
Common stock — Class S shares, $0.01 par value per share, 500,000,000 shares authorized; 163,554,503 and 130,085,145 shares issued and outstanding as of March 31, 2018 and December 31, 2017, respectively |
|
|
1,636 |
|
|
|
1,301 |
|
|
Common stock — Class T shares, $0.01 par value per share, 500,000,000 shares authorized; 9,759,108 and 5,624,614 shares issued and outstanding as of March 31, 2018 and December 31, 2017, respectively |
|
|
98 |
|
|
|
56 |
|
|
Common stock — Class D shares, $0.01 par value per share, 500,000,000 shares authorized; 6,840,379 and 3,955,114 shares issued and outstanding as of March 31, 2018 and December 31, 2017, respectively |
|
|
68 |
|
|
|
40 |
|
|
Common stock — Class I shares, $0.01 par value per share, 500,000,000 shares authorized; 47,335,054 and 30,719,160 shares issued and outstanding as of March 31, 2018 and December 31, 2017, respectively |
|
|
473 |
|
|
|
307 |
|
|
Additional paid-in capital |
|
|
2,185,832 |
|
|
|
1,616,720 |
|
|
Accumulated deficit and cumulative distributions |
|
|
(208,565 |
) |
|
|
(132,633 |
) |
|
Total stockholders' equity |
|
|
1,979,542 |
|
|
|
1,485,791 |
|
|
Non-controlling interests |
|
|
28,491 |
|
|
|
23,848 |
|
|
Total equity |
|
|
2,008,033 |
|
|
|
1,509,639 |
|
|
Total liabilities and equity |
|
$ |
6,945,876 |
|
|
$ |
4,625,308 |
|
See accompanying condensed notes to consolidated financial statements.
1
Blackstone Real Estate Income Trust, Inc.
Consolidated Statements of Operations (Unaudited)
(in thousands, except share and per share data)
|
|
|
|
|||||
|
|
Three Months Ended March 31, |
|
|||||
|
|
2018 |
|
|
2017 |
|
||
|
Revenues |
|
|
|
|
|
|
|
|
Rental revenue |
$ |
78,513 |
|
|
$ |
898 |
|
|
Tenant reimbursement income |
|
9,048 |
|
|
|
67 |
|
|
Hotel revenue |
|
17,821 |
|
|
|
1,426 |
|
|
Other revenue |
|
4,302 |
|
|
|
53 |
|
|
Total revenues |
|
109,684 |
|
|
|
2,444 |
|
|
Expenses |
|
|
|
|
|
|
|
|
Rental property operating |
|
38,618 |
|
|
|
305 |
|
|
Hotel operating |
|
11,614 |
|
|
|
840 |
|
|
General and administrative |
|
2,045 |
|
|
|
2,686 |
|
|
Management fee |
|
6,969 |
|
|
|
— |
|
|
Performance participation allocation |
|
7,873 |
|
|
|
— |
|
|
Depreciation and amortization |
|
74,124 |
|
|
|
1,090 |
|
|
Total expenses |
|
141,243 |
|
|
|
4,921 |
|
|
Other income (expense) |
|
|
|
|
|
|
|
|
Income from real estate-related securities |
|
13,235 |
|
|
|
866 |
|
|
Interest income |
|
77 |
|
|
|
265 |
|
|
Interest expense |
|
(31,391 |
) |
|
|
— |
|
|
Other income |
|
— |
|
|
|
79 |
|
|
Total other (expense) income |
|
(18,079 |
) |
|
|
1,210 |
|
|
Net loss |
$ |
(49,638 |
) |
|
$ |
(1,267 |
) |
|
Net loss attributable to non-controlling interests |
$ |
2,090 |
|
|
$ |
— |
|
|
Net loss attributable to BREIT stockholders |
$ |
(47,548 |
) |
|
$ |
(1,267 |
) |
|
Net loss per share of common stock — basic and diluted |
$ |
(0.23 |
) |
|
$ |
(0.03 |
) |
|
Weighted-average shares of common stock outstanding, basic and diluted |
|
206,104,310 |
|
|
|
37,307,094 |
|
|
Gross distributions declared per share of common stock |
$ |
0.16 |
|
|
$ |
0.04 |
|
See accompanying condensed notes to consolidated financial statements.
2
Blackstone Real Estate Income Trust, Inc.
Consolidated Statement of Changes in Equity (Unaudited)
(in thousands)
|
|
|
Par Value |
|
|
|
|
|
|
Accumulated |
|
|
|
|
|
|
|
|
|
|
|
|
|
||||||||||||||
|
|
|
Common |
|
|
Common |
|
|
Common |
|
|
Common |
|
|
Additional |
|
|
Deficit and |
|
|
Total |
|
|
Non- |
|
|
|
|
|
||||||||
|
|
|
Stock |
|
|
Stock |
|
|
Stock |
|
|
Stock |
|
|
Paid-in |
|
|
Cumulative |
|
|
Stockholders' |
|
|
controlling |
|
|
Total |
|
|||||||||
|
|
|
Class S |
|
|
Class T |
|
|
Class D |
|
|
Class I |
|
|
Capital |
|
|
Distributions |
|
|
Equity |
|
|
Interests |
|
|
Equity |
|
|||||||||
|
Balance at December 31, 2016 |
|
$ |
— |
|
|
$ |
— |
|
|
$ |
— |
|
|
$ |
— |
|
|
$ |
200 |
|
|
$ |
(115 |
) |
|
$ |
85 |
|
|
$ |
— |
|
|
$ |
85 |
|
|
Common stock issued |
|
|
400 |
|
|
|
— |
|
|
|
— |
|
|
|
77 |
|
|
|
482,284 |
|
|
|
— |
|
|
|
482,761 |
|
|
|
— |
|
|
|
482,761 |
|
|
Offering costs |
|
|
— |
|
|
|
— |
|
|
|
— |
|
|
|
— |
|
|
|
(41,398 |
) |
|
|
— |
|
|
|
(41,398 |
) |
|
|
— |
|
|
|
(41,398 |
) |
|
Amortization of restricted stock grant |
|
|
— |
|
|
|
— |
|
|
|
— |
|
|
|
— |
|
|
|
23 |
|
|
|
— |
|
|
|
23 |
|
|
|
— |
|
|
|
23 |
|
|
Net loss |
|
|
— |
|
|
|
— |
|
|
|
— |
|
|
|
— |
|
|
|
— |
|
|
|
(1,267 |
) |
|
|
(1,267 |
) |
|
|
— |
|
|
|
(1,267 |
) |
|
Distributions declared on common stock |
|
|
— |
|
|
|
— |
|
|
|
— |
|
|
|
— |
|
|
|
— |
|
|
|
(1,319 |
) |
|
|
(1,319 |
) |
|
|
— |
|
|
|
(1,319 |
) |
|
Balance at March 31, 2017 |
|
$ |
400 |
|
|
$ |
— |
|
|
$ |
— |
|
|
$ |
77 |
|
|
$ |
441,109 |
|
|
$ |
(2,701 |
) |
|
$ |
438,885 |
|
|
$ |
— |
|
|
$ |
438,885 |
|
|
|
|
|
|
|
|
|
|
|
|
|
|
|
|
|
|
|
|
|
|
|
|
|
|
|
|
|
|
|
|
|
|
|
|
|
|
|
|
Balance at December 31, 2017 |
|
$ |
1,301 |
|
|
$ |
56 |
|
|
$ |
40 |
|
|
$ |
307 |
|
|
$ |
1,616,720 |
|
|
$ |
(132,633 |
) |
|
$ |
1,485,791 |
|
|
$ |
23,848 |
|
|
$ |
1,509,639 |
|
|
Common stock issued |
|
|
325 |
|
|
|
42 |
|
|
|
28 |
|
|
|
163 |
|
|
|
593,143 |
|
|
|
— |
|
|
|
593,701 |
|
|
|
— |
|
|
|
593,701 |
|
|
Offering costs |
|
|
— |
|
|
|
— |
|
|
|
— |
|
|
|
— |
|
|
|
(37,361 |
) |
|
|
— |
|
|
|
(37,361 |
) |
|
|
— |
|
|
|
(37,361 |
) |
|
Distribution reinvestment |
|
|
11 |
|
|
|
— |
|
|
|
— |
|
|
|
4 |
|
|
|
16,482 |
|
|
|
— |
|
|
|
16,497 |
|
|
|
— |
|
|
|
16,497 |
|
|
Common stock repurchased |
|
|
(1 |
) |
|
|
— |
|
|
|
— |
|
|
|
(1 |
) |
|
|
(2,294 |
) |
|
|
— |
|
|
|
(2,296 |
) |
|
|
— |
|
|
|
(2,296 |
) |
|
Amortization of restricted stock grants |
|
|
— |
|
|
|
— |
|
|
|
— |
|
|
|
— |
|
|
|
25 |
|
|
|
— |
|
|
|
25 |
|
|
|
— |
|
|
|
25 |
|
|
Net loss ($374 allocated to redeemable non-controlling interest) |
|
|
— |
|
|
|
— |
|
|
|
— |
|
|
|
— |
|
|
|
— |
|
|
|
(47,548 |
) |
|
|
(47,548 |
) |
|
|
(1,716 |
) |
|
|
(49,264 |
) |
|
Distributions declared on common stock |
|
|
— |
|
|
|
— |
|
|
|
— |
|
|
|
— |
|
|
|
— |
|
|
|
(28,384 |
) |
|
|
(28,384 |
) |
|
|
— |
|
|
|
(28,384 |
) |
|
Contributions from non-controlling interests |
|
|
— |
|
|
|
— |
|
|
|
— |
|
|
|
— |
|
|
|
— |
|
|
|
— |
|
|
|
— |
|
|
|
6,940 |
|
|
|
6,940 |
|
|
Distributions to non-controlling interests |
|
|
— |
|
|
|
— |
|
|
|
— |
|
|
|
— |
|
|
|
— |
|
|
|
— |
|
|
|
— |
|
|
|
(581 |
) |
|
|
(581 |
) |
|
Allocation to redeemable non-controlling interest |
|
|
— |
|
|
|
— |
|
|
|
— |
|
|
|
— |
|
|
|
(883 |
) |
|
|
— |
|
|
|
(883 |
) |
|
|
— |
|
|
|
(883 |
) |
|
Balance at March 31, 2018 |
|
$ |
1,636 |
|
|
$ |
98 |
|
|
$ |
68 |
|
|
$ |
473 |
|
|
$ |
2,185,832 |
|
|
$ |
(208,565 |
) |
|
$ |
1,979,542 |
|
|
$ |
28,491 |
|
|
$ |
2,008,033 |
|
See accompanying condensed notes to consolidated financial statements.
3
Blackstone Real Estate Income Trust, Inc.
Consolidated Statements of Cash Flows (Unaudited)
(in thousands)
|
|
|
Three Months Ended March 31, |
|
|||||
|
|
|
2018 |
|
|
2017 |
|
||
|
Cash flows from operating activities: |
|
|
|
|
|
|
|
|
|
Net loss |
|
$ |
(49,638 |
) |
|
$ |
(1,267 |
) |
|
Adjustments to reconcile net loss to net cash provided by operating activities: |
|
|
|
|
|
|
|
|
|
Management fee |
|
|
6,969 |
|
|
|
— |
|
|
Performance participation allocation |
|
|
7,873 |
|
|
|
— |
|
|
Depreciation and amortization |
|
|
74,124 |
|
|
|
1,090 |
|
|
Unrealized gain on changes in fair value of financial instruments |
|
|
(1,789 |
) |
|
|
(725 |
) |
|
Other items |
|
|
813 |
|
|
|
1 |
|
|
Change in assets and liabilities: |
|
|
|
|
|
|
|
|
|
(Increase) / decrease in other assets |
|
|
(14,876 |
) |
|
|
(765 |
) |
|
Increase / (decrease) in due to affiliates |
|
|
(455 |
) |
|
|
1,883 |
|
|
Increase / (decrease) in accounts payable, accrued expenses, and other liabilities |
|
|
18,469 |
|
|
|
1,356 |
|
|
Net cash provided by operating activities |
|
|
41,490 |
|
|
|
1,573 |
|
|
Cash flows from investing activities: |
|
|
|
|
|
|
|
|
|
Acquisitions of real estate |
|
|
(2,029,571 |
) |
|
|
(159,842 |
) |
|
Capital improvements to real estate |
|
|
(6,086 |
) |
|
|
(15 |
) |
|
Pre-acquisition costs |
|
|
(555 |
) |
|
|
(607 |
) |
|
Purchase of real estate-related securities |
|
|
(259,553 |
) |
|
|
(132,396 |
) |
|
Proceeds from settlement of real estate-related securities |
|
|
115,619 |
|
|
|
— |
|
|
Net cash used in investing activities |
|
|
(2,180,146 |
) |
|
|
(292,860 |
) |
|
Cash flows from financing activities: |
|
|
|
|
|
|
|
|
|
Proceeds from issuance of common stock |
|
|
479,821 |
|
|
|
482,761 |
|
|
Offering costs paid |
|
|
(7,979 |
) |
|
|
(5,868 |
) |
|
Subscriptions received in advance |
|
|
150,213 |
|
|
|
103,717 |
|
|
Repurchase of common stock |
|
|
(1,260 |
) |
|
|
— |
|
|
Borrowings from mortgage notes, term loans, and revolving credit facilities |
|
|
1,821,620 |
|
|
|
— |
|
|
Repayments from mortgage notes, term loans, and revolving credit facilities |
|
|
(336,100 |
) |
|
|
— |
|
|
Borrowings under repurchase agreements |
|
|
216,987 |
|
|
|
— |
|
|
Settlement of repurchase agreements |
|
|
(89,557 |
) |
|
|
— |
|
|
Borrowings from affiliate line of credit |
|
|
206,500 |
|
|
|
— |
|
|
Repayments on affiliate line of credit |
|
|
(211,750 |
) |
|
|
— |
|
|
Payment of deferred financing costs |
|
|
(11,180 |
) |
|
|
(32 |
) |
|
Contributions from non-controlling interests |
|
|
6,940 |
|
|
|
— |
|
|
Distributions to non-controlling interests |
|
|
(581 |
) |
|
|
— |
|
|
Distributions |
|
|
(9,079 |
) |
|
|
— |
|
|
Net cash provided by financing activities |
|
|
2,214,595 |
|
|
|
580,578 |
|
|
Net change in cash and cash equivalents and restricted cash |
|
|
75,939 |
|
|
|
289,291 |
|
|
Cash and cash equivalents and restricted cash, beginning of period |
|
|
157,729 |
|
|
|
200 |
|
|
Cash and cash equivalents and restricted cash, end of period |
|
$ |
233,668 |
|
|
$ |
289,491 |
|
|
|
|
|
|
|
|
|
|
|
|
Reconciliation of cash and cash equivalents and restricted cash to the consolidated balance sheets: |
|
|
|
|
|
|
|
|
|
Cash and cash equivalents |
|
$ |
51,034 |
|
|
$ |
185,749 |
|
|
Restricted cash |
|
|
182,634 |
|
|
|
103,742 |
|
|
Total cash and cash equivalents and restricted cash |
|
$ |
233,668 |
|
|
$ |
289,491 |
|
|
|
|
|
|
|
|
|
|
|
|
Non-cash investing and financing activities: |
|
|
|
|
|
|
|
|
|
Assumption of mortgage notes in conjunction with acquisitions of real estate |
|
$ |
67,140 |
|
|
$ |
— |
|
|
Assumption of other liabilities in conjunction with acquisitions of real estate |
|
$ |
33,456 |
|
|
$ |
658 |
|
|
Accrued capital expenditures and acquisition related costs |
|
$ |
1,063 |
|
|
$ |
173 |
|
|
Accrued pre-acquisition costs |
|
$ |
807 |
|
|
$ |
1,509 |
|
|
Accrued distributions |
|
$ |
2,808 |
|
|
$ |
1,319 |
|
|
Accrued stockholder servicing fee due to affiliate |
|
$ |
28,868 |
|
|
$ |
29,621 |
|
|
Accrued offering costs due to affiliate |
|
$ |
508 |
|
|
$ |
5,909 |
|
|
Redeemable non-controlling interest issued as settlement for performance participation allocation |
|
$ |
16,974 |
|
|
$ |
— |
|
|
Allocation to redeemable non-controlling interest |
|
$ |
883 |
|
|
$ |
— |
|
|
Distribution reinvestment |
|
$ |
16,497 |
|
|
$ |
— |
|
|
Accrued common stock repurchases |
|
$ |
1,036 |
|
|
$ |
— |
|
See accompanying condensed notes to consolidated financial statements.
4
Blackstone Real Estate Income Trust, Inc.
Condensed Notes to Consolidated Financial Statements
(Unaudited)
1. Organization and Business Purpose
Blackstone Real Estate Income Trust, Inc. (“BREIT” or the “Company”) was formed on November 16, 2015 as a Maryland corporation and qualifies as a real estate investment trust (“REIT”) for U.S. federal income tax purposes commencing with the taxable year ended December 31, 2017. The Company invests primarily in stabilized income-oriented commercial real estate in the United States and to a lesser extent, in real estate-related securities. The Company is the sole general partner of BREIT Operating Partnership, L.P., a Delaware limited partnership (“BREIT OP”). BREIT Special Limited Partner L.P. (the “Special Limited Partner”), a wholly-owned subsidiary of The Blackstone Group L.P. (together with its affiliates, “Blackstone”), owns a special limited partner interest in BREIT OP. Substantially all of the Company’s business is conducted through BREIT OP. The Company and BREIT OP are externally managed by BX REIT Advisors L.L.C. (the “Adviser”), an affiliate of Blackstone.
The Company has registered with the Securities and Exchange Commission (the “SEC”) an offering of up to $5.0 billion in shares of common stock, consisting of up to $4.0 billion in shares in its primary offering and up to $1.0 billion in shares pursuant to its distribution reinvestment plan (the “Offering”). The Company intends to sell any combination of four classes of shares of its common stock, with a dollar value up to the maximum aggregate amount of the Offering. The share classes have different upfront selling commissions, dealer manager fees and ongoing stockholder servicing fees. As of March 31, 2018, the Company had received net proceeds of $2.3 billion from selling an aggregate of 227,489,044 shares of the Company’s common stock (consisting of 163,554,503 Class S shares, 9,759,108 Class T shares, 6,840,379 Class D shares, and 47,335,054 Class I shares). The Company intends to continue selling shares on a monthly basis.
As of March 31, 2018, the Company owned 30 investments in real estate and had 51 positions in real estate-related debt securities. The Company currently operates in five reportable segments: Residential, Industrial, Hotel, and Retail Properties, and Real Estate-Related Securities. Financial results by segment are reported in Note 13 — Segment Reporting.
2. Summary of Significant Accounting Policies
Basis of Presentation
The accompanying unaudited consolidated financial statements have been prepared in accordance with accounting principles generally accepted in the United States of America (“GAAP”) for interim financial information and the instructions to Form 10-Q and Rule 10-01 of Regulation S-X. The consolidated financial statements, including the condensed notes thereto, are unaudited and exclude some of the disclosures required in audited financial statements. Management believes it has made all necessary adjustments, consisting of only normal recurring items, so that the consolidated financial statements are presented fairly and that estimates made in preparing its consolidated financial statements are reasonable and prudent. The accompanying unaudited consolidated interim financial statements should be read in conjunction with the audited consolidated financial statements included in the Company’s Annual Report on Form 10-K for the fiscal year ended December 31, 2017 filed with the SEC.
Certain amounts in the Company’s prior period consolidated financial statements have been reclassified to conform to the current period presentation. The Company has chosen to aggregate certain financial statement line items in the Company’s consolidated statements of operations and consolidated statements of cash flows. Such reclassifications had no effect on net loss or previously reported totals or subtotals in the consolidated statements of cash flows.
The accompanying consolidated financial statements include the accounts of the Company, the Company’s subsidiaries and joint ventures in which the Company has a controlling interest. For consolidated joint ventures, the non-controlling partner’s share of the assets, liabilities and operations of the joint ventures is included in non-controlling interests as equity of the Company. The non-controlling partner’s interest is generally computed as the joint venture partner’s ownership percentage. All intercompany balances and transactions have been eliminated in consolidation.
The Company consolidates partially owned entities, in which it has a controlling financial interest. In determining whether the Company has a controlling financial interest in a partially owned entity and the requirement to consolidate the accounts of that entity, the Company considers whether the entity is a variable interest entity (“VIE”) and whether it is the primary beneficiary. The Company is the primary beneficiary of a VIE when it has (i) the power to direct the most significant activities impacting the economic performance of the VIE and (ii) the obligation to absorb losses or receive benefits significant to the VIE. BREIT OP and each of the Company’s joint ventures are considered to be a VIE. The Company consolidates these entities because it has the ability to direct the most significant activities of the entities such as purchases, dispositions, financings, budgets, and overall operating plans.
5
As of March 31, 2018, the total assets and liabilities of the Company’s consolidated VIEs, excluding BREIT OP, were $1.1 billion and $725.6 million, respectively, compared to $947.9 million and $645.5 million as of December 31, 2017. Such amounts are included on the Company’s Consolidated Balance Sheets.
The preparation of the financial statements in conformity with GAAP requires management to make estimates and assumptions that affect the reported amounts of assets and liabilities and disclosures of contingent assets and liabilities at the date of the balance sheet. Actual results could differ from those estimates.
Restricted Cash
As of March 31, 2018 and December 31, 2017, restricted cash primarily consists of $150.2 million and $107.6 million, respectively, of cash received for subscriptions prior to the date in which the subscriptions are effective. The Company’s restricted cash is held primarily in a bank account controlled by the Company’s transfer agent but in the name of the Company.
Fair Value Measurement
Under normal market conditions, the fair value of an investment is the amount that would be received to sell an asset or transfer a liability in an orderly transaction between market participants at the measurement date (i.e., the exit price). Additionally, there is a hierarchal framework that prioritizes and ranks the level of market price observability used in measuring investments at fair value. Market price observability is impacted by a number of factors, including the type of investment and the characteristics specific to the investment and the state of the marketplace, including the existence and transparency of transactions between market participants. Investments with readily available active quoted prices or for which fair value can be measured from actively quoted prices generally will have a higher degree of market price observability and a lesser degree of judgment used in measuring fair value.
Investments measured and reported at fair value are classified and disclosed in one of the following levels within the fair value hierarchy:
Level 1 — quoted prices are available in active markets for identical investments as of the measurement date. The Company does not adjust the quoted price for these investments.
Level 2 — quoted prices are available in markets that are not active or model inputs are based on inputs that are either directly or indirectly observable as of the measurement date.
Level 3 — pricing inputs are unobservable and include instances where there is minimal, if any, market activity for the investment. These inputs require significant judgment or estimation by management or third parties when determining fair value and generally represent anything that does not meet the criteria of Levels 1 and 2. Due to the inherent uncertainty of these estimates, these values may differ materially from the values that would have been used had a ready market for these investments existed.
As of March 31, 2018 and December 31, 2017, the Company’s $1.1 billion and $915.7 million, respectively, of investments in real estate-related securities were classified as Level 2.
Valuation
The Company’s investments in real estate-related securities are reported at fair value. As of March 31, 2018, the Company’s investments in real estate-related securities consisted of commercial mortgage-backed securities (“CMBS”), which are mortgage-related fixed income securities. Mortgage-related securities are usually issued as separate tranches, or classes, of securities within each deal. The Company generally determines the fair value of its CMBS by utilizing third-party pricing service providers and broker-dealer quotations on the basis of last available bid price.
In determining the fair value of a particular investment, pricing service providers may use broker-dealer quotations, reported trades or valuation estimates from their internal pricing models to determine the reported price. The pricing service providers’ internal models for mortgage-related securities such as CMBS usually consider the attributes applicable to a particular class of the security (e.g., credit rating, seniority), current market data, and estimated cash flows for each class and incorporate deal collateral performance such as prepayment speeds and default rates, as available.
6
As of March 31, 2018, the fair value of the Company’s mortgage notes, term loans, and revolving credit facilities, repurchase agreements, and affiliate line of credit was approximately $10.2 million below carrying value. Fair value of the Company’s indebtedness is estimated by modeling the cash flows required by the Company’s debt agreements and discounting them back to the present value using the appropriate discount rate. Additionally, the Company considers current market rate and conditions by evaluating similar borrowing agreements with comparable loan-to-value ratios and credit profiles. The inputs used in determining the fair value of the Company’s indebtedness are considered Level 3.
Recent Accounting Pronouncements
In May 2014, the FASB issued ASU 2014-09, “Revenue from Contracts with Customers (Topic 606).” ASU 2014-09 broadly amends the accounting guidance for revenue recognition. ASU 2014-09 is effective for the first interim or annual period beginning after December 15, 2017, and is to be applied retrospectively. The Company adopted ASU 2014-09 in the first quarter of 2018 and it did not have a material impact on the Company’s consolidated financial statements.
In February 2016, the FASB issued ASU 2016-02, “Leases,” which will require organizations that lease assets to recognize the assets and liabilities for the rights and obligations created by those leases on their balance sheet. Additional disclosure regarding a company’s leasing activities will also be expanded under the new guidance. In March 2018, the FASB approved an amendment to the new Leases standard that allows a practical expedient for lessors from separating lease and non-lease components. For public entities, ASU 2016-02 is effective for fiscal years beginning after December 15, 2018, including interim periods within those fiscal years, and requires a modified retrospective transition. The Company is currently evaluating the potential impact of this pronouncement on the Company’s consolidated financial statements from both a lessor and lessee standpoint. Under the new leasing standard, lessor accounting remains substantially the same as current GAAP. The new lease standard will have a significant impact on lessee accounting. As such, the Company will be required to recognize a right of use asset on the Company’s consolidated balance sheet along with a lease liability equal to the present value of the remaining minimum lease payments for the Company’s ground leases.
3. Investments in Real Estate
Investments in real estate, net consisted of the following ($ in thousands):
|
|
|
March 31, 2018 |
|
|
December 31, 2017 |
|
||
|
Building and building improvements |
|
$ |
4,396,881 |
|
|
$ |
2,815,348 |
|
|
Land and land improvements |
|
|
1,006,925 |
|
|
|
574,253 |
|
|
Furniture, fixtures and equipment |
|
|
67,779 |
|
|
|
64,080 |
|
|
Total |
|
|
5,471,585 |
|
|
|
3,453,681 |
|
|
Accumulated depreciation |
|
|
(80,911 |
) |
|
|
(47,126 |
) |
|
Investments in real estate, net |
|
$ |
5,390,674 |
|
|
$ |
3,406,555 |
|
During the three months ended March 31, 2018, the Company acquired interests in three real estate investments, which were comprised of 149 industrial and eight residential properties.
The following table provides further details of the properties acquired during the three months ended March 31, 2018 ($ in thousands):
|
Investment |
|
Ownership Interest(1) |
|
|
Number of Properties |
|
|
Location |
|
Sector |
|
Acquisition Date |
|
Purchase Price(2) |
|
|||
|
Aston Multifamily Portfolio(3) |
|
90% |
|
|
|
8 |
|
|
Various(4) |
|
Residential |
|
Jan. 2018 |
|
$ |
141,743 |
|
|
|
Kraft Chicago Industrial Portfolio |
|
100% |
|
|
|
3 |
|
|
Aurora, IL |
|
Industrial |
|
Jan. 2018 |
|
|
151,365 |
|
|
|
Canyon Industrial Portfolio(5) |
|
100% |
|
|
|
146 |
|
|
Various(5) |
|
Industrial |
|
Mar. 2018 |
|
|
1,837,061 |
|
|
|
|
|
|
|
|
|
|
157 |
|
|
|
|
|
|
|
|
$ |
2,130,169 |
|
|
(1) |
Certain of the investments made by BREIT provide the seller or the other partner a profits interest based on certain internal rate of return hurdles being achieved. |
|
(2) |
Purchase price is inclusive of acquisition related costs. |
|
(3) |
The Aston Multifamily Portfolio closed in two stages and the final eight properties closed in January 2018. The first closing in November 2017 included 12 properties. |
|
(4) |
The Aston Multifamily Portfolio is located in four markets: Austin/San Antonio, Texas (49% of units), Dallas/Fort Worth, Texas (25%), Nashville, Tennessee (22%) and Louisville, Kentucky (4%). |
|
(5) |
The Canyon Industrial Portfolio consists of 146 industrial properties primarily concentrated in Chicago (18% of March 2018 base rent), Dallas (13%), Baltimore/Washington, D.C. (12%), Los Angeles/Inland Empire (8%), South/Central Florida (7%), New Jersey (7%), and Denver (6%). |
7
The following table summarizes the purchase price allocation for the properties acquired during the three months ended March 31, 2018 ($ in thousands):
|
|
|
Canyon Industrial Portfolio |
|
|
All Other |
|
|
Total |
|
|||
|
Building and building improvements |
|
$ |
1,362,764 |
|
|
$ |
214,026 |
|
|
$ |
1,576,790 |
|
|
Land and land improvements |
|
|
376,762 |
|
|
|
55,325 |
|
|
|
432,087 |
|
|
Furniture, fixtures and equipment |
|
|
— |
|
|
|
1,920 |
|
|
|
1,920 |
|
|
In-place lease intangibles |
|
|
109,031 |
|
|
|
20,369 |
|
|
|
129,400 |
|
|
Above-market lease intangibles |
|
|
8,459 |
|
|
|
3,122 |
|
|
|
11,581 |
|
|
Below-market lease intangibles |
|
|
(19,955 |
) |
|
|
(1,654 |
) |
|
|
(21,609 |
) |
|
Total purchase price |
|
|
1,837,061 |
|
|
|
293,108 |
|
|
|
2,130,169 |
|
|
Assumed mortgage notes(1) |
|
|
— |
|
|
|
67,140 |
|
|
|
67,140 |
|
|
Net purchase price |
|
$ |
1,837,061 |
|
|
$ |
225,968 |
|
|
$ |
2,063,029 |
|
|
(1) |
Refer to Note 6 for additional details on the Company’s mortgage notes. |
The weighted-average amortization periods for the acquired in-place lease intangibles, above-market lease intangibles, and below-market lease intangibles of the properties acquired during the three months ended March 31, 2018 were 5 years.
4. Intangibles
The gross carrying amount and accumulated amortization of the Company’s intangible assets and liabilities consisted of the following ($ in thousands):
|
|
|
March 31, 2018 |
|
|
December 31, 2017 |
|
||
|
Intangible assets: |
|
|
|
|
|
|
|
|
|
In-place lease intangibles |
|
$ |
230,761 |
|
|
$ |
131,833 |
|
|
Below-market ground lease intangibles |
|
|
4,623 |
|
|
|
4,623 |
|
|
Above-market lease intangibles |
|
|
18,251 |
|
|
|
6,670 |
|
|
Prepaid ground lease rent |
|
|
16,114 |
|
|
|
16,114 |
|
|
Other |
|
|
676 |
|
|
|
676 |
|
|
Total intangible assets |
|
|
270,425 |
|
|
|
159,916 |
|
|
Accumulated amortization: |
|
|
|
|
|
|
|
|
|
In-place lease amortization |
|
|
(54,936 |
) |
|
|
(45,160 |
) |
|
Below-market ground lease amortization |
|
|
(103 |
) |
|
|
(85 |
) |
|
Above-market lease amortization |
|
|
(1,266 |
) |
|
|
(600 |
) |
|
Prepaid ground lease rent amortization |
|
|
(208 |
) |
|
|
(151 |
) |
|
Other |
|
|
(119 |
) |
|
|
(76 |
) |
|
Total accumulated amortization |
|
|
(56,632 |
) |
|
|
(46,072 |
) |
|
Intangible assets, net |
|
$ |
213,793 |
|
|
$ |
113,844 |
|
|
Intangible liabilities: |
|
|
|
|
|
|
|
|
|
Below-market lease intangibles |
|
$ |
36,529 |
|
|
$ |
14,920 |
|
|
Accumulated amortization |
|
|
(3,053 |
) |
|
|
(1,764 |
) |
|
Intangible liabilities, net |
|
$ |
33,476 |
|
|
$ |
13,156 |
|
8
The estimated future amortization on the Company’s intangibles for each of the next five years and thereafter as of March 31, 2018 is as follows ($ in thousands):
|
|
|
In-place Lease Intangibles |
|
|
Below-market Ground Lease Intangibles |
|
|
Above-market Lease Intangibles |
|
|
Pre-paid Ground Lease Intangibles |
|
|
Below-market Lease Intangibles |
|
|||||
|
2018 (remaining) |
|
$ |
53,876 |
|
|
$ |
59 |
|
|
$ |
3,469 |
|
|
$ |
171 |
|
|
$ |
(7,103 |
) |
|
2019 |
|
|
37,398 |
|
|
|
79 |
|
|
|
4,088 |
|
|
|
227 |
|
|
|
(8,007 |
) |
|
2020 |
|
|
27,799 |
|
|
|
79 |
|
|
|
3,156 |
|
|
|
227 |
|
|
|
(6,128 |
) |
|
2021 |
|
|
20,503 |
|
|
|
79 |
|
|
|
2,563 |
|
|
|
227 |
|
|
|
(4,389 |
) |
|
2022 |
|
|
14,437 |
|
|
|
79 |
|
|
|
1,992 |
|
|
|
227 |
|
|
|
(3,182 |
) |
|
Thereafter |
|
|
21,812 |
|
|
|
4,145 |
|
|
|
1,717 |
|
|
|
14,827 |
|
|
|
(4,667 |
) |
|
|
|
$ |
175,825 |
|
|
$ |
4,520 |
|
|
$ |
16,985 |
|
|
$ |
15,906 |
|
|
$ |
(33,476 |
) |
5. Investments in Real Estate-Related Securities
The following tables detail the Company’s investments in real estate-related debt securities, which are exclusively CMBS ($ in thousands):
|
|
|
|
|
|
|
|
|
March 31, 2018 |
|
|||||||||||||
|
Number of Positions |
|
|
Credit Rating(1) |
|
Collateral |
|
Weighted Average Coupon(2) |
|
Weighted Average Maturity Date |
|
Face Amount |
|
|
Cost Basis |
|
|
Fair Value |
|
||||
|
|
21 |
|
|
BB |
|
Residential, Hospitality, Office, Industrial, Retail |
|
L+3.05% |
|
2/24/2034 |
|
$ |
484,163 |
|
|
$ |
483,617 |
|
|
$ |
485,254 |
|
|
|
13 |
|
|
B |
|
Hospitality, Office, Residential, Retail |
|
L+3.76% |
|
6/9/2035 |
|
|
391,062 |
|
|
|
390,138 |
|
|
|
391,915 |
|
|
|
11 |
|
|
BBB |
|
Hospitality, Office, Residential |
|
L+2.19% |
|
11/1/2033 |
|
|
151,778 |
|
|
|
151,741 |
|
|
|
152,423 |
|
|
|
6 |
|
|
Other |
|
Residential |
|
L+2.28% |
|
2/6/2026 |
|
|
31,814 |
|
|
|
31,814 |
|
|
|
31,873 |
|
|
|
51 |
|
|
|
|
|
|
|
|
|
|
$ |
1,058,817 |
|
|
$ |
1,057,310 |
|
|
$ |
1,061,465 |
|
|
|
|
|
|
|
|
|
|
December 31, 2017 |
|
|||||||||||||
|
Number of Positions |
|
|
Credit Rating(1) |
|
Collateral |
|
Weighted Average Coupon(2) |
|
Weighted Average Maturity Date |
|
Face Amount |
|
|
Cost Basis |
|
|
Fair Value |
|
||||
|
|
15 |
|
|
BB |
|
Hospitality, Office, Residential, Retail |
|
L+3.21% |
|
2/1/2033 |
|
$ |
423,770 |
|
|
$ |
423,658 |
|
|
$ |
424,419 |
|
|
|
10 |
|
|
B |
|
Hospitality, Office, Residential |
|
L+4.05% |
|
6/27/2034 |
|
|
284,371 |
|
|
|
284,127 |
|
|
|
285,037 |
|
|
|
9 |
|
|
BBB |
|
Office, Hospitality, Residential, Industrial, Retail |
|
L+2.28% |
|
8/17/2032 |
|
|
194,013 |
|
|
|
193,838 |
|
|
|
194,549 |
|
|
|
3 |
|
|
Other |
|
Residential |
|
L+2.50% |
|
9/15/2026 |
|
|
11,749 |
|
|
|
11,749 |
|
|
|
11,737 |
|
|
|
37 |
|
|
|
|
|
|
|
|
|
|
$ |
913,903 |
|
|
$ |
913,372 |
|
|
$ |
915,742 |
|
|
|
(1) |
BBB represents credit ratings of BBB+, BBB, and BBB-, BB represents credit ratings of BB+, BB, and BB-, and B represents credit ratings of B+, B, and B-. Other consists of investments that, as of March 31, 2018 and December 31, 2017, were either not ratable or have not been submitted to rating agencies. |
|
|
(2) |
The term “L” refers to the three-month U.S. dollar-denominated London Interbank Offer Rate (“LIBOR”). As of March 31, 2018 and December 31, 2017, three-month LIBOR was equal to 2.3% and 1.7%, respectively. |
9
The Company’s investments in real estate-related securities included CMBS collateralized by properties owned by Blackstone-advised investment vehicles and CMBS collateralized by a loan originated by a Blackstone-advised investment vehicle. The following table details the Company’s affiliate CMBS positions ($ in thousands):
|
|
|
|
|
|
|
|
|
|
|
|
|
|
||||
|
|
|
As of March 31, 2018 |
|
|
As of December 31, 2017 |
|
|
Three Months Ended March 31, 2018 |
|
|
Three Months Ended March 31, 2017 |
|
||||
|
|
|
Cost Basis |
|
|
Cost Basis |
|
|
Interest Income |
|
|
Interest Income |
|
||||
|
CMBS collateralized by properties |
|
$ |
596,945 |
|
|
$ |
559,616 |
|
|
$ |
7,024 |
|
|
$ |
25 |
|
|
CMBS collateralized by a loan |
|
|
63,533 |
|
|
|
63,533 |
|
|
|
686 |
|
|
|
— |
|
|
Total |
|
$ |
660,478 |
|
|
$ |
623,149 |
|
|
$ |
7,710 |
|
|
$ |
25 |
|
For additional information regarding the Company’s investments in affiliated CMBS, see Note 5 to the Company’s Annual Report on Form 10-K for the year ended December 31, 2017. The terms and conditions of such affiliated CMBS held as of March 31, 2018 are consistent with the terms described in such Note.
During the three months ended March 31, 2018, the borrower paid off three of the Company’s CMBS with a total cost basis of $115.6 million collateralized by a property owned by a Blackstone-advised investment vehicle, which did not result in a gain or loss on the Company’s Consolidated Statement of Operations.
During the three months ended March 31, 2018 and 2017, the Company recorded an unrealized gain of $1.8 million and $0.7 million, respectively, as a component of Income from Real Estate-Related Securities on the Company’s Consolidated Statements of Operations. The Company did not sell any real estate-related debt securities during the three months ended March 31, 2018 and 2017.
6. Mortgage Notes, Term Loans, and Revolving Credit Facilities
The following table is a summary of the mortgage notes, term loans, and revolving credit facilities secured by the Company’s properties ($ in thousands):
|
|
|
|
|
|
|
|
|
|
|
|
|
Principal Balance Outstanding(3) |
|
|||||
|
Indebtedness |
|
Weighted Average Interest Rate(1) |
|
|
Weighted Average Maturity Date(2) |
|
Maximum Facility Size |
|
|
March 31, 2018 |
|
|
December 31, 2017 |
|
||||
|
Fixed rate loans |
|
|
|
|
|
|
|
|
|
|
|
|
|
|
|
|
|
|
|
Fixed rate mortgages |
|
3.92% |
|
|
2/19/2025 |
|
N/A |
|
|
$ |
2,720,955 |
|
|
$ |
1,468,294 |
|
||
|
Canyon Industrial Portfolio Mezzanine Loan |
|
5.85% |
|
|
4/5/2025 |
|
N/A |
|
|
|
200,000 |
|
|
|
— |
|
||
|
Total fixed rate loans |
|
4.06% |
|
|
2/22/2025 |
|
|
|
|
|
|
2,920,955 |
|
|
|
1,468,294 |
|
|
|
Variable rate loans |
|
|
|
|
|
|
|
|
|
|
|
|
|
|
|
|
|
|
|
BAML Industrial Term Loan(4) |
|
L+2.00% |
|
|
6/1/2022 |
|
N/A |
|
|
|
236,000 |
|
|
|
186,000 |
|
||
|
BAML Revolving Credit Facility(4) |
|
L+2.00% |
|
|
6/1/2022 |
|
$ |
236,000 |
|
|
|
236,000 |
|
|
|
186,000 |
|
|
|
Citi Revolving Credit Facility(5) |
|
L+2.25% |
|
|
10/26/2020 |
|
|
300,000 |
|
|
|
178,831 |
|
|
|
178,831 |
|
|
|
Floating rate mortgage |
|
L+2.18% |
|
|
5/9/2022 |
|
N/A |
|
|
|
63,600 |
|
|
|
63,600 |
|
||
|
Capital One Term Loan(6) |
|
L+1.80% |
|
|
12/12/2022 |
|
N/A |
|
|
|
22,500 |
|
|
|
22,500 |
|
||
|
Capital One Revolving Credit Facility(6) |
|
L+1.80% |
|
|
12/12/2022 |
|
|
20,600 |
|
|
|
20,600 |
|
|
|
20,600 |
|
|
|
Total variable rate loans |
|
3.95% |
|
|
1/23/2022 |
|
|
|
|
|
|
757,531 |
|
|
|
657,531 |
|
|
|
Total loans secured by the Company’s properties |
|
4.03% |
|
|
7/5/2024 |
|
|
|
|
|
|
3,678,486 |
|
|
|
2,125,825 |
|
|
|
Deferred financing costs, net |
|
|
|
|
|
|
|
|
|
|
|
|
(25,583 |
) |
|
|
(16,075 |
) |
|
Premium on assumed debt, net |
|
|
|
|
|
|
|
|
|
|
|
|
1,494 |
|
|
|
1,541 |
|
|
Mortgage notes, term loans, and revolving credit facilities, net |
|
|
|
|
|
$ |
3,654,397 |
|
|
$ |
2,111,291 |
|
||||||
|
|
(1) |
The term “L” refers to the one-month LIBOR. As of March 31, 2018 and December 31, 2017, one-month LIBOR was equal to 1.9% and 1.6%, respectively. |
|
|
(2) |
For loans where the Company, at its sole discretion, has extension options, the maximum maturity date has been assumed. |
|
|
(3) |
The majority of the Company’s mortgages contain yield or spread maintenance provisions. In addition, the majority of the Company’s loans are interest only except for certain loans with amortization provisions after a certain period of time. |
|
|
(4) |
The BAML Industrial Term Loan and BAML Revolving Credit Facility are secured by certain of the Company’s industrial assets. |
|
|
(5) |
The Citi Revolving Credit Facility is secured by the Company’s hotel investments. |
|
|
(6) |
The Capital One Term Loan and Capital One Revolving Credit Facility are secured by one of the Company’s industrial assets. |
10
The following table presents the future principal payments due under the Company’s mortgage notes, term loans, and revolving credit facilities as of March 31, 2018 ($ in thousands):
|
Year |
|
Amount |
|
|
|
2018 (remaining) |
|
$ |
1,911 |
|
|
2019 |
|
|
16,921 |
|
|
2020 |
|
|
196,665 |
|
|
2021 |
|
|
5,029 |
|
|
2022 |
|
|
588,168 |
|
|
Thereafter |
|
|
2,869,792 |
|
|
Total |
|
$ |
3,678,486 |
|
7. Repurchase Agreements
The Company has entered into master repurchase agreements with Citigroup Global Markets Inc. (the “Citi MRA”), Royal Bank of Canada (the “RBC MRA”), and Bank of America Merrill Lynch (the “BAML MRA”) to provide the Company with additional financing capacity secured by the Company’s $1.1 billion of investments in real estate-related securities. The terms of the Citi MRA, RBC MRA, and BAML MRA provide the lenders the ability to determine the size and terms of the financing provided based upon the particular collateral pledged by the Company from time-to-time.
The following tables are a summary of the Company’s repurchase agreements ($ in thousands):
|
|
|
March 31, 2018 |
||||||||||||||
|
Facility |
|
Weighted Average Interest Rate(1) |
|
Weighted Average Maturity Date(2) |
|
Security Interests |
|
Collateral Assets(3) |
|
|
Outstanding Balance |
|
|
Prepayment Provisions |
||
|
Citi MRA |
|
L+1.57% |
|
9/6/2018 |
|
CMBS |
|
$ |
620,122 |
|
|
$ |
458,335 |
|
|
None |
|
RBC MRA |
|
L+1.46% |
|
11/3/2018 |
|
CMBS |
|
|
415,098 |
|
|
|
331,123 |
|
|
None |
|
BAML MRA |
|
L+1.12% |
|
5/9/2018 |
|
CMBS |
|
|
26,245 |
|
|
|
20,820 |
|
|
None |
|
|
|
|
|
|
|
|
|
$ |
1,061,465 |
|
|
$ |
810,278 |
|
|
|
|
|
|
December 31, 2017 |
||||||||||||||
|
Facility |
|
Weighted Average Interest Rate(1) |
|
Weighted Average Maturity Date(2) |
|
Security Interests |
|
Collateral Assets(3) |
|
|
Outstanding Balance |
|
|
Prepayment Provisions |
||
|
Citi MRA |
|
L+1.57% |
|
8/23/2018 |
|
CMBS |
|
$ |
694,808 |
|
|
$ |
512,975 |
|
|
None |
|
RBC MRA |
|
L+1.54% |
|
11/24/2018 |
|
CMBS |
|
|
194,918 |
|
|
|
150,238 |
|
|
None |
|
BAML MRA |
|
L+1.16% |
|
2/9/2018 |
|
CMBS |
|
|
26,016 |
|
|
|
19,635 |
|
|
None |
|
|
|
|
|
|
|
|
|
$ |
915,742 |
|
|
$ |
682,848 |
|
|
|
|
|
(1) |
The term “L” refers to the one-month or three-month LIBOR. As of March 31, 2018 and December 31, 2017, one-month LIBOR was 1.9% and 1.6%, respectively, and three-month LIBOR was equal to 2.3% and 1.7%, respectively. |
|
|
(2) |
Subsequent to quarter end, the Company rolled its repurchase agreement contracts expiring in April and May 2018 into new one month contracts. |
|
|
(3) |
Represents the fair value of the Company’s investments in real estate-related securities. |
11
8. Other Assets and Other Liabilities
The following table summarizes the components of other assets ($ in thousands):
|
|
|
March 31, 2018 |
|
|
December 31, 2017 |
|
||
|
Real estate intangibles, net |
|
$ |
213,793 |
|
|
$ |
113,844 |
|
|
Receivables |
|
|
17,015 |
|
|
|
7,386 |
|
|
Prepaid expenses |
|
|
8,566 |
|
|
|
3,267 |
|
|
Pre-acquisition costs |
|
|
6,335 |
|
|
|
6,588 |
|
|
Deferred financing costs, net |
|
|
5,454 |
|
|
|
5,248 |
|
|
Straight-line rent receivable |
|
|
3,134 |
|
|
|
2,045 |
|
|
Deferred leasing commissions, net |
|
|
1,384 |
|
|
|
1,193 |
|
|
Other |
|
|
4,388 |
|
|
|
5,711 |
|
|
Total |
|
$ |
260,069 |
|
|
$ |
145,282 |
|
The following table summarizes the components of accounts payable, accrued expenses, and other liabilities ($ in thousands):
|
|
|
March 31, 2018 |
|
|
December 31, 2017 |
|
||
|
Subscriptions received in advance |
|
$ |
150,213 |
|
|
$ |
107,576 |
|
|
Intangible liabilities, net |
|
|
33,476 |
|
|
|
13,156 |
|
|
Accounts payable and accrued expenses |
|
|
20,876 |
|
|
|
13,202 |
|
|
Real estate taxes payable |
|
|
25,989 |
|
|
|
13,169 |
|
|
Tenant security deposits |
|
|
14,477 |
|
|
|
8,107 |
|
|
Prepaid rental income |
|
|
13,700 |
|
|
|
5,381 |
|
|
Distribution payable |
|
|
10,782 |
|
|
|
7,716 |
|
|
Accrued interest expense |
|
|
9,448 |
|
|
|
8,072 |
|
|
Other |
|
|
23,558 |
|
|
|
6,456 |
|
|
Total |
|
$ |
302,519 |
|
|
$ |
182,835 |
|
9. Equity and Redeemable Non-controlling Interest
Common Stock
As of March 31, 2018, the Company had sold 227.5 million shares of its common stock in the Offering for aggregate net proceeds of $2.3 billion. The following table details the movement in the Company’s outstanding shares of common stock (in thousands):
|
|
|
Three months ended March 31, 2018 |
|
|||||||||||||||||
|
|
|
Class S |
|
|
Class T |
|
|
Class D |
|
|
Class I |
|
|
Total |
|
|||||
|
December 31, 2017 |
|
|
130,085 |
|
|
|
5,625 |
|
|
|
3,955 |
|
|
|
30,719 |
|
|
|
170,384 |
|
|
Common stock issued |
|
|
32,511 |
|
|
|
4,089 |
|
|
|
2,843 |
|
|
|
16,324 |
|
|
|
55,767 |
|
|
Distribution reinvestment |
|
|
1,104 |
|
|
|
46 |
|
|
|
42 |
|
|
|
362 |
|
|
|
1,554 |
|
|
Common stock repurchased |
|
|
(145 |
) |
|
|
(1 |
) |
|
|
— |
|
|
|
(70 |
) |
|
|
(216 |
) |
|
March 31, 2018 |
|
|
163,555 |
|
|
|
9,759 |
|
|
|
6,840 |
|
|
|
47,335 |
|
|
|
227,489 |
|
Share Repurchase Plan
The Company has adopted a share repurchase plan whereby, subject to certain limitations, stockholders may request on a monthly basis that the Company repurchases all or any portion of their shares. For the three months ended March 31, 2018, the Company repurchased 216,087 shares of common stock representing a total of $2.3 million. The Company had no unfulfilled repurchase requests during the three months ended March 31, 2018.
Distributions
The Company generally intends to distribute substantially all of its taxable income, which does not necessarily equal net income as calculated in accordance with GAAP, to its stockholders each year to comply with the REIT provisions of the Internal Revenue Code.
12
The following table details the aggregate distributions declared for each applicable class of common stock for the three months ended March 31, 2018 ($ in thousands, except share and per share data):
|
|
|
Class S |
|
|
Class T |
|
|
Class D |
|
|
Class I |
|
||||
|
Aggregate gross distributions declared per share of common stock |
|
$ |
0.1552 |
|
|
$ |
0.1552 |
|
|
$ |
0.1552 |
|
|
$ |
0.1552 |
|
|
Stockholder servicing fee per share of common stock |
|
|
(0.0223 |
) |
|
|
(0.0220 |
) |
|
|
(0.0065 |
) |
|
|
— |
|
|
Net distributions declared per share of common stock |
|
$ |
0.1329 |
|
|
$ |
0.1332 |
|
|
$ |
0.1487 |
|
|
$ |
0.1552 |
|
Redeemable Non-controlling Interest
During 2017, the Special Limited Partner earned a performance participation allocation in the amount of $17.0 million. On January 1, 2018 the Company issued 1.6 million Class I units in BREIT OP to the Special Limited Partner as payment for the 2017 performance participation allocation based on the Company’s Net Asset Value at December 31, 2017. Because the Special Limited Partner has the ability to redeem these units for Class I shares in the Company or cash, at the election of the Special Limited Partner, the Company has classified these Class I units as Redeemable Non-controlling Interest in mezzanine equity on the Company’s Consolidated Balance Sheets. The Redeemable Non-controlling Interest is recorded at the greater of the carrying amount, adjusted for their share of the allocation of income or loss and dividends, or the redemption value, which is equivalent to fair value, of such units at the end of each measurement period. As the redemption value was greater than the adjusted carrying value at March 31, 2018, the Company recorded an allocation adjustment of $0.9 million between Additional Paid-in Capital and Redeemable Non-controlling Interest.
10. Related Party Transactions
Management Fee and Performance Participation Allocation
The Adviser is entitled to an annual management fee equal to 1.25% of the Company’s NAV, payable monthly, as compensation for the services it provides to the Company. The management fee can be paid, at the Adviser’s election, in cash, shares of common stock, or BREIT OP units. The Adviser has elected to receive the management fee in shares of the Company’s common stock to date. During the three months ended March 31, 2018, the Company incurred a management fee of $7.0 million. The Company issued 413,466 unregistered Class I shares to the Adviser as payment for such management fee and also had a payable of $2.6 million related to management fees as of March 31, 2018, which is included in Due to Affiliates on the Company’s Consolidated Balance Sheets. During April 2018, the Adviser was issued 240,867 unregistered Class I shares as payment for the $2.6 million management fee accrued as of March 31, 2018. The shares issued to the Adviser for payment of the management fee were issued at the applicable NAV per share at the end of each month for which the fee was earned. In accordance with the advisory agreement between the Company, BREIT OP and the Adviser, the Adviser waived management fees for the period January 1, 2017 to June 30, 2017, as such no management fee was incurred during the three months ended March 31, 2017.
Additionally, the Special Limited Partner holds a performance participation interest in BREIT OP that entitles it to receive an allocation of BREIT OP’s total return to its capital account. During the three months ended March 31, 2018, the Company recognized $7.9 million of Performance Participation Allocation Expense in the Company’s Consolidated Statement of Operations as the participation hurdle was achieved as of March 31, 2018.
Due to Affiliates
The following table details the components of due to affiliates ($ in thousands):
|
|
|
March 31, 2018 |
|
|
December 31, 2017 |
|
||
|
Accrued stockholder servicing fee(1) |
|
$ |
130,944 |
|
|
$ |
102,076 |
|
|
Advanced organization and offering costs |
|
|
9,652 |
|
|
|
10,160 |
|
|
Performance participation allocation |
|
|
7,873 |
|
|
|
16,974 |
|
|
Accrued management fee |
|
|
2,569 |
|
|
|
1,904 |
|
|
Accrued affiliate service provider expenses |
|
|
1,113 |
|
|
|
1,485 |
|
|
Advanced expenses |
|
|
1,019 |
|
|
|
472 |
|
|
Total |
|
$ |
153,170 |
|
|
$ |
133,071 |
|
13
|
|
Company’s shares in the Offering, which provide, among other things, for the re-allowance of the full amount of the selling commissions and dealer manager fee and all or a portion of the stockholder servicing fees received by the Dealer Manager to such selected dealers. |
Accrued affiliate service provider expenses
During the three months ended March 31, 2018 and 2017, the Company incurred expenses to affiliated service providers for services incurred in connection with its investments as well as any amounts the Company capitalized for transaction support services provided. Such amounts are included in the Company’s Consolidated Statements of Operations and Consolidated Balance Sheets, respectively. For further details on the Company’s relationships with the below affiliated service providers, see Note 11 to the Company’s Annual Report on Form 10-K for the year ended December 31, 2017.
The following table details the expenses incurred as well as any capitalized transaction costs ($ in thousands):
|
|
|
Affiliate Service Provider Expenses |
|
|
Capitalized Transaction Support Fees(1) |
|
||||||||||
|
|
|
For the Three Months Ended March 31, |
|
|
For the Three Months Ended March 31, |
|
||||||||||
|
|
|
2018 |
|
|
2017 |
|
|
2018 |
|
|
2017 |
|
||||
|
LivCor, LLC |
|
$ |
1,143 |
|
|
$ |
— |
|
|
$ |
— |
|
|
$ |
— |
|
|
Gateway Industrial Properties L.L.C. |
|
|
405 |
|
|
|
— |
|
|
|
179 |
|
|
|
— |
|
|
ShopCore Properties TRS Management LLC |
|
|
240 |
|
|
|
— |
|
|
|
— |
|
|
|
— |
|
|
BRE Hotels and Resorts LLC |
|
|
147 |
|
|
|
5 |
|
|
|
— |
|
|
|
— |
|
|
Equity Office Management, L.L.C. |
|
|
— |
|
|
|
10 |
|
|
|
— |
|
|
|
— |
|
|
Total |
|
$ |
1,935 |
|
|
$ |
15 |
|
|
$ |
179 |
|
|
$ |
— |
|
|
|
(1) |
Transaction support fees were capitalized to Investments in Real Estate on the Company’s Consolidated Balance Sheets. |
Beginning January 1, 2018, the Company engaged Gateway Industrial Properties L.L.C., a portfolio company owned by a Blackstone-advised fund, to provide the services that Equity Office Management, L.L.C. had previously provided to the Company’s industrial properties. For further detail on these affiliate relationships, see Note 11 to the Company’s Annual Report on Form 10-K for the year ended December 31, 2017.
During the three months ended March 31, 2018, the Company has not paid or accrued any incentive fees to its affiliated service providers.
Other
During the three months ended March 31, 2018, the Company paid Lexington National Land Services $0.2 million for title services related to one investment and such costs were capitalized to Investments in Real Estate on the Company’s Consolidated Balance Sheet. For additional information regarding this affiliate relationship, see Note 11 to the Company’s Annual Report on Form 10-K for the year ended December 31, 2017.
11. Commitments and Contingencies
As of March 31, 2018 and December 31, 2017, the Company was not subject to any material litigation nor is the Company aware of any material litigation threatened against it.
14
12. Five Year Minimum Rental Payments
The following table presents the future minimum rents the Company expects to receive for its industrial and retail properties ($ in thousands). Leases at the Company’s residential investments are short term, generally 12 months or less, and are therefore not included.
|
Year |
|
Future Minimum Rents |
|
|
|
2018 (remaining) |
|
$ |
114,781 |
|
|
2019 |
|
|
144,139 |
|
|
2020 |
|
|
126,244 |
|
|
2021 |
|
|
105,184 |
|
|
2022 |
|
|
83,726 |
|
|
Thereafter |
|
|
179,433 |
|
|
Total |
|
$ |
753,507 |
|
13. Segment Reporting
The Company operates in five reportable segments: Residential properties, Industrial properties, Hotel properties, Retail properties, and Real Estate-Related Securities. The Company allocates resources and evaluates results based on the performance of each segment individually. The Company believes that Segment Net Operating Income is the key performance metric that captures the unique operating characteristics of each segment.
The following table sets forth the total assets by segment ($ in thousands):
|
|
|
March 31, 2018 |
|
|
December 31, 2017 |
|
||
|
Residential |
|
$ |
2,674,960 |
|
|
$ |
2,567,735 |
|
|
Industrial |
|
|
2,657,117 |
|
|
|
636,900 |
|
|
Hotel |
|
|
280,068 |
|
|
|
281,242 |
|
|
Retail |
|
|
101,846 |
|
|
|
103,138 |
|
|
Real Estate-Related Securities |
|
|
1,070,962 |
|
|
|
918,975 |
|
|
Other (Corporate) |
|
|
160,923 |
|
|
|
117,318 |
|
|
Total assets |
|
$ |
6,945,876 |
|
|
$ |
4,625,308 |
|
15
The following table sets forth the financial results by segment for the three months ended March 31, 2018 ($ in thousands):
|
|
|
Residential |
|
|
Industrial |
|
|
Hotel |
|
|
Retail |
|
|
Real Estate- Related Securities |
|
|
Total |
|
||||||
|
Revenues: |
|
|
|
|
|
|
|
|
|
|
|
|
|
|
|
|
|
|
|
|
|
|
|
|
|
Rental revenue |
|
$ |
57,783 |
|
|
$ |
18,945 |
|
|
$ |
— |
|
|
$ |
1,785 |
|
|
$ |
— |
|
|
$ |
78,513 |
|
|
Tenant reimbursement income |
|
|
2,960 |
|
|
|
5,656 |
|
|
|
— |
|
|
|
432 |
|
|
|
— |
|
|
|
9,048 |
|
|
Hotel revenue |
|
|
— |
|
|
|
— |
|
|
|
17,821 |
|
|
|
— |
|
|
|
— |
|
|
|
17,821 |
|
|
Other revenue |
|
|
4,237 |
|
|
|
38 |
|
|
|
8 |
|
|
|
19 |
|
|
|
— |
|
|
|
4,302 |
|
|
Total revenues |
|
|
64,980 |
|
|
|
24,639 |
|
|
|
17,829 |
|
|
|
2,236 |
|
|
|
— |
|
|
|
109,684 |
|
|
|
|
|
|
|
|
|
|
|
|
|
|
|
|
|
|
|
|
|
|
|
|
|
|
|
|
Expenses: |
|
|
|
|
|
|
|
|
|
|
|
|
|
|
|
|
|
|
|
|
|
|
|
|
|
Rental property operating |
|
|
30,620 |
|
|
|
7,185 |
|
|
|
— |
|
|
|
813 |
|
|
|
— |
|
|
|
38,618 |
|
|
Hotel operating |
|
|
— |
|
|
|
— |
|
|
|
11,614 |
|
|
|
— |
|
|
|
— |
|
|
|
11,614 |
|
|
Total expenses |
|
|
30,620 |
|
|
|
7,185 |
|
|
|
11,614 |
|
|
|
813 |
|
|
|
— |
|
|
|
50,232 |
|
|
Income from real estate-related securities |
|
|
— |
|
|
|
— |
|
|
|
— |
|
|
|
— |
|
|
|
13,235 |
|
|
|
13,235 |
|
|
Segment net operating income |
|
$ |
34,360 |
|
|
$ |
17,454 |
|
|
$ |
6,215 |
|
|
$ |
1,423 |
|
|
$ |
13,235 |
|
|
$ |
72,687 |
|
|
|
|
|
|
|
|
|
|
|
|
|
|
|
|
|
|
|
|
|
|
|
|
|
|
|
|
Depreciation and amortization |
|
$ |
55,873 |
|
|
$ |
13,998 |
|
|
$ |
3,210 |
|
|
$ |
1,043 |
|
|
$ |
— |
|
|
$ |
74,124 |
|
|
|
|
|
|
|
|
|
|
|
|
|
|
|
|
|
|
|
|
|
|
|
|
|
|
|
|
Other income (expense): |
|
|
|
|
|
|
|
|
|
|
|
|
|
|
|
|
|
|
|
|
|
|
|
|
|
General and administrative |
|
|
|
|
|
|
|
|
|
|
|
|
|
|
|
|
|
|
|
|
|
|
(2,045 |
) |
|
Management fee |
|
|
|
|
|
|
|
|
|
|
|
|
|
|
|
|
|
|
|
|
|
|
(6,969 |
) |
|
Performance participation allocation |
|
|
|
|
|
|
|
|
|
|
|
|
|
|
|
|
|
|
|
|
|
|
(7,873 |
) |
|
Interest income |
|
|
|
|
|
|
|
|
|
|
|
|
|
|
|
|
|
|
|
|
|
|
77 |
|
|
Interest expense |
|
|
|
|
|
|
|
|
|
|
|
|
|
|
|
|
|
|
|
|
|
|
(31,391 |
) |
|
Net loss |
|
|
|
|
|
|
|
|
|
|
|
|
|
|
|
|
|
|
|
|
|
$ |
(49,638 |
) |
|
Net loss attributable to non-controlling interests |
|
|
|
|
|
|
|
|
|
|
|
|
|
|
|
|
|
|
|
|
|
|
2,090 |
|
|
Net loss attributable to BREIT stockholders |
|
|
|
|
|
|
|
|
|
|
|
|
|
|
|
|
|
|
|
|
|
$ |
(47,548 |
) |
16
The following table sets forth the financial results by segment for the three months ended March 31, 2017 ($ in thousands):
|
|
|
Residential |
|
|
Industrial |
|
|
Hotel |
|
|
Retail |
|
|
Real Estate- Related Securities |
|
|
Total |
|
||||||
|
Revenues: |
|
|
|
|
|
|
|
|
|
|
|
|
|
|
|
|
|
|
|
|
|
|
|
|
|
Rental revenue |
|
$ |
520 |
|
|
$ |
359 |
|
|
$ |
— |
|
|
$ |
19 |
|
|
$ |
— |
|
|
$ |
898 |
|
|
Tenant reimbursement income |
|
|
25 |
|
|
|
42 |
|
|
|
— |
|
|
|
— |
|
|
|
— |
|
|
|
67 |
|
|
Hotel revenue |
|
|
— |
|
|
|
— |
|
|
|
1,426 |
|
|
|
— |
|
|
|
— |
|
|
|
1,426 |
|
|
Other revenue |
|
|
53 |
|
|
|
— |
|
|
|
— |
|
|
|
— |
|
|
|
— |
|
|
|
53 |
|
|
Total revenues |
|
|
598 |
|
|
|
401 |
|
|
|
1,426 |
|
|
|
19 |
|
|
|
— |
|
|
|
2,444 |
|
|
|
|
|
|
|
|
|
|
|
|
|
|
|
|
|
|
|
|
|
|
|
|
|
|
|
|
Expenses: |
|
|
|
|
|
|
|
|
|
|
|
|
|
|
|
|
|
|
|
|
|
|
|
|
|
Rental property operating |
|
|
218 |
|
|
|
86 |
|
|
|
— |
|
|
|
1 |
|
|
|
— |
|
|
|
305 |
|
|
Hotel operating |
|
|
— |
|
|
|
— |
|
|
|
840 |
|
|
|
— |
|
|
|
— |
|
|
|
840 |
|
|
Total segment expenses |
|
|
218 |
|
|
|
86 |
|
|
|
840 |
|
|
|
1 |
|
|
|
— |
|
|
|
1,145 |
|
|
Income from real estate-related securities |
|
|
— |
|
|
|
— |
|
|
|
— |
|
|
|
— |
|
|
|
866 |
|
|
|
866 |
|
|
Segment net operating income |
|
$ |
380 |
|
|
$ |
315 |
|
|
$ |
586 |
|
|
$ |
18 |
|
|
$ |
866 |
|
|
$ |
2,165 |
|
|
|
|
|
|
|
|
|
|
|
|
|
|
|
|
|
|
|
|
|
|
|
|
|
|
|
|
Depreciation and amortization |
|
$ |
358 |
|
|
$ |
227 |
|
|
$ |
495 |
|
|
$ |
10 |
|
|
$ |
— |
|
|
$ |
1,090 |
|
|
|
|
|
|
|
|
|
|
|
|
|
|
|
|
|
|
|
|
|
|
|
|
|
|
|
|
Other income (expense): |
|
|
|
|
|
|
|
|
|
|
|
|
|
|
|
|
|
|
|
|
|
|
|
|
|
General and administrative |
|
|
|
|
|
|
|
|
|
|
|
|
|
|
|
|
|
|
|
|
|
|
(2,686 |
) |
|
Interest income |
|
|
|
|
|
|
|
|
|
|
|
|
|
|
|
|
|
|
|
|
|
|
265 |
|
|
Other income |
|
|
|
|
|
|
|
|
|
|
|
|
|
|
|
|
|
|
|
|
|
|
79 |
|
|
Net loss |
|
|
|
|
|
|
|
|
|
|
|
|
|
|
|
|
|
|
|
|
|
$ |
(1,267 |
) |
|
Net loss attributable to non-controlling interests |
|
|
|
|
|
|
|
|
|
|
|
|
|
|
|
|
|
|
|
|
|
|
— |
|
|
Net loss attributable to BREIT stockholders |
|
|
|
|
|
|
|
|
|
|
|
|
|
|
|
|
|
|
|
|
|
$ |
(1,267 |
) |
14. Subsequent Events
Acquisitions
Subsequent to March 31, 2018, the Company acquired an aggregate of $321.2 million, exclusive of closing costs, of real estate across three separate transactions.
Subsequent to March 31, 2018, the Company purchased an aggregate of $213.1 million of real estate-related debt securities.
Status of the Offering
As of May 11, 2018, the Company had sold an aggregate of 271,629,863 shares of its common stock (consisting of 189,759,390 Class S shares, 13,250,755 Class T shares, 9,402,143 Class D shares, and 59,217,575 Class I shares) in the Offering resulting in net proceeds of $2.8 billion to the Company as payment for such shares.
17
References herein to “Blackstone Real Estate Income Trust,” “BREIT,” the “Company,” “we,” “us,” or “our” refer to Blackstone Real Estate Income Trust, Inc. and its subsidiaries unless the context specifically requires otherwise.
The following discussion should be read in conjunction with the unaudited consolidated financial statements and notes thereto appearing elsewhere in this quarterly report on Form 10-Q.
Forward-Looking Statements
This Form 10-Q contains forward-looking statements about our business, operations and financial performance, including, in particular, statements about our plans, strategies and objectives. You can generally identify forward-looking statements by our use of forward-looking terminology such as “may,” “will,” “expect,” “intend,” “anticipate,” “estimate,” “believe,” “continue” or other similar words. These statements include our plans and objectives for future operations, including plans and objectives relating to future growth and availability of funds, and are based on current expectations that involve numerous risks, uncertainties and assumptions. Assumptions relating to these statements involve judgments with respect to, among other things, future economic, competitive and market conditions and future business decisions, all of which are difficult or impossible to accurately predict and many of which are beyond our control. Although we believe the assumptions underlying the forward-looking statements, and the forward-looking statements themselves, are reasonable, any of the assumptions could be inaccurate and, therefore, there can be no assurance that these forward-looking statements will prove to be accurate and our actual results, performance and achievements may be materially different from that expressed or implied by these forward-looking statements as a result of various factors, including but not limited to those discussed in the Company’s Registration Statement on Form S-11 (File No. 333-213043), as amended, under Item 1A. Risk Factors in our Annual Report on Form 10-K for the year ended December 31, 2017, and elsewhere in this quarterly report on Form 10-Q. In light of the significant uncertainties inherent in these forward looking statements, the inclusion of this information should not be regarded as a representation by us or any other person that our objectives and plans, which we consider to be reasonable, will be achieved.
Overview
BREIT is a non-exchange traded, perpetual life real estate investment trust (“REIT”) that acquires primarily stabilized income-oriented commercial real estate in the United States and to a lesser extent real estate-related securities. We are externally managed by BX REIT Advisors L.L.C. (the “Adviser”), a subsidiary of The Blackstone Group L.P. (“Blackstone”). We are the sole general partner of BREIT Operating Partnership L.P. (“BREIT OP”), a Delaware limited partnership, and we own all or substantially all of our assets through BREIT OP. As of March 31, 2018, we operated our business in five reportable segments: Residential, Industrial, Hotel, and Retail Properties, and Real Estate-Related Securities.
We qualified as a REIT under the Code for U.S. federal income tax purposes beginning with the taxable year ended December 31, 2017. We generally will not be subject to U.S. federal income taxes on our taxable income to the extent we annually distribute all of our net taxable income to stockholders and maintain our qualification as a REIT.
We have registered with the Securities and Exchange Commission (the “SEC”) an offering of up to $5.0 billion in shares of common stock (in any combination of purchases of Class S, Class T, Class D and Class I shares of our common stock), consisting of up to $4.0 billion in shares in our primary offering and up to $1.0 billion in shares pursuant to its distribution reinvestment plan (the “Offering”). The share classes have different upfront selling commissions and ongoing stockholder servicing fees.
As of May 11, 2018, we had received net proceeds of $2.8 billion from selling an aggregate of 271,629,863 shares of our common stock (consisting of 189,759,390 Class S shares, 13,250,755 Class T shares, 9,402,143 Class D shares, and 59,217,575 Class I shares). We have contributed the net proceeds from the Offering to BREIT OP in exchange for a corresponding number of Class S, Class T, Class D, and Class I units. BREIT OP has primarily used the net proceeds to make investments in real estate and real estate-related securities as further described below under “— Portfolio”. We intend to continue selling shares in the Offering on a monthly basis.
We are not aware of any material trends or uncertainties, favorable or unfavorable, other than national economic conditions affecting real estate generally, that may be reasonably anticipated to have a material impact on either capital resources or the revenues or income to be derived from acquiring properties or real estate-related securities, other than those disclosed in Item 1A. Risk Factors in our Annual Report on Form 10-K for the year ended December 31, 2017, our prospectus dated May 1, 2018 and filed with the SEC, as supplemented, and elsewhere in this quarterly report on Form 10-Q.
18
Operating Results:
|
|
• |
Raised $599.3 million of net proceeds in the Offering during the three months ended March 31, 2018. |
|
|
• |
Declared monthly distributions totaling $28.4 million for the three months ended March 31, 2018. |
|
|
• |
Inception to date annualized total return without upfront selling commissions of 9.9% for Class S, 10.9% for Class T, 11.9% for Class D, and 10.7% for Class I shares. Inception to date annualized total return with upfront selling commissions, of 6.8% for Class S and 6.4% for Class T shares. |
Investments:
|
|
• |
Our 272 properties as of March 31, 2018 consisted of Residential (47% based on fair value), Industrial (46%), Hotel (5%), and Retail (2%) and our portfolio of real estate was concentrated in the following regions: South (44%), West (27%), Midwest (15%), and East (14%). |
|
|
• |
Commercial mortgage backed securities (“CMBS”) investments as of March 31, 2018 were diversified by credit rating — BB (46% based on fair value), B (37%), BBB (14%), and Other (3%) and collateral backing — Hospitality (57%), Office (30%), Residential (9%), Retail (2%) and Industrial (2%). |
|
|
• |
Acquired 149 industrial and eight residential properties across three transactions with a total purchase price of $2.1 billion, inclusive of closing costs, consistent with our strategy of acquiring diversified, income producing, commercial real estate assets concentrated in high growth markets across the U.S. |
|
|
• |
One of the three transactions was the Canyon Industrial Portfolio for a total purchase price of $1.8 billion, inclusive of closing costs, a 22 million square foot industrial portfolio consisting of 146 properties concentrated in Chicago, Dallas, Baltimore/Washington, D.C., Los Angeles/Inland Empire, South/Central Florida, New Jersey, and Denver. |
|
|
• |
Made investments in real estate-related securities in the form of CMBS positions with a total cost basis of $267.4 million during the three months ended March 31, 2018. |
Financings:
|
|
• |
Closed or assumed an aggregate of $1.6 billion of property level financings, including a $1.1 billion mortgage loan, with an interest rate of 4.1%, and $200.0 million of mezzanine financing, with an interest rate of 5.85%, in conjunction with the closing of the Canyon Industrial Portfolio. |
|
|
• |
Obtained $214.2 million of financings secured by the CMBS positions acquired during the three months ended March 31, 2018. |
19
Portfolio
Summary of Portfolio
The following charts further describe our portfolio composition in real properties based on fair value as of March 31, 2018:
|
|
|
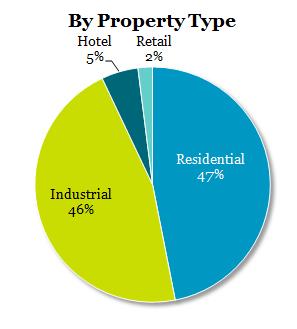
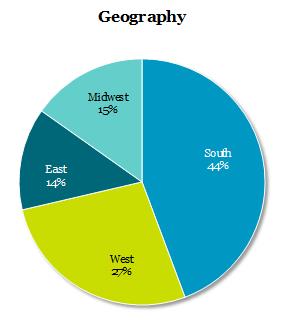
The following chart outlines the percentage of our investments in real properties and investments in real estate-related securities based on fair value as of March 31, 2018:
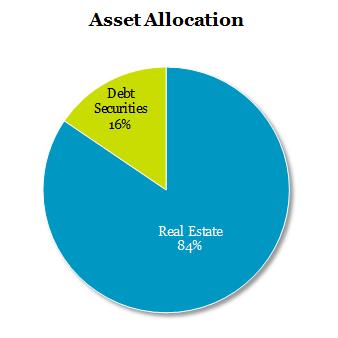
20
As of March 31, 2018, we had acquired 272 properties with a total purchase price of $5.7 billion, inclusive of closing costs. Our diversified portfolio of income producing assets primarily consists of Residential and Industrial properties, and to a lesser extent Hotel and Retail properties, located in growth markets across the U.S. The following table provides a summary of our portfolio as of March 31, 2018 ($ in thousands):
|
Segment |
|
Number of Properties |
|
|
Sq. Feet (in thousands)/ Number of Units/Keys |
|
Occupancy Rate(1) |
|
|
Average Effective Annual Base Rent Per Leased Square Foot or Unit(2) |
|
|
Gross Asset Value(3) |
|
|
Segment Revenue(4) |
|
|
Percentage of Total Rental and Hotel Revenue |
|
||||||
|
Residential |
|
|
56 |
|
|
17,171 units |
|
91% |
|
|
$ |
14,832 |
|
|
$ |
2,823,805 |
|
|
$ |
64,980 |
|
|
|
59 |
% |
|
|
|
|
|
|
|
|
|
|
|
|
|
|
|
|
|
|
|
|
|
|
|
|
|
|
|
|
|
|
Industrial |
|
|
204 |
|
|
32,767 sq. ft. |
|
92% |
|
|
$ |
4.75 |
|
|
|
2,663,991 |
|
|
|
24,639 |
|
|
|
23 |
% |
|
|
|
|
|
|
|
|
|
|
|
|
|
|
|
|
|
|
|
|
|
|
|
|
|
|
|
|
|
|
Hotel |
|
|
10 |
|
|
1,356 keys |
|
81% |
|
|
$160.88 / $130.71 |
|
|
|
292,213 |
|
|
|
17,829 |
|
|
|
16 |
% |
||
|
|
|
|
|
|
|
|
|
|
|
|
|
|
|
|
|
|
|
|
|
|
|
|
|
|
|
|
|
Retail |
|
|
2 |
|
|
403 sq. ft. |
|
97% |
|
|
$ |
16.59 |
|
|
|
100,098 |
|
|
|
2,236 |
|
|
|
2 |
% |
|
|
|
|
|
|
|
|
|
|
|
|
|
|
|
|
|
|
|
|
|
|
|
|
|
|
|
|
|
|
Total |
|
|
272 |
|
|
|
|
|
|
|
|
|
|
|
|
$ |
5,880,107 |
|
|
$ |
109,684 |
|
|
|
100 |
% |
|
(1) |
The occupancy rate is as of March 31, 2018 for non-hotels. The occupancy rate for our hotel investments is the average occupancy rate for the three months ended March 31, 2018. |
|
(2) |
Represents Average Daily Rate and Revenue Per Available Room (“RevPAR”), respectively, for our Hotel properties. |
|
(3) |
Based on fair value as of March 31, 2018. |
|
(4) |
Total represents Rental and Hotel Revenue. |
Acquisitions of Real Estate
During the three months ended March 31, 2018, we invested $2.1 billion in real estate investments consisting of 149 wholly-owned properties and eight properties through an existing joint venture. The following table provides further details of the properties acquired during the three months ended March 31, 2018:
|
Sector and Property/Portfolio Name |
|
Number of Properties |
|
|
Location |
|
Acquisition Date |
|
Ownership Interest(1) |
|
|
Acquisition Price (in thousands)(2) |
|
|
Sq. Feet (in thousands)/ Units |
|
Occupancy Rate(3) |
|
||||
|
Residential |
|
|
|
|
|
|
|
|
|
|
|
|
|
|
|
|
|
|
|
|
|
|
|
Aston Multifamily Portfolio (second closing) |
|
|
8 |
|
|
Various(4) |
|
Jan. 2018 |
|
90% |
|
|
$ |
141,743 |
|
|
1,283 units |
|
94% |
|
||
|
Total Residential |
|
|
8 |
|
|
|
|
|
|
|
|
|
|
|
141,743 |
|
|
1,283 units |
|
|
|
|
|
|
|
|
|
|
|
|
|
|
|
|
|
|
|
|
|
|
|
|
|
|
|
|
|
Industrial: |
|
|
|
|
|
|
|
|
|
|
|
|
|
|
|
|
|
|
|
|
|
|
|
Kraft Chicago Industrial Portfolio |
|
|
3 |
|
|
Aurora, IL |
|
Jan. 2018 |
|
100% |
|
|
|
151,365 |
|
|
1,693 sq. ft. |
|
100% |
|
||
|
Canyon Industrial Portfolio |
|
|
146 |
|
|
Various(5) |
|
Mar. 2018 |
|
100% |
|
|
|
1,837,061 |
|
|
21,719 sq. ft. |
|
90% |
|
||
|
Total Industrial |
|
|
149 |
|
|
|
|
|
|
|
|
|
|
|
1,988,426 |
|
|
23,412 sq. ft. |
|
|
|
|
|
|
|
|
|
|
|
|
|
|
|
|
|
|
|
|
|
|
|
|
|
|
|
|
|
Total Investments in Real Estate |
|
|
157 |
|
|
|
|
|
|
|
|
|
|
$ |
2,130,169 |
|
|
|
|
|
|
|
|
(1) |
Certain of the joint venture agreements entered into by BREIT provide the seller or the other partner a profits interest based on certain internal rate of return hurdles being achieved. |
|
(2) |
Purchase price is inclusive of acquisition-related costs. |
|
(3) |
The occupancy rate is as of March 31, 2018. |
|
(4) |
The Aston Multifamily Portfolio is located in four markets: Austin/San Antonio, Texas (49% of units), Dallas/Fort Worth, Texas (25% of units), Nashville, Tennessee (22% of units) and Louisville, Kentucky (4% of units) |
|
(5) |
The Canyon Industrial Portfolio consists of 146 industrial properties primarily concentrated in Chicago (18% of March 2018 base rent), Dallas (13%), Baltimore/Washington, D.C. (12%), Los Angeles/Inland Empire (8%), South/Central Florida (7%), New Jersey (7%), and Denver (6%). |
21
Subsequent to March 31, 2018, the Company acquired an aggregate of $321.2 million, exclusive of closing costs, of real estate across three separate transactions.
Investments in Real Estate-Related Securities
During the three months ended March 31, 2018, we made 17 investments in CMBS. The following table details our investments in CMBS as of March 31, 2018 ($ in thousands):
|
Number of Positions |
|
|
Credit Rating(1) |
|
Collateral |
|
Weighted Average Coupon(2) |
|
Weighted Average Maturity Date |
|
Face Amount |
|
|
Cost Basis |
|
|
Fair Value |
|
||||
|
|
21 |
|
|
BB |
|
Residential, Hospitality, Office, Industrial, Retail |
|
L+3.05% |
|
2/24/2034 |
|
$ |
484,163 |
|
|
$ |
483,617 |
|
|
$ |
485,254 |
|
|
|
13 |
|
|
B |
|
Hospitality, Office, Residential, Retail |
|
L+3.76% |
|
6/9/2035 |
|
|
391,062 |
|
|
|
390,138 |
|
|
|
391,915 |
|
|
|
11 |
|
|
BBB |
|
Hospitality, Office, Residential |
|
L+2.19% |
|
11/1/2033 |
|
|
151,778 |
|
|
|
151,741 |
|
|
|
152,423 |
|
|
|
6 |
|
|
Other |
|
Residential |
|
L+2.28% |
|
2/6/2026 |
|
|
31,814 |
|
|
|
31,814 |
|
|
|
31,873 |
|
|
|
51 |
|
|
|
|
|
|
|
|
|
|
$ |
1,058,817 |
|
|
$ |
1,057,310 |
|
|
$ |
1,061,465 |
|
|
|
(1) |
BBB represents credit ratings of BBB+, BBB, and BBB-, BB represents credit ratings of BB+, BB, and BB-, and B represents credit ratings of B+, B, and B-. Other consists of investments that, as of March 31, 2018, were either not ratable or have not been submitted to ratings agencies. |
|
|
(2) |
The term “L” refers to the three-month U.S. dollar-denominated London Interbank Offer Rate (“LIBOR”). |
The following charts further describe the diversification of our CMBS investments by credit rating and collateral type based on fair value as of March 31, 2018:
|
Credit Rating(1) |
Collateral Type |
|
|
|
|
|
|
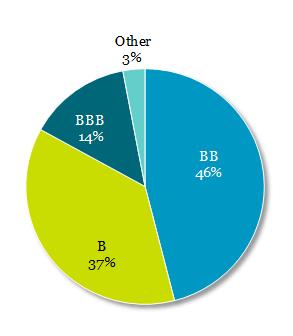
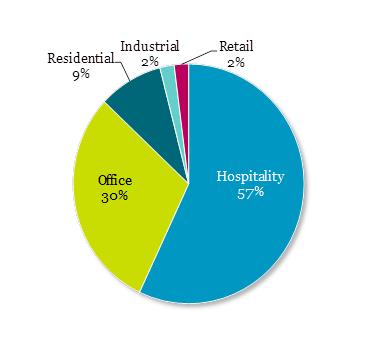
|
(1) |
BBB represents credit ratings of BBB+, BBB, and BBB-, BB represents credit ratings of BB+, BB, and BB-, and B represents credit ratings of B+, B, and B-. Other consists of investments that, as of March 31, 2018, were either not ratable or have not been submitted to ratings agencies. |
Subsequent to March 31, 2018, we purchased an aggregate of $213.1 million of real estate-related debt securities.
22
The following schedule details the expiring leases at our industrial and retail properties by annualized base rent and square footage as of March 31, 2018 ($ and square feet data in thousands). The table below excludes our residential properties as substantially all leases at such properties expire within 12 months.
|
Year |
|
Number of Expiring Leases |
|
|
Annualized Base Rent(1) |
|
|
% of Total Annualized Base Rent Expiring |
|
|
Square Feet |
|
|
% of Total Square Feet Expiring |
|
|||
|
2018 (remaining) |
|
|
72 |
|
|
$ |
13,157 |
|
|
7% |
|
|
|
1,990 |
|
|
6% |
|
|
2019 |
|
|
85 |
|
|
|
22,485 |
|
|
12% |
|
|
|
3,562 |
|
|
11% |
|
|
2020 |
|
|
90 |
|
|
|
28,738 |
|
|
15% |
|
|
|
4,727 |
|
|
14% |
|
|
2021 |
|
|
79 |
|
|
|
28,228 |
|
|
15% |
|
|
|
4,750 |
|
|
14% |
|
|
2022 |
|
|
64 |
|
|
|
22,496 |
|
|
12% |
|
|
|
3,534 |
|
|
12% |
|
|
2023 |
|
|
58 |
|
|
|
33,047 |
|
|
18% |
|
|
|
5,902 |
|
|
18% |
|
|
2024 |
|
|
22 |
|
|
|
8,176 |
|
|
4% |
|
|
|
1,080 |
|
|
3% |
|
|
2025 |
|
|
24 |
|
|
|
8,330 |
|
|
5% |
|
|
|
1,356 |
|
|
4% |
|
|
2026 |
|
|
11 |
|
|
|
7,230 |
|
|
4% |
|
|
|
1,470 |
|
|
4% |
|
|
2027 |
|
|
11 |
|
|
|
7,746 |
|
|
4% |
|
|
|
1,193 |
|
|
4% |
|
|
Thereafter |
|
|
13 |
|
|
|
7,254 |
|
|
4% |
|
|
|
3,589 |
|
|
10% |
|
|
Total |
|
|
529 |
|
|
$ |
186,887 |
|
|
100% |
|
|
|
33,153 |
|
|
100% |
|
|
(1) |
Annualized base rent is determined from the annualized March 2018 base rent per leased square foot of the applicable year and excludes tenant recoveries, straight-line rent and above-market and below-market lease amortization. |
Affiliate Service Providers
For details regarding our affiliate service providers, see Note 10 to our consolidated financial statements and our Annual Report on form 10-K for the year ended December 31, 2017.
23
Due to the significant amount of acquisitions of real estate and real estate-related securities we have made since we broke escrow in January 2017, our results of operations for the three months ended March 31, 2018 and 2017 are not comparable. None of the properties in our portfolio were owned for the full three months ended March 31, 2018 and 2017.
The following table sets forth information regarding our consolidated results of operations ($ in thousands):
|
|
|
For the Three Months Ended March 31, |
|
|
2018 vs. 2017 |
|
||||||
|
|
|
2018 |
|
|
2017 |
|
|
$ |
|
|||
|
Revenues |
|
|
|
|
|
|
|
|
|
|
|
|
|
Rental revenue |
|
$ |
78,513 |
|
|
$ |
898 |
|
|
$ |
77,615 |
|
|
Tenant reimbursement income |
|
|
9,048 |
|
|
|
67 |
|
|
|
8,981 |
|
|
Hotel revenue |
|
|
17,821 |
|
|
|
1,426 |
|
|
|
16,395 |
|
|
Other revenue |
|
|
4,302 |
|
|
|
53 |
|
|
|
4,249 |
|
|
Total revenues |
|
|
109,684 |
|
|
|
2,444 |
|
|
|
107,240 |
|
|
Expenses |
|
|
|
|
|
|
|
|
|
|
|
|
|
Rental property operating |
|
|
38,618 |
|
|
|
305 |
|
|
|
38,313 |
|
|
Hotel operating |
|
|
11,614 |
|
|
|
840 |
|
|
|
10,774 |
|
|
General and administrative |
|
|
2,045 |
|
|
|
2,686 |
|
|
|
(641 |
) |
|
Management fee |
|
|
6,969 |
|
|
|
— |
|
|
|
6,969 |
|
|
Performance participation allocation |
|
|
7,873 |
|
|
|
— |
|
|
|
7,873 |
|
|
Depreciation and amortization |
|
|
74,124 |
|
|
|
1,090 |
|
|
|
73,034 |
|
|
Total expenses |
|
|
141,243 |
|
|
|
4,921 |
|
|
|
136,322 |
|
|
Other income (expense) |
|
|
|
|
|
|
|
|
|
|
|
|
|
Income from real estate-related securities |
|
|
13,235 |
|
|
|
866 |
|
|
|
12,369 |
|
|
Interest income |
|
|
77 |
|
|
|
265 |
|
|
|
(188 |
) |
|
Interest expense |
|
|
(31,391 |
) |
|
|
— |
|
|
|
(31,391 |
) |
|
Other income |
|
|
— |
|
|
|
79 |
|
|
|
(79 |
) |
|
Total other (expense) income |
|
|
(18,079 |
) |
|
|
1,210 |
|
|
|
(19,289 |
) |
|
Net loss |
|
|
(49,638 |
) |
|
|
(1,267 |
) |
|
|
(48,371 |
) |
|
Net loss attributable to non-controlling interests |
|
|
2,090 |
|
|
|
— |
|
|
|
2,090 |
|
|
Net loss attributable to BREIT stockholders |
|
$ |
(47,548 |
) |
|
$ |
(1,267 |
) |
|
$ |
(46,281 |
) |
Revenues, Rental Property and Hotel Operating Expenses, Depreciation and Amortization
During the three months ended March 31, 2018, revenues, rental property and hotel operating expenses, and depreciation and amortization increased significantly compared to the corresponding period in 2017. The increase is driven by the growth in our portfolio, which increased from four properties as of March 31, 2017 to 272 properties as of March 31, 2018.
General and Administrative Expenses
During the three months ended March 31, 2018, general and administrative expenses decreased $0.6 million compared to the corresponding period in 2017. The decrease in general and administrative expenses was primarily due to $1.8 million of organization costs incurred in conjunction with our formation during the three months ended March 31, 2017. We did not incur such costs during the three months ended March 31, 2018. The decrease was partially offset by an increase in miscellaneous corporate level expenses related to the increased size of our portfolio.
Management Fee
During the three months ended March 31, 2018, the management fee increased by $7.0 million compared to the corresponding period in 2017. The Adviser waived management fees for the first six months of 2017, and as such, we did not incur a management fee during the three months ended March 31, 2017.
24
Performance Participation Allocation
During the three months ended March 31, 2018, the unrealized performance participation allocation accrual increased $7.9 million compared to the corresponding period in 2017. The increase was the result of the total return being greater than the 5% hurdle amount. Such amount was allocated to the Special Limited Partner. During the three months ended March 31, 2017, the total return did not exceed the 5% hurdle amount as this was our first quarter of operations.
Income from Real Estate-Related Securities
During the three months ended March 31, 2018, income from real estate-related securities increased $12.4 million compared to the corresponding period in 2017. The increase is primarily due to the growth of our portfolio of investments in real estate-related securities which increased from three positions as of March 31, 2017 to 51 positions as of March 31, 2018.
Interest Expense
During the three months ended March 31, 2018, interest expense increased $31.4 million compared to the corresponding period in 2017 as we did not have any outstanding indebtedness during the three months ended March 31, 2017.
Funds from Operations and Adjusted Funds from Operations
We believe funds from operations (“FFO”) is a meaningful supplemental non-GAAP operating metric. Our consolidated financial statements are presented under historical cost accounting which, among other things, requires depreciation of real estate investments to be calculated on a straight-line basis. As a result, our operating results imply that the value of our real estate investments will decrease evenly over a set time period. However, we believe that the value of real estate investments will fluctuate over time based on market conditions and as such, depreciation under historical cost accounting may be less informative. FFO is a standard REIT industry metric defined by the National Associational of Real Estate Investment Trusts (“NAREIT”).
FFO, as defined by NAREIT and presented below, is calculated as net income or loss (computed in accordance with accounting principles generally accepted in the United States (“GAAP”)), excluding gains or losses from sales of depreciable real property and impairment write-downs on depreciable real property, plus real estate-related depreciation and amortization, and similar adjustments for unconsolidated joint ventures.
The following table presents a reconciliation of FFO to net loss ($ in thousands):
|
|
|
Three Months Ended March 31, 2018 |
|
|
Three Months Ended March 31, 2017 |
|
||
|
Net loss attributable to BREIT stockholders |
|
$ |
(47,548 |
) |
|
$ |
(1,267 |
) |
|
Adjustments: |
|
|
|
|
|
|
|
|
|
Real estate depreciation and amortization |
|
|
74,124 |
|
|
|
1,090 |
|
|
Amount attributable to non-controlling interests for above adjustment |
|
|
(2,896 |
) |
|
|
— |
|
|
Funds from Operations attributable to BREIT stockholders |
|
$ |
23,680 |
|
|
$ |
(177 |
) |
We also believe that adjusted FFO (“AFFO”) is a meaningful supplemental non-GAAP disclosure of our operating results. AFFO further adjusts FFO in order for our operating results to reflect the specific characteristics of our business by adjusting for items we believe are not related to our core operations. Our adjustments to FFO to arrive at AFFO include straight-line rental income, amortization of above- and below-market lease intangibles, amortization of mortgage premium/discount, organization costs, unrealized gains or losses from changes in the fair value of financial instruments, amortization of stock awards, and performance participation allocation not paid in cash. AFFO is not defined by NAREIT and our calculation of AFFO may not be comparable to disclosures made by other REITs.
25
The following table presents a reconciliation of FFO to AFFO ($ in thousands):
|
|
|
Three Months Ended March 31, 2018 |
|
|
Three Months Ended March 31, 2017 |
|
||
|
Funds from Operations attributable to BREIT stockholders |
|
$ |
23,680 |
|
|
$ |
(177 |
) |
|
Adjustments: |
|
|
|
|
|
|
|
|
|
Straight-line rental income |
|
|
(1,089 |
) |
|
|
(18 |
) |
|
Amortization of above- and below-market lease intangibles |
|
|
(505 |
) |
|
|
(10 |
) |
|
Amortization of mortgage premium |
|
|
(46 |
) |
|
|
— |
|
|
Organization costs |
|
|
— |
|
|
|
1,838 |
|
|
Unrealized (gains) losses from changes in the fair value of real estate-related securities |
|
|
(1,789 |
) |
|
|
(725 |
) |
|
Amortization of restricted stock awards |
|
|
25 |
|
|
|
23 |
|
|
Performance participation allocation |
|
|
7,873 |
|
|
|
— |
|
|
Amount attributable to non-controlling interests for above adjustments |
|
|
(33 |
) |
|
|
— |
|
|
Adjusted Funds from Operations attributable to BREIT stockholders |
|
$ |
28,116 |
|
|
$ |
931 |
|
FFO and AFFO should not be considered to be more relevant or accurate than the current GAAP methodology in calculating net income or in evaluating our operating performance. In addition, FFO and AFFO should not be considered as alternatives to net income (loss) as indications of our performance or as alternatives to cash flows from operating activities as indications of our liquidity, but rather should be reviewed in conjunction with these and other GAAP measurements. Further, FFO and AFFO are not intended to be used as liquidity measures indicative of cash flow available to fund our cash needs, including our ability to make distributions to our stockholders.
Net Asset Value
The purchase price per share for each class of our common stock will generally equal our prior month’s NAV per share, as determined monthly, plus applicable selling commissions and dealer manager fees. Our NAV for each class of shares is based on the net asset values of our investments (including real estate-related securities), the addition of any other assets (such as cash on hand) and the deduction of any liabilities, including the allocation/accrual of any performance participation, and any stockholder servicing fees applicable to such class of shares.
The following table provides a breakdown of the major components of our NAV ($ and shares in thousands, except per share data):
|
Components of NAV |
|
March 31, 2018 |
|
|
|
Investments in real properties |
|
$ |
5,880,107 |
|
|
Investments in real estate-related securities |
|
|
1,061,465 |
|
|
Cash and cash equivalents |
|
|
51,034 |
|
|
Restricted cash |
|
|
182,634 |
|
|
Other assets |
|
|
40,440 |
|
|
Debt obligations |
|
|
(4,454,484 |
) |
|
Subscriptions received in advance |
|
|
(150,213 |
) |
|
Other liabilities |
|
|
(120,887 |
) |
|
Accrued performance participation allocation |
|
|
(7,873 |
) |
|
Management fee payable |
|
|
(2,569 |
) |
|
Accrued stockholder servicing fees(1) |
|
|
(1,357 |
) |
|
Non-controlling interests in joint ventures |
|
|
(52,045 |
) |
|
Net Asset Value |
|
$ |
2,426,252 |
|
|
Number of outstanding shares |
|
|
227,489 |
|
|
(1) |
Stockholder servicing fees only apply to Class S, Class T, and Class D shares. See Reconciliation of Stockholders’ Equity to NAV below for an explanation of the difference between the $1.4 million accrued for purposes of our NAV and the $130.9 million accrued under U.S. GAAP. |
26
The following table provides a breakdown of our total NAV and NAV per share by share class as of March 31, 2018 ($ and shares in thousands, except per share data):
|
NAV Per Share |
|
Class S Shares |
|
|
Class T Shares |
|
|
Class D Shares |
|
|
Class I Shares |
|
|
Total |
|
|||||
|
Monthly NAV |
|
$ |
1,746,688 |
|
|
$ |
102,520 |
|
|
$ |
72,236 |
|
|
$ |
504,808 |
|
|
$ |
2,426,252 |
|
|
Number of outstanding shares |
|
|
163,555 |
|
|
|
9,759 |
|
|
|
6,840 |
|
|
|
47,335 |
|
|
|
227,489 |
|
|
NAV Per Share as of March 31, 2018 |
|
$ |
10.6795 |
|
|
$ |
10.5050 |
|
|
$ |
10.5602 |
|
|
$ |
10.6646 |
|
|
|
|
|
Set forth below are the weighted averages of the key assumptions in the discounted cash flow methodology used in the March 31, 2018 valuations, based on property types.
|
Property Type |
|
Discount Rate |
|
|
Exit Capitalization Rate |
|
|
Residential |
|
7.8% |
|
|
5.7% |
|
|
Industrial |
|
7.3% |
|
|
6.3% |
|
|
Hospitality |
|
9.7% |
|
|
9.5% |
|
|
Retail |
|
7.7% |
|
|
6.0% |
|
These assumptions are determined by the Adviser and reviewed by our independent valuation advisor. A change in these assumptions would impact the calculation of the value of our property investments. For example, assuming all other factors remain unchanged, the changes listed below would result in the following effects on our investment values:
|
Input |
|
Hypothetical Change |
|
Residential Investment Values |
|
|
Industrial Investment Values |
|
|
Hospitality Investment Values |
|
|
Retail Investment Values |
|
|
Discount Rate |
|
0.25% decrease |
|
+1.9% |
|
|
+1.4% |
|
|
+0.9% |
|
|
+1.8% |
|
|
(weighted average) |
|
0.25% increase |
|
(1.8%) |
|
|
(1.3%) |
|
|
(0.9%) |
|
|
(1.8%) |
|
|
Exit Capitalization Rate |
|
0.25% decrease |
|
+3.0% |
|
|
+2.4% |
|
|
+1.9% |
|
|
+2.6% |
|
|
(weighted average) |
|
0.25% increase |
|
(2.6%) |
|
|
(2.2%) |
|
|
(1.8%) |
|
|
(2.4%) |
|
The following table reconciles stockholders’ equity per our consolidated balance sheet to our NAV ($ in thousands):
|
Reconciliation of Stockholders’ Equity to NAV |
|
March 31, 2018 |
|
|
|
Stockholders’ equity under U.S. GAAP |
|
$ |
1,979,542 |
|
|
Adjustments: |
|
|
|
|
|
Accrued stockholder servicing fee |
|
|
129,587 |
|
|
Organization and offering costs |
|
|
9,652 |
|
|
Unrealized real estate appreciation |
|
|
119,151 |
|
|
Accumulated depreciation and amortization |
|
|
188,320 |
|
|
NAV |
|
$ |
2,426,252 |
|
The following details the adjustments to reconcile GAAP stockholders’ equity to our NAV:
|
|
- |
Accrued stockholder servicing fee represents the accrual for the full cost of the stockholder servicing fee for Class S, Class T, and Class D shares. Under GAAP, we accrued the full cost of the stockholder servicing fee payable over the life of each share (assuming such share remains outstanding the length of time required to pay the maximum stockholder servicing fee) as an offering cost at the time we sold the Class S, Class T, and Class D shares. Refer to Note 2 to our Annual Report on Form 10-K for the year ended December 31, 2017 for further details of the GAAP treatment regarding the stockholder servicing fee. For purposes of NAV we recognize the stockholder servicing fee as a reduction of NAV on a monthly basis when such fee is paid. |
|
|
- |
The Adviser agreed to advance certain organization and offering costs on our behalf through December 31, 2017. Such costs are being reimbursed to the Adviser pro-rata basis over 60 months beginning January 1, 2018. Under GAAP, organization costs are expensed as incurred and offering costs are charged to equity as such amounts are incurred. For NAV, such costs will be recognized as a reduction to NAV as they are reimbursed ratably over 60 months. |
27
|
|
our investments in real estate or our Debt are not included in our GAAP results. For purposes of determining our NAV, our investments in real estate and our Debt are recorded at fair value. |
|
|
- |
In addition, we depreciate our investments in real estate and amortize certain other assets and liabilities in accordance with GAAP. Such depreciation and amortization is not recorded for purposes of determining our NAV. |
Distributions
Beginning March 31, 2017, we declared monthly distributions for each class of our common stock which are generally paid 20 days after month-end. Each class of our common stock receives the same gross distribution per share, which was $0.1552 per share for the three months ended March 31, 2018. The net distribution varies for each class based on the applicable stockholder servicing fee, which is deducted from the monthly distribution per share and paid directly to the applicable distributor. The table below details the net distribution for each of our share classes for the three months ended March 31, 2018.
|
|
|
Class S Shares |
|
|
Class T Shares |
|
|
Class D Shares |
|
|
Class I Shares |
|
||||
|
January 31, 2018 |
|
$ |
0.0441 |
|
|
$ |
0.0442 |
|
|
$ |
0.0495 |
|
|
$ |
0.0517 |
|
|
February 28, 2018 |
|
|
0.0443 |
|
|
|
0.0444 |
|
|
|
0.0492 |
|
|
|
0.0513 |
|
|
March 31, 2018 |
|
|
0.0445 |
|
|
|
0.0446 |
|
|
|
0.0500 |
|
|
|
0.0522 |
|
|
Total |
|
$ |
0.1329 |
|
|
$ |
0.1332 |
|
|
$ |
0.1487 |
|
|
$ |
0.1552 |
|
The following table summarizes our distributions declared during the three months ended March 31, 2018 and 2017 ($ in thousands).
|
|
|
For the Three Months Ended March 31, 2018 |
|
|
For the Three Months Ended March 31, 2017 |
|
||||||||||
|
|
|
Amount |
|
|
Percentage |
|
|
Amount |
|
|
Percentage |
|
||||
|
Distributions |
|
|
|
|
|
|
|
|
|
|
|
|
|
|
|
|
|
Payable in cash |
|
$ |
10,148 |
|
|
|
36 |
% |
|
$ |
378 |
|
|
|
29 |
% |
|
Reinvested in shares |
|
|
18,236 |
|
|
|
64 |
% |
|
|
941 |
|
|
|
71 |
% |
|
Total distributions |
|
$ |
28,384 |
|
|
|
100 |
% |
|
$ |
1,319 |
|
|
|
100 |
% |
|
Sources of Distributions |
|
|
|
|
|
|
|
|
|
|
|
|
|
|
|
|
|
Cash flows from operating activities |
|
$ |
28,384 |
|
|
|
100 |
% |
|
$ |
1,319 |
|
|
|
100 |
% |
|
Offering proceeds |
|
|
— |
|
|
|
— |
% |
|
|
— |
|
|
|
— |
% |
|
Total sources of distributions |
|
$ |
28,384 |
|
|
|
100 |
% |
|
$ |
1,319 |
|
|
|
100 |
% |
|
|
|
|
|
|
|
|
|
|
|
|
|
|
|
|
|
|
|
Cash flows from operating activities |
|
$ |
41,490 |
|
|
|
|
|
|
$ |
1,573 |
|
|
|
|
|
|
Funds from Operations |
|
$ |
23,680 |
|
|
|
|
|
|
$ |
(177 |
) |
|
|
|
|
Liquidity and Capital Resources
Our primary needs for liquidity and capital resources are to fund our investments, make distributions to our stockholders, repurchase shares of our common stock pursuant to our share repurchase plan, pay our organization and offering costs (including reimbursement of organization and offering costs advanced by the Adviser), operating expenses, capital expenditures and to pay debt service on any outstanding indebtedness we may incur. We anticipate our operating expenses will include, among other things, the management fee we pay to the Adviser (to the extent the Adviser elects to receive the management fee in cash or requests that we repurchase shares previously issued to the Adviser for payment of the management fee), the performance participation allocation that BREIT OP pays to the Special Limited Partner (to the extent the Special Limited Partner elects to receive the performance participation allocation in cash or requests that we repurchase shares previously issued to the Special Limited Partner for payment of the performance participation allocation), general corporate expenses, and fees and expenses related to managing our properties and other investments. We do not have any office or personnel expenses as we do not have any employees.
Our cash needs for acquisitions and other investments will be funded primarily from the sale of shares of our common stock and through the assumption or incurrence of debt.
As of March 31, 2018, our indebtedness included loans secured by our properties, master repurchase agreements with Citigroup Global Markets Inc. (the “Citi MRA”), Royal Bank of Canada (the “RBC MRA”), and Bank of America Merrill Lynch (the “BAML MRA”) secured by our investments in real estate-related securities, and an unsecured line of credit.
28
The following table is a summary of our indebtedness ($ in thousands):
|
|
|
|
|
|
|
|
|
|
|
|
|
Principal Balance as Of |
|
|||||
|
Indebtedness |
|
Weighted Average Interest Rate(1) |
|
|
Weighted Average Maturity Date(2) |
|
Maximum Facility Size |
|
|
March 31, 2018 |
|
|
December 31, 2017 |
|
||||
|
Fixed rate loans |
|
|
|
|
|
|
|
|
|
|
|
|
|
|
|
|
|
|
|
Fixed rate mortgages |
|
3.92% |
|
|
2/19/2025 |
|
N/A |
|
|
$ |
2,720,955 |
|
|
$ |
1,468,294 |
|
||
|
Canyon Industrial Portfolio Mezzanine Loan |
|
5.85% |
|
|
4/5/2025 |
|
N/A |
|
|
|
200,000 |
|
|
|
— |
|
||
|
Total fixed rate loans |
|
4.06% |
|
|
2/22/2025 |
|
|
|
|
|
|
2,920,955 |
|
|
|
1,468,294 |
|
|
|
Variable rate loans |
|
|
|
|
|
|
|
|
|
|
|
|
|
|
|
|
|
|
|
BAML Industrial Term Loan(4) |
|
L+2.00% |
|
|
6/1/2022 |
|
N/A |
|
|
|
236,000 |
|
|
|
186,000 |
|
||
|
BAML Revolving Credit Facility(4) |
|
L+2.00% |
|
|
6/1/2022 |
|
$ |
236,000 |
|
|
|
236,000 |
|
|
|
186,000 |
|
|
|
Citi Revolving Credit Facility(5) |
|
L+2.25% |
|
|
10/26/2020 |
|
|
300,000 |
|
|
|
178,831 |
|
|
|
178,831 |
|
|
|
Floating rate mortgage |
|
L+2.18% |
|
|
5/9/2022 |
|
N/A |
|
|
|
63,600 |
|
|
|
63,600 |
|
||
|
Capital One Term Loan(6) |
|
L+1.80% |
|
|
12/12/2022 |
|
N/A |
|
|
|
22,500 |
|
|
|
22,500 |
|
||
|
Capital One Revolving Credit Facility(6) |
|
L+1.80% |
|
|
12/12/2022 |
|
|
20,600 |
|
|
|
20,600 |
|
|
|
20,600 |
|
|
|
Total variable rate loans |
|
3.95% |
|
|
1/23/2022 |
|
|
|
|
|
|
757,531 |
|
|
|
657,531 |
|
|
|
Total loans secured by the Company's properties |
|
4.03% |
|
|
7/5/2024 |
|
|
|
|
|
|
3,678,486 |
|
|
|
2,125,825 |
|
|
|
|
|
|
|
|
|
|
|
|
|
|
|
|
|
|
|
|
|
|
|
Repurchase agreement borrowings secured by our real estate-related securities: |
|
|
|
|
|
|
|
|
|
|
|
|
|
|
|
|
|
|
|
Citi MRA |
|
L+1.57% |
|
|
9/6/2018 |
|
N/A |
|
|
|
458,335 |
|
|
|
512,975 |
|
||
|
RBC MRA |
|
L+1.46% |
|
|
11/3/2018 |
|
N/A |
|
|
|
331,123 |
|
|
|
150,238 |
|
||
|
BAML MRA |
|
L+1.12% |
|
|
5/9/2018(3) |
|
N/A |
|
|
|
20,820 |
|
|
|
19,635 |
|
||
|
Total repurchase agreement borrowings secured by our real estate-related securities |
|
|
|
|
|
|
|
|
|
810,278 |
|
|
|
682,848 |
|
|||
|
|
|
|
|
|
|
|
|
|
|
|
|
|
|
|
|
|
|
|
|
Unsecured loan: |
|
|
|
|
|
|
|
|
|
|
|
|
|
|
|
|
|
|
|
Affiliate line of credit |
|
L+2.25% |
|
|
1/23/2019 |
|
250,000 |
|
|
|
— |
|
|
|
5,374 |
|
||
|
|
|
|
|
|
|
|
|
|
|
|
|
|
|
|
|
|
|
|
|
Total indebtedness |
|
|
|
|
|
|
|
|
|
|
|
$ |
4,488,764 |
|
|
$ |
2,814,047 |
|
|
|
(1) |
The term “L” refers to (i) the one-month LIBOR with respect to the Line of Credit, Revolving Credit Facilities, and Term Loans, and (ii) the one-month and three-month LIBOR with respect to the Repurchase agreement borrowings. |
|
|
(2) |
For loans where we, at our sole discretion, have extension options, the maximum maturity date has been assumed. |
|
|
(3) |
Subsequent to quarter end, we rolled our repurchase agreement contracts expiring in May 2018 into new one month contracts. |
|
|
(4) |
The BAML Industrial Term Loan and BAML Revolving Credit Facility are secured by certain of our industrial assets. |
|
|
(5) |
The Citi Revolving Credit Facility is secured by our hotel investments. |
|
|
(6) |
The Capital One Term Loan and Capital One Revolving Credit Facility are secured by one of our industrial assets. |
Other potential future sources of capital include secured or unsecured financings from banks or other lenders and proceeds from the sale of assets. If necessary, we may use financings or other sources of capital in the event of unforeseen significant capital expenditures. We have not yet identified any sources for these types of financings.
As of May 11, 2018, we had received net proceeds of $2.8 billion from selling an aggregate of 271,629,863 shares of our common stock (consisting of 189,759,390 Class S shares, 13,250,755 Class T shares, 9,402,143 Class D shares, and 59,217,575 Class I shares).
Cash Flows
The following table provides a breakdown of the net change in our cash and cash equivalents and restricted cash ($ in thousands):
|
|
|
Three Months Ended March 31, 2018 |
|
|
Three Months Ended March 31, 2017 |
|
||
|
Cash flows provided by operating activities |
|
$ |
41,490 |
|
|
$ |
1,573 |
|
|
Cash flows used in investing activities |
|
|
(2,180,146 |
) |
|
|
(292,860 |
) |
|
Cash flows provided by financing activities |
|
|
2,214,595 |
|
|
|
580,578 |
|
|
Net increase in cash and cash equivalents and restricted cash |
|
$ |
75,939 |
|
|
$ |
289,291 |
|
Cash flows provided by operating activities increased $39.9 million during the three months ended March 31, 2018 compared to the corresponding period in the 2017 due to increased cash flows from the operations of the investments in real estate and income on our investments in real estate-related securities.
29
Cash flows used in investing activities increased $1.9 billion during the three months ended March 31, 2018 compared to the corresponding period in 2017 primarily due to an increase of $1.9 billion in the acquisition of real estate investments.
Cash flows provided by financing activities increased $1.6 billion during the three months ended March 31, 2018 compared to the corresponding period in 2017 primarily due to a net increase of $1.6 billion in borrowings.
Critical Accounting Policies
The preparation of the financial statements in accordance with GAAP involves significant judgments and assumptions and requires estimates about matters that are inherently uncertain. These judgments will affect our reported amounts of assets and liabilities and our disclosure of contingent assets and liabilities at the dates of the financial statements and the reported amounts of revenue and expenses during the reporting periods. With different estimates or assumptions, materially different amounts could be reported in our consolidated financial statements. We consider our accounting policies over investments in real estate and lease intangibles, investments in securities, and revenue recognition to be our critical accounting policies. See Note 2 to our Annual Report on Form 10-K for the year ended December 31, 2017 for further descriptions of such accounting policies.
Recent Accounting Pronouncements
See Note 2 — “Summary of Significant Accounting Policies” to our consolidated financial statements in this quarterly report on Form 10-Q for a discussion concerning recent accounting pronouncements.
Off-Balance Sheet Arrangements
We currently have no off-balance sheet arrangements that are reasonably likely to have a material current or future effect on our financial condition, changes in financial condition, revenues or expenses, results of operations, liquidity, capital expenditures or capital resources.
Contractual Obligations
The following table aggregates our contractual obligations and commitments with payments due subsequent to March 31, 2018 ($ in thousands).
|
Obligations |
|
Total |
|
|
Less than 1 year |
|
|
1-3 years |
|
|
3-5 years |
|
|
More than 5 years |
|
|||||
|
Indebtedness (1) |
|
$ |
5,456,023 |
|
|
$ |
960,923 |
|
|
$ |
528,567 |
|
|
$ |
892,879 |
|
|
$ |
3,073,654 |
|
|
Ground leases |
|
|
14,209 |
|
|
|
240 |
|
|
|
480 |
|
|
|
480 |
|
|
|
13,009 |
|
|
Organizational and offering costs |
|
|
9,652 |
|
|
|
2,032 |
|
|
|
4,064 |
|
|
|
3,556 |
|
|
|
— |
|
|
Other |
|
|
19,226 |
|
|
|
2,398 |
|
|
|
6,517 |
|
|
|
7,674 |
|
|
|
2,637 |
|
|
Total |
|
$ |
5,499,110 |
|
|
$ |
965,593 |
|
|
$ |
539,628 |
|
|
$ |
904,589 |
|
|
$ |
3,089,300 |
|
|
|
(1) |
The allocation of our indebtedness includes both principal and interest payments based on the current maturity date and interest rates in effect at March 31, 2018. |
30
Indebtedness
We are exposed to interest rate risk with respect to our variable-rate indebtedness, whereas an increase in interest rates would directly result in higher interest expense costs. We seek to manage our exposure to interest rate risk by utilizing a mix of fixed and floating rate financings with staggered maturities and through interest rate protection agreements to fix or cap a portion of our variable rate debt. As of March 31, 2018, the outstanding principal balance of our variable rate indebtedness was $1.6 billion and consisted of mortgage notes, term loans, revolving credit facilities, and repurchase agreements.
Certain of our mortgage loans, term loans, revolving credit facilities, and affiliate line of credit are variable rate and indexed to one-month U.S. Dollar denominated LIBOR. For the three months ended March 31, 2018, a 10% increase in one-month U.S. Dollar denominated LIBOR would have resulted in increased interest expense of $0.2 million.
Our repurchase agreements are variable rate and indexed to one-month or three-month U.S. Dollar denominated LIBOR. For the three months ended March 31, 2018, a 10% increase in the one-month or three-month U.S. Dollar denominated LIBOR rate would have resulted in increased interest expense of $0.2 million.
Investments in real estate-related securities
As of March 31, 2018, we held $1.1 billion of investments in real estate-related debt securities, which were exclusively CMBS. Our CMBS investments are floating-rate and indexed to three-month U.S. denominated LIBOR and as such, exposed to interest rate risk. Our net income will increase or decrease depending on interest rate movements. While we cannot predict factors which may or may not affect interest rates, for the three months ended March 31, 2018, a 10% increase or decrease in the three-month U.S. denominated LIBOR rate would have resulted in an increase or decrease to income from real estate-related securities of $1.1 million.
We may also be exposed to market risk with respect to our investments in real estate-related debt securities due to changes in the fair value of our investments. We seek to manage our exposure to market risk with respect to our investments in real estate-related debt securities by making investments in securities backed by different types of collateral and varying credit ratings. The fair value of our investments may fluctuate, thus the amount we will realize upon any sale of our investments in real estate-related debt securities is unknown. As of March 31, 2018, the fair value at which we may sell our investments in real estate-related debt securities is not known, but a 10% change in the fair value of our investments in real estate-related debt securities may result in an unrealized gain or loss of $106.1 million.
Evaluation of Disclosure Controls and Procedures
An evaluation of the effectiveness of the design and operation of our “disclosure controls and procedures” (as defined in Rule 13a-15(e) under the Securities Exchange Act of 1934, as amended (the “Exchange Act”)), as of the end of the period covered by this quarterly report on Form 10-Q was made under the supervision and with the participation of our management, including our Chief Executive Officer (“CEO”) and Chief Financial Officer (“CFO”). Based upon this evaluation, our CEO and CFO have concluded that our disclosure controls and procedures (a) are effective to ensure that information required to be disclosed by us in reports filed or submitted under the Exchange Act is recorded, processed, summarized and reported within the time periods specified by SEC rules and forms and (b) include, without limitation, controls and procedures designed to ensure that information required to be disclosed by us in reports filed or submitted under the Exchange Act is accumulated and communicated to our management, including our CEO and CFO, as appropriate to allow timely decisions regarding required disclosure.
Changes in Internal Controls over Financial Reporting
There have been no changes in our “internal control over financial reporting” (as defined in Rule 13a-15(f) of the Exchange Act) that occurred during the period covered by this quarterly report on Form 10-Q that have materially affected, or are reasonably likely to materially affect, our internal control over financial reporting.
31
From time to time, we may be involved in various claims and legal actions arising in the ordinary course of business. As of March 31, 2018, we were not involved in any material legal proceedings.
There have been no material changes to the risk factors previously disclosed under Item 1A of our Annual Report on Form 10-K for the year ended December 31, 2017.
32
Unregistered Sales of Equity Securities
Except as described below, during the three months ended March 31, 2018, we did not sell any equity securities that were not registered under the Securities Act. As described in Note 10 to our consolidated financial statements, the Adviser is entitled to an annual management fee payable monthly in cash, shares of common stock, or BREIT OP Units, in each case at the Adviser's election. For the three months ended March 31, 2018, the Adviser elected to receive its management fee in Class I shares and we issued 413,466 unregistered Class I shares to the Adviser in satisfaction of the management fee for January and February 2018. Additionally, we issued 240,867 unregistered Class I shares to the Adviser in April 2018 in satisfaction of the March 2018 management fee.
The Special Limited Partner is also entitled to an annual performance participation allocation. As further described in our Annual Report on Form10-K for the fiscal year ended December 31, 2017, the 2017 performance participation allocation became payable on December 31, 2017 and in January 2018, the Company issued approximately 1.6 million Class I units in BREIT OP to the Special Limited Partner as payment for the 2017 performance participation allocation. Each Class I unit is exchangeable into one Class I share. Each issuance to the Adviser and the Special Limited Partner was made pursuant to Section 4(a)(2) of the Securities Act.
Use of Offering Proceeds
On August 31, 2016, the Registration Statement on Form S-11 (File No. 333-213043) for the Offering was declared effective under the Securities Act. Amendment No. 8 to our Registration Statement was declared effective under the Securities Act on May 1, 2018. The initial offering price of each class of our common stock was $10.00 per share, plus applicable selling commissions and dealer manager fees. The offering price for each class of our common stock is determined monthly and is made available on our website and in prospectus supplement filings.
As of March 31, 2018, we received net proceeds of $2.3 billion from the Offering. The following table summarizes certain information about the Offering proceeds therefrom ($ in thousands except for share data):
|
|
|
Class S Shares |
|
|
Class T Shares |
|
|
Class D Shares |
|
|
Class I Shares |
|
|
Total |
|
|||||
|
Offering proceeds: |
|
|
|
|
|
|
|
|
|
|
|
|
|
|
|
|
|
|
|
|
|
Shares sold |
|
|
163,725,024 |
|
|
|
9,760,061 |
|
|
|
6,840,379 |
|
|
|
46,152,263 |
|
|
|
226,477,727 |
|
|
Gross offering proceeds |
|
$ |
1,697,649 |
|
|
$ |
103,753 |
|
|
$ |
71,052 |
|
|
$ |
475,957 |
|
|
$ |
2,348,411 |
|
|
Selling commissions and dealer manager fees |
|
|
(18,185 |
) |
|
|
(2,886 |
) |
|
|
— |
|
|
|
— |
|
|
|
(21,071 |
) |
|
Accrued stockholder servicing fees |
|
|
(10,102 |
) |
|
|
(314 |
) |
|
|
(61 |
) |
|
|
— |
|
|
|
(10,477 |
) |
|
Net offering proceeds |
|
$ |
1,669,362 |
|
|
$ |
100,553 |
|
|
$ |
70,991 |
|
|
$ |
475,957 |
|
|
$ |
2,316,863 |
|
We primarily used the net proceeds from the Offering toward the acquisition of $5.7 billion of real estate and $1.1 billion of real estate-related securities. In addition to the net proceeds from the Offering, we financed our acquisitions with $3.7 billion of financing secured by our investments in real estate, $810.3 million of repurchase agreements, and borrowings on the line of credit from Blackstone Holdings Finance Co. L.L.C., an affiliate of Blackstone. See “Management’s Discussion and Analysis of Financial Condition and Results of Operations — Liquidity and Capital Resources” for additional details on our borrowings.
Share Repurchases
Under our share repurchase plan, to the extent we choose to repurchase shares in any particular month, we will only repurchase shares as of the opening of the last calendar day of that month (each such date, a “Repurchase Date”). Repurchases will be made at the transaction price in effect on the Repurchase Date (which will generally be equal to our prior month’s NAV per share), except that shares that have not been outstanding for at least one year will be repurchased at 95% of the transaction price (an “Early Repurchase Deduction”) subject to certain limited exceptions. Settlements of share repurchases will be made within three business days of the Repurchase Date. The Early Repurchase Deduction will not apply to shares acquired through our distribution reinvestment plan.
The total amount of aggregate repurchases of Class S, Class T, Class D and Class I shares is limited to no more than 2% of our aggregate NAV per month and no more than 5% of our aggregate NAV per calendar quarter.
Should repurchase requests, in our judgment, place an undue burden on our liquidity, adversely affect our operations or risk having an adverse impact on the company as a whole, or should we otherwise determine that investing our liquid assets in real properties or other illiquid investments rather than repurchasing our shares is in the best interests of the Company as a whole, then we may choose to repurchase fewer shares than have been requested to be repurchased, or none at all. Further, our board of directors may modify,
33
suspend or terminate our share repurchase plan if it deems such action to be in our best interest and the best interest of our stockholders. In the event that we determine to repurchase some but not all of the shares submitted for repurchase during any month, shares repurchased at the end of the month will be repurchased on a pro rata basis.
If the transaction price for the applicable month is not made available by the tenth business day prior to the last business day of the month (or is changed after such date), then no repurchase requests will be accepted for such month and stockholders who wish to have their shares repurchased the following month must resubmit their repurchase requests.
During the three months ended March 31, 2018, we repurchased shares of our common stock in the following amounts, which represented all of the share repurchase requests received for the same period.
|
Period |
|
Total Number of Shares Repurchased |
|
|
Repurchases as a Percentage of Shares Outstanding |
|
|
Average Price Paid per Share |
|
|
Total Number of Shares Repurchased as Part of Publicly Announced Plans or Programs |
|
|
Maximum Number of Shares Pending Repurchase Pursuant to Publicly Announced Plans or Programs(1) |
|
|||||
|
January 1 - January 31, 2018 |
|
|
29,942 |
|
|
|
0.02 |
% |
|
$ |
10.57 |
|
|
|
29,942 |
|
|
|
— |
|
|
February 1 - February 28, 2018 |
|
|
88,765 |
|
|
|
0.04 |
% |
|
|
10.63 |
|
|
|
88,765 |
|
|
|
— |
|
|
March 1 - March 31, 2018 |
|
|
97,380 |
|
|
|
0.04 |
% |
|
|
10.64 |
|
|
|
97,380 |
|
|
|
— |
|
|
Total |
|
|
216,087 |
|
|
N/M |
|
|
$ |
10.63 |
|
|
|
216,087 |
|
|
|
— |
|
|
|
|
(1) |
Repurchases are limited under the share repurchase plan as described above. Under the share repurchase plan, we would have been able to repurchase up to an aggregate of $108.4 million of Class S, Class T, Class D and Class I shares based on our February 28, 2018 NAV in the first quarter of 2018 (if such repurchase requests were made). Pursuant to the share repurchase plan, this amount resets at the beginning of each quarter. |
None.
Not applicable.
Not applicable.
34
|
4.1 |
|
|
|
10.1 |
|
|
|
|
|
|
|
31.1 |
|
|
|
|
|
|
|
31.2 |
|
|
|
|
|
|
|
32.1 + |
|
|
|
|
|
|
|
32.2 + |
|
|
|
|
|
|
|
101.INS |
|
XBRL Instance Document |
|
|
|
|
|
101.SCH |
|
XBRL Taxonomy Extension Schema Document |
|
|
|
|
|
101.SCH |
|
XBRL Taxonomy Extension Calculation Linkbase Document |
|
|
|
|
|
101.LAB |
|
XBRL Taxonomy Extension Label Linkbase Document |
|
|
|
|
|
101.PRE |
|
XBRL Taxonomy Extension Presentation Linkbase Document |
|
|
|
|
|
101.DEF |
|
XBRL Taxonomy Extension Definition Linkbase Document |
|
+ |
This exhibit shall not be deemed “filed” for purposes of Section 18 of the Exchange Act or otherwise subject to the liability of that Section. Such exhibit shall not be deemed incorporated into any filing under the Securities Act or the Exchange Act. |
The agreements and other documents filed as exhibits to this report are not intended to provide factual information or other disclosure other than with respect to the terms of the agreements or other documents themselves, and you should not rely on them for that purpose. In particular, any representations and warranties made by us in these agreements or other documents were made solely within the specific context of the relevant agreement or document and may not describe the actual state of affairs as of the date they were made or at any other time.
35
Pursuant to the requirements of the Securities Exchange Act of 1934, the registrant has duly caused this report to be signed on its behalf by the undersigned thereunto duly authorized.
|
|
|
BLACKSTONE REAL ESTATE INCOME TRUST, INC. |
|
|
|
|
|
May 11, 2018 |
|
/s/ Frank Cohen |
|
Date |
|
Frank Cohen |
|
|
|
Chief Executive Officer |
|
|
|
(Principal Executive Officer) |
|
|
|
|
|
May 11, 2018 |
|
/s/ Paul D. Quinlan |
|
Date |
|
Paul D. Quinlan |
|
|
|
Chief Financial Officer and Treasurer |
|
|
|
(Principal Financial Officer and |
|
|
|
Principal Accounting Officer) |
36