Attached files
| file | filename |
|---|---|
| 8-K - FORM 8-K - HANGER, INC. | tm2019999d1_8k.htm |
Exhibit 99.1

Investor Presentation May 2020 E M P O W E R I N G H U M A N P O T E N T I A L

Cautionary Note Forward Looking Statements This presentation contains statements that are forward-looking statements within the meaning of the federal securities laws. Forward-looking statements include information concerning our liquidity and our possible or assumed future results of operations, including descriptions of our business strategies. These statements often include words such as “believe,” “expect,” “project,” “potential,” “anticipate,” “intend,” “plan,” “estimate,” “seek,” “will,” “may,” “would,” “should,” “could,” “forecasts,” “model” or similar words. These statements are based on certain assumptions that we have made in light of our experience in the industry as well as our perceptions of historical trends, current conditions, expected future developments and other factors we believe are appropriate in these circumstances. We believe these judgments are reasonable, but you should understand that these statements are not guarantees of performance or results, and our actual results could differ materially from those expressed in the forward-looking statements due to a variety of important factors, both positive and negative, that may be revised or supplemented in subsequent reports. These statements involve risks, estimates, assumptions, and uncertainties that could cause actual results to differ materially from those expressed in these statements and elsewhere in this report. These uncertainties include, but are not limited to, the financial and business impacts of COVID-19 on our operations and the operations of our customers, suppliers, governmental and private payers and others in the healthcare industry and beyond; federal laws governing the health care industry; governmental policies affecting O&P operations, including with respect to reimbursement; failure to successfully implement a new enterprise resource planning system or other disruptions to information technology systems; the inability to successfully execute our acquisition strategy, including integration of recently acquired O&P clinics into our existing business; changes in the demand for our O&P products and services, including additional competition in the O&P services market; disruptions to our supply chain; our ability to enter into and derive benefits from managed-care contracts; our ability to successfully attract and retain qualified O&P clinicians; and other risks and uncertainties generally affecting the health care industry. For additional information and risk factors that could affect the Company, see its Form 10-K for the year ended December 31, 2019 and Quarterly Report on Form 10-Q for the three months ended March 31, 2020, as filed with the Securities and Exchange Commission. The information contained in this presentation is made only as of the date hereof, even if subsequently made available by the Company on its website or otherwise. Note Regarding the Presentation of non-GAAP Financial Measures: This presentation includes certain “non-GAAP financial measures” as defined in Regulation G under the federal Securities Exchange Act of 1934. Non-GAAP measures include Adjusted EBITDA, Adjusted EBITDA Margin, adjusted earnings per share, leverage ratios, free cash flow. As required under Regulation G, Reconciliations of GAAP and non-GAAP financial results are included in schedules at the Appendix. These schedules reconcile the non-GAAP financial measures included in this presentation to the most direct comparable financial measure under generally-accepted accounting principles in the United States. The non-GAAP measures contained herein are used by the Company’s management to analyze the Company’s business results and are provided for informational and analytical context. 2 E M P O W E R I N G H U M A N P O T E N T I A L

Agenda Company Overview The Orthotics and Prosthetics Market Patient Care Segment Products and Services Segment Financial Performance 3 E M P O W E R I N G H U M A N P O T E N T I A L

CompanyOverview E M P O W E R I N G H U M A N P O T E N T I A L

Hanger At Glance WHO WE ARE • • • • Industry leader in orthotics & prosthetics services $4.3 billion1 addressable O&P domestic U.S. market Pioneered prosthetic devices in 1861 Focus on custom devices BY THE NUMBERS3 • • • • • Net Revenue $1.098 billion Adjusted EBITDA2 $124.2 million 4,800 FTEs 804 clinic & satellite locations in 46 states and D.C. (as of 3.31.20) Two segments: • • Patient Care (82.5% revenue) Products & Services (17.5% revenue) 1Source: Hanger Inc. estimates 2Adjusted EBITDA is a non GAAP-measure. Please see the Appendix for a reconciliation of GAAP to non-GAAP metrics. 3TTM 12.31.19 5 E M P O W E R I N G H U M A N P O T E N T I A L

Hanger Values, Vision and Purpose O U R V A L U E S Patient-focused, integrity, outcomes, collaboration, innovation – are the heartbeat of a cultural evolution that places our patients at the core of everything we do O U R V I S I O N To lead the orthotic and prosthetic markets by providing superior patient care, outcomes, services and value O U R P U R P O S E Empowering Human Potential Together 6 E M P O W E R I N G H U M A N P O T E N T I A L

Business Mix Primary Focus on the Provision of Specialty Health Care Net Revenue1 $1.098 BILLION Adjusted EBITDA1, 2 $124.2 MILLION – 11.3% EBITDA MARGIN Patient Care $164.6 million 18.2% margin Patient Care $905.7 million 82.5% revenue Products & Ser vices $192.4 million 17.5% revenue Corporate & Other ($69.5) million Products & Ser vices $29.2 million 15.2% margin 1TTM 12.31.19. 2Adjusted EBITDA is a non-GAAP measure. Please see the Appendix for a reconciliation of GAAP to non-GAAP metrics. 7 E M P O W E R I N G H U M A N P O T E N T I A L

Investment Thesis Industry Leader Building Sustainable Competitive Advantage M A R K E T L E A D E R S I Z E A B L E M A R K E T D I F F E R E N T I A T O R S G R O W T H L E V E R S The leading provider of orthotic and prosthetic services in the United States $4.3 billion market for prescription prostheses, orthoses and prefabricated or off-the-shelf orthoses Competitive differentiation through investments in clinical outcomes, centralized revenue cycle management, patient engagement and supply chain to drive growth Multi-tier strategy to grow organically, steadily expand margins and pursue M&A to drive incremental growth opportunities Provides approximately 21% of all O&P ser vices in the United States Broad demand drivers across injuries and multiple, high prevalence disease etiologies Premier scalable provider in a large market for specialized healthcare ser vices 8 E M P O W E R I N G H U M A N P O T E N T I A L

TheOrthotics and ProstheticsMarket E M P O W E R I N G H U M A N P O T E N T I A L

Orthotics Approximately 45% of Patient Care Revenue • Orthotic devices modify the structural and functional characteristics of the neuromuscular and skeletal system Prescribed for injuries, musculoskeletal, neurological or orthopedic disorders Hanger Clinic emphasizes fabrication of customized devices • • 10 E M P O W E R I N G H U M A N P O T E N T I A L

Prosthetics Approximately 55% of Patient Care Revenue • Prosthetic devices replace a missing limb or portion of a limb Provided to patients with amputated or congenitally absent limbs to replace the function and appearance of a limb Prosthetics are customized to meet the unique location and characteristics of the patient and their residual limb Prostheses have an average useful life ranging 3-5 years • • • 11 E M P O W E R I N G H U M A N P O T E N T I A L

Prosthetics: Large & Growing Addressable Market Approximately 500,000 People Living with Major Limb Loss in the U.S. • Approximately 350,000 people with major limb loss utilize a prosthesis Over 90% are lower extremity Traumatic amputations tend to have a positive long-term prognosis Typically have a 3-5 year replacement cycle (70% recurring revenue) Prosthetics total approximately 50% of the prescription O&P market Hanger Prosthetics Sales $520,000 • • $500,000 $480,000 $460,000 • $440,000 • $420,000 $400,000 2016 2017 2018 2019 Sources: Ziegler-Graham, et al., “Estimating the Prevalence of Limb Loss in the United States: 2005 to 2050”, Arch Phys Med Rehabil 2008:89, 422-429; Dillingham et al., “Rehabilitation Setting and Associated Mortality and Medical Stability Among Persons With Amputations”, Arch Phys Med Rehabil 2008:89, 1038-1045; Ahmad N, Thomas GN, Gill P, Chan C, Torella F. Lower limb amputation in England: prevalence, regional variation and relationship with revascularisation, deprivation and risk factors. A retrospective review of hospital data. J R Soc Med 2014;107:483-9. 12 E M P O W E R I N G H U M A N P O T E N T I A L

O&P Market: $4.3 billion Diverse Disease State Mix Drives Demand Injuries Approximately 76,000 major amputations per year, 5-10% of which are due to injury. +$1 billion spent on prosthetics secondary to injury Endocrine & Circulatory Endocrine and circulatory disorders drive the majority of major amputations. Mix of prosthetics and orthotics Musculoskeletal Disease Arthritis, spinal and foot disease requiring braces, boots and supports. Orthotics-only market Other Congenital, cancer and acute infections. May require prosthetics (i.e. congenital limb difference) or orthotics (i.e. cranial orthosis for plagiocephaly) Ner vous System 795,000 strokes per year – 75% occur in people +65, cerebral palsy, multiple sclerosis. Ankle-foot orthosis, braces $1,600 $1.4 $1,400 $1,200 $1,000 $800 $600 $400 $200 $0 $ millions Addressable market currently growing at 1.5-2.0% annually Sources: Hanger Estimates Note: “Major amputation or limb loss refers to a lower extremity, above or below the knee and upper limb, or combination thereof” 13 E M P O W E R I N G H U M A N P O T E N T I A L $1.2 $1.0 $0.5 $0.2

Patient CareSegment E M P O W E R I N G H U M A N P O T E N T I A L
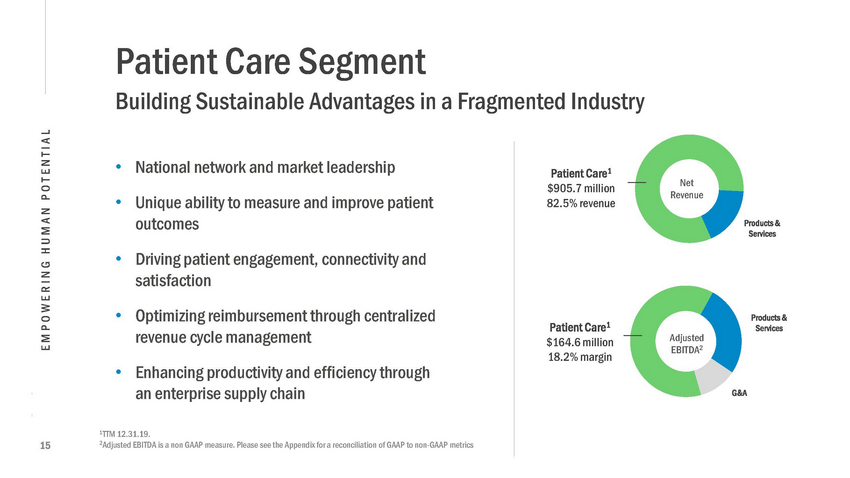
Patient Care Segment Building Sustainable Advantages in a Fragmented Industry • • National network and market leadership Unique ability to measure and improve patient outcomes Driving patient engagement, connectivity and satisfaction Optimizing reimbursement through centralized revenue cycle management Enhancing productivity and efficiency through an enterprise supply chain Patient Care1 $905.7 million 82.5% revenue Net Revenue Products & Services • • Products & Services Patient Care1 $164.6 million 18.2% margin Adjusted EBITDA2 • G&A 1TTM 12.31.19. 2Adjusted EBITDA is a non GAAP measure. Please see the Appendix for a reconciliation of GAAP to non-GAAP metrics 15 E M P O W E R I N G H U M A N P O T E N T I A L

General Lower Extremity Patient Rehab Timeline Hanger provides comprehensive patient care for a lifetime Pre-Op Post-Op Recovery Healing Initial Device Maturation Definitive Device Holistic Care Schedule • Apply post-op protector • Remove sutures • Incision fully healed • Fit first prosthesis • Limb volume stabilization • First definitive prosthesis delivery • Follow-up adjustments prosthetist & pre-op peer visit • Wear shrinker to manage limb volume • Measure for prosthesis • Prosthetic gait training • Patient events and continued peer support • Schedule post-op peer visit • Ongoing therapy and prosthetic adjustments • Patient continues to work toward long term rehab goals • Device replacements every 3 – 5 years. • Begin limb shaping and pre-prosthetic training • Initial prosthetic evaluation 16 Note: Example timeline for a new amputee reflects a general rehabilitation for a lower extremity vascular amputation patient, actual experiences vary. Replacement devices average a 45-60 day replacement cycle. E M P O W E R I N G H U M A N P O T E N T I A L

Scale as a Competitive Advantage National Network Brings Hanger Closer to the Community 8 0 0 + PAT I E N T C A R E L O C AT I O N S 1 , 6 0 0 C L I N I C I A N S Hanger employs over 20% of the board certified O&P clinicians in the U.S. Competitors are spread out in small local practitioner settings Hanger is the only O&P provider operating a nationwide network of patient care clinics in 46 states and D.C. N AT I O N W I D E N E T W O R K 2 M I L L I O N A N N U A L PAT I E N T E N C O U N T E R S Hanger has the highest volume of O&P patients as compared with any provider Enables Hanger to develop and deliver best practices in O&P care Hanger’s broad provider footprint allows for a healthy diversity of payor and referral sources Geographic diversity insulates Hanger from local or market specific challenges Hanger Patient Care Clinics 17 E M P O W E R I N G H U M A N P O T E N T I A L

Market Leader In a Fragmented Industry • Hanger currently operates 804 patient care locations nationally O&P Patient Care Clinic Market (by location) • • 694 patient care clinics 110 satellite locations Veteran’s Administration • • • 21% of private O&P clinics in the nation VA: Next largest at 2% Rest of market is comprised of diverse small providers 79 Rest of Market 335 10 next largest O&P providers •Ranging from 22-68 clinics •Average of 34 clinics Approximately 3,300 Clinics1 2,185 694 Hanger Clinic 1Total clinic count includes VA plus approximately 3,200 private sector certified clinics. Source: American Board For Certification 2019. Figures reflect Hanger as of 3.31.20 18 E M P O W E R I N G H U M A N P O T E N T I A L

Patient Engagement & Connectivity Enhance Consistency, Quality of Patient Experience Strategic initiatives that engage and connect our community, measure and improve patient satisfaction, driving growth • • • Clinician and peer visitors Net promoter score: Average of 84 (Healthcare industry average – 75) Outcomes, patient satisfaction and quality life tracked and reported at the patient and referral source level Patient events designed to support mobility and utilization of devices Comprehensive social media programs including patient and clinician stories as well as community outreach • • 19 E M P O W E R I N G H U M A N P O T E N T I A L

Clinical Focus Implementing Clinical on Patient Outcomes Care Standards and Demonstrating Value C L I N I C A L T E A M A N D S E N I O R L E A D E R S H I P T E C H N O L O G Y A N D P R O C E S S Enterprise-wide electronic health record captures more O&P clinical outcomes than any other source Implementing a patient portal O U T C O M E S , R E S E A R C H A N D E D U C A T I O N Comprehensive outcomes programs across Hanger Clinic, as standard of care Collaborations with leading clinical and academic institutions Six multi-center publications released to measure the impact of prosthetics on mobility Annual education conference • • Chief Clinical Officer and clinical leadership group 1,600+ certified/licensed clinicians 500 technicians and assistants Specialists and centers of excellence • • • • • • • • Agenda expanding beyond prosthetics in 2020 to orthotics and health economics 20 E M P O W E R I N G H U M A N P O T E N T I A L

Revenue Cycle Management Central Function Drives Disallowed Revenue Lower • Operate within DMEPOS fee schedules • O&P requires highly specialized customized devices • Patient population is high acuity (similar to an acute setting) with volume of ambulatory care Importance of detailed documentation and demonstration of medical necessity, supported by referring provider records • • Requires specialized knowledge of claim management, edits and denials management • Central RCM significantly reduces clinician burden, allowing for focus on patient care 21 E M P O W E R I N G H U M A N P O T E N T I A L

Advancing Supply Chain Capabilities Transforming Through Technology and Process Re-engineering Industry Leading Product Selection Same-Day Shipments 90+% E-Commerce Ordering Enhanced Product Descriptions & Website Features Vendor Consignment Lower excess shipment costs through inventory optimization* Lower In-Bound Freight Costs* Optimize Hanger Fabrication Network w/ Best-In-Class Systems to Reduce Costs* Hanger Distribution Center Throughput & Productivity Increases Materially* 22 *These capabilities are currently paused due to the impact of the COVID-19 pandemic and management’s asset allocation decisions. This representation is subject to additional change. E M P O W E R I N G H U M A N P O T E N T I A L 2 0 1 920202 0 2 1202220232 0 2 4

Productsand ServicesSegment E M P O W E R I N G H U M A N P O T E N T I A L

Products and Ser vices National Scale Supports Profitable Growth Distribution of O&P components & related devices through SPS (75% of segment net revenue) Patient Care Products & Services $192.4 million 17.5% revenue • • • 5.4% net revenue growth in 2019 Comprehensive catalog for independent O&P providers One-stop O&P industry destination with access to over 450,000 SKUs across more than 300 manufactures Leading dedicated O&P distributor in the industry Net Revenue1 • Therapeutic solutions features innovative rehabilitation technology through ACP (25% of segment net revenue) Products & Services $29.2 million 15.2% margin • Rehabilitation technologies and clinical programs to skilled nursing facilities (SNFs) Has faced headwinds due to challenging conditions and the reimbursement environment in SNFs Initial signs of stabilization in late 2019 Patient Care Adjusted EBITDA2 • • G&A 1TTM 12.31.19. 2Adjusted EBITDA is a non GAAP measure. Please see the Appendix for a reconciliation of GAAP to non-GAAP metrics. 24 E M P O W E R I N G H U M A N P O T E N T I A L

FinancialPerformance E M P O W E R I N G H U M A N P O T E N T I A L
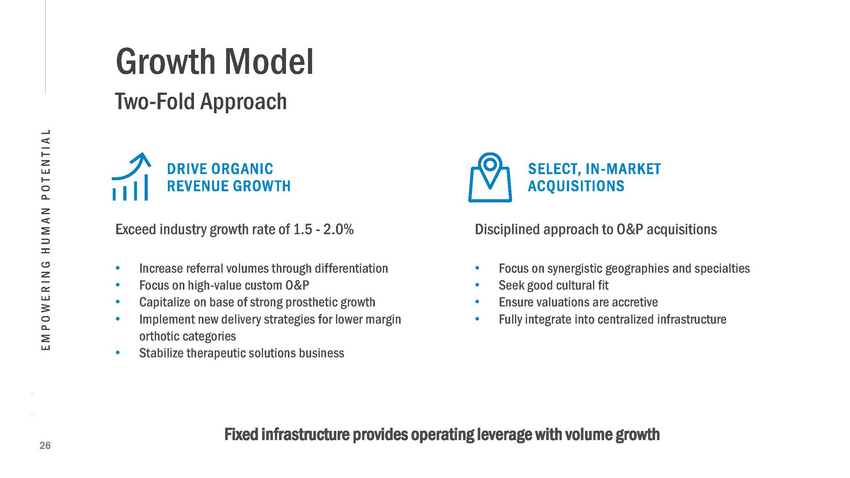
Growth Model Two-Fold Approach D R I V E O R G A N I C R E V E N U E G R O W T H S E L E C T, I N - M A R K E T A C Q U I S I T I O N S Exceed industr y growth rate of 1.5 - 2.0% Disciplined approach to O&P acquisitions • • • • Increase referral volumes through differentiation Focus on high-value custom O&P Capitalize on base of strong prosthetic growth Implement new delivery strategies for lower margin orthotic categories Stabilize therapeutic solutions business • • • • Focus on synergistic geographies and specialties Seek good cultural fit Ensure valuations are accretive Fully integrate into centralized infrastructure • Fixed infrastructure provides operating leverage with volume growth 26 E M P O W E R I N G H U M A N P O T E N T I A L

Financial Results $ millions First Quarter 2020 and 2019 Annual Revenue Performance P A T I E N T C A R E H A S D R I V E N R E V E N U E G R O W T H Y E A R 2 0 1 9 F I R S T Q U A R T E R ‘ 2 0 $1,098.0 • 2019: Patient Care segment grew 5.6%; 2019 annual same clinic, day-adjusted growth of 2.1%, with prosthetics growth of 3.2% and orthotics growth of 0.9% Products & Services segment revenue grew $1,048.8 • 0.5% as growth is distribution services was offset by an anticipated decline in therapeutic solutions Q1 2020: After a strong start to 2020, first • quarter same clinic, day-adjusted growth declined 3.2%, due primarily from lower patient volumes as a result of the COVID-19 pandemic in the second half of March Product & Services segment revenue declined in Q1 mostly driven by the impact of the pandemic as well as the intentional exit of certain third party channels for some orthotics componentry • 2018 2019 2020 27 E M P O W E R I N G H U M A N P O T E N T I A L +4.7% $236.4$233.7 -1.1%
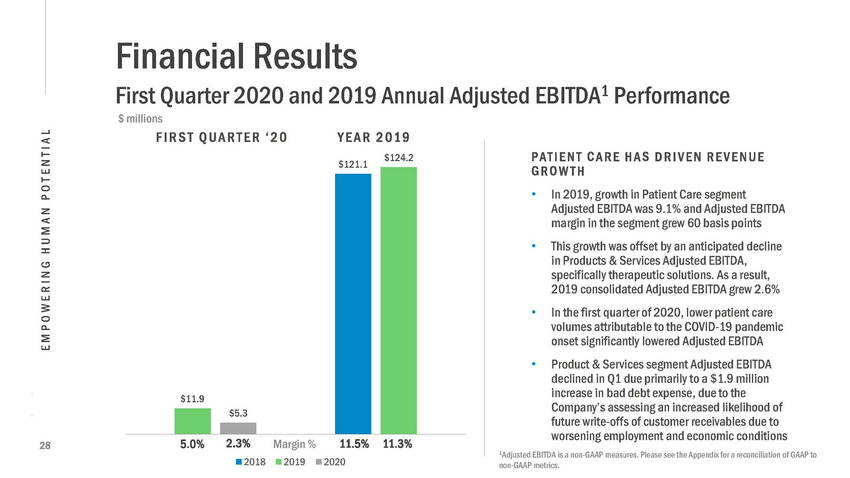
Financial Results $ millions Adjusted EBITDA1 Performance First Quarter 2020 and 2019 Annual F I R S T Q U A R T E R ‘ 2 0 Y E A R $121.1 2 0 1 9 $124.2 P A T I E N T C A R E H A S D R I V E N R E V E N U E G R O W T H • In 2019, growth in Patient Care segment Adjusted EBITDA was 9.1% and Adjusted EBITDA margin in the segment grew 60 basis points This growth was offset by an anticipated decline in Products & Ser vices Adjusted EBITDA, specifically therapeutic solutions. As a result, 2019 consolidated Adjusted EBITDA grew 2.6% In the first quarter of 2020, lower patient care volumes attributable to the COVID-19 pandemic onset significantly lowered Adjusted EBITDA Product & Ser vices segment Adjusted EBITDA declined in Q1 due primarily to a $1.9 million increase in bad debt expense, due to the Company’s assessing an increased likelihood of future write-offs of customer receivables due to worsening employment and economic conditions • • • 2.3% 5.0% Margin % 11.5% 2020 11.3% 28 1Adjusted EBITDA is a non-GAAP measures. Please see the Appendix for a reconciliation of GAAP to non-GAAP metrics. 2018 2019 E M P O W E R I N G H U M A N P O T E N T I A L $11.9 $5.3

Same Clinic Rate of Growth Net Revenue on Per Day Basis Quarterly % Change1 3.0% 2.9% 1.7% 1.1% 0.6% -3.2% Q1 17 Q2 17 Q3 17 Q4 17 Q1 18 Q2 18 Q3 18 Q4 18 Q1 19 Q2 19 Q3 19 Q419 Q1 20 1Same clinic revenue growth per day excludes the effect of change in rate of disallowances for 2017. Beginning in 2018, Hanger instituted reporting same clinic revenue growth per day that includes the impact of disallowed revenue, as this measure now better reflects year -year changes. 29 E M P O W E R I N G H U M A N P O T E N T I A L 2.1%2.1% 2.1% 0.9% 0.3% -0.1% -0.9% Impact of COVID-19 Beginning in the last two weeks of March, 2020

Payor Mix and Accounts Receivable Trend Multi-Year Improvements in Working Capital Conversion Payor Mix, Percentage of Patient Care Net Revenue1 Accounts Receivable, net (green bars) $ millions Day Sales Outstanding (orange line) 60 55 50 45 40 35 30 200 180 160 140 120 100 80 60 40 20 0 DSO 48 and A/R Peak in late 2014 balance at $159 VA 35% Commercial 9% 7% Private Pay 16% 33% Medicaid Medicare 20142015 2016 2017 2018 2019 B A L A N C E S A S O F D E C E M B E R 3 1 • • • Commercial mix excludes Medicare and Medicaid Managed Care Diverse reimbursement mix combined with improved A/R aging has driven stronger working capital characteristics 50 Day Days Sales Outstanding as of 3.31.20 (decline 2 days year/year) 30 1 As of 3.31.20 E M P O W E R I N G H U M A N P O T E N T I A L million
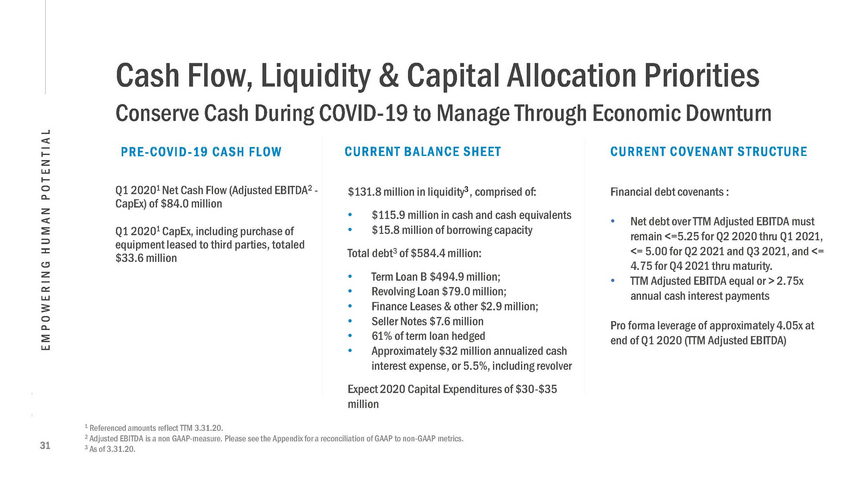
Cash Flow, Liquidity & Capital Allocation Priorities Conserve Cash During COVID-19 to Manage Through Economic Downturn C U R R E N T C O V E N A N T S T R U C T U R E P R E - C O V I D - 1 9 C A S H F L O W C U R R E N T B A L A N C E S H E E T Q1 20201 Net Cash Flow (Adjusted EBITDA2 - CapEx) of $84.0 million $131.8 million in liquidity3 , comprised of: Financial debt covenants : • • $115.9 million in cash and cash equivalents $15.8 million of borrowing capacity • Net debt over TTM Adjusted EBITDA must remain <=5.25 for Q2 2020 thru Q1 2021, <= 5.00 for Q2 2021 and Q3 2021, and <= 4.75 for Q4 2021 thru maturity. TTM Adjusted EBITDA equal or > 2.75x annual cash interest payments Q1 20201 CapEx, including purchase of equipment leased to third parties, totaled $33.6 million Total debt3 of $584.4 million: • • • • • • Term Loan B $494.9 million; Revolving Loan $79.0 million; Finance Leases & other $2.9 million; Seller Notes $7.6 million 61% of term loan hedged Approximately $32 million annualized cash interest expense, or 5.5%, including revolver • Pro forma leverage of approximately 4.05x at end of Q1 2020 (TTM Adjusted EBITDA) Expect 2020 Capital Expenditures of $30-$35 million 1 Referenced amounts reflect TTM 3.31.20. 2 Adjusted EBITDA is a non GAAP-measure. Please see the Appendix for a reconciliation of GAAP to non-GAAP metrics. 3 As of 3.31.20. 31 E M P O W E R I N G H U M A N P O T E N T I A L
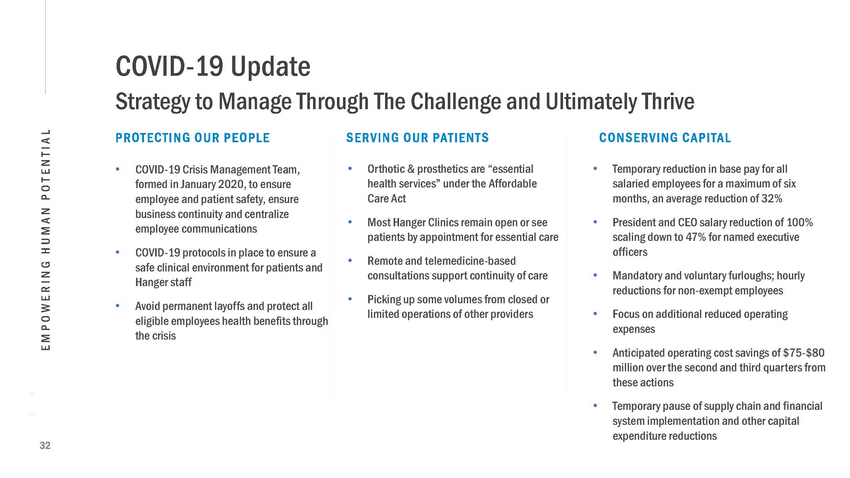
COVID-19 Update Strategy to Manage Through The Challenge and Ultimately Thrive P R O T E C T I N G O U R P E O P L E S E R V I N G O U R P A T I E N T S C O N S E R V I N G C A P I T A L • COVID-19 Crisis Management Team, formed in January 2020, to ensure employee and patient safety, ensure business continuity and centralize employee communications COVID-19 protocols in place to ensure a safe clinical environment for patients and Hanger staff Avoid permanent layoffs and protect all eligible employees health benefits through the crisis • Orthotic & prosthetics are “essential health services” under the Affordable Care Act Most Hanger Clinics remain open or see patients by appointment for essential care Remote and telemedicine-based consultations support continuity of care Picking up some volumes from closed or limited operations of other providers • Temporary reduction in base pay for all salaried employees for a maximum of six months, an average reduction of 32% President and CEO salary reduction of 100% scaling down to 47% for named executive officers Mandatory and voluntary furloughs; hourly reductions for non-exempt employees Focus on additional reduced operating expenses Anticipated operating cost savings of $75-$80 million over the second and third quarters from these actions Temporary pause of supply chain and financial system implementation and other capital expenditure reductions • • • • • • • • • • 32 E M P O W E R I N G H U M A N P O T E N T I A L

Investment Thesis Industry Leader Building Sustainable Competitive Advantage M A R K E T L E A D E R S I Z E A B L E M A R K E T D I F F E R E N T I A T O R S G R O W T H L E V E R S The leading provider of orthotic and prosthetic services in the United States $4.3 billion market for prescription prostheses, orthoses and prefabricated or off-the-shelf orthoses Competitive differentiation through investments in clinical outcomes, centralized revenue cycle management, patient engagement and supply chain to drive growth Multi-tier strategy to grow organically, steadily expand margins and pursue M&A to drive incremental growth opportunities Provides approximately 21% of all O&P ser vices in the United States Broad demand drivers across injuries and multiple, high prevalence disease etiologies Premier scalable provider in a large market for specialized healthcare ser vices 33 E M P O W E R I N G H U M A N P O T E N T I A L

AppendixNon-GAAP Reconciliations E M P O W E R I N G H U M A N P O T E N T I A L

Net Income to Adjusted EBITDA 2019-2017 For the Ye a rs Ende d De ce mber 31, 2019 2018 2017 Net income (loss) - as reported (GAAP) $ 27,525 (858) (104,671) Adjustments to calculate EBITDA: Depreciation and amortization Interest expense, net Loss on extinguishment of debt Non-service defined benefit plan expense Provision for income taxes Adjustments - Net income (loss) to EBITDA EBITDA (Non-GAAP) 35,925 34,258 — 691 36,455 37,566 16,998 703 39,259 57,688 — 736 2,954 5,238 27,297 73,828 96,960 124,980 101,353 96,102 20,309 Further adjustments to calculate Adjusted EBITDA: Impairment of intangible assets Third-party professional fees Equity-based compensation Acquisition-related expenses Disaster recovery / unclaimed property settlement Severance expenses Further adjustments - EBITDA to Adjusted EBITDA Adjusted EBITDA (Non-GAAP) — 8,548 13,414 939 — (11) 183 12,461 13,065 510 (2,221) 54,735 32,301 12,930 — — 957 64 22,890 24,955 100,030 $ 124,243 $ 121,057 $ 120,339 35 E M P O W E R I N G H U M A N P O T E N T I A L

Net Income to Adjusted EBITDA TTM March 31 2020 v. TTM March 31 2019 For the Twelve Months Ended March 31, 2020 2019 Net loss - as reported (GAAP) $ 18,728 $ 14,809 Adjustments to calculate EBITDA: Depreciation and amortization Interest expense, net Loss on extinguishment of debt Non-service defined benefit plan expense Benefit for income taxes Adjustments - Net (loss) income to EBITDA EBITDA (Non-GAAP) 35,983 33,989 — 676 35,898 33,841 — 700 4,841 7,695 75,489 78,134 94,217 92,943 Further adjustments to calculate Adjusted EBITDA: Impairment of intangible assets Third-party professional fees Equity-based compensation Acquisition-related expenses Hanger Supply Chain implementation costs Disaster recovery / unclaimed property settlement Severance expenses Further adjustments - EBITDA to Adjusted EBITDA Adjusted EBITDA (Non-GAAP) — 8,537 13,650 1,102 135 — (1) 183 10,410 13,746 680 — (2,221) 947 23,423 23,745 36 $ 117,640 $ 116,688 E M P O W E R I N G H U M A N P O T E N T I A L

Net Income to Segment Adjusted EBITDA For the Three Months Ended For the Years Ended March 31, December 31, 2020 2019 2019 2018 Patient Care Income from operations - as reported (GAAP) Depreciation & amortization EBITDA (Non-GAAP) Further adjustments to calculate Adjusted EBITDA: Equity based compensation Hanger Supply Chain implementation costs Severance expenses Further adjustments - EBITDA to Adjusted EBITDA Adjusted EBITDA (Non-GAAP) $ 11,537 $ 15,757 $ 141,576 $ 126,805 4,476 4,552 18,541 19,113 16,013 20,309 160,117 145,918 1,178 135 1,094 — 4,446 — (11) 4,372 — 591 — (11) 1,313 1,083 4,435 4,963 17,326 21,392 164,552 150,881 Products & Services Income from operations - as reported (GAAP) Depreciation & amortization EBITDA (Non-GAAP) Further adjustments to calculate Adjusted EBITDA: Impairment of intangible assets Equity based compensation Severance expenses Further adjustments - EBITDA to Adjusted EBITDA Adjusted EBITDA (Non-GAAP) 2,080 4,098 17,965 25,523 2,752 2,543 10,650 10,197 4,832 6,641 28,615 35,720 — 205 — 244 — 608 183 600 — — — — 205 244 608 783 5,037 6,885 29,223 36,503 Corporate & Other Loss from operations - as reported (GAAP) Depreciation & amortization EBITDA (Non-GAAP) Further adjustments to calculate Adjusted EBITDA: Third-party professional fees Equity based compensation Acquisition related expenses Disaster recovery / unclaimed property settlement Severance expenses Further adjustments - EBITDA to Adjusted EBITDA Adjusted EBITDA (Non-GAAP) Total Adjusted EBITDA (Non-GAAP) (22,790) (21,834) (94,113) (92,681) 1,603 1,678 6,734 7,145 (21,187) (20,156) (87,379) (85,536) 1,638 2,118 333 — 1,649 1,927 170 — 8,548 8,360 939 — 12,461 8,093 510 (2,221) — 1 — 366 4,089 3,747 17,847 19,209 37 (17,098) (16,409) (69,532) (66,327) $ 5,265 $ 11,868 $ 124,243 $ 121,057 E M P O W E R I N G H U M A N P O T E N T I A L

Adjusted EBITDA Margin: First Quarter 2020 v. 2019 and Year 2019 v. 2018 For the Three Months Ended For the Years Ended March 31, December 31, 2020 2019 2019 2018 Net Revenue (a) Patient Care Products & Services Net revenue $ 190,183 $ 190,601 $ 905,691 $ 857,382 43,556 45,818 192,355 191,378 $ 233,739 $ 236,419 $ 1,098,046 $ 1,048,760 EBITDA (b) Patient Care Products & Services Corporate & Other EBITDA (Non-GAAP) $ 16,013 4,832 $ 20,309 6,641 $ 160,117 28,615 $ 145,918 35,720 (21,187) (20,156) (87,379) (85,536) (342) $ 6,794 $ 101,353 $ 96,102 Adjusted EBITDA (b) Patient Care Products & Services Corporate & Other Adjusted EBITDA (Non-GAAP) $ 17,326 5,037 $ 21,392 6,885 $ 164,552 29,223 $ 150,881 36,503 (17,098) (16,409) (69,532) (66,327) $ 5,265 $ 11,868 $ 124,243 $ 121,057 Adjusted EBITDA Margin (Non-GAAP) Patient Care Products & Services Net revenue 9.1 11.6 2.3 % % % 11.2 15.0 5.0 % % % 18.2 15.2 11.3 % % % 17.6 19.1 11.5 % % % 38 (a) Excludes intersegment revenue (b) EBITDA and Adjusted EBITDA are "Non-GAAP" measures E M P O W E R I N G H U M A N P O T E N T I A L