Attached files
| file | filename |
|---|---|
| EX-21 - EX-21 - HANGER, INC. | a2213255zex-21.htm |
| EX-32 - EX-32 - HANGER, INC. | a2213255zex-32.htm |
| EX-23.1 - EX-23.1 - HANGER, INC. | a2213255zex-23_1.htm |
| EX-31.1 - EX-31.1 - HANGER, INC. | a2213255zex-31_1.htm |
| EX-31.2 - EX-31.2 - HANGER, INC. | a2213255zex-31_2.htm |
| EX-10.22 - EX-10.22 - HANGER, INC. | a2213255zex-10_22.htm |
| EX-10.24 - EX-10.24 - HANGER, INC. | a2213255zex-10_24.htm |
Use these links to rapidly review the document
Table of contents
TABLE OF CONTENTS 2
SECURITIES AND EXCHANGE COMMISSION
WASHINGTON, D.C. 20549
FORM 10-K
ý |
ANNUAL REPORT PURSUANT TO SECTION 13 OR 15(d) OF THE SECURITIES EXCHANGE ACT OF 1934. |
|
For the fiscal year ended December 31, 2012 |
||
OR |
||
o |
TRANSITION REPORT PURSUANT TO SECTION 13 OR 15(d) OF THE SECURITIES EXCHANGE ACT OF 1934. |
|
For the transition period from to |
||
Commission File Number 1-10670
HANGER, INC.
(Exact name of registrant as specified in its charter.)
| Delaware (State or other jurisdiction of incorporation or organization) |
84-0904275 (I.R.S. Employer Identification No.) |
|
10910 Domain Drive, Suite 300, Austin, TX (Address of principal executive offices) |
78758 (Zip Code) |
Registrant's phone number, including area code: (512) 777-3800
Securities registered pursuant to Section 12(b) of the Act:
| Title of class | Name of exchange on which registered | |
|---|---|---|
| Common Stock, par value $0.01 per share | New York Stock Exchange |
Securities registered pursuant to Section 12(g) of the Act: None.
Indicate by check mark if the registrant is a well-known seasoned issuer, as defined in Rule 405 of the Securities Act Yes ý No o
Indicate by check mark if the registrant is not required to file reports pursuant to Section 13 or Section 15(d) of the Act. Yes o No ý
Indicate by check mark whether the registrant (1) has filed all reports required to be filed by Section 13 or 15(d) of the Securities Exchange Act of 1934 during the preceding 12 months (or for such shorter period that the registrant was required to file such reports), and (2) has been subject to such filing requirements for the past 90 days: Yes ý No o
Indicate by check mark whether the registrant has submitted electronically and posted on its corporate Web site, if any, every Interactive Data File required to be submitted and posted pursuant to Rule 405 of Regulation S-T (232.405 of this chapter) during the preceding 12 months (or for such shorter period that the registrant was required to submit and post such files). Yes ý No o
Indicate by check mark if disclosure of delinquent filers pursuant to Item 405 of Regulation S-K (229.405 of this chapter) is not contained herein, and will not be contained, to the best of registrant's knowledge, in definitive proxy or information statements incorporated by reference in Part III of this Form 10-K or any amendment to this Form 10-K. o
Indicate by check mark whether the registrant is a large accelerated filer, an accelerated filer, or a non-accelerated filer, or a smaller reporting company. See definition of "accelerated filer," "large accelerated filer" and "smaller reporting company" in Rule 12b-2 of the Exchange Act. (Check one).
| Large accelerated filer ý | Accelerated filer o | Non-accelerated filer o (Do not check if a smaller reporting company) |
Smaller reporting company o |
Indicate by check mark whether the registrant is a shell company (as defined in Rule 12b-2 of the Exchange Act). Yes o No ý
State the aggregate market value of the voting and non-voting common equity held by non-affiliates computed by reference to the price at which the common equity was last sold, or the average bid and asked price of such common equity, as of the last business day of the registrant's most recently completed second fiscal quarter. $910,325,124
As of March 14, 2013 the registrant had 34,513,913 shares of its Common Stock issued and outstanding.
DOCUMENTS INCORPORATED BY REFERENCE
The information called for by Part III of the Form 10-K is incorporated by reference from the registrant's definitive proxy statement or amendment hereto which will be filed not later than 120 days after the end of the fiscal year covered by this report.
Business Overview
General
The goal of Hanger, Inc. (the "Company") is to be the world's premier provider of services and products that enhance human physical capabilities. Built on the legacy of James Edward Hanger, the first amputee of the American Civil War, Hanger is steeped in 150 years of clinical excellence and innovation. We provide orthotic and prosthetic patient care services, distribute O&P devices and components, manage O&P networks, and provide therapeutic solutions to the broader post-acute market. Through our subsidiary, Hanger Prosthetics & Orthotics, Inc., which we refer to as "Hanger Clinic," we are the largest owner and operator of orthotic and prosthetic patient care clinics in the United States and, through our distribution subsidiary, Southern Prosthetic Supply, Inc. ("SPS"), we are one of the largest distributors of O&P products in the United States. We operate in excess of 740 O&P patient care clinics located in 45 states and the District of Columbia and six strategically located distribution facilities. In addition to providing O&P services and products, we manage an O&P provider network and develop programs to manage all aspects of O&P patient care for insurance companies through our subsidiary, Linkia LLC ("Linkia"). We also provide therapeutic solutions through our subsidiaries Innovative Neurotronics ("IN, Inc.") and Accelerated Care Plus Corp. ("ACP"). IN, Inc. introduces emerging neuromuscular technologies developed through independent research in a collaborative effort with industry suppliers worldwide. ACP is a developer of specialized rehabilitation technologies and a leading provider of evidence-based clinical programs for post-acute rehabilitation serving more than 4,550 long-term care facilities and other sub-acute rehabilitation providers throughout the U.S.
For the years ended December 31, 2012, 2011, and 2010, our net sales were $985.6 million, $918.5 million, and $817.4 million, respectively. We recorded net income of $63.7 million, $54.5 million, and $20.9 million, for the years ended December 31, 2012, 2011, and 2010, respectively.
We have three segments—Patient Care, Distribution, and Therapeutic Solutions. The following table summarizes the percentage of total revenue derived from each segment:
| |
For the year ended December 31, |
|||||||||
|---|---|---|---|---|---|---|---|---|---|---|
| |
2012 | 2011 | 2010 | |||||||
Patient Care |
82.5 | % | 82.1 | % | 87.5 | % | ||||
Distribution |
10.9 | % | 10.9 | % | 11.7 | % | ||||
Therapeutic Solutions |
6.6 | % | 7.0 | % | 0.8 | % | ||||
See Note O to our Consolidated Financial Statements contained herein elsewhere in this Annual Report on Form 10-K for financial information about our segments.
Industry Overview
We estimate that approximately $4.3 billion is spent in the United States each year for orthotic and prosthetic products and services, of which Hanger Clinic currently accounts for approximately 19%. Hanger Clinic provides a unique portfolio of orthotic, prosthetic, post-operative and physical therapeutic solutions to patients in the acute, post-acute, and patient care clinic settings.
The traditional O&P patient care industry is highly fragmented and is characterized by local, independent O&P businesses, with the majority of these businesses generally having a single facility with annual revenues of less than $1.0 million. We do not believe that any single competitor accounts for more than 2% of the country's total estimated O&P patient care clinic revenues.
1
The traditional O&P patient care clinic industry is characterized by stable, recurring revenues, primarily resulting from new patients as well as the need for periodic replacement and modification of O&P devices. Based on our experience, the average replacement time for orthotic devices is one to three years, while the average replacement time for prosthetic devices is three to five years. There is also an attendant need for continuing O&P patient care services. In addition to the inherent need for periodic replacement and modification of O&P devices and continuing care, we expect the demand for O&P services to continue to grow as a result of several key trends, including the aging of the U.S. population, resulting in an increase in the prevalence of disease associated disability, and the demand for new and advanced devices.
We estimate that approximately $2.1 billion is spent in the United States each year for O&P products, components, devices and supplies. SPS distributes O&P products, components, devices and supplies to independent customers and to Hanger Clinic's patient care clinics, and accounts for approximately 5% of the $2.1 billion market.
We estimate the market for rehabilitation technologies and clinical programs in post-acute rehabilitation to include approximately 15,700 skilled nursing facilities (SNF) with an annual sales potential of approximately $240 million. We currently provide technologically advanced rehabilitation equipment and clinical programs to approximately 29% of these SNFs. We estimate the market for rehabilitation technologies and clinical programs in broader post-acute rehabilitation to be approximately $600 million. We currently provide goods and services to very few customers in this portion of the market; however, we believe this market would benefit from our products and services.
Business Strategy
Our goal is to be the provider of choice for products and services that enhance human physical capabilities. We focus on disciplined diversification of our revenue streams both within our traditional orthotic and prosthetics market and in complimentary and adjacent markets that expand our continuum of care. In addition, we continue to focus on gaining operational efficiencies and expanding the market share of our core businesses. We have implemented a strategy of disciplined diversification through internal efforts by developing businesses such as IN, Inc., Linkia, Dosteon, and CARES in the O&P market, and in adjacent markets through the acquisition of SureFit and ACP.
Our internal efforts focus on leveraging the resources and expertise of our core O&P patient care services business in order to provide additional products and services to our patients. IN, Inc. was created to bring innovative applications and product technologies to the O&P marketplace. IN, Inc. manufactures and markets two highly sophisticated products focused on improving people's mobility and independence, the WalkAide system and the V-Hold system. Our knowledge of the O&P market place enabled us to create Linkia, which is the only O&P provider network management service company. Linkia functions as a liaison between O&P providers and third party health insurance companies. Linkia provides insurance payors with data and administrative services that allow these payors to provide higher quality, more efficient O&P care to its insured; in return this solidifies our relationship with payors and allows us to negotiate favorable national or regional contracts.
We continually assess market opportunities to identify additional opportunities to leverage our footprint and expertise beyond the traditional O&P patient care clinic market channel. We have developed two new channels of revenue in recent years: CARES and Dosteon. CARES is a program that works with hospital emergency rooms to provide a wide variety of orthotic and durable medical equipment ("DME") products to patients, while Dosteon partners with physicians' offices, such as orthopedic and vascular surgeons to provide for the postoperative orthotic and DME needs of their patients. These businesses, along with their dedicated sales personnel, help us expand in markets not previously served by our traditional brick and mortar facilities. We are encouraged by the progress of these businesses and their contribution to the growth of our patient care business.
2
We continually look to diversify our revenue streams outside of our core O&P business. We have executed this through the acquisition of SureFit and ACP. SureFit, which is a part of our Distribution business, expanded our continuum of care into the podiatry market by providing custom shoe inserts and shoes. ACP, when combined with IN, Inc., comprises our Therapeutic Solutions segment. Therapeutic Solutions provides the platform to expand into the post-acute and other rehabilitation markets by providing technologically advanced therapeutic equipment and related clinical protocols which enhance the productivity and outcomes of rehabilitative care. We also look to leverage the relationships we have with the rehabilitation providers in order to provide our traditional O&P offerings to their patients.
It is also our goal to continue to provide superior patient care and to be the most cost-efficient national distributor of O&P products, components, devices, and supplies. The key elements of our strategy to achieve this goal are to:
- •
- Improve our performance by:
- •
- investing in and developing new processes to improve the productivity of our clinicians and our distribution centers,
including the use of scanning technology as well as development of a comprehensive electronic clinic management system;
- •
- continuing periodic patient follow-up visits to measure patient satisfaction as well as the functionality of
their device;
- •
- improving the utilization and efficiency of administrative and corporate support services;
- •
- enhancing margins through continued consolidation of vendors and product offering; and
- •
- leveraging our market share to increase sales and improve pricing.
- •
- Increase our market share and net sales by:
- •
- continued marketing of Linkia to regional and national providers and contracting with national and regional managed care
providers who we believe select us as a preferred O&P provider because of our reputation, national reach, density of the network and our ability to monitor quality and outcomes while reducing
administrative expenses;
- •
- increasing the volume of our patient care business through enhanced comprehensive marketing programs aimed at referring
physicians and patients. Our Patient Education Clinics program informs patients of technological improvements which may benefit them by further improving their mobility, and also provides an
opportunity to have their devices inspected and serviced if necessary. The "People in Motion" program also introduces potential patients to the latest O&P technology;
- •
- expanding the breadth of products being offered through our Distribution segment and our patient care clinics;
- •
- increasing the number of clinicians through our residency program; and
- •
- selectively acquiring small and medium-sized O&P patient care service businesses to expand our presence within an existing market and enter into new markets.
Business Description
Patient Care
As of December 31, 2012, Hanger Clinic provided O&P patient care services through over 740 patient care clinics and over 1,300 clinicians in 45 states and the District of Columbia. Substantially all of our clinicians are certified, or are candidates for formal certification, by the O&P industry certifying boards.
3
A clinician manages each of our patient care clinics. Our patient care clinics also employ highly trained technical personnel who assist in the provision of services to patients and who fabricate various O&P devices, as well as office administrators who schedule patient visits, obtain approvals from payors and bill and collect for services rendered.
In our orthotics business, we design, fabricate, fit and maintain a wide range of custom-made braces and other devices (such as spinal, knee and sports-medicine braces) that provide external support to patients suffering from musculoskeletal disorders, such as ailments of the back, extremities or joints and injuries from sports or other activities. In our prosthetics business, we design, fabricate, fit and maintain custom-made artificial limbs for patients who are without limbs as a result of traumatic injuries, vascular diseases, diabetes, cancer or congenital disorders. O&P devices are increasingly technologically advanced and are custom-designed to add functionality and comfort to patients' lives, shorten the rehabilitation process and lower the cost of rehabilitation. Patients are typically referred to Hanger Clinic by an attending physician who determines a patient's treatment and writes a prescription. Our clinicians then consult with both the referring physician and the patient with a view toward assisting in the design of an orthotic or prosthetic device to meet the patient's needs.
The fitting process often involves several stages in order to successfully achieve desired functional and cosmetic results. Custom devices are fabricated and fit by our skilled technicians using plaster castings, measurements and designs made by our clinicians. Frequently our proprietary Insignia scanning system is used to measure and design devices. The Insignia system scans the patient and produces a very accurate computer generated image of the patient's residual limb, resulting in a faster turnaround for the patient's device and a more professional overall experience. In order to provide timely service to our patients, we employ technical personnel and maintain laboratories at many of our patient care clinics. We have earned a strong reputation within the O&P industry for the development and use of innovative technology in our products, which has increased patient comfort and capability, and can significantly enhance the rehabilitation process. The quality of our services and the success of our technological advances have generated broad media coverage, building our brand equity among payors, patients and referring physicians.
The principal reimbursement sources for our services are:
- •
- Commercial and other, which consist of individuals, rehabilitation providers, private insurance companies, HMOs, PPOs,
hospitals, vocational rehabilitation, workers' compensation programs and similar sources;
- •
- Medicare, a federally funded health insurance program providing health insurance coverage for persons aged 65 or older and
certain disabled persons, which provides reimbursement for O&P products and services based on prices set forth in fee schedules for 10 regional service areas;
- •
- Medicaid, a health insurance program jointly funded by federal and state governments providing health insurance coverage
for certain persons based upon financial need, regardless of age, which may supplement Medicare benefits for financially needy persons aged 65 or older; and
- •
- U.S. Department of Veterans Affairs.
Government reimbursement, comprised of Medicare, Medicaid and the U.S. Department of Veterans Affairs, in the aggregate, accounted for approximately 40.4%, 40.0%, and 40.4% of our net sales in 2012, 2011, and 2010, respectively. These payors have set maximum reimbursement levels for O&P services and products. Medicare prices are adjusted each year based on the Consumer Price Index-Urban ("CPIU") unless Congress acts to change or eliminate the adjustment. The Medicare price increases/(decrease) for 2013, 2012, 2011, 2010, and 2009 were 0.8%, 2.4%, (0.1%), 0.0%, and 5.0%, respectively. There can be no assurance that future changes will not reduce reimbursements for O&P services and products from these sources.
4
We enter into contracts with third-party payors that allow us to perform O&P services for a referred patient and be paid under the contract with the third-party payor. These contracts typically have a stated term of one to three years. These contracts generally may be terminated without cause by either party on 60 to 90 days' notice or on 30 days' notice if we have not complied with certain licensing, certification, program standards, Medicare or Medicaid requirements or other regulatory requirements. Reimbursement for services is typically based on a fee schedule negotiated with the third-party payor that reflects various factors, including geographic area and number of persons covered.
Through the normal course of business, we receive patient deposits on devices not yet delivered. At December 31, 2012 and 2011, we held $1.1 million and $0.6 million of deposits, respectively, from our patients.
Provider Network Management
Linkia is the only provider network management company dedicated solely to serving the O&P market. Linkia is dedicated to managing the O&P services of national and regional insurance companies. Linkia partners with healthcare insurance companies by securing a national or regional contract either as a preferred provider or to manage their O&P network of providers. Linkia's network now includes approximately 1,120 O&P provider locations, including approximately 390 independent providers. As of December 31, 2012, Linkia had 55 contracts with national and regional insurance companies.
Distribution
We estimate that approximately $2.1 billion is spent in the United States each year for O&P products, components, devices and supplies, of which our wholly-owned subsidiary SPS accounts for approximately 5%. SPS distributes O&P products, components, devices and supplies to independent customers and to our own patient care clinics in the O&P and post-acute rehabilitation industry. SPS is also a leading fabricator and distributor of therapeutic footwear for diabetic patients in the podiatric market. SPS maintains in inventory approximately 33,000 individual SKUs manufactured by more than 390 different companies. SPS operates distribution facilities in California, Florida, Georgia, Illinois, Pennsylvania, and Texas, which allows us to deliver products via ground shipment anywhere in the contiguous United States typically within two business days.
Our Distribution business enables us to:
- •
- centralize our purchasing and thus lower our material costs by negotiating purchasing discounts from manufacturers;
- •
- reduce our patient care clinic inventory levels and improve inventory turns;
- •
- perform inventory quality control;
- •
- encourage our patient care clinics to use clinically appropriate products that enhance our profit margins; and
- •
- coordinate new product development efforts with key vendor "partners."
Marketing of our Distribution services is conducted on a national basis through a dedicated sales force, print and e-commerce catalogues, and exhibits at industry and medical meetings and conventions. We direct specialized catalogues to segments of the healthcare industry, such as orthopedic surgeons, physical therapists, occupational therapists and podiatrists.
Therapeutic Solutions
We provide therapeutic solutions to the O&P market and post-acute rehabilitation market through our subsidiaries IN, Inc. and ACP. On December 1, 2010 we acquired ACP, which is the nation's leading
5
provider of rehabilitation technologies and integrated clinical programs to rehabilitation providers. ACP's unique value proposition is to provide its customers with a full-service "total solutions" approach encompassing proven medical technology, evidence-based clinical programs, and continuous onsite therapist education and training. ACP's services support increasingly advanced treatment options for a broader patient population and more medically complex conditions. ACP has contracts to serve more than 4,550 skilled nursing facilities nationwide, including 21 of the 25 largest national providers. ACP's contracts contain negotiated pricing and service levels with terms ranging from one to five years. ACP generally bills its customers monthly and revenue is recognized based upon the contractual terms of the agreements.
IN, Inc. specializes in product development and commercialization of emerging products in the O&P and Rehabilitation markets. Working with inventors under licensing and consulting agreements, IN, Inc. commercializes the design, obtains regulatory approvals, develops clinical protocols for the technology, and then introduces the devices to the marketplace through a variety of distribution channels. IN, Inc. currently has two commercial products: the WalkAide system, which benefits patients with a condition referred to as foot drop, and the V-Hold, which is active vacuum technology used in lower extremity prosthetic devices. The V-Hold is primarily sold through our patient care clinics. The WalkAide system is currently reimbursable for Medicare beneficiaries with foot drop due to incomplete spinal cord injuries. IN, Inc. is currently conducting randomized clinical trials in an effort to gain additional coverage for stroke patients with foot drop, which represents the largest potential patient population. IN, Inc. fully enrolled the clinical trial in the second quarter of 2012 and completed the active phase of the clinical trial in the fourth quarter of 2012. IN, Inc. is currently analyzing the data, which it expects to publish and later submit to CMS in late 2013. In addition to reimbursement by Medicare, IN, Inc. has been working with commercial insurance companies and has had limited success in receiving coverage for the WalkAide. The WalkAide is sold in the United States through our patient care clinics and SPS. IN, Inc. is also marketing the WalkAide internationally through a network of distributors in Europe, the Middle East/Africa, Latin America, Canada, and Asia.
Competitive Strengths
We believe the combination of the following competitive strengths will help us to grow our businesses by increasing our net sales, net income and market share:
- •
- Leading market position both in the O&P market place and in the post-acute rehabilitation markets;
- •
- National scale of operations, which better enables us to:
- •
- establish our brand name and generate economies of scale;
- •
- implement best practices throughout the Company;
- •
- utilize shared fabrication facilities;
- •
- contract with national and regional managed care entities;
- •
- identify, test and deploy emerging technology; and
- •
- increase our influence on, and input into regulatory trends;
- •
- Distribution of, and purchasing power for, O&P components and finished O&P products, which enables us
to:
- •
- negotiate greater purchasing discounts from manufacturers and freight providers;
- •
- reduce patient care clinic inventory levels and improve inventory turns through centralized purchasing control;
6
- •
- quickly access prefabricated and finished O&P products;
- •
- promote the usage by our patient care clinics of clinically appropriate products that also enhance our profit margins;
- •
- engage in co-marketing and O&P product development programs with suppliers; and
- •
- expand the non-Hanger client base of our Distribution segment;
- •
- Development of leading-edge technology to be brought to market through our patient clinics and licensed
distributors worldwide;
- •
- Clinician compensation plans that financially reward clinicians for their efficient management of accounts receivable
collections, labor, materials, and other costs, and encourage cooperation among our clinicians within the same local market area;
- •
- Proven ability to rapidly incorporate technological advances in the fitting and fabrication of O&P devices;
- •
- History of successful integration of small and medium-sized O&P business acquisitions, including 115 O&P businesses since
1997, representing over 310 patient care clinics;
- •
- Highly trained clinicians, whom we provide with the highest level of continuing education and training through programs
designed to inform them of the latest technological developments in the O&P industry;
- •
- Experienced and committed management team; and
- •
- Successful government relations efforts which enables us to:
- •
- Support our patients' efforts to pass "The Prosthetic Parity Act" in 20 states;
- •
- Promote and educate legislators on the benefits and cost effectiveness of O&P services; and
- •
- Maintain an active Hanger Orthopedic Political Action Committee (The Hanger PAC).
Suppliers
In our O&P patient care businesses, we purchase prefabricated O&P devices, components and materials from in excess of 390 suppliers across the country that our technicians use to fabricate O&P products. These devices, components and materials are used in the products we offer in our patient care clinics throughout the country. As of December 31, 2012 only four of our third-party suppliers accounted for more than 5% of our total annual purchases. Our Therapeutic Solutions businesses purchase goods from a variety of suppliers, none of which accounted more than 5% of our total purchases.
Sales and Marketing
In our O&P patient care businesses, individual clinicians in local patient care clinics historically have conducted our sales and marketing efforts. Due primarily to the fragmented nature of the O&P industry, the success of a particular patient care clinic has been largely a function of its local reputation for quality of care, responsiveness and length of service in the local communities. In our Distribution and Therapeutic Solutions businesses, we employ dedicated sales professionals that generally are responsible for a geographic region or specific product line.
In addition, we have developed a centralized marketing department the goal of which is to augment the efforts of the business segment personnel. In the case of our O&P businesses, this enables the clinician
7
to focus more of his or her efforts on patient care. Our sales and marketing effort targets the following:
- •
- Marketing and Public Relations. Our objective is to
increase the visibility of the "Hanger" name by building relationships with major referral sources through activities such as co-sponsorship of sporting events and co-branding
of products. We also continue to explore creating alliances with certain vendors to market products and services on a nationwide basis.
- •
- Business Development. We have dedicated personnel in most
of our regions of operation who are responsible for arranging seminars, clinics and forums to educate and consult with patients and to increase the individual communities' awareness of the "Hanger"
name. These business development managers ("BDMs") also meet with local referral and contract sources to help our clinicians develop new relationships in their markets.
- •
- Insurance Contracts. Linkia is actively seeking contracts
with national insurance companies to manage their network. We also have regional contract managers who negotiate with hospitals and regional payors.
- •
- Other Initiatives. We are constantly seeking and developing new technology and products to enable us to provide the highest quality patient oriented care. We continue to use our Insignia laser scanning system, which enables our clinicians to create and modify a computer-based scan of patients' limbs to create more comprehensive patient records and a better prosthetic fit. Due to the improvement Insignia offers to our patient care, it has been an effective marketing tool for our clinicians.
Acquisitions
In 2012, we acquired eighteen O&P companies, operating a total of 59 patient care clinics located in Michigan, Montana, Washington, Alabama, Colorado, Tennessee, Texas, Oregon, Mississippi, Ohio, South Carolina, Maryland, Indiana, Georgia, Louisiana, North Carolina, and California. The aggregate purchase price for these O&P businesses was $83.1 million, including $60.1 million in cash and $23.0 million in unsecured notes and contingent earn-out payments to be paid over the next five years. We have preliminarily allocated the purchase price for 2012 acquisitions to the individual assets acquired and liabilities assumed. Our valuations are subject to adjustment as additional information is obtained; however, these adjustments are not expected to be material. The excess of purchase price over the aggregate fair values was recorded as goodwill. We incurred $1.2 million of one-time legal costs and other related acquisition expenses. In 2011, we acquired eight O&P companies, operating a total of 21 patient care clinics located in California, Illinois, Iowa, New York, Texas, Virginia and Washington. The aggregate purchase price for these O&P businesses was $24.9 million, including $14.1 million in cash and $10.8 million in unsecured notes and contingent earn-out payments to be paid over the next four years. We incurred $0.8 million of one-time legal costs and other related acquisition expenses. Acquisition related expenses are included in other operating expenses in the period incurred.
Competition
The O&P services industry is highly fragmented, consisting mainly of local O&P patient care clinics. The business of providing O&P patient care services is highly competitive in the markets in which we operate. We compete with numerous small independent O&P providers for referrals from physicians, therapists, employers, HMOs, PPOs, hospitals, rehabilitation centers, out-patient clinics and insurance companies on both a local and regional basis. We compete with other patient care service providers, including device manufacturers that have independent sales forces, on the basis of quality and timeliness of patient care, location of patient care clinics and pricing for services.
8
We also compete with independent O&P providers for the retention and recruitment of qualified clinicians. In certain markets, the demand for clinicians exceeds the supply of qualified personnel.
Our distribution business competes with other distributors, as well as manufactures who sell their products directly. Some of our distributor competitors are also dedicated to the O&P industry, but many others are large medical product distributors who also distribute O&P products, particularly orthotic products.
Our Therapeutic business competes with other device manufacturers, product distributors, and providers of equipment and services on a regional and national basis that have similar sales forces and products. We strive to differentiate our products with additional services such as clinical protocols and continuing education.
Government Regulation
We are subject to a variety of federal, state and local governmental regulations. We make every effort to comply with all applicable regulations through compliance programs, policies and procedures, manuals, and personnel training. Despite these efforts, we cannot guarantee that we will be in absolute compliance with all regulations at all times. Failure to comply with applicable governmental regulations may result in significant penalties, including exclusion from the Medicare and Medicaid programs, which would have a material adverse effect on our business.
Medical Device Regulation. We distribute products that are subject to regulation as medical devices by the U.S. Food and Drug Administration ("FDA") under the Federal Food, Drug and Cosmetic Act ("FDCA") and accompanying regulations. With the exception of two products which have been cleared for marketing as prescription medical devices under section 510(k) of the FDCA, we believe that the products we distribute, including O&P medical devices, accessories and components, are exempt from the FDA's regulations for pre-market clearance or approval requirements and from requirements relating to quality system regulation (except for certain recordkeeping and complaint handling requirements). We are required to adhere to regulations regarding adverse event reporting, establishment registration, and product listing; and we are subject to inspection by the FDA for compliance with all applicable requirements. Labeling and promotional materials also are subject to scrutiny by the FDA and, in certain circumstances, by the Federal Trade Commission. Our medical device operations are subject to inspection by the FDA for compliance with applicable FDA requirements, and the FDA has raised compliance concerns in connection with these investigations. We believe we have addressed these concerns and are in compliance with applicable FDA requirements, but we cannot assure that we will be found to be in compliance at all times. Non-compliance could result in a variety of civil and/or criminal enforcement actions, which could have a material adverse effect on our business and results of operations.
Fraud and Abuse. Violations of fraud and abuse laws are punishable by criminal and/or civil sanctions, including, in some instances, imprisonment and exclusion from participation in federal healthcare programs, including Medicare, Medicaid, U.S. Department of Veterans Affairs health programs and the Department of Defense's TRICARE program, formerly known as CHAMPUS. These laws, which include but are not limited to, antikickback laws, false claims laws, physician self-referral laws, and federal criminal healthcare fraud laws, are discussed in further detail below. We believe our billing practices, operations, and compensation and financial arrangements with referral sources and others materially comply with applicable federal and state requirements. However, we cannot assure that such requirements will not be interpreted by a governmental authority in a manner inconsistent with our interpretation and application. The failure to comply, even if inadvertent, with any of these requirements could require us to alter our operations and/or refund payments to the government. Such refunds could be significant and could also lead to the imposition of significant penalties. Even if we successfully defend against any action against us for violation of these laws or regulations, we would
9
likely be forced to incur significant legal expenses and divert our management's attention from the operation of our business. Any of these actions, individually or in the aggregate, could have a material adverse effect on our business and financial results.
Antikickback Laws. Our operations are subject to federal and state antikickback laws. The federal Antikickback Statute (Section 1128B(b) of the Social Security Act) prohibits persons or entities from knowingly and willfully soliciting, offering, receiving, or paying any remuneration in return for, or to induce, the referral of persons eligible for benefits under a federal healthcare program (including Medicare, Medicaid, the U.S. Department of Veterans Affairs health programs and TRICARE), or the ordering, purchasing, leasing, or arranging for, or the recommendation of purchasing, leasing or ordering of, items or services that may be paid for, in whole or in part, by a federal healthcare program. Courts have held that the statute may be violated when even one purpose (as opposed to a primary or sole purpose) of the remuneration is to induce referrals or other business.
Recognizing that the Antikickback Statute is broad and may technically prohibit beneficial arrangements, the Office of Inspector General of the Department of Health and Human Services has developed regulations addressing certain business arrangements that will offer protection from scrutiny under the Antikickback Statute. These "Safe Harbors" describe activities which may be protected from prosecution under the Antikickback Statute, provided that they meet all of the requirements of the applicable Safe Harbor. For example, the Safe Harbors cover activities such as offering discounts to healthcare providers and contracting with physicians or other individuals or entities that have the potential to refer business to us that would ultimately be billed to a federal healthcare program. Failure to qualify for Safe Harbor protection does not mean that an arrangement is illegal. Rather, the arrangement must be analyzed under the Antikickback Statute to determine whether there is intent to pay or receive remuneration in return for referrals. Conduct and business arrangements that do not fully satisfy one of the Safe Harbors may result in increased scrutiny by government enforcement authorities. In addition, some states have antikickback laws that vary in scope and may apply regardless of whether a federal healthcare program is involved.
Our operations and business arrangements include, for example, discount programs or other financial arrangements with individuals and entities, such as lease arrangements with hospitals and certain participation agreements. Therefore, our operations and business arrangements are required to comply with the antikickback laws. Although our business arrangements and operations may not always satisfy all the criteria of a Safe Harbor, we believe that our operations are in material compliance with federal and state antikickback statutes.
HIPAA Violations. The Health Insurance Portability and Accountability Act ("HIPAA") provides criminal penalties for, among other offenses: health care fraud; theft or embezzlement with respect to a health care benefit program; false statements in connection with the delivery of or payment for health care benefits, items or services; and obstruction of criminal investigation of health care offenses. Unlike other federal laws, these offenses are not limited to Federal health care programs.
In addition, HIPAA authorizes the imposition of civil monetary penalties where a person offers or pays remuneration to any individual eligible for benefits under a federal healthcare program that such person knows or should know is likely to influence the individual to order or receive covered items or services from a particular provider, clinician or supplier. Excluded from the definition of "remuneration" are incentives given to individuals to promote the delivery of preventive care (excluding cash or cash equivalents), incentives of nominal value and certain differentials in or waivers of coinsurance and deductible amounts.
These laws may apply to certain of our operations. As noted above, we have established various types of discount programs and other financial arrangements with individuals and entities. We also bill third-party payors and other entities for items and services provided at our patient care clinics. While we endeavor to ensure that our discount programs and other financial arrangements, and billing practices
10
comply with applicable laws, such programs, arrangements and billing practices could be subject to scrutiny and challenge under HIPAA.
False Claims Laws. We are also subject to federal and state laws prohibiting individuals or entities from knowingly presenting, or causing to be presented, claims for payment to third-party payors (including Medicare and Medicaid) that are false or fraudulent, are for items or services not provided as claimed, or otherwise contain misleading information. Each of our patient care clinics is responsible for the preparation and submission of reimbursement claims to third-party payors for items and services furnished to patients. In addition, our personnel may, in some instances, provide advice on billing and reimbursement to purchasers of our products. While we endeavor to assure that our billing practices comply with applicable laws, if claims submitted to payors are deemed to be false, fraudulent, or for items or services not provided as claimed, we may face liability for presenting or causing to be presented such claims.
Physician Self-Referral Laws. We are also subject to federal and state physician self-referral laws. With certain exceptions, the federal Medicare physician self-referral law (the "Stark Law") (Section 1877 of the Social Security Act) prohibits a physician from referring Medicare beneficiaries to an entity for "designated health services"—including prosthetic and orthotic devices and supplies—if the physician or the physician's immediate family member has a financial relationship with the entity. A financial relationship includes both ownership or investment interests and compensation arrangements. An entity that furnishes designated health services pursuant to a prohibited referral may not present or cause to be presented a claim or bill for such designated health services. Penalties for violating the Stark Law include denial of payment for the service, an obligation to refund any payments received, civil monetary penalties, and the possibility of being excluded from the Medicare or Medicaid programs.
With respect to ownership/investment interests, there is an exception under the Stark Law for referrals made to a publicly traded entity in which the physician or the physician's immediate family member has an investment interest if the entity's shares are generally available to the public at the time of the designated health service referral, and are traded on certain exchanges, including the New York Stock Exchange, and the entity had shareholders' equity exceeding $75.0 million for its most recent fiscal year or as an average during the three previous fiscal years. We meet these tests and, therefore, believe that referrals from physicians who have ownership interests in our stock, or whose immediate family members have ownership interests in our stock, should not result in liability under the Stark Law.
With respect to compensation arrangements, there are exceptions under the Stark Law that permit physicians to maintain certain business arrangements, such as personal service contracts and equipment or space leases, with healthcare entities to which they refer patients for designated health services. Unlike the Antikickback Statute, all of the elements of a Stark Law exception must be met in order for the exception to apply. We believe that our compensation arrangements with physicians comply with the Stark Law, either because the physician's relationship fits fully within a Stark Law exception or because the physician does not generate prohibited referrals. If, however, we receive a prohibited referral, our submission of a bill for services rendered pursuant to such a referral could subject us to sanctions under the Stark Law and applicable state self-referral laws. State self-referral laws may extend the prohibitions of the Stark Law to Medicaid beneficiaries.
Certification and Licensure. Our clinicians and/or certain operating units may be subject to certification or licensure requirements under the laws of some states. Most states do not require separate licensure for clinicians. However, several states currently require clinicians to be certified by an organization such as the American Board for Certification. The American Board for Certification conducts a certification program for clinicians and an accreditation program for patient care clinics. The minimum requirements for a certified clinician are a college degree, completion of an accredited academic program, one to four years of residency at a patient care clinic under the supervision of a certified clinician and successful completion of certain examinations. Minimum requirements for an accredited
11
patient care clinic include the presence of a certified clinician and specific plant and equipment requirements.
Some states may require licensure or registration of facilities that dispense or distribute prescription medical devices within or from outside of the state. In addition, some states may require a license or registration to provide services such as those offered by Linkia. We are in the process of meeting these requirements.
While we endeavor to comply with all state licensure requirements, we cannot assure that we will be in compliance at all times with these requirements. Failure to comply with state licensure requirements could result in suspension or termination of licensure, civil penalties, termination of our Medicare and Medicaid agreements, and repayment of amounts received from Medicare and Medicaid for services and supplies furnished by an unlicensed individual or entity.
Confidentiality and Privacy Laws. The Administrative Simplification Provisions of HIPAA, and their implementing regulations, set forth privacy standards and implementation specifications concerning the use and disclosure of individually identifiable health information (referred to as "protected health information") by health plans, healthcare clearinghouses and healthcare providers that transmit health information electronically in connection with certain standard transactions ("Covered Entities"). HIPAA further requires Covered Entities to protect the confidentiality of health information by meeting certain security standards and implementation specifications. In addition, under HIPAA, Covered Entities that electronically transmit certain administrative and financial transactions must utilize standardized formats and data elements ("the transactions/code sets standards"). HIPAA imposes civil monetary penalties for non-compliance, and, with respect to knowing violations of the privacy standards, or violations of such standards committed under false pretenses or with the intent to sell, transfer or use individually identifiable health information for commercial advantage, criminal penalties. We believe that we are subject to the Administrative Simplification Provisions of HIPAA and are taking steps to meet applicable standards and implementation specifications. The new requirements have had a significant effect on the manner in which we handle health data and communicate with payors. Our billing system, OPS, was designed to meet these requirements.
In addition, state confidentiality and privacy laws may impose civil and/or criminal penalties for certain unauthorized or other uses or disclosures of individually identifiable health information. We are also subject to these laws. While we endeavor to assure that our operations comply with applicable laws governing the confidentiality and privacy of health information, we could face liability in the event of a use or disclosure of health information in violation of one or more of these laws.
Personnel and Training
None of our employees are subject to a collective-bargaining agreement. We believe that we have satisfactory relationships with our employees and strive to maintain these relationships by offering competitive benefit packages, training programs and opportunities for advancement. During the year ended December 31, 2012, we had an average of 4,700 employees.
We provide a series of ongoing training programs to improve the professional knowledge of our clinicians. For example, we have an annual Education Fair that is attended by over 750 of our clinicians and consists of lectures and seminars covering many clinical topics including the latest technology and process improvements, basic accounting and business courses and other courses that allow the clinicians to fulfill their ongoing continuing education requirements.
12
Insurance
We currently maintain insurance coverage for professional liability, product liability, workers' compensation, executive protection and property damage. Our general liability insurance coverage is $1.0 million per incident, with a $50.0 million umbrella insurance policy. The coverage for professional liability, product liability and workers' compensation is self-insured with both individual specific claim and aggregate stop-loss policies to protect us from either significant individual claims or dramatic changes in our loss experience. Based on our experience and prevailing industry practices, we believe our coverage is adequate as to risks and amount. We have not incurred a material amount of expenses in the past as a result of uninsured O&P claims.
Special Note On Forward-Looking Statements
Some of the statements contained in this report discuss our plans and strategies for our business or make other forward-looking statements, as this term is defined in the Private Securities Litigation Reform Act. The words "anticipates," "believes," "estimates," "expects," "plans," "intends" and similar expressions are intended to identify these forward-looking statements, but are not the exclusive means of identifying them. These forward-looking statements reflect the current views of our management; however, various risks, uncertainties and contingencies could cause our actual results, performance or achievements to differ materially from those expressed in, or implied by, these statements, including the following:
- •
- the demand for our services and products;
- •
- changes in federal Medicare reimbursement levels and other governmental policies;
- •
- the impact of federal healthcare reform initiatives, including but not limited to the Patient Protection and Affordable
Care Act, on healthcare delivery and payment in the United States;
- •
- our ability to integrate effectively the operations of businesses that we have acquired and plan to acquire in the future;
- •
- our ability to enter into regional contracts;
- •
- our ability to attract and retain qualified orthotic and prosthetic clinicians;
- •
- our indebtedness, the impact of changes in prevailing interest rates and the availability of favorable terms of equity and
debt financing to fund the anticipated growth of our business;
- •
- changes in, or failure to comply with, federal, state and/or local governmental regulations; and
- •
- liabilities relating to orthotic and prosthetic services and products and other claims asserted against us.
For a discussion of important risk factors affecting our business, including factors that could cause actual results to differ materially from results referred to in the forward-looking statements, see "Item 1A—Risk Factors" and "Management's Discussion and Analysis of Financial Condition and Results of Operations" below. We do not have any obligation to publicly update any forward-looking statements, whether as a result of new information, future events or otherwise.
Changes in government reimbursement levels could adversely affect our net sales, cash flows and profitability.
We derived 40.4%, 40.0%, and 40.4% of our net sales for the years ended December 31, 2012, 2011 and 2010, respectively, from reimbursements for O&P services and products from programs administered by Medicare, Medicaid and the U.S. Department of Veterans Affairs. Each of these
13
programs set maximum reimbursement levels for O&P services and products. If these agencies reduce reimbursement levels for O&P services and products in the future, our net sales could substantially decline. In addition, the percentage of our net sales derived from these sources may increase as the portion of the U.S. population over age 65 continues to grow, making us more vulnerable to maximum reimbursement level reductions by these organizations. Reduced government reimbursement levels could result in reduced private payor reimbursement levels because fee schedules of certain third-party payors are indexed to Medicare. Furthermore, the healthcare industry is experiencing a trend towards cost containment as government and other third-party payors seek to impose lower reimbursement rates and negotiate reduced contract rates with service providers. This trend could adversely affect our net sales. For example, a number of states have reduced their Medicaid reimbursement rates for O&P services and products, or have reduced Medicaid eligibility, and others are in the process of reviewing Medicaid reimbursement policies generally, including for prosthetic and orthotic devices. Additionally, Medicare provides for reimbursement for O&P products and services based on prices set forth in fee schedules for ten regional service areas. Medicare prices are adjusted each year based on the Consumer Price Index—Urban ("CPIU") unless Congress acts to change or eliminate the adjustment. The Medicare price increases/(decrease) for 2013, 2012, 2011, 2010, and 2009 were 0.8%, 2.4%, (0.1%), 0.0%, and 5.0%, respectively. The Patient Protection and Affordable Care Act, Pub. L. No. 111-148, March 23, 2010 ("PPACA") changed the Medicare inflation factors applicable to O&P (and other) suppliers. The annual updates for years subsequent to 2011 are based on the percentage increase in the CPI-U for the 12-month period ending with June of the previous year. Section 3401(m) of PPACA required that for 2011 and each subsequent year, the fee schedule update factor based on the CPI-U for the 12-month period ending with June of the previous year is to be adjusted by the annual economy-wide private nonfarm business multifactory productivity ("the MFP Adjustment"). The MFP Adjustment may result in that percentage increase being less than zero for a year, and may result in payment rates for a year being less than such payment rates for the preceding year. CMS has not yet issued a final rule implementing these adjustments for years beyond 2011, but has indicated in a proposed rule that it will do so as part of the annual program instructions to the O&P fee schedule updates. See 75 Fed. Reg. 40040, 40122, et seq. (July 13, 2010). If the U.S. Congress were to legislate additional modifications to the Medicare fee schedules, our net sales from Medicare and other payors could be adversely and materially affected.
In addition to the risks to our Patient Care segment businesses discussed above, changes in government reimbursement levels could also adversely affect the net sales, cash flows and profitability of our Therapeutic Services segment business. In particular, a significant majority of ACP's sales involve devices and related services provided to skilled nursing facilities (SNFs) and similar businesses. Reductions in government reimbursement levels to SNFs could cause such SNFs to reduce or cancel their use of ACP's devices and modalities, negatively impacting net sales, cash flows and profitability. For example in July 2011 CMS announced an across the board reduction of approximately 10% in SNF reimbursement levels, negatively impacting the demand for ACP's devices and treatment modalities. We cannot predict whether any other modifications to reimbursement levels will be implemented, or if implemented what form any modifications might take.
Changes in payor reimbursements could negatively affect our net sales volume.
Recent years have seen a consolidation of healthcare companies coupled with certain payors terminating contracts, imposing caps or reducing reimbursement for O&P products. Additionally, employers are increasingly pushing healthcare costs down to their employees. These trends could result in decreased O&P revenue.
14
Healthcare reform in the United States may adversely affect our net sales, cash flows and profitability.
Various healthcare reform measures have been enacted into law in recent years, including the Patient Protection and Affordable Care Act adopted in March of 2010 ("PPACA"). These reforms are significant and over time could significantly change the way healthcare, including O&P services and products, are obtained and paid for in the United States. These changes are designed to increase access to and reduce the cost of healthcare through, among other things: expanded access to Medicaid; incentives to encourage shared savings programs, such as accountable care organizations; other alternative payment methodologies for Medicare reimbursement; and mandated private insurance for most non-indigent individuals under the age of 65. The reforms also include stronger enforcement tools and increased penalties. These changes could have a dramatic impact on the healthcare market generally, including the O&P services and products markets. It remains unclear, however, the ultimate impact the reforms will have since they will not be fully implemented for a number of years, and the reforms could be further modified, delayed or repealed prior to full implementation. Nevertheless, the reforms, when implemented, may have an adverse affect our net sales, cash flows and profitability.
We face periodic reviews, audits and investigations under our contracts with federal and state government agencies, and these audits could have adverse findings that may negatively impact our business.
We contract with various federal and state governmental agencies to provide O&P services. Pursuant to these contracts, we are subject to various governmental reviews, audits and investigations to verify our compliance with the contracts and applicable laws and regulations. Any adverse review, audit or investigation could result in:
- •
- refunding of amounts we have been paid pursuant to our government contracts;
- •
- imposition of fines, penalties and other sanctions on us;
- •
- loss of our right to participate in various federal programs;
- •
- damage to our reputation in various markets; or
- •
- material and/or adverse effects on our business, financial condition and results of operations.
We are subject to numerous federal, state and local governmental regulations, noncompliance with which could result in significant penalties that could have a material adverse effect on our business.
A failure by us to comply with the numerous federal, state and/or local healthcare and other governmental regulations to which we are subject, including the regulations discussed under "Government Regulation" in Item 1 above, could result in significant penalties and adverse consequences, including exclusion from the Medicare and Medicaid programs, which could have a material adverse effect on our business.
If the non-competition agreements we have with our key executive officers and key clinicians were found by a court to be unenforceable, we could experience increased competition resulting in a decrease in our net sales.
We generally enter into employment agreements with our executive officers and a significant number of our clinicians which contain non-compete and other provisions. The laws of each state differ concerning the enforceability of non-competition agreements. State courts will examine all of the facts and circumstances at the time a party seeks to enforce a non-compete covenant. We cannot predict with certainty whether or not a court will enforce a non-compete covenant in any given situation based on the facts and circumstances at that time. If one or more of our key executive officers and/or a significant number of our clinicians were to leave us and the courts refused to enforce the non-compete
15
covenant, we might be subject to increased competition, which could materially and adversely affect our business, financial condition and results of operations.
Our substantial indebtedness could impair our financial condition and our ability to fulfill our obligations under our indebtedness.
We have substantial debt. As of December 31, 2012, we have approximately $520.6 million of total indebtedness and $99.5 million available on our Revolving Credit Facility.
The level of our indebtedness could have important consequences to us. For example, our substantial indebtedness could:
- •
- make it more difficult for us to satisfy our obligations;
- •
- increase our vulnerability to adverse general economic and industry conditions;
- •
- require us to dedicate a substantial portion of our cash flow from operations to payments on our debt, thereby reducing
the availability of our cash flow to fund working capital, capital expenditures and other general corporate requirements;
- •
- limit our flexibility in planning for, or reacting to, changes in our business and the industry in which we operate;
- •
- place us at a competitive disadvantage compared to our competitors that have proportionately less debt;
- •
- make it more difficult for us to borrow money for working capital, capital expenditures, acquisitions or other purposes;
- •
- limit our ability to refinance indebtedness, or the associated costs may increase; and
- •
- expose us to the risk of increased interest rates with respect to that portion of our debt that has a variable rate of interest.
Our Website
Our website is http://www.hanger.com. We make available free of charge, on or through our website, our Annual Report on Form 10-K, Quarterly Reports on Form 10-Q, Current Reports on Form 8-K, Section 16 filings (i.e. Forms 3, 4 and 5), proxy statements, and other documents as required by applicable law and regulations as soon as reasonably practicable after electronically filing such reports with the Securities and Exchange Commission at http://www.sec.gov. The public may read and copy any materials that we file with the SEC at the SEC's Public Reference Room at 100 F Street N.E., Washington, DC 20549. The public may obtain information on the operation of the Public Reference Room by calling the SEC at 1-800-SEC-0330 (1-800-732-0330). The SEC maintains an Internet site (http://www.sec.gov) that contains reports, proxy and information statements, and other information regarding issuers that file electronically with the SEC. Our website also contains the charters of the Audit Committee, Corporate Governance and Nominating Committee, Compensation Committee and Quality and Technology Committee of our Board of Directors; our Code of Business Conduct and Ethics for Directors and Employees, which includes our principal executive, financial and accounting officers; as well as our Corporate Governance Guidelines. Information contained on our website is not part of this report.
ITEM 1B. UNRESOLVED STAFF COMMENTS
None.
16
As of December 31, 2012, we operated over 740 patient care clinics and facilities in 45 states and the District of Columbia. We own 14 buildings that house a patient care clinic. The remaining clinics are occupied under leases expiring between 2013 and 2023. We believe our leased and owned facilities are adequate for carrying out our current and anticipated future O&P operations. We believe we will be able to renew such leases as they expire or find comparable or alternative space on commercially suitable terms.
The following table sets forth the number of our patient care clinics located in each state as of December 31, 2012:
| State | Patient Care Clinics |
State | Patient Care Clinics |
State | Patient Care Clinics |
|||||||||
|---|---|---|---|---|---|---|---|---|---|---|---|---|---|---|
Alabama |
15 | Louisiana | 16 | North Carolina | 22 | |||||||||
Arizona |
41 | Maine | 5 | North Dakota | 2 | |||||||||
Arkansas |
6 | Maryland | 13 | Ohio | 37 | |||||||||
California |
71 | Massachusetts | 8 | Oklahoma | 12 | |||||||||
Colorado |
23 | Michigan | 8 | Oregon | 15 | |||||||||
Connecticut |
10 | Minnesota | 6 | Pennsylvania | 31 | |||||||||
Delaware |
1 | Mississippi | 15 | South Carolina | 21 | |||||||||
District of Columbia |
1 | Missouri | 22 | South Dakota | 1 | |||||||||
Florida |
55 | Montana | 5 | Tennessee | 16 | |||||||||
Georgia |
35 | Nebraska | 10 | Texas | 43 | |||||||||
Illinois |
26 | Nevada | 5 | Utah | 4 | |||||||||
Indiana |
13 | New Hampshire | 2 | Virginia | 11 | |||||||||
Iowa |
14 | New Jersey | 8 | Washington | 19 | |||||||||
Kansas |
13 | New Mexico | 8 | West Virginia | 6 | |||||||||
Kentucky |
10 | New York | 29 | Wisconsin | 11 | |||||||||
|
Wyoming | 3 | ||||||||||||
We also lease distribution facilities in Texas, California, Georgia, Florida, Illinois, and Pennsylvania. In January 2010, we signed a lease agreement and relocated our corporate headquarters to Austin, TX in August 2010. Substantially all of our owned properties are pledged to collateralize bank indebtedness. See Note G to our Consolidated Financial Statements.
We are subject to legal proceedings and claims which arise in the ordinary course of its business, including additional payments under business purchase agreements. In the opinion of management, the amount of ultimate liability, if any, with respect to these actions will not have a materially adverse effect on the financial position, liquidity or results of our operations.
We are in a highly regulated industry and receive regulatory agency inquiries from time to time in the ordinary course of our business, including inquiries relating to our billing activities. To date these inquiries have not resulted in material liabilities, but no assurance can be given that future regulatory agencies' inquiries will be consistent with the results to date or that any discrepancies identified during a regulatory review will not have a material adverse effect on our consolidated financial statements.
17
EXECUTIVE OFFICERS OF THE REGISTRANT
The following table sets forth information regarding current executive officers of the Company and certain of its subsidiaries:
Name
|
Age | Office with the Company | |||
|---|---|---|---|---|---|
Vinit K. Asar |
47 | President and Chief Executive Officer | |||
Richmond L. Taylor |
64 |
Executive Vice President, President and Chief Operating Officer of Hanger Prosthetics & Orthotics, Inc. |
|||
George E. McHenry |
60 |
Executive Vice President, Secretary, and Chief Financial Officer |
|||
Thomas E. Hartman |
50 |
Vice President and General Counsel |
|||
Walt A. Meffert, Jr. |
48 |
Vice President and Chief Information Officer |
|||
Russell G. Allen |
42 |
Vice President and Treasurer |
|||
Andrew C. Morton |
47 |
Vice President, Human Resources |
|||
Kenneth W. Wilson |
50 |
President and Chief Operating Officer of Southern Prosthetic Supply, Inc. |
|||
Rebecca J. Hast |
62 |
President of Linkia, LLC |
|||
Vinit K. Asar has been our Chief Executive Officer and President since May 2012, and served as our President and Chief Operating Officer from September 2011 to May 2012. Mr. Asar also served as our Executive Vice President and Chief Growth Officer from December 2008 to September 2011. Mr. Asar came to Hanger from the Medical Device & Diagnostic sector at Johnson and Johnson, having worked at the Ethicon, Ethicon-Endo-Surgery, Cordis and Biosense Webster franchises. During his 18 year career at Johnson and Johnson, Mr. Asar held various roles of increasing responsibility in Finance, Product Development, Manufacturing, and Marketing and Sales in the US and in Europe. Prior to joining Hanger, Mr. Asar was the Worldwide Vice-President at Biosense Webster, the Electrophysiology division of Johnson and Johnson, responsible for the Worldwide Sales, Marketing and Services organizations. Mr. Asar has a B.S.B.A from Aquinas College and an M.B.A. from Lehigh University.
Richmond L. Taylor is our Executive Vice President, and the President and Chief Operating Officer of Hanger Prosthetics & Orthotics, Inc. and HPO, Inc., our two wholly-owned subsidiaries which operate all of our patient care clinics. Previously, Mr. Taylor served as the Chief Operating Officer of NovaCare O&P from June 1996 until July 1999, and held the positions of Region Vice-President and Region President of NovaCare O&P for the West Region from 1989 to June 1996. Prior to joining NovaCare O&P, Mr. Taylor spent 20 years in the healthcare industry in a variety of management positions including Regional Manager at American Hospital Supply Corporation, Vice President of Operations at Medtech, Vice President of Sales at Foster Medical Corporation and Vice President of Sales at Integrated Medical Systems.
George E. McHenry has been our Executive Vice President and Chief Financial Officer since October 2001 and our Secretary since 2004. From 1987 until he joined us in October 2001, Mr. McHenry served as Executive Vice President, Chief Financial Officer and Secretary of U.S. Vision, Inc., an optical company with 600 locations in 47 states. Prior to joining U.S. Vision, Inc., he was employed principally as a Senior Manager by the firms of Touche Ross & Co. (now Deloitte & Touche) and Main Hurdman (now KPMG LLP) from 1974 to 1987. Mr. McHenry is a Certified Public Accountant and received a Bachelor of Science degree in accounting from St. Joseph's University.
Thomas E. Hartman has been our Vice President & General Counsel since June 2009. Mr. Hartman joined Hanger from Foley & Lardner, LLP where he was a partner in Foley's Business Law
18
Department. Mr. Hartman's practice at Foley was focused on securities transactions, securities law compliance, mergers and acquisitions, and corporate governance. Prior to joining Foley in 1995, Mr. Hartman was a business law associate at Jones Day. Mr. Hartman received his J.D. from the University of Wisconsin in Madison, and a Bachelor of Science in Engineering (Industrial & Operations Engineering) from the University of Michigan in Ann Arbor.
Walt A. Meffert, Jr. joined Hanger as Vice President and Chief Information Officer in April 2010. Mr. Meffert was previously the Senior Vice President & Chief Technology Officer for Apria Healthcare from December 2008. Concurrently Mr. Meffert also served as Senior Vice President & Chief Information Officer for Coram, Inc. since November 2005. As the CTO/CIO at Apria Healthcare and Coram, Inc. he directed all production infrastructures and business applications supporting over 700 branches and five main business lines in addition to providing IT oversight and alignment for Apria's Global IT service delivery. Before joining Apria Healthcare/Coram Inc., Mr. Meffert Served as Senior Vice President & Chief Information Officer for NeighborCare. Mr. Meffert served as Chief Technology Officer for Register.com, a leading provider of global domain name registration and Internet services from November 2001 to April 2004; Vice President of Enterprise Application Engineering at the creative software development company, Macromedia from October 1999 to November 2001; Director of Electronic Commerce—Internet Center at Bell Atlantic from January 1998 to October 1999; various leadership positions at The General Electric Company including the leading of the Internet Consulting and Systems Integration teams from 1990 to 1998. Mr. Meffert is a graduate of the renowned GE Edison Engineer program. Mr. Meffert holds a Bachelor of Science degree in Computer Science from the University of Maryland, Baltimore County and a Master of Science in Computer Science degree from John Hopkins University.
Russell G. Allen joined us in March of 2011 as our Vice President and Treasurer. Mr. Allen joined Hanger from Lance, Inc., a publicly traded consumer products company located in Charlotte, North Carolina, where he served in a variety of positions from 2003 to 2011, including Vice President of Treasury and Planning, and Director of Financial Planning & Analysis and Investor Relations. From 1995 to 2002 Mr. Allen worked at Ford Motor Company in Dearborn, Michigan, where he held various roles of increasing responsibility as part of Ford's Finance Management Development Program. Mr. Allen is a Certified Public Accountant and received a Bachelor of Business Administration from Southern Arkansas University and a Masters of Business Administration from The University of Illinois.
Andrew C. Morton joined us as our Vice President Human Resources in June 2010. Prior to joining Hanger, Mr. Morton worked for Freescale Semiconductor since 2006 in two capacities; first as Vice President Talent and Corporate Services, and then Vice President Human Resources Supply Chain. From 1992 to 2006 Mr. Morton worked at IBM and held various global field and corporate HR executive roles of increasing responsibility across its software, hardware and sales businesses. Mr. Morton has a B.S. degree in Finance from the University of Colorado at Boulder, and an MBA from Syracuse University. In between degrees he worked for Baxter Healthcare in Finance roles from 1988 to 1989.
Kenneth W. Wilson has been President and Chief Operating Officer of Southern Prosthetic Supply (SPS) since September 2011. Mr. Wilson was previously employed by Cardinal Health Inc., the largest distributor of pharmaceuticals and medical products in the United States, for 22 years, serving as Senior Vice President/General Manager of its Ambulatory Care business from 2008 until September 2011, as Vice President/General Manager of its Onsite business from 2006 to 2008, and as Senior Vice President—Group Purchasing Accounts from 2004 to 2006. Prior to joining Cardinal Health, he worked at Allegiance Healthcare Corporation, a manufacturer of medical products, including surgical apparel and drapes, surgical instruments and respiratory care products. Allegiance Healthcare was a 1997 spin-off of Baxter Healthcare Corporation that was acquired by Cardinal Health in 1999. Mr. Wilson served Allegiance Healthcare as Head of Allegiance National Account and Health Systems from 2002
19
to 2004, and as Vice President—Health Systems from 1997-2002. From 1988 to 1997, Mr. Wilson was with Baxter Healthcare, a manufacturer of a wide variety of medical products across three divisions, including drugs and vaccines, dialysis equipment and intravenous (IV) supplies. Mr. Wilson left Baxter in 1997 as a Regional Director in Encinitas, California. Prior to joining Baxter, he also worked for PepsiCo, USA and Proctor & Gamble in a variety of sales roles. Mr. Wilson received his Bachelor of Science degree in Economics and Social Science from Davidson College in 1984. He has been married to wife Candace since 1989 and has 5 children.
Rebecca J. Hast has been President of Linkia, LLC since November 2005. Prior to joining Linkia, Ms. Hast was with United Healthgroup Incorporated, a healthcare company that offers a broad spectrum of products and services through two distinct platforms: UnitedHealthcare, which provides health care coverage and benefits services; and Optum, which provides information and technologyenabled health services. Ms. Hast held a variety of positions from 1999 to 2004, leaving United Healthgroup as Senior Vice President, Account Development for the Dental Benefit Providers, a wholly owned subsidiary of United Healthgroup's Specialty Services Division (now Optum). Prior to joining United Healthgroup, Ms. Hast held management and leadership positions with Magellan Health Services, Inc., a specialty healthcare management company, and other healthcare insurance and services providers. Ms. Hast holds a Bachelor of Science degree from University of Pittsburgh.
ITEM 4. MINE SAFETY DISCLOSURES
Not applicable.
ITEM 5. MARKET FOR REGISTRANT'S COMMON EQUITY, RELATED STOCKHOLDER MATTERS AND ISSUER PURCHASES OF EQUITY SECURITIES
Market Information
Our common stock has been listed and traded on the New York Stock Exchange since December 15, 1998, under the symbol "HGR." The following table sets forth the high and low closing sale prices for the common stock for the periods indicated as reported on the New York Stock Exchange:
Year Ended December 31, 2012
|
High | Low | |||||
|---|---|---|---|---|---|---|---|
First Quarter |
$ | 22.93 | $ | 18.13 | |||
Second Quarter |
25.64 | 20.64 | |||||
Third Quarter |
29.13 | 23.81 | |||||
Fourth Quarter |
28.83 | 22.74 | |||||
Year Ended December 31, 2011
|
High | Low | |||||
|---|---|---|---|---|---|---|---|
First Quarter |
$ | 27.87 | $ | 20.55 | |||
Second Quarter |
27.97 | 23.46 | |||||
Third Quarter |
26.17 | 16.58 | |||||
Fourth Quarter |
22.01 | 14.58 | |||||
Holders
At March 14, 2013 there were approximately 233 holders of record of our 34,513,913 shares of outstanding common stock.
20
Dividend Policy
We have never paid cash dividends on our common stock and intend to continue this policy for the foreseeable future. We plan to retain earnings for use in our business. The terms of our credit agreements and certain other agreements limit the payment of dividends on our common stock and such agreements are expected to continue to limit the payment of dividends in the future.
Any future determination to pay cash dividends will be at the discretion of our Board of Directors and will be dependent on our results of operations, financial condition, contractual and legal restrictions and any other factors deemed to be relevant.
Equity Compensation Plans
The following table sets forth information as of December 31, 2012 regarding our equity compensation plans:
Plan Category
|
Number of securities to be issued upon exercise of outstanding options, warrants and rights |
Weighted average exercise price of outstanding options, warrants and rights |
Number of securities remaining available for future issuance (excluding securities reflected in column (a) |
|||||||
|---|---|---|---|---|---|---|---|---|---|---|
| |
(a) |
(b) |
(c) |
|||||||
Equity Compensation Plans: |
||||||||||
Approved by security holders |
221,855 | $ | 11.72 | 1,487,797 | ||||||
Not approved by security holders |
— | — | N/A | |||||||
Total |
221,855 | 1,487,797 | ||||||||
Sales of Unregistered Securities
During the year ended December 31, 2012, we sold no securities that were unregistered under the Securities Act of 1933, as amended.
Issuer Purchases of Equity Securities
During the year ended December 31, 2012, we made no repurchases of treasury stock.
21
The annual changes in the cumulative total shareholder return on Hanger's common stock for the five-year period shown in the graph shown below are based on the assumption that $100 had been invested in Hanger common stock, the Russell 2000 Stock Index, the Standard & Poor's 500 Stock Index, the Standard & Poor's Small Cap 600 Stock Index, the Standard & Poor's 500 Health Care Services Index and the Standard & Poor's 500 Health Care Facilities Index on December 31, 2007, and that all quarterly dividends were reinvested at the average of the closing stock prices at the beginning and end of the quarter. The total cumulative dollar returns shown on the graph represent returns that such investments would have had on December 31, 2012.
The following information in this Item 5 of this Annual Report on Form 10-K is not deemed to be "soliciting material" or to be "filed" with the SEC or subject to Regulation 14A or 14C under the Securities Exchange Act of 1934 (the "Exchange Act") or to the liabilities of Section 18 of the Exchange Act, and will not be deemed to be incorporated by reference into any filing under the Securities Act of 1933 or the Exchange Act, except to the extent we specifically incorporate it by reference into such a filing.
Comparison of 5 Year Cumulative Total Return
Assumes Initial Investment of $100
December 2012
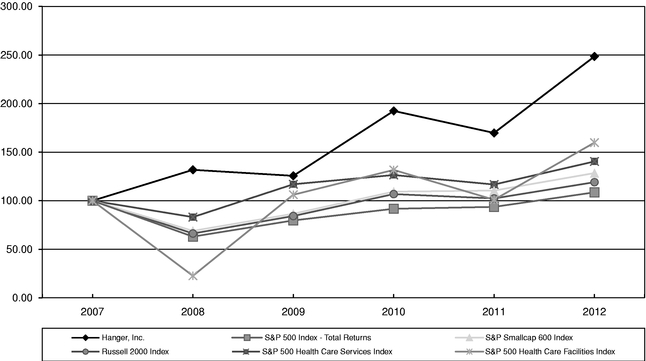
| |
December 31, | ||||||||||||||||||
|---|---|---|---|---|---|---|---|---|---|---|---|---|---|---|---|---|---|---|---|
| |
2007 | 2008 | 2009 | 2010 | 2011 | 2012 | |||||||||||||
Hanger, Inc. |
$ | 100.00 | $ | 131.79 | $ | 125.61 | $ | 192.46 | $ | 169.78 | $ | 248.54 | |||||||
S & P 500 |
$ | 100.00 | $ | 63.01 | $ | 79.68 | $ | 91.68 | $ | 93.62 | $ | 108.61 | |||||||
S&P SmallCap 600 |
$ | 100.00 | $ | 68.93 | $ | 86.55 | $ | 109.32 | $ | 110.43 | $ | 128.46 | |||||||
RUSSELL 2000 |
$ | 100.00 | $ | 66.21 | $ | 84.20 | $ | 106.81 | $ | 102.33 | $ | 119.06 | |||||||
S&P 500 Health Care Services Index |
$ | 100.00 | $ | 83.10 | $ | 116.93 | $ | 126.44 | $ | 116.65 | $ | 140.41 | |||||||
S&P 500 Health Care Facilities Index |
$ | 100.00 | $ | 22.64 | $ | 106.11 | $ | 131.69 | $ | 100.99 | $ | 159.80 | |||||||
22
ITEM 6. SELECTED FINANCIAL DATA
The following selected consolidated financial data should be read in conjunction with our consolidated financial statements and related notes, "Management's Discussion and Analysis of Financial Condition and Results of Operations" and other financial data included elsewhere in this annual report on Form 10-K. The Consolidated Statement of Income and Comprehensive Income and Balance Sheet data for all periods presented is derived from the audited consolidated financial statements included elsewhere in this annual report on Form 10-K or in annual reports on Form 10-K for prior years on file with the Commission.
| |
Year Ended December 31, | |||||||||||||||
|---|---|---|---|---|---|---|---|---|---|---|---|---|---|---|---|---|
Consolidated Statements of Income and Comprehensive Income: |
2012 | 2011 | 2010 | 2009 | 2008 | |||||||||||
| (In thousands, except per share amounts) |
|
|
|
|
|
|||||||||||
Net sales |
$ | 985,550 | $ | 918,539 | $ | 817,379 | $ | 760,070 | $ | 703,129 | ||||||
Material costs |
296,193 | 270,210 | 248,667 | 228,295 | 210,323 | |||||||||||
Personnel costs |
335,328 | 321,529 | 282,417 | 264,581 | 248,234 | |||||||||||
Other operating expenses |
188,868 | 177,910 | 165,158 | 160,355 | 149,661 | |||||||||||
Relocation expenses(1) |
— | 1,185 | 16,444 | — | — | |||||||||||
Acquisition expenses(2) |
1,171 | 781 | 5,414 | — | — | |||||||||||
Depreciation and amortization |
34,652 | 30,969 | 18,809 | 16,319 | 17,183 | |||||||||||
Income from operations |
129,338 | 115,955 | 80,470 | 90,520 | 77,728 | |||||||||||
Interest expense, net |
31,169 |
31,821 |
30,340 |
30,693 |
32,549 |
|||||||||||
Loss (gain) from interest rate swap(3) |
— | — | 1,610 | (167 | ) | 738 | ||||||||||
Extinguishment of debt |
— | — | 13,985 | — | — | |||||||||||
Income before taxes |
98,169 | 84,134 | 34,535 | 59,994 | 44,441 | |||||||||||
Provision for income taxes |
34,477 |
29,657 |
13,639 |
23,901 |
17,695 |
|||||||||||
Net income |
63,692 | 54,477 | 20,896 | 36,093 | 26,746 | |||||||||||
Other comprehensive income (loss) |
(734 |
) |
(906 |
) |
2,777 |
1,441 |
(4,497 |
) |
||||||||
Comprehensive income |
$ | 62,958 | $ | 53,571 | $ | 23,673 | $ | 37,534 | $ | 22,249 | ||||||
Preferred stock dividends and accretion(4) |
— | — | — | — | 5,670 | |||||||||||
Net income applicable to common stock |
$ | 63,692 | $ | 54,477 | $ | 20,896 | $ | 36,093 | $ | 21,076 | ||||||
Basic Per Common Share Data |
||||||||||||||||
Net income |
$ | 1.86 | $ | 1.62 | $ | 0.65 | $ | 1.15 | $ | 0.81 | ||||||
Shares used to compute basic per common share amounts |
34,283 | 33,545 | 32,238 | 31,384 | 25,930 | |||||||||||
Diluted Per Common Share Data |
||||||||||||||||
Net income |
$ | 1.83 | $ | 1.59 | $ | 0.64 | $ | 1.13 | $ | 0.78 | ||||||
Shares used to compute diluted per common share amounts |
34,833 | 34,220 | 32,888 | 32,068 | 27,091 | |||||||||||
- (1)
- During
2011 and 2010, the Company relocated its corporate headquarters from Bethesda, Maryland to Austin, Texas. The cost incurred included employee
separation, relocation costs, and lease termination costs.
- (2)
- During 2012 the company purchased eighteen O&P companies for an aggregate purchase price of $83.1 million and incurred $1.2 million in acquisition costs. During 2011, the Company acquired
23
eight O&P companies for an aggregate purchase price of $24.9 million and incurred $0.8 million in acquisition costs. During 2010, the Company completed the acquisition of ACP for $157.8 million and incurred $5.4 million in legal, professional, and other deal-related expenses.
- (3)
- During
2009 and 2008, the (gain) loss from interest rate swap results from the ineffective portions of the swap that occurred during the year. In 2010, the
Company was required to terminate its interest rate swaps in conjunction with refinancing of the debt, resulting in a $1.6 million charge to interest expense.
- (4)
- In June 2008, the average closing price of our common stock exceeded the forced conversion price of the Series A Preferred by 200% for a 20-trading day period, triggering an acceleration, pursuant to the Certificate of Designations of the Series A Preferred, of the Series A Preferred dividends that were otherwise payable through May 26, 2011. The accelerated dividends of $5.3 million were paid in the form of increased stated value of the Series A Preferred, in lieu of cash. On July 25, 2008, the Company notified the holder of the Series A Preferred of its election pursuant to the Certificate of Designations of the Series A Preferred to force the conversion of the Series A Preferred into 7,308,730 shares of common stock. The conversion of the Series A Preferred occurred on August 8, 2008.
| |
Year Ended December 31, | |||||||||||||||
|---|---|---|---|---|---|---|---|---|---|---|---|---|---|---|---|---|
Balance Sheet Data:
|
2012 | 2011 | 2010 | 2009 | 2008 | |||||||||||
| (In thousands) |
|
|
|
|
|
|||||||||||
Cash and cash equivalents |
$ | 19,211 | $ | 42,896 | $ | 36,308 | $ | 84,558 | $ | 58,413 | ||||||
Working capital |
251,465 | 240,648 | 185,260 | 216,664 | 200,248 | |||||||||||
Total assets |
1,237,327 | 1,126,719 | 1,060,570 | 875,036 | 813,750 | |||||||||||
Total debt |
520,646 | 508,033 | 508,684 | 410,472 | 422,324 | |||||||||||
Shareholders' equity |
503,094 | 428,582 | 364,427 | 315,893 | 266,866 | |||||||||||
| |
Year Ended December 31, | |||||||||||||||
|---|---|---|---|---|---|---|---|---|---|---|---|---|---|---|---|---|
Other Financial Data:
|
2012 | 2011 | 2010 | 2009 | 2008 | |||||||||||
| (In thousands) |
|
|
|
|
|
|||||||||||
Capital expenditures |
$ | 33,163 | $ | 28,674 | $ | 30,593 | $ | 21,270 | $ | 19,330 | ||||||
Net cash provided by (used in): |
||||||||||||||||
Operating activities |
$ | 81,319 | $ | 61,804 | $ | 54,200 | $ | 71,824 | $ | 51,750 | ||||||
Investing activities |
(99,051 | ) | (46,870 | ) | (185,975 | ) | (34,152 | ) | (30,168 | ) | ||||||
Financing activities |
(5,953 | ) | (8,346 | ) | 83,525 | (11,527 | ) | 9,893 | ||||||||
24
ITEM 7. MANAGEMENT'S DISCUSSION AND ANALYSIS OF FINANCIAL CONDITION AND RESULTS OF OPERATIONS
The following is a discussion of our results of operations and financial condition for the periods described below. This discussion should be read in conjunction with our consolidated financial statements included elsewhere in this Form 10-K. Our discussion of our results of operations and financial condition includes various forward-looking statements about, among other things, our markets, the demand for our products and services and our future results. These statements are based on our current expectations, which are inherently subject to risks and uncertainties. Our actual results and the timing of certain events may differ materially from those indicated in the forward looking statements.
Overview
The goal of Hanger, Inc. (the "Company") is to be the world's premier provider of services and products that enhance human physical capabilities. We provide orthotic and prosthetic patient care services, distribute O&P devices and components, manage O&P networks, and provide therapeutic solutions to the broader post-acute market. Through our subsidiary, Hanger Prosthetics and Orthotics, Inc., which we refer to as "Hanger Clinic," we are the largest owner and operator of orthotic and prosthetic patient care clinics in the United States. We are also one of the largest distributors of O&P products in the United States through our distribution subsidiary, Southern Prosthetic Supply, Inc. ("SPS"). We operate in excess of 740 O&P patient care clinics located in 45 states and the District of Columbia and six strategically located distribution facilities. In addition to providing O&P services and products we, through our subsidiary, Linkia LLC ("Linkia"), manage an O&P network and develop programs to manage all aspects of O&P patient care for insurance companies. We provide therapeutic solutions through our subsidiaries Innovative Neurotronics and Accelerated Care Plus Corp. Innovative Neurotronics ("IN, Inc.") introduces emerging neuromuscular technologies developed through independent research in a collaborative effort with industry suppliers worldwide. Accelerated Care Plus Corp. ("ACP") is a developer of specialized rehabilitation technologies and a leading provider of evidence-based clinical programs for post-acute rehabilitation serving more than 4,550 long-term care facilities and other sub-acute rehabilitation providers throughout the U.S.
We have increased our net sales during the past two years through organic growth, acquisitions and opening of new patient care clinics, increased distribution revenues though targeted sales efforts and increased product offerings, and continued growth in revenue associated with the Linkia contracts. Our operations include three reportable segments—Patient Care, Distribution, and Therapeutic Solutions.
We are analyzing the current reporting structure and assessing whether we may change the way information is reported and analyzed internally. If we were to realign the way we report information and analyze our business internally, we will realign our business segments accordingly.
Patient Care
As of December 31, 2012, we provided O&P patient care services through over 740 patient care clinics and over 1,300 clinicians in 45 states and the District of Columbia. For the years ended December 31, 2012 and 2011, net sales attributable to our patient care services were $813.6 million and $753.4 million, respectively.
Patients are referred to our local patient care clinics directly by physicians as a result of our reputation or through our agreements with managed care providers. In our orthotics business, we design, fabricate, fit and maintain a wide range of standard and custom-made braces and other devices (such as spinal, knee and sports-medicine braces) that provide external support to patients suffering from musculoskeletal disorders, such as ailments of the back, extremities or joints and injuries from sports or other activities. In our prosthetics business, we design, fabricate, fit and maintain custom-made artificial limbs for patients who are without limbs as a result of traumatic injuries, vascular diseases, diabetes,
25
cancer or congenital disorders. O&P devices are increasingly technologically advanced and are custom-designed to add functionality and comfort to patients' lives, shorten the rehabilitation process and lower the cost of rehabilitation.
Our clinicians are also responsible for managing and operating our patient care clinics and are compensated, in part, based on their success in managing costs and collecting accounts receivable. We provide centralized administrative, marketing and materials management services to take advantage of economies of scale and to increase the time clinicians have to provide patient care. In areas where we have multiple patient care clinics, we also utilize shared fabrication facilities where technicians fabricate devices for clinicians in that region.
Distribution
We distribute O&P products, components, devices and supplies to our customers and to our own patient care clinics through our wholly-owned subsidiary, SPS. We are also a leading fabricator and distributor of therapeutic footwear for diabetic patients in the podiatric market. For the year ended December 31, 2012, 35.9% or approximately $107.3 million of SPS distribution sales were to third-party O&P services providers, and the balance of approximately $191.2 million represented intercompany sales to Hanger Clinic's patient care clinics. SPS maintains in inventory approximately 33,000 individual SKUs manufactured by more than 390 different companies. SPS maintains distribution facilities in California, Florida, Georgia, Illinois, Pennsylvania, and Texas, which allows us to deliver products via ground shipment anywhere in the contiguous United States typically within two business days.
Our Distribution business enables us to:
- •
- centralize our purchasing and thus lower our material costs by negotiating purchasing discounts from manufacturers;
- •
- reduce our patient care clinic inventory levels and improve inventory turns;
- •
- perform inventory quality control;
- •
- encourage our patient care clinics to use clinically appropriate products that enhance our profit margins; and
- •
- coordinate new product development efforts with key vendor "partners".
Marketing of our Distribution services is conducted on a national basis through a dedicated sales force, print and e-commerce catalogues, and exhibits at industry and medical meetings and conventions. We direct specialized catalogues to segments of the healthcare industry, such as orthopedic surgeons, physical and occupational therapists, and podiatrists.
Therapeutic Solutions
We provide therapeutic solutions to the O&P market and post-acute rehabilitation market through our subsidiaries IN, Inc. and ACP. ACP is the nation's leading provider of rehabilitation technologies and integrated clinical programs to rehabilitation providers. ACP's unique value proposition is to provide its customers with a full-service "total solutions" approach encompassing proven medical technology, evidence based clinical programs, and continuous onsite therapist education and training. ACP's services support increasingly advanced treatment options for a broader patient population and more medically complex conditions. ACP has contracts to serve more than 4,550 skilled nursing facilities nationwide, including 21 of the 25 largest national providers. ACP's contracts contain negotiated pricing and service levels with terms ranging from one to five years. ACP generally bills its customers monthly and revenue is recognized based upon the contractual terms of the agreements.
26
IN, Inc. specializes in product development and commercialization of emerging products. Working with the inventors under licensing and consulting agreements, IN, Inc. commercializes the design, obtains regulatory approvals, develops clinical protocols for the technology, and then introduces the devices to the marketplace through a variety of distribution channels. IN, Inc. currently has two commercial products; the WalkAide system which benefits patients with a condition referred to as foot drop and the V-Hold which is active suction technology used in lower extremity prosthetic devices. The WalkAide system is currently reimbursable from Medicare beneficiaries with foot drop due to incomplete spinal cord injuries. IN, Inc. is currently conducting randomized clinical trials in an effort to gain additional coverage for stroke patients with foot drop, which represents the largest potential patient population. IN, Inc. fully enrolled the clinical trial in the second quarter of 2012 and completed the active phase of the clinical trial in the fourth quarter of 2012. IN, Inc. is currently analyzing the data, which it expects to publish and later submit to CMS in late 2013. In addition to reimbursement from Medicare and Medicaid, IN, Inc. has been working with commercial insurance companies and has had limited success in receiving coverage for the WalkAide. The WalkAide and V-Hold are sold in the United States through our patient care clinics and SPS. IN, Inc. is also marketing the WalkAide internationally through licensed distributors.
Results and Outlook
Net sales for the year ended December 31, 2012 increased by $67.1 million, or 7.3%, to $985.6 million from $918.5 million for the year ended December 31, 2011. The sales increase was principally the result of a $30.1 million, or 4.0%, increase in same center sales; a $30.2 million increase from acquired entities; and a $6.8 million, or 6.8%, increase in sales in the Distribution segment.
Income from operations and net income were $129.3 million and $63.7 million, respectively, in 2012 compared to $116.0 million and $54.5 million, respectively, in the prior year. Our cash flow from operations increased $19.5 million to $81.3 million in 2012, from $61.8 million in 2011, primarily due to normal changes in working capital. As of December 31, 2012, $293.3 million, or 56.3%, of our total debt of $520.6 million was subject to variable interest rates. We had total liquidity of $118.7 million, comprised of $19.2 million of cash and $99.5 million available under our Revolving Credit Facility, net of $0.5 million in letters of credit at December 31, 2012. We believe that we have sufficient liquidity to conduct our normal operations and fund our acquisition plans through 2013.
We expect 2013 revenues to increase to between $1.06 billion and $1.08 billion, resulting from 3% to 5% same center sales growth in its Patient Care segment, along with 3% to 5% growth in both its Distribution and Therapeutic Solutions segments. We anticipate 2013 adjusted diluted earnings per share of between $2.02 and $2.09 for the year, excluding approximately $0.05 for training costs related to the implementation of Janus, our new clinic management system. Our goal is to increase adjusted operating margins by 30 to 50 basis points. We anticipate generating cash flow from operations of between $80 million and $100 million in 2013, and investing a total of $40 million to $50 million in capital additions.
Significant Accounting Policies and Estimates
Our analysis and discussion of our financial condition and results of operations is based upon our Consolidated Financial Statements that have been prepared in accordance with accounting principles generally accepted in the United States of America ("GAAP"). The preparation of financial statements in conformity with GAAP requires management to make estimates and assumptions that affect the reported amounts of assets and liabilities, disclosure of contingent assets and liabilities at the date of the financial statements, and the reported amounts of revenues and expenses during the reporting period. GAAP provides the framework from which to make these estimates, assumptions and disclosures. We have chosen accounting policies within GAAP that management believes are appropriate to accurately and fairly report our operating results and financial position in a consistent
27
manner. Management regularly assesses these policies in light of current and forecasted economic conditions. Our accounting policies are stated in Note B to the Consolidated Financial Statements included elsewhere in this Annual Report on Form 10-K. We believe the following accounting policies are critical to understanding our results of operations and the more significant judgments and estimates used in the preparation of our Consolidated Financial Statements.
- •
- Revenue Recognition: Revenues in our Patient Care segment are derived from the sale of O&P devices and the maintenance and repair of existing devices and are recorded net of all known contractual adjustments and discounts. The sale of O&P devices includes the design, fabrication, assembly, fitting and delivery of a wide range of braces, limbs and other devices. Revenues from the sale of these devices are recorded when (i) acceptance by and delivery to the patient has occurred; (ii) persuasive evidence of an arrangement exists and there are no further obligations to the patient; (iii) the sales price is fixed or determinable; and (iv) collectability is reasonably assured. Revenues from maintenance and repairs are recognized when the service is provided. Revenues on the sale of O&P devices to customers by the Distribution segment are recorded upon the shipment of products, in accordance with the terms of the invoice, net of merchandise returns. Discounted sales are recorded at net realizable value. Revenues in our Therapeutic Solutions are primarily derived from leasing rehabilitation technology combined with clinical therapy programs and education and training. The revenue is recorded on a monthly basis according to terms of the contracts with our customers.
Certain accounts receivable may be uncollectible, even if properly pre-authorized and billed. Regardless of the balance, accounts receivable amounts are periodically evaluated to assess collectability. In addition to the actual bad debt expense recognized during collection activities, we estimate the amount of potential bad debt expense that may occur in the future. This estimate is based upon our historical experience as well as a review of our receivable balances.
On a quarterly basis, we evaluate cash collections, accounts receivable balances and write-off activity to assess the adequacy of our allowance for doubtful accounts. Additionally, a company-wide evaluation of collectability of receivable balances older than 180 days is performed at least semi-annually, the results of which are used in the next allowance analysis. In these detailed reviews, the account's net realizable value is estimated after considering the customer's payment history, past efforts to collect on the balance and the outstanding balance, and a specific reserve is recorded if needed. From time to time, we may outsource the collection of such accounts to collection agencies after internal collection efforts are exhausted. In cases where valid accounts receivable cannot be collected, the uncollectible account is written off to bad debt expense.
The following represents the composition of our accounts receivable balance by payor:
December 31, 2012
|
0-60 days | 61-120 days | Over 120 days | Total | |||||||||
|---|---|---|---|---|---|---|---|---|---|---|---|---|---|
| (In thousands) |
|
|
|
|
|||||||||
Patient Care |
|||||||||||||
Commercial insurance |
$ | 56,326 | $ | 11,413 | $ | 13,355 | $ | 81,094 | |||||
Private pay |
5,928 | 4,955 | 10,524 | 21,407 | |||||||||
Medicaid |
12,879 | 3,468 | 3,519 | 19,866 | |||||||||
Medicare |
29,910 | 6,118 | 5,625 | 41,653 | |||||||||
VA |
2,270 | 608 | 353 | 3,231 | |||||||||
Distribution & Therapeutic Solutions Trade accounts receivable |
12,556 | 3,149 | 4,091 | 19,796 | |||||||||
|
$ | 119,869 | $ | 29,711 | $ | 37,467 | $ | 187,047 | |||||
28
December 31, 2011
|
0-60 days | 61-120 days | Over 120 days | Total | |||||||||
|---|---|---|---|---|---|---|---|---|---|---|---|---|---|
| (In thousands) |
|
|
|
|
|||||||||
Patient Care |
|||||||||||||
Commercial insurance |
$ | 50,136 | $ | 9,594 | $ | 11,759 | $ | 71,489 | |||||
Private pay |
3,936 | 3,791 | 9,219 | 16,946 | |||||||||
Medicaid |
12,018 | 3,678 | 4,173 | 19,869 | |||||||||
Medicare |
25,438 | 3,489 | 4,433 | 33,360 | |||||||||
VA |
1,428 | 373 | 159 | 1,960 | |||||||||
Distribution & Therapeutic Solutions Trade accounts receivable |
11,367 | 2,663 | 3,200 | 17,230 | |||||||||
|
$ | 104,323 | $ | 23,588 | $ | 32,943 | $ | 160,854 | |||||
- •
- Inventories: Inventories in the Patient Care segment consisting principally of raw materials and work-in-process, which amounted to $96.6 million and $81.0 million as of December 31, 2012 and 2011, respectively, are valued based on the gross profit method which approximates lower of cost or market using the first-in first-out method. We apply the gross profit method on a patient care clinic basis in this segment's inventory to determine ending inventory at the end of each interim period except on October 31st, which is the date of our physical inventory. The annual physical inventory for this segment values the inventory at lower of cost or market using the first-in first-out method and includes work-in-process consisting of materials, labor and overhead which is valued based on established standards for the stage of completion of each custom order. Adjustments to reconcile the physical inventory to our books are treated as changes in accounting estimates and are recorded in the fourth quarter. We recorded fourth quarter adjustments of a decrease of $0.5 million, an increase of $2.3 million and a decrease of $1.0 million to inventory as of October 31, 2012, 2011 and 2010, respectively. The October 31st inventory is subsequently adjusted during interim periods to apply the gross profit method described above.
- •
- Fair Value: The Company follows the authoritative guidance for financial assets and liabilities, which establishes a framework for measuring fair value and requires enhanced disclosures about fair value measurements. The authoritative guidance requires disclosure about how fair value is determined for assets and liabilities and establishes a hierarchy by which these assets and liabilities must be categorized, based on significant levels of inputs as follows:
Inventories in the Distribution and Therapeutic Solutions segments consist principally of finished goods which are stated at the lower of cost or market using the first-in, first-out method for all reporting periods and are valued based on perpetual records.
| Level 1 | unadjusted quoted prices for identical assets or liabilities in active markets accessible by the Company | |
Level 2 |
inputs that are observable in the marketplace other than those inputs classified as Level 1 |
|
Level 3 |
inputs that are unobservable in the marketplace and significant to the valuation |
- •
- Investments: Prior to December 2010, the Company's investments consisted of two auction rate securities ("ARS") totaling $7.5 million of par value; $5.0 million was collateralized by Indiana Secondary Market Municipal Bond—1998 ("Indiana ARS"), and $2.5 million was collateralized
The determination of where assets and liabilities fall within this hierarchy is based upon the lowest level of input that is significant to the fair value measurement.
29
- •
- Interest Rate Swaps: Prior to December 2010, we utilized
interest rate swaps to manage our exposure to interest rate risk associated with our variable rate borrowings. On December 1, 2010, we were required to terminate the interest rate swaps due to
refinancing of the credit facilities. The Company incurred a loss of $1.6 million, which was recorded in loss/(gain) from interest rate swap on the Consolidated Statements of Income and
Comprehensive Income.
- •
- Goodwill and Other Intangible Assets: Goodwill represents
the excess of purchase price over the value assigned to net identifiable assets of purchased businesses. We assess goodwill and indefinite lived intangible assets for impairment annually during the
fourth quarter, or when events or circumstances indicate that the carrying value of the reporting units may not be recoverable. The Company has the option to first assess qualitative factors to
determine whether it is more likely than not that the fair value of a reporting unit is less than its carrying amount as a basis for determining whether it is necessary to perform the
two-step impairment test for goodwill and indefinite lived intangible assets. If the Company determines that a two-step impairment test is necessary or more efficient than a
qualitative approach, it measures the fair value of the Company's reporting units using a combination of income, market and cost approaches. Any impairment would be recognized by a charge to operating
results and a reduction in the carrying value of the intangible asset. As of October 1, 2012, there were no indicators of impairment as the fair value of the reporting units is substantially in
excess of the carrying value of the underlying assets.
- •
- Income taxes: We are required to estimate income taxes in each of the jurisdictions in which we operate. This process involves estimating the actual current tax liability together with assessing temporary differences in recognition of income (loss) for tax and accounting purposes. These differences result in deferred tax assets and liabilities, which are included in the Consolidated Balance Sheet. We then assess the likelihood that the deferred tax assets will be recovered from future taxable income and, to the extent that we believe that recovery is not likely, we establish a valuation allowance against the deferred tax asset.
by Primus Financial Products Subordinated Deferrable Interest Notes ("Primus ARS"). ARS are securities that are structured with short-term interest rate reset dates which generally occur every 28 days and are linked to LIBOR. At the reset date, investors can attempt to sell via auction or continue to hold the securities at par. These securities were accounted for in accordance with authoritative guidance for investments in debt and equity securities and were reported at fair value with unrealized gains and losses included in earnings.
During 2009, an other-than-temporary impairment ("OTTI") credit loss of $0.8 million was identified and recognized during the year ended December 31, 2009. This credit loss reduced the amortized cost basis on the Primus ARS to $1.7 million as of December 31, 2009. In May 2010, the Company sold its investment in the Primus ARS for $1.5 million. On July 1, 2010, the Company exercised its right to put the Indiana ARS back to UBS at par value of $5.0 million. The $5.0 million proceeds were received on July 1, 2010. As part of the settlement, the Company closed out a $3.6 million line of credit with UBS that the Company obtained as part of the buyback agreement originally executed in November 2008, with net cash proceeds of approximately $1.4 million.
We recognize liabilities for uncertain tax positions based on a two-step process. The first step requires us to determine if the weight of available evidence indicates that the tax position has met the threshold for recognition; therefore, we must evaluate whether it is more likely than not that the position will be sustained on audit, including resolution of any related appeals or litigation processes. The second step requires us to measure the tax benefit of the tax position taken, or expected to be taken, in an income tax return as the largest amount that is more than 50% likely of being realized upon ultimate settlement. This measurement step is inherently
30
- •
- Supplemental Executive Retirement Plan: Benefit costs and liabilities balances are calculated based on certain assumptions including benefits earned, discount rates, interest costs, mortality rates and other factors. Actual results that differ from the assumptions are accumulated and amortized over future periods, affecting the recorded obligation and expense in future periods. The following assumptions were used in the calculation of the net benefit cost and obligation at December 31:
complex and requires subjective estimations of such amounts to determine the probability of various possible outcomes. We re-evaluate the uncertain tax positions each quarter based on factors including, but not limited to, changes in facts or circumstances, changes in tax law, expirations of statutes of limitation, effectively settled issues under audit, and new audit activity. Such a change in recognition or measurement would result in the recognition of a tax benefit or an additional charge to the tax provision in the period.
Although we believe the measurement of our liabilities for uncertain tax positions is reasonable, no assurance can be given that the final outcome of these matters will not be different than what is reflected in the historical income tax provisions and accruals. If additional taxes are assessed as a result of an audit or litigation, it could have a material effect on the income tax provision and net income in the period or periods for which that determination is made. We operate within multiple taxing jurisdictions and are subject to audit in these jurisdictions. These audits can involve complex issues which may require an extended period of time to resolve and could result in additional assessments of income tax. We believe adequate provisions for income taxes have been made for all periods.
| |
2012 | 2011 | |||||
|---|---|---|---|---|---|---|---|
Discount rate |
3.25 | % | 3.90 | % | |||
Average rate of increase in compensation |
3.00 | % | 3.00 | % | |||
We believe the assumptions used are appropriate. However, changes in assumptions or differences in actual experience may affect our benefit obligation and future expenses.
Recently Issued Accounting Guidance
In July 2012, the FASB issued ASU 2012-02, Testing Indefinite-Lived Intangible Assets for Impairment, an amendment to FASB ASC Topic 350. The update provides an entity with the option to first assess qualitative factors in determining whether it is more likely than not that the indefinite-lived intangible asset is impaired. After assessing the qualitative factors, if an entity determines that it is not more likely than not that the indefinite-lived intangible asset is impaired, then the entity is not required to take further action. If an entity concludes otherwise, then it is required to determine the fair value of the indefinite-lived intangible asset and perform the quantitative impairment test. The ASU is effective for the Company for annual and interim impairment tests performed for fiscal years beginning after September 15, 2012. Early adoption was permitted. The Company did not early adopt the provisions of this ASU; however, the Company does not expect the impact of adopting this ASU to be material to the Company's financial position, results of operations or cash flows.
In February 2013, the FASB issued Accounting Standards Update ("ASU") 2013-02, Reporting of Amounts Reclassified Out of Accumulated Other Comprehensive Income, an amendment to FASB ASC Topic 220. The update requires disclosure of amounts reclassified out of accumulated other comprehensive income by component. In addition, an entity is required to present either on the face of the statement of operations or in the notes, significant amounts reclassified out of accumulated other comprehensive income by the respective line items of net income but only if the amount reclassified is required to be reclassified to net income in its entirety in the same reporting period. For amounts not reclassified in their entirety to net income, an entity is required to cross-reference to other disclosures
31
that provide additional detail about those amounts. This ASU is effective prospectively for the Company fiscal years, and interim periods within those years beginning after December 15, 2012. The Company will comply with the disclosure requirements of this ASU for the quarter ending March 31, 2013. The Company does not expect the impact of adopting this ASU to be material to the Company's financial position, results of operations or cash flows.
Results of Operations
The following table sets forth, for the periods indicated, certain items from our consolidated statements of income and comprehensive income as a percentage of our net sales:
| |
For the Year Ended December 31, |
|||||||||
|---|---|---|---|---|---|---|---|---|---|---|
| |
2012 | 2011 | 2010 | |||||||
Net sales |
100.0 | % | 100.0 | % | 100.0 | % | ||||
Material costs |
30.1 | 29.4 | 30.4 | |||||||
Personnel costs |
34.0 | 35.0 | 34.6 | |||||||
Other operating expenses |
19.2 | 19.4 | 20.2 | |||||||
Relocation expenses |
— | 0.1 | 2.0 | |||||||
Acquisition expenses |
0.1 | 0.1 | 0.7 | |||||||
Depreciation and amortization |
3.5 | 3.4 | 2.3 | |||||||
Income from operations |
13.1 | 12.6 | 9.8 | |||||||
Interest expense, net |
3.2 | 3.5 | 3.7 | |||||||
Extinguishment of debt |
— | — | 1.7 | |||||||
Loss from interest rate swap |
— | — | 0.2 | |||||||
Income before taxes |
9.9 | 9.1 | 4.2 | |||||||
Provision for income taxes |
3.5 | 3.2 | 1.7 | |||||||
Net income |
6.4 | 5.9 | 2.5 | |||||||
Year ended December 31, 2012 compared with the year ended December 31, 2011
Net Sales. Net sales for the year ended December 31, 2012 increased by $67.1 million, or 7.3%, to $985.6 million from $918.5 million last year. The sales increase was principally the result of a $30.1 million, or 4.0%, increase in same center sales; a $30.2 million increase from acquired entities; and a $6.8 million, or 6.8%, increase in sales of the Distribution segment.
Material Costs. Material costs for the year ended December 31, 2012 were $296.2 million, an increase of $26.0 million, or 9.6%, over $270.2 million for the same period in the prior year. The increase was the result of the growth in sales and change of product mix. Material costs as a percentage of net sales increased to 30.1% in 2012 from 29.4% in 2011.
Personnel Costs. Personnel costs for the year ended December 31, 2012 increased by $13.8 million to $335.3 million from $321.5 million for the year ended December 31, 2011. The increase from prior year was primarily due to $10.2 million of personnel costs associated with acquired patient care clinics, and other increases in salary expense, commissions and benefits.
Other Operating Expenses. Other operating expenses, which are comprised primarily of professional, office, bad debt, incentive compensation and reimbursable employee expenses, increased $11.0 million in 2012 to $188.9 million from $177.9 million for the year ended December 31, 2011. The increase was attributable to $4.2 million related to acquisitions, $3.3 million in incentive compensation and $2.2 million in professional fees, respectively. The remainder is attributable to other operating expenses. Other operating expenses as a percentage of net sales decreased slightly to 19.2%.
32
Relocation Expenses. During 2011, we completed the relocation of our corporate office from Bethesda, Maryland to Austin, Texas, which began in 2010. During the year ended December 31, 2012, we incurred no relocation costs compared to $1.2 million incurred in 2011.
Acquisition Expenses. During 2012, we acquired eighteen companies, consisting of 59 patient care clinics, and incurred $1.2 million of non-recurring costs related to these acquisitions, an increase of $0.4 million compared to the $0.8 million of acquisition related costs we incurred in 2011 to acquire eight companies that consisted of 21 patient care clinics.
Depreciation and Amortization. Depreciation and amortization for the year ended December 31, 2012 was $34.7 million versus $31.0 million for the year ended December 31, 2011. The increase was commensurate with the increase in capital expenditures in 2012.
Income from Operations. Income from operations increased $13.3 million to $129.3 million for the year ended December 31, 2012 compared to $116.0 million in the year ended December 31, 2011. The increase was primarily due to the Patient Care segment as fixed costs were leveraged over increased sales. The remaining increase was due to $5.9 million of additional operating income in the Distribution segment resulting from an increase in sales prices, implementation of cost management strategies and changes in sales mix. As a percentage of sales, income from operations in 2012 increased 0.5% from 12.6% to 13.1%.
Interest Expense. Interest expense for the year ended December 31, 2012 decreased slightly to $31.2 million, compared to $31.8 million for the year ended December 31, 2011, primarily due to a lower average term loan balance resulting from scheduled repayments, offset by increases in seller notes resulting from the 2012 acquisitions.
Provision for Income Taxes. An income tax provision of $34.5 million was recognized for the year ended December 31, 2012, compared to $29.7 million for the same period of the prior year. The increase in the income tax provision was primarily due to higher pre-tax earnings. Our effective tax rate was 35.1% and 35.3% for 2012 and 2011, respectively. The 2012 effective tax rate benefited 2.3% from prior period federal research and development credit claims filed in 2012, certain deferred tax asset rate changes, the release of a portion of our valuation allowance, and other nonrecurring discrete items. The 2011 effective tax rate benefited 2.5% from the realization of certain state tax benefits and other nonrecurring discrete items.
Net Income. Net income for the year ended December 31, 2012 increased to $63.7 million, or $1.83 per diluted share, compared to net income of $54.5 million, or $1.59 per diluted share, for the year ended December 31, 2011, primarily due to increased net sales and leveraged costs in 2012.
Year ended December 31, 2011 compared with the year ended December 31, 2010
Net Sales. Net sales for the year ended December 31, 2011 increased by $101.2 million, or 12.4%, to $918.5 million from $817.4 million in 2010. The sales increase was principally the result of a $18.4 million, or 2.6%, increase in same center sales in our Patient Care segment, a $4.9 million, or 5.1%, increase in sales of our Distribution segment, $57.4 million in increased sales from our Therapeutic Solutions segment, resulting primarily from the December 2010 acquisition of ACP, and a $20.5 million increase related to sales from acquired patient care entities.
Material Costs. Material costs for the year ended December 31, 2011 were $270.2 million, an increase of $21.5 million, or 8.6%, over $248.7 million for 2010. The increase was the result of the growth in sales. Material costs as a percentage of net sales decreased to 29.4% in 2011 from 30.4% in 2010. The decrease in material costs as a percentage of sales resulted from the inclusion of a full year of results from ACP, which has a lower of material costs as a percentage of sales.
33
Personnel Costs. Personnel costs for the year ended December 31, 2011 increased by $39.1 million to $321.5 million, from $282.4 million for the year ended December 31, 2010. The increase from the prior year was due primarily to $4.3 million related to merit increases and other compensation, $21.7 million from ACP, $9.5 million from acquired patient care clinics, and a $1.3 million increase in sales commissions. As a percentage of net sales, personnel costs increased by 40 basis points in 2011 compared to the same period in 2010 as a result of the acquisition of ACP, which is more labor intensive.
Other Operating Expenses. Other operating expenses for the year ended December 31, 2011 increased by $12.7 million to $177.9 million, from $165.2 million for the year ended December 31, 2010. The increase was due primarily to $12.2 million in expenses related to the acquisition of ACP and the patient care clinics, $4.0 million related to additional bad debt expense related to pilot programs in our Patient Care segment, and a $1.9 million increase in telephone and data expense, which was partially offset by a decrease of $4.0 million in incentive compensation expense and a $1.9 million change in expenses included in work in process compared to 2010. Other operating expenses as a percentage of net sales decreased 80 basis points to 19.4% compared to the same period in the prior year, as fixed costs were leveraged over increased sales.
Relocation Expenses. In 2011, we completed the relocation of our corporate office from Bethesda, Maryland to Austin, Texas which began in 2010. During the year ended December 31, 2011, we incurred $1.2 million in relocation costs, compared to $16.4 million in 2010. Of the $1.2 million in 2011, $1.0 million was from employee relocation and separation costs.
Acquisition Expenses. During 2011, we acquired eight companies, consisting of 21 patient care clinics, and incurred $0.8 million of legal and other costs related to these acquisitions. In December 2010, we acquired ACP and incurred acquisition costs of $5.4 million related to the transaction, consisting of $3.3 million in legal and advisor fees and $2.1 million of non-cash stock-based compensation expense.
Depreciation and Amortization. Depreciation and amortization for the year ended December 31, 2011 was $31.0 million, versus $18.8 million for the year ended December 31, 2010. The increase was commensurate with the increase in fixed asset purchases in 2011and the acquisition of ACP.
Income from Operations. Income from operations increased $35.5 million to $116.0 million for the year ended December 31, 2011, compared to $80.5 million for the year ended December 31, 2010. The increase was due to a reduction of $19.9 million in relocation and acquisition costs, $9.1 million of additional operating income related to the Therapeutic Services segment, and the remainder of the increase is attributable to the Patient Care segment. As a percentage of sales, income from operations increased to 12.6%, a 2.8% increase from 9.8% in 2010, primarily due to lower acquisition and relocation costs in 2011 and the acquisition of ACP in 2010.
Interest Expense. Interest expense for the year ended December 31, 2011 increased slightly to $31.8 million compared to $30.3 million for the year ended December 31, 2010, primarily due to higher debt balance in 2011 that resulted from the acquisition of ACP in the fourth quarter of 2010.
Extinguishment of Debt. In November and December 2010, we completed the refinancing of substantially all our outstanding debt. In conjunction with this transaction, a $14.0 million loss on extinguishment of debt was recorded during the fourth quarter of 2010.
Loss on Interest Rate Swaps. During 2010, we incurred a $1.6 million charge to terminate interest rate swaps. We were required to terminate the swaps in conjunction with refinancing our credit facilities.
Provision for Income Taxes. An income tax provision of $29.7 million was recognized for the year ended December 31, 2011, compared to $13.6 million in 2010. The increase in the income tax provision was primarily due to higher pre-tax earnings in 2011. Our effective tax rate was 35.3% and 39.5% for
34
2011 and 2010, respectively. The 2011 effective tax rate benefited 2.5% from the realization of certain state tax benefits and other nonrecurring discrete items.
Net Income. Net income for year ended December 31, 2011 increased to $54.5 million, or $1.59 per diluted share, compared to net income of $20.9 million, or $0.64 per diluted share, for the year ended December 31, 2010. 2011 net income increased over 2010 net income primarily due to increased net sales in 2011, and the absence of the following in 2011 that were incurred in 2010: corporate office relocation expenses, costs to acquire ACP, the extinguishment of debt, and the loss on the termination of the interest rate swaps, that were incurred in 2010.
Financial Condition, Liquidity and Capital Resources
Cash Flows
Our working capital at December 31, 2012 was $251.5 million, compared to $240.6 million and $185.3 million for the years ended December 31, 2011 and 2010, respectively. The increase in working capital was primarily due to an increase in cash, inventory, and accounts receivable. Days sales outstanding ("DSO"), which is the number of days between the billing for our O&P products and services and the date of our receipt of payment thereof, for the year ended December 31, 2012 increased to 58 days, compared to 54 days in 2011 and 52 days in 2010 for the same period. The increase in DSO was primarily due to the increase in fourth quarter sales and an increase in accounts receivable related to fourth quarter acquisitions. Net cash provided by operating activities was $81.3 million for the year ended December 31, 2012, compared to $61.8 million in 2011 or $54.2 million in 2010. The increase in cash provided by operating activities in the current year resulted primarily from increased net income and a decrease in incentive compensation payments in 2012.
Net cash used in investing activities was $99.1 million, $46.9 million, and $186.0 million for the years ended December 31, 2012, 2011, and 2010 respectively. In 2012, 2011, and 2010, we invested $33.2 million, $28.7 million, and $30.6 million, respectively, in improvements to our patient care clinics, upgrades to our computer hardware and software, and purchases of equipment leased to third parties by our Therapeutic Solutions segment. In 2012, we acquired eighteen O&P companies, operating a total of 59 patient care clinics, at an aggregate purchase price of $83.1 million. In 2011, we acquired eight O&P companies, operating a total of 21 patient care clinics, at an aggregate purchase price of $24.9 million. In 2010, we acquired five O&P companies, operating a total of six patient care clinics, at an aggregate purchase price of $10.6 million along with the acquisition of ACP for a purchase price of approximately $157.8 million. The ACP acquisition was funded using cash on hand and a portion of the proceeds from the new debt facility discussed below. Additionally, in 2012 we invested $2.0 million in company-owned life insurance policies that cover senior executives and certain management of the Company; the Company is the beneficiary under these policies. Additionally, in 2012, we restricted $3.1 million of cash in order to eliminate letters of credit obligations under our revolving credit agreement.
Net cash (used in)/provided by financing activities was $(6.0) million, $(8.3) million, and $83.5 million for the years ended December 31, 2012, 2011 and 2010, respectively. During 2012 we: (i) repaid $3.7 million related to term loan borrowings under our credit facilities ("Term Loans") (ii) made $5.3 million of scheduled repayments of promissory notes we issued in connection with acquisitions ("Seller Notes"); (iii) made $0.7 million of scheduled payments of capital lease obligations; (iv) received $1.5 million in tax benefits associated with stock-based compensation; and (iv) received $2.2 million of proceeds from employee stock compensation plans. During 2011 we: (i) borrowed and repaid $10.0 million under our revolving credit facility; (ii) made $4.2 million of scheduled repayments of Seller Notes; (iii) repaid $3.0 million related to Term Loans; incurred $4.2 million of financing costs related to the repricing of our debt in the first quarter of 2011; and (iv) received $0.6 million of proceeds from employee stock compensation plans. During 2010 we: (i) entered into new Credit
35
Facilities (see further description below under the heading "Debt"); (ii) sold 0.4 million shares of common stock with proceeds of $7.4 million to executives of ACP in connection with the closing of the ACP acquisition; (iii) paid off the $3.6 million line of credit related to the auction rate securities; and (iv) made scheduled repayments of Seller Notes of $3.8 million; and (v) $5.0 million of proceeds from issuance of stock under employee stock compensation plans.
Debt
The following summarizes our debt balance at December 31:
| (In thousands) |
2012 | 2011 | |||||
|---|---|---|---|---|---|---|---|
Revolving Credit Facility |
$ | — | $ | — | |||
Term Loan |
293,300 | 297,000 | |||||
71/8% Senior Notes due 2018 |
200,000 | 200,000 | |||||
Subordinated seller notes, non-collateralized, net of unamortized discount with principal and interest payable in either monthly, quarterly or annual installments at effective interest rates ranging from 2.00% to 6.5%, maturing through November 2018 |
27,346 | 11,033 | |||||
|
520,646 | 508,033 | |||||
Less current portion |
(11,082 | ) | (8,065 | ) | |||
|
$ | 509,564 | $ | 499,968 | |||
Refinancing and Amendment
During the fourth quarter of 2010, we refinanced our senior debt through the issuance of $200.0 million of 71/8% Senior Notes due 2018, a new $300.0 million Term Loan Facility which matures in 2016, and the establishment of a $100.0 million Revolving Credit Facility. We recorded a $14.0 million charge related to the early extinguishment of the senior debt, comprised primarily of $9.8 million of premiums paid to debt holders and a $4.2 million write-off of debt issuance costs and other fees. The proceeds of the refinancing were used for the following: (i) $184.8 million to retire our outstanding 101/4% Senior Notes due 2014 and related premiums and fees; (ii) $220.3 million to retire the outstanding balance under our existing Term Loan Facility; (iii) $16.9 million to pay debt issuance costs; and (iv) $78.2 million to partially fund the purchase price for the acquisition of ACP.
On March 11, 2011, we entered into an amendment to our Credit Agreement dated as of December 1, 2010 (as amended, the "Credit Agreement"). The amendment (i) reduced the interest rate margin applicable to the Term Loans under the Credit Agreement by 0.75% to 3.0% and (ii) reduced the LIBOR floor applicable to the Term Loans under the Credit Agreement from 1.5% to 1.0%. We incurred $4.1 million of fees related to the Amendment which will be amortized into interest expense over the remaining term of the debt.
Revolving Credit Facility
The $100.0 million Revolving Credit Facility matures on December 1, 2015 and bears interest at LIBOR plus 3.25%, or the applicable rate (as defined in the Credit Agreement). The Revolving Credit Facility requires compliance with various covenants including but not limited to (i) minimum consolidated interest coverage ratio of 3.50:1.00; (ii) maximum consolidated leverage ratio of 4.00:1.00; and (iii) maximum annual capital expenditures of 7.5% of consolidated net revenues of the preceding fiscal year with an additional rollover up to $15.0 million from the prior year's allowance if not expended in the fiscal year for which it is permitted. As of December 31, 2012, we were in compliance with these covenants. As of December 31, 2012, we had $99.5 million available under this facility. This
36
availability as of December 31, 2012 was net of standby letters of credit of approximately $0.5 million. On April 28, 2011, the Company paid back a $10.0 million draw on the Revolving Credit Facility. As of December 31, 2012 the Company had no funds drawn on the Revolving Credit Facility. The obligations under the Revolving Credit Facility are senior obligations, are guaranteed by our subsidiaries, and are secured by a first priority perfected interest in our subsidiaries' shares, all of our assets, and all the assets of our subsidiaries.
Term Loan
The $300.0 million Term Loan Facility matures on December 1, 2016 and requires quarterly principal payments. From time to time, mandatory prepayments may be required as a result of excess free cash flow as defined in the Credit Agreement, certain additional debt incurrences and asset sales, or other events as defined in the Credit Agreement. During 2012, the Company made a mandatory prepayment on its Term Loan Facility of $700,000. The Term Loan Facility bears interest at LIBOR plus 3.0%, or the applicable rate (as defined in the Credit Agreement), and includes a 1.0% LIBOR floor. As of December 31, 2012, the interest rate on the Term Loan Facility was 4.0%. The obligations under the Term Loan Facility are senior obligations, are guaranteed by the Company's subsidiaries, and are secured by a first priority perfected interest in the equity interests of Company's subsidiaries, all of the Company's assets, and all the assets of the Company's subsidiaries.
71/8% Senior Notes
The 71/8% Senior Notes mature November 15, 2018 and are senior indebtedness which is guaranteed on a senior unsecured basis by all of the Company's current and future subsidiaries. Interest is payable semi-annually on May 15 and November 15 of each year, commencing May 15, 2011.
On or prior to November 15, 2013, we may redeem up to 35% of the aggregate principal amount of the notes at a redemption price of 107.125% of the principal amount thereof, plus accrued and unpaid interest and additional interest to the redemption date with the proceeds of a public offering of our equity securities. On or after November 15, 2014, the Company may redeem all or from time to time a part of the notes, upon not less than 30 days' and not more than 60 days' notice, for the twelve month period beginning on November 15, of the indicated years at (i) 103.563% during 2014; (ii) 101.781% during 2015; and (iii) 100.00% during 2016 and thereafter through November 15, 2018.
Subsidiary Guarantees
The Revolving and Term Loan Facilities and the 71/8% Senior Notes are guaranteed by all of the Company's subsidiaries. Separate condensed consolidating information is not included as the Company does not have independent assets or operations. The Guarantees are full and unconditional and joint and several, and any subsidiaries of the Company other than the Guarantor Subsidiaries are minor. There are no restrictions on the ability of our subsidiaries to transfer cash to the Company or to co-guarantors. All consolidated amounts in the Company's financial statements are representative of the combined guarantors.
Debt Covenants
The terms of the Senior Notes, the Revolving Credit Facility, and the Term Loan Facility limit our ability to, among other things, incur additional indebtedness, create liens, pay dividends on or redeem capital stock, make certain investments, make restricted payments, make certain dispositions of assets, engage in transactions with affiliates, engage in certain business activities and engage in mergers, consolidations and certain sales of assets. As of December 31, 2012, we were in compliance with all covenants under these debt agreements.
37
General
We believe that, based on current levels of operations and anticipated growth, cash generated from operations, together with other available sources of liquidity, including borrowings available under the Revolving Credit Facility, will be sufficient for at least the next twelve months to fund anticipated capital expenditures and make required payments of principal and interest on our debt, including payments due on our outstanding debt. As of December 31, 2012, $293.3 million, or 56.3%, of our total debt of $520.6 million was subject to variable interest rates. We had access to funds totaling $118.7 million, comprised of $19.2 million of cash and $99.5 million available under the Revolving Credit Facility, at December 31, 2012. Availability under the Revolving Credit Facility is net of $0.5 million of outstanding letters of credit. We believe that we have sufficient liquidity to conduct our normal operations and fund our acquisition plan in 2013.
Obligations and Commercial Commitments
The following table sets forth our contractual obligations and commercial commitments as of December 31, 2012:
| (In thousands) |
2013 | 2014 | 2015 | 2016 | 2017 | Thereafter | Total | |||||||||||||||
|---|---|---|---|---|---|---|---|---|---|---|---|---|---|---|---|---|---|---|---|---|---|---|
Long-term debt(1) |
$ | 11,082 | $ | 10,942 | $ | 10,473 | $ | 287,574 | $ | 200,575 | — | $ | 520,646 | |||||||||
Interest payments on long-term debt |
26,665 | 26,323 | 25,958 | 24,245 | 14,266 | — | 117,457 | |||||||||||||||
Operating leases |
44,154 | 35,833 | 25,552 | 18,734 | 13,413 | 27,727 | 165,413 | |||||||||||||||
Capital leases |
927 | 750 | 701 | 663 | 618 | 2,287 | 5,946 | |||||||||||||||
Other long-term obligations(2) |
11,429 | 7,744 | 4,689 | 2,909 | 2,909 | 16,492 | 46,172 | |||||||||||||||
Total contractual cash obligations |
$ | 94,257 | $ | 81,592 | $ | 67,373 | $ | 334,125 | $ | 231,781 | $ | 46,506 | $ | 855,634 | ||||||||
- (1)
- Interest
projections were based on the assumptions that the future rate will remain at the current rate of 4%, which is the Company's estimate for such
period based on current and projected LIBOR rates.
- (2)
- Other long-term obligations include commitments under our SERP plan in addition to IT and telephone contracts. Refer to Note K to our Consolidated Financial Statements contained herein elsewhere in this Annual Report on Form 10-K for additional disclosure on the SERP plan.
The carrying value of the Company's long-term debt, excluding the Senior Notes, approximates fair value based on rates currently available to the Company for debt with similar terms and remaining maturities. The fair value of the Senior Notes, at December 31, 2012, was $211.5 million, as compared to the carrying value of $200.0 million at that date. The fair values of the Senior Notes were based on the quoted market price at December 31, 2012.
Off-Balance Sheet Arrangements
Our wholly-owned subsidiary, IN, Inc., is party to a non-binding purchase agreement under which it purchases assembled WalkAide system kits. As of December 31, 2012, IN, Inc. had outstanding purchase commitments of approximately $0.5 million, which we expect to be fulfilled over the next three months.
Dividends
We have never paid cash dividends on our common stock and intend to continue this policy for the foreseeable future. We plan to retain earnings for use in our business. The terms of our credit agreements and certain other agreements limit the payment of dividends on our common stock and such agreements are expected to continue to limit the payment of dividends in the future.
38
Supplemental Executive Retirement Plan
In 2004, we implemented an unfunded noncontributory defined benefit plan that covers certain of our senior executives. We have engaged an actuary to calculate the benefit obligation and net benefits cost as of December 31, 2012, and 2011 and have utilized such to establish our benefit obligation liability.
The following weighted average assumptions were used to determine the benefit obligation and net benefit cost at December 31:
| |
2012 | 2011 | |||||
|---|---|---|---|---|---|---|---|
Discount rate |
3.25 | % | 3.90 | % | |||
Average rate of increase in compensation |
3.00 | % | 3.00 | % | |||
The discount rate at December 31, 2012 of 3.25% decreased 65 basis points compared to the discount rate used at December 31, 2011 due to changes in the pension discount curve rate available on the open market at December 31, 2012. The average rate of increase in compensation was 3.00% at December 31, 2012 and 2011.
Future payments under the supplemental executive retirement plan as of December 31, 2012 are as follows:
| (In thousands) |
|
|||
|---|---|---|---|---|
2013 |
$ | 1,247 | ||
2014 |
1,578 | |||
2015 |
1,578 | |||
2016 |
1,578 | |||
2017 |
1,578 | |||
Thereafter |
14,818 | |||
|
$ | 22,377 | ||
Selected Operating Data
The following table sets forth selected operating data as of the end of the years indicated:
| |
2012 | 2011 | 2010 | 2009 | 2008 | |||||||||||
|---|---|---|---|---|---|---|---|---|---|---|---|---|---|---|---|---|
Patient care clinics |
748 | 701 | 678 | 677 | 668 | |||||||||||
Revenue generating O&P clinicians |
1,269 | 1,191 | 1,156 | 1,127 | 1,070 | |||||||||||
Number of states (including D.C.) |
46 | 46 | 46 | 46 | 46 | |||||||||||
Same center net sales growth(1) |
4.0 | % | 2.6 | % | 4.6 | % | 4.9 | % | 7.3 | % | ||||||
- (1)
- Represents the aggregate increase or decrease of our patient care clinics' sales in the current year compared to the preceding year. Patient care clinics that have been owned by the Company for at least one full year are included in the computation.
Market Risk
We are exposed to the market risk that is associated with changes in interest rates. $293.3 million of our $520.6 million total debt outstanding as of December 31, 2012 is subject to variable interest rates (see Item 7A below).
39
Forward Looking Statements
This report contains forward-looking statements setting forth our beliefs or expectations relating to future revenues, contracts and operations, as well as the results of an internal investigation and certain legal proceedings. Actual results may differ materially from projected or expected results due to changes in the demand for our O&P products and services, uncertainties relating to the results of operations or recently acquired O&P patient care clinics, our ability to enter into and derive benefits from managed-care contracts, our ability to successfully attract and retain qualified O&P clinicians, federal laws governing the health-care industry, uncertainties inherent in investigations and legal proceedings, governmental policies affecting O&P operations and other risks and uncertainties generally affecting the health-care industry. Readers are cautioned not to put undue reliance on forward-looking statements. Refer to risk factors disclosed in Part I, Item 1A of this filing for discussion of risks and uncertainties. We disclaim any intent or obligation to publicly update these forward-looking statements, whether as a result of new information, future events or otherwise.
ITEM 7A. QUANTITATIVE AND QUALITATIVE DISCLOSURES ABOUT MARKET RISK
We have existing obligations relating to our 71/8% Senior Notes, Term Loan Facility, and Seller Notes. As of December 31, 2012, we have cash flow exposure to the changing interest rates on $293.3 million of the Term Loan Facility. The other obligations have fixed interest rates.
Presented below is an analysis of our financial instruments as of December 31, 2012 that is sensitive to changes in interest rates. The table demonstrates the changes in estimated annual cash flow related to the outstanding balance under the Term Loan Facility, calculated for an instantaneous parallel shift in interest rates, plus or minus 50 basis points ("BPS"), 100 BPS, and 150 BPS. The LIBOR floor pursuant to the Term Loans under the Credit Agreement prevents the rate from dropping below 4.0%. As of December 31, 2012, the current LIBOR rate is below the LIBOR floor; therefore, our interest rate on this loan is fixed until Libor rises above the 1% floor. Any further changes in the LIBOR rate would not change annual cash flows related to the outstanding balance on the Term Loan Facility until LIBOR rises above the 1% floor.
| |
Annual Interest Expense Given an Interest Rate Decrease of X Basis Points |
No Change in Interest Rates |
Annual Interest Expense Given an Interest Rate Increase of X Basis Points |
|||||||||||||||||||
|---|---|---|---|---|---|---|---|---|---|---|---|---|---|---|---|---|---|---|---|---|---|---|
Cash Flow Risk
|
(150 BPS) | (100 BPS) | (50 BPS) | |
50 BPS | 100 BPS | 150 BPS | |||||||||||||||
| (In thousands) |
|
|||||||||||||||||||||
Term Loan |
$ | 11,732 | $ | 11,732 | $ | 11,732 | $ | 11,732 | $ | 11,732 | $ | 12,348 | $ | 13,814 | ||||||||
ITEM 8. FINANCIAL STATEMENTS AND SUPPLEMENTARY DATA
The consolidated financial statements and schedules required hereunder and contained herein are listed under Item 15(a) below and included beginning at page F-4 of this Annual Report on Form 10-K.
Quarterly Financial Data
| |
Quarter Ended (Unaudited) | ||||||||||||
|---|---|---|---|---|---|---|---|---|---|---|---|---|---|
2012
|
Mar 31 | Jun 30 | Sep 30 | Dec 31 | |||||||||
| (Dollars in thousands, except per share amounts) |
|||||||||||||
Net Sales |
$ | 218,091 | $ | 251,754 | $ | 243,503 | $ | 272,202 | |||||
Income from operations |
$ | 21,737 | $ | 35,726 | $ | 35,373 | $ | 36,502 | |||||
Net Income |
$ | 8,636 | $ | 17,386 | $ | 17,344 | $ | 20,326 | |||||
Basic per Common Share Net Income |
$ | 0.25 | $ | 0.51 | $ | 0.50 | $ | 0.59 | |||||
Diluted per Common Share Net Income |
$ | 0.25 | $ | 0.50 | $ | 0.50 | $ | 0.58 | |||||
40
| |
Quarter Ended (Unaudited) | ||||||||||||
|---|---|---|---|---|---|---|---|---|---|---|---|---|---|
2011
|
Mar 31 | Jun 30 | Sep 30 | Dec 31 | |||||||||
| (Dollars in thousands, except per share amounts) |
|||||||||||||
Net Sales |
$ | 200,439 | $ | 234,751 | $ | 235,261 | $ | 248,088 | |||||
Income from operations |
$ | 19,293 | $ | 32,882 | $ | 31,242 | $ | 32,537 | |||||
Net Income |
$ | 6,752 | $ | 15,431 | $ | 15,412 | $ | 16,882 | |||||
Basic per Common Share Net Income |
$ | 0.20 | $ | 0.46 | $ | 0.46 | $ | 0.50 | |||||
Diluted per Common Share Net Income |
$ | 0.20 | $ | 0.45 | $ | 0.45 | $ | 0.49 | |||||
The following table summarizes our unaudited quarterly operating results for each of 2012 and 2011. For a discussion of the restatement and the correction of errors, see Revision of Previously Reported Consolidated Income Statements in Note B of the financial statements. The impact of the error on the Consolidated Statements of Income and Comprehensive Income for the quarters is shown in the table below:
| (Dollars in thousands, except per share amounts) |
Three months ended March 31, 2012 |
Three months ended March 31, 2011 |
Three months ended December 31, 2011 |
|||||||||||||||||||||||||
|---|---|---|---|---|---|---|---|---|---|---|---|---|---|---|---|---|---|---|---|---|---|---|---|---|---|---|---|---|
Increase/(decrease)
|
As Reported |
Adjustment | As Restated |
As Reported |
Adjustment | As Restated |
As Reported |
Adjustment | As Revised |
|||||||||||||||||||
Income from operations |
19,956 | 1,781 | 21,737 | 18,384 | 909 | 19,293 | 34,318 | (1,781 | ) | 32,537 | ||||||||||||||||||
Net income |
7,555 | 1,081 | 8,636 | 6,213 | 539 | 6,752 | 17,963 | (1,081 | ) | 16,882 | ||||||||||||||||||
Diluted Earnings per share |
$ | 0.22 | $ | 0.03 | $ | 0.25 | $ | 0.18 | $ | 0.02 | $ | 0.20 | $ | 0.52 | $ | (0.03 | ) | $ | 0.49 | |||||||||
For a discussion of material events affecting performance in each quarter, see Item 7. Management's Discussion and Analysis of Financial Condition and Results of Operations.
ITEM 9. CHANGES IN AND DISAGREEMENTS WITH ACCOUNTANTS ON ACCOUNTING AND FINANCIAL DISCLOSURE
None.
ITEM 9A. CONTROLS AND PROCEDURES
Management's Restatement of Previously Issued Financial Statements
As discussed in Item 4.02 (a) of the Company's Current Report on Form 8-K, dated March 18, 2013, management of the Company will restate previously issued consolidated financial statements for the quarters ended March 31, 2012 and 2011 included in the Company's Quarterly Report on Form 10-Q for the quarter ended March 31, 2012. The determination to restate these consolidated financial statements was made as a result of the Company's identification of certain accounting errors as discussed in footnote B of the consolidated financial statements included in this Annual Report on Form 10-K.
Disclosure Controls and Procedures
Our disclosure controls and procedures are designed to provide reasonable assurance that information required to be disclosed by us in our reports filed or submitted to the Securities and Exchange Commission is recorded, processed, summarized and reported within the time periods specified in the Commission's rules and forms. Disclosure controls and procedures include, without limitation, controls and procedures designed to ensure that information required to be disclosed by an issuer in the reports that it files or submits under the Act is accumulated and communicated to the issuer's management, including its principal executive and principal financial officers, or persons performing similar functions, as appropriate to allow timely decisions regarding required disclosure. Based on an evaluation of the Company's disclosure controls and procedures conducted by our Chief Executive Officer and Chief
41
Financial Officer, such officers concluded that our disclosure controls and procedures were not effective as of December 31, 2012 because of the material weakness described in "Management's Report on Internal Control Over Financial Reporting" in Item 8.
Internal Control Over Financial Reporting
(a) Management's Annual Report on Internal Control Over Financial Reporting
In accordance with Item 308(a) of the Commission's Regulation S-K, the report of management on our internal control over financial reporting is set forth immediately preceding our financial statements included in this Annual Report on Form 10-K.
(b) Report of the Registrant's Independent Registered Public Accounting Firm
The effectiveness of our internal control over financial reporting as of December 31, 2012 has been audited by PricewaterhouseCoopers LLP, an independent registered public accounting firm, as stated in their report included in this Annual Report on Form 10-K.
(c) Changes in Internal Control Over Financial Reporting
In accordance with Rule 13a-15(d) under the Securities Exchange Act of 1934, management, with the participation of our Chief Executive Officer and Chief Financial Officer, determined that there was no change in our internal control over financial reporting that occurred during the fourth quarter ended December 31, 2012, that has materially affected, or is reasonably likely to materially affect, our internal control over financial reporting.
Plan for Remediation of Material Weakness
In an effort to remediate the material weakness discussed in Management's Annual Report on Internal Control Over Financial Reporting, Management will implement additional annual and quarterly reviews, analyses and calculations related to the valuation of work-in-process inventory. We believe the remediation measures described above will remediate this material weakness going forward. Management will also continue to evaluate our controls and procedures, and may implement additional measures in the future or modify certain of the remediation measures described above.
None.
42
ITEM 10. DIRECTORS, EXECUTIVE OFFICERS AND CORPORATE GOVERNANCE
Pursuant to General Instruction G(3) of Form 10-K, the information called for by this item regarding directors is hereby incorporated by reference from our definitive proxy statement or amendment hereto to be filed pursuant to Regulation 14A not later than 120 days after the end of the fiscal year covered by this report. Information regarding our executive officers is set forth at the end of Part I of this Annual Report on Form 10-K.
ITEM 11. EXECUTIVE COMPENSATION
Pursuant to General Instruction G(3) of Form 10-K, the information called for by this item is hereby incorporated by reference from our definitive proxy statement or amendment hereto to be filed pursuant to Regulation 14A not later than 120 days after the end of the fiscal year covered by this report.
ITEM 12. SECURITY OWNERSHIP OF CERTAIN BENEFICIAL OWNERS AND MANAGEMENT AND RELATED STOCKHOLDER MATTERS
Pursuant to General Instruction G(3) of Form 10-K, the information called for by this item is hereby incorporated by reference from our definitive proxy statement or amendment hereto to be filed pursuant to Regulation 14A not later than 120 days after the end of the fiscal year covered by this report.
ITEM 13. CERTAIN RELATIONSHIPS AND RELATED TRANSACTIONS, AND DIRECTOR INDEPENDENCE
Pursuant to General Instruction G(3) of Form 10-K, the information called for by this item is hereby incorporated by reference from our definitive proxy statement or amendment hereto to be filed pursuant to Regulation 14A not later than 120 days after the end of the fiscal year covered by this report.
ITEM 14. PRINCIPAL ACCOUNTING FEES AND SERVICES
Pursuant to General Instruction G(3) of Form 10-K, the information called for by this item is hereby incorporated by reference from our definitive proxy statement or amendment hereto to be filed pursuant to Regulation 14A not later than 120 days after the end of the fiscal year covered by this report.
43
ITEM 15. EXHIBITS AND FINANCIAL STATEMENT SCHEDULE
(a) Financial Statements and Financial Statement Schedule:
(1) Financial Statements:
Hanger, Inc. |
||||
Management's Annual Report on Internal Control over Financial Reporting |
||||
Report of Independent Registered Public Accounting Firm |
||||
Consolidated Balance Sheets as of December 31, 2012 and 2011 |
||||
Consolidated Statements of Income and Comprehensive Income for the Three Years Ended December 31, 2012 |
||||
Consolidated Statements of Changes in Shareholders' Equity for the Three Years Ended December 31, 2012 |
||||
Consolidated Statements of Cash Flows for the Three Years Ended December 31, 2012 |
||||
Notes to Consolidated Financial Statements |
(2) Financial Statement Schedule:
| Schedule II—Valuation and Qualifying Accounts | ||||
All other schedules are omitted either because they are not applicable or required, or because the required information is included in the financial statements or notes thereto. |
(3) Exhibits:
See Part (b) of this Item 15.
- (b)
- Exhibits: The following exhibits are filed herewith or incorporated herein by reference:
| Exhibit No. | Document | ||
|---|---|---|---|
| 3.1 | Restated Certificate of Incorporation of Hanger, Inc., dated August 27, 2012. (Incorporated herein by reference to Exhibit 3.1 to the Current Report on Form 8-K filed by the Registrant on August 27, 2012). | ||
3.2 |
Amended and Restated By-Laws of Hanger Orthopedic Group, Inc., as amended effective February 2, 2012. (Incorporated herein by reference to Exhibit 3.1 to the Current Report on Form 8-K filed by the Registrant on February 6, 2012). |
||
4.1 |
Indenture, dated November 2, 2010, by and among the Hanger Orthopedic Group, Inc., each of the Subsidiary Guarantors party thereto and Wilmington Trust Company, as trustee. (Incorporated herein by reference to Exhibit 4.1 to the Registrant's Current Report on Form 8-K filed on October 29, 2010). |
||
4.2 |
First Supplemental Indenture, dated December 13, 2010, by and among the Hanger Orthopedic Group, Inc., each of the Subsidiary Guarantors party thereto and Wilmington Trust Company, as trustee. (Incorporated herein by reference to Exhibit 4.3 to the Registrant's Annual Report on Form 10-K for the year ended December 31, 2010). |
||
44
| Exhibit No. | Document | ||
|---|---|---|---|
| 4.3 | Second Supplemental Indenture, dated February 15, 2011, by and among the Hanger Orthopedic Group, Inc., Accelerated Care Plus Corp., ACP Medical Supply Corporation, Liberty Health Services, LLC and Wilmington Trust Company, as trustee. (Incorporated herein by reference to Exhibit 4.2 to the Registrant's Quarterly Report on Form 10-Q for the quarter ended March 31, 2011). | ||
10.1 |
Amended and Restated 2002 Stock Incentive Plan, as amended through May 10, 2007. (Incorporated herein by reference to Appendix 1 to the Registrant's Proxy Statement, dated April 10, 2007, relating to the Registrant's Annual Meeting of Stockholders held on May 10, 2007).* |
||
10.2 |
Amended and Restated 2003 Non-Employee Directors' Stock Incentive Plan, as amended through May 10, 2007. (Incorporated herein by reference to Appendix 2 to the Registrant's Proxy Statement, dated April 10, 2007, relating to the Registrant's Annual Meeting of Stockholders held on May 10, 2007). |
||
10.3 |
Form of Stock Option Agreement (Non-Executive Employees), Stock Option Agreement (Executive Employees), Restricted Stock Agreement (Non-Executive Employees) and Restricted Stock Agreement (Executive Employees). (Incorporated herein by reference to Exhibits 10.1, 10.2, 10.3 and 10.4, respectively, to the Registrant's Current Report on Form 8-K filed on February 24, 2005).* |
||
10.4 |
Supplemental Executive Retirement Plan, as amended and restated effective January 1, 2011 (Incorporated herein by reference to Exhibit 10.4 to the Registrant's Annual Report on Form 10-K for the year ended December 31, 2010).* |
||
10.8 |
Credit Agreement, dated as of December 1, 2010, among the Company and the lenders and agents party thereto. (Incorporated herein by reference to Exhibit 4.1 to the Registrant's Current Report on Form 8-K filed on December 1, 2010). |
||
10.9 |
Guarantee and Collateral Agreement, dated as of December 1, 2010, made by the Registrant, as Borrower, and certain of its subsidiaries, in favor of Bank of America, N/A., as Administrative Agent. (Incorporated herein by reference to Exhibit 10.9 to the Registrant's Annual Report on Form 10-K for the year ended December 31, 2010). |
||
10.10 |
Amendment No. 1, dated as of March 11, 2011, to the Credit Agreement, dated as of December 1, 2010, among the Company and the lenders and gents party hereto. (Incorporated by reference to Exhibit 4.1 to the Current Report on Form 8-K filed by the Registrant on March 11, 2011). |
||
10.11 |
Fourth Amended and Restated Employment Agreement, effective as of January 1, 2012, by and between George E. McHenry and the Company. (Incorporated herein by reference to Exhibit 10.3 to the Registrant's Current Report on Form 8-K filed on January 27, 2012).* |
||
10.12 |
Fourth Amended and Restated Employment Agreement, effective as of January 1, 2012, by and between Richmond L. Taylor and the Company. (Incorporated herein by reference to Exhibit 10.4 to the Registrant's Current Report on Form 8-K filed on January 27, 2012).* |
||
10.13 |
Hanger Orthopedic Group, Inc. 2010 Omnibus Incentive Plan (incorporated herein by reference to Exhibit 10.1 to the Registrant's Quarterly Report on Form 10-Q for the quarter ended June 30, 2010).* |
||
10.14 |
Form of Restricted Stock Agreement for Non-Employee Directors (incorporated herein by reference to Exhibit 10.2 to the Registrant's Quarterly Report on Form 10-Q for the quarter ended June 30, 2010).* |
||
45
| Exhibit No. | Document | ||
|---|---|---|---|
| 10.15 | Form of Restricted Stock Agreement for Executives (incorporated herein by reference to Exhibit 10.3 to the Registrant's Quarterly Report on Form 10-Q for the quarter ended June 30, 2010).* | ||
10.16 |
Form of Restricted Stock Agreement for Employees Executives (incorporated herein by reference to Exhibit 10.4 to the Registrant's Quarterly Report on Form 10-Q for the quarter ended June 30, 2010).* |
||
10.17 |
Form of Non-Employee Director Non-Qualified Stock Option Agreement (incorporated herein by reference to Exhibit 10.5 to the Registrant's Quarterly Report on Form 10-Q for the quarter ended June 30, 2010).* |
||
10.18 |
Form of Executive Non-Qualified Stock Option Agreement (incorporated herein by reference to Exhibit 10.6 to the Registrant's Quarterly Report on Form 10-Q for the quarter ended June 30, 2010).* |
||
10.19 |
Form of Non-Qualified Stock Option Agreement (incorporated herein by reference to Exhibit 10.7 to the Registrant's Quarterly Report on Form 10-Q for the quarter ended June 30, 2010).* |
||
10.20 |
Securities Purchase and Lock-Up Agreement, dated October 18, 2010, by and between Hanger Orthopedic Group, Inc. and John B. Breach and Schedule of Substantially Identical Securities Purchase and Lock-Up Agreements Omitted Pursuant to Instruction 2 to Item 601 of Regulation S-K (Incorporated herein by reference to Exhibit 10.1 to the Registrant's Current Report on Form 8-K filed on October 18, 2010). |
||
10.21 |
Amended and Restated Employment Agreement, as of January 1, 2012 by and between Vinit K. Asar and the Company. (Incorporated herein by reference to Exhibit 10.2 to the Registrant's Current Report on Form 8-K filed on January 27, 2012).* |
||
10.22 |
Amended and Restated Employment Agreement, dated as of March 30, 2012, between Thomas E. Hartman and Hanger Prosthetics & Orthotics, Inc. (Filed herewith).* |
||
10.23 |
Second Amended and Restated Employment Agreement, dated August 27, 2012, by and between Vinit K. Asar and Hanger, Inc. (Incorporated herein by reference to Exhibit 10.1 to the Current Report on Form 8-K filed by the Registrant on August 27, 2012).* |
||
10.24 |
Amended and Restated Employment Agreement, dated as of February 25, 2013, by and between Kenneth W. Wilson and Southern Prosthetic Supply, Inc. (Filed herewith).* |
||
21 |
List of Subsidiaries of the Registrant. (Filed herewith). |
||
23.1 |
Consent of PricewaterhouseCoopers LLP. (Filed herewith). |
||
31.1 |
Written Statement of the Chief Executive Officer Pursuant to Section 302 of the Sarbanes-Oxley Act of 2002. (Filed herewith). |
||
31.2 |
Written Statement of the Chief Financial Officer Pursuant to Section 302 of the Sarbanes-Oxley Act of 2002. (Filed herewith). |
||
32 |
Written Statement of the Chief Executive Officer and Chief Financial Officer Pursuant to 18 U.S.C. Section 1350, as adopted Pursuant to Section 906 of the Sarbanes-Oxley Act of 2002. (Filed herewith). |
||
46
| Exhibit No. | Document | ||
|---|---|---|---|
| 101 | The following financial information from the Company's Annual Report on Form 10-K, for the period ended December 31, 2012, formatted in eXtensible Business Reporting Language: (i) Consolidated Balance Sheets, (ii) Consolidated Statements of Income and Comprehensive Income, (iii) Consolidated Statements of Shareholders' Equity, (iv) Consolidated Statements of Cash Flows, (v) Notes to Consolidated Financial Statements(1) | ||
- *
- Management contract or compensatory plan
47
Pursuant to the requirements of Section 13 or 15(d) of the Securities Exchange Act of 1934, the Registrant has duly caused this report to be signed on its behalf by the undersigned, thereunto duly authorized.
| HANGER, INC. | ||||
Dated: March 18, 2013 |
By: |
/s/ VINIT K. ASAR Vinit K. Asar Chief Executive Officer |
||
Pursuant to the requirements of the Securities Exchange Act of 1934, this report has been signed below by the following persons on behalf of the Registrant and in the capacities and on the dates indicated.
| |
|
|
|---|---|---|
| Dated: March 18, 2013 | /s/ VINIT K. ASAR Vinit K. Asar Chief Executive Officer and Director (Principal Executive Officer) |
|
Dated: March 18, 2013 |
/s/ GEORGE E. MCHENRY George E. McHenry Executive Vice President and Chief Financial Officer (Principal Financial Officer and Principal Accounting Officer) |
|
Dated: March 18, 2013 |
/s/ IVAN R. SABEL, CPO Ivan R. Sabel, CPO Director |
|
Dated: March 18, 2013 |
/s/ THOMAS P. COOPER, M.D. Thomas P. Cooper, M.D. Director |
|
Dated: March 18, 2013 |
/s/ CYNTHIA L. FELDMANN Cynthia L. Feldmann Director |
|
Dated: March 18, 2013 |
/s/ ERIC GREEN Eric Green Director |
48
| |
|
|
|---|---|---|
| Dated: March 18, 2013 | /s/ STEPHEN HARE Stephen Hare Director |
|
Dated: March 18, 2013 |
/s/ ISAAC KAUFMAN Isaac Kaufman Director |
|
Dated: March 18, 2013 |
/s/ THOMAS F. KIRK Thomas F. Kirk Director |
|
Dated: March 18, 2013 |
/s/ PETER NEFF Peter Neff Director |
|
Dated: March 18, 2013 |
/s/ PATRICIA B. SHRADER Patricia B. Shrader Director |
49
Management's Annual Report on Internal Control Over Financial Reporting
The following sets forth Item 308(a) of the Securities and Exchange Commission's Regulation S-K, the annual report of management of Hanger, Inc. (the "Company") on the Company's internal control over financial reporting.
1. Management of the Company is responsible for establishing and maintaining adequate internal control over financial reporting for the Company. Rule 13a-15(f) of the Securities Exchange Act of 1934, as amended defined internal control over financial reporting as a process designed by, or under the supervision of, the Company's Chief Executive Officer and Chief Financial Officer, and effected by the Company's Board of Directors, management and other personnel, to provide reasonable assurance regarding the reliability of financial reporting and the preparation of financial statements for external purposes in accordance with generally accepted accounting principles and includes those policies and procedures that:
- •
- Pertain to the maintenance of records that in reasonable detail accurately and fairly reflect the transactions and
dispositions of the assets of the Company;
- •
- Provide reasonable assurance that transactions are recorded as necessary to permit preparation of financial statements in
accordance with generally accepted accounting principles, and that receipts and expenditures of the Company are being made only in accordance with authorizations of management and directors of the
Company; and
- •
- Provide reasonable assurance regarding prevention or timely detection of unauthorized acquisition, use or disposition of the Company's assets that could have a material effect on the financial statements.
2. Management of the Company, in accordance with Rule 13a-15(c) under the Securities Exchange Act of 1934 and with the participation of the Company's Chief Executive Officer and Chief Financial Officer, evaluated the effectiveness of the Company's internal control over financial reporting as of December 31, 2012. The framework on which management's evaluation of the Company's internal control over financial reporting is based on the "Internal Control—Integrated Framework" by the Committee of Sponsoring Organizations ("COSO") of the Treadway Commission. Based on the evaluation performed, we identified the material weakness described below in the Company's internal control over financial reporting as of December 31, 2012. A material weakness is a deficiency, or a combination of deficiencies, in internal control over financial reporting, such that there is a reasonable possibility that a material misstatement of the Company's annual or interim financial statements will not be prevented or detected on a timely basis.
3. We did not maintain effective controls over the valuation of work-in-process inventory. Specifically, the Company did not appropriately account for the effect of sales volume changes on the determination of the valuation of the Company's work-in-process inventory resulting in misstatements of inventory, material costs, personnel costs, other operating expenses and income taxes as of and for the periods ended December 31, 2011 and 2010 and the three months ended March 31, 2012 and 2011 and resulted in an audit adjustment for the year and three month period ended December 31, 2012. This control deficiency could result in further misstatement to the aforementioned account balances or disclosures that would result in material misstatement to the annual or interim consolidated financial statements that would not be prevented or detected. Accordingly, management has concluded that this control deficiency constitutes a material weakness. Because of this material weakness, our management, including our Chief Executive Officer and our Chief Financial Officer, concluded, that as of December 31, 2012, our internal control over financial reporting was not effective based on the criteria set forth above.
4. Because of its inherent limitations, internal control over financial reporting may not prevent or detect misstatements. Also, projections of any evaluation of effectiveness to future periods are subject to the risk that controls may become inadequate because of changes in conditions, or that the degree of compliance with the policies or procedures may deteriorate.
5. The effectiveness of our internal control over financial reporting as of December 31, 2012 has been audited by PricewaterhouseCoopers LLP, an independent registered public accounting firm, as stated in their report which appears herein.
F-1
Report of Independent Registered Public Accounting Firm
To the Board of Directors and Shareholders of Hanger, Inc.:
In our opinion, the consolidated statements listed in the index appearing under Item 15(a)(1), present fairly, in all material respects, the financial position of Hanger, Inc. and its subsidiaries at December 31, 2012 and 2011, and the results of their operations and their cash flows for each of the three years in the period ended December 31, 2012 in conformity with accounting principles generally accepted in the United States of America. In addition, in our opinion, the financial statement schedule listed in the index appearing under Item 15(a)(2), presents fairly, in all material respects, the information set forth therein when read in conjunction with the related consolidated financial statements. Also in our opinion, the Company did not maintain, in all material respects, effective internal control over financial reporting as of December 31, 2012, based on criteria established in Internal Control—Integrated Framework issued by the Committee of Sponsoring Organizations of the Treadway Commission (COSO) because a material weakness in internal control over financial reporting related to the valuation of work-in-process inventory existed as of that date. A material weakness is a deficiency, or a combination of deficiencies, in internal control over financial reporting, such that there is a reasonable possibility that a material misstatement of the annual or interim financial statements will not be prevented or detected on a timely basis. The material weakness referred to above is described in the accompanying Management's Annual Report on Internal Control Over Financial Reporting. We considered this material weakness in determining the nature, timing, and extent of audit tests applied in our audit of the 2012 consolidated financial statements, and our opinion regarding the effectiveness of the Company's internal control over financial reporting does not affect our opinion on those consolidated financial statements. The Company's management is responsible for these financial statements and Financial statement schedule, for maintaining effective internal control over financial reporting and for its assessment of the effectiveness of internal control over financial reporting included in management's report referred to above. Our responsibility is to express opinions on these financial statements, on the financial statement schedule, and on the Company's internal control over financial reporting based on our integrated audits. We conducted our audits in accordance with the standards of the Public Company Accounting Oversight Board (United States). Those standards require that we plan and perform the audits to obtain reasonable assurance about whether the financial statements are free of material misstatement and whether effective internal control over financial reporting was maintained in all material respects. Our audits of the financial statements included examining, on a test basis, evidence supporting the amounts and disclosures in the financial statements, assessing the accounting principles used and significant estimates made by management, and evaluating the overall financial statement presentation. Our audit of internal control over financial reporting included obtaining an understanding of internal control over financial reporting, assessing the risk that a material weakness exists, and testing and evaluating the design and operating effectiveness of internal control based on the assessed risk. Our audits also included performing such other procedures as we considered necessary in the circumstances. We believe that our audits provide a reasonable basis for our opinions.
A company's internal control over financial reporting is a process designed to provide reasonable assurance regarding the reliability of financial reporting and the preparation of financial statements for external purposes in accordance with generally accepted accounting principles. A company's internal control over financial reporting includes those policies and procedures that (i) pertain to the maintenance of records that, in reasonable detail, accurately and fairly reflect the transactions and dispositions of the assets of the company; (ii) provide reasonable assurance that transactions are recorded as necessary to permit preparation of financial statements in accordance with generally accepted accounting principles, and that receipts and expenditures of the company are being made only in accordance with authorizations of management and directors of the company; and (iii) provide reasonable assurance regarding prevention or timely detection of unauthorized acquisition, use, or disposition of the company's assets that could have a material effect on the financial statements.
F-2
Because of its inherent limitations, internal control over financial reporting may not prevent or detect misstatements. Also, projections of any evaluation of effectiveness to future periods are subject to the risk that controls may become inadequate because of changes in conditions, or that the degree of compliance with the policies or procedures may deteriorate.
/s/PricewaterhouseCoopers LLP
Austin, Texas
March 18, 2013
F-3
HANGER, INC.
CONSOLIDATED BALANCE SHEETS
(Dollars in thousands, except share and per share amounts)
| |
December 31, | ||||||
|---|---|---|---|---|---|---|---|
| |
2012 | 2011 | |||||
ASSETS |
|||||||
CURRENT ASSETS |
|||||||
Cash and cash equivalents |
$ | 19,211 | $ | 42,896 | |||
Restricted Cash |
3,120 | — | |||||
Accounts receivable, less allowance for doubtful accounts of $21,379 and $22,028 in 2012 and 2011, respectively |
165,668 | 138,826 | |||||
Inventories |
127,295 | 112,305 | |||||
Prepaid expenses, other current assets and income taxes receivable |
15,673 | 17,015 | |||||
Deferred income taxes |
27,685 | 20,648 | |||||
Total current assets |
358,652 | 331,690 | |||||
PROPERTY, PLANT AND EQUIPMENT |
|||||||
Land |
794 | 794 | |||||
Buildings |
8,896 | 4,400 | |||||
Furniture and fixtures |
19,582 | 17,281 | |||||
Machinery and equipment |
60,364 | 56,137 | |||||
Equipment leased to third parties under operating leases |
34,827 | 33,830 | |||||
Leasehold improvements |
74,615 | 65,245 | |||||
Computer and software |
98,186 | 81,775 | |||||
Total property, plant and equipment, gross |
297,264 | 259,462 | |||||
Less accumulated depreciation and amortization |
182,803 | 154,690 | |||||
Total property, plant and equipment, net |
114,461 | 104,772 | |||||
INTANGIBLE ASSETS |
|||||||
Goodwill |
674,774 | 609,484 | |||||
Patents and other intangible assets, less accumulated amortization of $20,643 and $15,160 in 2012 and 2011, respectively |
64,281 | 54,894 | |||||
Total intangible assets, net |
739,055 | 664,378 | |||||
OTHER ASSETS |
|||||||
Debt issuance costs, net |
14,033 | 17,485 | |||||
Other assets |
11,126 | 8,394 | |||||
Total other assets |
25,159 | 25,879 | |||||
TOTAL ASSETS |
$ | 1,237,327 | $ | 1,126,719 | |||
The accompanying notes are an integral part of the consolidated financial statements.
F-4
HANGER, INC.
CONSOLIDATED BALANCE SHEETS (Continued)
(Dollars in thousands, except share and per share amounts)
| |
December 31, | ||||||
|---|---|---|---|---|---|---|---|
| |
2012 | 2011 | |||||
LIABILITIES AND SHAREHOLDERS' EQUITY |
|||||||
CURRENT LIABILITIES |
|||||||
Current portion of long-term debt |
$ | 11,082 | $ | 8,065 | |||
Accounts payable |
28,923 | 26,561 | |||||
Accrued expenses |
22,357 | 17,547 | |||||
Accrued interest payable |
3,041 | 3,040 | |||||
Accrued compensation related costs |
41,784 | 35,829 | |||||
Total current liabilities |
107,187 | 91,042 | |||||
LONG-TERM LIABILITIES |
|||||||
Long-term debt, less current portion |
509,564 | 499,968 | |||||
Deferred income taxes |
77,730 | 74,309 | |||||
Other liabilities |
39,752 | 32,818 | |||||
Total liabilities |
734,233 | 698,137 | |||||
COMMITMENTS AND CONTINGENCIES (Note H) |
|||||||
SHAREHOLDERS' EQUITY |
|||||||
Common stock, $.01 par value; 60,000,000 shares authorized, 35,617,884 shares and 35,127,230 shares issued and outstanding in 2012 and 2011, respectively |
356 | 351 | |||||
Additional paid-in capital |
280,084 | 268,535 | |||||
Accumulated other comprehensive loss |
(1,919 | ) | (1,185 | ) | |||
Retained earnings |
225,229 | 161,537 | |||||
|
503,750 | 429,238 | |||||
Treasury stock at cost (141,154 shares) |
(656 | ) | (656 | ) | |||
Total shareholders' equity |
503,094 | 428,582 | |||||
TOTAL LIABILITIES AND SHAREHOLDERS' EQUITY |
$ | 1,237,327 | $ | 1,126,719 | |||
The accompanying notes are an integral part of the consolidated financial statements.
F-5
HANGER, INC.
CONSOLIDATED STATEMENTS OF INCOME
AND COMPREHENSIVE INCOME
For the Years Ended December 31,
(Dollars in thousands, except share and per share amounts)
| |
2012 | 2011 | 2010 | |||||||
|---|---|---|---|---|---|---|---|---|---|---|
Net sales |
$ | 985,550 | $ | 918,539 | $ | 817,379 | ||||
Material costs |
296,193 | 270,210 | 248,667 | |||||||
Personnel costs |
335,328 | 321,529 | 282,417 | |||||||
Other operating expenses |
188,868 | 177,910 | 165,158 | |||||||
Relocation expenses |
— | 1,185 | 16,444 | |||||||
Acquisition expenses |
1,171 | 781 | 5,414 | |||||||
Depreciation and amortization |
34,652 | 30,969 | 18,809 | |||||||
Income from operations |
129,338 | 115,955 | 80,470 | |||||||
Interest expense, net |
31,169 |
31,821 |
30,340 |
|||||||
Extinguishment of debt |
— | — | 13,985 | |||||||
Loss from interest rate swap |
— | — | 1,610 | |||||||
Income before taxes |
98,169 | 84,134 | 34,535 | |||||||
Provision for income taxes |
34,477 |
29,657 |
13,639 |
|||||||
Net income |
$ | 63,692 | $ | 54,477 | $ | 20,896 | ||||
Other comprehensive income (loss): |
||||||||||
Unrealized gain on interest rate swaps, net of taxes of $1,912 |
$ | — | $ | — | $ | 2,868 | ||||
Reclassification of net losses on auction rate securities from OCI to net income, net of taxes of $125 |
— | — | 188 | |||||||
Unrealized loss on Retirement Plan, net of taxes of $440, $546 and $177 for 2012, 2011 and 2010, respectively |
(734 | ) | (906 | ) | (279 | ) | ||||
Total other comprehensive income (loss) |
(734 | ) | (906 | ) | 2,777 | |||||
Comprehensive income |
$ | 62,958 | $ | 53,571 | $ | 23,673 | ||||
Basic Per Common Share Data |
||||||||||
Net income |
$ | 1.86 | $ | 1.62 | $ | 0.65 | ||||
Shares used to compute basic per common share amounts |
34,282,591 | 33,544,813 | 32,238,401 | |||||||
Diluted Per Common Share Data |
||||||||||
Net income |
$ | 1.83 | $ | 1.59 | $ | 0.64 | ||||
Shares used to compute diluted per common share amounts |
34,832,830 | 34,220,256 | 32,888,305 | |||||||
The accompanying notes are an integral part of the consolidated financial statements.
F-6
HANGER, INC.
CONSOLIDATED STATEMENTS OF CHANGES IN SHAREHOLDERS' EQUITY
For the Three Years Ended December 31, 2012
(Dollars
in thousands, except share and per share amounts)
| |
Common Shares |
Common Stock |
Additional Paid in Capital |
Accumulated Other Comprehensive Loss |
Retained Earnings |
Treasury Stock |
Total | |||||||||||||||
|---|---|---|---|---|---|---|---|---|---|---|---|---|---|---|---|---|---|---|---|---|---|---|
Balance, December 31, 2009 |
32,992 | $ | 330 | $ | 233,111 | $ | (3,056 | ) | $ | 86,164 | $ | (656 | ) | $ | 315,893 | |||||||
Net income |
— | — | — | — | 20,896 | — | 20,896 | |||||||||||||||
Other comprehensive income |
— | — | — | 2,777 | — | — | 2,777 | |||||||||||||||
Issuance of Common Stock in connection with the exercise of stock options |
374 | 4 | 5,023 | — | — | — | 5,027 | |||||||||||||||
Proceeds from sale of stock |
488 | 5 | 7,351 | — | — | — | 7,356 | |||||||||||||||
Forfeiture of restricted stock units |
(33 | ) | — | — | — | — | — | — | ||||||||||||||
Issuance of restricted stock units |
531 | 5 | (5 | ) | — | — | — | — | ||||||||||||||
Stock-based compensation expense |
— | — | 9,597 | — | — | — | 9,597 | |||||||||||||||
Tax benefit associated with vesting of restricted stock units |
— | — | 2,342 | — | — | — | 2,342 | |||||||||||||||
Balance, December 31, 2010 |
34,352 | 344 | 257,419 | (279 | ) | 107,060 | (656 | ) | 363,888 | |||||||||||||
Net income |
— | — | — | — | 54,477 | — | 54,477 | |||||||||||||||
Other comprehensive loss |
— | — | — | (906 | ) | — | — | (906 | ) | |||||||||||||
Issuance of Common Stock in connection with the exercise of stock options |
417 | 4 | 2,676 | — | — | — | 2,680 | |||||||||||||||
Forfeiture of restricted stock units |
(63 | ) | (1 | ) | 1 | — | — | — | — | |||||||||||||
Issuance of restricted stock units |
548 | 5 | (5 | ) | — | — | — | — | ||||||||||||||
Purchase and retirement of common stock |
(127 | ) | (1 | ) | (2,106 | ) | — | — | — | (2,107 | ) | |||||||||||
Stock-based compensation expense |
— | — | 8,088 | — | — | — | 8,088 | |||||||||||||||
Tax benefit associated with vesting of restricted stock units |
— | — | 2,462 | — | — | — | 2,462 | |||||||||||||||
Balance, December 31, 2011 |
35,127 | 351 | 268,535 | (1,185 | ) | 161,537 | (656 | ) | 428,582 | |||||||||||||
Net income |
— | — | — | — | 63,692 | — | 63,692 | |||||||||||||||
Other comprehensive loss |
— | — | — | (734 | ) | — | — | (734 | ) | |||||||||||||
Issuance of Common Stock in connection with the exercise of stock options |
239 | 3 | 3,557 | — | — | — | 3,560 | |||||||||||||||
Forfeiture of restricted stock units |
(231 | ) | (2 | ) | 2 | — | — | — | — | |||||||||||||
Issuance of restricted stock units |
532 | 5 | (5 | ) | — | — | — | — | ||||||||||||||
Purchase and retirement of common stock |
(49 | ) | (1 | ) | (1,349 | ) | — | — | — | (1,350 | ) | |||||||||||
Stock-based compensation expense |
— | — | 8,061 | — | — | — | 8,061 | |||||||||||||||
Tax benefit associated with vesting of restricted stock units |
— | — | 1,283 | — | — | — | 1,283 | |||||||||||||||
Balance, December 31, 2012 |
35,618 | $ | 356 | $ | 280,084 | $ | (1,919 | ) | $ | 225,229 | $ | (656 | ) | $ | 503,094 | |||||||
The accompanying notes are an integral part of the consolidated financial statements.
F-7
HANGER, INC.
CONSOLIDATED STATEMENTS OF CASH FLOWS
For the Years Ended December 31,
(Dollars in thousands)
| |
2012 | 2011 | 2010 | |||||||
|---|---|---|---|---|---|---|---|---|---|---|
Cash flows from operating activities: |
||||||||||
Net income |
$ | 63,692 | $ | 54,477 | $ | 20,896 | ||||
Adjustments to reconcile net income to net cash provided by operating activities: |
||||||||||
Extinguishment of debt |
— | — | 13,985 | |||||||
Loss (gain) on interest rate swap and disposal of auction rate securities |
— | — | 1,798 | |||||||
Loss on disposals of assets |
64 | 7 | 828 | |||||||
Reduction of seller notes and earnouts |
(993 | ) | (541 | ) | — | |||||
Provision for doubtful accounts |
19,773 | 24,837 | 20,276 | |||||||
Provision (benefit) for deferred income taxes |
(4,303 | ) | 8,439 | 752 | ||||||
Depreciation and amortization |
34,652 | 30,969 | 18,809 | |||||||
Amortization of debt issuance costs |
3,452 | 3,334 | 1,893 | |||||||
Compensation expense on stock options and restricted stock |
8,061 | 8,088 | 9,596 | |||||||
Changes in operating assets and liabilities, net of effects of acquired companies: |
||||||||||
Accounts receivable |
(40,443 | ) | (42,024 | ) | (31,041 | ) | ||||
Inventories |
(12,827 | ) | (14,072 | ) | (4,522 | ) | ||||
Prepaid expenses, other current assets, and income taxes |
3,867 | 796 | (9,590 | ) | ||||||
Accounts payable |
(2,114 | ) | (5,902 | ) | (190 | ) | ||||
Accrued expenses, accrued interest payable |
3,501 | (1,424 | ) | 5,299 | ||||||
Accrued compensation related costs |
4,348 | (7,404 | ) | 5,599 | ||||||
Other |
589 | 2,224 | (188 | ) | ||||||
Net cash provided by operating activities |
81,319 | 61,804 | 54,200 | |||||||
Cash flows from investing activities: |
||||||||||
Purchase of property, plant and equipment (net of acquisitions) |
(29,492 | ) | (25,300 | ) | (30,593 | ) | ||||
Purchase of equipment leased to third parties under operating leases |
(3,671 | ) | (3,374 | ) | — | |||||
Acquisitions and contingent considerations (net of cash acquired) |
(62,500 | ) | (14,842 | ) | (162,250 | ) | ||||
Restricted cash |
(3,120 | ) | — | — | ||||||
Proceeds from sale of marketable securities |
— | — | 6,495 | |||||||
Purchase of company-owned life insurance investment |
(2,000 | ) | (4,000 | ) | — | |||||
Proceeds from sale of property, plant and equipment |
1,732 | 646 | 373 | |||||||
Net cash used in investing activities |
(99,051 | ) | (46,870 | ) | (185,975 | ) | ||||
Cash flows from financing activities: |
||||||||||
Borrowings under revolving credit agreement |
— | 10,000 | — | |||||||
Repayments under revolving credit agreement |
— | (10,000 | ) | — | ||||||
Repayment of term loan |
(3,700 | ) | (3,000 | ) | (221,956 | ) | ||||
Scheduled repayment of seller's notes |
(5,255 | ) | (4,151 | ) | (3,810 | ) | ||||
Repayment of capital lease obligations |
(713 | ) | — | — | ||||||
Repayment of senior notes due 2014 |
— | — | (184,831 | ) | ||||||
Proceeds on senior notes due 2018 |
— | — | 200,000 | |||||||
Proceeds on term loan |
— | — | 300,000 | |||||||
Deferred financing costs |
— | (4,230 | ) | (16,976 | ) | |||||
Repayment of line of credit |
— | — | (3,628 | ) | ||||||
Excess tax benefit from stock-based compensation |
1,505 | 2,462 | 2,342 | |||||||
Proceeds from issuance of common stock |
3,560 | 2,680 | 12,384 | |||||||
Purchase and retirement of common stock |
(1,350 | ) | (2,107 | ) | — | |||||
Net cash (used in) provided by financing activities |
(5,953 | ) | (8,346 | ) | 83,525 | |||||
Increase (decrease) in cash and cash equivalents |
(23,685 |
) |
6,588 |
(48,250 |
) |
|||||
Cash and cash equivalents, at beginning of year |
42,896 | 36,308 | 84,558 | |||||||
Cash and cash equivalents, at end of year |
$ | 19,211 | $ | 42,896 | $ | 36,308 | ||||
F-8
HANGER, INC.
NOTES TO CONSOLIDATED FINANCIAL STATEMENTS
NOTE A—THE COMPANY
The goal of Hanger, Inc. (the "Company") is to be the world's premier provider of services and products that enhance human physical capabilities. The Company provides orthotic and prosthetic ("O&P") patient care services, distributes O&P devices and components, manages O&P networks, and provides therapeutic solutions to the broader post-acute market. Through its subsidiary, Hanger Prosthetics and Orthotics, Inc., which the Company refers to as "Hanger Clinic," the Company is the largest owner and operator of orthotic and prosthetic patient care clinics in the United States and, through its distribution subsidiary, Southern Prosthetic Supply ("SPS"), one of the largest distributors of O&P products in the United States. The Company operates in excess of 740 O&P patient care clinics located in 45 states and the District of Columbia and six strategically located distribution facilities. In addition to providing O&P services and products the Company, through its subsidiary, Linkia LLC ("Linkia"), manages an O&P provider network and develops programs to manage all aspects of O&P patient care for insurance companies. The Company provides therapeutic solutions through its subsidiaries Innovative Neurotronics and Accelerated Care Plus Corp. Innovative Neurotronics ("IN, Inc.") introduces emerging neuromuscular technologies developed through independent research in a collaborative effort with industry suppliers worldwide. Accelerated Care Plus Corp. ("ACP") is a developer of specialized rehabilitation technologies and a leading provider of evidence-based clinical programs for post-acute rehabilitation serving more than 4,550 long-term care facilities and other sub-acute rehabilitation providers throughout the U.S.
NOTE B—SIGNIFICANT ACCOUNTING POLICIES
Principles of Consolidation
The consolidated financial statements include the accounts of the Company and its wholly-owned subsidiaries. All intercompany transactions and balances have been eliminated in the accompanying financial statements.
Revision of Previously Reported Consolidated Financial Information
During the fourth quarter of 2012, the Company identified adjustments necessary to correct prior periods for the overstatement of the value of work-in-process inventory at December 31, 2011 and 2010. The Company assessed the materiality of the errors on previously reported periods and concluded the impact was not material to any prior annual consolidated financial statements. Management, however, deemed the impact of this error on the consolidated financial statements for the three months ended March 31, 2012 and 2011 to be material and will restate the first quarter 2012 and 2011 financial results. These errors had no impact on operating cash flows for any of the periods. During 2012, 2011 and 2010, the only interim periods impacted by this error were the first and fourth quarters. Accordingly, the years ended December 31, 2011 and 2010 have been revised. The impact of the error on the Consolidated Balance Sheets and Statements of Income and Comprehensive Income for the
F-9
HANGER, INC.
NOTES TO CONSOLIDATED FINANCIAL STATEMENTS (Continued)
NOTE B—SIGNIFICANT ACCOUNTING POLICIES (Continued)
years ended December 31, 2011 and 2010 is shown in the table below (in 000's). The impact of the errors are included in the results of the Patient Care segment in Note O.
| |
2011 | 2010 | |||||||||||
|---|---|---|---|---|---|---|---|---|---|---|---|---|---|
| (Dollars in thousands, except share and per share amounts) |
As Previously Reported |
As Revised |
As Previously Reported |
As Revised |
|||||||||
Inventory |
$ | 114,086 | $ | 112,305 | $ | 98,290 | $ | 97,381 | |||||
Accrued expenses (taxes) |
18,247 | 17,547 | 20,796 | 20,426 | |||||||||
Material costs |
$ | 267,677 | $ | 270,210 | $ | 247,565 | $ | 248,667 | |||||
Personnel Costs |
$ | 322,765 | $ | 321,529 | $ | 284,095 | $ | 282,417 | |||||
Other Operating expenses |
$ | 178,335 | $ | 177,910 | $ | 163,673 | $ | 165,158 | |||||
Income from operations |
$ | 116,827 | $ | 115,955 | $ | 81,379 | $ | 80,470 | |||||
Income before taxes |
$ | 85,006 | $ | 84,134 | $ | 35,444 | $ | 34,535 | |||||
Provision for income taxes |
$ | 29,987 | $ | 29,657 | $ | 14,009 | $ | 13,639 | |||||
Net income |
$ | 55,019 | $ | 54,477 | $ | 21,435 | $ | 20,896 | |||||
Basic Per Common Share Net Income |
$ | 1.64 | $ | 1.62 | $ | 0.66 | $ | 0.65 | |||||
Diluted Per Common Share Net Income |
$ | 1.61 | $ | 1.59 | $ | 0.65 | $ | 0.64 | |||||
F-10
HANGER, INC.
NOTES TO CONSOLIDATED FINANCIAL STATEMENTS (Continued)
NOTE B—SIGNIFICANT ACCOUNTING POLICIES (Continued)
Use of Estimates
The preparation of financial statements in conformity with accounting principles generally accepted in the United States of America ("GAAP") requires management to make estimates and assumptions that affect the reported amounts of assets and liabilities, disclosure of contingent assets and liabilities at the date of the financial statements, and the reported amounts of revenues and expenses during the reporting period. Actual results could differ from those estimates.
Cash and Cash Equivalents
The Company considers all highly liquid investments with original maturities of three months or less at the date of purchase to be cash equivalents. At various times throughout the year, the Company maintains cash balances in excess of Federal Deposit Insurance Corporation limits.
Restricted Cash
Restricted cash has statutory or contractual restrictions that prevent it from being used in the Company's operations. The Company agreed to restrict $3.1 million of cash to eliminate letters of credit obligations used as collateral under the revolving credit facility.
Credit Risk
The Company primarily provides O&P devices and services and products throughout the United States of America and is reimbursed by the patients' third-party insurers, governmentally funded health insurance programs, and in the case of its Distribution segment from independent O&P providers. The Company also provides advanced rehabilitation technology and clinical programs to skilled nursing facilities in the United States primarily through operating leases. The Company performs ongoing credit evaluations of its customers. Accounts receivable are not collateralized. The ability of the Company's debtors to meet their obligations is dependent upon their financial stability which could be affected by future legislation and regulatory actions. Additionally, the Company maintains reserves for potential losses from these receivables that historically have been within management's expectations.
Inventories
Inventories in the Patient Care segment consisting principally of raw materials and work-in-process, which amounted to $96.6 million and $81.0 million as of December 31, 2012 and 2011, respectively, are valued based on the gross profit method which approximates lower of cost or market using the first-in first-out method. The Company applies the gross profit method on a patient care clinic basis in this segment's inventory to determine ending inventory at the end of each interim period except on October 31st, which is the date of our Physical inventory. The annual physical inventory for this segment values the inventory at lower of cost or market using the first-in first-out method and includes work-in-process consisting of materials, labor and overhead which is valued based on established standards for the stage of completion of each custom order. Adjustments to reconcile the physical inventory to our books are treated as changes in accounting estimates and are recorded in the fourth quarter. The Company recorded fourth quarter adjustments of a decrease of $0.5 million, an increase of $2.3 million and a decrease of $1.0 million to inventory as of October 31, 2012, 2011 and 2010, respectively. The October 31st inventory is subsequently adjusted during interim periods to apply the gross profit method described above.
F-11
HANGER, INC.
NOTES TO CONSOLIDATED FINANCIAL STATEMENTS (Continued)
NOTE B—SIGNIFICANT ACCOUNTING POLICIES (Continued)
Inventories in the Distribution and Therapeutic Solutions segments consist principally of finished goods which are stated at the lower of cost or market using the first-in, first-out method for all reporting periods and are valued based on perpetual records.
Fair Value Measurements
The Company follows the authoritative guidance for financial assets and liabilities, which establishes a framework for measuring fair value and requires enhanced disclosures about fair value measurements. The authoritative guidance requires disclosure about how fair value is determined for assets and liabilities and establishes a hierarchy by which these assets and liabilities must be categorized, based on significant levels of inputs as follows:
| Level 1 | unadjusted quoted prices for identical assets or liabilities in active markets accessible by the Company | |
Level 2 |
inputs that are observable in the marketplace other than those inputs classified as Level 1 |
|
Level 3 |
inputs that are unobservable in the marketplace and significant to the valuation |
The determination of where assets and liabilities fall within this hierarchy is based upon the lowest level of input that is significant to the fair value measurement.
Financial Instruments
Assets and liabilities measured at fair value on a recurring basis as of December 31, 2012 and 2011, are $11.0 million and $0, respectively, and are comprised of cash equivalent money market investments. The money market investments are based on Level 1 observable market prices and are equivalent to one dollar.
The carrying value of the Company's short-term financial instruments, such as receivables and payables, approximate their fair values based on the short-term maturities of these instruments. The carrying value of the Company's Term Loan as of December 31 2012 and 2011, $293.3 million and $297.0, respectively, approximates fair value for debt with similar terms and remaining maturities based on rates currently available to the Company and are considered Level 2 measurements. The fair value of the Senior Notes is based on a Level 1 quoted market price, and was $211.5 million and $203.0 million as of December 31, 2012 and 2011, respectively, compared to the carrying value of $200.0 million and $200.0 million as of those dates. Seller Notes recorded as a part of 2012 acquisitions, $21.9 million, were recorded at contractual carrying values, which are not based on observable rates and therefore represent Level 3 measurements. The Company believes the carrying value of the Seller Notes approximate fair value for similar debt in all material respects.
Contingent consideration recorded as a part of 2012 acquisitions was $2.7 million. Contingent consideration is recorded at fair value as of the date of the acquisition using Level 3 measurements.
Investments
Prior to December 2010, the Company's investments consisted of two auction rate securities ("ARS") totaling $7.5 million of par value; $5.0 million was collateralized by Indiana Secondary Market Municipal Bond—1998 ("Indiana ARS"), and $2.5 million was collateralized by Primus Financial
F-12
HANGER, INC.
NOTES TO CONSOLIDATED FINANCIAL STATEMENTS (Continued)
NOTE B—SIGNIFICANT ACCOUNTING POLICIES (Continued)
Products Subordinated Deferrable Interest Notes ("Primus ARS"). ARS are securities that are structured with short-term interest rate reset dates which generally occur every 28 days and are linked to LIBOR. At the reset date, investors can attempt to sell via auction or continue to hold the securities at par. These securities were accounted for in accordance with authoritative guidance for investments in debt and equity securities and were reported at fair value with unrealized gains and losses included in earnings.
In May 2010, the Company sold its investment in the Primus ARS for $1.5 million. On July 1, 2010, the Company exercised its right to put the Indiana ARS back to UBS at par value of $5.0 million, resulting in a realized loss of $0.2 million. The $5.0 million proceeds were received on July 1, 2010. As part of the settlement, the Company closed out a $3.6 million line of credit with UBS that the Company obtained as part of the buyback agreement originally executed in November 2008, with net cash proceeds of approximately $1.4 million.
Interest Rate Swaps
Prior to December 2010, the Company utilized interest rate swaps to manage our exposure to interest rate risk associated with our variable rate borrowings. On December 1, 2010, the Company was required to terminate the interest rate swaps due to refinancing of the credit facilities. The Company incurred a loss of $1.6 million, which is recorded in loss/(gain) from interest rate swap on the Consolidated Statements of Income and Comprehensive Income.
Revenue Recognition
Revenues in the Company's patient care clinics are derived from the sale of O&P devices and the maintenance and repair of existing devices and are recorded net of known contractual adjustments and discounts. The sale of O&P devices includes the design, fabrication, assembly, fitting and delivery of a wide range of braces, limbs and other devices. Revenues from the sale of these devices are recorded when (i) acceptance by and delivery to the patient has occurred; (ii) persuasive evidence of an arrangement exists and there are no further obligations to the patient; (iii) the sales price is fixed or determinable; and (iv) collectability is reasonably assured. Revenues from maintenance and repairs are recognized when the service is provided. Revenues on the sale of O&P devices to customers by the Distribution segment are recorded upon the shipment of products, in accordance with the terms of the invoice, net of merchandise returns. Discounted sales are recorded at net realizable value. Revenues in the Therapeutic Solutions segment are primarily derived from leasing rehabilitation technology combined with clinical therapy programs and education and training. The revenue is recorded on a monthly basis according to terms of the contracts with our customers.
Certain accounts receivable may be uncollectible, even if properly pre-authorized and billed. Regardless of the balance, accounts receivable amounts are periodically evaluated to assess collectability. In addition to the actual bad debt expense recognized during collection activities, the Company estimates the amount of potential bad debt expense that may occur in the future. This estimate is based upon historical experience as well as a review of the receivable balances.
On a quarterly basis, the Company evaluates cash collections, accounts receivable balances and write-off activity to assess the adequacy of the allowance for doubtful accounts. Additionally, a company-wide evaluation of collectability of receivable balances older than 180 days is performed at least semi-annually, the results of which are used in the next allowance analysis. In these detailed reviews, the account's net realizable value is estimated after considering the customer's payment history,
F-13
HANGER, INC.
NOTES TO CONSOLIDATED FINANCIAL STATEMENTS (Continued)
NOTE B—SIGNIFICANT ACCOUNTING POLICIES (Continued)
past efforts to collect on the balance and the outstanding balance, and a specific reserve is recorded if needed. From time to time, the Company may outsource the collection of such accounts to outsourced agencies after internal collection efforts are exhausted. In the cases when valid accounts receivable cannot be collected, the uncollectible account is written off to bad debt expense.
Property, Plant and Equipment
Property, plant and equipment are recorded at cost less accumulated depreciation and amortization, with the exception of assets acquired through acquisitions, which are initially recorded at fair value. Equipment acquired under capital leases is recorded at the lower of fair market value or the present value of the future minimum lease payments. The cost and related accumulated depreciation of assets sold, retired or otherwise disposed of are removed from the respective accounts, and any resulting gains or losses are included in the Consolidated Statements of Income and Comprehensive Income. Depreciation is computed for financial reporting purposes using the straight-line method over the estimated useful lives of the related assets as follows:
Asset class
|
Estimated life (in years) |
|
|---|---|---|
Furniture and fixtures |
5 | |
Machinery and equipment |
5 | |
Computers and software |
5 | |
Buildings |
10 - 40 | |
Assets under capital leases |
Shorter of 10 or lease term | |
Leasehold improvements |
Shorter of 10 or lease term | |
Equipment leased to third parties under operating leases |
Up to 10 |
The following table outlines the investment in equipment leased to third parties under operating leases:
| (In thousands) |
|
|||
|---|---|---|---|---|
Program equipment |
$ | 34,827 | ||
Less: Accumulated depreciation |
(10,315 | ) | ||
Net book value at December 31, 2012 |
$ | 24,512 | ||
Depreciation expense related to property, plant and equipment was approximately $29.2 million, $26.2 million, and $17.3 million for the years ended December 31, 2012, 2011, and 2010, respectively.
Repairs and Maintenance
Repair and maintenance costs are expensed as incurred. During the years ended December 31, 2012, 2011, and 2010, the Company incurred $1.5 million, $1.6 million, and $1.5 million, respectively, in repair and maintenance costs.
Goodwill and Other Intangible Assets
The authoritative guidance for Accounting for Goodwill and Other Intangible Assets requires that purchased goodwill and indefinite-lived intangibles not be amortized, but instead be tested for impairment at least annually or wherever facts or circumstances indicate potential impairment (the Company has selected October 1st as its annual test date). The Company has the option to first assess
F-14
HANGER, INC.
NOTES TO CONSOLIDATED FINANCIAL STATEMENTS (Continued)
NOTE B—SIGNIFICANT ACCOUNTING POLICIES (Continued)
qualitative factors to determine whether it is more likely than not that the fair value of a reporting unit is less than its carrying amount as a basis for determining whether it is necessary to perform the two-step impairment test for goodwill and indefinite lived intangible assets. If the Company determines that a two-step impairment test is necessary or more efficient than a qualitative approach, it measures the fair value of the Company's reporting units using any one of, or a combination of, income, market and cost approaches. The Company evaluated its intangible assets, other than goodwill and the ACP trade name, and determined that all such assets have determinable lives.
Non-compete agreements are recorded based on agreements entered into by the Company and are amortized, using the straight-line method, over their estimated term ranging from five to seven years. Other definite-lived intangible assets are recorded at cost and are amortized, using the straight-line method, over their estimated useful lives of up to 20 years. The Company periodically evaluates the recoverability of intangible assets and takes into account events or circumstances that may warrant revised estimates of useful lives or that indicate that impairment had occurred. Refer to Note D for further discussion.
Debt Issuance Costs
Debt issuance costs incurred in connection with the Company's long-term debt are amortized, on a straight-line basis, which is not materially different from the effective interest method, through the maturity of the related debt instrument. Amortization of these costs is included in Interest Expense in the Consolidated Statements of Income and Comprehensive Income.
Long-Lived Asset Impairment
The Company evaluates the carrying value of long-lived assets to be held and used whenever events or changes in circumstance indicate that the carrying amount may not be recoverable. The carrying value of a long-lived asset group is not recoverable and is considered impaired if it exceeds the sum of the undiscounted cash flows expected to result from the use and eventual disposition of the asset. The Company measures impairment as the amount by which the carrying value exceeds the fair market value. Fair market value is determined primarily using the projected future cash flows discounted at a rate commensurate with the risk involved. Losses on long-lived assets to be disposed of are determined in a similar manner, except that fair market values are reduced for the cost to dispose. There were no long-lived asset impairments or indicators of impairment for the years ended December 31, 2012 or 2011.
Supplemental Executive Retirement Plan
Expense and liability balances associated with the Company's Supplemental Executive Retirement Plan are calculated based on certain assumptions including benefits earned, discount rates, interest costs, mortality rates and other factors. Refer to Note K for further discussion.
Marketing
Marketing costs, including advertising, are expensed as incurred. The Company incurred $4.2 million, $3.9 million, and $4.3 million in marketing costs during the years ended December 31, 2012, 2011, and 2010, respectively.
F-15
HANGER, INC.
NOTES TO CONSOLIDATED FINANCIAL STATEMENTS (Continued)
NOTE B—SIGNIFICANT ACCOUNTING POLICIES (Continued)
Income Taxes
The Company recognizes deferred income tax liabilities and assets for the expected future tax consequences of events that have been included in the financial statements or tax returns. Deferred income tax liabilities and assets are determined based on the difference between the financial statement and the tax basis of assets and liabilities using enacted tax rates in effect for the year in which the differences are expected to reverse. The Company recognizes a valuation allowance on the deferred tax assets if it is more likely than not that the assets will not be realized in future years. Significant accounting judgment is required in determining the provision for income taxes and related accruals, deferred tax assets and liabilities. The Company believes that its tax positions are consistent with applicable tax law, but certain positions may be challenged by taxing authorities. In the ordinary course of business, there are transactions and calculations where the ultimate tax outcome is uncertain. In addition, the Company is subject to periodic audits and examinations by the Internal Revenue Service and other state and local taxing authorities. Although the Company believes that its estimates are reasonable, actual results could differ from these estimates.
Stock-Based Compensation
The Company issues restricted stock units of common stock under one active stock-based compensation plan. At December 31, 2012, 1.5 million shares of common stock were available for issuance under the Company's stock-based compensation plan. Shares of common stock issued under the stock-based compensation plan are issued from the Company's authorized and unissued shares. Restricted stock units are granted at the fair market value of the Company's common stock on the grant date. Restricted stock units vest over a period of time determined by the compensation plan, ranging from one to four years.
The Company applies the fair value recognition provisions of the authoritative guidance for stock compensation, which require companies to measure and recognize compensation expense for all stock-based payments at fair value.
Stock compensation expense relates to restricted stock units, as all stock options are fully vested and all associated compensation expense has been recognized in prior years. The total value of the restricted stock units is expensed ratably over the requisite service period of the employees receiving the awards.
Segment Information
The Company applies a "management" approach to disclosure of segment information. The management approach designates the internal organization that is used by management for making operating decisions and assessing performance as the basis of the Company's reportable segments. The description of the Company's reportable segments and the disclosure of segment information are presented in Note O.
Recently Adopted Accounting Guidance
In May 2011, the FASB issued Accounting Standards Update ("ASU") 2011-04, "Amendments to Achieve Common Fair Value Measurement and Disclosure Requirements in U.S. GAAP and IFRSs," which amends ASC 820, "Fair Value Measurement." The amended guidance changes the wording used to describe many requirements in U.S. GAAP for measuring fair value and for disclosing information about fair value measurements. Additionally, the amendments clarify the FASB's intent about the
F-16
HANGER, INC.
NOTES TO CONSOLIDATED FINANCIAL STATEMENTS (Continued)
NOTE B—SIGNIFICANT ACCOUNTING POLICIES (Continued)
application of existing fair value measurement requirements. The guidance provided in ASU No. 2011-04 was effective for interim and annual periods beginning after December 15, 2011 and is applied prospectively. The Company adopted the amendments of this ASU effective January 1, 2012, and the initial adoption of the amendments in this ASU did not have a material impact on the Company's consolidated financial statements.
In June 2011, the FASB issued ASU No. 2011-05, "Comprehensive Income (Topic 220)," which changes the presentation of comprehensive income. The amended guidance gives companies the option to present the total of comprehensive income, the components of net income and the components of other comprehensive income either in a single continuous statement of comprehensive income or in two separate but consecutive statements. The guidance provided in ASU No. 2011-05 is effective for interim and annual periods beginning after December 15, 2011 and is applied prospectively. The Company adopted the amendments of this ASU effective January 1, 2012, and the initial adoption of the amendments in this ASU did not have a material impact on the Company's consolidated financial statements.
In July 2011, the FASB issued ASU No. 2011-07 "Presentation and Disclosures of Patient Service Revenue, Provision for Bad Debts and the Allowance for Doubtful Accounts for Certain Health Care Entities." The objective of this update is to provide financial statement users with greater transparency about a health care entity's net patient service revenue and the related allowance for doubtful accounts. This update provides information to assist financial statement users in assessing an entity's sources of net patient service revenue and related changes in its allowance for doubtful accounts. The amendments require health care entities that recognize significant amounts of patient service revenue at the time the services are rendered even though they do not assess the patient's ability to pay to present the provision for bad debts related to patient service revenue as a deduction from patient service revenue (net of contractual allowances and discounts) on their statement of operations. The amendments in this update require certain health care entities to change the presentation of their statement of operations by reclassifying the provision for bad debts associated with patient service revenue from an operating expense to a deduction from patient service revenue (net of contractual allowances and discounts). Additionally, those health care entities are required to provide enhanced disclosure about their policies for recognizing revenue and assessing bad debts. The amendments also require disclosures of patient service revenue (net of contractual allowances and discounts) as well as qualitative and quantitative information about changes in the allowance for doubtful accounts. The guidance provided in ASU No. 2011-07 is effective for interim and annual periods beginning after December 15, 2011 and is applied prospectively. The provisions are effective for the Company's year ended December 31, 2012. The Company has determined that ASU No. 2011-07 has no impact on its consolidated financial statements.
In September 2011, FASB issued ASU 2011-08, "Intangibles—Goodwill and Other (Topic 350): Testing Goodwill for Impairment," which provides entities the option to perform a qualitative assessment in order to determine whether additional quantitative impairment testing is necessary. This amendment was effective for reporting periods beginning after December 15, 2011. This amendment does not impact the quantitative testing methodology. The Company adopted this standard on January 1, 2012 and the initial adoption of the amendment in this ASU did not have a material impact on the Company's consolidated financial statements.
F-17
HANGER, INC.
NOTES TO CONSOLIDATED FINANCIAL STATEMENTS (Continued)
NOTE C—SUPPLEMENTAL CASH FLOW FINANCIAL INFORMATION
The supplemental disclosure requirements for the statements of cash flows are as follows:
| (In thousands) |
2012 | 2011 | 2010 | |||||||
|---|---|---|---|---|---|---|---|---|---|---|
Cash paid during the period for: |
||||||||||
Interest |
$ | 27,362 | $ | 27,799 | $ | 27,758 | ||||
Income taxes |
34,468 | 17,152 | 14,120 | |||||||
Non-cash financing and investing activities: |
||||||||||
Purchase of property, plant, and equipment in accounts payable |
$ | 1,525 | $ | 810 | $ | 2,660 | ||||
Unrealized loss on SERP (net of tax) |
734 | 906 | 278 | |||||||
Capital lease obligations |
4,615 | 23 | 157 | |||||||
Unrealized gain (loss) on interest rate swaps |
— | — | 1,514 | |||||||
Earnouts payable on acquisitions |
2,672 | 4,098 | 2,182 | |||||||
Issuance of notes in connection with acquisitions |
21,895 | 6,700 | 2,950 | |||||||
Issuance of restricted stock units of common stock |
5,996 | 12,754 | 9,325 | |||||||
NOTE D—GOODWILL AND OTHER INTANGIBLE ASSETS
The Company completes its annual goodwill and indefinite lived intangible impairment analysis in the fourth quarter of each year. The Company determined that it has three reporting units to be evaluated, which are the same as its reportable segments: (i) Patient Care; (ii) Distribution; and (iii) Therapeutic Solutions. The Company completed its annual goodwill and indefinite lived intangible asset impairment in October 2012 and 2011 using a two-step approach, which did not result in an impairment as the fair value of the reporting units is substantially in excess of the carrying value of the underlying assets. The fair value of the Company's reporting units was primarily determined based on the income approach and considered the market and cost approach.
The activity related to goodwill for the two years ended December 31, 2012 and 2011 is as follows:
| (In thousands) |
Patient Care |
Distribution | Therapeutic Solutions |
Total | |||||||||
|---|---|---|---|---|---|---|---|---|---|---|---|---|---|
Balance at December 31, 2010 |
$ | 456,232 | $ | 38,388 | $ | 96,079 | $ | 590,699 | |||||
Additions due to acquisitions |
17,192 | — | 851 | 18,043 | |||||||||
Contingent consideration(1) |
742 | — | — | 742 | |||||||||
Balance at December 31, 2011 |
$ | 474,166 | $ | 38,388 | $ | 96,930 | $ | 609,484 | |||||
Additions due to acquisitions |
63,849 | — | 964 | 64,813 | |||||||||
Contingent consideration(1) |
477 | — | — | 477 | |||||||||
Balance at December 31, 2012 |
$ | 538,492 | $ | 38,388 | $ | 97,894 | $ | 674,774 | |||||
- (1)
- Contingent consideration relates to acquisitions completed prior to the adoption of ASC 805.
F-18
HANGER, INC.
NOTES TO CONSOLIDATED FINANCIAL STATEMENTS (Continued)
NOTE D—GOODWILL AND OTHER INTANGIBLE ASSETS (Continued)
The activity related to intangible assets for the two years ended December 31, 2012 and 2011 is as follows:
| (In thousands) |
Customer Lists |
Trade Name ACP |
Patents and Other Intangibles |
Total | |||||||||
|---|---|---|---|---|---|---|---|---|---|---|---|---|---|
Gross asset value |
|||||||||||||
As of December 31, 2010 |
$ | 32,447 | $ | 9,070 | $ | 25,262 | $ | 66,779 | |||||
Write-offs and other adjustments |
— | — | 147 | 147 | |||||||||
Additions |
2,436 | — | 692 | 3,128 | |||||||||
As of December 31, 2011 |
34,883 | 9,070 | 26,101 | 70,054 | |||||||||
Additions(1) |
13,161 | — | 1,709 | 14,870 | |||||||||
As of December 31, 2012 |
$ | 48,044 | $ | 9,070 | $ | 27,810 | $ | 84,924 | |||||
Accumulated Amortization |
|||||||||||||
As of December 31, 2010 |
$ | (1,942 | ) | $ | — | $ | (8,458 | ) | $ | (10,400 | ) | ||
Amortization expense |
(2,706 | ) | — | (2,054 | ) | (4,760 | ) | ||||||
As of December 31, 2011 |
(4,648 | ) | — | (10,512 | ) | (15,160 | ) | ||||||
Amortization expense |
(3,198 | ) | — | (2,285 | ) | (5,483 | ) | ||||||
As of December 31, 2012 |
(7,846 | ) | — | (12,797 | ) | (20,643 | ) | ||||||
Net book value |
$ | 40,198 | $ | 9,070 | $ | 15,013 | $ | 64,281 | |||||
- (1)
- The weighted average life of the additions to customer lists, patents and other intangibles is 9.7 years.
The $9.1 million ACP trade name has an indefinite life and is tested for recoverability in the annual impairment test. Estimated aggregate amortization expense for definite-lived intangible assets for each of the five years ending December 31 and thereafter is as follows:
| (In thousands) |
|
|||
|---|---|---|---|---|
2013 |
$ | 6,778 | ||
2014 |
6,731 | |||
2015 |
6,676 | |||
2016 |
5,195 | |||
2017 |
4,720 | |||
Thereafter |
25,111 | |||
|
$ | 55,211 | ||
F-19
HANGER, INC.
NOTES TO CONSOLIDATED FINANCIAL STATEMENTS (Continued)
NOTE E—INVENTORIES
Inventories which are valued at the lower of cost or market, for the two years ended December 31, 2012 and 2011 are as follows:
| (In thousands) |
2012 | 2011 | |||||
|---|---|---|---|---|---|---|---|
Raw materials |
$ | 41,372 | $ | 39,121 | |||
Work in process |
56,931 | 43,954 | |||||
Finished goods |
28,992 | 29,230 | |||||
|
$ | 127,295 | $ | 112,305 | |||
NOTE F—ACQUISITIONS
In 2012, the Company acquired eighteen O&P companies, operating a total of 59 patient care clinics. The aggregate purchase price for these O&P businesses was $83.1 million, which consisted of $60.1 million of cash on hand, $21.4 million of promissory notes and $1.6 million of contingent consideration payable within the next five years. The Company preliminarily allocated the purchase price for 2012 acquisitions to the individual assets acquired and liabilities assumed. The Company's valuations are subject to adjustment as additional information is obtained; however, these adjustments are not expected to be material. The excess of purchase price over the aggregate fair value was recorded as goodwill. Contingent consideration is reported as accounts payable and other liabilities on the Company's Consolidated Balance Sheet. The Company recorded (i) approximately $63.8 million of goodwill; (ii) $12.1 million of customer lists; (iii) $6.0 million in accounts receivable; and (iv) $1.2 million of other assets and liabilities related to these acquisitions. The value of the goodwill from these acquisitions can be attributed to a number of business factors including, but not limited to, expected revenue and cash flow growth in future years. The Company incurred $1.2 million in acquisition expenses, which were included in other operating expenses. The results of operations for these acquisitions are included in the Company's results of operations from the date of acquisition. Pro forma results would not be materially different. Of the $63.8 million of goodwill recorded for the 2012 acquisitions, the Company intends to make an election to treat certain of these acquisitions as an asset acquisition for tax purposes resulting in $13.0 million of this amount being amortizable for tax purposes.
In 2011 the Company acquired eight O&P companies, operating a total of 21 patient care clinics. The aggregate purchase price for these O&P businesses was $24.9 million, which consisted of $14.1 cash on hand, $6.7 million of promissory notes and $4.1 million of contingent consideration payable within the next four years. Contingent consideration is reported as accounts payable and other liabilities on the Company's Consolidated Balance Sheet. The Company recorded (i) approximately $17.2 million of goodwill; (ii) $2.4 million of customer lists; (iii) $3.0 million of accounts receivable; and (iv) $2.3 million of other assets and liabilities related to these acquisitions. The value of the goodwill from these acquisitions can be attributed to a number of business factors including, but not limited to, expected revenue and cash flow growth in future years. The Company incurred $0.8 million in acquisition expenses, which were included in other operating expenses. The results of operations for these acquisitions were included in the Company's results of operations from the date of acquisition. Pro forma results would not be materially different. Of the $17.2 million of goodwill recorded for the 2011 acquisitions, the Company intends to make an election to treat certain of these acquisitions as an
F-20
HANGER, INC.
NOTES TO CONSOLIDATED FINANCIAL STATEMENTS (Continued)
NOTE F—ACQUISITIONS (Continued)
asset acquisition for tax purposes resulting in $14.0 million of this amount being amortizable for tax purposes.
On December 1, 2010, the Company completed the acquisition of ACP for approximately $157.8 million in cash and incurred $5.4 million of costs to complete the transaction. These costs, which were reflected as acquisition expenses on the consolidated financial statements, are comprised of $3.3 million in legal and advisor fees and $2.1 million in stock based compensation related to the sale of stock to executives of ACP. The Company recorded: (i) approximately $96.9 million of goodwill, which is not amortizable for tax purposes; (ii) $48.2 million of intangible assets; (iii) $32.5 million of fixed assets at fair value; (iv) $7.2 million of current assets; (v) $6.4 million of current liabilities; and (vi) $20.4 million of deferred tax liabilities related to the ACP transaction. The value of the goodwill from this acquisition can be attributed to a number of business factors including, but not limited to, expected revenue and cash flow growth in future years and the ability to provide services to a previously underserved market. The Company identified intangible assets totaling $48.2 million comprised of: (i) $22.3 million of customer relationships with a useful life of 14 years; (ii) $9.1 million related to the trade name which has an indefinite life; (iii) $8.1 million related to proprietary treatment programs with a useful life of 15 years; (iv) $5.4 million of patented technology with a useful life of eight years; and (v) $3.3 million related to other assets with a three to five year useful life. The results of operations for ACP are included in the Company's results of operations from the date of acquisition. Pro forma results would not be materially different.
In addition to ACP, the Company acquired five O&P companies in 2010, operating a total of six patient care clinics located in California, New York, Texas, and Utah. The aggregate purchase price for these O&P businesses was $10.6 million, which consisted of $5.4 million of cash on hand, $3.0 million of promissory notes and $2.2 million of contingent considerations payable within the next three years. Contingent consideration is reported as other liabilities on the Company's Consolidated Balance Sheet. The Company recorded approximately $9.2 million of goodwill related to these acquisitions and the expenses incurred were included in other operating expenses. The results of operations for these acquisitions are included in the Company's results of operations from the date of acquisition. Pro forma results would not be materially different. The goodwill related to the acquisitions is not amortizable for tax purposes.
In connection with contingent consideration agreements with acquisitions completed prior to adoption of the revised authoritative guidance for business combinations becoming effective, the Company made payments of $0.5 million, $0.7 million, and $1.3 million during the years ended December 31, 2012, 2011, and 2010, respectively. The Company has accounted for changes in the estimates of these amounts as additional purchase price, resulting in an increase in goodwill. In connection with contingent consideration agreements with acquisitions completed subsequent to adoption of the revised authoritative guidance, the Company made payments of $2.5 million in 2012, $1.5 million in 2011, and $0.4 million in 2010.
The Company estimates that it may pay up to $6.3 million related to contingent consideration provisions of acquisitions in future periods.
F-21
HANGER, INC.
NOTES TO CONSOLIDATED FINANCIAL STATEMENTS (Continued)
NOTE G—LONG-TERM DEBT
Long-term debt as of December 31 was as follows:
| (In thousands) |
2012 | 2011 | |||||
|---|---|---|---|---|---|---|---|
Revolving Credit Facility |
$ | — | $ | — | |||
Term Loan |
293,300 | 297,000 | |||||
71/8% Senior Notes due 2018 |
200,000 | 200,000 | |||||
Subordinated seller notes, non-collateralized, net of unamortized discount with principal and interest payable in either monthly, quarterly or annual installments at effective interest rates ranging from 2.00% to 6.5%, maturing through November 2018 |
27,346 | 11,033 | |||||
|
520,646 | 508,033 | |||||
Less current portion |
(11,082 | ) | (8,065 | ) | |||
|
$ | 509,564 | $ | 499,968 | |||
Refinancing and Amendment
During the fourth quarter of 2010, the Company refinanced its senior debt through the issuance of $200.0 million of 71/8% Senior Notes due 2018, a new $300.0 million Term Loan Facility which matures in 2016, and the establishment of a $100.0 million Revolving Credit Facility. The Company recorded a $14.0 million charge related to the early extinguishment of the senior debt, comprised primarily of $9.8 million of premiums paid to debt holders and a $4.2 million write-off of debt issuance costs and other fees. The proceeds of the refinancing were used for the following: (i) $184.8 million to retire the outstanding 101/4% Senior Notes due 2014 and related premiums and fees; (ii) $220.3 million to retire the outstanding balance under the existing Term Loan Facility; (iii) $16.9 million to pay debt issuance costs; and (iv) $78.2 million to partially fund the purchase price for the acquisition of ACP.
On March 11, 2011, the Company entered into an amendment to its Credit Agreement dated as of December 1, 2010 (as amended, the "Credit Agreement"). The amendment (i) reduced the interest rate margin applicable to the Term Loans under the Credit Agreement by 0.75% to 3.0% and (ii) reduced the LIBOR floor applicable to the Term Loans under the Credit Agreement from 1.5% to 1.0%. The Company incurred $4.1 million of fees related to the Amendment which will be amortized into interest expense over the remaining term of the debt.
Revolving Credit Facility
The $100.0 million Revolving Credit Facility matures on December 1, 2015 and bears interest at LIBOR plus 3.25%, or the applicable rate (as defined in the Credit Agreement). The Revolving Credit Facility requires compliance with various covenants including but not limited to (i) minimum consolidated interest coverage ratio of 3.50:1.00; (ii) maximum total leverage ratio of 4.00:1.00; and (iii) maximum annual capital expenditures of 7.5% of consolidated net revenues of the preceding fiscal year with an additional rollover of up to $15.0 million from the prior year's allowance if not expended in the fiscal year for which it is permitted. As of December 31, 2012, the Company was in compliance with these covenants. As of December 31, 2012, the Company had $99.5 million available under this facility. This availability as of December 31, 2012 was net of standby letters of credit of approximately $0.5 million. As of December 31, 2012, the Company had no funds drawn on the Revolving Credit
F-22
HANGER, INC.
NOTES TO CONSOLIDATED FINANCIAL STATEMENTS (Continued)
NOTE G—LONG-TERM DEBT (Continued)
Facility. The obligations under the Revolving Credit Facility are senior obligations, are guaranteed by the Company's subsidiaries, and are secured by a first priority perfected interest in the equity interests of the Company's subsidiaries, all of the Company's assets, and all the assets of the Company's subsidiaries.
Term Loan Facility
The $300.0 million Term Loan Facility matures on December 1, 2016 and requires quarterly principal payments. From time to time, mandatory prepayments may be required as a result of excess free cash flow as defined in the Credit Agreement, certain additional debt incurrences and asset sales, or other events as defined in the Credit Agreement. During 2012, the Company made a mandatory prepayment on its Term Loan Facility of $700,000. The Term Loan Facility bears interest at LIBOR plus 3.0%, or the applicable rate (as defined in the Credit Agreement), and includes a 1.0% LIBOR floor. As of December 31, 2012, the interest rate on the Term Loan Facility was 4.0%. The obligations under the Term Loan Facility are senior obligations, are guaranteed by the Company's subsidiaries, and are secured by a first priority perfected interest in the Company's subsidiaries' shares, all of the Company's assets, and all the assets of the Company's subsidiaries.
71/8% Senior Notes
The 71/8% Senior Notes mature November 15, 2018 and are senior unsecured indebtedness which is guaranteed on a senior unsecured basis by all of the Company's current and future subsidiaries. Interest is payable semi-annually on May 15 and November 15 of each year, commencing May 15, 2011.
On or prior to November 15, 2013, the Company may redeem up to 35% of the aggregate principal amount of the notes at a redemption price of 107.125% of the principal amount thereof, plus accrued and unpaid interest and additional interest to the redemption date with the proceeds of a public offering of its equity securities. On or after November 15, 2014, the Company may redeem all or from time to time a part of the notes upon not less than 30 not more than 60 days' notice, for the twelve month period beginning on November 15, of the indicated years at (i) 103.563% during 2014; (ii) 101.781% during 2015; and (iii) 100.00% during 2016 and thereafter through November 15, 2018.
Subsidiary Guarantees
The Revolving and Term Loan Facilities and the 71/8% Senior Notes are guaranteed by all of the Company's subsidiaries. Separate condensed consolidating information is not included as the Company does not have independent assets or operations. The Guarantees are full and unconditional and joint and several, and any subsidiaries of the Company other than the Guarantor Subsidiaries are minor. There are no restrictions on the ability of our subsidiaries to transfer cash to the Company or to co-guarantors. All consolidated amounts in the Company's financial statements are representative of the combined guarantors.
Debt Covenants
The terms of the Senior Notes, the Revolving Credit Facility, and the Term Loan Facility limit the Company's ability to, among other things, incur additional indebtedness, create liens, pay dividends on or redeem capital stock, make certain investments, make restricted payments, make certain dispositions of assets, engage in transactions with affiliates, engage in certain business activities and engage in
F-23
HANGER, INC.
NOTES TO CONSOLIDATED FINANCIAL STATEMENTS (Continued)
NOTE G—LONG-TERM DEBT (Continued)
mergers, consolidations and certain sales of assets. At December 31, 2012 and 2011, the Company was in compliance with all covenants under these debt agreements.
Maturities of long-term debt at December 31, 2012 and the years thereafter are as follows:
| (In thousands) |
|
|||
|---|---|---|---|---|
2013 |
$ | 11,082 | ||
2014 |
10,942 | |||
2015 |
10,473 | |||
2016 |
287,574 | |||
2017 |
200,575 | |||
Thereafter |
— | |||
|
$ | 520,646 | ||
NOTE H—COMMITMENTS AND CONTINGENT LIABILITIES
Commitments
The Company's wholly-owned subsidiary, Innovative Neurotronics, Inc. ("IN, Inc."), is party to a non-binding purchase agreement under which it agreed to purchase assembled WalkAide system kits. As of December 31, 2012, IN, Inc. had outstanding purchase commitments of approximately $0.5 million that the Company expects to be fulfilled over the next three months.
Contingencies
The Company is subject to legal proceedings and claims which arise from time to time in the ordinary course of its business, including additional payments under business purchase agreements. In the opinion of management, the amount of ultimate liability, if any, with respect to these actions will not have a materially adverse effect on the financial position, liquidity or results of operations of the Company.
The Company is in a highly regulated industry and receives regulatory agency inquiries from time to time in the ordinary course of its business, including inquiries relating to the Company's billing activities. To date these inquiries have not resulted in material liabilities, but no assurance can be given that future regulatory agencies' inquiries will be consistent with the results to date or that any discrepancies identified during a regulatory review will not have a material adverse effect on the Company's consolidated financial statements.
Guarantees and Indemnifications
In the ordinary course of its business, the Company may enter into service agreements with service providers in which it agrees to indemnify or limit the service provider against certain losses and liabilities arising from the service provider's performance of the agreement. The Company has reviewed its existing contracts containing indemnification or clauses of guarantees and does not believe that its liability under such agreements is material to the Company's operations.
F-24
HANGER, INC.
NOTES TO CONSOLIDATED FINANCIAL STATEMENTS (Continued)
NOTE I—NET INCOME PER COMMON SHARE
Basic per common share amounts are computed using the weighted average number of common shares outstanding during the year. Diluted per common share amounts are computed using the weighted average number of common shares outstanding during the year and dilutive potential common shares. Dilutive potential common shares consist of stock options and restricted stock units and are calculated using the treasury stock method.
| (In thousands, except share and per share data) |
2012 | 2011 | 2010 | |||||||
|---|---|---|---|---|---|---|---|---|---|---|
Net income applicable to common stock |
$ | 63,692 | $ | 54,477 | $ | 20,896 | ||||
Shares of common stock outstanding used to compute basic per common share amounts |
34,282,591 | 33,544,813 | 32,238,401 | |||||||
Effect of dilutive restricted stock units and options |
550,239 | 675,443 | 649,904 | |||||||
Shares used to compute diluted per common share amounts |
34,832,830 | 34,220,256 | 32,888,305 | |||||||
Basic income per share applicable to common stock |
$ | 1.86 | $ | 1.62 | $ | 0.65 | ||||
Diluted income per share applicable to common stock |
$ | 1.83 | $ | 1.59 | $ | 0.64 | ||||
NOTE J—INCOME TAXES
Components of income tax expense attributable to continuing operations are as follows:
| (In thousands) |
2012 | 2011 | 2010 | |||||||
|---|---|---|---|---|---|---|---|---|---|---|
Current: |
||||||||||
Federal |
$ | 32,394 | $ | 18,976 | $ | 10,766 | ||||
State |
6,386 | 2,242 | 2,121 | |||||||
Total Current |
38,780 | 21,218 | 12,887 | |||||||
Deferred: |
||||||||||
Federal |
(3,273 | ) | 6,242 | 384 | ||||||
State |
(1,030 | ) | 2,197 | 368 | ||||||
Total Deferred |
(4,303 | ) | 8,439 | 752 | ||||||
Provision for income taxes |
$ | 34,477 | $ | 29,657 | $ | 13,639 | ||||
A reconciliation of the federal statutory tax rate to the Company's effective tax rate is as follows:
| |
2012 | 2011 | 2010 | |||||||
|---|---|---|---|---|---|---|---|---|---|---|
Federal statutory tax rate |
35.0 | % | 35.0 | % | 35.0 | % | ||||
Increase (decrease) in taxes resulting from: |
||||||||||
State income taxes (net of federal effect) |
4.3 | 4.3 | 5.7 | |||||||
Domestic manufacturing deduction |
(2.4 | ) | (2.0 | ) | (3.0 | ) | ||||
Adjustments to uncertain tax positions |
— | — | (2.1 | ) | ||||||
Non-deductible acquisition costs |
— | — | 2.3 | |||||||
Other |
(1.8 | ) | (2.0 | ) | 1.6 | |||||
Provision for income taxes |
35.1 | % | 35.3 | % | 39.5 | % | ||||
F-25
HANGER, INC.
NOTES TO CONSOLIDATED FINANCIAL STATEMENTS (Continued)
NOTE J—INCOME TAXES (Continued)
The significant components of the net deferred income tax liability (asset) were as follows at December 31:
| (In thousands) |
2012 | 2011 | |||||
|---|---|---|---|---|---|---|---|
Deferred tax liabilities: |
|||||||
Goodwill amortization |
$ | 63,405 | $ | 58,423 | |||
Property, plant and equipment |
3,339 | 6,011 | |||||
Acquired intangibles |
18,062 | 18,091 | |||||
Debt issuance costs |
1,600 | 2,446 | |||||
Tax accounting method changes |
1,278 | 2,626 | |||||
Other |
4,511 | 1,578 | |||||
|
92,195 | 89,175 | |||||
Deferred tax assets: |
|||||||
Net operating loss carryforwards |
4,943 | 5,499 | |||||
Accrued expenses |
15,573 | 11,870 | |||||
Deferred benefit plan compensation |
8,363 | 7,693 | |||||
Provision for doubtful accounts |
7,911 | 5,756 | |||||
Inventory capitalization and reserves |
2,408 | 2,247 | |||||
Restricted stock |
2,182 | 1,947 | |||||
Deferred rent |
1,432 | 1,282 | |||||
Other |
557 | 594 | |||||
|
43,369 | 36,888 | |||||
Valuation allowance |
(1,219 | ) | (1,374 | ) | |||
|
42,150 | 35,514 | |||||
Net deferred tax liabilities |
$ | 50,045 | $ | 53,661 | |||
At December 31, 2012 and 2011, the Company had accumulated federal net operating loss carryforwards of $7.0 million, and $7.1 million, respectively, and state net operating loss carryforwards of $49.7 million and $59.0 million, respectively. The federal net operating loss carryforwards expire from 2025 through 2029, and the state net operating loss carryforwards for significant taxing jurisdictions expire from 2022 through 2028. Utilization of the acquired carryforwards is subject to limitations due to ownership changes that may delay the utilization of a portion of the acquired carryforwards.
The Company establishes valuation allowances when necessary to reduce deferred tax assets to amounts expected to be realized. As of December 31, 2012 and 2011, the Company recorded a valuation allowance of $1.2 million and $1.4 million, respectively, related to state loss carryforwards, which are expected to expire before utilization.
F-26
HANGER, INC.
NOTES TO CONSOLIDATED FINANCIAL STATEMENTS (Continued)
NOTE J—INCOME TAXES (Continued)
A reconciliation of the beginning and ending balances of unrecognized tax benefits is as follows:
| (In thousands) |
2012 | 2011 | 2010 | |||||||
|---|---|---|---|---|---|---|---|---|---|---|
Unrecognized tax benefits, at beginning of the year |
$ | 230 | $ | 420 | $ | 1,709 | ||||
Additions for tax positions related to the current year |
107 | — | 107 | |||||||
Additions for tax positions of prior years |
79 | — | — | |||||||
Decrease related to prior year positions |
— | (190 | ) | (672 | ) | |||||
Decrease for lapse of applicable statute of limitations |
(39 | ) | — | (724 | ) | |||||
Unrecognized tax benefits, at end of the year |
$ | 377 | $ | 230 | $ | 420 | ||||
As of December 31, 2012, the total amount of unrecognized tax benefits, if recognized, that would affect the effective tax rate is $0.1 million. At December 31, 2012, there were no unrecognized tax benefits that the Company expects would change significantly over the next 12 months.
The Company recognizes accrued interest and penalties related to unrecognized tax benefits as a component of income tax expense. As of December 31, 2012, 2011, and 2010, the amount of accrued interest and penalties was immaterial. The amount of interest and penalties recognized in all periods presented was immaterial.
The Company is subject to income tax in U.S. federal, state and local jurisdictions. The Company is no longer subject to U.S. Federal income tax examinations for years before 2009, and with few exceptions, is no longer subject to state and local income tax examinations by tax authorities for years before 2008. However, due to acquired net operating losses, tax authorities have the ability to adjust those net operating losses related to closed years.
NOTE K—EMPLOYEE BENEFITS
Savings Plan
The Company maintains a 401(k) Savings and Retirement plan that covers all of the employees of the Company. Under this 401(k) plan, employees may defer such amounts of their compensation up to the levels permitted by the Internal Revenue Service. The Company recorded matching contributions of $4.2 million, $3.9 million, and $3.5 million under this plan during 2012, 2011 and 2010, respectively.
Supplemental Executive Retirement Plan
Effective January 2004, the Company implemented an unfunded noncontributory defined benefit plan (the "Plan") for certain senior executives. The Company has engaged an actuary to calculate the benefit obligation and net benefits cost at December 31, 2012 and has utilized such to establish the benefit obligation liability. The Plan, which is administered by the Company, calls for annual payments upon retirement based on years of service and final average salary. Net periodic benefit expense is actuarially determined.
F-27
HANGER, INC.
NOTES TO CONSOLIDATED FINANCIAL STATEMENTS (Continued)
NOTE K—EMPLOYEE BENEFITS (Continued)
The Plan's net benefit cost is as follows:
| (In thousands) |
|
|||
|---|---|---|---|---|
Change in Benefit Obligation |
||||
Benefit obligation at December 31, 2010 |
$ | 17,510 | ||
Service cost |
986 | |||
Interest cost |
807 | |||
Payments |
(526 | ) | ||
Actuarial loss |
1,453 | |||
Benefit obligation at December 31, 2011 |
$ | 20,230 | ||
Service cost |
878 | |||
Interest cost |
761 | |||
Amortization of (Gain)/Loss |
40 | |||
Payments |
(706 | ) | ||
Actuarial loss |
1,174 | |||
Benefit obligation at December 31, 2012 |
$ | 22,377 | ||
Unfunded status |
$ | 22,377 | ||
Unamortized net (gain) loss |
— | |||
Net amount recognized |
$ | 22,377 | ||
Amounts Recognized in the Consolidated Balance Sheet |
||||
Current Accrued liabilities |
1,247 | |||
Non-Current Accrued liabilities |
21,130 | |||
Total Accrued liabilities |
$ | 22,377 | ||
The Company recorded comprehensive losses of $(1.2) million and $(1.4) million, which consists of actuarial losses for the years 2012 and 2011, respectively. The company recorded a tax benefit on the unrealized losses for the plan years 2012 and 2011 of $0.4 million and $0.5 million, respectively. There were no other components such as prior service costs or transition obligations relating to Plan costs recorded within accumulated other comprehensive income (loss) during 2012 or 2011. Accumulated other comprehensive loss at December 31, 2012 and 2011 was comprised of actuarial losses of $0.7 million and $0.9 million, net of tax.
The following weighted average assumptions were used to determine the benefit obligation and net benefit cost at December 31:
| |
2012 | 2011 | |||||
|---|---|---|---|---|---|---|---|
Discount rate |
3.25 | % | 3.90 | % | |||
Average rate of increase in compensation |
3.00 | % | 3.00 | % | |||
F-28
HANGER, INC.
NOTES TO CONSOLIDATED FINANCIAL STATEMENTS (Continued)
NOTE K—EMPLOYEE BENEFITS (Continued)
At December 31, 2012, the estimated accumulated benefit obligation is $22.4 million. Future payments under the Plan are as follows:
| (In thousands) |
|
|||
|---|---|---|---|---|
2013 |
$ | 1,247 | ||
2014 |
1,578 | |||
2015 |
1,578 | |||
2016 |
1,578 | |||
2017 |
1,578 | |||
Thereafter |
14,818 | |||
|
$ | 22,377 | ||
NOTE L—STOCK-BASED COMPENSATION
On May 13, 2010, the stockholders of the Company approved the 2010 Omnibus Incentive Plan (the "2010 Plan") and terminated the Amended and Restated 2002 Stock Incentive and Bonus Plan (the "2002 Plan") and 2003 Non-Employee Directors' Stock Incentive Plan (the "2003 Plan"). In conjunction with this approval, it was determined that no new awards will be granted under the 2002 Plan or the 2003 Plan; however, awards granted under either the 2002 Plan or the 2003 Plan that were outstanding will remain outstanding and continue to be subject to all of the terms and conditions of the 2002 Plan or the 2003 Plan, as applicable.
The 2010 Plan provides that 2.5 million shares of Common Stock are reserved for issuance, subject to adjustment as set forth in the 2010 Plan; provided, however, that only 1.5 million shares may be issued pursuant to the exercise of incentive stock options and vesting of restricted stock units. Of these 2.5 million shares, 2.0 million are shares that are newly authorized for issuance under the 2010 Plan and 0.5 million are unissued shares not subject to awards that have been carried over from the shares previously authorized for issuance under the terms of the 2002 Plan and the 2003 Plan. Unless earlier terminated by the Board of Directors, the 2010 Plan will remain in effect until the earlier of (i) the date that is ten years from the date the plan is approved by the Company's stockholders, which is the effective date for the plan, namely May 13, 2020, or (ii) the date all shares reserved for issuance have been issued.
As of December 31, 2012, of the 2.5 million shares of common stock authorized for issuance under the Company's 2010 Plan, approximately 1.2 million shares have been issued and 0.2 million have been canceled, leaving 1.5 million shares available for future issuance. Total unrecognized stock-based compensation cost related to unvested restricted stock units was approximately $12.7 million at December 31, 2012, and is expected to be expensed as compensation expense over approximately four years.
Restricted Stock Units
For the year ended December 31, 2012, 2011, and 2010, the Company has included approximately $8.1 million, $8.1 million, and $7.5 million, respectively, of stock-based compensation cost in the accompanying Consolidated Statements of Income and Comprehensive Income for the 2002, 2003, and 2010 Plans. Compensation expense relates to restricted stock unit grants, as the amount of expense
F-29
HANGER, INC.
NOTES TO CONSOLIDATED FINANCIAL STATEMENTS (Continued)
NOTE L—STOCK-BASED COMPENSATION (Continued)
related to options is immaterial in all periods presented. The total value of the restricted stock units is expensed ratably over the requisite service period of the employees receiving the awards.
The summary of restricted stock units and weighted average exercise prices are as follows:
| |
Employee Awards | Director Awards | |||||||||||
|---|---|---|---|---|---|---|---|---|---|---|---|---|---|
| |
Shares | Weighted Average Grant Date Fair Value |
Shares | Weighted Average Grant Date Fair Value |
|||||||||
Nonvested at December 31, 2009 |
986,461 | $ | 12.29 | 129,123 | $ | 13.21 | |||||||
Granted |
454,950 |
18.45 |
75,710 |
18.48 |
|||||||||
Vested |
(585,228 | ) | 11.36 | (71,079 | ) | 12.86 | |||||||
Forfeited |
(48,112 | ) | 13.99 | — | — | ||||||||
Nonvested at December 31, 2010 |
808,071 | $ | 16.33 | 133,754 | $ | 16.38 | |||||||
Granted |
487,620 |
25.25 |
59,698 |
25.72 |
|||||||||
Vested |
(374,067 | ) | 14.61 | (62,533 | ) | 15.46 | |||||||
Forfeited |
(28,101 | ) | 19.17 | (15,001 | ) | 20.80 | |||||||
Nonvested at December 31, 2011 |
893,523 | $ | 21.84 | 115,918 | $ | 21.12 | |||||||
Granted |
468,500 |
20.47 |
63,497 |
22.35 |
|||||||||
Vested |
(318,927 | ) | 20.17 | (58,059 | ) | 19.34 | |||||||
Forfeited |
(231,537 | ) | 21.26 | — | — | ||||||||
Nonvested at December 31, 2012 |
811,559 | $ | 21.76 | 121,356 | $ | 22.62 | |||||||
During the years ended December 31, 2012 and 2011, 376,986 and 436,600 restricted stock units of common stock with an intrinsic value of $7.6 million and $6.4 million, respectively, became fully vested. As of December 31, 2012, total unrecognized compensation cost related to restricted stock units of common stock was approximately $12.7 million and the related weighted-average period over which it is expected to be recognized is approximately two years. The aggregate granted units have vesting dates through August 2016. The 2012 and 2011 grants totaled $11.0 million and $13.3 million, respectively, at the dates of grant, and are amortized to expense ratably over the vesting period of granted units.
F-30
HANGER, INC.
NOTES TO CONSOLIDATED FINANCIAL STATEMENTS (Continued)
NOTE L—STOCK-BASED COMPENSATION (Continued)
Options
The summary of option activity and weighted average exercise prices are as follows:
| |
Employee Awards | Director Awards | Non-Qualified Awards | ||||||||||||||||
|---|---|---|---|---|---|---|---|---|---|---|---|---|---|---|---|---|---|---|---|
| |
Shares | Weighted Average Exercise Price |
Shares | Weighted Average Exercise Price |
Shares | Weighted Average Exercise Price |
|||||||||||||
Outstanding at December 31, 2009 |
764,332 | $ | 13.74 | 95,464 | $ | 11.46 | 406,000 | $ | 5.95 | ||||||||||
Granted |
— | — | — | — | — | — | |||||||||||||
Terminated |
(1,500 | ) | 4.63 | — | — | — | — | ||||||||||||
Exercised |
(328,332 | ) | 14.16 | (15,373 | ) | 13.82 | (30,000 | ) | 5.50 | ||||||||||
Outstanding at December 31, 2010 |
434,500 | $ | 13.45 | 80,091 | $ | 11.08 | 376,000 | $ | 5.98 | ||||||||||
Granted |
— | — | — | — | — | — | |||||||||||||
Terminated |
— | — | (10,373 | ) | 10.79 | — | — | ||||||||||||
Exercised |
— | — | (41,459 | ) | 10.38 | (376,000 | ) | 5.98 | |||||||||||
Outstanding at December 31, 2011 |
434,500 | $ | 13.45 | 28,259 | $ | 11.99 | — | $ | — | ||||||||||
Granted |
— | — | — | — | — | — | |||||||||||||
Terminated |
(1,500 | ) | 15.60 | — | — | — | — | ||||||||||||
Exercised |
(230,000 | ) | 14.82 | (9,404 | ) | 16.04 | — | — | |||||||||||
Outstanding at December 31, 2012 |
203,000 | $ | 11.88 | 18,855 | $ | 10.02 | — | $ | — | ||||||||||
Aggregate intrinsic value at December 31, 2012 |
$ | 2,411,300 | $ | 189,003 | $ | — | |||||||||||||
Weighted average remaining contractual term (years) |
1.0 | 1.0 | — | ||||||||||||||||
The intrinsic value of options exercised during the years ended December 31, 2012 and 2011 was $3.6 million and $2.7 million, respectively. Options exercisable under the Company's stock-based compensation plans at December 31, 2012 and 2011 were 0.2 million and 0.5 million shares, respectively, with a weighted average exercise price of $11.72 and $13.36, respectively, an average remaining contractual term of 1.0 and 1.7 years, respectively, and an aggregate intrinsic value of $2.6 million and $6.2 million as of December 31, 2012 and 2011. Cash received by the Company related to the exercise of options during the years ended December 31, 2012 and 2011 amounted to $3.6 million and $2.7 million. As of December 31, 2012 and 2011, there is no unrecognized compensation cost related to stock option awards.
F-31
HANGER, INC.
NOTES TO CONSOLIDATED FINANCIAL STATEMENTS (Continued)
NOTE L—STOCK-BASED COMPENSATION (Continued)
The summary of the options vested and exercisable is as follows for the three years ended at December 31:
| |
Employee Plans |
Director Plans |
Non-Qualified Awards |
|||||||
|---|---|---|---|---|---|---|---|---|---|---|
2012 |
203,000 | 18,855 | — | |||||||
2011 |
434,500 | 28,259 | — | |||||||
2010 |
434,500 | 80,091 | 376,000 | |||||||
Information concerning outstanding and exercisable options as of December 31, 2012 is as follows:
| |
Options Outstanding and Exercisable |
|||||||||
|---|---|---|---|---|---|---|---|---|---|---|
| |
|
Weighted Average | ||||||||
Range of Exercise Prices |
Number of Options or Awards |
Remaining Life (Years) |
Exercise Price |
|||||||
$ 5.09 to $12.00 |
113,482 | 1.1 | 8.02 | |||||||
12.10 to 17.60 |
108,373 | 1.0 | 15.60 | |||||||
|
221,855 | 1.0 | $ | 11.72 | ||||||
NOTE M—LEASES
Operating Leases
The Company leases office space under non-cancellable operating leases, the majority of which contain escalation clauses. The Company recognizes rent expense on a straight-line basis for leases with escalation clauses. Certain of these leases also contain renewal options. Renewal periods vary according to lease agreements. Rent expense was approximately $43.0 million, $41.4 million, and $40.4 million, for the years ended December 31, 2012, 2011, and 2010, respectively. Sublease rental income of $1.3 million, $0.6 million, and $0.1 million, for the years ended December 31, 2012, 2011, and 2010, respectively, was netted against rent expense. The Company estimates it will receive approximately $2.4 million of sublease rent income over the next four years.
Future minimum rental payments, by year and in the aggregate, under operating leases with terms of one year or more at December 31, 2012 are as follows:
| (In thousands) |
|
|||
|---|---|---|---|---|
2013 |
$ | 45,081 | ||
2014 |
36,583 | |||
2015 |
26,253 | |||
2016 |
19,397 | |||
2017 |
14,031 | |||
Thereafter |
30,014 | |||
|
$ | 171,359 | ||
F-32
HANGER, INC.
NOTES TO CONSOLIDATED FINANCIAL STATEMENTS (Continued)
NOTE N—RELATED PARTY TRANSACTIONS
The firm of Foley & Lardner LLP serves as the Company's outside general counsel. The Company's Chairman is the brother-in-law of the partner in charge of the relationship. Total fees paid by the Company to Foley & Lardner LLP were $2.4 million, $2.6 million, and $3.3 million, for the years ended 2012, 2011, and 2010, respectively.
NOTE O—SEGMENT AND RELATED INFORMATION
The Company has identified three reportable segments in which it operates based on the products and services it provides. The Company evaluates segment performance and allocates resources based on the segments' income from operations. The reportable segments are: (i) Patient Care (ii) Distribution, and (iii) Therapeutic Solutions. The reportable segments are described further below:
Patient Care—This segment consists of the Company's owned and operated patient care clinics and fabrication centers of O&P components. The patient care clinics provide services to design and fit O&P devices to patients. These clinics also instruct patients in the use, care and maintenance of the devices. Fabrication centers are involved in the fabrication of O&P components for both the O&P industry and the Company's own patient care clinics. The principal reimbursement sources for the Company's services are:
- •
- Commercial and other, which consist of individuals, rehabilitation providers, private insurance companies, HMOs, PPOs,
hospitals, vocational rehabilitation, workers' compensation programs and similar sources;
- •
- Medicare, a federally funded health insurance program providing health insurance coverage for persons aged 65 or older and
certain disabled persons, which provides reimbursement for O&P products and services based on prices set forth in fee schedules for 10 regional service areas;
- •
- Medicaid, a health insurance program jointly funded by federal and state governments providing health insurance coverage
for certain persons in financial need, regardless of age, which may supplement Medicare benefits for financially needy persons aged 65 or older; and
- •
- U.S. Department of Veterans Affairs.
The Company estimates that government reimbursement, comprised of Medicare, Medicaid and the U.S. Department of Veterans Affairs, in the aggregate, accounted for approximately 40.4%, 40.0%, and 40.4% of the Company's net sales in 2012, 2011, and 2010, respectively.
Distribution—This segment distributes O&P products and components to both the O&P industry and the Company's own patient care clinics.
Therapeutic Solutions—This segment consists of the leasing of rehabilitation equipment from, and the provision of clinical program by, ACP as well the operations of IN, Inc. ACP is a developer of specialized rehabilitation technologies and provides evidence-based clinical programs for post-acute rehabilitation. IN, Inc. specializes in bringing emerging MyoOrthotics Technologies® to the O&P market. MyoOrthotics Technologies represents the merging of orthotic technologies with electrical stimulation.
Other—This consists of Hanger corporate and Linkia. Linkia is a national managed-care agent for O&P services and a patient referral clearing house.
The accounting policies of the segments are the same as those described in the summary of "Significant Accounting Policies" in Note B to the consolidated financial statements.
F-33
HANGER, INC.
NOTES TO CONSOLIDATED FINANCIAL STATEMENTS (Continued)
NOTE O—SEGMENT AND RELATED INFORMATION (Continued)
Summarized financial information concerning the Company's reportable segments is shown in the following table. Intersegment sales mainly include sales of O&P components from the Distribution segment to the Patient Care segment and were made at prices which approximate market values. The Patient Care segment results below are revised as described in footnote B.
| (In thousands) |
Patient Care | Distribution | Therapeutic Solutions |
Other | Consolidating Adjustments |
Total | |||||||||||||
|---|---|---|---|---|---|---|---|---|---|---|---|---|---|---|---|---|---|---|---|
2012 |
|||||||||||||||||||
Net sales |
|||||||||||||||||||
Customers |
$ | 813,556 | $ | 107,266 | $ | 63,921 | $ | 807 | $ | — | $ | 985,550 | |||||||
Intersegments |
17,621 | 191,202 | 3,902 | — | (212,725 | ) | — | ||||||||||||
Depreciation and amortization |
14,307 | 1,139 | 11,232 | 7,974 | — | 34,652 | |||||||||||||
Income (loss) from operations |
149,544 | 34,178 | 4,182 | (57,500 | ) | (1,066 | ) | 129,338 | |||||||||||
Interest (income) expense |
30,353 | 3,294 | 5,743 | (8,221 | ) | — | 31,169 | ||||||||||||
Income (loss) before taxes |
119,191 | 30,884 | (1,561 | ) | (49,279 | ) | (1,066 | ) | 98,169 | ||||||||||
Total assets |
1,423,258 |
199,268 |
135,786 |
(520,985 |
) |
— |
1,237,327 |
||||||||||||
Capital expenditures |
15,311 | 438 | 3,948 | 13,466 | — | 33,163 | |||||||||||||
2011 |
|||||||||||||||||||
Net sales |
|||||||||||||||||||
Customers |
$ | 753,409 | $ | 100,456 | $ | 64,014 | $ | 660 | $ | — | $ | 918,539 | |||||||
Intersegments |
15,853 | 174,431 | 3,520 | — | (193,804 | ) | — | ||||||||||||
Depreciation and amortization |
12,502 | 1,088 | 10,424 | 7,068 | (113 | ) | 30,969 | ||||||||||||
Income (loss) from operations |
138,918 | 28,293 | 3,703 | (54,654 | ) | (305 | ) | 115,955 | |||||||||||
Interest (income) expense |
28,440 | 3,356 | 5,761 | (5,736 | ) | — | 31,821 | ||||||||||||
Income (loss) before taxes |
110,478 | 24,937 | (2,058 | ) | (48,918 | ) | (305 | ) | 84,134 | ||||||||||
Total assets |
1,277,700 |
170,077 |
135,781 |
(456,839 |
) |
— |
1,126,719 |
||||||||||||
Capital expenditures |
11,886 | 1,318 | 4,217 | 11,253 | — | 28,674 | |||||||||||||
2010 |
|||||||||||||||||||
Net sales |
|||||||||||||||||||
Customers |
$ | 714,665 | $ | 95,544 | $ | 6,622 | $ | 548 | $ | — | $ | 817,379 | |||||||
Intersegments |
— | 168,823 | 3,839 | — | (172,662 | ) | — | ||||||||||||
Depreciation and amortization |
11,211 | 1,004 | 1,293 | 5,414 | (113 | ) | 18,809 | ||||||||||||
Income (loss) from operations |
130,521 | 30,395 | (5,402 | ) | (75,023 | ) | (21 | ) | 80,470 | ||||||||||
Interest (income) expense |
28,410 | 3,397 | 480 | (1,947 | ) | — | 30,340 | ||||||||||||
Income (loss) before taxes |
102,111 | 26,998 | (5,882 | ) | (88,671 | ) | (21 | ) | 34,535 | ||||||||||
Total assets |
1,053,361 |
146,166 |
142,970 |
(281,927 |
) |
— |
1,060,570 |
||||||||||||
Capital expenditures |
17,599 | 1,112 | 2,056 | 9,826 | — | 30,593 | |||||||||||||
F-34
HANGER, INC.
NOTES TO CONSOLIDATED FINANCIAL STATEMENTS (Continued)
NOTE O—SEGMENT AND RELATED INFORMATION (Continued)
The Company's foreign and export sales and assets located outside of the United States of America are not significant. Additionally, no single customer accounted for more than 10% of revenues in 2012, 2011, or 2010.
NOTE P—CORPORATE OFFICE RELOCATION
The Company moved its corporate headquarters from Bethesda, Maryland to Austin, Texas in 2010. In conjunction with the move, the Company incurred employee separation costs, other relocation costs, and lease termination costs. Employee separation costs are expensed pro-ratably over the requisite service period. The Company incurred $1.2 million of additional costs in 2011 and no additional expenses in 2012 as the final employee moves were completed. In 2010 the Company abandoned its lease premises in Bethesda, Maryland and recorded a remaining lease termination liability, net of anticipated sub-lease recoveries. $2.0 million of such liability remains as of December 31, 2012. The lease termination liability will be paid out over the remaining term of the lease which expires on September 30, 2014.
The following is a summary of the costs of the relocation incurred and to be paid in future periods:
| (in thousands) |
Employee Separation |
Other Relocation |
Lease Termination |
Total | |||||||||
|---|---|---|---|---|---|---|---|---|---|---|---|---|---|
Balance as of December 31, 2010 |
$ | 1,895 | $ | — | $ | 5,206 | $ | 7,101 | |||||
Expenses incurred |
(158 | ) | 1,211 | 132 | 1,185 | ||||||||
Amounts paid |
(1,511 | ) | (1,211 | ) | (2,253 | ) | (4,975 | ) | |||||
Balance as of December 31, 2011 |
$ | 226 | $ | — | $ | 3,085 | $ | 3,311 | |||||
Expenses incurred |
— | — | — | — | |||||||||
Amounts paid |
(134 | ) | — | (1,043 | ) | (1,177 | ) | ||||||
Balance as of December 31, 2012 |
$ | 92 | $ | — | $ | 2,042 | $ | 2,134 | |||||
F-35
HANGER, INC.
SCHEDULE II VALUATION AND QUALIFYING ACCOUNTS
Year
|
Classification | Balance at beginning of year |
Additions Charged to Costs and Expenses |
Write-offs | Balance at end of year |
||||||||||
|---|---|---|---|---|---|---|---|---|---|---|---|---|---|---|---|
| (In thousands) |
|
|
|
|
|
||||||||||
2012 |
Allowance for doubtful accounts | $ | 22,028 | $ | 19,773 | $ | 20,422 | $ | 21,379 | ||||||
2011 |
Allowance for doubtful accounts |
$ |
16,686 |
$ |
22,101 |
$ |
16,759 |
$ |
22,028 |
||||||
2010 |
Allowance for doubtful accounts |
$ |
10,526 |
$ |
20,276 |
$ |
14,116 |
$ |
16,686 |
||||||
Year
|
Classification | Balance at beginning of year |
Generated | Utilized/ Released |
Balance at end of year |
||||||||||
|---|---|---|---|---|---|---|---|---|---|---|---|---|---|---|---|
| (In thousands) |
|
|
|
|
|
||||||||||
2012 |
Deferred tax asset valuation allowance | $ | 1,374 | $ | 12 | $ | 167 | $ | 1,219 | ||||||
2011 |
Deferred tax asset valuation allowance |
$ |
828 |
$ |
547 |
$ |
1 |
$ |
1,374 |
||||||
2010 |
Deferred tax asset valuation allowance |
$ |
11,359 |
$ |
23 |
$ |
10,554 |
$ |
828 |
||||||
S-36
| Exhibit No. | Document | ||
|---|---|---|---|
| 3.1 | Restated Certificate of Incorporation of Hanger, Inc., dated August 27, 2012. (Incorporated herein by reference to Exhibit 3.1 to the Current Report on Form 8-K filed by the Registrant on August 27, 2012). | ||
3.2 |
Amended and Restated By-Laws of Hanger Orthopedic Group, Inc., as amended effective February 2, 2012. (Incorporated herein by reference to Exhibit 3.1 to the Current Report on Form 8-K filed by the Registrant on February 6, 2012). |
||
4.1 |
Indenture, dated November 2, 2010, by and among the Hanger Orthopedic Group, Inc., each of the Subsidiary Guarantors party thereto and Wilmington Trust Company, as trustee. (Incorporated herein by reference to Exhibit 4.1 to the Registrant's Current Report on Form 8-K filed on October 29, 2010). |
||
4.3 |
First Supplemental Indenture, dated December 13, 2010, by and among the Hanger Orthopedic Group, Inc., each of the Subsidiary Guarantors party thereto and Wilmington Trust Company, as trustee. (Incorporated herein by reference to Exhibit 4.3 to the Registrant's Annual Report on Form 10-K for the year ended December 31, 2010). |
||
4.4 |
Second Supplemental Indenture, dated February 15, 2011, by and among the Hanger Orthopedic Group, Inc., Accelerated Care Plus Corp., ACP Medical Supply Corporation, Liberty Health Services, LLC and Wilmington Trust Company, as trustee. (Incorporated herein by reference to Exhibit 4.2 to the Registrant's Quarterly Report on Form 10-Q for the quarter ended March 31, 2011). |
||
10.1 |
Amended and Restated 2002 Stock Incentive Plan, as amended through May 10, 2007. (Incorporated herein by reference to Appendix 1 to the Registrant's Proxy Statement, dated April 10, 2007, relating to the Registrant's Annual Meeting of Stockholders held on May 10, 2007).* |
||
10.2 |
Amended and Restated 2003 Non-Employee Directors' Stock Incentive Plan, as amended through May 10, 2007. (Incorporated herein by reference to Appendix 2 to the Registrant's Proxy Statement, dated April 10, 2007, relating to the Registrant's Annual Meeting of Stockholders held on May 10, 2007). |
||
10.3 |
Form of Stock Option Agreement (Non-Executive Employees), Stock Option Agreement (Executive Employees), Restricted Stock Agreement (Non-Executive Employees) and Restricted Stock Agreement (Executive Employees). (Incorporated herein by reference to Exhibits 10.1, 10.2, 10.3 and 10.4, respectively, to the Registrant's Current Report on Form 8-K filed on February 24, 2005).* |
||
10.4 |
Supplemental Executive Retirement Plan, as amended and restated effective January 1, 2011 (Incorporated herein by reference to Exhibit 10.4 to the Registrant's Annual Report on Form 10-K for the year ended December 31, 2010).* |
||
10.8 |
Credit Agreement, dated as of December 1, 2010, among the Company and the lenders and agents party thereto. (Incorporated herein by reference to Exhibit 4.1 to the Registrant's Current Report on Form 8-K filed on December 1, 2010). |
||
10.9 |
Guarantee and Collateral Agreement, dated as of December 1, 2010, made by the Registrant, as Borrower, and certain of its subsidiaries, in favor of Bank of America, N/A., as Administrative Agent. (Incorporated herein by reference to Exhibit 10.9 to the Registrant's Annual Report on Form 10-K for the year ended December 31, 2010). |
||
| Exhibit No. | Document | ||
|---|---|---|---|
| 10.10 | Amendment No. 1, dated as of March 11, 2011, to the Credit Agreement, dated as of December 1, 2010, among the Company and the lenders and gents party hereto. (Incorporated by reference to Exhibit 4.1 to the Current Report on Form 8-K filed by the Registrant on March 11, 2011). | ||
10.11 |
Fourth Amended and Restated Employment Agreement, effective as of January 1, 2012, by and between George E. McHenry and the Company. (Incorporated herein by reference to Exhibit 10.3 to the Registrant's Current Report on Form 8-K filed on January 27, 2012).* |
||
10.12 |
Fourth Amended and Restated Employment Agreement, effective as of January 1, 2012, by and between Richmond L. Taylor and the Company. (Incorporated herein by reference to Exhibit 10.4 to the Registrant's Current Report on Form 8-K filed on January 27, 2012).* |
||
10.13 |
Hanger Orthopedic Group, Inc. 2010 Omnibus Incentive Plan (incorporated herein by reference to Exhibit 10.1 to the Registrant's Quarterly Report on Form 10-Q for the quarter ended June 30, 2010).* |
||
10.14 |
Form of Restricted Stock Agreement for Non-Employee Directors (incorporated herein by reference to Exhibit 10.2 to the Registrant's Quarterly Report on Form 10-Q for the quarter ended June 30, 2010).* |
||
10.15 |
Form of Restricted Stock Agreement for Executives (incorporated herein by reference to Exhibit 10.3 to the Registrant's Quarterly Report on Form 10-Q for the quarter ended June 30, 2010).* |
||
10.16 |
Form of Restricted Stock Agreement for Employees Executives (incorporated herein by reference to Exhibit 10.4 to the Registrant's Quarterly Report on Form 10-Q for the quarter ended June 30, 2010).* |
||
10.17 |
Form of Non-Employee Director Non-Qualified Stock Option Agreement (incorporated herein by reference to Exhibit 10.5 to the Registrant's Quarterly Report on Form 10-Q for the quarter ended June 30, 2010).* |
||
10.18 |
Form of Executive Non-Qualified Stock Option Agreement (incorporated herein by reference to Exhibit 10.6 to the Registrant's Quarterly Report on Form 10-Q for the quarter ended June 30, 2010).* |
||
10.19 |
Form of Non-Qualified Stock Option Agreement (incorporated herein by reference to Exhibit 10.7 to the Registrant's Quarterly Report on Form 10-Q for the quarter ended June 30, 2010).* |
||
10.20 |
Securities Purchase and Lock-Up Agreement, dated October 18, 2010, by and between Hanger Orthopedic Group, Inc. and John B. Breach and Schedule of Substantially Identical Securities Purchase and Lock-Up Agreements Omitted Pursuant to Instruction 2 to Item 601 of Regulation S-K (Incorporated herein by reference to Exhibit 10.1 to the Registrant's Current Report on Form 8-K filed on October 18, 2010). |
||
10.21 |
Amended and Restated Employment Agreement, as of January 1, 2012 by and between Vinit K. Asar and the Company. (Incorporated herein by reference to Exhibit 10.2 to the Registrant's Current Report on Form 8-K filed on January 27, 2012).* |
||
10.22 |
Amended and Restated Employment Agreement, dated as of March 30, 2012, between Thomas E. Hartman and Hanger Prosthetics & Orthotics, Inc. (Filed herewith).* |
||
10.23 |
Second Amended and Restated Employment Agreement, dated August 27, 2012, by and between Vinit K. Asar and Hanger, Inc. (Incorporated herein by reference to Exhibit 10.1 to the Current Report on Form 8-K filed by the Registrant on August 27, 2012).* |
||
10.24 |
Amended and Restated Employment Agreement, dated as of February 25, 2013, by and between Kenneth W. Wilson and Southern Prosthetic Supply, Inc. (Filed herewith).* |
||
| Exhibit No. | Document | ||
|---|---|---|---|
| 21 | List of Subsidiaries of the Registrant. (Filed herewith). | ||
23.1 |
Consent of PricewaterhouseCoopers LLP. (Filed herewith). |
||
31.1 |
Written Statement of the Chief Executive Officer Pursuant to Section 302 of the Sarbanes-Oxley Act of 2002. (Filed herewith). |
||
31.2 |
Written Statement of the Chief Financial Officer Pursuant to Section 302 of the Sarbanes-Oxley Act of 2002. (Filed herewith). |
||
32 |
Written Statement of the Chief Executive Officer and Chief Financial Officer Pursuant to 18 U.S.C. Section 1350, as adopted Pursuant to Section 906 of the Sarbanes-Oxley Act of 2002. (Filed herewith). |
||
101 |
The following financial information from the Company's Annual Report on Form 10-K, for the period ended December 31, 2012, formatted in eXtensible Business Reporting Language: (i) Consolidated Balance Sheets, (ii) Consolidated Statements of Income and Comprehensive Income, (iii) Consolidated Statements of Changes in Shareholders' Equity, (iv) Consolidated Statements of Cash Flows, (v) Notes to Consolidated Financial Statements(1) |
||
- *
- Management contract or compensatory plan