Attached files
| file | filename |
|---|---|
| EX-32 - EXHIBIT 32 - HANGER, INC. | tm2031115d1_ex32.htm |
| EX-31.2 - EXHIBIT 31.2 - HANGER, INC. | tm2031115d1_ex31-2.htm |
| EX-31.1 - EXHIBIT 31.1 - HANGER, INC. | tm2031115d1_ex31-1.htm |
| EX-23 - EXHIBIT 23 - HANGER, INC. | tm2031115d1_ex23.htm |
| EX-21 - EXHIBIT 21 - HANGER, INC. | tm2031115d1_ex21.htm |
| EX-4.2 - EXHIBIT 4.2 - HANGER, INC. | tm2031115d1_ex4-2.htm |
UNITED STATES
SECURITIES AND EXCHANGE COMMISSION
WASHINGTON, D.C. 20549
FORM 10-K
| x | ANNUAL REPORT PURSUANT TO SECTION 13 OR 15(d) OF THE SECURITIES EXCHANGE ACT OF 1934 |
| For the fiscal year ended December 31, 2019 | |
| or | |
| ¨ | TRANSITION REPORT PURSUANT TO SECTION 13 OR 15(d) OF THE SECURITIES EXCHANGE ACT OF 1934 |
|
For the transition period from
to
| |
Commission File Number 1-10670
HANGER, INC.
(Exact name of registrant as specified in its charter)
Delaware
|
84-0904275 (I.R.S. Employer Identification No.) |
| 10910 Domain Drive, Suite 300, Austin, TX (Address of principal executive offices) |
78758 (Zip Code) |
Registrant’s phone number, including area code (512) 777-3800
Securities registered pursuant to Section 12(b) of the Act:
| Title of each class | Trading Symbol | Name of each exchange on which registered |
| Common Stock, par value $0.01 per share | HNGR | New York Stock Exchange |
Securities registered pursuant to Section 12(g) of the Act: None
Indicate by check mark if the registrant is a well-known seasoned issuer, as defined in Rule 405 of the Securities Act. Yes x No ¨
Indicate by check mark if the registrant is not required to file reports pursuant to Section 13 or Section 15(d) of the Act. Yes ¨ No x
Indicate by check mark whether the registrant (1) has filed all reports required to be filed by Section 13 or 15(d) of the Securities Exchange Act of 1934 during the preceding 12 months (or for such shorter period that the registrant was required to file such reports), and (2) has been subject to such filing requirements for the past 90 days. Yes x No ¨
Indicate by check mark whether the registrant has submitted electronically every Interactive Data File required to be submitted pursuant to Rule 405 of Regulation S-T (§232.405 of this chapter) during the preceding 12 months (or for such shorter period that the registrant was required to submit such files). Yes x No ¨
Indicate by check mark whether the registrant is a large accelerated filer, an accelerated filer, a non-accelerated filer, a smaller reporting company, or an emerging growth company. See the definitions of “large accelerated filer,” “accelerated filer,” “smaller reporting company,” and “emerging growth company” in Rule 12b-2 of the Exchange Act.
| Large accelerated filer ¨ | Accelerated filer x | Non-accelerated filer ¨ | Smaller reporting company ¨ | Emerging growth company ¨ |
If an emerging growth company, indicate by check mark if the registrant has elected not to use the extended transition period for complying with any new or revised financial accounting standards provided pursuant to Section 13(a) of the Exchange Act. ¨
Indicate by check mark whether the registrant is a shell company (as defined in Rule 12b-2 of the Exchange Act). Yes ¨ No x
The aggregate market value of common stock held by non-affiliates on June 30, 2019, was approximately $629.1 million.
As of February 29, 2020 the registrant had 37,429,065 shares of its Common Stock outstanding.
DOCUMENTS INCORPORATED BY REFERENCE
Part III of this Form 10-K incorporates information by reference from the registrant’s definitive proxy statement or amendment hereto to be filed within 120 days after the close of the fiscal year covered by this annual report.
INDEX
Hanger, Inc.
i
| ITEM 1. | BUSINESS. |
Business Overview
General
Hanger, Inc. (“the Company,” “we,” “our,” or “us”) is a leading national provider of products and services that assist in enhancing or restoring the physical capabilities of patients with disabilities or injuries. Built on the legacy of James Edward Hanger, the first amputee of the American Civil War, we and our predecessor companies have provided orthotic and prosthetic (“O&P”) services for over 150 years. We provide O&P services, distribute O&P devices and components, manage O&P networks, and provide therapeutic solutions to patients and businesses in acute, post-acute, and clinic settings. We operate through two segments - Patient Care and Products & Services.
Our Patient Care segment is primarily comprised of Hanger Clinic, which specializes in the design, fabrication, and delivery of custom O&P devices through 701 patient care clinics and 111 satellite locations in 46 states and the District of Columbia, as of December 31, 2019. We also provide payor network contracting services to other O&P providers through this segment.
Our Products & Services segment is comprised of our distribution services and therapeutic solutions businesses. As a leading provider of O&P products in the United States, we engage in the distribution of a broad catalog of O&P parts, componentry, and devices to independent O&P providers nationwide. The other business in our Products & Services segment is our therapeutic solutions business, which develops specialized rehabilitation technologies and provides evidence-based clinical programs for post-acute rehabilitation patients at approximately 4,000 skilled nursing and post-acute providers nationwide.
For the years ended December 31, 2019, 2018, and 2017, our net revenues were $1,098.0 million, $1,048.8 million, and $1,040.8 million, respectively. We recorded net income of $27.5 million for the year ended December 31, 2019, and a net loss of $0.9 million and $104.7 million for the years ended December 31, 2018 and 2017, respectively.
The following table summarizes the percentage of net revenues derived from each of our two operating segments:
| For the Years Ended December 31, | ||||||||||||
| 2019 | 2018 | 2017 | ||||||||||
| Patient Care | 82.5 | % | 81.8 | % | 81.9 | % | ||||||
| Products & Services | 17.5 | % | 18.2 | % | 18.1 | % | ||||||
See Note T - “Segment and Related Information” to our consolidated financial statements in this Annual Report on Form 10-K for additional information about our segments.
Industry Overview
We estimate that approximately $4.3 billion is spent in the United States each year for prescription-based O&P products and services through O&P clinics. Orthotic devices, or “orthoses,” are externally applied devices used to modify the structural and functional characteristics of the neuromuscular and skeletal system. These devices typically are provided to patients suffering from musculoskeletal disorders, such as ailments of the back, extremities, or joints; injuries from sports; or conditions such as cerebral palsy, scoliosis, and stroke. Prosthetic devices, or “prostheses,” are artificial devices that replace a missing limb or portion of a limb. These devices are provided to patients with amputated or congenitally absent limbs to replace the function and appearance of a limb so that patients can resume activities of daily living and work. The most prevalent causes for amputations are from complications due to diabetes, trauma associated with accidents, physical injury, or infection.
The industry derives its primary revenue from the evaluation, fabrication, and fitting of custom O&P devices to serve patients needing both new and replacement devices. Additionally, O&P clinics typically provide patients with other non-custom orthotic products, diabetic shoes and inserts, and support patients through the repair and adjustment of their devices.
1
We believe our Patient Care segment currently accounts for approximately 21% of market share, providing a comprehensive portfolio of orthotic, prosthetic, and post-operative solutions to patients in acute, post-acute, and patient care clinic settings. We estimate that the next largest provider of O&P services in the United States is the U.S. Department of Veterans Affairs (the “VA”), which operates 79 O&P clinics on behalf of its covered veteran patients. In addition to serving veterans through their own facilities, in certain markets the VA is also a client of Hanger Clinic. Approximately 10% of Hanger Clinic’s revenue is derived from services provided to veteran patients through contracts with the VA.
The O&P patient care services market is highly fragmented and is typically characterized by regional and local O&P businesses operated predominantly by independent operators, but also including two O&P product manufacturers with international patient care services operations. We estimate that our top ten competitors have an average of approximately 34 clinics each, with the smallest having 22 and the largest having 68 clinics. The remainder of the market is served by individual practitioners and smaller regional or market-based firms with approximately twenty or fewer clinics. Based on this, we do not believe that any single competitor accounts for more than approximately 2% of the nation’s total estimated O&P clinic revenues.
The industry is characterized by stable, recurring revenues, primarily resulting from new patients as well as the need for periodic replacement and modification of O&P devices. We anticipate that the demand for O&P services will continue to grow as the nation’s population increases, and as a result of several trends, including the aging of the U.S. population, there will be an increase in the prevalence of disease-related disability and the demand for new and advanced devices. We believe the typical replacement time for prosthetic devices is three to five years, while the typical replacement time for orthotic devices varies, depending on the device.
We estimate that approximately $1.7 billion is spent in the United States each year by providers of O&P patient care services for the O&P products, components, devices, and supplies used in their businesses. Our Products & Services segment distributes to independent providers of O&P services and to our own patient care clinics. We estimate that our distribution sales account for approximately 8% of the market for O&P products, components, devices, and supplies (excluding sales to our Patient Care segment).
We estimate the market for rehabilitation technologies, integrated clinical programs, and clinician training in skilled nursing facilities (“SNFs”) to be approximately $150 million annually. We currently provide these products and services to approximately 25% of the estimated 15,000 SNFs located in the U.S. We estimate the market for rehabilitation technologies, clinical programs, and training within the broader post-acute rehabilitation markets to be approximately $400 million annually. We do not currently provide a meaningful amount of products and services to this broader market.
Business Strategy
Our goal is to be the provider of choice for patients, referring physicians, and customers seeking products and services that enhance human physical capabilities. Our strategy is to pursue the creation of an integrated therapeutic solutions model that will have a strong focus in custom O&P and immediately adjacent markets to provide our patients and customers with a spectrum of services that address their individual needs. To foster growth, we intend to focus on initiatives that will differentiate Hanger from our competitors.
Government-led health care reform is driving significant changes to our business environment, with focus on lowering health care costs while improving patient outcomes and satisfaction. As a result, our strategy is focused on enhancing the quality of care to elevate patient satisfaction, investing in processes and technologies to measure and report on patient outcomes and connectedness, and further increasing our profile with referring health care providers and payors. In addition, we are committed to reducing the cost of this care by undertaking several initiatives that include establishing device standards that provide the highest function, durability, and comfort at the lowest cost, reconfiguring our supply chain and fabrication processes, streamlining internal administrative processes, and reducing back-office functions performed within patient care clinics.
2
Business Description
Patient Care
Our Patient Care segment employs approximately 1,600 clinical prosthetists, orthotists, and pedorthists, which we refer to as clinicians, substantially all of which are certified by either the American Board for Certification (“ABC”) or the Board of Certification of Orthotists and Prosthetists, which are the two boards that certify O&P clinicians. To facilitate timely service to our patients, we also employ technicians, fitters, and other ancillary providers to assist our clinicians in the performance of their duties. Through this segment, we additionally provide network contracting services to independent providers of O&P.
Patients are typically referred to Hanger Clinic by an attending physician who determines a patient’s treatment and writes a prescription. Our clinicians then consult with both the referring physician and the patient with a view toward assisting in the selection of an orthotic or prosthetic device to meet the patient’s needs. O&P devices are increasingly technologically advanced and custom designed to add functionality and comfort to patients’ lives, shorten the rehabilitation process, and lower the cost of rehabilitation.
Based on the prescription written by a referring physician, our clinicians examine and evaluate the patient and either design a custom device or, in the case of certain orthotic needs, utilize a non-custom device, including, in appropriate circumstances, an “off the shelf” device, to address the patient’s needs. When fabricating a device, our clinicians ascertain the specific requirements, componentry, and measurements necessary for the construction of the device. Custom devices are constructed using componentry provided by a variety of third party manufacturers that specialize in O&P, coupled with sockets and other elements that are fabricated by our clinicians and technicians, to meet the individual patient’s physical and ambulatory needs. Our clinicians and technicians typically utilize castings, electronic scans, and other techniques to fabricate items that are specialized for the patient. After fabricating the device, a fitting process is undertaken and adjustments are made to ensure the achievement of proper alignment, fit, and patient comfort. The fitting process often involves several stages to successfully achieve desired functional and cosmetic results.
Given the differing physical weight and size characteristics, location of injury or amputation, capability for physical activity and mobility, cosmetic, and other needs of each individual patient, each fabricated prosthesis and orthosis is customized for each particular patient. These custom devices are commonly fabricated at one of our regional or national fabrication facilities.
We have earned a reputation within the O&P industry for the development and use of innovative technology in our products, which has increased patient comfort and capability and can significantly enhance the rehabilitation process. Frequently, our proprietary Insignia scanning system is used in the fabrication process. The Insignia system scans the patient and produces an accurate computer-generated image, resulting in a faster turnaround for the patient’s device and a more professional overall experience.
In recent years, we have established a centralized revenue cycle management organization that assists our clinics in pre-authorization, patient eligibility, denial management, collections, payor audit coordination, and other accounts receivable processes.
The principal reimbursement sources for our services are:
| • | Commercial private payors and other non-governmental organizations, which consist of individuals, rehabilitation providers, commercial insurance companies, health management organizations (“HMOs”), preferred provider organizations (“PPOs”), hospitals, vocational rehabilitation centers, workers’ compensation programs, third party administrators, and similar sources; |
| • | Medicare, a federally funded health insurance program providing health insurance coverage for persons aged 65 or older and certain persons with disabilities; |
3
| • | Medicaid, a health insurance program jointly funded by federal and state governments providing health insurance coverage for certain persons based upon financial need, regardless of age, which may supplement Medicare benefits for persons aged 65 or older in financial need; and |
| • | the U.S. Department of Veterans Affairs. |
We typically enter into contracts with third party payors that allow us to perform O&P services for a referred patient and to be paid under the contract with the third party payor. These contracts usually have a stated term of one to three years. These contracts generally may be terminated without cause by either party on 60 to 90 days’ notice, or on 30 days’ notice if we have not complied with certain licensing, certification, program standards, Medicare or Medicaid requirements, or other regulatory requirements. Reimbursement for services is typically based on a fee schedule negotiated with the third party payor that reflects various factors, including market conditions, geographic area, and number of persons covered. Many of our commercial contracts are indexed to the commensurate Medicare fee schedule that relates to the products or services being provided.
Government reimbursement, comprised of Medicare, Medicaid, and the VA, in the aggregate, accounted for approximately, 57.5%, 56.5%, and 54.8% of our net revenue in 2019, 2018, and 2017, respectively. These payors set maximum reimbursement levels for O&P services and products. Medicare prices are adjusted each year based on the Consumer Price Index for All Urban Consumers (“CPI-U”) unless Congress acts to change or eliminate the adjustment. The CPI-U is adjusted further by an efficiency factor (the “Productivity Adjustment” or the “Multi-Factor Productivity Adjustment”) in order to determine the final rate adjustment each year. The Medicare price adjustments for 2020, 2019, 2018, and 2017 were 0.9%, 2.3%, 1.1%, and 0.7%, respectively. There can be no assurance that future adjustments will not reduce reimbursements for O&P services and products from these sources.
We, and the O&P industry in general, are subject to various Medicare compliance audits, including Recovery Audit Contractor (“RAC”) audits, Comprehensive Error Rate Testing (“CERT”) audits, Targeted Probe and Educate (“TPE”) audits, Zone Program Integrity Contractor (“ZPIC”) audits, Supplemental Medical Review Contractor (“SMRC”) audits, and Universal Payment Identification Code (“UPIC”) audits. TPE audits are generally pre-payment audits, while RAC, CERT, ZPIC, and SMRC audits are generally post-payment audits. UPIC audits can be both pre- or post-payment audits, with a majority currently pre-payment. TPE audits replaced the previous Medicare Administrative Contractor audits. Adverse post-payment audit determinations generally require Hanger to reimburse Medicare for payments previously made, while adverse pre-payment audit determinations generally result in the denial of payment. In either case, we can request a redetermination or appeal, if we believe the adverse determination is unwarranted, which can take an extensive period of time to resolve, currently up to six years or more.
Products & Services
Through our wholly-owned subsidiary, Southern Prosthetic Supply, Inc. (“SPS”), we distribute O&P components to independent O&P clinics and other customers. Through our wholly-owned subsidiary, Accelerated Care Plus Corp. (“ACP”), our therapeutic solutions business is a leading provider of rehabilitation technologies and integrated clinical programs to skilled nursing and post-acute rehabilitation providers. Our value proposition is to provide our customers with a full-service “total solutions” approach encompassing proven medical technology, evidence-based clinical programs, and ongoing consultative education and training. Our services support increasingly advanced treatment options for a broader patient population and more medically complex conditions. We currently serve approximately 4,000 skilled nursing and post-acute providers nationwide.
Through our internal “supply chain” organization, we purchase, warehouse, and distribute over 450,000 SKUs from more than 300 different manufacturers through SPS or directly to our own clinics within our Patient Care segment. Our warehousing and distribution facilities in Nevada, Georgia, Illinois, Pennsylvania, and Texas provide us with the ability to deliver products to the vast majority of our customers in the United States within two business days. Through our SureFit subsidiary, we also manufacture and sell therapeutic footwear for diabetic patients in the podiatric market. We also operate the Hanger Fabrication Network, which fabricates custom O&P devices for our patient care clinics as well as for independent O&P clinics.
4
Our supply chain organization enables us to:
| • | centralize our purchasing and thus lower our material costs by negotiating purchasing discounts from manufacturers; |
| • | better manage our patient care clinic inventory levels and improve inventory turns; |
| • | improve inventory quality control; |
| • | encourage our patient care clinics to use the most clinically appropriate products; and |
| • | coordinate new product development efforts with key vendors. |
Competition
The business of providing O&P patient care services is highly competitive in the markets in which we operate. In the prosthetic business, we compete with regional and local O&P providers for referrals from physicians, therapists, employers, HMOs, PPOs, hospitals, rehabilitation centers, out-patient clinics, and insurance companies on both a local and regional basis. In the orthotic business, we compete with other patient care service providers, including device manufacturers that have independent sales forces, on the basis of quality and timeliness of patient care, location of patient care clinics, and pricing for services. Additionally, two international O&P product manufacturers each own regional and local O&P patient care services business in the United States.
Although we serve a significant portion of the O&P patient care market, referral decisions made by surgeons, physicians, and other medical providers are generally made on a local basis, based on their individual evaluation of the relative quality of care provided by us and our local market competitors. Therefore, our national scale may not provide a competitive advantage in any particular market in which we operate.
We also compete with regional and local O&P providers for the retention and recruitment of qualified O&P clinicians. In some markets, the demand for clinicians exceeds the supply of qualified personnel.
Our Products & Services segment competes with other distributors, manufacturers that sell their products directly, and providers of equipment and services on a regional and national basis that have similar sales forces and products. Some of our distributor competitors are also dedicated to the O&P industry, but many others are large medical product distributors who also distribute O&P products, particularly orthotic products.
Competitive Strengths
We believe that the combination of the following competitive strengths will help us to grow our businesses by increasing our net revenues, net income and market share:
| • | Leading market position in both the O&P market place and the post-acute rehabilitation markets; |
| • | National scale of operations, which better enables us to: |
| • | establish our brand name and generate economies of scale; |
| • | identify and implement best practices throughout our organization; |
| • | consistently apply the rigorous claims documentation standards required for reimbursement and facilitate reimbursement through a revenue cycle management organization; |
| • | collect, aggregate, and publish our statistically significant clinical outcomes and patient satisfaction data and metrics; |
5
| • | offer a single network solution to national and regional shared fabrication facilities; |
| • | identify, test, and deploy emerging technology; and |
| • | increase our influence on, and input into, regulatory trends; |
| • | Distribution of, and purchasing power for, O&P components and finished O&P products, which better enables us to: |
| • | negotiate greater purchasing discounts from manufacturers and freight providers; |
| • | manage Hanger Clinic inventory levels on a national scale through centralized purchasing controls; |
| • | access prefabricated and finished O&P products; |
| • | promote the usage by our patient care clinics of products that have met or exceeded Hanger Clinic standards of quality and patient care that also expand our profit margins; and |
| • | expand the external client base of the distribution business in our Products & Services segment; |
| • | Proven ability to rapidly incorporate technological advances in the fitting and fabrication of O&P devices; |
| • | History of integrating small and medium sized O&P business acquisitions, including 147 O&P businesses between 1997 and 2019, representing over 400 patient care clinics; |
| • | Highly trained clinicians, with whom we provide the highest level of continuing education and training through programs designed to inform them of the latest technological developments in the O&P industry; |
| • | Experienced and committed management team; and |
| • | Beneficial government relations efforts, which enable us to educate legislators on the medical benefits and cost effectiveness of O&P services. |
Suppliers
We purchase prefabricated O&P devices, components, and materials from hundreds of suppliers across the country, which are utilized by our clinicians and technicians in the fabrication of O&P products. These devices, components, and materials are used in the products we offer in our patient care clinics throughout the United States. As of December 31, 2019, one supplier accounted for 10% or more of our annual purchases, with 10.6%.
Sales and Marketing
In our Patient Care segment, primarily through their interaction with and provision of prosthetic or orthotic services to the patients of referring surgeons, physicians, and other providers, our individual clinicians in local patient care clinics historically have conducted our sales and marketing efforts. Due primarily to the fragmented nature of the O&P industry, the success of a particular patient care clinic has been largely a function of its local reputation for quality of care, responsiveness, and length of service in the local communities.
6
To augment the efforts of the business segment personnel, we have developed a centralized sales and marketing department whose efforts target the following:
| • | Marketing and Public Relations. Our objective is to increase the visibility of the “Hanger” brand by building relationships with major referral sources. We also continue to explore creating alliances with certain vendors to market products and services on a nationwide basis. |
| • | Business Development. We have dedicated personnel in most of our operating regions who are responsible for arranging seminars, clinics, and forums to educate and consult with patients and to increase the local community’s awareness of the “Hanger” brand. These business development managers also meet with local referral and contract sources to help our clinicians develop new relationships in their markets. |
| • | Insurance Contracts. Our specialty health care company, Linkia, works with national insurance companies to help manage their O&P networks. Linkia is a network management organization dedicated solely to the O&P industry to improve the interface between payors and O&P providers by simplifying network management and administration, in-depth industry expertise, and scalability to payors. |
Marketing of our services is conducted on a national basis through a dedicated sales force, print and e-commerce catalogs, and exhibits at industry and medical meetings and conventions. We use directed marketing to segments of the health care industry, such as orthopedic surgeons, vascular surgeons, physical and occupational therapists, patient care managers, and podiatrists, by providing specialized catalogs focused on their medical specialty.
In our Products & Services segment, we employ dedicated sales professionals that call on independent O&P providers and are generally responsible for a geographic region or a specific product line.
Acquisition Strategy
Our strategy is to achieve long-term growth through disciplined diversification of our revenue streams, including geographic expansion or the broadening of our continuum of care through the acquisitions of high quality O&P providers. One of the primary drivers in executing our acquisition strategy is expanding our ability to serve new patients in new geographic markets.
Once an acquisition is consummated, we integrate and generally centralize certain key functions including IT, marketing, sales, finance, and administration to ensure that we can optimize cross-selling opportunities and realize cost efficiencies.
In certain of our historical acquisitions, in addition to cash paid at closing, the purchase price has included unsecured subordinated promissory notes (“Seller Notes”) and contingent consideration terms (“earnouts”) associated with the achievement of certain designated collection targets for the acquired business. Earnouts can be used to compromise between our valuation and seller’s expectations regarding purchase price, while providing protection from our overpayment if historical collections are not an accurate indicator of post-closing financial performance of the acquired business. Currently, there are no outstanding earnouts related to our historical acquisitions.
Our evaluation of the acquired business is based on various factors, including specialized know-how, reputation, geographic coverage, competitive position, and service and product offerings, as well as our experience and judgment.
7
Acquisition Activity
During 2019, we completed the following acquisitions of O&P clinics, none of which were individually material to our financial position, results of operations, or cash flows:
| • | In the first quarter of 2019, we completed the acquisition of all the outstanding equity interests of an O&P business for total consideration of $32.8 million, of which $27.7 million was cash consideration, net of cash acquired, $4.4 million was issued in the form of notes to shareholders at fair value, and $0.7 million in additional consideration. |
| • | In the second quarter of 2019, we completed the acquisition of all the outstanding equity interests of an O&P business for total consideration of $0.5 million, of which $0.2 million was cash consideration, net of cash acquired, and $0.3 million was issued in the form of notes to shareholders at fair value. |
| • | In the third quarter of 2019, we completed the acquisition of all the outstanding equity interests of one O&P business and acquired the assets of another O&P business for total consideration of $3.3 million, of which $3.0 million was cash consideration, net of cash acquired, and $0.3 million was issued in the form of notes to shareholders at fair value. |
| • | In the fourth quarter of 2019, we completed the acquisition of all the outstanding equity interests of one O&P business and acquired the assets of another O&P business for total consideration of $7.8 million, of which $5.0 million was cash consideration, net of cash acquired, and $2.8 million was issued in the form of notes to shareholders at fair value. |
In the fourth quarter of 2018, we completed the acquisitions of two O&P businesses for an aggregate purchase price of $3.1 million. The purchase price consisted of $2.0 million in cash consideration, net of cash acquired, and $1.1 million was issued in unsecured notes to the seller. We made no acquisitions in the first nine months of 2018 or in the year of 2017.
Acquisition-related costs are included in general and administrative expenses in our consolidated statements of operations. Total acquisition-related costs incurred during the year ended December 31, 2019 were $1.5 million, which includes those costs for transactions that were in progress or not completed during the respective period. Acquisition-related costs incurred for acquisitions completed during the year ended December 31, 2019 were $1.0 million.
Government Regulation
The operations of our business are subject to a variety of federal, state, and local governmental regulations. We make compliance with applicable regulations a corporate priority through, among other things, our compliance programs, policies and procedures, manuals, and personnel training. Despite these efforts, we cannot provide assurance that we will be in absolute compliance with all regulations at all times. Failure to comply with applicable governmental regulations may result in significant penalties, including exclusion from the Medicare and Medicaid programs, which would have a material adverse effect on our business and financial results.
Fraud and Abuse. Violations of fraud and abuse laws are punishable by criminal and/or civil sanctions, including, in some instances, False Claims Act liability (discussed below), imprisonment, and exclusion from participation in federal health care programs, including Medicare, Medicaid, VA health programs, and the Department of Defense’s TRICARE program, formerly known as CHAMPUS. These laws, which include but are not limited to federal and state anti-kickback laws, false claims laws, physician self-referral laws, and federal criminal health care fraud laws, are discussed in further detail below. We believe our billing practices, operations, and compensation and financial arrangements with referral sources and others materially comply with applicable federal and state requirements. However, we cannot assure that such requirements will always be interpreted by a governmental authority in a manner consistent with our interpretation and application. The failure to comply with any of these requirements, even if inadvertent, could require us to alter our operations with and/or refund payments to the governmental authority. Such refunds could be significant and could also lead to the imposition of significant penalties. Even if we successfully defend against any action against us for violation of these laws or regulations, we would likely be forced to incur significant legal expenses and divert our management’s attention from the operation of our business. Any of these actions, individually or in the aggregate, could have a material adverse effect on our business and financial results.
8
Anti-Kickback Laws. Our operations are subject to federal and state anti-kickback laws. The federal Anti-Kickback Statute (Section 1128B(b) of the Social Security Act) prohibits persons or entities from knowingly and willfully soliciting, offering, receiving, or paying any remuneration in any form (including any kickback, bribe, or rebate) in return for, or to induce, the referral of persons eligible for benefits under a federal health care program (including Medicare, Medicaid, the VA health programs, and TRICARE), or the ordering, purchasing, leasing, or arranging for, or the recommendation of purchasing, leasing, or ordering of, items or services that may be paid for, in whole or in part, by a federal health care program. Courts have held that the statute may be violated when even one purpose (as opposed to a primary or sole purpose) of the remuneration is to induce referrals or other business.
Recognizing that the Anti-Kickback Statute is broad and may technically prohibit beneficial commercial arrangements, the Office of Inspector General of the Department of Health and Human Services has developed regulations addressing certain business arrangements that will offer protection from scrutiny under the Anti-Kickback Statute. These “Safe Harbors” describe activities which may be protected from prosecution under the Anti-Kickback Statute, provided that they meet all of the requirements of the applicable Safe Harbor regulation. For example, the Safe Harbors cover activities such as offering discounts to health care providers and contracting with physicians or other individuals or entities that have the potential to refer business to us that would ultimately be billed to a federal health care program, so long as the discount is properly disclosed and appropriately reflected in any claims or charges.
Failure to qualify for Safe Harbor protection does not mean that an arrangement is illegal. Rather, the facts and circumstances of the arrangement must be analyzed to determine whether there is improper intent to pay or receive remuneration in return for referrals. Conduct and business arrangements that do not fully satisfy one of the Safe Harbors may result in increased scrutiny by government enforcement authorities. In addition, some states have anti-kickback laws that vary in scope and may apply regardless of whether a federal health care program is involved.
Our operations and business arrangements include, for example, discount programs or other financial arrangements with individuals and entities, such as lease arrangements with hospitals and certain participation agreements. Therefore, our operations and business arrangements are required to comply with the anti-kickback laws. Although our business arrangements and operations may not always satisfy all the criteria of a Safe Harbor, we make compliance with federal and state anti-kickback statutes a corporate priority. Nonetheless, we cannot assure that the government’s interpretation of a Safe Harbor provision will always be consistent with our own, and our arrangements may be subject to scrutiny under anti-kickback laws. Noncompliance with such laws can result in a number of enforcement actions, including the imposition of civil monetary penalties and exclusion from federal health care programs.
State anti-kickback laws may extend similar anti-kickback prohibitions to other payors, including commercial payors, and these state laws do not always contain the same safe harbors as the federal regulatory scheme.
Medical Device Regulation. We provide, distribute, and lease products that are subject to regulation as medical devices by the U.S. Food and Drug Administration (“FDA”) under the Federal Food, Drug and Cosmetic Act (“FDCA”) and accompanying regulations. In our Patient Care segment, with the exception of two products which have been cleared for marketing as prescription medical devices under section 510(k) of the FDCA, we believe that the products we provide, including O&P medical devices, accessories, and components, are not Class III devices and thus are exempt from the FDA’s regulations for pre-market clearance or approval requirements and from most requirements relating to the quality system regulation (except for certain record keeping and complaint handling requirements). In our Products & Services segment, ACP manufactures, leases, and sells a number of rehabilitation devices that have been cleared or approved for marketing under section 510(k) of the FDCA, and are subject to the requirements of the quality system regulation. All of our device businesses are required to adhere to regulations for medical devices regarding adverse event reporting, establishment registration, and product listing, and we are subject to inspection by the FDA for compliance with all applicable requirements. Labeling and promotional materials also are subject to scrutiny by the FDA and, in certain circumstances, by the Federal Trade Commission. Our medical device operations are subject to inspection by the FDA for compliance with applicable FDA requirements, and the FDA has in the past raised compliance concerns in connection with these investigations. We make compliance with applicable FDA requirements a corporate priority, but we cannot assure that we will be found to be in compliance at all times. Noncompliance could result in a variety of civil and/or criminal enforcement actions, including issuance of a Warning Letter, seizure, examination, and inspection of our products and a civil injunction or criminal prosecution, which could have a material adverse effect on our business and results of operations.
9
Physician Self-Referral Laws. We are also subject to federal and state physician self-referral laws. With certain exceptions, the federal Medicare physician self-referral law (the “Stark Law”) (Section 1877 of the Social Security Act) prohibits a physician from referring Medicare beneficiaries to an entity for “designated health services” including durable medical equipment and supplies, and prosthetic and orthotic devices and supplies, if the physician or the physician’s immediate family member has a financial relationship with the entity. A financial relationship includes both ownership or investment interests and compensation arrangements. An entity that furnishes designated health services pursuant to a prohibited referral may not present or cause to be presented a claim or bill for such designated health services. Penalties for violating the Stark Law include denial of payment for the service, an obligation to refund any payments received, civil monetary penalties, potential False Claims Act litigation, and the possibility of being excluded from the Medicare or Medicaid programs.
Despite the general prohibition on such physician financial relationships, the Stark Law does provide a number of exceptions from liability. For example, with respect to ownership/investment interests, there is an exception under the Stark Law for referrals made to a publicly traded entity in which the physician or the physician’s immediate family member has an investment interest if the entity’s shares are generally available to the public at the time of the designated health service referral, and are traded on certain exchanges, including among others the New York Stock Exchange (“NYSE”). We meet these tests and, therefore, believe that referrals from physicians who have ownership interests in our stock, or whose immediate family members have ownership interests in our stock, should not result in liability under the Stark Law.
With respect to compensation arrangements, there are exceptions under the Stark Law that permit physicians to maintain certain business arrangements, such as personal service contracts and equipment or space leases, with health care entities to which they refer patients for designated health services. All of the elements of a Stark Law exception must be met in order for the exception to apply. Further, unlike the Anti-Kickback Statute, under the Stark Law, liability can result without specific intent to induce referrals. We strive to assure that our compensation arrangements with physicians comply with the Stark Law, either because the physician’s relationship fits fully within a Stark Law exception or because the physician does not generate prohibited referrals. If, however, we receive a prohibited referral, our submission of a bill for services rendered pursuant to such a referral could subject us to sanctions under the Stark Law and applicable state self-referral laws, including false claims liability, potential exclusion, and imposition of civil monetary penalties. State self-referral laws may extend the prohibitions of the Stark Law to Medicaid beneficiaries, and there are some indications that the federal government may similarly expand the reach of the law, including certain adverse court decisions, to which we were not a party.
False Claims Laws. We are also subject to federal and state laws prohibiting individuals or entities from knowingly presenting, or causing to be presented, claims for payment to third party payors (including Medicare and Medicaid) that are false or fraudulent, are for items or services not provided as claimed, or otherwise contain misleading information. Our revenue cycle management function is responsible for the preparation of documents for the submission of reimbursement claims to third party payors for items and services furnished to patients. In addition, our personnel may, in some instances, provide advice on billing and reimbursement to purchasers of our products. Also, prosecutors and so-called “qui tam” relators (whistleblowers) may claim that a regulatory violation or wrongfully-retained overpayment may be the basis of False Claims Act litigation. Successful relators can receive a share of the recovery in a False Claims Act case ranging from 15% to 30%, depending on whether the government “intervenes” in the case. Penalties in a False Claims Act case may include double or triple damages plus penalties ranging from $11,463 to $23,331 per claim. While we endeavor to assure that our billing practices comply with applicable laws, if claims submitted to payors are deemed to be false, fraudulent, or for items or services not provided as claimed, we may face liability for presenting or causing to be presented such claims.
Certification and Licensure. Our clinicians and/or certain operating units may be subject to certification or licensure requirements under the laws of some states. Most states do not require separate licensure for clinicians. However, several states currently require clinicians to be certified by an organization such as the ABC. The ABC conducts a certification program for clinicians and an accreditation program for patient care clinics. The minimum requirements for new certified clinicians are a college degree, completion of an accredited master’s degree program, residency at a patient care clinic under the supervision of a certified clinician, and successful completion of certain examinations. Certified clinicians are required to participate in a prescribed number of hours of specialized continuing education courses to maintain their certifications. Minimum requirements for an accredited patient care clinic include the presence of a certified clinician and specific site and equipment requirements.
10
While we make compliance with state licensure requirements a corporate priority, we cannot assure that we will be in compliance at all times with these requirements, or how they may be interpreted or re-interpreted by the various state and local agencies. Failure to comply with state licensure requirements could result in suspension or termination of licensure, civil penalties, termination of our Medicare and Medicaid agreements, and repayment of amounts received from Medicare and Medicaid for services and supplies furnished by an unlicensed individual or entity.
Confidentiality and Privacy Laws. The Administrative Simplification Provisions of the Health Insurance Portability and Accountability Act (“HIPAA”), and their implementing regulations, set forth privacy standards and implementation specifications concerning the use and disclosure of individually identifiable health information (referred to as “protected health information”) by health plans, health care clearinghouses, and health care providers that transmit health information electronically in connection with certain standard transactions (“Covered Entities”). HIPAA further requires Covered Entities to protect the confidentiality of protected health information by meeting certain security standards and implementation specifications. In addition, under HIPAA, Covered Entities that electronically transmit certain administrative and financial transactions must utilize standardized formats and data elements. HIPAA imposes civil monetary penalties for noncompliance, and criminal penalties for knowing violations of the privacy standards; violations of such standards committed under false pretenses; or with the intent to sell, transfer, or use protected health information for commercial advantage. Certain agents of Covered Entities (“business associates”) also have HIPAA responsibilities and liabilities. We have business associates and are business associates to other Covered Entities. We believe that we are subject to the Administrative Simplification Provisions of HIPAA and have made it a corporate priority to meet applicable standards and implementation specifications. The new requirements have had a significant effect on the manner in which we handle health data and communicate with payors.
In addition, state confidentiality and privacy laws may impose civil and/or criminal penalties for certain unauthorized or other uses or disclosures of protected health information. We are also subject to these laws. While we endeavor to assure that our operations comply with applicable laws governing the confidentiality and privacy of protected health information, we could face liability in the event of a use or disclosure of protected health information in violation of one or more of these laws.
Personnel and Training
None of our employees are subject to a collective bargaining agreement. We believe that we have satisfactory relationships with our approximately 4,800 employees and strive to maintain these relationships by offering competitive benefit packages, training programs, and opportunities for advancement.
We provide a series of ongoing training programs to improve the professional knowledge of our clinicians. For example, we have an annual education fair that is attended by our clinicians, leaders, and other employees. This annual meeting consists of lectures and seminars covering many clinical topics including the latest technology and process improvements, business courses, and other courses that allow the clinicians to fulfill their ongoing continuing education requirements.
Insurance
We currently maintain insurance coverage for professional liability, product liability, general liability, directors’ and officers’ liability, workers’ compensation, executive protection, property damage, and other lines of insurance. Our general liability insurance coverage is $1.0 million per occurrence, with a $25.0 million umbrella insurance policy. The coverage for professional liability, product liability, and workers’ compensation is self-insured with both individual specific claim and aggregate stop-loss policies to protect us from either significant individual claims or dramatic changes in our loss experience. Based on our experience and prevailing industry practices, we believe our coverage is adequate as to risks and amount.
11
Our Website
Our website is http://www.hanger.com. We make available free of charge, on or through our website, our Annual Report on Form 10-K, Current Reports on Form 8-K, Section 16 filings (i.e., Forms 3, 4 and 5), proxy statements, and other documents as required by applicable law and regulations as soon as reasonably practicable after electronically filing such reports with the U.S. Securities and Exchange Commission (“SEC”). The SEC maintains an Internet site (http://www.sec.gov) that contains reports, proxy and information statements, and other information regarding issuers that file electronically with the SEC. Our website also contains the charters of the Audit Committee, Corporate Governance and Nominating Committee, Compensation Committee, and Quality, Technology, Compliance and Outcomes Committee of our Board of Directors; our Code of Business Conduct and Ethics for Directors and Employees, which includes our principal executive, financial, and accounting officers; as well as our Corporate Governance Guidelines. Information contained on our website is not part of this report.
Information About Our Executive Officers
The following tables set forth information regarding our current executive officers. The ages listed for all executive officers are as of December 31, 2019.
| Name | Age | Office with the Company | ||
| Vinit K. Asar | 53 | President and Chief Executive Officer | ||
| Samuel M. Liang | 57 | Executive Vice President of Hanger, Inc., President and Chief Operating Officer of Hanger Prosthetics & Orthotics, Inc. (dba Hanger Clinic) | ||
| Thomas E. Kiraly | 59 | Executive Vice President and Chief Financial Officer | ||
| C. Scott Ranson | 55 | Executive Vice President, Corporate Services and Chief Information Officer | ||
| Regina Weger | 47 | President of Southern Prosthetic Supply | ||
| James H. Campbell | 61 | Senior Vice President and Chief Clinical Officer | ||
| Thomas E. Hartman | 57 | Senior Vice President, General Counsel and Secretary | ||
| Mitchell D. Dobson | 48 | Senior Vice President and Chief Compliance Officer | ||
| Keri L. Jolly | 52 | Senior Vice President and Chief Human Resources Officer | ||
| Gabrielle B. Adams | 51 | Vice President and Chief Accounting Officer |
Vinit K. Asar has been our Chief Executive Officer and President since May 2012, and served as our President and Chief Operating Officer from September 2011 to May 2012. Mr. Asar also served as our Executive Vice President and Chief Growth Officer from December 2008 to September 2011. Mr. Asar came to Hanger from the Medical Device & Diagnostic sector at Johnson & Johnson, having worked at the Ethicon, Ethicon-Endo-Surgery, Cordis and Biosense Webster franchises. During his eighteen year career at Johnson & Johnson, Mr. Asar held various roles of increasing responsibility in Finance, Product Development, Manufacturing, and Marketing and Sales in the United States and in Europe. Prior to joining Hanger, Mr. Asar was the Worldwide Vice-President at Biosense Webster, the Electrophysiology division of Johnson & Johnson, responsible for the Worldwide Sales, Marketing and Services organizations. Mr. Asar has a B.S.B.A from Aquinas College and a M.B.A. from Lehigh University.
Samuel M. Liang has been our Executive Vice President since May 2016, and has been the President and Chief Operating Officer of Hanger Prosthetics & Orthotics, Inc. (dba Hanger Clinic), our patient care subsidiary, since September 2014. Mr. Liang joined Hanger in May 2014. Between May 2010 and May 2014, Mr. Liang was a Senior Vice President of Bayer HealthCare where he served as President and CEO of MEDRAD, Inc. and Head of the Radiology & Interventional business. Prior to that, he served as President and Chief Executive Officer of Vascular Therapies, LLC, a company that created a combination drug and device product for vascular surgery. Mr. Liang also held numerous leadership positions over 24 years at Cordis Corporation, a Johnson & Johnson company. Mr. Liang earned a B.S.E. degree in mechanical engineering and material sciences from Duke University, North Carolina, and a Master’s Degree in Management from the Kellogg Graduate School of Management, Northwestern University, Illinois.
12
Thomas E. Kiraly has been our Executive Vice President and Chief Financial Officer since January 2015. Mr. Kiraly joined Hanger in October 2014 as Executive Vice President. Prior to joining Hanger, Mr. Kiraly served as the Executive Vice President, Chief Financial Officer and Treasurer of Sheridan Healthcare, Inc., a provider of anesthesia, radiology, emergency department, and neonatology services from 2013 to 2014. From 1999 to 2011, Mr. Kiraly served as Executive Vice President, Chief Financial Officer and Treasurer and led the financial accounting, procurement and real estate functions of Concentra, Inc., a provider of urgent care, occupational health care, and other health care services. In 2010, when Concentra, Inc. was acquired by Humana, Inc., a Fortune 100 provider of insurance, health and wellbeing and related health care services, Mr. Kiraly transitioned to the position of Vice President of Finance for Humana, responsible for corporate financial forecasting, analysis, internal reporting, and accounting operations until 2013. From 1988 to 1999, Mr. Kiraly served as Executive Vice President and Chief Financial Officer of BRC Holdings, Inc., where he led the financial accounting, human resources and legal functions of this publicly-traded provider of information technology services to health care firms and local governments. Mr. Kiraly earned his Master of Business Administration from the University of Texas in Austin, Texas and his Bachelor of Arts in Speech Communication from California State University in Northridge, California.
C. Scott Ranson has been our Executive Vice President, Corporate Services and Chief Information Officer since May 2018. He joined Hanger as Senior Vice President and Chief Information Officer in July 2015. Mr. Ranson joined Hanger after 14 years of service as the Chief Information Officer for Brookdale Senior Living Inc., a publicly traded senior housing solution provider, from 2001 to June 2015. Previously, Mr. Ranson served as the Director of Software for Marketing Specialists Company, where he led the successful implementation of an ERP system and e-commerce strategies, and as Vice President of Information Technology for Atlas Marketing Company, Inc. Mr. Ranson earned his Bachelor of Science degree in Business Administration, Business Management, Computer Information Systems from Ashland University in Ohio.
Regina A. Weger is our President of Southern Prosthetic Supply (“SPS”) within our products & services segment, having assumed the role in December 2019. Ms. Weger has been with Hanger for over 20 years and most recently served as Vice President and General Manager responsible for the daily operational business activities. Previously, she had roles of Vice President, Sales and Marketing and Director of Sales, leading the functions of sales, marketing, and customer service. Ms. Weger was also appointed to the board of directors for the National Association for the Advancement of Orthotics and Prosthetics for 2020. She attended Brenau University in Gainesville, Georgia.
James H. Campbell, PhD. has been our Senior Vice President and Chief Clinical Officer since October 2018. Previously, he held the position of Chief Clinical Officer since joining Hanger in 2015. Prior to joining Hanger, Dr. Campbell spent seventeen years with Becker Orthopedic, a leading world-wide supplier of orthotic components and central fabrication, and has forty years of experience in the Orthotics and Prosthetics profession with distinction in leadership and research. Dr. Campbell is a named inventor on five issued U.S. Patents, and has served on the Board of Directors of the American Orthotic and Prosthetic Association as well as the American Academy of Orthotists & Prosthetists (“AAOP”), from which he received the Distinguished Practitioner Award in February 2013. Dr. Campbell is a Certified Orthotist, a Fellow of the AAOP, and a member of the International Society for Prosthetics & Orthotics. Dr. Campbell holds a Higher Diploma in Prosthetics and Orthotics and a PhD in Bio-Engineering from the University of Strathclyde in Glasgow, Scotland.
Thomas E. Hartman is our Senior Vice President, General Counsel and Secretary. He was appointed Senior Vice President in 2015 and Secretary in 2014, and has served as Vice President and General Counsel since 2009. Mr. Hartman joined Hanger from Foley & Lardner, LLP where he was a partner in Foley’s Business Law Department. Mr. Hartman’s practice at Foley was focused on securities transactions, securities law compliance, mergers and acquisitions, and corporate governance. Prior to joining Foley in 1995, Mr. Hartman was a business law associate at Jones Day. Mr. Hartman received his J.D. from the University of Wisconsin in Madison, and a Bachelor of Science in Engineering (Industrial & Operations Engineering) from the University of Michigan in Ann Arbor.
Mitchell D. Dobson has been our Senior Vice President and Chief Compliance Officer since October 2018. Mr. Dobson has been with Hanger for twenty-four years, and most recently served as the Vice President and Compliance Officer for Hanger’s patient care segment. He previously held various compliance and regulatory-related roles within Hanger. Mr. Dobson is also a certified prosthetist/orthotist, and practiced as a clinician for more than a decade. He is currently a Fellow of the American Academy of Orthotists and Prosthetists. Mr. Dobson holds a Bachelor of Science in Prosthetics and Orthotics from the University of Texas Southwestern Medical Center at Dallas and a Certificate in Healthcare Compliance from The George Washington University.
13
Keri L. Jolly joined Hanger, Inc. as Senior Vice President and Chief Human Resources Officer in July 2018. Ms. Jolly previously served as senior vice president, human resources at Baylor Scott & White Health, a private healthcare provider, from May 2016 to November 2017. Prior to that, Ms. Jolly served as the chief human resources officer for Global Power Equipment Group, a public global manufacturing and services company, from October 2014 to May 2016. From September 2012 to October 2014, Ms. Jolly served as the chief human resources officer at Vertex Group, a private IT services and business process outsource provider for the utilities industry. Ms. Jolly’s previous professional experience includes progressive leadership roles in human resources positions for companies in a variety of industries. Ms. Jolly obtained her Master of Business Administration from the University of Minnesota and her Bachelor of Arts degree in Business from the University of St. Thomas.
Gabrielle B. Adams has been our Vice President and Chief Accounting Officer since April 2017. Ms. Adams joined Hanger as its Vice President - Accounting in February 2015. Prior to joining Hanger, Ms. Adams served as Chief Financial Officer at the Texas Bankers Association, a trade association supporting the banking industry in Texas, from 2012 to 2015. Previously, Ms. Adams served in various roles of increasing responsibility at EZCorp, Inc., a publicly traded provider of pawn loans and operator of pawn stores, from 1999 to 2012, including serving as Vice President of Financial Planning and Analysis, Director of Internal Audit, and Assistant Controller. Ms. Adams holds a degree in accounting from the University of Texas at Austin and is a licensed CPA in the State of Texas.
There are no family relationships between any of the executive officers.
| ITEM 1A. | RISK FACTORS. |
Set forth below are certain risk factors that could adversely affect our business, results of operations, and financial condition. You should carefully read the following risk factors, together with the consolidated financial statements, related notes, and other information contained in this Annual Report on Form 10-K. This Annual Report on Form 10-K contains forward-looking statements that contain risks and uncertainties. Please read the cautionary notice regarding forward-looking statements in Item 7. under the heading “Management’s Discussion and Analysis of Financial Condition and Results of Operations” in connection with your consideration of the risk factors and other important factors that may affect future results described below.
Health care reform has initiated significant changes to the United States health care system and we expect to see further changes in the health care system in the future.
Various health care reform provisions became law upon enactment of the Patient Protection and Affordable Care Act, Pub. L. No. 111-148, on March 23, 2010 (the “Affordable Care Act”). The reforms contained in the Affordable Care Act have impacted our business. Continued political, economic and regulatory influences are subjecting the health care industry in the United States to fundamental change. Further changes relating to the health care industry and in health care spending may adversely affect our revenue. We anticipate that Congress will continue to review and assess alternative health care delivery and payment systems and may in the future propose and adopt legislation effecting additional fundamental changes in the health care system. Although efforts at replacing the Affordable Care Act and overhauling the health care system have stalled in Congress, health care reform remains a priority for Congressional leaders and the President. We cannot assure you as to the ultimate content, timing or effect of changes, nor is it possible at this time to estimate the impact of potential legislation on our business. However, although the specific reforms to the current health care system cannot be accurately predicted at this time, such changes could have a considerable impact on how health care is reimbursed, particularly on the coverage for certain types of services and on the reimbursement levels provided by government sources.
14
Changes in government reimbursement levels could adversely affect our Patient Care segment’s net revenue, cash flows, and profitability.
We derived approximately 57.5%, 56.5%, and 54.8% of our net revenue for the years ended December 31, 2019, 2018, and 2017, respectively, from reimbursements for O&P services and products from programs administered by Medicare, Medicaid, and the VA. Each of these programs set reimbursement levels for the O&P services and products provided under their program. If these agencies reduce reimbursement levels for O&P services and products in the future, our net revenues could substantially decline. In addition, the percentage of our net revenues derived from these sources may increase as the portion of the U.S. population over age 65 continues to grow, making us more vulnerable to reimbursement reductions by these organizations. Reduced government reimbursement levels could result in reduced private payor reimbursement levels because fee schedules of certain third party payors are indexed to Medicare reimbursement levels. Furthermore, the health care industry is experiencing a trend towards cost containment as government and other third party payors seek to impose lower reimbursement rates and negotiate reduced contract rates with service providers. This trend could adversely affect our net revenues. For example, a number of states have reduced their Medicaid reimbursement rates for O&P services and products, or have reduced Medicaid eligibility, and at any time some number of other states are reviewing Medicaid reimbursement policies generally, including for prosthetic and orthotic devices. Additionally, the federal government is continually evaluating potentially significant changes to the Medicaid program, including, but not limited to changing the nature and scope of Medicaid reimbursement. Any significant change to the Medicaid program could have a material adverse effect on our net revenues.
Medicare provides for reimbursement for O&P products and services based on prices set forth in fee schedules for ten regional service areas. Medicare prices are adjusted each year based on the CPI-U unless Congress acts to change or eliminate the adjustment. The Medicare price changes for 2020, 2019, 2018, and 2017 were 0.9%, 2.3%, 1.1%, and 0.7%, respectively. The Affordable Care Act (“ACA”) changed the Medicare inflation factors applicable to O&P (and other) suppliers. The annual updates for years subsequent to 2011 are based on the percentage increase in the CPI-U for the 12-months ended in June of the previous year. Section 3401(m) of the ACA required that for 2011 and each subsequent year, the fee schedule update factor based on the CPI-U for the 12-months ended in June of the previous year is to be adjusted by the annual change in economy-wide private nonfarm business multifactor productivity (the “MFP Adjustment”). The MFP Adjustment may result in the percentage increase being less than zero for a year and may result in payment rates for a year being less than such payment rates for the preceding year. If the U.S. Congress were to legislate additional modifications to the Medicare fee schedules, our net revenues from Medicare and other payors could be adversely and materially affected.
Regular challenges to the ACA occur in the federal courts. One round of litigation in the U.S. Fifth Circuit Court of Appeals potentially challenges the entirety of the ACA. See Texas v. United States, No. 19-10011 (5th Cir. Jan. 9, 2020). If any challenges to the ACA are successful, it may have a material adverse effect on our net revenues.
Alternative models of reimbursement for durable medical equipment, prosthetics, orthotics and supplies (“DMEPOS”) may also affect our business. The Medicare Prescription Drug, Improvement, and Modernization Act of 2003 requires that Medicare replace the current fee schedule payment methodology for certain DMEPOS items and services with “single payment amounts” determined through a competitive bidding process, and CMS has issued regulations finalizing the methodology for adjusting fee schedule amounts for such items. See 79 Fed, Reg. 66120, 66123 (November 6, 2014). The types of DMEPOS most applicable to us include certain off-the-shelf (“OTS”) orthotics. Under the DMEPOS Competitive Bidding Program, suppliers compete to submit bids for selected products, and the Medicare suppliers offering the best price, in addition to meeting applicable quality and financial standards, are awarded contracts to supply the designated products and services to Medicare beneficiaries in specified competitive bidding areas. Although our product offerings currently subject to competitive bidding do not comprise a significant portion of our business, it is possible that the DMEPOS Competitive Bidding Program may expand to include other types of products we offer, or that other payors will adopt similar models for reimbursement, which could negatively affect our net revenue.
15
The Budget Control Act of 2011 required, among other things, mandatory across-the-board reductions in Federal spending, or “sequestration”. While delayed by the American Taxpayer Relief Act of 2012, President Obama issued a sequestration order on March 1, 2013. For services provided on or after April 1, 2013, Medicare fee-for-service claim payments, including those for DMEPOS as well as claims under the DMEPOS Competitive Bidding Program, are reduced by 2%. On November 2, 2015, President Obama signed the Bipartisan Budget Act of 2015 into law, which provided for two years of increases to discretionary spending to be offset by an additional year of Medicare sequestration, through 2025. This is a claims payment adjustment with limited impact on us; no permanent reductions in the Medicare DMEPOS fee schedule have been made as a result of sequestration, therefore additional reimbursements from Medicaid, the VA, and commercial payors who use the Medicare fee schedule as a basis for reimbursement have not been impacted.
CMS may also develop policies to limit Medicare coverage of specific products and services. Medicare administrative contractors may issue local coverage determinations (“LCD”) that limit coverage for a particular item or service, and these determinations are generally coordinated across all applicable Medicare administrative contractors and therefore generally apply nationally. Any LCD that negatively impacts orthotic or prosthetic reimbursement would negatively affect our revenue.
Finally, patients may continue to move to Medicare Advantage plans from traditional Medicare plans, which will change the nature of the reimbursement received by us from the traditional Medicare program and may negatively affect our net revenue.
We utilize information technology systems to support our business. Our multi-year implementation of an enterprise-wide resource planning system, reliance upon multiple legacy business systems, security breaches, or other disruptions to our information technology systems or assets, could interfere with our operations, compromise security of our customers’ or suppliers’ information and expose us to liability which could adversely impact our business and reputation.
Our operations rely on certain key IT systems, many of which are legacy in nature or may be dependent upon third-party services, to provide critical connections of data, information, and services for internal and external users. Over the next several years, we expect to implement a new enterprise resource planning system (“ERP”), which will require significant financial and human resources to deploy. There can be no assurance that the actual costs for the ERP will not exceed our current estimates or that the ERP will not take longer to successfully implement than we currently expect. The failure to successfully implement the ERP in a timely manner may adversely affect our ability to establish and maintain an effective control environment. In addition, potential flaws in implementing the ERP, not adequately training our work force or adapting our systems and processes to effectively operate under the ERP, or the failure of any portion/module of the ERP to meet our needs, properly interface with legacy systems or provide appropriate controls, may pose risks to our ability to operate successfully and efficiently. There may be other challenges and risks to both our aging and current IT systems over time due to any number of causes, such as catastrophic events, availability of resources, power outages, security breaches, or cyber-based attacks, and as we upgrade and standardize our ERP system on a company-wide basis. These challenges and risks could result in legal claims or proceedings, liability or penalties, disruption to our operations, a material weakness in or failure of our control environment, loss of valuable data, and damage to our reputation, all of which could adversely affect our business.
We have made and may continue to make acquisitions, which could divert the attention of management and which may not be integrated successfully into our existing business. We may not find suitable acquisitions in the future, which could adversely affect our ability to penetrate new markets and achieve our growth objectives.
We intend to continue to pursue acquisitions to enter new geographic markets and expand the scope of services we provide. We cannot assure you that we will identify suitable acquisition candidates, acquisitions will be completed on acceptable terms or at all, our due diligence process will uncover all potential liabilities or issues affecting our integration process, we will not incur breakup, termination or similar fees and expenses, or we will be able to successfully integrate the operations of any acquired business. Furthermore, acquisitions in new geographic markets and services may require us to comply with new and unfamiliar legal and regulatory requirements, which could impose substantial obligations on us and our management, cause us to expend additional time and resources, and increase our exposure to penalties or fines for noncompliance with such requirements. The acquisitions could be of significant size and involve operations in multiple jurisdictions. The acquisition and integration of another business could divert management attention from other business activities. This diversion, together with other difficulties we may incur in integrating an acquired business, could have a material adverse effect on our business, financial condition, and results of operations. In addition, we may incur debt to finance acquisitions. Such borrowings may not be available on terms as favorable to us as our current borrowing terms and may increase our leverage.
16
A pandemic, epidemic or other widespread outbreak of an infectious disease in the United States could adversely impact our business.
If a pandemic, epidemic, or other widespread outbreak of an infectious disease, such as the coronavirus known as COVID-19, or other widespread public health crisis were to occur in the United States, then our business and operations could be adversely affected. A pandemic, epidemic or other widespread outbreak could adversely impact our business by causing a temporary decrease in or diversion of patients, by disrupting or delaying our supply chain, delaying reimbursement by governmental or private payers, or by causing staffing shortages in our facilities. The potential impact on our operations of a pandemic, epidemic or widespread outbreak of an infectious disease in the United States is inherently difficult to predict and could adversely impact our business, financial condition or results of operations.
We face new competitors in the O&P patient care services market.
The barriers to entry into the O&P patient care services business in the United States are generally low. In particular, we are aware that two O&P product manufacturers, each with international O&P patient care services operations, also now operate O&P patient care services business in the United States, and could continue to expand their U.S. presence. These O&P product manufacturers are important suppliers to our O&P patient care services business as well as our Product & Services segment distribution business. Other O&P product manufacturers with international O&P patient care services operations could also choose to enter the U.S. O&P patient care services market, as could other healthcare companies. These competitors have significant financial resources, established brands, and other competitive strengths. The continued expansion of these competitors, and the entry of new competitors into the O&P patient care services market in the United States, could adversely affect our business, financial condition, or results of operations.
In addition, these competitors could negatively impact our acquisition strategy in the O&P patient care services market. In particular, competition for acquisition candidates could increase the prices we pay to complete acquisitions, and could cause us to lose acquisitions to competitors, either of which could adversely affect our business, financial condition or results of operations.
We have substantial indebtedness, and our failure to comply with the covenants and payment requirements of that indebtedness may subject us to increased interest expenses, lender consent and amendment costs, or adverse financial consequences.
As of December 31, 2019, we had approximately $498.9 million in indebtedness. This current level of indebtedness is comprised of approximately $496.2 million of borrowings under the term loan facility under our Credit Agreement, no borrowings under the revolving credit facility of our Credit Agreement, and approximately $2.7 million of indebtedness related to other financing obligations and Seller Notes, net of unamortized discount and debt issuance costs. Under our Credit Agreement, we are required to comply with certain financial covenants and other provisions. In addition to other requirements, these provisions include requirements that we timely prepare our financial statements and timely receive audits on our annual financial statements, meet certain financial ratio requirements, and timely pay interest and principal when due. To the extent that we fail to meet our financial statement requirements in future periods, our operating trends do not enable us to meet our financial covenant requirements, we are unable to pay interest or principal when due or we are unable to meet other covenants and requirements contained within our currently existing Credit Agreement, we may default under the Credit Agreement. A default could result in increases in consent or amendment fees to lenders, increases in interest costs, the imposition of additional constraints on borrowing by our lenders, or potentially more serious liquidity constraints and adverse financial consequences, including reductions in the value of our common stock or the necessity of seeking protection from creditors under bankruptcy laws. See the “Liquidity and Capital Resources” section in this Management’s Discussion and Analysis for further discussion.
Additionally, our current Credit Agreement includes variable interest rates. In the event that interest rates rise, we will be required to pay greater interest expenses, which will have an adverse effect on our income from operations and financial condition.
17
To remedy issues we may encounter with meeting our debt obligations, or for other purposes, we may find it necessary to seek further refinancing of our indebtedness, and may do so with debt instruments that are more costly than our existing instruments (and which will rank senior to our equity securities), or we may issue additional equity securities which may dilute the ownership interests or value of our existing shareholders. These actions may decrease the value of our equity securities.
Disruption of our supply chain could adversely affect our net revenue, cash flow, and profitability
We depend on domestic and international outside suppliers and O&P product manufacturers to provide the materials, components and products we use in the devices we provide to the patients of our Patient Care segment, and distribute to the customers of our distribution business in our Products & Services segment. Disruption of our supply chain could result from a variety of factors that could impact our suppliers, manufacturers, or shipping carriers. These factors include, among other things: a natural disaster, including a hurricane, earthquake, or flood; a public health crisis, including a global or regional pandemic outbreak of disease; adverse weather; a cyber-security breach or incident; terrorism or other acts of violence; acts of war or other armed conflict; operational or financial instability of one or more key suppliers, manufacturers or shipping carriers; unavailability of raw materials; transportation interruptions or delays; or labor strikes or other labor activities. Any discontinuation or interruption in the availability of the materials, components and products we use and sell in our businesses from one or more suppliers or manufacturers could increase our cost of materials, or delay or preclude deliveries to our patients and customers, which could have an adverse effect on our net revenue, cash flow and profitability.
If the average rates that commercial payors pay us decline significantly, then it would have a material adverse effect on our Patient Care segment’s net revenues, earnings, and cash flows.
We derived approximately 35.8%, 37.0%, and 38.2% of our net revenues for the years ended December 31, 2019, 2018, and 2017, respectively, from reimbursements for O&P services and products for patients who have commercial payors as their primary payor. We continue to experience downward pressure on some of our commercial payment rates as a result of general conditions in the market, recent, and future consolidations among commercial payors, increased focus on O&P services and products and other factors. There is no guarantee that commercial payment rates will not be materially lower in the future, particularly given the fluctuations in government reimbursement rates.
We are continuously in the process of negotiating new agreements and renegotiating agreements that are up for renewal with commercial payors, who often begin negotiations with proposed reductions in our reimbursement rates. Sometimes many significant agreements are up for renewal or being renegotiated at the same time. In the event that our ongoing negotiations result in overall commercial rate reductions in excess of overall commercial rate increases, the cumulative effect could have a material adverse effect on our financial results. Consolidations in the commercial payor market have significantly increased the negotiating leverage of commercial payors. Our negotiations with payors are also influenced by competitive pressures, and we may experience decreased contracted rates with commercial payors or experience decreases in patient volume as our negotiations with commercial payors continue. If the average rates that commercial payors pay us decline significantly, or if we see a decline in commercial patients, it would have a material adverse effect on our revenues, earnings and cash flows.
18
We face periodic reviews, audits, and investigations under our contracts with federal and state government agencies, and these audits could have adverse findings that may negatively impact our business.
We contract with various federal and state governmental agencies to provide O&P services. Pursuant to these contracts, we are subject to various governmental reviews, audits, and investigations to verify our compliance with the contracts and applicable laws and regulations. Any adverse review, audit, or investigation could result in:
| • | refunding of amounts we have been paid pursuant to our government contracts; |
| • | imposition of fines, penalties, and other sanctions on us; |
| • | loss of our right to participate in various federal programs; |
| • | damage to our reputation in various markets; or |
| • | material and/or adverse effects on our business, financial condition, and results of operations. |
In recent years, we have seen a significant increase in Medicare audits, including RAC audits, CERT audits, TPE prepayment audits, and ZPIC audits. In addition, SMRCs are responsible for the identification of improper payment rates through medical record review. We believe that Medicare audits, inquiries and investigations will continue to occur from time to time in the ordinary course of our business. Medicare audits could have a material and adverse effect on our business financial condition and results of operations, particularly if we are unsuccessful at final adjudication.
We depend on our ability to recruit and retain experienced clinicians.
Our revenue generation is dependent upon referrals from physicians in the communities our patient care clinics serve, and our ability to maintain good relations with these physicians. Our clinicians are the front line for generating these referrals and we are dependent on their talents and skills to successfully cultivate and maintain strong relationships with these physicians. If we cannot recruit and retain our base of experienced and skilled clinicians, our business may decrease and our net operating revenues may decline. We may also experience increases in our labor costs, if higher wages and greater benefits are required to attract and retain qualified healthcare personnel, and such increases may adversely affect our profitability. Furthermore, while we attempt to manage overall labor costs in the most efficient way, our efforts to manage them may have limited effectiveness and may lead to increased turnover and other challenges.
Consolidation of manufacturers within the O&P industry may adversely affect our business by increasing prices we pay for certain devices and components.
We depend on a limited number of manufacturers who supply us with certain key devices and components used in the prostheses we provide to our patients, particularly with respect to high technology components. These manufacturers are subject to a consolidation trend within the O&P industry. To the extent this trend continues, consolidation amongst certain manufacturers could result in a sole or limited source for certain high technology devices and components used in the devices we provide to patients. Any such consolidation could require us to pay increased prices for such devices and components, which could significantly reduce our gross margin and profitability and have a material adverse effect on our business.
19
Changes in government reimbursement levels could adversely affect our Products & Services segment’s net revenues, cash flows, and profitability.
Changes in government reimbursement levels could adversely affect the net revenues, cash flows, and profitability of the businesses in our Products & Services segment. In particular, a significant majority of our therapeutic services sales involve devices and related services provided to SNFs and similar businesses. Reductions in government reimbursement levels to SNFs have caused, and could continue to cause, such SNFs to reduce or cancel their use of our therapeutic service equipment and related consultative services negatively impacting net revenues, cash flows, and profitability. For example, in July 2011 CMS announced an across the board reduction of approximately 11% in SNF reimbursement levels, which negatively impacted the demand for our devices and treatment modalities. Although CMS has announced increases in SNF reimbursement levels in the years since (the agency announced an increase of 2.4% for FY 2020, 2.4% for FY 2019, 1.0% for FY 2018, 2.4% for FY 2017, and 1.4% for FY 2016), we cannot predict whether any other changes to reimbursement levels will be implemented, or if implemented what form any changes might take. Effective October 1, 2019, the Patient-Driven Payment Model replaced the previous Resource Utilization Group IV SNF payment system under Medicare Part A. The overall economic impact of the FY 2020 SNF Prospective Payment System payment rate update is an estimated increase of $851 million in aggregate payments to SNFs during FY 2020. In addition, the overall annual cost for SNFs to submit data for the SNF Quality Reporting Program for the provisions in this final rule is $29 million. The overall economic impact of the SNF Value-Based Purchasing program is an estimated reduction of $213.6 million in aggregate payments to SNFs during FY 2020.
We depend on reimbursements by third party payors, as well as payments by individuals, which could lead to delays and uncertainties in the Patient Care segment’s reimbursement process.
We receive a substantial portion of our payments for health care services on a fee-for-service basis from third party payors, including Medicare and Medicaid, private insurers, and managed care organizations. We estimate that we have received approximately 93.3%, 93.5%, and 93.0% of our net revenues from such third party payors during 2019, 2018, and 2017, respectively. We estimate that such amounts included approximately 31.9%, 31.9%, and 30.5% from Medicare in 2019, 2018, and 2017, respectively, 15.8%, 15.5%, and 15.6% from Medicaid programs in 2019, 2018, and 2017, respectively. In addition, we estimate net revenues from the VA were 9.8%, 9.1%, and 8.7% in 2019, 2018, and 2017, respectively.
The reimbursement process is complex and can involve lengthy delays. Third party payors continue their efforts to control expenditures for health care, including proposals to revise reimbursement policies. While we recognize revenue when health care services are provided, there can be delays before we receive payment. In addition, third party payors may disallow, in whole or in part, requests for reimbursement based on determinations that certain amounts are not reimbursable under plan coverage, that services provided were not medically necessary, or that additional supporting documentation is necessary. Retroactive adjustments may change amounts realized from third party payors. Third party payors may require pre-authorizations for certain services and/or devices, which may result in a delay in our ability to provide services or to provide services at all. Additionally, we may see an increase in bundled payment models, which can result in delays before we receive payment or no payment at all for certain services.
Changes in government reimbursement levels and policies such as those described above may also contribute to uncertainties surrounding the reimbursement process. We are subject to governmental audits of our reimbursement claims under Medicare, Medicaid, the VA and other governmental programs and may be required to repay these agencies if found that we were incorrectly reimbursed. Delays and uncertainties in the reimbursement process may adversely affect accounts receivable, increase the overall costs of collection and cause us to incur additional borrowing costs.
We also may not be paid with respect to co-payments and deductibles that are the patient’s financial responsibility. Many of the plans offered on the state health insurance exchanges have high deductibles and require coinsurance that patients cannot afford to pay. Amounts not covered by third party payors are the obligations of individual patients from whom we may not receive whole or partial payment. We also may not receive whole or partial payments from uninsured and underinsured individuals. In such an event, our earnings and cash flow would be adversely affected, potentially affecting our ability to maintain our restrictive debt covenant ratios and meet our financial obligations.
Additionally, employer based plans and other individual plans are increasingly relying on “high deductible” plan designs. As their participation in health plans with these high deductible designs increases, our patients will face greater financial burdens and participatory costs that may affect their decisions regarding the timing of their replacement of their devices. Due to cost considerations, they may seek to repair or refurbish their existing devices and delay the purchase of new replacement devices, which will adversely affect our revenues and our profitability.
The risks associated with third party payors, co-payments, and deductibles and the inability to monitor and manage accounts receivable successfully could still have a material adverse effect on our business, financial condition, and results of operations. Furthermore, our collection policies or our provisions for allowances for Medicare, Medicaid, and contractual discounts and doubtful accounts receivable may not be adequate.
20
Cyber attacks, system security risks, data breaches, and other technology failures could adversely affect our ability to conduct business, our results of operations, and our financial position.
A cyber attack, system security risk, data breach or technology failure could occur and potentially disrupt our business, damage our reputation, and adversely affect our profitability. Our IT systems are subject to the risk of computer viruses or other malicious code, unauthorized access, or cyber attacks. The administrative and technical controls and other preventive actions that we take to reduce the risk of cyber incidents and protect our IT systems may be insufficient to prevent physical and electronic break-ins, cyber attacks, or other security breaches to our computer systems. We are not currently in full compliance with the standards prescribed under the Payment Card Industry Data Security Standard, and we are not currently in full compliance with all the requirements of the regulations issued under HIPAA, and this could result in heightened cybersecurity risk. In addition, disruptions or breaches could occur as a result of natural disasters, man-made disasters, epidemic/pandemic, industrial accident, blackout, criminal activity, technological changes or events, terrorism, or other unanticipated events beyond our control. While we have insurance intended to provide coverage from certain losses related to such incidents, and a variety of preventative security measures such as risk management, information protection, and disaster recovery systems, insurance may not cover all losses and our preventive security measures may not be sufficient or adequate to protect our IT systems. Additionally, we cannot predict the method or outcome of every possible cyber incident or ensure that we have protected ourselves against every possible cyber threat in light of the varied and increasingly complex breaches faced by companies on a regular basis. Problems with, or shortcomings in, our systems or plans could have a material adverse impact on our ability to conduct business, our results of operations, and our financial position.
Disruptions in our disaster recovery systems, management continuity planning, or information systems could limit our ability to operate our business effectively, or adversely affect our financial condition and results of operations.
Our IT systems facilitate our ability to conduct our business. While we have disaster recovery systems in place, these systems may not be adequate, and any disruptions in our disaster recovery systems could, depending on the magnitude of the problem, adversely affect our operating results by limiting our capacity to effectively monitor and control our operations. Despite our implementation of a variety of security measures, our technology systems could be subject to physical or electronic break-ins and similar disruptions from unauthorized tampering. In addition, in the event that a significant number of our management personnel were unavailable in the event of a disaster, our ability to effectively conduct business could be adversely affected.
In order to remain competitive, we are required to make capital expenditures to maintain our systems, properties, and our equipment.
In order to remain competitive, we are required to make capital expenditures to invest in reengineering our supply chain and financial systems, in therapeutic equipment for our Products & Services segment, and to refurbish and maintain our property and equipment generally. A substantial portion of our anticipated capital expenditure requirements over the next several years relate to updating and refreshing the physical and technology infrastructure that supports logistics and warehousing of products for both our business segments. We also continue to invest in refreshing the therapeutic equipment portfolio of Accelerated Care Plus in our Products & Services segment, and in upgrading and maintaining the appearance and function of our patient care clinics and satellite locations in our Patient Care segment. If we are unable to fund any such investment or otherwise fail to invest in such items, our business, financial condition, or results of operations could be materially and adversely affected.
We are subject to numerous federal, state, and local governmental regulations, noncompliance with which could result in significant penalties that could have a material adverse effect on our business.
A failure by us to comply with the numerous federal, state, and/or local health care and other governmental regulations to which we are subject, including the regulations discussed under “Government Regulation” in “ITEM 1. BUSINESS.” above, could result in significant penalties and adverse consequences, including exclusion from the Medicare and Medicaid programs, which could have a material adverse effect on our business.
21
Our non-compete agreements and other restrictive covenants involving clinicians may not be enforceable.
We have contracts with clinicians in many states. Some of these contracts include provisions preventing these clinicians from competing with us both during and after the term of our relationship with them. The law governing non-compete agreements and other forms of restrictive covenants varies from state to state. Some states are reluctant to strictly enforce non-compete agreements and restrictive covenants applicable to health care providers. There can be no assurance that our non-compete agreements related to affiliated clinicians will not be successfully challenged as unenforceable in certain states. In such event, we would be unable to prevent former affiliated clinicians from competing with us, potentially resulting in the loss of some of our patients, reducing our revenues and earnings.
Due to constraints in the growth of our rates of reimbursement, we may face cost pressures that could adversely affect our profitability.
Due to increased pressures on governmental and commercial payors to seek ways of reducing the costs of care, those payors have and may continue to seek ways to reduce growth in the rate of our reimbursement for the services we provide. This constraint in the rate of growth in reimbursement may adversely affect our profitability as we experience increases in the wages, materials, and other costs necessary to the conduct of our business. These cost increases may adversely affect our profitability and our profit margins.
A cybersecurity incident could cause a violation of HIPAA and other privacy laws and regulations or result in a loss of confidential data.
We are not currently in full compliance with all the requirements of the regulations issued under HIPAA, and this could result in heightened cybersecurity risk. A cyber attack that penetrates our IT security defenses causing an IT security breach, loss of protected health information or other data subject to privacy laws, loss of proprietary business information, or a material disruption of our IT business systems, could have a material adverse impact on our business, financial condition, or results of operations. In addition, our future results of operations, as well as our reputation, could be adversely impacted by theft, destruction, loss, or misappropriation of protected health information, other confidential data, or proprietary business information.
Our acquisitions require transitions and integration of various information technology systems, and we regularly upgrade and expand our information technology systems’ capabilities. If we experience difficulties with the transition and integration of these systems or are unable to implement, maintain, or expand our systems properly, we could suffer from, among other things, operational disruptions, regulatory problems, working capital disruptions, and increases in administrative expenses. While we make significant efforts to address any information security issues and vulnerabilities with respect to the companies we acquire, we may still inherit risks of security breaches or other compromises when we integrate these companies within our business.
Our products and services face the risk of technological obsolescence, which, if realized, could have a material adverse effect on our business.
The medical device industry is characterized by rapid and significant technological change. There can be no assurance that third parties will not succeed in developing and marketing technologies, products or services that are more effective than those that we provide our patients, or that would render the products and services we provide our patients obsolete or noncompetitive. Additionally, new surgical procedures and medications could be developed for diabetes, trauma associated with accidents or physical injury, tumors, infection, or musculoskeletal disorders of the back, extremities, or joints that would replace or reduce the importance of our prosthetic and orthotic products and services. Accordingly, our success will depend upon our ability to respond to future medical and technological changes that may impact the demand for our prosthetic and orthotic products and services.
Given the complexities and demands related to reimbursement, we may fail to adequately provide the staffing and systems necessary to ensure we effectively manage our reimbursement processes.
The nature of our business requires that we are effective in the assessment of patient eligibility, the process of pre-authorization, the recordation and collection of provider documentation, the timely and complete submission of claims for reimbursement, the application of cash receipts to patient accounts, the timely response to payor denials, and the conduct of collection activities. If we fail to provide adequate or qualified staffing, we could incur reductions in the amount of reimbursement we receive for the O&P services that we provide.
22
If we are unable to retain our senior management and key employees, then our business and results of operations and financial position could be harmed.
Our ability to maintain our competitive position is largely dependent on the services of our senior management and other key employees. Although we have employment agreements with our senior management, these agreements do not prevent those individuals from ceasing their employment with us at any time. If we are unable to retain existing senior management and other key employees, or to attract other such qualified employees on terms satisfactory to us, then our business could be adversely affected.
Our failure to economically procure necessary components and to conduct timely and effective inventories of the materials and components we use in our business could result in an adverse effect on our business, financial condition, and results of operations.
Our business involves the use of materials and componentry we acquire from third party manufacturers. If manufacturers critical to our business substantially increase the cost of the components they sell to us, then our inability to acquire the necessary materials and components on a cost effective basis may adversely affect revenues and earnings. Additionally, to successfully perform our business, it is necessary that we conduct timely and thorough inventories of our raw materials and Work in Process. The conduct of these inventories are costly and time consuming. If we encounter issues in their conduct, given that our clinicians oversee the inventory processes which occur in our clinics, remedial procedures can disrupt our ability to see and treat patients, and thereby adversely affect our revenues and profitability.
We may not be able to adequately protect our intellectual property and other proprietary rights that are material to our business or to defend successfully against intellectual property infringement claims by third parties.
Our ability to compete effectively depends in part upon our intellectual property rights, including but not limited to our trademarks and copyrights, and our proprietary technology. Our use of contractual provisions, confidentiality procedures and agreements, and trademark, copyright, unfair competition, trade secret, and other laws to protect our intellectual property rights and proprietary technology may not be adequate. Litigation may be necessary to enforce our intellectual property rights and protect our proprietary technology, or to defend against claims by third parties that the conduct of our businesses or our use of intellectual property infringes upon such third-party’s intellectual property rights. Any intellectual property litigation or claims brought against us, whether or not meritorious, could result in substantial costs and diversion of our resources, and there can be no assurances that favorable final outcomes will be obtained in all cases. The terms of any settlement or judgment may require us to pay substantial amounts to the other party or cease exercising our rights in such intellectual property, including ceasing the use of certain trademarks used by us to distinguish our services from those of others or ceasing the exercise of our rights in copyrightable works. In addition, we may have to seek a license to continue practices found to be in violation of a third-party’s rights, which may not be available on reasonable terms, or at all. Our business, financial condition, or results of operations could be adversely affected as a result.
Insurance coverage for some of our losses may be inadequate and may be subject to the credit risk of commercial insurance companies.
Some of our insurance coverage is through various third-party insurers. To the extent we hold policies to cover certain groups of claims or rely on insurance coverage obtained by third parties to cover such claims, but either we or such third parties did not obtain sufficient insurance limits, did not buy an extended reporting period policy, where applicable, or the issuing insurance company is unable or unwilling to pay such claims, we may be responsible for those losses. Furthermore, for our losses that are insured or reinsured through commercial insurance companies, we are subject to the “credit risk” of those insurance companies. While we believe our commercial insurance company providers currently are creditworthy, there can be no assurance that such insurance companies will remain so in the future.
23
The market price of our common stock may fluctuate significantly.
The market price of our common stock may fluctuate significantly. Among the factors that could affect our stock price are:
| • | industry or general market conditions; |
| • | domestic and international economic factors unrelated to our performance; |
| • | changes in our referral sources’ or customers’ preferences; |
| • | new regulatory pronouncements and changes in regulatory guidelines; |
| • | lawsuits, enforcement actions, and other claims by third parties or governmental authorities; |
| • | actual or anticipated fluctuations in our quarterly operating results; |
| • | changes in securities analysts’ estimates of our financial performance or lack of research and reports by industry analysts; |
| • | action by institutional shareholders or other large shareholders, including future sales of our common stock; |
| • | the entry of a new competitor into one of the our markets we serve; |
| • | speculation in the press or investment community; |
| • | investor perception of us and our industry; |
| • | changes in market valuations or earnings of similar companies; |
| • | announcements by us or our competitors of significant contracts, acquisitions, or strategic partnerships; |
| • | any future sales of our common stock or other securities; |
| • | additions or departures of key personnel; and |
| • | ability to file future SEC filings timely. |
The stock markets have experienced extreme volatility in recent years that has been unrelated to the operating performance of particular companies. These broad market fluctuations may adversely affect the market price of our common stock. In the past, following periods of volatility in the market price of a company’s securities, class action litigation has often been instituted against such company. Any litigation of this type brought against us could result in substantial costs and a diversion of management’s attention and resources, which would harm our business, results of operations, and financial condition.
If securities or industry analysts do not publish research or publish misleading or unfavorable research about our business, our stock price and trading volume could decline.
The trading market for our common stock will depend in part on the research and reports that securities or industry analysts publish about us or our business. If one or more analysts downgrade our stock or publishes misleading or unfavorable research about our business, our stock price would likely decline. If one or more of these analysts ceases coverage of us or fails to publish reports on us regularly, demand for our stock could decrease, which could cause our stock price or trading volume to decline.
24
We do not intend to pay dividends on our common stock and, consequently, your ability to achieve a return on your investment will depend on appreciation in the price of our common stock.
We do not intend to declare and pay dividends on our common stock for the foreseeable future. We currently intend to invest our future earnings, if any, to fund our growth, to develop our business, and to potentially fund future share repurchases. Therefore, you are not likely to receive any dividends on your common stock for the foreseeable future, and the success of an investment in shares of our common stock will depend upon any future appreciation in their value. There is no guarantee that shares of our common stock will appreciate in value or even maintain the price at which shareholders have purchased their shares.
| ITEM 1B. | UNRESOLVED STAFF COMMENTS. |
None.
| ITEM 2. | PROPERTIES. |
As of December 31, 2019, we operated or leased 812 patient care locations, comprised of 701 patient care clinics and 111 satellite locations, in 46 states and the District of Columbia. We own 10 buildings, including eight buildings that house a patient care clinic and two buildings that are currently unoccupied. Our patient care clinics occupied under leases have terms expiring between 2019 and 2028. Our patient care clinics average approximately 3,100 square feet in size. In total, including locations relating to our non-patient care businesses, administrative, and fabrication locations, as well as storage and other non-occupied space, we currently have 909 locations, of which 899 are under lease.
We believe our leased and owned facilities are adequate for carrying out our current and anticipated future O&P operations. We believe we will be able to renew such leases as they expire or find comparable or alternative space on commercially suitable terms. See Note L - “Leases” to our consolidated financial statements in this Annual Report on Form 10-K for additional information regarding our facilities leases.
The following table sets forth the number of our patient care clinics and satellite locations in each state as of December 31, 2019:
| State | Patient Care Locations | State | Patient Care Locations | State | Patient Care Locations | |||||
| Alabama | 11 | Louisiana | 15 | North Dakota | 4 | |||||
| Arizona | 41 | Maine | 9 | Ohio | 37 | |||||
| Arkansas | 6 | Maryland | 12 | Oklahoma | 10 | |||||
| California | 70 | Massachusetts | 7 | Oregon | 11 | |||||
| Colorado | 27 | Michigan | 14 | Pennsylvania | 49 | |||||
| Connecticut | 14 | Minnesota | 20 | South Carolina | 14 | |||||
| District of Columbia | 3 | Mississippi | 12 | South Dakota | 3 | |||||
| Delaware | 1 | Missouri | 24 | Tennessee | 21 | |||||
| Florida | 45 | Montana | 3 | Texas | 43 | |||||
| Georgia | 41 | Nebraska | 12 | Utah | 5 | |||||
| Idaho | 1 | Nevada | 7 | Virginia | 17 | |||||
| Illinois | 21 | New Hampshire | 2 | Washington | 20 | |||||
| Indiana | 12 | New Jersey | 7 | West Virginia | 6 | |||||
| Iowa | 19 | New Mexico | 12 | Wisconsin | 11 | |||||
| Kansas | 15 | New York | 33 | Wyoming | 5 | |||||
| Kentucky | 12 | North Carolina | 28 |
25
Other leased real estate holdings include our distribution facilities in Texas, Nevada, Georgia, Illinois, and Pennsylvania, our corporate headquarters in Austin, Texas; the headquarters for our therapeutic solutions business in Reno, Nevada, which is located within our Nevada distribution facility, and the headquarters for our distribution business in Alpharetta, Georgia, which is located within our Georgia distribution facility. We additionally operate twelve separate leased fabrication facilities that assist our patient care locations in the fabrication of devices. The fabrication facilities are located in the states of Alabama, Arizona, California, Colorado, Connecticut, Florida, Kansas, Tennessee, and Texas. Substantially all of our owned properties are pledged to collateralize bank indebtedness. See Note M - “Long-Term Debt” to our consolidated financial statements in this Annual Report on Form 10-K for additional information regarding our outstanding debt and related collateral.
| ITEM 3. | LEGAL PROCEEDINGS. |
Derivative Litigation
In February and August of 2015, two separate shareholder derivative suits were filed in Texas state court against us related to the announced restatement of certain of our financial statements. The cases were subsequently consolidated into Judy v. Asar, et. al., Cause No. D-1-GN-15-000625. On October 25, 2016, plaintiffs in that action filed an amended complaint, and the case is currently pending before the 345th Judicial District Court of Travis County, Texas.
The amended complaint in the consolidated derivative action names us and certain of our current and former officers and directors as defendants. It alleges claims for breach of fiduciary duty based, inter alia, on the defendants’ alleged failure to exercise good faith to ensure that we had in place adequate accounting and financial controls and that disclosures regarding our business, financial performance and internal controls were truthful and accurate. The complaint sought unspecified damages, costs, attorneys’ fees, and equitable relief.
As disclosed in our Current Report on Form 8-K filed with the SEC on June 6, 2016, the Board of Directors appointed a Special Litigation Committee of the Board (the “Special Committee”). The Board delegated to the Special Committee the authority to (1) determine whether it is in our best interests to pursue any of the allegations made in the derivative cases filed in Texas state court (which cases were consolidated into the Judy case discussed above), (2) determine whether it is in our best interests to pursue any remedies against any of our current or former employees, officers, or directors as a result of the conduct discovered in the Audit Committee investigation concluded on June 6, 2016 (the “Investigation”), and (3) otherwise resolve claims or matters relating to the findings of the Investigation. The Special Committee retained independent legal counsel to assist and advise it in carrying out its duties and reviewed and considered the evidence and various factors relating to our best interests. In accordance with its findings and conclusions, the Special Committee determined that it is not in our best interest to pursue any of the claims in the Judy derivative case. Also in accordance with its findings and conclusions, the Special Committee determined that it is not in our best interests to pursue legal remedies against any of our current or former employees, officers, or directors.
On April 14, 2017, we filed a motion to dismiss the consolidated derivative action based on the resolution by the Special Committee that it is not in our best interest to pursue the derivative claims. Counsel for the derivative plaintiffs opposed that motion and moved to compel discovery. In a hearing held on June 12, 2017, the Travis County court denied plaintiffs’ motion to compel, and held that the motion to dismiss would be considered only after appropriate discovery was concluded.
The plaintiffs subsequently subpoenaed counsel for the Special Committee, seeking a copy of the full report prepared by the Special Committee and its independent counsel. Counsel for the Special Committee, as well as our counsel, took the position that the full report is not discoverable under Texas law. Plaintiffs’ counsel filed a motion to compel the Special Committee’s counsel to produce the report. We opposed the motion. On July 20, 2018, the Travis County court ruled that only a redacted version of the report is discoverable, and counsel for the Special Committee provided a redacted version of the report to plaintiffs’ counsel. Plaintiffs objected to the redacted version of the report, and on February 4, 2019, the Travis County court appointed a Special Master to review plaintiffs’ objections to the redacted report. On March 22, 2019, the Special Master submitted a report to the Travis County court recommending that the court order that the entire Special Committee report be produced. On April 2, 2019 we filed an objection to the Special Master’s report and recommendation, and requested a hearing on the matter. On June 25, 2019, the Travis County court rejected the recommendation of the Special Master, and instead ordered that only a limited additional portion of the Special Committee report should be unredacted. On July 10, 2019, the updated redacted Special Committee report was provided to plaintiffs through their counsel.
26
In late October 2019, a non-binding agreement in principle was reached by the parties to settle the consolidated derivative action, the parties entered into a definitive settlement agreement in late December 2019, and in January 2020 the Travis County court issued an order providing preliminary approval of the settlement and ordering that notice of the settlement be made to the Company’s shareholders. On March 10, 2020, the Travis County court issued an order providing final approval of the settlement and dismissing with prejudice the consolidated derivative action.
Other Matters
From time to time we are subject to legal proceedings and claims which arise in the ordinary course of our business. In the opinion of management, the amount of ultimate liability, if any, with respect to these actions will not have a materially adverse effect on our consolidated financial position, liquidity, or results of our operations.
We are in a highly regulated industry and receive regulatory agency inquiries from time to time in the ordinary course of our business, including inquiries relating to our billing activities. No assurance can be given that any discrepancies identified during a regulatory review will not have a material adverse effect on our consolidated financial statements.
| ITEM 4. | MINE SAFETY DISCLOSURES. |
Not applicable.
27
| ITEM 5. | MARKET FOR REGISTRANT’S COMMON EQUITY, RELATED STOCKHOLDER MATTERS AND ISSUER PURCHASES OF EQUITY SECURITIES. |
The following information in this Item 5 of this Annual Report on Form 10-K is not deemed to be “soliciting material” or to be “filed” with the U.S. Securities and Exchange Commission (“SEC”) or subject to Regulation 14A or 14C under the Exchange Act or to the liabilities of Section 18 of the Exchange Act, and will not be deemed to be incorporated by reference into any filing under the Securities Act of 1933 or the Exchange Act, except to the extent we specifically incorporate it by reference into such a filing.
Market Information
Our common stock was listed and traded on the NYSE from December 15, 1998 to February 26, 2016 under the symbol “HGR.” On February 29, 2016, our common stock began trading on the OTC under the symbol “HNGR.” On September 11, 2018, our common stock resumed trading on the NYSE, under the symbol “HNGR.”
Holders
At February 29, 2020, there were approximately 156 holders of record of our 37,429,065 shares of outstanding common stock.
Dividend Policy
We have never paid cash dividends on our common stock and our Board of Directors intends to continue this policy for the foreseeable future. We plan to retain earnings for use in our business. The terms of our credit agreements and certain other agreements limit the payment of dividends on our common stock and such agreements are expected to continue to limit the payment of dividends in the future.
Any future determination to pay cash dividends will be at the discretion of our Board of Directors and will be dependent on our results of operations, financial condition, contractual and legal restrictions, and any other factors deemed to be relevant.
Sales of Unregistered Securities
During the year ended December 31, 2019, we did not sell any securities that were unregistered under the Securities Act of 1933.
Issuer Purchases of Equity Securities
During the year ended December 31, 2019, we did not make any purchases of our common stock.
28
STOCK PERFORMANCE CHART
The annual changes in the cumulative total shareholder return on our common stock for the five-year period shown in the graph below are based on the assumption that $100 had been invested in our common stock, the Standard & Poor’s 500 Stock Index, the Standard & Poor’s Small Cap 600 Stock Index, the Russell 2000 Stock Index, the Standard & Poor’s 500 Health Care Services Index, and the Standard & Poor’s 500 Health Care Facilities Index on December 31, 2014, and that all quarterly dividends were reinvested at the average of the closing stock prices at the beginning and end of the quarter. The total cumulative dollar returns shown on the graph represent returns that such investments would have had on December 31, 2019.
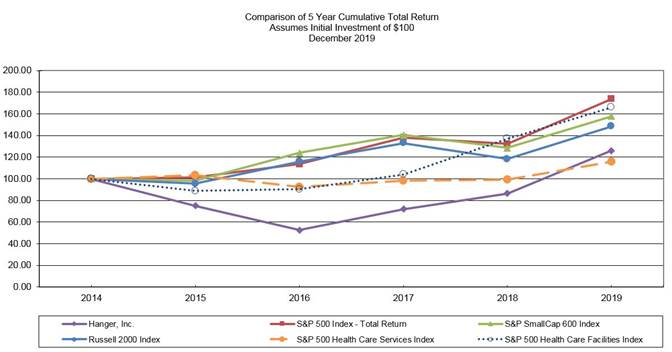
| As of December 31, | ||||||||||||||||||||||||
| 2014 | 2015 | 2016 | 2017 | 2018 | 2019 | |||||||||||||||||||
| Hanger, Inc. | $ | 100.00 | $ | 75.11 | $ | 52.51 | $ | 71.92 | $ | 86.53 | $ | 126.08 | ||||||||||||
| S&P 500 Index - Total Returns | $ | 100.00 | $ | 101.38 | $ | 113.51 | $ | 138.29 | $ | 132.23 | $ | 173.86 | ||||||||||||
| S&P Small Cap 600 Index | $ | 100.00 | $ | 98.03 | $ | 124.06 | $ | 140.48 | $ | 128.56 | $ | 157.85 | ||||||||||||
| Russell 2000 Index | $ | 100.00 | $ | 95.59 | $ | 115.95 | $ | 132.94 | $ | 118.30 | $ | 148.49 | ||||||||||||
| S&P 500 Health Care Services Index | $ | 100.00 | $ | 103.27 | $ | 92.30 | $ | 98.26 | $ | 99.47 | $ | 115.83 | ||||||||||||
| S&P 500 Health Care Facilities Index | $ | 100.00 | $ | 88.87 | $ | 90.43 | $ | 104.07 | $ | 137.20 | $ | 166.16 | ||||||||||||
Our stock price in 2016 was negatively impacted by our common stock’s suspension from trading on February 26, 2016 and subsequent delisting from trading on the NYSE and the commencement of trading on February 29, 2016 on the OTC. Our stock was relisted on the NYSE on September 11, 2018.
29
| ITEM 6. | SELECTED FINANCIAL DATA. |
The following tables set forth certain selected consolidated financial data for each of the years in the five-year period ended December 31, 2019, and is derived from the consolidated financial statements of Hanger, Inc. and its subsidiaries. The Consolidated Financial Statements for each of the years in the three-year period ended December 31, 2019 are included in this Annual Report on Form 10-K. The selected consolidated balance sheet data as of December 31, 2017, 2016, and 2015 and the consolidated statements of operations data for the years ended December 31, 2016 and 2015 are derived from our consolidated financial statements, which are not included in this Annual Report on Form 10-K. The selected consolidated financial data set forth below is qualified in its entirety by, and should be read in conjunction with, the consolidated financial statements and notes thereto and “Management’s Discussion and Analysis of Financial Condition and Results of Operations” in this Annual Report on Form 10-K.
30
| Year Ended December 31, | ||||||||||||||||||||
| Consolidated Statements of Operations and Comprehensive Income (Loss): | 2019 | 2018 | 2017 | 2016 | 2015 | |||||||||||||||
| (in thousands, except per share amounts) | ||||||||||||||||||||
| Net revenues (1) | $ | 1,098,046 | $ | 1,048,760 | $ | 1,040,769 | $ | 1,042,054 | $ | 1,067,172 | ||||||||||
| Material costs | 357,771 | 338,017 | 329,223 | 332,071 | 336,283 | |||||||||||||||
| Personnel costs | 372,225 | 364,089 | 361,090 | 363,537 | 367,094 | |||||||||||||||
| Other operating costs | 134,943 | 123,902 | 129,831 | 139,024 | 140,839 | |||||||||||||||
| General and administrative expenses | 118,065 | 109,552 | 109,342 | 106,438 | 110,957 | |||||||||||||||
| Professional accounting and legal fees | 13,689 | 16,915 | 36,239 | 41,233 | 28,647 | |||||||||||||||
| Depreciation and amortization | 35,925 | 36,455 | 39,259 | 44,887 | 46,343 | |||||||||||||||
| Impairment of intangible assets | — | 183 | 54,735 | 86,164 | 385,807 | |||||||||||||||
| Income (loss) from operations | 65,428 | 59,647 | (18,950 | ) | (71,300 | ) | (348,798 | ) | ||||||||||||
| Interest expense, net | 34,258 | 37,566 | 57,688 | 45,199 | 29,892 | |||||||||||||||
| Loss on extinguishment of debt | — | 16,998 | — | 6,031 | 7,237 | |||||||||||||||
| Non-service defined benefit plan expense | 691 | 703 | 736 | 786 | 804 | |||||||||||||||
Income (loss) from continuing operations before income taxes | 30,479 | 4,380 | (77,374 | ) | (123,316 | ) | (386,731 | ) | ||||||||||||
| Provision (benefit) for income taxes | 2,954 | 5,238 | 27,297 | (15,910 | ) | (67,614 | ) | |||||||||||||
| Income (loss) from continuing operations | 27,525 | (858 | ) | (104,671 | ) | (107,406 | ) | (319,117 | ) | |||||||||||
Income (loss) from discontinued operations, net of income taxes | — | — | — | 935 | (7,974 | ) | ||||||||||||||
| Net income (loss) | $ | 27,525 | $ | (858 | ) | $ | (104,671 | ) | $ | (106,471 | ) | $ | (327,091 | ) | ||||||
| Total other comprehensive (loss) income | (8,020 | ) | (2,482 | ) | (246 | ) | (26 | ) | 474 | |||||||||||
| Comprehensive income (loss) | $ | 19,505 | $ | (3,340 | ) | $ | (104,917 | ) | $ | (106,497 | ) | $ | (326,617 | ) | ||||||
| Basic Per Common Share Data: | ||||||||||||||||||||
| Income (loss) from continuing operations | $ | 0.74 | $ | (0.02 | ) | $ | (2.89 | ) | $ | (2.99 | ) | $ | (8.96 | ) | ||||||
| Income (loss) from discontinued operations, net of income taxes | — | — | — | 0.03 | (0.22 | ) | ||||||||||||||
| Basic income (loss) per share | $ | 0.74 | $ | (0.02 | ) | $ | (2.89 | ) | $ | (2.96 | ) | $ | (9.18 | ) | ||||||
| Shares used to compute basic per common share amounts | 37,267 | 36,765 | 36,271 | 35,933 | 35,635 | |||||||||||||||
| Diluted Per Common Share Data: | ||||||||||||||||||||
| Income (loss) from continuing operations | $ | 0.72 | $ | (0.02 | ) | $ | (2.89 | ) | $ | (2.99 | ) | $ | (8.96 | ) | ||||||
| Income (loss) from discontinued operations, net of income taxes | — | — | — | 0.03 | (0.22 | ) | ||||||||||||||
| Diluted income (loss) per share | $ | 0.72 | $ | (0.02 | ) | $ | (2.89 | ) | $ | (2.96 | ) | $ | (9.18 | ) | ||||||
| Shares used to compute diluted per common share amounts | 38,065 | 36,765 | 36,271 | 35,933 | 35,635 | |||||||||||||||
| Year Ended December 31, | ||||||||||||||||||||
| Consolidated Balance Sheet Data: | 2019 | 2018 | 2017 | 2016 | 2015 | |||||||||||||||
| Cash and cash equivalents | $ | 74,419 | $ | 95,114 | $ | 1,508 | $ | 7,157 | $ | 58,753 | ||||||||||
| Working capital (2) | $ | 107,249 | $ | 154,626 | $ | 78,666 | $ | 55,014 | $ | 139,824 | ||||||||||
| Total assets (2) | $ | 842,253 | $ | 703,010 | $ | 640,423 | $ | 755,104 | $ | 973,084 | ||||||||||
| Total debt | $ | 498,873 | $ | 510,673 | $ | 450,264 | $ | 472,650 | $ | 566,433 | ||||||||||
| Shareholders’ equity (deficit) | $ | 9,504 | $ | (21,924 | ) | $ | (28,051 | ) | $ | 65,414 | $ | 165,246 | ||||||||
(1) For the years ended December 31, 2019 and 2018, net revenues reflect the adoption of Accounting Standards Update (“ASU”) 2014-09, Revenue from Contracts with Customers and related clarifying standards. Periods prior to 2018 have not been adjusted.
(2) As of December 31, 2019, the balance sheet data reflects the adoption of ASU 2016-02, Leases and related clarifying standards. Periods prior to 2019 have not been adjusted.
For further information regarding the comparability of the financial data presented in the tables above and factors that may impact the comparability of future results, see “Management’s Discussion and Analysis of Financial Condition and Results of Operations,” as well as the consolidated financial statements and notes included in this Annual Report and previously filed Annual Reports on Form 10-K.
31
| ITEM 7. | MANAGEMENT’S DISCUSSION AND ANALYSIS OF FINANCIAL CONDITION AND RESULTS OF OPERATIONS. |
Forward Looking Statements
This Annual Report on Form 10-K including this “Management’s Discussion and Analysis of Financial Condition and Results of Operations” (or “Management’s Discussion and Analysis”) contains statements that are forward-looking statements within the meaning of the federal securities laws. Forward-looking statements include information concerning our liquidity and our possible or assumed future results of operations, including descriptions of our business strategies. These statements often include words such as “believe,” “expect,” “project,” “potential,” “anticipate,” “intend,” “plan,” “estimate,” “seek,” “will,” “may,” “would,” “should,” “could,” “forecasts,” or similar words. These statements are based on certain assumptions that we have made in light of our experience in the industry as well as our perceptions of historical trends, current conditions, expected future developments, and other factors we believe are appropriate in these circumstances. We believe these judgments are reasonable, but you should understand that these statements are not guarantees of performance or results, and our actual results could differ materially from those expressed in the forward-looking statements due to a variety of important factors, both positive and negative, that may be revised or supplemented in subsequent reports.
Readers are cautioned that all forward-looking statements involve known and unknown risks and uncertainties including, without limitation, those described in Item 1A. “Risk Factors” contained in this Annual Report on Form 10-K, some of which are beyond our control. Although we believe that the assumptions underlying the forward-looking statements contained herein are reasonable, any of the assumptions could be inaccurate. Therefore, there can be no assurance that the forward-looking statements included in this report will prove to be accurate. Actual results could differ materially and adversely from those contemplated by any forward-looking statement. In light of the significant risks and uncertainties inherent in the forward-looking statements included herein, the inclusion of such information should not be regarded as a representation by us or any other person that our objectives and plans will be achieved. We undertake no obligation to publicly release any revisions to any forward-looking statements in this discussion to reflect events and circumstances occurring after the date hereof or to reflect unanticipated events. Forward-looking statements and our liquidity, financial condition, and results of operations may be affected by the risks set forth in Item 1A. “Risk Factors” or by other unknown risks and uncertainties.
Effect of Delay in Financial Filings
Beginning in the third quarter of 2014, we were delayed in the preparation and filing of our financial statements, until we regained our current filing status in the first quarter of 2018. In connection with our efforts to restate our prior financial statements, remediate our material weaknesses, regain our timely filing status, and undertake related activities, we have incurred third party professional fees in excess of the amounts we estimate that we would have otherwise incurred. The estimated excess professional fees associated with these efforts are as follows (in thousands):
| Balance to be Paid | ||||||||||||
| Year | Expensed | Paid | in Future Periods | |||||||||
| 2017 | $ | 32,301 | $ | (44,917 | ) | $ | 10,285 | |||||
| 2018 | 12,461 | (19,551 | ) | 3,195 | ||||||||
| 2019 | 8,548 | (9,256 | ) | 2,487 | ||||||||
During 2019, we expended a total of $8.5 million in excess professional fees for the primary purpose of remediating our continuing material weaknesses in internal controls over financial reporting. Due to the material weaknesses in our controls over financial reporting that existed in 2019, we undertook additional substantive procedures to test and verify financial statement amounts in connection with the preparation of our 2019 financial statements. We currently estimate that we will incur approximately $1.0 million of such excess fees during the first quarter of 2020 in connection with the completion of our remediation activities.
32
Non-GAAP Measures
We refer to certain financial measures and statistics that are not in accordance with accounting principles generally accepted in the United States of America (“GAAP”). We utilize these non-GAAP measures in order to evaluate the underlying factors that affect our business performance and trends. These non-GAAP measures should not be considered in isolation and should not be considered superior to, or as a substitute for, financial measures calculated in accordance with GAAP. We have defined and provided a reconciliation of these non-GAAP measures to their most comparable GAAP measures. The non-GAAP measure used in this Management’s Discussion and Analysis is as follows:
Same Clinic Revenues Per Day - measures the year-over-year change in revenue from clinics that have been open a full calendar year or more. Examples of clinics not included in the same center population are closures and acquisitions. Day-adjusted growth normalizes sales for the number of days a clinic was open in each comparable period.
Overview
Business Overview
General
We are a leading national provider of products and services that assist in enhancing or restoring the physical capabilities of patients with disabilities or injuries. Built on the legacy of James Edward Hanger, the first amputee of the American Civil War, we and our predecessor companies have provided O&P services for over 150 years. We provide O&P services, distribute O&P devices and components, manage O&P networks, and provide therapeutic solutions to patients and businesses in acute, post-acute, and clinic settings. We operate through two segments - Patient Care and Products & Services.
Our Patient Care segment is primarily comprised of Hanger Clinic, which specializes in the design, fabrication, and delivery of custom O&P devices through 701 patient care clinics and 111 satellite locations in 46 states and the District of Columbia as of December 31, 2019. We also provide payor network contracting services to other O&P providers through this segment.
Our Products & Services segment is comprised of our distribution services and our therapeutic solutions businesses. As a leading provider of O&P products in the United States, we engage in the distribution of a broad catalog of O&P parts, componentry, and devices to independent O&P providers nationwide. The other business in our Products & Services segment is our therapeutic solutions business, which develops specialized rehabilitation technologies and provides evidence-based clinical programs for post-acute rehabilitation to patients at approximately 4,000 skilled nursing and post-acute providers nationwide.
For the years ended December 31, 2019, 2018, and 2017, our net revenues were $1,098.0 million, $1,048.8 million, and $1,040.8 million, respectively. We recorded net income of $27.5 million for the year ended December 31, 2019, and net losses of $0.9 million and $104.7 million for the years ended December 31, 2018 and 2017, respectively.
Industry Overview
We estimate that approximately $4.3 billion is spent in the United States each year for prescription-based O&P products and services through O&P clinics. We believe our Patient Care segment currently accounts for approximately 21% of the market, providing a comprehensive portfolio of orthotic, prosthetic, and post-operative solutions to patients in acute, post-acute, and patient care clinic settings.
The O&P patient care services market is highly fragmented and is characterized by regional and local independent O&P businesses operated predominantly by independent operators, but also including two O&P product manufacturers with international patient care services operations. We do not believe that any single competitor accounts for more than approximately 2% of the nation’s total estimated O&P clinic revenues.
33
The industry is characterized by stable, recurring revenues, primarily resulting from new patients as well as the need for periodic replacement and modification of O&P devices. We anticipate that the demand for O&P services will continue to grow as the nation’s population increases, and as a result of several trends, including the aging of the U.S. population, there will be an increase in the prevalence of disease-related disability and the demand for new and advanced devices. We believe the typical replacement time for prosthetic devices is three to five years, while the typical replacement time for orthotic devices varies, depending on the device.
We estimate that approximately $1.7 billion is spent in the United States each year by providers of O&P patient care services for the O&P products, components, devices, and supplies used in their businesses. Our Products & Services segment distributes to independent providers of O&P services and supplies our own patient care clinics. We estimate that our distribution sales account for approximately 8% of the market for O&P products, components, devices, and supplies (excluding sales to our Patient Care segment).
We estimate the market for rehabilitation technologies, integrated clinical programs, and clinician training in skilled nursing facilities (“SNFs”) to be approximately $150 million annually. We currently provide these products and services to approximately 25% of the estimated 15,000 SNFs located in the U.S. We estimate the market for rehabilitation technologies, clinical programs, and training within the broader post-acute rehabilitation markets to be approximately $400 million annually. We do not currently provide a meaningful amount of products and services to this broader market.
Business Description
Patient Care
Our Patient Care segment employs approximately 1,600 clinical prosthetists, orthotists, and pedorthists, which we refer to as clinicians, substantially all of which are certified by either the American Board for Certification (“ABC”) or the Board of Certification of Orthotists and Prosthetists, which are the two boards that certify O&P clinicians. To facilitate timely service to our patients, we also employ technicians, fitters, and other ancillary providers to assist its clinicians in the performance of their duties. Through this segment, we additionally provide network contracting services to independent providers of O&P.
Patients are typically referred to Hanger Clinic by an attending physician who determines a patient’s treatment and writes a prescription. Our clinicians then consult with both the referring physician and the patient with a view toward assisting in the selection of an orthotic or prosthetic device to meet the patient’s needs. O&P devices are increasingly technologically advanced and custom designed to add functionality and comfort to patients’ lives, shorten the rehabilitation process, and lower the cost of rehabilitation.
Based on the prescription written by a referring physician, our clinicians examine and evaluate the patient and either design a custom device or, in the case of certain orthotic needs, utilize a non-custom device, including, in appropriate circumstances, an “off the shelf” device, to address the patient’s needs. When fabricating a device, our clinicians ascertain the specific requirements, componentry, and measurements necessary for the construction of the device. Custom devices are constructed using componentry provided by a variety of third party manufacturers that specialize in O&P, coupled with sockets and other elements that are fabricated by our clinicians and technicians, to meet the individual patient’s physical and ambulatory needs. Our clinicians and technicians typically utilize castings, electronic scans, and other techniques to fabricate items that are specialized for the patient. After fabricating the device, a fitting process is undertaken and adjustments are made to ensure the achievement of proper alignment, fit, and patient comfort. The fitting process often involves several stages to successfully achieve desired functional and cosmetic results.
Given the differing physical weight and size characteristics, location of injury or amputation, capability for physical activity and mobility, cosmetic, and other needs of each individual patient, each fabricated prosthesis and orthosis is customized for each particular patient. These custom devices are commonly fabricated at one of our regional or national fabrication facilities.
34
We have earned a reputation within the O&P industry for the development and use of innovative technology in our products, which has increased patient comfort and capability and can significantly enhance the rehabilitation process. Frequently, our proprietary Insignia scanning system is used in the fabrication process. The Insignia system scans the patient and produces an accurate computer-generated image, resulting in a faster turnaround for the patient’s device and a more professional overall experience.
In recent years, we have established a centralized revenue cycle management organization that assists our clinics in pre-authorization, patient eligibility, denial management, collections, payor audit coordination, and other accounts receivable processes.
The principal reimbursement sources for our services are:
| • | Commercial private payors and other non-governmental organizations, which consist of individuals, rehabilitation providers, commercial insurance companies, health management organizations (“HMOs”), preferred provider organizations (“PPOs”), hospitals, vocational rehabilitation centers, workers’ compensation programs, third party administrators, and similar sources; |
| • | Medicare, a federally funded health insurance program providing health insurance coverage for persons aged 65 or older and certain persons with disabilities; |
| • | Medicaid, a health insurance program jointly funded by federal and state governments providing health insurance coverage for certain persons in financial need, regardless of age, which may supplement Medicare benefits for persons aged 65 or older in financial need; and |
| • | the U.S. Department of Veterans Affairs (“VA”). |
We typically enter into contracts with third party payors that allow us to perform O&P services for a referred patient and to be paid under the contract with the third party payor. These contracts usually have a stated term of one to three years. These contracts generally may be terminated without cause by either party on 60 to 90 days’ notice, or on 30 days’ notice if we have not complied with certain licensing, certification, program standards, Medicare or Medicaid requirements, or other regulatory requirements. Reimbursement for services is typically based on a fee schedule negotiated with the third party payor that reflects various factors, including market conditions, geographic area, and number of persons covered. Many of our commercial contracts are indexed to the commensurate Medicare fee schedule that relates to the products or services being provided.
Government reimbursement is comprised of Medicare, Medicaid, and the VA. These payors set maximum reimbursement levels for O&P services and products. Medicare prices are adjusted each year based on the Consumer Price Index for All Urban Consumers (“CPI-U”) unless Congress acts to change or eliminate the adjustment. The CPI-U is adjusted further by an efficiency factor (the “Productivity Adjustment” or the “Multi-Factor Productivity Adjustment”) in order to determine the final rate adjustment each year. There can be no assurance that future adjustments will not reduce reimbursements for O&P services and products from these sources.
We, and the O&P industry in general, are subject to various Medicare compliance audits, including Recovery Audit Contractor (“RAC”) audits, Comprehensive Error Rate Testing (“CERT”) audits, Targeted Probe and Educate (“TPE”) audits, Zone Program Integrity Contractor (“ZPIC”) audits, Supplemental Medical Review Contractor (“SMRC”) audits, and Universal Payment Identification Code (“UPIC”) audits. TPE audits are generally pre-payment audits, while RAC, CERT, ZPIC, and SMRC audits are generally post-payment audits. UPIC audits can be both pre- or post-payment audits, with a majority currently pre-payment. TPE audits replaced the previous Medicare Administrative Contractor audits. Adverse post-payment audit determinations generally require Hanger to reimburse Medicare for payments previously made, while adverse pre-payment audit determinations generally result in the denial of payment. In either case, we can request a redetermination or appeal, if we believe the adverse determination is unwarranted, which can take an extensive period of time to resolve, currently up to six years or more.
35
Products & Services
Through our wholly-owned subsidiary, Southern Prosthetic Supply, Inc. (“SPS”), we distribute O&P components to independent O&P clinics and other customers. Through our wholly-owned subsidiary, Accelerated Care Plus Corp. (“ACP”), our therapeutic solutions business is a leading provider of rehabilitation technologies and integrated clinical programs to skilled nursing and post-acute rehabilitation providers. Our value proposition is to provide our customers with a full-service “total solutions” approach encompassing proven medical technology, evidence-based clinical programs, and ongoing consultative education and training. Our services support increasingly advanced treatment options for a broader patient population and more medically complex conditions. We currently serve approximately 4,000 skilled nursing and post-acute providers nationwide. Through our SureFit subsidiary, we also manufacture and sell therapeutic footwear for diabetic patients in the podiatric market. We also operate the Hanger Fabrication Network, which fabricates custom O&P devices for our patient care clinics as well as for independent O&P clinics.
Through our internal “supply chain” organization, we purchase, warehouse, and distribute over 450,000 SKUs from more than 300 different manufacturers through SPS or directly to our own clinics within our Patient Care segment. Our warehousing and distribution facilities in Nevada, Georgia, Illinois, Pennsylvania, and Texas provide us with the ability to deliver products to the vast majority of our customers in the United States within two business days.
Our supply chain organization enables us to:
| • | centralize our purchasing and thus lower our material costs by negotiating purchasing discounts from manufacturers; |
| • | better manage our patient care clinic inventory levels and improve inventory turns; |
| • | improve inventory quality control; |
| • | encourage our patient care clinics to use the most clinically appropriate products; and |
| • | coordinate new product development efforts with key vendors. |
Reimbursement Trends
In our Patient Care segment, we are reimbursed primarily through employer-based plans offered by commercial insurance carriers, Medicare, Medicaid, and the VA. The following is a summary of our payor mix, expressed as an approximate percentage of net revenues for the periods indicated:
| For the Years Ended December 31, | ||||||||||||
| 2019 | 2018 | 2017 | ||||||||||
| Medicare | 31.9 | % | 31.9 | % | 30.5 | % | ||||||
| Medicaid | 15.8 | % | 15.5 | % | 15.6 | % | ||||||
| Commercial Insurance/Managed Care (excluding Medicare and Medicaid Managed Care) | 35.8 | % | 37.0 | % | 38.2 | % | ||||||
| Veterans Administration | 9.8 | % | 9.1 | % | 8.7 | % | ||||||
| Private Pay | 6.7 | % | 6.5 | % | 7.0 | % | ||||||
| Patient Care | 100.0 | % | 100.0 | % | 100.0 | % | ||||||
Patient Care constituted 82.5%, 81.8%, and 81.9% of our net revenues for the year ended December 31, 2019, 2018, and 2017, respectively. Our remaining net revenues were provided by our Products & Services segment which derives its net revenues from commercial transactions with independent O&P providers, healthcare facilities, and other customers. In contrast to net revenues from our Patient Care segment, payment for these products and services are not directly subject to third party reimbursement from health care payors.
36
The amount of our reimbursement varies based on the nature of the O&P device we fabricate for our patients. Given the particular physical weight and size characteristics, location of injury or amputation, capability for physical activity, and mobility, cosmetic, and other needs of each individual patient, each fabricated prostheses and orthoses is customized for each particular patient. The nature of this customization and the manner by which our claims submissions are reviewed by payors makes our reimbursement process administratively difficult.
To receive reimbursement for our work, we must ensure that our clinical, administrative, and billing personnel receive and verify certain medical and health plan information, record detailed documentation regarding the services we provide, and accurately and timely perform a number of claims submission and related administrative tasks. It is our belief the increased nationwide efforts to reduce health care costs has driven changes in industry trends with increases in payor pre-authorization processes, documentation requirements, pre-payment reviews, and pre- and post-payment audits, and our ability to successfully undertake these tasks using our traditional approach has become increasingly challenging. We believe these changes in industry trends have been brought about in part by increased nationwide efforts to reduce health care costs.
A measure of our effectiveness in securing reimbursement for our services can be found in the degree to which payors ultimately disallow payment of our claims. Payors can deny claims due to their determination that a physician who referred a patient to us did not sufficiently document that a device was medically necessary or clearly establish the ambulatory (or “activity”) level of a patient. Claims can also be denied based on our failure to ensure that a patient was currently eligible under a payor’s health plan, that the plan provides full O&P benefits, that we received prior authorization, or that we filed or appealed the payor’s determination timely, as well as on the basis of our coding, failure by certain classes of patients to pay their portion of a claim, or for various other reasons. If any portion of, or administrative factor within, our claim is found by the payor to be lacking, then the entirety of the claim amount may be denied reimbursement.
Commencing in late 2014 and continuing through today, we have taken a number of actions to manage disallowed revenue trends. These initiatives included: (i) the creation of a central revenue cycle management function; (ii) addressing the issues identified in our patient management and electronic health record system; and (iii) the establishment of new clinic-level procedures and training regarding the collection of supporting documentation and the importance of diligence in our claims submission processes.
37
Disallowed revenue is considered an adjustment to the transaction price. Estimated uncollectible amounts due to us by patients are generally considered implicit price concessions and are presented as a reduction of net revenues. These amounts recorded in net revenues within the Patient Care segment for the years ended December 31, 2019, 2018, and 2017 are as follows:
| For the Years Ended December 31, | ||||||||||||
| (dollars in thousands) | 2019 | 2018 | 2017 | |||||||||
| Gross charges | $ | 956,852 | $ | 900,035 | $ | 888,935 | ||||||
| Less estimated implicit price concessions arising from: | ||||||||||||
| Payor disallowances | 40,581 | 38,410 | 36,962 | |||||||||
| Patient non-payments | 10,580 | 4,243 | — | |||||||||
| Payor disallowances and patient non-payments | $ | 51,161 | $ | 42,653 | $ | 36,962 | ||||||
| Net revenues | $ | 905,691 | $ | 857,382 | $ | 851,973 | ||||||
| Payor disallowances | $ | 40,581 | $ | 38,410 | $ | 36,962 | ||||||
| Patient non-payments | 10,580 | 4,243 | — | |||||||||
| Bad debt expense | — | — | 8,921 | |||||||||
| Payor disallowances, patient non-payments, and bad debt expense | $ | 51,161 | $ | 42,653 | $ | 45,883 | ||||||
| Payor disallowances % | 4.2 | % | 4.3 | % | 4.2 | % | ||||||
| Patient non-payments % | 1.1 | % | 0.4 | % | — | % | ||||||
| Bad debt expense % | — | % | — | % | 1.0 | % | ||||||
| Percent of gross charges | 5.3 | % | 4.7 | % | 5.2 | % | ||||||
Our accounts receivable balances for 2015 through 2019 were as follows:
| As of December 31, | ||||||||||||||||||||
| (dollars in thousands) | 2019 | 2018 | 2017 | 2016 | 2015 | |||||||||||||||
| Gross charges before estimates for implicit price concessions | $ | 229,683 | $ | 206,880 | $ | 216,644 | $ | 221,220 | $ | 270,925 | ||||||||||
| Less estimates for implicit price concessions: | ||||||||||||||||||||
| Payor disallowances | (58,094 | ) | (53,378 | ) | (56,233 | ) | (61,137 | ) | (81,306 | ) | ||||||||||
| Patient non-payments | (9,589 | ) | (7,244 | ) | — | — | — | |||||||||||||
| Accounts receivable, gross | 162,000 | 146,258 | 160,411 | 160,083 | 189,619 | |||||||||||||||
| Allowance for doubtful accounts | (2,641 | ) | (2,272 | ) | (14,065 | ) | (15,521 | ) | (15,027 | ) | ||||||||||
| Accounts receivable, net | $ | 159,359 | $ | 143,986 | $ | 146,346 | $ | 144,562 | $ | 174,592 | ||||||||||
| Payor disallowances % | 25.3 | % | 25.8 | % | 26.0 | % | 27.6 | % | 30.0 | % | ||||||||||
| Patient non-payments % | 4.2 | % | 3.5 | % | — | % | — | % | — | % | ||||||||||
| Allowance for doubtful accounts % | 1.1 | % | 1.1 | % | 6.5 | % | 7.0 | % | 5.5 | % | ||||||||||
| Total allowance % | 30.6 | % | 30.4 | % | 32.5 | % | 34.6 | % | 35.5 | % | ||||||||||
Revenue Cycle Management
Prior to 2014, in our Patient Care segment, we performed our eligibility, patient pre-authorization, patient documentation, claims coding, claims submission, collection, cash application, and claims audit support activities (our “revenue cycle management” functions) primarily on a decentralized location by location basis. Due to the increases experienced in disallowed revenue, as well as to address certain procedural requirements of our new patient management and electronic health record system and to otherwise improve the effectiveness of our revenue cycle management functions, during 2014 we commenced the process of establishing a centralized revenue cycle management organization with the strategy to gradually transition these functions from our decentralized clinics to a centralized organization. We have continued to expand this initiative through fiscal year 2019.
38
As discussed in the “Reimbursement Trends” section above, we have experienced decreases in our disallowed revenue subsequent to the establishment of our revenue cycle management function when compared to 2014. In addition to other training and claims documentation initiatives, we believe that decreases we have experienced in disallowed revenue (as well as our overall accounts receivables balances) are due in part to our revenue cycle management initiative.
Clinic-Level Claims Documentation
In addition to our revenue cycle management initiatives and resolution of the aforementioned issues associated with our implementation of our new electronic health record and patient management system, in 2016 we commenced more intensive training and increased our internal clinic-level emphasis on the importance of adherence to procedural and documentation standards. The lack of sufficient documentation establishing medical necessity and a patient’s degree of ability for future activity is a key factor utilized by payors when denying our claims for reimbursement. Irrespective of a patient’s need and the existence of a referral from the treating physician, we have found it increasingly necessary to retrieve other supporting documentation and notes from referring physicians themselves to further justify and document their medical determinations relating to the patients they refer to us. Given that these referring physicians do not work for us, the retrieval of this additional information to suit payors can be difficult and time-consuming.
We believe our efforts to increase our discipline through this clinic-level claims documentation initiative assisted us in further reducing the level of our disallowed sales. However, we also believe these efforts had a one-time indirect effect of reducing our overall revenue growth rate. In addition to other factors affecting our same clinic sales trends in 2016 and early 2017, as clinicians and their office administrators increased their attention on achieving higher documentation standards, we believe we were able to see and treat fewer patients, thereby contributing to our reduced same clinic patient care net revenue in those years.
We applied these procedural and documentation standards throughout 2019 and plan to continue to do so in 2020. With the initial implementation impact behind us, we do not believe the use of these standards was a significant factor on our year-over-year growth in 2019, nor do we expect them to be in 2020.
Increasing Patient Responsibility for the Cost of Devices
The majority of our devices are provided as replacement devices to patients with devices that are broken or have become worn with age. Prosthetic devices are typically replaced every three to five years. In recent years, an increasing number of employers have been shifting the cost burdens in their health plans to employees through use of “high deductible” or “consumer-driven” health plans. These plan designs typically require the patient to bear a greater portion of the cost of their care in exchange for a lower monthly premium. We believe the increased use of these plans has and will continue to have the effect of causing patients to delay the replacement of their devices and could accordingly adversely impact our net revenue, and could also negatively impact our net revenue through higher patient non-payments.
Favorable Settlements
For year ended December 31, 2018, our results of operations and net income benefited from the favorable resolution of two matters.
On May 15, 2018, we received a net favorable settlement of $1.7 million in connection with our long standing damage claims relating to the “Deepwater Horizon” disaster, and the prior adverse effect which it had on our clinic operations along the Gulf Coast in April of 2010. We do not anticipate further payments in connection with this matter as this settlement constituted a full and final satisfaction of our claims. The benefit of this settlement has been recognized as a reduction to our general and administrative expenses for the year ended December 31, 2018.
On June 28, 2018, we entered into an agreement with the State of Delaware, and made payment, to satisfy all of the State’s abandoned or unclaimed property claims transactions represented within the period of January 1, 2001 through December 31, 2012 which were reportable through December 31, 2017 in the amount of $2.2 million. This agreed upon payment amount was favorable by $0.5 million to the amount we had previously estimated for these liabilities and had the effect of reducing our general and administrative expenses by this amount for the year ended December 31, 2018. Additionally, under the terms of the agreement, we were not required to pay interest on the previously unremitted cumulative abandoned or unclaimed property relating to this twelve year period in the amount of $1.5 million, which had the effect of lowering our interest expense for the year ended December 31, 2018 by this accrued interest amount.
39
New Systems Implementations
In recent years, we have been undertaking the implementation of a new patient management and electronic health record system at our patient care clinics, which we completed in the first quarter of 2019. For the three month period ended March 31, 2019, we expensed $0.8 million in training, travel, and related implementation costs. For the years ended December 31, 2018 and 2017, we expensed $4.4 million, and $4.3 million, respectively, for these implementation expenses. As we undertake acquisitions of independent O&P providers, we intend to convert these acquired clinics to this system in the ordinary course of our business.
During 2019, we commenced the design, implementation planning, and initial implementation of new financial and supply chain systems, and plan to invest in new servers and software that operate as a part of our technology infrastructure. In connection with our new financial and supply chain systems, for the year ended December 31, 2019, we have expensed $2.9 million. We are additionally incurring increased capital expenditures in connection with improvements to our systems’ infrastructure. In 2020, we currently expect to incur technology-related implementation expenses for the financial and supply chain projects of approximately $5.0 million and approximately $2.0 million in lease termination and related facility transition expenses. In addition, we expect to incur further significant cash outlays and capital expenditures in connection with our supply chain, financial systems, and technology infrastructure initiatives. For a further discussion of our current outlook for capital expenditures and systems implementation expenditures, refer to the “Financial Condition, Liquidity, and Capital Resources” section below.
In August 2018, the Financial Accounting Standards Board (“FASB”) issued ASU 2018-15, Intangibles - Goodwill and Other - Internal-Use Software (Topic 350) - Customer’s Accounting for Implementation Costs Incurred in a Cloud Computing Arrangement That Is a Service Contract. Effective July 1, 2019, we elected to early adopt the requirements of the standard on a prospective basis. The new guidance aligns the requirements for capitalizing implementation costs incurred in a hosting arrangement that is a service contract with the requirements for capitalizing implementation costs incurred to develop or obtain internal-use software (and hosting arrangements that include an internal-use software license). Under the new standard, certain of the implementation costs of our new financial and supply chain system will be capitalized. As of December 31, 2019, we capitalized $2.1 million of implementation costs for cloud computing arrangements, net of accumulated amortization, and recorded in other current assets and other assets in the consolidated balance sheet.
Business Environment and Outlook
Patient Care
In our Patient Care segment, we have a positive view of the long-term need for prosthetic and orthotic devices and services within the markets that we serve. To address the debilitating effects of injuries and medical conditions such as diabetes, vascular disease, cancer, and congenital disorders, we believe patients will have a continuing need for the O&P services that we provide. As the population grows and ages, we also believe there will be a gradual underlying increase in market demand.
To ensure we maintain and grow our share of this market, we believe that it will be necessary for us to find effective means to automate and better organize our business processes, further improve our reimbursement capabilities, and lower our cost structure in the longer term. Our size may afford us the ability to achieve economies of scale through purchasing and process automation initiatives that could be difficult for our smaller competitors. However, our size can work against us if we do not succeed in effectively serving our referring physicians and in competing with our individual competitors in each of the markets that we serve.
40
Products & Services
Generally, we believe our distribution customers encounter reimbursement pressures similar to those that we do in our own Patient Care services and, depending on their ability to adapt to the increased claims documentation standards that have emerged in our industry, that this may either limit the rate of growth of some of our customers, or otherwise affect the rate of growth we experience in our distribution of O&P componentry to independent providers. Additionally, during 2020, we plan to discontinue our distribution of certain low-margin orthotics products to podiatrists. While we do not anticipate that this will have a significant effect on earnings, we currently estimate that our revenue from distribution will decrease by approximately $5 million during 2020.
Within our Products & Services segment, in addition to our distribution of products, we provide therapeutic equipment and services to patients at SNFs and other healthcare provider locations. Since 2016, a number of our clients, including several of our larger SNF clients, began to discontinue their use of our therapeutic services. We believe these discontinuances relate primarily to their overall efforts to reduce the costs they bear for therapy-related services within their facilities. As a part of those terminations of service, in a number of cases, we elected to sell terminating clients the equipment that we had utilized for their locations, which resulted in our recognition of $2.4 million in equipment sales in 2019, as compared with $4.1 million in 2018 and $3.1 million in 2017. For the year ended December 31, 2019, due to customer discontinuances, we experienced a decrease of $4.7 million in therapeutic services and supplies revenue and of $1.7 million in therapeutic equipment sales, for a total reduction of $6.4 million in revenues we received from therapeutic equipment and services. We recognized a total of $49.0 million in revenues from therapeutic equipment and services in 2019. In 2020, we anticipate a further decline of approximately $2 million in revenue related to these services. Within this portion of our business, we have responded to these trends through increases in our marketing programs which convey the value we believe our services have to patients at SNFs and other adjacent health services provider markets.
Acquisitions
During 2019, we completed the following acquisitions of O&P clinics, none of which were individually material to our financial position, results of operations, or cash flows:
| • | In the first quarter of 2019, we completed the acquisition of all the outstanding equity interests of an O&P business for total consideration of $32.8 million, of which $27.7 million was cash consideration, net of cash acquired, $4.4 million was issued in the form of notes to shareholders at fair value, and $0.7 million in additional consideration. |
| • | In the second quarter of 2019, we completed the acquisition of all the outstanding equity interests of an O&P business for total consideration of $0.5 million, of which $0.2 million was cash consideration, net of cash acquired, and $0.3 million was issued in the form of notes to shareholders at fair value. |
| • | In the third quarter of 2019, we completed the acquisition of all the outstanding equity interests of one O&P business and acquired the assets of another O&P business for total consideration of $3.3 million, of which $3.0 million was cash consideration, net of cash acquired, and $0.3 million was issued in the form of notes to shareholders at fair value. |
| • | In the fourth quarter of 2019, we completed the acquisition of all the outstanding equity interests of one O&P business and acquired the assets of another O&P business for total consideration of $7.8 million, of which $5.0 million was cash consideration, net of cash acquired, and $2.8 million was issued in the form of notes to shareholders at fair value. |
In the fourth quarter of 2018, we completed the acquisitions of two O&P businesses for an aggregate purchase price of $3.1 million. The purchase price consisted of $2.0 million in cash consideration, net of cash acquired, and $1.1 million was issued in unsecured notes to the seller. We made no acquisitions in the first nine months of 2018 or in the year of 2017.
41
Acquisition-related costs are included in general and administrative expenses in our consolidated statements of operations. Total acquisition-related costs incurred during the year ended December 31, 2019 were $1.5 million, which includes those costs for transactions that are in progress or not completed during the respective period. Acquisition-related costs incurred for acquisitions completed during the year ended December 31, 2019 were $1.0 million.
Seasonality
We believe our business is affected by the degree to which patients have otherwise met the deductibles for which they are responsible in their medical plans during the course of the year. The first quarter is normally our lowest relative net revenue quarter, followed by the second and third quarters, which are somewhat higher and consistent with one another. Due to the general fulfillment by patients of their health plan co-payments and deductible requirements towards the year’s end, our fourth quarter is normally our highest revenue producing quarter.
Our results are also affected, to a lesser extent, by our holding of an education fair in the first quarter of each year. This one-week event is conducted to assist our clinicians in maintaining their training and certification requirements and to facilitate a national meeting with our clinical leaders. We also invite manufacturers of the componentry for the devices we fabricate to these annual events so they can demonstrate their products and otherwise assist in our training process. During the first quarter of 2019, 2018, and 2017, we spent approximately $2.3 million, $2.3 million, and $2.0 million, respectively, on travel and other costs associated with this one-week event. In addition to the costs we incur associated with this annual event, we also lose the productivity of a significant portion of our clinicians during the one-week period in which this event occurs, which contributes to the lower seasonal revenue level we experience during the first quarter of each year.
Critical Accounting Policies
Our analysis and discussion of our financial condition and results of operations is based upon the consolidated financial statements that have been prepared in accordance with GAAP. The preparation of consolidated financial statements in conformity with GAAP requires management to make estimates and assumptions that affect the reported amounts of assets and liabilities, disclosure of contingent assets and liabilities at the date of the consolidated financial statements, and the reported amounts of revenues and expenses during the reporting period. GAAP provides the framework from which to make these estimates, assumptions, and disclosures. We have chosen accounting policies within GAAP that management believes are appropriate to fairly present, in all material respects, our operating results, and financial position. Our significant accounting policies are stated in Note A - “Organization and Summary of Significant Accounting Policies” to the consolidated financial statements included in this Annual Report on Form 10-K. We believe the following accounting policies are critical to understanding our results of operations and the more significant judgments and estimates used in the preparation of our consolidated financial statements.
Revenue Recognition
Patient Care Segment
Revenue in our Patient Care segment is primarily derived from contracts with third party payors for the provision of O&P devices and is recognized upon the transfer of control of promised products or services to the patient at the time the patient receives the device. At, or subsequent to delivery, we issue an invoice to the third party payor, which primarily consists of commercial insurance companies, Medicare, Medicaid, the VA, and private or patient pay (“Private Pay”) individuals. We recognize revenue for the amounts we expect to receive from payors based on expected contractual reimbursement rates, which are net of estimated contractual discounts and implicit price concessions. These revenue amounts are further revised as claims are adjudicated, which may result in additional disallowances. As such, these adjustments do not relate to an inability to pay, but to contractual allowances, our failure to ensure that a patient was currently eligible under a payor’s health plan, the plan provides full O&P benefits, we received prior authorization, or we filed or appealed the payor’s determination timely, the basis of our coding, failure by certain classes of patients to pay their portion of a claim, or other administrative issues which are considered as part of the transaction price and recorded as a reduction of revenues.
42
Our products and services are sold with a 90-day labor and 180-day warranty for fabricated components. Warranties are not considered a separate performance obligation. We estimate warranties based on historical trends and include them in accrued expenses and other current liabilities in the consolidated balance sheet. The warrant liability was $2.5 million at December 31, 2019 and $2.1 million at December 31, 2018.
A portion of our O&P revenue comes from the provision of cranial devices. In addition to delivering the cranial device, there are patient follow-up visits where we assist in treating the patient’s condition by adjusting or modifying the cranial device. We conclude that, for these devices, there are two performance obligations and use the expected cost plus margin approach to estimate for the standalone selling price of each performance obligation. The allocated portion associated with the patient’s receipt of the cranial device is recognized when the patient receives the device while the portion of revenue associated with the follow-up visits is initially recorded as deferred revenue. On average, the cranial device follow-up visits occur under 90 days after the patient receives the device and the deferred revenue is recognized on a straight-line basis over the period.
Medicare and Medicaid regulations and the various agreements we have with other third party payors, including commercial healthcare payors under which these contractual adjustments and disallowed revenue are calculated, are complex and are subject to interpretation and adjustment and may include multiple reimbursement mechanisms for different types of services. Therefore, the particular O&P devices and related services authorized and provided, and the related reimbursement, are subject to interpretation and adjustment that could result in payments that differ from our estimates. Additionally, updated regulations and reimbursement schedules, and contract renegotiations occur frequently, necessitating regular review and assessment of the estimation process by management. As a result, there is a reasonable possibility that recorded estimates could change and any related adjustments will be recorded as adjustments to net revenue when they become known.
Products & Services Segment
Revenue in our Products & Services segment is derived from the distribution of O&P components and the leasing and sale of rehabilitation equipment and ancillary consumable supplies combined with equipment maintenance, education, and training.
Distribution services revenues are recognized when obligations under the terms of a contract with our customers are satisfied, which occurs with the transfer of control of our products. This occurs either upon shipment or delivery of goods, depending on whether the terms are FOB Origin or FOB Destination. Payment terms are typically between 30 to 90 days. Revenue is measured as the amount of consideration we expect to receive in exchange for transferring products to a customer (“transaction price”).
To the extent that the transaction price includes variable consideration, such as prompt payment discounts, list price discounts, rebates, and volume discounts, we estimate the amount of variable consideration that should be included in the transaction price utilizing the most likely amount method. Variable consideration is included in the transaction price if, in our judgment, it is probable that a significant future reversal of cumulative revenue under the contract will not occur. Estimates of variable consideration and determination of whether to include estimated amounts in the transaction price are based largely on an assessment of our anticipated performance and all information (historical, current, and forecasted) that is reasonably available.
We reduce revenue by estimates of potential future product returns and other allowances. Provisions for product returns and other allowances are recorded as a reduction to revenue in the period sales are recognized. We make estimates of the amount of sales returns and allowances that will eventually be incurred. Management analyzes sales programs that are in effect, contractual arrangements, market acceptance, and historical trends when evaluating the adequacy of sales returns and allowance accounts.
Therapeutic program equipment and related services revenue are recognized over the applicable term the customer has the right to use the equipment and as the services are provided. Equipment sales revenue is recognized upon delivery, with any related services revenue deferred and recognized as the services are performed. Sales of consumables are recognized upon shipment.
In addition, we estimate amounts recorded to bad debt expense using historical trends and these are presented as a bad debt expense under the operating expense section of our consolidated financial statements.
43
Accounts Receivable, Net
Patient Care Segment
We establish allowances for accounts receivable to reduce the carrying value of such receivables to their estimated net realizable value. The Patient Care segment’s accounts receivables are recorded net of unapplied cash and estimated implicit price concessions, such as disallowed revenue and patient non-payments, as described in the revenue recognition accounting policy above.
Estimates for both disallowed revenue and patient non-payments apply the expected value method by considering historical collection experience by each of the Medicare and non-Medicare (commercial insurance, Medicaid, the VA, and Private Pay) primary payor class groupings. For each payor class grouping, liquidation analysis of historical period end receivable balances are performed to ascertain collections experience by aging category. We believe the use of historical collection experience applied to current period end receivable balances is reasonable. In the absence of an evident adverse trend, we use historical experience rates calculated using an average of four quarters of data with at least twelve months of adjudication. We believe the time periods analyzed provide sufficient time for most balances to adjudicate in the normal course of operations. We will modify the time periods analyzed when significant trends indicate that adjustments should be made. In addition, estimates are adjusted when appropriate for information available up through the issuance of the consolidated financial statements.
Products & Services Segment
Our Products & Services segment’s allowance for doubtful accounts is estimated based on the analysis of the segment’s historical write-offs experience, accounts receivable aging, and economic status of its customers. Accounts receivable that are deemed uncollectible are written off to the allowance for doubtful accounts. Accounts receivable are also recorded net of an allowance for estimated sales returns.
Inventories
Inventories are valued at the lower of estimated cost or net realizable value with cost determined on a first-in, first-out (“FIFO”) basis. Provisions have also been made to reduce the carrying value of inventories for excess, obsolete, or otherwise impaired inventory on hand at period-end. The reserve for excess and obsolete inventory is $7.6 million and $7.2 million at December 31, 2019 and 2018, respectively.
Patient Care Segment
Substantially all of our Patient Care segment inventories are recorded through a periodic approach whereby inventory quantities are adjusted on the basis of a quarterly physical count. Segment inventories relate primarily to raw materials and work-in-process (“WIP”) at Hanger Clinics. Inventories at Hanger Clinics totaled $29.4 million and $27.5 million at December 31, 2019 and 2018, respectively, with WIP inventory representing $10.2 million and $9.3 million of the total inventory, respectively.
Raw materials consist of purchased parts, components, and supplies which are used in the assembly of O&P devices for delivery to patients. In some cases, purchased parts and components are also sold directly to patients. Raw materials are valued based on recent vendor invoices, reduced by estimated vendor rebates. Such rebates are recognized as a reduction of cost of materials in the consolidated statements of operations when the related devices or components are delivered to the patient. Approximately 74% of raw materials at December 31, 2019 and 2018, respectively were purchased from our Products & Services segment. Raw material inventory was $19.2 million and $18.2 million at December 31, 2019 and 2018, respectively.
WIP consists of devices which are in the process of assembly at our clinics or fabrication centers. WIP quantities were determined by the physical count of patient orders at the end of every quarter of 2019 and 2018 while the related stage of completion of each order was established by clinic personnel. We do not have an inventory costing system and as a result, the identified WIP quantities were valued on the basis of estimated raw materials, labor, and overhead costs. To estimate such costs, we develop bills of materials for certain categories of devices that we assemble and deliver to patients. Within each bill of material, we estimate (i) the typical types of component parts necessary to assemble each device, (ii) the points in the assembly process when such component parts are added, (iii) the estimated cost of such parts based on historical purchasing data, (iv) the estimated labor costs incurred at each stage of assembly, and (v) the estimated overhead costs applicable to the device.
44
Products & Services Segment
Product & Service segment inventories consist primarily of finished goods at its distribution centers as well as raw materials at fabrication facilities, and totaled $38.8 million and $40.2 million as of December 31, 2019 and 2018, respectively. Finished goods include products that are available for sale to third party customers as well as to our Patient Care segment as described above. Such inventories were determined on the basis of perpetual records and a physical count at year end. Inventories in connection with therapeutic services are valued at a weighted average cost.
Business Combinations
We record tangible and intangible assets acquired and liabilities assumed in business combinations under the acquisition method of accounting. Acquisition consideration typically includes cash payments, the issuance of Seller Notes and in certain instances contingent consideration with payment terms based on the achievement of certain targets of the acquired business. Amounts paid for each acquisition are allocated to the assets acquired and liabilities assumed based on their estimated fair values at the date of acquisition inclusive of identifiable intangible assets. The estimated fair value of identifiable assets and liabilities, including intangibles, are based on valuations that use information and assumptions available to management. We allocate any excess purchase price over the fair value of the tangible and identifiable intangible assets acquired and liabilities assumed to goodwill. Significant management judgments and assumptions are required in determining the fair value of acquired assets and liabilities assumed, particularly acquired intangible assets, including estimated useful lives. The valuation of purchased intangible assets is based upon estimates of the future performance and discounted cash flows of the acquired business. Each asset acquired or liability assumed is measured at estimated fair value from the perspective of a market participant. Subsequent changes in the estimated fair value of contingent consideration are recognized as general and administrative expenses within the consolidated statements of operations.
Goodwill and Other Intangible Assets, Net
Goodwill represents the excess of the purchase price over the estimated fair value of net identifiable assets acquired and liabilities assumed from purchased businesses. We assess goodwill for impairment annually during the fourth quarter, and between annual tests if an event occurs or circumstances change that would more likely than not reduce the fair value of a reporting unit below its carrying amount. We have the option to first assess qualitative factors for a reporting unit to determine whether it is more likely than not that the fair value of a reporting unit is less than its carrying amount as a basis for determining whether it is necessary to perform the quantitative goodwill impairment test. If we choose to bypass this qualitative assessment or alternatively determine that a quantitative goodwill impairment test is required, our annual goodwill impairment test is performed by comparing the estimated fair value of a reporting unit with its carrying amount (including attributed goodwill). We measure the fair value of the reporting units using a combination of income and market approaches. Any impairment would be recognized by a charge to income from operations and a reduction in the carrying value of the goodwill. As of October 1, 2019, we performed a qualitative assessment of the Patient Care reporting unit, which resulted in no indicators of goodwill impairment.
We apply judgment in determining the fair value of our reporting units and the implied fair value of goodwill which is dependent on significant assumptions and estimates regarding expected future cash flows, terminal value, changes in working capital requirements, and discount rates.
For the year ended December 31, 2017, we recorded impairments of our goodwill totaling $53.3 million, respectively. We did not have any goodwill impairment during 2019 and 2018. For the years ended December 31, 2018, and 2017, we recorded impairments of our indefinite-lived trade name totaling $0.2 million, and $1.4 million, respectively. We did not have any indefinite-lived trade name impairment during 2019. See Note H - “Goodwill and Other Intangible Assets” to our consolidated financial statements in this Annual Report on Form 10-K for additional information regarding these charges.
45
As described, we apply judgment in the selection of key assumptions used in the goodwill impairment test and as part of our evaluation of intangible assets tested annually and at interim testing dates as necessary. If these assumptions differ from actual, we could incur additional impairment charges and those charges could be material.
Income Taxes
We recognize deferred tax assets and liabilities for net operating loss and other credit carry forwards and the expected tax consequences of temporary differences between the tax basis of assets and liabilities and their reported amounts using enacted tax rates in effect for the year the differences are expected to reverse. The ultimate realization of deferred tax assets is dependent upon the generation of future taxable income during the periods in which those temporary differences become deductible. The evaluation of deferred tax assets requires judgment in assessing the likely future tax consequences of events that have been recognized in our financial statements or tax returns, and future profitability by tax jurisdiction.
We provide a valuation allowance to reduce our deferred tax assets to the amount that is more likely than not to be realized. We evaluate our deferred tax assets quarterly to determine whether adjustments to the valuation allowance are appropriate in light of changes in facts or circumstances, such as changes in expected future pre-tax earnings, tax law, interactions with taxing authorities, and developments in case law. Our material assumptions include forecasts of future pre-tax earnings and the nature and timing of future deductions and income represented by the deferred tax assets and liabilities, all of which involve the exercise of significant judgment. We have experienced losses from 2014 to 2017 due to impairments of our intangible assets, increased professional fees in relation to our restatement and related remediation procedures for identified material weaknesses, and increased interest and bank fees. These losses have necessitated that we evaluate the sufficiency of our valuation allowance. We are in a taxable income position in 2019 and are able to utilize net operating loss. We have $2.8 million and $10.7 million of U.S. federal and $136.9 million and $166.0 million of state net operating loss carryforwards available at December 31, 2019 and 2018, respectively. These carryforwards will be used to offset future income but may be limited by the change in ownership rules in Section 382 of the Internal Revenue Code. These net operating loss carryforwards will expire in varying amounts between 2020 and 2039. We expect to generate income before taxes in future periods at a level that would allow for the full realization of the majority of our net deferred tax assets. As of December 31, 2019 and 2018, we have recorded a valuation allowance of approximately $2.1 million and $8.9 million, respectively, related to various state jurisdictions.
Based on our assessment of all available positive and negative evidence, which is completed quarterly, on a taxing jurisdiction and legal entity basis, we determined that it was more likely than not that we would be able to realize the benefit of certain state deferred tax assets and released valuation allowances of $7.1 million against our state deferred tax assets during the fourth quarter of 2019. We considered a number of types of evidence, including the nature, frequency, and severity of current and cumulative financial reporting income and losses, sources of future taxable income, future reversals of existing taxable temporary differences, and prudent and feasible tax planning strategies, weighted by objectivity. Management decided to release this valuation allowance primarily because the legal entity involved has achieved twelve quarters of cumulative financial reporting income in 2019 and is forecasting future taxable income along with other types of favorable evidence mentioned above.
We believe that our tax positions are consistent with applicable tax law, but certain positions may be challenged by taxing authorities. In the ordinary course of business, there are transactions and calculations where the ultimate tax outcome is uncertain. In addition, we are subject to periodic audits and examinations by the Internal Revenue Service and other state and local taxing authorities. In these cases, we record the financial statement effects of a tax position when it is more likely than not, based on the technical merits, that the position will be sustained upon examination. We record the largest amount of tax benefit that is greater than fifty percent likely of being realized upon settlement with a taxing authority that has full knowledge of all relevant information. If not paid, the liability for uncertain tax positions is reversed as a reduction of income tax expense at the earlier of the period when the position is effectively settled or when the statute of limitations has expired. Although we believe that our estimates are reasonable, actual results could differ from these estimates. Interest and penalties, when applicable, are recorded within the income tax provision.
46
Recent Accounting Pronouncements
Refer to the “Recent Accounting Pronouncements” section in Note A - “Organization and Summary of Significant Accounting Policies” in this Annual Report on Form 10-K for disclosure of recent accounting pronouncements that are either expected to have more than a minimal impact on our consolidated financial position and results of operation, or that we are still assessing to determine their impact.
Results of Operations - Year Ended December 31, 2019 Compared to Year Ended December 31, 2018
For the years ended December 31, 2019 and 2018, our consolidated results of operations were as follows:
| For the Years Ended December 31, | Percent (1) Change | |||||||||||
| (dollars in thousands) | 2019 | 2018 | 2019 vs 2018 | |||||||||
| Net revenues | $ | 1,098,046 | $ | 1,048,760 | 4.7 | % | ||||||
| Material costs | 357,771 | 338,017 | 5.8 | % | ||||||||
| Personnel costs | 372,225 | 364,089 | 2.2 | % | ||||||||
| Other operating costs | 134,943 | 123,902 | 8.9 | % | ||||||||
| General and administrative expenses | 118,065 | 109,552 | 7.8 | % | ||||||||
| Professional accounting and legal fees | 13,689 | 16,915 | (19.1) | % | ||||||||
| Depreciation and amortization | 35,925 | 36,455 | (1.5) | % | ||||||||
| Impairment of intangible assets | — | 183 | (100.0) | % | ||||||||
| Operating expenses | 1,032,618 | 989,113 | 4.4 | % | ||||||||
| Income from operations | 65,428 | 59,647 | 9.7 | % | ||||||||
| Interest expense, net | 34,258 | 37,566 | (8.8) | % | ||||||||
| Loss on extinguishment of debt | — | 16,998 | (100.0) | % | ||||||||
| Non-service defined benefit plan expense | 691 | 703 | (1.7) | % | ||||||||
| Income before income taxes | 30,479 | 4,380 | 595.9 | % | ||||||||
| Provision for income taxes | 2,954 | 5,238 | (43.6) | % | ||||||||
| Net income (loss) | $ | 27,525 | $ | (858 | ) | NM | ||||||
| (1) NM - Not meaningful | |||||||||||
Material costs, personnel costs, and other operating costs reflect expenses we incur in connection with our delivery of care through our clinics and other patient care operations, or through the distribution of products and services, and exclude general and administrative activities. General and administrative activities reflect expenses we incur that are not directly related to the operation of our clinics or provision of products and services.
Due to the substantial amount we have incurred for professional accounting and legal services, we separately disclose these expenses within operating expenses. In connection with our efforts to restate our prior financial statements, remediate our material weaknesses, regain our timely filing status, and undertake related activities, we have incurred third party professional fees in excess of the amounts we estimate that we would have otherwise incurred.
47
During 2019 and 2018, our operating expenses as a percentage of net revenues were as follows:
| For the Years Ended December 31, | ||||||||
| 2019 | 2018 | |||||||
| Material costs | 32.6 | % | 32.2 | % | ||||
| Personnel costs | 33.9 | % | 34.7 | % | ||||
| Other operating costs | 12.2 | % | 11.9 | % | ||||
| General and administrative expenses | 10.8 | % | 10.4 | % | ||||
| Professional accounting and legal fees | 1.2 | % | 1.6 | % | ||||
| Depreciation and amortization | 3.3 | % | 3.5 | % | ||||
| Impairment of intangible assets | NM | NM | ||||||
| Operating expenses | 94.0 | % | 94.3 | % | ||||
During the previous two years, the number of patient care clinics and satellite locations we operated or leased have been as follows:
| As of December 31, | ||||||||
| 2019 | 2018 | |||||||
| Patient care clinics | 701 | 676 | ||||||
| Satellite locations | 111 | 104 | ||||||
| Total | 812 | 780 | ||||||
Patient care clinics reflect locations that are licensed as a primary location to provide O&P services and which are fully staffed and open throughout a typical operating week. To facilitate patient convenience, we also operate satellite clinics. These are remote locations associated with a primary care clinic, utilized to see patients, and are open for operation on less than a full-time basis during a typical operating week.
Net revenues. Net revenues for the year ended December 31, 2019 were $1,098.0 million, an increase of $49.3 million, or 4.7%, from $1,048.8 million for the year ended December 31, 2018. Net revenues by operating segment, after elimination of intersegment activity, were as follows:
| For the Years Ended December 31, | Change | Percent Change | ||||||||||||||
| (dollars in thousands) | 2019 | 2018 | 2019 vs 2018 | 2019 vs 2018 | ||||||||||||
| Patient Care | $ | 905,691 | $ | 857,382 | $ | 48,309 | 5.6 | % | ||||||||
| Products & Services | 192,355 | 191,378 | 977 | 0.5 | % | |||||||||||
| Net revenues | $ | 1,098,046 | $ | 1,048,760 | $ | 49,286 | 4.7 | % | ||||||||
Patient Care net revenues for the year ended December 31, 2019 were $905.7 million, an increase of $48.3 million, or 5.6%, from $857.4 million for the same period in the prior year. Net revenues from acquired clinics, inclusive of consolidations, was $28.9 million. Same clinic revenues increased $18.1 million for the year ended December 31, 2019 compared to the same period in the prior year, reflecting an increase in same clinic revenues of 2.1% on a per-day basis. Patient care revenues from other services contributed to $1.3 million in growth.
Prosthetics constituted approximately 55% of our total Patient Care revenues for the year ended December 31, 2019 and 54% for the same period in the prior year, excluding the impact of acquisitions. Prosthetic revenues were 3.2% higher on a per-day basis than the same period in the prior year, excluding the impact of acquisitions. Orthotics, shoes, inserts, and other products increased by 0.9% on a per-day basis for the same comparative period, excluding the impact of acquisitions.
48
Products & Services net revenues for the year ended December 31, 2019 were $192.4 million, an increase of $1.0 million, or 0.5%, from $191.4 million for the same period in the prior year. This increase was comprised of $7.4 million from the distribution of O&P componentry to independent providers as the result of new products added to the portfolio, an increase in volume, and new customers, partially offset by a $6.4 million decrease in net revenues from therapeutic solutions as a result of continued net client cancellations. During 2020, we plan to discontinue our distribution of certain low-margin orthotic products to podiatrists. While we do not anticipate that this will have a significant effect on earnings, we currently estimate that our revenue from distribution will decrease by approximately $5 million during 2020. We also anticipate a continuation in the decline of revenues we receive from therapeutic solutions, although we currently believe the amount of this decrease will lower than that experienced in prior years, and estimate that it will be in the $1 million to $2 million range.
Material costs. Material costs for the year ended December 31, 2019 were $357.8 million, an increase of $19.8 million or 5.8%, from $338.0 million for the same period in the prior year. Total material costs as a percentage of net revenues increased to 32.6% in 2019 from 32.2% in 2018 due primarily to changes in our Patient Care segment business mix. Material costs by operating segment, after elimination of intersegment activity, were as follows:
| For the Years Ended December 31, | Change | Percent Change | ||||||||||||||
| (dollars in thousands) | 2019 | 2018 | 2019 vs 2018 | 2019 vs 2018 | ||||||||||||
| Patient Care | $ | 274,801 | $ | 258,201 | $ | 16,600 | 6.4 | % | ||||||||
| Products & Services | 82,970 | 79,816 | 3,154 | 4.0 | % | |||||||||||
| Material costs | $ | 357,771 | $ | 338,017 | $ | 19,754 | 5.8 | % | ||||||||
Patient Care material costs increased $16.6 million, or 6.4%, for the year ended December 31, 2019 compared to the same period in the prior year as a result of acquisitions. Patient Care material costs as a percent of segment net revenues was 30.3% in 2019 and 30.1% in 2018.
Products & Services material costs increased $3.2 million, or 4.0%, for the year ended December 31, 2019 compared to the same period in the prior year. As a percent of net revenues in the Products & Services segment, material costs were 43.1% in the year ended December 31, 2019 as compared to 41.7% in the same period 2018. The increase in material costs as a percentage of segment net revenues was due to a change in the customer and business mix within the segment.
Personnel costs. Personnel costs for the year ended December 31, 2019 were $372.2 million, an increase of $8.1 million, or 2.2%, from $364.1 million for the same period in the prior year. Personnel costs by operating segment were as follows:
| For the Years Ended December 31, | Change | Percent Change | ||||||||||||||
| (dollars in thousands) | 2019 | 2018 | 2019 vs 2018 | 2019 vs 2018 | ||||||||||||
| Patient Care | $ | 319,633 | $ | 312,736 | $ | 6,897 | 2.2 | % | ||||||||
| Products & Services | 52,592 | 51,353 | 1,239 | 2.4 | % | |||||||||||
| Personnel costs | $ | 372,225 | $ | 364,089 | $ | 8,136 | 2.2 | % | ||||||||
Personnel costs for the Patient Care segment were $319.6 million for the year ended December 31, 2019, an increase of $6.9 million, or 2.2%, from $312.7 million for the same period in the prior year. The increase is primarily related to an increase of $3.9 million in salary expense, $1.4 million in bonus expense, $1.0 million in other personnel costs, and $0.8 million in benefits expense, offset by $0.2 million in lower commission expense, when compared the same period in the prior year.
Personnel costs in the Products & Services segment were $52.6 million for the year ended December 31, 2019, an increase of $1.2 million, or 2.4% compared to the same period in the prior year. Salary expense increased $1.4 million, and bonus expense decreased $0.2 million.
49
Other operating costs. Other operating costs for the year ended December 31, 2019 were $134.9 million, an increase of $11.0 million, or 8.9%, from $123.9 million for the same period in the prior year. Rent expense increased $2.3 million from new, renewed, and acquired leases and $1.3 million as a result of the adoption of ASC 842, further described in Note A - “Organization and Summary of Significant Accounting Policies”. In addition, professional fees increased $2.1 million for the year ended December 31, 2019 due to investments made in certain revenue cycle management initiatives. Bad debt expense increased $1.9 million due to the impact of higher recoveries in the same period in the prior year. Other operating expenses increased $1.5 million due to additional costs from acquisitions, and other occupancy costs and all other operating costs increased $1.9 million for the year ended December 31, 2019 compared to the year ended December 31, 2018.
General and administrative expenses. General and administrative expenses for the year ended December 31, 2019 were $118.1 million, an increase of $8.5 million, or 7.8%, from $109.6 million for the same period in the prior year. This increase included a $3.6 million increase in salary expense, a $1.7 million increase in other expenses, largely due to the impact of favorable settlements of damage claims and state unclaimed property claims in the prior year, a $1.1 million increase in benefits related to higher claims costs, a $0.4 million increase in other personnel-related costs, a $0.3 million increase in equity-based compensation, and a $1.4 million increase in office and other expenses.
Professional accounting and legal fees. Professional accounting and legal fees for the year ended December 31, 2019 were $13.7 million, a decrease of $3.2 million from $16.9 million for the same period in the prior year. Advisory and other fees decreased primarily due to decreased utilization of professional services as compared to the same period in 2018. This change related primarily to reductions in the use of third-party professionals to assist us in the remediation of our material weaknesses, to regain our timely filing status in August of 2018, and to undertake related activities.
Depreciation and amortization. Depreciation and amortization for the year ended December 31, 2019 was $35.9 million, a decrease of $0.5 million, or 1.5%, from the same period in the prior year. Amortization expense decreased $1.7 million when compared to the prior period as a result of certain intangible assets becoming fully amortized. Depreciation expense increased $0.9 million when compared to the prior year as a result of additions to certain fixed assets, and finance lease amortization increased $0.3 million.
Interest expense, net. Interest expense for the year ended December 31, 2019 was $34.3 million, a decrease of $3.3 million, or 8.8%, from $37.6 million for the same period in the prior year. This decrease was primarily due to lower interest rates on outstanding borrowings as a result of our debt refinancing in March 2018.
Provision for income taxes. The provision for income taxes for the year ended December 31, 2019 was $3.0 million, or 9.7% of income before taxes, compared to a provision of $5.2 million, or 119.6% of income before taxes for the year ended December 31, 2018. The effective tax rate in 2019 consists principally of the 21% federal statutory tax rate and the rate impact from the release of valuation allowance on certain state deferred tax assets and permanent tax differences. The federal statutory tax rate in 2018 was 21%. The decrease in the effective tax rate for the year ended December 31, 2019 compared with the year ended December 31, 2018 is primarily attributable to the increase in income before taxes and the release of valuation allowance on certain state deferred tax assets.
During the year ended December 31, 2019, we determined that it was more likely than not that we would be able to realize the benefit of certain state deferred tax assets after we achieved twelve quarters of cumulative pretax income adjusted for permanent differences, as well as forecasted future taxable income and other positive evidence, and released $7.1 million of the valuation allowance related to certain state deferred tax assets in the fourth quarter of 2019.
Net income. Our net income for year ended December 31, 2019 was $27.5 million as compared to a net loss of $0.9 million for year ended December 31, 2018.
50
Results of Operations - Year Ended December 31, 2018 Compared to Year Ended December 31, 2017
For the years ended December 31, 2018 and 2017, our consolidated results of operations were as follows:
| For the Years Ended December 31, | Percent (1) Change | |||||||||||
| (dollars in thousands) | 2018 | 2017 | 2018 v 2017 | |||||||||
| Net revenues | $ | 1,048,760 | $ | 1,040,769 | 0.8 | % | ||||||
| Material costs | 338,017 | 329,223 | 2.7 | % | ||||||||
| Personnel costs | 364,089 | 361,090 | 0.8 | % | ||||||||
| Other operating costs | 123,902 | 129,831 | (4.6) | % | ||||||||
| General and administrative expenses | 109,552 | 109,342 | 0.2 | % | ||||||||
| Professional accounting and legal fees | 16,915 | 36,239 | (53.3) | % | ||||||||
| Depreciation and amortization | 36,455 | 39,259 | (7.1) | % | ||||||||
| Impairment of intangible assets | 183 | 54,735 | (99.7) | % | ||||||||
| Operating expenses | 989,113 | 1,059,719 | (6.7) | % | ||||||||
| Income (loss) from operations | 59,647 | (18,950 | ) | NM | ||||||||
| Interest expense, net | 37,566 | 57,688 | (34.9) | % | ||||||||
| Loss on extinguishment of debt | 16,998 | — | 100.0 | % | ||||||||
| Non-service defined benefit plan expense | 703 | 736 | (4.5) | % | ||||||||
| Income (loss) before income taxes | 4,380 | (77,374 | ) | NM | ||||||||
| Provision for income taxes | 5,238 | 27,297 | (80.8) | % | ||||||||
| Net loss | $ | (858 | ) | $ | (104,671 | ) | 99.2 | % | ||||
| (1) NM - Not meaningful |
Material costs, personnel costs, and other operating costs reflect expenses we incur in connection with our delivery of care through our clinics and other patient care operations, or through the distribution of products and services, and exclude general and administrative activities. General and administrative activities reflect expenses we incur that are not directly related to the operation of our clinics or provision of products and services.
Due to the substantial amount we have incurred for professional accounting and legal services, we separately disclose these expenses within operating expenses. In connection with our efforts to restate our prior financial statements, remediate our material weaknesses, regain our timely filing status, and undertake related activities, we have incurred third party professional fees in excess of the amounts we estimate that we would have otherwise incurred.
During 2018 and 2017, our operating expenses as a percentage of net revenues were as follows:
| For the Years Ended December 31, | ||||||||
| 2018 | 2017 | |||||||
| Material costs | 32.2 | % | 31.6 | % | ||||
| Personnel costs | 34.7 | % | 34.7 | % | ||||
| Other operating costs | 11.9 | % | 12.4 | % | ||||
| General and administrative expenses | 10.4 | % | 10.5 | % | ||||
| Professional accounting and legal fees | 1.6 | % | 3.5 | % | ||||
| Depreciation and amortization | 3.5 | % | 3.8 | % | ||||
| Impairment of intangible assets | — | % | 5.3 | % | ||||
| Operating expenses | 94.3 | % | 101.8 | % | ||||
51
During the previous two years, the number of patient care clinics and satellite locations we operated or leased have been as follows:
| As of December 31, | ||||||||
| 2018 | 2017 | |||||||
| Patient care clinics | 676 | 682 | ||||||
| Satellite locations | 104 | 112 | ||||||
| Total | 780 | 794 | ||||||
Patient care clinics reflect locations that are licensed as a primary location to provide O&P services and which are fully staffed and open throughout a typical operating week. To facilitate patient convenience, we also operate satellite clinics. These are remote locations associated with a primary care clinic, utilized to see patients, and are open for operation on less than a full-time basis during a typical operating week.
Net revenues. Net revenues for the year ended December 31, 2018 were $1,048.8 million, an increase of $8.0 million, or 0.8%, from $1,040.8 million for the year ended December 31, 2017. Net revenues by operating segment, after elimination of intersegment activity, were as follows:
| For the Years Ended December 31, | Change | Percent Change | ||||||||||||||
| (dollars in thousands) | 2018 | 2017 | 2018 vs 2017 | 2018 vs 2017 | ||||||||||||
| Patient Care | $ | 857,382 | $ | 851,973 | $ | 5,409 | 0.6 | % | ||||||||
| Products & Services | 191,378 | 188,796 | 2,582 | 1.4 | % | |||||||||||
| Net revenues | $ | 1,048,760 | $ | 1,040,769 | $ | 7,991 | 0.8 | % | ||||||||
Patient Care net revenue for the year ended December 31, 2018 was $857.4 million, an increase of $5.4 million, or 0.6%, from $852.0 million for the same period in the prior year. Same clinic revenue increased $12.2 million for the year ended December 31, 2018 compared to the same period in the prior year, reflecting an increase in same clinic revenue per day of 0.9%. This growth was offset by the effect of clinic closures which reflected decreased revenue of $1.6 million as compared with the same period in the prior year. Net revenues were also negatively impacted as compared to the same period in the prior year by $4.0 million from the adoption of the new revenue accounting standard on January 1, 2018.
Revenue growth during the year was primarily the result of growth in services to prosthetic patients. During the year, our revenue from prosthetics increased by 3.3% and constituted 54% of Patient Care’s revenue in the year ended December 31, 2018 compared with 53% for the same period in the prior year. We believe an increased focus on the demonstration of patient outcomes and related marketing initiatives contributed to this growth in prosthetic revenue.
Products & Services net revenues for the year ended December 31, 2018 were $191.4 million, an increase of $2.6 million, or 1.4%, from $188.8 million for the same period in the prior year. This increase was comprised of $7.3 million from the distribution of O&P componentry to independent providers partially offset by a $4.7 million decrease in net revenues from therapeutic services, which related primarily to client cancellations and price concessions.
52
Material costs. Material costs for the year ended December 31, 2018 were $338.0 million, an increase of $8.8 million, or 2.7%, from $329.2 million for the same period in the prior year. Total material costs as a percentage of net revenue increased to 32.2% in 2018 from 31.6% in 2017 due primarily to changes in our Patient Care segment product mix to higher-cost prosthetic devices. Material costs by operating segment, after elimination of intersegment activity, were as follows:
| For the Years Ended December 31, | Change | Percent Change | ||||||||||||||
| (dollars in thousands) | 2018 | 2017 | 2018 vs 2017 | 2018 vs 2017 | ||||||||||||
| Patient Care | $ | 258,201 | $ | 251,899 | $ | 6,302 | 2.5 | % | ||||||||
| Products & Services | 79,816 | 77,324 | 2,492 | 3.2 | % | |||||||||||
| Material costs | $ | 338,017 | $ | 329,223 | $ | 8,794 | 2.7 | % | ||||||||
Patient Care material costs increased $6.3 million, or 2.5%, for the year ended December 31, 2018 compared to the same period in the prior year. Excluding the $4.0 million effect on net revenue resulting from the adoption of the new revenue accounting standard, Patient Care material costs as a percent of revenue increased slightly to 30.0% in 2018 from 29.6% in 2017, primarily due to increases in the mix of our business towards higher-cost prosthetic devices.
Products & Services material costs increased $2.5 million, or 3.2%, for the year ended December 31, 2018 compared to the same period in the prior year. As a percent of revenue, material costs grew to 41.7% in the year ended December 31, 2018 from 41.0% in the same period 2017.
Personnel costs. Personnel costs for the year ended December 31, 2018 were $364.1 million, an increase of $3.0 million, or 0.8%, from $361.1 million for the same period in the prior year. Personnel costs by operating segment were as follows:
| For the Years Ended December 31, | Change | Percent Change | ||||||||||||||
| (dollars in thousands) | 2018 | 2017 | 2018 vs 2017 | 2018 vs 2017 | ||||||||||||
| Patient Care | $ | 312,736 | $ | 312,695 | $ | 41 | — | % | ||||||||
| Products & Services | 51,353 | 48,395 | 2,958 | 6.1 | % | |||||||||||
| Personnel costs | $ | 364,089 | $ | 361,090 | $ | 2,999 | 0.8 | % | ||||||||
Personnel costs in the Products & Services segment increased $3.0 million, or 6.1% for the year ended December 31, 2018 compared to the same period in the prior year. Bonus and commission expense increased $2.0 million, salary expense increased $1.2 million, and benefits expense decreased $0.2 million.
Other operating costs. Other operating costs for the year ended December 31, 2018 were $123.9 million, a decrease of $5.9 million, or 4.6%, from $129.8 million for the same period in the prior year. Bad debt expense decreased $10.2 million, primarily from the adoption of the new revenue accounting standard under which certain of these expenses were re-characterized as implicit price concessions within our Patient Care segment and are now reflected as an adjustment to net revenue. This decrease was partially offset by a $2.6 million increase in professional fees, a $1.4 million increase in travel expenses, and a $0.3 million increase in other operating costs.
General and administrative expenses. General and administrative expenses for the year ended December 31, 2018 were $109.5 million, an increase of $0.2 million, or 0.2%, from $109.3 million for the same period in the prior year. This increase included $2.0 million in other expenses, $1.6 million of professional expense relating primarily to growth and other corporate initiatives, and $0.8 million in advertising expense. These increases were partially offset by a $1.7 million favorable settlement of our long standing claim relating to the “Deepwater Horizon” disaster and $0.5 million from our favorable resolution of outstanding abandoned and unclaimed property claims with the State of Delaware, and $2.0 million in personnel related costs.
53
Professional accounting and legal fees. Professional accounting and legal fees for the year ended December 31, 2018 were $16.9 million, a decrease of $19.3 million from $36.2 million for the same period in the prior year. Advisory and other fees decreased $17.2 million, audit related fees decreased by $2.0 million, and legal fees decreased by $0.1 million.
Depreciation and amortization. Depreciation and amortization for the year ended December 31, 2018 was $36.5 million, a decrease of $2.8 million, or 7.1%, from $39.3 million for the same period in the prior year. Fully amortized intangible assets decreased amortization $2.7 million.
Impairment of intangible assets. As more fully explained in Note H - “Goodwill and Intangible Assets” to our consolidated financial statements in this Annual Report on Form 10-K, due to the continued decline in our Therapeutic reporting unit forecasted outlook, we recorded an impairment of intangible assets of $0.2 million for the year ended December 31, 2018 related to our Therapeutic reporting unit’s indefinite-lived trade name. See the “Business Environment and Outlook” section in this Management’s Discussion and Analysis for information regarding the business environment and outlook of our Products & Services segment.
Interest expense, net. Interest expense for the year ended December 31, 2018 was $37.6 million, a decrease of $20.1 million, or 34.9%, from $57.7 million for the same period in the prior year. This decrease was primarily due to lower interest rates on outstanding borrowings arising from our debt refinancing in March 2018 and secondarily reflected a $1.5 million decrease related to our settlement of outstanding abandoned and unclaimed property claims with the State of Delaware in a manner that did not require us to pay a portion of the estimated interest we had accrued on long standing unpaid claim amounts.
Provision for income taxes. The provision for income taxes for the year ended December 31, 2018 was $5.2 million, or 119.6% of income from continuing operations before taxes, compared to a provision of $27.3 million, or (35.3)% of income before taxes for the year ended December 31, 2017. The effective tax rate in 2018 consists principally of the 21% federal statutory tax rate and the rate impact from state income taxes and permanent tax differences. The federal statutory tax rate in 2017 was 35%. The increase in the effective tax rate for the year ended December 31, 2018 compared with the year ended December 31, 2017 is primarily attributable to the pre-tax book income loss in the year ended December 31, 2017 and the deferred tax impact related to the change in the Tax Act, whereas we had pre-tax book income in the year ended December 31, 2018.
Net loss. Our net loss for year ended December 31, 2018 was $0.9 million as compared to a net loss of $104.7 million for year ended December 31, 2017.
Financial Condition, Liquidity, and Capital Resources
Liquidity
To provide cash for our operations and capital expenditures, our immediate source of liquidity is our cash and investment balances and any amounts we have available for borrowing under our revolving credit facility. We refer to the sum of these two amounts as our “liquidity.”
At December 31, 2019, we had total liquidity of $169.2 million, which reflected a decrease of $19.9 million, from the $189.2 million in liquidity we had as of December 31, 2018. Our liquidity at December 31, 2019 was comprised of cash and cash equivalents of $74.4 million and $94.8 million in available borrowing capacity under our $100.0 million revolving credit facility. This decrease in liquidity in 2019 primarily related to our use of $36.6 million in cash for the purposes of acquisitions, and secondarily due to capital expenditures of $33.1 million. We also utilized $8.6 million of cash to reduce our net indebtedness and outstanding letters of credit. These uses of cash were partially offset by operating cash flows provided by activities of $58.8 million. Other investing and financing activities resulted in a net use of $0.4 million of cash.
If we are not compliant with our debt covenants in any period, absent a waiver or amendment of our Credit Agreement, we may be unable to access funds in our revolving credit facility.
54
Working Capital and Days Sales Outstanding
As of December 31, 2019, we had working capital of $107.2 million compared to working capital of $154.6 million as of December 31, 2018. Our working capital decreased $47.4 million in 2019 compared to 2018 due to an increase in current liabilities of $37.1 million and a decrease in current assets of $10.3 million.
The increase in current liabilities was primarily attributable to the adoption of ASC 842 effective January 1, 2020, resulting in the recognition of operating lease liabilities of $34.3 million as of December 31, 2019, as well as an increase in accrued compensation related costs of $5.9 million. These increases were offset by a decrease in accounts payable and other accrued liabilities.
The decrease in current assets was primarily attributable to a decrease in cash and cash equivalents of $20.7 million and a reduction of $5.1 million in other current assets, of which $3.8 million related to the reclassification of prepaid rent to the current portion of long term debt upon adoption of ASC 842 historically recorded in other current assets. The decrease in cash primarily relates to the uses of cash discussed in the liquidity section related to acquisitions and capital expenditures. The decreases were offset by an increase in net accounts receivable of $15.4 million and, to a lesser extent, individually immaterial fluctuations in other current assets.
Days sales outstanding (“DSO”) is a calculation that approximates the average number of days between the billing for our services and the date of our receipt of payment, which we estimate using a 90 day rolling period of net revenue. This computation can provide a relative measure of the effectiveness of our billing and collections activities. As of December 31, 2019, our DSO was 48 days, as compared to 46 days as of December 31, 2018 and 2017. We believe that administrative changes to our collections operations made in the first quarter of 2019, increases in the rates of initial Medicare claims denials, and the impact of the implementation of our patient management and electronic health system in certain of our largest operating regions in the first quarter of 2019 contributed to collection delays and the increase in our DSO. As of March 31, 2019, the implementation of the new patient management and electronic health record system was complete.
Sources and Uses of Cash in the Year Ended December 31, 2019 Compared to December 31, 2018
Cash flows provided by operating activities decreased $19.7 million to an inflow of $58.8 million for year ended December 31, 2019 from an inflow of $78.5 million for year ended December 31, 2018. This comparative decrease was partially due to a $15.6 million reduction in cash provided by net accounts receivable. During 2018, we benefited from an improvement in our collections experience, particularly during the first quarter of the prior year. This year, in addition to not having a similar benefit in collections experience, we have also experienced increased difficulties in collections as discussed above. The decrease in cash provided by net accounts receivable is largely attributable to the timing of collections following the increase in revenues and corresponding increase in accounts receivable during the three months ended December 31, 2019 as compared to December 31, 2018 of approximately $16.0 million. Our operating cash flows have also decreased on a comparative basis due to a decrease in our income tax receivable of $11.5 million, largely due to our receipt of a $12.3 million tax refund in the first quarter of 2018.
The decreases in our operating cash flows were partially offset by the timing effect related to our payment of accrued compensation costs of $4.1 million, resulting in a benefit in our cash flows for 2019 as compared to 2018. In addition, the combined impact of cash provided by operating activities related to the timing of payments of accounts payable and accrued expenses and other liabilities was $2.1 million. The remaining difference related to the net impact of other changes within working capital and are further discussed in the Working Capital and Days Sales Outstanding section above.
Cash flows used in investing activities increased $40.0 million to $67.2 million for the year ended December 31, 2019 from $27.2 million for the year ended December 31, 2018. The increase in cash used in investing activities was due to an incremental $34.6 million in cash consideration for acquisitions, net of cash acquired, a $7.4 million increase in purchases of property, plant and equipment, and a $1.6 million decrease in proceeds from the sale of property, plant and equipment. These increases in cash flows used in investing activities were offset by a decrease in $3.1 million in cash used for the purchase of therapeutic program equipment and the $0.5 million purchase of company-owned life insurance in the prior year.
55
Cash flows used in financing activities increased $51.3 million to $12.4 million for the year ended December 31, 2019 from cash flows provided by financing activities of $39.0 million for the year ended December 31, 2018. Cash flows provided by financing activities for the year ended December 31, 2018 included $45.6 million related to the refinancing of our indebtedness, net of payment of $15.2 million in debt issuance and extinguishment costs, whereas cash flows used in financing activities for the year ended December 31, 2019 included $5.1 million related to repayments of our indebtedness. The remaining change in cash flows used in financing activities relates to higher payments of employee taxes on stock-based compensation of $1.2 million and repayments of seller notes of $1.2 million, partially offset by an increase in proceeds received from the exercise of stock options of $1.1 million.
Capital Expenditures and Deferred Cloud Implementation Expenditures
During 2019 we expended a combined total of $33.1 million for the purchase of property, plant, and equipment, and the purchase of therapeutic program equipment. Our capital expenditures relate primarily to our investment in leasehold and other machinery and equipment for our patient care clinics, for equipment we use in providing therapeutic solutions, as well as for the purchase or development of information technology assets that support our businesses and corporate activities. During 2020, we anticipate that we will incur an increase in capital expenditures, and in deferred cloud implementation expenditures, in connection with our planned reconfiguration of distribution facilities and our related implementation of supply chain and financial systems. In 2020, due to these projects, we currently estimate that our capital expenditures will increase to approximately $45 million. Of this amount, we estimate that approximately $13 million to $15 million will relate to our distribution and fabrication facility leasehold and equipment expenditures. In addition to this capital expenditure amount, we estimate that we will incur $7 million to $10 million in incremental expenditures related to the implementation of cloud-based supply chain and financial systems that will be deferred in accordance with ASU 2018-15 and will be included in future expense over the periods of operation of these systems. These expenditures are anticipated to be separate from and additional to the operating expenses discussed in “New Systems Implementations” section above. We currently believe that these supply chain and financial systems implementation-related technology expenditures will decrease significantly in 2021, and that capital expenditures will decrease into the $35 million range in that year.
Effect of Indebtedness
On March 6, 2018 we entered into a new Credit Agreement in order to refinance our indebtedness, as disclosed in Note M - “Debt and Other Obligations,” in the notes to the consolidated financial statements contained elsewhere in this report. Our indebtedness bears reduced rates of interest compared with those under our prior agreement, and as such, for the year ended December 31, 2019, we reported interest expense of $34.3 million compared with the $37.6 million we reported in 2018 and the $57.7 million we reported in 2017. Cash paid for interest totaled $29.2 million, $31.3 million, and $48.4 million for the years ended December 31, 2019, 2018, and 2017 respectively.
56
Scheduled maturities of debt as of December 31, 2019 were as follows (in thousands):
| (in thousands) | ||||
| 2020 | $ | 8,932 | ||
| 2021 | 8,089 | |||
| 2022 | 6,767 | |||
| 2023 | 6,247 | |||
| 2024 | 5,975 | |||
| Thereafter | 471,191 | |||
| Total debt before unamortized discount and debt issuance costs, net | 507,201 | |||
| Unamortized discount and debt issuance costs, net | (8,328 | ) | ||
| Total debt | $ | 498,873 | ||
Liquidity Outlook and Going Concern Evaluation
Our Credit Agreement has a term loan facility with $496.2 million in principal outstanding at December 31, 2019, due in quarterly principal installments equal to 0.25% of the original aggregate principal amount of $505 million, commencing June 29, 2018, with all remaining outstanding principal due at maturity in March 2025, and a revolving credit facility with no borrowings and a maximum aggregate amount of availability of $100 million at June 30, 2018 that matures in March 2023. We currently believe that our anticipated operating trends, when coupled with anticipated decreases in our payments of interest expense and professional fees, will provide us with sufficient liquidity to meet our financial obligations during the coming twelve months.
ASU 2014-15 Disclosure of Uncertainties about an Entity’s Ability to Continue as a Going Concern requires that we evaluate whether there is substantial doubt about our ability to meet our financial obligations when they become due during the twelve month period from the date our financial statements are available to be issued. We have performed such an evaluation and, based on the results of that assessment, we are not aware of any relevant conditions or events that raise substantial doubt regarding our ability to continue as a going concern within one year of the date the financial statements are issued.
Off-Balance Sheet Arrangements
We have no off-balance sheet arrangements that may or could have a current or future material effect on our financial condition, revenues or expenses, results of operations, liquidity, capital expenditures, or capital resources.
Contractual Obligations
The following table sets forth our contractual obligations and commercial commitments as of December 31, 2019 for each of the indicated periods:
| (in thousands) | 2020 | 2021 | 2022 | 2023 | 2024 | Thereafter | Total | |||||||||||||||||||||
| Debt principal payments | $ | 8,932 | $ | 8,089 | $ | 6,767 | $ | 6,247 | $ | 5,975 | $ | 471,191 | $ | 507,201 | ||||||||||||||
| Lease obligations (1) | 40,625 | 36,189 | 28,166 | 19,498 | 12,203 | 16,059 | 152,740 | |||||||||||||||||||||
| Interest payments on debt | 29,856 | 29,129 | 28,788 | 27,980 | 25,528 | 2,976 | 144,257 | |||||||||||||||||||||
| Other long-term obligations | 20,998 | 10,581 | 7,144 | 5,886 | 4,370 | 11,265 | 60,244 | |||||||||||||||||||||
| Total contractual cash obligations | $ | 100,411 | $ | 83,988 | $ | 70,865 | $ | 59,611 | $ | 48,076 | $ | 501,491 | $ | 864,442 | ||||||||||||||
(1) Lease obligations include Operating and Finance leases included in the consolidated balance sheet as of December 31, 2019, and in addition, payments for lease obligations under lease agreements that have not commenced and, as such, are not reflected in the consolidated balance sheet as of December 31, 2019.
57
Dividends
It is our policy to not pay cash dividends on our common stock, and, given our capital needs, we currently do not foresee a change in this policy. Certain of our agreements relating to indebtedness limit our ability to pay dividends, and we currently anticipate that these restrictions will continue to exist in future agreements that we may enter.
| ITEM 7A. | QUANTITATIVE AND QUALITATIVE DISCLOSURES ABOUT MARKET RISK. |
Our future financial results are subject to a variety of risks, including interest rate risk. As of December 31, 2019, the interest expense arising from the $496.2 million of outstanding borrowings under both our term loan facility under our Credit Agreement and our revolving credit facility under our Credit Agreement was subject to variable interest rates, partially offset by interest income subject to variable interest rates generated from our $74.4 million of cash equivalents as of that date. As of December 31, 2019, we had $11.0 million of fixed rate debt which included subordinated Seller Notes and financing leases.
Set forth below is an analysis of our financial instruments as of December 31, 2019 that were sensitive to changes in interest rates. The table demonstrates the changes in estimated annual cash flow related to the outstanding balance under the revolving and term loan facilities and the interest rate swap, calculated for an instantaneous shift in interest rates, plus or minus 50 BPS, 100 BPS, and 150 BPS. As of December 31, 2019, the interest rate on the revolving and term loan facilities was 5.20% based on a LIBOR rate of 1.70% and the applicable margin of 3.50%.
| Cash Flow Risk | Annual Interest Expense Given an Interest Rate Decrease of X Basis Points | No
Change in | Annual Interest Expense Given an Interest Rate Increase of X Basis Points | |||||||||||||||||||||||||
| (in thousands) | (150 BPS) | (100 BPS) | (50 BPS) | 50 BPS | 100 BPS | 150 BPS | ||||||||||||||||||||||
| Term Loan and Revolver and Swap | 26,392 | 27,311 | 28,229 | 29,147 | 30,066 | 30,984 | 31,902 | |||||||||||||||||||||
58
| ITEM 8. | FINANCIAL STATEMENTS AND SUPPLEMENTARY DATA. |
INDEX TO FINANCIAL STATEMENTS
59
Report of Independent Registered Public Accounting Firm
To the Board of Directors and Shareholders of Hanger, Inc.
Opinions on the Financial Statements and Internal Control over Financial Reporting
We have audited the accompanying consolidated balance sheets of Hanger, Inc. and its subsidiaries (the “Company”) as of December 31, 2019 and 2018, and the related consolidated statements of operations, comprehensive income (loss), changes in shareholders’ equity (deficit) and cash flows for each of the three years in the period ended December 31, 2019, including the related notes (collectively referred to as the “consolidated financial statements”). We also have audited the Company’s internal control over financial reporting as of December 31, 2019, based on criteria established in Internal Control - Integrated Framework (2013) issued by the Committee of Sponsoring Organizations of the Treadway Commission (COSO).
In our opinion, the consolidated financial statements referred to above present fairly, in all material respects, the financial position of the Company as of December 31, 2019 and 2018, and the results of its operations and its cash flows for each of the three years in the period ended December 31, 2019 in conformity with accounting principles generally accepted in the United States of America. Also in our opinion, the Company maintained, in all material respects, effective internal control over financial reporting as of December 31, 2019, based on criteria established in Internal Control - Integrated Framework (2013) issued by the COSO.
Change in Accounting Principle
As discussed in Note A to the consolidated financial statements, the Company changed the manner in which it accounts for leases in 2019.
Basis for Opinions
The Company’s management is responsible for these consolidated financial statements, for maintaining effective internal control over financial reporting, and for its assessment of the effectiveness of internal control over financial reporting, included in Management’s Report on Internal Control over Financial Reporting appearing under Item 9A. Our responsibility is to express opinions on the Company’s consolidated financial statements and on the Company’s internal control over financial reporting based on our audits. We are a public accounting firm registered with the Public Company Accounting Oversight Board (United States) (PCAOB) and are required to be independent with respect to the Company in accordance with the U.S. federal securities laws and the applicable rules and regulations of the Securities and Exchange Commission and the PCAOB.
We conducted our audits in accordance with the standards of the PCAOB. Those standards require that we plan and perform the audits to obtain reasonable assurance about whether the consolidated financial statements are free of material misstatement, whether due to error or fraud, and whether effective internal control over financial reporting was maintained in all material respects.
Our audits of the consolidated financial statements included performing procedures to assess the risks of material misstatement of the consolidated financial statements, whether due to error or fraud, and performing procedures that respond to those risks. Such procedures included examining, on a test basis, evidence regarding the amounts and disclosures in the consolidated financial statements. Our audits also included evaluating the accounting principles used and significant estimates made by management, as well as evaluating the overall presentation of the consolidated financial statements. Our audit of internal control over financial reporting included obtaining an understanding of internal control over financial reporting, assessing the risk that a material weakness exists, and testing and evaluating the design and operating effectiveness of internal control based on the assessed risk. Our audits also included performing such other procedures as we considered necessary in the circumstances. We believe that our audits provide a reasonable basis for our opinions.
60
Definition and Limitations of Internal Control over Financial Reporting
A company’s internal control over financial reporting is a process designed to provide reasonable assurance regarding the reliability of financial reporting and the preparation of financial statements for external purposes in accordance with generally accepted accounting principles. A company’s internal control over financial reporting includes those policies and procedures that (i) pertain to the maintenance of records that, in reasonable detail, accurately and fairly reflect the transactions and dispositions of the assets of the company; (ii) provide reasonable assurance that transactions are recorded as necessary to permit preparation of financial statements in accordance with generally accepted accounting principles, and that receipts and expenditures of the company are being made only in accordance with authorizations of management and directors of the company; and (iii) provide reasonable assurance regarding prevention or timely detection of unauthorized acquisition, use, or disposition of the company’s assets that could have a material effect on the financial statements.
Because of its inherent limitations, internal control over financial reporting may not prevent or detect misstatements. Also, projections of any evaluation of effectiveness to future periods are subject to the risk that controls may become inadequate because of changes in conditions, or that the degree of compliance with the policies or procedures may deteriorate.
| /s/ PricewaterhouseCoopers LLP |
| Austin, Texas |
| March 11, 2020 |
We have served as the Company’s auditor since 1987.
61
CONSOLIDATED BALANCE SHEETS
(dollars in thousands, except par value and share amounts)
| As of December 31, | ||||||||
| 2019 | 2018 | |||||||
| ASSETS | ||||||||
| Current assets: | ||||||||
| Cash and cash equivalents | $ | 74,419 | $ | 95,114 | ||||
| Accounts receivable, net | 159,359 | 143,986 | ||||||
| Inventories | 68,204 | 67,690 | ||||||
| Income taxes receivable | — | 379 | ||||||
| Other current assets | 13,673 | 18,731 | ||||||
| Total current assets | 315,655 | 325,900 | ||||||
| Non-current assets: | ||||||||
| Property, plant, and equipment, net | 84,057 | 89,489 | ||||||
| Goodwill | 232,244 | 198,742 | ||||||
| Other intangible assets, net | 17,952 | 15,478 | ||||||
| Deferred income taxes | 70,481 | 65,635 | ||||||
| Operating lease right-of-use assets | 110,559 | — | ||||||
| Other assets | 11,305 | 7,766 | ||||||
| Total assets | $ | 842,253 | $ | 703,010 | ||||
| TOTAL LIABILITIES AND SHAREHOLDERS’ EQUITY (DEFICIT) | ||||||||
| Current liabilities: | ||||||||
| Current portion of long-term debt | $ | 8,752 | $ | 8,583 | ||||
| Accounts payable | 48,477 | 55,797 | ||||||
| Accrued expenses and other current liabilities | 55,825 | 51,783 | ||||||
| Accrued compensation related costs | 61,010 | 55,111 | ||||||
| Current portion of operating lease liabilities | 34,342 | — | ||||||
| Total current liabilities | 208,406 | 171,274 | ||||||
| Long-term liabilities: | ||||||||
| Long-term debt, less current portion | 490,121 | 502,090 | ||||||
| Operating lease liabilities | 88,418 | — | ||||||
| Other liabilities | 45,804 | 51,570 | ||||||
| Total liabilities | 832,749 | 724,934 | ||||||
| Commitments and contingent liabilities (Note R) | ||||||||
| Shareholders’ equity (deficit): | ||||||||
| Common stock, $0.01 par value; 60,000,000 shares authorized; 37,602,873 shares issued and 37,460,052 shares outstanding at 2019, and 37,063,995 shares issued and 36,921,174 shares outstanding at 2018, respectively | 376 | 371 | ||||||
| Additional paid-in capital | 354,326 | 343,955 | ||||||
| Accumulated other comprehensive loss | (12,551 | ) | (4,531 | ) | ||||
| Accumulated deficit | (331,951 | ) | (361,023 | ) | ||||
| Treasury stock, at cost; 142,821 shares at 2019 and 2018, respectively | (696 | ) | (696 | ) | ||||
| Total shareholders’ equity (deficit) | 9,504 | (21,924 | ) | |||||
| Total liabilities and shareholders’ equity (deficit) | $ | 842,253 | $ | 703,010 | ||||
The accompanying notes are an integral part of the consolidated financial statements.
62
CONSOLIDATED STATEMENTS OF OPERATIONS
(dollars in thousands, except share and per share amounts)
| For the Years Ended December 31, | ||||||||||||
| 2019 | 2018 | 2017 | ||||||||||
| Net revenues | $ | 1,098,046 | $ | 1,048,760 | $ | 1,040,769 | ||||||
| Material costs | 357,771 | 338,017 | 329,223 | |||||||||
| Personnel costs | 372,225 | 364,089 | 361,090 | |||||||||
| Other operating costs | 134,943 | 123,902 | 129,831 | |||||||||
| General and administrative expenses | 118,065 | 109,552 | 109,342 | |||||||||
| Professional accounting and legal fees | 13,689 | 16,915 | 36,239 | |||||||||
| Depreciation and amortization | 35,925 | 36,455 | 39,259 | |||||||||
| Impairment of intangible assets | — | 183 | 54,735 | |||||||||
| Income (loss) from operations | 65,428 | 59,647 | (18,950 | ) | ||||||||
| Interest expense, net | 34,258 | 37,566 | 57,688 | |||||||||
| Loss on extinguishment of debt | — | 16,998 | — | |||||||||
| Non-service defined benefit plan expense | 691 | 703 | 736 | |||||||||
| Income (loss) before income taxes | 30,479 | 4,380 | (77,374 | ) | ||||||||
| Provision for income taxes | 2,954 | 5,238 | 27,297 | |||||||||
| Net income (loss) | $ | 27,525 | $ | (858 | ) | $ | (104,671 | ) | ||||
| Basic and Diluted Per Common Share Data: | ||||||||||||
| Basic income (loss) per share | $ | 0.74 | $ | (0.02 | ) | $ | (2.89 | ) | ||||
| Weighted average shares used to compute basic earnings per common share | 37,267,188 | 36,764,551 | 36,270,920 | |||||||||
| Diluted income (loss) per share | $ | 0.72 | $ | (0.02 | ) | $ | (2.89 | ) | ||||
| Weighted average shares used to compute diluted earnings per common share | 38,064,617 | 36,764,551 | 36,270,920 | |||||||||
The accompanying notes are an integral part of the consolidated financial statements.
63
CONSOLIDATED STATEMENTS OF COMPREHENSIVE INCOME (LOSS)
(in thousands)
| For the Years Ended December 31, | ||||||||||||
| 2019 | 2018 | 2017 | ||||||||||
| Net income (loss) | $ | 27,525 | $ | (858 | ) | $ | (104,671 | ) | ||||
| Other comprehensive loss: | ||||||||||||
| Unrealized loss on cash flow hedges, net of tax benefit of ($2,278), ($922), and $0, respectively | $ | (7,201 | ) | $ | (2,936 | ) | $ | — | ||||
| Unrealized (loss) gain on defined benefit plan, net of tax (benefit) provision of ($259), $142, and ($151), respectively | (819 | ) | 454 | (246 | ) | |||||||
| Total other comprehensive loss | (8,020 | ) | (2,482 | ) | (246 | ) | ||||||
| Comprehensive income (loss) | $ | 19,505 | $ | (3,340 | ) | $ | (104,917 | ) | ||||
The accompanying notes are an integral part of these consolidated financial statements.
64
CONSOLIDATED STATEMENTS OF CHANGES IN SHAREHOLDERS’ EQUITY (DEFICIT)
For the Three Years Ended December 31, 2019
(dollars and share amounts in thousands)
| Common Shares, Balance | Common Stock, Par Value | Additional Paid-in Capital | Accumulated Other Comprehensive Loss | Accumulated Deficit | Treasury Stock | Total | ||||||||||||||||||||||
| Balance, December 31, 2016 | 36,041 | $ | 362 | $ | 322,191 | $ | (1,440 | ) | $ | (255,003 | ) | $ | (696 | ) | $ | 65,414 | ||||||||||||
| Net loss | — | — | — | — | (104,671 | ) | — | (104,671 | ) | |||||||||||||||||||
| Share based compensation expense | — | — | 12,929 | — | — | — | 12,929 | |||||||||||||||||||||
| Issuance of common stock upon vesting of restricted stock units | 331 | 3 | (3 | ) | — | — | — | — | ||||||||||||||||||||
| Effect of shares withheld to cover taxes | — | — | (1,477 | ) | — | — | — | (1,477 | ) | |||||||||||||||||||
| Cumulative effect of a change in accounting for stock-based payments | — | — | 98 | — | (98 | ) | — | — | ||||||||||||||||||||
| Total other comprehensive loss | — | — | — | (246 | ) | — | — | (246 | ) | |||||||||||||||||||
| Balance, December 31, 2017 | 36,372 | 365 | 333,738 | (1,686 | ) | (359,772 | ) | (696 | ) | (28,051 | ) | |||||||||||||||||
| Cumulative effect of a change in accounting for revenue recognition | — | — | — | — | (756 | ) | — | (756 | ) | |||||||||||||||||||
| Balance, January 1, 2018 | 36,372 | 365 | 333,738 | (1,686 | ) | (360,528 | ) | (696 | ) | (28,807 | ) | |||||||||||||||||
| Net loss | — | — | — | — | (858 | ) | — | (858 | ) | |||||||||||||||||||
| Share based compensation expense | — | — | 13,065 | — | — | — | 13,065 | |||||||||||||||||||||
| Issuance in connection with the exercise of stock options | 5 | — | 64 | — | — | — | 64 | |||||||||||||||||||||
| Issuance of common stock upon vesting of restricted stock units | 544 | 6 | (6 | ) | — | — | — | — | ||||||||||||||||||||
| Effect of shares withheld to cover taxes | — | — | (2,906 | ) | — | — | — | (2,906 | ) | |||||||||||||||||||
| Reclassification of certain tax effects from accumulated other comprehensive loss | — | — | — | (363 | ) | 363 | — | — | ||||||||||||||||||||
| Total other comprehensive loss | — | — | — | (2,482 | ) | — | — | (2,482 | ) | |||||||||||||||||||
| Balance, December 31, 2018 | 36,921 | 371 | 343,955 | (4,531 | ) | (361,023 | ) | (696 | ) | (21,924 | ) | |||||||||||||||||
| Cumulative effect of a change in accounting for leases (Note A) | — | — | — | — | 1,547 | — | 1,547 | |||||||||||||||||||||
| Balance, January 1, 2019 | 36,921 | 371 | 343,955 | (4,531 | ) | (359,476 | ) | (696 | ) | (20,377 | ) | |||||||||||||||||
| Net income | — | — | — | — | 27,525 | — | 27,525 | |||||||||||||||||||||
| Share based compensation expense | — | — | 13,414 | — | — | — | 13,414 | |||||||||||||||||||||
| Issuance in connection with the exercise of stock options | 104 | 1 | 1,098 | — | — | — | 1,099 | |||||||||||||||||||||
| Issuance of common stock upon vesting of restricted stock units | 435 | 4 | (4 | ) | — | — | — | — | ||||||||||||||||||||
| Effect of shares withheld to cover taxes | — | — | (4,137 | ) | — | — | — | (4,137 | ) | |||||||||||||||||||
| Total other comprehensive loss | — | — | — | (8,020 | ) | — | — | (8,020 | ) | |||||||||||||||||||
| Balance, December 31, 2019 | 37,460 | $ | 376 | $ | 354,326 | $ | (12,551 | ) | $ | (331,951 | ) | $ | (696 | ) | $ | 9,504 | ||||||||||||
The accompanying notes are an integral part of the consolidated financial statements.
65
CONSOLIDATED STATEMENTS OF CASH FLOWS
(dollars in thousands)
| For the Years Ended December 31, | ||||||||||||
| 2019 | 2018 | 2017 | ||||||||||
| Cash flows provided by operating activities: | ||||||||||||
| Net income (loss) | $ | 27,525 | $ | (858 | ) | $ | (104,671 | ) | ||||
| Adjustments to reconcile net income (loss) to net cash from operating activities: | ||||||||||||
| Depreciation and amortization | 35,925 | 36,455 | 39,259 | |||||||||
| Provision (benefit) for doubtful accounts | 1,131 | (733 | ) | 9,422 | ||||||||
| Impairment of intangible assets | — | 183 | 54,735 | |||||||||
| Stock-based compensation expense | 13,414 | 13,065 | 12,930 | |||||||||
| Deferred income taxes | (3,226 | ) | 3,452 | 26,248 | ||||||||
| Amortization of debt discounts and issuance costs | 1,623 | 2,837 | 8,876 | |||||||||
| Loss on extinguishment of debt | — | 16,998 | — | |||||||||
| Gain on sale and disposal of fixed assets | (1,614 | ) | (2,713 | ) | (2,059 | ) | ||||||
| Changes in operating assets and liabilities (Note U): | (15,932 | ) | 9,841 | (14,635 | ) | |||||||
| Net cash provided by operating activities | 58,846 | 78,527 | 30,105 | |||||||||
| Cash flows used in investing activities: | ||||||||||||
| Purchase of property, plant, and equipment | (26,433 | ) | (18,984 | ) | (16,355 | ) | ||||||
| Purchase of therapeutic program equipment leased to third parties under operating leases | (6,672 | ) | (9,835 | ) | (6,000 | ) | ||||||
| Acquisitions, net of cash acquired | (36,585 | ) | (1,978 | ) | — | |||||||
| Proceeds from company-owned life insurance investment | — | — | 17,135 | |||||||||
| Purchase of company-owned life insurance investment | (66 | ) | (598 | ) | (555 | ) | ||||||
| Proceeds from sale of property, plant and equipment | 2,598 | 4,237 | 4,909 | |||||||||
| Net cash used in investing activities | (67,158 | ) | (27,158 | ) | (866 | ) | ||||||
| Cash flows (used in) provided by financing activities: | ||||||||||||
| Borrowings under term loan, net of discount | — | 501,467 | 420 | |||||||||
| Repayment of term loan | (5,050 | ) | (435,660 | ) | (28,545 | ) | ||||||
| Borrowings under revolving credit agreement | — | 3,000 | 156,965 | |||||||||
| Repayments under revolving credit agreement | — | (8,000 | ) | (151,965 | ) | |||||||
| Payment of employee taxes on stock-based compensation | (4,137 | ) | (2,906 | ) | (1,477 | ) | ||||||
| Payment on seller notes | (3,821 | ) | (2,599 | ) | (5,197 | ) | ||||||
| Payment of financing lease obligations | (474 | ) | (1,207 | ) | (1,210 | ) | ||||||
| Payment of debt issuance costs | — | (6,757 | ) | (2,863 | ) | |||||||
| Payment of debt extinguishment costs | — | (8,436 | ) | — | ||||||||
| Proceeds from exercise of options | 1,099 | 64 | — | |||||||||
| Net cash (used in) provided by financing activities | (12,383 | ) | 38,966 | (33,872 | ) | |||||||
| (Decrease) increase in cash, cash equivalents and restricted cash | (20,695 | ) | 90,335 | (4,633 | ) | |||||||
| Cash, cash equivalents, and restricted cash, at beginning of period | 95,114 | 4,779 | 9,412 | |||||||||
| Cash, cash equivalents, and restricted cash, at end of period | $ | 74,419 | $ | 95,114 | $ | 4,779 | ||||||
66
| Years Ended December 31, | ||||||||||||
| Reconciliation of Cash, Cash Equivalents, and Restricted Cash | 2019 | 2018 | 2017 | |||||||||
| Cash and cash equivalents, at beginning of period | $ | 95,114 | $ | 1,508 | $ | 7,157 | ||||||
| Restricted cash, at beginning of period | — | 3,271 | 2,255 | |||||||||
| Cash, cash equivalents, and restricted cash, at beginning of period | $ | 95,114 | $ | 4,779 | $ | 9,412 | ||||||
| Cash and cash equivalents, at end of period | $ | 74,419 | $ | 95,114 | $ | 1,508 | ||||||
| Restricted cash, at end of period | — | — | 3,271 | |||||||||
| Cash, cash equivalents, and restricted cash, at end of period | $ | 74,419 | $ | 95,114 | $ | 4,779 | ||||||
Changes in operating assets and liabilities on cash flows from operating activities and supplemental cash flow information is disclosed in Note U - “Supplemental Cash Flow Information” to the consolidated financial statements.
The accompanying notes are an integral part of the consolidated financial statements.
67
HANGER, INC.
NOTES TO CONSOLIDATED FINANCIAL STATEMENTS
As of and for the Years Ended December 31, 2019, 2018, and 2017
Note A — Organization and Summary of Significant Accounting Policies
Description of Business
Hanger, Inc. (“the Company,” “we,” “our,” or “us”) is a leading national provider of products and services that assist in enhancing or restoring the physical capabilities of patients with disabilities or injuries. We provide orthotic and prosthetic (“O&P”) services, distribute O&P devices and components, manage O&P networks, and provide therapeutic solutions to patients and businesses in acute, post-acute, and clinic settings. We operate through two segments, Patient Care and Products & Services.
Our Patient Care segment is primarily comprised of Hanger Clinic, which specializes in the design, fabrication, and delivery of custom O&P devices through 701 patient care clinics and 111 satellite locations in 46 states and the District of Columbia as of December 31, 2019. On a regular basis, we have been opening, closing, and merging patient care locations and satellite locations. During the year ended December 31, 2019, we have opened or acquired 100 and closed or consolidated 68 patient care locations.
Our Products & Services segment is comprised of our distribution services and therapeutic solutions businesses. As a leading provider of O&P products in the United States, we engage in the distribution of a broad catalog of O&P parts, componentry, and devices to independent O&P providers nationwide. The other business in our Products & Services segment is our therapeutic solutions business, which develops specialized rehabilitation technologies and provides evidence-based clinical programs for post-acute rehabilitation to patients at approximately 4,000 skilled nursing and post-acute providers nationwide.
Principles of Consolidation
Our consolidated financial statements include our accounts and those of our wholly-owned subsidiaries. All intercompany transactions and balances have been eliminated in the accompanying consolidated financial statements.
Use of Estimates and Assumptions
The preparation of consolidated financial statements in conformity with accounting principles generally accepted in the United States of America (“GAAP”) requires the use of estimates and assumptions that affect the reported amounts of revenues, expenses, assets, liabilities, and contingencies. Although actual results in subsequent periods may differ from these estimates, such estimates are developed based on the best information available to management and based on management’s best judgments at the time. We base our estimates on historical experience, observable trends, and various other assumptions that we believe are reasonable under the circumstances. All significant assumptions and estimates underlying the amounts reported in the consolidated financial statements and accompanying notes are regularly reviewed and updated when necessary. Changes in estimates are reflected prospectively in the consolidated financial statements based upon on-going actual trends, or subsequent settlements and realizations depending on the nature and predictability of the estimates and contingencies. Interim changes in estimates related to annual operating costs are applied prospectively within annual periods. Although we believe that our estimates are reasonable, actual results could differ from these estimates.
The most significant assumptions and estimates underlying these consolidated financial statements and accompanying notes involve revenue recognition and accounts receivable valuation, inventories, accounts payable and accrued liabilities, impairments of long-lived assets including goodwill, income taxes, business combinations, leases, and stock-based compensation.
68
Revenue Recognition
Patient Care Segment
Revenue in our Patient Care segment is primarily derived from contracts with third party payors for the provision of O&P devices and is recognized upon the transfer of control of promised products or services to the patient at the time the patient receives the device. At, or subsequent to delivery, we issue an invoice to the third party payor, which primarily consists of commercial insurance companies, Medicare, Medicaid, the VA, and private or patient pay (“Private Pay”) individuals. We recognize revenue for the amounts we expect to receive from payors based on expected contractual reimbursement rates, which are net of estimated contractual discounts and implicit price concessions. These revenue amounts are further revised as claims are adjudicated, which may result in additional disallowances. As such, these adjustments do not relate to an inability to pay, but to contractual allowances, our failure to ensure that a patient was currently eligible under a payor’s health plan, that the plan provides full O&P benefits, that we received prior authorization, that we filed or appealed the payor’s determination timely, on the basis of our coding, failure by certain classes of patients to pay their portion of a claim, or other administrative issues which are considered as part of the transaction price and recorded as a reduction of revenues.
Our products and services are sold with a 90-day labor and 180-day warranty for fabricated components. Warranties are not considered a separate performance obligation. We estimate warranties based on historical trends and include them in accrued expenses and other current liabilities in the consolidated balance sheet. The warranty liability was $2.5 million at December 31, 2019 and $2.1 million at December 31, 2018.
A portion of our O&P revenue comes from the provision of cranial devices. In addition to delivering the cranial device, there are patient follow-up visits where we assist in treating the patient’s condition by adjusting or modifying the cranial device. We conclude that, for these devices, there are two performance obligations and use the expected cost plus margin approach to estimate for the standalone selling price of each performance obligation. The allocated portion associated with the patient’s receipt of the cranial device is recognized when the patient receives the device while the portion of revenue associated with the follow-up visits is initially recorded as deferred revenue. On average, the cranial device follow-up visits occur under 90 days after the patient receives the device and the deferred revenue is recognized on a straight-line basis over the period.
Medicare and Medicaid regulations and the various agreements we have with other third party payors, including commercial healthcare payors under which these contractual adjustments and disallowed revenue are calculated, are complex and are subject to interpretation and adjustment and may include multiple reimbursement mechanisms for different types of services. Therefore, the particular O&P devices and related services authorized and provided, and the related reimbursement, are subject to interpretation and adjustment that could result in payments that differ from our estimates. Additionally, updated regulations and reimbursement schedules, and contract renegotiations occur frequently, necessitating regular review and assessment of the estimation process by management. As a result, there is a reasonable possibility that recorded estimates could change and any related adjustments will be recorded as adjustments to net revenue when they become known.
Products & Services Segment
Revenue in our Products & Services segment is derived from the distribution of O&P components and the leasing and sale of rehabilitation equipment and ancillary consumable supplies combined with equipment maintenance, education, and training.
Distribution services revenues are recognized when obligations under the terms of a contract with our customers are satisfied, which occurs with the transfer of control of our products. This occurs either upon shipment or delivery of goods, depending on whether the terms are FOB Origin or FOB Destination. Payment terms are typically between 30 to 90 days. Revenue is measured as the amount of consideration we expect to receive in exchange for transferring products to a customer (“transaction price”).
To the extent that the transaction price includes variable consideration, such as prompt payment discounts, list price discounts, rebates, and volume discounts, we estimate the amount of variable consideration that should be included in the transaction price utilizing the most likely amount method. Variable consideration is included in the transaction price if, in our judgment, it is probable that a significant future reversal of cumulative revenue under the contract will not occur. Estimates of variable consideration and determination of whether to include estimated amounts in the transaction price are based largely on an assessment of our anticipated performance and all information (historical, current, and forecasted) that is reasonably available.
69
We reduce revenue by estimates of potential future product returns and other allowances. Provisions for product returns and other allowances are recorded as a reduction to revenue in the period sales are recognized. We make estimates of the amount of sales returns and allowances that will eventually be incurred. Management analyzes sales programs that are in effect, contractual arrangements, market acceptance, and historical trends when evaluating the adequacy of sales returns and allowance accounts.
Therapeutic program equipment and related services revenue are recognized over the applicable term the customer has the right to use the equipment and as the services are provided. Equipment sales revenue is recognized upon shipment, with any related services revenue deferred and recognized as the services are performed. Sales of consumables are recognized upon shipment.
In addition, we estimate amounts recorded to bad debt expense using historical trends and these are presented as a bad debt expense under the operating costs section of our consolidated financial statements.
Material Costs
Material costs in our Patient Care segment reflect purchases of orthotics and prosthetic componentry and other related costs in connection with the delivery of care through our clinics and other patient care operations. Material costs in our Products & Services segment reflect purchases of orthotics and prosthetic materials and other related costs in connection with the distribution of products and services to third party customers.
Personnel Costs
Personnel costs reflect salaries, benefits, incentive compensation, contract labor, and other personnel costs we incur in connection with our delivery of care through our clinics and other patient care operations, or distribution of products and services, and exclude similar costs incurred in connection with general and administrative activities.
Other Operating Costs
Other operating costs reflect costs we incur in connection with our delivery of care through our clinics and other patient care operations or distribution of products and services. Marketing costs, including advertising, are expensed as incurred and are presented within this financial statement caption. We incurred approximately $3.8 million in advertising costs during the years ended December 31, 2019, 2018, and 2017, respectively. Other costs include rent, utilities, and other occupancy costs, general office expenses, bad debt expense, and travel and clinical professional education costs, and exclude similar costs incurred in connection with general and administrative activities.
General and Administrative Expenses
General and administrative expenses reflect costs we incur in the management and administration of our businesses that are not directly related to the operation of our clinics or provision of products and services. These include personnel costs and other operating costs supporting our general and administrative functions. We incurred approximately $0.9 million, $1.5 million, and $0.7 million in advertising costs during the years ended December 31, 2019, 2018, and 2017, respectively.
70
Professional Accounting and Legal Fees
We recognize fees associated with audits of our financial statements in the fiscal period to which the audit relates. All other professional fees are generally recognized as an expense in the periods in which services are performed. Please see the “Accounts Payable and Accrued Liabilities” section for legal fees associated with legal contingencies.
Depreciation and Amortization
Depreciation and amortization expenses reflect all depreciation and amortization expenses, whether incurred in connection with our delivery of care through our clinics, our distribution of products and services, or in the general management and administration of our business.
Cash and Cash Equivalents
We consider all highly liquid investments with original maturities of three months or less at the date of purchase to be cash equivalents. We maintain cash balances in excess of Federal Deposit Insurance Corporation (“FDIC”) limits at certain financial institutions. We manage this credit risk by concentrating our cash balances in high quality financial institutions and by periodically evaluating the credit quality of the primary financial institutions holding such deposits. With short maturities, the investments present insignificant risk of changes in value because of interest rate changes and are readily convertible to cash. Historically, no losses have been incurred due to such cash concentrations.
Accounts Receivable, Net
Patient Care Segment
We establish allowances for accounts receivable to reduce the carrying value of such receivables to their estimated net realizable value. The Patient Care segment’s accounts receivables are recorded net of unapplied cash and estimated implicit price concessions, such as disallowed revenue and patient non-payments, as described in the revenue recognition accounting policy above.
Estimates for both disallowed revenue and patient non-payments apply the expected value method by considering historical collection experience by each of the Medicare and non-Medicare (commercial insurance, Medicaid, the VA, and Private Pay) primary payor class groupings. For each payor class grouping, liquidation analysis of historical period end receivable balances are performed to ascertain collections experience by aging category. We believe the use of historical collection experience applied to current period end receivable balances is reasonable. In the absence of an evident adverse trend, we use historical experience rates calculated using an average of four quarters of data with at least twelve months of adjudication. We believe the time periods analyzed provide sufficient time for most balances to adjudicate in the normal course of operations. We will modify the time periods analyzed when significant trends indicate that adjustments should be made. In addition, estimates are adjusted when appropriate for information available up through the issuance of the consolidated financial statements.
71
Products & Services Segment
Our Products & Services segment’s allowance for doubtful accounts is estimated based on the analysis of the segment’s historical write-offs experience, accounts receivable aging and economic status of its customers. Accounts receivable that are deemed uncollectible are written off to the allowance for doubtful accounts. Accounts receivable are also recorded net of an allowance for estimated sales returns.
Inventories
Inventories are valued at the lower of estimated cost or net realizable value with cost determined on a first-in, first-out (“FIFO”) basis. Provisions have also been made to reduce the carrying value of inventories for excess, obsolete, or otherwise impaired inventory on hand at period end. The reserve for excess and obsolete inventory is $7.6 million and $7.2 million at December 31, 2019 and 2018, respectively.
Patient Care Segment
Substantially all of our Patient Care segment inventories are recorded through a periodic approach whereby inventory quantities are adjusted on the basis of a quarterly physical count. Segment inventories relate primarily to raw materials and work-in-process (“WIP”) at Hanger Clinics. Inventories at Hanger Clinics totaled $29.4 million and $27.5 million at December 31, 2019 and 2018, respectively, with WIP inventory representing $10.2 million and $9.3 million of the total inventory, respectively.
Raw materials consist of purchased parts, components, and supplies which are used in the assembly of O&P devices for delivery to patients. In some cases, purchased parts and components are also sold directly to patients. Raw materials are valued based on recent vendor invoices, reduced by estimated vendor rebates. Such rebates are recognized as a reduction of cost of materials in the consolidated statements of operations when the related devices or components are delivered to the patient. Approximately 74% of raw materials at December 31, 2019 and 2018, respectively, were purchased from our Products & Services segment. Raw material inventory was $19.2 million and $18.2 million at December 31, 2019 and 2018, respectively.
WIP consists of devices which are in the process of assembly at our clinics or fabrication centers. WIP quantities were determined by the physical count of patient orders at the end of every quarter of 2019 and 2018 while the related stage of completion of each order was established by clinic personnel. We do not have an inventory costing system and as a result, the identified WIP quantities were valued on the basis of estimated raw materials, labor, and overhead costs. To estimate such costs, we develop bills of materials for certain categories of devices that we assemble and deliver to patients. Within each bill of material, we estimate (i) the typical types of component parts necessary to assemble each device; (ii) the points in the assembly process when such component parts are added; (iii) the estimated cost of such parts based on historical purchasing data; (iv) the estimated labor costs incurred at each stage of assembly; and (v) the estimated overhead costs applicable to the device.
Products & Services Segment
Our Product & Service segment inventories consist primarily of finished goods at its distribution centers as well as raw materials at fabrication facilities, and totaled $38.8 million and $40.2 million as of December 31, 2019 and 2018, respectively. Finished goods include products that are available for sale to third party customers as well as to our Patient Care segment as described above. Such inventories were determined on the basis of perpetual records and a physical count at year end. Inventories in connection with therapeutic services are valued at a weighted average cost.
72
Fair Value Measurements
We follow the authoritative guidance for financial assets and liabilities, which establishes a framework for measuring fair value and requires enhanced disclosures about fair value measurements. The authoritative guidance requires disclosure about how fair value is determined for assets and liabilities and establishes a hierarchy by which these assets and liabilities must be categorized, based on significant levels of inputs. The determination of where assets and liabilities fall within this hierarchy is based upon the lowest level of input that is significant to the fair value measurement.
Level 1 consists of securities for which there are quoted prices in active markets for identical securities;
Level 2 consists of securities for which observable inputs other than Level 1 inputs are used, such as quoted prices for similar securities in active markets or quoted prices for identical securities in less active markets and model-derived valuations for which the variables are derived from, or corroborated by, observable market data; and
Level 3 consists of securities for which there are no observable inputs to the valuation methodology that are significant to the measurement of the fair value.
The determination of where assets and liabilities fall within this hierarchy is based upon the lowest level of input that is significant to the fair value measurement.
Derivative Financial Instruments
We are exposed to certain risks arising from both our business operations and economic conditions. We manage economic risks, including interest rate, liquidity, and credit risk primarily by managing the amount, sources, and duration of our debt funding and the use of derivative financial instruments. Our derivative financial instruments are used to manage differences in the amount, timing, and duration of our known or expected cash payments principally related to our borrowings.
Our objectives in using interest rate derivatives are to add stability to interest expense and to manage our exposure to interest rate movements. To accomplish these objectives, we primarily use interest rate swaps as part of our interest rate risk management strategy. Interest rate swaps designated as cash flow hedges involve the receipt of variable amounts from a counter party in exchange for us making fixed-rate payments over the life of the agreements without exchange of the underlying notional amount. In accordance with ASC 815, “Derivatives and Hedging,” we record all derivatives in the consolidated balance sheets as either assets or liabilities measured at fair value. The change in the fair value of derivatives designated and that qualify as cash flow hedges is recorded on our consolidated balance sheet in accumulated other comprehensive loss net of tax and is subsequently reclassified into earnings in the period that the hedged forecasted transaction affects earnings. During the year ended December 31, 2019, such derivatives were used to hedge certain variable cash flows associated with existing variable-rate debt.
Insurance Recoveries Receivable
We incur legal and other costs with respect to a variety of issues on an ongoing basis. We record a related receivable when costs are reimbursable under applicable insurance policies, we believe it is probable such costs will be reimbursed and such reimbursements can be reasonably estimated. We record the benefit of related receivables from the insurer as a reduction of costs in the same financial statement caption in which the related loss was recognized in our consolidated statements of operations. Loss contingency reserves, which are recorded within accrued liabilities, are not reduced by estimated insurance recoveries.
Property, Plant, and Equipment, Net
Property, plant, and equipment are recorded at cost less accumulated depreciation and amortization. The cost and related accumulated depreciation of assets sold, retired, or otherwise disposed of are removed from the respective accounts, and any resulting gains or losses are included in the consolidated statements of operations. Depreciation is computed for financial reporting purposes using the straight-line method over the useful lives of the related assets estimated as follows: furniture and fixtures, equipment, and information systems, principally five years, buildings ten to forty years, finance leases over the shorter of the useful life or lease term, and leasehold improvements over the shorter of ten years or the lease term. We record maintenance and repairs, including the cost of minor replacements, to maintenance expense which is included within “Other operating costs” in our consolidated statements of operations. Costs of major repairs that extend the effective useful life of property are capitalized and depreciated accordingly.
73
We capitalize the costs of obtaining or developing internal use software, including external direct costs of materials and services and directly related payroll costs. Amortization begins when the internal use software is ready for its intended use. Costs incurred during the preliminary project and post-implementation stages, as well as maintenance and training costs, are expensed as incurred.
Business Combinations
We record tangible and intangible assets acquired and liabilities assumed in business combinations under the acquisition method of accounting. Acquisition consideration typically includes cash payments, the issuance of Seller Notes and in certain instances contingent consideration with payment terms based on the achievement of certain targets of the acquired business. Amounts paid for each acquisition are allocated to the assets acquired and liabilities assumed based on their estimated fair values at the date of acquisition inclusive of identifiable intangible assets. The estimated fair value of identifiable assets and liabilities, including intangibles, are based on valuations that use information and assumptions available to management. We allocate any excess purchase price over the fair value of the tangible and identifiable intangible assets acquired and liabilities assumed to goodwill. Significant management judgments and assumptions are required in determining the fair value of assets acquired and liabilities assumed, particularly acquired intangible assets, including estimated useful lives. The valuation of purchased intangible assets is based upon estimates of the future performance and discounted cash flows of the acquired business. Each asset acquired or liability assumed is measured at estimated fair value from the perspective of a market participant. Subsequent changes in the estimated fair value of contingent consideration are recognized as general and administrative expenses within the consolidated statements of operations.
Goodwill and Other Intangible Assets, Net
Goodwill represents the excess of the purchase price over the estimated fair value of net identifiable assets acquired and liabilities assumed from purchased businesses. We assess goodwill for impairment annually during the fourth quarter, and between annual tests if an event occurs or circumstances change that would more likely than not reduce the fair value of a reporting unit below its carrying amount. We have the option to first assess qualitative factors for a reporting unit to determine whether it is more likely than not that the fair value of a reporting unit is less than its carrying amount as a basis for determining whether it is necessary to perform the quantitative goodwill impairment test. If we choose to bypass this qualitative assessment or alternatively determine that a quantitative goodwill impairment test is required, our annual goodwill impairment test is performed by comparing the estimated fair value of a reporting unit with its carrying amount (including attributed goodwill). We measure the fair value of the reporting units using a combination of income and market approaches. Any impairment would be recognized by a charge to income from operations and a reduction in the carrying value of the goodwill. As of October 1, 2019, we performed a qualitative assessment of the Patient Care reporting unit, which resulted in no indicators of goodwill impairment.
We apply judgment in determining the fair value of our reporting units and the implied fair value of goodwill which is dependent on significant assumptions and estimates regarding expected future cash flows, terminal value, changes in working capital requirements, and discount rates.
For the year ended December 31, 2017, we recorded impairments of our goodwill totaling $53.3 million, respectively. We did not have any goodwill impairment during 2019 and 2018. For the years ended December 31, 2018, and 2017, we recorded impairments of our indefinite-lived trade name totaling $0.2 million, and $1.4 million, respectively. We did not have any indefinite-lived trade name impairment during 2019. See Note H - “Goodwill and Other Intangible Assets” to our consolidated financial statements in this Annual Report on Form 10-K for additional information regarding these charges.
74
As described, we apply judgment in the selection of key assumptions used in the goodwill impairment test and as part of our evaluation of intangible assets tested annually and at interim testing dates as necessary. If these assumptions differ from actual, we could incur additional impairment charges and those charges could be material.
Long-Lived Asset Impairment
We evaluate the carrying value of long-lived assets to be held and used for impairment whenever events or changes in circumstance indicate that the carrying amount may not be recoverable. The carrying value of a long-lived asset group is not recoverable if it exceeds the sum of the undiscounted cash flows expected to result from the use and eventual disposition of the asset group. We measure impairment as the amount by which the carrying value exceeds the estimated fair value. Estimated fair value is determined primarily using the projected future cash flows discounted at a rate commensurate with the risk involved. Long-lived assets to be disposed of by sale are classified as held for sale when the applicable criteria are met, and recognized within the consolidated balance sheet at the lower of carrying value or fair value less cost to sell. Depreciation on such assets is ceased.
Long-Term Debt
Long-term debt is recorded on our consolidated balance sheets at amortized cost, net of discounts and issuance expenses. Debt issuance costs incurred in connection with long-term debt are amortized utilizing the effective interest method, through the maturity of the related debt instrument. Discounts and costs incurred pertaining to the long-term debt are classified as a reduction of debt, and the costs incurred to obtain the revolving credit facility are recorded as deferred charges and are classified within other assets in the consolidated balance sheets. Amortization of these costs is included within “Interest expense, net” in the consolidated statements of operations.
Accounts Payable and Accrued Liabilities
Accounts payable relating to goods or services received is based on various factors including payments made subsequent to period end, vendor invoice dates, shipping terms confirmed by certain vendors or other third party documentation. Accrued liabilities are recorded based on estimates of services received or amounts expected to be paid to third parties. Accrued legal costs for legal contingencies are recorded when they are probable and estimable.
Self-Insurance Reserves
We maintain insurance programs which include employee health insurance; workers’ compensation; and product, professional, and general liability. Our employee health insurance program is self-funded, with a stop-loss coverage on claims that exceed $0.8 million for any individually covered claim. We are responsible for workers’ compensation, product, professional and general liability claims up to $0.5 million per individual incident. The insurance and self-insurance accruals reflect the estimate of incurred but not reported losses, historical claims experience, and expected costs to settle unpaid claims and are undiscounted. We record amounts due from insurance policies in “Other assets” while recording the estimated liability in “Accrued expenses and other current liabilities” in our consolidated balance sheets.
Leases
We lease a majority of our patient care clinics and warehouses under lease arrangements, certain of which contain renewal options, rent escalation clauses, and/or landlord incentives. Rent expense for noncancellable leases with scheduled rent increases and/or landlord incentives is recognized on a straight-line basis over the lease term, including any applicable rent holidays, beginning on the lease commencement date. We exclude leases with a term of one year or less from our balance sheet, and do not separate non-lease components from our real estate leases. Our leases may include variable payments for maintenance, which are expensed as incurred.
In addition, we are the lessor of therapeutic program equipment to patients and businesses in acute, post-acute, and clinic settings. The therapeutic program equipment and related services revenue are recognized over the applicable term the customer has the right to use the equipment and as the services are provided. These operating lease agreements are typically for twelve months and have a 30-day cancellation policy. Equipment acquired under a finance lease is recorded at the present value of the future minimum lease payments. We do not separate non-lease components, consisting primarily of training, for these leases.
75
Income Taxes
We recognize deferred tax assets and liabilities for net operating loss and other credit carry forwards and the expected tax consequences of temporary differences between the tax basis of assets and liabilities and their reported amounts using enacted tax rates in effect for the year the differences are expected to reverse. The ultimate realization of deferred tax assets is dependent upon the generation of future taxable income during the periods in which those temporary differences become deductible. The evaluation of deferred tax assets requires judgment in assessing the likely future tax consequences of events that have been recognized in our financial statements or tax returns, and future profitability by tax jurisdiction.
We provide a valuation allowance to reduce our deferred tax assets to the amount that is more likely than not to be realized. We evaluate our deferred tax assets quarterly to determine whether adjustments to the valuation allowance are appropriate in light of changes in facts or circumstances, such as changes in expected future pre-tax earnings, tax law, interactions with taxing authorities, and developments in case law. Our material assumptions include forecasts of future pre-tax earnings and the nature and timing of future deductions and income represented by the deferred tax assets and liabilities, all of which involve the exercise of significant judgment. We have experienced losses from 2014 to 2017 due to impairments of our intangible assets, increased professional fees in relation to our restatement and related remediation procedures for identified material weaknesses, and increased interest and bank fees. These losses have necessitated that we evaluate the sufficiency of our valuation allowance. We are in a taxable income position in 2019 and are able to utilize net operating loss. We have $2.8 million and $10.7 million of U.S. federal and $136.9 million and $166.0 million of state net operating loss carryforwards available at December 31, 2019 and 2018, respectively. These carryforwards will be used to offset future income but may be limited by the change in ownership rules in Section 382 of the Internal Revenue Code. These net operating loss carryforwards will expire in varying amounts between 2020 and 2039. We expect to generate income before taxes in future periods at a level that would allow for the full realization of the majority of our net deferred tax assets. As of December 31, 2019 and 2018, we have recorded a valuation allowance of approximately $2.1 million and $8.9 million, respectively, related to various state jurisdictions.
Based on our assessment of all available positive and negative evidence, which is completed quarterly, on a taxing jurisdiction and legal entity basis, we determined that it was more likely than not that we would be able to realize the benefit of certain state deferred tax assets and released valuation allowances of $7.1 million against our state deferred tax assets during the fourth quarter of 2019. We considered a number of types of evidence, including the nature, frequency, and severity of current and cumulative financial reporting income and losses, sources of future taxable income, future reversals of existing taxable temporary differences, and prudent and feasible tax planning strategies, weighted by objectivity. Management decided to release this valuation allowance primarily because the legal entity involved has achieved twelve quarters of cumulative financial reporting income in 2019 and is forecasting future taxable income along with other types of favorable evidence mentioned above.
We believe that our tax positions are consistent with applicable tax law, but certain positions may be challenged by taxing authorities. In the ordinary course of business, there are transactions and calculations where the ultimate tax outcome is uncertain. In addition, we are subject to periodic audits and examinations by the Internal Revenue Service and other state and local taxing authorities. In these cases, we record the financial statement effects of a tax position when it is more likely than not, based on the technical merits, that the position will be sustained upon examination. We record the largest amount of tax benefit that is greater than fifty percent likely of being realized upon settlement with a taxing authority that has full knowledge of all relevant information. If not paid, the liability for uncertain tax positions is reversed as a reduction of income tax expense at the earlier of the period when the position is effectively settled or when the statute of limitations has expired. Although we believe that our estimates are reasonable, actual results could differ from these estimates. Interest and penalties, when applicable, are recorded within the income tax provision.
76
Interest Expense, Net
We record interest expense net of interest income. In our consolidated statements of operations, interest income was not material in the years ended December 31, 2019, 2018, and 2017.
Share Based Compensation
We primarily issue restricted common stock units under one active share based compensation plan. Shares of common stock issued under this plan are issued from our authorized and unissued shares.
We measure and recognize compensation expense, net of actual forfeitures, for all shares based payments at fair value. Prior to the adoption of ASU 2016-09, compensation expense was measured and recognized net of estimated forfeitures. Our outstanding awards are comprised of restricted stock units, performance-based restricted stock units, and stock options. The restricted stock units are subject to a service condition or vesting period ranging from one to four years. The performance-based restricted stock units include performance or market and service conditions. The performance conditions are primarily based on annual earnings per share targets and the market condition utilized in the Special Equity Plan is based on the three year absolute Common Stock price compounded annual growth rate (“CAGR”).
The fair value of each employee stock option award is estimated on the date of grant using the Black-Scholes option-pricing model. The expected dividend yield is derived from the annual dividend rate on the date of grant. The expected stock volatility is based on an assessment of our historical weekly stock prices as well as implied volatility. The risk-free interest rate is based on U.S. government zero coupon bonds with maturities similar to the expected holding period. The expected holding period was determined by examining historical and projected post-vesting exercise behavior activity. Forfeitures are recognized as they occur.
Compensation expense associated with restricted stock units and options is recognized on a straight-line basis over the requisite service period. Compensation expense associated with performance-based restricted stock units is primarily recognized on a graded vesting over the requisite service period when the performance condition is probable of being achieved. The compensation expense associated with the performance-based restricted stock subject to market conditions is recognized on a straight-line basis over the requisite service period.
Segment Information
We have two segments: Patient Care and Products & Services. Except for the segment specific policies described above, the segments follow the same accounting policies as followed in the consolidated financial statements. We apply the “management approach” to disclosure of segment information. The management approach designates the internal organization that is used by management for making operating decisions and assessing performance as the basis of our reportable segments. The description of our reportable segments and the disclosure of segment information are presented in Note T - “Segment and Related Information” to these consolidated financial statements.
Intersegment revenue represents sales of O&P components from our Products & Services segment to our Patient Care segment and are recorded at prices that approximate material cost plus overhead.
Recent Accounting Pronouncements
Recently Adopted Accounting Pronouncements
During 2019 we adopted the following:
| • | Accounting Standards Update (“ASU”) No. 2016-02, Leases (ASC 842), and related clarifying standards, as of January 1, 2019, using the modified retrospective approach. This approach allows us to apply the standard as of the adoption date and record a cumulative-effect adjustment to the opening balance of accumulated deficit at January 1, 2019. The new lease standard requires lessees to recognize a right-of-use (“ROU”) asset and a lease liability on the balance sheet for all leases (with the exception of short-term leases, defined as leases with a term of 12 months or less) at the lease commencement date and recognize expenses on the consolidated statements of operations on a straight-line basis. |
77
In addition, we elected the package of practical expedients available under the transition provisions of the new lease standard, including (i) not reassessing whether expired or existing contracts contain leases, (ii) carrying forward lease classification under legacy guidance, and (iii) not revaluing initial direct costs for existing leases. By electing the modified retrospective approach on adoption date, prior period results will continue to be presented under legacy guidance based on the accounting standards originally in effect for such period. We have elected to keep leases with an initial term of 12 months or less off the balance sheet and recognize those lease payments in the consolidated statements of operations on a straight-line basis over the lease term. We have lease agreements with lease and non-lease components, and have elected to utilize the practical expedient to account for lease and non-lease components together as a single combined lease component for real estate and therapeutic program equipment, from both a lessee and lessor perspective. From a lessor perspective, the timing and pattern of transfer are the same for the non-lease components and associated lease component and, the lease component, if accounted for separately, would be classified as an operating lease. The accounting for our finance leases and leases where we are the lessor remained substantially unchanged.
The lease liability was measured as the present value of the unpaid lease payments and the right-of-use asset was derived from the calculation of the lease liability. As the rate implicit in the lease is generally not readily determinable for our operating leases, the discount rates used to determine the present value of our lease liability are based on our incremental borrowing rate at the lease commencement date and commensurate with the remaining lease term. Our incremental borrowing rate for a lease is the rate of interest we would have to pay to borrow on a collateralized basis over a similar term an amount equal to the lease payments in a similar economic environment. Our lease term may include options to extend or terminate if the exercise of that option is reasonably certain to occur. We rent or sublease certain real estate to third parties. Our sublease portfolio consists mainly of operating leases on small medical office locations.
The most significant impact of the new lease standard was to the balance sheet, where values were added for real estate operating leases, which increased both assets and liabilities. The capital leases associated with equipment were already reflected on our balance sheet and did not add any incremental assets or liabilities under the new lease standard. The adoption of the new lease standard did not have an impact on our compliance with existing debt covenants because the impact of changes in accounting standards is excluded from debt covenant calculations. The impact of applying the new lease standard to our results of operations and cash flows was not material.
Additionally, we determined that the leases previously identified as build-to-suit leasing arrangements under legacy lease accounting should be derecognized pursuant to the transition guidance provided for build-to-suit leases in ASC 842. Accordingly, these leases were reassessed as operating leases as of January 1, 2019. The legacy guidance was based on a risks and rewards model which contained several prescriptive provisions designed to assess lessee ownership during construction. The ASC 842 model has eliminated these prescriptive rules and replaced them with a model based on control. Under ASC 842, we did not demonstrate control as the lessee and therefore the leases were derecognized at January 1, 2019. The resulting cumulative effect recognized at adoption to accumulated deficit was $1.5 million, net of tax.
78
Upon adoption of ASC 842, the cumulative effect of the changes made to our consolidated balance sheet as of January 1, 2019 was as follows:
| December 31, 2018 | Effects of | January 1, 2019 | ||||||||||
| (in thousands) | As reported | adoption | After adoption | |||||||||
| Assets | ||||||||||||
| Other current assets | $ | 18,731 | $ | (5,770 | ) | $ | 12,961 | |||||
| Total current assets | 325,900 | (5,770 | ) | 320,130 | ||||||||
| Property, plant, and equipment, net | 89,489 | (8,068 | ) | 81,421 | ||||||||
| Other intangible assets, net | 15,478 | (220 | ) | 15,258 | ||||||||
| Deferred income taxes | 65,635 | (584 | ) | 65,051 | ||||||||
| Operating lease right-of-use assets | — | 102,226 | 102,226 | |||||||||
| Other assets | 7,766 | 538 | 8,304 | |||||||||
| Total assets | 703,010 | 88,122 | 791,132 | |||||||||
| Liabilities | ||||||||||||
| Current liabilities: | ||||||||||||
| Current portion of long-term debt | 8,583 | (619 | ) | 7,964 | ||||||||
| Accrued expenses and other current liabilities | 51,783 | (1,352 | ) | 50,431 | ||||||||
| Current portion of operating lease liabilities | — | 31,479 | 31,479 | |||||||||
| Total current liabilities | 171,274 | 29,508 | 200,782 | |||||||||
| Long-term liabilities: | ||||||||||||
| Long-term debt, less current portion | 502,090 | (12,493 | ) | 489,597 | ||||||||
| Operating lease liabilities | — | 82,510 | 82,510 | |||||||||
| Other liabilities | 51,570 | (12,950 | ) | 38,620 | ||||||||
| Total liabilities | 724,934 | 86,575 | 811,509 | |||||||||
| Shareholders’ deficit: | ||||||||||||
| Accumulated deficit | (361,023 | ) | 1,547 | (359,476 | ) | |||||||
| Total shareholders’ deficit | (21,924 | ) | 1,547 | (20,377 | ) | |||||||
| Total liabilities and shareholders’ deficit | $ | 703,010 | $ | 88,122 | $ | 791,132 | ||||||
| • | ASU No. 2018-15, Intangibles - Goodwill and Other - Internal-Use Software (Topic 350) - Customer’s Accounting for Implementation Costs Incurred in a Cloud Computing Arrangement That Is a Service Contract, which requires capitalizing implementation costs incurred in a hosting arrangement that is a service contract with the requirements for capitalizing implementation costs incurred to develop or obtain internal-use software (and hosting arrangements that include an internal-use software license). Effective July 1, 2019, we elected to early adopt the requirements of the standard on a prospective basis. As of December 31, 2019, we capitalized $2.1 million of implementation costs for cloud computing arrangements, net of accumulated amortization, which is recorded in other current assets and other assets in the consolidated balance sheet. |
During 2018 we adopted the following:
| • | Accounting Standards Update (“ASU”) No. 2014-09, Revenue from Contracts with Customers (Topic 606) and related clarifying standards (“ASC 606”), on revenue recognition using the modified retrospective method for all contracts in place at January 1, 2018. Under ASC 606, estimated uncollectible amounts due from self-pay patients, as well as co-pays, co-insurance, and deductibles owed to us by patients with insurance are generally considered implicit price concessions and are now presented as a reduction of net revenue. Under prior guidance, these amounts were recognized as bad debt expense and were included in other operating costs. |
The adoption of this standard did not have a material impact on our results of operations. The cumulative effect of implementing this guidance resulted in an increase of $0.8 million to the opening balance of accumulated deficit from establishing a contract liability of $1.0 million for certain performance obligations that must be recognized over time and an increase in deferred tax assets in the amount of $0.3 million.
79
Recent Accounting Pronouncements, Not Yet Adopted
In June 2016, the FASB issued ASU No. 2016-13, Financial Instruments-Credit Losses (Topic 326): Measurement of Credit Losses on Financial Instruments, and related clarifying standards, which replaces the incurred loss impairment methodology in current GAAP with a methodology that reflects expected credit losses and requires consideration of a broader range of reasonable and supportable information to inform credit loss estimates. This ASU is effective for public entities for fiscal years beginning after December 15, 2019, with early adoption permitted. Adoption of the standard is not expected to have a material impact on our consolidated financial statements.
In August 2018, the FASB issued ASU No. 2018-13, Fair Value Measurement (Topic 820), which modifies the disclosures on fair value measurements by removing the requirement to disclose the amount and reasons for transfers between Level 1 and Level 2 of the fair value hierarchy and the policy for timing of such transfers. The ASU expands the disclosure requirements for Level 3 fair value measurements, primarily focused on changes in unrealized gains and losses included in other comprehensive income. The ASU is effective for public entities for fiscal years beginning after December 15, 2019, with early adoption permitted. Adoption of the standard is not expected to have a material impact on our consolidated financial statements.
In August 2018, the FASB issued ASU No. 2018-14, Compensation - Retirement Benefits - Defined Benefit Plans - General (Topic 715). This ASU modifies the disclosure requirements for defined benefit and other postretirement plans. This ASU eliminates certain disclosures associated with accumulated other comprehensive income, plan assets, related parties, and the effects of interest rate basis point changes on assumed health care costs; while other disclosures have been added to address significant gains and losses related to changes in benefit obligations. This ASU also clarifies disclosure requirements for projected benefit and accumulated benefit obligations. The amendments in this ASU are effective for public entities for fiscal years ending after December 15, 2020 and for interim periods therein with early adoption permitted. We are currently evaluating the effects that the adoption of this guidance will have on our consolidated financial statements and the related disclosures.
In December 2019, the FASB issued ASU No. 2019-12, Income Taxes (Topic 740): Simplifying the Accounting for Income Taxes. This ASU removes exceptions related to the incremental approach for intraperiod tax allocation when there is a loss from continuing operations and income or a gain from other comprehensive income, as well as, the exception to the general methodology for calculating income taxes in an interim period when a year-to-date loss exceeds the anticipated loss for the year. This ASU also modifies accounting related to income recognition of franchise tax, tax basis of goodwill, and effect of tax law or rate changes. The amendments in this ASU are effective for public entities for fiscal years ending after December 15, 2020 and for interim periods therein with early adoption permitted. We are currently evaluating the effects that the adoption of this guidance will have on our consolidated financial statements and the related disclosures.
Note B — Earnings Per Share
Basic earnings per common share is computed using the weighted average number of common shares outstanding during the period. Diluted earnings per common share is computed using the weighted average number of common shares outstanding during the period plus any potentially dilutive common shares, such as stock options, restricted stock units, and performance-based units calculated using the treasury stock method. Total anti-dilutive shares excluded from the diluted earnings per share were zero as of December 31, 2019, and 17,894 and 473,037 as of December 31, 2018 and 2017, respectively.
Our credit agreement restricts the payment of dividends or other distributions to our shareholders with respect to the parent company or any of its subsidiaries. See Note M - “Debt and Other Obligations” within these consolidated financial statements.
80
The reconciliation of the numerators and denominators used to calculate basic and diluted net income (loss) per share are as follows:
| For the Years Ended December 31, | ||||||||||||
| (in thousands, except per share data) | 2019 | 2018 | 2017 | |||||||||
| Net income (loss) | $ | 27,525 | $ | (858 | ) | $ | (104,671 | ) | ||||
| Weighted average shares outstanding - basic | 37,267,188 | 36,764,551 | 36,270,920 | |||||||||
| Effect of potentially dilutive restricted stock units and options(1) | 797,429 | — | — | |||||||||
| Weighted average shares outstanding - diluted | 38,064,617 | 36,764,551 | 36,270,920 | |||||||||
| Basic income (loss) per share | $ | 0.74 | $ | (0.02 | ) | $ | (2.89 | ) | ||||
| Diluted income (loss) per share | $ | 0.72 | $ | (0.02 | ) | $ | (2.89 | ) | ||||
(1) In accordance with ASC 260 - Earnings Per Share, during periods of a net loss, shares used to compute diluted per share amounts exclude potentially dilutive shares related to unvested restricted stock units and unexercised options. For the years ended December 31, 2018 and 2017, potentially dilutive shares of 709,309 shares and 295,718 shares were excluded, as we were in a net loss position.
Note C — Revenue Recognition
Patient Care Segment
Revenue in our Patient Care segment is primarily derived from contracts with third party payors for the provision of O&P devices and is recognized upon the transfer of control of promised products or services to the patient at the time the patient receives the device. At, or subsequent to delivery, we issue an invoice to the third party payor, which primarily consists of commercial insurance companies, Medicare, Medicaid, the VA, and Private Pay individuals. We recognize revenue for the amounts we expect to receive from payors based on expected contractual reimbursement rates, which are net of estimated contractual discounts and implicit price concessions. These revenue amounts are further revised as claims are adjudicated, which may result in additional disallowances.
The following table disaggregates revenue from contracts with customers in our Patient Care segment for the years ended December 31, 2019, 2018, and 2017:
| For the Years Ended December 31, | ||||||||||||
| (in thousands) | 2019 | 2018 | 2017 | |||||||||
| Patient Care Segment | ||||||||||||
| Medicare | $ | 289,099 | $ | 273,833 | $ | 260,275 | ||||||
| Medicaid | 143,438 | 132,938 | 132,707 | |||||||||
| Commercial Insurance/Managed Care (excluding Medicare and Medicaid Managed Care) | 323,499 | 316,243 | 325,639 | |||||||||
| Veterans Administration | 89,035 | 78,328 | 74,435 | |||||||||
| Private Pay | 60,620 | 56,040 | 58,917 | |||||||||
| Total | $ | 905,691 | $ | 857,382 | $ | 851,973 | ||||||
81
The impact to revenue related to prior period performance obligations was not material for the years ended December 31, 2019, 2018, and 2017.
Products & Services Segment
Revenue in our Products & Services segment is derived from the distribution of O&P components and from therapeutic solutions which includes the leasing and sale of rehabilitation equipment and ancillary consumable supplies combined with equipment maintenance, education, and training.
The following table disaggregates revenue from contracts with customers in our Product & Services segment for the years ended December 31, 2019, 2018, and 2017:
| For the Years Ended December 31, | ||||||||||||
| (in thousands) | 2019 | 2018 | 2017 | |||||||||
| Products & Services Segment | ||||||||||||
| Distribution services, net of intersegment revenue eliminations | $ | 143,400 | $ | 135,995 | $ | 128,686 | ||||||
| Therapeutic solutions | 48,955 | 55,383 | 60,110 | |||||||||
| Total | $ | 192,355 | $ | 191,378 | $ | 188,796 | ||||||
Note D — Accounts Receivable, Net
Accounts receivable, net represents outstanding amounts we expect to collect from the transfer of our products and services. Principally, these amounts are comprised of receivables from Medicare, Medicaid, and commercial insurance plans. Our accounts receivable represent amounts outstanding from our gross charges, net of contractual discounts, sales returns, and other implicit price concessions including estimates for payor disallowances and patient non-payments.
An allowance for doubtful accounts is also recorded for our Products & Services segment which is deducted from gross accounts receivable to arrive at “Accounts receivable, net.” Accounts receivable, net as of December 31, 2019 and 2018 is comprised of the following:
| As of December 31, 2019 | As of December 31, 2018 | |||||||||||||||||||||||
| (in thousands) | Patient Care | Products & Services | Consolidated | Patient Care | Products & Services | Consolidated | ||||||||||||||||||
| Gross charges before estimates for implicit price concessions | $ | 202,132 | $ | 27,551 | $ | 229,683 | $ | 182,338 | $ | 24,542 | $ | 206,880 | ||||||||||||
| Less estimates for implicit price concessions: | ||||||||||||||||||||||||
| Payor disallowances | (58,094 | ) | — | (58,094 | ) | (53,378 | ) | — | (53,378 | ) | ||||||||||||||
| Patient non-payments | (9,589 | ) | — | (9,589 | ) | (7,244 | ) | — | (7,244 | ) | ||||||||||||||
| Accounts receivable, gross | 134,449 | 27,551 | 162,000 | 121,716 | 24,542 | 146,258 | ||||||||||||||||||
| Allowance for doubtful accounts | — | (2,641 | ) | (2,641 | ) | — | (2,272 | ) | (2,272 | ) | ||||||||||||||
| Accounts receivable, net | $ | 134,449 | $ | 24,910 | $ | 159,359 | $ | 121,716 | $ | 22,270 | $ | 143,986 | ||||||||||||
Approximately 50.1% and 48.4% of gross charges before estimates for payor disallowances and patient non-payments, is due from the Federal Government (Medicare, Medicaid, and the VA) at December 31, 2019 and 2018, respectively.
82
The following table summarizes activities by year for the allowance for doubtful accounts:
| (in thousands) | Allowance for Doubtful Accounts | |||
| Balance at December 31, 2016 | $ | 15,521 | ||
| Additions | 9,423 | |||
| Reductions | (10,879 | ) | ||
| Balance at December 31, 2017 | 14,065 | |||
| Cumulative Effect of ASC 606 | (9,894 | ) | ||
| Additions | 630 | |||
| Reductions | (1,155 | ) | ||
| Recoveries | (1,374 | ) | ||
| Balance at December 31, 2018 | 2,272 | |||
| Additions | 1,877 | |||
| Reductions | (762 | ) | ||
| Recoveries | (746 | ) | ||
| Balance at December 31, 2019 | $ | 2,641 | ||
The following tables represent gross charges before estimates for payor disallowances and patient non-payments, by major payor classification and by aging categories reduced by implicit price concessions and allowance for doubtful accounts to accounts receivable, net as of December 31, 2019 and 2018, respectively:
| December 31, 2019 | ||||||||||||||||||||
| (in thousands) | 0-60 Days | 61-120 Days | 121-180 Days | Over 180 Days | Total | |||||||||||||||
| Patient Care | ||||||||||||||||||||
| Commercial insurance (excluding Medicare and Medicaid Managed Care) | $ | 46,771 | $ | 12,599 | $ | 7,050 | $ | 18,120 | $ | 84,540 | ||||||||||
| Private pay | 1,081 | 535 | 435 | 569 | 2,620 | |||||||||||||||
| Medicaid | 13,779 | 3,903 | 2,314 | 8,068 | 28,064 | |||||||||||||||
| VA | 4,465 | 1,015 | 353 | 565 | 6,398 | |||||||||||||||
| Non-Medicare | 66,096 | 18,052 | 10,152 | 27,322 | 121,622 | |||||||||||||||
| Medicare | 36,654 | 8,181 | 5,191 | 30,484 | 80,510 | |||||||||||||||
| Products & Services accounts receivable, before allowance | 15,898 | 7,345 | 2,103 | 2,205 | 27,551 | |||||||||||||||
| Gross charges before estimates for implicit price concessions and allowance for doubtful accounts | 118,648 | 33,578 | 17,446 | 60,011 | 229,683 | |||||||||||||||
| Less estimates for implicit price concessions | (67,683 | ) | ||||||||||||||||||
| Accounts receivable, before allowance | 162,000 | |||||||||||||||||||
| Allowance for doubtful accounts | (2,641 | ) | ||||||||||||||||||
| Accounts receivable, net | $ | 159,359 | ||||||||||||||||||
83
| December 31, 2018 | ||||||||||||||||||||
| (in thousands) | 0-60 Days | 61-120 Days | 121-180 Days | Over 180 Days | Total | |||||||||||||||
| Patient Care | ||||||||||||||||||||
| Commercial insurance (excluding Medicare and Medicaid Managed Care) | $ | 44,918 | $ | 11,495 | $ | 6,467 | $ | 17,172 | $ | 80,052 | ||||||||||
| Private pay | 951 | 437 | 343 | 483 | 2,214 | |||||||||||||||
| Medicaid | 12,690 | 2,964 | 1,855 | 6,629 | 24,138 | |||||||||||||||
| VA | 4,786 | 859 | 526 | 784 | 6,955 | |||||||||||||||
| Non-Medicare | 63,345 | 15,755 | 9,191 | 25,068 | 113,359 | |||||||||||||||
| Medicare | 32,339 | 5,483 | 3,002 | 28,155 | 68,979 | |||||||||||||||
| Products & Services accounts receivable, before allowance | 14,768 | 6,507 | 1,641 | 1,626 | 24,542 | |||||||||||||||
| Gross charges before estimates for implicit price concessions and allowance for doubtful accounts | 110,452 | 27,745 | 13,834 | 54,849 | 206,880 | |||||||||||||||
| Less estimates for implicit price concessions | (60,622 | ) | ||||||||||||||||||
| Accounts receivable, before allowance | 146,258 | |||||||||||||||||||
| Allowance for doubtful accounts | (2,272 | ) | ||||||||||||||||||
| Accounts receivable, net | $ | 143,986 | ||||||||||||||||||
Note E — Inventories
Our inventories are comprised of the following:
| As of December 31, | ||||||||
| (in thousands) | 2019 | 2018 | ||||||
| Raw materials | $ | 20,574 | $ | 19,632 | ||||
| Work in process | 10,165 | 9,278 | ||||||
| Finished goods | 37,465 | 38,780 | ||||||
| Total inventories | $ | 68,204 | $ | 67,690 | ||||
Note F — Property, Plant, and Equipment, Net
Property, plant, and equipment, net were comprised of the following:
| As of December 31, | ||||||||
| (in thousands) | 2019 | 2018 | ||||||
| Land | $ | 634 | $ | 644 | ||||
| Buildings (1) | 4,110 | 24,558 | ||||||
| Furniture and fixtures | 13,835 | 13,121 | ||||||
| Machinery and equipment | 25,438 | 27,452 | ||||||
| Equipment leased to third parties under operating leases | 29,217 | 30,093 | ||||||
| Leasehold improvements | 131,617 | 111,247 | ||||||
| Computers and software | 75,540 | 69,173 | ||||||
| Total property, plant, and equipment, gross | 280,391 | 276,288 | ||||||
| Less: accumulated depreciation and amortization | (196,334 | ) | (186,799 | ) | ||||
| Total property, plant, and equipment, net | $ | 84,057 | $ | 89,489 | ||||
(1) As discussed in Note A - “Organization and Summary of Significant Accounting Policies”, the new lease standard resulted in the removal of assets associated with build-to-suit leases.
84
Total depreciation expense was approximately $30.6 million, $29.7 million, and $29.7 million for the years ended December 31, 2019, 2018, and 2017, respectively.
The following table summarizes our investment in equipment leased to third parties under operating leases:
| As of December 31, | ||||||||
| (in thousands) | 2019 | 2018 | ||||||
| Program equipment | $ | 29,217 | $ | 30,093 | ||||
| Less: Accumulated depreciation | (12,972 | ) | (14,712 | ) | ||||
| Net book value | $ | 16,245 | $ | 15,381 | ||||
Note G — Acquisitions
2019 Acquisition Activity
During 2019, we completed the following acquisitions of O&P clinics, none of which were individually material to our financial position, results of operations, or cash flows. Each acquisition is intended to expand the geographic footprint of our patient care offerings through the acquisitions of high quality O&P providers.
| • | In the first quarter of 2019, we completed the acquisition of all the outstanding equity interests of an O&P business for total consideration of $32.8 million, of which $27.7 million was cash consideration, net of cash acquired, $4.4 million was issued in the form of notes to shareholders at fair value, and $0.7 million in additional consideration. |
| • | In the second quarter of 2019, we completed the acquisition of all the outstanding equity interests of an O&P business for total consideration of $0.5 million, of which $0.2 million was cash consideration, net of cash acquired, and $0.3 million was issued in the form of notes to shareholders at fair value. |
| • | In the third quarter of 2019, we completed the acquisition of all the outstanding equity interests of one O&P business and acquired the assets of another O&P business for total consideration of $3.3 million, of which $3.0 million was cash consideration, net of cash acquired, and $0.3 million was issued in the form of notes to shareholders at fair value. |
| • | In the fourth quarter of 2019, we completed the acquisition of all the outstanding equity interests of one O&P business and acquired the assets of another O&P business for total consideration of $7.8 million, of which $5.0 million was cash consideration, net of cash acquired, and $2.8 million was issued in the form of notes to shareholders at fair value. |
The notes issued to shareholders are unsecured and payable in installments over a period of 3 to 5 years.
We accounted for these transactions under the acquisition method of accounting and have reported the results of operations of each acquisition as of the respective dates of the acquisitions. The estimated fair values of intangible assets were based on an income approach utilizing primarily discounted cash flow techniques for non-compete agreements and an income approach utilizing the excess earnings method for customer relationships. The income approach utilizes management’s estimates of future operating results and cash flows using a weighted average cost of capital that reflects market participant assumptions. Other significant judgments used in the valuation of tangible assets acquired in the acquisition include estimated selling price of inventory and estimated replacement costs for acquired property, plant and equipment. Generally, for all other assets acquired and liabilities assumed, the fair value reflects the carrying value of the asset or liability due to their short maturity. The excess of the fair value of the consideration transferred in the acquisition over the fair value of net assets acquired was recorded as goodwill. The goodwill reflects our expectations of favorable future growth opportunities, anticipated synergies through the scale of our O&P operations, and the assembled workforce. We expect that substantially all of the goodwill, which has been assigned to our Patient Care reporting unit, will be deductible for federal income tax purposes.
85
Acquisition-related costs are included in general and administrative expenses in our consolidated statements of operations. Total acquisition-related costs incurred during the year ended December 31, 2019 were $1.5 million, which includes those costs for transactions that are in progress or not completed during the respective period. Acquisition-related costs incurred for acquisitions completed during the year ended December 31, 2019 were $1.0 million.
We have not presented pro forma combined results for these acquisitions because the impact on previously reported statements of operations would not have been material individually or in the aggregate.
Purchase Price Allocation
For acquisitions that occurred after the second quarter of 2019, we have performed a preliminary valuation analysis of the fair market value of the assets acquired and liabilities assumed in the acquisitions. The final purchase price allocations will be determined when we have completed and fully reviewed the detailed valuations and could differ materially from the preliminary allocations. The final allocations may include changes in allocations of acquired intangible assets as well as goodwill and other changes to assets and liabilities including deferred taxes. The estimated useful lives of acquired intangible assets are also preliminary. We have finalized the purchase price allocation within the measurement period for acquisitions that have been completed prior to the third quarter of 2019.
The aggregate purchase price of these acquisitions was allocated on a preliminary basis as follows:
| (in thousands) | ||||
| Cash paid, net of cash acquired | $ | 35,909 | ||
| Issuance of seller notes at fair value | 7,835 | |||
| Additional consideration, net (1) | 626 | |||
| Aggregate purchase price | 44,370 | |||
| Accounts receivable | 4,128 | |||
| Inventories | 2,081 | |||
| Customer relationships (Weighted average useful life of 4.7 years) | 7,038 | |||
| Non-compete agreements (Weighted average useful life of 4.9 years) | 350 | |||
| Other assets and liabilities, net | (2,983 | ) | ||
| Net assets acquired | 10,614 | |||
| Goodwill | $ | 33,756 | ||
(1) Approximately $0.7 million of additional consideration represents payments made during the third quarter related to certain tax elections with the seller, offset by an immaterial amount of favorable working capital adjustments.
Right-of-use assets and lease liabilities related to operating leases recognized in connection with acquisitions completed for the year ended December 31, 2019 was $5.2 million.
2018 Acquisition Activity
In the fourth quarter of 2018, we acquired two O&P businesses for an aggregate purchase price of $3.1 million, net of cash acquired. These acquisitions were accounted for using the acquisition method of accounting whereby assets acquired and liabilities assumed were recognized at fair value on the date of the transaction.
86
The aggregate purchase price of these acquisitions was allocated on a preliminary basis as follows:
| (in thousands) | ||||
| Cash paid, net of cash acquired | $ | 1,978 | ||
| Issuance of seller notes | 1,120 | |||
| Aggregate purchase price | 3,098 | |||
| Accounts receivable | 256 | |||
| Inventories | 302 | |||
| Customer relationships (Weighted average useful life of 4.0 years) | 260 | |||
| Non-compete agreements (Weighted average useful life of 4.6 years) | 214 | |||
| Other assets | 90 | |||
| Accounts payable | (59 | ) | ||
| Accrued expenses and other liabilities | (364 | ) | ||
| Net assets acquired | 699 | |||
| Goodwill | $ | 2,399 | ||
Note H — Goodwill and Other Intangible Assets
Goodwill
Under the provisions of ASC 350-10, Intangibles-Goodwill and Other, goodwill is not amortized. Rather, an entity’s goodwill is subject to periodic impairment testing. ASC 350 requires that an entity assign its goodwill to reporting units and test each reporting unit’s goodwill for impairment at least on an annual basis and between annual tests if an event occurs or circumstances change that would more likely than not reduce the fair value of a reporting unit below its carrying amount. Accordingly, we perform our goodwill test annually as of October 1 and between annual tests whenever we identify certain triggering events or circumstances that would more likely than not reduce the fair value of any of our reporting units below its respective carrying value. Additionally, we consider income tax effects from any tax deductible goodwill on the carrying amount of the reporting unit when measuring the goodwill impairment loss, if applicable.
The goodwill impairment test compares a reporting unit’s fair value to its carrying amount to identify any potential impairment. We apply judgment in determining the fair value of our reporting units for purposes of performing the goodwill impairment test. We rely on widely accepted valuation techniques, including discounted cash flow and market multiple analysis approaches, which capture both the future income potential of the reporting unit and the market behaviors and actions of market participants in the industry that includes the reporting unit. These types of analyses require us to make assumptions and estimates regarding future cash flows, industry-specific economic factors, and the profitability of future business strategies. The discounted cash flow approach uses a projection of estimated operating results and cash flows that are discounted using a weighted average cost of capital. Under the discounted cash flow approach, the projection uses management’s best estimates of the amount and timing of expected future cash flows impacted by economic and market conditions over the projected period for each reporting unit. Significant estimates and assumptions include terminal value growth rates, changes in working capital requirements, and weighted average cost of capital. The market multiple analysis estimates fair value by applying revenue and earnings multiples to the reporting unit’s operating results. The multiples are derived from comparable publicly traded companies with similar operating and investment characteristics to the reporting units.
We evaluate the reasonableness of the estimated fair value of our reporting units by reconciling the aggregate fair value of all three of our reporting units to our total market capitalization as of our impairment testing date, taking into account an appropriate control premium. The determination of a control premium requires the use of judgment and is based upon control premiums observed in comparable market transactions.
87
The changes in the carrying value of goodwill for the years ended December 31, 2019 and 2018 are as follows:
| Patient Care | Products & Services | Consolidated | ||||||||||||||||||||||||||||||||||
| (in thousands) | Goodwill, Gross | Accum. Impairment | Goodwill,
Net | Goodwill, Gross | Accum. Impairment | Goodwill,
Net | Goodwill, Gross | Accum. Impairment | Goodwill,
Net | |||||||||||||||||||||||||||
| Balance at December 31, 2017 | $ | 625,011 | $ | (428,668 | ) | $ | 196,343 | $ | 139,299 | $ | (139,299 | ) | $ | — | $ | 764,310 | $ | (567,967 | ) | $ | 196,343 | |||||||||||||||
| Additions from acquisitions | 2,399 | — | 2,399 | — | — | — | 2,399 | — | 2,399 | |||||||||||||||||||||||||||
| Balance at December 31, 2018 | 627,410 | (428,668 | ) | 198,742 | 139,299 | (139,299 | ) | — | 766,709 | (567,967 | ) | 198,742 | ||||||||||||||||||||||||
| Additions from acquisitions | 35,926 | — | 35,926 | — | — | — | 35,926 | — | 35,926 | |||||||||||||||||||||||||||
| Measurement period adjustments (1) | (2,424 | ) | — | (2,424 | ) | — | — | — | (2,424 | ) | — | (2,424 | ) | |||||||||||||||||||||||
| Balance at December 31, 2019 | $ | 660,912 | $ | (428,668 | ) | $ | 232,244 | $ | 139,299 | $ | (139,299 | ) | $ | — | $ | 800,211 | $ | (567,967 | ) | $ | 232,244 | |||||||||||||||
(1) Measurement period adjustments relate to 2019 and 2018 acquisitions of approximately $2.1 million and $0.3 million, respectively, and are primarily attributable to adjustments to the preliminary allocations of customer relationship intangibles.
See Note G - “Acquisitions” within these consolidated financial statements for details surrounding goodwill acquired during the years ended December 31, 2019 and 2018.
As of October 1, 2019 and 2018, we performed a qualitative assessment of goodwill impairment for the Patient Care reporting unit, which resulted in our determination that it was more likely than not that the carrying value of the reporting unit was less than its fair value.
As of October 1, 2017, we tested each of our three reporting units as part of our annual goodwill impairment test. Due to the nature and magnitude of events adversely impacting the reimbursement environment within the skilled nursing facility industry (our primary customer source for our Therapeutic solutions business) and the O&P industry (our primary source for our Distribution services business), combined with customer losses and related margin pressures, which increased in the fourth quarter of 2017, our evaluation of our Therapeutic and Distribution reporting units’ long-term outlook resulted in our conclusion that the carrying amounts of these two reporting units exceeded their respective estimated fair values. We recorded non-cash goodwill impairment charges of $32.8 million for our Therapeutic reporting unit and $20.5 million for our Distribution reporting unit which is included in “Impairment of intangible assets” in the consolidated statements of operations. The fair value of our Patient Care reporting unit exceeded its carrying amount. These goodwill impairment charges had no impact on our cash flow or compliance with debt covenants for 2017.
Other Intangible Assets
Under the provisions of ASC 360-10, Property, plant, and equipment, an intangible asset that has a finite life should be amortized over its estimated useful life and should be tested for recoverability by comparing the net carrying value of the asset or asset group to the undiscounted net cash flows to be generated from the use and eventual disposition of that asset or asset group when events or changes in circumstances indicate that its carrying amount may not be recoverable. If the carrying amount of a definite-lived asset or asset group is not recoverable, the fair value of the asset or asset group is measured and if the carrying amount exceeds the fair value, an impairment loss is recognized.
Under the provisions of ASC 350, Intangibles-goodwill and other, an indefinite-lived intangible asset is not amortized but should be tested for impairment annually and between annual tests if events or changes in circumstances indicate that it is more likely than not that the asset is impaired. The indefinite-lived intangible asset impairment standard allows an entity first to assess qualitative factors to determine if a quantitative impairment test is necessary. Further testing is only required if the entity determines, based on the qualitative assessment, that it is more likely than not that an indefinite-lived intangible asset’s fair value is less than its carrying amount. We perform our annual test for recoverability as of October 1.
88
The balances related to other intangible assets as of December 31, 2019 and 2018 are as follows:
| As of December 31, 2019 | ||||||||||||||||
| (in thousands) | Gross Carrying Amount | Accumulated Amortization | Accumulated Impairment | Net Carrying Amount | ||||||||||||
| Customer lists | $ | 32,772 | $ | (22,726 | ) | $ | — | $ | 10,046 | |||||||
| Trade name | 255 | (151 | ) | — | 104 | |||||||||||
| Patents and other intangibles | 9,188 | (5,503 | ) | — | 3,685 | |||||||||||
| Definite-lived intangible assets | 42,215 | (28,380 | ) | — | 13,835 | |||||||||||
| Indefinite-lived trade name | 9,070 | — | (4,953 | ) | 4,117 | |||||||||||
| Total other intangible assets | $ | 51,285 | $ | (28,380 | ) | $ | (4,953 | ) | $ | 17,952 | ||||||
| As of December 31, 2018 | ||||||||||||||||
| (in thousands) | Gross Carrying Amount | Accumulated Amortization | Accumulated Impairment | Net Carrying Amount | ||||||||||||
| Customer lists | $ | 26,036 | $ | (19,051 | ) | $ | — | $ | 6,985 | |||||||
| Trade name | 255 | (125 | ) | — | 130 | |||||||||||
| Patents and other intangibles | 9,391 | (5,145 | ) | — | 4,246 | |||||||||||
| Definite-lived intangible assets | 35,682 | (24,321 | ) | — | 11,361 | |||||||||||
| Indefinite-lived trade name | 9,070 | — | (4,953 | ) | 4,117 | |||||||||||
| Total other intangible assets | $ | 44,752 | $ | (24,321 | ) | $ | (4,953 | ) | $ | 15,478 | ||||||
The fair value of acquired customer list intangibles is estimated using an excess earnings model. Key assumptions utilized in the valuation model include pro-forma projected cash flows adjusted for market-participant assumptions, forecasted customer retention rates, and discount rates. Existing customer intangibles are amortized using the straight-line method over an estimated useful life of four to ten years. The fair value of non-compete agreements are estimated using a discounted cash flow model. The related intangible assets are amortized, using the straight-line method, over their contractual term which ranges from two to five years. Other definite-lived intangible assets are recorded at cost and are amortized, using the straight-line method, over their estimated useful lives of up to seventeen years. The fair value associated with trade names is estimated using the relief-from-royalty method with the primary assumptions being the royalty rate and expected revenues associated with the trade names. These assets, some of which have indefinite lives, are primarily included in the Products & Services segment. Indefinite-lived trade name intangible assets are assessed for impairment in the fourth quarter of each year, or more frequently if events or changes in circumstances indicate that the asset might be impaired. There was no impairment on our indefinite-lived trade name for the year ended December 31, 2019. The impairment on our indefinite-lived trade name was $0.2 million and $1.4 million for the years ended December 31, 2018 and 2017, respectively. Trade name intangible assets with definite lives are amortized over their estimated useful lives of one to ten years.
Amortization expense related to other intangible assets was approximately $5.0 million, $6.7 million, and $9.5 million for the years ended December 31, 2019, 2018, and 2017, respectively.
89
Estimated aggregate amortization expense for definite-lived intangible assets for each of the next five years ended December 31, and thereafter is as follows:
| (in thousands) | ||||
| 2020 | $ | 5,160 | ||
| 2021 | 2,576 | |||
| 2022 | 2,509 | |||
| 2023 | 2,284 | |||
| 2024 | 781 | |||
| Thereafter | 525 | |||
| Total | $ | 13,835 | ||
Note I — Other Current Assets and Other Assets
Other current assets consist of the following:
| As of December 31, | ||||||||
| (in thousands) | 2019 | 2018 | ||||||
| Non-trade receivables | $ | 6,711 | $ | 7,848 | ||||
| Prepaid maintenance | 2,767 | 3,330 | ||||||
| Prepaid rent | 1,145 | 4,442 | ||||||
| Prepaid other | 994 | 1,101 | ||||||
| Prepaid purchase orders | 922 | 998 | ||||||
| Prepaid education and training | 726 | 597 | ||||||
| Prepaid insurance | 264 | 258 | ||||||
| Other | 144 | 157 | ||||||
| Total other current assets | $ | 13,673 | $ | 18,731 | ||||
Non-trade receivables primarily relate to vendor rebate receivables, tenant improvement allowance receivables under previous lease accounting guidance, and other non-trade receivables. Prepaid maintenance primarily relates to prepaid software and hardware maintenance, and software license fees. Prepaid rent relates to amounts of future rent expense paid in advance of the rental period. Prepaid other includes the employer’s portion of health savings accounts, board member fees, and tax and accounting services. Prepaid purchase orders relate to unit commitments to fulfill our obligation with one of our product suppliers. Prepaid education and training is for our annual Education Fair event held in the first quarter of each fiscal year. Prepaid insurance is for product and general liability insurance. Other includes prepaid expenses for telecommunication, broker fees, and other miscellaneous prepaid expenses.
Other assets consist of the following:
| As of December 31, | ||||||||
| (in thousands) | 2019 | 2018 | ||||||
| Cash surrender value of company-owned life insurance | $ | 3,253 | $ | 2,918 | ||||
| Non-trade receivables | 2,398 | 1,904 | ||||||
| Implementation costs for cloud computing arrangements | 1,964 | — | ||||||
| Deposits | 1,893 | 1,698 | ||||||
| Finance lease right-of-use assets | 1,488 | — | ||||||
| Surety bond collateral | — | 1,000 | ||||||
| Other | 309 | 246 | ||||||
| Total other assets | $ | 11,305 | $ | 7,766 | ||||
90
The cash surrender value of company-owned life insurance (“COLI”) funded our Defined Contribution Supplemental Executive Retirement Plan (“DC SERP”) at December 31, 2019 and December 31, 2018. See Note Q - “Employee Benefits” for additional information. Non-trade receivables primarily relate to estimated receivables due from our various business insurance policies. Implementation costs for cloud computing arrangements relate to capitalized costs of our new financial and supply chain system. Deposits primarily relate to security deposits made in connection with property leases. Finance lease right-of-use assets relate to the recognition of right-of-use assets in connection with the adoption of ASC 842, further discussed in Note A - “Organization and Summary of Significant Accounting Policies.” Other relates to prepaid maintenance fees, prepaid license fees, and revolver facility fees.
Note J — Accrued Expenses and Other Current Liabilities and Other Liabilities
Accrued expenses and other current liabilities consist of:
| As of December 31, | ||||||||
| (in thousands) | 2019 | 2018 | ||||||
| Patient prepayments, deposits, and refunds payable | $ | 24,183 | $ | 24,563 | ||||
| Accrued sales taxes and other taxes | 8,543 | 6,810 | ||||||
| Insurance and self-insurance accruals | 8,033 | 8,886 | ||||||
| Derivative liability | 3,516 | 724 | ||||||
| Accrued professional fees | 2,533 | 3,751 | ||||||
| Accrued interest payable | 266 | 332 | ||||||
| Other current liabilities | 8,751 | 6,717 | ||||||
| Total | $ | 55,825 | $ | 51,783 | ||||
Patient prepayment deposits and refunds includes funds received for devices not yet delivered to a patient and refunds for overpayments. Taxes primarily includes accrued sales, property, and franchise tax liabilities. Accrued insurance primarily relates to accruals for estimated losses for certain self-insured risks including property, professional and general liability, and employee health care costs. Derivative liability relates to our cash flow hedge; refer to Note O - “Derivative Financial Instruments.” Accrued professional fees primarily relate to accruals for professional accounting and legal fees. Accrued interest payable relates to interest on our debt obligation. Other current liabilities are primarily related to accruals for deferred revenue and warranty liabilities.
Other liabilities consist of:
| As of December 31, | ||||||||
| (in thousands) | 2019 | 2018 | ||||||
| Supplemental executive retirement plan obligations | $ | 20,851 | $ | 20,195 | ||||
| Derivative liability | 9,821 | 3,134 | ||||||
| Long-term insurance accruals | 7,424 | 8,713 | ||||||
| Unrecognized tax benefits | 5,296 | 5,458 | ||||||
| Deferred tenant improvement allowances | — | 8,570 | ||||||
| Deferred rent | — | 4,455 | ||||||
| Other | 2,412 | 1,045 | ||||||
| Total | $ | 45,804 | $ | 51,570 | ||||
Supplemental executive retirement plan obligations includes obligations due on both the Defined Benefit Supplemental Executive Retirement Plan (“DB SERP”) and DC SERP. See Note Q - “Employee Benefits” within these consolidated financial statements. Derivative liability relates to our cash flow hedge; refer to Note O - “Derivative Financial Instruments.” Unrecognized tax benefits represent the difference between tax positions that we expect to take, or take on our income tax returns and the benefit we recognize on our financial statements. Deferred tenant improvement allowance represents deferred credits associated with receiving lease incentives under previous lease accounting guidance. Deferred rent represents net deferred credits associated with recognizing rent expense on a straight-line basis for property operating leases whose lease payments escalate over the life of the lease also under previous lease accounting guidance. Both deferred credits were recognized as reductions of rent expense over the term of the associated lease. Other includes asset retirement obligations, which is the liability to return a leased building to the state before it was occupied, fair market value lease differential liability, build-to-suit tenant interest accrual, and other long-term accrued expenses.
91
Note K — Income Taxes
Components of provision for income taxes are as follows:
| Years Ended December 31, | ||||||||||||
| (in thousands) | 2019 | 2018 | 2017 | |||||||||
| Current: | ||||||||||||
| Federal | $ | 5,461 | $ | 669 | $ | 541 | ||||||
| State | 719 | 1,117 | 574 | |||||||||
| Total current | 6,180 | 1,786 | 1,115 | |||||||||
| Deferred: | ||||||||||||
| Federal | 1,803 | 1,497 | 28,905 | |||||||||
| State | (5,029 | ) | 1,955 | (2,723 | ) | |||||||
| Total deferred | (3,226 | ) | 3,452 | 26,182 | ||||||||
| Total provision for income taxes | $ | 2,954 | $ | 5,238 | $ | 27,297 | ||||||
A reconciliation of the federal statutory tax rate to our effective tax rate applicable to continuing operations is as follows:
| Years Ended December 31, | ||||||||||||
| 2019 | 2018 | 2017 | ||||||||||
| Federal statutory tax rate | 21.0 | % | 21.0 | % | 35.0 | % | ||||||
| State and local income taxes | 6.0 | % | 26.6 | % | 0.9 | % | ||||||
| Change in valuation allowance | (22.5) | % | 9.5 | % | (0.7) | % | ||||||
| Permanent Items | 2.3 | % | 27.9 | % | (2.7) | % | ||||||
| Tax audit adjustments | 0.9 | % | 8.7 | % | — | % | ||||||
| Change in uncertain tax positions | 0.2 | % | 5.5 | % | (0.3) | % | ||||||
| Tax credits | (0.1) | % | (5.6) | % | 0.1 | % | ||||||
| State tax rate change effect on deferred balance | — | % | 27.7 | % | (0.2) | % | ||||||
| Federal statutory tax rate change effect on deferred balance | — | % | — | % | (45.0) | % | ||||||
| Goodwill impairment | — | % | — | % | (21.1) | % | ||||||
| Other | 1.9 | % | (1.7) | % | (1.3) | % | ||||||
| Tax provision | 9.7 | % | 119.6 | % | (35.3) | % | ||||||
92
The significant components of our deferred tax assets and liabilities are presented in the following table:
| As of December 31, | ||||||||
| (in thousands) | 2019 | 2018 | ||||||
| Deferred tax assets: | ||||||||
| Lease liabilities | $ | 31,432 | $ | — | ||||
| Provision for doubtful accounts and implicit price concessions | 18,547 | 16,529 | ||||||
| Accrued expenses | 12,789 | 15,352 | ||||||
| Property, plant and equipment | 9,797 | 10,829 | ||||||
| Interest expense | 8,946 | 7,798 | ||||||
| Deferred benefit plan compensation | 8,834 | 6,269 | ||||||
| Net operating loss carryforwards | 7,636 | 10,975 | ||||||
| Share based compensation | 4,016 | 3,902 | ||||||
| Inventory reserves | 2,554 | 2,710 | ||||||
| Refund liabilities | 2,346 | 2,517 | ||||||
| Intangibles | 1,236 | 1,063 | ||||||
| Interest on seller notes | 961 | 1,029 | ||||||
| Deferred rent | — | 1,136 | ||||||
| Other | 893 | 1,307 | ||||||
| Deferred tax assets | 109,987 | 81,416 | ||||||
| Less: Valuation allowance | (2,065 | ) | (8,930 | ) | ||||
| Total deferred tax assets | 107,922 | 72,486 | ||||||
| Deferred tax liabilities: | ||||||||
| Lease assets | 28,360 | — | ||||||
| Goodwill | 7,960 | 5,821 | ||||||
| Prepaid expenses | 1,121 | 1,030 | ||||||
| Total deferred tax liabilities | 37,441 | 6,851 | ||||||
| Net deferred tax assets | $ | 70,481 | $ | 65,635 | ||||
We provide a valuation allowance to reduce our deferred tax assets to the amount that is more likely than not to be realized. We have $2.8 million and $10.7 million of U.S. federal net operating loss carryforwards available as of December 31, 2019 and 2018, respectively. We have $136.9 million and $166.0 million of state net operating loss carryforwards available as of December 31, 2019 and 2018, respectively. These carryforwards will be used to offset future income but may be limited by the change in ownership rules in Section 382 of the Internal Revenue Code. These net operating loss carryforwards will expire in varying amounts between 2020 and 2039.
We establish valuation allowances when necessary to reduce deferred tax assets to amounts expected to be realized. As of December 31, 2019 and 2018, we have recorded a valuation allowance of approximately $2.1 million and $8.9 million, respectively, related to various state jurisdictions. In our assessment of the valuation allowance, we consider a number of types of evidence on a taxing jurisdiction and legal entity basis in each reporting period, including the nature, frequency, and severity of current and cumulative financial reporting income and losses, sources of future taxable income, future reversals of existing taxable temporary differences, and prudent and feasible tax planning strategies, weighted by objectivity. Based on our consideration of all available positive and negative evidence, we determined that it was more likely than not that we would be able to realize the benefit of certain state deferred tax assets after we achieved twelve quarters of cumulative pretax income adjusted for permanent differences, as well as forecasted future taxable income and other positive evidence, and released $7.1 million of the valuation allowance related to certain state deferred tax assets in the fourth quarter of 2019.
93
The following schedule presents the activity in the valuation allowance:
(in thousands) Year | Balance at Beginning of Year | Acquisitions | Provision | Released | Balance at End of Year | ||||||||||||||||
| 2019 | $ | 8,930 | $ | — | $ | 238 | $ | 7,103 | $ | 2,065 | |||||||||||
| 2018 | $ | 8,754 | $ | — | $ | 204 | $ | 28 | $ | 8,930 | |||||||||||
| 2017 | $ | 6,895 | $ | — | $ | 2,306 | $ | 447 | $ | 8,754 | |||||||||||
A reconciliation of our liability for unrecognized tax benefits is as follows:
| (in thousands) | 2019 | 2018 | 2017 | |||||||||
| Unrecognized tax benefits, at beginning of the year | $ | 4,765 | $ | 4,860 | $ | 4,664 | ||||||
| Additions for tax positions related to the current year | 247 | 257 | 466 | |||||||||
| Decrease related to prior year positions | (337 | ) | (352 | ) | (270 | ) | ||||||
| Decrease for lapse of applicable statute of limitations | (344 | ) | — | — | ||||||||
| Unrecognized tax benefits, at end of the year | $ | 4,331 | $ | 4,765 | $ | 4,860 | ||||||
As of December 31, 2019, the total amount of unrecognized tax benefits that, if recognized, would affect the effective tax rate is approximately $2.8 million. We do not expect unrecognized tax benefits to decrease within the next twelve months due to the lapse of statute limitations. We recognize accrued interest and penalties related to unrecognized tax benefits as a component of income tax expense. As of December 31, 2019, 2018, and 2017, the amount of accrued interest and penalties was approximately $1.0 million, $0.8 million, and $0.6 million, respectively.
We are subject to income tax in the U.S. federal, state, and local jurisdictions. We are no longer subject to U.S. federal income tax examinations for years prior to 2016. However, due to net operating loss carryforwards, tax authorities have the ability to adjust those net operating losses related to closed years. We believe the ultimate resolution of income tax examinations will not have a material adverse effect on our consolidated financial position, results of operations, or liquidity.
Note L — Leases
The information pertaining to leases on the consolidated balance sheet is as follows:
| (in thousands) | Classification | As of December 31, 2019 | ||||
| Assets | ||||||
| Operating lease right-of-use assets | Operating lease right-of-use assets | $ | 110,559 | |||
| Finance lease right-of-use assets | Other assets | 1,488 | ||||
| Total lease assets | $ | 112,047 | ||||
| Liabilities | ||||||
| Current | ||||||
| Operating | Current portion of operating lease liabilities | $ | 34,342 | |||
| Finance | Current portion of long-term debt | 370 | ||||
| Noncurrent | ||||||
| Operating | Operating lease liabilities | 88,418 | ||||
| Finance | Long-term debt, less current portion | 1,135 | ||||
| Total lease liabilities | $ | 124,265 | ||||
94
The components of lease cost recognized in the consolidated statement of operations are as follows:
| (in thousands) | For the Year Ended 2019 | |||
| Operating lease cost | $ | 44,081 | ||
| Finance lease cost | ||||
| Amortization of right-of-use assets | 312 | |||
| Interest on lease liabilities | 28 | |||
| Sublease income | (240 | ) | ||
| Short-term lease cost | 613 | |||
| Variable lease cost | 5,476 | |||
| Total lease cost | $ | 50,270 | ||
Maturities of our lease liabilities, by year and in the aggregate, under operating and financing obligations with terms of one year or more at December 31, 2019 are as follows:
| (in thousands) | Finance Leases | Operating Leases | Total Leases | ||||||||||
| 2020 | 422 | 38,972 | 39,394 | ||||||||||
| 2021 | 355 | 34,384 | 34,739 | ||||||||||
| 2022 | 267 | 26,416 | 26,683 | ||||||||||
| 2023 | 185 | 17,797 | 17,982 | ||||||||||
| 2024 | 148 | 10,530 | 10,678 | ||||||||||
| Thereafter | 289 | 8,975 | 9,264 | ||||||||||
| Total lease payments | 1,666 | 137,074 | 138,740 | ||||||||||
| Imputed interest | (161 | ) | (14,314 | ) | (14,475 | ) | |||||||
| Total | $ | 1,505 | $ | 122,760 | $ | 124,265 | |||||||
The lease term and discount rates are as follows:
| As of December 31, 2019 | ||||
| Weighted average remaining lease term (years) | ||||
| Operating leases | 3.98 | |||
| Finance leases | 5.17 | |||
| Weighted average discount rate | ||||
| Operating leases | 5.29 | % | ||
| Finance leases | 4.01 | % | ||
Supplemental cash flow information related to leases is as follows:
| (in thousands) | For the Year Ended December 31, 2019 | |||
| Cash flows for amounts included in the measurement of lease liabilities: | ||||
| Operating cash flows from operating leases | $ | 44,111 | ||
| Operating cash flows from finance leases | 28 | |||
| Financing cash flows from finance leases | 325 | |||
| Right-of-use assets obtained in exchange for lease obligations: | ||||
| Operating leases | 46,254 | |||
| Finance leases | 1,245 | |||
95
As previously disclosed in our 2018 Annual Report on Form 10-K and under previous lease accounting, future minimum rental payments, by year and in the aggregate, under operating and financing obligations as of December 31, 2018 were as follows:
| (in thousands) | Operating Leases | Capital Leases | |||||||
| 2019 | $ | 39,378 | $ | 249 | |||||
| 2020 | 29,641 | 175 | |||||||
| 2021 | 21,303 | 109 | |||||||
| 2022 | 14,479 | 28 | |||||||
| 2023 | 9,193 | — | |||||||
| Thereafter | 10,008 | — | |||||||
| $ | 124,002 | $ | 561 | ||||||
In August 2019, we entered into a lease agreement for a distribution facility in Georgia. The commencement date of the lease is expected to be in April 2020. The initial term of the lease is 127 months, with the option to extend the lease for up to two consecutive 60-month terms. The lease provides for annual base rent of approximately $1.0 million in the first year after a seven-month rent-free period following the lease commencement date, with subsequent annual increases of approximately 2%. In connection with the lease, the landlord has provided a tenant improvement allowance of $2.2 million to build-out certain improvements to the distribution facility.
Note M — Debt and Other Obligations
Debt consists of the following:
| (in thousands) | As of December 31, 2019 | As of December 31, 2018 | ||||||
| Debt: | ||||||||
| Term Loan B | $ | 496,163 | $ | 501,213 | ||||
| Seller notes | 9,005 | 4,506 | ||||||
| Finance lease liabilities and other | 2,033 | 14,361 | ||||||
| Total debt before unamortized discount and debt issuance costs | 507,201 | 520,080 | ||||||
| Unamortized discount and debt issuance costs, net | (8,328 | ) | (9,407 | ) | ||||
| Total debt | 498,873 | 510,673 | ||||||
| Current portion of long-term debt: | ||||||||
| Term Loan B | 5,050 | 5,050 | ||||||
| Seller notes | 3,175 | 2,513 | ||||||
| Finance lease liabilities and other | 527 | 1,020 | ||||||
| Total current portion of long-term debt | 8,752 | 8,583 | ||||||
| Long-term debt | $ | 490,121 | $ | 502,090 | ||||
96
Refinancing of Credit Agreement and Term B Borrowings
On March 6, 2018, we entered into a new $605.0 million Senior Credit Facility (the “Credit Agreement”). The Credit Agreement provides for (i) a revolving credit facility with an initial maximum aggregate amount of availability of $100.0 million that matures in March 2023 and (ii) a $505.0 million Term Loan B facility due in quarterly principal installments commencing June 29, 2018, with all remaining outstanding principal due at maturity in March 2025. Availability under the revolving credit facility is reduced by outstanding letters of credit, which were approximately $5.2 million as of December 31, 2019. We may (a) increase the aggregate principal amount of any outstanding tranche of term loans or add one or more additional tranches of term loans under the loan documents, and/or (b) increase the aggregate principal amount of revolving commitments or add one or more additional revolving loan facilities under the loan documents by an aggregate amount of up to the sum of (1) $125.0 million and (2) an amount such that, after giving effect to such incurrence of such amount (but excluding the cash proceeds of such incremental facilities and certain other indebtedness, and treating all commitments in respect of revolving indebtedness as fully drawn), the consolidated first lien net leverage ratio is equal to or less than 3.80 to 1.00, if certain conditions are satisfied, including the absence of a default or an event of default under the Credit Agreement at the time of the increase and that we obtain the consent of each lender providing any incremental facility.
Net proceeds from our initial borrowings under the Credit Agreement, which totaled approximately $501.5 million, were used in part to repay in full all previously existing loans outstanding under our previous credit agreement and Term B credit agreement. Proceeds were also used to pay various transaction costs including fees paid to respective lenders and accrued and unpaid interest. The remainder of the proceeds are being used to provide ongoing working capital and capital for other general corporate purposes.
In connection with the Credit Agreement, we paid debt issuance costs of approximately $6.8 million. As part of the repayment of amounts outstanding under our prior credit agreements, we paid a call premium totaling approximately $8.4 million and expensed outstanding unamortized discount and debt issuance costs totaling approximately $8.6 million. The call premium and unamortized debt issuance costs on the prior credit agreements are included in “Loss on Extinguishment of Debt” in the consolidated statements of operations for the year ended December 31, 2018.
Our obligations under the Credit Agreement are currently guaranteed by our material domestic subsidiaries and will from time to time be guaranteed by, subject in each case to certain exceptions, any domestic subsidiaries that may become material in the future. Subject to certain exceptions, the Credit Agreement is secured by first-priority perfected liens and security interests in substantially all of our personal property and each subsidiary guarantor.
Borrowings under the Credit Agreement bear interest at a variable rate equal to (i) LIBOR plus a specified margin, or (ii) the base rate (which is the highest of (a) Bank of America, N.A.’s prime rate, (b) the federal funds rate plus 0.50% or (c) the sum of 1% plus one-month LIBOR) plus a specified margin. For the years ended December 31, 2019 and 2018, the weighted average interest rate on outstanding borrowings under our Term Loan B facility was approximately 5.8% and 5.6%, respectively. We have entered into interest rate swap agreements to hedge certain of our interest rate exposures, as more fully disclosed in Note O - “Derivative Financial Instruments.”
We must also pay (i) an unused commitment fee ranging from 0.375% to 0.500% per annum of the average daily unused portion of the aggregate revolving credit commitments under the Credit Agreement, and (ii) a per annum fee equal to (a) for each performance standby letter of credit outstanding under the Credit Agreement with respect to nonfinancial contractual obligations, 50% of the applicable margin over LIBOR under the revolving credit facility in effect from time to time multiplied by the daily amount available to be drawn under such letter of credit, and (b) for each other letter of credit outstanding under the Credit Agreement, the applicable margin over LIBOR under the revolving credit facility in effect from time to time multiplied by the daily amount available to be drawn for such letter of credit.
97
The Credit Agreement contains various restrictions and covenants, including requirements that we maintain certain financial ratios at prescribed levels and restrictions on our ability and certain of our subsidiaries to consolidate or merge, create liens, incur additional indebtedness, dispose of assets, consummate acquisitions, make investments, and pay dividends and other distributions. The Credit Agreement includes the following financial covenants applicable for so long as any revolving loans and/or revolving commitments remain outstanding under the Credit Agreement: (i) a maximum consolidated first lien net leverage ratio (defined as, with certain adjustments and exclusions, the ratio of consolidated first-lien indebtedness to consolidated net income before interest, taxes, depreciation, amortization, non-cash charges, and certain other items (“EBITDA”) for the most recently ended period of four fiscal quarters for which financial statements are available) of 4.75 to 1.00 for the fiscal quarters ended December 31, 2019 and March 31, 2020; 4.50 to 1.00 for the fiscal quarters ended June 30, 2020 through March 31, 2021; 4.25 to 1.00 for the fiscal quarters ended June 30, 2021 through March 31, 2022; and 3.75 to 1.00 for the fiscal quarter ended June 30, 2022 and the last day of each fiscal quarter thereafter; and (ii) a minimum interest coverage ratio (defined as, with certain adjustments, the ratio of our EBITDA to consolidated interest expense to the extent paid or payable in cash) of 2.75 to 1.00 as of the last day of any fiscal quarter. We were in compliance with all covenants at December 31, 2019.
The Credit Agreement also contains customary events of default. If an event of default under the Credit Agreement occurs and is continuing, then the lenders may declare any outstanding obligations under the Credit Agreement to be immediately due and payable; provided, however, that the occurrence of an event of default as a result of a breach of a financial covenant under the Credit Agreement does not constitute a default or event of default with respect to any term facility under the Credit Agreement unless and until the required revolving lenders shall have terminated their revolving commitments and declared all amounts outstanding under the revolving credit facility to be due and payable. In addition, if we or any subsidiary guarantor becomes the subject of voluntary or involuntary proceedings under any bankruptcy, insolvency or similar law, then any outstanding obligations under the Credit Agreement will automatically become immediately due and payable. Loans outstanding under the Credit Agreement will bear interest at a rate of 2.00% per annum in excess of the otherwise applicable rate (i) upon acceleration of such loans, (ii) while a payment event of default exists or (iii) upon the lenders’ request, during the continuance of any other event of default.
Subsidiary Guarantees
The obligations under the Credit Agreement are guaranteed by our material domestic subsidiaries, which incorporates subsidiaries that both make up no less than 90% of our total net revenues and make up no less than 90% of our total assets. Separate condensed consolidating information is not included as the parent company does not have independent assets or operations, and the guarantees are full and unconditional and joint and several.
Other Restrictions
The Credit Agreement limits our ability to, among other things, purchase capital assets, incur additional indebtedness, create liens, pay dividends on or redeem capital stock, make certain investments, make restricted payments, make certain dispositions of assets, engage in transactions with affiliates, engage in certain business activities, and engage in mergers, consolidations, and certain sales of assets.
Seller Notes
We typically issue subordinated promissory notes (“Seller Notes”) as a part of the consideration transferred when making acquisitions. The Seller Notes are unsecured and are presented net of unamortized discount of $0.4 million and $0.2 million as of December 31, 2019 and 2018, respectively. We measure these instruments at their estimated fair values as of the respective acquisition dates. The stated interest rates on these instruments range from 2.00% to 3.00%. Principal and interest are payable in quarterly or annual installments and mature through October 2024.
98
Scheduled maturities of debt at December 31, 2019 were as follows:
| (in thousands) | |||||
| 2020 | $ | 8,932 | |||
| 2021 | 8,089 | ||||
| 2022 | 6,767 | ||||
| 2023 | 6,247 | ||||
| 2024 | 5,975 | ||||
| Thereafter | 471,191 | ||||
| Total debt before unamortized discount and debt issuance costs, net | 507,201 | ||||
| Unamortized discount and debt issuance costs, net | (8,328 | ) | |||
| Total debt | $ | 498,873 | |||
Note N — Fair Value Measurements
Financial Instruments
In March 2018, we refinanced our credit facilities with the Credit Agreement. The carrying value (excluding unamortized discounts and debt issuance costs of $8.3 million) of our outstanding term loan as of December 31, 2019 was $496.2 million compared to its fair value of $497.4 million. The carrying value of our outstanding term loan as of December 31, 2018 was $501.2 million (excluding unamortized discounts and debt issuance costs of $9.4 million) compared to its fair value of $491.2 million. Our estimates of fair value are based on a discounted cash flow model and indicative quotes using unobservable inputs, primarily, our risk-adjusted credit spread, which represents a Level 3 measurement.
As of December 31, 2019 and December 31, 2018, we had no amounts outstanding on our revolving credit facility.
In March 2018, we entered into interest rate swap agreements with notional values of $325.0 million, at inception, which reduces $12.5 million annually until the swaps mature on March 6, 2024. The notional value outstanding as of December 31, 2019 was $312.5 million. The interest rate swap agreements are designated as cash flow hedges and are measured at fair value based on inputs other than quoted market prices that are observable, which represents a Level 2 measurement. See Note M - “Debt and Other Obligations” and Note O - “Derivative Financial Instruments” for further information.
The carrying value of our outstanding Seller Notes issued in connection with acquisitions as of December 31, 2019 and December 31, 2018 was $9.0 million and $4.5 million, respectively. We believe that the carrying value of the Seller Notes approximates their fair values based on a discounted cash flow model using unobservable inputs, primarily, our credit spread for subordinated debt, which represents a Level 3 measurement.
Note O — Derivative Financial Instruments
Cash Flow Hedges of Interest Rate Risk
As of December 31, 2019, our swaps had a notional value outstanding of $312.5 million. As of December 31, 2018, our swaps had a notional value outstanding of $325.0 million.
99
Changes in Net Gain or Loss on Cash Flow Hedges Included in Accumulated Other Comprehensive Loss
The following table presents the activity of cash flow hedges included in accumulated other comprehensive loss for the years ended December 31, 2019 and 2018:
| (in thousands) | Cash Flow Hedges | |||
| Balance as of January 1, 2018 | $ | — | ||
| Unrealized loss recognized in other comprehensive loss, net of tax | (4,838 | ) | ||
| Reclassification to interest expense, net of tax | 1,902 | |||
| Balance as of December 31, 2018 | $ | (2,936 | ) | |
| Unrealized loss recognized in other comprehensive loss, net of tax | (8,806 | ) | ||
| Reclassification to interest expense, net of tax | 1,605 | |||
| Balance as of December 31, 2019 | $ | (10,137 | ) | |
The following table presents the fair value of derivative liabilities within the consolidated balance sheets as of December 31, 2019 and December 31, 2018:
| As of December 31, 2019 | As of December 31, 2018 | |||||||||||||||
| (in thousands) | Assets | Liabilities | Assets | Liabilities | ||||||||||||
| Derivatives designated as cash flow hedging instruments: | ||||||||||||||||
| Accrued expenses and other current liabilities | — | 3,516 | — | 724 | ||||||||||||
| Other liabilities | — | 9,821 | — | 3,134 | ||||||||||||
Note P — Share Based Compensation
On May 17, 2019, the shareholders approved the Hanger, Inc. 2019 Omnibus Incentive Plan (the “2019 Plan”). The 2019 Plan authorizes the issuance of (a) up to 2,025,000 shares of Common Stock, plus (b) 243,611 shares available for issuance under the Hanger, Inc. 2016 Omnibus Incentive Plan (the “2016 Plan”).
Upon approval of the 2019 Plan, the 2016 Plan was no longer available for future awards.
On May 19, 2017, the Board of Directors approved the Hanger, Inc. Special Equity Plan (the “Special Equity Plan”). The Special Equity Plan authorized up to 1.5 million shares of Common Stock and operates completely independent from our 2016 Omnibus Incentive Plan. All awards under the Special Equity Plan were made on May 19, 2017 which consisted of 0.8 million stock options and 0.3 million performance-based stock awards. No further grants of awards will be authorized or issued under the Special Equity Plan.
As of December 31, 2019, approximately 2.2 million shares were available for future issuance. The available shares consisted of (a) 2.0 million shares of common stock authorized for issuance under the amended 2019 Plan, plus (b) 0.2 million shares rolled forward from the 2016 Plan, plus (c) 0.1 million shares forfeited and added back to the pool, less (d) 0.1 million shares issued for awards. In 2019, shares issued under equity plans are issued from authorized and unissued shares.
For the years ended December 31, 2019, 2018, and 2017, we recognized a total of approximately $13.4 million, $13.1 million, and $12.9 million, respectively, of share based compensation expense for the 2010, 2016, and 2019 plans. Share based compensation expense, net of forfeitures, relates to restricted stock units, performance-based restricted stock units, and options.
100
Restricted Stock Units
The summary of restricted stock units, performance-based stock units, and weighted average grant date fair values are as follows:
| Employee Service-Based Awards | Employee Performance- Based Awards | Director Awards | ||||||||||||||||||||||
| Units | Weighted Average Grant Date Fair Value | Units | Weighted Average Grant Date Fair Value | Units | Weighted Average Grant Date Fair Value | |||||||||||||||||||
| Nonvested at December 31, 2017 | 1,183,039 | $ | 14.30 | 702,391 | $ | 19.40 | 98,406 | $ | 12.66 | |||||||||||||||
| Granted | 569,571 | 15.70 | 165,853 | 15.76 | 61,376 | 18.25 | ||||||||||||||||||
| Vested | (422,884 | ) | 16.07 | (199,395 | ) | 22.16 | (98,406 | ) | 12.66 | |||||||||||||||
| Forfeited | (121,098 | ) | 13.02 | (75,750 | ) | 18.06 | — | — | ||||||||||||||||
| Nonvested at December 31, 2018 | 1,208,628 | 14.47 | 593,099 | 17.63 | 61,376 | 18.25 | ||||||||||||||||||
| Granted | 467,896 | 19.14 | 147,983 | 19.16 | 55,752 | 20.09 | ||||||||||||||||||
| Vested | (452,306 | ) | 14.48 | (120,953 | ) | 18.40 | (61,376 | ) | 18.25 | |||||||||||||||
| Forfeited | (59,994 | ) | 14.94 | (20,645 | ) | 18.32 | — | — | ||||||||||||||||
| Nonvested at December 31, 2019 | 1,164,224 | $ | 16.32 | 599,484 | $ | 17.82 | 55,752 | $ | 20.10 | |||||||||||||||
During the years ended December 31, 2019, 2018, and 2017, approximately 0.6 million, 0.7 million, and 0.4 million of restricted common stock units with an intrinsic value of $12.3 million, $12.0 million, and $5.9 million, respectively, became fully vested. As of December 31, 2019, total unrecognized compensation expense related to unvested restricted stock units and unvested performance based restricted stock units for which we have concluded the performance condition was probable of achievement was approximately $32.7 million and the related weighted-average period over which it is expected to be recognized is approximately 1.4 years. The aggregate granted units have vesting dates through June 2022. The 2019, 2018, and 2017 aggregate grants had total estimated grant date fair values of $12.9 million, $13.3 million, and $17.7 million, respectively.
A special equity grant of performance-based restricted stock units was granted on May 19, 2017 and vests 100% three years after the date of issuance, assuming the performance goal is achieved. The financial target for this grant is to achieve a compounded annual growth rate (“CAGR”) of our common stock price of 20% as of market close on May 18, 2020. This equates to a share price on that date of $22.07 compared to the closing price on the eve of grant of $12.77. The grant provides for the vesting of 50% of the original targeted shares if a CAGR of 10% (a stock price of $17.00) is achieved. The grant also provides for the vesting of up to 200% of the original targeted shares if a CAGR of 30% (a stock price of $28.06) or more is achieved. The percentage of vested shares will be interpolated on a linear basis between 50% and 200% for a CAGR between 10% and 30%. The stock price at time of award was $12.77, but given market condition performance criteria the Monte Carlo Simulation valuation was used to calculate a fair value of $19.29 per share. The key assumptions used were a volatility rate of 109.5%, a risk-free interest rate of 1.44%, and a performance period of 3 years.
The 2017 special equity grant was amended on November 13, 2019 by adjusting the calculation of the CAGR of our common stock price from the third anniversary of the grant date to the average closing price for the 25 trading days ending on and including the last day of the three year performance period (i.e., May 18, 2020.) This adjustment was considered a modification per ASC 718, Compensation - Stock Compensation, and therefore, any incremental fair value arising from the modification of an award with market conditions would be recognized over the remaining service period. The valuation concluded an additional $34.0 thousand in incremental fair value that will be expensed ratably over the remainder of the service period.
101
Options
The fair value of each employee stock option award was estimated on the date of grant of May 19, 2017 using the Black-Scholes option-pricing model and calculated a grant date fair value of $8.67 per option. The key assumptions used were an expected dividend yield of zero, an expected stock volatility of 92.48%, a risk-free interest rate of 1.68%, and an expected term of 4.38 years.
The summary of option activity and weighted average exercise prices are as follows:
| Shares | Weighted Average Exercise Price | Aggregate Intrinsic Value | Weighted Average Remaining Contractual Term (Years) | |||||||||||||
| Outstanding at December 31, 2017 | 798,020 | $ | 12.77 | $ | 2,378,100 | |||||||||||
| Granted | — | — | ||||||||||||||
| Terminated | (111,203 | ) | 12.77 | |||||||||||||
| Exercised | (4,948 | ) | 12.77 | |||||||||||||
| Outstanding at December 31, 2018 | 681,869 | 12.77 | 4,213,950 | 8.4 | ||||||||||||
| Granted | — | — | ||||||||||||||
| Terminated | (9,913 | ) | 12.77 | |||||||||||||
| Exercised | (148,851 | ) | 12.77 | |||||||||||||
| Outstanding at December 31, 2019 | 523,105 | $ | 12.77 | $ | 7,762,878 | 7.4 | ||||||||||
At December 31, 2019, 0.5 million options were outstanding but not yet exercisable with a weighted average exercise price of $12.77, average remaining contractual terms of 7.4 years and aggregate intrinsic values of approximately $7.8 million. As of December 31, 2019, there was unrecognized compensation cost related to stock option awards of $0.7 million. At December 31, 2018, 0.7 million options were outstanding but not yet exercisable with a weighted average exercise price of $12.77, average remaining contractual terms of 8.4 years and aggregate intrinsic values of approximately $4.2 million.
Note Q — Employee Benefits
Savings Plan
We maintain a 401(k) Savings and Retirement plan that covers all of our employees. Under the plan, employees may defer a portion of their compensation up to the levels permitted by the Internal Revenue Service. We recorded matching contributions of approximately $6.1 million, $5.8 million, and $5.9 million under this plan during 2019, 2018, and 2017, respectively, which were included within “Personnel costs” and “General and administrative expenses” in our consolidated statements of operations.
Defined Benefit Supplemental Executive Retirement Plan
Effective January 2004, we implemented an unfunded noncontributory DB SERP for certain senior executives. The DB SERP, which we administer, calls for fifteen annual payments upon retirement with the payment amount based on years of service and final average salary. Benefit costs and liability balances are calculated based on certain assumptions including benefits earned, discount rates, interest costs, mortality rates, and other factors. We engaged an actuary to calculate the related benefit obligation at December 31, 2019 and 2018 as well as net periodic benefit plan expense for the years ended December 31, 2019, 2018, and 2017. As of December 31, 2019 and 2018, the average remaining service period of plan participants is 9.5 and 10.5 years, respectively. We believe the assumptions used are appropriate; however, changes in assumptions or differences in actual experience may affect our benefit obligation and future expenses. Actual results that differ from the assumptions are accumulated and amortized over future periods, affecting the recorded obligation and expense in future periods.
102
The DB SERP’s net benefit obligation is as follows:
| Change in Benefit Obligation | ||||
| (in thousands) | ||||
| Benefit obligation as of December 31, 2016 | $ | 21,304 | ||
| Service cost | 340 | |||
| Interest cost | 711 | |||
| Payments | (1,913 | ) | ||
| Actuarial loss | 351 | |||
| Benefit obligation as of December 31, 2017 | 20,793 | |||
| Service cost | 367 | |||
| Interest cost | 600 | |||
| Payments | (1,913 | ) | ||
| Actuarial gain | (920 | ) | ||
| Benefit obligation at December 31, 2018 | 18,927 | |||
| Service cost | 335 | |||
| Interest cost | 658 | |||
| Payments | (1,913 | ) | ||
| Actuarial loss | 1,207 | |||
| Benefit obligation as of December 31, 2019 | $ | 19,214 | ||
The funded status of the DB SERP’s net benefit obligation is as follows:
| December 31, | ||||||||
| (in thousands) | 2019 | 2018 | ||||||
| Unfunded status | $ | 15,950 | $ | 16,740 | ||||
| Unamortized net loss | 3,264 | 2,187 | ||||||
| Net amount recognized | $ | 19,214 | $ | 18,927 | ||||
| Amounts Recognized in the Consolidated Balance Sheets: | ||||||||
| December 31, | ||||||||
| (in thousands) | 2019 | 2018 | ||||||
| Current accrued expenses and other current liabilities | $ | 1,913 | $ | 1,913 | ||||
| Non-current other liabilities | 17,301 | 17,014 | ||||||
| Total accrued liabilities | $ | 19,214 | $ | 18,927 | ||||
We recorded gross actuarial losses (gains) under the DB SERP of approximately $1.2 million, ($0.9) million, and $0.4 million in 2019, 2018, and 2017, respectively, in other comprehensive loss. There were no other components such as prior service costs or transition obligations relating to the DB SERP costs recorded within other comprehensive loss during 2019, 2018, or 2017.
The following weighted average assumptions were used to determine the benefit obligation as of December 31 of each year. Net periodic benefit cost for each year was determined using the weighted average assumptions as of the prior year. We used a third party actuarial specialist to assist in determining, among other things, the discount rate for all three years presented.
Previously, the cash surrender value of a COLI funded our DB SERP. However, we received the cash surrender value of the DB SERP COLI in the amount of $17.1 million in 2017, resulting in the benefit obligation being unfunded at December 31, 2019 and 2018.
103
Our assumed weighted average discount rate for the defined benefit plan reflects the hypothetical rate at which the projected benefit obligation could be effectively settled or paid out to participants. We determine our discount rate based on a range of factors, including a yield curve composed of rates of return on high-quality, fixed income corporate bonds.
| 2019 | 2018 | 2017 | ||||||||||
| Discount rate | 2.9 | % | 4.0 | % | 3.3 | % | ||||||
| Average rate of increase in compensation | 2.5 | % | 3.0 | % | 3.0 | % | ||||||
At December 31, 2019, the estimated accumulated benefit obligation is $19.2 million. Future payments under the Plan are as follows:
| (in thousands) | ||||
| 2020 | $ | 1,913 | ||
| 2021 | 1,913 | |||
| 2022 | 1,913 | |||
| 2023 | 1,913 | |||
| 2024 | 1,913 | |||
| Thereafter | 9,649 | |||
| $ | 19,214 | |||
Defined Contribution Supplemental Executive Retirement Plan
In 2013, we established a defined contribution plan (“DC SERP”) that covers certain of our senior executives. Each participant is given a notional account to manage his or her annual distributions and allocate the funds among various investment options (e.g. mutual funds). These accounts are tracking accounts only for the purpose of calculating the participant’s benefit. The participant does not have ownership of the underlying mutual funds. When a participant initiates or changes the allocation of his or her notional account, we will generally make an allocation of our investments to match those chosen by the participant. While the allocation of our sub accounts is generally intended to mirror the participant’s account records (i.e. the distributions and gains or losses on those funds), the employee does not have legal ownership of any funds until payout upon retirement. The underlying investments are owned by the insurance company with which we own an insurance policy.
As of December 31, 2019 and 2018, the estimated accumulated benefit obligation is $3.9 million and $3.0 million, respectively, of which $3.3 million and $2.4 million is funded and $0.6 million and $0.6 million is unfunded at December 31, 2019 and 2018, respectively.
In connection with the DC SERP benefit obligation, we maintain a COLI policy. The carrying value of the COLI is measured at its cash surrender value and is presented within “Other assets” in our consolidated balance sheets. See Note I - “Other Current Assets and Other Assets” for additional information.
104
Note R — Commitments and Contingencies
Guarantees and Indemnification
In the ordinary course of our business, we may enter into service agreements with service providers in which we agree to indemnify or limit the service provider against certain losses and liabilities arising from the service provider’s performance of the agreement. We have reviewed our existing contracts containing indemnification or clauses of guarantees and do not believe that our liability under such agreements is material.
Legal Proceedings
Securities and Derivative Litigation
In November 2014, a securities class action complaint, City of Pontiac General Employees’ Retirement System v. Hanger, et al., C.A. No. 1:14-cv-01026-SS, was filed against us in the United States District Court for the Western District of Texas. The complaint named us and certain of our current and former officers for allegedly making materially false and misleading statements regarding, inter alia, our financial statements, RAC audit success rate, the implementation of new financial systems, same-store sales growth, and the adequacy of our internal processes and controls. The complaint alleged violations of Sections 10(b) and 20(a) of the Securities Exchange Act of 1934 (the “Exchange Act”) and Rule 10b-5 promulgated thereunder. The complaint sought unspecified damages, costs, attorneys’ fees, and equitable relief.
On January 26, 2017, the court granted the defendants’ motions to dismiss for failure to state a claim upon which relief can be granted and dismissed with prejudice all claims against all defendants. On February 24, 2017, plaintiffs filed a notice of appeal to the United States Court of Appeals for the Fifth Circuit. On August 6, 2018, the Court of Appeals affirmed in part and reversed in part. On August 20, 2018, Hanger, Inc. and the remaining individual defendant filed a petition for panel rehearing and a petition for rehearing en banc with the Court of Appeals. On April 10, 2019, the Court of Appeals granted the petition for panel rehearing, withdrew its previous panel decision, and substituted a new panel decision in its place that affirmed the District Court’s dismissal with prejudice of all claims against all the defendants for failure to state a claim. Plaintiffs did not petition the Court of Appeals for a panel rehearing or a rehearing en banc, and did not file a writ of certiorari with the United States Supreme Court. Therefore, the April 10, 2019 Court of Appeals ruling affirming the dismissal of all claims with prejudice against all defendants is now final.
In February and August of 2015, two separate shareholder derivative suits were filed in Texas state court against us related to the announced restatement of certain of our financial statements. The cases were subsequently consolidated into Judy v. Asar, et. al., Cause No. D-1-GN-15-000625. On October 25, 2016, plaintiffs in that action filed an amended complaint, and the case is currently pending before the 345th Judicial District Court of Travis County, Texas.
The amended complaint in the consolidated derivative action names us and certain of our current and former officers and directors as defendants. It alleges claims for breach of fiduciary duty based, inter alia, on the defendants’ alleged failure to exercise good faith to ensure that we had in place adequate accounting and financial controls and that disclosures regarding our business, financial performance and internal controls were truthful and accurate. The complaint sought unspecified damages, costs, attorneys’ fees, and equitable relief.
As disclosed in our Current Report on Form 8-K filed with the SEC on June 6, 2016, the Board of Directors appointed a Special Litigation Committee of the Board (the “Special Committee”). The Board delegated to the Special Committee the authority to (1) determine whether it is in our best interests to pursue any of the allegations made in the derivative cases filed in Texas state court (which cases were consolidated into the Judy case discussed above), (2) determine whether it is in our best interests to pursue any remedies against any of our current or former employees, officers or directors as a result of the conduct discovered in the Audit Committee investigation concluded on June 6, 2016 (the “Investigation”), and (3) otherwise resolve claims or matters relating to the findings of the Investigation. The Special Committee retained independent legal counsel to assist and advise it in carrying out its duties and reviewed and considered the evidence and various factors relating to our best interests. In accordance with its findings and conclusions, the Special Committee determined that it is not in our best interest to pursue any of the claims in the Judy derivative case. Also in accordance with its findings and conclusions, the Special Committee determined that it is not in our best interests to pursue legal remedies against any of our current or former employees, officers, or directors.
105
On April 14, 2017, we filed a motion to dismiss the consolidated derivative action based on the resolution by the Special Committee that it is not in our best interest to pursue the derivative claims. Counsel for the derivative plaintiffs opposed that motion and moved to compel discovery. In a hearing held on June 12, 2017, the Travis County Court denied plaintiffs’ motion to compel, and held that the motion to dismiss would be considered only after appropriate discovery was concluded.
The plaintiffs subsequently subpoenaed counsel for the Special Committee, seeking a copy of the full report prepared by the Special Committee and its independent counsel. Counsel for the Special Committee, as well as our counsel, took the position that the full report is not discoverable under Texas law. Plaintiffs’ counsel filed a motion to compel the Special Committee’s counsel to produce the full report. We opposed the motion. On July 20, 2018, the Travis County Court ruled that only a redacted version of the report is discoverable, and counsel for the Special Committee provided a redacted version of the report to plaintiffs’ counsel. Plaintiffs objected to the redacted version of the report, and on February 4, 2019, the Travis County Court appointed a Special Master to review plaintiffs’ objections to the redacted report. On March 22, 2019, the Special Master submitted a report to the Travis County Court recommending that the court order that the entire Special Committee report be produced. On April 2, 2019 we filed an objection to the Special Master’s report and recommendation, and requested a hearing on the matter. On June 25, 2019, the Travis County Court rejected the recommendation of the Special Master, and instead ordered that only a limited additional portion of the Special Committee report should be made available to plaintiffs. On July 10, 2019, the updated redacted Special Committee report was provided to plaintiffs through their counsel.
In late October 2019, a non-binding agreement in principle was reached by the parties to settle the consolidated derivative action, the parties entered into a definitive settlement agreement in late December 2019, and in January 2020 the Travis County court issued an order providing preliminary approval of the settlement and ordering that notice of the settlement be made to the Company’s shareholders. On March 10, 2020, the Travis County court issued an order providing final approval of the settlement and dismissing with prejudice the consolidated derivative action.
Other Matters
From time to time we are subject to legal proceedings and claims which arise in the ordinary course of our business, including additional payments under business purchase agreements. In the opinion of management, the amount of ultimate liability, if any, with respect to these actions will not have a materially adverse effect on our consolidated financial position, liquidity or results of our operations.
We operate in a highly regulated industry and receive regulatory agency inquiries from time to time in the ordinary course of our business, including inquiries relating to our billing activities. No assurance can be given that any discrepancies identified during a regulatory review will not have a material adverse effect on our consolidated financial statements.
Favorable Settlements
For the year ended December 31, 2018, our results of operations and net income benefited from the favorable resolution of two matters.
On May 15, 2018, we received a net favorable settlement of $1.7 million in connection with our long standing damage claims relating to the “Deepwater Horizon” disaster, and the prior adverse effect which it had on our clinic operations along the Gulf Coast in April of 2010. We do not anticipate further payments in connection with this matter as this settlement constituted a full and final satisfaction of our claims. The benefit of this settlement has been recognized as a reduction to our general and administrative expenses.
106
On June 28, 2018, we entered into an agreement with the State of Delaware, and made payment, to satisfy all of the State’s abandoned or unclaimed property claims transactions represented within the period of January 1, 2001 through December 31, 2012 which were reportable through December 31, 2017 in the amount of $2.2 million. This agreed upon payment amount was favorable by $0.5 million to the amount we had previously estimated for these liabilities and had the effect of reducing our general and administrative expenses by this amount. Additionally, under the terms of the agreement, we were not required to pay interest on the previously unremitted cumulative abandoned or unclaimed property relating to this twelve year period in the amount of $1.5 million, which had the effect of lowering our interest expense in the year by this accrued interest amount.
Note S — Shareholders’ Equity (Deficit)
Shareholder’s Rights Plan
On February 28, 2016, the Board of Directors declared a dividend of one preferred share purchase right (a “Right”) for each outstanding share of common stock, par value $0.01 per share (the “Common Stock”). The dividend was payable to the shareholders of record on March 10, 2016 (the “Record Date”). The Rights would not be exercisable until after the public announcement that a person or group of affiliated or associated persons has acquired or obtained the right or obligation to acquire beneficial ownership of 10% or more of our outstanding Common Stock (“Acquiring Person”) or following the commencement of a tender offer or exchange offer that, if consummated, would result in a person or group becoming an Acquiring Person. If a shareholder’s beneficial ownership of our Common Stock as of the time of the public announcement of the Rights Agreement and associated dividend declaration was at or above the applicable threshold, as defined by the Rights Agreement (including through entry into certain derivative positions), that shareholder’s then-existing ownership percentage would be grandfathered, but the rights would become exercisable if at any time after such announcement, the shareholder increases its ownership percentage.
Once exercisable, each Right allowed its holder to purchase one one-thousandth of a share of Series A Junior Participating Preferred Stock, par value $0.01 per share (the “Preferred Stock”), for $65.00 (the “Purchase Price”), subject to adjustment. Prior to exercise, the Right did not give its holder any dividend, voting, or liquidation rights. The description and terms of the Rights were set forth in a Rights Agreement, dated as of February 28, 2016, between us and Computershare Inc., as the Rights Agent.
The Rights had certain anti-takeover effects. The Rights would have caused a substantial dilution to any person or group that attempted to acquire us without the approval of our Board of Directors. As a result, the overall effect of the Rights may have been to render more difficult or discourage any attempt to acquire us even if such acquisition may be favorable to the interests of our shareholders. Because our Board of Directors could redeem the Rights and amend the Rights Agreement in any respect prior to a person or group becoming an Acquiring Person, the Rights should not interfere with a merger or other business combination approved by the Board of Directors. The Rights were originally set to expire on August 28, 2017.
Rights Agreement Amendment
On June 23, 2017, we entered into an amendment (the “Rights Agreement Amendment”) to the Rights Agreement to extend the “Final Expiration Date” under the Rights Agreement to December 31, 2018. Pursuant to the terms of the Rights Agreement as amended, we had the ability to redeem the rights prior to the “Final Expiration Date” or to further amend the Rights Agreement to provide for an earlier “Final Expiration Date”.
The “Final Expiration Date” under the Rights Agreement was not extended in response to any specific takeover bid or other proposal to acquire control.
The Rights Agreement expired on its terms on December 31, 2018 and is no longer of any force or effect.
107
Note T — Segment and Related Information
We have identified two operating segments and both performance evaluation and resource allocation decisions are determined based on each operating segment’s income from operations. The operating segments are described further below:
Patient Care - This segment consists of (i) our owned and operated patient care clinics, and (ii) our contracting and network management business. The patient care clinics provide services to design and fit O&P devices to patients. These clinics also instruct patients in the use, care, and maintenance of the devices. The principal reimbursement sources for our services are:
| • | Commercial private payors and other, which consist of individuals, rehabilitation providers, commercial insurance companies, HMOs, PPOs, hospitals, vocational rehabilitation, workers’ compensation programs, and similar sources; |
| • | Medicare, a federally funded health insurance program providing health insurance coverage for persons aged 65 or older and certain persons with disabilities, which provides reimbursement for O&P products and services based on prices set forth in published fee schedules with 10 regional pricing areas for prosthetics and orthotics and by state for durable medical equipment; |
| • | Medicaid, a health insurance program jointly funded by federal and state governments providing health insurance coverage for certain persons in financial need, regardless of age, which may supplement Medicare benefits for persons aged 65 or older in financial need; and |
| • | U.S. Department of Veterans Affairs. |
Our contract and network management business, known as Linkia, is the only network management company dedicated solely to serving the O&P market and is focused on managing the O&P services of national and regional insurance companies. We partner with healthcare insurance companies by securing a national or regional contract either as a preferred provider or to manage their O&P network of providers.
Products & Services - This segment consists of our distribution business, which distributes and fabricates O&P products and components to sell to both the O&P industry and our own patient care clinics, and our therapeutic solutions business. The therapeutic solutions business leases and sells rehabilitation equipment and ancillary consumable supplies combined with equipment maintenance, education, and training. This segment also develops emerging neuromuscular technologies for the O&P and rehabilitation markets.
Corporate & Other - This consists of corporate overhead and includes unallocated expense such as personnel costs, professional fees, and corporate offices expenses.
The accounting policies of the segments are the same as those described in Note A - “Organization and Summary of Significant Accounting Policies.”
Intersegment revenue primarily relates to sales of O&P components from the Products & Services segment to the Patient Care segment. The sales are priced at the cost of the related materials plus overhead.
We had no foreign and export sales and assets for the years ended December 31, 2019, 2018, and 2017.
For the Patient Care segment, government reimbursement, comprised of Medicare, Medicaid, and the VA, in the aggregate, accounted for approximately, 57.5%, 56.5%, and 54.8% of their net revenue in 2019, 2018, and 2017, respectively.
Additionally, for the Products & Services segment, no single customer accounted for more than 10% of net revenues in 2019, 2018, or 2017, respectively.
Summarized financial information concerning our reporting segments is shown in the following tables.
108
| Patient Care | Products & Services | |||||||||||||||||||||||
| For the Year Ended December 31, | For the Year Ended December 31, | |||||||||||||||||||||||
| (in thousands) | 2019 | 2018 | 2017 | 2019 | 2018 | 2017 | ||||||||||||||||||
| Net revenue | ||||||||||||||||||||||||
| Third party | $ | 905,691 | $ | 857,382 | $ | 851,973 | $ | 192,355 | $ | 191,378 | $ | 188,796 | ||||||||||||
| Intersegments | — | — | — | 203,496 | 192,096 | 178,768 | ||||||||||||||||||
| Total net revenue | 905,691 | 857,382 | 851,973 | 395,851 | 383,474 | 367,564 | ||||||||||||||||||
| Material costs | ||||||||||||||||||||||||
| Third party suppliers | 250,407 | 234,409 | 228,091 | 107,364 | 103,608 | 101,132 | ||||||||||||||||||
| Intersegments | 24,394 | 23,792 | 23,808 | 179,102 | 168,304 | 154,960 | ||||||||||||||||||
| Total material costs | 274,801 | 258,201 | 251,899 | 286,466 | 271,912 | 256,092 | ||||||||||||||||||
| Personnel expenses | 319,633 | 312,736 | 312,695 | 52,592 | 51,353 | 48,395 | ||||||||||||||||||
| Other expenses | 151,140 | 140,527 | 143,598 | 28,178 | 24,306 | 25,855 | ||||||||||||||||||
| Depreciation & amortization | 18,541 | 19,113 | 21,363 | 10,650 | 10,197 | 10,163 | ||||||||||||||||||
| Impairment of intangible assets | — | — | — | — | 183 | 54,735 | ||||||||||||||||||
| Segment income (loss) from operations | $ | 141,576 | $ | 126,805 | $ | 122,418 | $ | 17,965 | $ | 25,523 | $ | (27,676 | ) | |||||||||||
| Purchase of property, plant and equipment | $ | 16,102 | $ | 12,781 | $ | 8,163 | $ | 2,368 | $ | 1,890 | $ | 2,153 | ||||||||||||
| Purchase of therapeutic program equipment leased to third parties under operating leases | $ | — | $ | — | $ | — | $ | 6,672 | $ | 9,835 | $ | 6,000 | ||||||||||||
A reconciliation of the total of the reportable segment’s income (loss) from operations to consolidated income (loss) from operations is as follows:
| (in thousands) | 2019 | 2018 | 2017 | |||||||||
| Income (loss) from operations | ||||||||||||
| Patient Care | $ | 141,576 | $ | 126,805 | $ | 122,418 | ||||||
| Products & Services | 17,965 | 25,523 | (27,676 | ) | ||||||||
| Corporate & other | (94,113 | ) | (92,681 | ) | (113,692 | ) | ||||||
| Income (loss) from operations | 65,428 | 59,647 | (18,950 | ) | ||||||||
| Interest expense, net | 34,258 | 37,566 | 57,688 | |||||||||
| Loss on extinguishment of debt | — | 16,998 | — | |||||||||
| Non-service defined benefit plan expense | 691 | 703 | 736 | |||||||||
| Income (loss) before income taxes | 30,479 | 4,380 | (77,374 | ) | ||||||||
| Provision for income taxes | 2,954 | 5,238 | 27,297 | |||||||||
| Net income (loss) | $ | 27,525 | $ | (858 | ) | $ | (104,671 | ) | ||||
A reconciliation of the reportable segment net revenue to consolidated net revenue is as follows:
| (in thousands) | 2019 | 2018 | 2017 | |||||||||
| Net Revenue | ||||||||||||
| Patient Care | $ | 905,691 | $ | 857,382 | $ | 851,973 | ||||||
| Products & Services | 395,851 | 383,474 | 367,564 | |||||||||
| Corporate & other | — | — | — | |||||||||
| Consolidating adjustments | (203,496 | ) | (192,096 | ) | (178,768 | ) | ||||||
| Consolidated net revenue | $ | 1,098,046 | $ | 1,048,760 | $ | 1,040,769 | ||||||
109
A reconciliation of the reportable segment material costs to consolidated material costs is as follows:
| (in thousands) | 2019 | 2018 | 2017 | |||||||||
| Material costs | ||||||||||||
| Patient Care | $ | 274,801 | $ | 258,201 | $ | 251,899 | ||||||
| Products & Services | 286,466 | 271,912 | 256,092 | |||||||||
| Corporate & other | — | — | — | |||||||||
| Consolidating adjustments | (203,496 | ) | (192,096 | ) | (178,768 | ) | ||||||
| Consolidated material costs | $ | 357,771 | $ | 338,017 | $ | 329,223 | ||||||
A reconciliation of the reportable segment purchase of property, plant and equipment to consolidated purchase of property, plant and equipment, including purchases of therapeutic program equipment leased to third parties under operating leases, is as follows:
| (in thousands) | 2019 | 2018 | 2017 | |||||||||
| Purchase of property, plant and equipment and therapeutic program equipment leased to third parties under operating leases | ||||||||||||
| Patient Care | $ | 16,102 | $ | 12,781 | $ | 8,163 | ||||||
| Products & Services | ||||||||||||
| Property, plant and equipment | 2,368 | 1,890 | 2,153 | |||||||||
| Therapeutic program equipment leased to third parties under operating leases | 6,672 | 9,835 | 6,000 | |||||||||
| Corporate & other | 7,963 | 4,313 | 6,039 | |||||||||
| Total consolidated purchase of property, plant and equipment and therapeutic program equipment leased to third parties under operating leases | $ | 33,105 | $ | 28,819 | $ | 22,355 | ||||||
A reconciliation of the total of the reportable segment’s assets to consolidated assets is as follows:
| (in thousands) | 2019 | 2018 | ||||||
| Assets | ||||||||
| Patient Care | $ | 552,644 | $ | 415,469 | ||||
| Products & Services | 105,673 | 100,953 | ||||||
| Corporate & other | 183,936 | 186,588 | ||||||
| Total consolidated assets | $ | 842,253 | $ | 703,010 | ||||
110
Note U — Supplemental Cash Flow Information
Changes in operating assets and liabilities on cash flows from operating activities is as follows:
| For the Years Ended December 31, | ||||||||||||
| (in thousands) | 2019 | 2018 | 2017 | |||||||||
| Accounts receivable, net | $ | (12,329 | ) | $ | 3,238 | $ | (12,585 | ) | ||||
| Inventories | 1,568 | 1,750 | (913 | ) | ||||||||
| Other current assets and other assets | (2,611 | ) | 4,459 | 661 | ||||||||
| Income taxes receivable | 1,248 | 12,700 | 121 | |||||||||
| Accounts payable | (6,725 | ) | 6,511 | (3,562 | ) | |||||||
| Accrued expenses and other current liabilities | (1,242 | ) | (16,550 | ) | (12,929 | ) | ||||||
| Accrued compensation related costs | 5,780 | 1,713 | 16,843 | |||||||||
| Other liabilities | (1,883 | ) | (3,980 | ) | (2,271 | ) | ||||||
| Operating lease liabilities, net of amortization of right-of-use assets | 262 | — | — | |||||||||
| Changes in operating assets and liabilities on cash flows from operating activities | $ | (15,932 | ) | $ | 9,841 | $ | (14,635 | ) | ||||
A reconciliation of the change in operating lease liabilities, net of amortization of right-of-use assets is as follows:
| For the Years Ended December 31, | ||||||||||||
| (in thousands) | 2019 | 2018 | 2017 | |||||||||
| Operating lease liabilities | $ | (36,911 | ) | $ | — | $ | — | |||||
| Amortization of right-of-use assets | 37,173 | — | — | |||||||||
| Operating lease liabilities, net of amortization of right-of-use assets | $ | 262 | $ | — | $ | — | ||||||
The supplemental disclosure requirements for the statements of cash flows are as follows:
| For the Years Ended December 31, | ||||||||||||
| (in thousands) | 2019 | 2018 | 2017 | |||||||||
| Cash paid during the period for: | ||||||||||||
| Interest paid | $ | 29,192 | $ | 31,312 | $ | 48,437 | ||||||
| Income tax (refunds received) paid | 5,100 | (11,131 | ) | 725 | ||||||||
| Non-cash financing and investing activities: | ||||||||||||
| Issuance of seller notes and working capital adjustments in connection with acquisitions | 7,885 | 1,120 | — | |||||||||
| Purchase of property, plant and equipment in accounts payable at period end | 2,998 | 5,018 | 2,119 | |||||||||
| Purchase of property, plant and equipment through vendor financing | 2,200 | — | — | |||||||||
| Additions to property, plant and equipment acquired through financing obligations | — | 1,523 | 1,484 | |||||||||
| Retirements of financed property, plant and equipment and related financing obligations | — | 4,460 | 811 | |||||||||
111
Note V — Subsequent Events
In March 2020, we entered into definitive share purchase agreements in connection with the acquisitions of two orthotic and prosthetic businesses for a total purchase price of $51.7 million, of which $43.2 million was cash consideration, $4.5 million was issued in the form of notes to the shareholders, and the assumption of approximately $4.0 million in deferred payment obligations owed to certain shareholders or employees of one of the acquired businesses. The notes are payable in annual installments over a period of 3 to 5 years. The deferred payment obligations are payable in annual installments beginning in the fourth year following the acquisition and for three years thereafter. Acquisition-related expenses incurred during the year ended December 31, 2019 related to the two acquisitions were not material. Due to the proximity of these transactions to the filing of this Form 10-K, it is not practicable to provide a preliminary purchase price allocation of the fair value of the assets acquired and liabilities assumed in the acquisitions.
Note W — Quarterly Financial Information (Unaudited)
The following table presents our unaudited quarterly consolidated results of operations for each of the eight quarters in the two-year period ended December 31, 2019. The unaudited quarterly consolidated information has been derived from our unaudited quarterly financial statements on Forms 10-Q, which were prepared on the same basis as our audited consolidated financial statements. Amounts are computed independently each quarter, therefore, the sum of the quarterly amounts may not equal the total amount for the respective year due to rounding.
| Three Months Ended | ||||||||||||||||
| (dollars in thousands, except per share amounts) | March 31, 2019 | June 30, 2019 | September 30, 2019 | December 31, 2019 | ||||||||||||
| Net revenues | $ | 236,419 | $ | 281,098 | $ | 279,638 | $ | 300,891 | ||||||||
| Material costs | 78,377 | 91,399 | 92,034 | 95,961 | ||||||||||||
| Personnel costs | 86,711 | 91,490 | 94,594 | 99,430 | ||||||||||||
| Other operating costs | 33,555 | 33,741 | 32,771 | 34,876 | ||||||||||||
| General and administrative expenses | 28,282 | 29,358 | 29,834 | 30,591 | ||||||||||||
| Professional accounting and legal fees | 2,700 | 3,247 | 3,629 | 4,113 | ||||||||||||
| Depreciation and amortization | 8,773 | 8,760 | 9,373 | 9,019 | ||||||||||||
| (Loss) income from operations | (1,979 | ) | 23,103 | 17,403 | 26,901 | |||||||||||
| Interest expense, net | 8,538 | 8,481 | 8,954 | 8,285 | ||||||||||||
| Non-service defined benefit plan expense | 173 | 173 | 173 | 172 | ||||||||||||
| (Loss) income before income taxes | (10,690 | ) | 14,449 | 8,276 | 18,444 | |||||||||||
| (Benefit) provision for income taxes | (3,739 | ) | 4,414 | 2,585 | (306 | ) | ||||||||||
| Net (loss) income | $ | (6,951 | ) | $ | 10,035 | $ | 5,691 | $ | 18,750 | |||||||
| Other comprehensive (loss) income: | ||||||||||||||||
| Unrealized (loss) gain on cash flow hedges, net of tax | (2,936 | ) | (4,688 | ) | (1,641 | ) | 2,064 | |||||||||
| Unrealized gain (loss) on defined benefit plan, net of tax | 6 | 6 | 7 | (838 | ) | |||||||||||
| Comprehensive (loss) income | $ | (9,881 | ) | $ | 5,353 | $ | 4,057 | $ | 19,976 | |||||||
| Basic Per Common Share Data: | ||||||||||||||||
| Basic (loss) earnings per share | $ | (0.19 | ) | $ | 0.27 | $ | 0.15 | $ | 0.50 | |||||||
| Weighted average shares outstanding - basic | 37,001,977 | 37,299,766 | 37,349,144 | 37,411,847 | ||||||||||||
| Diluted Per Common Share Data: | ||||||||||||||||
| Diluted (loss) earnings per share | $ | (0.19 | ) | $ | 0.26 | $ | 0.15 | $ | 0.49 | |||||||
| Weighted average shares outstanding - diluted | 37,001,977 | 37,887,559 | 37,986,860 | 38,415,108 | ||||||||||||
112
| Three Months Ended | ||||||||||||||||
| (dollars in thousands, except per share amounts) | March 31, 2018 | June 30, 2018 | September 30, 2018 | December 31, 2018 | ||||||||||||
| Net revenues | $ | 233,995 | $ | 266,966 | $ | 262,946 | $ | 284,853 | ||||||||
| Material costs | 76,356 | 86,516 | 84,805 | 90,340 | ||||||||||||
| Personnel costs | 86,108 | 89,554 | 90,853 | 97,574 | ||||||||||||
| Other operating costs | 31,096 | 30,536 | 30,999 | 31,271 | ||||||||||||
| General and administrative expenses | 25,636 | 26,523 | 28,308 | 29,085 | ||||||||||||
| Professional accounting and legal fees | 4,846 | 4,236 | 3,107 | 4,726 | ||||||||||||
| Depreciation and amortization | 9,330 | 9,272 | 8,950 | 8,903 | ||||||||||||
| Impairment of intangible assets | — | — | — | 183 | ||||||||||||
| Income from operations | 623 | 20,329 | 15,924 | 22,771 | ||||||||||||
| Interest expense, net | 12,263 | 7,317 | 8,939 | 9,046 | ||||||||||||
| Loss on extinguishment of debt | 16,998 | — | — | — | ||||||||||||
| Non-service defined benefit plan expense | 176 | 176 | 176 | 176 | ||||||||||||
| (Loss) income before income taxes | (28,814 | ) | 12,836 | 6,809 | 13,549 | |||||||||||
| (Benefit) provision for income taxes | (6,196 | ) | (92 | ) | 2,440 | 9,086 | ||||||||||
| Net (loss) income | $ | (22,618 | ) | $ | 12,928 | $ | 4,369 | $ | 4,463 | |||||||
| Other comprehensive loss: | ||||||||||||||||
| Unrealized (loss) gain on cash flow hedges, net of tax | (2,290 | ) | 2,314 | 1,738 | (4,698 | ) | ||||||||||
| Unrealized (loss) gain on defined benefit plan, net of tax | (292 | ) | 26 | 26 | 694 | |||||||||||
| Comprehensive (loss) income | $ | (25,200 | ) | $ | 15,268 | $ | 6,133 | $ | 459 | |||||||
| Basic Per Common Share Data: | ||||||||||||||||
| Basic (loss) earnings per share | $ | (0.62 | ) | $ | 0.35 | $ | 0.12 | $ | 0.12 | |||||||
| Weighted average shares outstanding - basic | 36,498,482 | 36,790,401 | 36,856,881 | 36,906,938 | ||||||||||||
| Diluted Per Common Share Data: | ||||||||||||||||
| Diluted (loss) earnings per share | $ | (0.62 | ) | $ | 0.35 | $ | 0.12 | $ | 0.12 | |||||||
| Weighted average shares outstanding - diluted | 36,498,482 | 37,404,360 | 37,556,594 | 37,721,662 | ||||||||||||
113
| ITEM 9. | CHANGES IN AND DISAGREEMENTS WITH ACCOUNTANTS ON ACCOUNTING AND FINANCIAL DISCLOSURE. |
None.
| ITEM 9A. | CONTROLS AND PROCEDURES. |
Evaluation of Disclosure Controls and Procedures
Disclosure controls and procedures (as defined in Rules 13a-15(e) and 15d-15(e) under the Exchange Act) are designed to ensure that information required to be disclosed in reports filed or submitted under the Exchange Act is recorded, processed, summarized, and reported within the time periods specified in the SEC rules and forms, and that such information is accumulated and communicated to management, including the Chief Executive Officer and the Chief Financial Officer, to allow timely decisions regarding required disclosures.
Management, under the supervision and with the participation of our Chief Executive Officer and Chief Financial Officer, conducted an evaluation of the effectiveness of the design and effectiveness of our disclosure controls and procedures as of December 31, 2019. Based on that evaluation, our Chief Executive Officer and Chief Financial Officer have concluded that our disclosure controls and procedures were effective as of December 31, 2019.
Management’s Report on Internal Control over Financial Reporting
Management, under the supervision of our Chief Executive Officer and Chief Financial Officer, is responsible for establishing and maintaining adequate internal control over financial reporting. Internal control over financial reporting (as defined in Rules 13a-15(f) and 15d-15(f) under the Exchange Act) is a process designed by, or under the supervision of our Chief Executive Officer and Chief Financial Officer and effected by our board of directors, management and other personnel to provide reasonable assurance regarding the reliability of financial reporting and the preparation of financial statements for external purposes in accordance with GAAP.
Internal control over financial reporting includes those policies and procedures which (a) pertain to the maintenance of records that, in reasonable detail, accurately and fairly reflect the transactions and dispositions of assets, (b) provide reasonable assurance that transactions are recorded as necessary to permit preparation of financial statements in accordance with generally accepted accounting principles, (c) provide reasonable assurance that receipts and expenditures are being made only in accordance with appropriate authorization of management and the board of directors, and (d) provide reasonable assurance regarding prevention or timely detection of unauthorized acquisition, use or disposition of assets that could have a material effect on the financial statements.
Internal control over financial reporting has inherent limitations. Internal control over financial reporting is a process that involves human diligence and compliance and is subject to lapses in judgment and breakdowns resulting from human failures. Internal control over financial reporting also can be circumvented by collusion or improper management override. Because of such limitations, there is a risk that material misstatements will not be prevented or detected on a timely basis. However, these inherent limitations are known features of the financial reporting process. Therefore, it is possible to design into the process safeguards to reduce, though not eliminate, this risk. Also, projections of any evaluation of effectiveness to future periods are subject to the risk that controls may become inadequate because of changes in conditions, or that the degree of compliance with the policies or procedures may deteriorate in the future.
Our management, under the supervision and with the participation of our Chief Executive Officer and Chief Financial Officer, conducted an evaluation of the effectiveness of our internal control over financial reporting as of December 31, 2019, based on the criteria established in Internal Control - Integrated Framework (2013) issued by the Committee of Sponsoring Organizations of the Treadway Commission, and has concluded that we maintained effective internal control over financial reporting as of December 31, 2019.
114
PricewaterhouseCoopers LLP has issued a report on the effectiveness of the Company’s internal control over financial reporting as of December 31, 2019, which is included in Part II, Item 8 of this annual report.
Remediated Material Weaknesses
As of December 31, 2019, we have remediated the previously disclosed material weaknesses related to:
| • | Control Environment |
A deficiency related to the design and maintenance of effective controls with respect to establishing and assigning authority and responsibility over accounting operations, including the consolidation process and the preparation and review of financial statements.
| • | Risk Assessment |
A deficiency related to the design and maintenance of effective controls to identify, assess and address risks that significantly impact our financial statements or the effectiveness of our internal control over financial reporting.
| • | Information and Communication |
A deficiency related to the design and maintenance of effective controls to obtain, generate and communicate relevant and accurate information to support the function of internal control over financial reporting. Specifically, we did not implement or maintain sufficient information systems in support of our accounting and financial reporting processes.
115
| • | Monitoring |
A deficiency related to the design and maintenance of effective monitoring of compliance with established accounting policies, procedures and controls. This weakness included our failure to design and operate effective procedures and controls whose purpose is to evaluate and monitor the effectiveness of our individual control activities.
| • | Information Technology General Controls |
A deficiency related to the design and maintenance of effective controls over certain IT systems, which could result in misstatements potentially impacting all financial statement accounts and disclosures. Specifically, we did not design and maintain (i) user access controls to appropriately segregate duties and adequately restrict user and privileged access to financial applications and data to the appropriate personnel, (ii) effective controls to monitor, document and approve data changes, and (iii) effective controls related to monitoring of critical jobs.
| • | Inventory |
A deficiency related to the design and maintenance of effective controls over the accounting for inventory. Specifically, the operation of effective controls over:
| • | raw materials to ensure items are priced using the FIFO method, resulting from the identification of inaccurate prices utilized in the valuation of our inventory quantities on hand based on physical observation; |
| • | certain key assumptions used in the valuation of WIP, resulting from the identification of inaccurate or imprecise data used in the development of these assumptions; and |
| • | the completeness, accuracy, valuation and presentation and disclosure of raw materials and WIP. |
| • | Revenue |
A deficiency related to the design and maintenance of effective controls over our accounting for revenue. Specifically, the design and maintenance of effective controls over the completeness, accuracy, occurrence, and valuation of revenue.
116
| • | Accounts Receivable and Allowance |
A deficiency related to the design and maintenance of effective controls over accounts receivable and allowances. Specifically, the design and maintenance of effective controls over the completeness, accuracy, existence and valuation of amounts recorded to accounts receivable, including allowances.
| • | Accounts Payable |
A deficiency related to the design and maintenance of effective controls over accounts payable. Specifically, the design and maintenance of effective controls over the completeness, accuracy, existence, and rights and obligations related to purchased goods and services, accurately reflecting the receipt of such goods or services and the related liability in the proper period.
Changes in Internal Control over Financial Reporting
There have been no changes in internal control over financial reporting during the quarter ended December 31, 2019 that have materially affected, or are reasonably likely to materially affect, the Company’s internal control over financial reporting.
| ITEM 9B. | OTHER INFORMATION. |
None.
117
| ITEM 10. | DIRECTORS, EXECUTIVE OFFICERS, AND CORPORATE GOVERNANCE. |
The information in the sections titled “Proposal 1: Election of Directors,” “Corporate Governance Matters,” “Principal Stockholders,” and “Delinquent Section 16(a) Reports” in the Proxy Statement for the Annual Meeting of Shareholders to be held on May 17, 2020 (the “2020 Proxy Statement”) is incorporated by reference herein. Information with respect to our executive officers appears in Part I of this Annual Report on Form 10-K.
Information required under this item with respect to executive officers is contained in Part I of this Form 10-K under the caption “Information About Our Executive Officers.”
We have adopted a Code of Business Conduct and Ethics (the “Code”) that applies to all our directors, officers and employees. The Code is available on our website, along with our current Corporate Governance Guidelines, at www.hanger.com. The Code and our Corporate Governance Guidelines are also available in print to any shareholder who requests a copy in writing from the Corporate Secretary of Hanger. We intend to disclose through our website any amendments to, or waivers from, the provisions of these codes.
| ITEM 11. | EXECUTIVE COMPENSATION. |
The information in the sections titled “Compensation Discussion and Analysis,” “Executive Compensation,” “Report of the Corporate Governance and Nominating Committee,” “Director Compensation,” and “Compensation Committee Interlocks and Insider Participation” in the 2020 Proxy Statement is incorporated by reference herein.
| ITEM 12. | SECURITY OWNERSHIP OF CERTAIN BENEFICIAL OWNERS AND MANAGEMENT AND RELATED STOCKHOLDER MATTERS. |
The information in the section titled “Principal Stockholders” in the 2020 Proxy Statement is incorporated by reference herein.
| ITEM 13. | CERTAIN RELATIONSHIPS AND RELATED TRANSACTIONS, AND DIRECTOR INDEPENDENCE. |
The information in the section titled “Corporate Governance Matters” in the 2020 Proxy Statement is incorporated by reference herein.
| ITEM 14. | PRINCIPAL ACCOUNTING FEES AND SERVICES. |
The information in the section titled “Proposal 3: Ratification of Appointment of Independent Registered Public Accounting Firm” in the 2020 Proxy Statement is incorporated by reference herein.
118
| ITEM 15. | EXHIBITS, FINANCIAL STATEMENT SCHEDULES. |
(a) Financial Statements and Financial Statement Schedules:
(1) Financial Statements:
The information required by this Item is incorporated herein by reference to the financial statements set forth under Item 8 “Financial Statements and Supplementary Data” of Part II of this Form 10-K.
(2) Financial Statement Schedules:
All schedules are omitted because they are not applicable or the required information is shown in the financial statements or notes thereto.
(3) Exhibits:
See Part (b) of this Item 15.
(b) Exhibits: The following exhibits are filed herewith or incorporated herein by reference:
119
120
__________________________
* Management contract or compensatory plan
| ITEM 16. | FORM 10-K SUMMARY. |
None.
121
Pursuant to the requirements of Section 13 or 15(d) of the Securities Exchange Act of 1934, the Registrant has duly caused this report to be signed on its behalf by the undersigned, thereunto duly authorized.
|
HANGER, INC.
| ||
| Dated: March 11, 2020 | By: | /s/ VINIT K. ASAR |
|
Vinit K. Asar Chief Executive Officer | ||
122
Pursuant to the requirements of the Securities Exchange Act of 1934, this report has been signed below by the following persons on behalf of the Registrant and in the capacities and on the dates indicated.
| Dated: March 11, 2020 | /s/ VINIT K. ASAR |
| Vinit K. Asar Chief Executive Officer and Director (Principal Executive Officer) | |
| Dated: March 11, 2020 | /s/ THOMAS E. KIRALY |
| Thomas E. Kiraly Executive Vice President and Chief Financial Officer (Principal Financial Officer) | |
| Dated: March 11, 2020 | /s/ GABRIELLE B. ADAMS |
| Gabrielle B. Adams Vice President - Chief Accounting Officer (Principal Accounting Officer) | |
| Dated: March 11, 2020 | /s/ ASIF AHMAD |
| Asif Ahmad Director | |
| Dated: March 11, 2020 | /s/ CHRISTOPHER B. BEGLEY |
| Christopher B. Begley Director | |
| Dated: March 11, 2020 | /s/ JOHN T. FOX |
| John T. Fox Director | |
| Dated: March 11, 2020 | /s/ THOMAS C. FREYMAN |
| Thomas C. Freyman Director | |
| Dated: March 11, 2020 | /s/ STEPHEN E. HARE |
| Stephen E. Hare Director | |
| Dated: March 11, 2020 | /s/ CYNTHIA L. LUCCHESE |
| Cynthia L. Lucchese Director | |
| Dated: March 11, 2020 | /s/ RICHARD R. PETTINGILL |
| Richard R. Pettingill Director | |
| Dated: March 11, 2020 | /s/ KATHRYN M. SULLIVAN |
| Kathryn M. Sullivan Director |
123