Attached files
| file | filename |
|---|---|
| 8-K - WEX INC. 8-K - WEX Inc. | a52216442.htm |
Exhibit 99.1

WEX First Quarter 2020 Earnings May 7, 2020
WEX Forward-Looking Statements These earnings materials contain forward-looking statements, including
statements regarding: financial guidance; assumptions underlying the Company's financial guidance and the potential for providing the same; future growth opportunities and expectations; and, market opportunities. Any statements that are not
statements of historical facts may be deemed to be forward-looking statements. When used in these earnings materials, the words “anticipate,” “believe,” “continue,” “could,” “estimate,” “expect,” “intend,” “may,” “plan,” “project” and similar
expressions are intended to identify forward-looking statements, although not all forward-looking statements contain such words. These forward-looking statements are subject to a number of risks and uncertainties that could cause actual results
to differ materially, including: the extent to which the coronavirus (COVID-19) outbreak and measures taken in response thereto adversely impact our business, results of operations and financial condition; the effects of general economic
conditions on fueling patterns as well as payment and transaction processing activity; the impact of foreign currency exchange rates on the Company’s operations, revenue and income; changes in interest rates; the impact of fluctuations in fuel
prices including the impact of any continued reductions in fuel price and the resulting impact on our revenues and net income; the effects of the Company’s business expansion and acquisition efforts; potential adverse changes to business or
employee relationships, including those resulting from the completion of an acquisition; competitive responses to any acquisitions; uncertainty of the expected financial performance of the combined operations following completion of an
acquisition; the failure to complete or successfully integrate the Company's acquisitions; the ability to realize anticipated synergies and cost savings; unexpected costs, charges or expenses resulting from an acquisition; the Company's ability
to successfully acquire, integrate, operate and expand commercial fuel card programs; the failure of corporate investments to result in anticipated strategic value; the impact and size of credit losses; the impact of changes to the Company's
credit standards; breaches of the Company’s technology systems or those of the Company's third-party service providers and any resulting negative impact on the Company's reputation, liabilities or relationships with customers or merchants; the
Company’s failure to maintain or renew key commercial agreements; failure to expand the Company’s technological capabilities and service offerings as rapidly as the Company’s competitors; failure to successfully implement the Company's
information technology strategies and capabilities in connection with its technology outsourcing and insourcing arrangements and any resulting cost associated with that failure; the actions of regulatory bodies, including banking and securities
regulators, or possible changes in banking or financial regulations impacting the Company’s industrial bank, the Company as the corporate parent or other subsidiaries or affiliates; legal, political and economic uncertainty surrounding the
United Kingdom's departure from the European Union; the impact of the transition from LIBOR as a global benchmark to a replacement rate; the impact of the Company’s outstanding notes on its operations; the impact of increased leverage on the
Company's operations, results or borrowing capacity generally, and as a result of acquisitions specifically; the incurrence of impairment charges if our assessment of the fair value of certain of our reporting units changes; the uncertainties
of litigation; as well as other risks and uncertainties identified in Item 1A of our Annual Report for the year ended December 31, 2019, filed on Form 10-K with the Securities and Exchange Commission on February 28, 2020. The Company's
forward-looking statements do not reflect the potential future impact of any alliance, merger, acquisition, disposition or stock repurchases. The forward-looking statements speak only as of the date of these materials and undue reliance should
not be placed on these statements. The Company disclaims any obligation to update any forward-looking statements as a result of new information, future events or otherwise.Non-GAAP Information:For additional important information and disclosure
regarding our use of non-GAAP metrics, specifically adjusted net income attributable to shareholders and adjusted operating income, please see our most recent earnings release, issued on May 7, 2020. See the Appendix to this presentation for an
explanation and reconciliation of (i) non-GAAP adjusted net income attributable to shareholders (or "adjusted net income" or “ANI”) to GAAP net (loss) income attributable to shareholders, (ii) ANI per diluted share to GAAP net (loss) income per
diluted share, (iii) non-GAAP adjusted operating income (or "AOI") to GAAP operating income and (iv) AOI margin versus GAAP operating income margin.
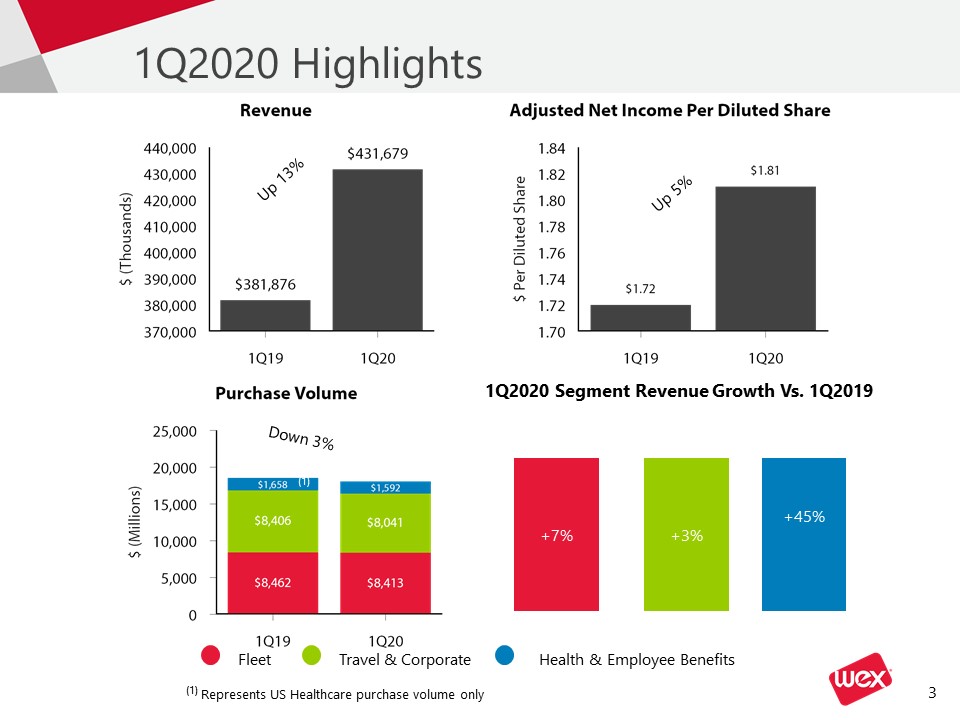
(1) Represents US Healthcare purchase volume only 1Q2020 Highlights 1Q2020 Segment Revenue Growth Vs.
1Q2019 Fleet Travel & Corporate Health & Employee Benefits Up 13% Up 5% Down 3% +45% +3% +7% (1)
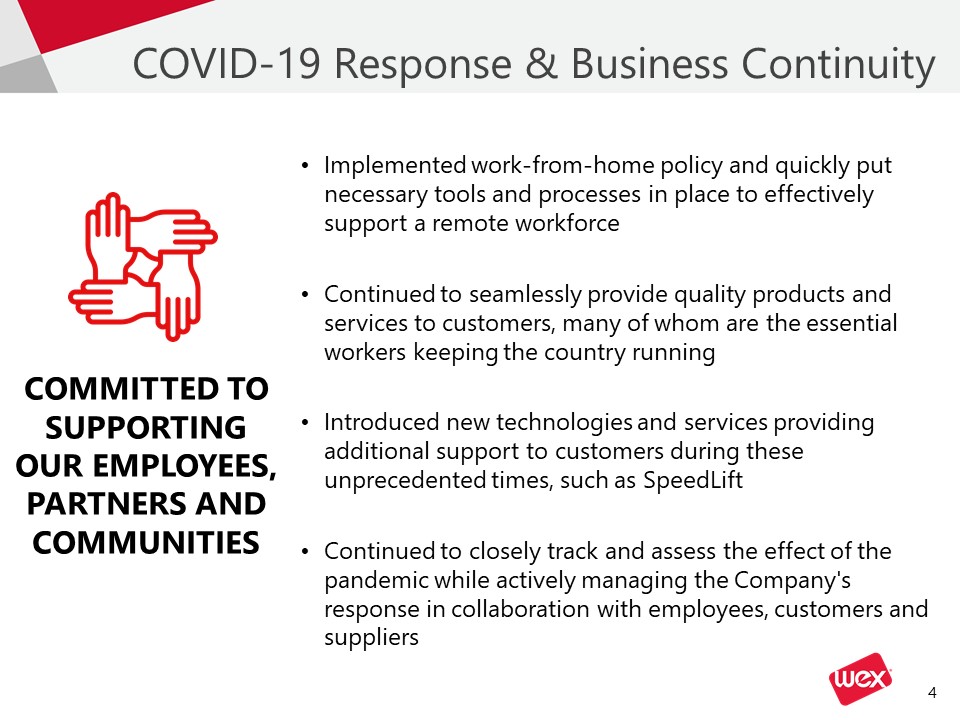
Implemented work-from-home policy and quickly put necessary tools and processes in place to effectively
support a remote workforceContinued to seamlessly provide quality products and services to customers, many of whom are the essential workers keeping the country runningIntroduced new technologies and services providing additional support to
customers during these unprecedented times, such as SpeedLiftContinued to closely track and assess the effect of the pandemic while actively managing the Company's response in collaboration with employees, customers and suppliers COVID-19
Response & Business Continuity COMMITTED TO SUPPORTING OUR EMPLOYEES, PARTNERS AND COMMUNITIES
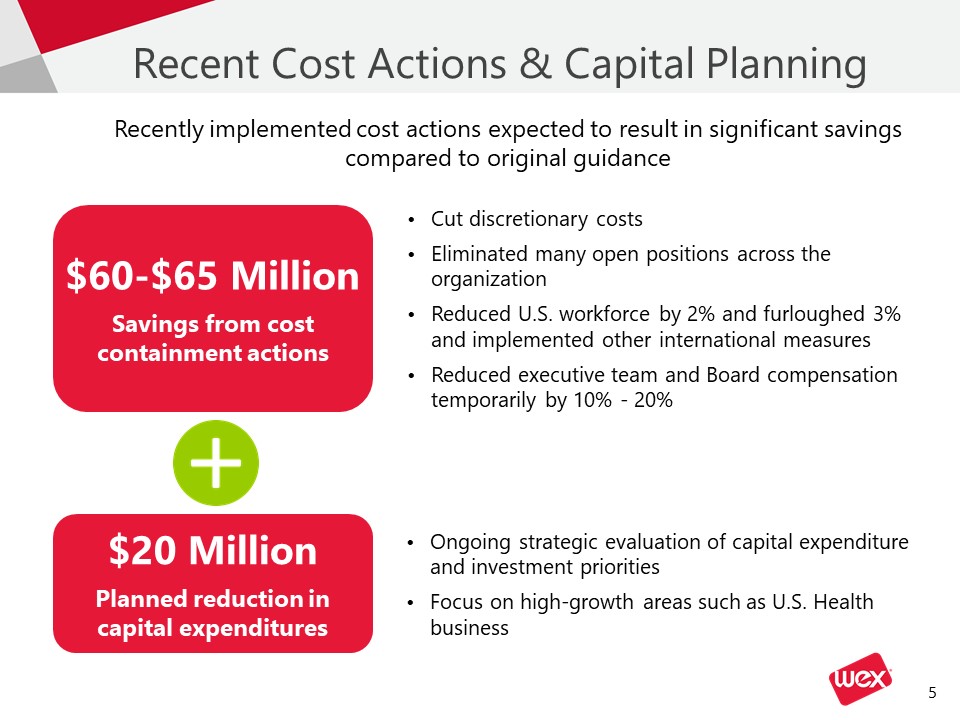
Cut discretionary costsEliminated many open positions across the organizationReduced U.S. workforce by 2%
and furloughed 3% and implemented other international measures Reduced executive team and Board compensation temporarily by 10% - 20% Recent Cost Actions & Capital Planning Recently implemented cost actions expected to result in
significant savings compared to original guidance $60-$65 MillionSavings from cost containment actions $20 MillionPlanned reduction in capital expenditures Ongoing strategic evaluation of capital expenditure and investment prioritiesFocus
on high-growth areas such as U.S. Health business
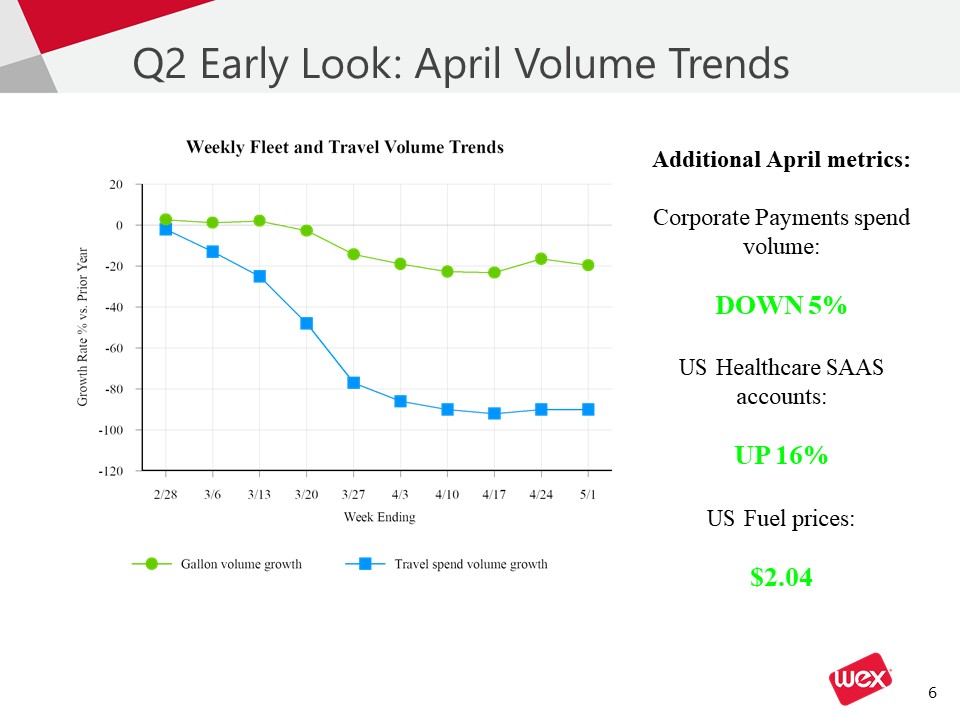
Q2 Early Look: April Volume Trends Additional April metrics:Corporate Payments spend volume:DOWN 5%US
Healthcare SAAS accounts:UP 16%US Fuel prices:$2.04

WEX Continues to Win in the Market RECENT WINS AND RENEWALS CONTINUING TO SERVE AND SUPPORT OUR
CUSTOMERS Existing customers continue to look to WEX for their payments and financial technology needsFirst responders, federal agencies, and truckers who are keeping the supply chain moving during these unprecedented times depend on WEX
products and servicesIncreased demand for health products as more Americans are using HSA, FSA, and COBRA products to pay for their health care needs Notable wins and renewals in the first quarter position us for the future Pipeline,
particularly in Corporate Payments and U.S. Health businesses, remains robust

WEX First Quarter 2020 Financial Results
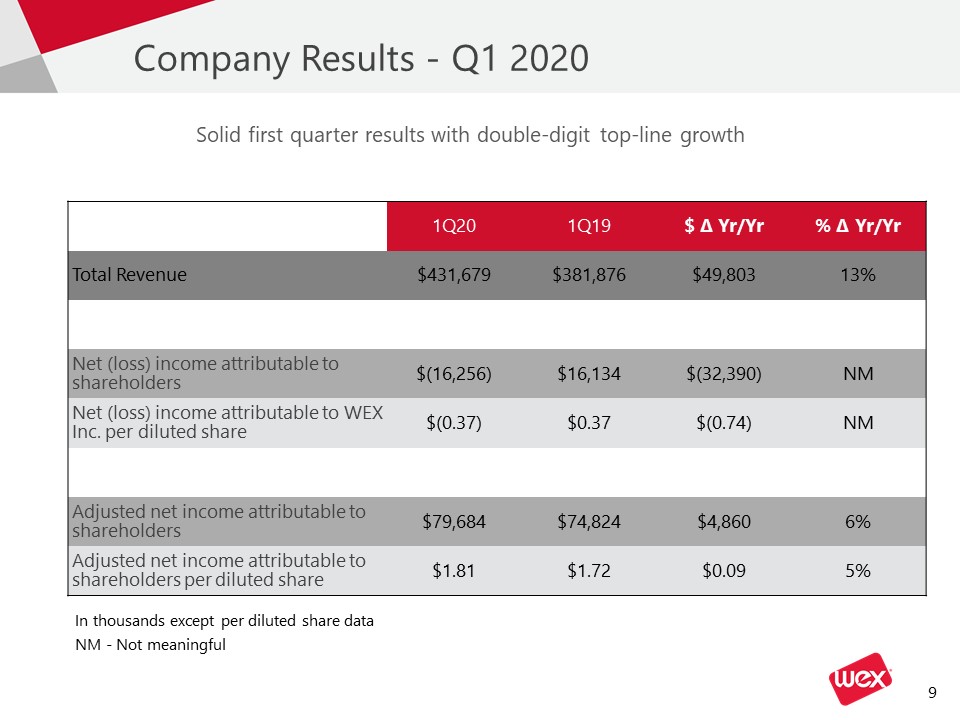
Company Results - Q1 2020 1Q20 1Q19 $ ∆ Yr/Yr % ∆ Yr/Yr Total
Revenue $431,679 $381,876 $49,803 13% Net (loss) income attributable to shareholders $(16,256) $16,134 $(32,390) NM Net (loss) income attributable to WEX Inc. per diluted
share $(0.37) $0.37 $(0.74) NM Adjusted net income attributable to shareholders $79,684 $74,824 $4,860 6% Adjusted net income attributable to shareholders per diluted share $1.81 $1.72 $0.09 5% Solid first quarter
results with double-digit top-line growth In thousands except per diluted share data NM - Not meaningful
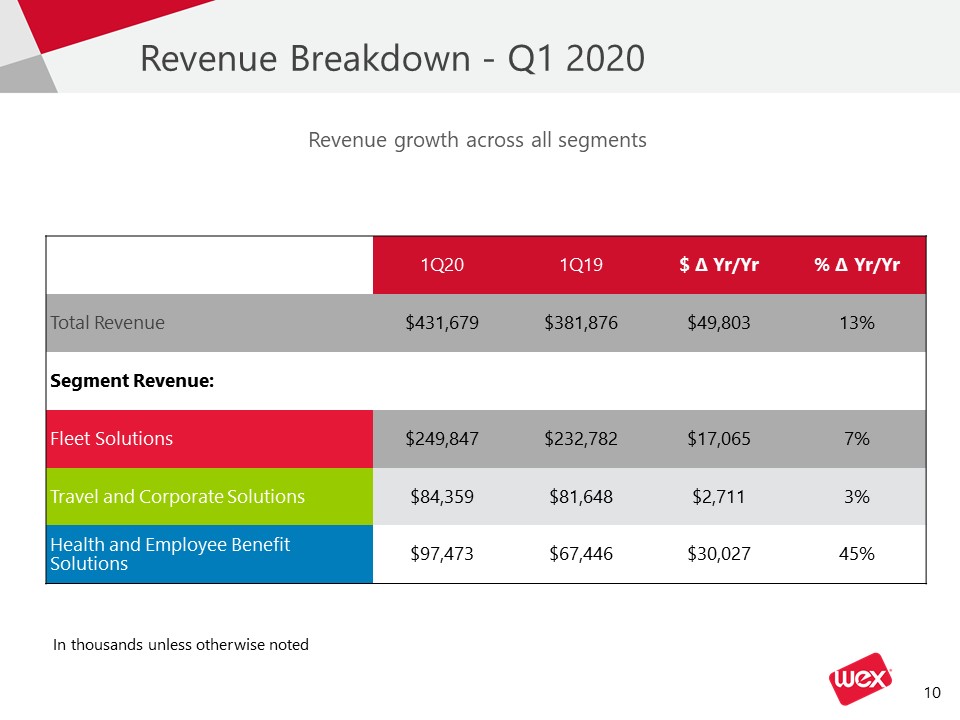
Revenue Breakdown - Q1 2020 1Q20 1Q19 $ ∆ Yr/Yr % ∆ Yr/Yr Total
Revenue $431,679 $381,876 $49,803 13% Segment Revenue: Fleet Solutions $249,847 $232,782 $17,065 7% Travel and Corporate Solutions $84,359 $81,648 $2,711 3% Health and Employee Benefit
Solutions $97,473 $67,446 $30,027 45% Revenue growth across all segments In thousands unless otherwise noted
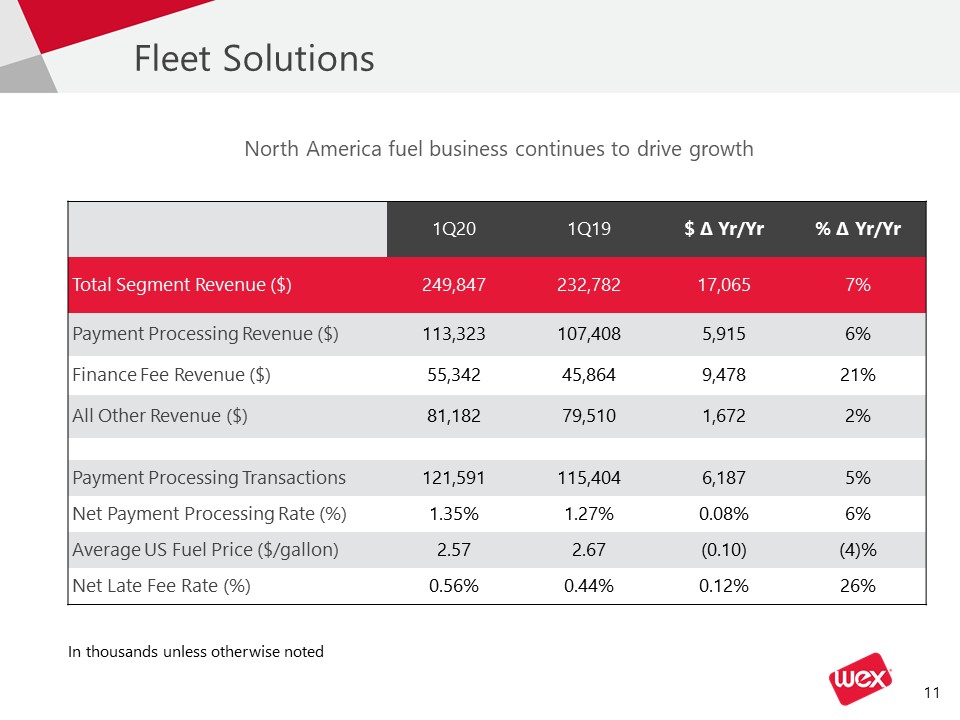
Fleet Solutions 1Q20 1Q19 $ ∆ Yr/Yr % ∆ Yr/Yr Total Segment Revenue
($) 249,847 232,782 17,065 7% Payment Processing Revenue ($) 113,323 107,408 5,915 6% Finance Fee Revenue ($) 55,342 45,864 9,478 21% All Other Revenue ($) 81,182 79,510 1,672 2% Payment Processing
Transactions 121,591 115,404 6,187 5% Net Payment Processing Rate (%) 1.35% 1.27% 0.08% 6% Average US Fuel Price ($/gallon) 2.57 2.67 (0.10) (4)% Net Late Fee Rate (%) 0.56% 0.44% 0.12% 26% North America fuel business
continues to drive growth In thousands unless otherwise noted
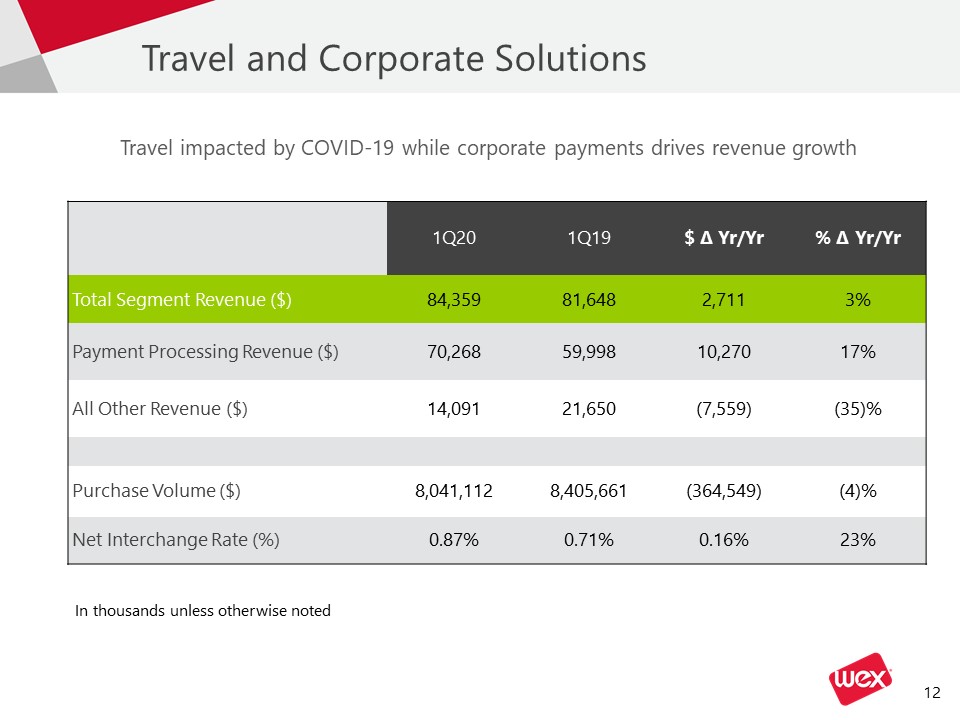
Travel and Corporate Solutions 1Q20 1Q19 $ ∆ Yr/Yr % ∆ Yr/Yr Total Segment Revenue
($) 84,359 81,648 2,711 3% Payment Processing Revenue ($) 70,268 59,998 10,270 17% All Other Revenue ($) 14,091 21,650 (7,559) (35)% Purchase Volume ($) 8,041,112 8,405,661 (364,549) (4)% Net Interchange Rate
(%) 0.87% 0.71% 0.16% 23% Travel impacted by COVID-19 while corporate payments drives revenue growth In thousands unless otherwise noted
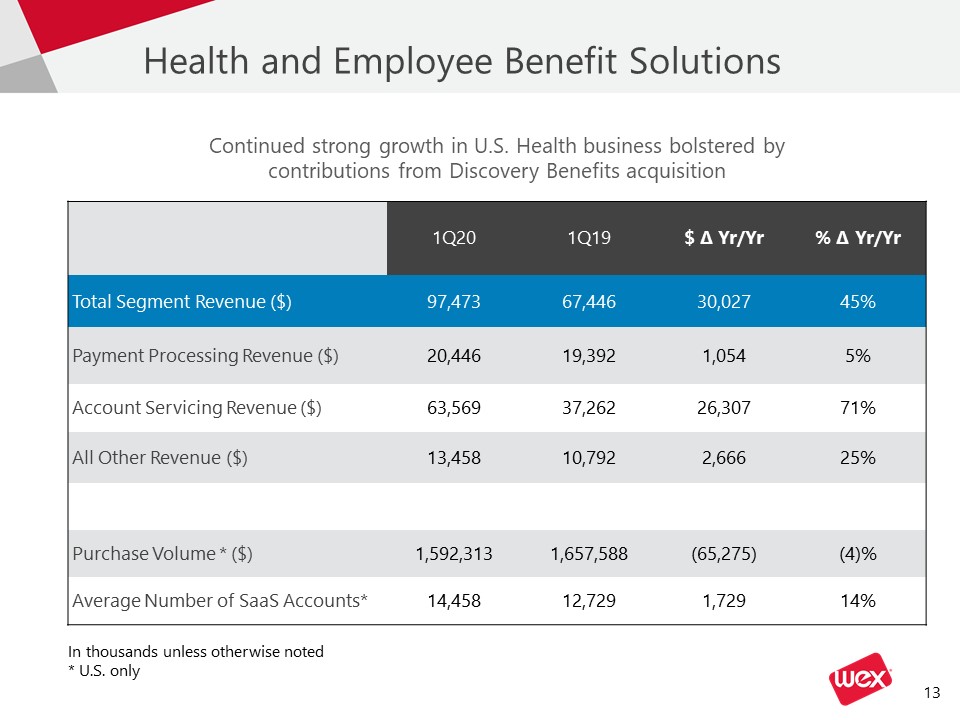
Health and Employee Benefit Solutions 1Q20 1Q19 $ ∆ Yr/Yr % ∆ Yr/Yr Total Segment Revenue
($) 97,473 67,446 30,027 45% Payment Processing Revenue ($) 20,446 19,392 1,054 5% Account Servicing Revenue ($) 63,569 37,262 26,307 71% All Other Revenue ($) 13,458 10,792 2,666 25% Purchase Volume *
($) 1,592,313 1,657,588 (65,275) (4)% Average Number of SaaS Accounts* 14,458 12,729 1,729 14% Continued strong growth in U.S. Health business bolstered by contributions from Discovery Benefits acquisition In thousands unless
otherwise noted* U.S. only
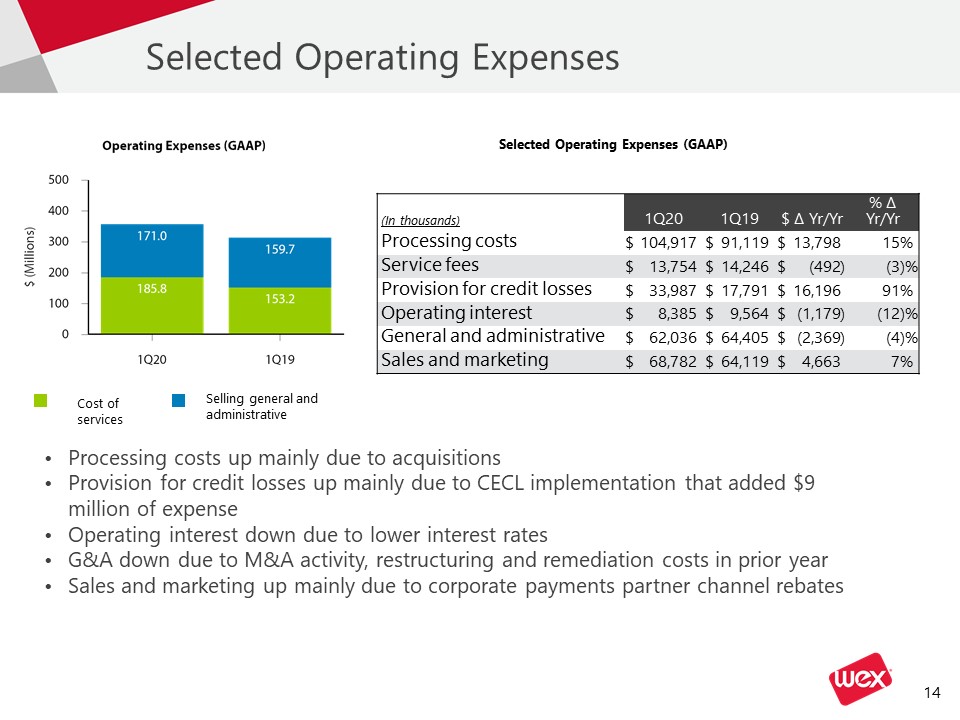
Selected Operating Expenses Processing costs up mainly due to acquisitionsProvision for credit losses
up mainly due to CECL implementation that added $9 million of expense Operating interest down due to lower interest ratesG&A down due to M&A activity, restructuring and remediation costs in prior yearSales and marketing up mainly due to
corporate payments partner channel rebates (In thousands) 1Q20 1Q20 1Q19 1Q19 $ ∆ Yr/Yr $ ∆ Yr/Yr % ∆ Yr/Yr Processing costs $ 104,917 $ 91,119 $ 13,798 15 % Service
fees $ 13,754 $ 14,246 $ (492 ) (3 )% Provision for credit losses $ 33,987 $ 17,791 $ 16,196 91 % Operating interest $ 8,385 $ 9,564 $ (1,179 ) (12 )% General and
administrative $ 62,036 $ 64,405 $ (2,369 ) (4 )% Sales and marketing $ 68,782 $ 64,119 $ 4,663 7 % Cost of services Selling general and administrative Selected Operating Expenses (GAAP)

Tax Rate Key Updates ANI tax rate in line with the prior year quarter
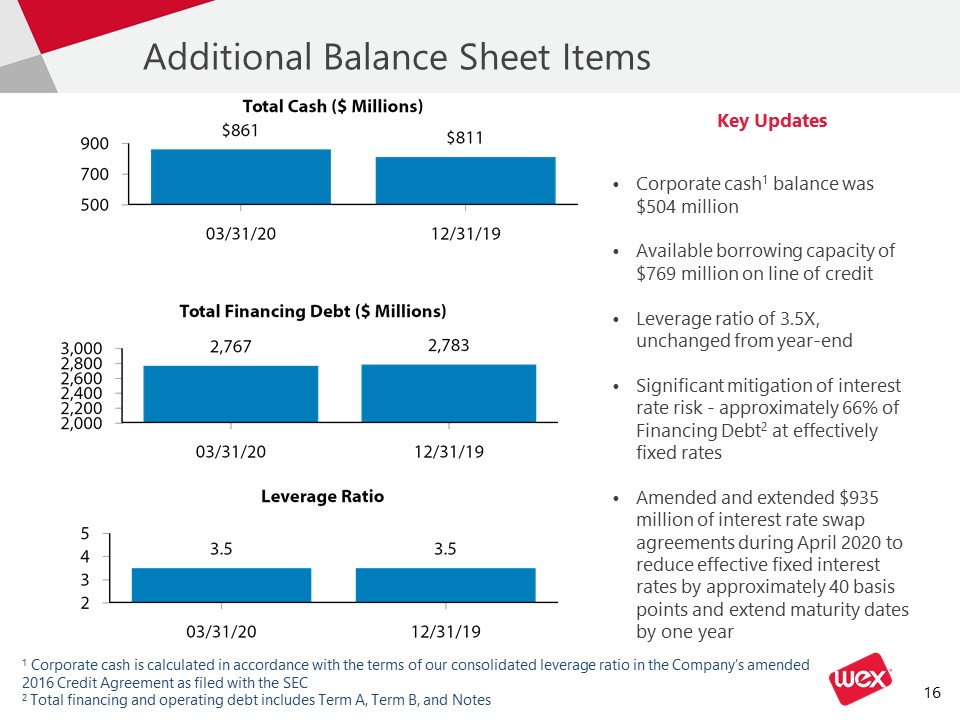
Additional Balance Sheet Items Key Updates Corporate cash1 balance was $504 million Available borrowing
capacity of $769 million on line of creditLeverage ratio of 3.5X, unchanged from year-endSignificant mitigation of interest rate risk - approximately 66% of Financing Debt2 at effectively fixed ratesAmended and extended $935 million of interest
rate swap agreements during April 2020 to reduce effective fixed interest rates by approximately 40 basis points and extend maturity dates by one year 1 Corporate cash is calculated in accordance with the terms of our consolidated leverage
ratio in the Company’s amended 2016 Credit Agreement as filed with the SEC2 Total financing and operating debt includes Term A, Term B, and Notes

Appendix

WEX Non-GAAP Reconciliation Three Months Ended March 31, Three Months Ended March
31, 2020 2020 2019 2019 per diluted share per diluted share per dilutedshare per dilutedshare Net (loss) income attributable to
shareholders $ (16,256 ) $ (0.37 ) $ 16,134 $ 0.37 Unrealized loss on financial instruments 32,047 0.74 11,912 0.27 Net foreign currency
loss 28,727 0.66 3,885 0.09 Acquisition–related intangible amortization 42,538 0.98 33,888 0.78 Other acquisition and divestiture related
items 7,942 0.18 9,780 0.23 Stock–based compensation 11,820 0.27 10,442 0.24 Other costs 2,240 0.05 2,755 0.06 Debt restructuring and debt issuance cost
amortization 2,082 0.05 6,496 0.15 ANI adjustments attributable to non–controlling interests 2,224 0.05 (573 ) (0.01 ) Tax related
items (33,680 ) (0.78 ) (19,895 ) (0.46 ) Dilutive impact of stock awards1 — (0.02 ) — — Adjusted net income attributable to
shareholders $ 79,684 $ 1.81 $ 74,824 $ 1.72 1As the Company reported a net loss for the three months ended March 31, 2020, GAAP diluted weighted average shares outstanding equals the basic weighted average shares
outstanding for that period. The non-GAAP adjustments described above resulted in adjusted net income attributable to shareholders for the first quarter of 2020. Therefore, dilutive common stock equivalents have been included in the calculation
of adjusted diluted weighted average shares outstanding.

WEX Non-GAAP Reconciliation The Company's non-GAAP adjusted net income excludes unrealized gains and
losses on financial instruments, net foreign currency gains and losses, acquisition-related intangible amortization, other acquisition and divestiture related items, stock-based compensation, other costs, debt restructuring and debt issuance
cost amortization, similar adjustments attributable to our non-controlling interests and certain tax related items. The Company's non-GAAP adjusted operating income excludes acquisition-related intangible amortization, other acquisition and
divestiture related items, debt restructuring, stock-based compensation, and other costs.Although adjusted net income and adjusted operating income are not calculated in accordance with U.S. generally accepted accounting principles (“GAAP”),
these non-GAAP measures are integral to the Company's reporting and planning processes. The Company considers these measures integral because they exclude the above-specified items that the Company's management excludes in evaluating the
Company's performance. Specifically, in addition to evaluating the Company's performance on a GAAP basis, management evaluates the Company's performance on a basis that excludes the above items because:Exclusion of the non-cash, mark-to-market
adjustments on financial instruments, including interest rate swap agreements and investment securities, helps management identify and assess trends in the Company's underlying business that might otherwise be obscured due to quarterly non-cash
earnings fluctuations associated with these financial instruments. Net foreign currency gains and losses primarily result from the remeasurement to functional currency of cash, accounts receivable and accounts payable balances, certain
intercompany notes denominated in foreign currencies and any gain or loss on foreign currency hedges relating to these items. The exclusion of these items helps management compare changes in operating results between periods that might
otherwise be obscured due to currency fluctuations.The Company considers certain acquisition-related costs, including certain financing costs, investment banking fees, warranty and indemnity insurance, certain integration related expenses and
amortization of acquired intangibles, as well as gains and losses from divestitures to be unpredictable, dependent on factors that may be outside of our control and unrelated to the continuing operations of the acquired or divested business or
the Company. In addition, the size and complexity of an acquisition, which often drives the magnitude of acquisition-related costs, may not be indicative of such future costs. The Company believes that excluding acquisition-related costs and
gains or losses of divestitures facilitates the comparison of our financial results to the Company's historical operating results and to other companies in our industry.Stock-based compensation is different from other forms of compensation as
it is a non-cash expense. For example, a cash salary generally has a fixed and unvarying cash cost. In contrast, the expense associated with an equity-based award is generally unrelated to the amount of cash ultimately received by the employee,
and the cost to the Company is based on a stock-based compensation valuation methodology and underlying assumptions that may vary over time. We exclude other costs when evaluating our continuing business performance as such items are not
consistently occurring and do not reflect expected future operating expense, nor do they provide insight into the fundamentals of current or past operations of our business. This includes costs related to further streamline the business,
improve the Company’s efficiency, create synergies and globalize the Company’s operations. For the three months ended March 31, 2020, other costs include certain costs incurred in association with COVID-19, including technology costs to enable
employees to work from home.Debt restructuring and debt issuance cost amortization are unrelated to the continuing operations of the Company. Debt restructuring costs are not consistently occurring and do not reflect expected future operating
expense, nor do they provide insight into the fundamentals of current or past operations of our business. In addition, since debt issuance cost amortization is dependent upon the financing method, which can vary widely company to company, we
believe that excluding these costs helps to facilitate comparison to historical results as well as to other companies within our industry.The adjustments attributable to non-controlling interests, including adjustments to the redemption value
of a non-controlling interest, have no significant impact on the ongoing operations of the business.The tax related items are the difference between the Company’s U.S. GAAP tax provision and a pro forma tax provision based upon the Company’s
adjusted net income before taxes as well as the impact from certain discrete tax items. The methodology utilized for calculating the Company’s adjusted net income tax provision is the same methodology utilized in calculating the Company’s U.S.
GAAP tax provision.For the same reasons, WEX believes that adjusted net income and adjusted operating income may also be useful to investors when evaluating the Company's performance. However, because adjusted net income and adjusted operating
income are non-GAAP measures, they should not be considered as a substitute for, or superior to, net income as determined in accordance with GAAP. In addition, adjusted net income as used by WEX may not be comparable to similarly titled
measures employed by other companies.