Attached files
| file | filename |
|---|---|
| 8-K - FORM 8-K - XO GROUP INC. | tv499620_8k.htm |
| EX-99.1 - EXHIBIT 99.1 - XO GROUP INC. | tv499620_ex99-1.htm |
Exhibit 99.2

Investor Presentation July 31, 2018
This presentation may contain projections or other forward - looking statements regarding future events or our future financial performance or estimates regarding third parties. These statements are only estimates or predictions and reflect our current beliefs and expectations. Actual events or results may differ materially from those contained in the estimates, projections or forward - looking statements. It is routine for internal projections and expectations to change as the quarter progresses, and therefore it should be clearly understood that the internal projections and beliefs upon which we base our expectations may change prior to the end of the quarter. Although these expectations may change, we will not necessarily inform you if they do. Our policy is to provide expectations not more than once per quarter, and not to update that information until the next quarter. Some of the factors that could cause actual results to differ materially from the forward - looking statements contained herein include, without limitation, (i) our operating results may fluctuate, are difficult to predict and could fall below expectations, (ii) our ability to accurately measure and monetize the level of offline store level traffic attributable to an online digital campaign conducted on our sites, (iii) our business depends on strong brands, and failing to maintain and enhance our brands would hurt our business, (iv) our ongoing investment in new businesses and new products, services, and technologies is inherently risky, and could disrupt our ongoing business and/or fail to generate the results we are expecting, (v) if we are unable to continue to develop solutions that generate revenue from advertising and other services delivered to mobile devices, our business could be harmed, (vi) our businesses could be negatively affected by changes in Internet search engine and app store search algorithms and email marketing policies, SAFE HARBOR (vii) we face intense competition in our markets. If we do not continue to innovate and provide products and services that are useful to users, we may not remain competitive, and our revenue and results of operations could be adversely affected, (viii) our transactions business is dependent on third - party participants, whose lack of performance could adversely affect our results of operations, (ix) fraudulent or unlawful activities on our marketplace could harm our business and consumer confidence in our marketplace, (x) we may be subject to legal liability associated with providing online services or content, (xi) we may be unable to continue to use the domain names that we use in our business, or prevent third parties from acquiring and using domain names that infringe on, are similar to, or otherwise decrease the value of our brand or our trademarks or service marks, and (xii) other factors detailed in documents we file from time to time with the Securities and Exchange Commission. Forward - looking statements in this release are made pursuant to the safe harbor provisions contained in the Private Securities Litigation Reform Act of 1995. This presentation includes certain “Non - GAAP financial information”. A reconciliation of such information to the most directly comparable GAAP financial measure can be found in documents we file from time to time with the Securities and Exchange Commission. 2 © 2018 XO Group Inc. All Rights Reserved.

Our mission is to help people navigate and truly enjoy life’s biggest moments, together. Our family of multi - platform brands guide couples through transformative life stages, from getting married to moving in together and having a baby. © 2018 XO Group Inc. All Rights Reserved.
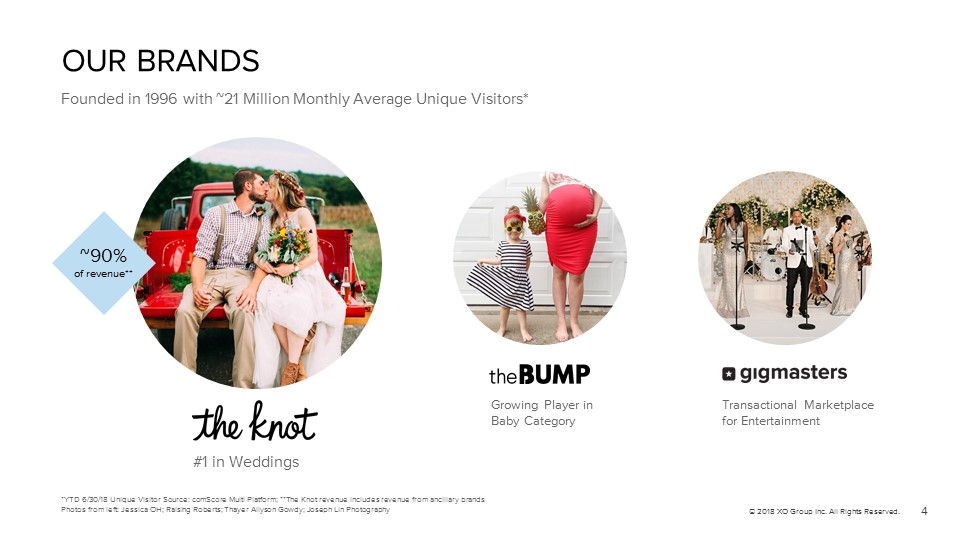
Founded in 1996 with ~21 Million Monthly Average Unique Visitors* *YTD 6/30/18 Unique Visitor Source: comScore Multi Platform; **The Knot revenue includes revenue from ancillary brands Photos from left: Jessica OH; Raising Roberts; Thayer Allyson Gowdy; Joseph Lin Photography OUR BRANDS #1 in Weddings Growing Player in Baby Category Transactional Marketplace for Entertainment ~90% of revenue** 4 © 2018 XO Group Inc. All Rights Reserved.
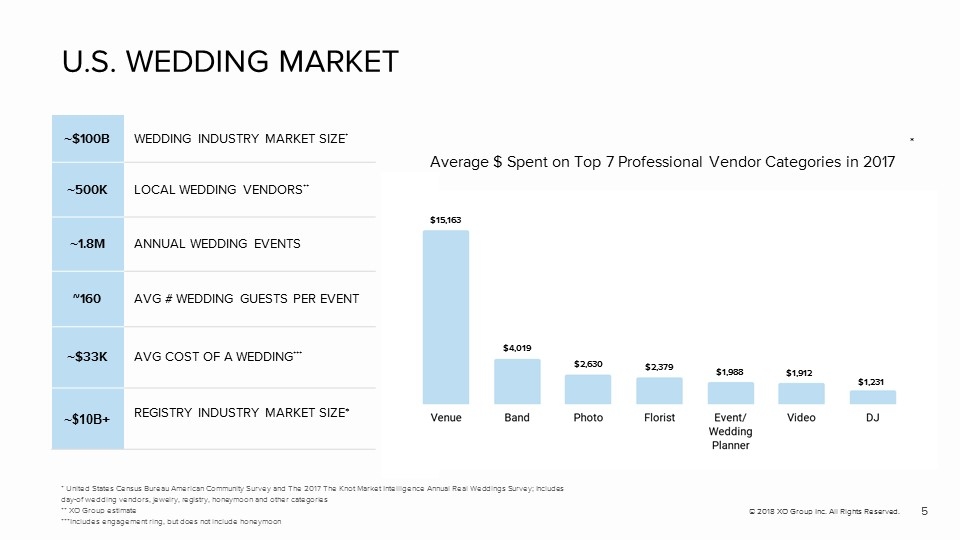
U.S. WEDDING MARKET * United States Census Bureau American Community Survey and The 2017 The Knot Market Intelligence Annual Real Weddings Survey ; I ncludes day - of wedding vendors, jewelry, registry, honeymoon and other categories ** XO Group estimate ***Includes engagement ring, but does not include honeymoon ~ $100B WEDDING INDUSTRY MARKET SIZE * ~ 500K LOCAL WEDDING VENDORS ** ~ 1.8M ANNUAL WEDDING EVENTS ~160 AVG # WEDDING GUESTS PER EVENT ~ $33K AVG COST OF A WEDDING *** ~$10B+ REGISTRY INDUSTRY MARKET SIZE* $15,163 $4,019 * $2,630 $2,379 $1,988 $1,912 $1,231 5 © 2018 XO Group Inc. All Rights Reserved. Average $ Spent on Top 7 Professional Vendor Categories in 2017
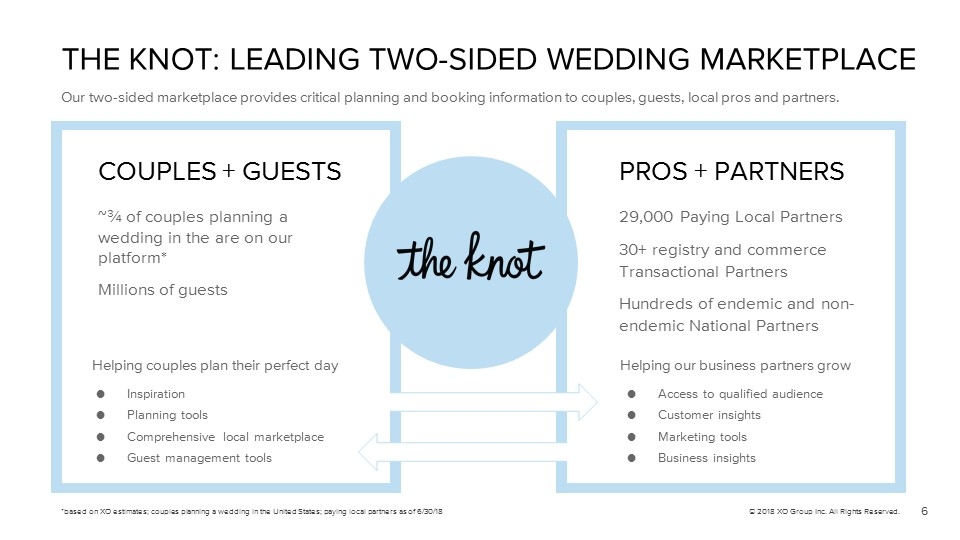
THE KNOT: LEADING TWO - SIDED WEDDING MARKETPLACE Our two - sided marketplace provides critical planning and booking information to couples, guests, local pros and partners. 6 © 2018 XO Group Inc. All Rights Reserved. *based on XO estimates; couples planning a wedding in the United States; paying local partners as of 6/30/18 ~¾ of couples planning a wedding in the are on our platform* Millions of guests ● Inspiration ● Planning tools ● Comprehensive local marketplace ● Guest management tools COUPLES + GUESTS Helping couples plan their perfect day 29,000 Paying Local Partners 30+ registry and commerce Transactional Partners Hundreds of endemic and non - endemic National Partners ● Access to qualified audience ● Customer insights ● Marketing tools ● Business insights PROS + PARTNERS Helping our business partners grow
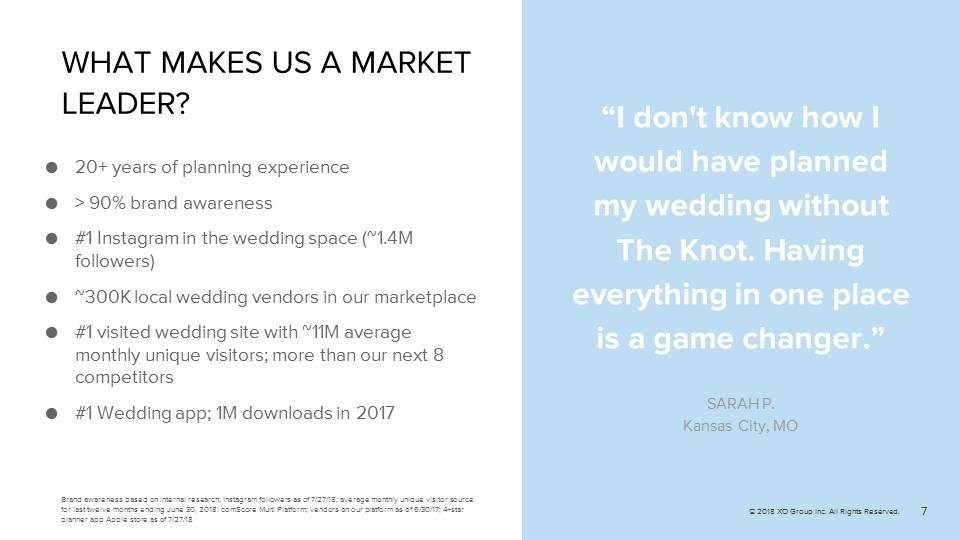
● 20+ years of planning experience ● > 90% brand awareness ● #1 Instagram in the wedding space (~1.4M followers) ● ~300K local wedding vendors in our marketplace ● #1 visited wedding site with ~11M average monthly unique visitors; more than our next 8 competitors ● #1 Wedding app; 1M downloads in 2017 WHAT MAKES US A MARKET LEADER? Brand awareness based on internal research; Instagram followers as of 7/27/18; average monthly unique visitor source for last twelve months ending June 30, 2018: comScore Multi Platform; vendors on our platform as of 6/30/17; 4+star planner app Apple store as of 7/27/18 7 © 2018 XO Group Inc. All Rights Reserved. “I don't know how I would have planned my wedding without The Knot. Having everything in one place is a game changer.” SARAH P. Kansas City, MO
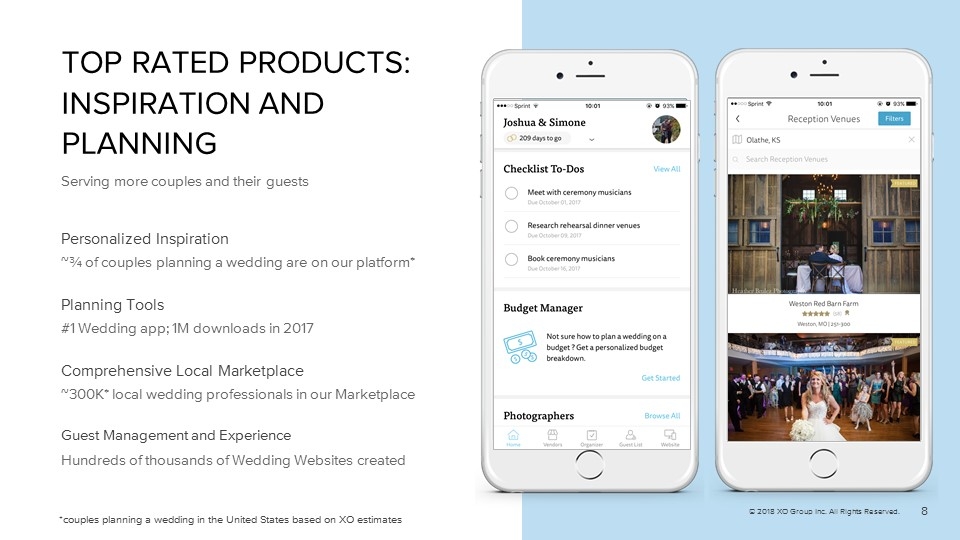
TOP RATED PRODUCTS: INSPIRATION AND PLANNING Serving more couples and their guests Personalized Inspiration ~¾ of couples planning a wedding are on our platform* Planning Tools #1 Wedding app; 1M downloads in 2017 Comprehensive Local Marketplace ~300K* local wedding professionals in our Marketplace Guest Management and Experience Hundreds of thousands of Wedding Websites created *couples planning a wedding in the United States based on XO estimates 8 © 2018 XO Group Inc. All Rights Reserved.
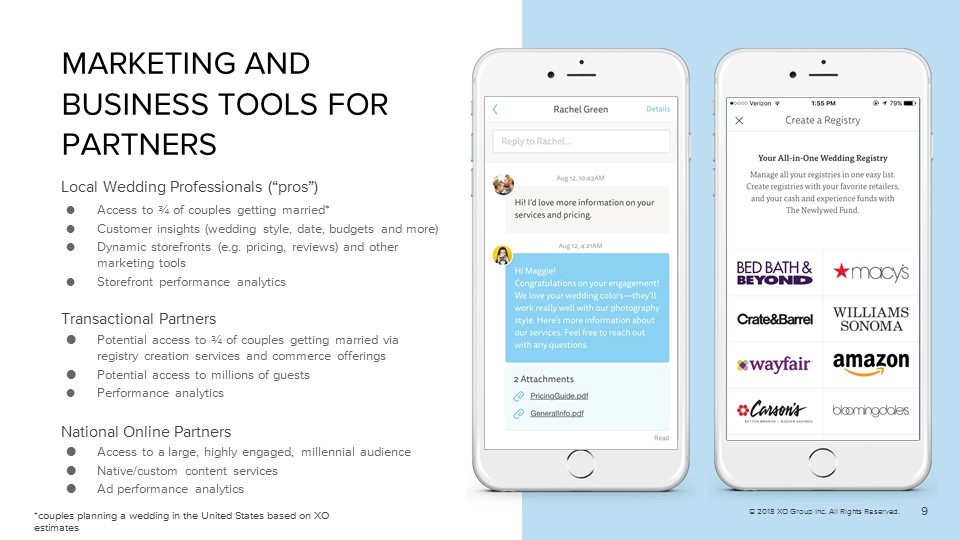
MARKETING AND BUSINESS TOOLS FOR PARTNERS *couples planning a wedding in the United States based on XO estimates 9 © 2018 XO Group Inc. All Rights Reserved. Local Wedding Professionals (“pros”) ● Access to ¾ of couples getting married* ● Customer insights (wedding style, date, budgets and more) ● Dynamic storefronts (e.g. pricing, reviews) and other marketing tools ● Storefront performance analytics Transactional Partners ● Potential access to ¾ of couples getting married via registry creation services and commerce offerings ● Potential access to millions of guests ● Performance analytics National Online Partners ● Access to a large, highly engaged, millennial audience ● Native/custom content services ● Ad performance analytics
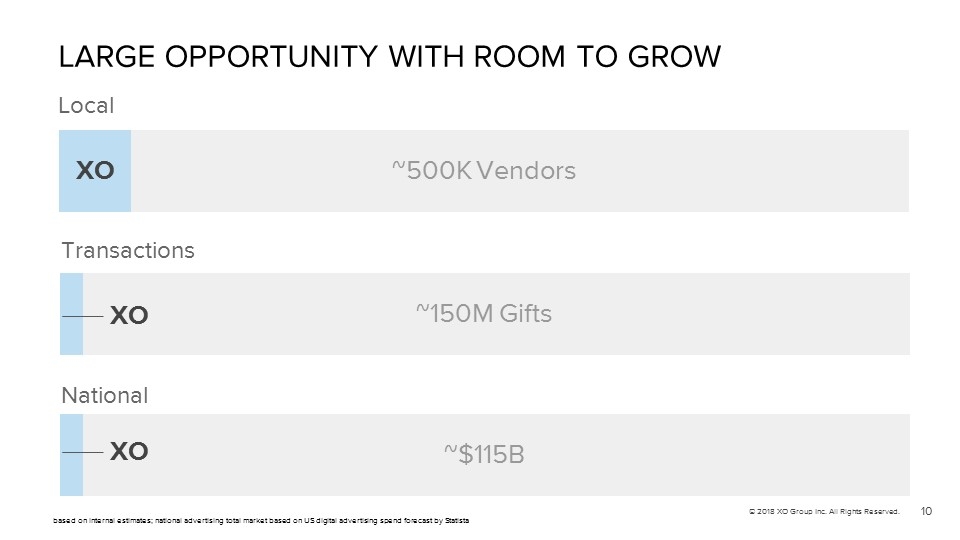
LARGE OPPORTUNITY WITH ROOM TO GROW ~500K Vendors ~150M Gifts Local Transactions XO 10 © 2018 XO Group Inc. All Rights Reserved. ~$115B National based on internal estimates; national advertising total market based on US digital advertising spend forecast by Statista XO XO

© 2018 XO Group Inc. All Rights Reserved. 11 ATTRACTIVE BUSINESS MODEL
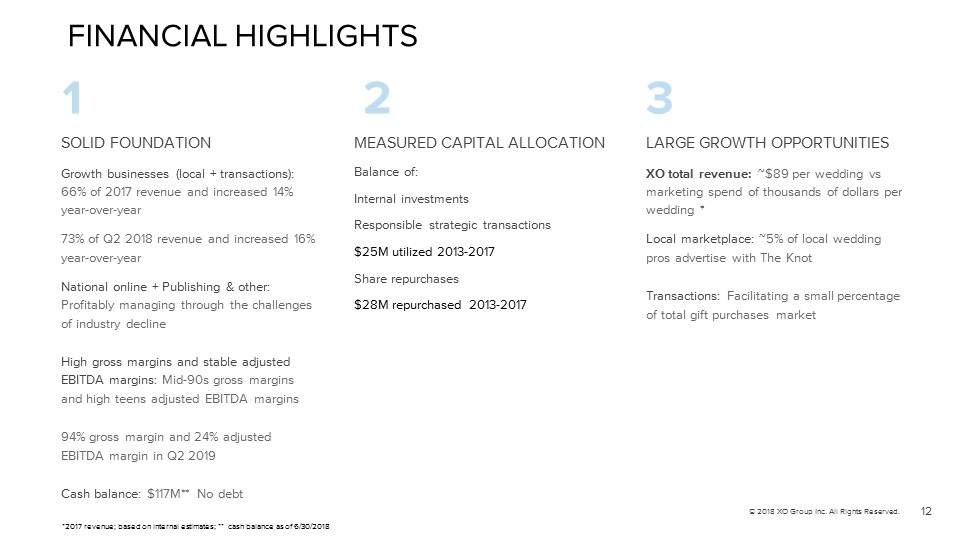
FINANCIAL HIGHLIGHTS 1 SOLID FOUNDATION Growth businesses (local + transactions): 66% of 2017 revenue and increased 14% year - over - year 73% of Q2 2018 revenue and increased 16% year - over - year National online + Publishing & other: Profitably managing through the challenges of industry decline High gross margins and stable adjusted EBITDA margins: Mid - 90s gross margins and high teens adjusted EBITDA margins 94% gross margin and 24% adjusted EBITDA margin in Q2 2019 Cash balance : $117M** No debt MEASURED CAPITAL ALLOCATION Balance of: Internal investments Responsible strategic transactions $25M utilized 2013 - 2017 Share repurchases $28M repurchased 2013 - 2017 LARGE GROWTH OPPORTUNITIES XO total revenue: ~$89 per wedding vs marketing spend of thousands of dollars per wedding * Local marketplace: ~5% of local wedding pros advertise with The Knot Transactions: Facilitating a small percentage of total gift purchases market 2 3 12 © 2018 XO Group Inc. All Rights Reserved. *2017 revenue; based on internal estimates; ** cash balance as of 6/30/2018
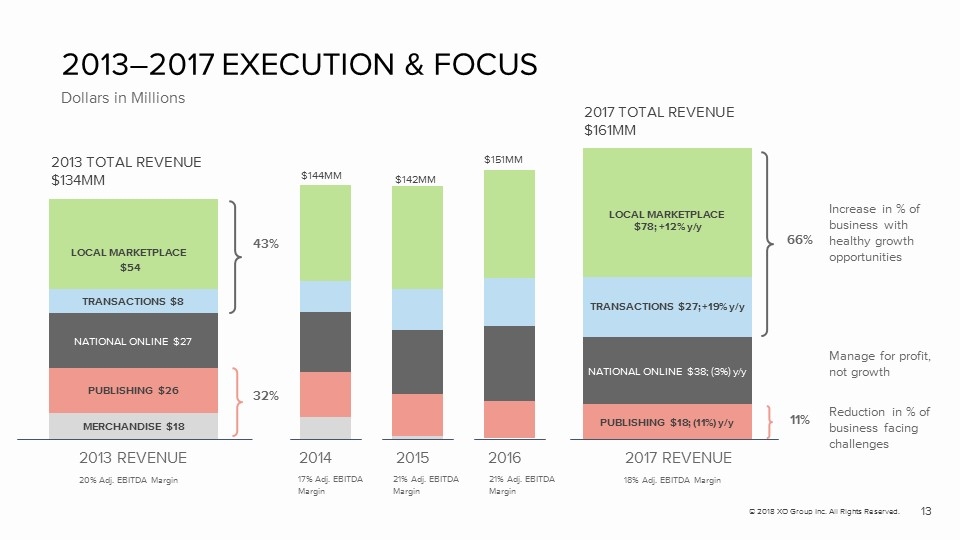
2013 – 2017 EXECUTION & FOCUS Dollars in Millions 2013 TOTAL REVENUE $134MM 2013 REVENUE 20% Adj. EBITDA Margin MERCHANDISE $18 PUBLISHING $26 NATIONAL ONLINE $27 2017 TOTAL REVENUE $161MM 2017 REVENUE 18% Adj. EBITDA Margin PUBLISHING $18; (11%) y/y NATIONAL ONLINE $38; (3%) y/y 11% 32% 43% 66% Increase in % of business with healthy growth opportunities LOCAL MARKETPLACE $54 TRANSACTIONS $8 Manage for profit, not growth Reduction in % of business facing challenges 13 © 2018 XO Group Inc. All Rights Reserved. TRANSACTIONS $27; +19% y/y 2014 2015 2016 17% Adj. EBITDA Margin 21% Adj. EBITDA Margin 21% Adj. EBITDA Margin $144MM $142MM $151MM LOCAL MARKETPLACE $78; +12% y/y
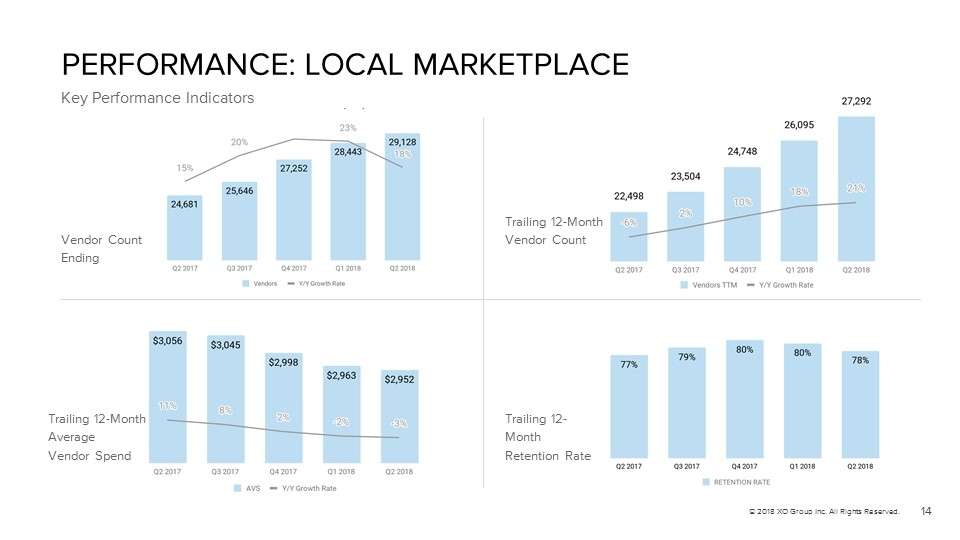
PERFORMANCE: LOCAL MARKETPLACE Key Performance Indicators 14 © 2018 XO Group Inc. All Rights Reserved. Trailing 12 - Month Vendor Count Trailing 12 - Month Average Vendor Spend Vendor Count Ending Trailing 12 - Month Retention Rate
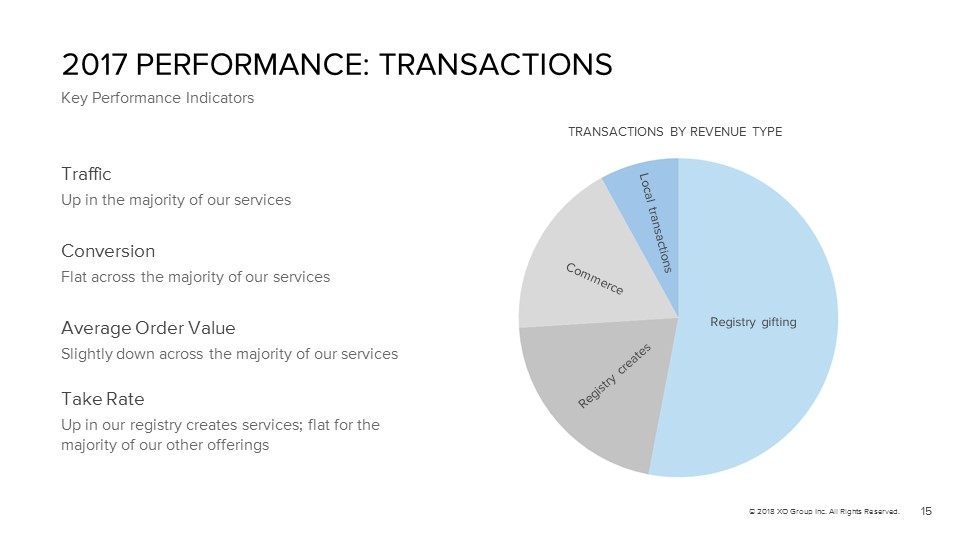
Traffic Up in the majority of our services Conversion Flat across the majority of our services Average Order Value Slightly down across the majority of our services Take Rate Up in our registry creates services; flat for the majority of our other offerings 2017 PERFORMANCE: TRANSACTIONS Key Performance Indicators 15 © 2018 XO Group Inc. All Rights Reserved. TRANSACTIONS BY REVENUE TYPE
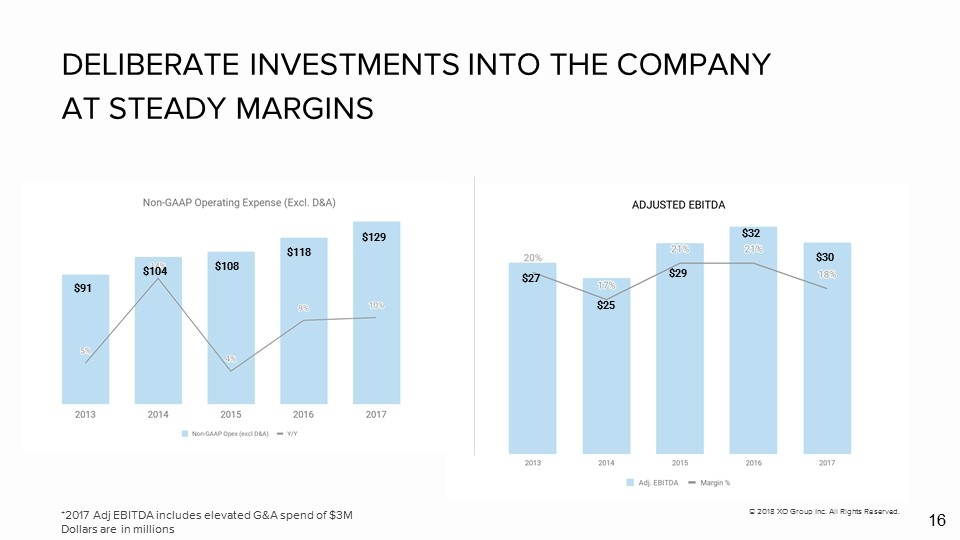
16 DELIBERATE INVESTMENTS INTO THE COMPANY AT STEADY MARGINS *2017 Adj EBITDA includes elevated G&A spend of $3M Dollars are in millions © 2018 XO Group Inc. All Rights Reserved. $91 $104 $108 $118 $129 $27 $25 $29 $32 $30
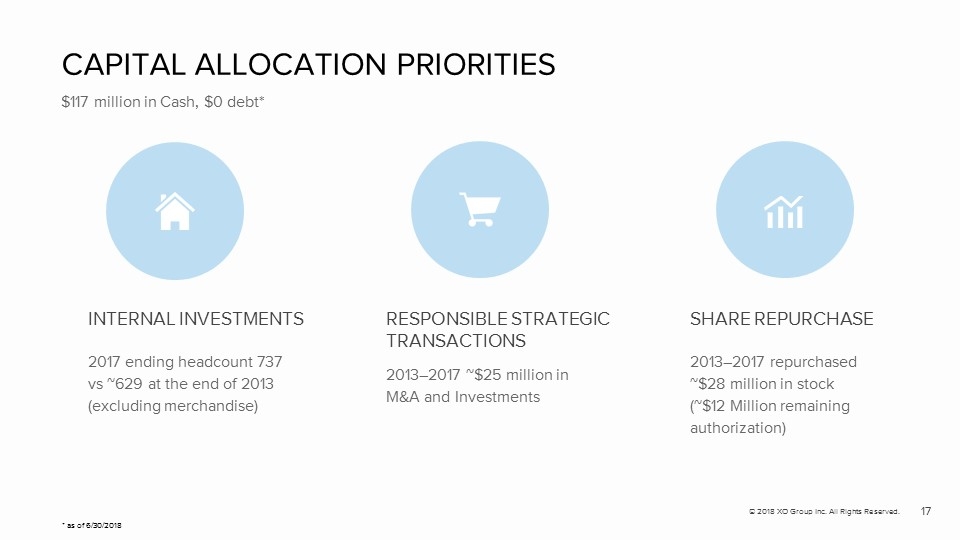
CAPITAL ALLOCATION PRIORITIES $117 million in Cash, $0 debt* INTERNAL INVESTMENTS 2017 ending headcount 737 vs ~629 at the end of 2013 (excluding merchandise) 2013 – 2017 ~$25 million in M&A and Investments 2013 – 2017 repurchased ~$28 million in stock (~$12 Million remaining authorization) RESPONSIBLE STRATEGIC TRANSACTIONS SHARE REPURCHASE 17 © 2018 XO Group Inc. All Rights Reserved. * as of 6/30/2018

LARGE GROWTH OPPORTUNITIES © 2017 XO Group Inc. All Rights Reserved. 18
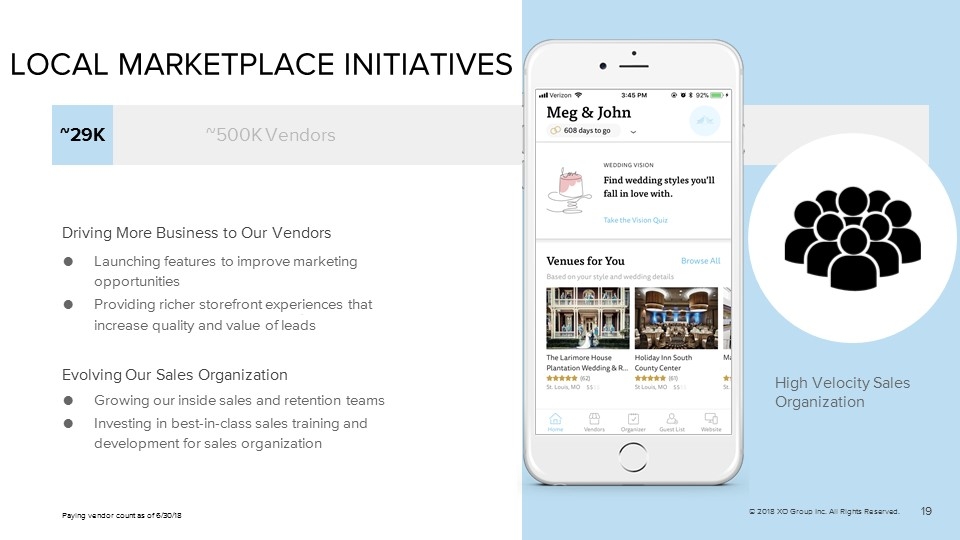
LOCAL MARKETPLACE INITIATIVES Evolving Our Sales Organization High Velocity Sales Organization Driving More Business to Our Vendors 19 © 2018 XO Group Inc. All Rights Reserved. ~29K ~500K Vendors ● Growing our inside sales and retention teams ● Investing in best - in - class sales training and development for sales organization ● Launching features to improve marketing opportunities ● Providing richer storefront experiences that increase quality and value of leads Paying vendor count as of 6/30/18

TRANSACTIONS INITIATIVES Optimizing Revenue - Generating 3rd Party Products/Services Facilitating connections between our couples and services providers (invitations, reception décor, hotel room blocks and more) Continuing to Enhance Our Registry and Newlywed Fund (Cash Registry) Offerings Connecting our couples with the right registry solution for them Strengthening Our Wedding Website Products Providing couples tools to make it easier for them to connect with their guests 20 © 2018 XO Group Inc. All Rights Reserved. ~150M Gifts
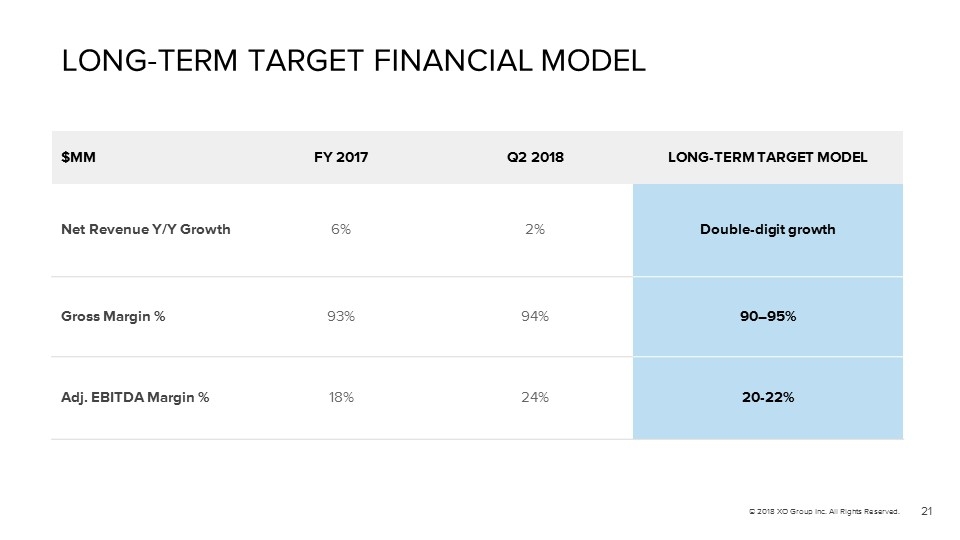
$MM FY 2017 Q2 2018 LONG - TERM TARGET MODEL Net Revenue Y/Y Growth 6% 2% Double - digit growth Gross Margin % 93% 94% 90 – 95% Adj. EBITDA Margin % 18% 24% 20 - 22% LONG - TERM TARGET FINANCIAL MODEL 21 © 2018 XO Group Inc. All Rights Reserved.
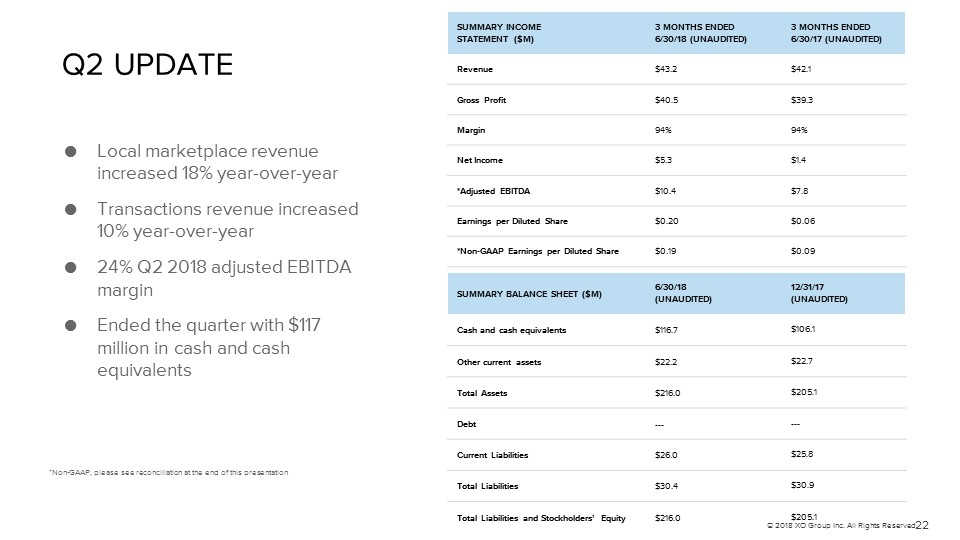
SUMMARY INCOME STATEMENT ($M) 3 MONTHS ENDED 6/30/18 (UNAUDITED) 3 MONTHS ENDED 6/30/17 (UNAUDITED) Revenue $43.2 $42.1 Gross Profit $40.5 $39.3 Margin 94% 94% Net Income $5.3 $1.4 *Adjusted EBITDA $10.4 $7.8 Earnings per Diluted Share $0.20 $0.06 *Non - GAAP Earnings per Diluted Share $0.19 $0.09 Q2 UPDATE *Non - GAAP, please see reconciliation at the end of this presentation SUMMARY BALANCE SHEET ($M) 6/30/18 (UNAUDITED) 12/31/17 (UNAUDITED) Cash and cash equivalents $116.7 $106.1 Other current assets $22.2 $22.7 Total Assets $216.0 $205.1 Debt --- --- Current Liabilities $26.0 $25.8 Total Liabilities $30.4 $30.9 Total Liabilities and Stockholders’ Equity $216.0 $205.1 ● Local marketplace revenue increased 18% year - over - year ● Transactions revenue increased 10% year - over - year ● 24% Q2 2018 adjusted EBITDA margin ● Ended the quarter with $117 million in cash and cash equivalents © 2018 XO Group Inc. All Rights Reserved. 22
Market opportunity is large and unique INVESTMENT HIGHLIGHTS © 2018 XO Group Inc. All Rights Reserved. 23 XO Group has an attractive business model XO Group is positioned to capture large growth opportunities 1 2 3

QUESTIONS? Please contact IR@xogrp.com 24 © 2018 XO Group Inc. All Rights Reserved.

RECONCILIATION OF GAAP TO NON - GAAP FINANCIAL MEASURES (UNAUDITED) 25 © 2018 XO Group Inc. All Rights Reserved.
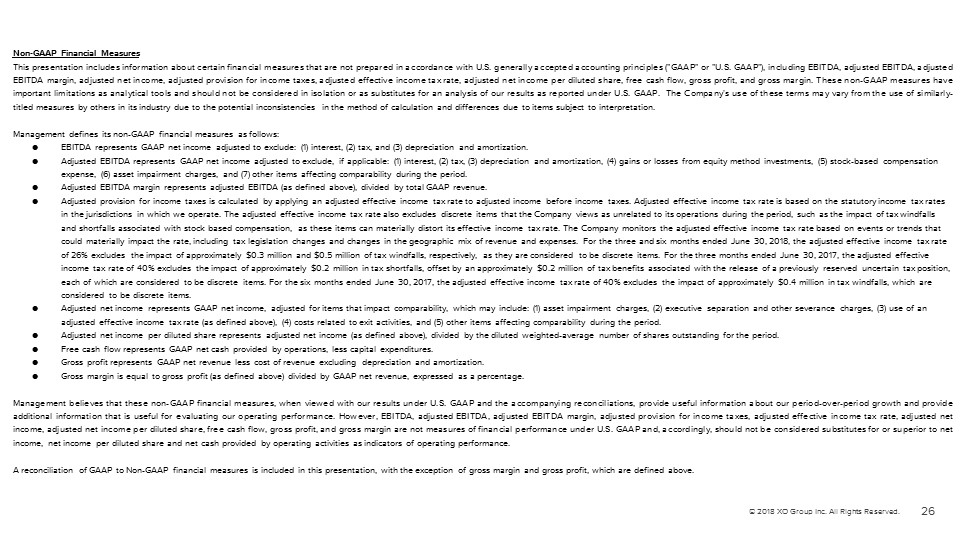
Non - GAAP Financial Measures This presentation includes information about certain financial measures that are not prepared in accordance with U . S . generally accepted accounting principles ("GAAP" or "U . S . GAAP"), including EBITDA, adjusted EBITDA, adjusted EBITDA margin, adjusted net income, adjusted provision for income taxes, adjusted effective income tax rate, adjusted net income per diluted share, free cash flow, gross profit, and gross margin . These non - GAAP measures have important limitations as analytical tools and should not be considered in isolation or as substitutes for an analysis of our results as reported under U . S . GAAP . The Company's use of these terms may vary from the use of similarly - titled measures by others in its industry due to the potential inconsistencies in the method of calculation and differences due to items subject to interpretation . Management defines its non - GAAP financial measures as follows: ● EBITDA represents GAAP net income adjusted to exclude: (1) interest, (2) tax, and (3) depreciation and amortization. ● Adjusted EBITDA represents GAAP net income adjusted to exclude, if applicable: (1) interest, (2) tax, (3) depreciation and am ort ization, (4) gains or losses from equity method investments, (5) stock - based compensation expense, (6) asset impairment charges, and (7) other items affecting comparability during the period. ● Adjusted EBITDA margin represents adjusted EBITDA (as defined above), divided by total GAAP revenue. ● Adjusted provision for income taxes is calculated by applying an adjusted effective income tax rate to adjusted income before in come taxes. Adjusted effective income tax rate is based on the statutory income tax rates in the jurisdictions in which we operate. The adjusted effective income tax rate also excludes discrete items that the Compan y v iews as unrelated to its operations during the period, such as the impact of tax windfalls and shortfalls associated with stock based compensation, as these items can materially distort its effective income tax rate. Th e Company monitors the adjusted effective income tax rate based on events or trends that could materially impact the rate, including tax legislation changes and changes in the geographic mix of revenue and expenses . F or the three and six months ended June 30, 2018, the adjusted effective income tax rate of 26% excludes the impact of approximately $0.3 million and $0.5 million of tax windfalls, respectively, as they are conside red to be discrete items. For the three months ended June 30, 2017, the adjusted effective income tax rate of 40% excludes the impact of approximately $0.2 million in tax shortfalls, offset by an approximately $0.2 m ill ion of tax benefits associated with the release of a previously reserved uncertain tax position, each of which are considered to be discrete items. For the six months ended June 30, 2017, the adjusted effective income tax rat e of 40% excludes the impact of approximately $0.4 million in tax windfalls, which are considered to be discrete items. ● Adjusted net income represents GAAP net income, adjusted for items that impact comparability, which may include: (1) asset im pai rment charges, (2) executive separation and other severance charges, (3) use of an adjusted effective income tax rate (as defined above), (4) costs related to exit activities, and (5) other items affecting co mpa rability during the period. ● Adjusted net income per diluted share represents adjusted net income (as defined above), divided by the diluted weighted - average number of shares outstanding for the period. ● Free cash flow represents GAAP net cash provided by operations, less capital expenditures. ● Gross profit represents GAAP net revenue less cost of revenue excluding depreciation and amortization. ● Gross margin is equal to gross profit (as defined above) divided by GAAP net revenue, expressed as a percentage. Management believes that these non - GAAP financial measures, when viewed with our results under U . S . GAAP and the accompanying reconciliations, provide useful information about our period - over - period growth and provide additional information that is useful for evaluating our operating performance . However, EBITDA, adjusted EBITDA, adjusted EBITDA margin, adjusted provision for income taxes, adjusted effective income tax rate, adjusted net income, adjusted net income per diluted share, free cash flow, gross profit, and gross margin are not measures of financial performance under U . S . GAAP and, accordingly, should not be considered substitutes for or superior to net income, net income per diluted share and net cash provided by operating activities as indicators of operating performance . A reconciliation of GAAP to Non - GAAP financial measures is included in this presentation, with the exception of gross margin and gross profit, which are defined above . 26 © 2018 XO Group Inc. All Rights Reserved.
27 © 2018 XO Group Inc. All Rights Reserved.
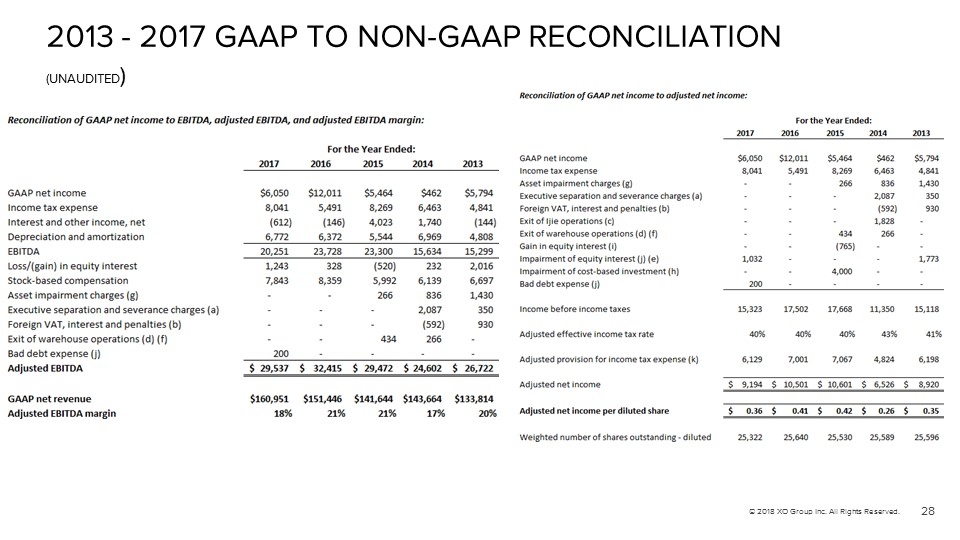
2013 - 2017 GAAP TO NON - GAAP RECONCILIATION (UNAUDITED ) 28 © 2018 XO Group Inc. All Rights Reserved.
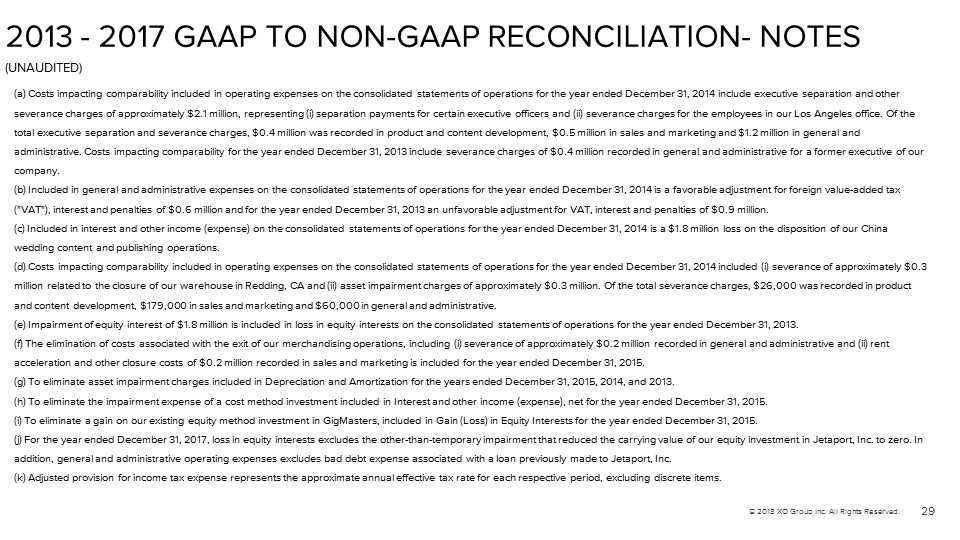
2013 - 2017 GAAP TO NON - GAAP RECONCILIATION - NOTES (UNAUDITED) 29 © 2018 XO Group Inc. All Rights Reserved. (a) Costs impacting comparability included in operating expenses on the consolidated statements of operations for the year en ded December 31, 2014 include executive separation and other severance charges of approximately $2.1 million, representing (i) separation payments for certain executive officers and (ii) se verance charges for the employees in our Los Angeles office. Of the total executive separation and severance charges, $0.4 million was recorded in product and content development, $0.5 million in sales and marketing and $1.2 million in general and administrative. Costs impacting comparability for the year ended December 31, 2013 include severance charges of $0.4 million rec orded in general and administrative for a former executive of our company. (b) Included in general and administrative expenses on the consolidated statements of operations for the year ended December 31, 2014 is a favorable adjustment for foreign value - added tax ("VAT"), interest and penalties of $0.6 million and for the year ended December 31, 2013 an unfavorable adjustment for VAT, i nte rest and penalties of $0.9 million. (c) Included in interest and other income (expense) on the consolidated statements of operations for the year ended December 31, 2014 is a $1.8 million loss on the disposition of our China wedding content and publishing operations. (d) Costs impacting comparability included in operating expenses on the consolidated statements of operations for the year en ded December 31, 2014 included (i) severance of approximately $0.3 million related to the closure of our warehouse in Redding, CA and (ii) asset impairment charges of approximately $0.3 millio n. Of the total severance charges, $26,000 was recorded in product and content development, $179,000 in sales and marketing and $60,000 in general and administrative. (e) Impairment of equity interest of $1.8 million is included in loss in equity interests on the consolidated statements of o per ations for the year ended December 31, 2013. (f) The elimination of costs associated with the exit of our merchandising operations, including (i) severance of approximate ly $0.2 million recorded in general and administrative and (ii) rent acceleration and other closure costs of $0.2 million recorded in sales and marketing is included for the year ended December 31, 2015. (g) To eliminate asset impairment charges included in Depreciation and Amortization for the years ended December 31, 2015, 20 14, and 2013. (h) To eliminate the impairment expense of a cost method investment included in Interest and other income (expense), net for the year ended December 31, 2015. (i) To eliminate a gain on our existing equity method investment in GigMasters, included in Gain (Loss) in Equity Interests f or the year ended December 31, 2015. (j) For the year ended December 31, 2017, loss in equity interests excludes the other - than - temporary impairment that reduced the carrying value of our equity investment in Jetaport, Inc. to zero. In addition, general and administrative operating expenses excludes bad debt expense associated with a loan previously made to J eta port, Inc. (k) Adjusted provision for income tax expense represents the approximate annual effective tax rate for each respective period , e xcluding discrete items.
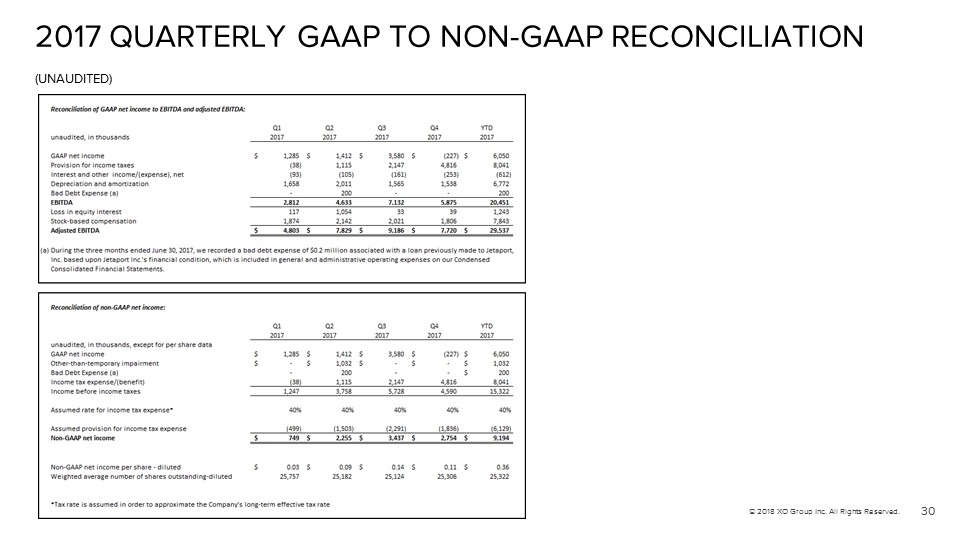
2017 QUARTERLY GAAP TO NON - GAAP RECONCILIATION (UNAUDITED) 30 © 2018 XO Group Inc. All Rights Reserved.