Attached files
| file | filename |
|---|---|
| EX-32.1 - EXHIBIT 32.1 - XO GROUP INC. | ex321123114.htm |
| EX-31.1 - EXHIBIT 31.1 - XO GROUP INC. | ex311123114.htm |
| EX-32.2 - EXHIBIT 32.2 - XO GROUP INC. | ex322123114.htm |
| EX-31.2 - EXHIBIT 31.2 - XO GROUP INC. | ex312123114.htm |
| EX-21.1 - EXHIBIT 21.1 - XO GROUP INC. | ex211123114.htm |
| EX-23.1 - EXHIBIT 23.1 - XO GROUP INC. | ex231123114.htm |
| EXCEL - IDEA: XBRL DOCUMENT - XO GROUP INC. | Financial_Report.xls |
UNITED STATES
SECURITIES AND EXCHANGE COMMISSION
Washington, D.C. 20549
______________________
FORM 10-K
______________________
ý | ANNUAL REPORT PURSUANT TO SECTION 13 OR 15(d) OF THE SECURITIES EXCHANGE ACT OF 1934 |
For the Fiscal Year Ended December 31, 2014
OR
o | TRANSITION REPORT PURSUANT TO SECTION 13 OR 15(d) OF THE SECURITIES EXCHANGE ACT OF 1934 |
Commission File Number 000-28271
____________________________
XO GROUP INC.
(Exact Name of Registrant as Specified in Its Charter)
Delaware | 13-3895178 |
(State or Other Jurisdiction of Incorporation or Organization) | (I.R.S. Employer Identification Number) |
195 Broadway, 25th Floor
New York, New York 10007
(Address of Principal Executive Offices and Zip Code)
(212) 219-8555
(Registrant’s Telephone Number, Including Area Code)
Securities registered pursuant to Section 12(b) of the Act:
Title of Each Class | Name of Each Exchange on which Registered | |
Common Stock, par value $0.01 per share | New York Stock Exchange | |
Securities registered pursuant to Section 12(g) of the Act: None
Indicate by check mark if the registrant is a well-known seasoned issuer, as defined in Rule 405 of the Securities Act.Yes o No ý
Indicate by check mark if the registrant is not required to file reports pursuant to Section 13 or Section 15(d) of the Exchange Act. Yes o No ý
Indicate by check mark whether the registrant: (1) has filed all reports required to be filed by Section 13 or 15(d) of the Securities Exchange Act of 1934 during the preceding 12 months (or for such shorter period that the registrant was required to file such reports), and (2) has been subject to such filing requirements for the past 90 days. Yes ý No o
Indicate by check mark whether the registrant has submitted electronically and posted on its corporate Web site, if any, every Interactive Data File required to be submitted and posted pursuant to Rule 405 of Regulation S-T during the preceding 12 months (or for such shorter period that the registrant was required to submit and post such files). Yes ý No o
Indicate by check mark if disclosure of delinquent filers pursuant to Item 405 of Regulation S-K is not contained herein, and will not be contained, to the best of registrant’s knowledge, in definitive proxy or information statements incorporated by reference in Part III of this Form 10-K or any amendment to this Form 10-K o
Indicate by check mark whether the registrant is a large accelerated filer, an accelerated filer, a non-accelerated filer, or a smaller reporting company. See definition of “large accelerated filer”, “accelerated filer” and “smaller reporting company” in Rule 12b-2 of the Exchange Act. (Check one):
Large Accelerated Filer o | Accelerated Filer x |
Non-Accelerated Filer o (Do not check if a smaller reporting company) | Smaller Reporting Company o |
Indicate by check mark whether the registrant is a shell company (as defined in Rule 12b-2 of the Exchange Act).Yes o No ý
The aggregate market value of voting common stock held by non-affiliates of the registrant as of June 30, 2014 was approximately $267,041,986. The number of shares outstanding of the registrant’s common stock as of March 5, 2015 was 26,232,763. The registrant does not have any non-voting stock outstanding.
DOCUMENTS INCORPORATED BY REFERENCE
Portions of the registrant’s definitive proxy statement for the 2015 Annual Meeting of Stockholders, which we plan to file subsequent to the date hereof, are incorporated by reference into Part III.
XO GROUP INC.
2014 FORM 10-K ANNUAL REPORT
TABLE OF CONTENTS
Page | |
i
SPECIAL NOTE ON FORWARD-LOOKING STATEMENTS
This report contains forward-looking statements relating to future events and the future performance of XO Group Inc. based on our current expectations, assumptions, estimates and projections about us and our industry. The statements contained in this Annual Report on Form 10-K that are not purely historical facts are forward-looking statements within the meaning of Section 27A of the Securities Act of 1933, as amended, or the Securities Act, and Section 21E of the Securities Exchange Act of 1934, as amended, or the Exchange Act. These forward-looking statements can be identified by the use of forward-looking terminology such as “may,” “should,” “expect,” “intend,” “estimate,” “are positioned to,” “continue,” “project,” “guidance,” “target,” “forecast,” “anticipated” or comparable terms.
These forward-looking statements involve risks and uncertainties. Our actual results or events could differ materially from those anticipated in such forward-looking statements as a result of certain factors, as more fully described in Item 1A (Risk Factors) and elsewhere in this report. We undertake no obligation to update publicly any forward-looking statements for any reason, even if new information becomes available or other events occur in the future.
ii
Unless the context otherwise indicates, references in this report to the terms “XO Group,” the “Company,” “we,” “our” and “us” refer to XO Group Inc., its divisions and its subsidiaries.
PART I
Item 1. Business.
Company Overview
Our mission is to help people navigate and truly enjoy life’s biggest moments, together. Our multi-platform brands guide couples through transformative life stages - from getting married, to moving in together and having a baby - and include The Knot (#1 wedding planning resource), The Bump, (a leading pregnancy and parenting brand), and The Nest (the hip guide to all things home for new couples).
The Knot. The Knot is the nation’s leading wedding resource reaching couples through its #1 wedding website and mobile apps, national and local wedding magazines and nationally published books. Based on ComScore data, our Knot Wedding Network Websites generate more unique visitors than the next top three competitors combined. The Knot is the flagship brand of XO Group Inc., providing the trusted information and tools to inspire, plan and connect couples with the right vendors to pull off their perfectly unique wedding. As the creator of leading wedding apps, we are frequently featured in the Apple App Store and have thousands of daily app downloads. By our estimates, we have inspired over 25 million couples during their wedding process. Based on research conducted by our internal team, including The Knot Market Intelligence’s Annual Real Wedding Survey, we estimate the spend associated with weddings, including payment to vendors who fulfill day of wedding needs, engagement rings, and registry gifts, totals approximately $70 billion.
The Bump. The Bump is a leading pregnancy and parenting brand, providing personalized information, content and tools for anyone at any stage of their journey from fertility to pregnancy and parenting through the toddler years. The Bump reaches millions of expectant and new parents across its seamless web and mobile experience, plus through its localized print magazines. The Bump has twice earned a post in Forbes’ Top 100 Best Websites for Women. The Bump Baby iOS app was a “Best New App” and our apps are frequently highlighted as best in its category in the Apple App Store. Based on information from the NCHS National Vital Health Statistics Reports and the United States Department of Agriculture, we estimate total annual spend on children ages 0-2 to be approximately $60 billion.
The Nest. The Nest is the only brand focused exclusively on young nesters setting up homes and navigating new lives together. The site takes a hip, how-to approach to all things “grown up”: merging finances, buying and decorating homes, entertaining and more through content, expert Q&As, online community and interactive tools.
Services
XO Group offers consumer internet multiplatform media services to the wedding, pregnancy and parenting, and nesting markets. We reach our audience through several platforms, including online properties, mobile applications, magazines and books, and television and video, which are available for all brands, with the exception of mobile applications, television and magazines for our Nest brand.
We create value for our consumers, advertisers, and partners by delivering relevant and personalized solutions at key decision making moments for some of life’s proudest and happiest events. We have a large, replenishing and highly motivated audience that drives over $130 billion in spend across the life stages we service (including weddings, honeymoons, registries, and adding a child to a household). We generate revenue through four distinct and diversified products:
National Online Advertising. Our national digital advertising products include, but are not limited to, sponsored and brand-integrated content, digital banner advertisements, native banner advertising, and direct e-mail marketing. National online advertising is 21.2% of our consolidated revenue.
Local Online Advertising. Our local products include, but are not limited to, digital advertisements and direct e-mail marketing. At December 31, 2014, our platforms hosted over 250,000 free and paid local profile listings in more than 80 local markets highlighting offerings for over 30 categories of wedding planning services. We ended 2014 with more than 24,700 paying vendors, spending an average of $2,527 per year. Local online advertising is 41.1% of our consolidated revenue.
Registry and Commerce. Our website allows couples the opportunity to create, manage and share multiple retail store registries from a single source. For our commerce partners, we identify and integrate product and service providers that address
1
our couples' needs, such as invitations and stationery, reception decor and personalized gifts, and health and beauty. We receive advertising spend and commission payments from sales that we generate through our sites, email and mobile apps. Registry services represent 6.8% of our consolidated revenue, while merchandising and commerce services represent 11.3% of our consolidated revenue.
Publishing and Other. We publish traditional magazines for our flagship brand, The Knot, and our pregnancy and parenting brand, The Bump. The Knot Weddings has a national imprint published four times a year, and a regional imprint published semi-annually in 17 U.S. markets. The Bump magazine is distributed semi-annually through OB/GYN offices in 20 U.S. markets. Each magazine provides original, expert-driven content in the brand’s signature voice, driving readers back to the digital assets for an interactive experience and additional connections and services. Publishing and other is 19.6% of our consolidated revenue.
In addition to the services described above, we have wedding merchandising operations fulfilling orders from our warehouse facility in Redding, California. After reviewing the past and expected financial performance of the operations, in October 2014, we committed to a plan to cease operations at our warehouse in Redding, California. The process of the warehouse closure is expected to be completed by end of the first quarter of 2015. We intend to continue to serve the commerce needs of our users through our registry and partner-based models.
Furthermore, from 2010 to 2014, we operated a wedding content and publishing business in China. During 2014, we determined an expansion of the content and publishing business into China was no longer in our or our stockholders best interest. In December of 2014, we completed the disposition of our China wedding content and publishing operations (Ijie).
Strategy
Our strategy is to pursue the following initiatives:
Expand Local Marketplace: In order to fully capitalize on our leading brand position and offer greater value to our audience and local vendor partners, we are taking steps to evolve the marketplace characteristics of our business. The advancements include:
• | User-centric, mobile-first, industry-leading apps and websites that engage and delight our users; |
• | A comprehensive directory of quality vendor/services listings; |
• | Personalized matches and enhanced methods of discovery; and |
• | Tools to better connect our users and vendors. |
Grow The Bump: As a growing player in the baby space we are launching new technologies to drive growth. In 2014, we embarked on an effort to re-architect our website and mobile applications, shifting from a portal experience to a feed of relevant content, community, and tools personalized to the age and stage of the pregnancy and baby. We feel these investments will position us to continue to grow our audience and attract new advertisers and baby registry partners.
Grow Registry and Partner Based Commerce: We are focused on helping business partners develop and offer quality, relevant solutions for our couples during their wedding or baby planning journey. As part of this strategy, we are increasing the number and categories of partners we work with and optimizing how and when we present these solutions to our couples in order to maximize conversion.
Maintain Steady Growth Rates in Publishing: Our goal is to drive a moderate growth rate in this revenue stream by continuing to offer best in class editorial content and beautifully designed publications that highlight our advertising partner’s offerings.
Continuously Examine Our Business: During 2014, we made certain decisions that focused the organization on opportunities that we believe are positioned to deliver value to stakeholders. These decisions included the exit of our warehouse operations and the disposition of our China content and publishing operations, Ijie. These actions may reduce our revenue in 2015 but we feel they position us for more profitable growth in the long term. Going forward, we will pursue opportunities that we feel show clear paths to creating value for our stakeholders.
Pursue Measured Capital Allocation: Our capital allocation strategy balances internal investments, strategic investments, mergers and acquisitions, and share repurchases.
2
Competition
We compete with local marketplaces, general market media and internet companies, and wedding and baby media and internet companies. We expect ongoing competition because of the size of the markets we serve and business opportunities presented by the growth of the internet and e-commerce. Competition may also intensify as a result of industry consolidation and a lack of substantial barriers to entry in our market.
Infrastructure and Technology
Our technology infrastructure provides for continuous availability of our online services. There are four major components to our online services comprised of our web, domain name service (“DNS”), network infrastructure and database servers. Our web, DNS servers and network infrastructure allow for the failure of multiple components with minimal or no effect expected on site operations. We have multiple database servers along with data caching serving various parts of our sites, allowing us to segregate parts of the sites for maintenance and upgrades.
Our operation is dependent on the ability to maintain our computer and telecommunications system in effective working order and to protect our systems against damage from fire, theft, natural disaster, power loss, telecommunications failure or similar events. A portion of our systems hardware is located at a third-party facility in Austin, Texas, and a second failover site with matching capabilities in Scottsdale, Arizona. The data centers are network-connected and application data is replicated from Austin to Scottsdale on a continuous basis. We have similar capacity in China for our software development operations there. Additionally, some of our production applications are on the Amazon Web Services Cloud (AWS). Our operations depend, in part, on the ability of these third parties to protect their own systems and our systems from similar unexpected adverse events. These third parties provide us with auxiliary power through the use of battery and diesel generators in the event of an unexpected power outage. We maintain multiple backups of our data, allowing us to quickly recover from any disaster. Additionally, at least once a week, copies of backup tapes are sent to off-site storage.
Regular capacity planning allows us to upgrade existing hardware and integrate new hardware to react quickly to a rapidly expanding member base and increased traffic to our sites. Our systems generally operate at 99% uptime. We employ several layers of security to protect data transmission and prevent unauthorized access. We keep all of our production servers behind firewalls. We do not allow direct outside access, and we enforce strict password management and physical security measures. We monitor all systems continuously, and emergency response teams respond to all alerts. We have also contracted the services of an outside company to independently monitor the site to help ensure that the site is available. E-commerce transactions employ secure socket layer encryption to secure payment card information between clients and servers. Payment card information is never shared with outside parties, and we provide shoppers with a toll free number to place orders by phone as an alternative to completing a transaction online. We adhere to industry standard best practices for security and privacy of payment card information and other personal financial data.
Seasonality
We believe that the impact of the frequency of weddings varying from quarter to quarter results in lower registry services and merchandise revenues in the first and fourth quarters. Our publishing business typically experiences a quarter to quarter revenue decline in the first and third quarters due to the cyclical pattern of our regional publishing schedule. We could experience seasonal fluctuations in results as a result of our e-commerce transition.
Government Regulation
We are subject to a number of laws and regulations that apply to e-commerce, online services, and the internet generally. Such laws address a range of issues, such as user privacy, freedom of expression, unsolicited commercial e-mail (spam), pricing, content and quality of services and products, taxation, advertising, intellectual property rights, net neutrality, information and cybersecurity, and restrictions or technological requirements regarding the collection, use, storage, protection or transfer of consumer data. For example, the U.S. Federal Trade Commission and other state and federal regulatory agencies’ and private litigants’ investigation and enforcement of privacy and cybersecurity practices of companies that collect, use, store and transfer information about individuals on the internet has intensified with respect to issues around the collection, use, storage and transfer of consumer information, web browsing and geolocation data collection, data analytics and cybersecurity and breach notification procedures. Regulators and industry groups have also released self-regulatory principles and guidelines for various data privacy and security practices. Interpretation of these laws and guidelines and their application to online services in the U.S. and foreign jurisdictions is ongoing, and cannot be fully determined at this time. These laws and guidelines could be interpreted or applied in a manner that is not consistent with our current business practices, which could cause significant negative publicity, require us to incur substantial compliance costs, and subject us to inquiries or investigations,
3
claims or other remedies, including fines or demands that we modify or cease existing business practices, and otherwise materially affect our business. It is also possible that new laws or regulations may be adopted, which could harm our business.
Because our services are accessible worldwide, certain foreign jurisdictions may claim that we are required to comply with their laws, even if we do not have a local entity, employees or infrastructure. The international regulatory environment relating to e-commerce, online services and the Internet more generally, could have a material and adverse effect on our business, subject us to government investigations and litigation, and affect results of operations and financial condition since we operate internationally. In particular, for example, the European Union and many countries within the European Union have adopted and are developing data privacy protection and security directives relating to the collection, use, storage and transfer of data that are more stringent than in the United States. The cost of compliance with any applicable laws could be material, and we may not be able to comply with them in a timely or cost-effective manner, if at all. We monitor pending legislation and regulatory initiatives to ascertain relevance, analyze impact and develop strategic direction surrounding regulatory trends and developments.
Privacy concerns in general may cause visitors to avoid online sites that collect behavioral information and even the perception of security and privacy concerns, whether valid or not, may indirectly inhibit market acceptance of our services. In addition, if our privacy practices are deemed unacceptable by watchdog groups or privacy advocates, such groups may attempt to harm our business by blocking access to our sites or disparaging our reputation and our business, which may have a material effect on our results of operations and financial condition. We may also be subject to claims of liability or responsibility for the actions of third parties with whom we interact or upon whom we rely in relation to various services, including but not limited to vendors and business partners. These third parties may be vulnerable, for example, to threats such as computer hacking, cyber-terrorism or other unauthorized attempts to access, modify or delete our or our customers' information or business assets that they service or maintain on our behalf. In addition, applicability to the Internet of existing laws governing issues such as, for example, property ownership, copyrights and other intellectual property issues, taxation, libel, obscenity, net neutrality, privacy and data security is uncertain. It is uncertain how such existing laws may apply to or address the unique issues of the internet and related technologies. Any new legislation or regulation regarding the internet or the application of existing laws and regulations to the internet could harm us.
Compliance with any applicable domestic or international laws could also delay or impede the development of new products, result in negative publicity, increase our operating costs, require significant management time and attention, or subject us to inquiries, investigations or lawsuits, claims or other remedies, including fines or demands that we modify or cease existing business practices. In addition, changes to existing laws or their interpretation or the passage of new laws could create uncertainty in the marketplace that could reduce demand for our services or increase the cost of doing business as a result of litigation costs or increased service delivery costs, or could in some other manner have a material adverse effect on our business, results of operations and financial condition.
Intellectual Property and Proprietary Rights
We rely on a combination of trade secrets, copyrights, trademarks, trade dress, domain names and patents to protect our intellectual property. We own a portfolio of patents and patent applications in the United States and regularly file patent applications to protect intellectual property that we believe is important to our business, including intellectual property related to gift registry systems and methods. We believe the duration of our patents is adequate relative to the expected lives of our products and services. We pursue the registration of our domain names, trademarks and tradenames in the United States and in certain locations outside the United States. Our portfolio of trademarks and tradenames include “The Knot”, “The Bump” and “The Nest” as well as others. We also own copyrights, including certain content in our websites, publications and designs on certain of our products. These intellectual property rights are important to our business and marketing efforts. We protect our intellectual property rights by relying on federal, state, and common law rights, including registration, in the United States and certain foreign jurisdictions, as well as contractual restrictions. We enforce and protect our intellectual property rights through litigation from time to time, and by controlling access to our intellectual property and proprietary technology, in part, by entering into confidentiality and invention assignment agreements with our employees and contractors, and confidentiality agreements with third parties.
The duration of the protection afforded to our intellectual property depends on the type of property in question, the laws and regulations of the relevant jurisdiction and the terms of its license agreements with others. With respect to our trademarks and trade names, trademark laws and rights are generally territorial in scope and limited to those countries where a mark has been registered or protected. While trademark registrations may generally be maintained in effect for as long as the mark is in use in the respective jurisdictions, there may be occasions where a mark or title is not registrable or protectable or cannot be used in a particular country. In addition, a trademark registration may be cancelled or invalidated if challenged by others based on certain use requirements or other limited grounds. The duration of property rights in trademarks, service marks and
4
tradenames in the United States, whether registered or not, is predicated on our continued use. We are currently using all of our material marks. We have renewed the registrations (or applied for variant forms of the registration, where appropriate, to assure continued protection) of our material registered trademarks. We plan to continue to use all of our material brand names and marks and to renew the registrations of all of our material registered trademarks so long as we continue to use them.
We have granted licenses to other parties to sell specified products under trademarks in specified distribution channels and geographic areas. Some of these license agreements contain advertising commitments. Some are for a short term and may not contain specific renewal options. We do not license from third parties any trademarks that are material to our business.
Employees
As of December 31, 2014, we had a total of 641 employees, of whom 303 were involved in product and content development, 280 were involved in sales and marketing and 58 were involved in general and administrative functions. None of our employees is represented by a labor union. We have not experienced any work-stoppages, and we consider relations with our employees to be good.
Segments and Geographic Areas
We operate in one reportable segment, as we are organized around our online and offline media and e-commerce service lines. In addition, there is a substantial amount of costs that benefit all service lines, but are not allocated to individual cost of revenue categories. The chief operating decision maker reviews financial information at a consolidated result of operations level in addition to also reviewing revenue and cost of revenue results of the individual service lines.
Information about geographic revenue is set forth in Note 2 of the Notes to Consolidated Financial Statements included in Part II, Item 8 of this Annual Report on Form 10-K under the heading “Concentration of Credit Risk.” For a discussion of the risks related to foreign operations, see the information in Part I, Item 1A of this Annual Report on Form 10-K under the heading "Risk Factors" under the caption "We could face additional regulatory requirements, tax liabilities and other risks related to our continuing operations in China and Hong Kong, and other markets outside the United States where we may commence operations." For a discussion of revenue, net income and total assets, see Part II, Items 7 and 8 of this Annual Report on Form 10-K.
Corporate History
We were incorporated in the state of Delaware and commenced operations in 1996. In 1999, we listed on the NASDAQ National Market. We transferred our listing from the NASDAQ Global Market to the New York Stock Exchange in June 2011. At the same time, we changed our corporate name to XO Group Inc. (from The Knot, Inc.), and our stock symbol to XOXO (from KNOT), in order to highlight our expanded footprint across multiple life stages.
Available Information
XO Group’s corporate website is located at www.xogroupinc.com. XO Group makes available free of charge, on or through our corporate website, our annual, quarterly and current reports, and any amendments to those reports, as soon as reasonably practicable after electronically filing such reports with, or furnishing to, the Securities and Exchange Commission (“SEC”). Information contained on XO Group’s corporate website is not part of this report or any other report filed with the SEC.
XO Group’s Corporate Governance Guidelines; Code of Business Conduct and Ethics that applies to all officers, directors and employees; Code of Ethics for the Chairman, Chief Executive Officer and Senior Financial Officers (and any amendments to, or waivers under such code); and the charters of the Audit, Compensation and Nominating and Corporate Governance Committees of our Board of Directors, are also available on XO Group’s corporate website and are available in print to any stockholder upon request by writing to XO Group Inc., 195 Broadway, 25th Floor, New York, New York, 10007, Attention: Investor Relations.
5
Item 1A. Risk Factors
Risk Factors that May Affect Future Results
Certain factors may have a material adverse effect on our business, financial condition, and results of operations. In addition to other information in this Annual Report on Form 10-K, the following risk factors should be carefully considered before purchasing shares of our common stock. The risks and uncertainties described below are not the only ones we face. Additional risks and uncertainties that we are unaware of, or that we currently believe are not material, may also become important factors that adversely affect our business.
Risks Related to Our Business and Industry
Our websites, mobile and other digital properties may fail to generate sufficient revenues to survive over the long term.
We cannot guarantee that we will be able to meet rapidly changing advertiser, vendor and consumer demands for content, products and user engagement in a timely manner, if at all, even if we are successful in enhancing and upgrading our online and commerce sites and other digital platforms in response to advances in technology and evolving preferences. If the number of visitors to our online sites and other digital properties stagnates or declines, we may not be able to create or maintain sufficient advertiser or vendor interest in our digital platforms. Even if we are successful in driving consumer traffic to our online sites and other digital platforms, advertisers and vendors are sensitive to general economic conditions and reductions in consumer spending, among other events and trends, which could result in reduced advertising expenditures and lower commission rates. Our advertising and commission revenue could also decline as a result of pricing pressures on digital advertising rates due to industry developments, such as the fragmentation of digital media. If we are unable to effectively monetize our digital platforms, our business, results of operations, financial condition and prospects could be materially and adversely affected.
We incurred losses for many years following our inception and may incur losses in the future.
Historically we have not consistently generated income. We expect to continue to incur significant operating expenses and, as a result, we will need to generate significant revenues to achieve or maintain profitability. We cannot assure you that we can achieve or maintain profitability on a quarterly or annual basis in the future. Failure to achieve or maintain profitability may materially and adversely affect our business, results of operations and financial condition, as well as the market price of our common stock.
We may be unable to adjust spending quickly enough to offset any unexpected revenue shortfall.
We incur a significant percentage of our expenses, such as employee compensation, prior to generating revenues associated with those expenses. Moreover, our expense levels are based, in part, on our expectation of future revenues. We may be unable to adjust spending quickly enough to offset any unexpected revenue shortfall. If we have a shortfall in revenue or if operating expenses exceed our expectations or cannot be adjusted accordingly, then our results of operations could be materially and adversely affected. During the sales cycle, we may expend substantial funds and management resources in advance of generating revenues. Accordingly, if forecasted revenue in a particular period is delayed or does not otherwise occur, we would generate less revenue during that period, and our results of operations would be adversely affected.
Our efforts to launch new and upgrade existing technology and services may not generate significant new revenue, may reduce our revenue from existing services and could increase our operating expenses, which may adversely impact our profitability.
We cannot be sure that our products, services and digital properties will appeal to, and garner acceptance from, the public or our advertisers and other third party partners. We expect to continue to increase our operating expense growth in excess of historic rates in the near future to launch new products or upgrade existing products. We may not be able to successfully leverage our audience share or brand positioning to create and maintain use of our new products and services. Moreover, even if new features and services prove to be commercially successful, they may reduce usage of our existing features and services. If we are unable to generate sufficient revenue from new services and features to gain a return on our investments, or if our revenue from existing services declines as a direct result of a shift in consumer usage to new services, our business, results of operations and financial condition could be adversely affected.
Researching and developing, launching, gaining acceptance of and establishing profitability for a new or expanded product, service or digital property, or assimilating and marketing an acquired product, is both risky and costly. New products generally incur initial operating losses. Such costs are generally expensed as incurred and, accordingly, our profitability from year to year may be adversely affected by the number, timing, and ultimate success of the launches of new products, services and digital
6
properties. Other businesses and brands that we may develop also may not prove successful. Resources deployed on new technology or products could reduce our ability to grow and/or generate revenue from existing sources.
Capital expenditures required for upgrades to our systems may have a material impact on our financial condition and results of operations. We may not be able to secure the technology talent to complete these upgrades. Moreover, oversight of these upgrades will consume significant attention from our management, which could hamper our ability to run our business. If our new technology and features are not successful, we may not be able to scale our digital properties or react to a changing competitive landscape. As a result, the value and recognition of our brands, as well as our financial condition and prospects, could be materially and adversely affected.
Individuals are increasingly using mobile phones and wireless devices to access and make transactions over the internet, and if we are unable to develop solutions that generate revenue from advertising and other services delivered to such devices, our business could be adversely affected.
The number of people who access the internet through devices other than computers, including mobile phones and handheld computers such as notebooks and tablets, and who use mobile payment and transaction services, has increased substantially in recent years and is expected to increase further. A significant and growing portion of users access our digital platforms through mobile devices. To date, we have not been able to generate revenue from our advertising and other services delivered to mobile devices as effectively as we have for our advertising and other services on traditional computers. In the absence of effective mobile advertising and other service solutions, we may be unable to attract and retain customers for advertisers or other services. If we are unable to successfully implement monetization strategies for mobile users, or if we incur excessive expenses in our effort to do so, our business and results of operations could be adversely affected.
Our quarterly revenue and operating results are subject to significant fluctuation, and these fluctuations may adversely affect the trading price of our common stock.
Our quarterly revenue and operating results have fluctuated significantly in the past and are expected to continue to fluctuate significantly in the future as a result of a variety of factors, many of which are outside of our control. These factors include:
• | the level of online usage and traffic on our digital properties; |
• | the addition or loss of advertisers; |
• | the advertising budgeting cycles of specific advertisers; |
• | the regional and national magazines’ publishing cycles; |
• | the amount and timing of capital expenditures and other costs relating to the expansion of our operations, including those related to acquisitions; |
• | the introduction of new sites and services by us or our competitors; |
• | changes in our pricing policies or the pricing policies of our competitors; and |
• | general economic conditions, as well as economic conditions specific to the internet, online and offline media and electronic commerce. |
We do not believe that period-to-period comparisons of our operating results are necessarily meaningful and you should not rely upon these comparisons as indicators of our future performance.
Due to the foregoing factors, it is also possible that our results of operations in one or more future quarters may fall below the expectations of investors and/or securities analysts. In such event, the trading price of our common stock could be adversely impacted.
We also experience some seasonal trends that may produce variations in quarterly results and financial conditions. For example, wedding-related merchandise revenues and registry sales generally are lower in the first and fourth quarters of each year. Our publishing business typically has lower quarter to quarter revenue in the first and third quarters due to our regional publishing schedule. As a result of these factors, we may experience fluctuations in our revenue during the year. In addition, we could experience seasonal fluctuations in results as a result of our e-commerce transition. To the extent there are significant fluctuations in our financial results, the trading price of our common stock could decline materially.
Our operations are dependent on internet search engines, and our ability to influence search engine rankings and distribution through high traffic digital properties limited.
We depend in part on various internet search engines (such as Google, Bing and Yahoo!) to direct traffic to our websites and properties. Similarly, we depend on distribution relationships with high-traffic digital properties, such as those operated by
7
Microsoft’s MSN and Yahoo!, to promote our websites and properties. Our ability to maintain the number of potential customers directed to our websites and properties is not entirely within our control. For example, search engines often revise their algorithms in an attempt to improve the search results presented to their users. Our ability to influence the search engine rankings of our websites and properties, through our search engine optimization efforts or otherwise, is limited. In addition, we cannot guarantee that our distribution relationships with high-traffic digital properties will yield additional users or that such relationships will continue to be available on commercially reasonable terms. In addition, our website relaunches of theknot.com and thebump.com may result in a decline in the search engine rankings of our websites and properties. Changes by internet search engines in their algorithms, or changes to competitive dynamics that affect our distribution relationships in a negative manner, could cause our websites and properties to receive less user traffic. Fewer potential customers could materially and adversely affect our business, results of operations and financial condition.
Our registry and commerce business are dependent on third party participants. If these third party participants do not perform as expected, our revenue could decline.
Our registry and commerce business are dependent on third parties’ participation in our registry and commerce programs, and the success of those partners and vendors. The retail services business is highly competitive. We are dependent on our retail partners to manage these competitive pressures, and to the extent they are unable to do so, we may experience lower revenue, which could materially and adversely affect our results of operations. Such businesses are also dependent on our partners keeping their respective websites and other digital properties operational, as well as on the visitors who use those sites. Any decline in traffic or technical difficulties experienced by these websites or mobile devices may negatively affect our results of operations.
The fulfillment and delivery of products purchased by customers are processed and delivered by our third party partners. As a result, we are dependent on our partners to manage inventory, process orders and distribute products to our customers in a timely manner. We also rely on information provided by these partners to update and integrate information daily. If our partners experience problems with customer fulfillment or inventory management, or if we cannot integrate our processes with those of our partners, our business, results of operations and financial condition would be harmed.
In addition, our partners are highly dependent on the health of the U.S. or foreign economies and many are further dependent on local economic conditions in the states or countries in which they primarily conduct their businesses. Deterioration in macroeconomic conditions and consumer confidence that negatively impacts our partners’ businesses could result in lower revenue to our business, which could materially and adversely affect our results of operations.
While we expect to benefit from cost savings as a result of our disposition of our merchandising operations, we may not achieve all of the benefits that we expect to achieve from this disposition, and any benefits we do receive may be offset by contingent liabilities or additional tax obligations associated with this disposition.
Our effective tax rate is subject to significant fluctuations, which could have a material adverse effect on our business, results of operations and financial condition.
Our effective tax rate could fluctuate significantly and could be adversely affected to the extent earnings are lower than anticipated in states where we have lower statutory tax rates and higher than anticipated in states where we have higher statutory tax rates. Our effective tax rate could also fluctuate due to the income recognized by our continuing international entities, changes in the valuation of our deferred tax assets or liabilities, or changes in tax laws, regulations, accounting principles or interpretations thereof. These fluctuations in our effective tax rate, including the impact of adverse outcomes from tax audits by domestic and foreign tax authorities, could have a material adverse effect on our business, results of operations and financial condition.
We cannot assure you that our publications will be profitable.
Our magazine publishing business is another significant source of revenue. Preserving circulation is critical for maintaining advertising sales. Magazines face increasing competition from alternative forms of media and entertainment. As a result, sales of magazines through subscriptions and at the newsstand could decline, which may lead to a reduction in expenditures for magazine advertising and suppressed advertising rates. Many of our bridal publishing competitors have closed or reduced the frequency of their publications. Advertisers may choose not to reallocate their spending to other publications, or may choose to spend it in other media, and there can be no assurance that our publications will receive any benefit from these closures. In fact, we may face increased competition from the remaining bridal publications in this market. If circulation of our magazines decreases or if advertisers decide to spend less money or advertise elsewhere in lieu of our magazines, our business and our results of operations could be materially and adversely affected.
8
Increased competition in our markets could reduce our market share, the number of our advertisers, our revenues and our margins.
The internet and mobile advertising markets, online markets and publishing markets in which our brands operate are intensely competitive, and we expect competition to intensify in the future. For example, our brands face competition for members, users, readers and advertisers from the following areas:
• | stand-alone online services, websites, mobile applications or blogs targeted at brides and grooms, such as those offered by Project Wedding, Weddingbee, WeddingWire, and MyWedding.com, and at new parents, such as Disney’s Kaboose and Babble, Johnson & Johnson’s BabyCenter, Cafe Mom, and others; |
• | online and brick and mortar retail stores, manufacturers and regional directories; |
• | wedding sub-domains, channels or niche sites of major online destinations or portals, such as Google and AOL’s Huffington Post; |
• | bridal magazines and their online destinations, such as Condé Nast’s Brides, RFP LLC’s Bridal Guide, and Martha Stewart Living Omnimedia’s Martha Stewart Weddings; |
• | parenting magazines and their online destinations, such as American Media’s Fit Pregnancy, Bonnier’s Parenting, and Meredith’s Parents and American Baby; and |
• | online and retail stores offering gift registries, especially from retailers offering specific gift registries. |
We expect competition to increase because of the business opportunities presented by the growth of the internet and e-commerce. Our competition may also intensify as a result of industry consolidation and a lack of substantial barriers to entry. Many of our current and potential competitors have longer operating histories, significantly greater financial, technical and marketing resources, greater name recognition and substantially larger readership bases than we have and, therefore, have significant ability to attract advertisers, users and readers. In addition, many of our competitors may be able to respond more quickly than we can to new or emerging technologies and changes in internet user requirements, as well as devote greater resources than we can to the development, promotion and sale of services.
There can be no assurance that our current or potential competitors will not develop services and products comparable or superior to those that we develop or adapt more quickly than we do to new technologies, evolving industry trends or changing internet user preferences. Increased competition could result in price reductions, lower margins or loss of market share, any of which would materially and adversely affect our business, results of operations and financial condition. There can be no assurance that we will be able to compete successfully against current and future competitors.
Our potential inability to compete effectively in our industry for qualified personnel could hinder the success of our business.
Competition for personnel in the digital, mobile and media industries is intense. We may be unable to retain employees who are important to the success of our business, in particular, members of our senior management team. We may also face difficulties attracting, integrating or retaining other highly qualified employees in the future. Any loss or interruption of the services of one or more of our key personnel or our inability to attract new personnel could result in us being unable to manage our operations effectively and/or to pursue our business strategy.
We are dependent on our management team and the loss of any key member of this team may prevent us from implementing our business plan in a timely manner.
Our success depends largely upon our ability to attract and retain executive officers and other key personnel, including senior creative, technical, operational and finance executives. In December 2014, two of our founding executives, David Liu and Carley Roney, completed a two-year process of transitioning from their management roles with us, and we have focused significant time and resources on recruiting new members of our management team to assume their roles, including our President and Chief Executive Officer, Michael Steib, who joined us in July 2013. If our management team, including any new hires, fails to work together effectively and to execute our plans and strategies on a timely basis, or if we fail to successfully integrate newly-hired executives or senior managers, our business could be harmed. We cannot assure you that if we were to experience a high degree of management change in the future, we would be able to replace departing members of management in a timely manner or successfully integrate newly-hired executives or senior managers.
Our business could be adversely affected if we are not able to successfully integrate any future acquisitions or successfully operate under our strategic partnerships.
In the future, we may acquire, or invest in, complementary companies, products or technologies or enter into new strategic partnerships. Acquisitions, investments and partnerships involve numerous risks, including:
9
• | difficulties in integrating operations, technologies, products and personnel; |
• | diversion of financial and management resources from existing operations; |
• | operating under commercial agreements entered into by an acquisition target; |
• | risks of entering new markets; |
• | potential loss of key employees; and |
• | inability to generate sufficient revenue to offset acquisition or investment costs. |
To pay for an acquisition or to enter into a strategic alliance, we might use equity securities, debt, cash, or a combination of the foregoing. If we use equity securities, our existing stockholders may experience dilution. In addition, an acquisition may involve non-recurring charges, including write-downs of significant amounts of intangible assets or goodwill. The related increases in expenses could adversely affect our results of operations. Any such acquisitions or strategic alliances may require us to obtain additional equity or debt financing, which may not be available on commercially acceptable terms, if at all.
Impairment charges related to assets may have a material adverse effect on our financial results.
We have several intangible assets that, depending upon competitive and economic conditions, could become impaired, which could have a material adverse effect on our financial results. In the past we have recorded a charge against our earnings for amortization of intangibles with a definite life, as well as impairment charges on certain intangible assets with indefinite lives, and we may be required to take other charges, including write-downs of significant amounts of intangible assets with indefinite lives or goodwill, in the future. Our results of operations and financial condition could be materially and adversely affected by such charges.
Our online advertising revenue, as well as our revenue generated from commerce activities, could decline if we become subject to burdensome government regulation and legal uncertainties related to doing business online.
Laws and regulations directly applicable to internet communications, privacy, cybersecurity, commerce and advertising are becoming more prevalent. Laws and regulations may be adopted covering issues such as user privacy, freedom of expression, pricing, unsolicited commercial e-mail (spam), content, taxation, quality of services and products, consumer protection, advertising, intellectual property rights and information security. Any new legislation could hinder the growth in use of the internet and other online services generally and decrease the acceptance of the internet and other online services as media for communications, commerce and advertising. In addition, the laws governing the internet remain largely unsettled, even in areas where legislation has been enacted. It may take years to determine whether and how existing laws such as those governing intellectual property, privacy, libel and taxation apply to the internet and internet advertising services. The adoption or modification of laws or regulations relating to the internet and other online services could cause our advertising revenue and commerce revenue to decline and our business and prospects to suffer.
Due to the global nature of the internet, it is possible that, although our U.S. assets and transmissions currently originate in New York, the governments of other states or foreign countries might attempt to regulate our business, services, transmissions or levy sales, or other taxes, or impose other requirements or restrictions relating to our activities. The uncertain nature of existing and proposed rules and regulations around the world could substantially impair the growth of electronic commerce, seriously harm our profitability, and result in our inability to enforce contracts or otherwise run our business.
We could face additional regulatory requirements, tax liabilities and other risks related to our continuing operations in China and Hong Kong, and other markets outside the United States where we may commence operations.
We have continuing operations in China and Hong Kong. There are risks related to doing business in international markets in general, such as:
• | different user preferences and requirements in specific international markets; |
• | difficulties in staffing and managing our current and future foreign operations; |
• | challenges caused by language, cultural differences and by doing business with foreign agencies and governments; |
• | changes in regulatory requirements and uncertainty regarding liability for services and content, including data privacy and cybersecurity issues; |
• | tariffs and other trade barriers; |
• | fluctuations in currency exchange rates and foreign exchange controls that might prevent us from repatriating cash earned in countries outside the U.S.; |
• | adverse tax consequences; |
• | stringent local labor laws and regulations; |
10
• | longer payment cycles; |
• | credit risk and higher levels of payment fraud; |
• | political or social unrest or economic instability; and |
• | seasonal volatility in business activity. |
In addition, there are risks related to doing business in the international media and online markets specifically, such as:
• | more stringent regulation of media and internet businesses; |
• | more stringent rules relating to the privacy and security of information relating to internet users; and |
• | less protection of intellectual property rights. |
One or more of these factors could harm our current or future international operations.
In addition, compliance with complex foreign and U.S. laws and regulations that apply to our international operations increases our cost of doing business and could interfere with our ability to offer, or prevent us from offering, our products and services to one or more countries or expose us or our employees to fines and penalties. These numerous and sometimes conflicting laws and regulations include import and export requirements, content requirements, trade restrictions, tax laws, sanctions, internal and disclosure control rules, data privacy and security requirements, labor relations laws, U.S. laws such as the Foreign Corrupt Practices Act, and local laws prohibiting corrupt payments to governmental officials. Violations of these laws and regulations could result in fines, criminal sanctions against us, our officers, or our employees, prohibitions on the conduct of our business, and damage to our reputation. Although we have implemented policies and procedures designed to address these laws, there can be no assurance that our employees, contractors, or agents will not violate our policies or any applicable laws or regulations. Any such violations could include prohibitions on our ability to offer our products and services to one or more countries, and could also materially damage our reputation, our brand, our ability to expand our international operations, our ability to attract and retain employees, our business, and our operating results, and expose us to lawsuits and regulatory investigations.
We may experience higher costs than expected from the disposition of our Ijie operations.
On December 30, 2014, we completed the disposition of our Ijie operations in China and Hong Kong. While we expect to benefit from cost savings as a result of this disposition, we may not achieve all of the benefits that we expect to achieve from this disposition, and any benefits we do receive may be offset by contingent liabilities or additional tax obligations associated with this disposition. For example, if third parties seek to hold us responsible for the liabilities of the Ijie operations, or if any disputes arise between us and the purchasers of the Ijie operations, our business could be harmed.
We may be unable to continue to build awareness of The Knot, The Bump and The Nest brand names, which would negatively impact our business and cause our revenue to decline.
The brand identity that we have developed has contributed significantly to the success of our business. Building and maintaining the brand recognition of The Knot, The Bump and The Nest is critical to attracting and expanding our base of online users and offline readership, advertisers, corporate customers and other partners, and increasing their engagement with our services, and will depend largely on our ability to maintain member trust, be a technology leader and continue to provide high-quality solutions, which we may not do successfully. Our brands may be negatively affected by a number of factors, including the reputation of our content and products and our ability to adapt to technological changes. Despite our efforts to protect and prevent misuse of our brands, if others misuse our brands or pass themselves off as being endorsed or affiliated with us, it could harm our reputation, and our business could suffer. Our brands are also important in attracting and maintaining highly qualified employees. If we fail to build or maintain awareness of our brands, or if we incur excessive expenses in this effort, our business and our results of operations could be materially and adversely affected.
If we cannot protect our domain names, it will impair our ability to successfully promote our brands.
We currently hold various web domain names, including TheKnot.com, TheBump.com, and TheNest.com that are critical to the operation of our business and the promotion of our brands. The acquisition and maintenance of domain names, or internet addresses, is generally regulated by governmental agencies and their designees and by trademark and other laws. The regulations governing domain names could change in ways that block or interfere with our ability to use relevant domains. Also, we might not be able to prevent third parties from registering or retaining domain names that interfere with our consumer communications, or infringe or otherwise decrease the value of our trademarks and other proprietary rights. Recently, regulatory bodies have approved expanded generic top-level domain names, which involves substantial costs and may lead to an increase in cybersquatting. Regulatory bodies also may establish additional generic or country-code top-level domains or modify the requirements for holding
11
domain names. As a result, we may be unable to acquire or maintain relevant domain names in all countries in which we conduct business, which could harm our business and results of operations.
Our business and prospects would suffer if we are unable to protect and enforce our intellectual property rights, and we may incur costs to defend against, or face liability for, intellectual property infringement claims of others.
We rely on copyright, trademark, patent and other intellectual property laws to protect our rights in our proprietary technology, processes, designs, content and other intellectual property to the extent such protection is sought or secured at all. We also depend on trade secret protection through, among other things, confidentiality agreements and/or invention assignment agreements with our employees, licensees and others, as well as through license agreements with our licensees and other partners. We may not have agreements containing adequate protective provisions in every case, and the contractual provisions that are in place may not provide us with adequate protection in all circumstances. In addition, the steps we might otherwise take may not be adequate to protect against infringement and misappropriation of our intellectual property by third parties.
Intellectual property laws afford us only limited protection. A third party may be able to develop similar or superior technology, processes, content or other intellectual property independently. In addition, monitoring the unauthorized use of our intellectual property, including our copyrights, trademarks, service marks and patents, is difficult. Third parties may register marks that are confusingly similar to the trademarks or services marks that we have used in the United States and our failure to monitor foreign registrations or mark usage may impact our rights in certain trademarks or services marks. The unauthorized reproduction or misappropriation of our intellectual property rights could enable third parties to benefit from our technology without paying us for it, diminish the value of our brands, competitive advantages or goodwill and result in decreased sales. If this occurs, our business and prospects would be materially and adversely affected.
Disputes concerning the ownership of our rights to use intellectual property could be costly and time-consuming to litigate, may distract management from other tasks of operating the business and may result in our loss of significant rights and the loss of our ability to operate our business. Litigation has been and may continue to be necessary to enforce our intellectual property rights or to determine the validity and scope of the proprietary rights of others.
In addition, other parties may assert infringement claims against us or claim that we have violated a patent or infringed a copyright, trademark or other proprietary right belonging to them, whether on our own or by virtue of our use of certain third-party technology. If we are subject to claims of infringement or are infringing the rights of third parties, we may not be able to obtain licenses to use those rights on commercially reasonable terms, if at all. In that event, we might need to undertake substantial reengineering to continue our online offerings. Any effort to undertake such reengineering might not be successful, resulting in a failure to continue to provide our services or sell our products. Furthermore, a party making such a claim could secure a judgment that requires us to pay substantial damages. An injunction or other court order could prevent us from operating products or our business. Any claim of infringement, even if the claim is invalid or without merit, could cause us to incur substantial costs defending against the claim, distract our management from our business, require us to pay substantial damage awards, prevent us from selling our products, require the development of non-infringing software, technology, business processes, systems or other intellectual property (none of which might be successful), limit our ability to use the intellectual property that is the subject of any of these claims, unless we enter into license agreements with the third parties (which may be costly, unavailable on commercially reasonable terms, or not available at all), be time-consuming, result in costly settlements, litigation or restrictions on our business and damage our reputation. Therefore, such claims could have a material adverse effect on our business, results of operations, cash flows and financial condition.
Furthermore, the laws of some foreign countries do not protect our proprietary rights to the same extent as do the laws of the United States. In addition, we have not obtained copyright and trademark protection for all of our proprietary technology, processes, content and brands in all of the countries where we sell our products or otherwise operate. This could leave us helpless to stop potential infringers or possibly even unable to sell our products or provide our services in certain territories.
Failure to license necessary third party software for use in our products and services, or failure to successfully integrate third party software, could cause delays or reductions in our sales, or errors or failures of our service.
In the future, we might need to license third-party software to enhance our products and services and meet evolving customer requirements. These licenses may not continue to be available on commercially reasonable terms or at all. Some of this technology could be difficult to replace once integrated. The loss of, or inability to obtain, these licenses could result in delays or reductions of our applications until we identify, license and integrate or develop equivalent software, and new licenses could require us to pay higher royalties. If we are unable to successfully license and integrate third party technology, we could experience a reduction in functionality and/or errors or failures of our products or services, which may reduce demand for our products and services. Third-party licenses may expose us to increased risks, including risks associated with the integration of new technology, the impact
12
of new technology integration on our existing technology, open source software disclosure risks, the diversion of resources from the development of our own proprietary technology, and our inability to generate revenue from new technology sufficient to offset associated acquisition and maintenance costs.
System disruptions, failures, or breaches in of our systems or our third-party service providers, including those resulting from cyber-attacks, security vulnerabilities, defects or errors, could cause advertiser or user dissatisfaction, reduce the attractiveness of our sites, harm our brand and reputation, disrupt our ability to provide services, any of which could reduce revenues, increase costs and expose us to regulatory actions and legal claims.
The continuing, uninterrupted and secure performance of our computer systems is critical to our success. While we continue to expand our focus on this issue and are taking safeguarding measures, we are vulnerable to the increasing risk of cyber-attacks and other security incidents, such as computer viruses, denial of service attacks, phishing attacks, electronic break-ins and similar disruptions. Because the techniques used in cyber-attacks are becoming more sophisticated in ways that avoid detection, we or our service providers may not be able to anticipate, prevent, identify or adequately remediate such incidents. A cyber-attack or other security incident involving our or our service providers’ systems may result in unauthorized access, loss, or other compromise to, among other things, our data, including trade secrets, our customers’ data, billing data such as credit or debit card information, and any other data that is confidential or subject to applicable domestic or foreign privacy or security laws or regulations. If we suffer a cyber-attack or other security incident due to third party or employee conduct, we could be subject to lawsuits, regulatory investigations, increased costs associated with regulatory compliance and systems remediation, investigations and fines by payment card companies, harm to our brand and reputation, disruption in our ability to provide our services, any of which could reduce revenue, increase costs, and materially harm our business and results of operations. Although we carry general liability insurance, our insurance may not cover any claims by dissatisfied advertisers or customers and may not be adequate to indemnify us for any costs or liability that may be imposed on us as a result of any system disruptions, failures, cyber-attacks, security breaches or other compromise or to our ability to provide various services to our customers and users.
Our business depends on third party service providers who support important aspects of our various services.
If any of our service providers fail to provide reliable and secure software, systems and services to us, we would need to pursue alternative sources of services, and while alternatives are available, we may be unable to secure such services on a timely basis or on terms favorable to us. Our advertisers, users and members may become dissatisfied by any systems disruption, failure, cyber-attacks or security incidents that interrupt our ability to provide services and content to them in a timely or secure manner whether it involves our systems or those of our service providers. Substantial or repeated system disruptions, prolonged failures or delays, or significant cyber-attacks or security incidents, would reduce the attractiveness of our online sites and services. All of the forgoing could result in increased costs to us, decreased demand for our websites and services, damage to our reputation and customer relationships, and expose us to lawsuits and regulatory investigations.
Our business is subject to the risks of natural catastrophic events and to interruption by man-made problems such as terrorism or computer viruses.
Our business operations are vulnerable to damage or interruption from power losses, telecommunications failures, terrorist attacks, acts of war, human errors, break-ins earthquakes, fires, floods, and similar events. Any of these events could have a material adverse impact on our business, operating results, financial condition, data and reputation, and our insurance coverage may be insufficient to compensate us for losses that may occur. In addition, acts of terrorism could cause disruptions in our business or the economy as a whole. Our principal executive offices are located in New York City, a region that has experienced acts of terrorism in the past. Our servers may also be vulnerable to computer viruses, break-ins and similar disruptions from unauthorized tampering with our computer systems, which could lead to interruptions, delays, loss of critical data or the unauthorized disclosure of confidential customer data. Although we have disaster recovery capabilities, there can be no assurance that we will not suffer from business interruption as a result of any such events, and any such event could also result in large expenditures necessary to repair or replace such networks or information systems or to protect them from similar events in the future. As we rely heavily on our servers, computer and communications systems and the internet to conduct our business and provide high-quality service to our customers, such disruptions could negatively impact our ability to run our business, result in loss of existing or potential customers and increased maintenance costs, which would adversely affect our operating results and financial condition.
Privacy concerns relating to elements of our technology and services and those of our customers and service providers could damage our reputation and deter current and potential users from using our products and services.
We currently face a myriad of U.S. federal and state statutory and regulatory rules regarding the collection, use, transfer, and retention of personal information and other data privacy and security issues. These laws and regulations are in a state of flux and expanding. In addition, because our services are accessible worldwide, certain foreign jurisdictions may claim that we are required
13
to comply with their laws, even if we don’t have a local entity, employees or infrastructure. In general, foreign data protection, privacy, and other laws and regulations are more restrictive than those in the United States. As in the U.S., the substance and applicability of such laws in Europe are subject to continued development and interpretation by agencies and courts. The cost of compliance with any applicable laws could be material, and we may not be able to comply with them in a timely or cost-effective manner, if at all. Compliance with any applicable laws could also delay or impede the development of new products or services, result in negative publicity and damage to our brand an reputation, increase our operating costs, require significant management time and attention, or subject us to inquiries or investigations, claims or other remedies, including fines or demands that we modify or cease existing business practices. In addition, changes to existing laws or the passage of new laws could create uncertainty in the marketplace that could reduce demand for our services or increase the cost of doing business as a result of litigation costs or increased service delivery costs or otherwise have a material adverse effect on our business, results of operations and financial condition.
In addition, privacy concerns in general may cause visitors to avoid online sites like ours that collect and use information, for purposes such as behavioral targeted advertising, and even the perception of privacy or security concerns, whether or not valid, may inhibit market acceptance of our services. In addition, if our privacy practices are deemed unacceptable by watchdog groups or privacy advocates, such groups may attempt to harm our business by blocking access to our sites or disparaging our reputation and our business and may have a material effect on our results of operations and financial condition. We may also be subject to claims of liability or responsibility for the actions of third parties with whom we interact or upon whom we rely in relation to various services, including but not limited to vendors and business partners. These third parties may be vulnerable to privacy violations, and threats, such as computer hacking, cyber-terrorism or other unauthorized attempts by access, modify or delete our or our customers' information or business assets that they service or maintain on our behalf. The foregoing could have a material effect on our business, results of operations, and financial condition.
We may be sued for information retrieved from our sites, mobile applications or other sources.
We may be subject to claims for defamation, negligence, copyright or trademark infringement, personal injury or other legal theories relating to the information we publish, display or distribute. These types of claims have been brought, sometimes successfully, against online services, as well as other print publications in the past. We could also be subject to claims based upon the content that is accessible from our online sites through links to other online sites or through content and materials that may be posted by members in message bulletin boards. Our insurance, which covers commercial general liability, may not adequately protect us against these types of claims.
The law relating to the liability of online service providers such as us for the activities of users of their online services is often challenged in the United States and internationally. We may be unable to prevent users of our services from providing negligent, unlawful or inappropriate advice, information or content via our services, or from behaving in an unlawful manner, and we may be subject to allegations of civil or criminal liability for negligent, fraudulent, unlawful or inappropriate activities carried out by users of our services.
Claims could be made against online services companies under both United States and foreign law such as fraud, defamation, libel, invasion of privacy, negligence, data breach, copyright or trademark infringement, or other theories based on the nature and content of the materials disseminated by users of our services. In addition, domestic and foreign legislation has been proposed that could prohibit or impose liability for the transmission over the internet of certain types of information. Our defense of any of these actions could be costly and involve significant time and attention of our management and other resources.
If we become liable for information provided by our users and carried via our service in any jurisdiction in which we operate, we could be directly harmed and we may be forced to implement new measures to reduce our exposure to this liability. In addition, the increased attention focused upon liability issues as a result of these lawsuits and legislative proposals could harm our reputation or otherwise impact the growth of our business. Any costs incurred as a result of this potential liability could harm our business.
In addition, negative publicity and user sentiment generated as a result of fraudulent or deceptive conduct by users of our services could damage our reputation, reduce our ability to attract new users or retain our current users, and diminish the value of our brand.
In the future, we may be required to spend substantial resources to take additional protective measures or discontinue certain service offerings, either of which could harm our business. Any costs incurred as a result of potential liability relating to the sale of unlawful services or the unlawful sale of services could harm our business.
Consumers may sue us if any of the products that our retail or other partners sell online or otherwise make available are defective, fail to perform properly or injure the user. Liability claims could require us to spend significant time and money in
14
litigation or to pay significant damages. As a result, any such claims, whether or not successful, could seriously damage our financial results, reputation and brand name.
It is possible that we may not be able to obtain additional financing necessary to execute our business strategy.
We currently believe that our current cash and cash equivalents will be sufficient to fund our working capital and capital expenditure requirements for the foreseeable future. Our ability to meet our obligations in the ordinary course of business is dependent upon our ability to maintain profitable operations and/or raise additional financing through public or private equity or debt financings, or other arrangements with corporate sources or other sources of financing to fund operations. However, there is no assurance that we will maintain profitable operations or that additional funding, if required, will be available to us in amounts or on terms acceptable to us.
Risks Related to Our Common Stock
Our stock price has been highly volatile and is likely to experience significant price and volume fluctuations in the future, which could result in substantial losses for our stockholders and subject us to litigation.
In the recent past, the equity trading markets have experienced, and may continue to experience, significant periods of volatility, resulting in highly variable and unpredictable pricing of equity securities. The market price of our common stock could change in ways that may or may not be related to our business, our industry or our operating performance and financial condition. In addition, the trading volume in our common stock may fluctuate and cause significant price variations to occur. Our common stock has experienced significant volume and price fluctuations in the past. Our current market price and valuation may not be sustainable. If the market price of our common stock declines significantly, you may be unable to resell your common stock at or above your purchase price. In the past, companies that have experienced volatility in the market price of their stock have been the object of securities class action litigation. If we were to become the subject of securities class action litigation, we could face substantial costs and be negatively affected by diversion of our management’s attention and resources. We cannot assure you that the market price of our common stock will not fluctuate or decline significantly, including a decline below your purchase price, in the future. In addition, the stock markets in general can experience considerable price and volume fluctuations, which could result in substantial losses for our stockholders.
Future sales of shares of our common stock, or the perception that these shares might be sold, could cause the market price of our common stock to drop significantly.
In the past, we have filed shelf registration statements with the SEC covering re-sales of shares of our common stock by institutional investors who purchased our shares in private placements. Certain future holders may be granted rights to participate in, or require us to file, registration statements for re-sales of common stock, and we may complete public offerings of shares or issue shares pursuant to acquisitions that are freely tradable.
We cannot predict the effect, if any, that future sales of shares of our common stock into the market, or the availability of shares of common stock for future sale, will have on the market price of our common stock. Sales of substantial amounts of common stock (including shares issued upon the exercise of outstanding stock options or vesting of restricted stock), or the perception that such sales could occur, may materially and adversely affect prevailing market prices for our common stock.
Provisions in our certificate of incorporation, bylaws and Delaware law may make it more difficult to effect a change in control, which could adversely affect the price of our common stock.
Provisions of our certificate of incorporation, bylaws and Delaware law could make it more difficult for a third party to acquire us, even if doing so would be beneficial to our stockholders. We may issue shares of preferred stock in the future without stockholder approval and upon such terms as our board of directors may determine. Our issuance of this preferred stock could have the effect of making it more difficult for a third party to acquire or of discouraging a third party from acquiring, a majority of our outstanding stock and potentially prevent the payment of a premium to stockholders in an acquisition. In addition, our certificate of incorporation includes provisions giving the board the exclusive right to fill all board vacancies, providing for a classified board of directors and permitting removal of directors only for cause and with a super-majority vote of the stockholders.
These provisions also could discourage proxy contests and make it more difficult for you and other stockholders to elect directors and take other corporate actions. As a result, these provisions could make it more difficult for a third party to acquire us, even if doing so would benefit our stockholders, and may limit the price that investors are willing to pay in the future for shares of our common stock.
15
We are also subject to provisions of the Delaware General Corporation Law that prohibit business combinations with persons owning 15% or more of the voting shares of a corporation’s outstanding stock for three years following the date that person became an interested stockholder, unless the combination is approved by the board of directors prior to the person owning 15% or more of the stock, after which the business combination would be subject to special stockholder approval requirements. This provision could deprive our stockholders of an opportunity to receive a premium for their common stock as part of a sale of our company or may otherwise discourage a potential acquirer from attempting to obtain control from us, which in turn could have a material adverse effect on the market price of our common stock.
We have not paid cash dividends on our common stock in the past.
In the past, we have retained all earnings and other cash resources for the future operation and development of our business. Payment of any future dividends will be at the discretion of our board of directors after taking into account many factors, including our operating results, financial conditions, current and anticipated cash needs and plans for expansion. Accordingly, if we do not declare or pay any cash dividends on our common stock in the future, investors must rely on sales of their common stock after price appreciation, which may not occur, as the only way to realize any future gains on their investment.
Our executive officers and directors, and stockholders that owned greater than 5% of our common stock, exercise significant control over all matters requiring a stockholder vote.
As of March 5, 2015, our executive officers and directors, and stockholders that owned greater than 5% of our common stock, and their affiliates, in the aggregate, beneficially owned approximately 39.8% of our outstanding common stock. As a result, if some or all of these parties act as a group, they would be able to significantly influence matters requiring approval by our stockholders, including the election of directors and approval of significant corporate transactions. This concentration of ownership could also have the effect of delaying or preventing a change in control.
Item 1B. Unresolved Staff Comments
Not applicable.
16
Item 2. Properties
The following table sets forth the location, primary use and size of our corporate and warehouse facilities as of December 31, 2014, all of which are leased. The leases expire at various times through 2022, subject to renewal options. We believe that our existing facilities are suitable for our current needs.
Location | Use | Approximate Square Footage | Lease Expiration | ||||
New York, New York | Principal executive office | 64,000 | August 2022 | ||||
Redding, California | Warehousing and fulfillment | 53,000 | July 2015 * | ||||
Omaha, Nebraska | Local sales and operations | 16,000 | January 2021 | ||||
Guangzhou, China | Technology development | 9,200 | April 2016 | ||||
Austin, Texas | Information technology | 9,000 | December 2018 | ||||
Los Angeles, California | General services | 3,600 | August 2016 * | ||||
San Francisco, California | Local sales and operations | 1,000 | April 2017 | ||||
Wanchai, Hong Kong | Technology management | 350 | January 2016 | ||||
* Our Redding, California lease will be terminated upon expiration in July 2015. Our Los Angeles, California lease has been terminated early, effective February 2015.
Item 3. Legal Proceedings
We are engaged in legal actions arising in the ordinary course of business and do not believe that the ultimate outcome of these actions will have a material effect on our results of operations, financial position or cash flows.
Item 4. Mine Safety Disclosures
None.
17
PART II
Item 5. Market for Registrant’s Common Equity, Related Stockholder Matters and Issuer Purchases of Equity Securities
Price Range of Common Stock
Our common stock currently trades under the symbol "XOXO" on the New York Stock Exchange. The table sets forth, for the periods indicated, the high and low sales prices per share of our common stock as reported on the New York Stock Exchange.
High | Low | |||||||
2013: | ||||||||
First quarter | $ | 10.08 | $ | 8.81 | ||||
Second quarter | $ | 11.84 | $ | 9.94 | ||||
Third quarter | $ | 13.57 | $ | 11.26 | ||||
Fourth quarter | $ | 15.78 | $ | 12.95 | ||||
2014: | ||||||||
First quarter | $ | 15.09 | $ | 8.82 | ||||
Second quarter | $ | 12.50 | $ | 9.94 | ||||
Third quarter | $ | 13.07 | $ | 10.94 | ||||
Fourth quarter | $ | 18.60 | $ | 10.99 | ||||
On December 31, 2014, the last reported sales price of our common stock on the New York Stock Exchange was $18.21. On March 5, 2015, the last reported sales price of our common stock on the New York Stock Exchange was $15.50.
Holders
As of March 5, 2015, there were approximately 229 holders of record of our common stock. This does not include the number of persons whose stock is in nominee or “street name” accounts through brokers.
Dividend Policy
We have never declared or paid any cash dividends on our capital stock. The payment of cash dividends in the future will be at the discretion of our board of directors.
Issuer Purchases of Equity Securities
Period | Total Number of Shares Purchased (a) | Average Price Paid per Share | Total Number of Shares Purchased as Part of Publicly Announced Plans or Programs (b) | Approximate Dollar Value of Shares That May Yet Be Purchased Under the Plans or Programs (c) | ||||||||||
October 1 to October 31, 2014 | 2,437 | $ | 11.67 | — | $ | 19,384,932 | ||||||||
November 1 to November 30, 2014 | 23,163 | $ | 14.54 | 7,300 | $ | 19,282,689 | ||||||||
December 1 to December 31, 2014 | 61,516 | $ | 16.50 | 51,409 | $ | 18,371,843 | ||||||||
Total | 87,116 | $ | 14.99 | 58,709 | $ | 18,371,843 | ||||||||
_____________
(a) | The terms of some awards granted under certain of our stock incentive plans allow participants to surrender or deliver shares of XO Group's common stock to us to pay for the exercise price of those awards or to satisfy tax withholding obligations related to the exercise or vesting of those awards. The shares listed in the table above represent the surrender or delivery of shares to us in connection with such exercise price payments or tax withholding obligations. For purposes of this table, the "price paid per share" is determined by reference to the closing sales price per share of XO Group's common stock on the New York Stock Exchange on the date of such surrender or delivery (or on the last date preceding such surrender or delivery for which such reported price exists). |
18
(b), (c) | On April 10, 2013, we announced that our Board of Directors had authorized the repurchase of up to $20.0 million of our common stock from time to time in the open market or in privately negotiated transactions. The repurchase program may be suspended or discontinued at any time, but it does not have an expiration date. As of December 31, 2014, we have repurchased a total of 120,557 shares of our common stock under this program. |
Stock Performance Graph
The graph below compares the yearly change in cumulative total stockholder return on XO Group’s common stock with the cumulative total return of (1) the NASDAQ Composite Index and (2) the Russell 2000 Index. Our stock was listed on the NASDAQ Global Market until June 27, 2011, when we transferred the listing to the New York Stock Exchange. We compare the total return on our common stock with the Russell 2000 Index because we do not believe we can reasonably identify a peer group consisting of issuers similar to XO Group for purposes of the stock performance comparison.
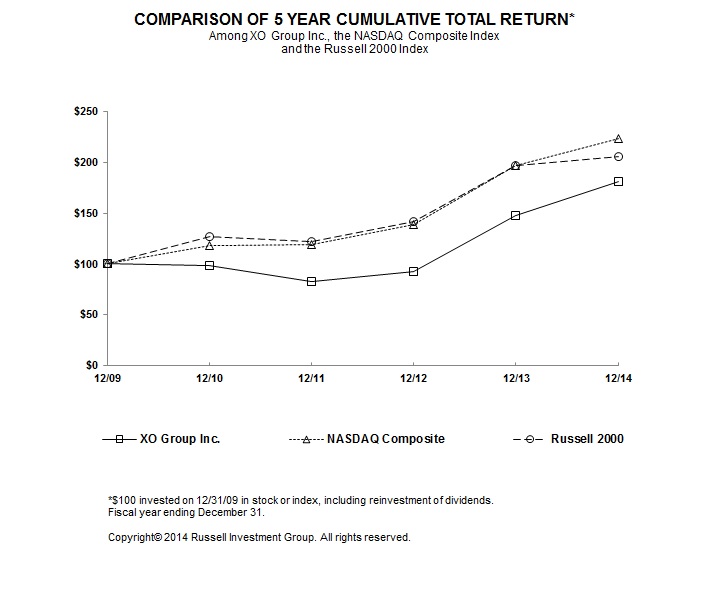
Notwithstanding anything to the contrary set forth in any of our previous or future filings under the Securities Act of 1933, as amended, or the Securities Exchange Act of 1934, as amended, that might incorporate by reference this Annual Report on Form 10-K or future filings made by XO Group under those statutes, the Stock Performance Graph is not deemed filed with the Securities and Exchange Commission, is not deemed soliciting material and shall not be deemed incorporated by reference into any of those prior filings or into any future filings made by XO Group under those statutes, except to the extent that XO Group specifically incorporates such information by reference into a previous or future filing, or specifically requests that such information be treated as soliciting material, in each case under those statutes.
19
Item 6. Selected Financial Data
The selected statements of operations data for the years ended December 31, 2014, 2013 and 2012 and the selected balance sheet data as of December 31, 2014 and December 31, 2013 have been derived from our audited financial statements included elsewhere herein. The selected statements of operations data for the years ended December 31, 2011 and 2010 and the selected balance sheet data as of December 31, 2012, 2011 and 2010 have been derived from our audited financial statements not included herein. You should read these selected financial data in conjunction with Item 7, “Management’s Discussion and Analysis of Financial Condition and Results of Operations," our financial statements and the notes to those statements included elsewhere herein.
Year Ended December 31, | ||||||||||||||||||||
2014 | 2013 | 2012 | 2011 | 2010 | ||||||||||||||||
(In Thousands, Except for per Share Data) | ||||||||||||||||||||
Consolidated Statements of Operations Data: | ||||||||||||||||||||
Net revenue: | ||||||||||||||||||||
Online advertising | $ | 89,549 | $ | 81,661 | $ | 76,475 | $ | 70,067 | $ | 60,441 | ||||||||||
Registry services | 9,794 | 7,926 | 6,231 | 6,398 | 6,727 | |||||||||||||||
Merchandise | 16,223 | 18,406 | 21,359 | 25,420 | 26,246 | |||||||||||||||
Publishing and other | 28,098 | 25,821 | 25,066 | 22,372 | 19,467 | |||||||||||||||
Total net revenues | 143,664 | 133,814 | 129,131 | 124,257 | 112,881 | |||||||||||||||
Gross profit | 122,469 | 111,413 | 106,529 | 99,171 | 89,697 | |||||||||||||||
Operating expenses(a) | 113,572 | 98,906 | 92,280 | 89,092 | 83,031 | |||||||||||||||
Income from operations | 8,897 | 12,507 | 14,249 | 10,079 | 6,666 | |||||||||||||||
Net income | 462 | 5,794 | 8,649 | 5,988 | 3,654 | |||||||||||||||
Plus: net loss attributable to noncontrolling interest | — | — | 65 | 52 | — | |||||||||||||||
Net income attributable to XO Group Inc. | $ | 462 | $ | 5,794 | $ | 8,714 | $ | 6,040 | $ | 3,654 | ||||||||||
Net income per share attributable to XO Group Inc. common stockholders: | ||||||||||||||||||||
Basic | $ | 0.02 | $ | 0.24 | $ | 0.35 | $ | 0.21 | $ | 0.11 | ||||||||||
Diluted | $ | 0.02 | $ | 0.23 | $ | 0.35 | $ | 0.20 | $ | 0.11 | ||||||||||
Weighted average number of shares used in calculating earnings per share | ||||||||||||||||||||
Basic(b) | 25,210 | 24,620 | 24,649 | 29,060 | 32,768 | |||||||||||||||
Diluted(b) | 25,589 | 25,596 | 25,218 | 29,692 | 33,660 | |||||||||||||||
Consolidated Percentage of Total Net Revenue Data: | ||||||||||||||||||||
Net revenue: | ||||||||||||||||||||
Online advertising | 62.3 | % | 61.0 | % | 59.3 | % | 56.4 | % | 53.5 | % | ||||||||||
Registry services | 6.8 | % | 5.9 | % | 4.8 | % | 5.1 | % | 6.0 | % | ||||||||||
Merchandise | 11.3 | % | 13.8 | % | 16.5 | % | 20.5 | % | 23.3 | % | ||||||||||
Publishing and other | 19.6 | % | 19.3 | % | 19.4 | % | 18.0 | % | 17.2 | % | ||||||||||
Gross margin | 85.2 | % | 83.3 | % | 82.5 | % | 79.8 | % | 79.5 | % | ||||||||||
Operating expenses | 79.1 | % | 73.9 | % | 71.5 | % | 71.7 | % | 73.6 | % | ||||||||||
Operating margin | 6.2 | % | 9.3 | % | 11.0 | % | 8.1 | % | 5.9 | % | ||||||||||
Net income | 0.3 | % | 4.3 | % | 6.7 | % | 4.9 | % | 3.2 | % | ||||||||||
Net income attributable to XO Group Inc. | 0.3 | % | 4.3 | % | 6.7 | % | 4.9 | % | 3.2 | % | ||||||||||
20
As of December 31, | ||||||||||||||||||||
2014 | 2013 | 2012 | 2011 | 2010 | ||||||||||||||||
(In Thousands) | ||||||||||||||||||||
Balance Sheet Data: | ||||||||||||||||||||
Cash, cash equivalents and investments(b) | $ | 89,955 | $ | 90,697 | $ | 77,407 | $ | 77,376 | $ | 139,586 | ||||||||||
Working capital(b) | 84,789 | 86,875 | 74,297 | 81,816 | 141,847 | |||||||||||||||
Total assets(b) | 193,582 | 193,242 | 183,354 | 188,312 | 238,328 | |||||||||||||||
Stockholders' equity(b) | 157,926 | 155,890 | 144,507 | 150,343 | 210,376 | |||||||||||||||
Noncontrolling interest | — | — | — | 536 | — | |||||||||||||||
Total equity(b) | 157,926 | 155,890 | 144,507 | 150,879 | 210,376 | |||||||||||||||
___________
(a) | Reference is made to Note 6: Goodwill and Other Intangible Assets in the Notes to the Consolidated Financial Statements on this Form 10-K, for further details addressing impairment charges recorded during the years ended December 31, 2014, 2013 and 2012 for certain of our intangible assets. Also, in 2014 and 2013, amounts include executive separation and other severance charges. |
(b) | Reference is made to Note 8: Capital Stock in the Notes to the Consolidated Financial Statements on this Form 10-K, for further details addressing the stock repurchases made during the years ended December 31, 2014 and 2012. Additional stock repurchases, authorized by our Board of Directors, were made in 2011 including a privately negotiated stock purchase transaction with Macy's, Inc. This stock repurchase activity was the primary driver for the decreases in cash (and therefore, working capital and total assets), stockholders' equity, total equity and weighted average shares outstanding for the year ended December 31, 2011. |
21
Item 7. Management’s Discussion and Analysis of Financial Condition and Results of Operations
You should read the following discussion and analysis in conjunction with our consolidated financial statements and related notes included elsewhere in this report. This discussion contains forward-looking statements relating to future events and the future performance of XO Group based on our current expectations, assumptions, estimates and projections about us and our industry. These forward-looking statements involve risks and uncertainties. Actual results or events could differ materially from those anticipated in such forward-looking statements as a result of certain factors, as more fully described in this section and elsewhere in this report. We undertake no obligation to update publicly any forward-looking statements for any reason, even if new information becomes available or other events occur in the future.
Executive Overview
The year ended December 31, 2014 was a transformational investment year. Investments were made in all areas of the business to (i) enhance our marketplace, connecting every couple to vendors and services they need to execute their perfect day and (ii) invest in our business to invigorate our team and products to drive more audience and vendor engagement.
During the year ended December 31, 2014, revenue increased 7.4% to $143.7 million, driven by our local and national online advertising offerings, gross margin improved 1.9% to 85.2% due to growth in high margin online and registry revenue and a continued reduction in revenue from the lower margin e-commerce business, and operating expenses increased 14.8% to $113.6 million due to our targeted investments in our business.
Our income before income taxes for the year ended December 31, 2014 declined to $6.9 million. Our 2014 results were reduced by $4.7 million, primarily related to (i) executive separation charges related to the transition to a new management team, (ii) a loss on the sale of our Ijie operations in China, and (iii) separation charges and asset impairments associated with the exit of our warehouse operations in Redding, California.
We continuously examine our operations. After reviewing the past and expected financial performance of our warehouse operations in Redding, California, in October 2014, we committed to a plan to cease operations there. The process of the warehouse closure is expected to be completed by end of the first quarter of 2015. We intend to continue to serve the commerce needs of our users through a registry and partner-based model for providing users with desired products and services.
Furthermore, from 2010 to 2014, we operated a wedding content and publishing business in China. During 2014 we determined an expansion of the content and publishing business into China was no longer in our best interest. In December of 2014, we completed the disposition of our China wedding content and publishing operations (Ijie).
Our financial condition remains strong with $90.0 million of cash and cash equivalents as of December 31, 2014 and no debt. During the year ended December 31, 2014, cash generated from operations totaled $20.0 million, capital expenditures totaled $5.1 million, acquisitions and investments in equity interests totaled $9.7 million and cash used in financing activities totaled $4.3 million. Financing activities included the repurchases of common stock totaling $1.6 million as part of a $20.0 million share repurchase authorization and $4.8 million for net share settlements of employee stock-based awards.
Key Metrics
We evaluate our operating and financial performance using various performance indicators. Our management relies on the key performance indicators set forth below to help us evaluate growth trends, establish budgets, measure the effectiveness of our sales and marketing efforts and assess operational efficiencies. We discuss revenue and gross margin under Results of Operations, and cash flow results under Liquidity and Capital Resources. Other measures of our performance, including adjusted EBITDA, Adjusted net income and Free cash flow are defined and discussed under Non-GAAP Financial Measures below.
22
Years Ended December 31, | ||||||||||||
2014 | 2013 | 2012 | ||||||||||
(Dollar Amounts in Thousands) | ||||||||||||
Total net revenue | $ | 143,664 | $ | 133,814 | $ | 129,131 | ||||||
Total gross margin | 85.2 | % | 83.3 | % | 82.5 | % | ||||||
Adjusted EBITDA | $ | 24,602 | $ | 26,722 | $ | 25,469 | ||||||
Adjusted net income | $ | 6,526 | $ | 8,920 | $ | 9,235 | ||||||
Free cash flow | $ | 14,947 | $ | 16,275 | $ | 22,542 | ||||||
Cash and cash equivalents at December 31 | $ | 89,955 | $ | 90,697 | $ | 77,407 | ||||||
Total employees at December 31(a) | 641 | 705 | 677 | |||||||||
(a) Reduction in employees in 2014 is a result of exit of Ijie operations.
Non-GAAP Financial Measures
This Form 10-K includes information about certain financial measures that are not prepared in accordance with U.S. generally accepted accounting principles (“GAAP” or “U.S. GAAP”), including adjusted EBITDA, adjusted net income, adjusted net income per diluted share and free cash flow. These non-GAAP measures have important limitations as analytical tools and should not be considered in isolation or as substitutes for an analysis of our results as reported under U.S. GAAP. Our use of these terms may vary from the use of similarly-titled measures by others in our industry due to the potential inconsistencies in the method of calculation and differences due to items subject to interpretation.
Management defines its non-GAAP financial measures as follows:
• | Adjusted EBITDA represents GAAP net income adjusted to exclude, if applicable: (1) income tax expense, (2) depreciation and amortization, (3) stock-based compensation expense, (4) asset impairment charges, (5) loss in equity interests, (6) interest and other income (expense), net (7) net loss attributable to non-controlling interest and (8) other items affecting comparability during the period. |
• | Adjusted net income represents GAAP net income, adjusted items that impact comparability for incremental or unusual costs incurred in the current period, which may include: (1) asset impairment charges, (2) executive separation and other severance charges, (3) non-recurring foreign taxes, interest and penalties, and (4) costs related to exit activities. |
• | Adjusted net income per diluted share represents adjusted net income (as defined above), divided by the diluted weighted-average number of shares outstanding for the period. |
• | Free cash flow represents GAAP net cash provided by operations, less capital expenditures. |
Management believes that these non-GAAP financial measures, when viewed with our results under U.S. GAAP and the accompanying reconciliations, provide useful information about our period-over-period growth and provide additional information that is useful for evaluating our operating performance. However, adjusted EBITDA, adjusted net income, adjusted net income per diluted share and free cash flow are not measures of financial performance under U.S. GAAP and, accordingly, should not be considered substitutes for or superior to net income, net income per diluted share and net cash provided by operating activities as indicators of operating performance.
23
The table below provides reconciliations between the non-GAAP financial measures discussed above to the comparable U.S. GAAP measures:
Years Ended December 31, | ||||||||||||
2014 | 2013 | 2012 | ||||||||||
(In Thousands, Except for per Share Data) | ||||||||||||
Net income | $ | 462 | $ | 5,794 | $ | 8,714 | ||||||
Income tax expense | 6,463 | 4,841 | 5,658 | |||||||||
Depreciation and amortization | 6,969 | 4,808 | 3,874 | |||||||||
Stock-based compensation expense | 6,139 | 6,697 | 6,388 | |||||||||
Asset impairment charges | 530 | 1,430 | 958 | |||||||||
Loss in equity interests | 232 | 2,016 | 55 | |||||||||
Interest and other income, net | (88 | ) | (144 | ) | (113 | ) | ||||||
Net loss attributable to noncontrolling interest | — | — | (65 | ) | ||||||||
Executive separation and severance charges(a) | 2,087 | 350 | — | |||||||||
Foreign VAT, interest and penalties(b) | (592 | ) | 930 | — | ||||||||
Exit of Ijie operations(c) | 1,828 | — | — | |||||||||
Exit of warehouse operations(d) | 572 | — | — | |||||||||
Adjusted EBITDA | $ | 24,602 | $ | 26,722 | $ | 25,469 | ||||||
Depreciation and amortization | (6,969 | ) | (4,808 | ) | (3,874 | ) | ||||||
Stock-based compensation expense | (6,139 | ) | (6,697 | ) | (6,388 | ) | ||||||
Loss in equity interests | (232 | ) | (2,016 | ) | (55 | ) | ||||||
Interest and other income, net | 88 | 144 | 113 | |||||||||
Impairment of equity interest(e) | — | 1,773 | — | |||||||||
Adjusted income before income taxes | 11,350 | 15,118 | 15,265 | |||||||||
Adjusted income tax expense(f) | 4,824 | 6,198 | 6,030 | |||||||||
Adjusted net income | $ | 6,526 | $ | 8,920 | $ | 9,235 | ||||||
Adjusted net income per diluted share | $ | 0.26 | $ | 0.35 | $ | 0.37 | ||||||
Diluted weighted average number of shares outstanding | 25,589 | 25,596 | 25,218 | |||||||||
Net cash provided by operating activities | $ | 20,015 | $ | 22,243 | $ | 25,373 | ||||||
Less: Capital expenditures | (5,068 | ) | (5,968 | ) | (2,831 | ) | ||||||
Free cash flow | $ | 14,947 | $ | 16,275 | $ | 22,542 | ||||||
(a) | Costs impacting comparability included in operating expenses on the consolidated statements of operations for the year ended December 31, 2014 include executive separation and other severance charges of approximately $2.1 million, representing (i) separation payments for certain executive officers and (ii) severance charges for the employees in our Los Angeles office. Of the total executive separation and severance charges, $0.4 million was recorded in product and content development, $0.5 million in sales and marketing and $1.2 million in general and administrative. Costs impacting comparability for the year ended December 31, 2013 include severance charges of $0.4 million recorded in general and administrative for a former executive of our company. |
(b) | Included in general and administrative expenses on the consolidated statements of operations for the year ended December 31, 2014 is a favorable adjustment for foreign value-added tax ("VAT"), interest and penalties of $0.6 million and for the year ended December 31, 2013 an unfavorable adjustment for VAT, interest and penalties of $0.9 million. |
(c) | Included in interest and other income (expense) on the consolidated statements of operations for the year ended December 31, 2014 is a $1.8 million loss on the disposition of our China wedding content and publishing operations. |
24
(d) | Costs impacting comparability included in operating expenses on the consolidated statements of operations for the year ended December 31, 2014 included (i) severance of approximately $0.3 million related to the closure of our warehouse in Redding, CA and (ii) asset impairment charges of approximately $0.3 million. Of the total severance charges, $26,000 was recorded in product and content development, $179,000 in sales and marketing and $60,000 in general and administrative. |
(e) | Impairment of equity interest of $1.8 million is included in loss in equity interests on the consolidated statements of operations for the year ended December 31, 2013. |
(f) | Adjusted income tax expense was calculated using the annual effective tax rate for each respective period, excluding discrete items. |
25
Results of Operations
Year Ended December 31, 2014 Compared to Year Ended December 31, 2013
The following table summarizes results of operations for 2014 compared to 2013:
Year Ended December 31, | |||||||||||||||||||||
2014 | 2013 | Increase/(Decrease) | |||||||||||||||||||
Amount | % of Net Revenue | Amount | % of Net Revenue | Amount | % | ||||||||||||||||
(Dollars in Thousands, Except for per Share Data) | |||||||||||||||||||||
Net revenue | $ | 143,664 | 100.0 | % | $ | 133,814 | 100.0 | % | $ | 9,850 | 7.4 | % | |||||||||
Cost of revenue | 21,195 | 14.8 | 22,401 | 16.7 | (1,206 | ) | (5.4 | ) | |||||||||||||
Gross profit | 122,469 | 85.2 | 111,413 | 83.3 | 11,056 | 9.9 | |||||||||||||||
Operating expenses | 113,572 | 79.0 | 98,906 | 73.9 | 14,666 | 14.8 | |||||||||||||||
Income from operations | 8,897 | 6.2 | 12,507 | 9.3 | (3,610 | ) | (28.9 | ) | |||||||||||||
Loss in equity interest | (232 | ) | (0.2 | ) | (2,016 | ) | (1.5 | ) | (1,784 | ) | (88.5 | ) | |||||||||
Interest and other income (expense), net | (1,740 | ) | (1.2 | ) | 144 | 0.1 | (1,884 | ) | (1,308.3 | ) | |||||||||||
Income before income taxes | 6,925 | 4.8 | 10,635 | 7.9 | (3,710 | ) | (34.9 | ) | |||||||||||||
Income tax expense | 6,463 | 4.5 | 4,841 | 3.6 | 1,622 | 33.5 | |||||||||||||||
Net income | 462 | 0.3 | 5,794 | 4.3 | (5,332 | ) | (92.0 | ) | |||||||||||||
Net income per share: | |||||||||||||||||||||
Basic | $ | 0.02 | $ | 0.24 | $ | (0.22 | ) | (91.7 | )% | ||||||||||||
Diluted | $ | 0.02 | $ | 0.23 | $ | (0.21 | ) | (91.3 | )% | ||||||||||||
Net Revenue
Net revenue increased to $143.7 million for the year ended December 31, 2014, from $133.8 million for the year ended December 31, 2013. The following table sets forth revenue by category for the year ended December 31, 2014 compared to the year ended December 31, 2013, the percentage increase or decrease between those periods, and the percentage of total net revenue that each category represented for those periods:
Year Ended December 31, | |||||||||||||||||
Net Revenue | Percentage Increase/ (Decrease) | Percentage of Total Net Revenue | |||||||||||||||
2014 | 2013 | 2014 | 2013 | ||||||||||||||
(In Thousands) | |||||||||||||||||
National online advertising | $ | 30,456 | $ | 27,216 | 11.9 | % | 21.2 | % | 20.3 | % | |||||||
Local online advertising | 59,093 | 54,445 | 8.5 | 41.1 | 40.7 | ||||||||||||
Total online advertising | 89,549 | 81,661 | 9.7 | 62.3 | 61.0 | ||||||||||||
Registry services | 9,794 | 7,926 | 23.6 | 6.8 | 5.9 | ||||||||||||
Merchandise | 16,223 | 18,406 | (11.9 | ) | 11.3 | 13.8 | |||||||||||
Publishing and other | 28,098 | 25,821 | 8.8 | 19.6 | 19.3 | ||||||||||||
Total net revenue | $ | 143,664 | $ | 133,814 | 7.4 | % | 100.0 | % | 100.0 | % | |||||||
Online advertising — The increase in total online advertising was 9.7%.
Revenue from national online advertising increased 11.9% driven by increased advertising from our Bump brand and moderate growth in our wedding business.
26
Local online advertising revenue increased 8.5%, attributable to an increase in the number of local vendors advertising with us on our network of websites as a result of new vendors and increased customer retention rates. As of December 31, 2014, we had more than 24,700 local paying vendors who displayed more than 33,400 profiles, compared to more than 22,700 local paying vendors displaying more than 30,500 profiles as of December 31, 2013.
Registry services — The increase of 23.6% was primarily driven by increases in guest purchase conversions with our retail partners, the number of events with registries, and guest user engagement with our registry aggregation pages.
Merchandise — The decrease of 11.9% was primarily driven by lower revenue generated as a result of reduced site traffic, an overall lower average order value and a decrease in shipping revenue due to free shipping and other promotions. In October 2014, we announced that after a strategic review we would cease wedding merchandising operations at its Redding, California warehouse. We intend to continue to serve the commerce needs of our users through a registry and partner-based model for providing users with desired products and services.
Publishing and other — The increase of 8.8% was primarily driven by an increase in advertising revenue related to The Knot national and regional magazines, specifically higher revenue per advertising page sold for the national magazine, as well as an increase in the number of advertising pages for the regional magazines.
In 2015, we believe our total revenue will be negatively impacted by our decision to exit our warehouse operations and Ijie, together representing $17.1 million in 2014 revenue, which we believe will be partially offset by growth opportunities in our other business lines.
Gross Profit/Gross Margin
Cost of revenues consists of the cost of merchandise sold, which includes outbound shipping and personalization costs, costs related to the production of national and regional magazines, payroll and related expenses for our personnel who are responsible for the production of online and offline media, and costs of internet and hosting services. Gross margin improved 1.9% to 85.2%, compared to 83.3% in 2013. The following table presents the components of gross profit and gross margin for the year ended December 31, 2014 compared to the year ended December 31, 2013:
Year Ended December 31, | |||||||||||||||||||||
2014 | 2013 | Increase/(Decrease) | |||||||||||||||||||
Gross Profit | Gross Margin % | Gross Profit | Gross Margin % | Gross Profit | Gross Margin % | ||||||||||||||||
(Dollars in Thousands) | |||||||||||||||||||||
Online advertising (national and local) | $ | 87,779 | 98.0 | % | $ | 79,734 | 97.6 | % | $ | 8,045 | 0.4 | % | |||||||||
Registry services | 9,794 | 100.0 | 7,926 | 100.0 | 1,868 | — | |||||||||||||||
Merchandise | 5,309 | 32.7 | 7,110 | 38.6 | (1,801 | ) | (5.9 | ) | |||||||||||||
Publishing and other | 19,587 | 69.7 | 16,643 | 64.5 | 2,944 | 5.2 | |||||||||||||||
Total gross profit | $ | 122,469 | 85.2 | % | $ | 111,413 | 83.3 | % | $ | 11,056 | 1.9 | % | |||||||||
The increase in the total gross margin percentage was primarily attributable to increases in revenue for the two lines of business that have the highest margins, specifically online advertising and registry services, as well as improved margins within our publishing business resulting from growth in advertising pages and cost savings under a contract with a new printer commencing in early 2014. Our gross margin percentage was also favorably impacted by a decline in revenue from our lower-margin merchandise business due to greater promotional sales of product, including personalized product.
Operating Expenses
Operating expenses increased $14.7 million, or 14.8%, to $113.6 million for the year ended December 31, 2014. Drivers of the operating expense growth were costs associated with revenue growth, the investment we are making in our transformation, and accelerated amortization of the WeddingChannel trade name.
The following table presents the components of operating expenses and the percentage of net revenue that each component represented for the year ended December 31, 2014 compared to the year ended December 31, 2013:
27
Year Ended December 31, | |||||||||||||||||
Operating Expenses | Percentage Increase/ (Decrease) | Percentage of Total Net Revenue | |||||||||||||||
2014 | 2013 | 2014 | 2013 | ||||||||||||||
(In Thousands) | |||||||||||||||||
Product and content development | $ | 35,820 | $ | 29,877 | 19.9 | % | 24.9 | % | 22.3 | % | |||||||
Sales and marketing | 44,330 | 39,718 | 11.6 | 30.9 | 29.7 | % | |||||||||||
General and administrative | 25,617 | 23,073 | 11.0 | 17.8 | 17.2 | % | |||||||||||
Asset impairment charges | 836 | 1,430 | (41.5 | ) | 0.6 | 1.1 | % | ||||||||||
Depreciation and amortization | 6,969 | 4,808 | 44.9 | 4.9 | 3.6 | % | |||||||||||
Total operating expenses | $ | 113,572 | $ | 98,906 | 14.8 | % | 79.1 | % | 73.9 | % | |||||||
Product and Content Development — The increase of 19.9% was primarily attributable to an increase in employee headcount, as well as an increase in expenditures to support our initiatives in product and technology development.
Sales and Marketing — The increase of 11.6% was primarily attributable to increased commissions and sales incentives as a result of our increased revenue.
General and Administrative — The increase of 11.0% was primarily attributable to increased compensation costs resulting from changes to the executive team, including executive separation charges.
Asset impairment charges — During the year ended December 31, 2014, we recorded $0.2 million in impairment charges related to a tradename and certain URLs and $0.6 million in impairments related to certain long-lived assets. During the year ended December 31, 2013, we recorded $1.4 million in impairment charges related to tradenames, including $1.2 million for the WeddingChannel tradename.
Depreciation and Amortization — The increase of 44.9% was primarily attributable to an increase in amortization of the WeddingChannel tradename.
Interest and Other Income (Expense), Net
Interest and other income (expense) was $1.7 million for the year ended December 31, 2014, and included a $1.8 million loss incurred on the disposition of our Ijie operations in China. Interest and other income (expense) for the year ended December 31, 2013 represented other income of $144,000 primarily attributable to other income recorded by one of our foreign subsidiaries for subsidies received from the local government, as well as foreign currency transaction gains.
Loss in Equity Interests
Loss in equity interests for the years ended December 31, 2014 and 2013 was $0.2 million and $2.0 million, respectively. During the year ended December 31, 2014, we recognized a loss on our equity investment in GigMasters.com, Inc. of $0.2 million, representing our share of this entity's losses for the year. During the year ended December 31, 2013, we recorded an impairment charge for our investment in PricingEngine, Inc. of $1.8 million as a result of our other-than-temporary impairment analysis.
Income Tax Expense
The following table presents our income before income taxes, income tax expense and effective tax rate for the periods presented:
Year Ended December 31, | ||||||||
2014 | 2013 | |||||||
(Dollars in Thousands) | ||||||||
Income before income taxes | $ | 6,925 | $ | 10,635 | ||||
Income tax expense | 6,463 | 4,841 | ||||||
Effective tax rate | 93.3 | % | 45.5 | % | ||||
28
The effective tax rate for the year ended December 31, 2014 was 93.3%, compared to 45.5% for the year ended December 31, 2013. The increase in our effective tax rate in the current year was primarily attributable to the sale of our Ijie operations in China. We expect an effective tax rate between 41% to 43% on an ongoing basis; however, our effective tax rate may fluctuate significantly based on the mix of our taxable income among states, changes in the valuation of our deferred tax assets or liabilities, and changes in tax laws, regulations, or interpretations thereof.
Year Ended December 31, 2013 Compared to Year Ended December 31, 2012
The following table summarizes results of operations for 2013 compared to 2012:
Year Ended December 31, | |||||||||||||||||||||
2013 | 2012 | Increase/(Decrease) | |||||||||||||||||||
Amount | % of Net Revenue | Amount | % of Net Revenue | Amount | % | ||||||||||||||||
(Dollars in Thousands, Except for per Share Data) | |||||||||||||||||||||
Net revenue | $ | 133,814 | 100.0 | % | $ | 129,131 | 100.0 | % | $ | 4,683 | 3.6 | % | |||||||||
Cost of revenue | 22,401 | 16.7 | 22,602 | 17.5 | (201 | ) | (0.8 | ) | |||||||||||||
Gross profit | 111,413 | 83.3 | 106,529 | 82.5 | 4,884 | 4.6 | |||||||||||||||
Operating expenses | 98,906 | 73.9 | 92,280 | 71.5 | 6,626 | 7.2 | |||||||||||||||
Income from operations | 12,507 | 9.4 | 14,249 | 11.0 | (1,742 | ) | (12.2 | ) | |||||||||||||
Loss in equity interest | (2,016 | ) | (1.5 | ) | (55 | ) | — | (1,961 | ) | (3,565.5 | ) | ||||||||||
Interest and other income (expense), net | 144 | 0.1 | 113 | 0.1 | 31 | 27.4 | |||||||||||||||
Income before income taxes | 10,635 | 8.0 | 14,307 | 11.1 | (3,672 | ) | (25.7 | ) | |||||||||||||
Income tax expense | 4,841 | 3.6 | 5,658 | 4.4 | (817 | ) | (14.4 | ) | |||||||||||||
Net income | 5,794 | 4.3 | 8,649 | 6.7 | (2,855 | ) | (33.0 | ) | |||||||||||||
Plus: net loss attributable to noncontrolling interest | — | — | 65 | — | (65 | ) | (100.0 | ) | |||||||||||||
Net income attributable to XO Group Inc. | $ | 5,794 | 4.3 | % | $ | 8,714 | 6.7 | % | $ | (2,920 | ) | (33.5 | )% | ||||||||
Net income per share attributable to XO Group Inc. common stockholders: | |||||||||||||||||||||
Basic | $ | 0.24 | $ | 0.35 | $ | (0.11 | ) | (31.4 | )% | ||||||||||||
Diluted | $ | 0.23 | $ | 0.35 | $ | (0.12 | ) | (34.3 | )% | ||||||||||||
Net Revenue
Net revenue increased to $133.8 million for the year ended December 31, 2013, from $129.1 million for the year ended December 31, 2012. The following table sets forth revenue by category for the year ended December 31, 2013 compared to the year ended December 31, 2012, the percentage increase or decrease between those periods, and the percentage of total net revenue that each category represented for those periods:
29
Year Ended December 31, | |||||||||||||||||
Net Revenue | Percentage Increase/ (Decrease) | Percentage of Total Net Revenue | |||||||||||||||
2013 | 2012 | 2013 | 2012 | ||||||||||||||
(In Thousands) | |||||||||||||||||
National online advertising | $ | 27,216 | $ | 26,561 | 2.5 | % | 20.3 | % | 20.6 | % | |||||||
Local online advertising | 54,445 | 49,914 | 9.1 | 40.7 | 38.7 | ||||||||||||
Total online advertising | 81,661 | 76,475 | 6.8 | 61.0 | 59.3 | ||||||||||||
Registry services | 7,926 | 6,231 | 27.2 | 5.9 | 4.8 | ||||||||||||
Merchandise | 18,406 | 21,359 | (13.8 | ) | 13.8 | 16.5 | |||||||||||
Publishing and other | 25,821 | 25,066 | 3.0 | 19.3 | 19.4 | ||||||||||||
Total net revenue | $ | 133,814 | $ | 129,131 | 3.6 | % | 100.0 | % | 100.0 | % | |||||||
Online advertising - The increase in total online advertising of 6.8% was primarily driven by an increase in revenue from local advertising programs. Local online advertising revenue increased 9.1%, primarily attributable to an increase in the number of local vendors advertising with us on our network of websites, as well as an increase in average vendor spending. As of December 31, 2013, we had over 22,700 local vendors displaying over 30,500 profiles, compared to over 22,100 vendors displaying over 29,100 profiles as of December 31, 2012. Revenue from national online advertising also contributed to the increase but at a lower growth rate year over year.
Registry services - The increase of 27.2% was primarily driven by an increase in sales from our registry partners, as well as the favorable impact from several product enhancements resulting from our registry replatform. These product enhancements significantly improved user experience with our registry services, resulting in a higher conversion rate to purchase.
Merchandise - The decrease of 13.8% was primarily driven by lower revenue generated from our ancillary sites due to reduced site traffic and a reduction in storefronts, due to a shift in focus on The Knot Shop.
Publishing and other - The increase of 3.0% was primarily driven by an increase in revenue per advertising page sold related to The Knot national and regional magazines, as well as an increase in the number of advertising pages for the regional magazines.
Gross Profit/Gross Margin
Cost of revenues consists of the cost of merchandise sold, which includes outbound shipping and personalization costs, costs related to the production of national and regional magazines, payroll and related expenses for our personnel who are responsible for the production of online and offline media, and costs of internet and hosting services. Gross margin improved 0.8% to 83.3%, compared to 82.5% in 2012. The following table presents the components of gross profit and gross margin for the year ended December 31, 2013 compared to the year ended December 31, 2012:
Year Ended December 31, | |||||||||||||||||||||
2013 | 2012 | Increase/(Decrease) | |||||||||||||||||||
Gross Profit | Gross Margin % | Gross Profit | Gross Margin % | Gross Profit | Gross Margin % | ||||||||||||||||
(Dollars in Thousands) | |||||||||||||||||||||
Online advertising (national and local) | $ | 79,734 | 97.6 | % | $ | 74,734 | 97.7 | % | $ | 5,000 | (0.1 | )% | |||||||||
Registry services | 7,926 | 100.0 | 6,231 | 100.0 | 1,695 | — | |||||||||||||||
Merchandise | 7,110 | 38.6 | 8,905 | 41.7 | (1,795 | ) | (3.1 | )% | |||||||||||||
Publishing and other | 16,643 | 64.5 | 16,659 | 66.5 | (16 | ) | (2.0 | )% | |||||||||||||
Total gross profit | $ | 111,413 | 83.3 | % | $ | 106,529 | 82.5 | % | $ | 4,884 | 0.8 | % | |||||||||
The increase in the total gross margin percentage was primarily attributable to increases in revenue for the two lines of business that have the highest margins, specifically online advertising and registry services, and by a decline in revenue from our lower-margin merchandise business. Our registry services business has no cost of revenue. Our gross margin percentage for merchandise
30
declined due to greater promotional sales of product, including personalized product. Our gross margin percentage for publishing and other declined due to an increase in returns of newsstand copies distributed for our National magazine.
Operating Expenses
Operating expenses increased 7.2% to $98.9 million, compared to $92.3 million in 2012 and as a percentage of net revenue, operating expenses were 73.9% and 71.5% for the years ended December 31, 2013 and 2012, respectively.
The following table presents the components of operating expenses and the percentage of revenue that each component represented for the year ended December 31, 2013 compared to the year ended December 31, 2012:
Year Ended December 31, | |||||||||||||||||
Operating Expenses | Percentage Increase/ (Decrease) | Percentage of Total Net Revenue | |||||||||||||||
2013 | 2012 | 2013 | 2012 | ||||||||||||||
(In Thousands) | |||||||||||||||||
Product and content development | $ | 29,877 | $ | 26,229 | 13.9 | % | 22.3 | % | 20.4 | % | |||||||
Sales and marketing | 39,718 | 40,239 | (1.3 | ) | 29.7 | 31.2 | |||||||||||
General and administrative | 23,073 | 20,980 | 10.0 | 17.2 | 16.2 | ||||||||||||
Asset impairment charges | 1,430 | 958 | 49.3 | 1.1 | 0.7 | ||||||||||||
Depreciation and amortization | 4,808 | 3,874 | 24.1 | 3.6 | 3.0 | ||||||||||||
Total operating expenses | $ | 98,906 | $ | 92,280 | 7.2 | % | 73.9 | % | 71.5 | % | |||||||
Product and Content Development - The increase of 13.9% was primarily attributable to an increase in employee headcount, as well as an increase in non-capitalizable expenditures to support our initiatives in product and technology development.
Sales and Marketing - The decrease of 1.3% was primarily attributable to a decrease in employee headcount.
General and Administrative - The increase of 10.0% was primarily attributable to increased compensation costs resulting from changes to the executive team, including executive separation charges, as well as provisions for value-added taxes, interest and related penalties payable in China.
Asset impairment charges - During the year ended December 31, 2013, we recorded $1.4 million in impairment charges related to tradenames, including $1.2 million for the WeddingChannel tradename (see the Critical Accounting Policies section of this Management's Discussion and Analysis for additional details), compared to impairment charges of approximately $1.0 million in the prior year on the tradenames of WeddingChannel and an e-commerce company that we acquired in May 2009.
Depreciation and Amortization - The increase of 24.1% was primarily attributable to the full year of amortization expense recorded in 2013 related to the tradenames for WeddingChannel and an e-commerce company we acquired in May 2009, compared to three months of amortization related to these tradenames recorded in 2012. These intangible assets were considered indefinite-lived assets until the fourth quarter of 2012, when they were changed to definite-lived assets as a result of our annual impairment analysis.
Interest and Other Income (Expense), Net
Interest and other income, net increased 27.4% to $144,000 for the year ended December 31, 2013, compared to $113,000 for the year ended December 31, 2012. The increase was primarily attributable to other income recorded by one of our foreign subsidiaries for subsidies received from the local government, as well as slightly higher foreign currency transaction gains as compared to the prior year.
Loss in Equity Interests
Loss in equity interests for the years ended December 31, 2013 and 2012 was $2.0 million and $55,000, respectively. The increase in the loss for the current year resulted from an impairment charge that was recorded for our investment in Pricing Engine, Inc. of $1.8 million, as a result of our other-than-temporary impairment analysis performed in the fourth quarter. The remaining increase in the loss in equity interests for the year ended December 31, 2013 was due to the recognition of our portion of the total losses related to its equity interests.
31
Income Tax Expense
The following table presents our income before income taxes, income tax expense and effective tax rate for the periods presented:
Year Ended December 31, | ||||||||
2013 | 2012 | |||||||
(Dollars in Thousands) | ||||||||
Income before income taxes | $ | 10,635 | $ | 14,307 | ||||
Income tax expense | 4,841 | 5,658 | ||||||
Effective tax rate | 45.5 | % | 39.5 | % | ||||
The effective tax rate for the year ended December 31, 2013 was 45.5%, compared to 39.5% for the year ended December 31, 2012. The increase in our effective tax rate in the current year was attributable to additional foreign taxes recorded of $78,000 related to the years ended December 31, 2010 through 2012, and an increase to unrecognized tax benefits related to current and prior year filings. Our effective tax rate may fluctuate significantly based on the mix of our taxable income among states or due to the income recognized by our international entities, changes in the valuation of our deferred tax assets or liabilities, and changes in tax laws, regulations, or interpretations thereof.
Net Loss Attributable to Noncontrolling Interest
There was no net loss attributable to noncontrolling interest for the year ended December 31, 2013. Net loss attributable to noncontrolling interest for the year ended December 31, 2012 resulted from the 25% equity interest in one of our consolidated subsidiaries held by another investor until April 20, 2012, when we purchased the remaining noncontrolling interest for $500,000.
Liquidity and Capital Resources
Cash Flow
Cash and cash equivalents consist of cash and highly liquid investments with maturities of 90 days or less at the date of acquisition. At December 31, 2014, we had $90.0 million in cash and cash equivalents, compared to $90.7 million at December 31, 2013 and $77.4 million at December 31, 2012.
The following table sets forth our cash flows from operating activities, investing activities and financing activities for the periods indicated:
For the Year Ended December 31, | ||||||||||||
2014 | 2013 | 2012 | ||||||||||
(In Thousands) | ||||||||||||
Net cash provided by operating activities | $ | 20,015 | $ | 22,243 | $ | 25,373 | ||||||
Net cash used in investing activities | (16,490 | ) | (7,952 | ) | (4,368 | ) | ||||||
Net cash used in financing activities | (4,267 | ) | (1,001 | ) | (20,974 | ) | ||||||
(Decrease) increase in cash and cash equivalents | $ | (742 | ) | $ | 13,290 | $ | 31 | |||||
Operating Activities
Net cash provided by operating activities was $20.0 million for the year ended December 31, 2014. This was driven by our net income of $0.5 million adjusted for non-cash items. Non-cash items included depreciation, amortization, stock-based compensation and other non-cash items of $18.2 million. These contributions to cash from operations were partially offset by an increase in operating assets and liabilities of $1.4 million, including a $4.0 million increase in accounts receivable, net of deferred revenue. The increase in account receivable was driven by a mix shift towards our revenue lines such as registry and national advertising, which generally have longer payment terms, and away from revenue in our merchandise business, which has shorter payment terms. Additionally, we adjusted our billing processes for our national advertising business to be consistent with industry standards, which extended our billing and collection cycle. The increases in operating assets and liabilities include a $1.8 million
32
decrease in inventories as a result of initiating the process of closing our warehouse operations in Redding, California, and a $3.8 million decrease in other assets.
Net cash provided by operating activities was $22.2 million for the year ended December 31, 2013. This was driven by our net income of $5.8 million adjusted for non-cash items. Non-cash items included depreciation and amortization, loss on disposal or sale of assets, stock-based compensation and other non-cash items of $16.7 million. These contributions to cash from operations were partially offset by an decrease in operating assets and liabilities of $0.2 million, including a $3.6 million increase in other assets, offset by a $2.8 million increase in accounts receivable, net of deferred revenue, and an increase in accounts payable and accrued expenses of $0.9 million.
Net cash provided by operating activities was $25.4 million for the year ended December 31, 2012. This was driven by our net income of $8.6 million adjusted for non-cash items. Non-cash items included depreciation and amortization, stock-based compensation and other non-cash items of $9.2 million. Also contributing to the increase was an increase in the change in operating assets and liabilities of $7.5 million, primarily due to decreases in other assets of $2.9 million, a decrease in accounts receivable, net of deferred revenue, of $2.1 million, a decrease in inventories of $1.6 million, and an increase in deferred rent of $0.7 million.
Investing Activities
Net cash used in investing activities was $16.5 million for the year ended December 31, 2014, primarily related to acquisitions totaling $5.7 million, as well as an investment in Touch Media International Holdings, a company with an interactive in-taxi advertising and media platform, with operations in China of $4.0 million for a minority equity interest of approximately 3%. Also contributing to the net cash used in investing activities were investments in capitalized software of $4.3 million and purchases of property and equipment of $0.8 million. Included as part of net assets sold with the disposition of our Ijie operations was $1.6 million in cash.
Net cash used in investing activities was $8.0 million for the year ended December 31, 2013, primarily consisting of investments in capitalized software of $4.3 million, purchases of property and equipment of $1.6 million and acquisitions and investments in equity interests of $1.9 million. Additionally, upon the maturity of the U.S. Treasury Bills purchased in May 2011, we purchased new U.S. Treasury Bills using the proceeds received from our prior investment of $2.6 million. These U.S. Treasury Bills serve as the collateral for the letter of credit related to our leased property for the corporate headquarters in New York. Pursuant to our lease agreement, the letter of credit is required to be in effect during the entire term of the lease as security for our obligations under the lease.
Net cash used in investing activities was $4.4 million for the year ended December 31, 2012, primarily consisting of investments in capitalized software of $1.5 million, purchases of property and equipment of $1.3 million and investments in equity interests of $1.5 million. Upon the maturity of the U.S. Treasury Bills purchased in May 2011, we purchased new U.S. Treasury Bills using the proceeds received from our prior investment of $2.6 million. These U.S. Treasury Bills serve as the collateral for the letter of credit related to our leased property for the corporate headquarters in New York. Pursuant to our lease agreement, the letter of credit is required to be in effect during the entire term of the lease as security for our obligations under the lease.
Financing Activities
Net cash used in financing activities was $4.3 million for the year ended December 31, 2014, primarily driven by cash used to satisfy tax withholding obligations for employees related to the vesting of their restricted stock awards of $4.8 million and the repurchase of shares totaling $1.6 million, partially offset by excess tax benefits related to stock awards of $1.3 million and the proceeds from the issuances of common stock in connection with our employee stock purchase plan and the exercise of stock options of $0.9 million.
Net cash used in financing activities was $1.0 million for the year ended December 31, 2013. This was driven by cash used to satisfy tax withholding obligations for employees related to the vesting of their restricted stock awards of $1.8 million. This use of cash was partially offset by the proceeds from the issuances of common stock in connection with our employee stock purchase plan, as well as the exercise of stock options of $0.5 million and excess tax benefits from stock-based awards of $0.3 million.
Net cash used in financing activities was $21.0 million for the year ended December 31, 2012. This was driven by repurchases of our common stock under our Board-approved stock repurchase programs. On December 19, 2011, the Board of Directors authorized a stock repurchase program of $20.0 million of our common stock. Under this program, we repurchased 2.1 million shares of our stock in the open market at an average price of $8.96 per share, for a total price of $18.9 million. All shares were retired upon repurchase. On June 12, 2012, we completed the program. We also had repurchases of common stock in connection
33
with the surrender of these shares by employees to satisfy tax withholding obligations related to the vesting of restricted stock awards of $1.9 million. The reversal of excess tax benefits for stock-based awards of $0.4 million also contributed to the net cash used in financing activities. These uses of cash were partially offset by the proceeds from the issuance of common stock in connection with our employee stock purchase plan, as well as the exercise of stock options of $0.3 million.
We expect our sources of liquidity to primarily include cash generated from operations. We believe that our existing cash and cash equivalents, together with cash expected to be generated from operations, will be sufficient to fund our operating activities, anticipated capital expenditures, investments in product and technology, potential business and asset acquisitions, strategic investments, and repurchases of our common stock for the foreseeable future.
Contractual Obligations and Commitments
The following table summarizes XO Group’s contractual obligations as of December 31, 2014:
Payments Due by Period | ||||||||||||||||||||
Total | Less Than 1 Year | 1 – 3 Years | 3 – 5 Years | More Than 5 Years | ||||||||||||||||
(In Thousands) | ||||||||||||||||||||
Operating leases | $ | 21,514 | $ | 3,368 | $ | 5,685 | $ | 5,648 | $ | 6,813 | ||||||||||
Purchase commitments | 2,704 | 1,957 | 747 | — | — | |||||||||||||||
Total | $ | 24,218 | $ | 5,325 | $ | 6,432 | $ | 5,648 | $ | 6,813 | ||||||||||
The above table excludes deferred rent of $5.2 million, which substantially represented accruals to recognize rent expense on a straight-line basis over the respective lives of our operating leases under which rental payments increase over the lease periods. These accruals will be reduced as the operating lease payments are made.
Due to the uncertainty with respect to the timing of future cash flows associated with our unrecognized tax benefits at December 31, 2014, we are unable to make a reasonably reliable estimate of the timing of any potential cash settlements with taxing authorities. Therefore, $0.9 million of unrecognized tax benefits have been excluded from the contractual obligation table above.
In connection with the sale of our Ijie operations, we have agreed to indemnify the buyers for certain liabilities that may arise related to events prior to the sale transaction or breach of our covenants under the sale agreement.
Off-Balance Sheet Arrangements
As of December 31, 2014, we did not have any relationships with unconsolidated entities or financial partnerships, such as entities often referred to as structured finance or special purpose entities, which would have been established for the purpose of facilitating off-balance sheet arrangements or other contractually narrow or limited purposes.
Seasonality
We believe that the impact of the frequency of weddings varying from quarter to quarter results in lower registry services and merchandise revenues in the first and fourth quarters. Our publishing business typically experiences a quarter to quarter revenue decline in the first and third quarters due to the cyclical pattern of our regional publishing schedule. We could experience seasonal fluctuations in results as a result of our e-commerce transition.
Critical Accounting Policies and Estimates
The discussion and analysis of our financial condition and results of operations are based upon our consolidated financial statements, which have been prepared in accordance with U.S. GAAP. The preparation of these financial statements requires us to make estimates and judgments that affect the reported amounts of assets, liabilities, revenues and expenses, and related disclosure of contingent assets and liabilities on an on-going basis. Significant estimates and assumptions made by management include the determination of fair value of equity awards issued, fair value of our reporting unit, valuation of intangible assets (and their related useful lives), certain components of the income tax provisions, including valuation allowances on our deferred tax assets, compensation accruals, allowances for bad debts, inventory obsolescence reserves and reserves for future returns. We base our estimates and assumptions on historical experience and on various other factors that we believe to be reasonable under the circumstances. The level of uncertainty in estimates and assumptions increases with the length of time until the underlying transactions are completed. Actual results could differ from estimates in amounts that may be material to the financial statements.
34
We believe the following critical accounting policies involve significant areas of management’s estimates and judgments in the preparation of our consolidated financial statements. For further information, refer to Note 2 of the Consolidated Financial Statements included herein.
Revenue Recognition
We recognize revenues primarily from the sale of online advertising programs, commissions earned in connection with the sale of gift registry products, the sale of merchandise and the publication of magazines, provided that there is persuasive evidence of an arrangement, the service has been provided or the product has been shipped, the selling price is fixed or determinable, collection is reasonably assured and we have no significant remaining obligation.
Online programs are designed to integrate advertising with online editorial content. Advertisers can purchase the exclusive right to promote products or services on a specific online editorial area and can purchase a special feature on our sites. These arrangements commonly include banner advertisements and direct e-mail marketing. Advertisers can also promote their services and products within the programming on our streaming video channels, The Knot TV, The Bump TV and The Nest TV.
Online advertising includes online banner advertisements and direct e-mail marketing as well as placement in our online search tools. This category also includes online listings, including preferred placement and other premium programs, in the local area of our websites for local wedding and other vendors. Local vendors may purchase online listings through fixed term contracts or open-ended subscriptions.
Certain elements of online advertising contracts provide for the delivery of a minimum number of impressions. Impressions are the featuring of a customer’s advertisement, banner, link or other form of content on our sites. We recognize online advertising revenue over the duration of the contracts on a straight-line basis when we deliver impressions in excess of minimum guarantees. To the extent that minimum guaranteed impressions are not met, we are often obligated to extend the period of the contract until the guaranteed impressions are achieved. If this occurs, we defer and recognize the corresponding revenue over the extended period based on impressions delivered.
Registry services revenue primarily represents commissions from retailers who participate in our registry aggregation service, which offers couples and their guests the opportunity to view multiple registries in one location and for guests to order gifts off of these registries. After the retail partners fulfill and ship the sales orders, the related commissions are contractually earned by us and recognized as revenue. Product returns or exchanges do not materially impact the commissions earned by us. We only record net commissions, and not gross revenue and cost of revenue associated with these products, since we are not primarily obligated in these transactions, are not subject to inventory risk and amounts earned are determined using a fixed percentage.
Merchandise revenue generally includes the selling price of wedding supplies through our websites, as well as related outbound shipping and handling charges since we are the primary party obligated in a transaction, are subject to inventory risk, and we establish our own pricing and selection of suppliers. Merchandise revenue is recognized when products are shipped to customers, reduced by discounts as well as an allowance for estimated sales returns. Merchandise revenue excludes related sales taxes collected.
Publishing revenue primarily includes print advertising revenue derived from the publication of national and regional magazines and guides. This revenue is recognized upon the publication of the related magazines, at which time all material services related to the magazine have been performed. Additionally, publishing revenue is derived from the sale of magazines on newsstands and in bookstores, and from author royalties received related to book publishing contracts. Revenue from the sale of magazines is reduced by an allowance for estimated sales returns. Author royalties, to date, have been derived primarily from publisher royalty advances that are recognized as revenue when all of our contractual obligations have been met, which is typically upon the delivery to, and acceptance by, the publisher of the final manuscript.
Multiple-deliverables included in an arrangement, primarily online and print advertising sales, are separated into different units of accounting and the arrangement consideration is allocated to the identified separate units based on their relative selling prices. Selling prices for deliverables that qualify as separate units of accounting are determined using a hierarchy of: (1) vendor-specific objective evidence of selling price, (2) third party evidence, and (3) best estimate of selling price. We use best estimate of selling price of our deliverables in allocating consideration to each deliverable since deliverables are typically priced with a wide range of discounts. Our best estimate of selling price is intended to represent the price at which we would sell the deliverable if we were to sell the item regularly on a stand-alone basis. The amount of revenue allocated to delivered items is limited by contingent revenue, if any. We evaluate multiple contracts entered into with the same advertiser as these contracts may need to be combined and accounted for as a single arrangement when the economics of the individual contracts cannot be understood without reference to the arrangement as a whole.
35
Allowance for Doubtful Accounts
We maintain an allowance for doubtful accounts for estimated losses resulting from the inability of our customers to make required payments. In determining these allowances, we evaluate a number of factors, including the credit risk of customers, historical trends and other relevant information. If the financial condition of our customers were to deteriorate, additional allowances may be required. Allowance for doubtful accounts has ranged between $1.5 million to $2.8 million over the three year period ended December 31, 2014. A 1% change in the balance of allowance for doubtful accounts as a percentage of gross accounts receivable would change our annual operating expense by $0.1 million to $0.2 million.
Goodwill, Other Intangible and Long-lived Assets
The purchase price of acquired companies is allocated between intangible assets and the net tangible assets of the acquired businesses with the residual of the purchase price recorded as goodwill. At December 31, 2014, we had goodwill of $41.9 million and intangible assets, net of accumulated amortization of $1.7 million. We evaluate goodwill and indefinite-lived intangible assets annually as of October 1 for impairment, or more often if events or changes in circumstances indicate that the carrying value may not be recoverable. To complete our impairment analysis of goodwill and indefinite-lived intangible assets, we estimate fair value using multiple approaches and also consider whether events or changes in circumstances such as significant declines in revenue or earnings, or material adverse changes in the business climate indicate that the carrying value of assets may be impaired. There were no impairments of goodwill in any of the periods presented in the Consolidated Financial Statements. However, in our annual impairment analysis of indefinite-lived intangible assets for 2014 and 2013, we determined that certain indefinite-lived intangible assets were impaired by $0.1 million and $0.2 million, respectively. See Note 6 to our Consolidated Financial Statements for additional details. We concluded there were no impairment indicators in 2012.
Our definite-lived intangible assets include customer and advertiser relationships, developed technology and patents, media content, trademarks and tradenames and service contracts. All definite-lived intangible assets are amortized on a straight-line basis over their estimated useful lives, which we believe is consistent with the expected future cash flows to be generated by the respective assets. Definite-lived intangible assets and other long-lived assets are evaluated for recoverability whenever events or changes in circumstances indicate that the carrying value of the asset may not be recoverable. In evaluating an asset for recoverability, we estimate the future cash flow expected to result from the use of the asset and eventual disposition. If the expected future undiscounted cash flow is less than the carrying amount of the asset, an impairment loss, equal to the excess of the carrying amount over the fair value of the asset, is recognized. During 2014, 2013 and 2012, we determined that certain definite-lived intangible assets were impaired by $0.1 million, $1.2 million, and $0.9 million respectively. See Note 6 to our Consolidated Financial Statements for additional details.
Other long-lived assets primarily consist of software, leasehold improvements, computer and office equipment and furniture and fixtures, which are subject to depreciation over the useful life of the asset. The useful lives of other long-lived assets are determined based on our estimate of the period over which the asset will be utilized; such periods are periodically reviewed for reasonableness. We may be required to change these estimates based on changes in our industry or other changing circumstances. If these estimates change in the future, we may be required to recognize increased or decreased depreciation expense for these assets. For the year ended December 31, 2014, we recorded impairments of certain long-lived assets of $0.6 million. There were no impairment charges on long-lived assets in the years ended December 31, 2013 and 2012.
Income Taxes
We account for income taxes using the asset and liability method, as required by the accounting standard for income taxes ASC 740. Under this method, deferred tax assets and liabilities are recognized for the future tax consequences attributable to differences between the financial statement carrying amounts of existing assets and liabilities and their respective tax bases, as well as net operating loss and tax credit carryforwards. Deferred taxes are measured using enacted tax rates expected to apply to taxable income in the years in which those temporary differences are expected to be recovered or settled. The effect on deferred taxes of a change in tax rates is recognized in results of operations in the period that includes the enactment date. The effects of any future changes in tax laws or rates have not been considered. We regularly review deferred tax assets to assess their potential realization and establish a valuation allowance for portions of such assets to reduce the carrying value if we do not consider it to be more likely than not that the deferred tax assets will be realized. Our review includes evaluating both positive (e.g., sources of taxable income) and negative (e.g., recent historical losses) evidence that could impact the realizability of our deferred tax assets.
We recognize the impact of an uncertain tax position in our financial statements if, in management's judgment, the position is not more-likely-then-not sustainable upon audit based on the position's technical merits. This involves the identification of
36
potential uncertain tax positions, the evaluation of applicable tax laws and an assessment of whether a liability for an uncertain tax position is necessary. We operate and are subject to audit in multiple taxing jurisdictions.
We record interest and penalties related to income taxes as a component of income tax expense.
A substantial portion of our net operating losses were acquired in connection with the acquisition of WeddingChannel.com and are subject to a limitation on future utilization under Section 382 of the Internal Revenue Code. We currently estimate that the effect of Section 382 will generally limit the amount of the loss carryforwards of WeddingChannel.com that are available to offset future taxable income to approximately $3.6 million annually. The overall determination of the annual loss limitation is subject to interpretation; therefore, the annual loss limitation could be subject to change.
A 1% change to our effective tax rate would have changed our annual net income during the three year period ended December 31, 2014 by approximately $0.1 million.
Stock-Based Compensation
We measure the cost of employee services received in exchange for an award of equity instruments based on the measurement-date fair value of the award. The fair value of restricted stock awarded under the 2009 Stock Incentive Plan is determined using the intrinsic value of the stock at the time of grant.
The fair value of the stock options granted during 2014 was determined using the Black-Scholes option pricing model (see Note 4 to our Consolidated Financial Statements for further details). Using this model, fair value was calculated based on assumptions with respect to (i) expected volatility of our stock price, (ii) the expected term of the award, (iii) expected dividend yield on our stock, and (iv) a risk-free interest rate, which is based on quoted U.S. Treasury rates for securities with maturities approximating the expected term. Specifically, the expected term of the options granted during 2014 was determined using the "simplified method" as prescribed by Staff Accounting Bulletin ("SAB") Topic 14D.2, which is presumed to be the midpoint between the vesting date and the end of the contractual term. The simplified method was used to determine the expected term of the options, due to the extended period of time that has lapsed since our last granted options, as well as differences in the contractual terms of the option awards compared to options granted in prior periods, such that our historical share option experience does not provide a reasonable basis to estimate the expected term. We intend to continue to consistently apply the simplified method until a sufficient amount of historical information regarding exercise data becomes available. We did not grant any stock options during the years ended December 31, 2012.
The fair value of the Employee Stock Purchase Plan (“ESPP”) rights granted from the 2009 Employee Stock Purchase Plan is estimated on the date of grant using the Black-Scholes option-pricing model (see Note 4 to our Consolidated Financial Statements for further details). Using this model, fair value is calculated based on assumptions with respect to (i) expected volatility of our stock price, (ii) the expected life of the award, which for ESPP rights is the period of time between the offering date and the exercise date (as defined in Note 4 to our Consolidated Financial Statements), (iii) expected dividend yield on our stock, and (iv) a risk-free interest rate, which is based on quoted U.S. Treasury rates for securities with maturities approximating the expected term. Expected volatility is calculated using historical prices of our stock. The expected dividend yield is zero, as we have never paid dividends and currently intend to retain future earnings, if any, to finance the expansion of the business. The use of different assumptions in the Black-Scholes pricing model would result in different amounts of stock-based compensation expense related to the ESPP; however, in total, stock-based compensation expense for the ESPP is not material to our Consolidated Financial Statements.
For grants of restricted stock and options, we record compensation expense based on the fair value of the shares on the grant date over the requisite service period, less estimated forfeitures. Compensations expense for ESPP rights is recorded in line with each respective offering period.
Forfeitures of equity awards are estimated at the grant date and reduce the compensation recognized. Estimated forfeitures of equity awards are periodically reviewed for reasonableness. We consider several factors when estimating future forfeitures, including types of awards, employee level and historical experience. Actual forfeitures may differ from current estimates.
Item 7A. Quantitative and Qualitative Disclosures About Market Risk
Market risk represents the risk of loss that may impact our financial position, results of operations, or cash flows due to adverse changes in financial market prices, including interest rate risk, foreign currency exchange rate risk, commodity price risk, and other relevant market rate or price risks.
37
We are exposed to market risk through interest rates related to the investment of our current cash and cash equivalents of $90.0 million as of December 31, 2014. These funds are generally invested in highly liquid debt instruments. As such instruments mature and the funds are re-invested, we are exposed to changes in market interest rates. This risk is not considered material, and we manage such risk by continuing to evaluate the best investment rates available for short-term, high quality investments.
Our results of operations and cash flows are subject to fluctuations in foreign currency exchange rates, particularly between the U.S. Dollar, Hong Kong Dollar and Chinese Yuan Renminbi. During the years ended December 31, 2014, 2013 and 2012, we incurred foreign currency translation gains of $56,000, $34,000 and $14,000, respectively.
38
Item 8. Financial Statements and Supplementary Data
INDEX TO FINANCIAL STATEMENTS
Page | |
39
REPORT OF INDEPENDENT REGISTERED PUBLIC ACCOUNTING FIRM
To the Board of Directors and Stockholders of XO Group Inc.
We have audited the accompanying consolidated balance sheets of XO Group Inc. (XO Group) as of December 31, 2014 and 2013, and the related consolidated statements of operations, comprehensive income, stockholders' equity, and cash flows for each of the three years in the period ended December 31, 2014. Our audits also included the financial statement schedule listed in the Index at Item 8. These financial statements and schedule are the responsibility of the Company's management. Our responsibility is to express an opinion on these financial statements and schedule based on our audits.
We conducted our audits in accordance with the standards of the Public Company Accounting Oversight Board (United States). Those standards require that we plan and perform the audit to obtain reasonable assurance about whether the financial statements are free of material misstatement. An audit includes examining, on a test basis, evidence supporting the amounts and disclosures in the financial statements. An audit also includes assessing the accounting principles used and significant estimates made by management, as well as evaluating the overall financial statement presentation. We believe that our audits provide a reasonable basis for our opinion.
In our opinion, the financial statements referred to above present fairly, in all material respects, the consolidated financial position of XO Group at December 31, 2014 and 2013, and the consolidated results of its operations and its cash flow for each of the three years in the period ended December 31, 2014, in conformity with U.S. generally accepted accounting principles. Also, in our opinion, the related financial statement schedule, when considered in relation to the basic financial statements taken as a whole, present fairly in all material respects the information set forth therein.
We also have audited, in accordance with the standards of the Public Company Accounting Oversight Board (United States), XO Group's internal control over financial reporting as of December 31, 2014, based on criteria established in Internal Control-Integrated Framework issued by the Committee of Sponsoring Organizations of the Treadway Commission (2013 Framework) and our report dated March 16, 2015 expressed an unqualified opinion thereon.
/s/ ERNST & YOUNG LLP
New York, New York
March 16, 2015
40
REPORT OF INDEPENDENT REGISTERED PUBLIC ACCOUNTING FIRM
To the Board of Directors and Stockholders of XO Group Inc.
We have audited XO Group Inc.'s (XO Group) internal control over financial reporting as of December 31, 2014, based on criteria established in Internal Control-Integrated Framework issued by the Committee of Sponsoring Organizations of the Treadway Commission (2013 Framework) (the COSO criteria). XO Group Inc.'s management is responsible for maintaining effective internal control over financial reporting, and for its assessment of the effectiveness of internal control over financial reporting included in the accompanying Report of Management on Internal Control over Financial Reporting. Our responsibility is to express an opinion on XO Group's internal control over financial reporting based on our audit.
We conducted our audit in accordance with the standards of the Public Company Accounting Oversight Board (United States). Those standards require that we plan and perform the audit to obtain reasonable assurance about whether effective internal control over financial reporting was maintained in all material respects. Our audit included obtaining an understanding of internal control over financial reporting, assessing the risk that a material weakness exists, testing and evaluating the design and operating effectiveness of internal control based on the assessed risk, and performing such other procedures as we considered necessary in the circumstances. We believe that our audit provides a reasonable basis for our opinion.
A company's internal control over financial reporting is a process designed to provide reasonable assurance regarding the reliability of financial reporting and the preparation of financial statements for external purposes in accordance with generally accepted accounting principles. A company's internal control over financial reporting includes those policies and procedures that (1) pertain to the maintenance of records that, in reasonable detail, accurately and fairly reflect the transactions and dispositions of the assets of the company; (2) provide reasonable assurance that transactions are recorded as necessary to permit preparation of financial statements in accordance with generally accepted accounting principles, and that receipts and expenditures of the company are being made only in accordance with authorizations of management and directors of the company; and (3) provide reasonable assurance regarding prevention or timely detection of unauthorized acquisition, use or disposition of the company's assets that could have a material effect on the financial statements.
Because of its inherent limitations, internal control over financial reporting may not prevent or detect misstatements. Also, projections of any evaluation of effectiveness to future periods are subject to the risk that controls may become inadequate because of changes in conditions, or that the degree of compliance with the policies or procedures may deteriorate.
In our opinion, XO Group maintained, in all material respects, effective internal control over financial reporting as of December 31, 2014, based on the COSO criteria.
We also have audited, in accordance with the standards of the Public Company Accounting Oversight Board (United States), the consolidated balance sheets of XO Group as of December 31, 2014 and 2013, and the related consolidated statements of operations, comprehensive income, stockholders' equity, and cash flows for each of the three years in the period ended December 31, 2014 of XO Group and our report date March 16, 2015 expressed an unqualified opinion thereon.
/s/ ERNST & YOUNG LLP
New York, New York
March 16, 2015
41
XO GROUP INC.
CONSOLIDATED BALANCE SHEETS
(Amounts in Thousands, Except for Share and Per Share Data)
December 31, | ||||||||
2014 | 2013 | |||||||
ASSETS | ||||||||
Current assets: | ||||||||
Cash and cash equivalents | $ | 89,955 | $ | 90,697 | ||||
Accounts receivable, net of allowance of $2,756 and $1,678 at December 31, 2014 and December 31, 2013, respectively | 15,785 | 11,838 | ||||||
Inventories, net | 640 | 2,374 | ||||||
Deferred production and marketing costs | 422 | 475 | ||||||
Deferred tax assets, net | 3,052 | 2,782 | ||||||
Prepaid expenses and other current assets | 3,634 | 5,993 | ||||||
Total current assets | 113,488 | 114,159 | ||||||
Long-term restricted cash | 2,600 | 2,599 | ||||||
Property and equipment, net | 15,125 | 15,490 | ||||||
Intangible assets, net | 1,687 | 3,357 | ||||||
Goodwill | 41,871 | 38,500 | ||||||
Deferred tax assets, net | 13,110 | 16,962 | ||||||
Investments | 5,501 | 1,680 | ||||||
Other assets | 200 | 495 | ||||||
Total assets | $ | 193,582 | $ | 193,242 | ||||
LIABILITIES AND STOCKHOLDERS' EQUITY | ||||||||
Current liabilities: | ||||||||
Accounts payable and accrued expenses | $ | 12,463 | $ | 12,420 | ||||
Deferred revenue | 16,236 | 14,864 | ||||||
Total current liabilities | 28,699 | 27,284 | ||||||
Deferred rent | 5,167 | 5,914 | ||||||
Other liabilities | 1,790 | 4,154 | ||||||
Total liabilities | 35,656 | 37,352 | ||||||
Commitments and contingencies (Note 10) | ||||||||
Stockholders’ equity: | ||||||||
Preferred stock, $0.001 par value; 5,000,000 shares authorized and 0 shares issued and outstanding as of December 31, 2014 and 2013, respectively | — | — | ||||||
Common stock, $0.01 par value; 100,000,000 shares authorized and 26,630,507 and 27,049,095 shares issued and outstanding at December 31, 2014 and 2013, respectively | 267 | 270 | ||||||
Additional paid-in-capital | 171,951 | 169,756 | ||||||
Accumulated other comprehensive income (loss) | 35 | (204 | ) | |||||
Accumulated deficit | (14,327 | ) | (13,932 | ) | ||||
Total stockholders’ equity | 157,926 | 155,890 | ||||||
Total liabilities and stockholders' equity | $ | 193,582 | $ | 193,242 | ||||
See accompanying Notes to Consolidated Financial Statements
42
XO GROUP INC.
CONSOLIDATED STATEMENTS OF OPERATIONS
(Amounts in Thousands, Except for Per Share Data)
Year Ended December 31, | ||||||||||||
2014 | 2013 | 2012 | ||||||||||
Net revenue: | ||||||||||||
Online advertising | $ | 89,549 | $ | 81,661 | $ | 76,475 | ||||||
Registry services | 9,794 | 7,926 | 6,231 | |||||||||
Merchandise | 16,223 | 18,406 | 21,359 | |||||||||
Publishing and other | 28,098 | 25,821 | 25,066 | |||||||||
Total net revenue | 143,664 | 133,814 | 129,131 | |||||||||
Cost of revenue: | ||||||||||||
Online advertising | 1,770 | 1,927 | 1,741 | |||||||||
Merchandise | 10,914 | 11,296 | 12,454 | |||||||||
Publishing and other | 8,511 | 9,178 | 8,407 | |||||||||
Total cost of revenue | 21,195 | 22,401 | 22,602 | |||||||||
Gross profit | 122,469 | 111,413 | 106,529 | |||||||||
Operating expenses: | ||||||||||||
Product and content development | 35,820 | 29,877 | 26,229 | |||||||||
Sales and marketing | 44,330 | 39,718 | 40,239 | |||||||||
General and administrative | 25,617 | 23,073 | 20,980 | |||||||||
Asset impairment charges | 836 | 1,430 | 958 | |||||||||
Depreciation and amortization | 6,969 | 4,808 | 3,874 | |||||||||
Total operating expenses | 113,572 | 98,906 | 92,280 | |||||||||
Income from operations | 8,897 | 12,507 | 14,249 | |||||||||
Loss in equity interests | (232 | ) | (2,016 | ) | (55 | ) | ||||||
Interest and other income (expense), net | (1,740 | ) | 144 | 113 | ||||||||
Income before income taxes | 6,925 | 10,635 | 14,307 | |||||||||
Income tax expense | 6,463 | 4,841 | 5,658 | |||||||||
Net income | 462 | 5,794 | 8,649 | |||||||||
Plus: net loss attributable to noncontrolling interest | — | — | 65 | |||||||||
Net income attributable to XO Group Inc. | $ | 462 | $ | 5,794 | $ | 8,714 | ||||||
Net income per share attributable to XO Group Inc. common stockholders: | ||||||||||||
Basic | $ | 0.02 | $ | 0.24 | $ | 0.35 | ||||||
Diluted | $ | 0.02 | $ | 0.23 | $ | 0.35 | ||||||
Weighted average number of shares used in calculating net earnings per share | ||||||||||||
Basic | 25,210 | 24,620 | 24,649 | |||||||||
Dilutive effect of: | ||||||||||||
Restricted stock | 355 | 874 | 444 | |||||||||
Employee Stock Purchase Program | 1 | 6 | 9 | |||||||||
Options | 23 | 96 | 116 | |||||||||
Diluted | 25,589 | 25,596 | 25,218 | |||||||||
See accompanying Notes to Consolidated Financial Statements
43
XO GROUP INC.
CONSOLIDATED STATEMENTS OF COMPREHENSIVE INCOME
(Amounts in Thousands)
Year Ended December 31, | ||||||||||||
2014 | 2013 | 2012 | ||||||||||
Net income attributable to XO Group Inc. | $ | 462 | $ | 5,794 | $ | 8,714 | ||||||
Other comprehensive loss: | ||||||||||||
Foreign currency translation adjustments | (64 | ) | (107 | ) | (97 | ) | ||||||
Total comprehensive income | $ | 398 | $ | 5,687 | $ | 8,617 | ||||||
See accompanying Notes to Consolidated Financial Statements
44
XO GROUP INC.
CONSOLIDATED STATEMENTS OF STOCKHOLDERS’ EQUITY
(Amounts in Thousands)
XO Group Inc. Shareholders' | |||||||||||||||||||||||||||||||
Common Stock | Additional Paid-in Capital | Accumulated Other Comprehensive Income (Loss) | Accumulated Deficit | Total | Noncontrolling Interest in Subsidiary | Total Equity | |||||||||||||||||||||||||
Shares | Par Value | ||||||||||||||||||||||||||||||
Balance at December 31, 2011 | 27,649 | $ | 276 | $ | 172,935 | $ | — | $ | (22,868 | ) | $ | 150,343 | $ | 536 | $ | 150,879 | |||||||||||||||
Issuance of common stock pursuant to the employee stock purchase plan | 41 | 1 | 289 | — | — | 290 | — | 290 | |||||||||||||||||||||||
Issuance of restricted common stock, net of cancellations | 483 | 5 | — | — | — | 5 | — | 5 | |||||||||||||||||||||||
Foreign currency translation adjustments | — | — | — | (97 | ) | — | (97 | ) | — | (97 | ) | ||||||||||||||||||||
Surrender of restricted common stock for income tax purposes | (211 | ) | (2 | ) | (1,945 | ) | — | — | (1,947 | ) | — | (1,947 | ) | ||||||||||||||||||
Issuance of common stock in connection with the exercise of vested stock options | — | — | 1 | — | — | 1 | — | 1 | |||||||||||||||||||||||
Repurchase of common stock and extinguishment | (2,109 | ) | (21 | ) | (13,182 | ) | — | (5,733 | ) | (18,936 | ) | — | (18,936 | ) | |||||||||||||||||
Stock-based compensation | — | — | 6,388 | — | — | 6,388 | — | 6,388 | |||||||||||||||||||||||
Excess tax benefits from stock-based awards | — | — | (386 | ) | — | — | (386 | ) | — | (386 | ) | ||||||||||||||||||||
Acquisition of noncontrolling interest in subsidiary | — | — | 471 | — | — | 471 | (471 | ) | — | ||||||||||||||||||||||
Deconsolidation of subsidiary | — | — | (500 | ) | — | 161 | (339 | ) | — | (339 | ) | ||||||||||||||||||||
Net income | — | — | — | — | 8,714 | 8,714 | (65 | ) | 8,649 | ||||||||||||||||||||||
Balance at December 31, 2012 | 25,853 | $ | 259 | $ | 164,071 | $ | (97 | ) | $ | (19,726 | ) | $ | 144,507 | $ | — | $ | 144,507 | ||||||||||||||
Issuance of common stock pursuant to the employee stock purchase plan | 39 | — | 298 | — | — | 298 | — | 298 | |||||||||||||||||||||||
Issuance of restricted common stock, net of cancellations | 1,275 | 13 | — | — | — | 13 | — | 13 | |||||||||||||||||||||||
Foreign currency translation adjustments | — | — | — | (107 | ) | — | (107 | ) | — | (107 | ) | ||||||||||||||||||||
Surrender of restricted common stock for income tax purposes | (187 | ) | (2 | ) | (1,780 | ) | — | — | (1,782 | ) | — | (1,782 | ) | ||||||||||||||||||
Issuance of common stock in connection with the exercise of vested stock options | 69 | — | 197 | — | — | 197 | — | 197 | |||||||||||||||||||||||
Stock-based compensation | — | — | 6,665 | — | — | 6,665 | — | 6,665 | |||||||||||||||||||||||
Excess tax benefits from stock-based awards | — | — | 305 | — | — | 305 | — | 305 | |||||||||||||||||||||||
Net income | — | — | — | — | 5,794 | 5,794 | — | 5,794 | |||||||||||||||||||||||
Balance at December 31, 2013 | 27,049 | $ | 270 | $ | 169,756 | $ | (204 | ) | $ | (13,932 | ) | $ | 155,890 | $ | — | $ | 155,890 | ||||||||||||||
45
XO GROUP INC.
CONSOLIDATED STATEMENTS OF STOCKHOLDERS’ EQUITY
(Amounts in Thousands)
XO Group Inc. Shareholders' | |||||||||||||||||||||||||||||||
Common Stock | Additional Paid-in Capital | Accumulated Other Comprehensive Income (Loss) | Accumulated Deficit | Total | Noncontrolling Interest in Subsidiary | Total Equity | |||||||||||||||||||||||||
Shares | Par Value | ||||||||||||||||||||||||||||||
Balance at January 1, 2014 | 27,049 | $ | 270 | $ | 169,756 | $ | (204 | ) | $ | (13,932 | ) | $ | 155,890 | $ | — | $ | 155,890 | ||||||||||||||
Issuance of common stock pursuant to the employee stock purchase plan | 38 | — | 374 | — | — | 374 | — | 374 | |||||||||||||||||||||||
Issuance of restricted common stock, net of cancellations | (82 | ) | — | — | — | — | — | — | — | ||||||||||||||||||||||
Foreign currency translation adjustments | — | — | — | (64 | ) | — | (64 | ) | — | (64 | ) | ||||||||||||||||||||
Realization of foreign currency translation adjustments | — | — | — | 303 | — | 303 | — | 303 | |||||||||||||||||||||||
Surrender of restricted common stock for income tax purposes | (384 | ) | (3 | ) | (4,793 | ) | — | — | (4,796 | ) | — | (4,796 | ) | ||||||||||||||||||
Issuance of common stock in connection with the exercise of vested stock options | 131 | 1 | 522 | — | — | 523 | — | 523 | |||||||||||||||||||||||
Repurchase of common stock and extinguishment | (121 | ) | (1 | ) | (770 | ) | — | (857 | ) | (1,628 | ) | — | (1,628 | ) | |||||||||||||||||
Stock-based compensation | — | — | 5,602 | — | — | 5,602 | — | 5,602 | |||||||||||||||||||||||
Excess tax benefits from stock-based awards | — | — | 1,260 | — | — | 1,260 | — | 1,260 | |||||||||||||||||||||||
Net income | — | — | — | — | 462 | 462 | — | 462 | |||||||||||||||||||||||
Balance at December 31, 2014 | 26,631 | $ | 267 | $ | 171,951 | $ | 35 | $ | (14,327 | ) | $ | 157,926 | $ | — | $ | 157,926 | |||||||||||||||
See accompanying Notes to Consolidated Financial Statements
46
XO GROUP INC.
CONSOLIDATED STATEMENTS OF CASH FLOWS
(Amounts in Thousands)
Year Ended December 31, | ||||||||||||
2014 | 2013 | 2012 | ||||||||||
CASH FLOWS FROM OPERATING ACTIVITIES | ||||||||||||
Net income | $ | 462 | $ | 5,794 | $ | 8,649 | ||||||
Adjustments to reconcile net income to net cash provided by operating activities: | ||||||||||||
Depreciation and amortization | 6,969 | 4,808 | 3,874 | |||||||||
Stock-based compensation expense | 6,139 | 6,697 | 6,388 | |||||||||
Deferred income taxes | 1,972 | 1,656 | (2,742 | ) | ||||||||
Loss on disposal or sale of assets | 1,828 | — | — | |||||||||
Allowance for doubtful accounts | 1,422 | 446 | 616 | |||||||||
Excess tax benefits from stock-based awards | (1,260 | ) | (305 | ) | 386 | |||||||
Asset impairment charges | 836 | 1,430 | 958 | |||||||||
Impairment of equity interest | — | 1,773 | — | |||||||||
Other non-cash charges | 279 | 160 | (248 | ) | ||||||||
Changes in operating assets and liabilities: | ||||||||||||
(Increase) decrease in accounts receivable | (5,565 | ) | 2,676 | 1,147 | ||||||||
Decrease (increase) in inventories | 1,836 | (349 | ) | 1,575 | ||||||||
Decrease (increase) in other assets | 3,781 | (3,582 | ) | 2,892 | ||||||||
Increase in accounts payable and accrued expenses | 403 | 865 | 200 | |||||||||
Increase in deferred revenue | 1,547 | 154 | 965 | |||||||||
(Decrease) increase in deferred rent | (747 | ) | (714 | ) | 694 | |||||||
Increase in other liabilities, net | 113 | 734 | 19 | |||||||||
Net cash provided by operating activities | 20,015 | 22,243 | 25,373 | |||||||||
CASH FLOWS FROM INVESTING ACTIVITIES | ||||||||||||
Acquisitions, net of cash acquired | (5,725 | ) | (600 | ) | — | |||||||
Additions to capitalized software | (4,282 | ) | (4,348 | ) | (1,501 | ) | ||||||
Payment to acquire investment | (4,000 | ) | (1,300 | ) | (1,500 | ) | ||||||
Maturity of U.S. Treasury Bills | 2,599 | 2,598 | 2,599 | |||||||||
Purchases of U.S. Treasury Bills | (2,599 | ) | (2,598 | ) | (2,599 | ) | ||||||
Decrease in cash associated with disposition | (1,640 | ) | — | — | ||||||||
Purchases of property and equipment | (786 | ) | (1,620 | ) | (1,330 | ) | ||||||
Other investing activities | (57 | ) | (84 | ) | (37 | ) | ||||||
Net cash used in investing activities | (16,490 | ) | (7,952 | ) | (4,368 | ) | ||||||
CASH FLOWS FROM FINANCING ACTIVITIES | ||||||||||||
Surrender of restricted common stock for income tax purposes | (4,796 | ) | (1,782 | ) | (1,947 | ) | ||||||
Repurchase of common stock | (1,628 | ) | — | (18,936 | ) | |||||||
Excess tax benefits from stock-based awards | 1,260 | 305 | (386 | ) | ||||||||
Proceeds pursuant to employee stock-based compensation plans | 897 | 476 | 295 | |||||||||
Net cash used in financing activities | (4,267 | ) | (1,001 | ) | (20,974 | ) | ||||||
(Decrease) increase in cash and cash equivalents | (742 | ) | 13,290 | 31 | ||||||||
Cash and cash equivalents at beginning of year | 90,697 | 77,407 | 77,376 | |||||||||
Cash and cash equivalents at end of year | $ | 89,955 | $ | 90,697 | $ | 77,407 | ||||||
Supplemental information: | ||||||||||||
Cash paid for income taxes | $ | 475 | $ | 7,379 | $ | 3,102 | ||||||
Cash paid for acquisitions and investments | $ | 9,725 | $ | 1,900 | $ | 1,500 | ||||||
See accompanying Notes to Consolidated Financial Statements
47
XO GROUP INC.
NOTES TO CONSOLIDATED FINANCIAL STATEMENTS
For the Years Ended December 31, 2014, 2013 and 2012
1. Nature of Operations
XO Group Inc.'s mission is to help people navigate and truly enjoy life’s biggest moments, together. The Company's multi-platform brands guide couples through transformative life stages - from getting married, to moving in together and having a baby - and include The Knot, The Bump, and The Nest. The Company provides content and marketing solutions, targeted advertising programs, registry services and merchandise.
2. Significant Accounting Policies
Principles of Consolidation
The consolidated financial statements include the accounts of XO Group Inc. ("the Company") and all 100% and majority owned subsidiaries, prepared in conformity with U.S. generally accepted accounting principles ("U.S. GAAP"). All intercompany transactions and balances are eliminated in consolidation. Investments in which the Company has at least a 20%, but not more than a 50% interest are generally accounted for under the equity method. Investment interests below 20% are generally accounted for under the cost method, except if the Company could exercise significant influence, the investment would be accounted for under the equity method.
Use of Estimates
The preparation of financial statements in conformity with U.S. GAAP requires management to make estimates and assumptions that affect the reported amounts of assets and liabilities and disclosure of contingent assets and liabilities at the date of the financial statements as well as the reported amounts of revenues and expenses during the reporting period.
Significant estimates and assumptions made by management include the determination of fair value of equity awards issued, fair value of the Company's reporting unit, valuation of intangible assets (and their related useful lives), certain components of the income tax provisions, including valuation allowances on the Company's deferred tax assets, compensation accruals, allowances for bad debts, inventory obsolescence reserves and reserves for future returns. The Company bases its estimates and assumptions on historical experience and on various other factors that it believes to be reasonable under the circumstances. The Company evaluates its estimates and assumptions on an ongoing basis. The level of uncertainty in estimates and assumptions increases with the length of time until the underlying transactions are completed. Actual results could differ from estimates in amounts that may be material to the financial statements.
Comparative Data
Certain prior year financial statement line items and disclosures have been reclassified to conform to the current year's presentation. The Company reclassified $4.5 million of long-term deferred tax liabilities as of December 31, 2013 to long-term deferred tax assets to be consistent with current year presentation.
Cash and Cash Equivalents
The Company considers all highly liquid investments with an original maturity of three months or less at the date of purchase to be cash equivalents. Cash and cash equivalents consist of cash on deposit with banks and money market funds. The market value of the Company’s cash equivalents approximates their cost plus accrued interest.
Fair Value of Financial Instruments
The carrying amounts of the Company's financial instruments, including cash and cash equivalents, accounts receivable, accounts payable and accrued expenses, approximate fair value as of December 31, 2014 and 2013 due to the short-term nature of these instruments.
48
XO GROUP INC.
NOTES TO CONSOLIDATED FINANCIAL STATEMENTS
For the Years Ended December 31, 2014, 2013 and 2012
2. Significant Accounting Policies - (continued)
Inventory
Inventory consists of finished goods and raw materials. Inventory costs are determined principally by using the average cost method and are stated at the lower of cost or net realizable value.
Deferred Production and Marketing Costs
Deferred production and marketing costs include certain magazine and online video production costs and prepaid sales commissions, which are deferred and expensed as the related revenue is recognized.
Property and Equipment
Property and equipment are stated at cost, less accumulated depreciation and amortization. Depreciation is computed using the straight-line method over the estimated useful lives of the related assets, which range from three to seven years. Leasehold improvements are depreciated over the shorter of their estimated useful lives or the remaining term of the related lease agreement. The Company capitalizes qualifying computer software costs incurred during the application development stage and amortizes these costs over the estimated useful life of the software, ranging from one to three years, on a straight-line basis, beginning when the software is ready for its intended use. For the years ended December 31, 2014, 2013 and 2012, the Company recorded amortization of capitalized software of $2.2 million, $1.4 million, and $1.3 million, respectively. Maintenance and repair costs are expensed as incurred while expenditures for major renewals and improvements are capitalized. Upon the disposition of property and equipment, the cost and related accumulated depreciation are removed from the accounts. For the year ended December 31, 2014, the Company recorded impairments of certain long-lived assets of $0.6 million. There were no impairment charges on long-lived assets in the years ended December 31, 2013 and 2012.
Goodwill, Other Intangible and Long-Lived Assets
Goodwill is the excess purchase price remaining from an acquisition after an allocation of purchase price has been made to identifiable assets acquired and liabilities assumed based on estimated fair values. Goodwill and intangible assets deemed to have indefinite lives are not amortized but are subject to annual impairment tests. The Company tests goodwill for impairment annually as of October 1 and more frequently if an event occurs or circumstances change that would more likely than not reduce the fair value of a reporting unit below its carrying amount. The goodwill impairment analysis is a two-step test that is performed at the reporting unit level. The first step, used to identify potential impairment, involves comparing the reporting unit’s fair value to its carrying value including goodwill. If the fair value of a reporting unit exceeds its carrying value, the applicable goodwill is considered not to be impaired. If the carrying value exceeds fair value, there is an indication of a potential impairment and the second step of the test is performed to measure the amount of impairment. Should the carrying amount for a reporting unit exceed its fair value, then the first step of the quantitative impairment test is failed and the magnitude of any goodwill impairment is determined under the second step, which is a comparison of the implied fair value of a reporting unit's goodwill to its carrying value. The implied fair value of goodwill is the excess of the fair value of the reporting unit over its carrying value, excluding goodwill. Impaired goodwill is written down to its implied fair value with a charge to expense in the period the impairment is identified. An impairment loss recognized cannot exceed the amount of goodwill assigned to a reporting unit, and the loss establishes a new basis in the goodwill. Subsequent reversal of goodwill impairment losses is not permitted.
In accordance with accounting guidance, the Company may first perform a qualitative goodwill assessment to determine whether events or circumstances lead to a determination that it is more likely than not that the fair value of a reporting unit is less than its carrying amount. Factors such as macroeconomic conditions; industry and market considerations; cost factors and other are used to assess the validity of goodwill. If, after assessing the totality of events or circumstances, the Company determines it is not more likely than not that the fair value of a reporting unit is less than its carrying amount, then performing the two-step goodwill impairment test, as described above, is not necessary. If, however, the Company concludes otherwise, then the Company must perform the first step of the two-step impairment test by comparing the reporting unit’s fair value with its carrying value including goodwill. If the carrying value exceeds fair value, then the Company must perform the second step of the goodwill impairment test to measure the impairment loss, if any.
49
XO GROUP INC.
NOTES TO CONSOLIDATED FINANCIAL STATEMENTS
For the Years Ended December 31, 2014, 2013 and 2012
2. Significant Accounting Policies - (continued)
The Company's intangible assets deemed to have definite lives are amortized over their estimated useful lives, on a straight-line basis as follows:
Customer and advertiser relationships | 6 to 10 years |
Developed technology and patents | 5 to 20 years |
Media content | 5 years |
Trademarks and trade names | 1 to 3 years |
Service contracts and other | 10 years |
The Company's long-lived assets primarily consist of software, leasehold improvements, computer and office equipment and furniture and fixtures, which are subject to depreciation over the useful life of the asset. Long-lived assets, including definite-lived intangible assets, are evaluated for recoverability whenever events or changes in circumstances indicate that the carrying value of the asset may be impaired. In evaluating an asset for recoverability, the Company estimates the future cash flow expected to result from the use of the asset and eventual disposition. If the expected future undiscounted cash flow is less than the carrying amount of the asset, an impairment loss, equal to the excess of the carrying amount over the fair value of the asset, is recognized.
The Company performs impairment evaluations annually as of October 1, or more often if events or changes in circumstances indicate that the carrying value may not be recoverable. For the years ended December 31, 2014, 2013, and 2012, the Company recorded impairments of certain intangible assets of $0.2 million, $1.4 million, and $1.0 million, respectively. See Note 6 for additional details on the impairments of certain intangible assets recorded during the year.
Income Taxes
The Company accounts for income taxes using the asset and liability method as required by the accounting standard for income taxes. Under this method, deferred tax assets and liabilities are recognized for the future tax consequences attributable to differences between the financial statement carrying amounts of existing assets and liabilities and their respective tax bases, as well as net operating loss and tax credit carryforwards. Deferred taxes are measured using enacted tax rates expected to apply to taxable income in the years in which those temporary differences are expected to be recovered or settled. The effect on deferred taxes of a change in tax rates is recognized in results of operations in the period that includes the enactment date.
Each reporting period, the Company assesses whether its deferred tax assets are more-likely-than-not realizable, in determining whether it is necessary to record a valuation allowance. This includes evaluating both positive (e.g., sources of taxable income) and negative (e.g., recent historical losses) evidence that could impact the realizability of the Company's deferred tax assets.
The Company records interest and penalties related to income taxes as a component of income tax expense.
The Company recognizes the impact of an uncertain tax position in its financial statements if, in management's judgment, the position is more-likely-then-not sustainable upon audit based on the position's technical merits. This involves the identification of potential uncertain tax positions, the evaluation of applicable tax laws and measurement of the amount of each uncertain tax position that is more-likely-than-not sustainable.
Revenue Recognition
The Company recognizes revenue primarily from the sale of online advertising programs, commissions earned in connection with the sale of gift registry products, the sale of merchandise and the publication of magazines, provided that there is persuasive evidence of an arrangement, the service has been provided or the product has been shipped, selling price is fixed or determinable, collection is reasonably assured and the Company has no significant remaining obligation.
Online programs are designed to integrate advertising with online editorial content. Advertisers can purchase the exclusive right to promote products or services on a specific online editorial area and can purchase a special feature on the Company’s sites. These arrangements commonly include banner advertisements and direct e-mail marketing. Advertisers can also promote their
50
XO GROUP INC.
NOTES TO CONSOLIDATED FINANCIAL STATEMENTS
For the Years Ended December 31, 2014, 2013 and 2012
2. Significant Accounting Policies - (continued)
services and products within the programming on the Company’s streaming video channels, The Knot TV, The Bump TV and The Nest TV.
Online advertising includes online banner advertisements and direct e-mail marketing as well as placement in the Company’s online search tools. This category also includes online listings, including preferred placement and other premium programs in the local area of the Company’s websites for local wedding and other vendors. Local vendors may purchase online listings through fixed term contracts or open-ended subscriptions.
Certain elements of online advertising contracts provide for the delivery of a minimum number of impressions. Impressions are the featuring of a customer’s advertisement, banner, link or other form of content on the Company’s sites. The Company recognizes online advertising revenue over the duration of the contracts on a straight-line basis when delivery of impressions is in excess of minimum guarantees. To the extent that minimum guaranteed impressions are not met, the Company is often obligated to extend the period of the contract until the guaranteed impressions are achieved. If this occurs, the Company defers and recognizes the corresponding revenue over the extended period based on impressions delivered.
Registry services revenue primarily represents commissions from retailers who participate in the Company's registry aggregation service, which offers couples and their guests the opportunity to view multiple registries in one location and for guests to order gifts off of these registries. After the retail partners fulfill and ship the sales orders, the related commissions are contractually earned by us and recognized as revenue. Product returns or exchanges do not materially impact the commissions earned by us. The Company only records net commissions, and not gross revenue and cost of revenue associated with these products, since the Company is not primarily obligated in these transactions, it is not subject to inventory risk and amounts earned are determined using a fixed percentage.
Merchandise revenue generally includes the selling price of wedding supplies through the Company’s websites, as well as related outbound shipping and handling charges since the Company is the primary party obligated in a transaction, is subject to inventory risk and establishes its own pricing and selection of suppliers. Merchandise revenue is recognized when products are shipped to customers, reduced by discounts as well as an allowance for estimated sales returns. Merchandise revenue excludes related sales taxes collected.
Publishing revenue primarily includes print advertising revenue derived from the publication of national and regional magazines and guides. This revenue is recognized upon the publication of the related magazines, at which time all material services related to the magazine have been performed. Additionally, publishing revenue is derived from the sale of magazines on newsstands and in bookstores, and from author royalties received related to book publishing contracts. Revenue from the sale of magazines is reduced by an allowance for estimated sales returns. Author royalties have been derived primarily from publisher royalty advances that are recognized as revenue when all the Company’s contractual obligations have been met, which is typically upon the delivery to, and acceptance by, the publisher of the final manuscript.
Multiple deliverables included in an arrangement, primarily online and print advertising sales, are separated into different units of accounting and the arrangement consideration is allocated to the identified separate units based on their relative selling prices. Selling prices for deliverables that qualify as separate units of accounting are determined using a hierarchy of: (1) vendor-specific objective evidence of selling price, (2) third-party evidence, and (3) best estimate of selling price. The Company uses best estimate of selling price of its deliverables in allocating consideration to each deliverable since deliverables are typically priced with a wide range of discounts. The Company's best estimate of selling price is intended to represent the price at which it would sell the deliverable if the Company were to sell the item regularly on a stand-alone basis. The amount of revenue allocated to delivered items is limited to contingent revenue, if any. We evaluate multiple contracts entered into with the same advertiser as these contracts may need to be combined and accounted for as a single arrangement when the economics of the individual contracts cannot be understood without reference to the arrangement as a whole.
We evaluate our revenue generating activities to determine whether it is appropriate to record the gross amount of sales and related costs or the net amount earned. Generally, when the Company is primarily obligated in a transaction, are subject to inventory risk, have latitude in establishing prices and selecting suppliers, or have several but not all of these indicators, revenue is recorded at the gross sale price, otherwise the Company records the net amounts earned. Net amounts earned are generally determined using a fixed percentage, a fixed-payment schedule, or a combination of both.
51
XO GROUP INC.
NOTES TO CONSOLIDATED FINANCIAL STATEMENTS
For the Years Ended December 31, 2014, 2013 and 2012
2. Significant Accounting Policies - (continued)
Deferred Revenue
Deferred revenue represents payments received or billings in excess of revenue recognized, which are primarily related to online and print advertising contracts.
Advertising Costs
Advertising costs are expensed as incurred. Advertising expense totaled $0.7 million, $0.7 million and $0.5 million for the years ended December 31, 2014, 2013 and 2012, respectively.
Shipping and Handling Charges
Merchandise revenues included outbound shipping and handling charges of $1.9 million, $2.6 million and $3.0 million for the years ended December 31, 2014, 2013 and 2012, respectively.
Concentration of Credit Risk
Financial instruments that potentially subject the Company to concentrations of credit risk consist principally of cash, cash equivalents and investments, and accounts receivable. Although the Company deposits its cash with more than one major financial institution, its deposits, at times, may exceed federally insured limits. The Company has not experienced any losses on cash and cash equivalent accounts to date and the Company believes it is not exposed to any significant credit risk related to cash.
No individual foreign country accounted for more than 10% of the Company's revenue during the years ended December 31, 2014, 2013 or 2012. No individual foreign country accounted for more than 10% of the Company's accounts receivable during the years ended December 31, 2014 or 2013. The Company holds fixed assets in the United States and China. No country outside of the United States holds greater than 10% of the Company's fixed assets.
For the years ended December 31, 2014, 2013 and 2012, No individual customer represented more than 10% of net revenue. At December 31, 2014 and December 31, 2013, no individual customer accounted for more than 10% of accounts receivable. The Company’s customers are concentrated in the United States. The Company performs ongoing credit evaluations, generally does not require collateral, and establishes an allowance for doubtful accounts based upon factors surrounding the credit risk of customers, historical trends and other information.
Stock-Based Compensation
The Company measures the cost of employee services received in exchange for an award of equity instruments based on the measurement-date fair value of the award. The fair value of restricted stock awarded under the 2009 Stock Incentive Plan is determined using the intrinsic value of the stock at the time of grant.
The fair value of the stock options granted in 2014 and 2013 from the 2009 Stock Incentive Plan was determined using the Black-Scholes option pricing model (see Note 4 for further details). Using this model, fair value was calculated based on assumptions with respect to (i) expected volatility of the Company's stock price, (ii) the expected term of the award, (iii) expected dividend yield on the Company's stock, and (iv) a risk-free interest rate, which is based on quoted U.S. Treasury rates for securities with maturities approximating the expected term. Specifically, the expected term of the options granted during 2014 and 2013 was determined using the "simplified method" as prescribed by Staff Accounting Bulletin ("SAB") Topic 14D.2, which is presumed to be the midpoint between the vesting date and the end of the contractual term. The simplified method was used to determine the expected term of the options, due to the extended period of time that has lapsed since the Company last granted options, as well as differences in the contractual terms of the option awards compared to options granted in prior periods, such that the Company's historical share option experience does not provide a reasonable basis to estimate the expected term. The Company intends to continue to consistently apply the simplified method until a sufficient amount of historical information regarding exercise data becomes available. The Company did not grant any stock options during the year ended December 31, 2012.
52
XO GROUP INC.
NOTES TO CONSOLIDATED FINANCIAL STATEMENTS
For the Years Ended December 31, 2014, 2013 and 2012
2. Significant Accounting Policies - (continued)
The fair value of the Employee Stock Purchase Plan (“ESPP”) rights granted from the 2009 Employee Stock Purchase Plan is estimated on the date of grant using the Black-Scholes option-pricing model (see Note 4 for further details). Using this model, fair value is calculated based on assumptions with respect to (i) expected volatility of the Company's stock price, (ii) the expected life of the award, which for ESPP rights is the period of time between the offering date and the exercise date (as defined in Note 4), (iii) expected dividend yield on the Company's stock, and (iv) a risk-free interest rate, which is based on quoted U.S. Treasury rates for securities with maturities approximating the expected term. Expected volatility is calculated using historical prices for the Company's stock. The expected dividend yield is zero, as the Company has never paid dividends and currently intends to retain future earnings, if any, to finance the expansion of the business.
For grants of restricted stock and stock options, the Company records compensation expense based on the fair value of the shares on the grant date over the requisite service period, less estimated forfeitures. Compensation expense for ESPP rights is recorded in line with each respective offering period.
Forfeitures of equity awards are estimated at the grant date and reduce the compensation recognized. Estimated forfeitures of equity awards are periodically reviewed for reasonableness. The Company considers several factors when estimating future forfeitures, including types of awards, employee level and historical experience. Actual forfeitures may differ from current estimates.
Earnings per Share
Basic earnings per share is computed by dividing the net income for the period by the weighted average number of common shares outstanding during the period. Diluted earnings per share adjusts basic earnings per share for the effects of stock options, restricted stock, and the Employee Stock Purchase Program (“ESPP”), only in the periods in which the effects are dilutive. The accounting standard pertaining to earnings per share precludes the calculation of diluted earnings per share when a net loss is presented. Common equivalent shares are excluded from the diluted computation if their effect is antidilutive. The calculation of diluted earnings per share for the year ended December 31, 2014 excludes a weighted average number of restricted stock and stock options of 408,835 and 219,315, respectively, because to include them in the calculation would be antidilutive. There were 101,843 and 41,397 antidilutive restricted stock and stock options for the years ended December 31, 2013 and 2012, respectively.
Segment Information
The Company operates in one reportable segment, as it is organized around its online and offline media and e-commerce service lines. In addition, there is a substantial amount of costs that benefit all service lines, but are not allocated to individual cost of revenue categories. The chief operating decision maker reviews financial information at a consolidated result of operations level in addition to also reviewing revenue and cost of revenue results of the individual service lines.
Comprehensive Income
Other comprehensive loss includes changes in stockholders' equity that are excluded from net income, specifically, cumulative foreign currency translation adjustments. Comprehensive loss is disclosed in a separate statement that immediately follows the Consolidated Statements of Operations in this Annual Report on Form 10-K.
Recently Adopted Accounting Pronouncements
In July 2013, the accounting standard relating to an unrecognized tax benefit when a net operating loss carryforward, a similar tax loss, or a tax credit carryforward exists was updated to clarify the balance sheet presentation. This updated standard is effective for annual and interim periods beginning after December 15, 2013 and early adoption was permitted. The Company adopted this standard as of January 1, 2014. Upon adoption, the Company reclassified approximately $3.1 million from other long-term liabilities to be reflected as a reduction of long-term deferred tax assets.
In April 2014, the accounting standard relating to the criteria for reporting discontinued operations was updated, which also expanded the disclosure requirements for disposals. Under the new guidance, a disposal that represents a strategic shift having a major effect on the organization’s operations and financial results should be presented as discontinued operations. The new guidance also requires expanded disclosures about discontinued operations, including more information about the assets, liabilities, revenues
53
XO GROUP INC.
NOTES TO CONSOLIDATED FINANCIAL STATEMENTS
For the Years Ended December 31, 2014, 2013 and 2012
2. Significant Accounting Policies - (continued)
and expenses of a discontinued operation. This updated standard is effective for annual periods beginning on or after December 15, 2014 and interim periods within those years. Early adoption of the updated standard is permitted but only for disposals (or classifications as held for sale) that have not been reported in financial statements previously issued or available for issue. The Company early adopted this standard during the fourth quarter of 2014. Upon adoption of this policy no disposal activities represented a significant strategic shift that would require discontinued operations presentation.
Recently Issued Accounting Pronouncements
In May 2014, the accounting standard relating to revenue from contracts with customers was updated to clarify the principles for recognizing revenue and develop a common standard for all industries. The new guidance is effective for reporting periods beginning after December 15, 2016. Entities have the option of using either a full retrospective or cumulative effect approach to adopt the new standard. The Company is currently evaluating the new guidance and has not determined the impact this standard may have on its consolidated financial statements or the method of adoption.
In June 2014, the accounting standard relating to performance targets that affect vesting of a share-based payment that could be achieved after the requisite service period was updated. Under the new guidance, these performance targets that could be achieved after the requisite service period should be accounted for as a performance condition and therefore, the target is not reflected in the estimation of the award's grant date fair value. This updated standard is effective for annual periods beginning after December 15, 2014 and interim periods within those years, and early adoption is permitted. The Company does not expect this standard to have a material impact on its consolidated financial statements since the Company's share-based payment awards currently do not contain performance targets that could be achieved after the requisite service period for the award.
In August 2014, the accounting standard relating to the evaluation of going concern was updated. Under the final guidance, management is required to evaluate whether there are conditions or events that raise substantial doubt about an entity’s ability to continue as a going concern and to provide disclosures when certain criteria are met. This updated standard is effective for annual periods beginning December 15, 2016 and for interim reporting periods starting in the first quarter of 2017, and early adoption is permitted.
3. Fair Value Measurements
Cash and cash equivalents and investments consist of the following:
December 31, | ||||||||
2014 | 2013 | |||||||
(In Thousands) | ||||||||
Cash and cash equivalents | ||||||||
Cash | $ | 27,186 | $ | 28,436 | ||||
Restricted cash | 525 | — | ||||||
Money market funds | 62,244 | 62,261 | ||||||
Total cash and cash equivalents | 89,955 | 90,697 | ||||||
Long-term investments | ||||||||
Long-term restricted cash | 2,600 | 2,599 | ||||||
Total cash and cash equivalents and investments | $ | 92,555 | $ | 93,296 | ||||
The inputs to the valuation techniques used to measure fair value are classified into the following categories:
Level 1 — Quoted prices in active markets for identical assets or liabilities
Level 2 — Quoted prices for similar assets and liabilities in active markets or inputs that are observable
Level 3 — Inputs that are unobservable (for example, cash flow modeling inputs based on assumptions)
54
XO GROUP INC.
NOTES TO CONSOLIDATED FINANCIAL STATEMENTS
For the Years Ended December 31, 2014, 2013 and 2012
3. Fair Value Measurements - (continued)
As of December 31, 2014, the Company’s investment in cash and cash equivalents of $90.0 million, restricted cash of $0.5 million and long-term restricted cash of $2.6 million on the Consolidated Balance Sheets were measured at fair value using Level 1 inputs. During the year ended December 31, 2014, there were no transfers in or out of the Company’s Level 1 assets.
4. Stock-Based Compensation
The Company maintains several stock-based compensation plans, which are more fully described below. The Company includes total stock-based compensation expense related to all its stock awards, including $0.5 million related to liability awards, in various operating expense categories for the years ended December 31, 2014, 2013 and 2012, as follows:
Year Ended December 31, | ||||||||||||
2014 | 2013 | 2012 | ||||||||||
(In Thousands) | ||||||||||||
Product and content development | $ | 2,020 | $ | 2,391 | $ | 2,084 | ||||||
Sales and marketing | 1,533 | 1,591 | 2,036 | |||||||||
General and administrative | 2,586 | 2,715 | 2,268 | |||||||||
Total stock-based compensation | $ | 6,139 | $ | 6,697 | $ | 6,388 | ||||||
XO Group Stock-Based Incentive Plans
The 2009 Stock Incentive Plan (the “2009 Plan”) was adopted by the Board of Directors, and became effective in May 2009 following approval by the stockholders, as a successor plan to the Company’s 1999 Stock Incentive Plan (the “1999 Plan”). All incentive stock options, nonqualified stock options (incentive and nonqualified stock options are collectively referred to as “options”), stock appreciation rights, stock issuances which may be subject to the attainment of designated performance goals or service requirements (“restricted stock”), or any combination thereof outstanding under the 1999 Plan have been incorporated into the 2009 Plan. Under the terms of the 2009 Plan, 1,000,000 shares of common stock of the Company were initially reserved for issuance in addition to the 3,190,737 shares that were incorporated from the 1999 Plan. Following approval by the stockholders, effective August 2014, an additional 2,700,000 shares were added to the shares reserved for the 2009 Plan. The 2009 Plan provides that awards may be granted to such non-employee directors, officers, employees and consultants of the Company as the Compensation Committee of the Board of Directors shall select in its discretion. Only employees of the Company are eligible to receive grants of incentive stock options. Options are granted at the fair market value of the stock on the date of grant. Options vest over periods up to 4 years and have terms not to exceed 10 years. Restricted stock awards vest over periods ranging from one to 4 years.
As of December 31, 2014, there were 3,307,686 shares available for future grants under the 2009 Plan. Increases to the number of shares available for future grants under the 2009 Plan require approval by the Board of Directors and the Company's stockholders.
55
XO GROUP INC.
NOTES TO CONSOLIDATED FINANCIAL STATEMENTS
For the Years Ended December 31, 2014, 2013 and 2012
4. Stock-Based Compensation - (continued)
Options
The following table represents a summary of the Company’s stock option activity under the 2009 and 2000 Plans and related information, without regard for estimated forfeitures, for the years ended December 31, 2014 and December 31, 2013:
Shares | Weighted Average Exercise Price | ||||||
(In Thousands) | |||||||
Options outstanding at December 31, 2012 | 201 | $ | 3.60 | ||||
Options granted | 150 | 12.97 | |||||
Options exercised | (69 | ) | 2.84 | ||||
Options forfeited | (1 | ) | 2.80 | ||||
Options outstanding at December 31, 2013 | 281 | 8.79 | |||||
Options granted | 100 | 10.28 | |||||
Options exercised | (131 | ) | 4.00 | ||||
Options forfeited | (100 | ) | 10.28 | ||||
Options outstanding at December 31, 2014 | 150 | $ | 12.97 | ||||
The fair value of the options granted during the year ended December 31, 2014 have been estimated on the date of grant using the Black-Scholes option pricing model with the following assumptions:
Year Ended December 31, | ||||||
2014 | 2013 | 2012 | ||||
Expected term | 3.75 years | 3.75 years | N/A | |||
Risk-free rate | 1.4% - 1.7% | 1.4% - 1.6% | N/A | |||
Expected volatility | 36.7% - 37.1% | 37.0% - 37.1% | N/A | |||
Dividend yield | —% | —% | N/A | |||
The expected term of the options granted during the year ended December 31, 2014 was determined using the "simplified method" as prescribed by SAB Topic 14D.2, which is presumed to be the midpoint between the vesting date and the end of the contractual term. The simplified method was used to determine the expected term of the options granted during the year ended December 31, 2014, due to the extended period of time that has lapsed since the Company's last granted options, as well as differences in the contractual terms of the option awards compared to options granted in prior periods, such that our historical share option experience does not provide a reasonable basis to estimate the expected term. The risk-free interest rates are based on quoted U.S. Treasury rates for securities with maturities approximating the expected term of the options. Expected volatility is based on the historical volatility of the market price of the Company’s stock.
During the years ended December 31, 2014, and 2013 the Company recorded $0.2 million and $0.1 million of compensation expense related to options, respectively. There was no expense related to options for the year ended December 31, 2012. The weighted average grant-date fair value of options granted during the years ended December 31, 2014 and December 31, 2013 was $3.09 and $3.89, respectively. No options were granted during the year ended December 31, 2012. During the year ended December 31, 2014, 37,500 options, with a weighted average exercise price of $12.97, vested. No options vested during the years ended December 31, 2013 and 2012. The intrinsic value of options exercised during the years ended December 31, 2014 and 2013 was $1.0 million and $0.8 million, respectively. During the year ended December 31, 2012, the number of options exercised and the intrinsic value of those options exercised was not material. During the year ended December 31, 2014, 100,000 options, with a weighted average exercise price of $10.28, were forfeited.
56
XO GROUP INC.
NOTES TO CONSOLIDATED FINANCIAL STATEMENTS
For the Years Ended December 31, 2014, 2013 and 2012
4. Stock-Based Compensation - (continued)
The following table summarizes information about options outstanding and exercisable at December 31, 2014:
Options Outstanding | Options Exercisable | |||||||||||||||
Number Outstanding as of December 31, 2014 | Weighted Average Remaining Contractual Life (in Years) | Weighted Average Exercise Price | Number Exercisable as of December 31, 2014 | Weighted Average Remaining Contractual Life (in Years) | Weighted Average Exercise Price | |||||||||||
(In Thousands) | (In Thousands) | |||||||||||||||
150 | 3.73 | $ | 12.97 | 38 | 3.73 | $ | 12.97 | |||||||||
150 | 3.73 | $ | 12.97 | 38 | 3.73 | $ | 12.97 | |||||||||
The aggregate intrinsic value of stock options outstanding at December 31, 2014 was $0.8 million, all of which relates to vested awards. The intrinsic value for stock options is calculated based on the exercise price of the underlying awards and the quoted closing price of the Company’s common stock as of December 31, 2014.
Service-Based Restricted Stock Awards
The following table summarizes the activity for awards of restricted stock with service-based vesting terms for the years ended December 31, 2014 and December 31, 2013:
Restricted Stock | Weighted Average Grant Date Fair Value (per share) | ||||||
(In Thousands) | |||||||
Unvested as of December 31, 2012 | 1,539 | $ | 9.38 | ||||
Granted | 1,620 | 10.21 | |||||
Vested | (471 | ) | 8.93 | ||||
Forfeited | (378 | ) | 9.62 | ||||
Unvested as of December 31, 2013 | 2,310 | 10.01 | |||||
Granted | 412 | 11.73 | |||||
Vested | (931 | ) | 9.67 | ||||
Forfeited | (526 | ) | 9.97 | ||||
Unvested as of December 31, 2014 | 1,265 | $ | 10.84 | ||||
For the years ended December 31, 2014, 2013 and 2012, the weighted average grant date fair value for service-based restricted stock granted was $11.73, $10.21 and $9.19, respectively. The fair value of service-based restricted stock that vested during these periods was $9.0 million, $4.8 million and $5.1 million, respectively. During the years ended December 31, 2014, 2013 and 2012, 383,811, 186,778 and 211,000 shares of service-based restricted stock, respectively, were repurchased by the Company in connection with the surrender of these shares by employees to satisfy tax withholding obligations related to the vesting of the service-based stock awards. The aggregate intrinsic value of unvested service-based restricted shares as of December 31, 2014 was $23.0 million. The intrinsic value for service-based restricted shares is calculated based on the par value of the underlying shares and the quoted price of the Company’s common stock as of December 31, 2014.
As of December 31, 2014, there was $8.8 million of total unrecognized compensation cost related to non-vested service-based restricted shares, net of estimated forfeitures, which is expected to be recognized over a weighted average period of 2.47 years. During the years ended December 31, 2014, 2013 and 2012, the Company recorded $4.9 million, $6.0 million and $6.3 million, respectively, of compensation expense related to service-based restricted shares.
57
XO GROUP INC.
NOTES TO CONSOLIDATED FINANCIAL STATEMENTS
For the Years Ended December 31, 2014, 2013 and 2012
4. Stock-Based Compensation - (continued)
Performance-Based Restricted Stock Awards
During the year ended December 31, 2014, the Company granted 31,250 restricted shares of common stock to its President and CEO, pursuant to his employment agreement. Vesting of this award was based upon (1) the achievement of performance goals established by the Compensation Committee of the Board and (2) continued employment with the Company through the end of the performance period. The performance period for this award ended on December 31, 2014 and was remeasured as of December 31, 2014 using the closing market price of $18.21. The Compensation Committee of the Board determined that the performance goals were achieved and therefore the award vested. The grant date fair value of this performance-based restricted stock award was $12.03, which was determined using the fair market value of the Company's stock on the grant date. During the year ended December 31, 2014, the Company incurred stock-based compensation expense related to this performance-based restricted stock award of $0.6 million. As of December 31, 2014, there was no unrecognized compensation cost related to this performance-based restricted stock award.
Employee Stock Purchase Plan ("ESPP")
The 2009 Employee Stock Purchase Plan (the “2009 ESPP”) was adopted by the Board of Directors, and was approved by the stockholders in May 2009, as a successor plan to the Company’s 1999 Employee Stock Purchase Plan (the “1999 ESPP”). The first offering period under the 2009 ESPP began August 1, 2009 and shares were first purchased under this plan on January 31, 2010. The Compensation Committee of the Board of Directors administers the ESPP. The 2009 ESPP permits a participating employee to make contributions to purchase shares of common stock by having withheld from his or her salary an amount between 1% and 15% of compensation. Under the 2009 ESPP, eligible employees of the Company may elect to participate before the start date of a semi-annual offering period. On each purchase date during an offering period, a participating employee’s contributions will be used to purchase up to 1,000 shares of the Company’s common stock for such participating employee at a 15% discount from the fair market value, as defined in the 2009 ESPP, of such stock. In addition to the 1,000 share purchase limit, the cost of shares purchased under the plan by a participating employee cannot exceed $25,000 in any plan year.
Under the terms of the 2009 ESPP, 300,000 shares of common stock of the Company were reserved for issuance. As of December 31, 2014, there were 92,436 shares available for future grants under the 2009 ESPP. Increases to the number of shares available for future grants under the 2009 ESPP require approval by the Board of Directors and the Company's stockholders.
During the years ended December 31, 2014 and 2013, the Company issued shares of common stock under the 2009 ESPP, as follows:
Offering Period Purchase Date | Number of Shares | Purchase Price | |||
January 31, 2013 | 20,170 | $ | 7.11 | ||
July 31, 2013 | 19,048 | $ | 8.15 | ||
Total 2013 | 39,218 | ||||
January 31, 2014 | 17,640 | $ | 10.26 | ||
July 31, 2014 | 20,356 | $ | 10.31 | ||
Total 2014 | 37,996 | ||||
58
XO GROUP INC.
NOTES TO CONSOLIDATED FINANCIAL STATEMENTS
For the Years Ended December 31, 2014, 2013 and 2012
4. Stock-Based Compensation - (continued)
The fair value of 2009 ESPP rights have been estimated on the date of grant using the Black-Scholes option pricing model with the following assumptions:
Year Ended December 31, | ||||||
2014 | 2013 | 2012 | ||||
ESPP Rights | ESPP Rights | ESPP Rights | ||||
Expected term | 6 months | 6 months | 6 months | |||
Risk-free rate | 0.05% - 0.06% | 0.08% - 0.11% | 0.14% - 0.15% | |||
Expected volatility | 25.2% - 29.3% | 19.9% - 20.3% | 8.3% - 29.4% | |||
Dividend yield | —% | —% | —% | |||
Expected volatility is based on the historical volatility of the market price of the Company’s stock. The expected lives of ESPP rights granted are based on the period of time between the offering date and the exercise date. The risk-free interest rates are based on the quoted U.S. Treasury rates for securities with maturities approximating the expected term. The fair value for 2009 ESPP rights includes the option exercise price discount from market value provided for under the 2009 ESPP.
During the years ended December 31, 2014, 2013 and 2012, the Company recorded $104,000, $84,000 and $66,000, respectively, of compensation expense related to 2009 ESPP rights. The weighted average grant-date fair value of 2009 ESPP rights arising from elections made by ESPP participants was $2.63, $2.24 and $1.70 during the years ended December 31, 2014, 2013 and 2012, respectively. The fair value of 2009 ESPP rights that vested during the years ended December 31, 2014, 2013 and 2012 was $102,000, $67,000 and $86,000, respectively.
The intrinsic value of shares purchased through the 2009 ESPP during the year ended December 31, 2014 was $67,000. The intrinsic value of outstanding 2009 ESPP rights as of December 31, 2014 was $59,000. The intrinsic value of the shares of 2009 ESPP rights is calculated as the discount from the quoted price of the Company’s common stock, as defined in the 2009 ESPP, which was available to employees as of the respective dates.
As of December 31, 2014, there was approximately $9,000 of unrecognized compensation cost for the 2009 ESPP rights related to a 2014 offering period, which is expected to be recognized over a period of one month.
The Company received cash from the exercise of options and 2009 ESPP rights of $0.9 million, $0.5 million and $0.3 million for the years ended December 31, 2014, 2013 and 2012, respectively, for which the Company issued new shares of common stock.
The tax benefit attributable to all recorded stock-based compensation was $2.6 million, $3.0 million and $2.3 million for the years ended December 31, 2014, 2013 and 2012, respectively. For the years ended December 31, 2014, 2013 and 2012, the Company also recorded an increase of $1.3 million, an increase of $0.3 million and a decrease of $0.4 million, respectively, to additional paid-in-capital, for tax benefits attributable to tax deductions generated from the exercise of employee stock options, vesting of restricted stock and the exercise of stock warrants in excess of related stock-based compensation recorded for financial reporting purposes. The tax benefits for these deductions are recognized when they result in a reduction to current taxes payable and are accounted for as additional paid-in-capital.
5. Acquisitions and Exit Activities
Acquisitions
On March 10, 2014, the Company acquired the assets of Gojee, Inc. ("Gojee"), a mobile development company, for a total purchase price of $0.5 million. The full purchase price was allocated to goodwill, all of which is expected to be deductible for tax purposes.
On March 26, 2014, the Company acquired the assets of Two Bright Lights, Inc. ("TBL"), a platform used by professional photographers to submit wedding photos, for a total purchase price of $5.3 million. TBL is expected to expand the Company's content to users and service offerings to vendors. A portion of the purchase price for the assets of TBL was allocated to the net
59
XO GROUP INC.
NOTES TO CONSOLIDATED FINANCIAL STATEMENTS
For the Years Ended December 31, 2014, 2013 and 2012
5. Acquisitions and Exit Activities - (continued)
tangible and intangible assets, in the amounts of $0.1 million and $1.7 million, respectively, based upon their fair values preliminarily assessed as of the acquisition date. The excess of the purchase price over these fair values was allocated to goodwill, all of which is expected to be deductible for tax purposes. The final allocation of the purchase price for the assets of TBL is as follows:
Assets and Liabilities Acquired | Amount | |||
(In Thousands) | ||||
Current assets | $ | 6 | ||
Other long term assets | 7 | |||
Property and equipment | 24 | |||
Software development | 47 | |||
Trade name | 36 | |||
Media content | 325 | |||
Customer relationships | 573 | |||
Goodwill | 4,350 | |||
Deferred revenue and other liabilities | (68 | ) | ||
Total purchase price | $ | 5,300 | ||
The results of operations for the acquired businesses have been included in the Company's consolidated statement of operations since the respective acquisition dates. Pro forma consolidated statements of operations have not been provided since the acquired assets would not have had a material impact had the acquisitions been made as of January 1, 2013.
Exit Activities
The Company's wedding merchandising operations include the fulfillment of customer orders from its warehouse facility in Redding, California. After reviewing the past and expected financial performance of the operations, in October 2014, the Company committed to a plan to cease operations at its warehouse in Redding, California. The process of the warehouse closure is expected to be completed by end of the first quarter of 2015. The Company intends to continue to serve the commerce needs of its users through a registry and partner-based model for providing users with desired products and services. The Company will recognize charges for separation, contract terminations, asset impairments and loss on sales of assets of approximately $1.0 million as a result of exiting its Redding warehouse operations. During the year ended December 31, 2014, the Company recognized $0.3 million of separation expense, of which $26,000 is recorded in product and content expenses, $60,000 is recorded in sales and marketing expenses and $179,000 is recorded in general and administrative expenses in the consolidated statement of operations . In addition, the Company recognized $0.3 million of asset impairments, which were recorded in asset impairment charges in the consolidated statement of operations for the year ended December 31, 2014. The Company has a liability of $0.3 million related to separation charges accrued as of December 31, 2014, which is recorded within accounts payable and accrued expenses on the consolidated balance sheet. The Company expects to incur additional charges related to exiting its Redding warehouse operations of $0.4 million in the first quarter of 2015.
From 2010 to 2014, the Company operated a wedding content and publishing business in China. During 2014, the Company determined an expansion of the content and publishing business into China was no longer in the best interest of the Company and its stockholders. In December of 2014, the Company completed the disposition of its China wedding content and publishing operations (Ijie) to PUM Development Co, Ltd. and Novel Horizon Ventures Limited. The disposition consisted of 95% of the issued share capital of TK Investment, which holds the Ijie operations, for consideration consisting primarily of the assumption of ongoing operating responsibility of the Ijie operations, plus a nominal cash payment of $1.00. The Company will retain 5% of the issued share capital of TK Investment. No asset value was recorded related to this investment. The Company recognized a loss related to the disposition of the Ijie operations in the aggregate amount of $1.8 million, which is included in interest and other income (expense), net in the consolidated statement of operations for the year ended December 31, 2014. The loss relates primarily to $1.1 million of carrying value of net assets in excess of the proceeds from the disposition, $0.4 million of disposal costs and $0.3 million associated with the realization of the cumulative translation adjustment. The tax impact from the disposition was
60
XO GROUP INC.
NOTES TO CONSOLIDATED FINANCIAL STATEMENTS
For the Years Ended December 31, 2014, 2013 and 2012
5. Acquisitions and Exit Activities - (continued)
approximately $1.4 million, for a total cost of approximately $3.2 million. Furthermore, the Company does not expect to recognize any material additional costs of exiting its Ijie operations.
On April 20, 2012, the Company contributed an additional $500,000 to acquire the remaining 25% ownership of an entity that the Company initially invested in August 2011. As a result of this transaction, the noncontrolling interest balance of $471,000, which included the net loss attributable to noncontrolling interest of $65,000 from the beginning of the year through April 20, 2012, was removed to account for the 100% ownership of this subsidiary.
6. Goodwill and Other Intangible Assets
The changes in the carrying amount of goodwill for the years ended December 31, 2014 and 2013 are as follows:
Amount | |||
(In Thousands) | |||
Balance at December 31, 2012 | $ | 37,750 | |
Acquisition of mobile development company in 2013 | 750 | ||
Balance at December 31, 2013 | $ | 38,500 | |
Acquisition of the assets of Gojee, Inc | 500 | ||
Acquisition of the assets of Two Bright Lights, Inc. | 4,350 | ||
Adjustment to deferred tax assets | (1,479 | ) | |
Balance at December 31, 2014 | $ | 41,871 | |
See details on assets acquired in Note 5. See Note 2 for information regarding our annual impairment methodology. The Company performed goodwill impairment testing as of December 31, 2014 and 2013, and no impairments were recorded.
During the year ended December 31, 2014, the Company determined that it understated the value of net operating loss carryforwards recorded as part of its September 2006 acquisition of WeddingChannel. During the year ended December 31, 2014, the Company made an adjustment to increase the deferred tax asset associated with these net operating loss carryforwards and decrease goodwill by approximately $1.5 million, which represents the tax impact of approximately $4.9 million net operating loss carryforwards not recorded at the acquisition date.
61
XO GROUP INC.
NOTES TO CONSOLIDATED FINANCIAL STATEMENTS
For the Years Ended December 31, 2014, 2013 and 2012
6. Goodwill and Other Intangible Assets - (continued)
Other intangible assets consisted of the following:
December 31, 2014 | December 31, 2013 | |||||||||||||||||||||||
Gross Carrying Amount | Accumulated Amortization | Net Cost | Gross Carrying Amount | Accumulated Amortization | Net Cost | |||||||||||||||||||
(In Thousands) | ||||||||||||||||||||||||
Indefinite lived intangible assets: | ||||||||||||||||||||||||
Trade names | $ | 480 | $ | — | $ | 480 | $ | 480 | $ | — | $ | 480 | ||||||||||||
URLs | 35 | — | 35 | 127 | — | 127 | ||||||||||||||||||
Subtotal indefinite lived intangible assets | $ | 515 | $ | — | $ | 515 | $ | 607 | $ | — | $ | 607 | ||||||||||||
Definite lived intangible assets: | ||||||||||||||||||||||||
Customer and advertiser relationships | $ | 897 | $ | (365 | ) | $ | 532 | $ | 324 | $ | (251 | ) | $ | 73 | ||||||||||
Media content | 325 | (49 | ) | 276 | — | — | — | |||||||||||||||||
Developed technology and patents | 523 | (283 | ) | 240 | 523 | (258 | ) | 265 | ||||||||||||||||
Service contracts and other | 150 | (56 | ) | 94 | 94 | (47 | ) | 47 | ||||||||||||||||
Trademarks and trade names | 3,571 | (3,541 | ) | 30 | 3,643 | (1,278 | ) | 2,365 | ||||||||||||||||
Subtotal definite lived intangible assets | $ | 5,466 | $ | (4,294 | ) | $ | 1,172 | $ | 4,584 | $ | (1,834 | ) | $ | 2,750 | ||||||||||
Total intangible assets | $ | 5,981 | $ | (4,294 | ) | $ | 1,687 | $ | 5,191 | $ | (1,834 | ) | $ | 3,357 | ||||||||||
The Company evaluates intangible assets annually as of October 1 for impairment, or more often if indicators of impairment exist. In order to complete its impairment analysis, the Company estimates fair value using multiple approaches. In its assessment of impairment of intangible assets, the Company considers whether events or changes in circumstances such as significant declines in revenues, earnings or material adverse changes in the business climate indicate that the carrying value of assets may be impaired.
The annual impairment analysis for the year ended December 31, 2014 resulted in the Company concluding that a definite-lived trade name and certain URLs were impaired, resulting in an impairment charge of $0.2 million. The annual impairment analysis for the year ended December 31, 2013 resulted in the Company concluding that an indefinite-lived trade name from a prior year acquisition was impaired, primarily based on an analysis of future cash flows expected to be generated by this trade name. As a result, an impairment charge of $0.2 million, representing the full carrying value of the asset, was recorded.
During the year ended December 31, 2013, the Company concluded there were further impairment indicators with respect to the WeddingChannel trade name, which was categorized as a definite-lived intangible asset as of December 31, 2012. Impairment indicators included continued declines in revenue, traffic and membership related to this site. As a result of its review, the Company recorded a non-cash impairment of $1.2 million to write down the value of the trade name. The resulting fair value measurement was considered to be a Level 3 measurement and was determined using a discounted cash flow methodology with assumptions for cash flows, royalty rate, and discount rate. The Company also evaluated the estimated useful life of this trade name asset, concluding that the remaining carrying value of the trade name should be amortized over a period of one year. During the year ended December 31, 2014, the Company accelerated amortization of the WeddingChannel trade name of $2.1 million.
During the year ended December 31, 2012, the Company concluded there were impairment indicators with respect to the WeddingChannel trade name. The impairment indicators included trending declines in revenue, as well as lower advertising and registry services revenue attributable to this trade name. Based primarily on future cash flow projections for the lines of business most closely related to this trade name, the Company concluded that an impairment charge of $0.7 million was necessary in the third quarter of 2012. During the fourth quarter of 2012, the Company determined that, based on prior period impairment charges and management's evaluation of the estimated future cash flows associated with this intangible asset, the WeddingChannel trade name should be categorized as a definite-lived intangible asset and amortized over an estimated useful life of 5 years.
62
XO GROUP INC.
NOTES TO CONSOLIDATED FINANCIAL STATEMENTS
For the Years Ended December 31, 2014, 2013 and 2012
6. Goodwill and Other Intangible Assets - (continued)
During the year ended December 31, 2012, based on management's evaluation of the estimated future cash flows, the Company determined that the trade name of an e-commerce company acquired in May 2009 should be categorized as a definite-lived intangible asset and amortized over an estimated useful life of 3 years. These factors resulted in impairment charges of $0.2 million against the e-commerce company's trade name during the year ended December 31, 2012.
Amortization expense for definite-lived intangible assets was $2.5 million, $1.1 million and $0.4 million for the years ended December 31, 2014, 2013 and 2012, respectively. Estimated annual amortization expense is $0.2 million in 2015, $0.2 million in 2016, $0.2 million in 2017, $0.2 million in 2018, and $0.1 million thereafter.
7. Investments
As of December 31, 2014, the Company's investments consisted of equity ownership in the following entities:
Company | Approximate % Ownership |
Touch Media International Holdings | 2.9% |
Catchafire, Inc. | 5.2% |
Pricing Engine Inc. | 17.4% |
GigMasters.com, Inc. | 30.8% |
On January 16, 2014, the Company entered into an agreement to contribute $4.0 million in cash in exchange for a minority equity interest of approximately 2.9% in Touch Media International Holdings, an interactive in-taxi advertising and media platform with operations in China. The Company uses the cost method of accounting for this investment since the Company cannot exercise significant influence.
Effective May 31, 2014, the Company changed its method of accounting for its investment in Catchafire, Inc. from the equity method to the cost method of accounting. As of that date, the Company relinquished its representation on this investee's board of directors and, accordingly, the ability to exercise significant influence.
During the year ended December 31, 2013, the Company entered into an agreement to contribute $1.3 million in cash in exchange for a 25.0% equity investment in GigMasters.com Inc. During the year ended December 31, 2014, the amount of in-substance common stock was reconsidered resulting in an increase the Company's ownership to 30.8%. This increased the Company's share of losses in GigMasters.com Inc. The Company accounts for this investment under the equity method of accounting since it owns greater than 20% and has representation on the investee’s board of directors and, accordingly, exercises significant influence.
During the year ended December 31, 2012, the Company entered into an agreement to contribute $1.0 million in cash, plus the assets of a subsidiary of the Company, in exchange for a 17.4% equity investment in Pricing Engine Inc.
The Company's proportionate shares of the operating results of its investments are recorded in “Loss in equity interests” in the Company's Consolidated Statements of Operations. Losses in equity interests for the years ended December 31, 2014, 2013 and 2012 were $0.2 million, $2.0 million and $0.1 million, respectively. Loss in equity interests for the year ended December 31, 2013 includes an other-than-temporary impairment charge of $1.8 million, representing the full carrying value of the Pricing Engine, Inc. investment.
8. Capital Stock
The Company’s Amended and Restated Certificate of Incorporation provides for 105,000,000 authorized shares of capital stock consisting of 100,000,000 shares of common stock, each having a par value of $0.01 per share and 5,000,000 shares of preferred stock, each having a par value of $0.001.
63
XO GROUP INC.
NOTES TO CONSOLIDATED FINANCIAL STATEMENTS
For the Years Ended December 31, 2014, 2013 and 2012
8. Capital Stock - (continued)
The Board of Directors is authorized, without further stockholder approval, to issue from time to time up to an aggregate of 5,000,000 shares of preferred stock, in one or more series and to fix or alter the designations, preferences, rights, and any qualifications, limitations or restrictions, of the shares of each series thereof, including the dividend rights, dividend rates, conversion rights, voting rights, terms of redemption, including sinking fund provisions, redemption price or prices, liquidation preferences and the number of shares constituting any series or designation of series.
At December 31, 2014, the Company had reserved the following shares of common stock for future issuance under the Company’s 2009 Stock Incentive Plan and the Employee Stock Purchase Plan (collectively, the “Plans”):
Amount | ||
(In Thousands) | ||
Shares under the 2009 Stock Incentive Plan | 3,308 | |
Shares under the Employee Stock Purchase Plan | 92 | |
Total common stock reserved for future issuance under the Plans | 3,400 | |
On December 19, 2011, the Company’s Board of Directors authorized a new repurchase program of up to $20.0 million of the Company’s common stock (the “December 2011 Repurchase Program”). On June 12, 2012, the Company completed the December 2011 Repurchase Program. Under the December 2011 Repurchase Program, the Company repurchased a total of 2.2 million shares of common stock in the open market at an average cost of $8.94 per share. The aggregate purchase price of these transactions was $20.0 million, including commissions. The shares repurchased represented 6.5% of the Company’s outstanding common stock as of December 31, 2012. The Company funded the repurchase with available cash. All shares repurchased under the foregoing repurchase programs were retired upon repurchase.
On April 10, 2013, the Company announced that its Board of Directors authorized the repurchase of up to $20.0 million of the Company’s common stock. As of December 31, 2014, there were 120,557 shares repurchased for $1.6 million by the Company under this repurchase program.
64
XO GROUP INC.
NOTES TO CONSOLIDATED FINANCIAL STATEMENTS
For the Years Ended December 31, 2014, 2013 and 2012
9. Income Taxes
The components of the provision for income taxes are as follows:
Year Ended December 31, | ||||||||||||
2014 | 2013 | 2012 | ||||||||||
(In Thousands) | ||||||||||||
Current: | ||||||||||||
U.S. federal | $ | 3,826 | $ | 3,876 | $ | 4,755 | ||||||
Foreign | 525 | 344 | 87 | |||||||||
State and local | 137 | 1,061 | 1,301 | |||||||||
Total current | 4,488 | 5,281 | 6,143 | |||||||||
Deferred: | ||||||||||||
U.S. federal | 1,012 | (7 | ) | (445 | ) | |||||||
Foreign | — | 2 | — | |||||||||
State and local | 963 | (435 | ) | (40 | ) | |||||||
Total deferred | 1,975 | (440 | ) | (485 | ) | |||||||
Provision for income taxes | $ | 6,463 | $ | 4,841 | $ | 5,658 | ||||||
The reconciliation of income tax expense computed at the U.S. federal statutory rate to the income tax provision for the years ended December 31, 2014, 2013 and 2012 is as follows:
Year Ended December 31, | ||||||||||||
2014 | 2013 | 2012 | ||||||||||
(In Thousands) | ||||||||||||
Income taxes at federal statutory rate | $ | 2,424 | $ | 3,722 | $ | 4,980 | ||||||
State income taxes, net of federal benefit | 833 | 591 | 793 | |||||||||
Sale of Ijie operations | 1,404 | — | — | |||||||||
Foreign taxes | 714 | (102 | ) | (44 | ) | |||||||
Subpart F income | 570 | — | — | |||||||||
Income tax reserve | 266 | 690 | — | |||||||||
Nondeductible expenses | 252 | 352 | 122 | |||||||||
Provision for foreign unremitted earnings | 221 | — | — | |||||||||
Return to provision | 51 | (423 | ) | — | ||||||||
Domestic production activities deduction | (236 | ) | (264 | ) | (236 | ) | ||||||
Other | (36 | ) | 275 | 43 | ||||||||
Provision for income taxes | $ | 6,463 | $ | 4,841 | $ | 5,658 | ||||||
The increase in the Company's effective tax rate in the current year was primarily attributable to the sale of the Company’s Ijie operations, higher non-deductible expenses and certain expired state tax attributes.
Deferred income taxes reflect the net tax effects of temporary differences between the carrying amount of assets and liabilities for financial reporting purposes and amounts used for income tax purposes. Significant components of the Company’s deferred tax assets and liabilities consist of the following:
65
XO GROUP INC.
NOTES TO CONSOLIDATED FINANCIAL STATEMENTS
For the Years Ended December 31, 2014, 2013 and 2012
9. Income Taxes - (continued)
Year Ended December 31, | ||||||||
2014 | 2013 | |||||||
(In Thousands) | ||||||||
Deferred tax assets: | ||||||||
Net operating loss and tax credit carryforwards | $ | 12,745 | $ | 16,387 | ||||
Allowance for doubtful accounts and other reserves | 3,092 | 1,021 | ||||||
Deferred rent | 2,392 | 2,891 | ||||||
Stock-based compensation | 1,550 | 2,974 | ||||||
Other | 1,121 | 978 | ||||||
Total deferred tax assets | 20,900 | 24,251 | ||||||
Deferred tax liabilities: | ||||||||
Unremitted earnings | (221 | ) | — | |||||
Intangible assets | (165 | ) | (1,872 | ) | ||||
Property and equipment | (2,405 | ) | (1,867 | ) | ||||
Capitalized software costs | (1,947 | ) | (768 | ) | ||||
Total deferred tax liabilities | (4,738 | ) | (4,507 | ) | ||||
Total net deferred tax assets | $ | 16,162 | $ | 19,744 | ||||
As of December 31, 2014, the Company had net operating loss carryforwards of approximately $42.2 million for federal tax purposes, which are set to expire in years 2019 through 2026. The majority of this amount represents acquired tax loss carryforwards of WeddingChannel.com, which are subject to limitation on future utilization under Section 382 of the Internal Revenue Code of 1986. Section 382 imposes limitations on the availability of a company’s net operating losses after a more than 50 percentage point ownership change occurs over a 3 year period. It is estimated that the effect of Section 382 will generally limit the amount of the net operating loss carryforwards of WeddingChannel.com that is available to offset future taxable income to approximately $3.6 million annually. The overall determination of the annual loss limitation is subject to interpretation, and, therefore, the annual loss limitation could be subject to change.
The following is a reconciliation of the Company’s unrecognized tax benefits for 2014 and 2013:
2014 | 2013 | |||||||
(In Thousands) | ||||||||
Balances of unrecognized tax benefits as of January 1 | $ | 5,093 | $ | 4,403 | ||||
(Decreases) increases for positions taken in prior years | (3,089 | ) | 426 | |||||
Increases for positions related to the current year | 172 | 264 | ||||||
Balance of unrecognized tax benefits as of December 31 | $ | 2,176 | $ | 5,093 | ||||
Of the total $2.2 million, approximately $0.9 million is presented within other long-term liabilities on the consolidated balance sheets. These unrecognized tax benefits would affect the Company's effective income tax rate, if and when recognized in future years. The remainder of the unrecognized tax benefits has been netted against the related deferred tax assets and, if recognized, would also be reported as a reduction of income tax expense. The Company does not presently anticipate such uncertain tax positions will significantly increase or decrease in the next twelve months; however, actual developments could differ from those currently expected.
The Company is subject to income tax in the United States and various foreign state and local jurisdictions. In 2013, the Company received notification that its New York state franchise tax returns would be audited for the years ended December 31, 2010 through December 31, 2012. This audit was completed during 2014 and resulted in no change in taxes due. The Company is subject to U.S. federal, state and local income tax examination for tax years 2011, 2012 and 2013; however, net operating losses utilized by the Company that were generated in prior years are subject to review.
66
XO GROUP INC.
NOTES TO CONSOLIDATED FINANCIAL STATEMENTS
For the Years Ended December 31, 2014, 2013 and 2012
9. Income Taxes - (continued)
The Company records interest and penalties as a component of income tax expense. For the years ended December 31, 2014 and 2013, the total interest and penalties included in the Company's tax provision was $30,000 and $0.2 million, respectively. For the year ended December 31, 2012, interest and penalties were immaterial. As of December 31, 2014 and 2013, the Company had $0.1 million of accrued interest and penalties related to accrued income taxes.
Following the sale of the Company’s Ijie operations, the Company determined that it will no longer permanently reinvest its foreign earnings and as a result the Company has recorded a deferred tax liability in the amount of $0.2 million as of December 31, 2014.
10. Commitments and Contingencies
Long-Term Restricted Cash
On May 13, 2011, the Company entered into an agreement with 195 Broadway LLC to lease office space for its New York headquarters. The Company is required to deliver to 195 Broadway LLC, and maintain in effect during the entire lease term, an unconditional irrevocable letter of credit in the amount of $2.4 million, as security for the Company’s obligations under the lease. Provided the Company is not in default beyond the applicable notice and grace periods, on the fifth anniversary of the lease commencement date, the required letter of credit amount will be reduced to $1.2 million. On May 12, 2011, the Company entered into an irrevocable letter of credit with Union Bank of Switzerland (“UBS”) in the amount of $2.6 million. The letter of credit matured and was renewed on May 12, 2012 and will continue to renew on a yearly basis. The letter of credit is collateralized by U.S. Treasury Bills in the amount of $2.6 million. The additional amount of $200,000 was required by UBS to account for potential market fluctuation in the value of such collateral. Upon a default by the Company in respect of its payment obligations under the lease, 195 Broadway LLC may request the funds from UBS under the terms of the letter of credit, and UBS will draw down on the Company’s restricted cash to satisfy the obligation.
Restricted Cash
The Company holds $0.5 million restricted cash related to the acquisition of the assets of Two Bright Lights, Inc. completed in March 2014. Under this escrow agreement, the cash is to be held as restricted until September 2015, at which point it will be released if there are no contingencies which the Company needs to reimburse for.
Operating Leases
The Company leases office facilities and certain warehouse space under non-cancelable operating lease agreements which expire at various dates through 2022. Rent-free periods and scheduled rent increases are recorded as components of rent expense on a straight-line basis over the related terms of such leases. Rent expense for each of the years ended December 31, 2014, 2013 and 2012 amounted to $3.0 million, $2.9 million and $2.9 million, respectively.
Future minimum lease payments under non-cancelable operating leases are as follows (in thousands):
Years ending December 31, | |||
2015 | $ | 3,368 | |
2016 | 2,892 | ||
2017 | 2,793 | ||
2018 | 2,900 | ||
2019 | 2,748 | ||
Thereafter | 6,813 | ||
Total | $ | 21,514 | |
67
XO GROUP INC.
NOTES TO CONSOLIDATED FINANCIAL STATEMENTS
For the Years Ended December 31, 2014, 2013 and 2012
10. Commitments and Contingencies - (continued)
Legal Proceedings
As of December 31, 2014, the Company was engaged in certain legal actions arising in the ordinary course of business and believes that the ultimate outcome of these actions will not have a material effect on its results of operations, financial position or cash flows.
Other Commitments and Contingencies
In connection with the sale of our Ijie operations, the Company has agreed to indemnify the buyers for certain liabilities that may arise related to events prior to the sale transaction or breach of our covenants under the sale agreement.
11. 401(k) Plan
The Company maintains a 401(k) plan covering all eligible employees and provides for a Company match on a portion of participant contributions. Employees may contribute up to 92% of their eligible compensation, subject to IRS maximums. The Company matches 25% of the first 4% of eligible compensation contributed. The Company’s matching contributions are made in cash and amounted to $0.3 million, $0.2 million and $0.1 million for the years ended December 31, 2014, 2013 and 2012, respectively.
68
XO GROUP INC.
NOTES TO CONSOLIDATED FINANCIAL STATEMENTS
For the Years Ended December 31, 2014, 2013 and 2012
12. Supplemental Balance Sheet Information
The components of certain balance sheet accounts are as follows:
December 31, | ||||||||
2014 | 2013 | |||||||
(In Thousands) | ||||||||
Inventory | ||||||||
Raw materials | $ | 371 | $ | 859 | ||||
Finished goods | 269 | 1,515 | ||||||
Total inventory, net | $ | 640 | $ | 2,374 | ||||
Prepaid expenses and other current assets | ||||||||
Taxes | $ | 786 | $ | 2,693 | ||||
Software licenses and maintenance | 1,538 | 1,882 | ||||||
Compensation and employee benefits | 221 | 346 | ||||||
Other | 1,089 | 1,072 | ||||||
Total prepaid expenses and other current assets | $ | 3,634 | $ | 5,993 | ||||
Property and equipment | ||||||||
Leasehold improvements | $ | 9,722 | $ | 9,921 | ||||
Furniture and fixtures | 654 | 1,477 | ||||||
Computer and office equipment | 5,782 | 7,324 | ||||||
Less: accumulated depreciation | (8,323 | ) | (8,635 | ) | ||||
Total fixed assets, net | 7,835 | 10,087 | ||||||
Capitalized software | 16,646 | 13,523 | ||||||
Less: accumulated amortization | (9,356 | ) | (8,120 | ) | ||||
Total capitalized software, net | 7,290 | 5,403 | ||||||
Total property and equipment, net | $ | 15,125 | $ | 15,490 | ||||
Accounts payable and accrued expenses | ||||||||
Accounts payable | $ | 2,540 | $ | 4,617 | ||||
Compensation and employee benefits | 6,339 | 3,384 | ||||||
Taxes | 528 | 1,664 | ||||||
Other accrued expenses | 3,056 | 2,755 | ||||||
Total accounts payable and accrued expenses | $ | 12,463 | $ | 12,420 | ||||
69
XO GROUP INC.
NOTES TO CONSOLIDATED FINANCIAL STATEMENTS
For the Years Ended December 31, 2014, 2013 and 2012
13. Quarterly Financial Data (Unaudited)
The following tables set forth certain unaudited condensed consolidated quarterly statement of operations data for the eight quarters ended December 31, 2014. This information is unaudited, but in the opinion of management, it has been prepared substantially on the same basis as the audited consolidated financial statements and all necessary adjustments, consisting only of normal recurring adjustments, have been included in the amounts stated below to present fairly the unaudited consolidated quarterly results of operations. The condensed consolidated quarterly data should be read in conjunction with our audited consolidated financial statements and the notes to such statements. The results of operations for any quarter are not necessarily indicative of the results of operations for any future period.
First Quarter | Second Quarter | Third Quarter | Fourth Quarter | |||||||||||||
(In Thousands, Except for Per Share Data) | ||||||||||||||||
2014 | ||||||||||||||||
Net revenue: | ||||||||||||||||
Online advertising | $ | 21,349 | $ | 22,051 | $ | 22,122 | $ | 24,027 | ||||||||
Registry services | 1,731 | 2,934 | 3,289 | 1,840 | ||||||||||||
Merchandise | 3,768 | 4,852 | 4,539 | 3,064 | ||||||||||||
Publishing and other | 5,572 | 8,493 | 5,908 | 8,125 | ||||||||||||
Total net revenue | 32,420 | 38,330 | 35,858 | 37,056 | ||||||||||||
Gross profit | 27,960 | 32,288 | 30,997 | 31,224 | ||||||||||||
Net income (loss) | $ | (676 | ) | $ | 3,047 | $ | 2,084 | $ | (3,993 | ) | ||||||
Net income (loss) per share(1): | ||||||||||||||||
Basic | $ | (0.03 | ) | $ | 0.12 | $ | 0.08 | $ | (0.16 | ) | ||||||
Diluted | $ | (0.03 | ) | $ | 0.12 | $ | 0.08 | $ | (0.16 | ) | ||||||
2013 | ||||||||||||||||
Net revenue: | ||||||||||||||||
Online advertising | $ | 20,135 | $ | 20,772 | $ | 20,620 | $ | 20,134 | ||||||||
Registry services | 1,174 | 2,409 | 2,790 | 1,553 | ||||||||||||
Merchandise | 3,818 | 6,361 | 5,232 | 2,995 | ||||||||||||
Publishing and other | 5,146 | 7,446 | 5,326 | 7,903 | ||||||||||||
Total net revenue | 30,273 | 36,988 | 33,968 | 32,585 | ||||||||||||
Gross profit | 25,577 | 29,982 | 28,708 | 27,146 | ||||||||||||
Net income (loss) | 1,673 | 4,088 | 3,101 | (3,068 | ) | |||||||||||
Net income (loss) per share(1): | ||||||||||||||||
Basic | $ | 0.07 | $ | 0.17 | $ | 0.13 | $ | (0.12 | ) | |||||||
Diluted | $ | 0.07 | $ | 0.16 | $ | 0.12 | $ | (0.12 | ) | |||||||
(1) | The sum of the quarterly earnings per share may not equal the full-year amount, as the computations of the weighted-average number of common basic and diluted shares outstanding for each quarter and the full year are performed independently. |
70
Schedule II — Valuation and Qualifying Accounts
For the Years Ended December 31, 2014, 2013 and 2012
(In Thousands)
Balance Beginning of Year | Charged to Costs and Expenses | Write-offs, Net of Recoveries and Actual Returns | Balance at End of Year | |||||||||||||
2014 | ||||||||||||||||
Allowance for doubtful accounts | $ | 936 | $ | 1,422 | $ | (537 | ) | $ | 1,821 | |||||||
Allowance for returns | 742 | 5,987 | (5,794 | ) | 935 | |||||||||||
Total | $ | 1,678 | $ | 7,409 | $ | (6,331 | ) | $ | 2,756 | |||||||
2013 | ||||||||||||||||
Allowance for doubtful accounts | $ | 898 | $ | 446 | $ | (408 | ) | $ | 936 | |||||||
Allowance for returns | 569 | 6,206 | (6,033 | ) | 742 | |||||||||||
Total | $ | 1,467 | $ | 6,652 | $ | (6,441 | ) | $ | 1,678 | |||||||
2012 | ||||||||||||||||
Allowance for doubtful accounts | $ | 727 | $ | 616 | $ | (445 | ) | $ | 898 | |||||||
Allowance for returns | 637 | 4,522 | (4,590 | ) | 569 | |||||||||||
Total | $ | 1,364 | $ | 5,138 | $ | (5,035 | ) | $ | 1,467 | |||||||
71
Item 9. Changes in and Disagreements With Accountants on Accounting and Financial Disclosure
None.
Item 9A. Controls and Procedures
Evaluation of Disclosure Controls and Procedures
The Company’s management, including the Chief Executive Officer and Chief Financial Officer, evaluated the effectiveness of the Company’s disclosure controls and procedures, as that term is defined in Rule 13a-15(e) promulgated under the Securities Exchange Act of 1934, as amended (the “Exchange Act”), as of December 31, 2014. Based on that evaluation, the Chief Executive Officer and Chief Financial Officer concluded that the disclosure controls and procedures are effective to ensure that information required to be disclosed by the Company in the reports that the Company files or submits under the Exchange Act is recorded, processed, summarized and reported, within the time periods specified in the SEC’s rules and forms, and to ensure that such information is accumulated and communicated to the Company’s management, including the Chief Executive Officer and Chief Financial Officer, as appropriate to allow timely decisions regarding required disclosure.
Report of Management on Internal Control Over Financial Reporting
Management is responsible for establishing and maintaining adequate internal control over financial reporting, as defined in Rule 13a-15(f) of the Exchange Act. Management, including the Chief Executive Officer and Chief Financial Officer, has assessed the effectiveness of our internal control over financial reporting as of December 31, 2014 based on criteria established in Internal Control — Integrated Framework issued by the Committee of Sponsoring Organizations of the Treadway Commission (2013 Framework). As a result of this assessment, management concluded that as of December 31, 2014, the Company’s internal control over financial reporting was effective in providing reasonable assurance regarding the reliability of financial reporting and the preparation of financial statements for external purposes in accordance with generally accepted accounting principles. Ernst & Young LLP has issued an attestation report on management’s internal control over financial reporting, a copy of which is included in this Form 10-K in Item 8, “Financial Statements and Supplementary Data.”
There were no changes in the Company’s internal control over financial reporting during the three months and year ended December 31, 2014 identified in connection with the evaluation thereof by the Company’s management, including the Chief Executive Officer and Chief Financial Officer, that have materially affected, or are reasonably likely to materially affect, the Company’s internal control over financial reporting.
Management does not expect that our disclosure controls and procedures or our internal control over financial reporting will prevent or detect all error and fraud. Any control system, no matter how well designed and operated, is based upon certain assumptions and can provide only reasonable, not absolute, assurance that its objectives will be met. Further, no evaluation of controls can provide absolute assurance that misstatements due to error or fraud will not occur or that all control issues and instances of fraud, if any, within the Company have been detected. The Company’s disclosure controls and procedures are designed to provide reasonable assurance of achieving their objectives and the Chief Executive Officer and Chief Financial Officer have concluded that the disclosure controls and procedures are effective at that reasonable assurance level.
Item 9B. Other Information
None.
72
PART III
Item 10. Directors, Executive Officers and Corporate Governance
The information required by this Item 10 is incorporated by reference to the sections captioned “Election of Directors,” “Management,” “Board Meetings and Committees — Audit Committee,” “Corporate Governance — Codes of Conduct,” “Section 16(a) Beneficial Ownership Reporting Compliance” and “Board Meetings and Committees — Nominating and Corporate Governance Committee” in our definitive proxy statement for the 2015 Annual Meeting of Stockholders, which we plan to file with the Securities and Exchange Commission within 120 days of the end of the calendar year to which this report relates.
Item 11. Executive Compensation
The information required by this Item 11 is incorporated by reference to the sections captioned “Compensation Discussion and Analysis,” “Compensation Committee Report” (which information shall be deemed furnished in this Annual Report on Form 10-K), “Executive and Director Compensation” and “Compensation Committee Interlocks and Insider Participation” in our definitive proxy statement for the 2015 Annual Meeting of Stockholders, which we plan to file with the Securities and Exchange Commission within 120 days of the end of the calendar year to which this report relates.
Item 12. Security Ownership of Certain Beneficial Owners and Management and Related Stockholder Matters
EQUITY COMPENSATION PLAN INFORMATION
The following table summarizes information about our equity compensation plans as of December 31, 2014. All outstanding awards relate to our common stock. For additional information about our equity compensation plans, refer to Notes 4 and 8 of the Consolidated Financial Statements included in Item 8.
Plan Category | Number of Securities to Be Issued Upon Exercise of Outstanding Options, Warrants and Rights | Weighted-Average Exercise Price of Outstanding Options, Warrants and Rights | Number of Securities Remaining Available for Future Issuance Under Equity Compensation Plans (Excluding Securities Reflected in Second Column) | |||||||
Equity compensation plans approved by security holders | 150,000 | $ | 12.97 | 3,400,122 | ||||||
Equity compensation plans not approved by security holders | — | — | — | |||||||
Total | 150,000 | 3,400,122 | ||||||||
The other information required by this Item 12 is incorporated by reference to the section captioned “Ownership of Securities” in our definitive proxy statement for the 2015 Annual Meeting of Stockholders, which we plan to file with the Securities and Exchange Commission within 120 days of the end of the calendar year to which this report relates.
Item 13. Certain Relationships and Related Transactions, and Director Independence
The information required by this Item 13 is incorporated by reference to the sections captioned “Certain Relationships and Related Party Transactions” and “Corporate Governance — Director Independence” in our definitive proxy statement for the 2015 Annual Meeting of Stockholders, which we plan to file with the Securities and Exchange Commission within 120 days of the end of the calendar year to which this report relates.
Item 14. Principal Accountant Fees and Services
The information required by this Item 14 is incorporated by reference to the sections captioned “Fees” and “Pre-Approval Policies and Procedures” in the proposal related to ratification of the appointment of our independent registered public accounting firm in our definitive proxy statement for the 2015 Annual Meeting of Stockholders, which we plan to file with the Securities and Exchange Commission within 120 days of the end of the calendar year to which this report relates.
73
PART IV
Item 15. Exhibits and Financial Statement Schedules
1 | Financial Statements. |
See Index to Financial Statements in Item 8.
2 | Financial Statement Schedules. |
See Index to Financial Statements in Item 8.
3 | Exhibits. |
Incorporated by reference to the Exhibit Index immediately preceding the exhibits attached to this Annual Report on Form
10-K.
74
SIGNATURES
Pursuant to the requirements of Section 13 or 15(d) of the Securities Exchange Act of 1934, as amended, XO Group Inc. has duly caused this Report to be signed on its behalf by the undersigned, thereunto duly authorized in the City of New York, State of New York, on this 16th day of March 2015.
XO GROUP INC. |
By: /s/ Michael Steib Michael Steib Chief Executive Officer & President |
Pursuant to the requirements of the Securities Exchange Act of 1934, as amended, this Report has been signed by the following persons on behalf of the registrant and in the capacities indicated on March 16, 2015.
Signature | Title(s) | |
/s/ Michael Steib Michael Steib | Chief Executive Officer, President and Director (Principal Executive Officer) | |
/s/ Gillian Munson Gillian Munson | Chief Financial Officer (Principal Financial and Accounting Officer) | |
/s/ David Liu David Liu | Chairman of the Board of Directors | |
/s/ Charles Baker Charles Baker | Director | |
/s/ Diane Irvine Diane Irvine | Director | |
/s/ Barbara Messing Barbara Messing | Director | |
/s/ Peter Sachse Peter Sachse | Director | |
/s/ Elizabeth Schimel Elizabeth Schimel | Director | |
/s/ Michael Zeisser Michael Zeisser | Director | |
75
EXHIBIT INDEX
Number | Description | |
3.1 | Amended and Restated Certificate of Incorporation (Incorporated by reference to Registrant’s Registration Statement on Form S-1 (Registration number 333-87345) (the “Form S-1”)) | |
3.2 | Amended and Restated Bylaws (Incorporated by reference to the identically numbered exhibit to Registrant’s Quarterly Report on Form 10-Q filed on August 5, 2011 (the “Q2 2011 10-Q”)) | |
3.3 | Certificate of Amendment to Amended and Restated Certificate of Incorporation (incorporated by reference to the identically numbered exhibit to the Q2 2011 10-Q) | |
4.1 | Specimen Common Stock certificate (Incorporated by reference to the identically numbered exhibit to the Q2 2011 10-Q) | |
4.2 | See Exhibits 3.1 and 3.2 for provisions defining the rights of holders of common stock of Registrant | |
4.6 | Warrant Certificate issued to Allen & Company LLC on October 27, 2004 (Incorporated by reference to Exhibit 4.6 to Registrant’s Annual Report on Form 10-K filed on March 21, 2005) | |
10.5* | 2000 Non-Officer Stock Incentive Plan (Incorporated by reference to Exhibit 99.1 to Registrant’s Registration Statement on Form S-8 (Registration number 333-41960)) | |
10.6* | Amended and Restated 1999 Stock Incentive Plan (Incorporated by reference to Exhibit 99.1 to the Registrant’s Registration Statement on Form S-8 (Registration number 333-74398)) | |
10.7* | 1999 Employee Stock Purchase Plan (Incorporated by reference to the Form S-1) | |
10.11* | Form of Indemnification Agreement (Incorporated by reference to the Form S-1) | |
10.12 | Common Stock Purchase Agreement between The Knot, Inc. and May Bridal Corporation (Incorporated by reference to Exhibit 10.12 to Registrant’s Annual Report on Form 10-K filed on March 29, 2002) | |
10.13 | Amendment to Common Stock Purchase Agreement between The Knot, Inc. and May Bridal Corporation, dated as of November 11, 2003 (Incorporated by reference to Registrant’s Registration Statement on Form S-3 (Registration number 333-111060)) | |
10.16 | Agreement, dated as of June 5, 2006, between Federated Department Stores, Inc. and The Knot, Inc. (Incorporated by reference to the identically numbered exhibit to Registrant’s Annual Report on Form 10-K filed on March 13, 2007) | |
10.17* | Letter Agreement between The Knot, Inc. and Nic Di Iorio dated January 11, 2008 (Incorporated by reference to Exhibit 10.18 to Registrant’s Quarterly Report on Form 10-Q filed on May 8, 2008) | |
10.18 | Registration Rights Agreement dated as of April 30, 2008 between The Knot, Inc. and Macy’s, Inc. (Incorporated by reference to Exhibit 10.1 of the Registrant’s Current Report on Form 8-K filed May 2, 2008) | |
10.19* | Letter Agreement between The Knot, Inc. and Carol Koh Evans (Incorporated by reference to Exhibit 10.1 of the Registrant’s Current Report on Form 8-K filed May 12, 2008) | |
10.20* | Letter Agreement between The Knot, Inc. and David Liu dated November 5, 2008 (Incorporated by reference to the identically numbered exhibit to Registrant’s Quarterly Report on Form 10-Q filed on November 7, 2008 (the “Q3 2008 10-Q”)) | |
10.21* | Letter Agreement between The Knot, Inc. and Carley Roney dated November 5, 2008 (Incorporated by reference to the identically numbered exhibit to the Q3 2008 10-Q) | |
10.22* | Name And Likeness Licensing Agreement between The Knot, Inc. and Carley Roney dated November 5, 2008 (Incorporated by reference to the identically numbered exhibit to the Q3 2008 10-Q) | |
10.24* | Letter Agreement between The Knot, Inc. and Jeremy Lechtzin dated August 7, 2008 (Incorporated by reference to the identically numbered exhibit to the Q3 2008 10-Q) | |
10.25* | 2009 Stock Incentive Plan (Incorporated by reference to Exhibit 99.1 of Registrant's Registration Statement on Form S-8, filed with the Securities and Exchange Commission on May 22, 2009 (Registration number 333-159455)) | |
10.26* | 2009 Employee Stock Purchase Plan (Incorporated by reference to Exhibit 99.2 of Registrant's Registration Statement on Form S-8, filed with the Securities and Exchange Commission on May 22, 2009 (Registration number 333-159455)) | |
10.27* | Suspension to Name And Likeness Licensing Agreement between The Knot, Inc. and Carley Roney dated as of July 1, 2009 (Incorporated by reference to Exhibit 10.25 to Registrant’s Quarterly Report on Form 10-Q filed on November 9, 2009) | |
10.28 | Agreement, dated as of January 11, 2010, between Macy’s, Inc. and The Knot, Inc. (Incorporated by reference to Exhibit 10.28 to Registrant’s Quarterly Report on Form 10-Q filed on May 10, 2010) | |
76
Number | Description | |
10.29* | Amendment to Name And Likeness Licensing Agreement between The Knot, Inc. and Carley Roney dated as of February 18, 2010 (Incorporated by reference to Exhibit 10.29 to Registrant’s Quarterly Report on Form 10-Q filed on May 10, 2010) | |
10.30 | Stock Purchase Agreement dated February 25, 2011, by and among The Knot, Inc., Macy’s Inc., and Macy’s Corporate Services, Inc. (Incorporated by reference to Exhibit 10.1 of Registrant's Current Report on Form 8-K, filed with the Securities and Exchange Commission on February 28, 2011) | |
10.31* | Form of Restricted Stock Award Agreement under the 2009 Stock Incentive Plan (incorporated by reference to the identically numbered exhibit to Registrant’s Quarterly Report on Form 10-Q filed on May 10, 2011) | |
10.32* | 2011 Long-Term Incentive Plan (Incorporated by reference to the identically numbered exhibit to the Q2 2011 10-Q) | |
10.33* | Letter Agreement between XO Group Inc. and Kristin Savilia dated September 7, 2011 (Incorporated by reference to the identically numbered exhibit to Registrant's Annual Report on Form 10-K filed on March 15, 2012) | |
10.34* | Form of Participation Letter Agreement under the 2011 Long-Term Incentive Plan (Incorporated by reference to the identically numbered exhibit to the Registrant's Annual Report on Form 10-K filed on March 18, 2013 (the "2013 Annual Report") | |
10.35* | Form of Restricted Stock Award Agreement for 2012 long-term incentive awards (Incorporated by reference to the identically numbered exhibit to the 2013 Annual Report) | |
10.36* | Form of Restricted Stock Award Agreement for 2013 awards under Long-Term Incentive Plan (Incorporated by reference to the identically numbered exhibit to the 2013 Annual Report) | |
10.37* | Form of Vested Stock Award Agreement for 2014 awards under Long-Term Incentive Plan (Incorporated by reference to the identically numbered exhibit to the 2013 Annual Report) | |
10.38* | Letter Agreement between XO Group Inc. and Rob Fassino dated June 19, 2012 (Incorporated by reference to the identically numbered exhibit to Registrant's Quarterly Report on Form 10-Q filed on May 10, 2013) | |
10.39* | Employment Agreement between XO Group Inc. and Michael Steib dated as of June 28, 2013 (Incorporated by reference to Exhibit 10.1 to Registrant's Current Report on Form 8-K filed July 3, 2013) | |
10.40* | Employment Agreement between XO Group Inc. and Gillian Munson dated as of November 12, 2013 (Incorporated by reference to Exhibit 10.1 to Registrant's Current Report on Form 8-K filed November 18, 2013) | |
10.42* | Letter Agreement between XO Group Inc. and Rob Fassino dated October 3, 2013 | |
10.43* | Letter Agreement between XO Group Inc. and David Liu dated April 7, 2014 (Incorporated by reference to Exhibit 10.1 to Registrant's Current Report on Form 8-K filed April 11, 2014) | |
10.44* | Amendment to Name and Likeness Licensing Agreement between XO Group Inc. and Carley Roney dated April 7, 2014 (Incorporated by reference to Exhibit 10.2 to Registrant's Current Report on Form 8-K filed April 11, 2014) | |
10.45* | Amended and Restated Letter Agreement between XO Group Inc. and David Liu dated April 16, 2014 (Incorporated by reference to Exhibit 10.1 to Registrant's Current Report on Form 8-K filed April 17, 2014) | |
10.46* | Amendment to the Employment Agreement between XO Group and Michael Steib dated April 17, 2014 (Incorporated by reference to Exhibit 10.2 to Registrant's Current Report on Form 8-K filed April 17, 2014) | |
10.47* | Amendment to the Employment Agreement between XO Group and Gillian Munson dated April 17, 2014 (Incorporated by reference to Exhibit 10.3 to Registrant's Current Report on Form 8-K filed April 17, 2014) | |
10.48* | 2009 Stock Incentive Plan (Incorporated by reference to Exhibit 99.1 to Registrant's Registration Statement on Form S-8 (Registration number 333-198192)) | |
10.49* | Letter Agreement between XO Group Inc. and David Liu dated December 16, 2014 (Incorporated by reference to Exhibit 10.1 to Registrant's Current Report on Form 8-K filed December 16, 2014) | |
10.50* | Letter Agreement between XO Group Inc. and Carley Roney dated December 16, 2014 (Incorporated by reference to Exhibit 10.2 to Registrant's Current Report on Form 8-K filed December 16, 2014) | |
21.1 | Subsidiaries | |
23.1 | Consent of Ernst & Young LLP | |
31.1 | Certification of Chief Executive Officer and President Pursuant to Exchange Act Rule 13a-14(a), As Adopted Pursuant to Section 302 of the Sarbanes-Oxley Act of 2002 | |
31.2 | Certification of Chief Financial Officer Pursuant to Exchange Act Rule 13a-14(a), As Adopted Pursuant to Section 302 of the Sarbanes-Oxley Act of 2002 | |
32.1† | Certification of Chief Executive Officer and President Pursuant to 18 U.S.C Section 1350, As Adopted Pursuant to Section 906 of the Sarbanes-Oxley Act of 2002 | |
32.2† | Certification of Chief Financial Officer Pursuant to 18 U.S.C Section 1350, As Adopted Pursuant to Section 906 of the Sarbanes-Oxley Act of 2002 | |
77
101.INS** | XBRL Instance Document | |
101.SCH** | XBRL Taxonomy Extension Schema Document | |
101.CAL** | XBRL Taxonomy Extension Calculation Linkbase Document | |
101.LAB** | XBRL Taxonomy Extension Labels Linkbase Document | |
101.PRE** | XBRL Taxonomy Extension Presentation Linkbase Document | |
101.DEF** | XBRL Taxonomy Extension Definition Linkbase Document | |
78
* | Management contract or compensatory plan or arrangement |
† | The certifications attached as Exhibit 32.1 and Exhibit 32.2 accompany the Annual Report on Form 10-K pursuant to Section 906 of the Sarbanes-Oxley Act of 2002 and shall not be deemed “filed” by the Company for purposes of Section 18 of the Securities Exchange Act of 1934, as amended. |
** | Pursuant to applicable securities laws and regulations, the Registrant is deemed to have complied with the reporting obligation relating to the submission of interactive data files in such exhibits and is not subject to liability under any anti-fraud provisions of the federal securities laws as long as the Registrant has made a good faith attempt to comply with the submission requirements and promptly amends the interactive data files after becoming aware that the interactive data files fail to comply with the submission requirements. These interactive data files are deemed not filed or part of a registration statement or prospectus for purposes of sections 11 or 12 of the Securities Act of 1933, as amended, are deemed not filed for purposes of section 18 of the Securities Exchange Act of 1934, as amended, and otherwise are not subject to liability under these sections. |
79