Attached files
| file | filename |
|---|---|
| EX-32.2 - EXHIBIT 32.2 - NETSCOUT SYSTEMS INC | ntct-ex322_2018331.htm |
| EX-32.1 - EXHIBIT 32.1 - NETSCOUT SYSTEMS INC | ntct-ex321_2018331.htm |
| EX-31.2 - EXHIBIT 31.2 - NETSCOUT SYSTEMS INC | ntct-ex312_2018331.htm |
| EX-31.1 - EXHIBIT 31.1 - NETSCOUT SYSTEMS INC | ntct-ex311_2018331.htm |
| EX-23 - EXHIBIT 23 - NETSCOUT SYSTEMS INC | ntct-ex23_2018331.htm |
| EX-21 - EXHIBIT 21 - NETSCOUT SYSTEMS INC | ntct-ex21_2018331.htm |
UNITED STATES
SECURITIES AND EXCHANGE COMMISSION
Washington, D.C. 20549
FORM 10-K
(Mark One)
x | ANNUAL REPORT PURSUANT TO SECTION 13 OR 15(d) OF THE SECURITIES EXCHANGE ACT OF 1934 |
For the fiscal year ended March 31, 2018
OR
¨ | TRANSITION REPORT PURSUANT TO SECTION 13 OR 15(d) OF THE SECURITIES EXCHANGE ACT OF 1934 |
For the transition period from to | |
Commission file number 000-26251
NETSCOUT SYSTEMS, INC.
(Exact name of registrant as specified in its charter)
Delaware | 04-2837575 |
(State or other jurisdiction of incorporation or organization) | (IRS Employer Identification No.) |
310 Littleton Road, Westford, MA 01886
(978) 614-4000
Securities registered pursuant to Section 12(b) of the Act: | Name of each exchange on which registered: Nasdaq Global | |
Common Stock, $0.001 Par value | Select Market | |
Securities registered pursuant to Section 12(g) of the Act: None
Indicate by check mark if the registrant is a well-known seasoned issuer, as defined in Rule 405 of the Securities Act. YES x NO ¨
Indicate by check mark if the registrant is not required to file reports pursuant to Section 13 or Section 15(d) of the Act. YES ¨ NO x
Indicate by check mark whether the registrant: (1) has filed all reports required to be filed by Section 13 or 15(d) of the Securities Exchange Act of 1934 during the preceding 12 months (or for such shorter period that the registrant was required to file such reports), and (2) has been subject to such filing requirements for the past 90 days. YES x NO ¨
Indicate by check mark if disclosure of delinquent filers pursuant to Item 405 of Regulation S-K is not contained herein, and will not be contained, to the best of registrant’s knowledge, in definitive proxy or information statements incorporated by reference in Part III of this Form 10-K or any amendment to this Form 10-K. x
Indicate by check mark whether the registrant has submitted electronically and posted on its corporate Web site, if any, every Interactive Data File required to be submitted and posted pursuant to Rule 405 of Regulation S-T (§ 232.405 of this chapter) during the preceding 12 months (or for such shorter period that the registrant was required to submit and post such files). YES x NO ¨
Indicate by check mark whether the registrant is a large accelerated filer, an accelerated filer, a non-accelerated filer, a smaller reporting company, or an emerging growth company. See the definitions of "large accelerated filer," "accelerated filer," "smaller reporting company," and "emerging growth company" in Rule 12b-2 of the Exchange Act. (Check one):
Large accelerated filer x Accelerated filer ¨
Non-accelerated filer ¨ (Do not check if a smaller reporting company)
Smaller reporting company ¨ Emerging growth company ¨
If an emerging growth company, indicate by check mark if the registrant has elected not to use the extended transition period for complying with any new or revised financial accounting standards provided pursuant to Section 13(a) of the Exchange Act. ¨
Indicate by check mark whether the registrant is a shell company (as defined in Rule 12b-2 of the Exchange Act). YES ¨ NO x
The aggregate market value of common stock held by non-affiliates of the registrant as of September 30, 2017 (based on the last reported sale price on the Nasdaq Global Select Market as of such date) was approximately $2,722,835,641. As of May 14, 2018, there were 80,274,022 shares of the registrant’s common stock outstanding.
DOCUMENTS INCORPORATED BY REFERENCE
Portions of the Registrant’s Proxy Statement for the fiscal year 2018 Annual Meeting of Stockholders are incorporated by reference into Part III of this Annual Report on Form 10-K. Except as expressly incorporated by reference, the proxy statement is not deemed to be part of this report.
NETSCOUT SYSTEMS, INC.
FORM 10-K
FOR THE FISCAL YEAR ENDED MARCH 31, 2018
TABLE OF CONTENTS
PART I | ||
Item 1. | ||
Item 1A. | ||
Item 1B. | ||
Item 2. | ||
Item 3. | ||
Item 4. | ||
PART II | ||
Item 5. | ||
Item 6. | ||
Item 7. | ||
Item 7A. | ||
Item 8. | ||
Item 9. | ||
Item 9A. | ||
Item 9B. | ||
PART III | ||
Item 10. | ||
Item 11. | ||
Item 12. | ||
Item 13. | ||
Item 14. | ||
PART IV | ||
Item 15. | ||
Item 16. | Form 10-K Summary | |
Unless the context suggests otherwise, references in this Annual Report on Form 10-K (Annual Report) to "NetScout," the "Company," "we," "us," and "our" refer to NetScout Systems, Inc. and, where appropriate, our consolidated subsidiaries.
NetScout, the NetScout logo, Adaptive Service Intelligence and other trademarks or service marks of NetScout appearing in this Annual Report are the property of NetScout Systems, Inc. and/or its subsidiaries and/or affiliates in the United States and/or other countries. Any third-party trade names, trademarks and service marks appearing in this Annual Report are the property of their respective holders.
Cautionary Statement Concerning Forward-Looking Statements
This Annual Report contains forward-looking statements under Section 21E of the Exchange Act (as defined below) and other federal securities laws. These statements relate to future events or our future financial performance and are identified by terminology such as "may," "will," "could," "should," "expects," "plans," "intends," "seeks," "anticipates," "believes," "estimates," "potential" or "continue," or the negative of such terms or other comparable terminology. These statements are only predictions. You should not place undue reliance on these forward-looking statements. Actual events or results may differ materially. Factors that may cause such differences include, but are not limited to, the factors discussed under the heading "Risk Factors" and in our other filings with the Securities and Exchange Commission (SEC). These factors may cause our actual results to differ materially from any forward-looking statement. New risks emerge from time to time. It is not possible for our management to predict all risks, nor can we assess the impact of all factors on our business or the extent to which any factor, or combination of factors, may cause actual results to differ materially from those contained in any forward-looking statements we may make.
Except as required by law, we do not undertake any obligation to release publicly any revisions to these forward-looking statements after completion of the filing of this Annual Report to reflect later events or circumstances or the occurrence of unanticipated events.
PART I
Item 1. Business
Overview
We are an industry leader for real-time operational intelligence and performance analytics that are used by customers worldwide to assure their digital business services against disruptions in availability, performance and security. Service providers, enterprises and local, state and federal government agencies around the world rely on our solutions to achieve the visibility necessary to optimize network performance, ensure the delivery of high-quality, mission-critical applications and services, provide timely insight into the end user experience and protect the network from attack. Powered by our patented Adaptive Service Intelligence (ASI) technology, our solutions can instantaneously convert network traffic data, often referred to as wire data, into high-value metadata, or "smart data," that can be used by customers to help them identify network and application performance issues, defend their networks from distributed denial of service (DDoS) attacks, and rapidly find and isolate advanced network threats. With our offerings, customers can quickly, efficiently and effectively resolve issues that cause business disruptions, downtime, poor service quality or compromised security, thereby driving compelling returns on their investments in their network and broader information technology (IT) initiatives.
Our mission is to enable enterprise and service providers to realize maximum benefit with minimal risk from technology advances, such as internet protocol (IP) convergence, network function virtualization (NFV), software defined networking (SDN), virtualization, cloud, mobility and the Internet of Things (IoT), by managing the inherent complexity in a cost-effective manner. We have been a technology innovator for three-plus decades since our founding in 1984. Our solutions change how organizations manage and optimize the delivery of business applications and services, assure user experience across global internet protocol (IP) networks and help protect networks from unwanted security threats. Through both internal development and acquisitions, we have continually enhanced and expanded our product portfolio to meet the evolving needs of customers worldwide. By using our products to capture and transform terabytes of network traffic data in real time into high-value, actionable information, customers can optimize network performance, facilitate high-quality delivery of services and applications, enhance security and gain insight into the end-user experience. Our solutions are typically deployed by customers as integrated hardware and software, as software only for use in commercial-off-the-shelf hardware or in a virtualized form factor.
Our operating results are influenced by a number of factors, including, but not limited to, the mix and quantity of products and services sold, pricing, costs of materials used in our products, growth in employee-related costs, including commissions, and the expansion of our operations. Factors that affect our ability to maximize our operating results include, but are not limited to, our ability to introduce and enhance existing products, the marketplace acceptance of those new or enhanced products, continued expansion into international markets, development of strategic partnerships, competition, successful acquisition integration efforts, and our ability to achieve expense reductions and make improvements in a highly competitive industry.
On July 14, 2015, we completed the acquisition of Danaher Corporation’s (Danaher) Communications Business (Communications Business), which included certain assets, liabilities, technology and employees within Tektronix Communications, VSS Monitoring, Arbor Networks and certain portions of the Fluke Networks Enterprise business, which excluded Danaher’s data communications cable installation business and its communication service provider business (the
3
Comms Transaction), which was structured as a Reverse Morris Trust transaction whereby Danaher contributed the Communications Business to a new subsidiary, Potomac Holding, LLC (Newco). The total equity consideration was approximately $2.3 billion based on issuing approximately 62.5 million new shares of NetScout common stock to the holders of common units of Newco, based on the July 13, 2015 NetScout common stock closing share price of $36.89 per share. The Comms Transaction was aimed at extending NetScout's reach into growth-oriented adjacent markets, including cybersecurity, with a broader range of market-leading products and capabilities; strengthening its go-to-market resources to better support a larger, more diverse and more global customer base; and increasing NetScout's scale and elevating its strategic position within key accounts. Since completing the Comms Transaction, we have invested significant resources to integrate certain acquired product lines, features and functionality into our product portfolio to deliver greater value to customers.
Markets
NetScout’s service assurance solutions are used by enterprises (including government agencies) and service providers to optimize network performance, quickly identify and resolve issues impacting application and service quality, and gain insight into the end user experience. We also provide security solutions that enterprises and service providers use to identify and mitigate advanced, volumetric and application specific DDoS attacks as well as assist enterprise security teams in rapidly finding and isolating advanced network threats
Enterprise Market
Within the enterprise market, NetScout’s nGeniusONE and ISNG offerings, along with certain product lines from the businesses acquired in the Comms Transaction, enable IT organizations to improve service delivery quality, and identify and address business service performance issues and security threats before they become serious and affect large numbers of users. Our solutions support a wide range of use cases including:
• | Network Performance Management – Our nGeniusONE analytics and our ISNG real-time information platform provide the necessary insight to optimize network performance, restore service and understand the quality of the users’ experience. By integrating certain acquired product lines and product features from the former Fluke Networks Enterprise business with our core offerings, our customers can benefit from a consistent view across their traditional wired network infrastructures, remote offices and WiFi wireless networks. |
• | Application Performance Management: Data Center Modernization and Cloud Computing – We enable IT organizations, from their development operations to their infrastructure teams, to manage the delivery of services across virtual and physical environments, providing a comprehensive, unified real-time view into network, application, server, and user communities' performance. We proactively detect emerging issues with the ability to help analyze both physical and virtual service delivery environments within the data center which enables organizations to optimize datacenter infrastructure investments, protect against service degradations, and simplify the operation of complex, multi-tier application environments in consolidated, state-of-the-art data centers. Our solutions are often used by enterprises to support private cloud computing environments that are aimed at enabling greater, more cost-effective accessibility to applications without compromising the reliability and security of those applications and the network. In addition, we introduced new solutions during fiscal year 2018 that are aimed at helping enterprise customers extend their monitoring of applications deeper into their traditional data centers as well as confidently migrate applications into public cloud environments. |
• | Unified Communications (UC) – We deliver deep application-level unified visibility into voice, data and video services side-by-side in order to understand the interrelationships of all UC services that traverse the network infrastructure and assess quality and performance of the delivery of these services. As a result, our real-time, actionable intelligence helps customers to deliver a high-quality UC experience as users make calls, video conference and engage in instant messaging. We also help desktop, network, telecom, and application teams manage UC through a common platform across complex, geographically dispersed, and multi-vendor environments. |
• | Infrastructure Performance Management – As a result of ongoing innovation, we provide enterprise customers with a more holistic view of network and application performance, including the ability to determine the health of devices across the infrastructure. Consequently, enterprises can cost-effectively leverage our platform, rather than use disparate third-party tools, to quickly and accurately identify issues that impact network and application performance and then drill down to determine the root cause of the issue, as well as perform active, synthetic testing of software-as-a-service (SaaS) applications to ensure application uptime and performance integrity. As a result, customers can see the relationships and interdependencies across all service delivery components including applications, network, servers, databases, and enabling protocols so they can deliver a superior user experience, achieve outstanding service quality and drive return on their application and infrastructure investments. |
4
• | Application and Desktop Virtualization – We provide clear and actionable insights that help customers fully realize the operational benefits associated with Application and Desktop Virtualization, and reduce the time it takes to identify and resolve service problems. We offer visibility across all virtual desktop infrastructure (VDI) tiers including remote access, client, virtualization, web, front-end application, and related database systems, and help customers gain actionable metrics from monitoring and analyzing the consumption and performance of VDI services. |
• | Cybersecurity: DDoS Protection and Cyber Threat Analytics – Computer networks continue to be targeted for cyberattacks that are aimed at disrupting, damaging or otherwise destroying an enterprise’s ability to conduct its business or gaining unauthorized access to corporate applications and stealing valuable information. We provide a range of network security solutions under the NetScout Arbor brand that enable enterprises to protect their networks from high-volume and application-specific DDoS attacks, which are aimed at either overwhelming the network with traffic or over-exercising specific functions or features of a website with the intention to disable those functions or features. We have also developed solutions that are used by enterprises to help identify unauthorized intrusions into the network that can pose significant threats to the integrity of sensitive information and key business operations. We are integrating a new set of advanced threat analytics with our ISNG real-time information platform, and expect this offering to be introduced over the next several quarters. We also provide incident response activities with deep-dive network forensics and offer contextual information surrounding a specific alert or incident to enhance investigative capabilities and avoid false positives. |
Government Markets
Considered as part of our enterprise vertical, we have built a strong position with federal, state and local government agencies, both in the United States and abroad. Similar to our enterprise customers, government agencies are focused on streamlining and transforming IT into more efficient and more easily managed environments. To accomplish this, agencies are turning to IT solutions that will help simplify managing and assuring their IT environments as well as reduce costs. However, governmental markets differ from enterprise markets primarily due to their purchasing cycles being influenced by potential changes in government administrators, budgetary priorities and allocated funding for key projects.
Telecommunication Service Provider Markets
Today’s service providers are focused on delivering a compelling set of services and ensuring a high-quality user experience, while also striving to minimize operational complexity and costs. This, coupled with the challenge of IP transformation activities and complex technologies such as LTE, NFV, IP-TV, wireless network (WiFi) and cloud services drives the need for a more automated and unified approach to managing service delivery and the subscriber experience. Service providers strive to reduce the cost of service delivery, address increasing complexity, scale their networks cost-effectively and adapt to emerging technologies such as cloud services, NFV and 5G, while assuring high-quality user experiences to retain their revenue base. Service providers are also seeking to gain greater insight into the subscriber experience in order to create upselling opportunities and improve retention. Additionally, service providers must protect their networks from high-volume, increasingly sophisticated cyberattacks that consume bandwidth and potentially create outages that impact their business customers. As a result, our service assurance, business intelligence and DDoS solutions can be leveraged by multiple areas within our service provider customers, including network operations and engineering, customer care, marketing and security.
• | Service Assurance for Mobile, Fixed Line and Cable Operators – The fundamental transformation of the mobile network to all-IP enables mobile operators to build highly-scalable service delivery environments to offer new services to meet the growing subscriber demand for data, voice and video-centric services and to consolidate and simplify network operations. Mobile operators use our offerings to gain real-time, detailed IP packet-level insight and core-to-access visibility, which enables them to effectively manage capacity, assess overall network quality, take proactive steps to modify the network before issues impact subscribers, and quickly identify and troubleshoot network problems. In addition to improving the overall return on their network infrastructure investments, mobile operators using our solutions also benefit from improved network quality and unique customer insights - both of which contribute to subscriber acquisition, retention and monetization. The growing demand for high-bandwidth triple-play services, broadband connectivity, content anywhere, IP-TV, on-demand video traffic, new extended WiFi initiatives and carrier Ethernet services presents fixed line and cable multi-system operators with significant revenue opportunities. IP has become the de facto convergence mechanism for access, distribution and core networks, enabling new service offerings and simplifying network operations while reducing total cost of operations. For example, cable operators use our solutions to monitor and manage their local area WiFi connectivity services, ensure the high-quality delivery of video to consumers outside of their homes as well as provide broadband and telephony services targeting small- and medium-sized businesses. |
5
• | Business Intelligence for Service Providers – Service providers strive to understand how the performance of their networks impact customer experience, subscriber behavior and related usage trends. By combining network traffic data with other information, including support requests, subscriber calling plans, demographic data and other details, service providers can make more timely decisions about their offerings and sales and marketing initiatives to acquire, retain and further monetize their subscribers. NetScout’s analytics deliver timely insights into a service provider’s subscribers, services, networks, and applications, as well as easily export this information into their data lakes and third-party analytic platforms. |
• | DDoS Protection – Over the past decade, Internet Service Providers (ISPs), including leading telecommunications providers, cable multi service operators and cloud providers, have seen significant increases in the sophistication, scale and frequency of high-volume and application-specific DDoS attacks on their networks. DDoS attacks are aimed at disrupting the online services of an ISP’s business customer by overwhelming the network with traffic or by over-exercising specific functions or features of a website with the intention to disable those functions or features. NetScout Arbor DDoS solutions are used by a wide range of ISPs around the world to help protect their networks against DDoS attacks, and to resell certain DDoS offerings to their enterprise customers. |
Products & Technology Overview
NetScout continuously develops its solutions to meet the increasing demands and ever-changing technology landscape of IP networks, service and applications. In recent years, we have delivered major product upgrades across our product lines, more tightly integrating deep packet analysis and forensics into our top-down performance management workflows, improving the flexibility of our industry-leading intelligent early warning capabilities, and adding support for new sources of user experience and performance related metrics. NetScout’s solutions are used by customers to better understand and manage network and application performance, alert themselves to problems that impact end users, validate services and network policy, plan and optimize network capacity, generate timely reports, conduct deep forensic and historical analysis, and protect their networks against security threats.
During fiscal year 2018, we continued to invest in development programs aimed at enhancing our range of offerings, including delivering new features and functionality for our nGeniusONE Service Assurance platform that address the evolving requirements of our enterprise, service provider and government customers. The nGeniusONE platform, which is powered by NetScout’s ASI technology, supports a wide range of use cases spanning network performance, application performance, cybersecurity and business intelligence. Our patented ASI technology is a critical differentiating technology that instantaneously converts wire data into contextually rich, statistic metadata that enables real-time, scalable monitoring of all users and sessions, all applications and all services consistently across the network. We also invested significantly in enhancing product lines acquired in the Comms Transaction and in leveraging our ASI technology to advance product integration initiatives aimed at further elevating our value proposition to customers in each of the markets we serve.
Service Assurance Solutions for Network and Application Performance, and Business Intelligence Analytics
• | nGeniusONE Management Software and Analytic Modules – NetScout’s nGeniusONE management software is used to support the Company’s enterprise, service provider and government customers enabling them to predict, preempt, and resolve network and service delivery problems while facilitating the optimization and capacity planning of their network infrastructures. Other products acquired from the Communications Business are supported by their own respective management software and related analytics. Additionally, NetScout markets a range of specialized platforms and analytic modules that can enable its customers to analyze and troubleshoot traffic in radio access network and WiFi networks, as well as gain timely insight into high-value services, applications and systems, and better understand the subscriber’s experience on the network. During the past fiscal year, the Company also extended its nGeniusONE workflows through a substantially enhanced offering, nGeniusPULSE, which enables enterprises to identify infrastructure performance issues and actively test SaaS applications. During fiscal year 2018, NetScout also introduced its nGenius Business Analytics solution, which makes wire data consumable for Big Data applications in a scalable, cost-effective manner. This solution enables service providers to quickly and efficiently analyze their network traffic to acquire intelligent and timely insights into their subscribers, services, networks, and applications, as well as the ability to easily export NetScout’s smart data into their data lakes and to third-party analytic platforms. |
• | Intelligent Data Sources, Packet Flow Switches and Taps – NetScout’s intelligent data sources, marketed under the InfiniStream brand and often referred to as network probes, provide real-time collection and analysis of information-rich, high-volume packet-flow data from across the network that is displayed through the nGeniusONE Service Assurance Solution. Our newest intelligent data source, the ISNG, powers the traditional nGeniusONE monitoring analytics, the subscriber troubleshooting analytics associated with the former Tektronix Communications Business and other key features and functionality from the acquired Comms Transaction assets. The ISNG can be deployed as a traditional appliance with integrated hardware and software, as software-only for use in commercial-off-the-shelf |
6
hardware or in virtualized form factors. The virtualized form factor version of our intelligent data source, which is marketed under the vSCOUT and vSTREAM product brands, can be deployed to support NFV environments as well as to cost-effectively monitor application performance in traditional data center, private cloud and public cloud environments.
• | NetScout also provides comprehensive packet flow systems (also called network packet brokers or network visibility fabric switches), that deliver targeted network traffic access to an increasing number of systems, including the nGeniusONE Service Assurance platform, as well as other monitoring and security systems. The acquired product lines from the VSS Monitoring unit further complement the Company’s family of packet flow switch offerings. During fiscal year 2018, NetScout introduced new versions of its packet flow systems that decouple packet broker functions from its underlying hardware to offer an industry-leading open compute platform option along with enhanced packet flow switch management software. Additionally, NetScout markets a suite of test access points (TAPs) that enable full, non-disruptive access to network traffic with multiple link type and speed options. |
Portable Network Analysis and Troubleshooting Tools
• | NetScout, through the acquired Fluke Networks Enterprise assets, provides a range of portable network analysis and troubleshooting tools that help customers quickly identify key issues that can impact network and application performance. NetScout’s tools are used by IT departments to support traditional, cloud and WiFi network environments. Certain capabilities and information delivered through these tools have been integrated into NetScout's nGeniusONE management solutions. |
Cybersecurity Solutions
• | DDoS Protection – NetScout provides security solutions that enable service providers and enterprises around the world to protect their networks against DDoS attacks. Our portfolio of DDoS solutions offers complete deployment flexibility spanning on-premise offerings and cloud-based capabilities to meet a broad array of customer needs. We plan to further enhance and expand these capabilities in ways that will enable greater adoption of our solutions by service provider and enterprise customers. |
• | Advanced Threat Detection – Our initial offering for advanced threat detection, Arbor Spectrum, was designed to help enterprises rapidly identify and investigate advanced threat campaigns that present tangible risks to the integrity of their networks. The product, which was launched in the first quarter of fiscal year 2016, combined Internet-scale visibility with advanced threat detection to help security teams quickly and efficiently search their entire network to uncover, investigate and prove sophisticated attack campaigns. We are currently in the process of more tightly integrating these advanced threat detection analytics with our ISNG real-time information platform, and expect to have this new offering available during fiscal year 2019. |
Integration with Third-Party Solutions
To have greater operational impact on assuring performance of applications and service delivery, NetScout has integrated its technology with third-party management consoles and business service management systems. This integration allows organizations to receive alarms on impending performance problems and to link into the nGenius Service Assurance solution in order to perform detailed problem analysis and troubleshooting. NetScout’s ASI-level data is accessible to third-party platforms, and we are pursuing partnerships and technology alliances accordingly. In addition, we have embedded NetScout Arbor DDoS mitigation capabilities on a blade within Cisco's market-leading ASR9000 router and will continue to evaluate partnership opportunities to integrate its DDoS capabilities within other network equipment platforms. By providing seamless integration into management platforms, NetScout fills a significant gap in the third-party product functionality and visibility into the interaction of applications, services and infrastructure resources from a packet-based network vantage point. NetScout collaborates with technology partners to provide integrated solutions and extend the value of the nGenius Service Assurance Solution for application and network performance management across the organization. Using wire data, key performance indicators and other sources of performance information derived from the nGenius Service Assurance Solution, an organization’s ability to optimize, simplify and protect the service delivery environment is enhanced. Among the third-party solutions providers that NetScout has integrated its solutions with are Cisco Systems, Cisco Sourcefire, Citrix Systems, Dell Technologies, Hewlett-Packard Company, IBM Tivoli and VMWare.
7
Growth Strategy
Our key objectives during fiscal year 2018 were to continue to gain market share in the service provider market and to accelerate our enterprise market growth by extending into the application performance management sector. In addition, given the nature of the customers in our government sector, we believe future cybersecurity products would be effective in this market. Key elements of our strategy include:
• | Driving technology innovation – NetScout continues to invest in research and development, and leverage the strong technical and domain expertise across its organization. The Company’s engineering teams are focused on advancing technical innovation across its broad product portfolio. By capitalizing on NetScout’s extensive experience with global enterprise, service provider and government organizations with IP-based networks, NetScout remains well positioned to cross-leverage its technology development across all major platforms and relevant technologies to address the evolving demands of current and prospective customers. |
• | Continued portfolio enhancements and product integration – We plan to continue to enhance our products and solutions to address the management challenges associated with virtualization, cloud computing, service-oriented architectures, VoIP, video, telepresence technologies, and network security. In addition, we plan to continue to enhance our solutions to help IT organizations address the challenges of complex service delivery, datacenter consolidation, branch office consolidation and optimization, and achieve the visibility necessary to successfully migrate application workloads to private and public cloud environments. |
• | Extension into adjacent markets – By enhancing and expanding NetScout’s product portfolio and driving product integration, NetScout has expanded its reach into complementary adjacent markets such as application performance management, infrastructure performance management and cybersecurity. We believe that this element of our strategy will enable us to gain access to larger budgets, increase spending from existing customers, help attract new customers, and increase our total addressable market. |
• | Enable pervasive visibility – We intend to continue to expand our intelligent data source family to enable our customers to achieve greater visibility into more places across their end-to-end network environments. We believe that expanding the range of use cases that the ISNG real-time information platform can support and making it available in multiple form factors, including software that can be deployed with commercial off-the-shelf servers, will make it easier and more affordable for customers to deploy our technology across their networks and IT infrastructures. |
• | Expand our customer base in both enterprise and service provider markets – As a result of the Comms Transaction, NetScout has a larger direct sales force with specialized expertise in targeting the enterprise, service provider and government markets, along with a more extensive global network of value-added resellers and systems integrators. It is our intention to substantially grow our presence in both the enterprise and service provider markets. In the enterprise market, we plan to further expand our relationships with existing large and mid-sized customers, further fortify third-party distribution channels for the enterprise tools products, and help accelerate enterprise adoption of the NetScout Arbor cybersecurity products. We expect to also continue to drive further penetration into our global service provider customer base. |
• | Increase market relevance and awareness – NetScout plans to continue to implement marketing campaigns aimed at generating high-quality sales opportunities with both current and prospective enterprise and service provider customers, promoting thought leadership and building the NetScout brand. |
• | Extend our technology partner alliance ecosystem – We plan to continue to develop and fortify alliances with complementary solutions providers that can help us support a larger, more global and more diverse customer base. We plan to continue to enhance our technology value, product capabilities and customer relevance through the continued integration of our products into technology partner products. This includes both interoperability integration efforts, as well as embedding our technology into alliance partner products to gain a more extensive footprint across both enterprise and service provider networks. |
• | Pursue strategic acquisitions – We have completed many acquisitions since the Company’s inception that have helped broaden our capabilities, enhance our products and technologies, and better position the Company to meet the needs of a larger base of customers and prospects. In fiscal year 2018, we acquired Efflux Systems, Inc., which was developing technology to detect, analyze and correlate threat activity within enterprise networks. The Efflux technology and engineering talent have been integrated into Arbor Networks in order to support the ongoing enhancement of our advanced threat detection solution. |
• | Improve cost structure and drive efficiencies – We plan to balance our investments in key technology, product development, sales and marketing, and other initiatives that will enable us to drive long-term profitable growth with |
8
an ongoing focus on controlling costs and driving efficiencies. For example, we have taken steps to combine the previously separate service assurance and security marketing organizations, consolidate certain back-office functions and IT systems, and continue to eliminate or reduce redundancies associated with pre-existing resources, programs and capabilities. In addition, we are evaluating potential opportunities to restructure or divest certain underperforming, lower margin product lines.
Support Services
Customer satisfaction is a key driver of NetScout’s success. NetScout’s support programs offer customers various levels of high quality support services to assist in the deployment and use of our solutions. We have support personnel strategically deployed across the globe to deliver 24/7 telephone support to our premium customers. Certain support services, such as on-site support activities, are provided by qualified third-party support partners. In addition, many of our certified resellers provide Partner Enabled Support to NetScout end users. This is especially prevalent in international locations where time zones and language, among other factors, make it more efficient for end users to have the reseller provide initial support functions. Our support also includes updates to our software and firmware at no additional charge, if and when such updates are developed and made generally available to our commercial customer base. If ordered, support commences upon expiration of the standard warranty for software. For software, which also includes firmware, the standard warranty commences upon shipment and expires 60 to 90 days thereafter. With regard to hardware, the standard warranty commences upon shipment and expires 60 days to 12 months thereafter. We believe our warranties are consistent with commonly accepted industry standards. NetScout expects to continue to provide support services for the acquired platforms under existing agreements and plans to explore opportunities to further simplify and standardize its support obligations over the coming years.
Manufacturing
Our manufacturing operations consist primarily of final product assembly, configuration and testing. We purchase components and subassemblies from suppliers and construct our hardware products in accordance with NetScout standard specifications. We inspect, test and use process control to ensure the quality and reliability of our products. We maintain an ISO 9001 quality systems registration, a certification showing that our corporate procedures and manufacturing facilities comply with standards for quality assurance and process control. We also maintain an ISO 9001:2000 quality systems registration, a certification showing that our corporate procedures comply with standards for continuous improvement and customer satisfaction. Additionally, we have outsourced the manufacturing of certain acquired products to high-quality third-party contract manufacturers.
We generally use standard parts and components for our products, which can be sourced from various suppliers. We have generally been able to obtain adequate supplies of components in a timely manner from current suppliers. While certain components, such as computer network interface cards, are currently purchased from a single supplier, we have identified alternate suppliers that we believe can be qualified relatively quickly to fulfill our needs should an issue arise with the existing supplier. Our reliance on single source suppliers is further described in Item 1A "Risk Factors."
We manufacture our products based upon near-term demand estimates resulting from sales forecasts and historical fulfillment information. However, since these forecasts have a high degree of variability because of factors that include time of year, overall economic conditions and sales employee incentives, we believe it is prudent to maintain inventory levels in advance of receipt of firm orders to ensure that we have sufficient stock to satisfy incoming orders.
Sales and Marketing
Sales
We sell our products, support and services through a direct sales force and an indirect reseller and distribution channel.
Our direct sales force uses a "high-touch" sales model that consists of face-to-face meetings with customers to understand and identify their unique business challenges and requirements. Our sales teams then translate those requirements into tailored business solutions that allow the customer to maximize the performance of its infrastructure and service delivery environment. Due to the complexity of the systems and the capital expenditures involved, our sales cycles typically take between three and twelve months. We build strategic relationships with our customers by continually enhancing our solution to help them address their evolving service delivery management challenges. In addition to providing a comprehensive solution to meet these needs, we continually provide software enhancements to our customers as part of their maintenance contracts with us. These enhancements are designed to provide additional and ongoing value to our existing customers to promote loyalty and the expansion of their deployment of our products. Existing customer growth is also driven by the expansion and changes in their networks as they add new infrastructure elements, new users, new locations, new applications and experience increasing service traffic volumes.
9
We also maintain an indirect reseller and distribution channel. Sales to customers outside the United States are primarily export sales through channel partners. Our channel partners assist us by improving our reach to customers, extending our presence in new markets, and marketing and selling our products to a broad array of organizations globally. We sell through a range of channel partners including value-added resellers, value-added distributors, resellers, and system integrators, to our enterprise, service provider and government customers. Historically and currently, we have used indirect distribution channels principally as intermediaries on contractual terms for customers with whom we do not have a contract. Our sales force meets with end user customers to present NetScout products and solutions, conduct demonstrations, provide evaluation equipment, recommend detailed product solutions, develop product deployment designs and timelines, and assist in establishing financial and other justifications for the proposed solution. During this selling process, a channel partner, who has contracts with both the end customer and NetScout, may be brought in to facilitate the transaction and to provide fulfillment services. In the case of international channel partners, those services usually also include currency translation and support. In the U.S., fulfillment services are usually limited to invoicing and cash collection. Under this approach, we have limited dependence upon channel partners for the major elements of the selling process. In many cases, there are multiple channel partners with the required contractual relationships, so dependence on any single channel partner is not significant.
During the fiscal year ended March 31, 2018, no direct customers or indirect channel partners accounted for more than 10% of our total revenue. During the fiscal years ended March 31, 2017 and 2016, one direct customer, Verizon Communications, Inc. (Verizon), accounted for more than 10% of total revenue, while no indirect channel partner accounted for more than 10% of total revenue.
Marketing
Our marketing organization drives our market research, strategy, product positioning and messaging and produces and manages a variety of programs such as advertising, trade shows, industry events, public and analyst relations, social media, direct mail, seminars, sales promotions, and web marketing to promote the sale and acceptance of our solutions and to build the NetScout, ASI, nGenius, Arbor and other applicable product brand names in the marketplace. We also host an annual worldwide user conference, Engage, to provide technical education and awareness, and to promote expanded use of our solutions with these customers.
Key elements of our marketing strategy focus on thought leadership, market positioning, market education, go to market strategies, reputation management, demand generation, and the acceleration of our strategic selling relationships with local and global resellers, systems integrators, and our technology alliance partners. During fiscal year 2018, NetScout began to advance plans to fortify and amplify the NetScout brand while leveraging the nGenius and Arbor brands as core solution-level brands in their respective markets. We expect to continue these initiatives during fiscal year 2019. To align our marketing efforts during the year, we also took steps to consolidate the previously separate NetScout and Arbor marketing organizations.
Research and Development
Our continued success depends significantly on our ability to anticipate and create solutions that will meet emerging customer requirements. NetScout works closely with its largest enterprise and service provider customers to better understand and address their near-term and longer-term requirements. By better understanding the key, time-sensitive needs of NetScout’s global customer base, we believe NetScout’s development programs will continue to result in enhanced products that are able to meet the increasing challenges of an increasingly complex and dynamic global network environment.
We have invested significant financial resources and personnel into the development of our products and technology. Our continued investment in research and development is crucial to our business and our continued success in the market. We have assembled a team of highly skilled engineers with expertise in various technologies associated with our business and the technologies being deployed by our customers. We plan to continue to enhance and expand our product offerings and capabilities in the near future while integrating key capabilities from acquired product lines as appropriate. As a result, we plan to continue to invest and dedicate significant resources to our research and development activities for both our enterprise and service provider customers. Additionally, we continue to support the legacy product lines that we acquired as a result of the Comms Transaction and work closely with customers on migrating to our next-generation offerings.
We predominantly develop our products internally, with some limited third-party contracting. We have also acquired developed technology through business acquisitions. To promote industry standards and manifest technology leadership, we participate in and support the activities and recommendations of industry standards bodies, such as the Internet Engineering Task Force and the 3rd Generation Partnership Project, and we also engage in close and regular dialogue with our key customers and alliance partners. These activities provide early insight into the direction of network and application performance requirements for current and emerging technologies.
10
Seasonality
We have experienced, and expect to continue to experience, quarterly variations in our order bookings as a result of a number of factors, including the length of the sales cycle, complexity of customer environments, new product introductions and their market acceptance and seasonal factors affected by customer projects and typical IT buying cycles. Due to these factors, we historically have experienced stronger bookings during our fiscal third and fourth quarters than in our first and second quarters.
Customers
We sell our products to enterprises, service providers and local, state and federal governmental agencies with large- and medium-sized high-speed IP computer networks. Our enterprise customers cover a wide variety of industries, such as financial services, technology, manufacturing, healthcare, utilities, education, transportation and retail. Our telecommunications service provider customer group includes mobile operators, wireline operators, cable operators and cloud providers. A significant number of our service provider customers are mobile operators.
Backlog
We produce our products on the basis of our forecast of near-term demand and maintain inventory in advance of receipt of firm orders from customers. We configure our products to customer specifications and generally deliver products shortly after receipt of the purchase order. Service engagements are also included in certain orders. Customers generally may reschedule or cancel orders with little or no penalty. We believe that our backlog at any particular time is not meaningful because it is not necessarily indicative of future sales levels. Our combined product backlog at March 31, 2018 was $28.0 million compared to $62.7 million at March 31, 2017. A majority of the backlog relates to customization and integration projects from our acquired business units. In some cases, we have begun these projects but have not yet hit billable milestones. A majority of revenue for these projects is expected to be recognized into revenue throughout fiscal year 2019.
Competition
We compete with many companies in the markets we serve. The service assurance market, including the network and application performance management markets, is highly competitive, rapidly evolving, and fragmented with overlapping technologies and a wide range of competitors, both large and small, who may deliver certain elements of our solution. Consequently, there are a number of companies who have greater name recognition and substantially greater financial, management, marketing, service, support, technical, distribution and other resources than we do. Additionally, certain competitors, either due to their size and resources or due to their technological strengths, may be able to respond more effectively than we can to new or changing opportunities, technologies, standards and customer requirements.
Principal competitive factors in our service assurance market include scalability; ability to address a large number of applications, locations and users; product performance; the ability to easily deploy into existing network environments; the ability to offer virtualized solutions; and the ability to administer and manage the solution.
While NetScout faces multiple competitors within the service assurance industry, we believe that we compete favorably on the basis of the following factors:
• | we provide a comprehensive service delivery management solution that is capable of addressing the needs of both enterprise and service provider customers and can be scaled to meet the challenges of today’s dynamic service delivery environments; |
• | we believe that our solutions provide superior data and compete favorably on a broad range of metrics including the ability to recognize and track a large number of applications; |
• | we believe our solutions possess the scalability to support high and increasing levels of data and network traffic; |
• | our solutions look at both data and control plane traffic across an entire network; and |
• | our ASI technology is optimized to provide real-time information about service performance and real-time alerts to emerging service problems whereas traditional solutions are inherently latent, supporting only forensic-trouble shooting after an issue has occurred. |
In the enterprise market, our competitors include companies who provide network performance management, application performance management, infrastructure performance management and other related solutions such as Avaya, CA Technologies, Cisco Systems, Dynatrace, ExtraHop, InfoVista, Keysight, Viavi, Gigamon, Lancope, Corvil, ThousandEyes, New Relic, Riverbed Technology and SolarWinds. In addition, we both compete with and partner with large enterprise
11
management vendors, such as HP and IBM, who offer performance management solutions. We also compete with smaller, privately held competitors who often focus on specific vertical markets.
In the service provider market, we compete with traditional probe vendors, network equipment manufacturers, big data and analytics vendors, and virtualization vendors. These vendors include Alcatel-Lucent, Astellia, Anritsu, Cisco, Empirix, Ericsson, Dell Technologies, EXFO, Guavas, Huawei, IBM, JDSU, Niksun, Polystar, Radcom, SevOne, Splunk, and Zettics. We face additional competitive threats from startups and new entrants that seek to offer innovative solutions in an industry characterized by rapid technological change.
In the cybersecurity market, we face a range of competitors, including those that may have greater name recognition and substantially greater financial, management, marketing, service, support, technical, distribution and other resources than we do. We believe that the scalability of our solutions, flexible deployment, and price-performance of our cybersecurity solutions positions us well to compete against both larger network equipment and security companies and smaller niche security solutions vendors.
In the DDoS solutions market, we compete under the NetScout Arbor brand with a broad range of vendors including Radware, Akamai, F5 Networks, A10 Networks, Fortinet and Corero Network Security. In the market for specialized threat analysis and protection solutions used to identify advanced network threats, we compete with a range of vendors including Darktrace, Vectra Networks, Cisco, Palo Alto Networks, RSA (a Dell Technologies business) and other specialist providers.
Our ability to sustain a competitive advantage depends on our ability to deliver continued technology innovation and adapt to meet the evolving needs of our customers. Competitive factors in our industry are further described in Item 1A "Risk Factors."
Intellectual Property Rights
We rely on patent, copyright, trademark, and trade secret laws and contract rights to establish and maintain our rights in our technology and products. While our intellectual property rights are an important element in our success, our business as a whole does not depend on any one particular patent, trademark, copyright, trade secret, license, or other intellectual property right.
NetScout uses contracts, statutory laws, domestic and foreign intellectual property registration processes, and international intellectual property treaties to police and protect its intellectual property portfolio and rights from infringement. From a contractual perspective, NetScout uses license agreements and non-disclosure agreements to control the use of our intellectual property and protect NetScout trade secrets from unauthorized use and disclosure. In addition to license agreements, NetScout relies on U.S. and international copyright law to protect against unauthorized copying of software programs, in the U.S. and abroad. NetScout has obtained U.S. and foreign trademark registrations to preserve and protect certain trademarks and trade names. NetScout has also filed and obtained U.S. patents and international counterparts to protect certain unique NetScout inventions from being unlawfully exploited by other parties. However, there is no assurance that pending or future patent applications will be granted, that we will be able to obtain patents covering all of our products, or that we will be able to license, if needed, patents from other companies on favorable terms or at all. Our proprietary rights are subject to other risks and uncertainties described under Item 1A "Risk Factors."
Employees
At March 31, 2018, we had a total of 3,019 employees, 1,986 of whom were employed in the United States. The majority of our employees are not subject to a collective bargaining agreement. In accordance with applicable laws, employees in certain international jurisdictions are subject to collective bargaining agreements. Employees by department at March 31, 2018 were as follows:
Function | Number of Employees | ||
Sales and marketing | 919 | ||
Research and development | 1,122 | ||
Support services | 616 | ||
General and administrative | 272 | ||
Manufacturing | 90 | ||
3,019 | |||
12
Financial Information About Geographic Area
Our sales force is organized into four main geographic teams covering sales around the globe: United States, Europe, Asia and the rest of the world. Revenue from sales outside the United States represented 41%, 38% and 29% of our total revenue in the fiscal years ended March 31, 2018, 2017 and 2016, respectively. For a detailed summary of financial information about geographic location, see Note 18 of our Notes to Consolidated Financial Statements.
Corporate Information
Our corporate headquarters are located at 310 Littleton Road, Westford, Massachusetts, and our telephone number is (978) 614-4000. NetScout was incorporated in Delaware in 1984.
NetScout’s internet address is http://www.NetScout.com. Our Annual Report on Form 10-K, Quarterly Reports on Form 10-Q, Current Reports on Form 8-K and amendments to reports filed pursuant to Sections 13(a) and 15(d) of the Exchange Act, are made available free of charge on or through our website at http://ir.netscout.com/phoenix.zhtml?c=92658&p=irol-sec until May 31, 2018, or ir.netscout.com after May 31, 2018, as soon as reasonably practicable after such reports are filed with, or furnished to, the SEC. None of the information posted on our website is incorporated by reference into this Report.
We webcast our earnings calls and certain events we participate in or host with members of the investment community. They are made available on our investor relations website at http://ir.netscout.com/phoenix.zhtml?c=92658&p=irol-calendar until May 31, 2018, or ir.netscout.com//investors/events-and-presentations/events-calendar/default.aspx after May 31, 2018. Additionally, we provide notifications of news or announcements regarding our financial performance, including SEC filings, investor events, press and earnings releases, as part of our investor relations website. The contents of these sections of our investor relations website are not intended to be incorporated by reference into this report or in any other report or document we file with the SEC.
Item 1A. Risk Factors.
In addition to the other information in this report, the following factors should be considered carefully in evaluating NetScout and our business.
Our operating results and financial condition have varied in the past and may vary significantly in the future depending on a number of factors. Except for the historical information in this report, the matters contained in this report include forward-looking statements that involve risk and uncertainties. The following factors are among many that could cause actual results to differ materially from those contained in or implied by forward-looking statements made in this report. These statements involve the risks and uncertainties identified below as well as additional risks and uncertainties that are not yet identified or that we currently think are immaterial but may also impact our business operations. Such factors are among many that may have a material adverse impact upon our business, results of operations and financial condition.
You should consider carefully the risks and uncertainties described below, together with the information included elsewhere in this Annual Report on Form 10-K and other documents we file with the SEC. The risks and uncertainties described below are those that we have identified as material but are not the only risks and uncertainties facing us. Our business is also subject to general risks and uncertainties that affect many other companies. Additional risks and uncertainties not currently known to us or that we currently believe are immaterial also may impair our business, including our results of operations, liquidity and financial condition.
Because of the following factors, as well as other variables affecting our results of operations, past financial performance may not be a reliable indicator of future performance, and historical trends should not be used to anticipate results or trends in future periods.
Risks Related to the Company and its Operations
Our indebtedness may limit our operations and our use of our cash flow, and any failure to comply with the covenants that apply to our indebtedness could adversely affect our liquidity and financial condition.
On January 16, 2018, we amended and expanded our existing credit facility (Amended Credit Agreement) with a syndicate of lenders. The Amended Credit Agreement provides for a five-year $1.0 billion senior secured revolving credit facility, including a letter of credit sub-facility of up to $75.0 million. We have used the new credit facility for working capital purposes and to finance the repurchase of common stock under our previously announced accelerated stock repurchase plan.
13
The commitments under the Amended Credit Agreement will expire on January 16, 2023, and any outstanding loans will be due on that date. As of the date of this report, we had approximately $600 million in outstanding indebtedness under the Amended Credit Agreement. Our debt level can have negative consequences, including exposing us to interest rate risk. We may incur significantly more debt in the future, and there can be no assurance that our cost of funding will not substantially increase. Our current revolving credit facility also imposes certain restrictions on us; for a more detailed description please refer to "Management's Discussion and Analysis of Financial Condition and Results of Operations." Upon an event of default, for example, the administrative agent with the consent of, or at the request of, the holders of more than 50% in principal amount of the loans and commitments may terminate the commitments and accelerate the maturity of the loans and enforce certain other remedies under the Amended Credit Agreement and the other loan documents, which would adversely affect our liquidity and financial condition. If we take on additional indebtedness, the risks described above could increase.
Any failure to meet our debt obligations could damage our business.
Our ability to meet our obligations under the Amended Credit Agreement will depend on market conditions and our future performance, which is subject to economic, financial, competitive and other factors beyond our control. If we are unable to remain profitable or if we use more cash than we generate in the future, our level of indebtedness at such time could adversely affect our operations by increasing our vulnerability to adverse changes in general economic and industry conditions and by limiting or prohibiting our ability to obtain additional financing for additional capital expenditures, acquisitions and general corporate and other purposes. In addition, if we are unable to make payments as required under the Amended Credit Agreement, we would be in default under the terms of the loans, which could seriously harm our business. If we incur significantly more debt, this could intensify the risks described above.
Foreign currency exchange rates may adversely affect our financial statements.
Following the Comms Transaction, an increasing portion of our revenue is derived from international operations. Our consolidated financial results are reported in U.S. dollars. Most of the revenue and expenses of our foreign subsidiaries are denominated in local currencies. Given that cash is typically received over an extended period of time for many of our license agreements and given that a material and increasing portion of our revenue is generated outside of the United States, fluctuations in foreign exchange rates (including the Euro) against the U.S. dollar could result in substantial changes in reported revenues and operating results due to the foreign exchange impact upon translation of these transactions into U.S. dollars.
In the normal course of business, we employ various hedging strategies to partially mitigate these risks, including the use of derivative instruments. These strategies may not be effective in fully protecting us against the effects of fluctuations from movements in foreign exchange rates. Fluctuations of the foreign exchange rates could materially adversely affect our business, financial condition, operating results and cash flow.
Additionally, sales and purchases in currencies other than the U.S. dollar expose us to fluctuations in foreign currencies relative to the U.S. dollar and may adversely affect our financial statements. Increased strength of the U.S. dollar increases the effective price of our products sold in U.S. dollars into other countries, which may require us to lower our prices or adversely affect sales to the extent we do not increase local currency prices. Decreased strength of the U.S. dollar could adversely affect the cost of materials, products and services we purchase overseas. Sales and expenses of our non-U.S. businesses are also translated into U.S. dollars for reporting purposes and the strengthening or weakening of the U.S. dollar could result in unfavorable translation effects. In addition, we may invoice customers in a currency other than the functional currency of our business, and movements in the invoiced currency relative to the functional currency could also result in unfavorable translation effects. The Company also faces exchange rate risk from its investments in subsidiaries owned and operated in foreign countries.
Our effective tax rate may fluctuate, which could increase our income tax expense and reduce our net income.
Our effective tax rate or the taxes we owe could be adversely affected by several factors, many of which are outside of our control, including:
• | changes in the relative proportions of revenues and income before taxes in the various jurisdictions in which we operate that have differing statutory tax rates; |
• | changing tax laws, regulations, and interpretations in multiple jurisdictions in which we operate as well as the requirements of certain tax rulings; |
• | changes in the research and development tax credit laws, earnings being lower than anticipated in jurisdictions where we have lower statutory rates and being higher than anticipated in jurisdictions where we have higher statutory rates; |
• | changes in accounting and tax treatment of share-based compensation; |
• | the valuation of generated and acquired deferred tax assets and the related valuation allowance on these assets; |
14
• | transfer pricing adjustments; |
• | the tax effects of purchase accounting for acquisitions and restructuring charges that may cause fluctuations between reporting periods; and |
• | tax assessments or any related tax interest or penalties that could significantly affect our income tax expense for the period in which the settlements take place. |
We are subject to income taxes in the United States and in numerous foreign jurisdictions. From time to time, we may receive notices that a tax authority in a particular jurisdiction believes that we owe a greater amount of tax than we have reported to such authority.
While we regularly assess the likelihood of adverse outcomes from such examinations and the adequacy of our provision for income taxes, there can be no assurance that such provision is sufficient and that a determination by a tax authority will not have an adverse effect on our results of operations. An adverse change in our effective tax rate could have a material and adverse effect on our financial condition and results of operations and the price of our common stock could decline if our financial results are materially affected by an adverse change in our effective tax rate.
We may fail to secure necessary additional financing.
Our future success may depend in part on our ability to obtain additional financing to support our continued growth and operations and any downgrades in our credit rating could affect our ability to obtain additional financing in the future and may affect the terms of any such financing. If our existing sources of liquidity are insufficient to satisfy our operating requirements, we may need to seek to raise capital by one or more of the following:
• | issuing additional common stock or other equity instruments; |
• | acquiring additional bank debt; |
• | issuing debt securities; or |
• | obtaining lease financings. |
However, we may not be able to obtain additional capital when we want or need it, or capital may not be available on satisfactory terms. Furthermore, any additional capital may have terms and conditions that adversely affect our business, such as new financial or operating covenants, or that may result in additional dilution to our stockholders.
We expect that existing cash, cash equivalents, marketable securities, cash provided from operations and our bank credit facilities will be sufficient to meet ongoing cash requirements. However, our failure to generate sufficient cash as our debt becomes due or to renew credit lines prior to their expiration could materially adversely affect our business, financial condition, operating results and cash flows.
Our estimates and judgments related to critical accounting policies could be inaccurate.
We consider accounting policies related to marketable securities, revenue recognition, valuation of goodwill and acquired intangible assets and share-based compensation to be critical in fully understanding and evaluating our financial results. Management makes accounting judgments and estimates related to these policies. These estimates and judgments affect, among other things, the reported amounts of our assets, liabilities, revenue and expenses, the amounts of charges accrued by us, and related disclosure of contingent assets and liabilities. We base our estimates on historical experience and on various other assumptions that we believe to be reasonable under the circumstances and at the time they are made. If our estimates or the assumptions underlying them are not correct, actual results may differ materially from our estimates and we may need to, among other things, accrue additional charges that could adversely impact our business. As a result, our operating results and financial condition could be materially and adversely impacted in future periods and could negatively affect our stock price.
Our quarterly revenue and operating results may fluctuate.
Our quarterly revenue and operating results are difficult to predict and may fluctuate significantly from quarter to quarter. Our quarterly revenue may fluctuate as a result of a variety of factors associated with our industry, many of which may be outside of our control, including the following:
• | the rate of growth of, and changes in technology trends in, our market and other industries in which we currently operate or may operate in the future; |
• | technology spending by current and potential customers; |
• | reduced demand for our products; |
15
• | uneven demand for service delivery and network and application performance management solutions and network security solutions; |
• | the timing and size of orders from customers, especially in light of our lengthy sales cycle; |
• | the timing and market acceptance of new products or product enhancements by us or our competitors; |
• | the timing of hiring sales personnel and the speed at which such personnel become fully productive; |
• | our ability to develop and manufacture new products and technologies in a timely manner; |
• | the competitive position of our products; |
• | the continued acceptance of our products by our customers and in the industries that we serve; |
• | changes in the number and size of our competitors, including the effects of new entrants and the effects of well-resourced competitors increasing their investment in our markets, and changes in the prices and capabilities of competitors' products; |
• | customer ability to implement our products; |
• | cancellation, deferral, or limitation of orders by customers; |
• | changes in foreign currency exchange rates; |
• | attrition of key employees and competition with other companies for employees with specific talents and experience; |
• | the number, severity, and timing of cyber-related threat outbreaks (e.g., malware, attacks, worms and viruses); |
• | the quality and level of our execution of our business strategy and operating plan, and the effectiveness of our sales and marketing programs; |
• | changes in accounting rules; |
• | costs related to acquisitions; and |
• | our ability to manage expenses. |
If our revenue or operating results fall below the expectations of investors or securities analysts or below any guidance we may provide to the market, the price of our common stock could decline substantially. Such a stock price decline could also occur even if we meet or exceed our publicly stated revenue and/or earnings guidance. Most of our expenses, such as employee compensation, benefits and rent, are relatively fixed in the short term. Moreover, our expense levels are based, in part, on our expectations regarding future revenue levels. As a result, if revenue for a particular quarter is significantly below our expectations, we may not be able to reduce operating expenses proportionately for that quarter, and, therefore, this revenue shortfall would have a disproportionately negative impact on our operating results for that quarter.
It may be necessary in the future to undertake cost reduction initiatives to improve profitability, which could lead to a deterioration of our competitive position. Any difficulties that we encounter as we reduce our costs could negatively impact our results of operations and cash flows.
Our disclosure controls and procedures and internal control over financial reporting may not be effective.
Our disclosure controls and procedures and internal control over financial reporting may not prevent all material errors and intentional misrepresentations. Any system of internal control can only provide reasonable assurance that all control objectives are met. Some of the potential risks involved could include, but are not limited to, management judgments, simple errors or mistakes and willful misconduct regarding controls or misinterpretation. Under Section 404 of the Sarbanes-Oxley Act, we are required to evaluate and determine the effectiveness of our internal control over financial reporting. Compliance with this provision requires management's attention and expense. Management's assessment of our internal control over financial reporting may or may not identify weaknesses that need to be addressed in our internal control system. If we are unable to conclude that our internal control over financial reporting is effective, investors could lose confidence in our reported financial information which could have an adverse effect on the market price of our stock or impact our borrowing ability. In addition, changes in operating conditions and changes in compliance with policies and procedures currently in place may result in inadequate disclosure controls and procedures and internal control over financial reporting in the future.
If our products contain errors or quality issues, such issues may be costly to correct, revenue may be delayed, we could be sued and our reputation could be harmed.
Our products are inherently complex and, despite testing by our customers and us, errors or quality issues may be found in our products after commencement of commercial shipments, especially when products are first introduced or when new versions are released. These errors may result from components supplied by third parties incorporated into our products, which makes us dependent upon the cooperation and expertise of such third parties for the diagnosis and correction of such errors. If errors are discovered, we may not be able to correct them in a timely manner or at all. In addition, we may need to make significant expenditures to eliminate errors and failures. Errors and failures in our products could result in loss of or delay in market acceptance of our products and could damage our reputation. Regardless of the source of these defects or errors, we may need to divert the attention of our engineering personnel from our product development efforts to address the detection and
16
correction of these errors and defects. If one or more of our products fail, a customer may assert warranty and other contractual claims for substantial damages against us. Our contracts with customers contain provisions relating to warranty disclaimers and liability limitations, which may not be upheld. Defending a lawsuit, regardless of its merit, is costly and may divert management's attention and harm the market's perception of us and our products. In addition, if our business liability insurance coverage proves inadequate or future coverage is unavailable on acceptable terms or at all, our business, operating results and financial condition could be adversely impacted.
The occurrence or discovery of these types of errors or failures could have a material and adverse impact on our business, operating results and financial condition. Any such errors, defects, or security vulnerabilities could also adversely affect the market's perception of our products and business.
If we fail to introduce new products and solutions or enhance our existing products and solutions to keep up with rapid technological change, demand for our products and solutions may decline.
The market for application and network performance management and service assurance solutions is highly competitive and characterized by rapid changes in technology, evolving industry standards, changes in customer requirements and frequent product introductions and enhancements. Such changes also affect the network security market in which we now participate. Our success is dependent upon our ability to meet our customers' needs, which are driven by changes in computer networking technologies, new application technologies and the emergence of new industry standards. In addition, new technologies may shorten the life cycle for our products and solutions or could render our existing or planned products and services obsolete. We must address demand from our customers for advancements in our products and services applications in order to support our customers' growing needs and requirements. In order to meet this challenge and remain competitive in the market, we must introduce new enhancements, and additional form factors, to our existing product lines and service offerings. If we are unable to develop, introduce and communicate new network and application performance management and service assurance products or enhancements to existing products, as well as network security products and solutions, in a timely and successful manner, this inability could have a material and adverse impact on our business, operating results and financial condition.
As our success depends in part on our ability to develop product enhancements and new products and solutions that keep pace with continuing changes in technology and customer preferences, we must devote significant resources to research and development, development and introduction of new products and enhancements on a timely basis, and obtaining market acceptance for our existing products and new products. We have introduced and intend to continue to introduce new products and solutions, including by moving to higher software content in our products. If the introduction of these products and solutions is significantly delayed or if we are unsuccessful in bringing these products and solutions to market, our business, operating results and financial condition could be materially and adversely impacted. We are currently developing a number of new products as well as enhancements to our existing products and offerings, including software only solutions and products available in multiple form factors.
In addition, we must invest in research and development in order to remain competitive in our industry. However, there can be no assurances that continued investment and higher costs of research and development will ultimately result in us maintaining or increasing our market share, which could result in a decline to our operating results. The process of developing new solutions is complex and uncertain; we must commit significant resources to developing new services or features without knowing whether our investments will result in services or features the market will accept. If our research and development expenses increase without a corresponding increase in our revenues, it could have a material adverse effect on our operating results. Also, we may not be able to successfully complete the development and market introduction of new products or product enhancements in a timely manner. If we fail to develop and deploy new products and product enhancements on a timely basis, or if we fail to gain market acceptance of our new products, our revenues will decline, and we may lose market share to our competitors.
We face significant competition from other technology companies.
The service assurance, application performance management and network security markets are highly competitive, rapidly evolving, and fragmented markets that have overlapping technologies and competitors, both large and small, and we expect the competition on offerings and pricing to increase. We believe customers make service management system and network security purchasing decisions based primarily upon the following factors:
• | product and service performance, functionality and price; |
• | timeliness of new product and service introductions; |
• | network capacity; |
• | ease of installation, integration, and use; |
• | customer service and technical support; |
17
• | name and reputation of vendor; |
• | quality and value of the product and services; and |
• | alliances with industry partners. |
We compete with a growing number of providers of service assurance, application performance management solutions, network security offerings and portable network traffic analyzers and probes. In addition, leading network equipment, network security and service assurance and application technology vendors offer their own management solutions, including products which they license from other competitors. Some of our current and potential competitors have greater name recognition and substantially greater financial, management, marketing, service, support, technical, distribution and other resources than we do. In addition, some of our customers develop their own in-house solutions to meet their technological needs. Further, in recent years some of our competitors have been acquired by larger companies that are seeking to enter or expand in the markets in which we operate. We expect this trend to continue as companies attempt to strengthen or maintain their market positions in an evolving industry. Therefore, given their larger size and greater resources, our competitors may be able to respond more effectively than we can to new or changing opportunities, technologies, standards and customer requirements.
As a result of the competitive factors highlighted in this section and in other risk factors, we may not be able to compete effectively with our current or future competitors. If we are unable to anticipate or react to these competitive challenges or if existing or new competitors gain market share in any of our markets, our competitive position could weaken and we could experience a decline in our sales that could adversely affect our business and operating results. This competition could result in increased pricing pressure, reduced profit margins, increased sales and marketing expenses, and failure to increase, or the loss of market share, any of which would likely have a material and adverse impact on our business, operating results and financial condition.
Increased customer demands on our technical support services may adversely affect our relationships with our customers and our financial results.
We offer technical support services with many of our products. We may be unable to respond quickly enough to accommodate short-term increases in customer demand for support services. We also may be unable to modify the format of our support services to compete with changes in support services provided by competitors. Our customers depend on our support organization to resolve any issues relating to our products deployed on their networks. A high level of support is critical for continued relationships with our customers. If we or our channel partners do not effectively assist our customers in deploying our products, succeed in helping our customers quickly resolve post-deployment issues, and provide effective ongoing support, it would adversely affect our ability to sell our products to existing customers and would harm our reputation with potential customers. In addition, as we continue to expand our operations internationally, our support organization will face additional challenges, including those associated with delivering support, training and documentation in languages other than English. Any failure to maintain high quality support and services would harm our operating results and reputation. Further customer demand for these services, without corresponding revenues, could have a material and adverse impact on our financial condition and results of operations.
Failure to manage growth properly and to implement enhanced automated systems could adversely impact our business.
The growth in size and complexity of our business and our customer base has been and will continue to be a challenge to our management and operations. Our growth has been through acquisitions of businesses with complementary technologies, and we anticipate that further significant expansion will be required. This growth is expected to continue to place significant demands on our management, infrastructure, and other resources. To manage further growth effectively, we must hire, integrate, and retain highly skilled personnel qualified to manage our expanded operations. We will also need to continue to improve our financial and management controls, reporting systems, and procedures. If we are unable to manage our growth effectively, our costs, the quality of our products, the effectiveness of our sales organization, attraction and retention of key personnel, our business, our operating results and financial condition could be materially and adversely impacted. To manage our growth effectively, we may need to implement new or enhanced automated infrastructure technology and systems.
Any disruptions or ineffectiveness relating to our systems implementations and enhancements could adversely affect our ability to process customer orders, ship products, provide services and support to our customers, bill and track our customers, fulfill contractual obligations, and otherwise run our business.
As a result of the diversification of our business, personnel growth, acquisitions and international expansion in recent years, most of our employees are now based outside of our headquarters. If we are unable to appropriately increase management depth and enhance succession planning, we may not be able to achieve our financial or operational goals. It is also important to our continued success that we hire qualified employees, properly train them and manage out poorly-performing
18
personnel, all while maintaining our corporate culture and spirit of innovation. If we are not successful at these efforts, our growth and operations could be adversely affected.
As our business evolves, we must also expand and adapt our information technology (IT) and operational infrastructure. Our business relies on our data systems, billing systems and other operational and financial reporting and control systems. All of these systems have become increasingly complex due to the diversification and complexity of our business, acquisitions of new businesses with different systems and increased regulation over controls and procedures. To manage our technical support infrastructure effectively and improve our sales efficiency, we will need to continue to upgrade and improve our data systems, billing systems, ordering processes and other operational and financial systems, procedures and controls. These upgrades and improvements may be difficult and costly. If we are unable to adapt our systems and organization in a timely, efficient and cost-effective manner to accommodate changing circumstances, our business may be adversely affected. If the third parties we rely on for hosted data solutions for our internal network and information systems are subject to a security breach or otherwise suffer disruptions that impact the services we utilize, the integrity and availability of our internal information could be compromised causing the loss of confidential or proprietary information, damage to our reputation and economic loss.
We may not successfully complete acquisitions or integrate acquisitions we do make, which could impair our ability to compete and could harm our operating results.
We may need to acquire complementary businesses, products or technologies to remain competitive or expand our business. We actively investigate and evaluate potential acquisitions of complementary businesses, products and technologies in the ordinary course of business. We may compete for acquisition opportunities with entities having significantly greater resources than we have. As a result, we may not succeed in acquiring some or all businesses, products or technologies that we seek to acquire. Our inability to effectively consummate acquisitions on favorable terms could significantly impact our ability to compete effectively in our targeted markets and could negatively affect our results of operations.
Acquisitions that we do complete could adversely impact our business. The potential adverse consequences from acquisitions include:
• | the potentially dilutive issuance of common stock or other equity instruments; |
• | the incurrence of debt and amortization expenses related to acquired intangible assets; |
• | the potentially costly and disruptive impact of assuming unfavorable pre-existing contractual relationships of acquired companies that we would not have otherwise entered into and potentially exiting or modifying such relationships; |
• | the potential litigation or other claims in connection with, or inheritance of claims or litigation risk as a result of, an acquisition including claims from terminated employees, customers, third parties or enforcement actions by various regulators; |
• | the incurrence of significant costs and expenses; and |
• | the potentially negative impact of poor performance of an acquisition on our earnings per share. |
Acquisition transactions also involve numerous business risks. These risks from acquisitions include:
• | difficulties in assimilating the acquired operations, technologies, personnel and products; |
• | difficulties in managing geographically dispersed operations; |
• | difficulties in assimilating diverse financial reporting and management information systems; |
• | difficulties in maintaining uniform standards, controls, procedures and policies; |
• | the diversion of management's attention from other business concerns; |
• | use of cash to pay for acquisitions that may limit other potential uses of our cash, including stock repurchases and retirement of outstanding indebtedness; |
• | substantial accounting charges for restructuring and related expenses, write-off of in-process research and development, impairment of goodwill, amortization or impairment of intangible assets and share-based compensation expense; |
• | the potential disruption of our business; |
• | the potential loss of key employees, customers, distributors or suppliers; |
• | the inability to generate sufficient revenue to offset acquisition or investment costs; and |
• | the potential for delays in customer purchases due to uncertainty and the inability to maintain relationships with customers of the acquired businesses. |
If we are not able to successfully manage these issues, the anticipated benefits and efficiencies of the acquisitions may not be realized fully or at all, or may take longer to realize than expected, and our ability to compete, our revenue and gross margins and our results of operations may be adversely affected.
19
Our ability to quickly and successfully recover from a disaster or other business continuity event could affect our ability to deliver our products and cause reputational harm to our business.
The occurrence of a natural disaster or an act of terrorism, or a decision or need to close any of our facilities without adequate notice or time for making alternative arrangements could result in interruptions in the delivery of our products and services. Our central business functions, including administration, human resources, finance services, manufacturing and customer support depend on the proper functioning of our computer, telecommunication and other related systems and operations. A disruption or failure of these systems or operations because of a disaster or other business continuity event could cause data to be lost or otherwise delay our ability to complete sales and provide the highest level of service to our customers. In addition, we could have difficulty producing accurate financial statements on a timely basis, which could adversely affect the trading value of our stock. Although we endeavor to ensure there is redundancy in these systems and that they are regularly backed-up, there are no assurances that data recovery in the event of a disaster would be effective or occur in an efficient manner. Our operations are dependent upon our ability to protect our technology infrastructure against damage from business continuity events that could have a significant disruptive effect on our operations. We could experience material adverse interruptions to our operations or delivery of services to our clients in a disaster recovery scenario.
If a security breach or cyberattack of our IT networks and systems, or any of our products, occurs, our operations could be interrupted, our products and services may be perceived as vulnerable, and our brand and reputation could be damaged, which could reduce revenue, increase expenses, and expose us to legal claims or regulatory actions.
Although we have controls and security measures in place to prevent such attacks, experienced computer hackers are increasingly organized and sophisticated. Malicious attack efforts operate on a large-scale and sometimes offer targeted attacks as a paid for service. In addition, the techniques they use to access or sabotage networks change frequently and generally are not recognized until launched against a target. Use of open source code or other third-party software in our products and infrastructure could also result in increased cybersecurity risks. Our products may not anticipate new techniques quickly enough to protect against malicious attacks. If we fail to identify and respond to new and increasingly complex methods of attack and to update our products accordingly, we could be at risk of a cyberattack.
Other individuals or entities, including employees or vendors, may also intentionally or unintentionally provide unauthorized access to our IT environments or to our customers' IT environments.
As such, our IT networks and systems, and our products, may still be vulnerable to data theft, computer viruses, programming errors, attacks by third parties or similar problems. If we, or our customers using our products, were to experience a security breach or cyberattack, we could incur substantial costs and liabilities, including but not limited to, expenses attributable to rectifying the security breach or cyberattack including the cost of repairing any damage to our, or our customers' systems, liability for stolen assets or information, lost revenue and income resulting from any system or product downtime, increased costs for cybersecurity protection, and damage to our reputation causing customers and possibly investors to lose confidence in us. Similarly, an actual or perceived breach of our customers' network security allowing access to our customers' data centers or other parts of their IT environments, regardless of whether the breach is attributable to our products, may cause contractual disputes, result in damage to our reputation and could require significant expenditures of our capital and diversion of our resources from development efforts.
Because some of our products include SaaS offerings, and our customers who purchase these hosted products and solutions depend on us for reliable access to our solution, any significant disruption in our SaaS hosting network infrastructure could harm our reputation, result in early termination of customer agreements or loss of customers, and negatively affect our business.
Additionally, efforts by hackers or others could cause interruptions, delays or cessation of our product licensing, or modification of our software, which could cause us to lose existing or potential customers. If these efforts are successful and a third party obtains unauthorized access to our or our customers' IT environments, our business operations, and those of our customers could be adversely affected, losses or theft of data could occur, our reputation and future sales could be harmed, governmental regulatory action or private or governmental litigation could be commenced against us and our business, and our financial condition, operating results and cash flows could be materially adversely affected.
Our internal operations are dependent upon various information technology systems, and failures of or interruptions to those systems could harm our business.
Our business processes are dependent upon certain information technology systems, some of which are operated or hosted by third parties. In addition, in connection with integrating the acquired business units, we have reconfigured some of our IT systems or other business processes; these efforts have been time-consuming and costly.
20
If any of these systems fail or are interrupted, or if our ability to connect to or interact with one or more networks is interrupted, our processes may function at a diminished level or not at all. This would harm our ability to ship products, which could negatively impact our relationships with our customers and partners and our financial results would likely be harmed.
Our reliance on sole source suppliers could adversely impact our business.
Specific components that are necessary for the hardware assembly of our instruments are obtained from separate sole source suppliers or a limited group of suppliers. These components include our network interface cards and proprietary hardware. Our reliance on sole or limited suppliers involves several risks, including a lack of control over the manufacturing process, inventory management and potential inability to obtain an adequate supply of required components and the inability to exercise control over pricing, quality and timely delivery of components. For most of our products, we do not have the internal manufacturing capabilities to meet our customers' demands. It is our practice to mitigate these risks by partnering with key suppliers, including distributors, to establish a variety of supply continuity practices. These practices may include, among other approaches, establishing buffer supply requiring suppliers to maintain adequate stocks of materials, bonding agreements with distributors, and use-based and kanban programs to set supply thresholds. We also enter into escrow arrangements for certain technologies. Where possible, we use widely-available off the shelf hardware and work with large suppliers with multiple factories and other risk management practices. However, failure of supply or failure to execute effectively on any of these programs could result in our inability to obtain adequate deliveries or the occurrence of any other circumstance that would require us to seek alternative sources of these components would impact our ability to ship our products on a timely basis. Moreover, if we are unable to continue to acquire from these suppliers on acceptable terms, or should any of these suppliers cease to supply us with components for any reason, we may not be able to identify and integrate an alternative source of supply in a timely fashion or at the same costs. Any transition to one or more alternate manufacturers would likely result in delays, operational problems and increased costs, and may limit our ability to deliver our products to our customers on time for such transition period. These risks could damage relationships with our current and prospective customers, cause shortfalls in expected revenue, and could materially and adversely impact our business, operating results and financial condition.
If we violate the U.S. Foreign Corrupt Practices Act or applicable anti-bribery laws in other countries, or if we fail to comply with U.S. export controls and government contracting laws, our business could be harmed.
We earn a significant portion of our total revenues from international sales. As a result, we must comply with complex foreign and U.S. laws and regulations, such as the U.S. Foreign Corrupt Practices Act, the U.K. Bribery Act and other local laws prohibiting corrupt payments to government officials and others, as well as anti-competition regulations.
The U.S. Foreign Corrupt Practices Act (FCPA), which continues to see increased enforcement in recent years, generally prohibits U.S. companies and their intermediaries from making corrupt payments to foreign officials for the purpose of obtaining or keeping business or otherwise obtaining favorable treatment and requires companies to maintain appropriate record-keeping and internal accounting practices to accurately reflect the transactions of the company. Under the FCPA, U.S. companies may be held liable for actions taken by agents or local partners or representatives. In addition, regulators may seek to hold us liable for successor liability FCPA violations committed by companies which we acquire. We are also subject to the U.K. Bribery Act and may be subject to certain anti-corruption laws of other countries in which we do business.
In addition to anti-bribery and anti-corruption laws, we are also subject to the export and re-export control laws of the U.S., including the U.S. Export Administration Regulations (EAR) and to U.S. government contracting laws, rules and regulations, and may be subject to government contracting laws of other countries in which we do business. If we or our distributors, resellers, agents, or other intermediaries fail to comply with the FCPA, the EAR or U.S. government contracting laws, or the anti-corruption, export or governmental contracting laws of other countries, governmental authorities in the U.S. or other countries could seek to impose civil and/or criminal penalties, which could have a material adverse effect on our business, results of operations, financial conditions and cash flows.
Violations of these laws and regulations could result in fines and penalties, criminal sanctions, restrictions on our business conduct and on our ability to offer our products and services in one or more countries. Such violations could also adversely affect our reputation with existing and prospective clients, which could negatively impact our operating results and growth prospects.
The failure to recruit and retain qualified personnel and plan for and manage the succession of key executives could hinder our ability to successfully manage our business, which could have a material adverse effect on our financial position and operating results.
We operate in businesses where there is intense competition for experienced personnel in all of our global markets and have, in some instances, experienced attrition of our employees to direct and indirect competitors. We depend on our ability to
21
identify, recruit, hire, train, develop and retain qualified and effective professionals and to attract and retain talent needed to execute our business strategy. Our future success depends in large part upon our ability to attract, train, motivate and retain highly skilled employees, particularly executives, sales and marketing personnel, software engineers, and technical support personnel. The complexity of our products, processing functionality, software systems and services requires highly trained professionals. While we presently have a sophisticated, dedicated and experienced team of employees who have a deep understanding of our business lines, the labor market for these individuals has historically been very competitive due to the limited number of people available with the necessary technical skills and understanding. If we are unable to attract and retain the highly skilled technical personnel that are integral to our sales, marketing, product development and technical support teams, the rate at which we can generate sales and develop new products or product enhancements may be limited. This inability could have a material and adverse impact on our business, operating results and financial condition.
In addition, we must maintain and periodically increase the size of our sales force in order to increase our direct sales and support our indirect sales channels. Because our products are very technical, sales people require a comparatively long period of time to become productive, typically three to twelve months. This lag in productivity, as well as the challenge of attracting qualified candidates, may make it difficult to meet our sales force growth targets. Further, we may not generate sufficient sales to offset the increased expense resulting from growing our sales force. If we are unable to maintain and periodically expand our sales capability, our business, operating results and financial condition could be materially and adversely impacted.
Loss of key personnel could adversely impact our business. Our future success depends to a significant degree on the skills, experience and efforts of Anil Singhal, our President, Chief Executive Officer, and co-founder, and our other key executive officers and senior managers to work effectively as a team. Effective succession planning is also important for our long-term success. Failure to ensure effective transfers of knowledge and smooth transitions involving key employees could hinder our strategic planning and execution. The loss of one or more of our key personnel could have a material and adverse impact on our business, operating results and financial condition. We must, therefore, plan for and manage the succession of key executives due to retirement, illness or competitive offers elsewhere.
We have assumed certain non-U.S. pension benefit obligations associated with the Communications Business. Future funding obligations related to these liabilities could restrict cash available for our operations, capital expenditures or other requirements, or require us to borrow additional funds.
As part of the Comms Transaction, we assumed certain unfunded non-U.S. pension obligations related to non-U.S. employees of the Communications Business. While we intend to comply with any future funding obligations for our non-U.S. pension benefit plans through the use of cash from operations, there can be no assurance that we will generate enough cash to do so and also meet our other required or intended cash uses. Our inability to fund these obligations through cash from operations could require us to seek funding from other sources, including through additional borrowings, which could materially increase our outstanding debt or debt service requirements.
Our success depends, in part, on our ability to manage and leverage our distribution channels. Disruptions to, or our failure to effectively develop and manage, these partners and the processes and procedures that support them could adversely affect our ability to generate revenues from the sale of our products and services. Managing these distribution channels and relationships requires experienced personnel, and lack of sufficient expertise could lead to the decrease of the sales of our products and services and our operating results could suffer.
To increase our sales we need to continue to enhance our indirect sales efforts, to continue to manage and expand these existing distribution channels and to develop new indirect distribution channels. Our channel partners have no obligation to purchase any products from us. Some of our distribution and channel partners sell competitive products and services and the loss of, or reduction in sales by, these partners could materially reduce our revenues. In addition, they could internally develop products that compete with our solutions or partner with our competitors or bundle or resell competitors' solutions, possibly at lower prices. The potential inability to develop relationships with new partners in new markets, expand and manage our existing partner relationships, the unwillingness of our partners to market and sell our products effectively or the loss of existing partnerships could have a material and adverse impact on our business, operating results and financial condition. Our international operations, including our operations in the United Kingdom, mainland Europe, India, Asia-Pacific and other regions, are generally also subject to the risk of longer sales cycles through our international distribution channels. Sales to customers outside the United States accounted for 41%, 38%, and 29% of our total revenue for the fiscal years ended March 31, 2018, 2017 and 2016, respectively.
Our future success will likely require us to maintain and increase the number and depth of our relationships with distributors and channel partners and to leverage those relationships to expand our distribution channels and increase revenue. The need to develop such relationships can be particularly acute in areas outside of the U.S. Recruiting and retaining qualified
22
channel partners and training them in the use of our technology and services and ensuring that they comply with our legal and ethical expectations requires significant time and resources.
Our failure to maintain and increase the number and quality of relationships with channel partners, and any inability to successfully execute on the partnerships we initiate, could significantly impede our revenue growth prospects in the short and long term.
Our success depends, in part, on our ability to manage our international research and development operations and related partnerships. Our international research and development efforts may achieve delayed or lower than expected benefits and involve competitive and other risks.
We must continue to enhance our existing products and introduce new products in order to keep up with rapid technological change. Our international research and development teams play a critical role in these efforts. We must attract, train, motivate and retain our international research and development team members. To maintain this stable international employee research and development talent, we believe we must provide our international engineers with compelling and strategically significant work, coupled with technical and architectural ownership of their respective development projects. We must develop the leaders of these international teams, while ensuring their frequent inclusion and participation in corporate strategic and operational planning. We are likely to recognize the costs associated with these investments earlier than some of the anticipated benefits, and the return on these investments may be lower, or may develop more slowly, than we expect. These development efforts also involve risks, including, knowledge transfer issues related to our technology and resulting exposure to misappropriation of intellectual property or information that is proprietary to us, heightened exposure to economic, security and political conditions abroad, and exchange rate and tax compliance issues. The risks related to our research and development efforts abroad could increase our expenses, impair our development efforts, harm our competitive position and/or damage our reputation. If we do not achieve the benefits anticipated from these investments, or if the achievement of these benefits is delayed, our operating results may be adversely affected.
Necessary licenses for third-party technology may not be available to us or may be very expensive.
We currently and will in the future license technology from third parties that we use to produce or embed in our products. While we have generally been able to license required third-party technology to date, third-party licenses required in the future may not be available to us on commercially reasonable terms or at all. Third parties who hold exclusive rights to technology that we seek to license may include our competitors. If we are unable to obtain any necessary third-party licenses, we would be required to redesign our product or obtain substitute technology, which may not perform as well, be of lower quality or be more costly. The loss of these licenses or the inability to maintain any of them on commercially acceptable terms could delay development of future products or the enhancement of existing products. We may also choose to pay a premium price for such a license in certain circumstances where continuity of the licensed product would outweigh the premium cost of the license. The unavailability of these licenses or the necessity of agreeing to commercially unreasonable terms for such licenses could materially adversely affect our business, financial condition, operating results and cash flows.
Our success depends on our ability to protect our intellectual property rights.
Our business is heavily dependent on our intellectual property. We rely upon a combination of patent, copyright, trademark and trade secret laws and registrations and non-disclosure and other contractual and license arrangements to protect our intellectual property rights. The reverse engineering, unauthorized copying, or other misappropriation of our intellectual property could enable third parties to benefit from our technology without compensating us. Furthermore, the laws of some foreign jurisdictions do not offer the same protections for our proprietary rights as the laws of the United States, and we may be subject to unauthorized use of our products in those countries. Legal proceedings to enforce our intellectual property rights could be burdensome and expensive and could involve a high degree of uncertainty. In addition, legal proceedings may divert management's attention from growing our business. There can be no assurance that the steps we have taken to protect our intellectual property rights will be adequate to deter misappropriation of proprietary information, or that we will be able to detect unauthorized use by third parties and take appropriate steps to enforce our intellectual property rights. The unauthorized copying or use of our products or proprietary information could result in reduced sales of our products and eventually harm our operating results.
Others may claim that we infringe on their intellectual property rights.
From time to time we have been and may continue to be subject to claims by others that our products infringe on their intellectual property rights, patents, copyrights or trademarks. In some cases, we may have agreed to indemnify our customers and partners if our products or technology infringe or misappropriate specified third party intellectual property rights; therefore, we could become involved in litigation or claims brought against our customers or partners if our products or technology are
23
the subject of such allegations. These claims, whether or not valid, could require us to spend significant sums in litigation, pay damages or royalties, delay product shipments, reengineer our products, rename our products and rebuild name recognition or acquire licenses to such third-party intellectual property. We may not be able to secure any required licenses on commercially reasonable terms or secure them at all. Any of these claims or resulting events could have a material and adverse impact on our business, operating results and financial condition.
Uncertainties of regulation of the Internet and data traveling over the Internet could have a material and adverse impact on our financial condition and results of operations.
Currently, few laws or regulations apply directly to access to or commerce conducted on the Internet. We could be materially adversely affected by regulation of the Internet and Internet commerce in any country where we operate. Further, governments may regulate or restrict the sales, licensing, distribution, and export or import of certain technologies to certain countries. The adoption of regulation of the Internet and Internet commerce could decrease demand for our products and, at the same time, increase the cost of selling our products, which could have a material and adverse effect on our financial condition and results of operations.
The enactment of new privacy laws and regulations in the jurisdictions in which we do business could require significant company resources or limit the way our customers can use our products.
The enactment of new federal, state, or foreign data privacy laws and regulations could cause customers not to be able to take advantage of all the features or capabilities of our products which in turn could reduce demand for certain of our products. In addition, changes in international privacy laws have required an adjustment to some of our internal processes and significant resources in the past and future changes could require similar efforts and resources with regard to compliance. The adoption of or changes to any such data privacy laws and regulations could affect demand for our products, increase the cost of selling our products and divert time and attention of our management, all of which could have a material and adverse effect on our financial condition and results of operations.
International data protection laws and regulations often are more restrictive than those in the United States and are rapidly evolving. The European Union (EU) data protection law, the General Data Protection Regulation (GDPR), which will become effective in May 2018, is wide-ranging in scope. In order to adapt to these new requirements, we are investing resources necessary to enhance our policies and controls across our business units and services relating to how we collect and use personal data from customers and employees and how vendors handle personal data we provide to them. Additionally, we expect that the international transfer of personal data will present ongoing compliance challenges and complicate our business transactions as we negotiate and implement suitable arrangements with international customers and international and domestic vendors.
We or our suppliers may be impacted by new regulations related to climate change or other environmental issues.
We or our suppliers may become subject to new laws enacted with regards to climate change or other environmental issues. In the event that new laws are enacted or current laws are modified in countries in which we or our suppliers operate, our flow of product may be impacted which could have a material and adverse effect on our financial condition and results of operations.
The current economic and geopolitical environment may impact some specific industries into which we sell and may lead our customers to delay or forgo technology investments and could have other impacts, any of which could materially adversely affect our business, financial condition, operating results and cash flows.
Many of our customers are concentrated in certain industries, including financial services, public sector, healthcare, and the service provider market segment. Certain industries may be more acutely affected by economic, geopolitical and other factors than other sectors. Our public sector customers are affected by federal, state and local budget decisions. To the extent that one or more of the sectors in which our customer base operates is adversely impacted, whether as a result of general conditions affecting all sectors or as a result of conditions affecting only those particular sectors, our business, financial condition and results of operations could be materially and adversely impacted. If companies in our target markets reduce capital expenditures, we may experience a reduction in sales, longer sales cycles, slower adoption of new technologies as well as downward pressure on the price of our products.
24
International economic, political, legal, compliance and business factors could negatively affect our financial statements and growth.
The Communications Business historically derived significant sales from customers outside the U.S. and certain manufacturing operations, suppliers and employees of the Communications Business are located outside the U.S. We expect to continue to increase our sales and presence outside the U.S., particularly in the high-growth markets. Our international business (and particularly our business in high-growth markets) is subject to risks that are customarily encountered in non-U.S. operations, any of which could negatively affect our business, financial condition and results of operations.
The success of our business depends, in part, on the continued growth in the market for and the continued commercial demand for service delivery, service assurance and network security solutions focused on the performance monitoring and management of applications and networks.
We derive nearly all of our revenue from the sale of products and services that are designed to allow our customers to assure the delivery of services through management of the performance and network security of applications across IP networks. We have actively expanded our operations in the past through acquisitions and organic growth and may continue to expand them in the future in order to gain share in the evolving market in which we operate. Therefore, we must be able to predict the appropriate features and prices for future products to address the market, the optimal distribution strategy and the future changes to the competitive environment. In order for us to be successful, our potential customers must recognize the value of more sophisticated application management and network security solutions, decide to invest in the management of their networked applications and, in particular, adopt our management solutions. Any failure of this market to continue to be viable would materially and adversely impact our business, operating results and financial condition. Additionally, businesses may choose to outsource the operations and management of their networks to managed service providers. Our business may depend on our ability to continue to develop relationships with these service providers and successfully market our products to them.
Changes in industry structure and market conditions could lead to charges related to discontinuances of certain of our products or businesses and asset impairments.
In response to changes in industry and market conditions, we may be required to strategically reallocate managerial, operational, financial and other resources. Any such efforts may result in charges related to consolidation of excess facilities or claims from third parties who were resellers or users of discontinued products.
Our growth could suffer if the markets into which we sell our products and services experience cyclicality.
Our growth will depend in part on the growth of the markets which the Company serves. The Company serves certain industries that have historically been cyclical and have experienced periodic downturns that have had a material adverse impact on demand for the products, software and services that the Company offers. Any of these factors could adversely affect the business, financial condition and results of operations of the combined company in any given period.
Uncertain conditions in the global economy and constraints in the global credit market may adversely affect our revenue and results of operations.
Disruptions in the global economy and constraints in the global credit market may cause some of our customers to reduce, delay, or cancel spending on capital and technology projects, resulting in reduced spending with us. While some industry sectors such as government and telecommunications may be less susceptible to the effects of an economic slowdown, our enterprise customers may be adversely affected, especially in financial services and consumer industries. Continued volatility in, or disruption of financial markets could limit customers' ability to obtain adequate financing to maintain operations and result in a decrease in sales volume that could have a negative impact on our results of operations. Further, competitors may respond to economic conditions by lowering their prices, which could put pressure on our pricing. We could also experience lower than anticipated order levels, cancellations of orders in backlog, defaults on outstanding accounts receivable and extended payment or delivery terms. Economic weakness, customer financial difficulties and constrained spending on IT initiatives have resulted, and may in the future result, in challenging and delayed sales cycles and could negatively impact our ability to forecast future periods. In addition, some of the markets we serve are emerging and the purchase of our products involves material changes to established purchasing patterns and policies. The purchase of our products is often discretionary and may involve a significant commitment of capital and other resources.
25
The price of our common stock may fluctuate with market volatility.
The market price of our common stock has been volatile and may continue to fluctuate in response to a number of factors, some of which are beyond our control. The stock market in general, and the market prices of stocks of technology companies in particular, have experienced extreme price volatility that has adversely affected, and may continue to adversely affect, the market price of our common stock for reasons unrelated to our business or operating results. Broad market fluctuations could adversely affect the market price of our common stock, which in turn could cause impairment of goodwill that could materially and adversely impact our financial condition and results of operations. In addition, the stock market in general, and the market prices of stock of publicly-traded technology companies in particular, have experienced significant volatility that often has been unrelated to the operating performance of such companies.
It is not uncommon when the market price of a stock has been volatile for holders of that stock to institute securities class action litigation against the company that issues that stock. If any of our stockholders brought such a lawsuit against us, even if the lawsuit is without merit, we could incur substantial costs defending the lawsuit beyond any insurance coverage which we may have for such risks. Such a lawsuit could also divert the time and attention of our management. Any of these events, as well as other circumstances discussed in these Risk Factors, may cause the price of our common stock to fall.
Item 1B. Unresolved Staff Comments
None.
Item 2. Properties
We currently lease approximately 175,000 square feet of property in an office building in Westford, Massachusetts where our headquarters is located. The current lease will expire in September 2030, and we have an option to extend the lease for two additional five-year terms. We maintain offices in several other locations in the United States, including in or near the following cities: Berkeley, Manhattan Beach and San Jose, California; Colorado Springs, Colorado; Atlanta, Georgia; Saint Charles, Illinois; Elliott City and Rockville, Maryland; Burlington, Massachusetts; Ann Arbor, Michigan; Marlton, New Jersey; Allen, Austin and Plano, Texas; American Fork, Utah; Reston, Virginia and Everett, Washington.
We also maintain offices in or near the following cities outside the United States: Brisbane, Melbourne and Sydney, Australia; Vienna, Austria; Sao Paulo, Brazil; Brossard and Waterloo, Canada; Beijing, Guangzhou, Shanghai, and Wanchai, China; Brno, Czech Republic; Boulogne - Billancourt, and Massy, France; Berlin, Munich, and Schwalbach Germany; Bangalore, Mumbai, Noida, and Pune, India; Jakarta, Indonesia; Dublin, Ireland; Modena and Padua, Italy; Tokyo, Japan; Seoul, Korea; Kuala Lumpur, Malaysia; Mexico City, Mexico; Rabat, Morocco; Eindhoven, the Netherlands; Makati City, Philippines; Singapore; Madrid, Spain; Stockholm, Sweden; Taipei, Taiwan; Bangkok, Thailand; Dubai, United Arab Emirates; and Bracknell and Ipswich, United Kingdom.
All of our facilities are leased. We believe our facilities are sufficient to meet our needs for the foreseeable future and, if needed, additional space will be available at a reasonable cost.
26
Item 3. Legal Proceedings
From time to time, NetScout is subject to legal proceedings and claims in the ordinary course of business. In the opinion of management, the amount of ultimate expense with respect to any current legal proceedings and claims, if determined adversely, will not have a material adverse effect on the Company’s financial condition, results of operations or cash flows.
As previously disclosed, in March 2016, Packet Intelligence LLC (“Packet Intelligence” or “Plaintiff”) filed a Complaint against NetScout and two subsidiary entities in the United States District Court for the Eastern District of Texas asserting infringement of five United States patents. Plaintiff’s Complaint alleged that legacy Tektronix GeoProbe products, including the G10 and GeoBlade products, infringed these patents. NetScout filed an Answer denying Plaintiff’s allegations and asserting that Plaintiff’s patents were, among other things, invalid, not infringed, and unenforceable due to inequitable conduct. In October 2017, a jury trial was held to address the parties’ claims and counterclaims regarding infringement of three patents by the G10 and GeoBlade products, invalidity of these patents, and damages. On October 13, 2017, the jury rendered a verdict finding in favor of the Plaintiff and that Plaintiff was entitled to $3,500,000 for pre-suit damages and $2,250,000 for post-suit damages. The jury indicated that the awarded damages amounts were intended to reflect a running royalty. The Court also conducted a bench trial on whether these patents were unenforceable due to, among other things, inequitable conduct. The Court has not yet rendered a decision on the equitable issues or entered final judgment in this matter. NetScout has concluded that the risk of loss from this matter is currently neither remote nor probable, and therefore, under U.S. GAAP definitions, the risk of loss is termed "reasonably possible". Therefore, accounting rules require NetScout to provide an estimate for the range of potential liability. Netscout currently estimates that the estimated range of liability is between $0 and the aggregate amount awarded by the jury, plus potential additional pre- and post-judgment interest amounts, subject to other adjustments that the Court may make. NetScout intends to continue to vigorously dispute Packet Intelligence’s claims including through appeal, if necessary.
Item 4. Mine Safety Disclosures
None.
27
PART II
Item 5. Market for Registrant's Common Equity, Related Stockholder Matters and Issuer Purchases of Equity Securities
Price Range of Common Stock
Our common stock trades on the Nasdaq Global Select Market, under the symbol NTCT. The following table sets forth, for the periods indicated, the high and low intraday sales prices for our common stock. Such information reflects inter-dealer price, without retail mark-up, markdown or commission and may not represent actual transactions.
Quarter Ended | High | Low | ||||||
Fiscal Year 2017 | ||||||||
June 30, 2016 | $ | 25.33 | $ | 20.99 | ||||
September 30, 2016 | $ | 30.31 | $ | 21.46 | ||||
December 31, 2016 | $ | 33.83 | $ | 26.25 | ||||
March 31, 2017 | $ | 38.45 | $ | 29.50 | ||||
Fiscal Year 2018 | ||||||||
June 30, 2017 | $ | 38.48 | $ | 32.25 | ||||
September 30, 2017 | $ | 36.80 | $ | 31.70 | ||||
December 31, 2017 | $ | 33.50 | $ | 27.65 | ||||
March 31, 2018 | $ | 31.60 | $ | 25.33 | ||||
Stockholders
At May 7, 2018, we had 110 stockholders of record. We believe that the number of beneficial holders of our common stock exceeds 20,000.
Stock Performance Graph
This performance graph shall not be deemed "filed" for purposes of Section 18 of the Exchange Act or otherwise subject to the liabilities under that Section, and shall not be deemed to be incorporated by reference into any filing of NetScout under the Exchange Act or the Securities Act of 1933, as amended.
The Stock Performance Graph set forth below compares the yearly change in the cumulative total stockholder return on our common stock during the five-year period from March 31, 2013 through March 31, 2018 with the cumulative total return of the Nasdaq Composite Index and the Nasdaq Computer & Data Processing Index. The comparison assumes $100 was invested on March 31, 2013 in our common stock or in the Nasdaq Composite Index and the Nasdaq Computer & Data Processing Index and assumes reinvestment of dividends, if any.
The stock price performance shown on the graph below is not necessarily indicative of future price performance. Information used in the graph was obtained from Zacks Investment Research, Inc.
28
COMPARISON OF 5 YEAR CUMULATIVE TOTAL RETURN
Assumes Initial Investment of $100
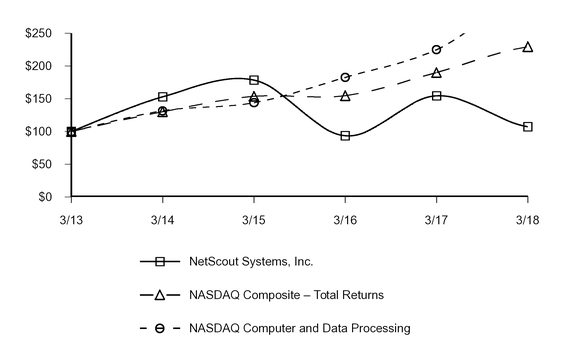
3/31/2013 | 3/31/2014 | 3/31/2015 | 3/31/2016 | 3/31/2017 | 3/31/2018 | ||||||||||||||||||
NetScout Systems, Inc. | $ | 100.00 | $ | 152.95 | $ | 178.47 | $ | 93.49 | $ | 154.46 | $ | 107.24 | |||||||||||
Nasdaq Composite – Total Returns | $ | 100.00 | $ | 130.18 | $ | 153.76 | $ | 154.62 | $ | 189.99 | $ | 229.43 | |||||||||||
Nasdaq Computer and Data Processing | $ | 100.00 | $ | 131.59 | $ | 143.96 | $ | 182.68 | $ | 225.02 | $ | 308.32 | |||||||||||
Dividend Policy
In fiscal years 2018 and 2017, we did not declare any cash dividends and do not anticipate declaring cash dividends in the foreseeable future. In addition, the terms of our credit facility limit our ability to pay cash dividends on our capital stock. It is our intention to retain all future earnings for reinvestment to fund our expansion and growth, as well as for our stock buyback program further described under Item 7 "Liquidity and Capital Resources." Any future cash dividend declaration will be at the discretion of our Board of Directors and will depend upon, among other things, our future earnings, general financial conditions, capital requirements, existing bank covenants and general business conditions.
29
Purchases of Equity Securities by the Issuer
The following table provides information about purchases we made during the quarter ended March 31, 2018 of equity securities that are registered by us pursuant to Section 12 of the Exchange Act:
Total Number of Shares Purchased(1) | Average Price Paid per Share | Total Number of Shares Purchased as Part of Publicly Announced Plans or Programs (2) | Maximum Number of Shares That May Yet be Purchased Under the Program | |||||||||
1/1/2018 - 1/31/2018 | — | $ | — | — | 25,970,650 | |||||||
2/1/2018 - 2/28/2018 | 7,409,951 | 28.60 | 7,387,862 | 18,582,788 | ||||||||
3/1/2018 - 3/31/2018 | 554 | 30.36 | — | 18,582,788 | ||||||||
Total | 7,410,505 | $ | 28.60 | 7,387,862 | 18,582,788 | |||||||
(1) | We purchased an aggregate of 22,643 shares transferred to us from employees in satisfaction of minimum tax withholding obligations associated with the vesting of restricted stock units during the period. Such purchases reflected in the table do not reduce the maximum number of shares that may be purchased under our previously announced stock repurchase program (our previously disclosed 25 million share repurchase program). |
(2) | On February 1, 2018, we entered into accelerated share repurchase (ASR) agreements with two third-party financial institutions (the Dealers) to repurchase an aggregate of $300 million of our common stock via accelerated stock repurchase transactions under our previously disclosed 20 million and 25 million share repurchase programs. We borrowed $300 million under our Amended Credit Agreement to finance the payment of the initial purchase price to each of the Dealers. Under the terms of the ASR, we made a $150 million payment to each of the Dealers on February 2, 2018, and received an initial delivery of 3,693,931 shares from each of the Dealers, or 7,387,862 shares in the aggregate, which is approximately 70 percent of the total number of shares of our common stock expected to be repurchased under the ASR. As part of this purchase, 970,650 shares for $27.6 million were deducted under the 20 million share repurchase program and 6,417,212 shares for $182.4 million were deducted under the 25 million share repurchase program. The final number of shares to be repurchased is dependent upon the average of the daily volume-weighted average prices of our common stock during the term of the ASR, less a discount and subject to adjustments pursuant to the terms and conditions of the ASR. The delivery of additional shares of common stock to us or an additional delivery of shares of common stock or a cash payment, at our election, by NetScout to the Dealers may be required. The final settlement of each of the ASR transactions is expected to occur no later than the end of the second quarter of fiscal year 2019. |
30
Item 6. Selected Financial Data
SELECTED CONSOLIDATED FINANCIAL DATA
The selected consolidated financial data set forth below should be read in conjunction with our audited consolidated financial statements and notes thereto and "Management’s Discussion and Analysis of Financial Condition and Results of Operations" included under Item 7 of this Annual Report on Form 10-K. The consolidated statement of operations data for the fiscal years ended March 31, 2018, 2017 and 2016 and the consolidated balance sheet data at March 31, 2018 and 2017 are derived from audited consolidated financial statements included under Item 8 of this Annual Report on Form 10-K. The consolidated statement of operations data for the fiscal years ended March 31, 2015 and 2014 and the consolidated balance sheet data at March 31, 2016, 2015 and 2014 have been derived from audited consolidated financial statements of NetScout that do not appear in this Annual Report on Form 10-K. The historical results are not necessarily indicative of the operating results to be expected in the future.
Year Ended March 31, | |||||||||||||||||||
2018 | 2017 | 2016 (1) | 2015 | 2014 | |||||||||||||||
(In thousands, except per share data) | |||||||||||||||||||
Statement of Operations Data: | |||||||||||||||||||
Revenue: | |||||||||||||||||||
Product | $ | 546,127 | $ | 735,531 | $ | 633,408 | $ | 272,895 | $ | 234,268 | |||||||||
Service | 440,660 | 426,581 | 322,011 | 180,774 | 162,379 | ||||||||||||||
Total revenue | 986,787 | 1,162,112 | 955,419 | 453,669 | 396,647 | ||||||||||||||
Cost of revenue: | |||||||||||||||||||
Product | 164,526 | 238,002 | 238,037 | 59,037 | 51,219 | ||||||||||||||
Service | 107,379 | 108,137 | 90,412 | 35,524 | 33,294 | ||||||||||||||
Total cost of revenue | 271,905 | 346,139 | 328,449 | 94,561 | 84,513 | ||||||||||||||
Gross profit | 714,882 | 815,973 | 626,970 | 359,108 | 312,134 | ||||||||||||||
Operating expenses: | |||||||||||||||||||
Research and development | 215,076 | 232,701 | 208,630 | 75,242 | 70,454 | ||||||||||||||
Sales and marketing | 312,536 | 328,628 | 293,335 | 136,446 | 129,611 | ||||||||||||||
General and administrative | 109,479 | 118,438 | 117,714 | 47,296 | 30,623 | ||||||||||||||
Amortization of acquired intangible assets | 76,640 | 70,141 | 32,373 | 3,351 | 3,432 | ||||||||||||||
Restructuring charges | 5,209 | 4,001 | 468 | — | — | ||||||||||||||
Total operating expenses | 718,940 | 753,909 | 652,520 | 262,335 | 234,120 | ||||||||||||||
Income (loss) from operations | (4,058 | ) | 62,064 | (25,550 | ) | 96,773 | 78,014 | ||||||||||||
Interest and other expense, net | (14,601 | ) | (9,879 | ) | (6,889 | ) | (1,808 | ) | (158 | ) | |||||||||
Income (loss) before income tax expense (benefit) | (18,659 | ) | 52,185 | (32,439 | ) | 94,965 | 77,856 | ||||||||||||
Income tax expense (benefit) | (98,471 | ) | 18,894 | (4,070 | ) | 33,773 | 28,750 | ||||||||||||
Net income (loss) | $ | 79,812 | $ | 33,291 | $ | (28,369 | ) | $ | 61,192 | $ | 49,106 | ||||||||
Basic net income (loss) per share | $ | 0.91 | $ | 0.36 | $ | (0.35 | ) | $ | 1.49 | $ | 1.19 | ||||||||
Diluted net income (loss) per share | $ | 0.90 | $ | 0.36 | $ | (0.35 | ) | $ | 1.47 | $ | 1.17 | ||||||||
Weighted average common shares outstanding used in computing: | |||||||||||||||||||
Net income (loss) per share—basic | 87,425 | 92,226 | 81,927 | 41,105 | 41,366 | ||||||||||||||
Net income (loss) per share—diluted | 88,261 | 92,920 | 81,927 | 41,637 | 41,955 | ||||||||||||||
(1) | During the fiscal year ended March 31, 2016, NetScout completed the Comms Transaction. The total equity consideration was approximately $2.3 billion based on issuing approximately 62.5 million new shares of NetScout common stock. |
31
March 31, | |||||||||||||||||||
2018 | 2017 | 2016 (1) | 2015 | 2014 | |||||||||||||||
(In thousands) | |||||||||||||||||||
Balance Sheet Data: | |||||||||||||||||||
Cash, cash equivalents and short- and long-term marketable securities | $ | 447,762 | $ | 464,705 | $ | 352,075 | $ | 264,857 | $ | 218,794 | |||||||||
Working capital | $ | 339,108 | $ | 394,279 | $ | 283,422 | $ | 149,651 | $ | 115,798 | |||||||||
Total assets | $ | 3,368,608 | $ | 3,601,513 | $ | 3,592,843 | $ | 669,049 | $ | 607,763 | |||||||||
Debt | $ | 600,000 | $ | 300,000 | $ | 300,000 | $ | — | $ | — | |||||||||
Total stockholders’ equity | $ | 2,068,782 | $ | 2,436,250 | $ | 2,443,382 | $ | 435,750 | $ | 409,161 | |||||||||
(1) | During the fiscal year ended March 31, 2016, NetScout completed the Comms Transaction. The total equity consideration was approximately $2.3 billion based on issuing approximately 62.5 million new shares of NetScout common stock. |
Item 7. Management's Discussion and Analysis of Financial Condition and Results of Operations
The following information should be read in conjunction with the audited consolidated financial information and the notes thereto included in this Annual Report on Form 10-K. In addition to historical information, the following discussion and other parts of this Annual Report contain forward-looking statements that involve risks and uncertainties. You should not place undue reliance on these forward-looking statements. Actual events or results may differ materially due to competitive factors and other factors discussed in Item 1A. "Risk Factors" and elsewhere in this Annual Report. These factors may cause our actual results to differ materially from any forward-looking statement. See the section titled "Cautionary Statement Concerning Forward-Looking Statements" that appears at the beginning of this Annual Report.
Overview
We are an industry leader for real-time operational intelligence and performance analytics that are used by customers worldwide to assure their digital business services against disruptions in availability, performance, and security. Service providers, enterprise and local, state and federal government agencies around the world rely on our solutions to achieve the visibility necessary to optimize network performance, ensure the delivery of high-quality, mission-critical applications and services, provide timely insight into the end user experience and protect the network from attack. Powered by our patented Adaptive Service Intelligence (ASI) technology, our solutions can instantaneously convert network traffic data, often referred to as wire data, into high-value metadata, or "smart data," that can be used by customers to help them identify network and application performance issues, defend their networks from distributed denial of service (DDoS) attacks, and rapidly find and isolate advanced network threats. With our offerings, customers can quickly, efficiently and effectively resolve issues that cause business disruptions, downtime, poor service quality or compromised security, thereby driving compelling returns on their investments in their network and broader information technology (IT) initiatives.
Our mission is to enable enterprise and service providers to realize maximum benefit with minimal risk from technology advances, such as internet protocol (IP) convergence, network function virtualization (NFV), software defined networking (SDN), virtualization, cloud, mobility and the Internet of Things (IoT) by managing the inherent complexity in a cost-effective manner. We have been a technology innovator for three-plus decades since our founding in 1984. Our solutions change how organizations manage and optimize the delivery of business applications and services, assure user experience across global IP networks and help protect networks from unwanted security threats. Through both internal development and acquisitions, we have continually enhanced and expanded our product portfolio to meet the evolving needs of customers worldwide. By using our products to capture and transform terabytes of network traffic data in real time into high value, actionable information, customers can optimize network performance, manage applications, enhance security and gain insight into the end user experience. Our solutions are typically deployed by customers as integrated hardware and software, as software only for use in commercial-off-the-shelf hardware or in a virtualized form factor.
Our operating results are influenced by a number of factors, including, but not limited to, the mix and quantity of products and services sold, pricing, costs of materials used in our products, growth in employee-related costs, including commissions, and the expansion of our operations. Factors that affect our ability to maximize our operating results include, but are not limited to, our ability to introduce and enhance existing products, the marketplace acceptance of those new or enhanced products, continued expansion into international markets, development of strategic partnerships, competition, successful
32
acquisition integration efforts, and our ability to achieve expense reductions and make structural improvements in the current economic conditions.
Results Overview
Total revenue for the fiscal year ended March 31, 2018 continued to be impacted by the ongoing moderation in spending by a large tier-one service provider, which represented greater than 10% of total revenue during the fiscal years ended March 31, 2017 and 2016 and is no longer spending at the same level. Additionally, the service provider capital spending environment remains under pressure, resulting in lower-than-anticipated and delayed orders for our service assurance products and, to a lesser extent, our distributed denial of service (DDoS) offerings. With our enterprise customers, we have experienced funding delays for certain projects with federal agency customers, lengthening sales cycles for both traditional and new products, and, to a lesser extent, softening demand for certain other ancillary product lines. We currently expect that many of these issues will impact revenue through the fiscal year 2019.
Our gross profit percentage increased by 2% percentage points during the fiscal year ended March 31, 2018 as compared with the fiscal year ended March 31, 2017.
Net income for the fiscal year ended March 31, 2018 was $79.8 million, as compared with net income for the fiscal year ended March 31, 2017 of $33.3 million, resulting in an increase in net income of $46.5 million.
NetScout's financial results for the fiscal year ended March 31, 2016 included approximately eight and one-half months of contribution from the Communications Business.
At March 31, 2018, we had cash, cash equivalents, and marketable securities of $447.8 million. This represents a decrease of $16.9 million over the previous fiscal year ended March 31, 2017. This decrease was primarily due to $501.3 million used to repurchase shares of our common stock, $15.9 million used for capital expenditures, $13.6 million for tax withholding on restricted stock units and $8.3 million used for the acquisition of Efflux. These decreases were partially offset by $294.6 million in proceeds from the issuance of long-term debt and $222.5 million in cash provided by operations during the fiscal year ended March 31, 2018.
Use of Non-GAAP Financial Measures
We supplement the United States generally accepted accounting principles (GAAP) financial measures we report in quarterly and annual earnings announcements, investor presentations and other investor communications by reporting the following non-GAAP measures: non-GAAP total revenue, non-GAAP product revenue, non-GAAP service revenue, non-GAAP gross profit, non-GAAP income from operations, non-GAAP operating margin, non-GAAP earnings before interest and other expense, income taxes, depreciation and amortization (EBITDA) from operations, non-GAAP EBIDTA from operations margin, non-GAAP net income, and non-GAAP net income per share (diluted). Non-GAAP revenue (total, product and service) eliminates the GAAP effects of acquisitions by adding back revenue related to deferred revenue revaluation, as well as revenue impacted by the amortization of acquired intangible assets. Non-GAAP gross profit includes the foregoing adjustments and also removes expenses related to the amortization of acquired intangible assets, stock-based compensation, certain expenses relating to acquisitions including depreciation costs, compensation for post-combination services and business development and integration costs. Non-GAAP income from operations includes the foregoing adjustments and also removes restructuring charges and costs related to new accounting standard implementation. Non-GAAP operating margin is calculated based on the non-GAAP financial metrics discussed above. Non-GAAP EBITDA from operations includes the aforementioned items related to non-GAAP income from operations and also removes non-acquisition-related depreciation expense. Non-GAAP net income includes the foregoing adjustments and also removes expenses and or benefit related to share-based compensation and certain expenses relating to acquisitions including: compensation for post-combination services, business development charges, and depreciation expense, net of related income tax effects in addition to the provisional one-time impacts of the U.S. Tax Cuts and Jobs Act. Non-GAAP diluted net income per share also excludes these expenses as well as the related impact of all these adjustments on the provision for income taxes.
These non-GAAP measures are not in accordance with GAAP, should not be considered an alternative for measures prepared in accordance with GAAP (revenue, gross profit, operating profit, net income (loss) and diluted net income (loss) per share), and may have limitations in that they do not reflect all our results of operations as determined in accordance with GAAP. These non-GAAP measures should only be used to evaluate our results of operations in conjunction with the corresponding GAAP measures. The presentation of non-GAAP information is not meant to be considered superior to, in isolation from, or as a substitute for results prepared in accordance with GAAP.
Management believes these non-GAAP financial measures enhance the reader's overall understanding of our current financial performance and our prospects for the future by providing a higher degree of transparency for certain financial measures and providing a level of disclosure that helps investors understand how we plan and measure our business. We believe
33
that providing these non-GAAP measures affords investors a view of our operating results that may be more easily compared with our peer companies and also enables investors to consider our operating results on both a GAAP and non-GAAP basis during and following the integration period of our acquisitions. Presenting the GAAP measures on their own may not be indicative of our core operating results. Furthermore, management believes that the presentation of non-GAAP measures when shown in conjunction with the corresponding GAAP measures provide useful information to management and investors regarding present and future business trends relating to our financial condition and results of operations.
The following table reconciles revenue, gross profit, income (loss) from operations, net income (loss) and net income (loss) per share on a GAAP and non-GAAP basis for the fiscal years ended March 31, 2018, 2017 and 2016:
Fiscal Year Ended March 31, (Dollars in Thousands, Except per Share Data) | |||||||||||
2018 | 2017 | 2016 | |||||||||
GAAP revenue | $ | 986,787 | $ | 1,162,112 | $ | 955,419 | |||||
Product deferred revenue fair value adjustment | 3,064 | 6,786 | 10,166 | ||||||||
Service deferred revenue fair value adjustment | 9,409 | 19,476 | 51,625 | ||||||||
Delayed transfer entity adjustment | — | — | 633 | ||||||||
Amortization of acquired intangible assets | 9 | 11,439 | 6,746 | ||||||||
Non-GAAP revenue | $ | 999,269 | $ | 1,199,813 | $ | 1,024,589 | |||||
GAAP gross profit | $ | 714,882 | $ | 815,973 | $ | 626,970 | |||||
Product deferred revenue fair value adjustment | 3,064 | 6,786 | 10,166 | ||||||||
Service deferred revenue fair value adjustment | 9,409 | 19,476 | 51,625 | ||||||||
Inventory fair value adjustment | — | — | 28,638 | ||||||||
Delayed transfer entity adjustment | — | — | 535 | ||||||||
Share-based compensation expense | 5,983 | 4,890 | 3,246 | ||||||||
Amortization of acquired intangible assets | 37,332 | 53,455 | 51,873 | ||||||||
Business development and integration expense | 244 | 398 | 1,401 | ||||||||
Compensation for post-combination services | — | 552 | 4,148 | ||||||||
Acquisition related depreciation expense | 145 | 240 | 293 | ||||||||
Non-GAAP gross profit | $ | 771,059 | $ | 901,770 | $ | 778,895 | |||||
GAAP income (loss) from operations | $ | (4,058 | ) | $ | 62,064 | $ | (25,550 | ) | |||
Product deferred revenue fair value adjustment | 3,064 | 6,786 | 10,166 | ||||||||
Service deferred revenue fair value adjustment | 9,409 | 19,476 | 51,625 | ||||||||
Inventory fair value adjustment | — | — | 28,638 | ||||||||
Delayed transfer entity adjustment | — | — | 383 | ||||||||
Share-based compensation expense | 47,317 | 39,189 | 28,351 | ||||||||
Amortization of acquired intangible assets | 113,972 | 123,596 | 84,246 | ||||||||
Business development and integration expense | 2,689 | 12,083 | 29,434 | ||||||||
New standard implementation expense | 2,630 | — | — | ||||||||
Compensation for post-combination services | 1,108 | 5,076 | 35,118 | ||||||||
Restructuring charges | 5,209 | 4,001 | 468 | ||||||||
Acquisition related depreciation expense | 2,057 | 3,136 | 3,898 | ||||||||
Non-GAAP income from operations | $ | 183,397 | $ | 275,407 | $ | 246,777 | |||||
GAAP net income (loss) | $ | 79,812 | $ | 33,291 | $ | (28,369 | ) | ||||
Product deferred revenue fair value adjustment | 3,064 | 6,786 | 10,166 | ||||||||
Service deferred revenue fair value adjustment | 9,409 | 19,476 | 51,625 | ||||||||
34
Inventory fair value adjustment | — | — | 28,638 | ||||||||
Share-based compensation expense | 47,317 | 39,189 | 28,351 | ||||||||
Amortization of acquired intangible assets | 113,972 | 123,596 | 84,246 | ||||||||
Business development and integration expense | 2,689 | 12,083 | 29,434 | ||||||||
New standard implementation expense | 2,630 | — | — | ||||||||
Compensation for post-combination services | 1,108 | 5,076 | 35,118 | ||||||||
Restructuring charges | 5,209 | 4,001 | 468 | ||||||||
Loss on extinguishment of debt | — | — | 55 | ||||||||
Acquisition-related depreciation expense | 2,057 | 3,136 | 3,898 | ||||||||
Other income | (57 | ) | (426 | ) | — | ||||||
Income tax adjustments | (142,546 | ) | (67,662 | ) | (86,263 | ) | |||||
Non-GAAP net income | $ | 124,664 | $ | 178,546 | $ | 157,367 | |||||
GAAP diluted net income (loss) per share | $ | 0.90 | $ | 0.36 | $ | (0.35 | ) | ||||
Per share impact of non-GAAP adjustments identified above | 0.51 | 1.56 | 2.26 | ||||||||
Non-GAAP diluted net income per share | $ | 1.41 | $ | 1.92 | $ | 1.91 | |||||
GAAP income (loss) from operations | $ | (4,058 | ) | $ | 62,064 | $ | (25,550 | ) | |||
Previous adjustments to determine non-GAAP income from operations | 187,455 | 213,343 | 272,327 | ||||||||
Non-GAAP income from operations | 183,397 | 275,407 | 246,777 | ||||||||
Depreciation excluding acquisition related | 37,474 | 34,131 | 23,289 | ||||||||
Non-GAAP EBITDA from operations | $ | 220,871 | $ | 309,538 | $ | 270,066 | |||||
Critical Accounting Policies
We consider accounting policies related to revenue recognition, marketable securities, valuation of goodwill, intangible assets and other acquisition accounting items, and share based compensation to be critical in fully understanding and evaluating our financial results. We apply significant judgment and create estimates when applying these policies.
Revenue Recognition
We exercise judgment and use estimates in connection with determining the amounts of product and services revenues to be recognized in each accounting period.
We derive revenues primarily from the sale of network management tools and security solutions for service provider and enterprise customers, which include hardware, software and service offerings. The majority of our product sales consist of hardware products with embedded software that are essential to providing customers the intended functionality of the solutions. We also sell stand-alone software solutions to provide customers with enhanced functionality. In addition, we sell hardware bundled with a software license. Product revenue is recognized upon shipment, provided that evidence of an arrangement exists, title and risk of loss have passed to the customer, and in the case of software products, when the customer has the rights and ability to access the software, fees are fixed or determinable and collection of the related receivable is reasonably assured. If any significant obligations to the customer remain post-delivery, typically involving obligations relating to installation and acceptance by the customer, revenue recognition is deferred until such obligations have been fulfilled. Because many of our solutions are comprised of both hardware and more than incidental software components, we recognize revenue in accordance with authoritative guidance on both hardware and software revenue recognition.
Our service offerings include installation, integration, extended warranty and maintenance services, post-contract customer support (PCS), and other professional services including consulting and training. We generally provide software and/or hardware support as part of product sales. Revenue related to the initial bundled software and hardware support is recognized ratably over the support period. In addition, customers can elect to purchase extended support agreements for periods after the initial software/hardware warranty expiration. Support services generally include rights to unspecified upgrades (when and if available), telephone and internet-based support, updates, bug fixes and hardware repair and replacement. Consulting services are recognized upon delivery or completion of performance. Reimbursements of out-of-pocket expenditures incurred in
35
connection with providing consulting services are included in services revenue, with the offsetting expense recorded in cost of service revenue. Training services include on-site and classroom training. Training revenues are recognized upon delivery of the training.
Generally, our contracts are accounted for individually. However, when contracts are closely interrelated and dependent on each other, it may be necessary to account for two or more contracts as one to reflect the substance of the group of contracts.
Multi-element arrangements are concurrent customer purchases of a combination of our product and service offerings that may be delivered at various points in time. For multi-element arrangements comprised only of hardware products and related services, we allocate the total arrangement consideration to the multiple elements based on each element’s fair value compared to the total relative selling price of all the elements. Each element’s selling price is based on management’s best estimate of selling price (BESP) paid by customers based on the element’s historical pricing when vendor-specific objective evidence (VSOE) or third-party evidence (TPE) does not exist. We have established BESP for product elements as the average or median selling price the element was recently sold for, whether sold alone or sold as part of a multiple element transaction. We also consider our overall pricing objectives and practices across different sales channels and geographies, and market conditions. We review sales of the product elements on a quarterly basis and update, when appropriate, our BESP for such elements to ensure that it reflects recent pricing experience. We have established VSOE for a majority of our service elements based on historical standalone sales or by the renewal rate offered to the customer. However, certain business units we acquired as part of the Comms Transaction are unable to establish VSOE for undelivered elements. This occurs because the pricing for standalone sales does not occur in tight bands around a midpoint, and they are not contractually fixed. In these scenarios we have typically established BESP by creating wider bands around a midpoint for stand-alone transactions or in some cases using cost plus a margin for the underlying services and products. If VSOE of fair value does not exist for a deliverable, we have determined that BESP is the highest level of fair value that exists for those deliverables.
For multi-element arrangements comprised only of software products and related services, we allocate a portion of the total arrangement consideration to the undelivered elements, primarily support agreements and professional services, using VSOE of fair value for the undelivered elements. The remaining portion of the total arrangement consideration is allocated to the delivered software, referred to as the residual method. VSOE of fair value of the undelivered elements is based on the price customers pay when the element is sold separately. We review the separate sales of the undelivered elements on a regular basis and update when appropriate, our VSOE of fair value for such elements to ensure that it reflects recent pricing experience. If we cannot objectively determine the VSOE of the fair value of any undelivered software element, revenue is deferred until all elements are delivered and services have been performed, or until fair value can objectively be determined for any remaining undelivered elements. However, if the only undelivered element is maintenance and support, the entire arrangement fee is recognized over the service period.
For multi-element arrangements comprised of a combination of hardware and software elements, the total arrangement consideration is bifurcated between the hardware and hardware-related deliverables and the software and software-related deliverables based on the relative selling prices of all deliverables as a group. Then, arrangement consideration for the hardware and hardware-related services is recognized upon delivery or as the related services are provided as outlined above and revenue for the software and software-related services is allocated following the residual method and recognized based upon delivery or as the related services are provided.
Our products are distributed through our direct sales force and indirect distribution channels through alliances with resellers and distributors. Revenue arrangements with resellers and distributors are recognized on a sell-in basis; that is, when we deliver the product to the reseller or distributor. We record consideration given to a reseller or distributor as a reduction of revenue to the extent we have recorded revenue from the reseller or distributor. With limited exceptions, our return policy does not allow product returns for a refund. Returns have been insignificant to date. In addition, we have a history of successfully collecting receivables from our resellers and distributors.
Marketable Securities
We measure the fair value of our marketable securities at the end of each reporting period. Fair value is defined as the exchange price that would be received for an asset in the principal or most advantageous market for the asset in an orderly transaction between market participants on the measurement date. Marketable securities are recorded at fair value and have been classified as Level 1 or 2 within the fair value hierarchy. Fair values determined by Level 1 inputs utilize quoted prices (unadjusted) in accessible active markets for identical assets or liabilities. Fair values determined by Level 2 inputs utilize data points that are observable such as quoted prices, interest rates and yield curves.
36
Valuation of Goodwill, Intangible Assets and Other Acquisition Accounting Items
We amortize acquired definite-lived intangible assets over their estimated useful lives. Goodwill and other indefinite-lived intangible assets are not amortized but subject to annual impairment tests; more frequently if events or circumstances occur that would indicate a potential decline in their fair value. We perform the assessment annually during the fourth quarter and on an interim basis if potential impairment indicators arise. We have identified two reporting units: (1) Service Assurance and (2) Security. To test impairment, we first assess qualitative factors to determine whether the existence of events and circumstances indicate that it is more likely than not that the intangible asset is impaired. If based on our qualitative assessment, it is more likely than not that the fair value of the intangible asset is less than its carrying amount, quantitative impairment testing is required. However, if we conclude otherwise, quantitative impairment testing is not required. During fiscal year 2018, we performed a quantitative analysis for goodwill and our non-amortizing intangible asset. We determined the fair value of the reporting unit's goodwill using established income and market valuation approaches and the fair value of its trade names using a forward-looking relief from royalty model. All goodwill and indefinite-lived intangible assets were estimated to be recoverable as of January 31, 2018.
We completed three acquisitions (the Comms Transaction, the Avvasi acquisition and the Efflux acquisition) during the three-year period ended March 31, 2018. The acquisition method of accounting requires an estimate of the fair value of the assets and liabilities acquired as part of these transactions. In order to estimate the fair value of acquired intangible assets, we use a relief from royalty model which requires management to estimate: future revenues expected to be generated by the acquired intangible assets, a royalty rate which a market participant would pay related to the projected revenue stream, a present value factor which approximates a risk adjusted rate of return for a market participant purchasing the assets, and a technology migration curve representing a period of time over which the technology assets or some portion thereof are still being used. We are also required to develop the fair value for customer relationships acquired as part of these transactions which requires that we create estimates for the following items: a projection of future revenues associated with the acquired company’s existing customers, a turnover rate for those customers, a margin related to those sales, and a risk adjusted rate of return for a market participant purchasing those relationships.
The Comms Transaction in July 2015 contained both contingently returnable consideration and contingent purchase consideration. The contingently returnable consideration represented a contingent right of return from Danaher to reimburse NetScout for certain cash awards paid by NetScout to employees of the Communications Business transferred to Newco for post-combination services on various dates through August 4, 2016. During the fiscal year ended March 31, 2017, certain post-combination cash retention payments had been disbursed. Danaher reimbursed the Company for those costs and NetScout reimbursed Danaher for the tax benefit.
The acquisition of Simena LLC on November 18, 2011 also contained contingent consideration based on the ultimate settlement of assets and liabilities acquired as part of the transaction, and the former owners' future period of employment with NetScout. Contingent consideration accounting requires us to estimate the probability of various settlement scenarios, the former owners' expected period of employment with NetScout, and a risk adjusted interest rate to present value to the payment streams.
The Company has a contingent liability for $523 thousand related to the acquisition of Efflux in July 2017 for which an escrow account was established to cover damages NetScout suffers related to any liabilities that NetScout did not agree to assume or as a result of the breach of representations and warranties of the seller as described in the merger agreement. Generally, indemnification claims that Efflux would be liable for are limited to the total amount of the escrow account and shall be the sole source for the satisfaction of any damages to the Company for such claims, but such limitation does not apply with respect to seller's breach of certain fundamental representations or related to other specified indemnity items, for which certain of Efflux's shareholders may be liable for additional amounts in excess of the escrow amount. Except to the extent that valid indemnification claims are made prior to such time, the $523 thousand will be paid to the seller on July 12, 2018.
In addition, the Company had a contingent liability at March 31, 2017 for $660 thousand related to the acquisition of Avvasi in August 2016. The $660 thousand was paid to the seller in August 2017.
Share-Based Compensation
We recognize compensation expense for all share-based payments. Under the fair value recognition provisions, we recognize share-based compensation net of an estimated forfeiture rate and only recognize compensation cost for those shares expected to vest on a straight-line basis over the requisite service period of the award.
We are required to estimate the expected forfeiture rate and only recognize expense for those shares expected to vest. If our actual forfeiture rate is materially different from our estimate, the share-based compensation expense could be significantly different from what we have recorded in the current period.
37
Based on historical experience, we assumed an annualized forfeiture rate of 0% for awards granted to our directors, an annualized forfeiture rate of approximately 2% for awards granted to our senior executives, and an annualized forfeiture rate of approximately 5% for all remaining employees. We will record additional expense if the actual forfeitures are lower than estimated and will record a recovery of prior expense if the actual forfeitures are higher than estimated.
Results of Operations
Comparison of Years Ended March 31, 2018 and 2017
Revenue
Product revenue consists of sales of our hardware products and licensing of our software products. Service revenue consists of customer support agreements, consulting and training. During the fiscal year ended March 31, 2018, no direct customer or indirect channel partner accounted for more than 10% of our total revenue. During the fiscal year ended March 31, 2017, one direct customer, Verizon Communications, Inc. (Verizon), accounted for more than 10% of total revenue, while no indirect channel partner accounted for more than 10% of total revenue.
Fiscal Year Ended March 31, (Dollars in Thousands) | ||||||||||||||||||||
2018 | 2017 | Change | ||||||||||||||||||
% of Revenue | % of Revenue | $ | % | |||||||||||||||||
Revenue: | ||||||||||||||||||||
Product | $ | 546,127 | 55 | % | $ | 735,531 | 63 | % | $ | (189,404 | ) | (26 | )% | |||||||
Service | 440,660 | 45 | 426,581 | 37 | 14,079 | 3 | % | |||||||||||||
Total revenue | $ | 986,787 | 100 | % | $ | 1,162,112 | 100 | % | $ | (175,325 | ) | (15 | )% | |||||||
Product. The 26%, or $189.4 million, decrease in product revenue compared with the same period last year was primarily due to the combination of lower product revenue from a large tier-one service provider, and to, a lesser extent, lower-than expected orders for service assurance and DDoS offerings by other service providers primarily in North America, as well as lower product revenue from enterprise customers.
Service. The 3%, or $14.1 million, increase in service revenue compared to the same period last year was primarily due to an increase in maintenance contracts.
Total revenue by geography is as follows:
Fiscal Year Ended March 31, (Dollars in Thousands) | ||||||||||||||||||||
2018 | 2017 | Change | ||||||||||||||||||
% of Revenue | % of Revenue | $ | % | |||||||||||||||||
United States | $ | 581,853 | 59 | % | $ | 722,440 | 62 | % | $ | (140,587 | ) | (19 | )% | |||||||
International: | ||||||||||||||||||||
Europe | 174,445 | 18 | 193,441 | 17 | (18,996 | ) | (10 | )% | ||||||||||||
Asia | 88,917 | 9 | 95,735 | 8 | (6,818 | ) | (7 | )% | ||||||||||||
Rest of the world | 141,572 | 14 | 150,496 | 13 | (8,924 | ) | (6 | )% | ||||||||||||
Subtotal international | 404,934 | 41 | 439,672 | 38 | (34,738 | ) | (8 | )% | ||||||||||||
Total revenue | $ | 986,787 | 100 | % | $ | 1,162,112 | 100 | % | $ | (175,325 | ) | (15 | )% | |||||||
United States revenue decreased 19%, or $140.6 million, primarily due to the decrease in revenue from service assurance products.
38
Cost of Revenue and Gross Profit
Cost of product revenue consists primarily of material components, manufacturing personnel expenses, packaging materials, overhead and amortization of capitalized software, acquired software and core technology. Cost of service revenue consists primarily of personnel, material, overhead and support costs.
Fiscal Year Ended March 31, (Dollars in Thousands) | Change | |||||||||||||||||||
2018 | 2017 | |||||||||||||||||||
% of Revenue | % of Revenue | $ | % | |||||||||||||||||
Cost of revenue: | ||||||||||||||||||||
Product | $ | 164,526 | 17 | % | $ | 238,002 | 21 | % | $ | (73,476 | ) | (31 | )% | |||||||
Service | 107,379 | 11 | 108,137 | 9 | (758 | ) | (1 | )% | ||||||||||||
Total cost of revenue | $ | 271,905 | 28 | % | $ | 346,139 | 30 | % | $ | (74,234 | ) | (21 | )% | |||||||
Gross profit: | ||||||||||||||||||||
Product $ | $ | 381,601 | 39 | % | $ | 497,529 | 43 | % | $ | (115,928 | ) | (23 | )% | |||||||
Product gross profit % | 70 | % | 68 | % | 2 | % | ||||||||||||||
Service $ | 333,281 | 34 | % | 318,444 | 27 | % | 14,837 | 5 | % | |||||||||||
Service gross profit % | 76 | % | 75 | % | 1 | % | ||||||||||||||
Total gross profit $ | $ | 714,882 | $ | 815,973 | $ | (101,091 | ) | (12 | )% | |||||||||||
Total gross profit % | 72 | % | 70 | % | 2 | % | ||||||||||||||
Product. The 31%, or $73.5 million, decrease in cost of product revenue was primarily due to a $62.3 million decrease in direct material costs due to shifts in product mix and the decrease in product revenue, a $3.7 million decrease in the amortization of intangibles, a $2.3 million decrease in expenses related to the transitional service agreements related to the Comms Transaction, a $2.3 million decrease in employee-related expenses primarily due to a decrease in variable incentive compensation and a $1.7 million decrease in shipping costs. The product gross profit percentage increased by two percentage points to 70% during the fiscal year ended March 31, 2018 as compared to the same period in the prior year. The 23%, or $115.9 million decrease in product gross profit, corresponds with the 26%, or $189.4 million decrease in product revenue, partially offset by the 31%, or $73.5 million decrease in cost of product. Average headcount in cost of product revenue was 92 and 96 for the fiscal years ended March 31, 2018 and 2017, respectively.
Service. The 1%, or $0.8 million, decrease in cost of service revenue was primarily due to a $1.3 million decrease in employee related expenses primarily due to a decrease in variable incentive compensation and a $1.2 million decrease in cost of materials used to support customers under service contracts. These increases were partially offset by a $1.9 million increase in contractor fees. The service gross profit percentage increased by one percentage point to 76% during the fiscal year ended March 31, 2018 when compared to the fiscal year ended March 31, 2017. The 5%, or $14.8 million, increase in service gross profit corresponds with the 3%, or $14.1 million, increase in service revenue, and the 1%, or $0.8 million, decrease in cost of services. Average headcount in cost of service revenue was 606 and 616 for the fiscal years ended March 31, 2018 and 2017, respectively.
Gross profit. Our gross profit decreased 12%, or $101.1 million, compared to the fiscal year ended March 31, 2017. This decrease is attributable to the 15%, or $175.3 million, decrease in revenue partially offset by a $74.2 million, or 21%, decrease in cost of revenue. The gross margin percentage increased two percentage points to 72% during the fiscal year ended March 31, 2018 when compared to the same period in the prior year.
39
Operating Expenses
Fiscal Year Ended March 31, (Dollars in Thousands) | Change | |||||||||||||||||||
2018 | 2017 | |||||||||||||||||||
% of Revenue | % of Revenue | $ | % | |||||||||||||||||
Research and development | $ | 215,076 | 22 | % | $ | 232,701 | 20 | % | $ | (17,625 | ) | (8 | )% | |||||||
Sales and marketing | 312,536 | 32 | 328,628 | 28 | (16,092 | ) | (5 | )% | ||||||||||||
General and administrative | 109,479 | 11 | 118,438 | 10 | (8,959 | ) | (8 | )% | ||||||||||||
Amortization of acquired intangible assets | 76,640 | 8 | 70,141 | 6 | 6,499 | 9 | % | |||||||||||||
Restructuring charges | 5,209 | 1 | 4,001 | — | 1,208 | 30 | % | |||||||||||||
Total operating expenses | $ | 718,940 | 74 | % | $ | 753,909 | 64 | % | $ | (34,969 | ) | (5 | )% | |||||||
Research and development. Research and development expenses consist primarily of personnel expenses, fees for outside consultants, overhead and related expenses associated with the development of new products and the enhancement of existing products.
The 8%, or $17.6 million, decrease in research and development expenses compared to the same period last year was primarily due to a $13.5 million decrease in employee-related expenses largely due to a decrease in variable incentive compensation, a $5.3 million decrease in consulting fees, a $1.4 million decrease from depreciation expense and a $1.1 million decrease in compensation for post-combination services. These decreases were partially offset by a $2.2 million increase from capitalized software costs. During the fiscal year ended March 31, 2017, there were higher costs capitalized for software development. Average headcount in research and development was 1,148 and 1,210 for the fiscal years ended March 31, 2018 and 2017, respectively.
Sales and marketing. Sales and marketing expenses consist primarily of personnel expenses, including commissions, overhead and other expenses associated with selling activities and marketing programs such as trade shows, seminars, advertising, and new product launch activities.
The 5%, or $16.1 million, decrease in total sales and marketing expenses compared to the same period last year was primarily due to an $18.0 million decrease in commissions expense, a $5.8 million decrease in trade shows and other events, and a $1.4 million decrease in compensation for post-combination services. These decreases were partially offset by a $7.1 million increase in employee-related expenses and a $2.6 million increase in depreciation expense. Average headcount in sales and marketing was 956 and 935 for the fiscal years ended March 31, 2018 and 2017, respectively.
General and administrative. General and administrative expenses consist primarily of personnel expenses for executive, financial, legal and human resource employees, overhead and other corporate expenditures.
The 8%, or $9.0 million, decrease in general and administrative expenses compared to the same period last year was primarily due to a $9.5 million decrease in business development expenses, a $3.0 million decrease in employee-related expenses primarily due to a decrease in variable incentive compensation, a $1.9 million decrease in expenses related to the transitional services agreements related to the Comms Transaction and a $1.4 million decrease in legal expenses. These decreases were partially offset by a $2.8 million increase in consulting fees related to the implementation of new accounting standards, a $1.7 million increase in bad debt expense and a $1.7 million increase in rent expense. Average headcount in general and administrative was 274 and 283 for the fiscal years ended March 31, 2018 and 2017, respectively.
Amortization of acquired intangible assets. Amortization of acquired intangible assets consists primarily of amortization of customer relationships, definite-lived trademark and tradenames, and leasehold interest related to the acquisitions of the Communications Business, ONPATH Technologies, Inc. (ONPATH), Simena, LLC (Simena), Psytechnics, Ltd (Psytechnics), Network General, Avvasi and Efflux.
The 9%, or $6.5 million, increase in amortization of acquired intangible assets was primarily due to an increase of $3.5 million due to the acceleration of certain intangibles related to the Comms Transaction, with the remaining increase due to changes in percentages of amortization related to the Comms Transaction.
Restructuring. During fiscal year 2018 and 2017, we restructured certain departments to better align functions, drive productivity and improve efficiency. As a result of the restructuring programs, we recorded $5.2 million and $4.0 million of
40
restructuring charges related to costs to be paid to employees for one-time termination benefits as well as facility-related charges during the fiscal year ended March 31, 2018 and 2017, respectively. We expect to incur an additional $1.7 million of restructuring charges in the first half of fiscal year 2019.
Interest and Other Expense, Net
Interest and other expense, net includes interest earned on our cash, cash equivalents and marketable securities, interest expense and other non-operating gains or losses.
Fiscal Year Ended March 31, (Dollars in Thousands) | Change | |||||||||||||||||||
2018 | 2017 | |||||||||||||||||||
% of Revenue | % of Revenue | $ | % | |||||||||||||||||
Interest and other expense, net | $ | (14,601 | ) | (1 | )% | $ | (9,879 | ) | (1 | )% | $ | (4,722 | ) | (48 | )% | |||||
The 48%, or $4.7 million, increase in interest and other expense, net was primarily due to a $3.5 million increase in interest expense due to additional amounts drawn down on the credit facility entered into on January 16, 2018 as well as an increase in the average interest rate and a $1.6 million increase in foreign currency exchange expense.
Income Tax Expense
The annual effective tax rate for fiscal year 2018 was 527.7%, compared to an annual effective tax rate of 36.2% for fiscal year 2017. Generally, the effective tax rate differs from the statutory tax rate due to state income taxes and foreign withholding taxes, partially offset by the tax benefit associated with the Company’s domestic production activities deduction, research and development tax credits and earnings in jurisdictions subject to tax rates lower than the U.S. statutory rate. The effective tax rate for the twelve months ended March 31, 2018 is higher than the effective rate for the twelve months ended March 31, 2017, primarily due to the enactment of the Tax Cuts and Jobs Act (Tax Legislation) during the fiscal year. As a result of the enactment, we recorded a significant tax benefit during the fiscal year ended March 31, 2018. This benefit has the effect of increasing the tax rate due to losses generated in the twelve months ended March 31, 2018.
On December 22, 2017, the Tax Legislation was signed into law. The Tax Legislation significantly revises the U.S. tax code by, among other things, lowering the corporate tax rate from 35% to 21%; imposing a minimum tax on certain foreign earnings; limiting the deductibility of interest expense; implementing a territorial tax system and imposing a one-time transition tax on deemed repatriation of earnings of foreign subsidiaries. In December 2017, the SEC staff issued Staff Accounting Bulletin No. 118 (SAB 118), which addresses situations where the accounting is incomplete for the income tax effects of the Tax Legislation. SAB 118 directs taxpayers to consider the impact of the Tax Legislation as “provisional” when they do not have the necessary information available, prepared or analyzed (including computations) to finalize the accounting for the change in tax law. Companies are provided a measurement period of up to one year to obtain, prepare, and analyze information necessary to finalize the accounting for provisional amounts or amounts that could not be estimated as of December 31, 2017.
Fiscal Year Ended March 31, (Dollars in Thousands) | Change | |||||||||||||||||||
2018 | 2017 | |||||||||||||||||||
% of Revenue | % of Revenue | $ | % | |||||||||||||||||
Income tax (benefit) expense | $ | (98,471 | ) | (10 | )% | $ | 18,894 | 2 | % | $ | (117,365 | ) | (621 | )% | ||||||
41
Comparison of Years Ended March 31, 2017 and 2016
Revenue
During the fiscal years ended March 31, 2017 and 2016, one direct customer, Verizon, accounted for more than 10% of total revenue, while no indirect channel partner accounted for more than 10% of total revenue.
Fiscal Year Ended March 31, (Dollars in Thousands) | Change | |||||||||||||||||||
2017 | 2016 | |||||||||||||||||||
% of Revenue | % of Revenue | $ | % | |||||||||||||||||
Revenue: | ||||||||||||||||||||
Product | $ | 735,531 | 63 | % | $ | 633,408 | 66 | % | $ | 102,123 | 16 | % | ||||||||
Service | 426,581 | 37 | 322,011 | 34 | 104,570 | 32 | % | |||||||||||||
Total revenue | $ | 1,162,112 | 100 | % | $ | 955,419 | 100 | % | $ | 206,693 | 22 | % | ||||||||
Product. The 16%, or $102.1 million, increase in product revenue compared to fiscal year ended March 31, 2016 was primarily due to a $105.4 million increase in revenue from entities acquired in the Comms Transaction. The twelve months ended March 31, 2016 only included eight and a half months of such revenues, as the Comms Transaction closed on July 14, 2015. In addition, there was a $10.8 million increase from the general enterprise sector in the legacy NetScout business. These increases were partially offset by a $14.1 million decrease in revenue from the service provider sector in the legacy NetScout business.
Service. The 32%, or $104.6 million, increase in service revenue compared to fiscal year ended March 31, 2016 was primarily due to a $106.4 million increase in revenue from entities acquired in the Comms Transaction. The twelve months ended March 31, 2016 only included eight and a half months of revenues from these entities as the Comms Transaction closed on July 14, 2015. This increase was partially offset by a $2.8 million decrease in maintenance revenue in the legacy NetScout business.
Total revenue by geography is as follows:
Fiscal Year Ended March 31, (Dollars in Thousands) | Change | |||||||||||||||||||
2017 | 2016 | |||||||||||||||||||
% of Revenue | % of Revenue | $ | % | |||||||||||||||||
United States | $ | 722,440 | 62 | % | $ | 681,569 | 71 | % | $ | 40,871 | 6 | % | ||||||||
International: | ||||||||||||||||||||
Europe | 193,441 | 17 | 137,411 | 14 | 56,030 | 41 | % | |||||||||||||
Asia | 95,735 | 8 | 61,566 | 7 | 34,169 | 55 | % | |||||||||||||
Rest of the world | 150,496 | 13 | 74,873 | 8 | 75,623 | 101 | % | |||||||||||||
Subtotal international | 439,672 | 38 | 273,850 | 29 | 165,822 | 61 | % | |||||||||||||
Total revenue | $ | 1,162,112 | 100 | % | $ | 955,419 | 100 | % | $ | 206,693 | 22 | % | ||||||||
United States revenue increased 6%, or $40.9 million, primarily due to a $52.9 million increase in United States revenue from entities acquired as part of the Comms Transaction. The twelve months ended March 31, 2016 only included eight and a half months of such revenues, as the Comms Transaction closed on July 14, 2015. These increases were partially offset by a $5.1 million decrease within the legacy NetScout business related to lower revenue in the service provider sector. The 61%, or $165.8 million, increase in international revenue was primarily due to a $159.5 million increase in international revenue from entities acquired as part of the Comms Transaction due to twelve months of such revenue as compared to eight and half months in the prior period, as well as an increase across the legacy NetScout general enterprise sector.
42
Cost of Revenue and Gross Profit
Fiscal Year Ended March 31, (Dollars in Thousands) | ||||||||||||||||||||
2017 | 2016 | Change | ||||||||||||||||||
% of Revenue | % of Revenue | $ | % | |||||||||||||||||
Cost of revenue: | ||||||||||||||||||||
Product | $ | 238,002 | 21 | % | $ | 238,037 | 25 | % | $ | (35 | ) | — | % | |||||||
Service | 108,137 | 9 | 90,412 | 9 | 17,725 | 20 | % | |||||||||||||
Total cost of revenue | $ | 346,139 | 30 | % | $ | 328,449 | 34 | % | $ | 17,690 | 5 | % | ||||||||
Gross profit: | ||||||||||||||||||||
Product $ | $ | 497,529 | 43 | % | $ | 395,371 | 41 | % | $ | 102,158 | 26 | % | ||||||||
Product gross profit % | 68 | % | 62 | % | 6 | % | ||||||||||||||
Service $ | 318,444 | 27 | % | 231,599 | 24 | % | 86,845 | 37 | % | |||||||||||
Service gross profit % | 75 | % | 72 | % | 3 | % | ||||||||||||||
Total gross profit $ | $ | 815,973 | $ | 626,970 | $ | 189,003 | 30 | % | ||||||||||||
Total gross profit % | 70 | % | 66 | % | 4 | % | ||||||||||||||
Product. The $35 thousand decrease in cost of product revenue was due to a $3.0 million decrease in direct material costs and a $2.3 million decrease in amortization of legacy NetScout intangibles primarily due to the acceleration of amortization of certain intangibles during the twelve months ended March 31, 2016 for the legacy NetScout business. These decreases were partially offset by a $5.9 million increase in the incremental costs related to the Comms Transaction. The twelve months ended March 31, 2016 only included eight and a half months of such expenses, as the Comms Transaction closed on July 14, 2015. The product gross profit percentage increased by six percentage points to 68% during the fiscal year ended March 31, 2017 as compared to the same period in the prior year. Average headcount in cost of product revenue was 96 and 100 for the fiscal years ended March 31, 2017 and 2016, respectively.
Service. The 20%, or $17.7 million, increase in cost of service revenue was primarily due to a $16.0 million increase in the incremental costs related to the Comms Transaction. The twelve months ended March 31, 2016 only included eight and a half months of such expenses, as the Comms Transaction closed on July 14, 2015. In addition, in the legacy NetScout business there was a $782 thousand increase in allocated overhead expenses, a $591 thousand increase in employee-related expenses due to an increase in headcount and a $506 thousand increase in software license expense. These increases were partially offset by a $717 thousand decrease in cost of materials used to support customers under service contracts in the legacy NetScout business. The service gross profit percentage increased by three percentage points to 75% for the twelve months ended March 31, 2017 when compared to the twelve months ended March 31, 2016. The 37%, or $86.8 million, increase in service gross profit corresponds with the 32%, or $104.6 million, increase in service revenue, partially offset by the 20%, or $17.7 million, increase in cost of services. Average headcount in cost of service revenue was 616 and 608 for the fiscal years ended March 31, 2017 and 2016, respectively.
Gross profit. Our gross profit increased 30%, or $189.0 million. This increase is attributable to our increase in revenue of 22%, or $206.7 million, partially offset by a $17.7 million, or 5%, increase in cost of revenue. The gross margin percentage increased four percentage points to 70% during the fiscal year ended March 31, 2017 when compared to the same period in the prior year.
43
Operating Expenses
Fiscal Year Ended March 31, (Dollars in Thousands) | ||||||||||||||||||||
2017 | 2016 | Change | ||||||||||||||||||
% of Revenue | % of Revenue | $ | % | |||||||||||||||||
Research and development | $ | 232,701 | 20 | % | $ | 208,630 | 22 | % | $ | 24,071 | 12 | % | ||||||||
Sales and marketing | 328,628 | 28 | 293,335 | 31 | 35,293 | 12 | % | |||||||||||||
General and administrative | 118,438 | 10 | 117,714 | 12 | 724 | 1 | % | |||||||||||||
Amortization of acquired intangible assets | 70,141 | 6 | 32,373 | 3 | 37,768 | 117 | % | |||||||||||||
Restructuring charges | 4,001 | — | 468 | — | 3,533 | 755 | % | |||||||||||||
Total operating expenses | $ | 753,909 | 64 | % | $ | 652,520 | 68 | % | $ | 101,389 | 16 | % | ||||||||
Research and development. The 12%, or $24.1 million, increase in research and development expenses compared to the fiscal year ended March 31, 2016 was primarily due to a $23.5 million increase in the incremental costs related to the Comms Transaction. The twelve months ended March 31, 2016 only included eight and a half months of such expenses, as the Comms Transaction closed on July 14, 2015. Average headcount in research and development was 1,210 and 1,224 for the fiscal years ended March 31, 2017 and 2016, respectively.
Sales and marketing. The 12%, or $35.3 million, increase in total sales and marketing expenses compared to the fiscal year ended March 31, 2016 was primarily due to a $35.9 million increase in the incremental costs related to the Comms Transaction. The twelve months ended March 31, 2016 only included eight and a half months of such expenses, as the Comms Transaction closed on July 14, 2015. Average headcount in sales and marketing was 935 and 930 for the fiscal years ended March 31, 2017 and 2016, respectively.
General and administrative. The 1%, or $724 thousand, increase in general and administrative expenses compared to the fiscal year ended March 31, 2016 was primarily due a $15.0 million decrease in business development expenses related to the Comms Transaction and a $3.1 million decrease in the costs related to the Comms Transaction offset by a $6.6 million increase in compensation-related expenses, a $3.5 million increase in legal expenses, a $1.9 million increase in depreciation expense, a $1.6 million increase in allocated overhead expenses, a $1.3 million increase in software license expense, a $960 thousand increase in consulting and outside services fees and a $513 thousand increase in state franchise taxes in the legacy NetScout business. Average headcount in general and administrative was 283 and 282 for the fiscal years ended March 31, 2017 and 2016, respectively.
Amortization of acquired intangible assets. The 117%, or $37.8 million, increase in amortization of acquired intangible assets was primarily due to an increase of $39.4 million in amortization related to the Comms Transaction, as there were twelve months of such amortization as of March 31, 2017 as compared to eight and a half months in the prior period. These increases were partially offset by a $1.6 million decrease in amortization of acquired intangible assets in the legacy NetScout business as a result of the acceleration of amortization of certain intangibles during the twelve months ended March 31, 2016.
Restructuring. We restructured certain departments to better align functions subsequent to the Comms Transaction. As a result of the restructuring programs, we recorded $4.0 million and $0.5 million of restructuring charges related to costs to be paid to employees for one-time termination benefits and facility related charges during the twelve months ended March 31, 2017 and 2016, respectively.
Interest and Other Expense, Net
Fiscal Year Ended March 31, (Dollars in Thousands) | ||||||||||||||||||||
2017 | 2016 | Change | ||||||||||||||||||
% of Revenue | % of Revenue | $ | % | |||||||||||||||||
Interest and other expense, net | $ | (9,879 | ) | (1 | )% | $ | (6,889 | ) | (1 | )% | $ | (2,990 | ) | (43 | )% | |||||
44
The 43%, or $3.0 million, increase in interest and other expense, net was primarily due to a $2.9 million increase in interest expense due to additional amounts drawn down on the credit facility entered into on July 14, 2015 during the fourth quarter of fiscal year 2016 and a $1.0 million increase in foreign currency exchange expense.
Income Tax Expense
The annual effective tax rate for fiscal year 2017 was 36.2%, compared to an annual effective tax benefit of 12.5% for fiscal year 2016. Generally, the effective tax rate differs from the statutory tax rate due to state income taxes and foreign withholding taxes, partially offset by the tax benefit associated with the Company’s domestic production activities deduction, research and development tax credits and earnings in jurisdictions subject to tax rates lower than the U.S. statutory rate. The effective tax rate for the twelve months ended March 31, 2017 was higher than the effective rate for the twelve months ended March 31, 2016, primarily due to the volatility related to the low profit before tax coupled with significant differences due to transaction related expenses recorded in the twelve months ended March 31, 2016.
Fiscal Year Ended March 31, (Dollars in Thousands) | ||||||||||||||||||||
2017 | 2016 | Change | ||||||||||||||||||
% of Revenue | % of Revenue | $ | % | |||||||||||||||||
Income tax expense (benefit) | $ | 18,894 | 2 | % | $ | (4,070 | ) | — | % | $ | 22,964 | 564 | % | |||||||
Contractual Obligations
At March 31, 2018, we had the following contractual obligations:
Payment due by period (Dollars in thousands)
Contractual Obligations | Total | Less than 1 year | 1-3 years | 3-5 years | More than 5 years | ||||||||||||||
Long-term debt obligations (1) | $ | 698,696 | $ | 20,562 | $ | 41,180 | $ | 636,954 | $ | — | |||||||||
Unconditional purchase obligations (2) | 39,864 | 38,607 | 1,257 | — | — | ||||||||||||||
Operating lease obligations (3) | 99,617 | 16,613 | 25,334 | 19,868 | 37,802 | ||||||||||||||
Pension benefit plan | 7,053 | 380 | 944 | 1,183 | 4,546 | ||||||||||||||
Contingent purchase consideration | 5,464 | 5,464 | — | — | — | ||||||||||||||
Total contractual obligations | $ | 850,694 | $ | 81,626 | $ | 68,715 | $ | 658,005 | $ | 42,348 | |||||||||
At March 31, 2018, the total amount of net unrecognized tax benefits for uncertain tax positions and the accrual for the related interest was $2.4 million. We are unable to make a reliable estimate when cash settlement, if any, will occur with a tax authority as the timing of examinations and ultimate resolution of those examinations is uncertain. We have also excluded long-term deferred revenue of $91.4 million as such amounts will be recognized as services are provided.
(1) | Includes estimated future interest at an interest rate of 3.38% for our outstanding term loan at March 31, 2018. |
(2) | Represents estimated open purchase orders to purchase inventory as well as commitments for products and services used in the normal course of business. |
(3) | We lease facilities and certain equipment under operating lease agreements extending through July 2030 for a total of $99.6 million. |
Off-Balance Sheet Arrangements
We do not have any relationships with unconsolidated entities or financial partnerships, such as entities often referred to as structured finance or special purpose entities, which would have been established for the purpose of facilitating off-balance sheet arrangements. As such, we are not exposed to any financing, liquidity, market or credit risk that could arise if we had engaged in such relationships.
Commitment and Contingencies
We account for claims and contingencies in accordance with authoritative guidance that requires us to record an estimated loss from a claim or loss contingency when information available prior to issuance of our consolidated financial statements indicates that it is probable that a liability has been incurred at the date of the consolidated financial statements and the amount
45
of the loss can be reasonably estimated. If we determine that it is reasonably possible, but not probable, that an asset has been impaired or a liability has been incurred, or if the amount of a probable loss cannot be reasonably estimated, then, in accordance with the authoritative guidance, we disclose the amount or range of estimated loss if the amount or range of estimated loss is material. Accounting for claims and contingencies requires us to use our judgment. We consult with legal counsel on those issues related to litigation and seek input from other experts and advisors with respect to matters in the ordinary course of business.
We have a contingent liability for $523 thousand related to the acquisition of Efflux in July 2017 for which an escrow account was established to cover damages NetScout might suffer related to any liabilities that NetScout did not agree to assume or as a result of the breach of representations and warranties of the seller as described in the merger agreement. Generally, indemnification claims that Efflux would be liable for are limited to the total amount of the escrow account and shall be the sole source for the satisfaction of any damages to NetScout for such claims, but such limitation does not apply with respect to seller's breach of certain fundamental representations or related to other specified indemnity items, for which certain of Efflux's shareholders may be liable for additional amounts in excess of the escrow amount. Except to the extent that valid indemnification claims are made prior to such time, the $523 thousand will be paid to the seller on July 12, 2018.
In addition, we had a contingent liability at March 31, 2017 for $660 thousand related to the acquisition of Avvasi in August 2016. The $660 thousand was paid to the seller in August 2017.
We have one contingent liability related to the acquisition of Simena in November 2011 for future consideration to be paid to the former seller which had an initial fair value of $8.0 million at the time of acquisition. At March 31, 2018, the fair value of the future consideration was $4.9 million.
Legal - From time to time, NetScout is subject to legal proceedings and claims in the ordinary course of business. In the opinion of management, the amount of ultimate expense with respect to any current legal proceedings and claims, if determined adversely, will not have a material adverse effect on our financial condition, results of operations or cash flows.
As previously disclosed, in March 2016, Packet Intelligence LLC ("Packet Intelligence" or "Plaintiff") filed a Complaint against NetScout and two subsidiary entities in the United States District Court for the Eastern District of Texas asserting infringement of five United States patents. Plaintiff’s Complaint alleged that legacy Tektronix GeoProbe products, including the G10 and GeoBlade products, infringed these patents. NetScout filed an Answer denying Plaintiff’s allegations and asserting that Plaintiff’s patents were, among other things, invalid, not infringed, and unenforceable due to inequitable conduct. In October 2017, a jury trial was held to address the parties’ claims and counterclaims regarding infringement of three patents by the G10 and GeoBlade products, invalidity of these patents, and damages. On October 13, 2017, the jury rendered a verdict finding in favor of the Plaintiff and that Plaintiff was entitled to $3,500,000 for pre-suit damages and $2,250,000 for post-suit damages. The jury indicated that the awarded damages amounts were intended to reflect a running royalty. The Court also conducted a bench trial on whether these patents were unenforceable due to, among other things, inequitable conduct. The Court has not yet rendered a decision on the equitable issues or entered final judgment in this matter. NetScout has concluded that the risk of loss from this matter is currently neither remote nor probable, and therefore, under U.S. GAAP definitions, the risk of loss is termed "reasonably possible". Therefore, accounting rules require NetScout to provide an estimate for the range of potential liability. NetScout currently estimates that the estimated range of liability is between $0 and the aggregate amount awarded by the jury, plus potential additional pre- and post-judgment interest amounts, subject to other adjustments that the Court may make. NetScout intends to continue to vigorously dispute Packet Intelligence’s claims including through appeal, if necessary.
Warranty and Indemnification
We warrant that our software and hardware products will substantially conform to the documentation accompanying such products on their original date of shipment. For software, which also includes firmware, the standard warranty commences upon shipment and generally expires 60 to 90 days thereafter. With regard to hardware, the standard warranty commences upon shipment and generally expires 60 days to 12 months thereafter. Additionally, this warranty is subject to various exclusions which include, but are not limited to, non-conformance resulting from modifications made to the software or hardware by a party other than NetScout; customers’ failure to follow our installation, operation or maintenance instructions; and events outside of our reasonable control. We also warrant that all support services will be performed in a good and workmanlike manner. We believe that our product and support service warranties are consistent with commonly accepted industry standards. Warranty cost information is presented and no material warranty costs are accrued since service revenue associated with warranty is deferred at the time of sale and recognized ratably over the warranty period.
Contracts that we enter into in the ordinary course of business may contain standard indemnification provisions. Pursuant to these agreements, we may agree to defend third party claims brought against a partner or direct customer claiming
46
infringement of such third party’s (i) U.S. patent and/or European Union (EU), or other selected countries’ patents, (ii) Berne convention member country copyright, and/or (iii) U.S., EU, and/or other selected countries’ trademark or intellectual property rights. Moreover, this indemnity may require us to pay any damages awarded against the partner or direct customer in such type of lawsuit as well as reimburse the partner or direct customer for reasonable attorney’s fees incurred by them from the lawsuit.
We may also agree from time to time to provide other forms of indemnification to partners or direct customers, such as indemnification that would obligate us to defend and pay any damages awarded to a third party against a partner or direct customer based on a lawsuit alleging that such third party has suffered personal injury or tangible property damage legally determined to have been caused by negligently designed or manufactured products.
We have agreed to indemnify our directors and officers and our subsidiaries’ directors and officers if they are made a party or are threatened to be made a party to any proceeding (other than an action by or in the right of NetScout) by reason of the fact that the indemnified are agents of NetScout. The indemnity is for any and all expenses and liabilities of any type (including but not limited to, judgments, fines and amounts paid in settlement) reasonably incurred by the directors or officers in connection with the investigation, defense, settlement or appeal of such proceeding, provided they acted in good faith.
Liquidity and Capital Resources
Cash, cash equivalents and marketable securities consist of the following (in thousands):
At March 31, (Dollars in Thousands) | |||||||||||
2018 | 2017 | 2016 | |||||||||
Cash and cash equivalents | $ | 369,821 | $ | 304,880 | $ | 210,711 | |||||
Short-term marketable securities | 77,941 | 137,892 | 128,003 | ||||||||
Long-term marketable securities | — | 21,933 | 13,361 | ||||||||
Cash, cash equivalents and marketable securities | $ | 447,762 | $ | 464,705 | $ | 352,075 | |||||
Cash, cash equivalents and marketable securities
At March 31, 2018 cash, cash equivalents and marketable securities (current and non-current) totaled $447.8 million, down $16.9 million from $464.7 million at March 31, 2017. This decrease was primarily due to $501.3 million used to repurchase shares of our common stock, $15.9 million used for capital expenditures, $13.6 million for tax withholding on restricted stock units and $8.3 million used for the acquisition of Efflux. These decreases were partially offset by $294.6 million in proceeds from the issuance of long-term debt and $222.5 million in cash provided by operations during the fiscal year ended March 31, 2018.
At March 31, 2018, cash, short-term and long-term investments in the United States were $281.3 million, while cash held outside of the United States was approximately $166.5 million.
Cash and cash equivalents were impacted by the following:
Fiscal Year Ended March 31, (Dollars in Thousands) | |||||||||||
2018 | 2017 (1) | 2016 (1) | |||||||||
Net cash provided by operating activities | $ | 222,454 | $ | 226,764 | $ | 97,211 | |||||
Net cash provided by (used in) investing activities | $ | 57,128 | $ | (41,621 | ) | $ | 25,089 | ||||
Net cash used in financing activities | $ | (220,962 | ) | $ | (89,553 | ) | $ | (17,226 | ) | ||
(1) Represents cash flows as of March 31, 2017 and 2016, recast to present our retrospective adoption of accounting guidance related to the presentation of the cash flow statement.
Net cash from operating activities
Fiscal year 2018 compared to fiscal year 2017
Cash provided by operating activities was $222.5 million during the fiscal year ended March 31, 2018, compared to $226.8 million of cash provided by operating activities in the fiscal year ended March 31, 2017. This $4.3 million decrease was due in part to a $116.8 million decrease from deferred income taxes, a $41.2 million decrease from deferred revenue, a $24.5
47
million decrease from accrued compensation and other expenses, a $21.9 million net decrease from amounts due to and from related parties, an $11.5 million decrease from inventories, a $9.3 million decrease from accounts payable, a $7.4 million decrease from depreciation and amortization, and a $4.7 million decrease from income taxes payable. These decreases were partially offset by a $133.0 million increase from accounts receivable, a $46.5 million increase from net income, a $44.9 million increase from prepaid expenses and other assets and an $8.1 million increase from share-based compensation expense associated with equity awards. Accounts receivable days sales outstanding was 78 days at March 31, 2018 compared to 80 days at March 31, 2017 and March 31, 2016.
Fiscal year 2017 compared to fiscal year 2016
Cash provided by operating activities was $226.8 million during the fiscal year ended March 31, 2017, compared to $97.2 million of cash provided by operating activities in the fiscal year ended March 31, 2016. This $129.6 million increase was due in part to a $61.7 million increase from net income, a $47.5 million net increase from amounts due to and from related parties as a result of the Comms Transaction, a $31.1 million increase from deferred income taxes, a $20.8 million increase from depreciation and amortization, a $10.8 million increase from share-based compensation expense, a $7.4 million increase from deferred revenue, a $6.9 million increase from inventories, and a $4.7 million increase from prepaid expenses and other assets. These increases were partially offset by a $26.5 million decrease from accrued compensation and other expenses and a $24.8 million unfavorable impact from accounts receivable and unbilled costs. Accounts receivable days sales outstanding was 80 days at March 31, 2017 compared to 80 days at March 31, 2016. In addition, there was a $6.6 million decrease from deal-related compensation expense and accretion charges, a $1.9 million decrease in income taxes payable and a $1.9 million decrease in cash inflows from accounts payable related to the normalization of the accounts payable balances across the larger business during twelve months ended March 31, 2017 as compared to the twelve months ended March 31, 2016.
Net cash from investing activities
Fiscal Year Ended March 31, (Dollars in Thousands) | |||||||||||
2018 | 2017 (1) | 2016 | |||||||||
Cash provided by (used in) investing activities included the following: | |||||||||||
Purchase of marketable securities | $ | (114,178 | ) | $ | (199,841 | ) | $ | (100,278 | ) | ||
Proceeds from maturity of marketable securities | 196,041 | 181,321 | 118,881 | ||||||||
Purchase of fixed assets | (15,913 | ) | (29,696 | ) | (24,783 | ) | |||||
Purchase of intangible assets | (544 | ) | (1,031 | ) | (3,962 | ) | |||||
Acquisition of businesses, net of cash acquired | (8,334 | ) | (4,606 | ) | 27,700 | ||||||
(Increase) decrease in deposits | (330 | ) | 129 | (150 | ) | ||||||
Contingent purchase consideration | 523 | 660 | — | ||||||||
Collection of contingently returnable consideration | — | 12,864 | 9,306 | ||||||||
Capitalized software development costs | (137 | ) | (1,421 | ) | (1,625 | ) | |||||
$ | 57,128 | $ | (41,621 | ) | $ | 25,089 | |||||
(1) Represents cash flows as of March 31, 2017, recast to present our retrospective adoption of accounting guidance related to the presentation of the cash flow statement.
Cash provided by investing activities increased by $98.7 million to $57.1 million during the fiscal year ended March 31, 2018, compared to $41.6 million of cash used in investing activities during the fiscal year ended March 31, 2017. Cash used in investing activities increased by $66.7 million to $41.6 million during the fiscal year ended March 31, 2017, compared to $25.1 million of cash provided by investing activities during the fiscal year ended March 31, 2016.
Net cash inflows relating to the purchase and sales of marketable securities increased $100.4 million during the fiscal year ended March 31, 2018 relating to the amount of investments held at each respective balance sheet date, from an outflow of $18.5 million during fiscal year ended March 31, 2017 to an inflow of $81.9 million during fiscal year ended March 31, 2018. Net cash inflows relating to the purchase and sales of marketable securities decreased $37.1 million during the fiscal year ended March 31, 2017 relating to the amount of investments held at each respective balance sheet date, from an inflow of $18.6 million during the fiscal year ended March 31, 2016 to an outflow of $18.5 million during the fiscal year ended March 31, 2017.
48
During the twelve months ended March 31, 2018, there was an $8.3 million cash outflow related to the acquisition of Efflux. During the twelve months ended March 31, 2017, there was a $4.6 million cash outflow related to the assets and liabilities acquired as part of the Avvasi acquisition. During the twelve months ended March 31, 2016, there was a $27.7 million cash inflow related to cash acquired as part of the Comms Transaction.
Our investments in property and equipment consist primarily of computer equipment, demonstration units, office equipment and facility improvements. We plan to continue to invest in capital expenditures to support our infrastructure in our fiscal year 2019.
Purchases of intangible assets decreased by $0.5 million during the fiscal year ended March 31, 2018 as compared to the fiscal year ended March 31, 2017. During fiscal years ended March 31, 2018 and 2017, we entered into agreements to acquire technology licenses for $0.5 million and $1.0 million, respectively.
Net cash from financing activities
Fiscal Year Ended March 31, (Dollars in Thousands) | |||||||||||
2018 | 2017 (1) | 2016 (1) | |||||||||
Cash used in financing activities included the following: | |||||||||||
Issuance of common stock under stock plans | $ | 1 | $ | 2 | $ | 1 | |||||
Payment of contingent consideration | (660 | ) | — | — | |||||||
Tax withholding on restricted stock units | (13,598 | ) | (9,559 | ) | (9,066 | ) | |||||
Treasury stock repurchases, including accelerated share repurchases | (501,324 | ) | (79,996 | ) | (302,784 | ) | |||||
Proceeds from issuance of long-term debt, net of issuance costs | 294,619 | — | 294,623 | ||||||||
$ | (220,962 | ) | $ | (89,553 | ) | $ | (17,226 | ) | |||
(1) Represents cash flows as of March 31, 2017 and 2016, recast to present our retrospective adoption of accounting guidance related to the presentation of the cash flow statement.
Cash used in financing activities increased $131.4 million to $221.0 million during the fiscal year ended March 31, 2018, compared to $89.6 million of cash used in financing activities during the fiscal year ended March 31, 2017.
During the twelve months ended March 31, 2018, we repurchased 13,190,650 shares for $411.3 million under our stock repurchase and accelerated share repurchase (ASR) programs. During the twelve months ended March 31, 2017, we repurchased 3,148,426 shares for $80.0 million under our stock repurchase program.
On February 1, 2018, we entered into ASR agreements with two third-party financial institutions to repurchase an aggregate of $300 million of our common stock via accelerated stock repurchase transactions under the twenty million share repurchase program and the twenty five million share repurchase program. We borrowed $300 million under our Amended Credit Agreement and made an up-front payment of $300 million pursuant to the ASR and received an initial delivery of 7,387,862 shares in the aggregate, which is approximately 70 percent of the total number of shares of our common stock expected to be repurchased under the ASR. As part of this purchase, 970,650 shares for $27.6 million were deducted under the twenty million share repurchase program and 6,417,212 shares for $182.4 million were deducted under the twenty five million share repurchase program. The final number of ASR shares is dependent upon the average of the daily volume-weighted average prices of our common stock during the term of the ASR, less a discount and subject to adjustments pursuant to the terms and conditions of the ASR. The delivery of additional shares of common stock to us or an additional delivery of shares of common stock or a cash payment, at our election, by NetScout to the Dealers may be required. The final settlement of each of the ASR transactions is expected to occur no later than the end of the second quarter of fiscal year 2019.
In connection with the delivery of common shares upon vesting of restricted stock units, we have withheld 408,097 shares for $13.6 million, 320,572 shares for $9.6 million and 256,514 shares for $9.1 million related to minimum statutory tax withholding requirements on these restricted stock units during the fiscal years ended March 31, 2018, 2017 and 2016, respectively. These withholding transactions do not fall under the repurchase program described above, and therefore do not reduce the amount that is available for repurchase under that program.
49
Credit Facility
On January 16, 2018, we amended and expanded our existing credit agreement (Amended Credit Agreement) with a syndicate of lenders by and among: the Company; JPMorgan Chase Bank, N.A. (JPMorgan), as administrative agent and collateral agent; J.P. Morgan Securities LLC, KeyBanc Capital Markets, Merrill Lynch, Pierce, Fenner & Smith Incorporated, RBC Capital Markets and Wells Fargo Securities, LLC, as joint lead arrangers and joint bookrunners; Fifth Third Bank, Santander Bank, N.A., SunTrust Bank, N.A. and U.S. Bank National Association, as co-documentation agents; and the lenders party thereto.
The Amended Credit Agreement provides for a five-year $1.0 billion senior secured revolving credit facility, including a letter of credit sub-facility of up to $75.0 million. We may elect to use the new credit facility for general corporate purposes or to finance the repurchase of common stock under our common stock repurchase plan. The commitments under the Amended Credit Agreement will expire on January 16, 2023, and any outstanding loans will be due on that date.
On February 1, 2018, we also announced that we entered into agreements with JPMorgan Chase Bank, National Association and Bank of America, N.A. (the Dealers) to repurchase an aggregate of $300 million of our common stock via accelerated stock repurchase transactions (the ASR) under our previously disclosed share repurchase program. On February 1, 2018, we borrowed an additional $300 million aggregate principal amount under the Amended Credit Agreement in order to finance the payment of the ASR to each of the Dealers. At March 31, 2018, $600 million was outstanding under the Amended Credit Agreement.
At our election, revolving loans under the Amended Credit Agreement bear interest at either (a) an Alternate Base Rate per annum equal to the greatest of (1) JPMorgan’s prime rate, (2) 0.50% in excess of the New York Federal Reserve Bank (NYFRB) rate, or (3) an adjusted one month LIBOR rate plus 1%; or (b) such adjusted LIBOR rate (for the interest period selected by us), in each case plus an applicable margin. For the period from the delivery of our financial statements for the quarter ended December 31, 2017, until we have delivered financial statements for the quarter ended March 31, 2018, the applicable margin will be 1.50% per annum for LIBOR loans and 0.50% per annum for Alternate Base Rate loans, and thereafter the applicable margin will vary depending on our leverage ratio, ranging from 1.00% per annum for Base Rate loans and 2.00% per annum for LIBOR loans if our consolidated leverage ratio is greater than 3.50 to 1.00, down to 0.00% per annum for Alternate Base Rate loans and 1.00% per annum for LIBOR loans if our consolidated leverage ratio is equal to or less than 1.50 to 1.00.
Our consolidated leverage ratio is the ratio of our total funded debt compared to our consolidated adjusted EBITDA. Consolidated adjusted EBITDA includes certain adjustments, including, without limitation, adjustments relating to extraordinary, unusual or non-recurring charges, certain restructuring charges, non-cash charges, certain transaction costs and expenses and certain pro forma adjustments in connection with material acquisitions and dispositions, all as set forth in detail in the definition of consolidated adjusted EBITDA in the Amended Credit Agreement.
Commitment fees will accrue on the daily unused amount of the credit facility. For the period from the delivery of our financial statements for the quarter ended December 31, 2017 until we have delivered financial statements for the quarter ended March 31, 2018, the commitment fee will be 0.25% per annum, and thereafter the commitment fee will vary depending on the our consolidated leverage ratio, ranging from 0.30% per annum if our consolidated leverage ratio is greater than 2.75 to 1.00, down to 0.15% per annum if our consolidated leverage ratio is equal to or less than 1.00.
Letter of credit participation fees are payable to each lender on the amount of such lender’s letter of credit exposure, during the period from the closing date of the Amended Credit Agreement to but excluding the date which is the later of (i) the date on which such lender’s commitment terminates or (ii) the date on which such lender ceases to have any letter of credit exposure, at a rate per annum equal to the applicable margin for LIBOR loans. Additionally, we will pay a fronting fee to each issuing bank in amounts to be agreed to between us and the applicable issuing bank.
Interest on Alternate Base Rate loans is payable at the end of each calendar quarter. Interest on LIBOR loans is payable at the end of each interest rate period or at the end of each three-month interval within an interest rate period if the period is longer than three months. We may also prepay loans under the Amended Credit Agreement at any time, without penalty, subject to certain notice requirements.
Debt is recorded at the amount drawn on the revolving credit facility plus interest based on floating rates reflective of changes in the market which approximates fair value.
The loans and other obligations under the credit facility are (a) guaranteed by each of our wholly owned material domestic restricted subsidiaries, subject to certain exceptions, and (b) are secured by substantially all of the assets of us and the subsidiary guarantors, including a pledge of all the capital stock of material subsidiaries held directly by us and the subsidiary guarantors (which pledge, in the case of any foreign subsidiary, is limited to 65% of the voting stock), subject to certain
50
customary exceptions and limitations. The Amended Credit Agreement generally prohibits any other liens on the assets of the Company and its restricted subsidiaries, subject to certain exceptions as described in the Amended Credit Agreement.
The Amended Credit Agreement contains certain covenants applicable to us and our restricted subsidiaries, including, without limitation, limitations on additional indebtedness, liens, various fundamental changes, dividends and distributions, investments (including acquisitions), transactions with affiliates, asset sales, including sale-leaseback transactions, speculative hedge agreements, payment of junior financing, changes in business and other limitations customary in senior secured credit facilities. In addition, we are required to maintain certain consolidated leverage and interest coverage ratios. These covenants and limitations are more fully described in the Amended Credit Agreement. At March 31, 2018, we were in compliance with all of these covenants.
The Amended Credit Agreement provides that events of default will exist in certain circumstances, including failure to make payment of principal or interest on the loans when required, failure to perform certain obligations under the Amended Credit Agreement and related documents, defaults under certain other indebtedness, certain insolvency events, certain events arising under ERISA, a change of control and certain other events. Upon an event of default, the administrative agent with the consent of, or at the request of, the holders of more than 50% in principal amount of the loans and commitments may terminate the commitments and accelerate the maturity of the loans and enforce certain other remedies under the Credit Agreement and the other loan documents.
In connection with the Company's Amended Credit Agreement described above, we terminated our previous term loan dated as of July 14, 2015, by and among the Company; JPMorgan Chase Bank, N.A. (JPMorgan), as administrative agent and collateral agent; J.P. Morgan Securities LLC, KeyBanc Capital Markets, Merrill Lynch, Pierce, Fenner & Smith Incorporated, RBC Capital Markets and Wells Fargo Securities, LLC, as joint lead arrangers and joint bookrunners; Santander Bank, N.A., SunTrust Bank, N.A. and U.S. Bank National Association, as co-documentation agents; and the lenders party thereto.
We capitalized debt issuance costs totaling $12.2 million at March 31, 2018, which are being amortized over the life of the revolving credit facility. The unamortized balance was $8.3 million as of March 31, 2018. The balance of $1.7 million was included as prepaid expenses and other current assets and a balance of $6.6 million was included as other assets in Company’s consolidated balance sheet.
Expectations for Fiscal Year 2019
We believe that our cash balances, available debt, short-term marketable securities classified as available-for-sale and future cash flows generated by operations will be sufficient to meet our anticipated cash needs for working capital and capital expenditures for at least the next 12 months. In addition, we expect that cash provided by operating activities in fiscal year 2019 will be lower than cash provided by operations in fiscal year 2018 due to changes in working capital and higher capital expenditures.
Additionally, a portion of our cash may be used to acquire or invest in complementary businesses or products or to obtain the right to use complementary technologies. From time to time, in the ordinary course of business, we evaluate potential acquisitions of such businesses, products or technologies. If our existing sources of liquidity are insufficient to satisfy our liquidity requirements, we may seek to sell additional equity or debt securities. The sale of additional equity or debt securities could result in additional dilution to our stockholders.
Recent Accounting Standards
In March 2018, the Financial Account Standards Board (FASB) issued Accounting Standards Update (ASU) 2018-05 associated with the accounting and disclosures around the enactment of the Tax Legislation and the Securities and Exchange Commission’s Staff Accounting Bulletin No. 118, Income Tax Accounting Implications of the Tax Legislation (SAB 118), which we have adopted.
In February 2018, the FASB issued ASU 2018-02, Reclassification of Certain Tax Effects From Accumulated Other Comprehensive Income. ASU 2018-02 amends ASC 220, Income Statement - Reporting Comprehensive Income, to allow a reclassification from accumulated other comprehensive income to retained earnings for stranded tax effects resulting from the Tax Legislation. In addition, under the ASU 2018-02, we may be required to provide certain disclosures regarding stranded tax effects. ASU 2018-02 is effective for years beginning after December 15, 2018, and interim periods within those fiscal years. ASU 2018-02 is effective for NetScout beginning April 1, 2019. Early adoption is permitted. We do not believe the adoption of ASU 2018-02 will have a material impact on our consolidated financial statements.
In August 2017, the FASB issued ASU 2017-12, Derivatives and Hedging (Topic 815), Targeted Improvements to Accounting for Hedging Activities (ASU 2017-12). ASU 2017-12 intends to better align an entity's risk management activities and financial reporting for hedging relationships through changes to both the designation and measurement guidance for
51
qualifying hedging relationships and the presentation of hedge results. The amendments expand and refine hedge accounting for both non-financial and financial risk components and align the recognition and presentation of the effects of the hedging instrument and the hedged item in the financial statements. This standard is effective for financial statements issued for fiscal years beginning after December 15, 2018, with early adoption permitted. ASU 2017-12 is effective for NetScout beginning April 1, 2019. We are currently assessing the potential impact of the adoption of ASU 2017-12 on our consolidated financial statements.
In March 2017, the FASB issued ASU 2017-07, Improving the Presentation of Net Periodic Pension Cost and Net Periodic Post-Retirement Benefit Cost (ASU 2017-07) which requires that an employer report the service cost component in the same line item or items as other compensation costs arising from services rendered by the pertinent employees during the period. The other components of net benefit cost are required to be presented in the income statement separately from the service cost component and outside a subtotal of income from operations. This standard is effective for financial statements issued for fiscal years beginning after December 15, 2017 and should be applied retrospectively to all periods presented. ASU 2017-07 is effective for NetScout beginning April 1, 2018. We do not believe the adoption of ASU 2017-07 will have a material impact on our consolidated financial statements.
In January 2017, the FASB issued ASU 2017-01, Business Combinations (Topic 805), Clarifying the Definition of a Business (ASU 2017-01). ASU 2017-01 clarifies the definition of a business with the objective of addressing whether transactions involving in-substance nonfinancial assets, held directly or in a subsidiary, should be accounted for as acquisitions or disposals of nonfinancial assets or of businesses. ASU 2017-01 is effective for annual periods beginning after December 15, 2017. ASU 2017-01 is effective for NetScout beginning April 1, 2018. Early adoption is permitted for transactions, including acquisitions or dispositions, which occurred before the issuance date or effective date of the standard if the transactions were not reported in financial statements that have been issued or made available for issuance. We do not believe the adoption of ASU 2017-01 will have a material impact on our consolidated financial statements.
In November 2016, the FASB issued ASU No. 2016-18, Statement of Cash Flows (Topic 230): Restricted Cash (ASU 2016-18) related to the presentation of restricted cash in the statement of cash flows. The pronouncement requires entities to show the changes in the total of cash, cash equivalents, restricted cash and restricted cash equivalents in the statement of cash flows. As a result, entities will no longer present transfers between cash and cash equivalents and restricted cash and restricted cash equivalents in the statement of cash flows. When cash, cash equivalents, restricted cash and restricted cash equivalents are presented in more than one line item on the balance sheet, the new guidance requires a reconciliation of the totals in the statement of cash flows to the related captions in the balance sheet. Entities will also have to disclose the nature of restricted cash and restricted cash equivalent balances. The pronouncement is effective for fiscal years, and for interim periods within those fiscal years, beginning after December 15, 2017, with early adoption permitted. We adopted this guidance retrospectively on April 1, 2017. We do not have a material amount of restricted cash. Adoption of this ASU did not have a material impact on our consolidated financial statements.
In October 2016, the FASB issued ASU 2016-16, Income Taxes (Topic 740): Intra-Entity Transfers of Assets Other Than Inventory (ASU 2016-16). ASU 2016-16 requires that entities recognize the income tax effects of intra-entity transfers of assets other than inventory when the transfer occurs. Current GAAP prohibits the recognition of those tax effects until the asset has been sold to an outside party. The pronouncement is effective for fiscal years, and for interim periods within those fiscal years, beginning after December 15, 2017, with early adoption permitted. ASU 2016-16 is effective for NetScout beginning April 1, 2018. We are currently evaluating the new guidance and do not believe the adoption of ASU 2016-16 will have a material impact on our consolidated financial statements.
In August 2016, the FASB issued ASU 2016-15, Classification of Certain Cash Receipts and Cash Payments (ASU 2016-15). ASU 2016-15 is intended to add or clarify guidance on the classification of certain cash receipts and payments in the statement of cash flows and to eliminate the diversity in practice related to such classifications. The guidance in ASU 2016-15 is required for annual reporting periods beginning after December 15, 2017, with early adoption permitted. ASU 2016-15 is effective for NetScout beginning April 1, 2018. We are currently assessing the potential impact of the adoption of ASU 2016-15 on our consolidated statement of cash flows.
In March 2016, the FASB issued ASU 2016-09, Compensation - Stock Compensation (Topic 718): Improvements to Employee Share-Based Payment Accounting (ASU 2016-09), which simplifies several aspects of the accounting for employee share-based payment transactions, including the accounting for income taxes, forfeitures and statutory tax withholding requirements, as well as classification in the statement of cash flows. We adopted this guidance on April 1, 2017, which had the following impact on our consolidated financial statements:
•On a prospective basis, as required, we recorded an excess tax benefit of $0.7 million to the provision for income taxes in the consolidated statement of operations for the fiscal year ended March 31, 2018 instead of additional paid-in capital in the consolidated balance sheets. As a result, net income increased $0.7 million and basic and diluted earnings per share increased $0.01 for the fiscal year ended March 31, 2018.
52
•Excess tax benefits are presented as operating cash activity instead of financing cash activity in the consolidated statements of cash flows, which we elected to apply on a retrospective basis. As a result, we classified $0.7 million of excess tax benefit, a $1.0 million tax shortfall, and a $1.9 million excess tax benefit for the fiscal years ended March 31, 2018, 2017 and 2016, respectively, as operating cash inflows for the fiscal years ended March 31, 2018 and March 31, 2016, and as an operating cash outflow for the fiscal year ended March 31, 2017 included within the change in income taxes payable in the consolidated statements of cash flows. The retrospective classification resulted in a $0.7 million and a $1.9 million increase in cash provided by operating activities and cash used in financing activities for the fiscal years ended March 31, 2018 and 2016, respectively, and a decrease in cash provided by operating activities and cash provided by financing activities of $1.0 million for the fiscal year ended March 31, 2017.
•The Company prospectively excluded the excess tax benefits from the assumed proceeds available to repurchase shares in the computation of diluted earnings per share under the treasury stock method, which did not have a material impact on diluted earnings per share for the fiscal year ended March 31, 2018.
In February 2016, the FASB issued ASU 2016-02, Leases (Topic 842) Section A - Leases: Amendments to the FASB Accounting Standards Codification (ASU 2016-02), its new standard on accounting for leases. This update requires the recognition of leased assets and lease obligations by lessees for those leases currently classified as operating leases under existing lease guidance. Short term leases with a term of 12 months or less are not required to be recognized. The update also requires disclosure of key information about leasing arrangements to increase transparency and comparability among organizations. ASU 2016-02 is effective for annual reporting periods beginning after December 31, 2018 and interim periods within those fiscal years, and early adoption is permitted. We are currently assessing the potential impact of the adoption of ASU 2016-02 on our consolidated financial statements.
In May 2014, the FASB issued ASU No. 2014-09, Revenue from Contracts with Customers: Topic 606 (ASU 2014-09) and issued subsequent amendments to the initial guidance in August 2015, March 2016, April 2016, May 2016, December 2016 and September 2017 within ASU 2015-04, 2016-08, ASU 2016-10, ASU 2016-12, ASU 2016-20, ASU 2017-13 and ASU 2017-14, respectively (collectively, Topic 606). Topic 606 supersedes nearly all existing revenue recognition guidance under GAAP. The core principle of Topic 606 is to recognize revenues when promised goods or services are transferred to customers in an amount that reflects the consideration that is expected to be received for those goods or services. Topic 606 defines a five step process to achieve this core principle and, in applying this process, it is possible that more judgments and estimates may be required within the revenue recognition process than are required under existing GAAP, including identifying performance obligations in the contract, estimating the amount of variable consideration to include in the transaction price and allocating the transaction price to each separate performance obligation, among others. Entities have the option of using either a full retrospective or a modified retrospective approach to adopt this standard. We are electing to use the modified retrospective transition approach. Topic 606 became effective for NetScout on April 1, 2018. In preparation for adoption of the standard, we have implemented internal controls and key system functionality to enable the preparation of financial information and have reached conclusions on key accounting assessments related to the standard. As of April 1, 2018, we expect to release approximately $34.9 million of deferred revenue. In addition, prior to the adoption of Topic 606, we expensed commissions as they were earned by the sales force, while under Topic 606 the requirement is to match the timing of the commissions expense with the timing of the revenue for each arrangement’s underlying performance obligations. We have elected to employ a practical expedient wherein commissions are expensed immediately for revenues recognized within one year, however commissions associated with arrangements where revenues are recognized over longer time frames (primarily multi-year PCS arrangements and maintenance renewals) will be capitalized and amortized. The expected impact of the second change created $7.2 million of capitalized commissions costs as of April 1, 2018. A majority of those costs will be fully amortized by the end of the fiscal year ending March 31, 2019.
53
Item 7A. Quantitative and Qualitative Disclosures About Market Risk
Interest Rate Risk. We hold our cash, cash equivalents and investments for working capital purposes. Some of the securities we invest in are subject to market risk. This means that a change in prevailing interest rates may cause the principal amount of the investment to fluctuate. To minimize this risk, we maintain our portfolio of cash, cash equivalents and investments in a variety of securities, including money market funds and government debt securities. The risk associated with fluctuating interest rates is limited to our investment portfolio. Due to the short-term nature of these instruments, we believe that we do not have any material exposure to changes in the fair value of our investment portfolio as a result of changes in interest rates. Declines in interest rates, however, would reduce future interest income. The effect of a hypothetical 10% increase or decrease in overall interest rates would not have had a material impact on our operating results or the total fair value of the portfolio.
We are exposed to market risks related to fluctuations in interest rates related to our credit facility. As of March 31, 2018, we owed $600 million on this loan with an interest rate of 3.38%. A sensitivity analysis was performed on the outstanding portion of our debt obligation as of March 31, 2018. Should the current weighted average interest rate increase or decrease by 10%, the resulting annual increase or decrease to interest expense would be approximately $2.0 million as of March 31, 2018.
Credit Risk. Our cash equivalents and marketable securities consist primarily of money market instruments, U.S. Treasury bills, certificates of deposit, commercial paper, corporate bonds and municipal obligations.
At March 31, 2018 and periodically throughout the year, we have maintained cash balances in various operating accounts in excess of federally insured limits. We limit the amount of credit exposure with any one financial institution by evaluating the creditworthiness of the financial institutions with which we invest.
Foreign Currency Exchange Risk. As a result of our foreign operations, we face exposure to movements in foreign currency exchange rates, primarily the Euro, British Pound, Canadian Dollar and Indian Rupee. The current exposures arise primarily from expenses denominated in foreign currencies. NetScout currently engages in foreign currency hedging activities in order to limit these exposures. We do not use derivative financial instruments for speculative trading purposes.
At March 31, 2018, we had foreign currency forward contracts with notional amounts totaling $11.2 million. The valuation of outstanding foreign currency forward contracts at March 31, 2018 resulted in a liability balance of $40 thousand, reflecting unfavorable contract rates in comparison to current market rates at this date and an asset balance of $122 thousand reflecting favorable rates in comparison to current market rates. At March 31, 2017, we had foreign currency forward contracts with notional amounts totaling $14.8 million. The valuation of outstanding foreign currency forward contracts at March 31, 2017 resulted in a liability balance of $213 thousand, reflecting unfavorable contract rates in comparison to current market rates at this date and an asset balance of $110 thousand reflecting favorable rates in comparison to current market rates.
54
Item 8. Financial Statements and Supplementary Data
NetScout’s Consolidated Financial Statements and Schedule and Report of Independent Registered Public Accounting Firm appear beginning on page F-1 attached to this report.
Item 9. Changes in and Disagreements with Accountants on Accounting and Financial Disclosure
There have been no changes in or disagreements with accountants on accounting or financial disclosure matters.
Item 9A. Controls and Procedures
Evaluation of Disclosure Controls and Procedures
As of March 31, 2018, NetScout, under the supervision and with the participation of our management, including the Company’s principal executive officer and principal financial officer, evaluated the effectiveness of the design and operation of our disclosure controls and procedures pursuant to Rule 13a-15(b) promulgated under the Exchange Act. Based upon that evaluation, our principal executive officer and principal financial officer concluded that, as of March 31, 2018 our disclosure controls and procedures were effective in ensuring that material information relating to NetScout, including its consolidated subsidiaries, required to be disclosed by NetScout in the reports that it files or submits under the Exchange Act is recorded, processed, summarized and reported within the time periods specified in the SEC’s rules and forms, including ensuring that such material information is accumulated and communicated to our management, including our principal executive officer and principal financial officer, as appropriate, to allow timely decisions regarding required disclosure.
Changes in Internal Control over Financial Reporting
During the year ended March 31, 2018, there were no changes in our internal control over financial reporting that have materially affected, or are reasonably likely to materially affect, our internal control over financial reporting.
Management’s Report on Internal Control Over Financial Reporting
Our management is responsible for establishing and maintaining adequate internal control over financial reporting as such term is defined in Exchange Act Rule 13a-15(f). Our internal control over financial reporting was designed to provide reasonable assurance regarding reliability of financial reporting and the preparation of financial statements for external purposes in accordance with generally accepted accounting principles. Because of its inherent limitations, internal control over financial reporting may not prevent or detect misstatements. Also, projections of any evaluation of effectiveness to future periods are subject to the risk that controls may become inadequate because of changes in conditions, or that the degree of compliance with the policies or procedures may deteriorate. Our management assessed the effectiveness of our internal control over financial reporting as of March 31, 2018. In making this assessment, our management used the criteria set forth by the Committee of Sponsoring Organizations of the Treadway Commission (COSO) in Internal Control—Integrated Framework in 2013. Based on our assessment, we concluded that our internal control over financial reporting was effective as of March 31, 2018.
The effectiveness of the Company’s internal control over financial reporting as of March 31, 2018 has been audited by PricewaterhouseCoopers LLP, an independent registered public accounting firm, as stated in their report which appears herein.
Item 9B. Other Information
Not applicable.
55
PART III
Item 10. Directors, Executive Officers and Corporate Governance
The information required by this Item 10 will be included under the captions "Directors and Executive Officers," "Election of Directors," "Section 16(a) Beneficial Ownership Reporting Compliance," "Code of Ethics," "The Board of Directors and its Committees" and "Corporate Governance" in our definitive Proxy Statement with respect to our 2018 Annual Meeting of Stockholders to be filed with the SEC no later than 120 days after the end of the fiscal year covered by this Annual Report and is incorporated herein by reference.
Item 11. Executive Compensation
The information required by this Item 11 will be included under the caption "Compensation and Other Information Concerning Directors and Executive Officers" in our definitive Proxy Statement with respect to our 2018 Annual Meeting of Stockholders to be filed with the SEC not later than 120 days after the end of the fiscal year covered by this Annual Report and is incorporated herein by reference.
Item 12. Security Ownership of Certain Beneficial Owners and Management and Related Stockholder Matters
The information required by this Item 12 will be included under the captions "Security Ownership of Certain Beneficial Owners and Management" and "Equity Compensation Plan Information" in our definitive Proxy Statement with respect to our 2018 Annual Meeting of Stockholders to be filed with the SEC not later than 120 days after the end of the fiscal year covered by this Annual Report and is incorporated herein by reference.
Item 13. Certain Relationships and Related Transactions, and Director Independence
The information required by this Item 13 will be included, as applicable, under the captions "Director Independence," "Employment and Other Agreements" and "Transactions with Related Persons" in our definitive Proxy Statement with respect to our 2018 Annual Meeting of Stockholders to be filed with the SEC not later than 120 days after the end of the fiscal year covered by this Annual Report and is incorporated herein by reference.
Item 14. Principal Accounting Fees and Services
The information required by this Item 14 will be included under the captions "Auditors Fees and Services" and "Policy on Audit Committee Pre-approval of Audit and Non-Audit Services" in our definitive Proxy Statement with respect to our 2018 Annual Meeting of Stockholders to be filed with the SEC not later than 120 days after the end of the fiscal year covered by this Annual Report and is incorporated herein by reference.
56
PART IV
Item 15. Exhibits, Financial Statement Schedules
(a) | 1. | Consolidated Financial Statements. | ||
2. | Financial Statement Schedule. | |||
No other financial statement schedules have been included because they are either not applicable or the information is in the consolidated financial statements. | ||||
3. | Exhibits listed in the accompanying Index to Exhibits are filed or incorporated by reference as part of this report. | |||
(b) | We hereby file as part of this Annual Report on Form 10-K the exhibits listed in Item 15(a)(3) above. | |||
(c) | We hereby file as part of this Annual Report on Form 10-K the financial statement schedule listed in Item 15(a)(2) above. | |||
57
NetScout Systems, Inc.
Index to Exhibits
Agreement and Plan of Merger and Reorganization dated October 12, 2014 by and among NetScout Systems, Inc., Danaher Corporation, Potomac Holding LLC, RS Merger Sub I, Inc., and RS Merger Sub II, LLC (filed as Exhibit 2.1 to NetScout’s current report on Form 8-K, SEC File No. 000-26251, filed with the SEC on October 14, 2014 and incorporated herein by reference). | ||
Separation and Distribution Agreement dated October 12, 2014 by and among Danaher Corporation, NetScout Systems, Inc. and Potomac Holding LLC (filed as Exhibit 10.1 to NetScout’s current report on Form 8-K, SEC File No. 000-26251, filed with the SEC on October 14, 2014 and incorporated herein by reference). | ||
Closing Agreement dated July 14, 2015 by and among NetScout Systems, Inc., Danaher Corporation, Potomac Holding LLC, RS Merger Sub I, Inc., and RS Merger Sub II, LLC (filed as Exhibit 2.3 to NetScout’s current report on Form 8-K, SEC File No. 000-26251, filed with the SEC on July 15, 2015 and incorporated herein by reference). | ||
Composite conformed copy of Third Amended and Restated Certificate of Incorporation of NetScout (as amended) (filed as Exhibit 3.2 to NetScout’s current report on Form 8-K, SEC File No. 000-26251, filed on September 21, 2016, and incorporated herein by reference). | ||
Amended and Restated By-laws of NetScout (filed as Exhibit 3.1 to NetScout’s current Report on Form 8-K, SEC File No. 000-26251, filed on October 30, 2017 and incorporated herein by reference). | ||
Specimen Certificate for shares of NetScout’s Common Stock (filed as Exhibit 4.3 to NetScout’s Annual Report on Form 10-K for the fiscal year ended March 31, 2001, SEC File No. 000-26251, filed on June 29, 2001, and incorporated herein by reference). | ||
Form of Amended and Restated Indemnification Agreement between NetScout and each director and executive officer filed as Exhibit 10.1 to NetScout's Quarterly Report on Form 10-Q for the quarterly period ended December 31, 2013, SEC File No. 000-26251, filed January 28, 2014, and incorporated herein by reference). | ||
Form of Incentive Stock Option Agreement – Incorporated Terms and Conditions pursuant to 1999 Stock Option and Incentive Plan, as amended (filed as Exhibit 10.1 to NetScout’s Quarterly Report on Form 10-Q for the quarterly period ended September 30, 2004, SEC File No 000-26251, filed November 4, 2004 and incorporated herein by reference). | ||
Lease between Arturo J. Gutierrez and John A. Cataldo, Trustees of Nashoba Westford Realty Trust, u/d/t dated April 27, 2000 and recorded with the Middlesex North Registry of Deeds in Book 10813, Page 38 and NetScout for Westford Technology Park West, as amended (filed as Exhibit 10.26 to NetScout’s Annual Report on Form 10-K for the fiscal year ended March 31, 2001, SEC File No. 000-26251, filed on June 29, 2001, and incorporated herein by reference). | ||
Agreement Relating to Employment, dated January 3, 2007, by and between NetScout and Anil K. Singhal (filed as Exhibit 10.2 to NetScout’s Current Report on Form 8-K, SEC File No. 000-26251, filed on January 5, 2007 and incorporated herein by reference). | ||
Amendment No. 1, dated February 2, 2007, to Agreement Relating to Employment by and between the Company and Anil K. Singhal (filed as exhibit 10.1 to NetScout’s Quarterly Report on Form 10-Q for the quarterly period ended December 31, 2006, SEC File No. 000-26251, filed February 5, 2007 and incorporated herein by reference). | ||
Amendment No. 2, dated December 22, 2008, to Agreement Relating to Employment by and between the Company and Anil K. Singhal (filed as exhibit 10.1 to NetScout’s Quarterly Report on Form 10-Q for the quarterly period ended December 31, 2008, SEC File No. 000-26251, filed February 6, 2009 and incorporated herein by reference). | ||
Amendment No. 3, dated May 28, 2012, to Agreement Relating to Employment, by and between the Company and Anil K. Singhal (filed as Exhibit 10.3 to NetScout’s Current Report on Form 8-K, SEC File No. 000-26251, filed on June 1, 2012 and incorporated herein by reference). | ||
58
NetScout Systems, Inc. 2007 Equity Incentive Plan, as amended (filed as Appendix A to the Registrant’s Definitive Proxy Statement on Schedule 14A, SEC File No. 000-26251, filed with the Commission on July 28, 2015 and incorporated herein by reference) | ||
NetScout Form of Restricted Stock Unit Agreement with respect to the NetScout 2007 Equity Incentive Plan (filed as Exhibit 99.2 to NetScout’s Registration Statement on Form S-8, SEC File No. 333-148364, filed on December 27, 2007 and incorporated herein by reference). | ||
Form of Amended and Restated Severance Agreement for Named Executive Officers (other than the CEO and CFO) (filed as Exhibit 10.1 to NetScout’s Current Report on Form 8-K, SEC File No. 000-26251, filed on June 1, 2012 and incorporated herein by reference). | ||
Amended and Restated Severance Agreement, dated May 28, 2012, by and between the Company and Jean Bua (filed as Exhibit 10.2 to NetScout’s Current Report on Form 8-K, SEC File No. 000-26251, filed on June 1, 2012 and incorporated herein by reference). | ||
Third Amendment Agreement, dated August 10, 2010, to that certain Lease, dated August 17, 2000, as amended, between the Company and Westford West I Limited Partnership, as successor to Arturo J. Gutierrez and John A. Cataldo, Trustees of Nashoba Westford Realty Trust, u/d/t dated April 27, 2000 (filed as Exhibit 10.1 to NetScout’s Quarterly Report on Form 10-Q for the quarterly period ended September 30, 2010, SEC File No. 000-26251, filed November 9, 2010 and incorporated herein by reference). | ||
NetScout Systems, Inc. Amended and Restated 2011 Employee Stock Purchase Plan (filed as Exhibit 10.1 to NetScout’s Current Report on Form 8-K, SEC File No. 000-26251, filed on February 14, 2012 and incorporated herein by reference) . | ||
Form of Amendment to Amended and Restated Severance Agreement for Executive Officers (filed as Exhibit 10.9 to NetScout’s Quarterly Report on Form 10-Q for the quarterly period ended December 31, 2014, SEC File No. 000-26251, filed on January 27, 2015 and incorporated herein by reference). | ||
Tax Matters Agreement dated July 14, 2015 by and among Danaher Corporation, NetScout Systems, Inc. and Potomac Holding LLC (filed as Exhibit 10.1 to NetScout’s current report on Form 8-K, SEC File No. 000-26251, filed with the SEC on July 15, 2015 and incorporated herein by reference). | ||
Transition Services Agreement dated July 14, 2015 by and among NetScout Systems, Inc., Danaher Corporation and Potomac Holding LLC (filed as Exhibit 10.2 to NetScout’s current report on Form 8-K, SEC File No. 000-26251, filed with the SEC on July 15, 2015 and incorporated herein by reference). | ||
Employee Matters Agreement dated July 14, 2015 by and among NetScout Systems, Inc., Danaher Corporation and Potomac Holding LLC (filed as Exhibit 10.3 to NetScout’s current report on Form 8-K, SEC File No. 000-26251, filed with the SEC on July 15, 2015 and incorporated herein by reference). | ||
Intellectual Property Cross-License Agreement dated July 14, 2015 by and between Danaher Corporation and Potomac Holding LLC (filed as Exhibit 10.4 to NetScout’s current report on Form 8-K, SEC File No. 000-26251, filed with the SEC on July 15, 2015 and incorporated herein by reference). | ||
Credit Agreement, dated as of July 14, 2015, by and among: NetScout Systems, Inc., JPMorgan Chase Bank, N.A., as administrative agent and collateral agent; J.P. Morgan Securities LLC, KeyBanc Capital Markets, Merrill Lynch, Pierce, Fenner & Smith Incorporated, RBC Capital Markets and Wells Fargo Securities, LLC, as joint lead arrangers and joint bookrunners; Santander Bank, N.A., SunTrust Bank, N.A. and U.S. Bank National Association, as co-documentation agents; and the Lenders party thereto (filed as Exhibit 10.5 to NetScout’s current report on Form 8-K, SEC File No. 000-26251, filed with the SEC on July 15, 2015 and incorporated herein by reference). | ||
Amendment and Restatement Agreement dated as of January 16, 2018, to the Credit Agreement, dated as of July 14, 2015, by and among NetScout Systems, Inc.; certain subsidiaries of NetScout Systems, Inc. as loan parties; the lenders and issuing banks party thereto and JPMorgan Chase Bank, N.A., as administrative agent attaching the Amended and Restated Credit Agreement, dated as of January 16, 2018, by and among NetScout Systems, Inc.; JPMorgan Chase Bank, N.A., as administrative agent and collateral agent; JPMorgan Chase Bank, N.A., Wells Fargo Securities, LLC, Merrill Lynch, Pierce, Fenner & Smith Incorporated, RBC Capital Markets and KeyBanc Capital Markets Inc., as joint lead arrangers and joint bookrunners; SunTrust Bank, N.A., Santander Bank, N.A., U.S. Bank National Association and Fifth Third Bank, as co-documentation agents; and the lenders party thereto (filed as Exhibit 10.5 to NetScout’s current report on Form 8-K, SEC File No. 000-26251, filed with the SEC on January 18, 2018 and incorporated by reference herein. | ||
59
Summary of Non-Employee Director Compensation (filed as Exhibit 10.1 to NetScout’s Quarterly Report on Form 10-Q for the quarterly period ended December 31, 2016, SEC File No. 000-26251, filed on February 2, 2017 and incorporated herein by reference). | ||
Confirmation - Issuer Forward Repurchase Transaction, dated February 1, 2018, between NetScout Systems, Inc. and JPMorgan Chase Bank, National Association (filed as Exhibit 10.1 to NetScout’s current report on Form 8-K, SEC File No. 000-26251, filed on February 2, 2018 and incorporated herein by reference). | ||
Confirmation - Issuer Forward Repurchase Transaction, dated February 1, 2018, between NetScout Systems, Inc. and Bank of America, N.A. (filed as exhibit 10.2 to NetScout’s current report on Form 8-K, SEC File No. 000-26251, filed on February 2, 2018 and incorporated herein by reference). | ||
Subsidiaries of NetScout (filed herewith). | ||
Consent of PricewaterhouseCoopers LLP (filed herewith). | ||
Certification Pursuant to Section 302 of the Sarbanes-Oxley Act of 2002 (filed herewith). | ||
Certification Pursuant to Section 302 of the Sarbanes-Oxley Act of 2002 (filed herewith). | ||
32.1† | Certification Pursuant to Section 906 of the Sarbanes–Oxley Act of 2002 (furnished herewith). | |
32.2† | Certification Pursuant to Section 906 of the Sarbanes–Oxley Act of 2002 (furnished herewith). | |
101.INS** | XBRL Instance Document. | |
101.SCH** | XBRL Taxonomy Extension Schema Document. | |
101.CAL** | XBRL Taxonomy Extension Calculation Linkbase Document. | |
101.DEF** | XBRL Taxonomy Extension Definition Linkbase Document. | |
101.LAB** | XBRL Taxonomy Extension Label Linkbase Document. | |
101.PRE** | XBRL Taxonomy Extension Presentation Linkbase Document. | |
* | Indicates a management contract or compensatory plan or arrangement. |
** | XBRL (Extensible Business Reporting Language) information is furnished and not filed or a part of a registration statement or prospectus for purposes of sections 11 or 12 of the Securities Act of 1933, as amended, is deemed not filed for purposes of section 18 of the Securities Exchange Act of 1934, as amended, and otherwise is not subject to liability under these sections. |
† | Exhibit has been furnished, is not deemed filed and is not to be incorporated by reference into any of the Company's filings under the Securities Act of 1933, as amended, or the Securities Exchange Act of 1934, as amended, irrespective of any general incorporation language contained in any such filing |
60
Item 16. Form 10-K Summary
Not provided
61
SIGNATURES
Pursuant to the requirements of Section 13 or 15(d) of the Securities Exchange Act of 1934, the registrant has duly caused this report to be signed on its behalf by the undersigned, thereunto duly authorized.
NETSCOUT SYSTEMS, INC. | ||
By: | /S/ ANIL K. SINGHAL | |
Anil K. Singhal | ||
President, Chief Executive Officer, and Chairman | ||
Date: May 21, 2018 | ||
Pursuant to the requirements of the Securities Exchange Act of 1934, this report has been signed below by the following persons on behalf of the registrant and in the capacities and on the dates indicated.
Signature | Title(s) | Date | ||
/S/ ANIL K. SINGHAL | President, Chief Executive Officer, and Chairman (Principal Executive Officer) | May 21, 2018 | ||
Anil K. Singhal | ||||
/S/ JEAN BUA | Executive Vice President and Chief Financial Officer (Principal Financial Officer) (Principal Accounting Officer) | May 21, 2018 | ||
Jean Bua | ||||
/S/ ROBERT E. DONAHUE | Director | May 21, 2018 | ||
Robert E. Donahue | ||||
/S/ JOHN R. EGAN | Director | May 21, 2018 | ||
John R. Egan | ||||
/S/ ALFRED GRASSO | Director | May 21, 2018 | ||
Alfred Grasso | ||||
/S/ JOSEPH G. HADZIMA, JR. | Director | May 21, 2018 | ||
Joseph G. Hadzima, Jr. | ||||
/S/ JAMES A. LICO | Director | May 21, 2018 | ||
James A. Lico | ||||
/S/ VINCENT J. MULLARKEY | Director | May 21, 2018 | ||
Vincent J. Mullarkey | ||||
/S/ CHRISTOPHER PERRETTA | Director | May 21, 2018 | ||
Christopher Perretta | ||||
/S/ SUSAN L. SPRADLEY | Director | May 21, 2018 | ||
Susan L. Spradley | ||||
62
NetScout Systems, Inc.
Index to Consolidated Financial Statements
F-1
Report of Independent Registered Public Accounting Firm
To the Board of Directors and Stockholders of NetScout Systems, Inc.:
Opinions on the Financial Statements and Internal Control over Financial Reporting
We have audited the accompanying consolidated balance sheets of NetScout Systems, Inc and its subsidiaries as of March 31, 2018 and 2017, and the related consolidated statements of operations, comprehensive income (loss), stockholders’ equity and cash flows for each of the three years in the period ended March 31, 2018, including the related notes and schedule of valuation and qualifying accounts listed in the index appearing under Item 15(a)(2) (collectively referred to as the “consolidated financial statements”). We also have audited the Company's internal control over financial reporting as of March 31, 2018, based on criteria established in Internal Control - Integrated Framework (2013) issued by the Committee of Sponsoring Organizations of the Treadway Commission (COSO).
In our opinion, the consolidated financial statements referred to above present fairly, in all material respects, the financial position of the Company as of March 31, 2018 and 2017, and the results of their operations and their cash flows for each of the three years in the period ended March 31, 2018 in conformity with accounting principles generally accepted in the United States of America. Also in our opinion, the Company maintained, in all material respects, effective internal control over financial reporting as of March 31, 2018, based on criteria established in Internal Control - Integrated Framework (2013) issued by the COSO.
Basis for Opinions
The Company's management is responsible for these consolidated financial statements, for maintaining effective internal control over financial reporting, and for its assessment of the effectiveness of internal control over financial reporting, included in Management’s Report on Internal Control Over Financial Reporting appearing under Item 9A. Our responsibility is to express opinions on the Company’s consolidated financial statements and on the Company's internal control over financial reporting based on our audits. We are a public accounting firm registered with the Public Company Accounting Oversight Board (United States) ("PCAOB") and are required to be independent with respect to the Company in accordance with the U.S. federal securities laws and the applicable rules and regulations of the Securities and Exchange Commission and the PCAOB.
We conducted our audits in accordance with the standards of the PCAOB. Those standards require that we plan and perform the audits to obtain reasonable assurance about whether the consolidated financial statements are free of material misstatement, whether due to error or fraud, and whether effective internal control over financial reporting was maintained in all material respects.
Our audits of the consolidated financial statements included performing procedures to assess the risks of material misstatement of the consolidated financial statements, whether due to error or fraud, and performing procedures that respond to those risks. Such procedures included examining, on a test basis, evidence regarding the amounts and disclosures in the consolidated financial statements. Our audits also included evaluating the accounting principles used and significant estimates made by management, as well as evaluating the overall presentation of the consolidated financial statements. Our audit of internal control over financial reporting included obtaining an understanding of internal control over financial reporting, assessing the risk that a material weakness exists, and testing and evaluating the design and operating effectiveness of internal control based on the assessed risk. Our audits also included performing such other procedures as we considered necessary in the circumstances. We believe that our audits provide a reasonable basis for our opinions.
Definition and Limitations of Internal Control over Financial Reporting
A company’s internal control over financial reporting is a process designed to provide reasonable assurance regarding the reliability of financial reporting and the preparation of financial statements for external purposes in accordance with generally accepted accounting principles. A company’s internal control over financial reporting includes those policies and procedures that (i) pertain to the maintenance of records that, in reasonable detail, accurately and fairly reflect the transactions and dispositions of the assets of the company; (ii) provide reasonable assurance that transactions are recorded as necessary to permit preparation of financial statements in accordance with generally accepted accounting principles, and that receipts and
F-2
expenditures of the company are being made only in accordance with authorizations of management and directors of the company; and (iii) provide reasonable assurance regarding prevention or timely detection of unauthorized acquisition, use, or disposition of the company’s assets that could have a material effect on the financial statements.
Because of its inherent limitations, internal control over financial reporting may not prevent or detect misstatements. Also, projections of any evaluation of effectiveness to future periods are subject to the risk that controls may become inadequate because of changes in conditions, or that the degree of compliance with the policies or procedures may deteriorate.
/s/ PricewaterhouseCoopers LLP
Boston, Massachusetts
May 21, 2018
We have served as the Company’s auditor since 1993.
F-3
NetScout Systems, Inc.
Consolidated Balance Sheets
(In thousands, except share and per share data)
March 31, 2018 | March 31, 2017 | ||||||
Assets | |||||||
Current assets: | |||||||
Cash and cash equivalents | $ | 369,821 | $ | 304,880 | |||
Marketable securities | 77,941 | 137,892 | |||||
Accounts receivable and unbilled costs, net of allowance for doubtful accounts of $1,991 and $2,066 at March 31, 2018 and 2017, respectively | 213,438 | 294,374 | |||||
Inventories and deferred costs | 34,774 | 40,002 | |||||
Prepaid income taxes | 22,932 | 40,346 | |||||
Prepaid expenses and other current assets (related party balances of $3,187 and $3,585 at March 31, 2018 and 2017, respectively) | 33,502 | 36,972 | |||||
Total current assets | 752,408 | 854,466 | |||||
Fixed assets, net | 52,511 | 61,393 | |||||
Goodwill | 1,712,764 | 1,718,162 | |||||
Intangible assets, net | 831,374 | 931,269 | |||||
Deferred income taxes | 6,685 | 6,580 | |||||
Long-term marketable securities | — | 21,933 | |||||
Other assets | 12,866 | 7,710 | |||||
Total assets | $ | 3,368,608 | $ | 3,601,513 | |||
Liabilities and Stockholders’ Equity | |||||||
Current liabilities: | |||||||
Accounts payable (related party balances of $369 and $444 at March 31, 2018 and 2017, respectively) | $ | 30,133 | $ | 37,407 | |||
Accrued compensation | 46,552 | 77,607 | |||||
Accrued other | 33,164 | 29,522 | |||||
Income taxes payable | 1,526 | 5,057 | |||||
Deferred revenue and customer deposits | 301,925 | 310,594 | |||||
Total current liabilities | 413,300 | 460,187 | |||||
Other long-term liabilities | 8,308 | 3,976 | |||||
Deferred tax liability | 151,563 | 277,599 | |||||
Accrued long-term retirement benefits | 35,246 | 32,117 | |||||
Long-term deferred revenue and customer deposits | 91,409 | 86,595 | |||||
Long-term debt | 600,000 | 300,000 | |||||
Contingent liabilities, net of current portion | — | 4,789 | |||||
Total liabilities | 1,299,826 | 1,165,263 | |||||
Commitments and contingencies (Note 17) | |||||||
Stockholders’ equity: | |||||||
Preferred stock, $0.001 par value: 5,000,000 shares authorized; no shares issued or outstanding at March 31, 2018 and 2017 | — | — | |||||
Common stock, $0.001 par value: 300,000,000 shares authorized; 117,744,913 and 115,917,431 shares issued and 80,270,023 and 92,041,288 shares outstanding at March 31, 2018 and 2017, respectively | 117 | 116 | |||||
Additional paid-in capital | 2,665,120 | 2,693,846 | |||||
Accumulated other comprehensive income (loss) | 2,895 | (3,472 | ) | ||||
Treasury stock at cost, 37,474,890 and 23,876,143 shares at March 31, 2018 and 2017, respectively | (995,843 | ) | (570,921 | ) | |||
Retained earnings | 396,493 | 316,681 | |||||
Total stockholders’ equity | 2,068,782 | 2,436,250 | |||||
Total liabilities and stockholders’ equity | $ | 3,368,608 | $ | 3,601,513 | |||
The accompanying notes are an integral part of these consolidated financial statements.
F-4
NetScout Systems, Inc.
Consolidated Statements of Operations
(In thousands, except per share data)
Year Ended March 31, | |||||||||||
2018 | 2017 | 2016 | |||||||||
Revenue: | |||||||||||
Product | $ | 546,127 | $ | 735,531 | $ | 633,408 | |||||
Service | 440,660 | 426,581 | 322,011 | ||||||||
Total revenue | 986,787 | 1,162,112 | 955,419 | ||||||||
Cost of revenue: | |||||||||||
Product (related party balances of $245, $7,229 and $25,055, respectively) | 164,526 | 238,002 | 238,037 | ||||||||
Service (related party balances of $665, $745 and $5,736, respectively) | 107,379 | 108,137 | 90,412 | ||||||||
Total cost of revenue | 271,905 | 346,139 | 328,449 | ||||||||
Gross profit | 714,882 | 815,973 | 626,970 | ||||||||
Operating expenses: | |||||||||||
Research and development (related party balances of $3, $1,624 and $16,701, respectively) | 215,076 | 232,701 | 208,630 | ||||||||
Sales and marketing (related party balances of $2, $2,423 and $15,430, respectively) | 312,536 | 328,628 | 293,335 | ||||||||
General and administrative (related party balances of $1,703, $4,099 and $16,055, respectively) | 109,479 | 118,438 | 117,714 | ||||||||
Amortization of acquired intangible assets | 76,640 | 70,141 | 32,373 | ||||||||
Restructuring charges | 5,209 | 4,001 | 468 | ||||||||
Total operating expenses | 718,940 | 753,909 | 652,520 | ||||||||
Income (loss) from operations | (4,058 | ) | 62,064 | (25,550 | ) | ||||||
Interest and other income (expense), net: | |||||||||||
Interest income | 1,808 | 1,021 | 691 | ||||||||
Interest expense | (12,633 | ) | (9,184 | ) | (6,329 | ) | |||||
Other income (expense), net (related party balances of $56, $426 and ($379), respectively) | (3,776 | ) | (1,716 | ) | (1,251 | ) | |||||
Total interest and other expense, net | (14,601 | ) | (9,879 | ) | (6,889 | ) | |||||
Income (loss) before income tax expense (benefit) | (18,659 | ) | 52,185 | (32,439 | ) | ||||||
Income tax expense (benefit) | (98,471 | ) | 18,894 | (4,070 | ) | ||||||
Net income (loss) | $ | 79,812 | $ | 33,291 | $ | (28,369 | ) | ||||
Basic net income (loss) per share | $ | 0.91 | $ | 0.36 | $ | (0.35 | ) | ||||
Diluted net income (loss) per share | $ | 0.90 | $ | 0.36 | $ | (0.35 | ) | ||||
Weighted average common shares outstanding used in computing: | |||||||||||
Net income (loss) per share—basic | 87,425 | 92,226 | 81,927 | ||||||||
Net income (loss) per share—diluted | 88,261 | 92,920 | 81,927 | ||||||||
The accompanying notes are an integral part of these consolidated financial statements.
F-5
NetScout Systems, Inc.
Consolidated Statements of Comprehensive Income (Loss)
(In thousands)
Year Ended March 31, | |||||||||||
2018 | 2017 | 2016 | |||||||||
Net income (loss) | $ | 79,812 | $ | 33,291 | $ | (28,369 | ) | ||||
Other comprehensive income (loss): | |||||||||||
Cumulative translation adjustments | 4,889 | (1,000 | ) | 1,446 | |||||||
Recognition of actuarial net gain (loss) from pension and other post-retirement plans, net of taxes (benefit) of $435, ($368) and $215 | 1,353 | (858 | ) | 632 | |||||||
Changes in market value of investments: | |||||||||||
Changes in unrealized (losses) gains, net of (benefit) taxes of $15, $0 and $0 | (6 | ) | (59 | ) | 3 | ||||||
Total net change in market value of investments | (6 | ) | (59 | ) | 3 | ||||||
Changes in market value of derivatives: | |||||||||||
Changes in market value of derivatives, net of tax (benefits) of $267, ($167), and ($329) | 812 | (277 | ) | (523 | ) | ||||||
Reclassification adjustment for net (losses) gains included in net income (loss), net of (benefit) taxes of ($219), $135, and $915 | (681 | ) | 223 | 1,586 | |||||||
Total net change in market value of derivatives | 131 | (54 | ) | 1,063 | |||||||
Other comprehensive income (loss) | 6,367 | (1,971 | ) | 3,144 | |||||||
Total comprehensive income (loss) | $ | 86,179 | $ | 31,320 | $ | (25,225 | ) | ||||
The accompanying notes are an integral part of these consolidated financial statements.
F-6
NetScout Systems, Inc.
Consolidated Statements of Stockholders' Equity
(In thousands, except share data)
Common stock Voting | Additional Paid In Capital | Accumulated Other Comprehensive Income (Loss) | Treasury stock | Retained Earnings | Total Stockholders' Equity | ||||||||||||||||||||||||
Shares | Par Value | Shares | Stated Value | ||||||||||||||||||||||||||
Balance, March 31, 2015 | 50,812,548 | $ | 51 | $ | 298,101 | $ | (4,645 | ) | 10,004,743 | $ | (169,516 | ) | $ | 311,759 | $ | 435,750 | |||||||||||||
Net loss | (28,369 | ) | (28,369 | ) | |||||||||||||||||||||||||
Unrealized net investment gains | 3 | 3 | |||||||||||||||||||||||||||
Unrealized net gains on derivative financial instruments | 1,063 | 1,063 | |||||||||||||||||||||||||||
Cumulative translation adjustments | 1,446 | 1,446 | |||||||||||||||||||||||||||
Recognition from actuarial net gain from pension and other post-retirement plan | 632 | 632 | |||||||||||||||||||||||||||
Issuance of common stock pursuant to vesting of restricted stock units | 736,170 | 1 | 1 | ||||||||||||||||||||||||||
Stock-based compensation expense for restricted stock units granted to employees | 26,609 | 26,609 | |||||||||||||||||||||||||||
Issuance of common stock under employee stock purchase plan | 447,252 | 10,560 | 10,560 | ||||||||||||||||||||||||||
Repurchase of treasury stock | 10,402,402 | (311,850 | ) | (311,850 | ) | ||||||||||||||||||||||||
Issuance of shares related to the Comms Transaction | 62,499,644 | 62 | 2,305,549 | 2,305,611 | |||||||||||||||||||||||||
Excess tax benefit from share-based compensation awards | 1,926 | 1,926 | |||||||||||||||||||||||||||
Balance, March 31, 2016 | 114,495,614 | 114 | 2,642,745 | (1,501 | ) | 20,407,145 | (481,366 | ) | 283,390 | 2,443,382 | |||||||||||||||||||
Net income | 33,291 | 33,291 | |||||||||||||||||||||||||||
Unrealized net investment losses | (59 | ) | (59 | ) | |||||||||||||||||||||||||
Unrealized net losses on derivative financial instruments | (54 | ) | (54 | ) | |||||||||||||||||||||||||
Cumulative translation adjustments | (1,000 | ) | (1,000 | ) | |||||||||||||||||||||||||
Recognition of actuarial net losses from pension and other post-retirement plan | (858 | ) | (858 | ) | |||||||||||||||||||||||||
Issuance of common stock pursuant to vesting of restricted stock units | 950,159 | 2 | 2 | ||||||||||||||||||||||||||
Stock-based compensation expense for restricted stock units granted to employees | 36,449 | 36,449 | |||||||||||||||||||||||||||
Issuance of common stock under employee stock purchase plan | 471,658 | 15,697 | 15,697 | ||||||||||||||||||||||||||
Repurchase of treasury stock | 3,468,998 | (89,555 | ) | (89,555 | ) | ||||||||||||||||||||||||
Shortfall from tax benefit from share-based compensation awards | (1,045 | ) | (1,045 | ) | |||||||||||||||||||||||||
Balance, March 31, 2017 | 115,917,431 | 116 | 2,693,846 | (3,472 | ) | 23,876,143 | (570,921 | ) | 316,681 | 2,436,250 | |||||||||||||||||||
Net income | 79,812 | 79,812 | |||||||||||||||||||||||||||
Unrealized net investment losses | (6 | ) | (6 | ) | |||||||||||||||||||||||||
Unrealized net gains on derivative financial instruments | 131 | 131 | |||||||||||||||||||||||||||
Cumulative translation adjustments | 4,889 | 4,889 | |||||||||||||||||||||||||||
Recognition of actuarial net gains from pension and other post-retirement plan | 1,353 | 1,353 | |||||||||||||||||||||||||||
Issuance of common stock pursuant to vesting of restricted stock units | 1,216,535 | 1 | 1 | ||||||||||||||||||||||||||
Stock-based compensation expense for restricted stock units granted to employees | 43,425 | 43,425 | |||||||||||||||||||||||||||
Issuance of common stock under employee stock purchase plan | 610,947 | 17,849 | 17,849 | ||||||||||||||||||||||||||
Repurchase of treasury stock | (90,000 | ) | 13,598,747 | (424,922 | ) | (514,922 | ) | ||||||||||||||||||||||
Balance, March 31, 2018 | 117,744,913 | $ | 117 | $ | 2,665,120 | $ | 2,895 | 37,474,890 | $ | (995,843 | ) | $ | 396,493 | $ | 2,068,782 | ||||||||||||||
The accompanying notes are an integral part of these consolidated financial statements.
F-7
NetScout Systems, Inc.
Consolidated Statements of Cash Flows
(In thousands)
Year Ended March 31, | |||||||||||
2018 | 2017 | 2016 | |||||||||
Cash flows from operating activities: | |||||||||||
Net income (loss) | $ | 79,812 | $ | 33,291 | $ | (28,369 | ) | ||||
Adjustments to reconcile net income (loss) to cash provided by operating activities, net of the effects of acquisitions: | |||||||||||
Depreciation and amortization | 153,503 | 160,863 | 140,071 | ||||||||
Loss on disposal of fixed assets | 481 | 271 | 134 | ||||||||
Deal related compensation expense and accretion charges | 153 | 153 | 6,728 | ||||||||
Share-based compensation expense associated with equity awards | 47,317 | 39,189 | 28,351 | ||||||||
Deferred income taxes | (127,784 | ) | (11,008 | ) | (42,121 | ) | |||||
Other (gains) losses | 18 | (111 | ) | (279 | ) | ||||||
Changes in assets and liabilities | |||||||||||
Accounts receivable and unbilled costs | 84,952 | (48,080 | ) | (23,259 | ) | ||||||
Due from related party | 443 | 25,055 | (18,483 | ) | |||||||
Inventories | 1,006 | 12,456 | 5,523 | ||||||||
Prepaid expenses and other assets | 20,147 | (24,751 | ) | (29,481 | ) | ||||||
Accounts payable | (8,929 | ) | 405 | 2,334 | |||||||
Accrued compensation and other expenses | (17,718 | ) | 6,785 | 33,250 | |||||||
Due to related party | (75 | ) | (2,792 | ) | (6,743 | ) | |||||
Income taxes payable | (2,734 | ) | 1,963 | 3,910 | |||||||
Deferred revenue | (8,138 | ) | 33,075 | 25,645 | |||||||
Net cash provided by operating activities | 222,454 | 226,764 | 97,211 | ||||||||
Cash flows from investing activities: | |||||||||||
Purchase of marketable securities | (114,178 | ) | (199,841 | ) | (100,278 | ) | |||||
Proceeds from maturity of marketable securities | 196,041 | 181,321 | 118,881 | ||||||||
Purchase of fixed assets | (15,913 | ) | (29,696 | ) | (24,783 | ) | |||||
Purchase of intangible assets | (544 | ) | (1,031 | ) | (3,962 | ) | |||||
Acquisition of businesses, net of cash acquired | (8,334 | ) | (4,606 | ) | 27,700 | ||||||
(Increase) decrease in deposits | (330 | ) | 129 | (150 | ) | ||||||
Contingent purchase consideration | 523 | 660 | — | ||||||||
Collection of contingently returnable consideration | — | 12,864 | 9,306 | ||||||||
Capitalized software development costs | (137 | ) | (1,421 | ) | (1,625 | ) | |||||
Net cash provided by (used in) investing activities | 57,128 | (41,621 | ) | 25,089 | |||||||
Cash flows from financing activities: | |||||||||||
Issuance of common stock under stock plans | 1 | 2 | 1 | ||||||||
Payment of contingent consideration | (660 | ) | — | — | |||||||
Treasury stock repurchases, including accelerated share repurchases | (501,324 | ) | (79,996 | ) | (302,784 | ) | |||||
Tax withholding on restricted stock units | (13,598 | ) | (9,559 | ) | (9,066 | ) | |||||
Proceeds from issuance of long-term debt, net of issuance costs | 294,619 | — | 294,623 | ||||||||
Net cash used in financing activities | (220,962 | ) | (89,553 | ) | (17,226 | ) | |||||
Effect of exchange rate changes on cash and cash equivalents | 6,385 | (761 | ) | 744 | |||||||
Net increase in cash and cash equivalents | 65,005 | 94,829 | 105,818 | ||||||||
Cash and cash equivalents, beginning of year | 305,726 | 210,897 | 105,079 | ||||||||
Cash and cash equivalents, end of year | $ | 370,731 | $ | 305,726 | $ | 210,897 | |||||
Supplemental disclosures of cash flow information: | |||||||||||
Cash paid for interest | $ | 9,604 | $ | 6,442 | $ | 3,807 | |||||
Cash paid for income taxes | $ | 18,216 | $ | 49,290 | $ | 50,658 | |||||
Non-cash transactions: | |||||||||||
Transfers of inventory to fixed assets | $ | 5,556 | $ | 4,928 | $ | 1,229 | |||||
Additions to property, plant and equipment included in accounts payable | $ | 1,379 | $ | 1,241 | $ | (1,065 | ) | ||||
Debt issuance costs settled through the issuance of additional debt | $ | — | $ | — | $ | 5,377 | |||||
Issuance of common stock under employee stock purchase plans | $ | 17,849 | $ | 15,697 | $ | 10,560 | |||||
Purchase consideration | $ | — | $ | — | $ | 2,276,256 | |||||
Contingently returnable consideration | $ | — | $ | — | $ | 29,355 | |||||
Contingent consideration related to acquisition, included in accrued other | $ | 523 | $ | 660 | $ | — | |||||
Tenant improvement allowance | $ | 2,104 | $ | — | $ | — | |||||
The accompanying notes are an integral part of these consolidated financial statements.
F-8
NetScout Systems, Inc.
Notes to Consolidated Financial Statements
NOTE 1 – NATURE OF BUSINESS
NetScout Systems, Inc., or NetScout or the Company, has been a technology innovator for three-plus decades since its founding in 1984. The Company's solutions, based on patented Adaptive Service Intelligence (ASI) technology, help customers identify network and application performance issues, defend their networks from denial of service (DDoS) attacks, and rapidly find and isolate advanced network threats. As a result, customers can quickly resolve issues that cause business disruptions, downtime, poor service quality or compromised security, thereby driving compelling returns on their investments in their network and broader information technology (IT) initiatives. The Company reports revenue and income in one reportable segment.
NOTE 2 – SUMMARY OF SIGNIFICANT ACCOUNTING POLICIES
Principles of Consolidation
The consolidated financial statements include the accounts of NetScout and its wholly owned subsidiaries. Inter-company transactions and balances have been eliminated in consolidation.
Fiscal Year End
During fiscal years 2018 and 2017, the fiscal year end of NetScout and its wholly owned subsidiaries ended on March 31st. During the fiscal year 2016, the fiscal year end of NetScout and its wholly owned subsidiaries ended on March 31st, except for Fluke Networks Enterprise business, which ended on April 1, 2016. During fiscal years 2018 and 2017, NetScout’s quarters ended on the last calendar day of the months of June, September and December. The fiscal year 2016 quarter end dates of the entities acquired as part of the acquisition of Danaher Corporation's (Danaher) Communications Business in July 2015 (Comms Transaction) were October 2nd and December 31st. The Company does not adjust for the difference in fiscal periods between the acquired entities and itself, as such difference would be fewer than 93 days, pursuant to Regulation S-X Rule 3A-02. References herein to Fiscal 2018, 2017 and 2016 refer to the fiscal years ended March 31, 2018, 2017, and 2016, respectively.
Segment Reporting
Our operating segments are determined based on the units that constitute a business for which financial information is available and for which operating results are regularly reviewed by the Chief Operating Decision Maker (CODM). The Company reports revenue and income in one reportable segment.
Use of Estimates
The preparation of financial statements in conformity with generally accepted accounting principles (GAAP) requires management to make estimates and assumptions that affect the reported amounts of assets and liabilities and disclosures of contingent assets and liabilities at the date of the consolidated financial statements and the reported amounts of revenues and expenses during the reporting period. Significant estimates in these financial statements include those involving revenue recognition, valuation of goodwill and acquired assets and liabilities, valuation of the pension obligation and share-based compensation. These items are continuously monitored and analyzed by management for changes in facts and circumstances and material changes in these estimates could occur in the future.
Cash and Cash Equivalents and Marketable Securities
Under current authoritative guidance, NetScout has classified its investments as "available-for-sale" which are carried at fair value based on quoted market prices and associated unrealized gains or losses are recorded as a separate component of stockholders’ equity until realized. NetScout considers all highly liquid investments purchased with an original maturity of three months or less to be cash equivalents and those investments with original maturities greater than three months to be marketable securities.
At March 31, 2018 and periodically throughout the year, NetScout has maintained cash balances in various operating accounts in excess of federally insured limits. NetScout limits the amount of credit exposure by investing only with credit worthy institutions which the Company believes are those institutions with an investment grade rating for deposits.
F-9
Revenue Recognition
The Company exercises judgment and uses estimates in connection with determining the amounts of product and services revenues to be recognized in each accounting period.
The Company derives revenues primarily from the sale of network management tools and security solutions for service provider and enterprise customers, which include hardware, software and service offerings. The majority of the Company’s product sales consist of hardware products with embedded software that are essential to providing customers the intended functionality of the solutions. The Company also sells stand-alone software solutions to provide customers with enhanced functionality. In addition, the Company sells hardware bundled with a software license. Product revenue is recognized upon shipment, provided that evidence of an arrangement exists, title and risk of loss have passed to the customer, and in the case of software products, when the customer has the rights and ability to access the software, fees are fixed or determinable and collection of the related receivable is reasonably assured. If any significant obligations to the customer remain post-delivery, typically involving obligations relating to installation and acceptance by the customer, revenue recognition is deferred until such obligations have been fulfilled. Because many of the Company’s solutions are comprised of both hardware and more than incidental software components, the Company recognizes revenue in accordance with authoritative guidance on both hardware and software revenue recognition.
The Company's service offerings include installation, integration, extended warranty and maintenance services, post-contract customer support (PCS), and other professional services including consulting and training. The Company generally provides software and/or hardware support as part of product sales. Revenue related to the initial bundled software and hardware support is recognized ratably over the support period. In addition, customers can elect to purchase extended support agreements for periods after the initial software/hardware warranty expiration. Support services generally include rights to unspecified upgrades (when and if available), telephone and internet-based support, updates, bug fixes and hardware repair and replacement. Consulting services are recognized upon delivery or completion of performance. Reimbursements of out-of-pocket expenditures incurred in connection with providing consulting services are included in services revenue, with the offsetting expense recorded in cost of service revenue. Training services include on-site and classroom training. Training revenues are recognized upon delivery of the training.
Generally, the Company's contracts are accounted for individually. However, when contracts are closely interrelated and dependent on each other, it may be necessary to account for two or more contracts as one to reflect the substance of the group of contracts.
Multi-element arrangements are concurrent customer purchases of a combination of the Company's product and service offerings that may be delivered at various points in time. For multi-element arrangements comprised only of hardware products and related services, the Company allocates the total arrangement consideration to the multiple elements based on each element’s fair value compared to the total relative selling price of all the elements. Each element’s selling price is based on management’s best estimate of selling price (BESP) paid by customers based on the element’s historical pricing when vendor-specific objective evidence (VSOE) or third-party evidence (TPE) does not exist. The Company has established BESP for product elements as the average or median selling price the element was recently sold for, whether sold alone or sold as part of a multiple element transaction. The Company also considers its overall pricing objectives and practices across different sales channels and geographies, and market conditions. The Company reviews sales of the product elements on a quarterly basis and updates when appropriate, its BESP for such elements to ensure that it reflects recent pricing experience. The Company has established VSOE for a majority of its service elements based on historical stand-alone sales or by the renewal rate offered to the customer. However, certain business units acquired as part of the Comms Transaction are unable to establish VSOE for undelivered elements. This occurs because the pricing for standalone sales does not occur in tight bands around a midpoint, and they are not contractually fixed. In these scenarios the Company has typically established BESP by creating wider bands around a midpoint for standalone transactions or in some cases using cost plus a margin for the underlying services and products. If VSOE of fair value does not exist for a deliverable, the Company has determined that BESP is the highest level of fair value that exists for those deliverables.
For multi-element arrangements comprised only of software products and related services, the Company allocates a portion of the total arrangement consideration to the undelivered elements, primarily support agreements and professional services, using vendor-specific objective evidence of fair value for the undelivered elements. The remaining portion of the total arrangement consideration is allocated to the delivered software, referred to as the residual method. VSOE of fair value of the undelivered elements is based on the price customers pay when the element is sold separately. The Company reviews the separate sales of the undelivered elements on a regular basis and updates when appropriate, its VSOE of fair value for such
F-10
elements to ensure that it reflects recent pricing experience. If the Company cannot objectively determine the VSOE of the fair value of any undelivered software element, revenue is deferred until all elements are delivered and services have been performed, or until fair value can objectively be determined for any remaining undelivered elements. However, if the only undelivered element is maintenance and support, the entire arrangement fee is recognized over the service period.
For multi-element arrangements comprised of a combination of hardware and software elements, the total arrangement consideration is bifurcated between the hardware and hardware related deliverables and the software and software related deliverables based on the relative selling prices of all deliverables as a group. Then, arrangement consideration for the hardware and hardware-related services is recognized upon delivery or as the related services are provided outlined above and revenue for the software and software-related services is allocated following the residual method and recognized based upon delivery or as the related services are provided.
The Company's products are distributed through its direct sales force and indirect distribution channels through alliances with resellers and distributors. Revenue arrangements with resellers and distributors are recognized on a sell-in basis; that is, when the Company delivers the product to the reseller or distributor. The Company records consideration given to a reseller or distributor as a reduction of revenue to the extent the Company has recorded revenue from the reseller or distributor. With limited exceptions, the Company's return policy does not allow product returns for a refund. Returns have been insignificant to date. In addition, the Company has a history of successfully collecting receivables from our resellers and distributors.
Commission Expense
The Company recognizes commission expense related to the renewal of maintenance contracts at the time an order is booked. As a result, commission expense can be recognized in full even though the related revenue may not be fully recognized. Base commission expense on product revenue and corresponding new maintenance contracts is recognized in the same period as related product revenue, typically upon shipment.
Uncollected Deferred Revenue
Because of NetScout's revenue recognition policies, there are circumstances for which the Company does not recognize revenue relating to sales transactions that have been billed, but the related account receivable has not been collected. While the receivable represents an enforceable obligation, for balance sheet presentation purposes, the Company has not recognized the deferred revenue or the related account receivable and no amounts appear in the consolidated balance sheets for such transactions. The aggregate amount of unrecognized accounts receivable and deferred revenue was $20.0 million and $17.9 million at March 31, 2018 and 2017, respectively.
Concentration of Credit Risk
Financial instruments that potentially subject the Company to concentration of credit risk consist primarily of investments, trade accounts receivable and accounts payable. NetScout's cash, cash equivalents, and marketable securities are placed with financial institutions with high credit standings.
At March 31, 2018 and 2017 respectively, the Company had no direct customers or indirect channel partners which accounted for more than 10% of the accounts receivable balance.
During the fiscal year ended March 31, 2018 no direct customers or indirect channel partners accounted for more than 10% of total revenue. During the fiscal years ended March 31, 2017 and 2016, one direct customer, Verizon, accounted for more than 10% of total revenue, while no indirect channel partner accounted for more than 10% of total revenue.
As disclosed parenthetically within the Company's consolidated balance sheet, the Company had a receivable from related parties in the amount of $3.2 million that represents a concentration of credit risk at March 31, 2018.
Historically, the Company has not experienced any significant failure of its customers to meet their payment obligations nor does the Company anticipate material non-performance by its customers in the future; accordingly, the Company does not require collateral from its customers. However, if the Company’s assumptions are incorrect, there could be an adverse impact on its allowance for doubtful accounts.
F-11
Trade Receivable Valuations
Accounts receivable are stated at their net realizable value. The allowance against gross trade receivables reflects the best estimate of probable losses inherent in the receivables portfolio determined on the basis of historical experience, specific allowances for known troubled accounts and other currently available information.
Inventories
Inventories are stated at the lower of actual cost or net realizable value. Cost is determined by using the first-in, first-out (FIFO) method.
Fixed Assets
Fixed assets are stated at cost and depreciated using the straight-line method over the estimated useful lives of the assets. Leasehold improvements are amortized on a straight-line basis over the shorter of the lease term or anticipated useful life of the improvement. Gains and losses upon asset disposal are recognized in the year of disposition. Expenditures for replacements and building improvements are capitalized, while expenditures for maintenance and repairs are charged against earnings as incurred.
Valuation of Goodwill, Intangible Assets and Other Acquisition Accounting Items
The Company amortizes acquired definite-lived intangible assets over their estimated useful lives. Goodwill and other indefinite-lived intangible assets are not amortized but subject to annual impairment tests; more frequently if events or circumstances occur that would indicate a potential decline in their fair value. The Company performs the assessment annually during the fourth quarter and on an interim basis if potential impairment indicators arise. The Company has identified two reporting units: (1) Service Assurance and (2) Security.
To test impairment, the Company first assesses qualitative factors to determine whether the existence of events and circumstances indicate that it is more likely than not that the intangible asset is impaired. If based on the Company's qualitative assessment it is more likely than not that the fair value of the intangible asset is less than its carrying amount, quantitative impairment testing is required. However, if the Company concludes otherwise, quantitative impairment testing is not required. During fiscal year 2018, the Company performed a quantitative analysis for goodwill and its non-amortizing intangible asset. The Company determined the fair value of the reporting unit's goodwill using established income and market valuation approaches and the fair value of its trade names using a forward-looking relief from royalty model. All goodwill and indefinite-lived intangible assets were estimated to be recoverable as of January 31, 2018.
The Company completed three acquisitions during the three-year period ended March 31, 2018. The acquisition method of accounting requires an estimate of the fair value of the assets and liabilities acquired as part of these transactions. In order to estimate the fair value of acquired intangible assets, the Company uses a relief from royalty model which requires management to estimate: future revenues expected to be generated by the acquired intangible assets, a royalty rate which a market participant would pay related to the projected revenue stream, a present value factor which approximates a risk adjusted rate of return for a market participant purchasing the assets, and a technology migration curve representing a period of time over which the technology assets or some portion thereof are still being used. The Company is also required to develop the fair value for customer relationships acquired as part of these transactions which requires that we create estimates for the following items: a projection of future revenues associated with the acquired company’s existing customers, a turnover rate for those customers, a margin related to those sales, and a risk adjusted rate of return for a market participant purchasing those relationships.
The Company has a contingent liability for $523 thousand related to the acquisition of Efflux in July 2017 for which an escrow account was established to cover damages NetScout suffers related to any liabilities that NetScout did not agree to assume or as a result of the breach of representations and warranties of the seller as described in the merger agreement. Generally, indemnification claims that Efflux would be liable for are limited to the total amount of the escrow account and shall be the sole source for the satisfaction of any damages to the Company for such claims, but such limitation does not apply with respect to seller's breach of certain fundamental representations or related to other specified indemnity items, for which certain of Efflux's shareholders may be liable for additional amounts in excess of the escrow amount. Except to the extent that valid indemnification claims are made prior to such time, the $523 thousand will be paid to the seller on July 12, 2018.
The Company's contingent purchase consideration at March 31, 2017 included $660 thousand related to the acquisition of Avvasi Incorporated (Avvasi) in August 2016 for which an escrow account was established to cover damages NetScout suffers
F-12
related to any liabilities that NetScout did not agree to assume or as a result of the breach of representations and warranties of the seller as described in the asset purchase agreement. The $660 thousand was paid to the seller on August 21, 2017.
The Comms Transaction during fiscal year ended March 31, 2016 contained both contingently returnable consideration and contingent purchase consideration. The contingently returnable consideration represented a contingent right of return from Danaher to reimburse NetScout for certain cash awards paid by NetScout to employees of the Communications Business transferred to Newco for post-combination services on various dates through August 4, 2016. During the fiscal year ended March 31, 2017, certain post-combination cash retention payments had been disbursed. Danaher reimbursed the Company for those costs and NetScout reimbursed Danaher for the tax benefit.
The acquisition of Simena LLC on November 18, 2011 also contained contingent consideration based on the ultimate settlement of assets and liabilities acquired as part of the transaction, and the former owners' future period of employment with the Company. Contingent consideration accounting requires the Company to estimate the probability of various settlement scenarios, the former owners' expected period of employment with NetScout, and a risk adjusted interest rate to present value the payment streams.
Capitalized Software Development Costs
Costs incurred in the research and development of the Company’s products are expensed as incurred, except for certain software development costs. Costs associated with the development of computer software are expensed prior to the establishment of technological feasibility and capitalized thereafter until the related software products are available for first customer shipment. Such costs are amortized using the straight-line method over the estimated economic life of the product, which generally does not exceed three years. Capitalized software development costs are periodically assessed for recoverability in the event of changes to the anticipated future revenue for the software products or changes in product technologies. Unamortized capitalized software development costs that are determined to be in excess of the net realizable value of the software products would be expensed in the period in which such a determination is made.
Typically for accounting purposes, these R&D investments have not been capitalized because of the development methodology employed. The developments are added individually to the core code over a shorter period of time but marketed as a release once all portions are complete.
Amortization included as cost of product revenue was $1.0 million, $594 thousand and $0 for the fiscal years ended March 31, 2018, 2017, and 2016, respectively. The Company capitalized $0.1 million and $1.4 million in software development costs in the fiscal years ended March 31, 2018 and 2017.
Derivative Financial Instruments
Under authoritative guidance for derivative instruments and hedging activities, all hedging activities must be documented at the inception of the hedge and must meet the definition of highly effective in offsetting changes to future cash flows in order for the derivative to qualify for hedge accounting. Under the guidance, if an instrument qualifies for hedge accounting, the changes in the fair value each period for open contracts, measured at the end of the period, are recorded to other comprehensive income. Otherwise, changes in the fair value are recorded in earnings each period. Management must perform initial and ongoing tests in order to qualify for hedge accounting. In accordance with the guidance, the Company accounts for its instruments under hedge accounting. The effectiveness and a measurement of ineffectiveness of qualifying hedge contracts are assessed by the Company quarterly. The Company records the fair value of its derivatives in prepaid expenses and other current assets and accrued other in the Company's consolidated balance sheet. The effective portion of gains or losses resulting from changes in the fair value of qualifying hedges are recorded in other comprehensive income (loss) until the forecasted transaction occurs, with any ineffective portion classified directly to the Company’s consolidated statement of operations based on the expense categories of the items being hedged. When forecasted transactions occur, unrealized gains or losses associated with the effective portion of the hedge are reclassified to the respective expense categories in the Company’s consolidated statement of operations. Gains or losses related to hedging activity are included as operating activities in the Company’s consolidated statement of cash flows. If the underlying forecasted transactions do not occur, or it becomes probable that they will not occur, the gain or loss on the related cash flow hedge is recognized immediately in earnings.
F-13
Contingencies
NetScout accounts for claims and contingencies in accordance with authoritative guidance that requires an estimated loss to be recorded from a claim or loss contingency when information available prior to issuance of our consolidated financial statements indicates that it is probable that a liability has been incurred at the date of the consolidated financial statements and the amount of the loss can be reasonably estimated. If NetScout determines that it is reasonably possible but not probable that an asset has been impaired or a liability has been incurred or if the amount of a probable loss cannot be reasonably estimated, then in accordance with the authoritative guidance, we disclose the amount or range of estimated loss if the amount or range of estimated loss is material. Accounting for claims and contingencies requires NetScout to use its judgment. NetScout consults with legal counsel on those issues related to litigation and seeks input from other experts and advisors with respect to matters in the ordinary course of business.
Contingent liabilities include contingent consideration in connection with the Company’s acquisitions. Contingent consideration represents earnout payments in connection with the Company’s acquisitions and is recognized at fair value on the acquisition date and remeasured each reporting period with subsequent adjustments recognized in the consolidated statements of income. The Company discounts the contingent purchase consideration to present value using a risk adjusted interest rate at each reporting period. Contingent consideration is valued using significant inputs that are not observable in the market which are defined as Level 3 inputs pursuant to fair value measurement accounting. The Company believes its estimates and assumptions are reasonable, however, there is significant judgment involved.
Changes in the fair value of contingent liabilities may result from changes in discount periods. The Company reflects changes in fair value due to probability changes in earnings in the consolidated statements of income. Earnout payments are reflected in cash flows from financing activities and the changes in fair value are reflected in cash flows from operating activities in the consolidated statements of cash flows.
Share-Based Compensation
NetScout recognizes compensation expense for all share-based payments granted. Under the fair value recognition provisions, share-based compensation is calculated net of an estimated forfeiture rate and compensation cost is only recognized for those shares expected to vest on a straight-line basis over the expected requisite service period of the award.
Foreign Currency
NetScout accounts for its reporting of foreign operations in accordance with guidance which establishes guidelines for the determination of the functional currency of foreign subsidiaries. In accordance with the guidance, NetScout has determined its functional currency for those foreign subsidiaries that are an extension of NetScout's U.S. operations to be the U.S. Dollar.
Assets and liabilities of subsidiaries operating outside the United States with a functional currency other than U.S. dollars are translated into United States dollars using the period-end exchange rate, and income and expense items are translated using the average exchange rate during the period. Cumulative translation adjustments are reflected as a separate component of stockholders’ equity.
NetScout will experience currency exchange risk with respect to foreign currency denominated expenses. In order to partially offset the risks associated with the effects of certain foreign currency exposures, NetScout has established a program that utilizes foreign currency forward contracts. Under this program, increases or decreases in foreign currency exposures are partially offset by gains or losses on forward contracts, to mitigate the impact of foreign currency transaction gains or losses. The Company does not use forward contracts to engage in currency speculation. All outstanding foreign currency forward contracts are recorded at fair value at the end of each fiscal period.
The Company had foreign currency losses of $4.1 million, $2.5 million and $1.5 million for the fiscal years ended March 31, 2018, 2017 and 2016, respectively. These amounts are included in other income (expense), net.
Advertising Expense
NetScout recognizes advertising expense as incurred. Advertising expense was $6.5 million, $8.1 million and $6.4 million for the fiscal years ended March 31, 2018, 2017 and 2016, respectively.
F-14
Comprehensive Income (Loss)
Comprehensive income (loss) is comprised of net income (loss) and other comprehensive income (loss). Other comprehensive income (loss) typically consists of unrealized gains and losses on marketable securities, unrealized gain (loss) on hedge contracts, actuarial gains and losses, and foreign currency translation adjustments.
Income Taxes
NetScout accounts for its income taxes under the asset and liability method. Under the asset and liability method, deferred tax assets and liabilities are recognized based on anticipated future tax consequences attributable to differences between financial statement carrying amounts of assets and liabilities and their respective tax basis, as well as the effect of any net operating loss and tax credit carryforwards. Income tax expense is comprised of the current tax liability or benefit and the change in deferred tax assets and liabilities. We evaluate the recoverability of deferred tax assets by considering all positive and negative evidence relating to future profitability. We weigh objective and verifiable evidence more heavily in this analysis. In situations where we conclude that we do not have sufficient objective and verifiable evidence to support the realizability of the deferred tax asset, we create a valuation allowance against it.
Recent Accounting Standards
In March 2018, the Financial Account Standards Board (FASB) issued Accounting Standards Update (ASU) 2018-05 associated with the accounting and disclosures around the enactment of the Act and the Securities and Exchange Commission’s Staff Accounting Bulletin No. 118, Income Tax Accounting Implications of the Tax Cuts and Jobs Act (SAB 118), which the Company has adopted.
In February 2018, the FASB issued ASU 2018-02, Reclassification of Certain Tax Effects From Accumulated Other Comprehensive Income. ASU 2018-02 amends ASC 220, Income Statement - Reporting Comprehensive Income, to allow a reclassification from accumulated other comprehensive income to retained earnings for stranded tax effects resulting from the Tax Act. In addition, under the ASU 2018-02, the Company may be required to provide certain disclosures regarding stranded tax effects. ASU 2018-02 is effective for years beginning after December 15, 2018, and interim periods within those fiscal years. ASU 2018-02 is effective for the Company beginning April 1, 2019. Early adoption is permitted. The Company does not believe the adoption of ASU 2018-02 will have a material impact on its consolidated financial statements.
In August 2017, the FASB issued ASU 2017-12, Derivatives and Hedging (Topic 815), Targeted Improvements to Accounting for Hedging Activities (ASU 2017-12). ASU 2017-12 intends to better align an entity's risk management activities and financial reporting for hedging relationships through changes to both the designation and measurement guidance for qualifying hedging relationships and the presentation of hedge results. The amendments expand and refine hedge accounting for both non-financial and financial risk components and align the recognition and presentation of the effects of the hedging instrument and the hedged item in the financial statements. This standard is effective for financial statements issued for fiscal years beginning after December 15, 2018, with early adoption permitted. ASU 2017-12 is effective for the Company beginning April 1, 2019. The Company is currently assessing the potential impact of the adoption of ASU 2017-12 on its consolidated financial statements.
In March 2017, the FASB issued ASU 2017-07, Improving the Presentation of Net Periodic Pension Cost and Net Periodic Post-Retirement Benefit Cost (ASU 2017-07) which requires that an employer report the service cost component in the same line item or items as other compensation costs arising from services rendered by the pertinent employees during the period. The other components of net benefit cost are required to be presented in the income statement separately from the service cost component and outside a subtotal of income from operations. This standard is effective for financial statements issued for fiscal years beginning after December 15, 2017 and should be applied retrospectively to all periods presented. ASU 2017-07 is effective for the Company beginning April 1, 2018. The Company does not believe the adoption of ASU 2017-07 will have a material impact on its consolidated financial statements.
In January 2017, the FASB issued ASU 2017-01, Business Combinations (Topic 805), Clarifying the Definition of a Business (ASU 2017-01). ASU 2017-01 clarifies the definition of a business with the objective of addressing whether transactions involving in-substance nonfinancial assets, held directly or in a subsidiary, should be accounted for as acquisitions or disposals of nonfinancial assets or of businesses. ASU 2017-01 is effective for annual periods beginning after December 15, 2017. ASU 2017-01 is effective for the Company beginning April 1, 2018. Early adoption is permitted for transactions, including acquisitions or dispositions, which occurred before the issuance date or effective date of the standard if the
F-15
transactions were not reported in financial statements that have been issued or made available for issuance. The Company does not believe the adoption of ASU 2017-01 will have a material impact on its consolidated financial statements.
In November 2016, the FASB issued ASU No. 2016-18, Statement of Cash Flows (Topic 230): Restricted Cash (ASU 2016-18) related to the presentation of restricted cash in the statement of cash flows. The pronouncement requires entities to show the changes in the total of cash, cash equivalents, restricted cash and restricted cash equivalents in the statement of cash flows. As a result, entities will no longer present transfers between cash and cash equivalents and restricted cash and restricted cash equivalents in the statement of cash flows. When cash, cash equivalents, restricted cash and restricted cash equivalents are presented in more than one line item on the balance sheet, the new guidance requires a reconciliation of the totals in the statement of cash flows to the related captions in the balance sheet. Entities will also have to disclose the nature of restricted cash and restricted cash equivalent balances. The pronouncement is effective for fiscal years, and for interim periods within those fiscal years, beginning after December 15, 2017, with early adoption permitted. The Company adopted this guidance retrospectively on April 1, 2017. The Company does not have a material amount of restricted cash. Adoption of this ASU did not have a material impact on the Company's consolidated financial statements.
In October 2016, the FASB issued ASU 2016-16, Income Taxes (Topic 740): Intra-Entity Transfers of Assets Other Than Inventory (ASU 2016-16). ASU 2016-16 requires that entities recognize the income tax effects of intra-entity transfers of assets other than inventory when the transfer occurs. Current GAAP prohibits the recognition of those tax effects until the asset has been sold to an outside party. The pronouncement is effective for fiscal years, and for interim periods within those fiscal years, beginning after December 15, 2017, with early adoption permitted. ASU 2016-16 is effective for the Company beginning April 1, 2018. The Company is evaluating the new guidance and does not believe the adoption of ASU 2016-16 will have a material impact on its consolidated financial statements.
In August 2016, the FASB issued ASU 2016-15, Classification of Certain Cash Receipts and Cash Payments (ASU 2016-15). ASU 2016-15 is intended to add or clarify guidance on the classification of certain cash receipts and payments in the statement of cash flows and to eliminate the diversity in practice related to such classifications. The guidance in ASU 2016-15 is required for annual reporting periods beginning after December 15, 2017, with early adoption permitted. ASU 2016-15 is effective for the Company beginning April 1, 2018. The Company is currently assessing the potential impact of the adoption of ASU 2016-15 on its consolidated statement of cash flows.
In March 2016, the FASB issued ASU 2016-09, Compensation - Stock Compensation (Topic 718): Improvements to Employee Share-Based Payment Accounting (ASU 2016-09), which simplifies several aspects of the accounting for employee share-based payment transactions, including the accounting for income taxes, forfeitures and statutory tax withholding requirements, as well as classification in the statement of cash flows. The Company adopted this guidance on April 1, 2017, which had the following impact on the consolidated financial statements:
•On a prospective basis, as required, the Company recorded an excess tax benefit of $0.7 million to the provision for income taxes in the consolidated statement of operations for the fiscal year ended March 31, 2018 instead of additional paid-in capital in the consolidated balance sheet. As a result, net income increased $0.7 million and basic and diluted earnings per share increased $0.01 for the fiscal year ended March 31, 2018.
•Excess tax benefits are presented as operating cash activity instead of financing cash activity in the consolidated statements of cash flows, which the Company elected to apply on a retrospective basis. As a result, the Company classified $0.7 million of excess tax benefits, a $1.0 million tax shortfall, and a $1.9 million excess tax benefit for the fiscal years ended March 31, 2018, 2017 and 2016, respectively, as operating cash inflows for the fiscal years ended March 31, 2018 and March 31, 2016, and as an operating cash outflow for the fiscal year ended March 31, 2017 included within the change in income taxes payable in the consolidated statements of cash flows. The retrospective classification resulted in a $0.7 million and a $1.9 million increase in cash provided by operating activities and cash used in financing activities for the fiscal years ended March 31, 2018 and 2016, respectively, and a decrease in cash provided by operating activities and cash provided by financing activities of $1.0 million for the fiscal year ended March 31, 2017.
•The Company prospectively excluded the excess tax benefits from the assumed proceeds available to repurchase shares in the computation of diluted earnings per share under the treasury stock method, which did not have a material impact on diluted earnings per share for the fiscal year ended March 31, 2018.
In February 2016, the FASB issued ASU 2016-02, Leases (Topic 842) Section A - Leases: Amendments to the FASB Accounting Standards Codification (ASU 2016-02), its new standard on accounting for leases. This update requires the recognition of leased assets and lease obligations by lessees for those leases currently classified as operating leases under
F-16
existing lease guidance. Short term leases with a term of 12 months or less are not required to be recognized. The update also requires disclosure of key information about leasing arrangements to increase transparency and comparability among organizations. ASU 2016-02 is effective for annual reporting periods beginning after December 31, 2018 and interim periods within those fiscal years, and early adoption is permitted. The Company is currently assessing the potential impact of the adoption of ASU 2016-02 on its consolidated financial statements.
In May 2014, the FASB issued ASU No. 2014-09, Revenue from Contracts with Customers: Topic 606 (ASU 2014-09) and issued subsequent amendments to the initial guidance in August 2015, March 2016, April 2016, May 2016, December 2016 and September 2017, within ASU 2015-04, 2016-08, ASU 2016-10, ASU 2016-12, ASU 2016-20, ASU 2017-13 and ASU 2017-14, respectively (collectively, Topic 606). Topic 606 supersedes nearly all existing revenue recognition guidance under GAAP. The core principle of Topic 606 is to recognize revenues when promised goods or services are transferred to customers in an amount that reflects the consideration that is expected to be received for those goods or services. Topic 606 defines a five-step process to achieve this core principle and, in applying this process, it is possible that more judgments and estimates may be required within the revenue recognition process than are required under existing GAAP, including identifying performance obligations in the contract, estimating the amount of variable consideration to include in the transaction price and allocating the transaction price to each separate performance obligation, among others. Entities have the option of using either a full retrospective or a modified retrospective approach to adopt this standard. The Company is electing to use the modified retrospective transition approach. Topic 606 became effective for the Company on April 1, 2018. In preparation for adoption of the standard, the Company has implemented internal controls and key system functionality to enable the preparation of financial information and have reached conclusions on key accounting assessments related to the standard. As of April 1, 2018, the Company expects to release approximately $34.9 million of deferred revenue. In addition, prior to the adoption of Topic 606, the Company expensed commissions as they were earned by the sales force, while under ASC 606 the requirement is to match the timing of the commissions expense with the timing of the revenue for each arrangement’s underlying performance obligations. The Company has elected to employ a practical expedient wherein commissions are expensed immediately for revenues recognized within one year, however commissions associated with arrangements where revenues are recognized over longer time frames (primarily multi-year PCS arrangements and maintenance renewals) will be capitalized and amortized. The expected impact of the second change created $7.2 million of capitalized commissions costs as of April 1, 2018. A majority of those costs will be fully amortized by the end of the fiscal year ending March 31, 2019.
NOTE 3 – CASH, CASH EQUIVALENTS AND MARKETABLE SECURITIES
Cash and cash equivalents consisted of money market instruments and cash maintained with various financial institutions at March 31, 2018 and 2017.
Cash, Cash Equivalents and Restricted Cash
The following table provides a reconciliation of cash, cash equivalents and restricted cash reported within the consolidated balance sheets that sum to the total of the same such amounts shown in the consolidated statements of cash flows (in thousands):
March 31, 2018 | March 31, 2017 | March 31, 2016 | March 31, 2015 | ||||||||||||
Cash and cash equivalents | $ | 369,821 | $ | 304,880 | $ | 210,711 | $ | 104,893 | |||||||
Restricted cash | 910 | 846 | 186 | 186 | |||||||||||
Total cash, cash equivalents and restricted cash | $ | 370,731 | $ | 305,726 | $ | 210,897 | $ | 105,079 | |||||||
The Company's restricted cash includes cash balances which are legally or contractually restricted. The Company's restricted cash is included within prepaid and other current assets and consists of amounts related to holdbacks associated with prior acquisitions.
F-17
Marketable Securities
The following is a summary of marketable securities held by NetScout at March 31, 2018 classified as short-term and long-term (in thousands):
Amortized Cost | Unrealized Losses | Fair Value | |||||||||
Type of security: | |||||||||||
U.S. government and municipal obligations | $ | 42,246 | $ | (60 | ) | $ | 42,186 | ||||
Commercial paper | 33,003 | — | 33,003 | ||||||||
Corporate bonds | 2,754 | (2 | ) | 2,752 | |||||||
Total short-term marketable securities | 78,003 | (62 | ) | 77,941 | |||||||
Total long-term marketable securities | — | — | — | ||||||||
Total marketable securities | $ | 78,003 | $ | (62 | ) | $ | 77,941 | ||||
The following is a summary of marketable securities held by NetScout at March 31, 2017, classified as short-term and long-term (in thousands):
Amortized Cost | Unrealized Losses | Fair Value | |||||||||
Type of security: | |||||||||||
U.S. government and municipal obligations | $ | 98,989 | $ | (21 | ) | $ | 98,968 | ||||
Commercial paper | 29,469 | — | 29,469 | ||||||||
Corporate bonds | 7,959 | (3 | ) | 7,956 | |||||||
Certificates of deposit | 1,499 | — | 1,499 | ||||||||
Total short-term marketable securities | 137,916 | (24 | ) | 137,892 | |||||||
U.S. government and municipal obligations | 21,952 | (19 | ) | 21,933 | |||||||
Total long-term marketable securities | 21,952 | (19 | ) | 21,933 | |||||||
Total marketable securities | $ | 159,868 | $ | (43 | ) | $ | 159,825 | ||||
Contractual maturities of the Company’s marketable securities held at March 31, 2018 and March 31, 2017 were as follows (in thousands):
March 31, 2018 | March 31, 2017 | ||||||
Available-for-sale securities: | |||||||
Due in 1 year or less | $ | 77,941 | $ | 137,892 | |||
Due after 1 year through 5 years | — | 21,933 | |||||
$ | 77,941 | $ | 159,825 | ||||
F-18
NOTE 4 – FAIR VALUE MEASUREMENTS
The fair value hierarchy has three levels based on the reliability of the inputs used to determine fair value. Level 1 refers to fair values determined based on quoted prices in active markets for identical assets. Level 2 refers to fair values estimated using significant other observable inputs, and Level 3 includes fair values estimated using significant non-observable inputs. The following tables present the Company’s financial assets and liabilities measured on a recurring basis using the fair value hierarchy at March 31, 2018 and 2017 (in thousands):
Fair Value Measurements at | |||||||||||||||
March 31, 2018 | |||||||||||||||
Level 1 | Level 2 | Level 3 | Total | ||||||||||||
ASSETS: | |||||||||||||||
Cash and cash equivalents | $ | 369,821 | $ | — | $ | — | $ | 369,821 | |||||||
U.S. government and municipal obligations | 14,513 | 27,673 | — | 42,186 | |||||||||||
Commercial paper | — | 33,003 | — | 33,003 | |||||||||||
Corporate bonds | 2,752 | — | — | 2,752 | |||||||||||
Derivative financial instruments | — | 122 | — | 122 | |||||||||||
$ | 387,086 | $ | 60,798 | $ | — | $ | 447,884 | ||||||||
LIABILITIES: | |||||||||||||||
Contingent purchase consideration | $ | — | $ | — | $ | (5,464 | ) | $ | (5,464 | ) | |||||
Derivative financial instruments | — | (40 | ) | — | (40 | ) | |||||||||
$ | — | $ | (40 | ) | $ | (5,464 | ) | $ | (5,504 | ) | |||||
Fair Value Measurements at | |||||||||||||||
March 31, 2017 | |||||||||||||||
Level 1 | Level 2 | Level 3 | Total | ||||||||||||
ASSETS: | |||||||||||||||
Cash and cash equivalents | $ | 304,880 | $ | — | $ | — | $ | 304,880 | |||||||
U.S. government and municipal obligations | 40,628 | 80,273 | — | 120,901 | |||||||||||
Commercial paper | — | 29,469 | — | 29,469 | |||||||||||
Corporate bonds | 7,956 | — | — | 7,956 | |||||||||||
Certificate of deposits | — | 1,499 | — | 1,499 | |||||||||||
Derivative financial instruments | — | 110 | — | 110 | |||||||||||
$ | 353,464 | $ | 111,351 | $ | — | $ | 464,815 | ||||||||
LIABILITIES: | |||||||||||||||
Contingent purchase consideration | $ | — | $ | — | $ | (5,449 | ) | $ | (5,449 | ) | |||||
Derivative financial instruments | — | (213 | ) | — | (213 | ) | |||||||||
$ | — | $ | (213 | ) | $ | (5,449 | ) | $ | (5,662 | ) | |||||
This hierarchy requires the Company to use observable market data, when available, and to minimize the use of unobservable inputs when determining fair value. On a recurring basis, the Company measures certain financial assets and liabilities at fair value, including marketable securities and derivative financial instruments.
The Company’s Level 1 investments are classified as such because they are valued using quoted market prices or alternative pricing sources with reasonable levels of price transparency.
The Company’s Level 2 investments are classified as such because fair value is calculated using market observable data for similar but not identical instruments, or a discounted cash flow model using the contractual interest rate as compared to the underlying interest yield curve. The Company classifies municipal obligations as Level 2 because the fair values are determined
F-19
using quoted prices from markets the Company considers to be inactive. Commercial paper is classified as Level 2 because the Company uses market information from similar but not identical instruments and discounted cash flow models based on interest rate yield curves to determine fair value. The Company's derivative financial instruments consist of forward foreign exchange contracts and are classified as Level 2 because the fair values of these derivatives are determined using models based on market observable inputs, including spot prices for foreign currencies and credit derivatives, as well as an interest rate factor.
The Company's Level 3 liabilities consist of contingent purchase consideration. The Company's contingent purchase consideration includes $523 thousand related to the acquisition of Efflux Systems, Inc. (Efflux) in the second quarter of fiscal year 2018. The contingent purchase consideration represents amounts deposited into an escrow account, which was established to cover damages NetScout might suffer related to any liabilities that NetScout did not agree to assume or as a result of the breach of representations and warranties of the seller as described in the merger agreement. The contingent purchase consideration is included as accrued other in the Company's consolidated balance sheet at March 31, 2018.
The Company's contingent purchase consideration at March 31, 2017 included $660 thousand related to the acquisition of certain assets and liabilities of Avvasi Inc. (Avvasi) in the second quarter of fiscal year 2017. The contingent purchase consideration represented amounts deposited into an escrow account, which was established to cover damages the Company suffers related to any liabilities that the Company did not agree to assume or as a result of the breach of representations and warranties of the seller as described in the merger agreement. The contingent purchase consideration was paid to the seller in August 2017.
The fair value of contingent purchase consideration related to the acquisition of Simena LLC (Simena) in November 2011 for future consideration to be paid to the former seller is $4.9 million and $4.8 million at March 31, 2018 and 2017, respectively. The contingent purchase consideration is included as a contingent liability within accrued other in the Company's consolidated balance sheet at March 31, 2018 and as a long-term contingent liability at March 31, 2017.
The following table sets forth a reconciliation of changes in the fair value of the Company’s Level 3 financial liabilities for the year ended March 31, 2018 (in thousands):
Contingent Purchase Consideration | |||
Balance at March 31, 2017 | $ | (5,449 | ) |
Additions to Level 3 | (523 | ) | |
Increase in fair value and accretion expense (included within research and development expense) | (152 | ) | |
Payments made | 660 | ||
Balance at March 31, 2018 | $ | (5,464 | ) |
Deal-related compensation expense and accretion charges related to the contingent purchase consideration for the fiscal year ended March 31, 2018 were $152 thousand and were included as part of earnings.
F-20
The following table sets forth a reconciliation of changes in the fair value of the Company’s Level 3 financial liabilities for the year ended March 31, 2017 (in thousands):
Contingent Purchase Consideration | Contingently Returnable Consideration | ||||||
Balance at March 31, 2016 | $ | (7,293 | ) | $ | 16,131 | ||
Additions to Level 3 | (660 | ) | — | ||||
Increase in fair value and accretion expense (included within research and development expense) | (153 | ) | — | ||||
Decrease in fair value | — | (610 | ) | ||||
Gross presentation of contingently returnable consideration to contingent purchase consideration | (3,910 | ) | 3,910 | ||||
Payments received | — | (19,431 | ) | ||||
Payments made | 6,567 | — | |||||
Balance at March 31, 2017 | $ | (5,449 | ) | $ | — | ||
Deal related compensation expense, accretion charges and changes related to settlements of contractual non-compliance liabilities for the fiscal year ended March 31, 2017 were $153 thousand and were included as part of earnings.
NOTE 5 – INVENTORIES
Inventories are stated at the lower of actual cost or net realizable value. Cost is determined by using the FIFO method. Inventories consist of the following (in thousands):
March 31, | |||||||
2018 | 2017 | ||||||
Raw materials | $ | 20,860 | $ | 22,305 | |||
Work in process | 2,589 | 998 | |||||
Finished goods and deferred costs | 11,325 | 16,699 | |||||
$ | 34,774 | $ | 40,002 | ||||
NOTE 6 – FIXED ASSETS
Fixed assets consist of the following (in thousands):
Estimated Useful Life in Years | March 31, | ||||||||
2018 | 2017 | ||||||||
Furniture and fixtures | 3-7 | $ | 6,596 | $ | 6,436 | ||||
Computer equipment and internal use software | 3-5 | 147,237 | 135,100 | ||||||
Demonstration and spare part units | 2-5 | 31,338 | 28,036 | ||||||
Leasehold improvements (1) | up to 12 | 19,340 | 16,623 | ||||||
204,511 | 186,195 | ||||||||
Less – accumulated depreciation | (152,000 | ) | (124,802 | ) | |||||
$ | 52,511 | $ | 61,393 | ||||||
(1) Leasehold improvements are depreciated over the shorter of the lease term or anticipated useful life of the improvement.
Depreciation expense was $34.7 million, $33.0 million and $26.6 million for the fiscal years ended March 31, 2018, 2017 and 2016, respectively.
F-21
NOTE 7 – ACQUISITIONS
Efflux
On July 12, 2017 (the Efflux Closing Date), the Company completed the acquisition of Efflux for $8.6 million. Efflux's technology detects, analyzes and correlates threat activity within enterprise networks. The Efflux technology and engineering talent have been integrated into Arbor Networks in order to support the ongoing enhancement of Arbor Spectrum for advanced threat detection.
The Company has completed the purchase accounting related to the Efflux acquisition.
The following table summarizes the allocation of the purchase price (in thousands):
Initial cash payment | $ | 8,104 | ||
Estimated fair value of contingent purchase consideration | 523 | |||
Estimated purchase price | $ | 8,627 | ||
Estimated fair value of assets acquired and liabilities assumed (in thousands):
Cash | $ | 93 | ||
Accounts receivable | 3 | |||
Prepaid and other current assets | 208 | |||
Property, plant and equipment | 8 | |||
Intangible assets | 2,590 | |||
Deferred tax asset | 841 | |||
Accounts payable | (7 | ) | ||
Accrued other liabilities | (200 | ) | ||
Deferred revenue | (8 | ) | ||
Deferred tax liabilities | (978 | ) | ||
Goodwill | $ | 6,077 | ||
Of the total consideration, $523 thousand was deposited into an escrow account. The escrow account was established to cover damages NetScout suffers related to any liabilities that NetScout did not agree to assume or as a result of the breach of representations and warranties of the seller as described in the merger agreement. Generally, indemnification claims that Efflux would be liable for are limited to the total amount of the escrow account such account and shall be the sole source for the satisfaction of any damages to the Company for such claims, but such limitation does not apply with respect to seller's breach of certain fundamental representations or related to other specified indemnity items, for which certain of Efflux's shareholders may be liable for additional amounts in excess of the escrow amount. The $523 thousand will be paid to the seller on July 12, 2018.
In connection with the Efflux acquisition, certain former employees of Efflux will receive cash retention payments subject to such employee's continued employment with the Company through the next regularly scheduled payroll dates following each of the first and second anniversaries of the Efflux Closing Date. The cash retention payment liability was accounted for separately from the business combination as the cash retention payment is automatically forfeited upon termination of employment. The Company will record the liability over the period it is earned as compensation expense for post-combination services.
Goodwill was recognized for the excess purchase price over the fair value of the net assets acquired. Goodwill of $6.1 million from the acquisition was included within the Security reporting unit. Goodwill and intangible assets recorded as part of the acquisition are not deductible for tax purposes.
F-22
The fair values of intangible assets were based on valuations using an income approach. These assumptions include estimates of future revenues associated with the technology purchased as part of the acquisition and the migration of the current technology to a more advanced version of the software. This fair value measurement was based on significant inputs not observable in the market and thus represents Level 3 fair value measurements.
The following table reflects the fair value of the acquired identifiable intangible assets and related estimates of useful lives (in thousands):
Fair Value | Useful Life (Years) | |||||
Developed technology | $ | 1,980 | 10 | |||
Customer relationships | 610 | 10 | ||||
$ | 2,590 | |||||
The weighted average useful life of identifiable intangible assets acquired from Efflux is 10 years.
Avvasi
On August 19, 2016, the Company acquired certain assets and liabilities of Avvasi for $4.6 million. Avvasi’s technology allows service providers to measure, improve and monetize video in their networks. This acquisition builds on the Company's ongoing investment in enhancing its service assurance capabilities for video traffic over 4G/LTE networks.
Goodwill was recognized for the excess purchase price over the fair value of the net assets acquired. Goodwill of $2.0 million from the acquisition was included within the Service Assurance reporting unit.
Communications Business
On July 14, 2015 (Closing Date), the Company completed the Comms Transaction, which was structured as a Reverse Morris Trust transaction whereby Danaher contributed its Communications Business to a new subsidiary, Potomac Holding LLC (Newco). The total equity consideration was approximately $2.3 billion based on issuing approximately 62.5 million new shares of NetScout common stock to the existing common unit holders of Newco, based on the July 13, 2015 NetScout common stock closing share price of $36.89 per share. On the Closing Date, the Company did not gain control over certain foreign entities due to regulatory and other compliance requirements (Delayed Close Entities). The Company closed on the acquisition of these Delayed Close Entities on October 7, 2015.
In connection with the Comms Transaction, under the Employee Matters Agreement dated July 14, 2015 by and among the Company, Danaher and Newco, Danaher funded certain contracts under which employees provided post-combination services to the Company.
1) | For any outstanding Danaher restricted stock units or stock options held by employees of the Communications Business transferred to Newco (Newco Employees) that vested from July 14, 2015 through August 4, 2015, the awards continued to vest in Danaher shares. These awards met the definition of a derivative under ASC 815 and as such, the Company determined the fair value of these awards on July 14, 2015 and recorded them separately from the business combination as prepaid compensation. The derivative was amortized into compensation expense through August 4, 2015, the post-combination requisite settlement date. The total amount of compensation expense for post-combination services recorded for fiscal years ended March 31, 2018, 2017, and 2016 was $0, $0 and $6.5 million, respectively. |
2) | All outstanding Danaher restricted stock units or stock options held by Newco Employees that were due to vest after August 4, 2015 were canceled and replaced by NetScout with a cash retention award equal to one half of the value of the employee’s canceled Danaher equity award and up to an aggregate of $15 million of restricted stock units relating to shares of NetScout common stock equal to the remaining one half of the value of the employee’s canceled Danaher equity award. The restricted stock units issued are considered new share-based payment awards granted by NetScout to the former employees of Danaher. NetScout accounted for these new awards separately from the business combination. The Company recognized share-based compensation net of an estimated forfeiture rate and only recognized compensation cost for those shares expected to vest on a straight-line basis over the requisite service period of the award. The cash retention award was paid on August 4, 2016, to those employees that continued their employment with NetScout through the applicable vesting date of August 4, 2016. Danaher reimbursed NetScout for |
F-23
the amount of the cash retention payments (net of any applicable employment taxes and tax deductions). The cash retention award liability was accounted for separately from the business combination as the cash retention award was automatically forfeited upon termination of employment. NetScout recorded the cash retention award liability over the period it was earned as compensation expense for post-combination services. The reimbursement by Danaher to NetScout of the cash retention award payment was accounted for separately from the business combination on the date of the acquisition. For the fiscal years ended March 31, 2018, 2017, and 2016, $0, $4.3 million and $8.0 million, respectively, has been recorded as compensation expense for post-combination services.
3) | Newco Employees that were entitled to receive an incentive bonus under the Danaher annual bonus plan and who continued to be employed by NetScout through December 31, 2015 received a cash incentive bonus payment. The cash incentive bonus liability was accounted for separately from the business combination as the cash incentive bonus is automatically forfeited upon termination of employment. NetScout recorded the liability over the period it was earned as compensation expense for post-combination services. The payment of the cash retention award, which was reimbursed by Danaher to NetScout, was accounted for separately from the business combination on the date of the acquisition. For the fiscal years ended March 31, 2018, 2017, and 2016, $0, $0 and $9.3 million, respectively, was recorded as compensation expense for post-combination services. |
4) | Certain Newco Employees received cash retention payments that were subject to the employee’s continued employment with NetScout through October 16, 2015, ninety (90) days after the close of the acquisition. The cash retention payment liability was accounted for separately from the business combination as the cash retention payment was automatically forfeited upon termination of employment. NetScout recorded the liability over the period it was earned as compensation expense for post-combination services. The payment of the cash retention award, which was reimbursed by Danaher to NetScout, was accounted for separately from the business combination on the date of the acquisition. For the fiscal year ended March 31, 2018, 2017 and 2016, $0, $0 and $7.8 million, respectively, was recorded as compensation expense for post-combination services. |
NOTE 8 – GOODWILL & INTANGIBLE ASSETS
Goodwill
The Company has two reporting units: (1) Service Assurance and (2) Security. At March 31, 2018, goodwill attributable to the Company's Service Assurance and Security reporting units was $1.2 billion and $555.9 million, respectively. At March 31, 2017, goodwill attributable to the Company's Service Assurance and Security reporting units was $1.2 billion and $548.5 million, respectively. Goodwill is tested for impairment at a reporting unit level at least annually, or on an interim basis if an event occurs or circumstances change that would, more likely than not, reduce the fair value of the reporting unit below its carrying value. The Company completed its annual impairment test on January 31, 2018.
In fiscal years 2018 and 2017, the Company's quantitative impairment tests indicated that goodwill was not impaired. The Company determined the fair values of its reporting units by preparing a discounted cash flow analysis using forward looking projections of the reporting units’ future operating results and by comparing the value of the reporting units to the implied market value of selected peers. The significant assumptions used in the discounted cash flow analysis include: revenue and revenue growth, selling margins, other operating expenditures, the discounted rate used to present value future cash flows and terminal growth rates. The discount rate used is a cost of equity method, which is essentially equal to the "market participant" weighted-average cost of capital (WACC). The Service Assurance and Security reporting units' goodwill fair value substantially exceeded their respective carrying value.
The change in the carrying amount of goodwill for the fiscal year ended March 31, 2018 is due to the acquisition of Efflux and the impact of foreign currency translation adjustments related to asset balances that are recorded in currencies other than the U.S. Dollar.
F-24
The changes in the carrying amount of goodwill for the fiscal years ended March 31, 2018 and 2017 are as follows (in thousands):
Balance at March 31, 2016 | $ | 1,709,369 | |
Goodwill attributable to the Avvasi acquisition | 1,950 | ||
Purchase accounting adjustments | 3,792 | ||
Foreign currency translation impact and other adjustments | 3,051 | ||
Balance at March 31, 2017 | $ | 1,718,162 | |
Goodwill attributable to the Efflux acquisition | 6,077 | ||
Foreign currency translation impact | (11,475 | ) | |
Balance as of March 31, 2018 | $ | 1,712,764 | |
Intangible Assets
The net carrying amounts of intangible assets were $831.4 million and $931.3 million at March 31, 2018 and 2017, respectively. Intangible assets acquired in a business combination are recorded under the acquisition method of accounting at their estimated fair values at the date of acquisition. The Company amortizes intangible assets over their estimated useful lives, except for the acquired trade name which resulted from the Network General acquisition, which has an indefinite life and thus is not amortized. The carrying value of the indefinite lived trade name is evaluated for potential impairment annually or more frequently if events or changes in circumstances indicate that the asset might be impaired.
In fiscal year 2018 and 2017, the Company's annual impairment tests indicated that the acquired trade name was not impaired. In the fourth quarter of fiscal year 2018, the Company performed a quantitative step 1 analysis of its non-amortizing trade name. The Company determined the fair value of its trade name using a forward-looking relief from royalty model. The significant assumptions used in the forward-looking relief from royalty method include: revenue growth, royalty rates and the discount rate. The non-amortizing trade name fair value substantially exceeded its carrying value.
During the fiscal years ended March 31, 2018 and 2017, the Company acquired technology licenses for $0.5 million and $1.0 million, respectively. These amounts are included within distributor relationships and are being amortized using the economic benefit method over a useful life of 3 years.
Intangible assets include the indefinite lived trade name with a carrying value of $18.6 million and the following amortizable intangible assets at March 31, 2018 (in thousands):
Cost | Accumulated Amortization | Net | |||||||||
Developed technology | $ | 259,758 | $ | (148,937 | ) | $ | 110,821 | ||||
Customer relationships | 845,490 | (176,425 | ) | 669,065 | |||||||
Distributor relationships and technology licenses | 9,019 | (5,389 | ) | 3,630 | |||||||
Definite-lived trademark and trade name | 44,387 | (18,138 | ) | 26,249 | |||||||
Core technology | 7,345 | (6,712 | ) | 633 | |||||||
Net beneficial leases | 336 | (336 | ) | — | |||||||
Non-compete agreements | 317 | (317 | ) | — | |||||||
Leasehold interest | 2,600 | (2,130 | ) | 470 | |||||||
Backlog | 18,544 | (18,544 | ) | — | |||||||
Capitalized software | 3,183 | (1,621 | ) | 1,562 | |||||||
Other | 1,247 | (903 | ) | 344 | |||||||
$ | 1,192,226 | $ | (379,452 | ) | $ | 812,774 | |||||
F-25
Intangible assets include the indefinite lived trade name with a carrying value of $18.6 million and the following amortizable intangible assets at March 31, 2017 (in thousands):
Cost | Accumulated Amortization | Net | |||||||||
Developed technology | $ | 254,005 | $ | (110,200 | ) | $ | 143,805 | ||||
Customer relationships | 831,731 | (105,319 | ) | 726,412 | |||||||
Distributor relationships and technology licenses | 8,290 | (3,068 | ) | 5,222 | |||||||
Definite-lived trademark and trade name | 43,817 | (12,078 | ) | 31,739 | |||||||
Core technology | 7,108 | (6,009 | ) | 1,099 | |||||||
Net beneficial leases | 336 | (336 | ) | — | |||||||
Non-compete agreements | 278 | (278 | ) | — | |||||||
Leasehold interest | 2,600 | (998 | ) | 1,602 | |||||||
Backlog | 18,142 | (18,133 | ) | 9 | |||||||
Capitalized software | 3,047 | (594 | ) | 2,453 | |||||||
Other | 1,208 | (880 | ) | 328 | |||||||
$ | 1,170,562 | $ | (257,893 | ) | $ | 912,669 | |||||
Amortization included as product revenue consists of amortization of backlog. Amortization included as cost of product revenue consists of amortization of developed technology, distributor relationships and technology licenses, core technology and software. Amortization included as operating expense consists of all other intangible assets. The following table provides a summary of amortization expense during the fiscal years ended March 31, 2018, 2017, and 2016 (in thousands).
Years Ended March 31, | |||||||||||
2018 | 2017 | 2016 | |||||||||
Amortization of intangible assets included as: | |||||||||||
Product revenue | $ | 9 | $ | 11,438 | $ | 6,747 | |||||
Cost of product revenue | 40,286 | 44,326 | 45,127 | ||||||||
Operating expense | 76,661 | 70,325 | 32,547 | ||||||||
$ | 116,956 | $ | 126,089 | $ | 84,421 | ||||||
The following is the expected future amortization expense at March 31, 2018 for the fiscal years ended March 31 (in thousands):
2019 | $ | 130,108 | |
2020 | 116,494 | ||
2021 | 80,232 | ||
2022 | 69,778 | ||
2023 | 62,045 | ||
Thereafter | 354,117 | ||
Total | $ | 812,774 | |
The weighted average amortization period of developed technology and core technology is 11.5 years. The weighted average amortization period for customer and distributor relationships is 16.1 years. The weighted average amortization period for trademarks and trade names is 8.5 years. The weighted average amortization period for leasehold interests is 5.6 years. The weighted average amortization period for backlog is 2.0 years. The weighted average amortization period for capitalized software is 4.0 years. The weighted average amortization period for all amortizing intangible assets is 14.6 years.
F-26
NOTE 9 – DERIVATIVE INSTRUMENTS AND HEDGING ACTIVITIES
NetScout operates internationally and, in the normal course of business, is exposed to fluctuations in foreign currency exchange rates. The exposures result from costs that are denominated in currencies other than the U.S. Dollar, primarily the Euro, British Pound, Canadian Dollar, and Indian Rupee. The Company manages its foreign cash flow risk by hedging forecasted cash flows for operating expenses denominated in foreign currencies for up to twelve months, within specified guidelines through the use of forward contracts. The Company enters into foreign currency exchange contracts to hedge cash flow exposures from costs that are denominated in currencies other than the U.S. Dollar. These hedges are designated as cash flow hedges at inception.
All of the Company’s derivative instruments are utilized for risk management purposes, and the Company does not use derivatives for speculative trading purposes. These contracts will mature over the next twelve months and are expected to impact earnings on or before maturity.
The notional amounts and fair values of derivative instruments in the consolidated balance sheets at March 31, 2018 and 2017 were as follows (in thousands):
Notional Amounts (a) | Prepaid Expenses and Other Current Assets | Accrued Other | |||||||||||||||||||||
March 31, 2018 | March 31, 2017 | March 31, 2018 | March 31, 2017 | March 31, 2018 | March 31, 2017 | ||||||||||||||||||
Derivatives Designated as Hedging Instruments: | |||||||||||||||||||||||
Forward contracts | $ | 11,225 | $ | 14,752 | $ | 122 | $ | 110 | $ | 40 | $ | 213 | |||||||||||
(a) | Notional amounts represent the gross contract/notional amount of the derivatives outstanding. |
The following table provides the effect foreign exchange forward contracts had on other comprehensive income (loss), (OCI) and results of operations at March 31, 2018 and 2017 (in thousands):
Derivatives in Cash Flow Hedging Relationships | Effective Portion | Ineffective Portion | |||||||||||||||||||||||||
Gain (Loss) Recognized in OCI on Derivative (a) | Gain (Loss) Reclassified from Accumulated OCI into Income (b) | Gain (Loss) Recognized in Income (Amount Excluded from Effectiveness Testing) (c) | |||||||||||||||||||||||||
March 31, | March 31, | March 31, | March 31, | March 31, | March 31, | ||||||||||||||||||||||
2018 | 2017 | Location | 2018 | 2017 | Location | 2018 | 2017 | ||||||||||||||||||||
Forward contracts | $ | 1,079 | $ | (444 | ) | Research and development | $ | (121 | ) | $ | (3 | ) | Research and development | $ | 60 | $ | 74 | ||||||||||
Sales and marketing | (779 | ) | 361 | Sales and marketing | (153 | ) | (183 | ) | |||||||||||||||||||
$ | 1,079 | $ | (444 | ) | $ | (900 | ) | $ | 358 | $ | (93 | ) | $ | (109 | ) | ||||||||||||
(a) | The amount represents the change in fair value of derivative contracts due to changes in spot rates. |
(b) | The amount represents reclassification from other comprehensive income to earnings that occurs when the hedged item affects earnings. |
(c) | The amount represents the change in fair value of derivative contracts due to changes in the difference between the spot price and forward price that is excluded from the assessment of hedge effectiveness and therefore recognized in earnings. No gains or losses were reclassified as a result of discontinuance of cash flow hedges. |
F-27
NOTE 10 – RESTRUCTURING CHARGES
During the fiscal year ended March 31, 2016, the Company recorded a restructuring charge of $500 thousand related to one-time termination benefits to be paid to one employee, which was the completion of a plan that was required as a closing condition for the Comms Transaction.
During the fiscal year ended March 31, 2017, the Company approved two restructuring plans. During the quarter ended June 30, 2016, the Company restructured certain departments to better align functions subsequent to the Comms Transaction. As a result of the restructuring program, the Company recorded $2.0 million of restructuring charges related to one-time termination benefits to be paid to nineteen employees which was recorded during the fiscal year ended March 31, 2017. The one-time termination benefits related to this plan were paid in full during the fiscal year ended March 31, 2017. In addition, during the quarter ended March 31, 2017, the Company restructured certain departments to better align functions subsequent to the Comms Transaction, resulting in the termination of forty-one employees. Communication of the plan to the impacted employees was substantially completed on March 31, 2017. As a result of the workforce reduction, during the fiscal year ended March 31, 2017, the Company recorded a restructuring change totaling $1.9 million related to one-time termination benefits and $0.4 million in facility related charges. All of the workforce reduction was completed during the quarter ended September 30, 2017. During the fiscal year ended March 31, 2018, the Company recorded an additional charge for one-time termination benefits and facility-related costs of $0.9 million. The one-time termination benefits and facilities-related costs related to this plan were paid in full during the fiscal year ended March 31, 2018.
During the fiscal year ended March 31, 2018, the Company restructured certain departments to better align functions resulting in the termination of sixty-one employees. As a result of the workforce reduction, during the twelve months ended March 31, 2018, the Company recorded a restructuring charge totaling $5.1 million related to one-time termination benefits for the employees that were notified during the period. Additional one-time termination benefit charges and facility-related costs of approximately $1.7 million are anticipated to be recorded in the next six months. The one-time termination benefits will be paid in full during the fiscal year ending March 31, 2019.
The following table provides a summary of the activity related to the restructuring plans and the related restructuring liability (in thousands):
Q3 FY2016 Plan | Q1 FY2017 Plan | Q4 FY2017 Plan | Q3 FY2018 Plan | ||||||||||||||||||||
Employee-Related | Employee-Related | Employee-Related | Facilities Related | Employee-Related | Total | ||||||||||||||||||
Balance at March 31, 2016 | $ | 272 | $ | — | $ | — | $ | — | $ | — | $ | 272 | |||||||||||
Restructuring charges to operations | — | 2,034 | 1,867 | 405 | — | 4,306 | |||||||||||||||||
Cash payments | (272 | ) | (1,739 | ) | (317 | ) | — | — | (2,328 | ) | |||||||||||||
Other adjustments | — | (295 | ) | — | — | — | (295 | ) | |||||||||||||||
Balance at March 31, 2017 | $ | — | $ | — | $ | 1,550 | $ | 405 | $ | — | $ | 1,955 | |||||||||||
Restructuring charges to operations | — | — | 729 | 208 | 5,085 | 6,022 | |||||||||||||||||
Cash payments | — | — | (1,867 | ) | (374 | ) | (1,331 | ) | (3,572 | ) | |||||||||||||
Other adjustments | — | — | (412 | ) | (239 | ) | (58 | ) | (709 | ) | |||||||||||||
Balance at March 31, 2018 | $ | — | $ | — | $ | — | $ | — | $ | 3,696 | $ | 3,696 | |||||||||||
The accrual for employee-related severance is included as accrued compensation in the Company's consolidated balance sheets. The balance is expected to be paid in full in the next twelve months.
The accruals for facilities-related exit costs are included as accrued other and other long-term liabilities.
F-28
NOTE 11 – LONG-TERM DEBT
On January 16, 2018, the Company amended and expanded its existing credit agreement (Amended Credit Agreement) with a syndicate of lenders by and among: the Company; JPMorgan Chase Bank, N.A. (JPMorgan), as administrative agent and collateral agent; J.P. Morgan Securities LLC, KeyBanc Capital Markets, Merrill Lynch, Pierce, Fenner & Smith Incorporated, RBC Capital Markets and Wells Fargo Securities, LLC, as joint lead arrangers and joint bookrunners; Fifth Third Bank, Santander Bank, N.A., SunTrust Bank, N.A. and U.S. Bank National Association, as co-documentation agents; and the lenders party thereto.
The Amended Credit Agreement provides for a five-year $1.0 billion senior secured revolving credit facility, including a letter of credit sub-facility of up to $75.0 million. The Company may elect to use the new credit facility for general corporate purposes or to finance the repurchase of the Company's common stock under the Company's common stock repurchase plan. The commitments under the Amended Credit Agreement will expire on January 16, 2023, and any outstanding loans will be due on that date.
On February 1, 2018, the Company also announced that it entered into agreements with JPMorgan Chase Bank, National Association and Bank of America, N.A. (the Dealers) to repurchase an aggregate of $300 million of the Company's common stock via accelerated stock repurchase transactions (the ASR) under the Company's previously disclosed share repurchase program. On February 1, 2018, the Company borrowed an additional $300 million aggregate principal amount under its Amended Credit Agreement in order to finance the payment of the ASR to each of the Dealers. At March 31, 2018, $600 million was outstanding under the Amended Credit Agreement.
At the Company’s election, revolving loans under the Amended Credit Agreement bear interest at either (a) an Alternate Base Rate per annum equal to the greatest of (1) JPMorgan’s prime rate, (2) 0.50% in excess of the New York Federal Reserve Bank (NYFRB) rate, or (3) an adjusted one month LIBOR rate plus 1%; or (b) such adjusted LIBOR rate (for the interest period selected by the Company), in each case plus an applicable margin. For the period from the delivery of the Company's financial statements for the quarter ended December 31, 2017, until the Company has delivered financial statements for the quarter ended March 31, 2018, the applicable margin will be 1.50% per annum for LIBOR loans and 0.50% per annum for Alternate Base Rate loans, and thereafter the applicable margin will vary depending on the Company’s leverage ratio, ranging from 1.00% per annum for Base Rate loans and 2.00% per annum for LIBOR loans if the Company’s consolidated leverage ratio is greater than 3.50 to 1.00, down to 0.00% per annum for Alternate Base Rate loans and 1.00% per annum for LIBOR loans if the Company’s consolidated leverage ratio is equal to or less than 1.50 to 1.00.
The Company’s consolidated leverage ratio is the ratio of its total funded debt compared to its consolidated adjusted EBITDA. Consolidated adjusted EBITDA includes certain adjustments, including, without limitation, adjustments relating to extraordinary, unusual or non-recurring charges, certain restructuring charges, non-cash charges, certain transaction costs and expenses and certain pro forma adjustments in connection with material acquisitions and dispositions, all as set forth in detail in the definition of consolidated adjusted EBITDA in the Amended Credit Agreement.
Commitment fees will accrue on the daily unused amount of the credit facility. For the period from the delivery of the Company's financial statements for the quarter ended December 31, 2017 until the Company has delivered financial statements for the quarter ended March 31, 2018, the commitment fee will be 0.25% per annum, and thereafter the commitment fee will vary depending on the Company’s consolidated leverage ratio, ranging from 0.30% per annum if the Company’s consolidated leverage ratio is greater than 2.75 to 1.00, down to 0.15% per annum if the Company’s consolidated leverage ratio is equal to or less than 1.50 to 1.00.
Letter of credit participation fees are payable to each lender on the amount of such lender’s letter of credit exposure, during the period from the closing date of the Amended Credit Agreement to but excluding the date which is the later of (i) the date on which such lender’s commitment terminates or (ii) the date on which such lender ceases to have any letter of credit exposure, at a rate per annum equal to the applicable margin for LIBOR loans. Additionally, the Company will pay a fronting fee to each issuing bank in amounts to be agreed to between the Company and the applicable issuing bank.
Interest on Alternate Base Rate loans is payable at the end of each calendar quarter. Interest on LIBOR loans is payable at the end of each interest rate period or at the end of each three-month interval within an interest rate period if the period is longer than three months. The Company may also prepay loans under the Amended Credit Agreement at any time, without penalty, subject to certain notice requirements.
Debt is recorded at the amount drawn on the revolving credit facility plus interest based on floating rates reflective of changes in the market which approximates fair value.
F-29
The loans and other obligations under the credit facility are (a) guaranteed by each of the Company’s wholly owned material domestic restricted subsidiaries, subject to certain exceptions, and (b) are secured by substantially all of the assets of the Company and the subsidiary guarantors, including a pledge of all the capital stock of material subsidiaries held directly by the Company and the subsidiary guarantors (which pledge, in the case of any foreign subsidiary, is limited to 65% of the voting stock), subject to certain customary exceptions and limitations. The Amended Credit Agreement generally prohibits any other liens on the assets of the Company and its restricted subsidiaries, subject to certain exceptions as described in the Amended Credit Agreement.
The Amended Credit Agreement contains certain covenants applicable to the Company and its restricted subsidiaries, including, without limitation, limitations on additional indebtedness, liens, various fundamental changes, dividends and distributions, investments (including acquisitions), transactions with affiliates, asset sales, including sale-leaseback transactions, speculative hedge agreements, payment of junior financing, changes in business and other limitations customary in senior secured credit facilities. In addition, the Company is required to maintain certain consolidated leverage and interest coverage ratios. These covenants and limitations are more fully described in the Amended Credit Agreement. At March 31, 2018, the Company was in compliance with all of these covenants.
The Amended Credit Agreement provides that events of default will exist in certain circumstances, including failure to make payment of principal or interest on the loans when required, failure to perform certain obligations under the Amended Credit Agreement and related documents, defaults under certain other indebtedness, certain insolvency events, certain events arising under ERISA, a change of control and certain other events. Upon an event of default, the administrative agent with the consent of, or at the request of, the holders of more than 50% in principal amount of the loans and commitments may terminate the commitments and accelerate the maturity of the loans and enforce certain other remedies under the Amended Credit Agreement and the other loan documents.
In connection with the Company's Amended Credit Agreement described above, the Company terminated its previous term loan dated as of July 14, 2015, by and among the Company; JPMorgan Chase Bank, N.A. (JPMorgan), as administrative agent and collateral agent; J.P. Morgan Securities LLC, KeyBanc Capital Markets, Merrill Lynch, Pierce, Fenner & Smith Incorporated, RBC Capital Markets and Wells Fargo Securities, LLC, as joint lead arrangers and joint bookrunners; Santander Bank, N.A., SunTrust Bank, N.A. and U.S. Bank National Association, as co-documentation agents; and the lenders party thereto.
The Company has capitalized debt issuance costs totaling $12.2 million at March 31, 2018, which are being amortized over the life of the revolving credit facility. The unamortized balance was $8.3 million as of March 31, 2018. The balance of $1.7 million was included as prepaid expenses and other current assets and a balance of $6.6 million was included as other assets in Company’s consolidated balance sheet.
F-30
NOTE 12 – NET INCOME (LOSS) PER SHARE
Calculations of the basic and diluted net income (loss) per share and potential common shares are as follows (in thousands, except for per share data):
Year Ended March 31, | |||||||||||
2018 | 2017 | 2016 | |||||||||
Numerator: | |||||||||||
Net income (loss) | $ | 79,812 | $ | 33,291 | $ | (28,369 | ) | ||||
Denominator: | |||||||||||
Denominator for basic net income (loss) per share - weighted average common shares outstanding | 87,425 | 92,226 | 81,927 | ||||||||
Dilutive common equivalent shares: | |||||||||||
Weighted average restricted stock units | 836 | 694 | — | ||||||||
Denominator for diluted net income (loss) per share - weighted average shares outstanding | 88,261 | 92,920 | 81,927 | ||||||||
Net income (loss) per share: | |||||||||||
Basic net income (loss) per share | $ | 0.91 | $ | 0.36 | $ | (0.35 | ) | ||||
Diluted net income (loss) per share | $ | 0.90 | $ | 0.36 | $ | (0.35 | ) | ||||
The following table sets forth options and restricted stock units excluded from the calculation of diluted net income per share, since their inclusion would be antidilutive (in thousands):
Year Ended March 31, | ||||||||
2018 | 2017 | 2016 | ||||||
Restricted stock units | 1,450 | 1,320 | 453 | |||||
Basic net income (loss) per share is calculated by dividing net income (loss) by the weighted average number of shares outstanding during the period. Unvested restricted shares, although legally issued and outstanding, are not considered outstanding for purposes of calculating basic earnings per share. Diluted net income (loss) per share is calculated by dividing net income (loss) by the weighted average number of shares outstanding plus the dilutive effect, if any, of outstanding restricted shares and restricted stock units using the treasury stock method. The calculation of the dilutive effect of outstanding equity awards under the treasury stock method includes consideration of proceeds from the assumed exercise of unrecognized compensation expense. As we incurred a net loss in the fiscal year ended March 31, 2016, all outstanding restricted stock units have an anti-dilutive effect and are therefore excluded from the computation of diluted weighted average share outstanding.
The delivery of 7.4 million shares under the Company's accelerated share repurchase (ASR) agreements reduced our outstanding shares used to determine our weighted average common shares outstanding for purposes of calculating basic and diluted earnings per share for the fiscal year ended March 31, 2018. See Note 13 for additional information. We evaluated the ASR agreements for potential dilutive effects of any shares remaining to be received or owed upon settlement and determined the additional shares to be received would be anti-dilutive, and therefore they were not included in our calculation of diluted earnings per share for the fiscal year ended March 31, 2018.
NOTE 13 – TREASURY STOCK
On April 22, 2014, the Company's Board of Directors approved a stock repurchase program. This program authorized management to make repurchases of NetScout outstanding common stock of up to $100 million. Through July 15, 2015, the Company had repurchased 824,452 shares totaling $34.3 million in the open market under this stock repurchase plan. The Company repurchased 67,752 shares for $2.8 million under the program during the fiscal year ended March 31, 2016. At March 31, 2018, there were no shares of common stock that remained available to be purchased under this plan due to the approval of another share repurchase program approved on May 19, 2015.
On May 19, 2015, the Company’s Board of Directors approved a share repurchase program, conditional upon the completion of the Comms Transaction. This program enabled the Company to repurchase up to 20 million shares of its common
F-31
stock. This plan became effective on July 14, 2015 upon the completion of the Comms Transaction and replaced the Company's previously existing open market stock repurchase program described above. The Company was not obligated to acquire any specific amount of common stock within any particular timeframe under this program. The Company repurchased 6,773,438 shares for $227.6 million, 3,148,426 shares for $80.0 million and 10,078,136 shares for $300.0 million in the open market under this stock repurchase plan during the fiscal years ended March 31, 2018, 2017 and 2016, respectively. At March 31, 2018, there were no shares of common stock that remained available to be purchased under this plan.
On October 24, 2017, the Company’s Board of Directors approved a new share repurchase program that enables the Company to repurchase up to twenty-five million shares of its common stock. This new program became effective once the Company’s previously disclosed twenty million share repurchase program was completed. The Company is not obligated to acquire any specific amount of common stock within any particular timeframe as a result of its new share repurchase program.
On February 1, 2018, the Company entered into ASR agreements with two third-party financial institutions (the Dealers) to repurchase an aggregate of $300 million of the Company's common stock via accelerated stock repurchase transactions under the Company’s twenty million share repurchase program and the twenty five million share repurchase program. The Company borrowed $300 million against its Amended Credit Facility in order to finance the payment of the initial purchase price to each of the Dealers. Under the terms of the ASR, the Company made a $150 million payment to each of the Dealers on February 2, 2018, and received an initial delivery of 3,693,931 shares from each of the Dealers, or 7,387,862 shares in the aggregate, which is approximately 70 percent of the total number of shares of the Company's common stock expected to be repurchased under the ASR. As part of this purchase, 970,650 shares for $27.6 million were deducted under the twenty million share repurchase program and 6,417,212 shares for $182.4 million were deducted from the twenty-five million share repurchase program. The final number of ASR shares is dependent upon the average of the daily volume-weighted average prices of the Company’s common stock during the term of the ASR, less a discount and subject to adjustments pursuant to the terms and conditions of the ASR. The delivery of additional shares of common stock to the Company or an additional delivery of shares of common stock or a cash payment, at NetScout's election, by the Company to the Dealers may be required. The final settlement of each of the ASR transactions is expected to occur no later than the end of the second quarter of fiscal year 2019.
At March 31, 2018, 18,582,788 shares of common stock remained available to be purchased under the current program.
In connection with the vesting and release of the restriction on previously vested shares of restricted stock, the Company repurchased 408,097 shares for $13.6 million, 320,572 shares for $9.6 million and 256,514 shares for $9.1 million related to minimum statutory tax withholding requirements on these restricted stock units during the fiscal years ended March 31, 2018, 2017 and 2016, respectively. These repurchase transactions do not fall under the repurchase program described above, and therefore do not reduce the amount that is available for repurchase under those programs.
NOTE 14 – STOCK PLANS
2011 Employee Stock Purchase Plan
On September 7, 2011, the Company’s stockholders approved the 2011 Employee Stock Purchase Plan (the ESPP), under which 2,500,000 shares of the Company’s common stock have been reserved for issuance. The Company implemented the ESPP on March 1, 2012. Eligible employees may purchase shares of the Company’s common stock through regular payroll deductions of up to 20% of their eligible compensation. Under the terms of the offering under the ESPP, the number of shares of the Company’s common stock which a participant could purchase during any purchase period is limited to 2,000. In addition, the fair market value of shares purchased by an individual participant in the plan may not exceed $25,000 if the contribution period is within any calendar year. However, if contribution periods overlap calendar years, an individual participant is eligible to utilize the unused portion of the $25,000 limit from the subsequent purchase in the current purchase up to $50,000. Under the ESPP, shares of the company's common stock may be purchased on the last day of each bi-annual offering period at 85% of the fair market value on the last day of such offering period. The offering periods run from March 1 through August 31 and from September 1 through the last day of February of each year. During the fiscal year ended March 31, 2018, employees purchased 610,947 shares under the ESPP with a weighted average purchase price per share of $29.22. At March 31, 2018, 485,143 shares were available for future issuance under the ESPP.
F-32
2007 Equity Incentive Plan
Enacted in September 2007, the 2007 Equity Incentive Plan (2007 Plan) permits the granting of stock options, restricted stock and restricted stock units, collectively referred to as “share-based awards.” Periodically, the Company grants share-based awards to employees and officers of the Company and its subsidiaries. The Company accounts for these share-based awards in accordance with GAAP, which requires the measurement and recognition of compensation expense based on estimated fair values for all share-based payment awards made to its employees and directors. Share-based award grants are generally measured at fair value on the date of grant based on the number of shares granted and the quoted price of the Company’s common stock. Such value is recognized as a cost of revenue or an operating expense over the corresponding vesting period. On September 7, 2011, the Company’s stockholders approved an amendment and restatement of the 2007 Equity Incentive Plan to increase the shares of common stock reserved for issuance by 8,000,000 shares. On September 22, 2015, the Company's stockholders approved an amendment and restatement of the 2007 Equity Incentive Plan (the Amended 2007 Plan) to increase the shares of common stock reserved for issuance by 8,500,000. A total of 21,500,000 shares are reserved for issuance under the Amended 2007 Plan. In addition, any shares not delivered to a participant because an award is exercised through a reduction of shares subject to the award (cashless exercise) will not be available for issuance under the Amended 2007 Plan and any shares reacquired by the Company to cover withholding taxes upon exercise of a stock option or stock appreciation right or as consideration for the exercise of a stock option or stock appreciation right will not become available for issuance under the Amended 2007 Plan. Shares withheld to cover tax liabilities of restricted stock unit grants will be restored to the available reserve on the 2 for 1 amount. Furthermore, the share reserve under the Amended 2007 Plan is reduced one share for each share of common stock issued pursuant to a stock option or stock appreciation right and two shares for each share of common stock issued pursuant to restricted stock, restricted stock units, performance stock awards, or other stock awards granted under the Amended 2007 Plan on or after March 31, 2011. At March 31, 2018, an aggregate of 4,078,780 unvested equity awards were outstanding under the Amended 2007 Plan.
The Amended 2007 Plan is administered by the Compensation Committee of the Board of Directors. The Compensation Committee operates under guidelines established by the Board of Directors. The Compensation Committee has the authority to select the employees and consultants to whom awards are granted (except for directors and executive officers) and determine the terms of each award, including the number of shares of common stock subject to the award.
Share-based awards generally vest over four years. The exercise price of incentive stock options shall not be less than 100% of the fair market value of the common stock at the date of grant (110% for incentive stock options granted to holders of more than 10% of the voting stock of NetScout). The term of options granted cannot exceed ten years (five years for incentive stock options granted to holders of more than 10% of the voting stock of NetScout).
Based on historical experience, the Company assumed an annualized forfeiture rate of 0% for awards granted to its independent directors, approximately 2% for awards granted to its senior executives, and approximately 5% granted to all remaining employees during the fiscal years ended March 31, 2018, 2017 and 2016.
The following is a summary of share-based compensation expense including restricted stock units and employee stock purchases made under our employee stock purchase plan (ESPP) based on estimated fair values within the applicable cost and expense lines identified below (in thousands):
Year Ended March 31, | |||||||||||
2018 | 2017 | 2016 | |||||||||
Cost of product revenue | $ | 1,159 | $ | 934 | $ | 645 | |||||
Cost of service revenue | 4,824 | 3,956 | 2,601 | ||||||||
Research and development | 14,711 | 12,362 | 9,205 | ||||||||
Sales and marketing | 15,213 | 12,823 | 8,725 | ||||||||
General and administrative | 11,410 | 9,114 | 7,175 | ||||||||
$ | 47,317 | $ | 39,189 | $ | 28,351 | ||||||
F-33
Transactions under the Amended 2007 Plan during the fiscal years ended March 31, 2018, 2017 and 2016 are summarized in the table below.
Restricted Stock Units | ||||||
Number of Awards | Weighted Average Fair Value | |||||
Outstanding – March 31, 2015 | 1,929,315 | $ | 30.18 | |||
Granted | 1,806,490 | 37.20 | ||||
Vested | (736,170 | ) | 26.52 | |||
Canceled | (126,329 | ) | 34.99 | |||
Outstanding – March 31, 2016 | 2,873,306 | $ | 35.32 | |||
Granted | 2,020,536 | 24.92 | ||||
Vested | (950,159 | ) | 33.16 | |||
Canceled | (333,382 | ) | 33.40 | |||
Outstanding – March 31, 2017 | 3,610,301 | $ | 30.24 | |||
Granted | 1,962,590 | 34.01 | ||||
Vested | (1,216,585 | ) | 31.09 | |||
Canceled | (277,526 | ) | 31.70 | |||
Outstanding – March 31, 2018 | 4,078,780 | $ | 31.77 | |||
At March 31, 2018, there were 6,048,327 shares of common stock available for grant under the Amended 2007 Plan.
The Company does not currently expect to repurchase shares from any source to satisfy its obligations under the Amended 2007 Plan.
The aggregate intrinsic value of stock options exercised and the fair value of restricted stock units vested at March 31, 2018, 2017 and 2016 were as follows (in thousands):
Year Ended March 31, | |||||||||||
2018 | 2017 | 2016 | |||||||||
Total fair value of restricted stock unit awards vested | $ | 40,539 | $ | 28,293 | $ | 25,936 | |||||
At March 31, 2018, the total unrecognized compensation cost related to restricted stock unit awards was $100.8 million, which is expected to be amortized over a weighted-average period of 1.4 years.
NOTE 15 – PENSION BENEFIT PLANS
401(k) Plan
The Company has a defined contribution program for certain employees that is qualified under Section 401(k) of the Internal Revenue Code of 1986, as amended. The Company matches 50% of the employee’s contribution up to 6% of the employee’s salary. NetScout contributions vest at a rate of 25% per year of service. NetScout made matching contributions of $8.0 million, $9.4 million and $7.8 million to the plan for the fiscal years ended March 31, 2018, 2017 and 2016, respectively.
Defined Benefit Pension Plan
Certain of the Company's non-U.S. employees participate in certain noncontributory defined benefit pension plans acquired in the Comms Transaction on July 14, 2015. None of the Company's employees in the U.S. participate in any noncontributory defined benefit pension plans. In general, these plans are funded based on considerations relating to legal requirements, underlying asset returns, the plan’s funded status, the anticipated deductibility of the contribution, local practices, market conditions, interest rates and other factors.
F-34
The components of the change in benefit obligation of the pension plan is as follows (in thousands):
March 31, | March 31, | ||||||
2018 | 2017 | ||||||
Benefit obligation, at beginning of year | $ | 30,141 | $ | 29,188 | |||
Service cost | 407 | 329 | |||||
Interest cost | 718 | 638 | |||||
Benefits paid and other | (288 | ) | (231 | ) | |||
Actuarial loss (gain) | (1,788 | ) | 1,226 | ||||
Foreign exchange rate impact | 4,274 | (1,009 | ) | ||||
Benefit obligation, at end of year | $ | 33,464 | $ | 30,141 | |||
The reconciliation of the beginning and ending balances of the fair value of the assets of the pension plan is as follows (in thousands):
March 31, | March 31, | ||||||
2018 | 2017 | ||||||
Fair value of plan assets, at beginning of year | $ | — | $ | — | |||
Employer direct benefit payments | 288 | 231 | |||||
Benefits paid and other | (288 | ) | (231 | ) | |||
Fair value of plan assets, at end of year | $ | — | $ | — | |||
The following sets forth the components of the Company's net periodic pension cost of the noncontributory defined benefit pension plans for the fiscal years ended March 31, 2018, 2017, and 2016 (in thousands):
Year Ended March 31, | |||||||||||
2018 | 2017 | 2016 | |||||||||
Service cost | $ | 407 | $ | 329 | $ | 279 | |||||
Interest cost | 718 | 638 | 391 | ||||||||
Net periodic pension cost | $ | 1,125 | $ | 967 | $ | 670 | |||||
Weighted average assumptions used to determine net periodic pension cost at date of measurement:
March 31, | March 31, | March 31, | ||||||
2018 | 2017 | 2016 | ||||||
Discount rate | 2.30 | % | 2.10 | % | 2.30 | % | ||
Rate of compensation increase | 2.25 | % | 2.25 | % | 2.25 | % | ||
As of March 31, 2018, unrecognized actuarial gains of $1.8 million ($1.4 million, net of tax) which have not yet been recognized in net periodic pension cost are included in accumulated other comprehensive income (loss). The unrecognized actuarial gains and losses are calculated as the difference between the actuarially determined projected benefit obligation and the value of the plan assets less accrued pension costs. None of this amount is expected to be recognized in net periodic pension costs during the fiscal year ending March 31, 2019. No plan assets are expected to be returned to the Company during the fiscal year ending March 31, 2019.
F-35
Expected Contributions
During the fiscal year ended March 31, 2018, the Company contributed $288 thousand to its defined benefit pension plan. The following sets forth benefit payments, which reflect expected future service, as appropriate, expected to be paid by the plan in the periods indicated (in thousands):
2019 | $ | 380 | |
2020 | $ | 442 | |
2021 | $ | 502 | |
2022 | $ | 556 | |
2023 | $ | 627 | |
2024 - 2029 | $ | 4,546 | |
NOTE 16 – INCOME TAXES
Income (loss) before income tax expense (benefit) consisted of the following (in thousands):
Year Ended March 31, | |||||||||||
2018 | 2017 | 2016 | |||||||||
Domestic | $ | (35,032 | ) | $ | 32,475 | $ | (6,979 | ) | |||
Foreign | 16,373 | 19,710 | (25,460 | ) | |||||||
$ | (18,659 | ) | $ | 52,185 | $ | (32,439 | ) | ||||
The components of the income tax expense (benefit) are as follows (in thousands):
Year Ended March 31, | |||||||||||
2018 | 2017 | 2016 | |||||||||
Current income tax expense: | |||||||||||
Federal | $ | 14,191 | $ | 15,912 | $ | 29,238 | |||||
State | 1,925 | 3,152 | 2,223 | ||||||||
Foreign | 12,249 | 11,175 | 6,628 | ||||||||
28,365 | 30,239 | 38,089 | |||||||||
Deferred income tax expense (benefit): | |||||||||||
Federal | (113,122 | ) | (8,278 | ) | (30,216 | ) | |||||
State | (10,037 | ) | 3,578 | (4,461 | ) | ||||||
Foreign | (3,677 | ) | (6,645 | ) | (7,482 | ) | |||||
(126,836 | ) | (11,345 | ) | (42,159 | ) | ||||||
$ | (98,471 | ) | $ | 18,894 | $ | (4,070 | ) | ||||
F-36
The income tax expense (benefit) computed using the federal statutory income tax rate differs from NetScout’s effective tax rate primarily due to the following:
Year Ended March 31, | ||||||||
2018 | 2017 | 2016 | ||||||
Statutory U.S. federal tax rate | 31.6 | % | 35.0 | % | 35.0 | % | ||
State taxes, net of federal tax effect | 6.9 | 9.7 | 3.1 | |||||
Research and development tax credits | 39.5 | (8.2 | ) | 13.0 | ||||
Effect of foreign operations | 15.5 | (6.7 | ) | (18.2 | ) | |||
Meals and entertainment | (6.7 | ) | 2.5 | (3.5 | ) | |||
Domestic production activities deduction | 13.8 | (4.0 | ) | 9.2 | ||||
Change in valuation allowance | (0.2 | ) | (0.1 | ) | 0.7 | |||
Transaction costs | — | — | (19.1 | ) | ||||
2017 tax act | 454.1 | — | — | |||||
Foreign withholding | (21.0 | ) | 3.8 | (6.1 | ) | |||
Other permanent differences | (5.8 | ) | 4.2 | (1.6 | ) | |||
527.7 | % | 36.2 | % | 12.5 | % | |||
On December 22, 2017, the Tax Cuts and Jobs Act (Tax Legislation) was signed into law. The Tax Legislation significantly revises the U.S. tax code by, among other things, lowering the corporate tax rate from 35% to 21%; imposing a minimum tax on certain foreign earnings; limiting the deductibility of interest expense; implementing a territorial tax system and imposing a one-time transition tax on deemed repatriating earnings of foreign subsidiaries. In December 2017, the SEC issued Staff Accounting Bulletin No. 118 (SAB 118), which addresses situations where the accounting is incomplete for the income tax effects of the Tax Legislation. SAB 118 directs taxpayers to consider the impact of the Tax Legislation as “provisional” when the Company does not have the necessary information available, prepared or analyzed (including computations) to finalize the accounting for the change in tax law. Companies are provided a measurement period of up to one year to obtain, prepare, and analyze information necessary to finalize the accounting for provisional amounts or amounts that could not be estimated as of December 31, 2017.
Due to the effective date of the rate reduction on our fiscal year, the Company recorded a blended statutory rate for the year ended March 31, 2018. While the Company continues to assess the impact of the Tax Legislation on its consolidated financial statements, the Company has recorded a provisional amount increasing current tax expense by approximately $2 million related to the transition tax associated with the deemed repatriation of foreign earnings. The Company has not provided additional income taxes for any additional outside basis differences inherent in our investments in foreign subsidiaries because the investments are essentially permanent in duration or it has been concluded that no additional tax liability will arise upon disposal. Determining the amount of unrecognized deferred tax liability related to any remaining undistributed foreign earnings not subject to the transition tax and additional outside basis difference in these entities (i.e., basis difference in excess of that subject to the one-time transition tax) is not practicable. The Company is still in the process of analyzing the impact of the Tax Legislation on its indefinite reinvestment assertion. Additionally, the Company has recorded a provisional deferred tax benefit of approximately $87 million related to the re-measurement of deferred tax assets and liabilities. In the three months ending March 31, 2018, the Company recorded an overall adjustment to our provisional income tax benefit of $4 million of additional income tax benefit principally due to changes in our estimate of the re-measurement of deferred tax assets and liabilities.
The aforementioned provisional amounts may differ from actual results due to a variety of factors, including, among others, (i) management’s further assessment of the Tax Legislation and related regulatory guidance; (ii) guidance that may be issued; (iv) finalization of earnings and profits amounts and cash balances held by foreign subsidiaries impacting the transitions tax and (iv) actions the Company may take as a result of the Tax Legislation. Any adjustments to these provisional amounts made during the measurement period will be included in income from continuing operations as an adjustment to tax expense or benefit in the reporting period the amounts are determined.
The Company may be subject to the tax on the Global Intangible Low-Taxed Income (GILTI) in future years but has not completed its analysis of the applicability of the tax. The Company will continue to gather and evaluate information as to the
F-37
impact of this tax, and therefore will not make a policy election on how to account for GILTI (as part of deferred taxes or as a period expense) until management has received and evaluated the necessary information. Accordingly, no amounts related to GILTI are included within deferred taxes.
The components of net deferred tax assets and liabilities are as follows (in thousands):
Year Ended March 31, | |||||||
2018 | 2017 | ||||||
Deferred tax assets: | |||||||
Accrued expenses | $ | 4,068 | $ | 4,883 | |||
Deferred revenue | 12,168 | 8,427 | |||||
Reserves | 3,375 | 6,240 | |||||
Pension and other retiree benefits | 5,307 | 4,978 | |||||
Net operating loss carryforwards | 21,251 | 27,322 | |||||
Tax credit carryforwards | 6,625 | 5,502 | |||||
Share-based compensation | 5,164 | 6,418 | |||||
Other | 418 | 288 | |||||
Total gross deferred tax assets | 58,376 | 64,058 | |||||
Valuation allowance | (3,108 | ) | (3,374 | ) | |||
Net deferred tax assets | 55,268 | 60,684 | |||||
Deferred tax liabilities: | |||||||
Intangible assets | (195,959 | ) | (323,008 | ) | |||
Depreciation | (4,187 | ) | (8,695 | ) | |||
Total deferred tax asset (liability) | $ | (144,878 | ) | $ | (271,019 | ) | |
Deferred tax assets and liabilities are recognized based on the anticipated future tax consequences, attributable to differences between financial statement carrying amounts of assets and liabilities and their respective tax bases. Deferred tax assets and liabilities are measured using enacted tax rates in effect for the year in which the differences are expected to reverse. We evaluate the recoverability of deferred tax assets by considering all positive and negative evidence relating to future profitability. We weigh objective and verifiable evidence more heavily in this analysis. In situations where we conclude that we do not have sufficient objective and verifiable evidence to support the realizability of the asset we create a valuation allowance against it. A valuation allowance has been established for the deferred tax assets related to Psytechnics Ltd., and for certain deferred tax assets related to the acquisition of ONPATH. If it is later determined the Company is able to use all or a portion of the deferred tax assets for which a valuation allowance has been established, then the Company may be required to recognize these deferred tax assets through a tax benefit recorded in the period such determination is made.
At March 31, 2018, the Company had U.S. federal net operating loss carry forwards of approximately $33 million, state net operating loss carryforwards of approximately $66 million and tax credit carryforwards of approximately $8 million. The net operating loss and credit carryforwards will expire at various dates beginning in 2019. The Company also had foreign net operating loss carryforwards of approximately $67 million at March 31, 2018. The majority of foreign net operating losses have no expiration dates. Utilization of the U.S. net operating losses and credits are subject to an annual limitation due to the ownership change limitations provided by the Internal Revenue Code of 1986, as amended, and similar state tax provisions.
The Company files U.S. federal tax returns and files returns in various state, local and foreign jurisdictions. With respect to the U.S. federal and primary state jurisdictions, the Company is no longer subject to examinations by tax authorities for tax years before 2014, although carryforward attributes that were generated prior to 2014 may still be adjusted upon examination if they either have been or will be used in a future period. The Company also receives inquiries from various tax jurisdictions during the year, and some of those inquiries may include an audit of the tax return previously filed. In the normal course of business, NetScout and its subsidiaries are examined by various taxing authorities, including the IRS in the United States.
F-38
A reconciliation of the beginning and ending amount of unrecognized tax benefits for the fiscal years ended March 31, 2018, 2017 and 2016 is as follows (in thousands):
Year Ended March 31, | |||||||||||
2018 | 2017 | 2016 | |||||||||
Balance at April 1, | $ | 2,926 | $ | 1,588 | $ | 1,038 | |||||
Additions based on tax positions related to the current year | 126 | 46 | 48 | ||||||||
Release of tax positions of prior years | (481 | ) | (154 | ) | — | ||||||
Increase in unrecognized tax benefits as a result of a tax position taken during a prior period | — | 1,446 | 502 | ||||||||
Decrease relating to settlements with taxing authorities | (356 | ) | — | — | |||||||
Balance at March 31, | $ | 2,215 | $ | 2,926 | $ | 1,588 | |||||
We are unable to make a reliable estimate when cash settlement, if any, will occur with a tax authority as the timing of examinations and ultimate resolution of those examinations is uncertain. All of the unrecognized tax benefits would affect the effective tax rate if recognized.
The Company includes interest and penalties accrued in the consolidated financial statements as a component of the tax provision.
NOTE 17 – COMMITMENTS AND CONTINGENCIES
Acquisition related
The Company has a contingent liability for $523 thousand related to the acquisition of Efflux in July 2017 for which an escrow account was established to cover damages NetScout might suffer related to any liabilities that NetScout did not agree to assume or as a result of the breach of representations and warranties of the seller as described in the merger agreement. Generally, indemnification claims that Efflux would be liable for are limited to the total amount of the escrow account and shall be the sole source for the satisfaction of any damages to the Company for such claims, but such limitation does not apply with respect to seller's breach of certain fundamental representations or related to other specified indemnity items, for which certain of Efflux's shareholders may be liable for additional amounts in excess of the escrow amount. Except to the extent that valid indemnification claims are made prior to such time, the $523 thousand will be paid to the seller on July 12, 2018.
In addition, the Company had a contingent liability for $660 thousand related to the acquisition of Avvasi in August 2016 for which an escrow account was established to cover damages NetScout suffers related to any liabilities that NetScout did not agree to assume or as a result of the breach of representations and warranties of the seller as described in the asset purchase agreement. The $660 thousand was paid to the seller on August 21, 2017.
The Company has a contingent liability related to the acquisition of Simena in November 2011 for future consideration to be paid to the former seller which had an initial fair value of $8.0 million at the time of acquisition. At March 31, 2018 and 2017, the present value of the future consideration was $4.9 million and $4.8 million, respectively.
Legal
From time to time, NetScout is subject to legal proceedings and claims in the ordinary course of business. In the opinion of management, the amount of ultimate expense with respect to any current legal proceedings and claims, if determined adversely, will not have a material adverse effect on the Company’s financial condition, results of operations or cash flows.
As previously disclosed, in March 2016, Packet Intelligence LLC ("Packet Intelligence" or "Plaintiff") filed a Complaint against NetScout and two subsidiary entities in the United States District Court for the Eastern District of Texas asserting infringement of five United States patents. Plaintiff’s Complaint alleged that legacy Tektronix GeoProbe products, including the G10 and GeoBlade products, infringed these patents. NetScout filed an Answer denying Plaintiff’s allegations and asserting that Plaintiff’s patents were, among other things, invalid, not infringed, and unenforceable due to inequitable conduct. In October 2017, a jury trial was held to address the parties’ claims and counterclaims regarding infringement of three patents by the G10 and GeoBlade products, invalidity of these patents, and damages. On October 13, 2017, the jury rendered a verdict finding in favor of the Plaintiff and that Plaintiff was entitled to $3,500,000 for pre-suit damages and $2,250,000 for post-suit damages. The jury indicated that the awarded damages amounts were intended to reflect a running royalty. The Court also
F-39
conducted a bench trial on whether these patents were unenforceable due to, among other things, inequitable conduct. The Court has not yet rendered a decision on the equitable issues or entered final judgment in this matter. NetScout has concluded that the risk of loss from this matter is currently neither remote nor probable, and therefore, under U.S. GAAP definitions, the risk of loss is termed "reasonably possible". Therefore, accounting rules require NetScout to provide an estimate for the range of potential liability. NetScout currently estimates that the estimated range of liability is between $0 and the aggregate amount awarded by the jury, plus potential additional pre- and post-judgment interest amounts, subject to other adjustments that the Court may make. NetScout intends to continue to vigorously dispute Packet Intelligence’s claims including through appeal, if necessary.
Unconditional purchase obligations
At March 31, 2018, the Company had unconditional purchase obligations of $39.9 million, which represent estimated open purchase orders to purchase inventory as well as commitments for products and services used in the normal course of business.
Leases
NetScout leases office space under non-cancelable operating leases. Total rent expense under the leases was $16.6 million, $13.8 million and $12.8 million for the fiscal years ended March 31, 2018, 2017 and 2016, respectively.
At March 31, 2018, future non-cancelable minimum lease commitments (including office space, copiers and automobiles) are as follows (in thousands):
Year Ending March 31, | |||
2019 | $ | 16,613 | |
2020 | 13,930 | ||
2021 | 11,404 | ||
2022 | 10,538 | ||
2023 | 9,330 | ||
Remaining years | 37,802 | ||
Total minimum lease payments | $ | 99,617 | |
NOTE 18 – SEGMENT AND GEOGRAPHIC INFORMATION
The Company manages its business in the following geographic areas: United States, Europe, Asia and the rest of the world. In accordance with United States export control regulations, the Company does not sell or do business with countries subject to economic sanctions and export controls.
Total revenue by geography is as follows (in thousands):
Year Ended March 31, | |||||||||||
2018 | 2017 | 2016 | |||||||||
United States | $ | 581,853 | $ | 722,440 | $ | 681,569 | |||||
Europe | 174,445 | 193,441 | 137,411 | ||||||||
Asia | 88,917 | 95,735 | 61,566 | ||||||||
Rest of the world | 141,572 | 150,496 | 74,873 | ||||||||
$ | 986,787 | $ | 1,162,112 | $ | 955,419 | ||||||
The United States revenue includes sales to resellers in the United States. These resellers fulfill customer orders and may subsequently ship the Company’s products to international locations. The Company reports these shipments as United States revenue because the Company ships the products to a United States location. Further, the Company determines the geography of its sales after considering where the contract originated. Beginning in the first quarter of fiscal year 2018, the Company changed the structure of its sales force. As a result, consideration was given to this change when determining revenue by
F-40
geography for the fiscal year ended March 31, 2017. Prior periods in fiscal year 2017 were recast to conform to the current presentation. A majority of revenue attributable to locations outside of the United States is a result of export sales. Substantially all of the Company’s identifiable assets are located in the United States.
NOTE 19 - RELATED PARTY TRANSACTIONS
During our fiscal year ended March 31, 2016 and the three months ended June 30, 2016, a member of the Company’s Board of Directors served as an executive officer of Danaher. As part of the split off of Danaher’s Communications Business and the Company’s subsequent acquisition of that business from Newco's shareholders, NetScout entered into multiple transactions with Danaher which include: transition services agreements, lease agreements, closing agreements, and compensation for post-combination services provisions within the separation and distribution agreement. This board member is now the founding President and CEO of Fortive Corporation (Fortive), which spun off of Danaher in July 2016. As part of the spin-off of Fortive, the transition services agreement was amended to, among other things, assign Danaher's rights, duties, obligations and liabilities under the transition services agreement to Fluke Corporation, a subsidiary of Fortive. The Company has disclosed the transactions with Danaher and Fortive parenthetically within the financial statements.
As disclosed parenthetically within the Company's consolidated balance sheet, the Company has receivables from related parties. The following table summarizes those balances (in thousands):
March 31, 2018 | March 31, 2017 | ||||||
Danaher | $ | 252 | $ | 404 | |||
Fortive | 2,935 | 3,181 | |||||
$ | 3,187 | $ | 3,585 | ||||
As disclosed parenthetically within the Company's consolidated balance sheet, the Company has payables due to related parties. The following table summarizes those balances (in thousands):
March 31, 2018 | March 31, 2017 | ||||||
Danaher | $ | — | $ | — | |||
Fortive | 369 | 444 | |||||
$ | 369 | $ | 444 | ||||
As disclosed parenthetically within the Company's consolidated statements of operations, the Company has recorded expenses from related parties. The following table summarizes those balances (in thousands):
Year Ended March 31, | |||||||||||
2018 | 2017 | 2016 | |||||||||
Danaher: | |||||||||||
Cost of product revenue | $ | — | $ | 4,690 | $ | 25,055 | |||||
Cost of service revenue | — | 485 | 5,736 | ||||||||
Research and development expenses | — | 1,720 | 16,701 | ||||||||
Sales and marketing | 2 | 2,273 | 15,430 | ||||||||
General and administrative expenses | 7 | 2,551 | 16,055 | ||||||||
Other expense | — | — | 379 | ||||||||
$ | 9 | $ | 11,719 | $ | 79,356 | ||||||
Fortive: | |||||||||||
Cost of product revenue | $ | 245 | $ | 2,539 | $ | — | |||||
Cost of service revenue | 665 | 260 | — | ||||||||
Research and development expenses | 3 | (96 | ) | — | |||||||
Sales and marketing | — | 150 | — | ||||||||
General and administrative expenses | 1,696 | 1,548 | — | ||||||||
Other income | (56 | ) | (426 | ) | — | ||||||
$ | 2,553 | $ | 3,975 | $ | — | ||||||
F-41
As disclosed within the Company's consolidated statements of cash flows, the Company has cash flows from operating activities resulting from amounts due to related parties and due from related parties. The following table summarizes those cash flows from operating activities (in thousands):
Year Ended March 31, | |||||||||||
2018 | 2017 | 2016 | |||||||||
Due from related party: | |||||||||||
Danaher | $ | 96 | $ | 17,310 | $ | (18,483 | ) | ||||
Fortive | 347 | 7,745 | — | ||||||||
Total | $ | 443 | $ | 25,055 | $ | (18,483 | ) | ||||
Due to related party: | |||||||||||
Danaher | $ | — | $ | (2,954 | ) | $ | (6,743 | ) | |||
Fortive | (75 | ) | 162 | — | |||||||
Total | $ | (75 | ) | $ | (2,792 | ) | $ | (6,743 | ) | ||
As disclosed within the Company's consolidated statements of cash flows, the Company has cash flows from investing activities resulting from amounts due from related parties. The following table summarizes those cash flows from investing activities (in thousands):
Year Ended March 31, | |||||||||||
2018 | 2017 | 2016 | |||||||||
Due from related party: | |||||||||||
Danaher | $ | — | $ | 12,864 | $ | 9,306 | |||||
Total | $ | — | $ | 12,864 | $ | 9,306 | |||||
The Company recognized $45 thousand, $177 thousand, and $130 thousand in revenue from Danaher during the fiscal years ended March 31, 2018, 2017, and 2016 in the ordinary course of business.
A member of the Company’s Board of Directors served as a member of the board of directors for EMC Corporation (EMC) during the fiscal years ended March 31, 2017 and 2016, and therefore, the Company considered sales to EMC to be a related party transaction. During the quarter ended September 30, 2016, EMC was acquired by Dell Technologies and EMC's board member resigned. The Company continued to report the wind down of preexisting transactions as related party transactions through the Company's fiscal year 2017. The Company recognized $167 thousand, and $475 thousand in revenue from EMC during the fiscal years ended March 31, 2017 and 2016 in the ordinary course of business.
During the fiscal year ended March 31, 2016, the Company had a member of the Board of Directors who served as a Section 16 officer of State Street Corporation (State Street) and therefore, the Company considered sales to State Street to be a related party transaction. The Company recognized $452 thousand in revenue from State Street during the fiscal year ended March 31, 2016 in the ordinary course of business. This board member is no longer a Section 16 officer of State Street, and as a result, State Street was no longer considered a related party during the Company's fiscal year ended March 31, 2017.
A member of the Company’s Board of Directors served as a trustee for Boston College during the fiscal years ended March 31, 2017 and 2016 and a portion of the fiscal year ended March 31, 2018 and therefore, the Company considers sales to Boston College to be a related party transaction. The Company recognized $150 thousand, $0 and $0 in revenue from Boston College during the fiscal years ended March 31, 2018, 2017 and 2016, respectively, in the ordinary course of business.
F-42
NOTE 20 – QUARTERLY RESULTS OF OPERATIONS – UNAUDITED
The following table sets forth certain unaudited quarterly results of operations of NetScout for the fiscal years ended March 31, 2018 and 2017. In the opinion of management, this information has been prepared on the same basis as the audited consolidated financial statements and all necessary adjustments, consisting only of normal recurring adjustments, have been included in the amounts stated below to present fairly the quarterly information when read in conjunction with the audited consolidated financial statements and notes thereto included elsewhere in this Annual Report on Form 10-K. The quarterly operating results are not necessarily indicative of future results of operations.
Three Months Ended | |||||||||||||||||||||||||||||||
(in thousands, except per share data) | |||||||||||||||||||||||||||||||
March 31, 2018 | Dec. 31, 2017 | Sept. 30, 2017 | June 30, 2017 | March 31, 2017 | Dec. 31, 2016 | Sept. 30, 2016 | June 30, 2016 | ||||||||||||||||||||||||
Revenue | $ | 235,224 | $ | 268,944 | $ | 256,863 | $ | 225,756 | $ | 318,920 | $ | 302,192 | $ | 272,048 | $ | 268,952 | |||||||||||||||
Gross profit | $ | 168,633 | $ | 204,435 | $ | 182,620 | $ | 159,194 | $ | 226,003 | $ | 220,514 | $ | 187,538 | $ | 181,918 | |||||||||||||||
Net income (loss) | $ | 16,817 | $ | 89,685 | $ | (2,468 | ) | $ | (24,222 | ) | $ | 22,310 | $ | 21,245 | $ | (1,266 | ) | $ | (8,998 | ) | |||||||||||
Diluted net income (loss) per share | $ | 0.20 | $ | 1.02 | $ | (0.03 | ) | $ | (0.27 | ) | $ | 0.24 | $ | 0.23 | $ | (0.01 | ) | $ | (0.10 | ) | |||||||||||
F-43
NetScout Systems, Inc.
Schedule II—Valuation and Qualifying Accounts
(in thousands)
Balance at Beginning of Year | Additions Resulting in Charges to Operations | Charges to Other Accounts | Deductions Due to Write-Offs | Balance at End of Year | ||||||||||||||||
Year ended March 31, 2016 | ||||||||||||||||||||
Allowance for doubtful accounts | $ | 173 | $ | 1,824 | $ | 3,221 | $ | (149 | ) | $ | 5,069 | |||||||||
Deferred tax asset valuation allowance | $ | 3,906 | $ | 99 | $ | — | $ | (228 | ) | $ | 3,777 | |||||||||
Year ended March 31, 2017 | ||||||||||||||||||||
Allowance for doubtful accounts | $ | 5,069 | $ | 6,961 | $ | (7,580 | ) | $ | (2,384 | ) | $ | 2,066 | ||||||||
Deferred tax asset valuation allowance | $ | 3,777 | $ | (338 | ) | $ | (65 | ) | $ | — | $ | 3,374 | ||||||||
Year ended March 31, 2018 | ||||||||||||||||||||
Allowance for doubtful accounts | $ | 2,066 | $ | 695 | $ | (346 | ) | $ | (424 | ) | $ | 1,991 | ||||||||
Deferred tax asset valuation allowance | $ | 3,374 | $ | — | $ | — | $ | (266 | ) | $ | 3,108 | |||||||||
S-1