Attached files
Table of Contents
UNITED STATES
SECURITIES AND EXCHANGE COMMISSION
Washington, D.C. 20549
FORM 10-K
(Mark One)
| x | ANNUAL REPORT PURSUANT TO SECTION 13 OR 15(d) OF THE SECURITIES EXCHANGE ACT OF 1934 |
For the fiscal year ended March 31, 2011
OR
| ¨ | TRANSITION REPORT PURSUANT TO SECTION 13 OR 15(d) OF THE SECURITIES EXCHANGE ACT OF 1934 |
For the transition period from to
Commission file number 0000-26251
NETSCOUT SYSTEMS, INC.
(Exact name of registrant as specified in its charter)
| Delaware | 04-2837575 | |
| (State or other jurisdiction of incorporation or organization) |
(IRS Employer Identification No.) |
310 Littleton Road, Westford, MA 01886
(978) 614-4000
Securities registered pursuant to Section 12(b) of the Act:
Common Stock, $0.001 Par Value
Securities registered pursuant to Section 12(g) of the Act:
None
Indicate by check mark if the registrant is a well-known seasoned issuer, as defined in Rule 405 of the Securities Act. YES x NO ¨
Indicate by check mark if the registrant is not required to file reports pursuant to Section 13 or Section 15(d) of the Act. YES ¨ NO x
Indicate by check mark whether the registrant: (1) has filed all reports required to be filed by Section 13 or 15(d) of the Securities Exchange Act of 1934 during the preceding 12 months (or for such shorter period that the registrant was required to file such reports), and (2) has been subject to such filing requirements for the past 90 days. YES x NO ¨
Indicate by check mark if disclosure of delinquent filers pursuant to Item 405 of Regulation S-K is not contained herein, and will not be contained, to the best of registrant’s knowledge, in definitive proxy or information statements incorporated by reference in Part III of this Form 10-K or any amendment to this Form 10-K. ¨
Indicate by check mark whether the registrant has submitted electronically and posted on its corporate Web site, if any, every Interactive Data File required to be submitted and posted pursuant to Rule 405 of Regulation S-T during the preceding 12 months (or for such shorter period that the registrant was required to submit and post such files). YES ¨ NO ¨
Indicate by check mark whether the registrant is a large accelerated filer, an accelerated filer, a non-accelerated filer, or a smaller reporting company. See the definitions of “large accelerated filer,” “accelerated filer” and “smaller reporting company” in Rule 12b-2 of the Exchange Act. (Check one):
Large accelerated filer x Accelerated filer ¨ Non-accelerated filer ¨ Smaller reporting company ¨
(Do not check if a smaller reporting company)
Indicate by check mark whether the registrant is a shell company (as defined in Rule 12b-2 of the Exchange Act). YES ¨ NO x
The aggregate market value of common stock held by non-affiliates of the registrant as of September 30, 2010 (based on the last reported sale price on the Nasdaq Global Market as of such date) was approximately $782,715,213. As of May 26, 2011, there were 42,585,817 shares of the registrant’s common stock outstanding.
DOCUMENTS INCORPORATED BY REFERENCE
(1) Portions of the Registrant’s Proxy Statement for the fiscal year 2011 Annual Meeting of Stockholders are incorporated by reference into Part III of this Annual Report on Form 10-K. Except as expressly incorporated by reference, the proxy statement is not deemed to be part of this report.
Table of Contents
FORM 10-K
FOR THE FISCAL YEAR ENDED MARCH 31, 2011
TABLE OF CONTENTS
| PART I | ||||||
| Item 1. | Corporate Background | 4 | ||||
| General | 4 | |||||
| Industry Background | 5 | |||||
| Products & Technology Overview | 7 | |||||
| nGenius Service Assurance Solution | 8 | |||||
| Integration with Third-Party Solutions | 10 | |||||
| Product Enhancements and New Products | 11 | |||||
| Strategy | 12 | |||||
| Sales and Marketing | 13 | |||||
| Seasonality | 14 | |||||
| Support Services | 14 | |||||
| Research and Development | 14 | |||||
| Manufacturing | 15 | |||||
| Customers | 15 | |||||
| Backlog | 15 | |||||
| Channels | 16 | |||||
| Competition | 16 | |||||
| Intellectual Property Rights | 17 | |||||
| Employees | 17 | |||||
| Item 1A. | Risk Factors | 18 | ||||
| Item 1B. | Unresolved Staff Comments | 26 | ||||
| Item 2. | Properties | 26 | ||||
| Item 3. | Legal Proceedings | 26 | ||||
| PART II | ||||||
| Item 5. | Market for Registrant’s Common Equity, Related Stockholder Matters and Issuer Purchases of Equity Securities | 27 | ||||
| Item 6. | Selected Financial Data | 30 | ||||
| Item 7. | Management’s Discussion and Analysis of Financial Condition and Results of Operations | 31 | ||||
| Overview | 31 | |||||
| Results Overview | 31 | |||||
| Use of Non-GAAP Financial Measures | 32 | |||||
Table of Contents
3
Table of Contents
PART I
Corporate Background
NetScout Systems, Inc., or we, NetScout or the Company, designs, develops, manufactures, markets, sells and supports market leading unified service delivery management, service assurance and application and network performance management solutions focused on assuring service delivery for the world’s largest, most demanding and complex internet protocol (IP) based service delivery environments. We manufacture and market these products in integrated hardware and software solutions that are used by commercial enterprises, large governmental agencies and telecommunication service providers worldwide. We have a single operating segment and substantially all of our identifiable assets are located in the United States.
We conduct our business globally and our sales force is managed in four main geographic teams: United States, Europe, Asia and the rest of the world.
We are a Delaware corporation founded in 1984 and our principal executive offices are located at 310 Littleton Road, Westford, Massachusetts, and our telephone number is (978) 614-4000. NetScout’s internet address is http://www.netscout.com. Information contained or referenced on our website is not incorporated by reference in and does not form a part of this Annual Report on Form 10-K. NetScout makes available, free of charge, on our website our Annual Report on Form 10-K, Quarterly Reports on Form 10-Q, Current Reports on Form 8-K, and amendments to those reports filed or furnished pursuant to Section 13(a) or 15(d) of the Securities Exchange Act of 1934 (Exchange Act), as amended, as soon as reasonably practicable after such material is electronically filed with or furnished to the Securities and Exchange Commission (SEC).
With a sustained history of 26 years of technology innovation, NetScout continues to lead the market, changing how organizations manage the delivery of business services and assure user experience across global IP networks. NetScout has continually advanced its product portfolio to meet the needs of organizations to provide solutions to manage dynamic network and application environments and to improve user experience by assuring service availability and reliability. Our solution is a highly scalable and flexible real-time service delivery management platform that supports a wide-range of enterprise information technology (IT) operations including network managers, datacenter operations, application managers, network operations centers, network engineering and IT operations. In addition, our solutions are deployed by telecommunication service providers who support a broad range of users including the network operations, network engineering, service operations, application groups, customer care, marketing, chief technology officers and advance engineering groups.
NetScout solutions use advanced packet flow technologies to enable these organizations to gain greater, more granular visibility into the interdependencies of network and application behavior to effectively monitor, analyze and assure the end-to-end performance of applications and business services. NetScout’s value proposition to our customers is to identify application and service delivery issues early to enable prevention of significant service degradations or failures. Within our unified service delivery management framework, organizations gain superior visibility to better understand their service delivery environment. This significantly enhances operational agility and enables the organization to:
| • | Assure business service continuity; |
| • | Improve and protect the user experience; |
| • | Optimize service delivery performance; |
| • | Increase efficiency and utilization of existing infrastructure; |
| • | Simplify managing service delivery; |
4
Table of Contents
| • | Reduce operations and support complexity and costs; and |
| • | Lower the overall total cost of IT operations. |
Large enterprises, public sector agencies, and telecommunication service providers are critically dependent upon their data networks and on the Internet to generate and deliver information and business services to their customers, suppliers, investors, employees, and citizens. Simultaneously, these data networks are taking on new roles, including the role of carrying voice and video traffic, and serving as the platform for the next generation of massively distributed, virtualized and service-oriented application architectures. Furthermore, rapidly advancing server technology and exploding multimedia applications continue to drive growth in traffic levels which have spawned a new wave of infrastructure upgrades. In parallel, the service provider market continues to undergo fundamental changes with the accelerating transition to IP based services, requiring new network infrastructures and presenting new and daunting challenges for assessing and assuring service quality. The combination of these fundamental trends produces unprecedented complexity coupled with unparalleled business impact requiring superior management technology.
NetScout is in a unique position, addressing both the enterprise and service provider markets. Building on our common packet-flow technology foundation, we have developed substantial expertise in assuring IP network-based service delivery that has enabled us to develop a highly scalable and extensible solution offering that not only addresses the needs of both the enterprise and the service provider markets, but also allows us to transfer this knowledge and technology development between these market segments.
We market and distribute our products globally through our own direct sales force and through strategic channel partners that include distributors, value added resellers and systems integrators. We have a dual market strategy that includes both the enterprise and service provider markets. For our enterprise markets, we focus on the Global 5000, which includes industry segments such as financial, healthcare, manufacturing, retail, technology, utilities, education, and the public sector, which includes many large agencies of federal, state and local governments. In the service provider segment, we sell focused solutions to mobile operators, wireline operators and cable Multi-Service Operators globally. We had no single customer or channel partner representing more than 10% of revenues in fiscal years 2011, 2010 or 2009.
Enterprise Markets
In today’s dynamic business environment, the IP network has emerged as a critical success factor for many organizations. The IT organization is under extreme pressure to orchestrate the seamless and reliable delivery of services to meet increasing user expectations. IT must provide more services and greater business value with fewer resources and lower operating budgets than ever before. The IT mission is focused on reducing the cost of IT while increasing IT performance, improving operational efficiencies and delivering the highest quality and availability of IT services possible. The lack of unified and consistent visibility into network and application performance with dynamic correlation to services, business and user experience is no longer acceptable to an increasing number of large enterprises. This, coupled with the ever changing technology landscape and the continued increasing complexity of IT infrastructure, drives the need for a more automated and unified approach to managing service delivery. IT management must reduce the cost of service delivery, address increasing complexity, scale globally and adapt to emerging technologies such as cloud services, virtualization and unified communication services.
The result is increasingly large, geographically dispersed, and complex networks and infrastructures that are challenging to manage and make service performance levels difficult to assure. Application and network malfunctions, resource contention, and infrastructure and application mis-configurations can all cause service disruptions, lost revenue and customer dissatisfaction. Consequently, network managers are recognizing the
5
Table of Contents
critical importance of addressing customer service performance problems quickly and proactively. The NetScout portfolio of products is designed for this rapidly growing market of organizations running complex, widely-distributed networks that provide for always-on service delivery environments.
Enterprise Environments
Within the enterprise environment, the value of NetScout’s nGenius® and Sniffer® technologies enables IT organizations to protect and improve service quality while evolving their service management model from a reactive approach, that responds to user complaints, to a more proactive model that is able to address business service performance issues before they become serious and impact large numbers of users. Organizations can efficiently assure service delivery consistently from the data center to local users and over the wide area network (WAN) to branch offices, freeing up scarce IT resources to spend time on more strategic initiatives. Some of the current enterprise IT initiatives our solutions support include:
| • | Data Center Modernization & Virtualization – We enable IT organizations to manage the delivery of services across virtual and physical environments, providing a comprehensive, unified view of application and network performance. Intelligent early warning of emerging issues with the ability to analyze both physical and virtual services within the data center enables organizations to optimize datacenter infrastructure investments, protect against service degradations, and simplify the operation of complex, multi-tier application environments. |
| • | Unified Communications – We deliver unified visibility to view voice, data and video services side-by-side in order to understand the interrelationships of all services that traverse the network infrastructure and assess quality and performance of the delivery of these services. |
| • | Branch Office & WAN – We bring extended visibility into the performance of applications and networks at and between locations, including cloud-based services, with a unified view of end-to-end service delivery enabling collaborative problem-solving and uniform planning, enabling IT organizations to reduce the cost of managing their remote sites. |
| • | Enterprise Mobility – We provide service assurance across the infrastructure and applications supporting wireless service delivery, and rapid-response network troubleshooting, integrated with Cisco® wireless networks. |
| • | Process Improvement & ITIL Initiatives – We deliver real-time and historical information that provides the necessary insight to restore service, manage capacity, and understand the users’ quality of experience. The unified service delivery management approach enabled by the nGenius solution empowers IT organizations to collaborate more meaningfully while reducing the overall costs of IT operations through a unified platform delivering a common set of metrics and insight across disparate IT departments. The nGenius solution also provides IT organizations a highly efficient service-oriented workflow that aligns with Information Technology Infrastructure Library (ITIL) process models. |
| • | Structured Approach to Service Assurance & Troubleshooting – Our solution provides real-time enterprise-wide views, backed up by high-definition, actionable information on all network traffic, including individual applications, segments and end-users, for rapid isolation of network issues, quick service restoration, and a minimization of business impact. |
Telecommunication Service Provider Markets
Our opportunity in the service provider market stems from the industry’s transformation to next generation all-IP networks. The move to IP has touched every single segment of the service provider environment. IP enables service providers to optimize their operating environment, consolidate and converge multiple networks and gain a high degree of flexibility in service offerings due to the dynamic nature of modern IP technology. Most carriers are moving from legacy circuit switched environments, where each user connection or service is using a dedicated circuit with dedicated bandwidth, to highly dynamic packet switched IP-based environments.
6
Table of Contents
The value of IP is that service providers gain a high degree of efficiency and provisioning flexibility for services over shared facilities with security and service quality capabilities coming from the underlying network equipment technology rather than through dedicated connections. As a result, service providers now require a much higher level of understanding of the traffic flows in a true multi-service delivery environment.
Telecommunication Service Provider Environments
As service providers transform their operations using the power of the modern IP network, they are confronted with new challenges in assuring services over an increasingly dynamic operating environment. New multimedia applications, migration from time division multiplexing (TDM) technology, or asynchronous transfer mode (ATM) technology, transport networks to a next generation all-IP network, introduction of Voice over IP (VoIP) and the transition to IP multimedia sub-systems (IMS) require a new and innovative approach to assuring the delivery of next-generation broadband IP services.
Today’s service providers are focused on creating a compelling set of services, with a high quality user experience, while also keeping an eye on reducing operational complexity and costs. This, coupled with the challenge of IP transformation activities and emerging new technologies like Long-term Evolution (LTE) Internet Protocol Television (IPTV) and cloud services drives the need for a more automated and unified approach to managing service delivery and the subscriber experience. Service providers must reduce the cost of service delivery, address increasing complexity, scale globally and adapt to emerging technologies such as cloud services, virtualization and unified communication services while assuring high quality user experiences to retain their revenue base.
| • | For Mobile Operators – The fundamental transformation of the mobile network to all-IP enables mobile operators to build highly-scalable service delivery environments to offer new dynamic services to meet the growing subscriber demand for data, voice and video-centric services and to consolidate and dramatically simplify network operations. However, to capitalize fully on the value of IP and the significant market opportunities, mobile operators need detailed IP packet-level insight and core-to-access visibility. |
| • | For Fixed-line Operators – The growing demand for high-bandwidth triple-play services, broadband connectivity, IPTV, on-demand video traffic and carrier Ethernet services presents carriers with significant revenue opportunities. IP has become the defacto convergence mechanism for access, distribution and core networks, enabling new service offerings, simplifying network operations while reducing total cost of operations. To realize these benefits, operators need comprehensive insight into IP services, service usage, service availability, application awareness, traffic load, network availability and network performance. |
Products & Technology Overview
NetScout has developed three distinct product families that range from portable field service tools, to dedicated hot-spot deep packet analysis (DPA) and forensics, to our end-to-end always-on service delivery management and service assurance system with high definition intelligent early warning capabilities. NetScout products enable enterprise and service provider organizations to meet the challenges and demands associated with managing performance and service levels associated with modern-day service delivery.
| • | nGenius Service Assurance Solution delivers comprehensive high definition visibility into end-to-end performance of the network, applications, services and users. Using a family of unified software modules and rich packet-flow based metadata, the nGenius Service Assurance Solution delivers unprecedented visibility into the end-to-end service delivery environment. By delivering a broad range of intelligent data sources, the nGenius solution provides unified visibility into virtually any place in the network – extending from the datacenter infrastructure and virtualized servers to the network core, edge and branch office – to deliver highly accurate insight into the user’s application performance experience. This highly scalable, network-wide solution provides IT organizations the tools and |
7
Table of Contents
| service-oriented workflows needed to significantly improve the quality of services delivered, and dramatically reduce the time required to identify and resolve performance problems by enabling a more predictive and preventative approach to managing service delivery. |
| • | Sniffer Analysis Software Suite provides a direct connection to nGenius InfiniStream® appliances for highly optimized forensic analysis and packet data mining to exploit fully the valuable information contained within network packets. The Sniffer Analysis software suite can be deployed on a stand-alone basis or as a part of the comprehensive nGenius Service Assurance Solution. When deployed in a stand-alone mode, Sniffer Analysis delivers segment-by-segment DPA and troubleshooting capabilities. The Sniffer Analysis software suite provides a powerful view deep into IP network packets revealing granular information about network and application interactions and response time and latency metrics. |
| • | Sniffer Portable Analyzer Product Family provides portable network and application analysis capabilities for field deployments. Built on widely deployed Sniffer technology, the software is used in individual laptops for portable analysis and troubleshooting to enable rapid isolation of issues for wired and wireless networks. |
nGenius Service Assurance Solution
The nGenius Service Assurance Solution is a tightly integrated unified service delivery management platform that provides comprehensive, real-time network, application and service performance intelligence to enable organizations to assure optimized network and application performance and quality of user experience. The nGenius Service Assurance Solution provides always-on network and application visibility with a consistent view of service-oriented analysis and reporting with service-oriented workflows that enables increased productivity and collaboration across the IT organization. Solution capabilities include:
| • | Intelligent early warning and service visualization – enables the automated identification and reporting of service and network anomalies by continuously monitoring and analyzing application and service traffic flowing across the network at multiple points. Network-based anomaly detection capabilities identify deviations in normal service and user behavior as well as changes to application and server usage. These capabilities provide early warning of potential service degradations before they can impact large numbers of users or lead to service degradations. |
| • | Network, application and service performance management – provides unified insight into a converged network environment with the ability to view voice, video and data metrics side-by-side in the same easy-to-use workspace. With application recognition and monitoring of well-known, custom-developed, virtualized, and Web-based applications and services, users are able to monitor and analyze critical application and network performance metrics that identify interrelationships and interdependencies between applications over the network infrastructure. |
| • | Packet-level forensic analysis – enables deep-packet visibility and granular back-in time forensic analysis to resolve the most difficult application and service delivery problems. This expert level visibility is useful in both application and network performance management activities. |
| • | Planning and optimization capabilities – shows how resources are being consumed and reveals capacity shortfalls to keep service delivery environments running at peak efficiency and performance to optimize existing IT technology investments. |
| • | Service and Policy validation – delivers key metrics and insight into the service delivery environment to validate the impact of the implementation of network optimization policies for applications and services. |
The nGenius Service Assurance Solution enables a unified approach to managing all aspects of service delivery that empowers IT teams to improve the overall quality of service for applications and service with
8
Table of Contents
greater reliability, availability, improved network performance and responsiveness. We believe that a unified framework for managing service delivery helps organizations lower the total cost of IT operations by enabling them to consolidate operations around a single unified tool set that can then be leveraged across the entire organization. This improves IT staff productivity, collaboration and enables better cross-departmental sharing of management tool investments. With a common basis for analysis and understanding the IT organization gains better insight into the real-time operation of the service delivery environment and is able to reduce the overall total cost of ownership and maximize the return on network and application investments.
The nGenius Service Assurance Solution is a platform that uses a number of specialized software modules and intelligent data sources consisting of:
| • | nGenius Performance Manager – Our core analysis module that analyzes and correlates the meta-data delivered by a comprehensive range of nGenius intelligent data sources (hardware devices and software agents) for integrated application and service performance monitoring, response time analysis, troubleshooting, capacity planning and trending and reporting enabling end-to-end visibility and assurance of service delivery. |
| • | nGenius Service Delivery Manager – A real-time service dashboard that provides unified visibility into service delivery in the context of how services are delivered and consumed to produce timely, actionable management insight. Combining real-time and historical views of service domains the dashboard automates the detection of service quality problems and emerging security threats across physical, virtual, and cloud-based services from the application hosting environment, through the network, to the user. |
| • | nGenius Subscriber Intelligence – Designed for mobile operators, nGenius Subscriber Intelligence provides datacenter-to-core-to-access visibility for managing mobile data sessions in general packet radio service (GPRS), in universal mobile telecommunications systems (UMTS), code division multiple access (CDMA) and LTE mobile networks. nGenius Subscriber Intelligence incorporates NetScout’s Adaptive Session Intelligence ™ (ASI) technology built into our nGenius InfiniStream appliances to provide unmatched, real-time correlation – with network, service and subscriber context –of related user plane and control plane sessions across both the core and access portions of the network. |
| • | nGenius Trading Intelligence – A high-performance, latency-management solution purpose-built for trading environments that addresses the specialized visibility needs of exchanges and trading market firms. Trading Intelligence provides real-time visibility into complex trade order execution, market data feed latency and performance for trading environments enabling trade engineers to isolate delays, compare venue execution routes, monitor trade activity, and track client access to better optimize the performance of high-speed trading platforms. |
| • | Sniffer Analysis – Enables deep levels of data mining into network packets. This includes forensic analysis and expert decodes from the nGenius InfiniStream appliance to speed troubleshooting and help with post event analysis. |
| • | nGenius Intelligent Data Sources – nGenius Intelligent data sources range from nGenius InfiniStream appliances, to software-based agents for virtual environments and deployment within network equipment; to support for Cisco NetFlow, jFlow and sFlow data collection devices. Our intelligent data sources utilize a common ASI technology framework that enables the disparate metrics collected to be displayed in comprehensive and unified views, with seamless workflows across the fully integrated and unified nGenius Service Assurance Solution. |
| • | nGenius Performance Manager for Flows and nGenius Analytics for Flows – nGenius Performance Manager and Analytics for Flows support Cisco NetFlow, sFlow, IP service level agreement data for analysis and reporting of performance problems, analysis and reporting for application utilization and conversation-level statistics and management information base (MIB II) data collected by nGenius Collectors. |
9
Table of Contents
Our unique and scalable approach to understanding the service delivery environment and the interdependencies of the network, application and users has allowed us to break new ground in the industry, offering superior visibility into service and application traffic.
Integration with third-party solutions
To have greater operational impact on assuring performance of applications and service delivery, NetScout has integrated its technology with third-party management consoles and business service management systems. This integration allows organizations to receive alarms on impending performance problems and to link into the nGenius solution in order to perform detailed problem analysis and troubleshooting. By providing seamless integration into management platforms, NetScout fills a significant gap in the third party product functionality and visibility into the interaction of applications, services and infrastructure resources from a packet-based network vantage point. NetScout collaborates with technology partners to provide integrated solutions and extend the value of the nGenius Service Assurance Solution for application and network performance management across the organization. Using packet-flow data, key performance indicators and other sources of performance information derived from the nGenius Service Assurance Solution, integrated solutions enhance an organization’s ability to optimize, simplify and protect the service delivery environment.
| • | Cisco Systems – NetScout is a member of the Cisco Developer Network Program for Mobility, Unified Communications and Advanced Routing. NetScout has integrated its widely deployed nGenius probe technology into the Cisco Integrated Services Router (ISR) platform enabling our joint customers to leverage the end-to-end capabilities of our service assurance solution from the datacenter to the branch office. We have received certification of our compatibility and interoperability with Cisco’s Unified Communications platform. NetScout has also integrated its Sniffer Global product with the Cisco 3300 series Mobility Services Engine, to provide contextual location information to simplify and improve management of wireless networks. |
| • | Hewlett-Packard Company – NetScout is a Platinum Business Partner in Hewlett-Packards (HP’s) Enterprise Management Alliance Program, and provides integration between the nGenius Service Assurance Solution with HP Business Technology Optimization, Software solutions including HP OpenView Network Node Manager, HP Business Availability Center and HP Operations Manager. Together the integrated solutions provide our joint customers a “single-pane-of-glass” approach to troubleshooting to speed problem identification and resolution and assure users experience. In addition, NetScout has integrated its nGenius Integrated agent into some of the HP Networking chassis switching products to provide visibility into network and application performance at the network edge. |
| • | ArcSight (an HP Company) – The nGenius Service Assurance Solution supports the ArcSight Common Event Format connector to deliver automated real-time alerts to the ArcSight Logger, ArcSight Enterprise Security Manager and ArcSight Express platforms. This integration provides ArcSight users with trusted advanced early warning alerts that link the nGenius Solution’s intelligent early warning and DPA and forensics capabilities to improve situational awareness and rapidly assess and remediate security incident impact. |
| • | IBM – NetScout is an International Business Machine (IBM®), PartnerWorld member, and has been awarded “Ready for IBM Tivoli Software” validation status to nGenius service assurance solution for its integration with IBM Tivoli® NetView®, IBM Tivoli Enterprise Console® and IBM Tivoli Netcool®/OMNIbus. The integration between NetScout and IBM platforms provides our joint customers with expanded reach of their Event Management Systems by combining integrated fault management and service delivery assurance into a single integrated console view with a seamless troubleshooting workflow. |
| • | EMC® Ionix™ Control Center (formerly SMARTS®) – NetScout is an EMC Corp. (EMC) Velocity2 partner and provides integration between the nGenius Service Assurance Solution and the EMC Ionix Service Assurance Manager, EMC Ionix IP Availability Manager and EMC Ionix |
10
Table of Contents
| Discovery Manager. Integration between the nGenius solution and EMC Ionix solution provides our joint customers with complementary visibility into the packet-flow data within the service delivery environment. |
Product Enhancements and New Products
NetScout continuously enhances its solutions to meet the increasing demands and ever changing technology landscape of IP networks and service and applications. Typically, these types of changes result in modest increases in the functionality of the products that do not meet the criteria for capitalization. In recent years, we have also delivered major product upgrades across our product lines, more tightly integrating deep packet analysis and forensics into our top-down performance management workflows, improving the flexibility of our industry-leading intelligent early warning capabilities, and adding support for new sources of user experience and performance related metrics. During fiscal year 2011, we released several new integrations with third-party solutions and new products and enhancements that will help our customers meet the challenges of managing service delivery, and performance issues across large, globally distributed enterprise, service provider, and government networks. Key introductions during the fiscal year include:
| • | nGenius Service Delivery Manager – Is a real-time service dashboard that provides unified visibility into end-to-end service delivery in context with how services are delivered and consumed to deliver timely and actionable management insight to effectively assure service levels and the user experience. Combining real-time and historical views of service domains to provide a view into the health and availability of services, the dashboard automated the detection of service quality problems and emerging security threats across physical, virtual, and cloud-based services from the application hosting environment, through the network, to the user. |
| • | nGenius InfiniStream 7900 series Appliance – We introduced the nGenius InfiniStream 7900 series appliance to help our customers address the need for increased performance and packet storage capacity to meet the challenges of growing service provider traffic levels. Providing 10 Gigabit Ethernet connections, the appliance has a modular design enabling our customers’ expansion flexibility and supports up to 96 terabytes of storage. |
| • | Added support for LTE – We added new capabilities that support Long Term Evolution/System Architecture Evolution (LTE/SAE) and Evolved Packet Core (EPC) networks to enable mobile operators to manage service delivery and user experience. These enhancements include support for new LTE/EPC protocols and interfaces providing operators unified and consistent visibility across 2.5G, 3G and LTE/EPC networks from a single unified service management platform. |
| • | Integration into the ArcSight SEIM solutions – NetScout received certification for its integration with the ArcSight Enterprise Threat and Risk Management platforms. With support for the ArcSight Common Event Format the nGenius solution delivers automated real-time alerts to ArcSight platforms providing trusted advanced early warning notifications that link the nGenius Solution’s powerful network-based anomaly detection, DPA and rich forensics capabilities to improve situational awareness and rapidly assess event impact. |
| • | Integration into HP Networking network switches – We extended our nGenius Integrated Agent technology to be deployed into HP Networking switches to allow the HP Networking E8200 zl and E5400 zl switches to become intelligent instrumentation points providing DPA capabilities. Utilizing the HP AllianceONE Advanced Services zl Module, we have been able to integrate our industry-leading probe technology into the HP E Switch Series to enable cost-effective monitoring of service delivery at the network edge. |
| • | nGenius Trading Intelligence – A high-performance, latency-management solution purpose-built for trading environments that addresses the specialized visibility needs of exchanges and trading market firms. Trading Intelligence provides real-time visibility into complex trade order execution, market data feed latency and performance for trading environments enabling trade engineers to isolate delays, |
11
Table of Contents
| compare venue execution routes, monitor trade activity, and track client access to better optimize the performance of high-speed trading platforms. |
| • | Adaptive Session Intelligence (ASI) technology – ASI is a proprietary, real-time DPA engine that enables more scalable and granular visibility into IP service performance across complex multi-domain and cloud environments. ASI’s patent pending technology performs granular data mining as traffic crosses the wire and dynamically tracks complex service transactions across physical and virtual environments. ASI’s technology dramatically increases the scale, depth and speed of the nGenius solution’s analysis velocity. |
Enhancing shareholder value through sustained growth and increased profitability based on our continued market leadership is our primary objective. We continue to see a strong level of interest by the market for our products and technology as both enterprise and service provider customers struggle to keep up with the increasing complexity and volume of service traffic over IP networks. Both of these segments are looking for unified approaches that can scale to manage and assure the delivery of critical services over highly distributed IP networks. We intend to capitalize on this growing market demand regarding user experience in managing service delivery. We will pursue growth by increasing our ongoing business with our established customers, expanding our worldwide coverage and presence to add new customers, growing and establishing new relationships with technology alliance partners and driving greater value through strategic resellers and go to market partners. Key elements of our strategy include:
| • | Drive technology innovation to extend our market leadership – We are increasing our investment in research and development to expand and enhance our unified service delivery management capabilities that capitalize on our extensive experience with global enterprise and service provider organizations with very large, high-capacity IP-based networks. We intend to take advantage of our unique position in both the enterprise and service provider markets to cross-leverage our technology development for both markets to enable greater capabilities for our current and new customers. We will enhance and extend our product line to meet the increasing challenges of managing a diverse range of services over an increasingly global network environment. |
| • | Continued portfolio enhancements – We plan to continue to enhance our products and solutions to address the management challenges associated with virtualization, cloud computing, service-oriented architectures, VoIP, video, and Telepresence technologies. In addition, we will continue to drive our solutions to help IT organizations address the challenges of borderless networks, datacenter consolidation, branch office consolidation and optimization, increasing mobility and the move to a more process-oriented operating environment. |
| • | Enabling pervasive visibility – We intend to continue to expand our intelligent data source family to enable our customers to achieve more visibility in more places across their end-to-end network environment. We are expanding our nGenius InfiniStream appliance family to enable greater levels of storage and processing capacity and to expand our software-based nGenius Virtual Agent and nGenius Integrated Agent technology to enable wider deployment of our technology within virtual computing environments, network devices and computing platforms. We intend to continue to greatly enhance our ability to scale and to generate real-time metadata to meet the need for addressing a rapidly growing level of data traffic and an increasingly complex application environment. This includes extending and strengthening our market and technology lead by supporting new and innovative ways to address the ongoing technology challenges associated with the increasing volume of data traffic and enable scalable support for 40 Gigabit, 100 Gigabit topologies and increasing global deployments of IPv6. |
| • | Expand our customer base in both enterprise and service provider markets – As of March 31, 2011, NetScout’s customer set included 96 of the Fortune 100 companies and approximately forty |
12
Table of Contents
| percent of the Fortune Global 2000. We are deployed in more than 130 service provider networks across 42 countries. It is our intention to substantially grow our presence in both the enterprise and service provider markets. In the enterprise market, we are growing our installed base footprint to include a broader number of top-tier enterprise customers as well as extending to reach the mid-market enterprise customers. We intend to increase the use of our products across the IT organization to include new operational groups by expanding their capabilities and value. In the service provider market, we are expanding our presence through new service provider customer acquisitions as well as expanding our footprint further out into the radio access network deeper into the core and into new datacenter expansions as cloud-based service offerings become increasingly strategic to service providers. |
| • | Increase market relevance and awareness – To generate increased demand for our products we will continue to promote and position our technology, products and solutions to both the enterprise and service provider market and drive our vision and strategy of unified service delivery management. In addition, we will continue to drive industry initiatives around managing service delivery. |
| • | Scale and grow our direct sales force – We expanded our direct sales force in fiscal year 2011 and restructured it to specifically and effectively target the enterprise and service provider markets. Each of these markets has different technology issues, challenges and sales cycles. Consequently, NetScout is very well positioned with a well aligned field organization that will enable us to better meet the needs of these two diverse markets. |
| • | Extend our technology partner alliance ecosystem – We plan to continue to enhance our technology value, product capabilities and customer relevance through the continued integration of our products into technology partner products. This includes both interoperability integration efforts, as well as embedding our technology into alliance partner products to gain a more pervasive footprint across both enterprise and service provider networks. |
| • | Enhance and extend our training services – We plan to extend and continue to enhance our training services to support our growing customer base in both the enterprise and service provider markets. We continue to enhance our training with personalized education programs to help our customers deploy and use our products more effectively. We have strengthened our classroom training and added web-based on-demand training programs. We also continue to enhance our certification programs designed to recognize network professionals who have demonstrated an in-depth understanding of nGenius and Sniffer products and technologies. |
We sell our products, support and services through a direct sales force and an indirect reseller and distribution channel. Our sales force uses a “high-touch” sales model that consists of face-to-face meetings with customers to understand and identify their unique business challenges and requirements. Our sales teams then translate those requirements into tailored business solutions that allow the customer to maximize the performance of its infrastructure and service delivery environment. Due to the complexity of the systems and the capital expenditure involved, our sales cycle typically takes three to twelve months. We build strategic relationships with our customers by continually enhancing our solution to help them address their evolving service delivery management challenges. In addition to providing a comprehensive solution to meet these needs, we continually provide software enhancements to our customers as part of their maintenance contracts with us. These enhancements are designed to provide additional and ongoing value to our existing customers to promote loyalty and the expansion of their deployment of our products. Existing customer growth is also driven by the expansion and changes in their networks as they add new infrastructure elements, new users, new locations, new applications and experience increasing service traffic volumes.
Our sales force is organized into four main geographic teams covering sales around the globe: United States, Europe, Asia and the rest of the world. Revenue from sales outside the United States represented 27%, 27% and
13
Table of Contents
25% of our total revenue in the fiscal years ended March 31, 2011, 2010 and 2009, respectively. Sales to customers outside the United States are primarily export sales through channel partners, who are generally responsible for distributing our products and providing technical support and service to customers within their territories. Sales arrangements are primarily transacted in United States dollars. Our reported international revenue does not include any revenue from sales to customers outside the United States that are shipped to our United States-based indirect channel partners. These domestic resellers fulfill customer orders based upon joint selling efforts in conjunction with our direct sales force and may subsequently ship our products to international locations; however, we report these shipments as United States revenue since we ship the products to a domestic location. We expect revenue from sales to customers outside the United States to continue to account for a significant portion of our total revenue in the future.
Our marketing organization drives our market strategy, product positioning and messaging and produces and manages a variety of programs such as advertising, trade shows, industry events, public and analyst relations, direct mail, seminars, sales promotions, and web marketing to promote the sale and acceptance of our solutions and to build the NetScout, nGenius and Sniffer brand names in the marketplace. Key elements of our marketing strategy focus on thought leadership, market education, go to market strategies, reputation management, demand generation, and the acceleration of our strategic selling relationships with local and global resellers, systems integrators, and our technology alliance partners.
We have experienced, and expect to continue to experience, quarterly variations in our order bookings as a result of a number of factors, including the length of the sales cycle, complexity of customer environments, new product introductions and their market acceptance and seasonal factors affected by customer projects and typical IT buying cycles. Due to these factors, we historically have experienced stronger bookings during our fiscal third and fourth quarters than in the first and second quarters. Net revenue can also be affected by unforeseen delays in product shipments due to issues such as on hand inventory, customer shipping instructions and acceptance requirements.
Customer satisfaction is a key driver of NetScout’s success. NetScout’s MasterCare™ support programs offer customers various levels of high quality support services to assist in the deployment and use of our solutions. We have support personnel strategically deployed across the globe to deliver 24/7 toll-free telephone support to our premium MasterCare customers. Some of the support services, such as on-site support activities, are provided by qualified third party support partners. In addition many of our certified resellers provide Partner Enabled Support to NetScout end-users. This is especially prevalent in international locations where time zones and language, among other factors, make it more efficient for end-users to have the reseller provide initial support functions. MasterCare support also includes updates to our software and firmware at no additional charge, if and when such updates are developed and made generally available to our commercial customer base. If ordered, MasterCare support commences upon expiration of the standard warranty for software. For software, which also includes firmware, the standard warranty commences upon shipment and expires 90 days thereafter. With regard to hardware, the standard warranty commences upon shipment and expires 12 months thereafter. We believe our warranties are consistent with commonly accepted industry standards.
Our continued success depends significantly on our ability to anticipate and create solutions that will meet emerging customer requirements. We have invested significant financial resources and personnel into the development of our products and technology. Our continued investment in research and development is crucial to our business and our continued success in the market. We have assembled a team of highly skilled engineers with expertise in various technologies associated with our business and the technologies being deployed by our
14
Table of Contents
customers. These technologies and expertise include networks, protocols, applications, application delivery, WAN technologies, storage and systems management. As we have expanded our market to also include the wireless service provider sector, we have added a significant number of resources with expertise in service provider networks and technologies including GSM, UMTS, CDMA and LTE technologies. We plan to continue to expand our product offerings and capabilities in the near future, and, therefore, plan to continue to invest and dedicate significant resources to our research and development activities. In addition, as we continue to expand our position in the service provider market, we will need to continue to expand our offerings and focused capabilities for these customers. We will continue to make substantial investments in growing our service provider technology expertise to maintain and grow our market and technology lead for this rapidly growing market opportunity.
We predominantly develop our products internally, with some third party contracting. We have also acquired developed technology through business acquisitions. To promote industry standards and manifest technology leadership, we participate in and support the activities and recommendations of industry standards bodies, such as the Internet Engineering Task Force, the 3rd Generation Partnership Project and we also engage in close and regular dialogue with our key customers and alliance partners. These activities provide early insight into the direction of network and applications performance requirements for current and emerging technologies.
Our manufacturing operations consist primarily of final product assembly, configuration and testing. We purchase components and subassemblies from suppliers and construct our hardware products in accordance with NetScout standard specifications. We inspect, test and use process control to ensure the quality and reliability of our products. In February 1998, we obtained ISO 9001 quality systems registration, a certification showing that our corporate procedures and manufacturing facilities comply with standards for quality assurance and process control. In July 2003, we obtained ISO 9001:2000 quality systems registration, a certification showing that our corporate procedures comply with standards for continuous improvement and customer satisfaction.
Although we generally use standard parts and components for our products, which are available from various suppliers, each of the computer network interface cards used in our devices is currently available only from separate single source suppliers. We have generally been able to obtain adequate supplies of components in a timely manner from current suppliers. While currently we purchase from specific suppliers, we believe that, in most cases, alternate suppliers can be identified if current suppliers are unable to fulfill our needs. Our reliance on single source suppliers is further described in Item 1A “Risk Factors.”
We manufacture our products based upon near-term demand estimates resulting from detailed sales forecasts. Due to the fact that these forecasts have a high degree of variability because of such factors as time of year, overall economic conditions and employee incentives, we maintain inventory levels in advance of receipt of firm orders to ensure that we have sufficient stock to satisfy all incoming orders.
We sell our products to enterprises and service providers and other organizations with large- and medium-sized high-speed IP computer networks. Our enterprise customers cover a wide variety of industries, such as financial services, technology, public sector, manufacturing, healthcare, utilities, education and retail. In the telecommunications service provider segment we address mobile operators, wireline operators and cable operators. A significant number of our service provider customers are mobile operators.
We configure our products to customer specifications and generally deliver the final products to the customer within a relatively short time after receipt of the purchase order. These orders also often include service engagements and technical support coverage. Customers may reschedule or cancel orders prior to shipment with little or no penalty.
15
Table of Contents
We concluded fiscal years 2011 and 2010 with an immaterial amount of combined product backlog, consisting of unshipped orders and deferred product revenue.
In recent years we implemented reseller specific programs to improve our reach to customers and extend our presence in new markets through channel partners. We sell through a broad range of channel partners including value added resellers, value added distributors, resellers, and system integrators, for both the enterprise and service provider markets. Sales to customers outside the United States are primarily export sales through channel partners. These channel partners help us market and sell our products to a broad array of organizations globally and allow us to better allocate and leverage our field sales force. In addition, and in conjunction with our relationship with Cisco Systems, we have been developing channel programs that we expect will enable us to use our common channel partners to tap the extended reach and value of the global Cisco reseller channel.
Historically and currently, we have used indirect distribution channels principally as intermediaries on contractual terms for customers with whom we have no contract. Our sales force meets with end user customers to present NetScout products and solutions, conduct demonstrations, provide evaluation equipment, recommend detailed product solutions, develop product deployment designs and timelines, and assist in establishing financial and other justification for the proposed solution. During this selling process a channel partner, who has contracts with both the end customer and NetScout, may be brought in to facilitate the transaction and to provide fulfillment services. In the case of international channel partners, those services usually also include currency translation and support. In the U.S., fulfillment services are usually limited to invoicing and cash collection. Under this approach, we have limited dependence upon channel partners for the major elements of the selling process. In many cases, there are multiple channel partners with the required contractual relationships, so dependence on any single channel partner is not significant.
Total revenue from indirect channels represented 59%, 61% and 59% of our total revenue for the fiscal years ended March 31, 2011, 2010 and 2009, respectively.
The service assurance and performance management market is highly competitive, rapidly evolving, and a fragmented market that has overlapping technologies and competitors. Consequently, there are a number of companies that deliver some elements of our solutions. There are also larger IT management companies that compete for the same IT budget for managing performance and service delivery with broader less focused offerings.
We believe we compete primarily on the basis of offering a complete and comprehensive service delivery management solution that enables IT organizations to addresses the challenges of managing and assuring the delivery of critical IT services and applications to predict, identify and resolve the root causes of poor performance of large-scale, distributed IP networking environments. We believe other principal competitive factors in our market include scalability, ability to address a large number of applications, locations and users, product performance, the ability to easily deploy into existing network environments and the ability to administer and manage the solution. We believe that our solutions provide superior data and perform better than competitive products as measured by a broad range of metrics including the ability to recognize and track a large number of applications, scalability to support high and increasing levels of data and network traffic, the ability to look at both data and control plane traffic across an entire network and the ability to provide real-time information about service performance and real-time alerts to emerging service problems. Our ability to sustain such a competitive advantage depends on our ability to deliver continued technology innovation and adapt to meet the evolving needs of our customers.
We believe we are currently the only vendor providing a comprehensive and end-to-end service delivery management solution that is capable of addressing the needs of both enterprise and service provider customers and can scale to meet the enormous challenges of today’s dynamic service delivery environments. This capability will be the
16
Table of Contents
most critical factor in managing mission critical applications in the much anticipated new public cloud IT paradigm of the future. There have been some acquisitions by large IT management vendors to strengthen their portfolio in the service assurance market and they will continue to invest in this area. We believe that we compete favorably in the service delivery management and service assurance markets and are the only vendor with a comprehensive service assurance and service delivery management solution with the necessary factors of speed, granularity of critical information and power of analysis to meet the needs of today and tomorrow’s dynamic IP-based network operating environments. We have a unified architecture, compared to many vendors’ approach in combining disparate technology elements. We believe we have a significant advantage in scalability, comprehensiveness of data gathered, performance, ease-of-use, unified workflows and the ability to scale our solution to address large global deployments that encompass a large number of applications, services, locations and users.
In the enterprise market, our larger competitors include companies such as Computer Associates and OPNET Technologies, Inc. along with a number of smaller private companies and new market entrants. In addition, we both compete with and partner with the large enterprise management vendors, such as IBM, HP, and EMC, who currently offer generalized performance management solutions but could provide enhanced solutions in the future. In the service provider market our primary large competitors include Tektronix, a division of Danaher, and JDSU, who provide operational management systems based primarily on monitoring legacy signaling data, along with a number of smaller private companies and new market entrants. Competitive factors in our industry are further described in Item 1A “Risk Factors.”
We rely on patent, copyright, trademark, and trade secret laws and contract rights to establish and maintain our rights in our technology and products. While our intellectual property rights are an important element in our success, our business as a whole does not depend on any one particular patent, trademark, copyright, trade secret, license, or other intellectual property right.
NetScout uses contracts, statutory laws, domestic and foreign intellectual property registration processes, and international intellectual property treaties to police and protect its intellectual property portfolio and rights from infringement. From a contractual perspective, NetScout uses license agreements and non-disclosure agreements to control the use of our intellectual property and protect NetScout trade secrets from unauthorized use and disclosure. In addition to license agreements, NetScout relies on U.S. and international copyright law to protect against unauthorized copying of software programs, in the U.S. and abroad. NetScout has obtained U.S. and foreign trademark registrations to preserve and protect certain trademarks and trade names. NetScout has also filed and obtained U.S. patents to protect certain unique NetScout inventions from being unlawfully exploited by other parties. However, there is no assurance that pending or future patent applications will be granted, that we will be able to obtain patents covering all of our products, or that we will be able to license, if needed, patents from other companies on favorable terms or at all. Our proprietary rights are subject to other risks and uncertainties described under Item 1A “Risk Factors.”
As of March 31, 2011, we had a total of 845 employees, 586 of whom were employed in the United States, in the following departments:
| Function |
Number of employees |
|||
| Sales and marketing |
313 | |||
| Research and development |
270 | |||
| Support services |
121 | |||
| General and administrative |
114 | |||
| Manufacturing |
27 | |||
| 845 | ||||
17
Table of Contents
In addition to the other information in this report, the following discussion should be considered carefully in evaluating NetScout and our business. This Annual Report on Form 10-K contains forward-looking statements under Section 21E of the Exchange Act and other federal securities laws. These statements relate to future events or our future financial performance and are identified by terminology such as “may,” “will,” “could,” “should,” “expects,” “plans,” “intends,” “seeks,” “anticipates,” “believes,” “estimates,” “potential” or “continue,” or the negative of such terms or other comparable terminology. These statements are only predictions. You should not place undue reliance on these forward-looking statements. Actual events or results may differ materially. Factors that may cause such differences include, but are not limited to, the factors discussed below and in our other filings with the SEC. These factors may cause our actual results to differ materially from any forward-looking statement.
Our operating results and financial condition have varied in the past and may in the future vary significantly depending on a number of factors. Except for the historical information in this report, the matters contained in this report include forward-looking statements that involve risk and uncertainties. The following factors are among many that could cause actual results to differ materially from those contained in or implied by forward-looking statements made in this report. These statements involve the risks and uncertainties identified below as well as additional risks and uncertainties that are not yet identified or that we currently think are immaterial may also impact our business operations. Such factors are among many that may have a material adverse impact upon our business, results of operations and financial condition.
Our quarterly revenue and operating results may fluctuate. Our quarterly revenue and operating results are difficult to predict and may fluctuate significantly from quarter to quarter. Our quarterly revenue may fluctuate as a result of a variety of factors, many of which may be outside of our control, including the following:
| • | technology spending by current and potential customers; |
| • | uneven demand for service delivery and application performance management solutions; |
| • | the timing and size of orders from customers, especially in light of our lengthy sales cycle; |
| • | the timing and market acceptance of new products or product enhancements by us or our competitors; |
| • | changes in the distribution channels through which our products are sold; |
| • | the timing of hiring sales personnel and the speed at which such personnel become productive; |
| • | our ability to anticipate or adapt effectively to developing markets and rapidly changing technologies; |
| • | changes in the number and size of our competitors and changes in the prices of competitors’ products; |
| • | the timing and impact of security-related threats and outbreaks (e.g., worms and viruses); |
| • | customer ability to implement our products; |
| • | changes in foreign currency exchange rates; |
| • | attrition of key employees; and |
| • | economic slowdowns and the occurrence of unforeseeable events, such as terrorist attacks, which contribute to such slowdowns. |
Most of our expenses, such as employee compensation, benefits and rent, are relatively fixed in the short term. Moreover, our expense levels are based, in part, on our expectations regarding future revenue levels. As a result, if revenue for a particular quarter is below our expectations, we may not be able to reduce operating expenses proportionately for that quarter, and, therefore, this revenue shortfall would have a disproportionately negative impact on our operating results for that quarter.
18
Table of Contents
If we fail to introduce new products or enhance our existing products to keep up with rapid technological change, demand for our products may decline. The market for application and network performance management and service assurance solutions is characterized by rapid changes in technology, evolving industry standards, changes in customer requirements and frequent product introductions and enhancements. Our success is dependent upon our ability to meet our customers’ needs, which are driven by changes in computer networking technologies, new application technologies and the emergence of new industry standards. In addition, new technologies may shorten the life cycle for our products or could render our existing or planned products obsolete. If we are unable to develop and introduce new network and application performance management and service assurance products or enhancements to existing products in a timely and successful manner, this inability could have a material and adverse impact on our business, operating results and financial condition.
We have introduced and intend to continue to introduce new products. If the introduction of these products is significantly delayed or if we are unsuccessful in bringing these products to market, our business, operating results and financial condition could be materially and adversely impacted.
We face significant competition from other technology companies. The market for application and network performance management and service assurance solutions is highly competitive. The market is fragmented with a number of vendors offering elements of our total solution. We believe customers make service management system purchasing decisions based primarily upon the following factors:
| • | product performance, functionality and price; |
| • | name and reputation of vendor; |
| • | distribution strength; and |
| • | alliances with industry partners. |
We compete with a growing number of smaller providers of application performance management solutions and providers of portable network traffic analyzers and probes. In addition, leading network equipment and application technology vendors offer their own limited, generalized management solutions, including products which they license from other competitors. Some of our current and potential competitors have longer operating histories, greater name recognition and substantially greater financial, management, marketing, service, support, technical, distribution and other resources than we do. Further, in recent years some of our competitors have been acquired by larger companies that are seeking to enter or expand in the markets in which we operate. Therefore, given their larger size and greater resources our competitors may be able to respond more effectively than we can to new or changing opportunities, technologies, standards and customer requirements.
As a result of these and other factors, we may not be able to compete effectively with our current or future competitors, which could have a material and adverse impact on our business, operating results and financial condition.
If our products contain errors, they may be costly to correct, revenue may be delayed, we could be sued and our reputation could be harmed. Despite testing by our customers and us, errors may be found in our products after commencement of commercial shipments. If errors are discovered, we may not be able to correct them in a timely manner or at all. In addition, we may need to make significant expenditures to eliminate errors and failures. Errors and failures in our products could result in loss of or delay in market acceptance of our products and could damage our reputation. If one or more of our products fail, a customer may assert warranty and other claims for substantial damages against us. The occurrence or discovery of these types of errors or failures could have a material and adverse impact on our business, operating results and financial condition.
Increased customer demands on our technical support services may adversely affect our relationships with our customers and our financial results. We offer technical support services with many of our products.
19
Table of Contents
We may be unable to respond quickly enough to accommodate short-term increases in customer demand for support services. We also may be unable to modify the format of our support services to compete with changes in support services provided by competitors. Further customer demand for these services, without corresponding revenues, could have a material and adverse impact on our financial condition and results of operations.
We must hire and retain skilled personnel. Our success depends in large part upon our ability to attract, train, motivate and retain highly skilled employees, particularly executives, sales and marketing personnel, software engineers, and technical support personnel. If we are unable to attract and retain the highly skilled technical personnel that are integral to our sales, marketing, product development and technical support teams, the rate at which we can generate sales and develop new products or product enhancements may be limited. This inability could have a material and adverse impact on our business, operating results and financial condition. In addition, loss of key personnel could adversely impact our business. Our future success depends to a significant degree on the skills, experience and efforts of Anil Singhal, our President, Chief Executive Officer, and co-founder, and our other executive officers and senior managers to work effectively as a team. The loss of one or more of our key personnel could have a material and adverse impact on our business, operating results and financial condition.
The success of our business depends, in part, on the continued growth in the market for and the continued commercial acceptance of application performance management and service assurance solutions. We derive all of our revenue from the sale of products and services that are designed to allow our customers to assure the delivery of services through the management of the performance of applications across IP networks. Therefore, we must be able to predict the appropriate features and prices for future products to address the market, the optimal distribution strategy and the future changes to the competitive environment. In order for us to be successful, our potential customers must recognize the value of more sophisticated application management solutions, decide to invest in the management of their networked applications and, in particular, adopt our management solutions. Any failure of this market to continue to be viable would materially and adversely impact our business, operating results and financial condition. Additionally, businesses may choose to outsource the operations and management of their networks to managed service providers. Our business may depend on our ability to continue to develop relationships with these service providers and successfully market our products to them.
Failure to manage growth properly and to implement enhanced automated systems could adversely impact our business. The growth in size and complexity of our business and our customer base has been and will continue to be a challenge to our management and operations. To manage further growth effectively, we must integrate new personnel and manage expanded operations. If we are unable to manage our growth effectively, our costs, the quality of our products, the effectiveness of our sales organization, attraction and retention of key personnel, our business, and our operating results and financial condition could be materially and adversely impacted. Any disruptions or ineffectiveness relating to our systems implementations and enhancements could adversely affect our ability to process customer orders, ship products, provide services and support to our customers, bill and track our customers, fulfill contractual obligations, and otherwise run our business.
Our success depends, in part, on our ability to manage and leverage our distribution channels. Sales to our distribution channels, which include resellers, original equipment manufacturers, distributors, systems integrators and service providers, accounted for 59%, 61%, and 59% of our total revenue for the fiscal years ended March 31, 2011, 2010 and 2009, respectively. To increase our sales we need to continue to enhance our indirect sales efforts, to continue to manage and expand these existing distribution channels and to develop new indirect distribution channels. Our channel partners have no obligation to purchase any products from us. In addition, they could internally develop products that compete with our solutions or partner with our competitors or bundle or resell competitors’ solutions, possibly at lower prices. The potential inability to develop new relationships or to expand and manage our existing relationships with partners, the potential inability or unwillingness of our partners to market and sell our products effectively or the loss of existing partnerships could have a material and adverse impact on our business, operating results and financial condition.
20
Table of Contents
Our success depends, in part, on our ability to expand and manage our international operations. Sales to customers outside the United States accounted for 27%, 27%, and 25% of our total revenue for the fiscal years ended March 31, 2011, 2010 and 2009, respectively. We currently expect international revenue to continue to account for a significant percentage of total revenue in the future. We believe that we must continue to expand our international sales activities in order to be successful. Our international sales growth will be limited if we are unable to:
| • | expand international distribution channels; |
| • | hire additional overseas sales personnel; |
| • | adapt products for local markets and comply with foreign regulations; and |
| • | manage geographically dispersed operations. |
The major geographic areas outside of the United States in which we manage our business are Europe, Asia and the rest of the world. Our international operations, including our operations in the United Kingdom, mainland Europe, India, Asia-Pacific and other regions are generally subject to a number of risks, including:
| • | failure of local laws to provide the same degree of protection that the laws in the United States provide against infringement of our intellectual property; |
| • | protectionist laws and business practices that favor local competitors; |
| • | dependence on local indirect channel partners; |
| • | conflicting and changing governmental laws and regulations; |
| • | longer sales cycles; |
| • | greater difficulty in collecting accounts receivable; and |
| • | foreign currency exchange rate fluctuations and political and economic instability. |
Our future growth depends on our ability to maintain and periodically expand our sales force. We must maintain and periodically increase the size of our sales force in order to increase our direct sales and support our indirect sales channels. Because our products are very technical, sales people require a comparatively long period of time to become productive, typically three to twelve months. This lag in productivity, as well as the challenge of attracting qualified candidates, may make it difficult to meet our sales force growth targets. Further, we may not generate sufficient sales to offset the increased expense resulting from growing our sales force. If we are unable to maintain and periodically expand our sales capability, our business, operating results and financial condition could be materially and adversely impacted.
If we fail to develop our brand cost-effectively, our business may suffer. We believe that developing and maintaining awareness of our brand in a cost-effective manner is important to achieving widespread acceptance of our existing and future products and services and is an important element in attracting new customers. Furthermore, we believe that the importance of brand recognition will increase as competition in our market develops. Successful promotion of our brand will depend largely on the effectiveness of our marketing efforts and on our ability to provide reliable and useful products and services at competitive prices. Brand promotion activities may not yield increased revenue, and even if they do, any increased revenue may not offset the expenses we incurred in building our brand. If we fail to promote and maintain our brand successfully, or incur substantial expenses in an unsuccessful attempt to promote and maintain our brand, we may fail to attract enough new customers or retain our existing customers to the extent necessary to realize a sufficient return on our brand-building efforts, and this could have a material and adverse impact on our financial condition and results of operations.
The current economic and geopolitical environment may impact some specific industries into which we sell. Many of our customers are concentrated in a small number of industries, including financial services,
21
Table of Contents
public sector, healthcare, and the service provider market segment. Certain industries may be more acutely affected by economic, geopolitical and other factors than other sectors. To the extent that one or more of the sectors in which our customer base operates is adversely impacted, whether as a result of general conditions affecting all sectors or as a result of conditions affecting only those particular sectors, our business, financial condition and results of operations could be materially and adversely impacted.
Uncertain conditions in the global economy and constraints in the global credit market may adversely affect our revenue and results of operations. Disruptions in the current global economy and constraints in the global credit market may cause some of our customers to reduce, delay, or cancel spending on capital and technology projects, resulting in reduced spending with us. While some industry sectors such as government and telecommunications may be less susceptible to the effects of an economic slowdown, our enterprise customers may be adversely affected, especially in financial services and consumer industries. Continued volatility in, or disruption of financial markets could limit customers’ ability to obtain adequate financing to maintain operations and result in a decrease in sales volume that could have a negative impact on our results of operations. Further, competitors may respond to economic conditions by lowering their prices, which could put pressure on our pricing. We could also experience lower than anticipated order levels, cancellations of orders in backlog, defaults on outstanding accounts receivable and extended payment or delivery terms.
Constraints in the global credit market may affect our ability to obtain credit on favorable terms or at all and to refinance any debt facilities. If conditions in the global credit markets are not favorable, we may be limited in our ability to obtain credit or obtain credit on favorable terms and could increase our borrowing costs.
We may fail to secure necessary additional financing. We may require significant capital resources to expand our business and remain competitive in the rapidly changing application performance management and service assurance industry. We may need to invest in our operations as well as acquire complementary businesses, products or technologies. Our future success may depend in part on our ability to obtain additional financing to support our continued growth and operations. If our existing sources of liquidity are insufficient to satisfy our operating requirements, we may need to seek to raise capital by:
| • | issuing additional common stock or other equity instruments; |
| • | acquiring additional bank debt; |
| • | issuing debt securities; or |
| • | obtaining lease financings. |
However, we may not be able to obtain additional capital when we want or need it, or capital may not be available on satisfactory terms. Furthermore, any additional capital may have terms and conditions that adversely affect our business, such as new financial or operating covenants, or that may result in additional dilution to our stockholders.
We have a significant amount of debt. If we fail to maintain sufficient cash as our debt becomes due or are unable to renew our revolving credit facility prior to its expiration, this may adversely affect our business, financial condition, and operating results. At March 31, 2011, we had outstanding debt of $68.1 million and a $10 million revolving credit facility, both of which expire in December 2012. We expect that existing cash, cash equivalents, marketable securities, cash provided from operations and our revolving credit facility will be sufficient to meet ongoing cash requirements. However, failure to generate sufficient cash as our debt becomes due or to renew our revolving credit facility prior to its expiration could adversely affect our business, financial condition, operating results and cash flows.
A portion of our marketable securities is invested in auction rate securities. At March 31, 2011 we had $17.5 million of our long-term marketable securities portfolio invested in auction rate securities. These securities are AAA rated and collateralized by student loans with underlying support by the federal government through the Federal Family Education Loan Program (FFELP) and by monoline insurance companies. Beginning in February
22
Table of Contents
2008 and continuing through March 31, 2011, the majority of auction rate securities in the marketplace, including all of the auction rate securities that we hold in our portfolio, experienced failed auctions. As a result, we will not be able to liquidate these holdings until a future auction is successful, the issuer redeems the outstanding securities, a buyer is found outside the auction process which may require us to take a significant discount from the face value of the securities, the securities mature, or there is a default requiring immediate repayment from the issuer. In the future, should we determine that the decline in value of these auction rate securities are other than temporary, we would recognize a loss in our consolidated statement of operations, which could be material. Because these securities are currently illiquid, we are unable to access this cash in the short term. If this illiquidity in the auction rate security market continues we may not be able to use these funds, if needed, to make debt payments, and should we need to access these assets for operations, this could have a negative effect on our business, financial condition and operating results of the company.
The price of our common stock may decrease due to market volatility. The market price of our common stock has been volatile and has fluctuated since the initial public offering of our common stock on August 12, 1999. The market price of our common stock may continue to fluctuate in response to a number of factors, some of which are beyond our control. Though activity in our stock has increased over the past three years, trading activity of our stock has historically been relatively thin, in part as a result of officers and directors and institutional shareholders holding a significant percentage of our stock. In addition, the market prices of securities of technology companies have been volatile and have experienced fluctuations that often have been unrelated or disproportionate to the operating performance of these companies. Also, broad market fluctuations could adversely impact the market price of our common stock, which in turn could cause impairment of goodwill that could materially and adversely impact our financial condition and results of operations.
It is not uncommon when the market price of a stock has been volatile for holders of that stock to institute securities class action litigation against the company that issues that stock. If any of our stockholders brought such a lawsuit against us, even if the lawsuit is without merit, we could incur substantial costs defending the lawsuit beyond any insurance coverage which we may have for such risks. Such a lawsuit could also divert the time and attention of our management.
We may not successfully complete acquisitions or integrate acquisitions we do make, which could impair our ability to compete and could harm our operating results. We may need to acquire complementary businesses, products or technologies to remain competitive or expand our business. We actively investigate and evaluate potential acquisitions of complementary businesses, products and technologies in the ordinary course of business. We may compete for acquisition opportunities with entities having significantly greater resources than us. As a result, we may not succeed in acquiring some or all businesses, products or technologies that we seek to acquire. Our inability to effectively consummate acquisitions on favorable terms could significantly impact our ability to compete effectively in our targeted markets and could negatively affect our results of operations.
Acquisitions that we do complete could adversely impact our business. The potential adverse consequences from acquisitions include:
| • | the potentially dilutive issuance of common stock or other equity instruments; |
| • | the incurrence of debt and amortization expenses related to goodwill and acquired intangible assets; |
| • | the potentially costly and disruptive impact of assuming unfavorable pre-existing contractual relationships of acquired companies that we would not have otherwise entered into and potentially exiting or modifying such relationships; |
| • | the potential litigation or other claims in connection with, or inheritance of claims or litigation risk as a result of, an acquisition including claims from terminated employees, customers, third parties or enforcement actions by various regulators; |
| • | the incurrence of significant costs and expenses; and |
| • | the potentially negative impact of poor performance of an acquisition on our earnings per share. |
23
Table of Contents
Acquisition transactions also involve numerous business risks. These risks from acquisitions include:
| • | difficulties in assimilating the acquired operations, technologies, personnel and products; |
| • | difficulties in managing geographically dispersed operations; |
| • | difficulties in assimilating diverse financial reporting and management information systems; |
| • | difficulties in maintaining uniform standards, controls, procedures and policies; |
| • | the diversion of management’s attention from other business concerns; |
| • | use of cash to pay for acquisitions may limit other potential uses of our cash, including stock repurchases and retirement of outstanding indebtedness; |
| • | substantial accounting charges for restructuring and related expenses, write-off of in-process research and development, impairment of goodwill, amortization or impairment of intangible assets and share-based compensation expense; |
| • | the potential disruption of our business; |
| • | the potential loss of key employees, customers, distributors or suppliers; |
| • | the inability to generate sufficient revenue to offset acquisition or investment costs; and |
| • | the potential for delays in customer purchases due to uncertainty and the inability to maintain relationships with customers of the acquired businesses. |
Our effective tax rate may increase or fluctuate, which could increase our income tax expense and reduce our net income. Our effective tax rate could be adversely affected by several factors, many of which are outside of our control, including:
| • | Changes in the relative proportions of revenues and income before taxes in the various jurisdictions in which we operate that have differing statutory tax rates; |
| • | Changing tax laws, regulations, and interpretations in multiple jurisdictions in which we operate as well as the requirements of certain tax rulings; |
| • | Changes in accounting and tax treatment of share-based compensation; |
| • | The valuation of generated and acquired deferred tax assets and the related valuation allowance on these assets; |
| • | The tax effects of purchase accounting for acquisitions and restructuring charges that may cause fluctuations between reporting periods; and |
| • | Tax assessments, or any related tax interest or penalties that could significantly affect our income tax expense for the period in which the settlements take place. |
An adverse change in our effective tax rate could have a material and adverse effect on our financial condition and results of operations.
Our estimates and judgments related to critical accounting policies could be inaccurate. We consider accounting policies related to cash, cash equivalents and marketable securities, revenue recognition, commission expense, uncollected deferred product revenue, valuation of inventories, valuation of goodwill and acquired intangible assets, capitalization of software development costs, derivative financial instruments, share-based compensation and income taxes to be critical in fully understanding and evaluating our financial results. Management makes accounting judgments and estimates related to these policies. Our business, operating results and financial condition could be materially and adversely impacted in future periods if our accounting judgments and estimates related to these critical accounting policies prove to be inaccurate.
24
Table of Contents
Our reliance on sole source suppliers could adversely impact our business. Specific components that are necessary for the hardware assembly of our instruments are obtained from separate sole source suppliers or a limited group of suppliers. These components include our network interface cards. Our reliance on sole or limited suppliers involves several risks, including a potential inability to obtain an adequate supply of required components and the inability to exercise control over pricing, quality and timely delivery of components. We do not generally maintain long-term agreements with any of our suppliers or have on hand large volumes of inventory. Our inability to obtain adequate deliveries or the occurrence of any other circumstance that would require us to seek alternative sources of these components would impact our ability to ship our products on a timely basis. This could damage relationships with our current and prospective customers, cause shortfalls in expected revenue, and could materially and adversely impact our business, operating results and financial condition.
Our success depends on our ability to protect our intellectual property rights. Our business is heavily dependent on our intellectual property. We rely upon a combination of patent, copyright, trademark and trade secret laws and registrations and non-disclosure and other contractual and license arrangements to protect our intellectual property rights. The reverse engineering, unauthorized copying, or other misappropriation of our intellectual property could enable third parties to benefit from our technology without compensating us. Legal proceedings to enforce our intellectual property rights could be burdensome and expensive and could involve a high degree of uncertainty. In addition, legal proceedings may divert management’s attention from growing our business. There can be no assurance that the steps we have taken to protect our intellectual property rights will be adequate to deter misappropriation of proprietary information, or that we will be able to detect unauthorized use by third parties and take appropriate steps to enforce our intellectual property rights. Further, we also license software from third parties for use as part of our products, and if any of these licenses were to terminate, we might experience delays in product shipment until we develop or license alternative software.
Others may claim that we infringe on their intellectual property rights. From time to time we may be subject to claims by others that our products infringe on their intellectual property rights, patents, copyrights or trademarks. These claims, whether or not valid, could require us to spend significant sums in litigation, pay damages or royalties, delay product shipments, reengineer our products, rename our products and rebuild name recognition or acquire licenses to such third-party intellectual property. We may not be able to secure any required licenses on commercially reasonable terms or secure them at all. We expect that these claims could become more frequent as more companies enter the market for network and application infrastructure performance management solutions. Any of these claims or resulting events could have a material and adverse impact on our business, operating results and financial condition.
The effectiveness of our disclosure and internal controls may be limited. Our disclosure controls and procedures and internal control over financial reporting may not prevent all material errors and intentional misrepresentations. Any system of internal control can only provide reasonable assurance that all control objectives are met. Some of the potential risks involved could include, but are not limited to, management judgments, simple errors or mistakes and willful misconduct regarding controls or misinterpretation. Under Section 404 of the Sarbanes-Oxley Act we are required to evaluate and determine the effectiveness of our internal control over financial reporting. Compliance with this legislation requires management’s attention and expense. Management’s assessment of our internal control over financial reporting may or may not identify weaknesses that need to be addressed in our internal control system. If we are unable to conclude that our internal control over financial reporting is effective, investors could lose confidence in our reported financial information which could have an adverse effect on the market price of our stock or impact our borrowing ability. In addition, changes in operating conditions and changes in compliance with policies and procedures currently in place may result in inadequate internal control over financial reporting in the future.
We or our suppliers may be impacted by new regulations related to climate change. We or our suppliers may become subject to new laws enacted with regards to climate change. In the event that new laws are enacted or current laws are modified in countries in which we or our suppliers operate, our flow of product may be impacted which could have a material and adverse effect on our financial condition and results of operations.
25
Table of Contents
Uncertainties of regulation of the Internet and data traveling over the Internet could have a material and adverse impact on our financial condition and results of operations. Currently, few laws or regulations apply directly to access to or commerce on the Internet. We could be materially adversely affected by regulation of the Internet and Internet commerce in any country where we operate. Such regulations could include matters such as net neutrality. The adoption of regulation of the Internet and Internet commerce could decrease demand for our products and, at the same time, increase the cost of selling our products, which could have a material and adverse effect on our financial condition and results of operations. In addition, the enactment of new federal, state, or foreign data privacy laws and regulations could cause customers not to be able to take advantage of all the features or capabilities of our products which in turn could reduce demand for certain of our products.
Item 1B. Unresolved Staff Comments
We have no unresolved comments from the SEC.
We currently lease approximately 175,000 square feet of space in an office building in Westford, Massachusetts, for our headquarters. The current lease will expire in September 2023, and we have an option to extend the lease for two additional five-year terms. We lease office space in twenty six international cities throughout the world for our sales and support personnel, as well as 72,742 square feet of space in San Jose, California. We lease 34,021 square feet of office space for our engineering and support personnel in India. We believe that our existing facilities are adequate to meet our foreseeable requirements or that suitable additional or substitute space will be available on commercially reasonable terms.
From time to time, NetScout is subject to legal proceedings and claims in the ordinary course of business. In the opinion of management, the amount of ultimate expense with respect to any current legal proceedings and claims, if determined adversely, will not have a significant adverse effect on our financial position or results of operations.
26
Table of Contents
PART II
| Item 5. | Market for Registrant’s Common Equity, Related Stockholder Matters and Issuer Purchases of Equity Securities |
Price Range of Common Stock
We completed our initial public offering on August 17, 1999. Since that time, our common stock has traded on the Nasdaq Global Market and its predecessor, the Nasdaq National Market, under the symbol NTCT. The following table sets forth, for the periods indicated, the high and low intraday sales prices for our common stock. Such information reflects inter-dealer price, without retail mark-up, markdown or commission and may not represent actual transactions.
| Quarter Ended |
High | Low | ||||||
| Fiscal Year 2010 |
||||||||
| June 30, 2009 |
$ | 11.19 | $ | 6.90 | ||||
| September 30, 2009 |
$ | 14.13 | $ | 8.75 | ||||
| December 31, 2009 |
$ | 15.05 | $ | 11.75 | ||||
| March 31, 2010 |
$ | 15.79 | $ | 13.69 | ||||
| Fiscal Year 2011 |
||||||||
| June 30, 2010 |
$ | 16.14 | $ | 12.25 | ||||
| September 30, 2010 |
$ | 21.00 | $ | 13.50 | ||||
| December 31, 2010 |
$ | 24.60 | $ | 20.50 | ||||
| March 31, 2011 |
$ | 27.72 | $ | 21.59 | ||||
Stockholders
As of May 24, 2011, we had 101 stockholders of record. We believe that the number of beneficial holders of our common stock exceeds 6,200.
27
Table of Contents
Stock Performance Graph
This performance graph shall not be deemed “filed” for purposes of Section 18 of the Exchange Act or otherwise subject to the liabilities under that Section, and shall not be deemed to be incorporated by reference into any filing of NetScout under the Exchange Act or the Securities Act of 1933, as amended.
The Stock Performance Graph set forth below compares the yearly change in the cumulative total stockholder return on our common stock during the five year period from March 31, 2006 through March 31, 2011, with the cumulative total return of the Nasdaq Composite Index and the Nasdaq Computer & Data Processing Index. The comparison assumes $100 was invested on March 31, 2006 in our common stock or in the Nasdaq Composite Index and the Nasdaq Computer & Data Processing Index and assumes reinvestment of dividends, if any.
The stock price performance shown on the graph below is not necessarily indicative of future price performance. Information used in the graph was obtained from Zacks Investment Research, Inc., a source believed to be reliable, but NetScout is not responsible for any errors or omissions in such information.
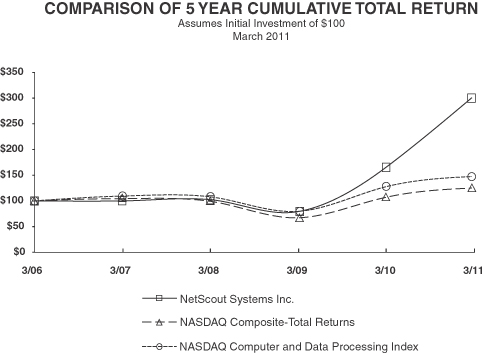
| 3/31/2006 | 3/31/2007 | 3/31/2008 | 3/31/2009 | 3/31/2010 | 3/31/2011 | |||||||||||||||||||
| NetScout Systems, Inc. |
$ | 100.00 | $ | 99.45 | $ | 102.20 | $ | 78.68 | $ | 162.53 | $ | 300.22 | ||||||||||||
| NASDAQ Composite – Total Returns |
$ | 100.00 | $ | 104.23 | $ | 98.89 | $ | 67.01 | $ | 106.10 | $ | 124.35 | ||||||||||||
| NASDAQ Computer and Data Processing |
$ | 100.00 | $ | 109.11 | $ | 107.49 | $ | 79.41 | $ | 126.15 | $ | 147.01 | ||||||||||||
28
Table of Contents
Dividend Policy
In fiscal years 2011 and 2010, we did not declare any cash dividends and do not anticipate declaring cash dividends in the foreseeable future. In addition, the terms of our credit facility limit our ability to pay cash dividends on our capital stock. It is our intention to retain all future earnings for reinvestment to fund our expansion and growth. Any future cash dividend declaration will be at the discretion of our Board of Directors and will depend upon, among other things, our future earnings, general financial conditions, capital requirements, existing bank covenants and general business conditions.
Issuer Purchases of Equity Securities
During the fourth quarter of fiscal year 2011, we did not repurchase any shares of our outstanding common stock pursuant to our open market stock repurchase program further described in Note 12 to the attached consolidated financial statements.
29
Table of Contents
Item 6. Selected Financial Data
SELECTED CONSOLIDATED FINANCIAL DATA
The selected consolidated financial data set forth below should be read in conjunction with our audited consolidated financial statements and notes thereto and “Management’s Discussion and Analysis of Financial Condition and Results of Operations” included under Item 7 of this Annual Report on Form 10-K. The consolidated statement of operations data for the fiscal years ended March 31, 2011, 2010 and 2009 and the consolidated balance sheet data as of March 31, 2011 and 2010 are derived from audited consolidated financial statements included under Item 8 of this Annual Report on Form 10-K. The consolidated statement of operations data for the fiscal years ended March 31, 2008 and 2007 and the consolidated balance sheet data as of March 31, 2009, 2008 and 2007 have been derived from audited consolidated financial statements of NetScout that do not appear in this Annual Report on Form 10-K. The historical results are not necessarily indicative of the operating results to be expected in the future.
| Year Ended March 31, | ||||||||||||||||||||
| 2011 | 2010 | 2009 | 2008(1) | 2007 | ||||||||||||||||
| (In thousands, except per share data) | ||||||||||||||||||||
| Statement of Operations Data: |
||||||||||||||||||||
| Revenue: |
||||||||||||||||||||
| Product |
$ | 159,948 | $ | 142,113 | $ | 154,161 | $ | 106,182 | $ | 63,524 | ||||||||||
| Service |
130,592 | 118,229 | 113,443 | 62,774 | 38,948 | |||||||||||||||
| Total revenue |
290,540 | 260,342 | 267,604 | 168,956 | 102,472 | |||||||||||||||
| Cost of revenue: |
||||||||||||||||||||
| Product |
38,175 | 35,564 | 43,315 | 33,965 | 17,184 | |||||||||||||||
| Service |
23,186 | 20,500 | 20,824 | 13,721 | 6,444 | |||||||||||||||
| Total cost of revenue |
61,361 | 56,064 | 64,139 | 47,686 | 23,628 | |||||||||||||||
| Gross margin |
229,179 | 204,278 | 203,465 | 121,270 | 78,844 | |||||||||||||||
| Operating expenses: |
||||||||||||||||||||
| Research and development |
40,628 | 36,650 | 40,189 | 30,000 | 18,320 | |||||||||||||||
| Sales and marketing |
105,271 | 99,059 | 98,818 | 69,652 | 42,470 | |||||||||||||||
| General and administrative |
23,308 | 20,609 | 26,118 | 26,149 | 10,531 | |||||||||||||||
| Amortization of acquired intangible assets |
1,907 | 2,057 | 1,962 | 811 | 155 | |||||||||||||||
| Total operating expenses |
171,114 | 158,375 | 167,087 | 126,612 | 71,476 | |||||||||||||||
| Income (loss) from operations |
58,065 | 45,903 | 36,378 | (5,342 | ) | 7,368 | ||||||||||||||
| Interest and other income (expense), net |
(1,772 | ) | (2,832 | ) | (5,337 | ) | (1,207 | ) | 3,898 | |||||||||||
| Income (loss) before income tax expenses (benefit) and cumulative effect of accounting change |
56,293 | 43,071 | 31,041 | (6,549 | ) | 11,266 | ||||||||||||||
| Income tax expense (benefit) |
19,028 | 15,154 | 10,993 | (4,461 | ) | 3,598 | ||||||||||||||
| Cumulative effect of accounting change, net of taxes of $42 |
— | — | — | — | 69 | |||||||||||||||
| Net income (loss) |
$ | 37,265 | $ | 27,917 | $ | 20,048 | ($ | 2,088 | ) | $ | 7,737 | |||||||||
| Basic net income (loss) per share |
$ | 0.89 | $ | 0.69 | $ | 0.51 | ($ | 0.06 | ) | $ | 0.24 | |||||||||
| Diluted net income (loss) per share |
$ | 0.87 | $ | 0.67 | $ | 0.49 | ($ | 0.06 | ) | $ | 0.23 | |||||||||
| Weighted average common shares outstanding used in computing: |
||||||||||||||||||||
| Net income (loss) per share—basic |
42,059 | 40,691 | 39,351 | 34,913 | 31,713 | |||||||||||||||
| Net income (loss) per share—diluted |
42,973 | 41,915 | 40,925 | 34,913 | 33,050 | |||||||||||||||
| (1) | On November 1, 2007, NetScout completed its acquisition of Network General Central Corporation (Network General) for aggregate consideration of approximately $212 million. |
30
Table of Contents
| March 31, | ||||||||||||||||||||
| 2011 | 2010 | 2009 | 2008(1) | 2007 | ||||||||||||||||
| (In thousands) | ||||||||||||||||||||
| Balance Sheet Data: |
||||||||||||||||||||
| Cash, cash equivalents and short- and long-term marketable securities |
$ | 228,478 | $ | 170,551 | $ | 135,912 | $ | 100,931 | $ | 100,104 | ||||||||||
| Working capital |
$ | 147,136 | $ | 91,174 | $ | 51,720 | $ | 13,754 | $ | 79,493 | ||||||||||
| Total assets |
$ | 527,570 | $ | 482,601 | $ | 436,734 | $ | 420,937 | $ | 180,419 | ||||||||||
| Debt |
$ | 68,106 | $ | 79,356 | $ | 92,500 | $ | 98,750 | $ | — | ||||||||||
| Total stockholders’ equity |
$ | 319,559 | $ | 266,843 | $ | 225,731 | $ | 197,333 | $ | 138,407 | ||||||||||
| (1) | On November 1, 2007, NetScout completed its acquisition of Network General for aggregate consideration of approximately $212 million, including $53 million in cash. |
Item 7. Management’s Discussion and Analysis of Financial Condition and Results of Operations
The following information should be read in conjunction with the audited consolidated financial information and the notes thereto included in this Annual Report on Form 10-K. In addition to historical information, the following discussion and other parts of this Annual Report contain forward-looking statements that involve risks and uncertainties. You should not place undue reliance on these forward-looking statements. Actual events or results may differ materially due to competitive factors and other factors discussed in Item 1A. “Risk Factors” and elsewhere in this Annual Report. These factors may cause our actual results to differ materially from any forward-looking statement.
NetScout Systems was founded in 1984 and is headquartered in Westford, Massachusetts. We design, develop, manufacture, market, sell and support market leading unified service delivery management, service assurance and application performance management solutions focused on assuring service delivery for the world’s largest, most demanding and complex IP based service delivery environments. We manufacture and market these products in integrated hardware and software solutions that are used by commercial enterprises, large governmental agencies and telecommunication service providers worldwide. We have a single operating segment and substantially all of our identifiable assets are located in the United States.
Our operating results are influenced by a number of factors, including, but not limited to, the mix and quantity of products and services sold, pricing, costs of materials used in our products, growth in employee related costs, including commissions, and the expansion of our operations. Factors that affect our ability to maximize our operating results include, but are not limited to, our ability to introduce and enhance existing products, the marketplace acceptance of those new or enhanced products, continued expansion into international markets, development of strategic partnerships, competition, successful integration efforts and current economic conditions.
On April 1, 2011, we completed the acquisition of Psytechnics, Inc., a provider of IP voice, video and telepresence technologies that proactively assures the user experience for unified communications services. Psytechnics’ technology strengthens NetScout’s Unified Service Delivery Management strategy by providing more comprehensive management of the quality of IP voice, video and telepresence service delivery along with all other application and data services.
We saw continued growth during the fiscal year ended March 31, 2011, with product revenue growth of 13% and overall revenue growth of 12% compared to the prior fiscal year driven by strength in our enterprise and service provider sectors. New business bookings increased by 14% when compared to the prior fiscal year. As
31
Table of Contents
the year progressed, we drove a return to growth in our broader enterprise sector that finished the year with a 17% increase in new business bookings. Within the enterprise sector, financial services was strong with new business bookings up 25% as financials recovered from the economic downturn. New business from our service provider sector increased 12%, which we expect to accelerate in fiscal 2012 as we support expanding 4G, LTE network rollouts.
Gross margin for fiscal year 2011 was 79%, up one percentage point from fiscal year 2010. We did this in part through a shift towards higher margin products.
While operating expenses increased on higher sales and marketing expenses and incentive compensation, we improved our operating margin to 20% for fiscal year 2011, compared to 18% for fiscal year 2010.
Net income and diluted net income per share increased 33% and 30%, respectively, in fiscal year 2011 through gross margin improvements compared to fiscal year 2010.
We also achieved strong cash flow with cash, cash equivalents and marketable securities increasing to $228.5 million at March 31, 2011. This represents an increase of $57.9 million over the previous fiscal year ended March 31, 2010.
Use of Non-GAAP Financial Measures
From time to time in press releases regarding quarterly earnings, presentations and other communications, we may provide financial information determined by methods other than in accordance with generally accepted accounting principles (GAAP). Recent non-GAAP financial measures have included non-GAAP revenue, income from operations, net income and net income per diluted share, each of which were adjusted from amounts determined based on GAAP to exclude the effect of purchase accounting adjustments to acquired deferred revenue resulting from our acquisitions, and to eliminate the revenue impact of recently adopted accounting guidance, and to remove share-based compensation expenses, certain business development expenses, integration expenses and the amortization of acquired intangible assets, net of related income tax effects.
Management regularly uses supplemental non-GAAP financial measures internally to understand, manage and evaluate its business and to make operating decisions. These non-GAAP measures are among the primary factors that management uses in planning and forecasting future periods. Management believes these non-GAAP financial measures enhance the reader’s overall understanding of NetScout’s current financial performance and its prospects for the future by providing a higher degree of transparency for certain financial measures and providing a level of disclosure that helps investors understand how NetScout plans and measures its business. We believe that providing these non-GAAP measures affords investors a view of our operating results that may be more easily compared to our peer companies and against prior periods by enabling investors to consider our operating results on both a GAAP and non-GAAP basis during periods where GAAP results were affected by non-recurring events, such as our acquisition of Network General in 2007.
These non-GAAP measures are not in accordance with GAAP, should not be considered an alternative for measures prepared in accordance with GAAP, and may have limitations in that they do not reflect all our results of operations as determined in accordance with GAAP. These non-GAAP measures should only be used to evaluate our results of operations in conjunction with the corresponding GAAP measures. The presentation of non-GAAP information is not meant to be considered superior to, in isolation from or as a substitute for results prepared in accordance with GAAP.
32
Table of Contents
The following table reconciles revenue, net income and net income per share on a GAAP and non-GAAP basis for the years ended March 31, 2011, 2010 and 2009 (in thousands):
| Year Ended March 31, | ||||||||||||
| 2011 | 2010 | 2009 | ||||||||||
| GAAP revenue |
$ | 290,540 | $ | 260,342 | $ | 267,604 | ||||||
| Impact of new accounting guidance |
(929 | ) | — | — | ||||||||
| Deferred revenue fair value adjustment |
132 | 1,317 | 11,782 | |||||||||
| Non-GAAP revenue |
$ | 289,743 | $ | 261,659 | $ | 279,386 | ||||||
| GAAP net income |
$ | 37,265 | $ | 27,917 | $ | 20,048 | ||||||
| Impact of new accounting guidance |
(929 | ) | — | — | ||||||||
| Deferred revenue fair value adjustment |
132 | 1,317 | 11,782 | |||||||||
| Share-based compensation expense |
6,439 | 5,456 | 5,122 | |||||||||
| Amortization of acquired intangible assets |
5,887 | 6,037 | 5,959 | |||||||||
| Business development expenses |
755 | — | — | |||||||||
| Integration expenses |
— | — | 1,858 | |||||||||
| Income tax adjustments |
(4,668 | ) | (4,868 | ) | (9,394 | ) | ||||||
| Non-GAAP net income |
$ | 44,881 | $ | 35,859 | $ | 35,375 | ||||||
| GAAP diluted net income per share |
$ | 0.87 | $ | 0.67 | $ | 0.49 | ||||||
| Share impact of non-GAAP adjustments identified above |
0.17 | 0.19 | 0.37 | |||||||||
| Non-GAAP diluted net income per share |
$ | 1.04 | $ | 0.86 | $ | 0.86 | ||||||
We consider accounting policies related to cash, cash equivalents and marketable securities, revenue recognition, commission expense, uncollected deferred product revenue, valuation of inventories, assumptions related to purchase accounting, valuation of goodwill and acquired intangible assets, capitalization of software development costs, derivative financial instruments, share based compensation and income taxes to be critical in fully understanding and evaluating our financial results. The application of these policies involves significant judgments and estimates by us.
Cash and Cash Equivalents and Marketable Securities
We account for our investments in accordance with authoritative guidance. Under the provisions, we have classified our investments as “available-for-sale” which are carried at fair value based on quoted market prices and associated unrealized gains or losses are recorded as a separate component of stockholders’ equity until realized. We consider all highly liquid investments purchased with a maturity of three months or less to be cash equivalents and those with maturities greater than three months are considered to be marketable securities. Cash and cash equivalents typically consist of money market instruments, commercial paper with a maturity of three months or less and cash maintained with various financial institutions. Marketable securities generally consist of U.S. Treasury bills, commercial paper with an original maturity of greater than three months, U.S. government bonds, certificates of deposit, agency bonds, corporate bonds, auction rate securities and municipal bonds.
Long-term marketable securities consist of auction rate securities, U.S. Treasury bills, corporate bonds and certificates of deposit. The auction rate securities we hold are all collateralized by student loans with underlying support by the federal government through the Federal Family Education Loan Program (FFELP) and by monoline insurance companies. Auction rate securities typically were stated at par value prior to February 2008 due to liquidity provided through the auction process. While we continue to earn interest on auction rate securities, the failure of these auctions has created illiquidity. As a result, par value no longer approximates the
33
Table of Contents
estimated fair value of auction rate securities. A discounted cash flow model was used to determine the estimated fair value of our investments in auction rate securities as of March 31, 2011 and 2010. The assumptions used in preparing the discounted cash flow model include estimates for interest rates, timing and amount of cash flows, a liquidity risk premium and expected holding periods of the investments. Based on this assessment of fair value, as of March 31, 2011 we have recorded a cumulative decline in the fair value of auction rate securities of $2.3 million ($1.4 million net of tax) which was deemed temporary. Assumptions used to value these securities and in determining the temporary nature of this impairment require significant judgment by management. Changes in the assumptions could result in materially different estimates of fair values and the failure of these securities to return to par value or a decision by management to sell these securities at a loss could have a material adverse impact on earnings.
Revenue Recognition
In October 2009, the FASB amended the accounting standards for revenue recognition to remove tangible products containing software components and non-software components that function together to deliver the product’s essential functionality from the scope of industry-specific software revenue recognition guidance. In October 2009, the FASB also amended the accounting standards for multiple deliverable revenue arrangements to:
| (i) | provide updated guidance on how the deliverables in a multiple deliverable arrangement should be separated, and how the consideration should be allocated; |
| (ii) | require an entity to allocate revenue in an arrangement using estimated selling prices of deliverables if a vendor does not have vendor-specific objective evidence (VSOE) of selling price or third-party evidence of selling price; and |
| (iii) | eliminate the use of the residual method and require an entity to allocate revenue using the relative selling price method. |
We elected to early adopt this accounting guidance at the beginning of our first quarter of fiscal year 2011 on a prospective basis for applicable transactions originating or materially modified after April 1, 2010. The adoption of this guidance did not have a material impact on our financial position or results of operations for the fiscal year ended March 31, 2011. The following reflects our updated policy for revenue recognition.
Product revenue consists of sales of our hardware products (which include embedded software that works together with the hardware to deliver the product’s essential functionality), licensing of our software products, and sale of hardware bundled with a software license. Product revenue is recognized upon shipment, provided that evidence of an arrangement exists, title and risk of loss have passed to the customer, fees are fixed or determinable and collection of the related receivable is probable. Because many of our solutions are comprised of both hardware and more than incidental software components, we recognize our revenue in accordance with authoritative guidance on both hardware and software revenue recognition.
Service revenue consists primarily of fees from customer support agreements, consulting and training. We generally provide software and hardware support as part of product sales. Revenue related to the initial bundled software and hardware support is recognized ratably over the support period. In addition, customers can elect to purchase extended support agreements for periods after the initial software warranty expiration, typically for 12-month periods. Revenue from customer support agreements is recognized ratably over the support period. Revenue from consulting and training services is recognized as the work is performed.
Multi-element arrangements are concurrent customer purchases of a combination of our product and service offerings that may be delivered at various points in time. For multi-element arrangements comprised only of hardware products and related services, we allocate the total transaction revenue to the multiple elements based on each element’s relative fair value compared to the total fair value of all the elements. Each element’s relative
34
Table of Contents
fair value is based on management’s best estimate of selling price (BESP) paid by customers based on the element’s historical pricing. We review the sales of all products and services quarterly and update, when appropriate, our best estimate of selling price for each element to ensure that it reflects our recent pricing experience.
For multi-element arrangements comprised only of software products and related services, we allocate a portion of the total purchase price to the undelivered elements, primarily support agreements and training, using VSOE of fair value for the undelivered elements. The remaining portion of the total transaction value is allocated to the delivered software, referred to as the residual method. VSOE of fair value of the undelivered elements is based on the price customers pay when the element is sold separately. We review the separate sales of the undelivered elements on a quarterly basis and update, when appropriate, our VSOE of fair value for such elements to ensure that it reflects our recent pricing experience.
For multi-element arrangements comprised of a combination of hardware and software elements, the total transaction value is bifurcated between the hardware elements and the software elements based on the relative selling prices of the hardware elements and the software elements as a group. Then, revenue for the hardware and hardware-related services is recognized following the hardware revenue recognition methodology outlined above and revenue for the software and software-related services is recognized following the residual method.
Commission Expense
We recognize commission expense related to the renewal of maintenance contracts at the time an order is booked. As a result, commission expense can be recognized in full even though the related revenue may not be fully recognized. Commission expense on product revenue and corresponding new maintenance contracts is recognized in the same period as the related product revenue, typically upon shipment.
Uncollected Deferred Product Revenue
Because of our revenue recognition policies, there are circumstances for which we are unable to recognize product revenue relating to sales transactions that have been shipped and billed. While the receivable represents an enforceable obligation, for balance sheet presentation purposes we have not recognized the deferred revenue or the related account receivable and no amounts appear in our consolidated balance sheets for such transactions. The aggregate amount of unrecognized accounts receivable and deferred revenue was $183 thousand and $2.0 million at March 31, 2011 and 2010, respectively.
Valuation of Inventories
Inventories are stated at the lower of actual cost or their net realizable value. Cost is determined by using the first-in, first-out (FIFO) method. Inventories consist primarily of raw materials and finished goods. Inventory carrying values are reduced to our estimate of net realizable value. We regularly monitor our inventories for potential obsolete and excess inventory. Our net realizable value adjustment is based upon our estimates of forecasts of unit sales, expected timing and impact of new product introductions, historical product demand, current economic trends, expected market acceptance of our products and expected customer buying patterns. We adjust the carrying value of inventory to reflect its net realizable value when lower than original cost. Significant judgments and estimates are made when establishing the net realizable value adjustment. If these accounting judgments and estimates prove to be materially inaccurate, our financial results could be materially and adversely impacted in future periods.
Valuation of Goodwill and Acquired Intangible Assets
The carrying value of goodwill was $128.2 million as of March 31, 2011 and 2010. Goodwill is reviewed for impairment at the enterprise-level at least annually or more frequently when events and circumstances occur indicating that the recorded goodwill may be impaired.
35
Table of Contents
We consider the market capitalization of our outstanding common stock versus our stockholders’ equity as one indicator that may potentially trigger an impairment of goodwill analysis. Significant judgments and estimates are made when assessing impairment. If these accounting judgments and estimates prove to be materially inaccurate, goodwill may be determined to be impaired and our financial results could be materially and adversely impacted in future periods. Likewise, if a future event or circumstance indicates that an impairment assessment is required and goodwill is determined to be impaired, our financial results could be materially and adversely impacted in future periods. As of March 31, 2011, based upon our review, we determined that there has been no goodwill impairment.
The carrying value of acquired intangible assets was $47.7 million and $53.6 million as of March 31, 2011 and 2010, respectively. The carrying value of acquired intangible assets is recorded at their estimated fair values at the date of acquisition less accumulated amortization. Our acquired intangible assets include acquired software; customer relationships and an indefinite lived tradename resulting from the acquisition of Network General on November 1, 2007. We amortize acquired intangible assets over their estimated useful lives on a straight-line basis, except for the acquired tradename which has an indefinite life and thus, is not amortized. The carrying value of the indefinite lived “Sniffer” tradename is evaluated for potential impairment on an annual basis. At March 31, 2011, we determined that there had been no impairment of acquired intangible assets or indefinite lived assets. Significant judgment and estimates are made when estimating fair value and useful lives for acquired intangible assets. If these accounting judgments and estimates prove to be materially inaccurate, the value of these assets and our financial results could be materially and adversely impacted. We periodically review long-lived assets for impairment whenever events or changes in business circumstances indicate that the carrying amount of the assets may not be fully recoverable or that the useful lives of these assets are no longer appropriate.
Capitalization of Software Development Costs
Costs incurred in the research and development of our products are expensed as incurred, except for certain software development costs. Costs associated with the development of computer software are expensed prior to establishment of technological feasibility and capitalized thereafter until the related software products are available for general release to customers. Judgment is required in determining the point at which technological feasibility has been met. Amortization of capitalized software development costs begin once projects are ready for sale to the general public and are charged to cost of revenue on a straight-line basis over two years.
Capitalized software development costs are periodically assessed for recoverability in the event of changes to the anticipated future revenue for the software products or changes in product technologies. Unamortized capitalized software development costs that are determined to be in excess of the net realizable value of the software products would be expensed in the period in which such a determination is made.
Derivative Financial Instruments
Under authoritative guidance for derivative instruments and hedging activities, all hedging activities must be documented at the inception of the hedge and must meet the definition of highly effective in offsetting changes to future cash flows in order for the derivative to qualify for hedge accounting. Under the guidance, if an instrument qualifies for hedge accounting, the changes in the fair value each period for open contracts, measured as of the end of the period, are recorded to other comprehensive income. Otherwise, changes in the fair value are recorded in earnings each period. Management must perform initial and ongoing tests in order to qualify for hedge accounting. In accordance with the guidance, we account for our instruments under hedge accounting. The effectiveness and a measurement of ineffectiveness of qualifying hedge contracts is assessed by NetScout quarterly. We record the fair value of derivatives hedges in other current assets and other current liabilities. The effective portion of gains or losses resulting from changes in the fair value of qualifying hedges are recorded in other comprehensive income (loss) until the forecasted transaction occurs, with any ineffective portion classified directly to our consolidated statement of operations based on the expense categories of the items being hedged. When forecasted transactions occur, unrealized gains or losses associated with the effective portion of the hedge
36
Table of Contents
are reclassified to the respective expense categories in our consolidated statement of operations. Gains or losses related to hedging activity are included as operating activities in our consolidated statement of cash flows. If the underlying forecasted transactions do not occur, or it becomes probable that they will not occur, the gain or loss on the related cash flow hedge is recognized immediately in earnings. Further information relative to our derivative instruments is disclosed in Note 9 to our Consolidated Financial Statements.
Share-based Compensation
We recognize compensation expense for all share-based payments. Under the fair value recognition provisions, we recognize share-based compensation net of an estimated forfeiture rate and only recognize compensation cost for those shares expected to vest on a straight-line basis over the requisite service period of the award.
We are required to estimate the expected forfeiture rate and only recognize expense for those shares expected to vest. If our actual forfeiture rate is materially different from our estimate, the share-based compensation expense could be significantly different from what we have recorded in the current period.
Based on historical experience, we assumed an annualized forfeiture rate of 0% for awards granted to our directors, and an annualized forfeiture rate of 10% for awards granted to our senior executives and remaining employees. We will record additional expense if the actual forfeitures are lower than estimated and will record a recovery of prior expense if the actual forfeitures are higher than estimated.
Income Taxes
Significant judgments and estimates are made when calculating our annual provision for income taxes. In addition, we may record certain tax reserves to address potential exposures involving our tax positions. Our estimate of the value of our tax reserves contains assumptions based on past experiences and judgments about the interpretation of statutes, rules and regulations by taxing jurisdictions. If these judgments and estimates prove to be materially inaccurate, our tax rate could fluctuate significantly and our financial results could be materially and adversely impacted in the future.
We recognize deferred income tax assets and liabilities based on the differences between the financial statement carrying amounts and the tax basis of these assets and liabilities as well as on acquired or incurred net operating loss carryforward amounts. We make an assessment of the likelihood that our deferred income tax assets will be recovered from future taxable income, and, to the extent that recovery is not believed to be more likely than not, a valuation allowance is established. All available evidence, both positive and negative, is considered in the determination of recording a valuation allowance. We consider past performance, future taxable income and ongoing tax planning strategies when assessing the need for a valuation allowance.
We account for uncertain tax positions in accordance with generally accepted accounting principles. These standards clarify the accounting for uncertainty in income taxes by prescribing the minimum recognition threshold a tax position is required to meet before being recognized in the financial statements. A two-step approach is utilized for evaluating tax positions. Recognition (Step 1) occurs when an enterprise concludes that a tax position, based solely on its technical merits, is not more likely than not to be sustained upon examination. Measurement (Step 2) is only addressed if Step 1 has been satisfied. Under Step 2, the tax benefit is measured at the largest amount of benefit, determined on a cumulative probability basis, that is more likely than not to be realized upon settlement. As used in the accounting standards, the term “more likely than not” means that the likelihood of an occurrence is greater than 50%.
37
Table of Contents
Results of Operations
Comparison of Years Ended March 31, 2011 and March 31, 2010
Revenue
Product revenue consists of sales of our hardware products and licensing of our software products. Service revenue consists of customer support agreements, consulting and training. No one direct customer or indirect channel partner accounted for more than 10% of our total revenue during fiscal years ended March 31, 2011 and 2010.
| Fiscal Year Ended
March 31, (Dollars in Thousands) |
Change | |||||||||||||||||||||||
| 2011 | 2010 | |||||||||||||||||||||||
| % of Revenue |
% of Revenue |
$ | % | |||||||||||||||||||||
| Revenue: |
||||||||||||||||||||||||
| Product |
$ | 159,948 | 55 | % | $ | 142,113 | 55 | % | $ | 17,835 | 13 | % | ||||||||||||
| Service |
130,592 | 45 | 118,229 | 45 | 12,363 | 10 | % | |||||||||||||||||
| Total revenue |
$ | 290,540 | 100 | % | $ | 260,342 | 100 | % | $ | 30,198 | 12 | % | ||||||||||||
Product. The 13%, or $17.8 million, increase in product revenue was due to an $11.3 million increase in our enterprise business sector and a $6.5 million increase in our service provider sector. Compared to our previous fiscal year, we realized an increase of approximately 22% in the average selling price per unit of our products offset by a 6% decrease in units shipped. The increase in selling price per unit is due to a shift in product mix towards our higher capacity Infinistream products. The 6% decrease in units shipped was also due to product mix.
Service. The 10%, or $12.4 million, increase in service revenue was due in part to a $4.2 million increase in revenue from maintenance contracts due to increased renewals from a growing support base, a $3.9 million increase in revenue from post-contract customer support in connection with product revenue growth, and an $827 thousand increase in other service revenue largely due to on-site revenue. In addition, there was a decline of $1.2 million in purchase accounting adjustments to deferred service revenue associated with our acquisition of Network General. As a result of this acquisition, acquired deferred revenue was reduced to fair value to eliminate selling profit from the contracts that were acquired from Network General. As the fair value adjusted deferred revenue has amortized over time, it comprised a smaller proportion of total maintenance revenue during the fiscal year ended March 31, 2011. Subsequent maintenance renewal contracts are recorded at their full value and thus result in higher recorded revenue. We also recognized $1.7 million in training and consulting revenue during the fiscal year ended March 31, 2011 from non-refundable expired contracts. In prior years, we had not been able to demonstrate that we had fulfilled our obligations. However, starting with the quarter ended June 30, 2010, we were able to demonstrate that our obligations had been fulfilled related to the non-refundable expired contracts. While we will continue to recognize revenue from non-refundable contracts, we do not expect the revenue in future quarters to be significant.
Total product and service revenue from direct and indirect channels are as follows:
| Fiscal Year Ended
March 31, (Dollars in Thousands) |
Change | |||||||||||||||||||||||
| 2011 | 2010 | |||||||||||||||||||||||
| % of Revenue |
% of Revenue |
$ | % | |||||||||||||||||||||
| Indirect |
$ | 172,010 | 59 | % | $ | 159,379 | 61 | % | $ | 12,631 | 8 | % | ||||||||||||
| Direct |
118,530 | 41 | 100,963 | 39 | 17,567 | 17 | % | |||||||||||||||||
| Total revenue |
$ | 290,540 | 100 | % | $ | 260,342 | 100 | % | $ | 30,198 | 12 | % | ||||||||||||
38
Table of Contents
The 8%, or $12.6 million, increase in indirect channel revenue is the result of an increase in international sales. Sales to customers outside the United States are primarily export sales through channel partners, who are generally responsible for distributing our products and providing technical support and service to customers within their territories. Our reported international revenue does not include any revenue from sales to customers outside the United States that are shipped to our United States-based indirect channel partners. These domestic resellers fulfill customer orders based upon joint selling efforts in conjunction with our direct sales force and may subsequently ship our products to international locations; however, we report these shipments as United States revenue since we ship the products to a domestic location. The 17%, or $17.6 million, increase in direct channel revenue and change in sales mix between direct and indirect is primarily the result of increased domestic revenue from our service provider and enterprise sectors, as well as the $1.2 million reduction in purchase accounting adjustments related to the Network General acquisition which had the effect of increasing revenue.
Total revenue by geography is as follows:
| Fiscal Year Ended
March 31, (Dollars in Thousands) |
Change | |||||||||||||||||||||||
| 2011 | 2010 | |||||||||||||||||||||||
| % of Revenue |
% of Revenue |
$ | % | |||||||||||||||||||||
| United States |
$ | 211,711 | 73 | % | $ | 189,517 | 73 | % | $ | 22,194 | 12 | % | ||||||||||||
| International: |
||||||||||||||||||||||||
| Europe |
37,921 | 13 | 35,072 | 14 | 2,849 | 8 | % | |||||||||||||||||
| Asia |
16,260 | 6 | 13,694 | 5 | 2,566 | 19 | % | |||||||||||||||||
| Rest of the world |
24,648 | 8 | 22,059 | 8 | 2,589 | 12 | % | |||||||||||||||||
| Subtotal international |
78,829 | 27 | 70,825 | 27 | 8,004 | 11 | % | |||||||||||||||||
| Total revenue |
$ | 290,540 | 100 | % | $ | 260,342 | 100 | % | $ | 30,198 | 12 | % | ||||||||||||
United States revenues increased 12%, or $22.2 million, primarily as a result of strong growth in our enterprise sector, which includes financial services, and in our service provider sector. The 11%, or $8.0 million, increase in international revenue is also due to growth in both our enterprise and service provider sectors. We expect revenue from sales to customers outside the United States to continue to account for a significant portion of our total revenue in the future. In accordance with United States export control regulations we do not sell or do business with countries subject to economic sanctions and export controls.
39
Table of Contents
Cost of Revenue and Gross Profit
Cost of product revenue consists primarily of material components, personnel expenses, media duplication, manuals, packaging materials, overhead and amortization of capitalized software and developed product technology. Cost of service revenue consists primarily of personnel, material, overhead and support costs.
| Fiscal Year Ended
March 31, (Dollars in Thousands) |
Change | |||||||||||||||||||||||
| 2011 | 2010 | |||||||||||||||||||||||
| % of Revenue |
% of Revenue |
$ | % | |||||||||||||||||||||
| Cost of revenue: |
||||||||||||||||||||||||
| Product |
$ | 38,175 | 13 | % | $ | 35,564 | 14 | % | $ | 2,611 | 7 | % | ||||||||||||
| Service |
23,186 | 8 | 20,500 | 8 | 2,686 | 13 | % | |||||||||||||||||
| Total cost of revenue |
$ | 61,361 | 21 | % | 56,064 | 22 | % | 5,297 | 9 | % | ||||||||||||||
| Gross profit: |
||||||||||||||||||||||||
| Product $ |
$ | 121,773 | 42 | % | $ | 106,549 | 41 | % | 15,224 | 14 | % | |||||||||||||
| Product gross profit % |
76 | % | 75 | % | 1 | % | ||||||||||||||||||
| Service $ |
107,406 | 37 | % | 97,729 | 38 | % | 9,677 | 10 | % | |||||||||||||||
| Service gross profit % |
82 | % | 83 | % | (1 | %) | ||||||||||||||||||
| Total gross profit $ |
$ | 229,179 | $ | 204,278 | $ | 24,901 | 12 | % | ||||||||||||||||
| Total gross profit % |
79 | % | 78 | % | 1 | % | ||||||||||||||||||
Product. The 7%, or $2.6 million, increase in cost of product revenue was primarily due to the 13%, or $17.8 million increase in product revenue for the fiscal year ended March 31, 2011 when compared to the fiscal year ended March 31, 2010. Our product gross profit percentage increased by one point to 76% during the fiscal year ended March 31, 2011. This increase was primarily due to favorable product mix and improved overhead absorption. Average headcount in cost of product revenue was 29 and 27 for the years ended March 31, 2011 and 2010, respectively.
Service. The 13%, or $2.7 million, increase in cost of service revenue was primarily due to a $2.0 million increase in employee related expenses resulting from increased headcount to support our growing installed base as well as increased incentive compensation, a $223 thousand increase in cost of materials used to support customers under service contracts and a $344 thousand increase in travel in our support and consulting groups. The 10%, or $9.7 million, increase in service gross profit corresponds with the 10%, or $12.4 million, increase in service revenue, offset by the 13%, or $2.7 million, increase in cost of services. The service gross profit percentage decreased by one point to 82% for the fiscal year ended March 31, 2011. Average headcount in cost of service revenue was 115 and 105 for the years ended March 31, 2011 and 2010, respectively.
Gross profit. Our gross profit increased 12%, or $24.9 million. This increase is attributable to our increase in revenue of 12%, or $30.2 million, offset by a 9%, or $5.3 million, increase in cost of revenue. The net effect of the combined increases in revenue and cost of revenue on gross margin was a one point increase during the fiscal year ended March 31, 2011.
40
Table of Contents
Operating Expenses
| Fiscal Year Ended
March 31, (Dollars in Thousands) |
Change | |||||||||||||||||||||||
| 2011 | 2010 | |||||||||||||||||||||||
| % of Revenue |
% of Revenue |
$ | % | |||||||||||||||||||||
| Research and development |
$ | 40,628 | 14 | % | $ | 36,650 | 14 | % | $ | 3,978 | 11 | % | ||||||||||||
| Sales and marketing |
105,271 | 36 | 99,059 | 38 | 6,212 | 6 | % | |||||||||||||||||
| General and administrative |
23,308 | 8 | 20,609 | 8 | 2,699 | 13 | % | |||||||||||||||||
| Amortization of acquired intangible assets |
1,907 | 1 | 2,057 | 1 | (150 | ) | (7 | )% | ||||||||||||||||
| Total operating expenses |
$ | 171,114 | 59 | % | $ | 158,375 | 61 | % | $ | 12,739 | 8 | % | ||||||||||||
Research and development. Research and development expenses consist primarily of personnel expenses, fees for outside consultants, overhead and related expenses associated with the development of new products and the enhancement of existing products.
The 11%, or $4.0 million, increase in research and development expenses is primarily due to increases in incentive compensation and other employee related expenses due to increased headcount associated with continued investment in our service provider and enterprise offerings. In addition, there was a $408 thousand increase due to the capitalization of salaries associated with late stage software development during the fiscal year ended March 31, 2010. Average headcount in research and development was 257 and 238 for the fiscal years ended March 31, 2011 and 2010, respectively.
Sales and marketing. Sales and marketing expenses consist primarily of personnel expenses, including commissions, overhead and other expenses associated with selling activities and marketing programs such as trade shows, seminars, advertising, and new product launch activities.
The 6%, or $6.2 million, increase in total sales and marketing expenses was primarily due to a $5.0 million increase in employee related expenses resulting from increased headcount tied to new sales territories, a $1.4 million increase in travel expenses tied to increased headcount, marketing events and sales meetings, a $778 thousand increase in recruiting fees, a $750 thousand increase in expenses related to the NetScout user conferences and other sales meetings, a $557 thousand increase in depreciation expense associated with demonstration units and a $195 thousand increase in rent. These were partially offset by a $2.5 million decrease in sales commissions. During the fiscal year ended March 31, 2010, sales commissions were larger due to the impact of unusually high early and multi-year renewal bookings for which expense is recognized when earned. Average headcount in sales and marketing was 312 and 297 for the fiscal years ended March 31, 2011 and 2010, respectively.
General and administrative. General and administrative expenses consist primarily of personnel expenses for executive, financial, legal and human resource employees, overhead and other corporate expenditures.
The 13%, or $2.7 million, increase in general and administrative expenses was primarily due to a $2.0 million increase in incentive compensation and other employee related expenses and a $1.6 million increase in professional services largely due to business development costs. These were partially offset by a $540 thousand decrease in allocated overhead costs due to lower facility costs and depreciation expense, as well as a $341 thousand decrease in consulting costs. Average headcount in general and administrative was 113 and 109 for the fiscal years ended March 31, 2011 and 2010, respectively.
Amortization of acquired intangible assets. Amortization of acquired intangible assets consists primarily of amortization of customer relationships related to the acquisition of Network General.
41
Table of Contents
Interest and Other Income (Expense), Net
Interest and other income (expense), net includes interest earned on our cash, cash equivalents, marketable securities and restricted investments and interest expense.
| Fiscal Year Ended
March 31, (Dollars in Thousands) |
Change | |||||||||||||||||||||||
| 2011 | 2010 | |||||||||||||||||||||||
| % of Revenue |
% of Revenue |
$ | % | |||||||||||||||||||||
| Interest and other income (expense), net |
$ | (1,772 | ) | (1 | %) | $ | (2,832 | ) | (1 | %) | $ | 1,060 | 37 | % | ||||||||||
The 37%, or $1.1 million, decrease in interest and other expense was primarily due to a $1.0 million decrease in interest expense due to a reduction in the interest rate and principal amounts outstanding associated with our debt. During the fiscal years ended March 31, 2011 and 2010, the average interest rates on our term loan were 2.750% and 3.453%, respectively. Interest income was relatively flat compared to the prior year.
Income Tax Expense
The annual effective tax rate for fiscal year 2011 is 33.8%, compared to an annual effective tax rate of 35.2% for fiscal year 2010. Generally, the annual effective tax rates differ from statutory rates primarily due to the impact of the domestic production activities deduction, differences in tax rates in foreign jurisdictions and federal and state tax credits. The difference in our effective tax rate compared to the prior year is primarily due to the reinstatement of the federal research and development credit and an increase in our domestic production activities deduction. The federal research and development credit was re-enacted on December 17, 2010 as part of “The Tax Relief, Unemployment Insurance Reauthorization, and Job Creation Act of 2010 (H.R. 4853)”. The impact of this law change was accounted for during the quarter ended December 31, 2010. This act retroactively extends the federal research and development credit to the beginning of calendar year 2010. We have recorded a rate reduction of approximately 1.4% to our annual effective tax rate for fiscal year 2011 attributed to this tax law change.
| Fiscal Year Ended
March 31, (Dollars in Thousands) |
Change | |||||||||||||||||||||||
| 2011 | 2010 | |||||||||||||||||||||||
| % of Revenue |
% of Revenue |
$ | % | |||||||||||||||||||||
| Income tax expense |
$ | 19,028 | 7 | % | $ | 15,154 | 6 | % | $ | 3,874 | 26 | % | ||||||||||||
Net Income
Net income for the fiscal years ended March 31, 2011 and 2010 was as follows:
| Fiscal Year Ended
March 31, (Dollars in Thousands) |
Change | |||||||||||||||||||||||
| 2011 | 2010 | |||||||||||||||||||||||
| % of Revenue |
% of Revenue |
$ | % | |||||||||||||||||||||
| Net income |
$ | 37,265 | 13 | % | $ | 27,917 | 11 | % | $ | 9,348 | 33 | % | ||||||||||||
The $9.3 million increase in net income during the fiscal year ended March 31, 2011 was largely attributable to the $24.9 million increase in total gross profit and a $1.0 million decrease in interest expense offset by a $12.7 million increase in operating expenses mainly due to increased employee related expenses and incentive compensation.
42
Table of Contents
Comparison of Years Ended March 31, 2010 and March 31, 2009
Revenue
Product revenue consists of sales of our hardware products and licensing of our software products. Service revenue consists of customer support agreements, consulting and training. No one direct customer or indirect channel partner accounted for more than 10% of our total revenue during fiscal years ended March 31, 2010 and 2009.
| Fiscal Year Ended
March 31, (Dollars in Thousands) |
Change | |||||||||||||||||||||||
| 2010 | 2009 | |||||||||||||||||||||||
| % of Revenue |
% of Revenue |
$ | % | |||||||||||||||||||||
| Revenue: |
||||||||||||||||||||||||
| Product |
$ | 142,113 | 55 | % | $ | 154,161 | 58 | % | $ | (12,048 | ) | (8 | %) | |||||||||||
| Service |
118,229 | 45 | 113,443 | 42 | 4,786 | 4 | % | |||||||||||||||||
| Total revenue |
$ | 260,342 | 100 | % | $ | 267,604 | 100 | % | $ | (7,262 | ) | (3 | %) | |||||||||||
Product. The 8%, or $12.0 million, decrease in product revenue was primarily the result of decreased volume due to the impact of the global economic downturn on our customers’ capital spending during the year ended March 31, 2010, which included a $22.0 million decline in our enterprise sector. This decline was partially offset by growth in our service provider sector of $9.5 million. While product bookings increased 11% over fiscal year 2009 we entered 2009 with significant backlog which allowed for higher revenue in fiscal year 2009 on lower bookings. Compared to fiscal year 2009, we realized an increase of approximately 30% in the average selling price per unit due to a shift in product mix towards our Infinistream product line and away from lower priced probes. We also generated $7.6 million of product revenue from our new lower capacity Infinistream product launched during the year. Product revenue recognized during the year ended March 31, 2009 reflected a $1.9 million purchase accounting adjustment that was made to reduce acquired deferred product revenue to fair value as a result of the Network General acquisition. The impact of purchase accounting adjustments was not material for fiscal year 2010. Product revenue as a percent of total revenue decreased three percentage points when compared to the year ended March 31, 2009.
Service. The 4%, or $4.8 million, increase in service revenue was due to the renewal of maintenance contracts associated with the acquired Network General business at full value, while deferred revenue acquired in November 2007 and subsequently recognized into revenue had been reduced to fair value as required under purchase accounting. This adjustment to service revenue was $8.6 million lower in fiscal year 2010 than it was in fiscal year 2009. This was offset by a $4.3 million decrease in maintenance revenue due to a portion of our customers not renewing their customer support agreements as well as NetScout ending support for some of our older product models. While our renewal rate had not changed significantly from prior periods, growth in product revenue and associated new maintenance typically offsets lost renewals. With an 8% decline in product revenue in fiscal year 2010 compared to fiscal year 2009, this offset did not occur at the same rate as in prior periods.
Total product and service revenue from direct and indirect channels are as follows:
| Fiscal Year Ended
March 31, (Dollars in Thousands) |
Change | |||||||||||||||||||||||
| 2010 | 2009 | |||||||||||||||||||||||
| % of Revenue |
% of Revenue |
$ | % | |||||||||||||||||||||
| Indirect |
$ | 159,379 | 61 | % | $ | 158,195 | 59 | % | $ | 1,184 | 1 | % | ||||||||||||
| Direct |
100,963 | 39 | 109,409 | 41 | (8,446 | ) | (8 | %) | ||||||||||||||||
| Total revenue |
$ | 260,342 | 100 | % | $ | 267,604 | 100 | % | $ | (7,262 | ) | (3 | %) | |||||||||||
43
Table of Contents
The 1%, or $1.2 million, increase in indirect channel revenue was the result of a 4% growth in international revenue. Sales to customers outside the United States are primarily export sales through indirect channel partners, who are generally responsible for distributing our products and providing technical support and service to customers within their territories. Sales arrangements are primarily transacted in United States dollars. Our reported international revenue does not include any revenue from sales to customers outside the United States that are shipped to our United States-based indirect channel partners. These domestic resellers fulfill customer orders based upon joint selling efforts in conjunction with our direct sales force and may subsequently ship our products to international locations; however, we report these shipments as United States revenue since we ship the products to a domestic location. The 8%, or $8.4 million, decrease in direct channel revenue and change in sales mix between direct and indirect was primarily the result of lower revenue in the United States due to the decline in volume with our larger direct financial services and enterprise customers.
Total revenue by geography is as follows:
| Fiscal Year Ended
March 31, (Dollars in Thousands) |
Change | |||||||||||||||||||||||
| 2010 | 2009 | |||||||||||||||||||||||
| % of Revenue |
% of Revenue |
$ | % | |||||||||||||||||||||
| United States |
$ | 189,517 | 73 | % | $ | 199,737 | 75 | % | $ | (10,220 | ) | (5 | %) | |||||||||||
| International: |
||||||||||||||||||||||||
| Europe |
35,072 | 14 | 37,618 | 14 | (2,546 | ) | (7 | %) | ||||||||||||||||
| Asia |
13,694 | 5 | 12,973 | 5 | 721 | 6 | % | |||||||||||||||||
| Rest of the world |
22,059 | 8 | 17,276 | 6 | 4,783 | 28 | % | |||||||||||||||||
| Subtotal international |
70,825 | 27 | 67,867 | 25 | 2,958 | 4 | % | |||||||||||||||||
| Total revenue |
$ | 260,342 | 100 | % | $ | 267,604 | 100 | % | $ | (7,262 | ) | (3 | %) | |||||||||||
United States revenues declined 5%, or $10.2 million, due to the impact of the global economic downturn on capital spending for our enterprise and financial services customers, however, we saw the beginnings of a return to health in the financial services sector and strong growth in the service provider sector. However, core enterprise spending and resulting revenue continued to lag as we saw these customers remaining cautious on significant IT spending. The 7%, or $2.5 million, decrease in revenue in Europe was a result of decreased revenue from the northern European region. The 28%, or $4.8 million, increase in revenue from the Rest of the World was primarily due to further market penetration in this region from our service provider and enterprise sectors. We expect revenue from sales to customers outside the United States to continue to account for a significant portion of our total revenue in the future. In accordance with United States export control regulations we do not sell or do business with countries subject to economic sanctions and export controls.
44
Table of Contents
Cost of Revenue and Gross Profit
Cost of product revenue consists primarily of material components, personnel expenses, media duplication, manuals, packaging materials, overhead and amortization of capitalized software and developed product technology. Cost of service revenue consists primarily of personnel, material, overhead and support costs.
| Fiscal Year Ended
March 31, (Dollars in Thousands) |
Change | |||||||||||||||||||||||
| 2010 | 2009 | |||||||||||||||||||||||
| % of Revenue |
% of Revenue |
$ | % | |||||||||||||||||||||
| Cost of revenue: |
||||||||||||||||||||||||
| Product |
$ | 35,564 | 14 | % | $ | 43,315 | 16 | % | $ | (7,751 | ) | (18 | %) | |||||||||||
| Service International: |
20,500 | 8 | 20,824 | 8 | (324 | ) | (2 | %) | ||||||||||||||||
| Total cost of revenue |
$ | 56,064 | 22 | % | $ | 64,139 | 24 | % | $ | (8,075 | ) | (13 | %) | |||||||||||
| Gross profit: |
||||||||||||||||||||||||
| Product $ |
$ | 106,549 | 41 | % | $ | 110,846 | 41 | % | (4,297 | ) | (4 | %) | ||||||||||||
| Product gross profit % |
75 | % | 72 | % | 3 | % | ||||||||||||||||||
| Service $ |
97,729 | 38 | % | 92,619 | 35 | % | 5,110 | 6 | % | |||||||||||||||
| Service gross profit % |
83 | % | 82 | % | 1 | % | ||||||||||||||||||
| Total gross profit $ |
$ | 204,278 | $ | 203,465 | $ | 813 | — | % | ||||||||||||||||
| Total gross profit % |
78 | % | 76 | % | 2 | % | ||||||||||||||||||
Product. The 18%, or $7.8 million, decrease in cost of product revenue was due to the 8%, or $12.0 million decline in product revenue for the years ended March 31, 2010 when compared to March 31, 2009 as well as improved gross profit percentage. The product gross profit percentage increased by three percentage points from 72% to 75% for the year ended March 31, 2010. This increase was primarily due to favorable product mix, with a shift towards higher margin products, such as 10G Infinistream and software. In addition, there was a decrease in the indirect manufacturing costs largely due to lower incentive compensation as well as lower product component costs. Average headcount in cost of product was 27 for both years ended March 31, 2010 and 2009.
Service. The 2%, or $324 thousand, decrease in cost of service revenue was primarily due to a $232 thousand reduction in integration costs associated with the acquisition of Network General, a $294 thousand decrease in travel in our support and consulting groups and a $198 thousand decrease in employee compensation. These costs were partially offset by higher allocations due to increased headcount. The 6%, or $5.1 million, increase in service gross profit corresponds with the 4%, or $4.8 million, increase in service revenue, as well as additional operating leverage from the reduced direct expenses. Average headcount in cost of service was 105 and 99 for the years ended March 31, 2010 and 2009, respectively.
Gross profit. Despite the decrease in revenue of 3%, or $7.3 million, our gross profit increased $813 thousand due to a two point increase in gross profit percentage from 76% to 78%. This increase in gross profit percentage was primarily attributable to favorable product mix towards higher margin hardware platforms and a larger percentage of higher margin service revenue.
45
Table of Contents
Operating Expenses
| Fiscal Year Ended
March 31, (Dollars in Thousands) |
Change | |||||||||||||||||||||||
| 2010 | 2009 | |||||||||||||||||||||||
| % of Revenue |
% of Revenue |
$ | % | |||||||||||||||||||||
| Research and development |
$ | 36,650 | 14 | % | $ | 40,189 | 15 | % | $ | (3,539 | ) | (9 | %) | |||||||||||
| Sales and marketing |
99,059 | 38 | 98,818 | 37 | 241 | — | % | |||||||||||||||||
| General and administrative |
20,609 | 8 | 26,118 | 10 | (5,509 | ) | (21 | %) | ||||||||||||||||
| Amortization of acquired intangible assets |
2,057 | 1 | 1,962 | — | 95 | 5 | % | |||||||||||||||||
| Total operating expenses |
$ | 158,375 | 61 | % | $ | 167,087 | 62 | % | $ | (8,712 | ) | (5 | %) | |||||||||||
Research and development. Research and development expenses consist primarily of personnel expenses, fees for outside consultants, overhead and related expenses associated with the development of new products and the enhancement of existing products.
The 9%, or $3.5 million, decrease in research and development expenses was primarily due to a $2.7 million decrease in incentive compensation and other employee related expenses, a $408 thousand decrease due to the capitalization of salaries associated with late stage software development, a $328 thousand reduction in integration costs associated with the acquisition of Network General and a $226 thousand decrease in travel expenses. Average headcount in research and development was 238 and 244 for the fiscal years ended March 31, 2010 and 2009, respectively.
Sales and marketing. Sales and marketing expenses consist primarily of personnel expenses, including commissions, overhead and other expenses associated with selling activities and marketing programs such as trade shows, seminars, advertising, and new product launch activities.
The $241 thousand increase in total sales and marketing expenses was primarily due to $1.3 million in increased sales commissions as well as a $965 thousand increase in other employee related expenses. Despite the decline in revenue, commissions increased due to incremental special incentive programs and commission expense on increased service bookings, including maintenance renewals for which some revenue will be recognized in future periods. These were partially offset by a $501 thousand decrease in travel expenses, a $422 thousand decrease in expenses related to the NetScout user conference, a $366 thousand decrease in allocated overhead costs such as lower internal IT spending, a $378 thousand decrease in integration expenses as a result of the Network General acquisition, a $242 thousand decrease in rent and other office expenses as well a $176 thousand reduction in sales meeting expenses. Average headcount in sales and marketing was 297 and 303 for the fiscal years ended March 31, 2010 and 2009, respectively.
General and administrative. General and administrative expenses consist primarily of personnel expenses for executive, financial, legal and human resource employees, overhead and other corporate expenditures.
The 21%, or $5.5 million, decrease in general and administrative expenses was due to a $2.6 million decrease in professional fees, a $1.7 million decrease in incentive compensation, a decrease of $782 thousand relating to Network General integration and acquisition related expenses and a $612 thousand decrease in bad debt expense. The decrease in professional fees was primarily due to the settlement of litigation in the prior year, as well as savings from entity consolidation and other cost reduction initiatives. Average headcount in general and administrative was 109 for both fiscal years ended March 31, 2010 and 2009.
Amortization of acquired intangible assets. Amortization of acquired intangible assets consists primarily of amortization of customer relationships related to the acquisition of Network General.
46
Table of Contents
The $95 thousand increase in amortization of acquired intangible assets was due to the write off of a net beneficial lease due to the closure of an office acquired in the acquisition of Network General in November 2007.
Interest and Other Income (Expense), Net
Interest and other income (expense), net includes interest earned on our cash, cash equivalents, marketable securities and restricted investments and interest expense.
| Fiscal Year Ended
March 31, (Dollars in Thousands) |
Change | |||||||||||||||||||||||
| 2010 | 2009 | |||||||||||||||||||||||
| % of Revenue |
% of Revenue |
$ | % | |||||||||||||||||||||
| Interest and other income (expense), net |
$ | (2,832 | ) | (1 | %) | $ | (5,337 | ) | (2 | %) | $ | 2,505 | (47 | %) | ||||||||||
The 47%, or $2.5 million, change in interest and other income (expense), net was primarily due to a $2.8 million decrease in interest expense due to a reduction in the interest rate as well as a reduction of approximately $13 million on the outstanding principal of our debt due to scheduled debt repayments. During the years ended March 31, 2010 and 2009, the average interest rates on our outstanding debt were 3.45% and 5.94%, respectively. Additionally, the change was affected by a $1.1 million decrease in foreign currency transaction expense due to a reduction in the settlement of transactions, such as the collection of accounts receivable or the payment of liabilities related to our international locations, which were denominated in currencies other than the U.S. dollar. These decreases to interest and other income (expense) were partially offset by a $1.4 million decrease in interest income due to a decrease in market interest rates received on investments as well as a $61 thousand loss on the disposal of assets.
Income Tax Expense
The annual effective tax rate for fiscal year 2010 was 35.2%, compared to an annual effective tax rate of 35.4% for fiscal year 2009. Generally, the annual effective tax rates differ from statutory rates primarily due to the impact of tax exempt interest income, differences in tax rates in foreign jurisdictions and federal and state tax credits. The difference in our effective tax rate compared to the prior year was primarily due to a decrease in tax exempt interest income, an increase in qualified production activities deduction and the impact of the expiration of the federal research and development credit as of December 31, 2009.
| Fiscal Year Ended
March 31, (Dollars in Thousands) |
Change | |||||||||||||||||||||||
| 2010 | 2009 | |||||||||||||||||||||||
| % of Revenue |
% of Revenue |
$ | % | |||||||||||||||||||||
| Income tax expense |
$ | 15,154 | 6 | % | $ | 10,993 | 4 | % | $ | 4,161 | 38 | % | ||||||||||||
Net Income
Net income for the fiscal years ended March 31, 2010 and 2009 was as follows:
| Fiscal Year Ended
March 31, (Dollars in Thousands) |
Change | |||||||||||||||||||||||
| 2010 | 2009 | |||||||||||||||||||||||
| % of Revenue |
% of Revenue |
$ | % | |||||||||||||||||||||
| Net income |
$ | 27,917 | 11 | % | $ | 20,048 | 7 | % | $ | 7,869 | 39 | % | ||||||||||||
The $7.9 million increase in net income during the fiscal year ended March 31, 2010 was largely attributable to the $8.7 million decrease in operating expenses mainly due to decreased employee related expenses and incentive compensation, a $2.5 million decrease in interest and other income (expense) and an $813 thousand increase in total product and service gross profit.
47
Table of Contents
As of March 31, 2011, we had the following contractual obligations:
Payment due by period (Dollars in thousands)
| Contractual Obligations |
Total | Less than 1 year |
1-3 years | 3-5 years | More than 5 years |
|||||||||||||||
| Short and long-term debt obligations(1) |
$ | 70,636 | $ | 16,588 | $ | 54,048 | $ | — | $ | — | ||||||||||
| Unconditional purchase obligations |
11,839 | 11,839 | — | — | — | |||||||||||||||
| Operating lease obligations(2) |
37,612 | 3,981 | 7,022 | 6,836 | 19,773 | |||||||||||||||
| Retirement obligations |
3,780 | 318 | 2,217 | 528 | 717 | |||||||||||||||
| Total contractual obligations |
$ | 123,867 | $ | 32,726 | $ | 63,287 | $ | 7,364 | $ | 20,490 | ||||||||||
As of March 31, 2011, the total amount of net unrecognized tax benefits for uncertain tax positions and the accrual for the related interest was $383 thousand. We are unable to make a reliable estimate when cash settlement, if any, will occur with a tax authority as the timing of examinations and ultimate resolution of those examinations is uncertain. We have also excluded long-term deferred revenue of $14.7 million as such amounts will be recognized as services are provided.
| (1) | Includes estimated future interest at an interest rate of 2.500% for our outstanding term loan at March 31, 2011. |
| (2) | We lease facilities and certain equipment under operating lease agreements extending through September 2023 for a total of $37.6 million. |
Off-Balance Sheet Arrangements
We do not have any relationships with unconsolidated entities or financial partnerships, such as entities often referred to as structured finance or special purpose entities, which would have been established for the purpose of facilitating off-balance sheet arrangements. As such, we are not exposed to any financing, liquidity, market or credit risk that could arise if we had engaged in such relationships.
We warrant that our software and hardware products will substantially conform to the documentation accompanying such products on their original date of shipment. For software, which also includes firmware, the standard warranty commences upon shipment and expires 90 days thereafter. With regard to hardware, the standard warranty commences upon shipment and expires 12 months thereafter. Additionally, this warranty is subject to various exclusions which include, but are not limited to, non-conformance resulting from modifications made to the software or hardware by a party other than NetScout; customers’ failure to follow our installation, operation or maintenance instructions; and events outside of our reasonable control. We also warrant that all support services will be performed in a good and workmanlike manner. We believe that our product and support service warranties are consistent with commonly accepted industry standards. No warranty cost information is presented and no warranty costs are accrued since service revenue associated with warranty is deferred at the time of sale and recognized ratably over the warranty period.
Contracts that we enter into in the ordinary course of business may contain standard indemnification provisions. Pursuant to these agreements, we may agree to defend third party claims brought against a partner or direct customer claiming infringement of such third party’s (i) U.S. patent and/or European Union (EU), or other selected countries’ patents, (ii) Berne convention member country copyright, and/or (iii) U.S., EU, and/or other
48
Table of Contents
selected countries’ trademark or intellectual property rights. Moreover, this indemnity may require us to pay any damages awarded against the partner or direct customer in such type of lawsuit as well as reimburse the partner or direct customer for reasonable attorney’s fees incurred by them from the lawsuit.
We may also agree from time to time to provide other forms of indemnification to partners or direct customers, such as indemnification that would obligate us to defend and pay any damages awarded to a third party against a partner or direct customer based on a lawsuit alleging that such third party has suffered personal injury or tangible property damage legally determined to have been caused by negligently designed or manufactured products.
We have agreed to indemnify our directors and officers and our subsidiaries’ directors and officers if they are made a party or are threatened to be made a party to any proceeding (other than an action by or in the right of NetScout) by reason of the fact that the indemnified are an agent of NetScout or by reason of anything done or not done by them in any such capacity. The indemnity is for any and all expenses and liabilities of any type (including but not limited to, judgments, fines and amounts paid in settlement) reasonably incurred by the directors or officers in connection with the investigation, defense, settlement or appeal of such proceeding, provided they acted in good faith.
Liquidity and Capital Resources
Cash, cash equivalents, and marketable securities consist of the following (in thousands):
| As of March 31, | ||||||||||||
| 2011 | 2010 | 2009 | ||||||||||
| Cash and cash equivalents |
$ | 67,168 | $ | 63,322 | $ | 82,222 | ||||||
| Short-term marketable securities |
133,430 | 69,875 | 24,162 | |||||||||
| Long-term marketable securities |
27,880 | 37,354 | 29,528 | |||||||||
| Cash, cash equivalents and marketable securities |
$ | 228,478 | $ | 170,551 | $ | 135,912 | ||||||
At March 31, 2011, we had a revolving credit facility with a syndicate of lenders led by KeyBank National Association (KeyBank) which allows us to borrow up to $10 million for working capital purposes and to obtain letters of credit subject to a sublimit. Amounts outstanding under the facility bear interest at a floating interest rate dependent upon, at our election, LIBOR or KeyBank’s prime rate, in each case plus a margin, and are collateralized by substantially all of our assets. Under the agreement, we are required to comply with certain financial covenants which require that we maintain minimum certain amounts of liquidity, the most restrictive of which are a minimum fixed charge coverage ratio of no less than 1.25 to 1.00 and a maximum leverage ratio of less than 3.00 to 1.00. As of March 31, 2011, we were in compliance with such covenants. As of March 31, 2011, no amounts were outstanding under the revolving credit facility.
Cash, cash equivalents, and marketable securities increased by $57.9 million from March 31, 2010 to March 31, 2011. While cash and cash equivalents increased by $3.8 million, short and long-term marketable securities increased in total by $54.1 million. These increases were the result of cash flow from operations.
Our long-term marketable securities include investments in auction rate securities. Beginning in February 2008 and continuing through March 31, 2011, auctions have failed resulting in a lack of short-term liquidity for these securities, which has caused us to classify $17.5 million as long-term on our consolidated balance sheet. The remaining $4.0 million was reported as short-term reflecting the redemption of one of our holdings at par value on April 20, 2011. As of March 31, 2011, our auction rate securities consisted of four positions issued by municipal agencies with a total par value of $23.8 million and a current estimated market value totaling $21.5 million. The auction rate securities held by NetScout at March 31, 2011 have maturity dates ranging from December 2032 through June 2038. As of March 31, 2011, the portion of these securities reported as long-term
49
Table of Contents
were all AAA rated. These securities are collateralized by student loans with underlying support by the federal government through the FFELP and by monoline insurance companies. We have the ability and intent to hold these securities until a recovery in the auction process or other liquidity event occurs. The fair value of these securities has been estimated by management based on the assumptions disclosed in the notes to our consolidated financial statements. In addition, subsequent to our fiscal year ended March 31, 2011 a total of $4.0 million of auction rate securities were redeemed at par value, providing liquidity for a portion of these securities. We will continue to analyze our auction rate securities each reporting period for impairment, and we may be required to record an impairment charge in the consolidated statement of operations if the decline in fair value is determined to be other-than-temporary. The estimated fair value of our auction rate securities could change significantly based on market and economic conditions, including changes in market rates, the estimated timing until a liquidity event, the discount factor associated with illiquidity and the credit ratings of our securities. There is no assurance as to when liquidity will return to this investment class, and therefore, we continue to monitor and evaluate these securities. Based on our expected operating cash flows, and our other sources of cash, we do not expect the lack of liquidity in these investments to affect our ability to execute our current business plan.
Cash and cash equivalents were impacted by the following:
| Year Ending March 31, (Dollars in Thousands) |
||||||||||||
| 2011 | 2010 | 2009 | ||||||||||
| Net cash provided by operating activities |
$ | 68,537 | $ | 47,224 | $ | 44,396 | ||||||
| Net cash used in investing activities |
$ | (61,312 | ) | $ | (61,075 | ) | $ | (17,843 | ) | |||
| Net cash used in financing activities |
$ | (3,379 | ) | $ | (5,049 | ) | $ | (1,315 | ) | |||
Net cash provided by operating activities.
Net cash provided by operating activities amounted to $68.5 million during the fiscal year ended March 31, 2011. The primary sources of operating cash flow in the fiscal year ended March 31, 2011 included net income of $37.3 million, adjusted to exclude the effects of non-cash items of $23.9 million, including depreciation and amortization, share-based compensation expense, deferred income taxes and loss on disposal of fixed assets, a $3.4 million increase in accrued compensation resulting from an increase in non-sales incentive compensation and a $2.8 million decrease in accounts receivable resulting from decreased billings. The overall increase in cash provided by operating activities is attributable to net income improvement over the prior year.
Net cash provided by operating activities amounted to $47.2 million during the fiscal year ended March 31, 2010. The primary sources of operating cash flow in the fiscal year ended March 31, 2010 included net income of $27.9 million, adjusted to exclude the effects of non-cash items of $25.6 million, including depreciation and amortization, share-based compensation expense, deferred income taxes, inventory write-downs and loss on disposal of fixed assets, a $22.3 million increase in deferred revenue resulting from increased billings and a $5.7 million increase in prepaid income taxes, offset by a $25.7 million increase in accounts receivable resulting from increased billings, a $4.0 million decrease in accrued compensation and other expense primarily due to a decrease in non-sales incentive compensation based on Company underperformance in the year ended March 31, 2010. The overall increase in cash provided by operating activities is attributable to net income improvement over the prior year.
Net cash provided by operating activities amounted to $44.4 million during the fiscal year ended March 31, 2009. The primary sources of operating cash flow in the fiscal year ended March 31, 2009 included net income of $20.0 million, adjusted to exclude the effects of non-cash items of $23.8 million, including depreciation and amortization, share-based compensation expense, deferred income taxes and inventory write-downs, an $8.6 million decrease in prepaid expenses and other current assets mainly due to discontinuance of outsourcing the Network General inventory and a $4.9 million decrease in inventories, offset by a $7.8 million increase in accounts receivable resulting from increased revenue and billing and the timing of cash collections and shipments. The overall increase in cash provided by operating activities is attributable to net income improvement over the prior year.
50
Table of Contents
Net cash used in investing activities.
For the fiscal years ended March 31, 2011, 2010 and 2009, cash used in investing activities reflects the purchase of marketable securities of $153.9 million, $92.9 million and $30.3 million, respectively, offset by the proceeds from maturities and sales of marketable securities due to cash management activities of $101.4 million, $39.1 million and $17.4 million, respectively. The fiscal year ended March 31, 2010 includes $408 thousand in capitalized software development costs. Cash used in investing activities also includes capital expenditures. Capital expenditures for fixed assets of $8.8 million, $6.8 million and $5.0 million for the fiscal years ended March 31, 2011, 2010 and 2009, respectively, represent an investment in our infrastructure as we prepared for future growth. We anticipate that our investment in our infrastructure will grow in future quarters.
Net cash used in financing activities.
Net cash used in financing activities was $3.4 million during the fiscal year ended March 31, 2011. The primary outflow was due to the repayment of $11.3 million of our long-term debt with KeyBank and $367 thousand for the net issuance of common stock under stock plans, offset by an $8.2 million tax benefit from stock options exercised.
Net cash used in financing activities was $5.0 million during the fiscal year ended March 31, 2010. The primary outflow was due to the repayment of $13.1 million of our long-term debt with KeyBank which included a $3.1 million excess cash flow payment, offset by $3.0 million for the net issuance of common stock under stock plans and a tax benefit from stock options exercised of $5.1 million.
Net cash used in financing activities was $1.3 million during the fiscal year ended March 31, 2009. The primary outflow was due to the repayment of $6.3 million of our long-term debt with KeyBank, offset by proceeds from the exercise of stock options in the amount of $4.6 million and a tax benefit from stock options exercised of $362 thousand.
Liquidity
We believe that our cash balances, short-term marketable securities classified as available-for-sale and future cash flows generated by operations will be sufficient to meet our anticipated cash needs for working capital, capital expenditures and scheduled principal and interest payments on our debt for at least the next 12 months. If demand for our product were to decrease substantially, our ability to generate cash flow sufficient for our short-term working capital and expenditure needs could be materially impacted.
Additionally, a portion of our cash may be used to acquire or invest in complementary businesses or products or to obtain the right to use complementary technologies. From time to time, in the ordinary course of business, we evaluate potential acquisitions of such businesses, products or technologies such as our acquisition of Network General. If our existing sources of liquidity are insufficient to satisfy our liquidity requirements, we may seek to sell additional equity or debt securities. The sale of additional equity or debt securities could result in additional dilution to our stockholders. In the fourth quarter of our fiscal year 2011, we announced the acquisition of Psytechnics, Ltd. The acquisition closed on April 1, 2011.
We have reviewed and considered all recent accounting pronouncements and believe there are none that could potentially have a material impact on our financial condition, results of operations or disclosures.
Item 7A. Quantitative and Qualitative Disclosures About Market Risk
Market Risk. Market risk represents the risk of loss that may impact our financial position due to adverse changes in financial market prices and rates. Our primary market risk exposures are in the areas of illiquidity of auction rate securities, interest rate risk and foreign currency exchange rate risk. We currently do not hedge
51
Table of Contents
interest rate exposure, but do not believe that a fluctuation in interest rates would have a material impact on the value of our cash equivalents and marketable securities. Our long-term marketable securities, which consist primarily of auction rate securities, are stated at fair value based on risk adjusted discounted cash flow calculations. Prior to February 2008, these securities typically were stated at par value. While we continue to earn interest on auction rate securities at the maximum contractual rate, these securities are not currently trading and therefore do not currently have a readily determinable market value. Accordingly, par value no longer approximates the estimated fair value of auction rate securities. As a result of their illiquidity, we have recorded a temporary impairment at March 31, 2011 against the carrying value of our auction rate securities. For more information on auction rate securities, refer to Note 3.
Credit Risk. Our cash equivalents and marketable securities consist primarily of money market instruments, U.S. Treasury bills, certificates of deposit, commercial paper, corporate bonds, municipal obligations and student loan backed auction rate securities.
At March 31, 2011 and periodically throughout the year, we have maintained cash balances in various operating accounts in excess of federally insured limits. We limit the amount of credit exposure with any one financial institution by evaluating the creditworthiness of the financial institutions with which we invest.
Interest Rate Risk. We are exposed to market risks related to fluctuations in interest rates related to our term loan. As of March 31, 2011, we owed $68.1 million on this loan with an interest rate of 2.500% effective March 31, 2011 through September 30, 2011, the next LIBOR reset date. A sensitivity analysis was performed on the outstanding portion of our debt obligation as of March 31, 2011. Should the current weighted average interest rate increase or decrease by 10%, the resulting annual increase or decrease to interest expense would be approximately $156 thousand as of March 31, 2011. When a sensitivity analysis was performed at March 31, 2010, the resulting annual increase or decrease to interest expense was $203 thousand.
Foreign Currency Exchange Risk. As a result of our foreign operations, we face exposure to movements in foreign currency exchange rates, primarily the Euro, British Pound, Canadian Dollar and Indian Rupee. The current exposures arise primarily from expenses denominated in foreign currencies. NetScout currently engages in foreign currency hedging activities in order to limit these exposures. We do not use derivative financial instruments for speculative trading purposes.
As of March 31, 2011, we had foreign currency forward contracts with notional amounts totaling $10.9 million. The valuation of outstanding foreign currency forward contracts at March 31, 2011 resulted in a liability balance of $92 thousand, reflecting unfavorable contract rates in comparison to current market rates at this date and an asset balance of $158 thousand reflecting favorable rates in comparison to current market rates. As of March 31, 2010, we had foreign currency forward contracts with notional amounts totaling $9.4 million. The valuation of outstanding foreign currency forward contracts at March 31, 2010 resulted in a liability balance of $359 thousand, reflecting unfavorable contract rates in comparison to current market rates at this date and an asset balance of $94 thousand reflecting favorable rates in comparison to current market rates.
Item 8. Financial Statements and Supplementary Data
NetScout’s Consolidated Financial Statements and Schedule and Report of Independent Registered Public Accounting Firm appear beginning on page F-1 attached to this report.
Item 9. Changes in and Disagreements With Accountants on Accounting and Financial Disclosure
There have been no changes in or disagreements with accountants on accounting or financial disclosure matters.
52
Table of Contents
Item 9A. Controls and Procedures
Evaluation of Disclosure Controls and Procedures
As of March 31, 2011, NetScout, under the supervision and with the participation of our management, including the Company’s principal executive officer and principal financial officer, evaluated the effectiveness of the design and operation of our disclosure controls and procedures pursuant to Rule 13a-15(b) promulgated under the Exchange Act. Based upon that evaluation, our principal executive officer and principal financial officer concluded that, as of March 31, 2011, our disclosure controls and procedures were effective in ensuring that material information relating to NetScout, including its consolidated subsidiaries, required to be disclosed by NetScout in the reports that it files or submits under the Exchange Act is recorded, processed, summarized and reported within the time periods specified in the Securities Exchange Commission’s rules and forms, including ensuring that such material information is accumulated and communicated to our management, including our principal executive officer and principal financial officer, as appropriate, to allow timely decisions regarding required disclosure.
Changes in Internal Control over Financial Reporting
During the year ended March 31, 2011, there were no changes in our internal control over financial reporting that have materially affected, or are reasonably likely to materially affect, our internal control over financial reporting.
Management’s Report on Internal Control Over Financial Reporting
Our management is responsible for establishing and maintaining adequate internal control over financial reporting as such term is defined in Exchange Act Rule 13a-15(f). Our internal control over financial reporting was designed to provide reasonable assurance regarding reliability of financial reporting and the preparation of financial statements for external purposes in accordance with generally accepted accounting principles. Because of its inherent limitations, internal control over financial reporting may not prevent or detect misstatements. Also, projections of any evaluation of effectiveness to future periods are subject to the risk that controls may become inadequate because of changes in conditions, or that the degree of compliance with the policies or procedures may deteriorate. Our management assessed the effectiveness of our internal control over financial reporting as of March 31, 2011. In making this assessment, our management used the criteria set forth by the Committee of Sponsoring Organizations of the Treadway Commission (COSO) in Internal Control—Integrated Framework. Based on our assessment, we concluded that our internal control over financial reporting was effective as of March 31, 2011.
The effectiveness of the Company’s internal control over financial reporting as of March 31, 2011 has been audited by PricewaterhouseCoopers LLP, an independent registered public accounting firm, as stated in their report which is included herein at F-2 of this Annual Report on Form 10-K.
Not applicable.
53
Table of Contents
PART III
Item 10. Directors and Executive Officers of the Registrant
The information required by this Item 10 is included under the captions “Directors and Executive Officers,” “Election of Directors,” “Section 16(a) Beneficial Ownership Reporting Compliance,” “Code of Ethics,” “The Board of Directors and its Committees” and “Corporate Governance” in our definitive Proxy Statement with respect to our 2011 Annual Meeting of Stockholders to be filed with the SEC no later than 120 days after the end of the fiscal year and is incorporated herein by reference.
Item 11. Executive Compensation
The information required by this Item 11 is included under the caption “Compensation and Other Information Concerning Executive Officers” in our definitive Proxy Statement with respect to our 2011 Annual Meeting of Stockholders to be filed with the SEC not later than 120 days after the end of the fiscal year and is incorporated herein by reference.
Item 12. Security Ownership of Certain Beneficial Owners and Management and Related Stockholder Matters
The information required by this Item 12 is included under the captions “Security Ownership of Certain Beneficial Owners and Management” and “Equity Compensation Plan Information” in our definitive Proxy Statement with respect to our 2011 Annual Meeting of Stockholders to be filed with the SEC not later than 120 days after the end of the fiscal year and is incorporated herein by reference.
Item 13. Certain Relationships and Related Transactions
The information required by this Item 13 is included, as applicable, under the captions “Director Independence,” “Employment and Other Agreements” and “Transactions with Related Persons” in our definitive Proxy Statement with respect to our 2011 Annual Meeting of Stockholders to be filed with the SEC not later than 120 days after the end of the fiscal year and is incorporated herein by reference.
Item 14. Principal Accountant Fees and Services
The information required by this Item 14 is included under the captions “Auditors Fees and Services” and “Policy on Audit Committee Pre-approval of Audit and Non-audit Services” in our definitive Proxy Statement with respect to our 2011 Annual Meeting of Stockholders to be filed with the SEC not later than 120 days after the end of the fiscal year and is incorporated herein by reference.
54
Table of Contents
PART IV
Item 15. Exhibits and Financial Statement Schedule
| (a) | 1. | Consolidated Financial Statements. | ||||||||
| F-2 | ||||||||||
| F-3 | ||||||||||
| Consolidated Statements of Operations for the Years Ended March 31, 2011, 2010 and 2009 |
F-4 | |||||||||
| F-5 | ||||||||||
| Consolidated Statements of Cash Flows for the Years Ended March 31, 2011, 2010 and 2009 |
F-6 | |||||||||
| F-7 | ||||||||||
| 2. | Financial Statement Schedule. | |||||||||
| Valuation and Qualifying Accounts | S-1 | |||||||||
| No other financial statement schedules have been included because they are either not applicable or the information is in the consolidated financial statements. | ||||||||||
| 3. | List of Exhibits. | |||||||||
| We hereby file as part of, or incorporate by reference into, this Annual Report on Form 10-K the exhibits listed on the index to exhibits immediately following the financial statements. | ||||||||||
| (b) | We hereby file as part of this Annual Report on Form 10-K the exhibits listed in Item 15(a)(3) above. |
| (c) | We hereby file as part of this Annual Report on Form 10-K the financial statement schedule listed in Item 15(a)(2) above. |
55
Table of Contents
Pursuant to the requirements of Section 13 or 15(d) of the Securities Exchange Act of 1934, the registrant has duly caused this report to be signed on its behalf by the undersigned, thereunto duly authorized.
| NETSCOUT SYSTEMS, INC. | ||
| By: | /S/ ANIL K. SINGHAL | |
| Anil K. Singhal | ||
| President, Chief Executive Officer, and Chairman | ||
| Date: May 27, 2011 | ||
Pursuant to the requirements of the Securities Exchange Act of 1934, this report has been signed below by the following persons on behalf of the registrant and in the capacities and on the dates indicated.
| Signature |
Title(s) |
Date | ||
| /S/ ANIL K. SINGHAL Anil K. Singhal |
President, Chief Executive Officer, and Chairman (Principal Executive Officer) |
May 27, 2011 | ||
| /S/ DAVID P. SOMMERS David P. Sommers |
Senior Vice President, General Operations and Chief Financial Officer (Principal Financial Officer) |
May 27, 2011 | ||
| /S/ JEAN BUA Jean Bua |
Vice President, Finance and Chief Accounting Officer (Principal Accounting Officer) |
May 27, 2011 | ||
| /S/ VICTOR A. DEMARINES Victor A. DeMarines |
Director | May 27, 2011 | ||
| /S/ JOHN R. EGAN John R. Egan |
Director | May 27, 2011 | ||
| /S/ JOSEPH G. HADZIMA, JR. Joseph G. Hadzima, Jr |
Director | May 27, 2011 | ||
| /S/ STUART MCGUIGAN Stuart McGuigan |
Director | May 27, 2011 | ||
| /S/ VINCENT J. MULLARKEY Vincent J. Mullarkey |
Director | May 27, 2011 | ||
| /S/ STEPHEN PEARSE Stephen Pearse |
Director | May 27, 2011 | ||
56
Table of Contents
Index to Consolidated Financial Statements
| F-2 | ||||
| F-3 | ||||
| Consolidated Statements of Operations for the Years Ended March 31, 2011, 2010 and 2009 |
F-4 | |||
| F-5 | ||||
| Consolidated Statements of Cash Flows for the Years Ended March 31, 2011, 2010 and 2009 |
F-6 | |||
| F-7 |
F-1
Table of Contents
Report of Independent Registered Public Accounting Firm
To the Board of Directors and Stockholders of NetScout Systems, Inc.:
In our opinion, the consolidated financial statements listed in the index appearing under Item 15 (a)(1) present fairly, in all material respects, the financial position of NetScout Systems, Inc. and its subsidiaries at March 31, 2011 and 2010, and the results of their operations and their cash flows for each of the three years in the period ended March 31, 2011 in conformity with accounting principles generally accepted in the United States of America. In addition, in our opinion, the financial statement schedule listed in the index appearing under Item 15 (a)(2) presents fairly, in all material respects, the information set forth therein when read in conjunction with the related consolidated financial statements. Also, in our opinion, the Company maintained, in all material respects, effective internal control over financial reporting as of March 31, 2011, based on criteria established in Internal Control-Integrated Framework issued by the Committee of Sponsoring Organizations of the Treadway Commission (COSO). The Company’s management is responsible for these financial statements and the financial statement schedule, for maintaining effective internal control over financial reporting and for its assessment of the effectiveness of internal control over financial reporting, included in Management’s Report on Internal Control over Financial Reporting appearing under Item 9A. Our responsibility is to express opinions on these financial statements, on the financial statement schedule, and on the Company’s internal control over financial reporting based on our integrated audits. We conducted our audits in accordance with the standards of the Public Company Accounting Oversight Board (United States). Those standards require that we plan and perform the audits to obtain reasonable assurance about whether the financial statements are free of material misstatement and whether effective internal control over financial reporting was maintained in all material respects. Our audits of the financial statements included examining, on a test basis, evidence supporting the amounts and disclosures in the financial statements, assessing the accounting principles used and significant estimates made by management, and evaluating the overall financial statement presentation. Our audit of internal control over financial reporting included obtaining an understanding of internal control over financial reporting, assessing the risk that a material weakness exists, and testing and evaluating the design and operating effectiveness of internal control based on the assessed risk. Our audits also included performing such other procedures as we considered necessary in the circumstances. We believe that our audits provide a reasonable basis for our opinions.
A company’s internal control over financial reporting is a process designed to provide reasonable assurance regarding the reliability of financial reporting and the preparation of financial statements for external purposes in accordance with generally accepted accounting principles. A company’s internal control over financial reporting includes those policies and procedures that (i) pertain to the maintenance of records that, in reasonable detail, accurately and fairly reflect the transactions and dispositions of the assets of the company; (ii) provide reasonable assurance that transactions are recorded as necessary to permit preparation of financial statements in accordance with generally accepted accounting principles, and that receipts and expenditures of the company are being made only in accordance with authorizations of management and directors of the company; and (iii) provide reasonable assurance regarding prevention or timely detection of unauthorized acquisition, use, or disposition of the company’s assets that could have a material effect on the financial statements.
Because of its inherent limitations, internal control over financial reporting may not prevent or detect misstatements. Also, projections of any evaluation of effectiveness to future periods are subject to the risk that controls may become inadequate because of changes in conditions, or that the degree of compliance with the policies or procedures may deteriorate.
/S/ PRICEWATERHOUSECOOPERS LLP
Boston, Massachusetts
May 27, 2011
F-2
Table of Contents
Consolidated Balance Sheets
(In thousands, except share and per share data)
| March 31, 2011 |
March 31, 2010 |
|||||||
| Assets |
||||||||
| Current assets: |
||||||||
| Cash and cash equivalents |
$ | 67,168 | $ | 63,322 | ||||
| Marketable securities |
133,430 | 69,875 | ||||||
| Accounts receivable, net of allowance for doubtful accounts of $346 and $427 at March 31, 2011 and 2010, respectively |
62,801 | 65,556 | ||||||
| Inventories |
8,925 | 9,181 | ||||||
| Prepaid income taxes |
3,205 | 2,730 | ||||||
| Deferred income taxes |
3,383 | 2,698 | ||||||
| Prepaid expenses and other current assets |
4,814 | 5,422 | ||||||
| Total current assets |
283,726 | 218,784 | ||||||
| Fixed assets, net |
13,467 | 12,773 | ||||||
| Goodwill |
128,177 | 128,177 | ||||||
| Acquired intangible assets, net |
47,686 | 53,573 | ||||||
| Deferred income taxes |
25,167 | 30,062 | ||||||
| Long-term marketable securities |
27,880 | 37,354 | ||||||
| Other assets |
1,467 | 1,878 | ||||||
| Total assets |
$ | 527,570 | $ | 482,601 | ||||
| Liabilities and Stockholders’ Equity |
||||||||
| Current liabilities: |
||||||||
| Accounts payable |
$ | 9,709 | $ | 7,307 | ||||
| Accrued compensation |
21,854 | 19,806 | ||||||
| Accrued other |
4,786 | 5,051 | ||||||
| Current portion of long-term debt |
15,000 | 11,250 | ||||||
| Deferred revenue |
85,241 | 84,196 | ||||||
| Total current liabilities |
136,590 | 127,610 | ||||||
| Other long-term liabilities |
1,721 | 551 | ||||||
| Accrued long-term retirement benefits |
1,859 | 1,645 | ||||||
| Long-term deferred revenue |
14,735 | 17,846 | ||||||
| Long-term debt, net of current portion |
53,106 | 68,106 | ||||||
| Total liabilities |
208,011 | 215,758 | ||||||
| Commitments and contingencies (Note 16) |
||||||||
| Stockholders’ equity: |
||||||||
| Preferred stock, $0.001 par value: 5,000,000 shares authorized; no shares issued or outstanding at March 31, 2011 and 2010 |
— | — | ||||||
| Common stock, $0.001 par value: 150,000,000 shares authorized; 47,441,879 and 46,490,166 shares issued and 42,557,319 and 41,769,680 shares outstanding at March 31, 2011 and 2010, respectively |
47 | 46 | ||||||
| Additional paid-in capital |
227,201 | 209,146 | ||||||
| Accumulated other comprehensive loss |
(676 | ) | (1,817 | ) | ||||
| Treasury stock at cost, 4,884,658 and 4,720,584 shares at March 31, 2011 and 2010, respectively |
(35,437 | ) | (31,691 | ) | ||||
| Retained earnings |
128,424 | 91,159 | ||||||
| Total stockholders’ equity |
319,559 | 266,843 | ||||||
| Total liabilities and stockholders’ equity |
$ | 527,570 | $ | 482,601 | ||||
The accompanying notes are an integral part of these consolidated financial statements.
F-3
Table of Contents
Consolidated Statements of Operations
(In thousands, except per share data)
| Year Ended March 31, | ||||||||||||
| 2011 | 2010 | 2009 | ||||||||||
| Revenue: |
||||||||||||
| Product |
$ | 159,948 | $ | 142,113 | $ | 154,161 | ||||||
| Service |
130,592 | 118,229 | 113,443 | |||||||||
| Total revenue |
290,540 | 260,342 | 267,604 | |||||||||
| Cost of revenue: |
||||||||||||
| Product |
38,175 | 35,564 | 43,315 | |||||||||
| Service |
23,186 | 20,500 | 20,824 | |||||||||
| Total cost of revenue |
61,361 | 56,064 | 64,139 | |||||||||
| Gross profit |
229,179 | 204,278 | 203,465 | |||||||||
| Operating expenses: |
||||||||||||
| Research and development |
40,628 | 36,650 | 40,189 | |||||||||
| Sales and marketing |
105,271 | 99,059 | 98,818 | |||||||||
| General and administrative |
23,308 | 20,609 | 26,118 | |||||||||
| Amortization of acquired intangible assets |
1,907 | 2,057 | 1,962 | |||||||||
| Total operating expenses |
171,114 | 158,375 | 167,087 | |||||||||
| Income from operations |
58,065 | 45,903 | 36,378 | |||||||||
| Interest and other income (expense): |
||||||||||||
| Interest income |
672 | 644 | 2,031 | |||||||||
| Interest expense |
(2,452 | ) | (3,464 | ) | (6,287 | ) | ||||||
| Other (income) expense, net |
8 | (12 | ) | (1,081 | ) | |||||||
| Total interest and other income (expense), net |
(1,772 | ) | (2,832 | ) | (5,337 | ) | ||||||
| Income before income tax expense |
56,293 | 43,071 | 31,041 | |||||||||
| Income tax expense |
19,028 | 15,154 | 10,993 | |||||||||
| Net income |
$ | 37,265 | $ | 27,917 | $ | 20,048 | ||||||
| Basic net income per share |
$ | 0.89 | $ | 0.69 | $ | 0.51 | ||||||
| Diluted net income per share |
$ | 0.87 | $ | 0.67 | $ | 0.49 | ||||||
| Weighted average common shares outstanding used in computing: |
||||||||||||
| Net income per share—basic |
42,059 | 40,691 | 39,351 | |||||||||
| Net income per share—diluted |
42,973 | 41,915 | 40,925 | |||||||||
The accompanying notes are an integral part of these consolidated financial statements.
F-4
Table of Contents
Consolidated Statements of Stockholders’ Equity and Comprehensive Income
(In thousands, except share data)
| Common stock Voting |
Additional Paid In Capital |
Accumulated Other Comprehensive Income (Loss) |
Treasury stock | Retained Earnings |
Total Stockholders’ Equity |
Comprehensive Income |
||||||||||||||||||||||||||||||
| Shares | Par Value | Shares | Stated Value | |||||||||||||||||||||||||||||||||
| Balance, March 31, 2008 |
43,370,802 | 43 | 182,789 | 246 | 4,532,017 | (28,939 | ) | 43,194 | 197,333 | |||||||||||||||||||||||||||
| Net Income |
20,048 | 20,048 | $ | 20,048 | ||||||||||||||||||||||||||||||||
| Unrealized investment losses, net of tax of $1,394 |
(1,707 | ) | (1,707 | ) | (1,707 | ) | ||||||||||||||||||||||||||||||
| Comprehensive income |
$ | 18,341 | ||||||||||||||||||||||||||||||||||
| Issuance of common stock pursuant to exercise of options |
819,580 | 2 | 4,571 | 4,573 | ||||||||||||||||||||||||||||||||
| Issuance of common stock pursuant to vesting of restricted stock units |
621,347 | — | — | |||||||||||||||||||||||||||||||||
| Stock-based compensation expense for stock options granted to employees |
141 | 141 | ||||||||||||||||||||||||||||||||||
| Stock-based compensation expense for restricted stock units granted to employees |
4,981 | 4,981 | ||||||||||||||||||||||||||||||||||
| Tax benefits of disqualifying disposititions of incentive stock options |
362 | 362 | ||||||||||||||||||||||||||||||||||
| Balance, March 31, 2009 |
44,811,729 | 45 | 192,844 | (1,461 | ) | 4,532,017 | (28,939 | ) | 63,242 | 225,731 | ||||||||||||||||||||||||||
| Net Income |
27,917 | 27,917 | $ | 27,917 | ||||||||||||||||||||||||||||||||
| Unrealized investment losses, net of tax of $112 |
(196 | ) | (196 | ) | (196 | ) | ||||||||||||||||||||||||||||||
| Unrealized losses on derivative financial instruments, net of tax of $100 |
(160 | ) | (160 | ) | (160 | ) | ||||||||||||||||||||||||||||||
| Comprehensive income |
$ | 27,561 | ||||||||||||||||||||||||||||||||||
| Issuance of common stock pursuant to exercise of options |
1,026,771 | 1 | 5,790 | 5,791 | ||||||||||||||||||||||||||||||||
| Issuance of common stock pursuant to vesting of restricted stock units and repurchase of common stock for net settlements |
651,666 | — | 188,567 | (2,752 | ) | (2,752 | ) | |||||||||||||||||||||||||||||
| Stock-based compensation expense for stock options granted to employees |
10 | 10 | ||||||||||||||||||||||||||||||||||
| Stock-based compensation expense for restricted stock units granted to employees |
5,446 | 5,446 | ||||||||||||||||||||||||||||||||||
| Tax benefits of disqualifying disposititions of incentive stock options |
5,056 | 5,056 | ||||||||||||||||||||||||||||||||||
| Balance, March 31, 2010 |
46,490,166 | $ | 46 | $ | 209,146 | $ | (1,817 | ) | 4,720,584 | $ | (31,691 | ) | $ | 91,159 | $ | 266,843 | ||||||||||||||||||||
| Net Income |
37,265 | 37,265 | $ | 37,265 | ||||||||||||||||||||||||||||||||
| Unrealized investment gains, net of tax of $(623) |
936 | 936 | 936 | |||||||||||||||||||||||||||||||||
| Unrealized gains on derivative financial instruments, net of tax of $(128) |
205 | 205 | 205 | |||||||||||||||||||||||||||||||||
| Comprehensive income |
$ | 38,406 | ||||||||||||||||||||||||||||||||||
| Issuance of common stock pursuant to exercise of options |
450,432 | 1 | 3,378 | 3,379 | ||||||||||||||||||||||||||||||||
| Issuance of common stock pursuant to vesting of restricted stock units and repurchase of common stock for net settlements |
501,281 | — | 164,074 | (3,746 | ) | (3,746 | ) | |||||||||||||||||||||||||||||
| Stock-based compensation expense for restricted stock units granted to employees |
6,439 | 6,439 | ||||||||||||||||||||||||||||||||||
| Tax benefits of disqualifying disposititions of incentive stock options |
8,238 | 8,238 | ||||||||||||||||||||||||||||||||||
| Balance, March 31, 2011 |
47,441,879 | $ | 47 | $ | 227,201 | $ | (676 | ) | 4,884,658 | $ | (35,437 | ) | $ | 128,424 | $ | 319,559 | ||||||||||||||||||||
The accompanying notes are an integral part of these consolidated financial statements.
F-5
Table of Contents
Consolidated Statements of Cash Flows
(In thousands)
| Year Ended March 31, | ||||||||||||
| 2011 | 2010 | 2009 | ||||||||||
| Cash flows from operating activities: |
||||||||||||
| Net income |
$ | 37,265 | $ | 27,917 | $ | 20,048 | ||||||
| Adjustments to reconcile net income to cash provided by operating activities: |
||||||||||||
| Depreciation and amortization |
13,877 | 14,357 | 13,805 | |||||||||
| Loss on disposal of fixed assets |
127 | 258 | 8 | |||||||||
| Share-based compensation expense associated with equity awards |
6,439 | 5,456 | 5,122 | |||||||||
| Deferred income taxes |
3,459 | 5,189 | 8,225 | |||||||||
| Changes in assets and liabilities |
||||||||||||
| Accounts receivable |
2,755 | (25,729 | ) | (7,779 | ) | |||||||
| Inventories |
256 | (1,862 | ) | 5,233 | ||||||||
| Prepaid income taxes |
(475 | ) | 5,659 | (3,353 | ) | |||||||
| Prepaid expenses and other current assets |
621 | (380 | ) | 8,640 | ||||||||
| Other assets |
258 | (25 | ) | 798 | ||||||||
| Accounts payable |
2,583 | (238 | ) | (2,822 | ) | |||||||
| Accrued compensation and other expenses |
3,438 | (3,966 | ) | (2,897 | ) | |||||||
| Income taxes payable |
— | (1,702 | ) | 637 | ||||||||
| Deferred revenue |
(2,066 | ) | 22,290 | (1,269 | ) | |||||||
| Net cash provided by operating activities |
68,537 | 47,224 | 44,396 | |||||||||
| Cash flows from investing activities: |
||||||||||||
| Purchase of marketable securities |
(153,903 | ) | (92,919 | ) | (30,326 | ) | ||||||
| Proceeds from maturity of marketable securities |
101,430 | 39,064 | 17,449 | |||||||||
| Purchase of fixed assets |
(8,839 | ) | (6,812 | ) | (4,966 | ) | ||||||
| Capitalized software development costs |
— | (408 | ) | — | ||||||||
| Net cash used in investing activities |
(61,312 | ) | (61,075 | ) | (17,843 | ) | ||||||
| Cash flows from financing activities: |
||||||||||||
| Issuance of common stock under stock plans |
(367 | ) | 3,039 | 4,573 | ||||||||
| Repayment of long-term debt |
(11,250 | ) | (13,144 | ) | (6,250 | ) | ||||||
| Excess tax benefit from stock options exercised |
8,238 | 5,056 | 362 | |||||||||
| Net cash used in financing activities |
(3,379 | ) | (5,049 | ) | (1,315 | ) | ||||||
| Effect of exchange rate changes on cash and cash equivalants |
— | — | 282 | |||||||||
| Net increase (decrease) in cash and cash equivalents |
3,846 | (18,900 | ) | 25,520 | ||||||||
| Cash and cash equivalents, beginning of year |
63,322 | 82,222 | 56,702 | |||||||||
| Cash and cash equivalents, end of year |
$ | 67,168 | $ | 63,322 | $ | 82,222 | ||||||
| Supplemental disclosure of cash flow information: |
||||||||||||
| Cash paid for interest |
$ | 2,079 | $ | 3,063 | $ | 5,878 | ||||||
| Cash paid for income taxes |
$ | 7,846 | $ | 2,897 | $ | 4,859 | ||||||
| Non-cash transactions: |
||||||||||||
| Additions to property, plant and equipment included in accounts payable |
$ | 979 | $ | 1,160 | $ | — | ||||||
The accompanyin notes are an integral part of these consolidated financial statements.
F-6
Table of Contents
Notes to Consolidated Financial Statements
1. Nature of Business
NetScout Systems, Inc., or NetScout or the Company, designs, develops, manufactures, markets, sells and supports market leading unified service delivery management, service assurance and application and network performance management solutions focused on assuring service delivery for the world’s largest, most demanding and complex IP based service delivery environments. NetScout manufactures and markets these products in integrated hardware and software solutions that are used by commercial enterprises, large governmental agencies and telecommunication service providers worldwide. NetScout has a single operating segment and substantially all of its identifiable assets are located in the United States.
2. Summary of Significant Accounting Policies
Basis of Presentation
The consolidated financial statements include the accounts of NetScout and its wholly-owned subsidiaries. All inter-company transactions and balances have been eliminated in consolidation.
Use of Estimates
The preparation of financial statements in conformity with generally accepted accounting principles, or GAAP, requires management to make estimates and assumptions that affect the reported amounts of assets and liabilities and disclosures of contingent assets and liabilities at the date of the consolidated financial statements and the reported amounts of revenues and expenses during the reporting period. Significant estimates in these financial statements include revenue recognition, valuation of inventories, valuation of goodwill and acquired intangible assets, capitalization of software development costs, derivative financial instruments, purchased software and internal use software, share-based compensation and income taxes. These items are continuously monitored and analyzed by management for changes in facts and circumstances and material changes in these estimates could occur in the future.
Cash and Cash Equivalents and Marketable Securities
Under current authoritative guidance, NetScout has classified its investments as “available-for-sale” which are carried at fair value based on quoted market prices and associated unrealized gains or losses are recorded as a separate component of stockholders’ equity until realized. NetScout considers all highly liquid investments purchased with a maturity of three months or less to be cash equivalents and those with maturities greater than three months are considered to be marketable securities.
At March 31, 2011 and periodically throughout the year, NetScout has maintained cash balances in various operating accounts in excess of federally insured limits. NetScout limits the amount of credit exposure by investing only with credit worthy institutions.
Revenue Recognition
In October 2009, the FASB amended the accounting standards for revenue recognition to remove tangible products containing software components and non-software components that function together to deliver the product’s essential functionality from the scope of industry-specific software revenue recognition guidance. In October 2009, the FASB also amended the accounting standards for multiple deliverable revenue arrangements to:
| (i) | provide updated guidance on how the deliverables in a multiple deliverable arrangement should be separated, and how the consideration should be allocated; |
F-7
Table of Contents
NetScout Systems, Inc.
Notes to Consolidated Financial Statements—(Continued)
2. Summary of Significant Accounting Policies (Continued)
| (ii) | require an entity to allocate revenue in an arrangement using estimated selling prices of deliverables if a vendor does not have VSOE of selling price or third-party evidence of selling price; and |
| (iii) | eliminate the use of the residual method and require an entity to allocate revenue using the relative selling price method. |
The Company elected to early adopt this accounting guidance at the beginning of its first quarter of fiscal year 2011 on a prospective basis for applicable transactions originating or materially modified after April 1, 2010. The adoption of this guidance did not have a material impact on its financial position or results of operations for the fiscal year ended March 31, 2011. The following reflects our updated policy for revenue recognition.
Product revenue consists of sales of NetScout’s hardware products (which include embedded software that works together with the hardware to deliver the product’s essential functionality), licensing of its software products, and sale of hardware bundled with a software license. Product revenue is recognized upon shipment, provided that evidence of an arrangement exists, title and risk of loss have passed to the customer, fees are fixed or determinable and collection of the related receivable is probable. Because many of NetScout’s solutions are comprised of both hardware and more than incidental software components, the Company recognizes revenue in accordance with authoritative guidance on both hardware and software revenue recognition.
Service revenue consists primarily of fees from customer support agreements, consulting and training. NetScout generally provides software and hardware support as part of product sales. Revenue related to the initial bundled software and hardware support is recognized ratably over the support period. In addition, customers can elect to purchase extended support agreements for periods after the initial software warranty expiration, typically for 12-month periods. Revenue from customer support agreements is recognized ratably over the support period. Revenue from consulting and training services is recognized as the work is performed.
Multi-element arrangements are concurrent customer purchases of a combination of NetScout’s product and service offerings that may be delivered at various points in time. For multi-element arrangements comprised only of hardware products and related services, the Company allocates the total transaction revenue to the multiple elements based on each element’s relative fair value compared to the total fair value of all the elements. Each element’s relative fair value is based on management’s best estimate of selling price paid by customers based on the element’s historical pricing. The Company reviews the sales of all products and services quarterly and updates, when appropriate, its best estimate of selling price for each element to ensure that it reflects recent pricing experience.
For multi-element arrangements comprised only of software products and related services, the Company allocates a portion of the total purchase price to the undelivered elements, primarily support agreements and training, using vendor-specific objective evidence, or VSOE, of fair value for the undelivered elements. The remaining portion of the total transaction value is allocated to the delivered software, referred to as the residual method. VSOE of fair value of the undelivered elements is based on the price customers pay when the element is sold separately. The Company reviews the separate sales of the undelivered elements on a quarterly basis and updates, when appropriate, its VSOE of fair value for such elements to ensure that it reflects recent pricing experience.
For multi-element arrangements comprised of a combination of hardware and software elements, the total transaction value is bifurcated between the hardware elements and the software elements based on the relative
F-8
Table of Contents
NetScout Systems, Inc.
Notes to Consolidated Financial Statements—(Continued)
2. Summary of Significant Accounting Policies (Continued)
selling prices of the hardware elements and the software elements as a group. Then, revenue for the hardware and hardware-related services is recognized following the hardware revenue recognition methodology outlined above and revenue for the software and software-related services is recognized following the residual method.
Commission Expense
The Company recognizes commission expense related to the renewal of maintenance contracts at the time an order is booked. As a result, commission expense can be recognized in full even though the related revenue may not be fully recognized. Commission expense on product revenue and corresponding new maintenance contracts is recognized in the same period as related product revenue, typically upon shipment.
Uncollected Deferred Product Revenue
Because of NetScout’s revenue recognition policies, there are circumstances for which the Company does not recognize revenue relating to sales transactions that have been billed, but the related account receivable has not been collected. While the receivable represents an enforceable obligation, for balance sheet presentation purposes, NetScout has not recognized the deferred revenue or the related account receivable and no amounts appear in the consolidated balance sheets for such transactions. The aggregate amount of unrecognized accounts receivable and deferred revenue was $183 thousand and $2.0 million at March 31, 2011 and 2010, respectively.
Concentration of Credit Risk and Significant Customers
Financial instruments, which include: cash, cash equivalents, accounts receivable and accounts payable, are stated at cost, plus accrued interest where applicable, which approximates fair value. Long-term marketable securities include auction rate securities, which are currently illiquid, corporate bonds and U.S. government and municipal obligations. Auction rate securities are stated at fair value based on discounted cash flow calculations. At March 31, 2010, long-term marketable securities also included certificates of deposit.
At March 31, 2011 and 2010, one customer accounted for approximately 13% and 12% of the accounts receivable balance, respectively. No one direct customer or indirect channel partner accounted for more than 10% of total revenue during the fiscal years ended March 31, 2011, 2010 and 2009. Historically, the Company has not experienced any significant non-performance by its customers nor does the Company anticipate non-performance by its customers in the future; accordingly, the Company does not require collateral.
Trade Receivable Valuations
Accounts receivable are stated at their net realizable value. The allowance against gross trade receivables reflects the best estimate of probable losses inherent in the receivables portfolio determined on the basis of historical experience, specific allowances for known troubled accounts and other currently available information.
Inventories
Inventories are stated at the lower of actual cost or net realizable value. Cost is determined by using the first-in, first-out(FIFO) method.
F-9
Table of Contents
NetScout Systems, Inc.
Notes to Consolidated Financial Statements—(Continued)
2. Summary of Significant Accounting Policies (Continued)
Fixed Assets
Fixed assets are stated at cost and depreciated using the straight-line method over the estimated useful lives of the assets. Leasehold improvements are amortized on a straight-line basis over the shorter of the lease term or anticipated useful life of the improvement. Gains and losses upon asset disposal are recognized in the year of disposition. Expenditures for replacements and building improvements are capitalized, while expenditures for maintenance and repairs are charged against earnings as incurred.
Valuation of Goodwill and Acquired Intangible Assets
NetScout amortizes acquired intangible assets over their estimated useful lives on a straight-line basis, except for an acquired tradename which has an indefinite life and thus, is not amortized. NetScout considered the economic consumption method for amortizing acquired intangible assets and determined that the straight-line method was preferable given the amount of subjectivity involved in projecting the timing of cash flows related to the acquired intangibles. The Company periodically reviews long-lived assets for impairment whenever events or changes in business circumstances indicate that the carrying amount of the assets may not be fully recoverable or that the useful lives of these assets are no longer appropriate. The carrying value of the indefinite lived tradename is evaluated for potential impairment on an annual basis. At March 31, 2011, NetScout determined that there had been no impairment of acquired intangible assets or indefinite lived intangible assets.
NetScout assesses goodwill for impairment at the enterprise-level at least annually or more frequently when events and circumstances occur indicating that the recorded goodwill may be impaired. At March 31, 2011 and 2010, NetScout determined that there had been no impairment of goodwill.
Capitalized Software Development Costs
Costs incurred in the research and development of the Company’s products are expensed as incurred, except for certain software development costs. Costs associated with the development of computer software are expensed prior to the establishment of technological feasibility and capitalized thereafter until the related software products are available for first customer shipment.
Capitalized software development costs are periodically assessed for recoverability in the event of changes to the anticipated future revenue for the software products or changes in product technologies. Unamortized capitalized software development costs that are determined to be in excess of the net realizable value of the software products would be expensed in the period in which such a determination is made.
Derivative Financial Instruments
Under authoritative guidance for derivative instruments and hedging activities, all hedging activities must be documented at the inception of the hedge and must meet the definition of highly effective in offsetting changes to future cash flows in order for the derivative to qualify for hedge accounting. Under the guidance, if an instrument qualifies for hedge accounting, the changes in the fair value each period for open contracts, measured as of the end of the period, are recorded to other comprehensive income. Otherwise, changes in the fair value are recorded in earnings each period. Management must perform initial and ongoing tests in order to qualify for hedge accounting. In accordance with the guidance, the Company accounts for its instruments under hedge accounting. The effectiveness and a measurement of ineffectiveness of qualifying hedge contracts is assessed by the Company quarterly. The Company records the fair value of its derivatives in other current assets and other
F-10
Table of Contents
NetScout Systems, Inc.
Notes to Consolidated Financial Statements—(Continued)
2. Summary of Significant Accounting Policies (Continued)
current liabilities. The effective portion of gains or losses resulting from changes in the fair value of qualifying hedges are recorded in other comprehensive income (loss) until the forecasted transaction occurs, with any ineffective portion classified directly to the Company’s consolidated statement of operations based on the expense categories of the items being hedged. When forecasted transactions occur, unrealized gains or losses associated with the effective portion of the hedge are reclassified to the respective expense categories in the Company’s consolidated statement of operations. Gains or losses related to hedging activity are included as operating activities in the Company’s consolidated statement of cash flows. If the underlying forecasted transactions do not occur, or it becomes probable that they will not occur, the gain or loss on the related cash flow hedge is recognized immediately in earnings.
Share-based Compensation
NetScout recognizes compensation expense for all share-based payments granted. Under the fair value recognition provisions, share-based compensation is calculated net of an estimated forfeiture rate and compensation cost is only recognized for those shares expected to vest on a straight-line basis over the requisite service period of the award.
Foreign Currency
NetScout accounts for its reporting of foreign operations in accordance with guidance which establishes guidelines for the determination of the functional currency of foreign subsidiaries. NetScout’s foreign subsidiaries are an extension of NetScout’s U.S. operations. All revenue transactions are generated out of the Company’s U.S. headquarters in U.S. dollars. In accordance with the guidance, NetScout has determined its functional currency for its foreign subsidiaries to be the U.S. dollar. Foreign subsidiary expenses that are denominated in a currency other than the functional currency are translated at the foreign exchange rate in effect at the time the transaction is recorded. The net gains (losses) from foreign currency translations were immaterial for the years ended March 31, 2011, 2010 and 2009, respectively.
NetScout will experience currency exchange risk with respect to those foreign currency denominated expenses. In order to partially offset the risks associated with the effects of certain foreign currency exposures, NetScout has established a program that utilizes foreign currency forward contracts. Under this program, increases or decreases in foreign currency exposures are partially offset by gains or losses on forward contracts, to mitigate the impact of foreign currency transaction gains or losses. The Company does not use forward contracts to engage in currency speculation. All outstanding foreign currency forward contracts are recorded at fair value at the end of each fiscal period.
Advertising Expense
NetScout recognizes advertising expense as incurred. Advertising expense was $175 thousand, $201 thousand and $366 thousand for the years ended March 31, 2011, 2010 and 2009, respectively.
Comprehensive Income
Comprehensive income is comprised of net income and other comprehensive income (loss). Other comprehensive income (loss) typically consists of unrealized gains and losses on marketable securities and restricted investments, unrealized gain (loss) on hedge contracts and foreign currency translation adjustments.
F-11
Table of Contents
NetScout Systems, Inc.
Notes to Consolidated Financial Statements—(Continued)
2. Summary of Significant Accounting Policies (Continued)
Income Taxes
NetScout accounts for its income taxes under the asset and liability method. Under the asset and liability method, deferred tax assets and liabilities are recognized based on anticipated future tax consequences attributable to differences between financial statement carrying amounts of assets and liabilities and their respective tax bases, as well as the effect of any net operating loss and tax credit carryforwards. Income tax expense is comprised of the current tax liability or benefit and the change in deferred tax assets and liabilities. A valuation allowance is established to the extent that it is more likely than not that the deferred tax assets will not be realized.
Recent Accounting Standards
The Company has reviewed and considered all recent accounting pronouncements and believes there are none that could potentially have a material impact on its financial condition, results of operations or disclosures.
3. Cash, Cash Equivalents and Marketable Securities
Cash and cash equivalents consisted of money market instruments and cash maintained with various financial institutions at March 31, 2011 and 2010.
The following is a summary of marketable securities held by NetScout at March 31, 2011 classified as short-term and long-term (in thousands):
| Amortized Cost |
Unrealized Gains (Losses) |
Fair Value | ||||||||||
| Type of security: |
||||||||||||
| U.S. government and municipal obligations |
$ | 86,670 | $ | (1 | ) | $ | 86,669 | |||||
| Commercial paper |
24,111 | (1 | ) | 24,110 | ||||||||
| Corporate bonds |
13,364 | 17 | 13,381 | |||||||||
| Certificates of deposit |
5,251 | 12 | 5,263 | |||||||||
| Auction rate securities |
4,007 | — | 4,007 | |||||||||
| Total short-term marketable securities |
133,403 | 27 | 133,430 | |||||||||
| Auction rate securities |
19,784 | (2,302 | ) | 17,482 | ||||||||
| U.S. government and municipal obligations |
8,716 | 3 | 8,719 | |||||||||
| Corporate bonds |
1,678 | 1 | 1,679 | |||||||||
| Total long-term marketable securities |
30,178 | (2,298 | ) | 27,880 | ||||||||
| Total marketable securities |
$ | 163,581 | $ | (2,271 | ) | $ | 161,310 | |||||
Maturity dates for short-term marketable securities held at March 31, 2011 range from April 2011 to March 2012. Maturity dates for long-term marketable securities held at March 31, 2011, which consist of auction rate securities, U.S. Treasury bills and corporate bonds, range from April 2012 to June 2038.
F-12
Table of Contents
NetScout Systems, Inc.
Notes to Consolidated Financial Statements—(Continued)
3. Cash, Cash Equivalents and Marketable Securities (Continued)
The following is a summary of marketable securities held by NetScout at March 31, 2010, classified as short-term and long-term (in thousands):
| Amortized Cost |
Unrealized Gains (Losses) |
Fair Value | ||||||||||
| Type of security: |
||||||||||||
| U.S. government and municipal obligations |
$ | 42,026 | $ | 59 | $ | 42,085 | ||||||
| Commercial paper |
8,993 | — | 8,993 | |||||||||
| Corporate bonds |
9,039 | (15 | ) | 9,024 | ||||||||
| Certificates of deposit |
10,761 | — | 10,761 | |||||||||
| Subtotal |
70,819 | 44 | 70,863 | |||||||||
| Less: restricted investment |
937 | 51 | 988 | |||||||||
| Total short-term marketable securities |
69,882 | (7 | ) | 69,875 | ||||||||
| Auction rate securities |
32,399 | (3,924 | ) | 28,475 | ||||||||
| U.S. government and municipal obligations |
2,032 | (4 | ) | 2,028 | ||||||||
| Corporate bonds |
3,589 | (2 | ) | 3,587 | ||||||||
| Certificates of deposit |
3,266 | (2 | ) | 3,264 | ||||||||
| Total long-term marketable securities |
41,286 | (3,932 | ) | 37,354 | ||||||||
| Total marketable securities |
$ | 111,168 | $ | (3,939 | ) | $ | 107,229 | |||||
Maturity dates for short-term marketable securities held at March 31, 2010 ranged from April 2010 to March 2011. Maturity dates for long-term marketable securities held at March 31, 2010, which consist of auction rate securities, corporate bonds and certificates of deposit, ranged from April 2011 to December 2039.
The Company’s long-term marketable securities include investments in auction rate securities. Beginning in February 2008 and continuing through March 31, 2011, auctions have failed resulting in a lack of short-term liquidity for these securities, which has caused the Company to classify $17.5 million as long-term on its consolidated balance sheet. As of March 31, 2011, the Company’s auction rate securities consisted of four positions issued by municipal agencies with a total par value of $23.8 million and a current estimated market value totaling $21.5 million. As of March 31, 2011, the portion of these investments reported under long-term marketable securities are AAA rated. The securities are collateralized by student loans with underlying support by the federal government through the Federal Family Education Loan Program and by monoline insurance companies.
During the year ended March 31, 2011, redemptions by the issuers for certain of the Company’s auction rate securities totaled $8.6 million and were settled at par, providing liquidity for a portion of these securities. In addition, subsequent to our fiscal year ended March 31, 2011, a total of $4.0 million of auction rate securities were redeemed at par value. As a result, the Company has classified $4.0 million under short-term marketable securities on its consolidated balance sheet. All other auction rate securities are classified as long-term marketable securities.
At March 31, 2011, the Company valued its outstanding long-term auction rate securities at fair value using a discounted cash flow model. This model estimated future interest income using maximum rate formulas applicable to each of these securities which consider historical spreads for benchmark rates included in these
F-13
Table of Contents
NetScout Systems, Inc.
Notes to Consolidated Financial Statements—(Continued)
3. Cash, Cash Equivalents and Marketable Securities (Continued)
formulas as well as rates for U.S. Treasuries. The model then discounts the estimated future interest income using a risk based discount rate that considers known U.S. Treasury yields as of March 31, 2011, historical spreads in comparison to U.S. Treasuries, and a liquidity risk premium of 350 basis points. As these securities have retained investment grade credit ratings with Standard and Poor’s, the Company has not applied a credit spread to its discount rate. The valuation also includes assumptions as to when these securities will return to liquidity, of which the weighted average period is estimated at between 51 and 55 months depending on the security being valued. This valuation resulted in a cumulative temporary decline in value of $2.3 million ($1.4 million, net of tax) as of March 31, 2011 recorded within accumulated other comprehensive income (loss) on the balance sheet. This represents a reduction in the valuation reserve of $1.6 million ($1.0 million, net of tax) during the fiscal year ended March 31, 2011 reflecting redemptions at par. The valuation is also impacted by changes in market interest rates used to value the securities. To the extent the Company determines that any impairment is other-than-temporary, the Company would record a charge to earnings.
The Company has the ability and intent to hold these securities until a recovery in the auction process or other liquidity event occurs. Based on the Company’s current cash position, expected operating cash flows and the Company’s other sources of cash, the Company does not believe that it is more likely than not that it will be required to sell the securities before a recovery in the auction process or other liquidity event occurs. Additionally, the Company believes that the present value of expected future cash flows consisting of interest payments and the return of principal is sufficient to recover the amortized cost basis of the securities and expects to collect these cash flows. Therefore, the Company does not believe that the decline in value of its auction rate securities is other than temporary, or that any portion of the temporary decline is the result of a credit loss.
Restricted Investment
NetScout had a restricted investment account related to a deferred compensation plan which was liquidated during the fiscal year ended March 31, 2011. As of March 31, 2010, the balance of $988 thousand was included in prepaid and other current assets. As of March 31, 2010, there were unrealized gains of $51 thousand recorded as accumulated other comprehensive income (loss) related to this investment.
4. Fair Value Measurements
The Company follows the authoritative guidance for fair value measurements of its financial assets and financial liabilities.
The guidance clarifies the definition of fair value as an exit price representing the amount that would be received to sell an asset or paid to transfer a liability in an orderly transaction between market participants. As such, fair value is a market-based measurement that should be determined based on assumptions that market participants would use in pricing an asset or liability. The following summarizes the three-tier value hierarchy, which prioritizes, in descending order, the inputs used in measuring fair value as follows:
| Level I – | Observable inputs for identical securities such as quoted prices in active markets, |
| Level II – | Inputs other than the quoted prices in active markets that are observable either directly or indirectly, and |
| Level III – | Unobservable inputs in which there is little or no market data, which requires the Company to develop its own assumptions. |
F-14
Table of Contents
NetScout Systems, Inc.
Notes to Consolidated Financial Statements—(Continued)
4. Fair Value Measurements (Continued)
This hierarchy requires the Company to use observable market data, when available, and to minimize the use of unobservable inputs when determining fair value. On a recurring basis, the Company measures certain financial assets and liabilities at fair value, including marketable securities and derivative financial instruments.
The Company’s Level I investments are classified as such because they are valued using quoted market prices or alternative pricing sources with reasonable levels of price transparency. The Company’s Level II investments are classified as such because fair value is being calculated using data from similar but not identical issues, or a discounted cash flow model using the contractual interest rate as compared to the underlying interest yield curve. The Company’s short-term auction rate securities were also classified as Level II since the amount which was redeemed is based upon a redemption notice for an inactive market. The Company’s long-term auction rate securities are classified as Level III of the fair value hierarchy due to the limited market data for pricing these securities and the subjective factors considered to create a liquidity discount. For further information on the Company’s auction rate securities refer to Note 3. The Company’s derivative financial instruments consist of forward foreign exchange contracts and are classified as Level II because the fair values of these derivatives are determined using models based on market observable inputs, including spot prices for foreign currencies and credit derivatives, as well as an interest rate factor. For further information on the Company’s derivative instruments refer to Note 9.
The following table summarizes the valuation of the Company’s financial assets and liabilities by the above categories as of March 31, 2011 (in thousands):
| Total Fair Value |
Level I | Level II | Level III | |||||||||||||
| ASSETS: |
||||||||||||||||
| Cash and cash equivalents |
$ | 67,168 | $ | 67,168 | $ | — | $ | — | ||||||||
| U.S. government and municipal obligations |
95,388 | 95,388 | — | — | ||||||||||||
| Commercial paper |
24,110 | — | 24,110 | — | ||||||||||||
| Corporate bonds |
15,060 | 15,060 | — | — | ||||||||||||
| Certificate of deposits |
5,263 | — | 5,263 | — | ||||||||||||
| Auction rate securities |
21,489 | — | 4,007 | 17,482 | ||||||||||||
| Derivative financial instruments |
158 | — | 158 | — | ||||||||||||
| $ | 228,636 | $ | 177,616 | $ | 33,538 | $ | 17,482 | |||||||||
| LIABILITIES: |
||||||||||||||||
| Derivative financial instruments |
$ | 92 | $ | — | $ | 92 | $ | — | ||||||||
| $ | 92 | $ | — | $ | 92 | $ | — | |||||||||
F-15
Table of Contents
NetScout Systems, Inc.
Notes to Consolidated Financial Statements—(Continued)
4. Fair Value Measurements (Continued)
The following table provides a reconciliation of assets classified as Level III measured at fair value using significant unobservable inputs for the years ended March 31, 2011 and 2010 (in thousands):
| March 31, | ||||||||
| 2011 | 2010 | |||||||
| Balance at beginning of period |
$ | 28,475 | $ | 29,528 | ||||
| Change in accrued interest receivable |
(8 | ) | (112 | ) | ||||
| Change in valuation |
600 | (364 | ) | |||||
| Redemptions |
(8,600 | ) | (650 | ) | ||||
| Transfers in and/or out of Level III |
(4,007 | ) | — | |||||
| Reversal of temporary loss on redeemed securities |
1,022 | 73 | ||||||
| Balance at end of period |
$ | 17,482 | $ | 28,475 | ||||
The amount reclassified to Level II during the year ended March 31, 2011 represents an auction rate security holding that was redeemed in April 2011.
5. Inventories
Inventories are stated at the lower of actual cost or net realizable value. Cost is determined by using the FIFO method. Inventories consist of the following (in thousands):
| March 31, | ||||||||
| 2011 | 2010 | |||||||
| Raw materials |
$ | 4,548 | $ | 5,184 | ||||
| Work in process |
27 | 269 | ||||||
| Finished goods |
4,350 | 3,728 | ||||||
| $ | 8,925 | $ | 9,181 | |||||
6. Fixed Assets
Fixed assets consist of the following (in thousands):
| Estimated Useful Life In Years |
March 31, | |||||||||||
| 2011 | 2010 | |||||||||||
| Furniture and fixtures |
3-7 | $ | 2,442 | $ | 3,149 | |||||||
| Computer equipment and internal use software |
3-5 | 38,690 | 35,081 | |||||||||
| Demonstration and spare part units |
2 | 3,517 | 3,966 | |||||||||
| Leasehold improvements |
4-12 | 6,242 | 4,941 | |||||||||
| 50,891 | 47,137 | |||||||||||
| Less – accumulated depreciation |
(37,424 | ) | (34,364 | ) | ||||||||
| $ | 13,467 | $ | 12,773 | |||||||||
Depreciation expense on fixed assets for the years ended March 31, 2011, 2010 and 2009 was $7.8 million, $8.3 million and $7.8 million, respectively.
F-16
Table of Contents
NetScout Systems, Inc.
Notes to Consolidated Financial Statements—(Continued)
7. Goodwill & Acquired Intangible Assets
Goodwill
The carrying amount of goodwill was $128.2 million as of March 31, 2011 and 2010. The Company’s goodwill resulted from the acquisition of Network General in November 2007, the acquisition of substantially all of the assets of Quantiva, Inc. in April 2005 and the acquisition of NextPoint Networks, Inc. in July 2000.
Acquired Intangible Assets
The net carrying amounts of acquired intangible assets were $47.7 million and $53.6 million as of March 31, 2011 and 2010, respectively. Intangible assets acquired in a business combination are recorded under the purchase method of accounting at their estimated fair values at the date of acquisition. The Company amortizes acquired intangible assets over their estimated useful lives on a straight-line basis, except for the acquired trade name, which has an indefinite life and thus is not amortized. The carrying value of the indefinite lived trade name will be evaluated for potential impairment annually or more frequently if events or changes in circumstances indicate that the asset might be impaired.
Acquired intangible assets consist of the following as of March 31, 2011 (in thousands):
| Cost | Accumulated Amortization |
Net | ||||||||||
| Acquired software |
$ | 19,900 | $ | (13,598 | ) | $ | 6,302 | |||||
| Customer relationships |
29,200 | (6,437 | ) | 22,763 | ||||||||
| Indefinite lived trade name |
18,600 | — | 18,600 | |||||||||
| Net beneficial leases |
336 | (315 | ) | 21 | ||||||||
| $ | 68,036 | $ | (20,350 | ) | $ | 47,686 | ||||||
Acquired intangible assets consist of the following as of March 31, 2010 (in thousands):
| Cost | Accumulated Amortization |
Net | ||||||||||
| Acquired software |
$ | 19,900 | $ | (9,618 | ) | $ | 10,282 | |||||
| Customer relationships |
29,200 | (4,553 | ) | 24,647 | ||||||||
| Indefinite lived trade name |
18,600 | — | 18,600 | |||||||||
| Net beneficial leases |
336 | (292 | ) | 44 | ||||||||
| $ | 68,036 | $ | (14,463 | ) | $ | 53,573 | ||||||
Amortization of acquired software included as cost of product revenue was $4.0 million for the fiscal years ended March 31, 2011, 2010 and 2009. Amortization of other acquired intangible assets included as operating expense was $1.9 million, $2.1 million and $2.0 million for the fiscal years ended March 31, 2011, 2010 and 2009, respectively.
F-17
Table of Contents
NetScout Systems, Inc.
Notes to Consolidated Financial Statements—(Continued)
7. Goodwill & Acquired Intangible Assets (Continued)
The following is the expected future amortization expense as of March 31, 2011 for the years ended March 31 (in thousands):
| 2012 |
$ | 5,885 | ||
| 2013 |
4,206 | |||
| 2014 |
1,884 | |||
| 2015 |
1,884 | |||
| 2016 |
1,884 | |||
| Thereafter |
13,343 | |||
| Total |
$ | 29,086 | ||
The weighted average useful life of acquired intangible assets is 11 years.
8. Capitalized Software Development Costs
Net capitalized software development costs for NetScout’s nGenius Service Delivery Manager product totaled $255 thousand and $408 thousand at March 31, 2011 and 2010, respectively. This product was released on June 29, 2010, and is being amortized on a straight-line basis over two years. Amortization included as cost of product revenue related to this product was $153 thousand for the fiscal year ended March 31, 2011.
9. Derivative Instruments and Hedging Activities
NetScout operates internationally and, in the normal course of business, is exposed to fluctuations in foreign currency exchange rates. The exposures result from costs that are denominated in currencies other than the U.S. dollar, primarily the Euro, British Pound, Canadian Dollar, and Indian Rupee. During the year ended March 31, 2010, the Company began managing its foreign cash flow risk by hedging forecasted cash flows for operating expenses denominated in foreign currencies for up to twelve months, within specified guidelines through the use of forward contracts. The Company enters into foreign currency exchange contracts to hedge cash flow exposures from costs that are denominated in currencies other than the U.S. dollar. These hedges are designated as cash flow hedges at inception.
All of the Company’s derivative instruments are utilized for risk management purposes, and the Company does not use derivatives for speculative trading purposes. As of March 31, 2011 and 2010, the Company had open contracts with notional amounts totaling $10.9 million and $9.4 million, respectively. These contracts will mature over the next twelve months and are expected to impact earnings on or before maturity.
The location and amounts of derivative fair values on the consolidated balance sheets as of March 31, 2011 and 2010 were as follows (in thousands):
| Balance
Sheet Location |
Asset Derivatives | Liability Derivatives | ||||||||||||||||||
| March 31, | March 31, | March 31, | March 31, | |||||||||||||||||
| 2011 | 2010 | 2011 | 2010 | |||||||||||||||||
| Derivatives Designated as Hedging Instruments: |
||||||||||||||||||||
| Forward contracts |
|
Other current assets / accrued other liabilities |
|
$ | 158 | $ | 94 | $ | 92 | $ | 359 | |||||||||
F-18
Table of Contents
NetScout Systems, Inc.
Notes to Consolidated Financial Statements—(Continued)
9. Derivative Instruments and Hedging Activities (Continued)
The following table provides the effect foreign exchange forward contracts had on other comprehensive income (loss), or OCI, and results of operations as of March 31, 2011 and 2010 (in thousands):
| Derivatives in Cash Flow Hedging Relationships |
Effective Portion | Ineffective Portion | ||||||||||||||||||||||||||||||
| Gain (Loss) Recognized in OCI on Derivative (a) |
Gain (Loss) Reclassified from Accumulated OCI into Income (b) |
Gain (Loss) Recognized in Income (Amount Excluded from Effectiveness Testing) (c) |
||||||||||||||||||||||||||||||
| March 31, | March 31, | March 31, | March 31, | March 31, | March 31, | |||||||||||||||||||||||||||
| 2011 | 2010 | Location | 2011 | 2010 | Location | 2011 | 2010 | |||||||||||||||||||||||||
| Forward contracts |
$ | 3 | $ | (474 | ) | |
Research and development |
|
$ | (13 | ) | $ | (6 | ) | |
Research and development |
|
$ | (43 | ) | $ | (3 | ) | |||||||||
| |
Sales and marketing |
|
349 | (209 | ) | |
Sales and marketing |
|
9 | 1 | ||||||||||||||||||||||
| $ | 3 | $ | (474 | ) | $ | 336 | $ | (215 | ) | $ | (34 | ) | $ | (2 | ) | |||||||||||||||||
| (a) | The amount represents the change in fair value of derivative contracts due to changes in spot rates. |
| (b) | The amount represents reclassification from other comprehensive income to earnings that occurs when the hedged item affects earnings. |
| (c) | The amount represents the change in fair value of derivative contracts due to changes in the difference between the spot price and forward price that is excluded from the assessment of hedge effectiveness and therefore recognized in earnings. No amounts were recognized in income due to ineffectiveness. No gains or losses were reclassified as a result of discontinuance of cash flow hedges. |
10. Long-term Debt
In December 2007, the Company entered into a credit facility with a syndicate of lenders led by KeyBank National Association, or KeyBank, providing a term loan of $100 million and a $10 million revolving credit facility, or the Credit Facility, pursuant to a Credit Agreement, dated as of December 21, 2007, as amended, by and among the Company, KeyBank and the other parties thereto, or the Credit Agreement. The proceeds of the $100 million term loan were used to redeem all of the Company’s outstanding senior secured floating rate notes issued in connection with the acquisition of Network General on November 1, 2007. No amounts were outstanding under the revolving credit facility as of March 31, 2011.
At the Company’s election, revolving loans and the term loan under the Credit Agreement bear interest at either (1) a rate per annum equal to the greater of KeyBank’s prime rate or 0.5% in excess of the federal funds effective rate, or the Alternative Base Rate, or (2) the one-, two-, three-, or six-month per annum LIBOR, as selected by the Company, multiplied by the statutory reserve adjustment, collectively the Eurodollar Rate, in each case plus an applicable margin. The applicable margin varies depending on the Company’s consolidated leverage ratio ranging from 175 basis points for Alternative Base Rate loans and 300 basis points for Eurodollar Rate loans if the Company’s consolidated leverage ratio is 2.50 to 1.00 or higher, down to 75 basis points for Alternative Base Rate loans and 200 basis points for Eurodollar Rate loans if the Company’s consolidated leverage ratio is 1.00 to 1.00 or less. The consolidated leverage ratio is the ratio of funded indebtedness to adjusted earnings before interest, taxes, depreciation and amortization (EBITDA). At March 31, 2010, the term loan incurred interest at 2.688%. As of March 31, 2011, the applicable interest rate on the term loan was 2.500%, and the Company expects this to be the rate in effect until September 30, 2011.
F-19
Table of Contents
NetScout Systems, Inc.
Notes to Consolidated Financial Statements—(Continued)
10. Long-term Debt (Continued)
Payments of principal on the term loan commenced on March 31, 2008, and will be made in regular quarterly installments. As of March 31, 2011, the aggregate annual repayment amounts are as follows for the years ended March 31 (in thousands):
| 2012 |
$ | 15,000 | ||
| 2013 |
53,106 | |||
| Total |
$ | 68,106 | ||
The Credit Agreement contains financial covenants that stipulate a maximum leverage ratio of 3.00 to 1.00 and a minimum fixed-charge coverage ratio of 1.25 to 1.00. As of March 31, 2011, the Company was in compliance with all covenants. Substantially all of the Company’s assets serve as collateral under the Credit Agreement. Subject to certain exceptions, the Credit Agreement contains provisions for mandatory prepayments including from (a) 100% of the net proceeds from certain asset sales by the Company and its subsidiaries, (b) 100% of the net proceeds from the issuance of debt, (c) annually, subject to the Company’s leverage ratio, either 25% or 50% of the annual excess cash flow of the Company and its subsidiaries as defined in the Credit Agreement, (d) 50% of the net proceeds from the issuance of equity by the Company and its subsidiaries and (e) 100% of the net proceeds from insurance recovery and condemnation events of the Company and its subsidiaries. The Company made a $3.1 million payment during the second quarter of fiscal year 2010 as a result of the annual excess cash flow calculation based on the year ended March 31, 2009 financial results. An excess cash flow payment was not triggered for the years ended March 31, 2011 and 2010. The Company may also prepay loans under the Credit Agreement, including the term loan, at any time, without penalty, subject to certain notice requirements.
11. Net Income Per Share
Calculations of the basic and diluted net income per share and potential common shares are as follows (in thousands, except share and per share data):
| Year Ended March 31, | ||||||||||||
| 2011 | 2010 | 2009 | ||||||||||
| Basic: |
||||||||||||
| Net income |
$ | 37,265 | $ | 27,917 | $ | 20,048 | ||||||
| Weighted average common shares outstanding |
42,058,562 | 40,690,854 | 39,351,294 | |||||||||
| Basic net income per share |
$ | 0.89 | $ | 0.69 | $ | 0.51 | ||||||
| Diluted: |
||||||||||||
| Net income |
$ | 37,265 | $ | 27,917 | $ | 20,048 | ||||||
| Weighted average common shares outstanding |
42,058,562 | 40,690,854 | 39,351,294 | |||||||||
| Weighted average stock options |
320,277 | 710,763 | 1,026,331 | |||||||||
| Weighted average restricted stock units |
594,527 | 513,402 | 547,711 | |||||||||
| Diluted weighted average shares |
42,973,366 | 41,915,019 | 40,925,336 | |||||||||
| Diluted net income per share |
$ | 0.87 | $ | 0.67 | $ | 0.49 | ||||||
F-20
Table of Contents
NetScout Systems, Inc.
Notes to Consolidated Financial Statements—(Continued)
11. Net Income Per Share (Continued)
The following table sets forth options and restricted stock units excluded from the calculation of diluted net income per share, since their inclusion would be antidilutive. This is due to the exercise prices exceeding the average market price of the Company’s common stock during the years ended March 31, 2011, 2010 and 2009.
| Year Ended March 31, | ||||||||||||
| 2011 | 2010 | 2009 | ||||||||||
| Stock options |
14,301 | 200,497 | 223,719 | |||||||||
| Restricted stock units |
5,630 | 5,697 | 30,903 | |||||||||
12. Treasury Stock
On September 17, 2001, the Company announced an open market stock repurchase program to purchase up to one million shares of outstanding Company common stock, subject to market conditions and other factors. Any purchases under the Company’s stock repurchase program may be made from time to time without prior notice. On July 26, 2006, the Company announced that it had expanded the existing open market stock repurchase program to enable the Company to purchase up to an additional three million shares of the Company’s outstanding common stock, bringing the total number of shares authorized for repurchase to four million shares. Through March 31, 2011, the Company had repurchased a total of 486,794 shares of common stock through the open market stock repurchase program. The Company did not repurchase any shares under the program during the fiscal years ended March 31, 2011, 2010 and 2009, respectively.
In connection with the vesting and release of the restriction on previously vested shares of restricted stock, the Company repurchased 164,074 shares for $3.7 million and 188,567 shares for $2.8 million related to minimum statutory tax withholding requirements on these restricted stock units during the fiscal years ended March 31, 2011 and 2010. The Company did not have any such repurchases during the fiscal year ended March 31, 2009. These repurchase transactions do not fall under the repurchase program described above, and therefore do not reduce the amount that is available for repurchase under that program.
13. Stock Plans
1999 Stock Option and Incentive Plan
In April 1999, NetScout adopted the 1999 Stock Option and Incentive Plan (1999 Stock Option Plan). The 1999 Stock Option Plan, which was replaced by the 2007 Equity Incentive Plan effective September 12, 2007, provided for the grant of share-based awards to employees, officers and directors, consultants or advisors. Under the 1999 Stock Option Plan, NetScout could grant options that were intended to qualify as incentive stock options, options not intended to qualify as incentive stock options, restricted stock and other share-based awards. Incentive stock options could be granted only to employees of NetScout. As of March 31, 2011, options to purchase an aggregate of 325,519 shares of common stock at a weighted average exercise price of $6.48 per share were outstanding under the 1999 Stock Option Plan. No additional grants can be made under the 1999 Stock Option Plan.
2007 Equity Incentive Plan
In September 2007, the 2007 Equity Incentive Plan (2007 Plan), replaced the 1999 Stock Option Plan. The 2007 Plan permits the granting of stock options, restricted stock and restricted stock units, collectively referred to as “share-based awards.” Periodically, the Company grants share-based awards to employees and officers of the
F-21
Table of Contents
NetScout Systems, Inc.
Notes to Consolidated Financial Statements—(Continued)
13. Stock Plans (Continued)
Company and its subsidiaries. The Company accounts for these share-based awards in accordance with GAAP, which requires the measurement and recognition of compensation expense based on estimated fair values for all share-based payment awards made to its employees and directors. Share-based award grants are generally measured at fair value on the date of grant based on the number of shares granted and the quoted price of the Company’s common stock. Such value is recognized as a cost of revenue or an operating expense over the corresponding vesting period. A total of 5,000,000 equity awards are reserved for issuance under the 2007 Plan. As of March 31, 2011, an aggregate of 1,411,251 equity awards were outstanding under the 2007 Plan.
The 2007 Plan is administered by the Compensation Committee of the Board of Directors. For administrative convenience, the Board of Directors established the Equity Compensation Committee, which was responsible until April 29, 2009 for granting share-based awards to employees and consultants of the Company who are not directors or executive officers of the Company. The Equity Compensation Committee operated under guidelines established by the Board of Directors. The Equity Compensation Committee had the authority to select the employees and consultants to whom awards are granted (except for directors and executive officers) and determine the terms of each award, including the number of shares of common stock subject to the award. On April 29, 2009, the activities previously undertaken by the Equity Compensation Committee reverted to the Compensation Committee.
Share-based awards generally vest over four years. The exercise price of incentive stock options shall not be less than 100% of the fair market value of the common stock at the date of grant (110% for incentive stock options granted to holders of more than 10% of the voting stock of NetScout). The term of options granted cannot exceed ten years (five years for incentive stock options granted to holders of more than 10% of the voting stock of NetScout).
Based on historical experience, the Company assumed an annualized forfeiture rate of 0% for awards granted to its directors during fiscal years 2011, 2010 and 2009, and an annualized forfeiture rate of 10% for awards granted to its senior executives and remaining employees during fiscal years 2011, 2010 and 2009.
The following is a summary of share-based compensation expense for the years ended March 31, 2011, 2010 and 2009 (in thousands):
| Year Ended March 31, | ||||||||||||
| 2011 | 2010 | 2009 | ||||||||||
| Cost of product revenue |
$ | 134 | $ | 129 | $ | 119 | ||||||
| Cost of service revenue |
218 | 237 | 217 | |||||||||
| Research and development |
1,651 | 1,364 | 1,278 | |||||||||
| Sales and marketing |
2,527 | 2,299 | 2,232 | |||||||||
| General and administrative |
1,909 | 1,427 | 1,276 | |||||||||
| $ | 6,439 | $ | 5,456 | $ | 5,122 | |||||||
F-22
Table of Contents
NetScout Systems, Inc.
Notes to Consolidated Financial Statements—(Continued)
13. Stock Plans (Continued)
Transactions under the 1999 Stock Option Plan and the 2007 Equity Incentive Plan during the fiscal year ended March 31, 2011 are summarized as follows:
| Stock Options | Restricted Stock Units | |||||||||||||||
| Number of Shares |
Weighted Average Exercise Price |
Number of Awards |
Weighted Average Fair Value |
|||||||||||||
| Outstanding — March 31, 2008 |
2,715,961 | $ | 6.49 | 2,287,016 | $ | 9.11 | ||||||||||
| Granted |
— | — | 263,102 | 11.65 | ||||||||||||
| Exercised (Options)/Issued (RSU’s) |
(819,580 | ) | 5.58 | (621,445 | ) | 8.84 | ||||||||||
| Canceled |
(3,450 | ) | 6.22 | (176,972 | ) | 9.21 | ||||||||||
| Outstanding — March 31, 2009 |
1,892,931 | 6.89 | 1,751,701 | 9.58 | ||||||||||||
| Granted |
— | — | 120,279 | 11.19 | ||||||||||||
| Exercised (Options)/Issued (RSU’s) |
(1,026,771 | ) | 5.64 | (651,666 | ) | 9.21 | ||||||||||
| Canceled |
(52,419 | ) | 20.50 | (107,938 | ) | 9.64 | ||||||||||
| Outstanding — March 31, 2010 |
813,741 | 7.60 | 1,112,376 | 9.96 | ||||||||||||
| Granted |
— | — | 928,596 | 13.67 | ||||||||||||
| Exercised (Options)/Issued (RSU’s) |
(450,432 | ) | 7.50 | (504,393 | ) | 10.81 | ||||||||||
| Canceled |
(37,790 | ) | 19.42 | (117,720 | ) | 9.87 | ||||||||||
| Outstanding — March 31, 2011 |
325,519 | $ | 6.35 | 1,418,859 | $ | 12.35 | ||||||||||
As of March 31, 2011, there were 2,156,693 shares of common stock available for grant under the 2007 Plan.
Shares issued upon exercise of options are issued from new shares of the Company. The Company does not currently expect to repurchase shares from any source to satisfy its obligations under the 2007 Plan.
The aggregate intrinsic values of stock options and restricted stock units as of March 31, 2011, 2010 and 2009 were as follows (in thousands):
| Year Ended March 31, | ||||||||||||
| 2011 | 2010 | 2009 | ||||||||||
| Options: |
||||||||||||
| Outstanding(1) |
$ | 6,825 | $ | 6,084 | $ | 3,177 | ||||||
| Exercisable(1) |
$ | 6,825 | $ | 6,084 | $ | 3,158 | ||||||
| Restricted Stock Units(2) |
$ | 38,763 | $ | 16,452 | $ | 12,542 | ||||||
| (1) | The aggregate intrinsic values in this table were calculated based on the positive difference between the closing market value of the Company’s common stock on March 31, 2011 ($27.32), 2010 ($14.79) and 2009 ($7.16) and the exercise price of the underlying options. |
| (2) | The aggregate intrinsic values in this table were calculated based on the closing market value of the Company’s common stock on March 31, 2011 ($27.32), 2010 ($14.79) and 2009 ($7.16) for the underlying restricted stock units. |
As of March 31, 2011, there was no unrecognized compensation cost related to stock options.
F-23
Table of Contents
NetScout Systems, Inc.
Notes to Consolidated Financial Statements—(Continued)
13. Stock Plans (Continued)
As of March 31, 2011, the total unrecognized compensation cost related to restricted stock unit awards was $11.0 million, which is expected to be amortized over a weighted-average period of 1.7 years.
14. Retirement Plan
In 1996, NetScout established an employee savings plan, which is intended to qualify under Section 401(k) of the Internal Revenue Code of 1986, as amended. NetScout matches 50% of the employee’s contribution up to 6% of the employee’s salary. NetScout contributions vest at a rate of 25% per year of service. NetScout made matching contributions of $1.8 million, $1.9 million and $1.7 million to the plan for the years ended March 31, 2011, 2010 and 2009, respectively.
15. Income Taxes
Income before income tax expense consisted of the following (in thousands):
| Year Ended March 31, | ||||||||||||
| 2011 | 2010 | 2009 | ||||||||||
| Domestic |
$ | 53,008 | $ | 40,371 | $ | 28,284 | ||||||
| Foreign |
3,285 | 2,700 | 2,757 | |||||||||
| $ | 56,293 | $ | 43,071 | $ | 31,041 | |||||||
The components of the income tax expense are as follows (in thousands):
| Year Ended March 31, | ||||||||||||
| 2011 | 2010 | 2009 | ||||||||||
| Current income tax expense: |
||||||||||||
| Federal |
$ | 13,197 | $ | 8,499 | $ | 369 | ||||||
| State |
1,268 | 611 | 232 | |||||||||
| Foreign |
1,104 | 856 | 1,101 | |||||||||
| 15,569 | 9,966 | 1,702 | ||||||||||
| Deferred income tax expense (benefit): |
||||||||||||
| Federal |
2,967 | 4,825 | 8,606 | |||||||||
| State |
492 | 363 | 685 | |||||||||
| 3,459 | 5,188 | 9,291 | ||||||||||
| $ | 19,028 | $ | 15,154 | $ | 10,993 | |||||||
F-24
Table of Contents
NetScout Systems, Inc.
Notes to Consolidated Financial Statements—(Continued)
15. Income Taxes (Continued)
The income tax expense computed using the federal statutory income tax rate differs from NetScout’s effective tax rate primarily due to the following:
| Year Ended March 31, | ||||||||||||
| 2011 | 2010 | 2009 | ||||||||||
| Statutory U.S. federal tax rate |
35.0 | % | 35.0 | % | 35.0 | % | ||||||
| State taxes, net of federal tax effect |
3.0 | 3.1 | 3.1 | |||||||||
| Tax-exempt interest |
(0.1 | ) | (0.2 | ) | (1.3 | ) | ||||||
| Research and development tax credits |
(2.1 | ) | (1.7 | ) | (3.4 | ) | ||||||
| Tax rate differential of foreign operations |
(0.2 | ) | (0.2 | ) | (0.4 | ) | ||||||
| Meals and entertainment |
0.6 | 0.7 | 1.2 | |||||||||
| Domestic production activities deduction |
(3.0 | ) | (1.7 | ) | (0.2 | ) | ||||||
| Other |
0.6 | 0.2 | 1.4 | |||||||||
| 33.8 | % | 35.2 | % | 35.4 | % | |||||||
Deferred tax assets and liabilities are recognized based on the anticipated future tax consequences, attributable to differences between financial statement carrying amounts of assets and liabilities and their respective tax bases. Deferred tax assets and liabilities are measured using enacted tax rates in effect for the year in which the differences are expected to reverse. A valuation allowance is established if, based on management’s review of both positive and negative evidence, it is more likely than not that all or a portion of the deferred tax asset will not be realized. A valuation allowance has been established for federal foreign tax credits related to the Network General acquisition, which the Company believes do not meet the “more likely than not” criteria established under generally accepted accounting standards for income taxes. If it is later determined the Company is able to use all or a portion of the deferred tax assets for which a valuation allowance has been established, then the Company may be required to recognize these deferred tax assets through a charge to income tax expense in the period such determination is made. Deferred income taxes were not provided on approximately $11.9 million of undistributed earnings of certain foreign subsidiaries as of March 31, 2011 because such undistributed foreign earnings are to be indefinitely reinvested outside of the United States.
At March 31, 2011, the Company had United States federal net operating loss carryforwards of $49.8 million. At March 31, 2011, the Company had state net operating loss carryforwards of $68.5 million. At March 31, 2011, the Company had gross federal and state research and development tax carryforwards of $2.2 million. The net operating loss and credit carryforwards will expire at various dates beginning in 2023 and extending through 2027, if not utilized. Utilization of the net operating losses and credits are subject to an annual limitation due to the ownership change limitations provided by the Internal Revenue Code of 1986, as amended, and similar state tax provisions.
F-25
Table of Contents
NetScout Systems, Inc.
Notes to Consolidated Financial Statements—(Continued)
15. Income Taxes (Continued)
The components of net deferred tax assets are as follows (in thousands):
| Year Ended March 31, | ||||||||
| 2011 | 2010 | |||||||
| Assets: |
||||||||
| Accrued expenses |
$ | 3,475 | $ | 2,923 | ||||
| Depreciation |
1,639 | 619 | ||||||
| Deferred revenue |
6,750 | 6,798 | ||||||
| Reserves |
648 | 603 | ||||||
| Net operating loss carryforwards |
20,933 | 23,504 | ||||||
| Tax credit carryforwards |
1,994 | 1,994 | ||||||
| Share-based compensation |
522 | — | ||||||
| Auction rate securities temporary impairment |
883 | 1,506 | ||||||
| Other |
434 | 160 | ||||||
| 37,278 | 38,107 | |||||||
| Liabilities: |
||||||||
| Intangible assets |
(8,479 | ) | (4,978 | ) | ||||
| Share-based compensation |
— | (120 | ) | |||||
| Valuation allowance |
(249 | ) | (249 | ) | ||||
| $ | 28,550 | $ | 32,760 | |||||
The Company files U.S. federal tax returns and files returns in various states, local and foreign jurisdictions. With respect to the U.S. federal and primary state jurisdictions, the Company is no longer subject to examinations by tax authorities for tax years before 2007, although carryforward attributes that were generated prior to 2007 may still be adjusted upon examination if they either have been or will be used in a future period. The Company also receives inquiries from various tax jurisdictions during the year, and some of those inquiries may include an audit of the tax return previously filed.
A reconciliation of the beginning and ending amount of unrecognized tax benefits for the fiscal years ended March 31, 2011 and 2010 is as follows (in thousands):
| Year Ended March 31, | ||||||||||||
| 2011 | 2010 | 2009 | ||||||||||
| Balance at April 1, |
$ | 349 | $ | 314 | $ | 135 | ||||||
| Additions based on tax positions related to the current year |
34 | 35 | 53 | |||||||||
| Additions for tax positions of prior years |
— | — | 126 | |||||||||
| Balance at March 31, |
$ | 383 | $ | 349 | $ | 314 | ||||||
The Company does not expect its unrecognized tax benefit to change significantly during the next twelve months.
Significant accounting judgments and estimates are made when determining whether it is more likely than not that the Company’s deferred income tax assets will be realized and, accordingly, do not require a valuation allowance. If these judgments and estimates prove to be materially inaccurate, a valuation allowance may be required and the Company’s financial results could be materially and adversely impacted in the future. If the
F-26
Table of Contents
NetScout Systems, Inc.
Notes to Consolidated Financial Statements—(Continued)
15. Income Taxes (Continued)
Company determines that it will not be able to realize some or all of the deferred income taxes in the future, an adjustment to the deferred income tax assets will be charged to income tax expense in the period such determination is made.
16. Commitments and Contingencies
Leases
NetScout leases office space under non-cancelable operating leases. Total rent expense under the leases was $5.6 million, $6.5 million and $6.8 million for the fiscal years ended March 31, 2011, 2010 and 2009, respectively.
As of March 31, 2011, future non-cancelable minimum lease commitments (including office space, copiers and automobiles) are as follows (in thousands):
| Year Ending March 31, |
||||
| 2012 |
$ | 3,981 | ||
| 2013 |
3,632 | |||
| 2014 |
3,390 | |||
| 2015 |
3,416 | |||
| 2016 |
3,420 | |||
| Remaining years |
19,773 | |||
| Total minimum lease payments |
$ | 37,612 | ||
Contingencies
From time to time, NetScout is subject to legal proceedings and claims in the ordinary course of business. In the opinion of management, the amount of ultimate expense with respect to any current legal proceedings and claims, if determined adversely, will not have a significant adverse effect on NetScout’s financial position or results of operations.
17. Segment and Geographic Information
The Company reports revenues and income under one reportable industry segment. The Company’s management assesses operating results on an aggregate basis to make decisions about the allocation of resources.
The Company manages its business in the following geographic areas: United States, Europe, Asia and Rest of the world. In accordance with United States export control regulations, the Company does not sell or do business with countries subject to economic sanctions and export controls.
Total revenue by geography is as follows (in thousands):
| Year Ended March 31, | ||||||||||||
| 2011 | 2010 | 2009 | ||||||||||
| United States |
$ | 211,711 | $ | 189,517 | $ | 199,737 | ||||||
| Europe |
37,921 | 35,072 | 37,618 | |||||||||
| Asia |
16,260 | 13,694 | 12,973 | |||||||||
| Rest of the world |
24,648 | 22,059 | 17,276 | |||||||||
| $ | 290,540 | $ | 260,342 | $ | 267,604 | |||||||
F-27
Table of Contents
NetScout Systems, Inc.
Notes to Consolidated Financial Statements—(Continued)
17. Segment and Geographic Information (Continued)
The United States revenue includes sales to resellers in the United States. These resellers fulfill customer orders and may subsequently ship the Company’s products to international locations. The Company reports these shipments as United States revenue since the Company ships the products to a United States location. Revenue attributable to locations outside of the United States is a result of export sales. Substantially all of the Company’s identifiable assets are located in the United States.
18. Subsequent Events
The Company has evaluated subsequent events for potential recognition or disclosure in these financial statements. No material subsequent events have occurred since March 31, 2011 that required recognition or disclosure in these financial statements.
On April 1, 2011, the Company completed the acquisition of Psytechnics, Ltd., a provider of IP voice, video and telepresence technologies that proactively assure the user experience for unified communications services. The acquisition will be accounted for under the acquisition method of accounting with the operations of Psytechnics included in the Company’s operating results from the date of acquisition.
19. Quarterly Results of Operations – Unaudited
The following table sets forth certain unaudited quarterly results of operations of NetScout for the fiscal years ended March 31, 2011 and 2010. In the opinion of management, this information has been prepared on the same basis as the audited consolidated financial statements and all necessary adjustments, consisting only of normal recurring adjustments, have been included in the amounts stated below to present fairly the quarterly information when read in conjunction with the audited consolidated financial statements and notes thereto included elsewhere in this Annual Report on Form 10-K. The quarterly operating results are not necessarily indicative of future results of operations.
| Three Months Ended | ||||||||||||||||||||||||||||||||
| (in thousands, except per share data) | ||||||||||||||||||||||||||||||||
| March 31, | Dec. 31, | Sept. 30, | June 30, | March 31, | Dec. 31, | Sept. 30, | June 30, | |||||||||||||||||||||||||
| 2011 | 2010 | 2010 | 2010 | 2010 | 2009 | 2009 | 2009 | |||||||||||||||||||||||||
| Revenue |
$ | 77,980 | $ | 76,336 | $ | 69,413 | $ | 66,811 | $ | 71,874 | $ | 70,715 | $ | 59,691 | $ | 58,062 | ||||||||||||||||
| Gross profit |
$ | 61,593 | $ | 60,244 | $ | 55,106 | $ | 52,236 | $ | 56,256 | $ | 55,310 | $ | 46,818 | $ | 45,894 | ||||||||||||||||
| Net income |
$ | 10,771 | $ | 11,101 | $ | 8,248 | $ | 7,145 | $ | 7,053 | $ | 8,541 | $ | 7,086 | $ | 5,237 | ||||||||||||||||
| Diluted net income per share |
$ | 0.25 | $ | 0.26 | $ | 0.19 | $ | 0.17 | $ | 0.17 | $ | 0.20 | $ | 0.17 | $ | 0.13 | ||||||||||||||||
F-28
Table of Contents
NetScout Systems, Inc.
Schedule II—Valuation and Qualifying Accounts
(in thousands)
| Balance at Beginning of Year |
Additions Resulting in Charges to Operations |
Charges to Other Accounts |
Deductions Due to Write-Offs |
Balance at End of Year |
||||||||||||||||
| Year ended March 31, 2009 |
||||||||||||||||||||
| Allowance for doubtful accounts |
$ | 86 | $ | 608 | $ | — | $ | (122 | ) | $ | 572 | |||||||||
| Deferred tax asset valuation allowance |
$ | 3,505 | $ | — | $ | (3,256 | )(1) | $ | — | $ | 249 | |||||||||
| Year ended March 31, 2010 |
||||||||||||||||||||
| Allowance for doubtful accounts |
$ | 572 | $ | 187 | $ | — | $ | (332 | ) | $ | 427 | |||||||||
| Deferred tax asset valuation allowance |
$ | 249 | $ | — | $ | — | $ | — | $ | 249 | ||||||||||
| Year ended March 31, 2011 |
||||||||||||||||||||
| Allowance for doubtful accounts |
$ | 427 | $ | 8 | $ | 35 | $ | (124 | ) | $ | 346 | |||||||||
| Deferred tax asset valuation allowance |
$ | 249 | $ | — | $ | — | $ | — | $ | 249 | ||||||||||
| (1) | Adjustment recorded to goodwill. |
S-1
Table of Contents
NetScout Systems, Inc
Index to Exhibits
| 3.1, 4.1 | Third Amended and Restated Certificate of Incorporation of NetScout (filed as Exhibit 3.3, 4.1 to NetScout’s Registration Statement on Form S-1 (No. 333-76843) and incorporated herein by reference). | |
| 3.2, 4.2 | Composite copy of Amended and Restated By-laws of NetScout (filed as Exhibit 3.1 to NetScout’s current Report on Form 8-K filed on January 27, 2009 and incorporated herein by reference). | |
| 4.3 | Specimen Certificate for shares of NetScout’s Common Stock (filed as Exhibit 4.3 to NetScout’s Annual Report on Form 10-K for the fiscal year ended March 31, 2001 and incorporated herein by reference). | |
| 4.4 | Stockholders Agreement, dated September 19, 2007, by and among NetScout and certain stockholders of Network General Central Corporation (filed as Exhibit 10.1 to NetScout’s Current Report on Form 8-K filed on September 25, 2007 and incorporated herein by reference). | |
| 10.1 | 1997 Stock Incentive Plan of NextPoint Networks, Inc., assumed by NetScout (filed as Exhibit 4.3 to NetScout’s Registration Statement on Form S-8 (No. 333-41880) and incorporated herein by reference).* | |
| 10.2 | 1999 Stock Option and Incentive Plan, as amended (filed as Exhibit 10.1 to NetScout’s Quarterly Report on Form 10-Q for the quarterly period ended September 30, 2001 and incorporated herein by reference).* | |
| 10.3 | Form of Incentive Stock Option Agreement – Incorporated Terms and Conditions pursuant to 1999 Stock Option and Incentive Plan, as amended (filed as Exhibit 10.1 to NetScout’s Quarterly Report on Form 10-Q for the quarterly period ended September 30, 2004 and incorporated herein by reference).* | |
| 10.4 | Form of Restricted Stock Unit Agreement with respect to the NetScout 1999 Stock Option and Incentive Plan (filed as Exhibit 10.2 to NetScout’s Quarterly Report on Form 10-Q for the quarterly period ended September 30, 2005 and incorporated herein by reference).* | |
| 10.5 | 1999 Employee Stock Purchase Plan, as amended (included as Annex A to NetScout’s Definitive Proxy Statement on Schedule 14A filed with the Securities and Exchange Commission on August 15, 2003 and incorporated herein by reference).* | |
| 10.6 | Lease between Arturo J. Gutierrez and John A. Cataldo, Trustees of Nashoba Westford Realty Trust, u/d/t dated April 27, 2000 and recorded with the Middlesex North Registry of Deeds in Book 10813, Page 38 and NetScout for Westford Technology Park West, as amended (filed as Exhibit 10.26 to NetScout’s Annual Report on Form 10-K for the fiscal year ended March 31, 2001 and incorporated herein by reference). | |
| 10.7 | 2000 Stock Incentive Plan of NextPoint Networks, Inc., assumed by NetScout (filed as Exhibit 4.4 to NetScout’s Registration Statement on Form S-8 (No. 333-41880) and incorporated herein by reference).* | |
| 10.8 | Form of Indemnification Agreement (filed as Exhibit 10.2 to NetScout’s Current Report on Form 8-K filed on September 19, 2006 and incorporated herein by reference).* | |
| 10.9 | Summary of Non-Employee Director Compensation (filed as exhibit 10.1 to NetScout’s Quarterly Report on Form 10-Q for the quarterly period ended September 30, 2006 and incorporated herein by reference).* | |
| 10.10 | Agreement Relating to Employment, dated January 3, 2007, by and between NetScout and Anil K. Singhal (filed as Exhibit 10.2 to NetScout’s Current Report on Form 8-K filed on January 5, 2007 and incorporated herein by reference).* | |
Table of Contents
| 10.11 | Amendment No. 1 to Agreement Relating to Employment, dated February 2, 2007, by and between the Company and Anil K. Singhal (filed as exhibit 10.1 to NetScout’s Quarterly Report on Form 10-Q for the quarterly period ended December 31, 2006 and incorporated herein by reference).* | |
| 10.12 | Amendment No. 2 to Agreement Relating to Employment, dated December 22, 2008, by and between the Company and Anil K. Singhal (filed as exhibit 10.1 to NetScout’s Quarterly Report on Form 10-Q for the quarterly period ended December 31, 2008 and incorporated herein by reference).* | |
| 10.13 | NetScout 2007 Equity Incentive Plan. (filed as Exhibit 10.1 to NetScout’s Quarterly Report on Form 10-Q for the quarterly period ended September 30, 2007 and incorporated herein by reference).* | |
| 10.14 | NetScout Form of Restricted Stock Unit Agreement with respect to the NetScout 2007 Equity Incentive Plan (filed as Exhibit 99.2 to NetScout’s Registration Statement on Form S-8 (No. 333-148364) and incorporated herein by reference).* | |
| 10.15 | Credit and Security Agreement, dated as of December 21, 2007, by and among, NetScout, KeyBank National Association, as lead arranger, sole book runner and administrative agent, Silicon Valley Bank and Wells Fargo Foothill, LLC, as co-syndication agents, and Comerica Bank, as documentation agent, and the Lenders party thereto (filed as Exhibit 10.1 to NetScout’s Current Report on Form 8-K filed on December 31, 2007 and incorporated herein by reference). | |
| 10.16 | Form of Severance Agreement for Executive Officers (filed as Exhibit 10.17 to NetScout’s Annual Report on Form 10-K for the fiscal year ended March 31, 2009 and incorporated herein by reference).* | |
| 10.17 | Form of Severance Agreement for Executive Officers (change of control only) (filed as Exhibit 10.18 to NetScout’s Annual Report on Form 10-K for the fiscal year ended March 31, 2009 and incorporated herein by reference).* | |
| 10.18 | First Amendment Agreement, dated as of December 4, 2009, to the Credit and Security Agreement, dated as of December 21, 2007, by and among NetScout, Keybank National Association, as lead arranger, sole book runner and administrative agent, Silicon Valley Bank and Wells Fargo Foothill, LLC, as co-syndication agents, and Comerica Bank, as documentation agent, and the Lenders party thereto (filed as Exhibit 10.1 to NetScout’s Quarterly Report on Form 10-Q for the quarterly period ended December 31, 2009 and incorporated herein by reference). | |
| 10.19 | Amendment Agreement, dated August 12, 2010, to that certain Lease, dated August 17, 2000, as amended, between the Company and Westford West I Limited Partnership, as successor to Arturo J. Gutierrez and John A. Cataldo, Trustees of Nashoba Westford Realty Trust, u/d/t dated April 27, 2000 (filed as Exhibit 10.1 to NetScout’s Quarterly Report on Form 10-Q for the quarterly period ended September 30, 2010 and incorporated herein by reference). | |
| 21 | Subsidiaries of NetScout (filed herewith). | |
| 23 | Consent of PricewaterhouseCoopers LLP (filed herewith). | |
| 31.1 | Certification Pursuant to Section 302 of the Sarbanes-Oxley Act of 2002 (filed herewith). | |
| 31.2 | Certification Pursuant to Section 302 of the Sarbanes-Oxley Act of 2002 (filed herewith). | |
| 32.1 | Certification Pursuant to Section 906 of the Sarbanes–Oxley Act of 2002 (furnished herewith). | |
| 32.2 | Certification Pursuant to Section 906 of the Sarbanes–Oxley Act of 2002 (furnished herewith). | |
| * | Indicates a management contract or compensatory plan or arrangement. |