Attached files
| file | filename |
|---|---|
| EX-99.1 - EXHIBIT 99.1 - PHILLIPS EDISON GROCERY CENTER REIT II, INC. | reitiiq12018exhibit991.htm |
| EX-32.2 - EXHIBIT 32.2 - PHILLIPS EDISON GROCERY CENTER REIT II, INC. | reitiiq12018exhibit322.htm |
| EX-32.1 - EXHIBIT 32.1 - PHILLIPS EDISON GROCERY CENTER REIT II, INC. | reitiiq12018exhibit321.htm |
| EX-31.2 - EXHIBIT 31.2 - PHILLIPS EDISON GROCERY CENTER REIT II, INC. | reitiiq12018exhibit312.htm |
| EX-31.1 - EXHIBIT 31.1 - PHILLIPS EDISON GROCERY CENTER REIT II, INC. | reitiiq12018exhibit311.htm |
UNITED STATES SECURITIES AND EXCHANGE COMMISSION
Washington, D.C. 20549
FORM 10-Q
(Mark One)
þ QUARTERLY REPORT PURSUANT TO SECTION 13 OR 15(d) OF THE SECURITIES EXCHANGE ACT OF 1934
For the quarterly period ended March 31, 2018
OR
¨ TRANSITION REPORT PURSUANT TO SECTION 13 OR 15(d) OF THE SECURITIES EXCHANGE ACT OF 1934
For the transition period from to
Commission file number 000-55438

PHILLIPS EDISON GROCERY CENTER REIT II, INC.
(Exact Name of Registrant as Specified in Its Charter)
Maryland | 61-1714451 |
(State or Other Jurisdiction of Incorporation or Organization) | (I.R.S. Employer Identification No.) |
11501 Northlake Drive Cincinnati, Ohio | 45249 |
(Address of Principal Executive Offices) | (Zip Code) |
(513) 554-1110
(Registrant’s Telephone Number, Including Area Code)
Indicate by check mark whether the registrant: (1) has filed all reports required to be filed by Section 13 or 15(d) of the Securities Exchange Act of 1934 during the preceding 12 months (or for such shorter period that the registrant was required to file such reports), and (2) has been subject to such filing requirements for the past 90 days. Yes þ No ¨
Indicate by check mark whether the registrant has submitted electronically and posted on its corporate website, if any, every Interactive Data File required to be submitted and posted pursuant to Rule 405 of Regulation S-T (§232.405 of this chapter) during the preceding 12 months (or for such shorter period that the registrant was required to submit and post such files). Yes þ No ¨
Indicate by check mark whether the registrant is a large accelerated filer, an accelerated filer, a non-accelerated filer, a smaller reporting company, or an emerging growth company. See the definitions of “large accelerated filer,” “accelerated filer,” “smaller reporting company,” and “emerging growth company” in Rule 12b-2 of the Exchange Act:
Large Accelerated Filer | ¨ | Accelerated Filer | ¨ |
Non-Accelerated Filer | þ (Do not check if a smaller reporting company) | Smaller reporting company | ¨ |
Emerging growth company | þ | ||
If an emerging growth company, indicate by check mark if the registrant has elected not to use the extended transition period for complying with any new or revised financial accounting standards provided pursuant to Section 13(a) of the Exchange Act. þ
Indicate by check mark whether the registrant is a shell company (as defined in Rule 12b-2 of the Exchange Act). Yes ¨ No þ
As of April 30, 2018, there were 46.5 million outstanding shares of common stock of Phillips Edison Grocery Center REIT II, Inc.
INDEX TO CONSOLIDATED FINANCIAL STATEMENTS
w PART I. FINANCIAL INFORMATION |
ITEM 1. FINANCIAL STATEMENTS
PHILLIPS EDISON GROCERY CENTER REIT II, INC.
CONSOLIDATED BALANCE SHEETS
AS OF MARCH 31, 2018 AND DECEMBER 31, 2017
(Unaudited)
(In thousands, except per share amounts)
March 31, 2018 | December 31, 2017 | ||||||
ASSETS | |||||||
Investment in real estate: | |||||||
Land and improvements | $ | 525,500 | $ | 520,526 | |||
Building and improvements | 1,062,353 | 1,047,758 | |||||
Acquired in-place lease assets | 160,261 | 158,510 | |||||
Acquired above-market lease assets | 15,017 | 14,742 | |||||
Total investment in property | 1,763,131 | 1,741,536 | |||||
Accumulated depreciation and amortization | (176,411 | ) | (157,290 | ) | |||
Net investment in property | 1,586,720 | 1,584,246 | |||||
Investment in unconsolidated joint venture | 15,463 | 16,076 | |||||
Total investment in real estate assets, net | 1,602,183 | 1,600,322 | |||||
Cash and cash equivalents | 2,998 | 1,435 | |||||
Restricted cash | 4,748 | 4,382 | |||||
Other assets, net | 54,244 | 46,178 | |||||
Total assets | $ | 1,664,173 | $ | 1,652,317 | |||
LIABILITIES AND EQUITY | |||||||
Liabilities: | |||||||
Debt obligations, net | $ | 799,651 | $ | 775,275 | |||
Acquired below-market lease liabilities, net of accumulated amortization of $12,123 | |||||||
and $10,959, respectively | 54,394 | 54,994 | |||||
Accounts payable - affiliates | 1,772 | 1,808 | |||||
Accounts payable and other liabilities | 35,504 | 36,961 | |||||
Total liabilities | 891,321 | 869,038 | |||||
Commitments and contingencies (Note 7) | — | — | |||||
Equity: | |||||||
Preferred stock, $0.01 par value per share, 10,000 shares authorized, zero shares issued and outstanding | |||||||
at March 31, 2018 and December 31, 2017, respectively | — | — | |||||
Common stock, $0.01 par value per share, 1,000,000 shares authorized, 46,713 and 46,584 shares | |||||||
issued and outstanding at March 31, 2018 and December 31, 2017, respectively | 470 | 468 | |||||
Additional paid-in capital | 1,034,636 | 1,031,685 | |||||
Accumulated other comprehensive income (“AOCI”) | 12,472 | 6,459 | |||||
Accumulated deficit | (274,726 | ) | (255,333 | ) | |||
Total equity | 772,852 | 783,279 | |||||
Total liabilities and equity | $ | 1,664,173 | $ | 1,652,317 | |||
See notes to consolidated financial statements.
1
PHILLIPS EDISON GROCERY CENTER REIT II, INC.
CONSOLIDATED STATEMENTS OF OPERATIONS AND COMPREHENSIVE INCOME
FOR THE THREE MONTHS ENDED MARCH 31, 2018 AND 2017
(Unaudited)
(In thousands, except per share amounts)
Three Months Ended March 31, | |||||||
2018 | 2017 | ||||||
Revenues: | |||||||
Rental income | $ | 31,979 | $ | 28,476 | |||
Tenant recovery income | 11,885 | 10,209 | |||||
Other property income | 296 | 116 | |||||
Total revenues | 44,160 | 38,801 | |||||
Expenses: | |||||||
Property operating | 7,326 | 6,603 | |||||
Real estate taxes | 7,023 | 6,121 | |||||
General and administrative | 4,337 | 4,613 | |||||
Depreciation and amortization | 18,888 | 17,022 | |||||
Total expenses | 37,574 | 34,359 | |||||
Other: | |||||||
Interest expense, net | (7,468 | ) | (4,474 | ) | |||
Other expense, net | (372 | ) | (55 | ) | |||
Net loss | $ | (1,254 | ) | $ | (87 | ) | |
Earnings per common share: | |||||||
Net loss per share - basic and diluted | $ | (0.03 | ) | $ | (0.00 | ) | |
Weighted-average common shares outstanding: | |||||||
Basic and diluted | 46,693 | 46,512 | |||||
Comprehensive income: | |||||||
Net loss | $ | (1,254 | ) | $ | (87 | ) | |
Other comprehensive income: | |||||||
Change in unrealized gain on interest rate swaps | 6,013 | 913 | |||||
Comprehensive income | $ | 4,759 | $ | 826 | |||
See notes to consolidated financial statements.
2
PHILLIPS EDISON GROCERY CENTER REIT II, INC.
CONSOLIDATED STATEMENTS OF EQUITY
FOR THE THREE MONTHS ENDED MARCH 31, 2018 AND 2017
(Unaudited)
(In thousands, except per share amounts)
Common Stock | Additional Paid-In Capital | AOCI | Accumulated Deficit | Total Equity | ||||||||||||||||||
Shares | Amount | |||||||||||||||||||||
Balance at January 1, 2017, as adjusted | 46,372 | $ | 463 | $ | 1,026,887 | $ | 4,906 | $ | (170,022 | ) | $ | 862,234 | ||||||||||
Share repurchases | (364 | ) | (3 | ) | (8,162 | ) | — | — | (8,165 | ) | ||||||||||||
Distribution reinvestment plan (“DRIP”) | 409 | 5 | 9,191 | — | — | 9,196 | ||||||||||||||||
Change in unrealized gain on interest rate swaps | — | — | — | 913 | — | 913 | ||||||||||||||||
Common distributions declared, $0.40 per share | — | — | — | — | (18,638 | ) | (18,638 | ) | ||||||||||||||
Share-based compensation | — | — | 15 | — | — | 15 | ||||||||||||||||
Net loss | — | — | — | — | (87 | ) | (87 | ) | ||||||||||||||
Balance at March 31, 2017 | 46,417 | $ | 465 | $ | 1,027,931 | $ | 5,819 | $ | (188,747 | ) | $ | 845,468 | ||||||||||
Balance at December 31, 2017, as reported | 46,584 | $ | 468 | $ | 1,031,685 | $ | 6,459 | $ | (255,333 | ) | $ | 783,279 | ||||||||||
Adoption of ASU 2017-05 (see Note 2) | — | — | — | — | 835 | 835 | ||||||||||||||||
Balance at January 1, 2018 as adjusted | 46,584 | 468 | 1,031,685 | 6,459 | (254,498 | ) | 784,114 | |||||||||||||||
Share repurchases | (259 | ) | (2 | ) | (5,886 | ) | — | — | (5,888 | ) | ||||||||||||
DRIP | 388 | 4 | 8,822 | — | — | 8,826 | ||||||||||||||||
Change in unrealized gain on interest rate swaps | — | — | — | 6,013 | — | 6,013 | ||||||||||||||||
Common distributions declared, $0.40 per share | — | — | — | — | (18,974 | ) | (18,974 | ) | ||||||||||||||
Share-based compensation | — | — | 15 | — | — | 15 | ||||||||||||||||
Net loss | — | — | — | — | (1,254 | ) | (1,254 | ) | ||||||||||||||
Balance at March 31, 2018 | 46,713 | $ | 470 | $ | 1,034,636 | $ | 12,472 | $ | (274,726 | ) | $ | 772,852 | ||||||||||
See notes to consolidated financial statements.
3
PHILLIPS EDISON GROCERY CENTER REIT II, INC.
CONSOLIDATED STATEMENTS OF CASH FLOWS
FOR THE THREE MONTHS ENDED MARCH 31, 2018 AND 2017
(Unaudited)
(In thousands)
2018 | 2017 | ||||||
CASH FLOWS FROM OPERATING ACTIVITIES: | |||||||
Net loss | $ | (1,254 | ) | $ | (87 | ) | |
Adjustments to reconcile net loss to net cash provided by operating activities: | |||||||
Depreciation and amortization | 18,622 | 16,718 | |||||
Net amortization of above- and below-market leases | (598 | ) | (607 | ) | |||
Amortization of deferred financing expense | 757 | 676 | |||||
Change in fair value of derivatives | (131 | ) | (116 | ) | |||
Straight-line rental income | (742 | ) | (836 | ) | |||
Other | 78 | 40 | |||||
Changes in operating assets and liabilities: | |||||||
Accounts receivable and accounts payable – affiliates | (74 | ) | (1,167 | ) | |||
Other assets | (2,280 | ) | (4,112 | ) | |||
Accounts payable and other liabilities | (1,050 | ) | (2,533 | ) | |||
Net cash provided by operating activities | 13,328 | 7,976 | |||||
CASH FLOWS FROM INVESTING ACTIVITIES: | |||||||
Real estate acquisitions | (17,979 | ) | (88,334 | ) | |||
Capital expenditures | (2,232 | ) | (1,549 | ) | |||
Investment in unconsolidated joint venture | — | (705 | ) | ||||
Return of investment in unconsolidated joint venture | 550 | — | |||||
Net cash used in investing activities | (19,661 | ) | (90,588 | ) | |||
CASH FLOWS FROM FINANCING ACTIVITIES: | |||||||
Net change in credit facility | 25,000 | 106,000 | |||||
Payments on mortgages and loans payable | (823 | ) | (12,461 | ) | |||
Distributions paid, net of DRIP | (10,249 | ) | (9,415 | ) | |||
Repurchases of common stock | (5,666 | ) | (5,589 | ) | |||
Net cash provided by financing activities | 8,262 | 78,535 | |||||
NET INCREASE (DECREASE) IN CASH, CASH EQUIVALENTS, AND RESTRICTED CASH | 1,929 | (4,077 | ) | ||||
CASH, CASH EQUIVALENTS, AND RESTRICTED CASH: | |||||||
Beginning of period | 5,817 | 11,088 | |||||
End of period | $ | 7,746 | $ | 7,011 | |||
RECONCILIATION TO CONSOLIDATED BALANCE SHEET | |||||||
Cash and cash equivalents | $ | 2,998 | $ | 4,068 | |||
Restricted cash | 4,748 | 2,943 | |||||
Cash, cash equivalents, and restricted cash at end of period | $ | 7,746 | $ | 7,011 | |||
SUPPLEMENTAL CASH FLOW DISCLOSURE, INCLUDING NON-CASH INVESTING AND FINANCING ACTIVITIES: | |||||||
Cash paid for interest | $ | 6,980 | $ | 4,193 | |||
Accrued capital expenditures and acquisition costs | 2,907 | 2,458 | |||||
Change in distributions payable | (101 | ) | 27 | ||||
Change in accrued share repurchase obligation | 222 | 2,576 | |||||
Distributions reinvested | 8,826 | 9,196 | |||||
See notes to consolidated financial statements.
4
Phillips Edison Grocery Center REIT II, Inc.
Notes to Consolidated Financial Statements
(Unaudited)
1. ORGANIZATION |
Phillips Edison Grocery Center REIT II, Inc. (“we,” the “Company,” “our,” or “us”) was formed as a Maryland corporation in June 2013. Substantially all of our business is conducted through Phillips Edison Grocery Center Operating Partnership II, L.P., (the “Operating Partnership”), a Delaware limited partnership formed in June 2013. We are a limited partner of the Operating Partnership, and our wholly owned subsidiary, PE Grocery Center OP GP II LLC, is the sole general partner of the Operating Partnership.
We invest primarily in well-occupied, grocery-anchored, neighborhood and community shopping centers that have a mix of creditworthy national and regional retailers that sell necessity-based goods and services in strong demographic markets throughout the United States. In addition, we may invest in other retail properties including power and lifestyle shopping centers, multi-tenant shopping centers, free-standing single-tenant retail properties, and other real estate or real estate-related assets.
Our advisor and property managers are owned by Phillips Edison & Company, Inc. and its subsidiaries (“PECO,” “Advisor,” or “Manager”). Under the terms of the advisory agreement (“Advisory Agreement”) and the master property management and master services agreements (“Management Agreements”) between subsidiaries of PECO and us, PECO is responsible for the management of our day-to-day activities and the implementation of our investment strategy.
As of March 31, 2018, we wholly-owned fee simple interests in 86 real estate properties acquired from third parties unaffiliated with us or PECO. In addition, we own a 20% equity interest in a joint venture that owned 14 real estate properties as of March 31, 2018 (see Note 4).
2. SUMMARY OF SIGNIFICANT ACCOUNTING POLICIES |
Certain of our accounting estimates are particularly important for an understanding of our financial position and results of operations and require the application of significant judgment by management. For example, significant estimates and assumptions have been made with respect to the useful lives of assets; recoverable amounts of receivables; and other fair value measurement assessments required for the preparation of the consolidated financial statements. As a result, these estimates are subject to a degree of uncertainty.
Other than those noted below, there have been no changes to our significant accounting policies during the three months ended March 31, 2018. For a full summary of our accounting policies, refer to our 2017 Annual Report on Form 10-K filed with the SEC on March 27, 2018.
Basis of Presentation and Principles of Consolidation—The accompanying consolidated financial statements have been prepared in accordance with accounting principles generally accepted in the United States of America (“GAAP”) for interim financial information and with instructions to Form 10-Q and Article 10 of Regulation S-X. Accordingly, they do not include all of the information and footnotes required by GAAP for complete financial statements. Readers of this Quarterly Report on Form 10-Q should refer to the audited consolidated financial statements of Phillips Edison Grocery Center REIT II, Inc. for the year ended December 31, 2017, which are included in our 2017 Annual Report on Form 10-K. In the opinion of management, all normal and recurring adjustments necessary for the fair presentation of the unaudited consolidated financial statements for the periods presented have been included in this Quarterly Report. Our results of operations for the three months ended March 31, 2018, are not necessarily indicative of the operating results expected for the full year.
The accompanying consolidated financial statements include our accounts and those of our majority-owned subsidiaries. All intercompany balances and transactions are eliminated upon consolidation.
Investment in Unconsolidated Joint Venture—We account for our investment in our unconsolidated joint venture using the equity method of accounting as we exercise significant influence over, but do not control, this entity. This investment was initially recorded at cost and is subsequently adjusted for contributions made to and distributions received from the joint venture. Earnings or losses on our investment are recognized in accordance with the terms of the applicable joint venture agreement, generally through a pro rata allocation. Under a pro rata allocation, net income or loss is allocated between the partners in the joint venture based on their respective stated ownership percentages.
We use the cumulative earnings approach to classify distributions from our unconsolidated joint venture. Distributions received are considered returns on investment and classified as cash inflows from operating activities unless our cumulative distributions received less distributions received in prior periods that were determined to be returns of investment exceed cumulative equity in earnings recognized by us. When such an excess occurs, the current-period distribution up to this excess is considered a return of investment and is classified as cash inflows from investing activities.
On a periodic basis, management assesses whether there are indicators, including the operating performance of the underlying real estate and general market conditions, that the value of our investment in our unconsolidated joint venture may be impaired. An investment’s value is impaired only if management’s estimate of the fair value of the investment is less than its carrying value and such difference is deemed to be other-than-temporary. To the extent impairment has occurred, the loss is measured as the excess of the carrying amount of the investment over its estimated fair value.
5
Management’s estimates of fair value are based upon a discounted cash flow model for each specific investment that includes all estimated cash inflows and outflows over a specified holding period and, where applicable, any estimated debt premiums, capitalization rates, discount rates and credit spreads used in these models are based upon rates we believe to be within a reasonable range of current market rates.
Newly Adopted and Recently Issued Accounting Pronouncements—The following table provides a brief description of recent accounting pronouncements that could have a material effect on our consolidated financial statements:
Standard | Description | Date of Adoption | Effect on the Financial Statements or Other Significant Matters | |||
Accounting Standards Update (“ASU”) 2016-02, Leases (Topic 842), ASU 2018-01, Leases (Topic 842): Land Easement Practical Expedient for Transition to Topic 842 | This update amends existing guidance by recognizing lease assets and lease liabilities on the balance sheet and disclosing key information about leasing arrangements. In January 2018, the Financial Accounting Standards Board (“FASB”) issued ASU 2018-01, which includes amendments to clarify land easements are within the scope of the new leases standard (Topic 842). Early adoption is permitted as of the original effective date. | January 1, 2019 | We are currently evaluating the impact the adoption of these standards will have on our consolidated financial statements. We have identified areas within our accounting policies we believe could be impacted by the new standard. This standard impacts the lessor’s ability to capitalize certain costs related to leasing, which will result in a reduction in the amount of execution costs currently being capitalized in connection with leasing activities and an increase to our General and Administrative expenses. In January 2018, the FASB issued a proposed ASU related to Accounting Standards Codification (“ASC”) 842. The update would allow lessors to use a practical expedient to account for non-lease components and related lease components as a single lease component instead of accounting for them separately, if certain conditions are met. This proposal is currently under consideration by regulators. We also expect to recognize right of use assets on our consolidated balance sheets related to certain ground leases where we are the lessee. We will continue to evaluate the effect the adoption of these ASUs will have on our consolidated financial statements. However, we currently believe that the adoption will not have a material impact for operating leases where we are a lessor and will continue to record revenues from rental properties for our operating leases on a straight-line basis. We are still evaluating the impact for leases where we are the lessee. | |||
The following table provides a brief description of newly adopted accounting pronouncements and their effect on our consolidated financial statements:
Standard | Description | Date of Adoption | Effect on the Financial Statements or Other Significant Matters | |||
ASU 2017-05, Other Income - Gains and Losses from the Derecognition of Nonfinancial Assets (Subtopic 610-20) | This update amends existing guidance in order to provide consistency in accounting for the derecognition of a business or nonprofit activity. | January 1, 2018 | We have evaluated the impact of ASU 2017-05 on $0.8 million of deferred gains relating to the contribution of real estate assets in 2016 to our joint venture. As a result of our evaluation, we determined that this contribution meets all of the requirements under ASC 610-20 as a completed sale. In accordance with the modified retrospective transition method, we recognized the cumulative effect of the change, representing the recognition of $0.8 million of previously deferred gain as of December 31, 2017, in the opening balance of Accumulated Deficit with a corresponding adjustment to the opening balance of Accounts Payable and Other Liabilities as of the beginning of 2018. | |||
ASU 2016-15, Statement of Cash Flows (Topic 230); ASU 2016-18, Statement of Cash Flows (Topic 230) | These updates address the presentation of eight specific cash receipts and cash payments on the statement of cash flows as well as clarify the classification and presentation of restricted cash on the statement of cash flows. | January 1, 2018 | We adopted these ASUs by applying a retrospective transition method which requires a restatement of our consolidated statement of cash flows for all periods presented. | |||
6
ASU 2014-09, Revenue from Contracts with Customers (Topic 606) | This update outlines a comprehensive model for entities to use in accounting for revenue arising from contracts with customers. ASU 2014-09 states that “an entity recognizes revenue to depict the transfer of promised goods or services to customers in an amount that reflects the consideration to which the entity expects to be entitled in exchange for those goods or services.” While ASU 2014-09 specifically references contracts with customers, it also applies to certain other transactions such as the sale of real estate or equipment. Expanded quantitative and qualitative disclosures are also required for contracts subject to ASU 2014-09. | January 1, 2018 | The majority of our revenue is lease revenue from our wholly-owned properties. We record these amounts as Rental Income and Tenant Recovery Income on the consolidated statements of operations. These revenue amounts are excluded from the scope of ASU 2014-09. As a result, the adoption of ASU 2014-09 did not result in any adjusting entries to prior periods as our revenue recognition related to these revenues aligned with the updated guidance. | |||
Reclassifications—The following line item on our consolidated statement of operations and comprehensive income for the three months ended March 31, 2017, was reclassified:
• | Unrealized Gain on Derivatives and Reclassification of Derivative Loss to Interest Expense were combined to Change in Unrealized Gain on Interest Rate Swaps. |
3. FAIR VALUE MEASUREMENTS |
The following describes the methods we use to estimate the fair value of our financial and nonfinancial assets and liabilities:
Cash and Cash Equivalents, Restricted Cash, Accounts Receivable, and Accounts Payable—We consider the carrying values of these financial instruments to approximate fair value because of the short period of time between origination of the instruments and their expected realization.
Real Estate Investments—The purchase prices of the investment properties, including related lease intangible assets and liabilities, were allocated at estimated fair value based on Level 3 inputs, such as discount rates, capitalization rates, comparable sales, replacement costs, income and expense growth rates, and current market rents and allowances as determined by management.
Debt Obligations—We estimate the fair value of our debt by discounting the future cash flows of each instrument at rates currently offered for similar debt instruments of comparable maturities by our lenders using Level 3 inputs. The discount rates used approximate current lending rates for loans or groups of loans with similar maturities and credit quality, assuming the debt is outstanding through maturity and considering the debt’s collateral (if applicable). We have utilized market information, as available, or present value techniques to estimate the amounts required to be disclosed.
The following is a summary of borrowings as of March 31, 2018 and December 31, 2017 (dollars in thousands):
March 31, 2018 | December 31, 2017 | ||||||
Fair value | $ | 791,338 | $ | 770,537 | |||
Recorded value(1) | 804,452 | 780,545 | |||||
(1) | Recorded value does not include deferred financing costs of $4.8 million and $5.3 million as of March 31, 2018 and December 31, 2017, respectively. |
Derivative Instruments—As of March 31, 2018 and December 31, 2017, we had five interest rate swaps that fixed LIBOR on $570 million of our unsecured term loan facilities (“Term Loans”). As of March 31, 2018 and December 31, 2017, we were also party to two interest rate swaps that fixed the variable interest rate on $15.3 million and $15.4 million, respectively, of two of our variable-rate mortgage notes. The change in fair value of these instruments is recorded in Other Expense, Net on the consolidated statements of operations and was not material for the three months ended March 31, 2018 and 2017.
All interest rate swap agreements are measured at fair value on a recurring basis. The valuation of these instruments is determined using widely accepted valuation techniques, including discounted cash flow analysis on the expected cash flows of each derivative. This analysis reflects the contractual terms of the derivatives, including the period to maturity, and uses observable market-based inputs, including interest rate curves and implied volatilities. The fair values of interest rate swaps are determined using the market standard methodology of netting the discounted future fixed cash receipts (or payments) and the discounted expected variable cash payments (or receipts). The variable cash payments (or receipts) are based on an expectation of future interest rates (forward curves) derived from observable market interest rate curves.
In accordance with ASC 820 Fair Value Measurement, we incorporate credit valuation adjustments to appropriately reflect both our own nonperformance risk and the respective counterparty’s nonperformance risk in the fair value measurements. In adjusting the fair value of our derivative contracts for the effect of nonperformance risk, we have considered the impact of netting and any applicable credit enhancements, such as collateral postings, thresholds, mutual puts, and guarantees.
Although we determined that the significant inputs used to value our derivatives fell within Level 2 of the fair value hierarchy, the credit valuation adjustments associated with our counterparties and our own credit risk utilize Level 3 inputs, such as estimates of current credit spreads, to evaluate the likelihood of default by us and our counterparties. However, as of
7
March 31, 2018 and December 31, 2017, we have assessed the significance of the impact of the credit valuation adjustments on the overall valuation of our derivative positions and have determined that the credit valuation adjustments are not significant to the overall valuation of our derivatives. As a result, we have determined that our derivative valuations in their entirety are classified in Level 2 of the fair value hierarchy.
We record derivative assets in Other Assets, Net and derivative liabilities in Accounts Payable and Other Liabilities on our consolidated balance sheets. The fair value measurements of our derivative assets and liabilities as of March 31, 2018 and December 31, 2017, were as follows (in thousands):
March 31, 2018 | December 31, 2017 | ||||||
Derivative asset: | |||||||
Interest rate swaps designated as hedging instruments - Term Loans | $ | 12,472 | $ | 6,544 | |||
Derivative liability: | |||||||
Interest rate swaps designated as hedging instruments - Term Loans | $ | — | $ | 85 | |||
Interest rate swaps not designated as hedging instruments - mortgage notes | 124 | 255 | |||||
Total | $ | 124 | $ | 340 | |||
4. INVESTMENT IN UNCONSOLIDATED JOINT VENTURE |
In March 2016, we entered into a joint venture (“Joint Venture”) where we may contribute up to $50 million in equity. The following table summarizes the cumulative activity related to our unconsolidated Joint Venture as of March 31, 2018 and December 31, 2017 (dollars in thousands):
Ownership Percentage | Number of Shopping Centers | Cumulative Equity Contributions as of | Cumulative Distributions as of | ||||||||||||||||
March 31, 2018 | December 31, 2017 | March 31, 2018 | December 31, 2017 | ||||||||||||||||
Joint Venture | 20% | 14 | $ | 17,456 | $ | 17,456 | $ | 1,500 | $ | 950 | |||||||||
In March 2017, our board of directors approved certain short-term loans (the “JV Loans”) that we may provide to the Joint Venture for its acquisition needs. The JV Loans have terms of up to 60 days, and are to be funded 20% by us. Our portion of the outstanding principal should not exceed $15 million at any given time. The JV Loans will incur interest at a rate equal to the greater of a) LIBOR plus 1.70%, or b) the borrowing rate on our revolving credit facility. As of March 31, 2018 and December 31, 2017, there were no outstanding loans between the Joint Venture and us.
5. REAL ESTATE ACQUISITIONS |
During the three months ended March 31, 2018 and 2017, we acquired one and four grocery-anchored shopping centers, respectively. None of these acquisitions were considered business combinations, but rather were classified as asset acquisitions. As such, most acquisition-related costs were capitalized and are included in the total purchase prices shown below. Our real estate asset acquired during the three months ended March 31, 2018, was as follows (dollars in thousands):
Property Name | Location | Anchor Tenant | Acquisition Date | Purchase Price | Square Footage | Leased % of Rentable Square Feet at Acquisition | ||||||||
Seville Commons | Arlington, TX | Walmart | 1/19/2018 | $ | 18,483 | 113,742 | 92.4% | |||||||
During the three months ended March 31, 2017, we acquired the following real estate assets (dollars in thousands):
Property Name | Location | Anchor Tenant | Acquisition Date | Purchase Price | Square Footage | Leased % of Rentable Square Feet at Acquisition | |||||||||
Herndon Station | Fresno, CA | Save Mart | 2/10/2017 | $ | 16,934 | 95,370 | 96.1% | ||||||||
Windmill Station | Clovis, CA | Save Mart(1) | 2/10/2017 | 9,665 | 27,486 | 100.0% | |||||||||
Plaza 23 Station | Pompton Plains, NJ | Stop & Shop | 2/27/2017 | 52,375 | 161,035 | 95.5% | |||||||||
Bells Fork Station | Greenville, NC | Harris Teeter | 3/1/2017 | 9,609 | 71,666 | 91.7% | |||||||||
(1) | We do not own the portion of the shopping center that contains the grocery anchor. |
8
The fair value at acquisition as well as weighted-average useful life for in-place, above-market, and below-market lease intangibles acquired during the three months ended March 31, 2018 and 2017, are as follows (in years):
2018 | 2017 | |||||||||||
Fair Value | Weighted-Average Useful Life | Fair Value | Weighted-Average Useful Life | |||||||||
Acquired in-place leases | $ | 1,751 | 8 | $ | 9,214 | 10 | ||||||
Acquired above-market leases | 275 | 9 | 1,318 | 8 | ||||||||
Acquired below-market leases | (564 | ) | 13 | (2,976 | ) | 17 | ||||||
6. DEBT OBLIGATIONS, NET |
The following is a summary of the outstanding principal balances and interest rates, which include the effect of derivative financial instruments, of our debt obligations as of March 31, 2018 and December 31, 2017 (in thousands):
Interest Rate | March 31, 2018 | December 31, 2017 | |||||||
Revolving credit facility(1) | 3.35% | $ | 82,357 | $ | 57,357 | ||||
Term loans(2) | 2.24%-4.09% | 570,000 | 570,000 | ||||||
Mortgages payable(3) | 3.45%-6.64% | 148,258 | 149,081 | ||||||
Assumed below-market debt adjustment, net(4) | 3,837 | 4,107 | |||||||
Deferred financing costs, net(5) | (4,801 | ) | (5,270 | ) | |||||
Total | $ | 799,651 | $ | 775,275 | |||||
(1) | The revolving credit facility matures in July 2018. Subsequent to March 31, 2018, our board of directors approved a resolution to exercise an option to extend the maturity date to January 2019. We also have an additional option to extend to July 2019. Gross borrowings under our revolving credit facility were $38.0 million and gross payments on our revolving credit facility were $13.0 million during the three months ended March 31, 2018. The revolving credit facility had a maximum capacity of $350 million as of March 31, 2018 and December 31, 2017. |
(2) | Of the outstanding Term Loans balance, $185 million matures in 2019 with options to extend to 2021, $185 million matures in 2020 with an option to extend to 2021, and $200 million matures in 2024. A maturity date extension requires the payment of an extension fee of 0.15% of the outstanding principal amount of the corresponding tranche. |
(3) | Due to the non-recourse nature of our fixed-rate mortgages, the assets and liabilities of the properties securing such mortgages are neither available to pay the debts of the consolidated property-holding limited liability companies, nor do they constitute obligations of such consolidated limited liability companies as of March 31, 2018 and December 31, 2017. |
(4) | Net of accumulated amortization of $2.2 million and $2.0 million as of March 31, 2018 and December 31, 2017, respectively. |
(5) | Net of accumulated amortization of $3.1 million and $2.6 million as of March 31, 2018 and December 31, 2017, respectively. |
As of March 31, 2018 and December 31, 2017, the weighted-average interest rate for all of our mortgages and loans payable was 3.5%.
The allocation of total debt between fixed and variable-rate and between secured and unsecured, excluding market debt adjustments and deferred financing costs, as of March 31, 2018 and December 31, 2017, is summarized below (in thousands):
March 31, 2018 | December 31, 2017 | ||||||
As to interest rate:(1) | |||||||
Fixed-rate debt | $ | 718,258 | $ | 719,081 | |||
Variable-rate debt | 82,357 | 57,357 | |||||
Total | $ | 800,615 | $ | 776,438 | |||
As to collateralization: | |||||||
Unsecured debt | $ | 652,357 | $ | 627,357 | |||
Secured debt | 148,258 | 149,081 | |||||
Total | $ | 800,615 | $ | 776,438 | |||
(1) | Includes the effects of derivative financial instruments (see Notes 3 and 8). |
9
7. COMMITMENTS AND CONTINGENCIES |
Litigation
We are involved in various claims and litigation matters arising in the ordinary course of business, some of which involve claims for damages. Many of these matters are covered by insurance, although they may nevertheless be subject to deductibles or retentions. Although the ultimate liability for these matters cannot be determined, based upon information currently available, we believe the resolution of such claims and litigation will not have a material adverse effect on our consolidated financial statements.
Environmental Matters
In connection with the ownership and operation of real estate, we may potentially be liable for costs and damages related to environmental matters. In addition, we may own or acquire certain properties that are subject to environmental remediation. Generally, the seller of the property, the tenant of the property, and/or another third party is responsible for environmental remediation costs related to a property. Additionally, in connection with the purchase of certain properties, the respective sellers and/or tenants may agree to indemnify us against future remediation costs. We also carry environmental liability insurance on our properties that provides limited coverage for any remediation liability and/or pollution liability for third-party bodily injury and/or property damage claims for which we may be liable. We are not aware of any environmental matters which we believe are reasonably likely to have a material effect on our consolidated financial statements.
8. DERIVATIVES AND HEDGING ACTIVITIES |
Risk Management Objective of Using Derivatives
We are exposed to certain risks arising from both our business operations and economic conditions. We principally manage our exposure to a wide variety of business and operational risks through management of our core business activities. We manage economic risks, including interest rate, liquidity, and credit risk, primarily by managing the amount, sources, and duration of our debt funding and the use of derivative financial instruments. Specifically, we enter into interest rate swaps to manage exposures that arise from business activities that result in the receipt or payment of future known and uncertain cash amounts, the value of which are determined by interest rates. Our derivative financial instruments are used to manage differences in the amount, timing, and duration of our known or expected cash receipts and our known or expected cash payments principally related to our investments and borrowings.
Cash Flow Hedges of Interest Rate Risk
Interest rate swaps designated as cash flow hedges involve the receipt of variable amounts from a counterparty in exchange for our making fixed-rate payments over the life of the agreements without exchange of the underlying notional amount.
The changes in the fair value of derivatives designated, and that qualify, as cash flow hedges are recorded in AOCI and are subsequently reclassified into earnings in the period that the hedged forecasted transaction affects earnings. During the three months ended March 31, 2018 and 2017, such derivatives were used to hedge the variable cash flows associated with certain variable-rate debt. The ineffectiveness previously reported in earnings for the quarter ended March 31, 2017, was adjusted to reflect application of the provisions of ASU 2017-12 as of the beginning of 2017. This adjustment was not material.
Amounts reported in AOCI related to these derivatives will be reclassified to Interest Expense, Net as interest payments are made on the variable-rate debt. During the next twelve months, we estimate that an additional $4.0 million will be reclassified from Other Comprehensive Income to Interest Expense, Net.
The following is a summary of our interest rate swaps that were designated as cash flow hedges of interest rate risk as of March 31, 2018 and December 31, 2017 (notional amount in thousands):
2018 | 2017 | ||||||
Count | 5 | 5 | |||||
Notional Amount | $ | 570,000 | $ | 570,000 | |||
Fixed LIBOR | 0.7%-2.2% | 0.7%-2.2% | |||||
Maturity Date | 2019-2024 | 2019-2024 | |||||
The table below details the location of the gain or loss recognized on interest rate derivatives designated as cash flow hedges in the consolidated statements of operations and comprehensive income for the three months ended March 31, 2018 and 2017 (in thousands):
Three Months Ended March 31, | |||||||
2018 | 2017 | ||||||
Amount of gain recognized in OCI on derivative | $ | 6,251 | $ | 635 | |||
Amount of gain (loss) reclassified from AOCI into interest expense | 239 | (222 | ) | ||||
Credit-risk-related Contingent Features
We have agreements with our derivative counterparties that contain provisions where, if we either default or are capable of being declared in default on any of our indebtedness, we could also be declared to be in default on our derivative obligations.
10
As of March 31, 2018, the fair value of our derivatives in a net liability position, which included accrued interest but excluded any adjustment for nonperformance risk related to these agreements, was approximately $0.1 million. As of March 31, 2018, we had not posted any collateral related to these agreements and were not in breach of any agreement provisions. If we had breached any of these provisions, we could have been required to settle our obligations under the agreements at their termination value of $0.1 million.
9. EQUITY |
On May 9, 2018, our board of directors increased its estimated value per share of our common stock to $22.80 based substantially on the estimated market value of our portfolio of real estate properties as of March 31, 2018. We engaged a third party valuation firm to provide a calculation of the range in estimated value per share of our common stock as of March 31, 2018, which reflected certain balance sheet assets and liabilities as of that date. Shares of our common stock are issued under the DRIP and redeemed under the Share Repurchase Program (“SRP”), as discussed below, at the same price as the estimate value per share in effect at the time of issuance or redemption.
Distribution Reinvestment Plan—The DRIP allows stockholders to invest distributions in additional shares of our common stock. Stockholders who elect to participate in the DRIP, and who are subject to U.S. federal income taxation laws, will incur a tax liability on an amount equal to the fair value on the relevant distribution date of the shares of our common stock purchased with reinvested distributions, even though such stockholders have elected not to receive the distributions in cash.
Share Repurchase Program—Our SRP provides an opportunity for stockholders to have shares of common stock repurchased, subject to certain restrictions and limitations. The cash available for repurchases on any particular date will generally be limited to the proceeds from the DRIP during the preceding four fiscal quarters, less amounts already used for repurchases since the beginning of that period. Our board of directors reserves the right, in its sole discretion, at any time and from time to time, to reject any request for repurchase.
During the three months ended March 31, 2018, repurchase requests surpassed the funding limits under the SRP. In April 2018, approximately 0.3 million shares of our common stock were repurchased under our SRP. Repurchase requests in connection with a stockholder’s death, “qualifying disability,” or “determination of incompetence” were fulfilled in full. The remaining repurchase requests that were in good order were fulfilled on a pro rata basis. As of April 30, 2018, we had approximately 0.8 million shares of unfulfilled repurchase requests, which will be treated as requests for repurchase during future months until satisfied or withdrawn. We continue to fulfill all repurchases sought upon a stockholder’s death, “qualifying disability,” or “determination of incompetence” in accordance with the terms of the SRP.
Due to the program’s funding limits, the funds available for repurchases during 2018 are expected to be insufficient to meet all requests. When we are unable to fulfill all repurchase requests in a given month, we will honor requests on a pro rata basis to the extent funds are available.
Class B Units—The Operating Partnership issues limited partnership units that are designated as Class B units for asset management services provided by PECO. The vesting of the Class B units is contingent upon a market condition and service condition. We had 0.4 million unvested Class B units outstanding as of March 31, 2018 and December 31, 2017.
10. EARNINGS PER SHARE |
We use the two-class method of computing earnings per share (“EPS”), which is an earnings allocation formula that determines EPS for common stock and any participating securities according to dividends declared (whether paid or unpaid). Under the two-class method, basic EPS is computed by dividing the income available to common stockholders by the weighted-average number of shares of common stock outstanding for the period. Diluted EPS reflects the potential dilution that could occur from share equivalent activity.
Restricted stock is granted under our 2013 Independent Director Stock Plan and is potentially dilutive. There were 4,968 and 4,448 restricted stock awards outstanding as of March 31, 2018 and 2017, respectively. During periods of net loss, these securities are anti-dilutive and, as a result, are excluded from the weighted average common shares used to calculate diluted EPS.
Class B units are participating securities as they contain non-forfeitable rights to dividends or dividend equivalents, and are potentially dilutive due to their right of conversion to common stock upon vesting. There were 0.4 million Class B units of the Operating Partnership outstanding as of March 31, 2018 and 2017, respectively. The vesting of the Class B units is contingent upon satisfaction of a market condition and service condition. Since the satisfaction of both conditions was not probable as of March 31, 2018 and 2017, the Class B units remained unvested and thus were not included in the diluted net loss per share computations.
11
11. RELATED PARTY TRANSACTIONS |
Economic Dependency—We are dependent on PECO for certain services that are essential to us, including asset acquisition and disposition decisions, asset management, operating and leasing of our properties, and other general and administrative responsibilities. In the event that PECO is unable to provide such services, we would be required to find alternative service providers, which could result in higher costs and expenses.
Advisor—Effective September 1, 2017, we entered into the amended and restated Advisory Agreement. Pursuant to the Advisory Agreement, the Advisor is entitled to specified fees for certain services, including managing our day-to-day activities and implementing our investment strategy. The Advisor manages our day-to-day affairs and our portfolio of real estate investments subject to the board of directors’ supervision.
Asset Management Fee and Subordinated Participation
Date | Rate | Payable | Description |
January 1, 2016 through August 31, 2017 | 1.00% | 80% in cash; 20% in Class B units | The cash portion was paid on a monthly basis in arrears at the rate of 0.06667% multiplied by the cost of our assets as of the last day of the preceding monthly period. The Class B unit portion was issued on a quarterly basis at the rate of 0.05% multiplied by the lower of the cost of assets and the applicable quarterly NAV, divided by the per share NAV. |
Beginning September 1, 2017 | 0.85% | 80% in cash; 20% in Class B units | The cash portion is paid on a monthly basis in arrears at the rate of 0.05667% multiplied by the cost of our assets as of the last day of the preceding monthly period. The Class B unit portion is issued on a quarterly basis at the rate of 0.0425% multiplied by the lower of the cost of assets and the applicable quarterly NAV, divided by the per share NAV. |
The Advisor is entitled to receive distributions on the Class B units at the same rate as distributions are paid to common stockholders. Such distributions are in addition to the incentive compensation that the Advisor and its affiliates may receive from us. During the three months ended March 31, 2018 and 2017, the Operating Partnership issued 19,727 and 23,066 Class B units, respectively, to the Advisor for asset management services performed. Prior to September 2017, a portion of the asset management fee and subordinated participation, and distributions on Class B units, were paid to a former third-party advisor. Effective September 2017, this relationship was terminated.
Other Advisory Fees and Reimbursements Paid in Cash
Fee Type | Date | Rate | Description |
Acquisition fee | January 1, 2015 though August 31, 2017 | 1.00% | Equal to the product of (x) the rate and (y) the cost of investments we acquired or originated, including any debt attributable to such investments. |
Beginning September 1, 2017 | 0.85% | ||
Acquisition expenses | Beginning January 1, 2015 | N/A | Reimbursements for direct expenses incurred related to selecting, evaluating, and acquiring assets on our behalf, including certain personnel costs. |
Disposition fee | January 1, 2015 through August 31, 2017 | 2.00% | Equal to the lesser of: (i) the product of the rate and the contract sales price of each property or other investment sold; or (ii) one-half of the total brokerage commissions paid if a non-affiliated broker is also involved in the sale, provided that total real estate commissions paid (to the Advisor and others) in connection with the sale may not exceed the lesser of a competitive real estate commission or 6% of the contract sales price. |
Beginning September 1, 2017 | 1.70% | ||
General and Administrative Expenses—As of March 31, 2018 and December 31, 2017, we owed the Advisor and their affiliates approximately $66,000 and $119,000, respectively, for general and administrative expenses paid on our behalf.
12
Summarized below are the fees earned by and the expenses reimbursable to the Advisor and former advisor for the three months ended March 31, 2018 and 2017. As of September 2017, pursuant to the termination of the relationship with our former advisor, they were no longer entitled to these fees and reimbursements. This table includes any related amounts unpaid as of March 31, 2018 and December 31, 2017, except for unpaid general and administrative expenses, which we disclose above (in thousands):
Three Months Ended | Unpaid Amount as of | ||||||||||||||
March 31, | March 31, | December 31, | |||||||||||||
2018 | 2017 | 2018 | 2017 | ||||||||||||
Acquisition fees(1) | $ | 155 | $ | 866 | $ | — | $ | — | |||||||
Acquisition expenses(1) | 36 | 173 | — | — | |||||||||||
Asset management fees(2) | 2,878 | 3,018 | 60 | 48 | |||||||||||
Class B units distribution(3) | 186 | 169 | 68 | 56 | |||||||||||
Total | $ | 3,255 | $ | 4,226 | $ | 128 | $ | 104 | |||||||
(1) | The majority of acquisition and due diligence fees are capitalized and allocated to the related investment in real estate assets on the consolidated balance sheet based on the acquisition-date fair values of the respective assets and liability acquired. |
(2) | Asset management fees are presented in General and Administrative on the consolidated statements of operations. |
(3) | Represents the distributions paid to holders of Class B units of the Operating Partnership and is presented in General and Administrative on the consolidated statements of operations. |
Manager—All of our properties are managed and leased by the Manager. The Manager also manages properties owned by PECO affiliates or other third parties. Below is a summary of fees charged by and expenses reimbursable to the Manager as outlined in the Management Agreements.
Manager Fees and Reimbursements Paid in Cash
Fee Type | Rate | Description |
Property Management | 4.00% | Equal to the product of (x) the monthly gross cash receipts from the properties managed and (y) the rate. |
Leasing Commissions | Market Rate | Fees for leasing services rendered with respect to a particular property, including if a tenant exercised an option to extend an existing lease. The fee may be increased by up to 50% if a co-broker is engaged to lease a particular vacancy. |
Construction Management | Market Rate | Paid for construction management services rendered with respect to a particular property. |
Other Expenses and Reimbursements | N/A | Costs and expenses incurred by the Manager on our behalf, including certain employee compensation, legal, travel, and other out-of-pocket expenses that were directly related to the management of specific properties and corporate matters, as well as fees and expenses of third-party accountants. |
Summarized below are the fees earned by and the expenses reimbursable to the Manager for the three months ended March 31, 2018 and 2017, and any related amounts unpaid as of March 31, 2018 and December 31, 2017 (in thousands):
Three Months Ended | Unpaid Amount as of | ||||||||||||||
March 31, | March 31, | December 31, | |||||||||||||
2018 | 2017 | 2018 | 2017 | ||||||||||||
Property management fees(1) | $ | 1,698 | $ | 1,400 | $ | 594 | $ | 580 | |||||||
Leasing commissions(2) | 1,265 | 636 | 375 | 202 | |||||||||||
Construction management fees(2) | 75 | 78 | 29 | 260 | |||||||||||
Other fees and reimbursements(3) | 664 | 794 | 530 | 491 | |||||||||||
Total | $ | 3,702 | $ | 2,908 | $ | 1,528 | $ | 1,533 | |||||||
(1) | The property management fees are included in Property Operating on the consolidated statements of operations. |
(2) | Leasing commissions paid for leases with terms less than one year are expensed immediately and included in Depreciation and Amortization on the consolidated statements of operations. Leasing commissions paid for leases with terms greater than one year, and construction management fees, are capitalized and amortized over the life of the related leases or assets. |
(3) | Other fees and reimbursements are included in Property Operating and General and Administrative on the consolidated statements of operations based on the nature of the expense. |
Unconsolidated Joint Venture—As of March 31, 2018 and December 31, 2017, we had a payable to the Joint Venture of approximately $50,000 and $52,000, respectively, and as of March 31, 2018, we had a receivable from the Joint Venture of approximately $38,000, all primarily related to activity at the six properties contributed by us to the Joint Venture. There was no receivable as of December 31, 2017. See Note 4 for more information regarding the Joint Venture.
13
12. SUBSEQUENT EVENTS |
Distributions to Stockholders
Distributions were paid subsequent to March 31, 2018, as follows (in thousands):
Month | Record Date | Distribution Amount per Share | Date Distribution Paid | Gross Amount of Distribution Paid | Distribution Reinvested through the DRIP | Net Cash Distribution | ||||||||||||||
March | 3/15/2018 | $ | 0.13541652 | 4/2/2018 | $ | 6,330 | $ | 2,862 | $ | 3,468 | ||||||||||
April | 4/16/2018 | 0.13541652 | 5/1/2018 | 6,343 | 2,808 | 3,535 | ||||||||||||||
In May 2018, our board of directors authorized distributions for June, July, and August 2018 in the amount of $0.13541652 per share to the stockholders of record at the close of business on June 15, 2018, July 16, 2018, and August 15, 2018, respectively.
14
ITEM 2. MANAGEMENT’S DISCUSSION AND ANALYSIS OF FINANCIAL CONDITION AND RESULTS OF OPERATIONS
Cautionary Note Regarding Forward-Looking Statements
Certain statements contained in this Quarterly Report on Form 10-Q of Phillips Edison Grocery Center REIT II, Inc. (“we,” the “Company,” “our,” or “us”) other than historical facts may be considered forward-looking statements within the meaning of Section 27A of the Securities Act of 1933, as amended (the “Securities Act”), and Section 21E of the Securities Exchange Act of 1934, as amended (the “Exchange Act”). We intend for all such forward-looking statements to be covered by the applicable safe harbor provisions for forward-looking statements contained in those acts. Such statements include, in particular, statements about our plans, strategies, and prospects and are subject to certain risks and uncertainties, including known and unknown risks, which could cause actual results to differ materially from those projected or anticipated. Therefore, such statements are not intended to be a guarantee of our performance in future periods. Such forward-looking statements can generally be identified by our use of forward-looking terminology such as “may,” “will,” “expect,” “intend,” “anticipate,” “estimate,” “believe,” “continue,” or other similar words. Readers are cautioned not to place undue reliance on these forward-looking statements, which speak only as of the date this report is filed with the SEC. We make no representations or warranties (express or implied) about the accuracy of any such forward-looking statements contained in this Quarterly Report on Form 10-Q, and we do not intend to publicly update or revise any forward-looking statements, whether as a result of new information, future events, or otherwise.
Any such forward-looking statements are subject to risks, uncertainties, and other factors and are based on a number of assumptions involving judgments with respect to, among other things, future economic, competitive, and market conditions, all of which are difficult or impossible to predict accurately. To the extent that our assumptions differ from actual conditions, our ability to accurately anticipate results expressed in such forward-looking statements, including our ability to generate positive cash flow from operations, make distributions to stockholders, and maintain the value of our real estate properties, may be significantly hindered.
See Item 1A. Risk Factors, in Part II of this Form 10-Q and Item 1A. Risk Factors, in Part I of our 2017 Annual Report on Form 10-K, filed with the SEC on March 27, 2018, for a discussion of the risks and uncertainties, although not all of the risks and uncertainties, that could cause actual results to differ materially from those presented in our forward-looking statements. Except as required by law, we do not undertake any obligation to update or revise any forward-looking statements contained in this Form 10-Q. Important factors that could cause actual results to differ materially from the forward-looking statements are disclosed in Item 1A. Risk Factors, in Part II, and Item 2. Management’s Discussion and Analysis of Financial Condition and Results of Operations, of this Form 10-Q.
All references to “Notes” throughout this document refer to the footnotes to the consolidated financial statements in Part I, Item 1. Financial Statements.
Overview
Organization—We are a public non-traded real estate investment trust (“REIT”) that invests in retail real estate properties. Our primary focus is on grocery-anchored neighborhood and community shopping centers that meet the day-to-day needs of residents in the surrounding trade areas.
As of March 31, 2018, we wholly-owned 86 real estate properties acquired from third parties unaffiliated with us or PECO. In addition, we own a 20% equity interest in a joint venture, which owned 14 real estate properties as of March 31, 2018.
Portfolio—Below are statistical highlights of our wholly-owned portfolio:
Property Acquisitions | ||||||
During the | ||||||
Total Portfolio as of | Three Months Ended | |||||
March 31, 2018 | March 31, 2018 | |||||
Number of properties | 86 | 1 | ||||
Number of states | 24 | 1 | ||||
Total square feet (in thousands) | 10,337 | 114 | ||||
Leased % of rentable square feet | 95.1 | % | 92.4 | % | ||
Average remaining lease term (in years)(1) | 5.4 | 7.5 | ||||
(1) | As of March 31, 2018. The average remaining lease term in years excludes future options to extend the term of the lease. |
15
Lease Expirations—The following chart shows, on an aggregate basis, all of the scheduled lease expirations after March 31, 2018, for each of the next ten years and thereafter for our 86 wholly-owned shopping centers. The chart shows the leased square feet and annualized base rent (“ABR”) represented by the applicable lease expirations (dollars and square feet in thousands):
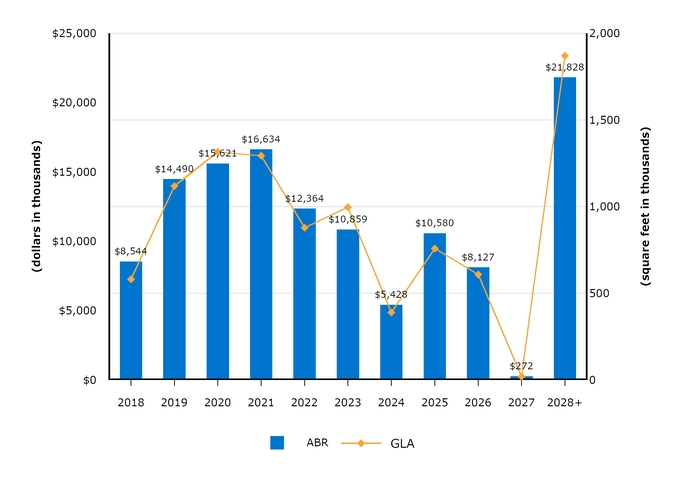
Subsequent to March 31, 2018, we renewed approximately 104,000 total square feet and $1.3 million of total ABR of the leases expiring.
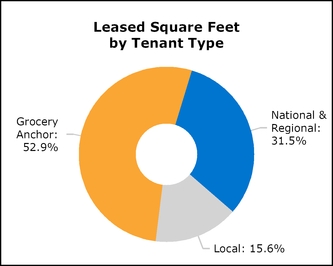
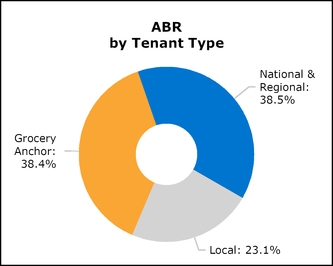
Portfolio Tenancy—We define national tenants as those tenants that operate in at least three states. Regional tenants are defined as those tenants that have at least three locations. The following charts present the composition of our portfolio by tenant type as of March 31, 2018:
16
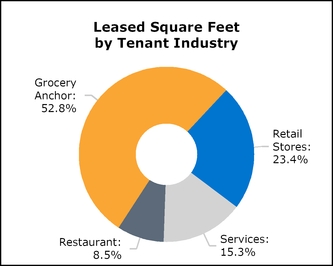
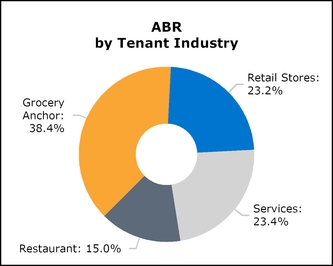
The following charts present the composition of our portfolio by tenant industry as of March 31, 2018 (dollars and square feet in thousands):
The following table presents our top ten tenants, grouped according to parent company, by ABR as of March 31, 2018 (dollars and square feet in thousands):
Tenant | ABR | % of ABR | Leased Square Feet | % of Leased Square Feet | Number of Locations(1) | |||||||||||
Publix Super Markets | $ | 8,157 | 6.5 | % | 843 | 8.6 | % | 18 | ||||||||
Albertsons Companies | 7,208 | 5.8 | % | 716 | 7.3 | % | 12 | |||||||||
Ahold Delhaize | 6,374 | 5.1 | % | 389 | 4.0 | % | 6 | |||||||||
Walmart | 5,820 | 4.7 | % | 903 | 9.2 | % | 7 | |||||||||
Kroger | 5,452 | 4.4 | % | 792 | 8.1 | % | 12 | |||||||||
Giant Eagle | 2,776 | 2.2 | % | 273 | 2.8 | % | 4 | |||||||||
Sprouts Farmers Market | 1,815 | 1.5 | % | 109 | 1.1 | % | 4 | |||||||||
Save Mart Supermarkets | 1,750 | 1.4 | % | 208 | 2.1 | % | 4 | |||||||||
T.J. Maxx | 1,314 | 1.1 | % | 108 | 1.1 | % | 4 | |||||||||
Supervalu | 1,089 | 0.9 | % | 136 | 1.4 | % | 2 | |||||||||
$ | 41,755 | 33.6 | % | 4,477 | 45.7 | % | 73 | |||||||||
(1) | Number of locations excludes auxiliary leases with grocery anchors such as fuel stations, pharmacies, and liquor stores. |
17
Results of Operations
Summary of Operating Activities for the Three Months Ended March 31, 2018 and 2017
Favorable (Unfavorable) Change | |||||||||||||||||||
(In thousands, except per share amounts) | 2018 | 2017 | Change | Non-Same-Center | Same-Center | ||||||||||||||
Operating Data: | |||||||||||||||||||
Total revenues | $ | 44,160 | $ | 38,801 | $ | 5,359 | $ | 4,533 | $ | 826 | |||||||||
Property operating expenses | (7,326 | ) | (6,603 | ) | (723 | ) | (751 | ) | 28 | ||||||||||
Real estate tax expenses | (7,023 | ) | (6,121 | ) | (902 | ) | (818 | ) | (84 | ) | |||||||||
General and administrative expenses | (4,337 | ) | (4,613 | ) | 276 | 205 | 71 | ||||||||||||
Depreciation and amortization | (18,888 | ) | (17,022 | ) | (1,866 | ) | (1,717 | ) | (149 | ) | |||||||||
Interest expense, net | (7,468 | ) | (4,474 | ) | (2,994 | ) | (2,994 | ) | — | ||||||||||
Other expense, net | (372 | ) | (55 | ) | (317 | ) | (308 | ) | (9 | ) | |||||||||
Net loss | $ | (1,254 | ) | $ | (87 | ) | $ | (1,167 | ) | $ | (1,850 | ) | $ | 683 | |||||
Net loss per share - basic and diluted | $ | (0.03 | ) | $ | (0.00 | ) | $ | (0.03 | ) | ||||||||||
We wholly-owned 86 properties as of March 31, 2018, and 78 properties as of March 31, 2017. The Same-Center column in the table above includes the 74 properties that were owned and operational prior to January 1, 2017. The Non-Same-Center column includes properties that were acquired after December 31, 2016, in addition to corporate-level income and expenses. In this section, we primarily explain fluctuations in activity shown in the Same-Center column as well as any notable fluctuations in the Non-Same-Center column related to corporate-level activity. Unless otherwise discussed below, year-over-year comparative differences for the three months ended March 31, 2018 and 2017, are almost entirely attributable to the number of properties owned and the length of ownership of these properties.
Total revenues—Of the $5.4 million increase in total revenues, $4.5 million was related to our 12 non-same-center properties. The remaining variance was the result of an increase in revenue among same-center properties, primarily due to a $0.8 million increase in minimum rent, which was driven by a 0.9% increase in same-center occupancy and a $0.05 increase in same-center minimum rent per square foot since March 31, 2017. Same-center tenant recovery income increased $0.5 million as a result of an increase in our overall recovery rate. The growth in rent and tenant recovery income were partially offset by a $0.4 million reduction in straight-line rent adjustments.
Interest expense, net—Of the $3.0 million increase in interest expense, $2.7 million is related to higher borrowings in 2018 on the term loans and revolving credit facility due to acquiring new properties in 2017 and 2018, as well as an increase of $0.1 million in amortization of deferred financing costs, related to new debt instruments. Additionally, $0.2 million of the increase is related to new mortgage loans assumed in connection with certain acquisitions throughout 2017, partially offset by one mortgage that matured.
18
Leasing Activity—Below is a summary of leasing activity for the three months ended March 31, 2018 and 2017:
Three Months Ended March 31, | ||||||||||||||||
Total Deals | Inline Deals(1) | |||||||||||||||
2018 | 2017 | 2018 | 2017 | |||||||||||||
New leases: | ||||||||||||||||
Number of leases | 33 | 15 | 31 | 15 | ||||||||||||
Square footage (in thousands) | 88 | 30 | 66 | 30 | ||||||||||||
First-year base rental revenue (in thousands) | $ | 1,408 | $ | 577 | $ | 1,123 | $ | 577 | ||||||||
Average rent per square foot (“PSF”) | $ | 16.09 | $ | 19.26 | $ | 17.13 | $ | 19.26 | ||||||||
Average cost PSF of executing new leases(2)(3) | $ | 22.24 | $ | 28.84 | $ | 23.63 | $ | 28.84 | ||||||||
Comparable rent spread(4) | 9.9 | % | 14.9 | % | 11.7 | % | 14.9 | % | ||||||||
Weighted-average lease term (in years) | 7.1 | 6.4 | 6.8 | 6.4 | ||||||||||||
Renewals and options: | ||||||||||||||||
Number of leases | 35 | 37 | 31 | 36 | ||||||||||||
Square footage (in thousands) | 217 | 129 | 81 | 79 | ||||||||||||
First-year base rental revenue (in thousands) | $ | 2,988 | $ | 2,058 | $ | 1,694 | $ | 1,533 | ||||||||
Average rent PSF | $ | 13.75 | $ | 15.94 | $ | 20.89 | $ | 19.37 | ||||||||
Average rent PSF prior to renewals | $ | 12.85 | $ | 14.42 | $ | 19.16 | $ | 17.20 | ||||||||
Percentage increase in average rent PSF | 7.0 | % | 10.5 | % | 9.0 | % | 12.6 | % | ||||||||
Comparable rent spread(4) | 9.8 | % | 14.6 | % | 9.8 | % | 14.6 | % | ||||||||
Average cost PSF of executing renewals and options(2)(3) | $ | 2.35 | $ | 3.16 | $ | 3.58 | $ | 4.16 | ||||||||
Weighted-average lease term (in years) | 5.0 | 4.8 | 4.5 | 4.7 | ||||||||||||
Portfolio retention rate(5) | 87.7 | % | 81.2 | % | 84.9 | % | 87.6 | % | ||||||||
(1) | We consider an inline deal to be a lease for less than 10,000 square feet of gross leasable area (“GLA”). |
(2) | The cost of executing new leases, renewals, and options includes leasing commissions, tenant improvement costs, and tenant concessions. |
(3) | The costs associated with landlord improvements are excluded for repositioning and redevelopment projects, if any. |
(4) | The comparable rent spread compares the percentage increase (or decrease) of new or renewal leases (excluding options) to the expiring lease of a unit that was occupied within the past twelve months. There were 34 total comparable deals executed during the three months ended March 31, 2018, 32 of which were inline deals. There were 28 total comparable deals executed during the three months ended March 31, 2017, all of which were inline deals. |
(5) | The portfolio retention rate is calculated by dividing (a) total square feet of retained tenants with current period lease expirations by (b) the square feet of leases expiring during the period. |
The average rent per square foot and cost of executing leases fluctuate based on the tenant mix, size of the space, and lease
term. Leases with national and regional tenants generally require a higher cost per square foot than those with local tenants.
However, such tenants tend to execute leases for a longer term. As we continue to attract more of these national and regional tenants, our costs to lease may increase.
Non-GAAP Measures
Same-Center Net Operating Income—We present Same-Center Net Operating Income (“Same-Center NOI”) as a supplemental measure of our performance. We define Net Operating Income (“NOI”) as total operating revenues less property operating expenses, real estate taxes, and non-cash revenue items. Same-Center NOI represents the NOI for the 74 properties that were wholly-owned and operational for the entire portion of both comparable reporting periods. We believe NOI and Same-Center NOI provide useful information to our investors about our financial and operating performance because each provides a performance measure of the revenues and expenses directly involved in owning and operating real estate assets and provides a perspective not immediately apparent from net income. Because Same-Center NOI excludes the change in NOI from properties acquired after December 31, 2016, it highlights operating trends such as occupancy levels, rental rates, and operating costs on properties that were operational for both comparable periods. Other REITs may use different methodologies for calculating Same-Center NOI, and accordingly, our Same-Center NOI may not be comparable to other REITs.
Same-Center NOI should not be viewed as an alternative measure of our financial performance since it does not reflect the operations of our entire portfolio, nor does it reflect the impact of general and administrative expenses, acquisition expenses, depreciation and amortization, interest expense, other income, or the level of capital expenditures and leasing costs necessary to maintain the operating performance of our properties that could materially impact our results from operations.
19
The table below is a comparison of the Same-Center NOI for the three months ended March 31, 2018 and 2017 (in thousands):
Three Months Ended March 31, | Favorable (Unfavorable) Change | |||||||||||||
2018 | 2017 | $ | % | |||||||||||
Revenues: | ||||||||||||||
Rental income(1) | $ | 27,060 | $ | 26,323 | $ | 737 | ||||||||
Tenant recovery income | 10,562 | 10,071 | 491 | |||||||||||
Other property income | 240 | 91 | 149 | |||||||||||
Total revenues | 37,862 | 36,485 | 1,377 | 3.8 | % | |||||||||
Operating expenses: | ||||||||||||||
Property operating expenses | 6,534 | 6,395 | 139 | |||||||||||
Real estate taxes | 6,101 | 6,017 | 84 | |||||||||||
Total operating expenses | 12,635 | 12,412 | 223 | 1.8 | % | |||||||||
Total Same-Center NOI | $ | 25,227 | $ | 24,073 | $ | 1,154 | 4.8 | % | ||||||
(1) | Excludes straight-line rental income, net amortization of above- and below-market leases, and lease buyout income. |
Below is a reconciliation of Net Loss to NOI and Same-Center NOI for the three months ended March 31, 2018 and 2017 (in thousands):
Three Months Ended March 31, | |||||||
2018 | 2017 | ||||||
Net loss | $ | (1,254 | ) | $ | (87 | ) | |
Adjusted to exclude: | |||||||
Straight-line rental income | (742 | ) | (836 | ) | |||
Net amortization of above- and below-market leases | (598 | ) | (607 | ) | |||
Lease buyout income | — | (125 | ) | ||||
General and administrative expenses | 4,337 | 4,613 | |||||
Depreciation and amortization | 18,888 | 17,022 | |||||
Interest expense, net | 7,468 | 4,474 | |||||
Other | 372 | 55 | |||||
NOI | 28,471 | 24,509 | |||||
Less: NOI from centers excluded from Same-Center | (3,244 | ) | (436 | ) | |||
Total Same-Center NOI | $ | 25,227 | $ | 24,073 | |||
Funds from Operations and Modified Funds from Operations—Funds from operations (“FFO”) is a non-GAAP performance financial measure that is widely recognized as a measure of REIT operating performance. We use FFO as defined by the National Association of Real Estate Investment Trusts (“NAREIT”) to be net income (loss) attributable to common stockholders computed in accordance with GAAP, excluding gains (or losses) from sales of property, plus depreciation and amortization, and after adjustments for unconsolidated partnerships and joint ventures. Adjustments for unconsolidated partnerships and joint ventures are calculated to reflect funds from operations on the same basis.
Modified funds from operations (“MFFO”) is an additional performance financial measure used by us as FFO includes certain non-comparable items that affect our performance over time. MFFO excludes the following items:
• | acquisition fees and expenses; |
• | straight-line rent amounts, both income and expense; |
• | amortization of above- or below-market intangible lease assets and liabilities; |
• | amortization of discounts and premiums on debt investments; |
• | gains or losses from the early extinguishment of debt; |
• | gains or losses on the extinguishment of derivatives, except where the trading of such instruments is a fundamental attribute of our operations; |
• | gains or losses related to fair-value adjustments for derivatives not qualifying for hedge accounting; |
• | gains or losses related to consolidation from, or deconsolidation to, equity accounting; and |
• | adjustments related to the above items for unconsolidated entities in the application of equity accounting. |
We believe that MFFO is helpful in assisting management and investors with the assessment of the sustainability of operating performance in future periods. Neither FFO nor MFFO should be considered as an alternative to net income (loss) or income (loss) from continuing operations under GAAP, nor as an indication of our liquidity, nor is either of these measures indicative of
20
funds available to fund our cash needs, including our ability to fund distributions. MFFO may not be a useful measure of the impact of long-term operating performance on value if we do not continue to operate our business plan in the manner currently contemplated.
Accordingly, FFO and MFFO should be reviewed in connection with other GAAP measurements. FFO and MFFO should not be viewed as more prominent measures of performance than our net income or cash flows from operations prepared in accordance with GAAP. Our FFO and MFFO as presented may not be comparable to amounts calculated by other REITs.
The following section presents our calculation of FFO and MFFO and provides additional information related to our operations. As a result of the timing of the commencement of our initial public offering and our active real estate acquisitions, FFO and MFFO are not relevant to a discussion comparing operations for the periods presented. We expect revenues and expenses to increase in future periods as we acquire additional investments.
Three Months Ended March 31, | |||||||
2018 | 2017 | ||||||
Calculation of FFO | |||||||
Net loss | $ | (1,254 | ) | $ | (87 | ) | |
Adjustments: | |||||||
Depreciation and amortization of real estate assets | 18,888 | 17,022 | |||||
Depreciation and amortization related to unconsolidated joint venture | 519 | 425 | |||||
FFO | $ | 18,153 | $ | 17,360 | |||
Calculation of MFFO | |||||||
FFO | $ | 18,153 | $ | 17,360 | |||
Adjustments: | |||||||
Net amortization of above- and below-market leases | (598 | ) | (607 | ) | |||
Straight-line rental income | (742 | ) | (836 | ) | |||
Amortization of market debt adjustment | (270 | ) | (281 | ) | |||
Gain on extinguishment of debt | — | (11 | ) | ||||
Change in fair value of derivatives | (131 | ) | (116 | ) | |||
Adjustments related to unconsolidated joint venture | (25 | ) | (2 | ) | |||
Other | 314 | — | |||||
MFFO | $ | 16,701 | $ | 15,507 | |||
Earnings per common share: | |||||||
Weighted-average common shares outstanding - basic | 46,693 | 46,512 | |||||
Weighted-average common shares outstanding - diluted(1) | 46,696 | 46,515 | |||||
FFO per share - basic and diluted | $ | 0.39 | $ | 0.37 | |||
MFFO per share - basic and diluted | $ | 0.36 | $ | 0.33 | |||
(1) | Restricted stock awards were dilutive to FFO/MFFO for the three months ended March 31, 2018 and 2017, and accordingly, were included in the weighted-average common shares used to calculate diluted FFO/MFFO per share. |
Liquidity and Capital Resources
General—Our principal cash demands are for real estate and real estate-related investments, capital expenditures, operating expenses, repurchases of common stock, distributions to stockholders, and principal and interest on our outstanding indebtedness. We intend to use our cash on hand, operating cash flows, proceeds from our DRIP, and proceeds from debt financings, including borrowings under our unsecured credit facility, as our primary sources of immediate and long-term liquidity. We continue to acquire additional investments to complete our portfolio. We expect that substantially all of the net cash generated from operations will be used to pay distributions to our stockholders after certain capital expenditures, including tenant improvements and leasing commissions, are funded; however, we have and may continue to use other sources to fund distributions as necessary, including borrowings.
As of March 31, 2018, we had cash, cash equivalents, and restricted cash of $7.7 million. During the three months ended March 31, 2018, we had a net increase of $1.9 million, as discussed below.
Operating Activities—Our net cash provided by operating activities consists primarily of cash inflows from tenant rental and recovery payments and cash outflows for property operating expenses, real estate taxes, general and administrative expenses, and interest payments.
Our cash flows from operating activities were $13.3 million as of March 31, 2018, compared to $8.0 million from the same period in 2017. The increase is primarily due to additional properties owned, the length of ownership of those properties, a 4.8% increase in Same-Center NOI, and favorable changes in working capital.
21
Investing Activities—Net cash used in investing activities is impacted by the nature, timing, and extent of improvements to and acquisitions of real estate and real estate-related assets.
Cash paid for acquisitions decreased during the three months ended March 31, 2018 compared to the same period in 2017. During the three months ended March 31, 2018, we had a total cash outlay of $18.0 million related to the acquisition of one grocery-anchored shopping center. During the same period in 2017, we acquired four grocery-anchored shopping centers and additional real estate adjacent to a previously acquired grocery-anchored shopping center for a total cash investment of $88.3 million.
Additionally, during the three months ended March 31, 2018, we received $0.6 million in distributions from the Joint Venture. We contributed an additional $0.7 million in cash to the Joint Venture during the three months ended March 31, 2017 to acquire additional assets. See Note 4 for more information regarding the Joint Venture.
Financing Activities—Net cash flows from financing activities are affected by payments of distributions, share repurchases, principal and other payments associated with our outstanding debt, and borrowings during the period. As our debt obligations mature, we intend to refinance the remaining balance, if possible, or pay off the balances at maturity using proceeds from operations and/or corporate-level debt.
Debt—The following table presents our calculation of net debt to total enterprise value as of March 31, 2018 (dollars in thousands):
2018 | |||
Net debt: | |||
Total debt, excluding below-market adjustments and deferred financing costs | $ | 800,615 | |
Less: Cash and cash equivalents | (2,998 | ) | |
Total net debt | $ | 797,617 | |
Enterprise Value: | |||
Total net debt | $ | 797,617 | |
Total equity value(1) | 1,062,789 | ||
Total enterprise value | $ | 1,860,406 | |
Net debt to total enterprise value | 42.9 | % | |
(1) Total equity value is calculated as the product of the number of diluted shares outstanding and the estimated value per share at the end of the period. There were 46.7 million diluted shares outstanding as of March 31, 2018.
We have access to a revolving credit facility with a capacity of up to $350 million and a current interest rate of LIBOR plus 1.55%. As of March 31, 2018, $267.4 million was available for borrowing, from which we may draw funds to pay certain long-term debt obligations as they mature, increase our investment in real estate, or pay operating costs and expenses. The revolving credit facility matures in July 2018. Subsequent to March 31, 2018, our board of directors approved a resolution to exercise an option to extend the maturity date to January 2019. We also have an additional option to extend to July 2019. During the three months ended March 31, 2018, we had an increase of $25.0 million in net borrowings from our revolving credit facility compared to an increase of $106.0 million for the same period in 2017.
Equity—We offer an SRP that provides a limited opportunity for stockholders to have shares of common stock repurchased, subject to certain restrictions and limitations. For a more detailed discussion of our SRP, see Note 9. During the three months ended March 31, 2018, we paid cash for repurchases of common stock in the amount of $5.7 million. Due to the program’s funding limits, the funds available for repurchases during 2018 are expected to be insufficient to meet all requests.
Activity related to distributions to our common stockholders for the three months ended March 31, 2018 and 2017, is as follows (in thousands):
Three Months Ended March 31, | |||||||
2018 | 2017 | ||||||
Gross distributions paid | $ | 19,075 | $ | 18,611 | |||
Distributions reinvested through DRIP | 8,826 | 9,196 | |||||
Net cash distributions | $ | 10,249 | $ | 9,415 | |||
Net loss | $ | (1,254 | ) | $ | (87 | ) | |
Net cash provided by operating activities | $ | 13,328 | $ | 7,976 | |||
FFO(1) | $ | 18,153 | $ | 17,360 | |||
(1) See Item 2. Management’s Discussion and Analysis of Financial Condition and Results of Operations - Non-GAAP Measures - Funds from Operations and Modified Funds from Operations for the definition of FFO, information regarding why we present FFO, as well as for a reconciliation of this non-GAAP financial measure to Net Loss.
We paid distributions monthly and expect to continue paying distributions monthly unless our results of operations, our general financial condition, general economic conditions or other factors, as determined by our board of directors, make it imprudent to do so. The timing and amount of distributions is determined by our board of directors and is influenced in part by our intention to comply with REIT requirements of the Internal Revenue Code.
22
To maintain our qualification as a REIT, we must make aggregate annual distributions to our stockholders of at least 90% of our REIT taxable income (which is computed without regard to the dividends paid deduction or net capital gain and which does not necessarily equal net income as calculated in accordance with GAAP). If we meet the REIT qualification requirements, we generally will not be subject to U.S. federal income tax on the income that we distribute to our stockholders each year. However, we may be subject to certain state and local taxes on our income, property, or net worth, respectively, and to federal income and excise taxes on our undistributed income.
We have not established a minimum distribution level, and our charter does not require that we make distributions to our stockholders.
ITEM 3. QUANTITATIVE AND QUALITATIVE DISCLOSURES ABOUT MARKET RISK
There have been no material changes from the quantitative and qualitative disclosures about market risk disclosed in Part II, Item 7A of our 2017 Annual Report on Form 10-K filed with the SEC on March 27, 2018.
ITEM 4. CONTROLS AND PROCEDURES
Evaluation of Disclosure Controls and Procedures
Our management, with the participation of our Principal Executive Officer and Principal Financial Officer, has evaluated the effectiveness of our disclosure controls and procedures (as defined in Rule 13a-15(e) under the Exchange Act) as of March 31, 2018. Based on that evaluation, our Principal Executive Officer and Principal Financial Officer concluded that our disclosure controls and procedures (as defined in Rule 13a-15(e) under the Exchange Act) were effective as of March 31, 2018.
Internal Control Changes
During the quarter ended March 31, 2018, there were no changes in our internal control over financial reporting (as defined in Rule 13a-15(f) under the Exchange Act) that have materially affected, or are reasonably likely to materially affect, our internal control over financial reporting.
23
w PART II. OTHER INFORMATION |
ITEM 1. LEGAL PROCEEDINGS
From time to time, Phillips Edison Grocery Center REIT II, Inc. (“we,” the “Company,” “our,” or “us”) is party to legal proceedings, which arise in the ordinary course of our business. We are not currently involved in any legal proceedings of which the outcome is reasonably likely to have a material impact on our results of operations or financial condition, nor are we aware of any such legal proceedings contemplated by governmental authorities.
ITEM 1A. RISK FACTORS
For a listing of risk factors associated with investing in us, please see Item 1A. Risk Factors in Part I of our 2017 Annual Report on Form 10-K filed with the SEC on March 27, 2018.
ITEM 2. UNREGISTERED SALES OF EQUITY SECURITIES AND USE OF PROCEEDS
During the quarter ended March 31, 2018, we repurchased shares as follows (shares in thousands):
Period | Total Number of Shares Repurchased | Average Price Paid per Share | Total Number of Shares Purchased as Part of a Publicly Announced Plan or Program(1) | Approximate Dollar Value of Shares Available That May Yet Be Repurchased Under the Program | ||||||||
January 2018 | 210 | $ | 22.75 | 210 | (2) | |||||||
February 2018 | 20 | 22.75 | 20 | (2) | ||||||||
March 2018 | 29 | 22.75 | 29 | (2) | ||||||||
(1) | All purchases of our equity securities by us in the three months ended March 31, 2018, were made pursuant to the share repurchase program (“SRP”). We announced the commencement of the SRP on November 25, 2013, and it was subsequently amended effective May 15, 2016. |
(2) | We currently limit the dollar value and number of shares that may yet be repurchased under the SRP, as described below. |
Our SRP may provide a limited opportunity for stockholders to have shares of common stock repurchased, subject to certain restrictions and limitations that are discussed below:
• | During any calendar year, we may repurchase no more than 5% of the weighted-average number of shares outstanding during the prior calendar year. |
• | We have no obligation to repurchase shares if the repurchase would violate the restrictions on distributions under Maryland law, which prohibits distributions that would cause a corporation to fail to meet statutory tests of solvency. |
• | The cash available for repurchases on any particular date will generally be limited to the proceeds from the distribution reinvestment plan (“DRIP”) during the preceding four fiscal quarters, less any cash already used for repurchases since the beginning of the same period; however, subject to the limitations described above, we may use other sources of cash at the discretion of the board of directors. The limitations described above do not apply to shares repurchased due to a stockholder’s death, “qualifying disability,” or “determination of incompetence.” |
• | Only those stockholders who purchased their shares from us or received their shares from us (directly or indirectly) through one or more non-cash transactions may be able to participate in the SRP. In other words, once our shares are transferred for value by a stockholder, the transferee and all subsequent holders of the shares are not eligible to participate in the SRP. |
• | The board of directors reserves the right, in its sole discretion, at any time and from time to time, to reject any request for repurchase. |
Our board of directors may amend, suspend or terminate the program upon 30 days’ notice. We may provide notice by including such information (a) in a current report on Form 8-K or in our annual or quarterly reports, all publicly filed with the SEC, or (b) in a separate mailing to the stockholders.
During the three months ended March 31, 2018, repurchase requests surpassed the funding limits under the SRP. Approximately 0.3 million shares of common stock were repurchased under our SRP during the three months ended March 31, 2018. Repurchase requests in connection with a stockholder’s death, “qualifying disability,” or “determination of incompetence” were satisfied in full. The remaining repurchase requests that were in good order were satisfied on a pro rata basis. As of April 30, 2018, we had approximately 0.8 million shares of unfulfilled repurchase requests, which will be treated as requests for repurchase during future months until satisfied or withdrawn.
Due to the program’s funding limits, the funds available for repurchases during 2018 are expected to be insufficient to meet all requests. When we are unable to fulfill all repurchase requests in a given month, we will honor requests on a pro rata basis to the extent funds are available. We will continue to fulfill repurchases sought upon a stockholder’s death, “qualifying disability,” or “determination of incompetence” in accordance with the terms of the SRP.
24
ITEM 3. DEFAULTS UPON SENIOR SECURITIES
None.
ITEM 4. MINE SAFETY DISCLOSURES
Not applicable.
ITEM 5. OTHER INFORMATION
Valuation Overview
On May 9, 2017, our board of directors approved an estimated value per share of our common stock of $22.80 based substantially on the estimated market value of our portfolio of real estate properties in various geographic locations in the United States (the “Portfolio”) as of March 31, 2018. We provided this estimated value per share to assist broker-dealers that participated in our public offering in meeting our customer account statement reporting obligations under National Association of Securities Dealers Conduct Rule 2340 as required by the Financial Industry Regulatory Authority (“FINRA”). This valuation was performed in accordance with the provisions of Practice Guideline 2013-01, Valuations of Publicly Registered Non-Listed REITs, issued by the Institute for Portfolio Alternatives (“IPA”) in April 2013 (the “IPA Valuation Guidelines”).
We engaged Duff & Phelps, LLC (“Duff & Phelps”) to provide a calculation of the range in estimated value per share of our common stock as of March 31, 2018. Duff & Phelps prepared a valuation report (the “Valuation Report”) that provided this range based substantially on its estimate of the “as is” market values of the Portfolio. Duff & Phelps made adjustments to the aggregate estimated value of the Portfolio to reflect balance sheet assets and liabilities provided by our management as of March 31, 2018, before calculating a range of estimated values based on the number of outstanding shares of our common stock as of March 31, 2018. These calculations produced an estimated value per share in the range of $21.27 to $24.17 as of March 31, 2018. The board of directors ultimately approved $22.80 as the estimated value per share of our common stock.
The following table summarizes the material components of the estimated value per share of our common stock as of March 31, 2018 (dollars and shares in thousands):
Low | High | ||||||
Investment in Real Estate Assets | $ | 1,785,495 | $ | 1,920,995 | |||
Other Assets | |||||||
Cash and cash equivalents | 2,998 | 2,998 | |||||
Restricted cash | 4,748 | 4,748 | |||||
Accounts receivable | 21,168 | 21,168 | |||||
Mark to market | 12,292 | 12,292 | |||||
Prepaid expenses and other assets | 3,639 | 3,639 | |||||
Total other assets | 44,845 | 44,845 | |||||
Liabilities | |||||||
Notes payable and credit facility | 800,615 | 800,615 | |||||
Joint venture net liabilities | 32,256 | 32,256 | |||||
Accounts payable and accrued expenses | 3,897 | 3,897 | |||||
Total liabilities | 836,768 | 836,768 | |||||
Net Asset Value | $ | 993,572 | $ | 1,129,072 | |||
Common stock outstanding | 46,713 | 46,713 | |||||
Net Asset Value Per Share | $ | 21.27 | $ | 24.17 | |||
As with any valuation methodology, the methodologies used are based upon a number of assumptions and estimates that may not be accurate or complete. Different parties with different assumptions and estimates could derive a different estimated value per share, and these differences could be significant. These limitations are discussed further under “Limitations of Estimated Value per Share” below.
Valuation Methodologies
Our goal in calculating an estimated value per share is to arrive at a value that is reasonable and supportable using what we deem to be appropriate valuation and appraisal methodologies and assumptions and a process that is in accordance with the
25
IPA Valuation Guidelines. The following is a summary of the valuation methodologies and components used to calculate the estimated value per share.
Real Estate Portfolio
Independent Valuation Firm
Duff & Phelps was recommended by Phillips Edison & Company, Inc. and its subsidiaries (“PECO” or “Advisor”) to the Conflicts committee of our board of directors (the “Conflicts Committee”) to provide independent valuation services. The Conflicts Committee approved the engagement of Duff & Phelps for those services, and they are not affiliated with us or the Advisor. The Duff & Phelps personnel who prepared the valuation have no present or prospective interest in the Portfolio and no personal interest with us or the Advisor. Duff & Phelps has previously provided allocation of acquisition purchase price valuations for financial reporting purposes pertaining to our acquisitions as well as providing services to us in connection with the calculation of our estimated values per share as of March 31, 2016 and 2017. They receive the usual and customary compensation for such services. Duff & Phelps may be engaged to provide professional services to us in the future.
Duff & Phelps’ engagement for its valuation services was not contingent upon developing or reporting predetermined results. In addition, Duff & Phelps’ compensation for completing the valuation services was not contingent upon the development or reporting of a predetermined value or direction in value that favors the cause of us, the amount of the value opinion, the attainment of a stipulated result, or the occurrence of a subsequent event directly related to the intended use of its Valuation Report. We have agreed to indemnify Duff & Phelps against certain liabilities arising out of this engagement.
Duff & Phelps’ analyses, opinions, or conclusions were developed, and the Valuation Report was prepared, in conformity with the Uniform Standards of Professional Appraisal Practice. The Valuation Report was reviewed, approved and signed by Duff & Phelps’ personnel with the professional designation of Member of the Appraisal Institute (the “MAI”). The use of the Valuation Report is subject to the requirements of the Appraisal Institute relating to review by its duly authorized representatives.
In preparing the Valuation Report, Duff & Phelps relied on information provided by us and the Advisor regarding the Portfolio. For example, we and the Advisor provided information regarding building size, year of construction, land size and other physical, financial and economic characteristics. We and the Advisor also provided lease information, such as current rent amounts, rent commencement and expiration dates, and rent increase amounts and dates. Duff & Phelps did not inspect the Portfolio properties as part of the valuation process.
Duff & Phelps did not investigate the legal description or legal matters relating to the Portfolio, including title or encumbrances, and title to the properties was assumed to be good and marketable. The Portfolio was also assumed to be free and clear of liens, easements, encroachments and other encumbrances, and to be in full compliance with zoning, use, occupancy, environmental and similar laws unless otherwise stated by us. The Valuation Report contains other assumptions, qualifications and limitations that qualify the analysis, opinions and conclusions set forth therein. Furthermore, the prices at which our real estate properties may actually be sold could differ from their appraised values.
The foregoing is a summary of the standard assumptions, qualifications and limitations that generally apply to the Valuation Report.
Real Estate Valuation
Duff & Phelps estimated the “as is” market values of the Portfolio as of March 31, 2018, using various methodologies. Generally accepted valuation practice suggests assets may be valued using a range of methodologies. Duff & Phelps utilized the income capitalization approach with support from the sales comparison approach for each property. The income approach was the primary indicator of value, with secondary consideration given to the sales approach. Duff & Phelps performed a study of each market to measure current market conditions, supply and demand factors, growth patterns, and their effect on each of the subject properties.
The income capitalization approach simulates the reasoning of an investor who views the cash flows that would result from the anticipated revenue and expense on a property throughout its lifetime. Under the income capitalization approach, Duff & Phelps used an estimated net operating income (“NOI”) for each property, and then converted it to a value indication using a discounted cash flow analysis. The discounted cash flow analysis focuses on the operating cash flows expected from a property and the anticipated proceeds of a hypothetical sale at the end of an assumed holding period, with these amounts then being discounted to their present value. The discounted cash flow method is appropriate for the analysis of investment properties with multiple leases, particularly leases with cancellation clauses or renewal options, and especially in volatile markets.
The sales comparison approach estimates value based on what other purchasers and sellers in the market have agreed to as a price for comparable improved properties. This approach is based upon the principle of substitution, which states that the limits of prices, rents and rates tend to be set by the prevailing prices, rents and rates of equally desirable substitutes. Duff & Phelps gathered comparable sales data throughout various markets as secondary support for its valuation estimate.
The following summarizes the range of capitalization and discount rates that were used to arrive at the estimated market values of our Portfolio:
Range in Values | |
Overall capitalization rate | 6.65% - 7.15% |
Terminal capitalization rate | 7.04% - 7.53% |
Discount rate | 7.72% - 8.21% |
Sensitivity Analysis
While we believe that Duff & Phelps’ assumptions and inputs are reasonable, a change in these assumptions would impact the calculations of the estimated value of the Portfolio and our estimated value per share. The table below illustrates the impact
26
on Duff & Phelps’ range in estimated value per share if the terminal capitalization rates or discount rates were adjusted by 25 basis points and assumes all other factors remain unchanged. Additionally, the table illustrates the impact of a 5% change in these rates in accordance with the IPA Valuation Guidelines. The table is only hypothetical to illustrate possible results if only one change in assumptions was made, with all other factors held constant. Further, each of these assumptions could change by more than 25 basis points or 5%.
Resulting Range in Estimated Value Per Share | |||||||
Increase of 25 Basis Points | Decrease of 25 Basis Points | Increase of 5% | Decrease of 5% | ||||
Terminal capitalization rate | 20.57 - 23.36 | 21.92 - 24.96 | 20.30 - 23.08 | 22.25 - 25.26 | |||
Discount rate | 20.56 - 23.37 | 21.91 - 24.87 | 20.16 - 23.02 | 22.33 - 25.25 | |||
Other Assets and Other Liabilities
Duff & Phelps made adjustments to the aggregate estimated values of our investments to reflect other assets and other liabilities of us based on balance sheet information provided by us and the Advisor as of March 31, 2018.
Role of the Conflicts Committee and the Board of Directors
The Conflicts Committee is composed of all of our independent directors. It is responsible for the oversight of the valuation process, including the review and approval of the valuation process and methodologies used to determine our estimated value per share, the consistency of the valuation and appraisal methodologies with real estate industry standards and practices and the reasonableness of the assumptions used in the valuations and appraisals. The Conflicts Committee approved our engagement of Duff & Phelps to provide an estimation of the value per share as of March 31, 2018. The Conflicts Committee received a copy of the Valuation Report and discussed the report with representatives of Duff & Phelps. The Conflicts Committee also discussed the Valuation Report, the Portfolio, our assets and liabilities and other matters with senior management of the Advisor. The Advisor recommended to the Conflicts Committee that $22.80 per share be approved as the estimated value per share of our common stock. The Conflicts Committee discussed the rationale for this value with the Advisor.
Following the Conflicts Committee’s receipt and review of the Valuation Report, the recommendation of the Advisor, and in light of other factors considered by the Conflicts Committee and its own extensive knowledge of our assets and liabilities, the Conflicts Committee concluded that the range in estimated value per share of $21.27 to $24.17 was appropriate. The Conflicts Committee then recommended to our board of directors that it select $22.80 as the estimated value per share of our common stock. Our board of directors unanimously agreed to accept the recommendation of the Conflicts Committee and approved $22.80 as the estimated value per share of our common stock as of March 31, 2018, which determination was ultimately and solely the responsibility of the board of directors.
Limitations of Estimated Value per Share
We are providing this estimated value per share to assist broker-dealers that participated in our public offering in meeting their customer account statement reporting obligations. This valuation was performed in accordance with the provisions of the IPA Valuation Guidelines. As with any valuation methodology, the methodologies used are based upon a number of estimates and assumptions that may not be accurate or complete. Different parties with different assumptions and estimates could derive a different estimated value per share, and this difference could be significant. The estimated value per share is not audited and does not represent a determination of the fair value of our assets or liabilities based on GAAP, nor does it represent a liquidation value of our assets and liabilities or the amount at which our shares of common stock would trade on a national securities exchange.
Accordingly, with respect to the estimated value per share, we can give no assurance that:
• | a stockholder would be able to resell his or her shares at the estimated value per share; |
• | a stockholder would ultimately realize distributions per share equal to our estimated value per share upon liquidation of our assets and settlement of our liabilities or a sale of us; |
• | our shares of common stock would trade at the estimated value per share on a national securities exchange; |
• | a third party would offer the estimated value per share in an arm’s-length transaction to purchase all or substantially all of our shares of common stock; |
• | another independent third-party appraiser or third-party valuation firm would agree with our estimated value per share; or |
• | the methodologies used to calculate our estimated value per share would be acceptable to FINRA or for compliance with Employee Retirement Income Security Act of 1974 reporting requirements. |
Further, the estimated value per share as of March 31, 2018, is based on the estimated value per share of the Company as of March 31, 2018. We did not make any adjustments to the valuation for the impact of other transactions occurring subsequent to March 31, 2018, including, but not limited to, (1) the issuance of common stock under the DRIP, (2) NOI earned and dividends declared, (3) the repurchase of shares and (4) changes in leases, tenancy or other business or operational changes. The value of our shares will fluctuate over time in response to developments related to individual assets in the Portfolio, the management of those assets and changes in the real estate and finance markets. Because of, among other factors, the high concentration of our total assets in real estate and the number of shares of our common stock outstanding, changes in the value of individual assets in the Portfolio or changes in valuation assumptions could have a very significant impact on the value of our shares. The estimated value per share does not reflect a portfolio premium or the fact that we are externally managed. The estimated value per share also does not take into account any disposition costs or fees for real estate properties, debt
27
prepayment penalties that could apply upon the prepayment of certain of our debt obligations or the impact of restrictions on the assumption of debt.
ITEM 6. EXHIBITS
Ex. | Description |
101.1 | The following information from the Company’s quarterly report on Form 10-Q for the quarter ended March 31, 2018, formatted in XBRL (eXtensible Business Reporting Language): (i) Consolidated Balance Sheets; (ii) Consolidated Statements of Operations and Comprehensive Income; (iii) Consolidated Statements of Equity; and (iv) Consolidated Statements of Cash Flows* |
*Filed herewith.
28
SIGNATURES
Pursuant to the requirements of the Securities Exchange Act of 1934, the registrant has duly caused this report to be signed on its behalf by the undersigned thereunto duly authorized.
PHILLIPS EDISON GROCERY CENTER REIT II, INC. | ||
Date: May 10, 2018 | By: | /s/ Jeffrey S. Edison |
Jeffrey S. Edison | ||
Chairman of the Board and Chief Executive Officer | ||
(Principal Executive Officer) | ||
Date: May 10, 2018 | By: | /s/ Devin I. Murphy |
Devin I. Murphy | ||
Chief Financial Officer | ||
(Principal Financial Officer) | ||
29