Attached files
UNITED STATES SECURITIES AND EXCHANGE COMMISSION
Washington, D.C. 20549
FORM 10-K
(Mark One)
x ANNUAL REPORT PURSUANT TO SECTION 13 OR 15(d) OF THE SECURITIES EXCHANGE ACT OF 1934
For the fiscal year ended December 31, 2017
OR
¨ TRANSITION REPORT PURSUANT TO SECTION 13 OR 15(d) OF THE SECURITIES EXCHANGE ACT OF 1934
For the transition period from to
Commission file number 000-55438

PHILLIPS EDISON GROCERY CENTER REIT II, INC.
(Exact Name of Registrant as Specified in Its Charter)
Maryland | 61-1714451 |
(State or Other Jurisdiction of Incorporation or Organization) | (I.R.S. Employer Identification No.) |
11501 Northlake Drive Cincinnati, Ohio | 45249 |
(Address of Principal Executive Offices) | (Zip Code) |
(513) 554-1110
(Registrant’s Telephone Number, Including Area Code)
Securities registered pursuant to Section 12(b) of the Act:
Title of Each Class | Name of Each Exchange on Which Registered | |
None | None | |
Securities registered pursuant to Section 12(g) of the Act:
Common Stock, $0.01 par value per share
Indicate by check mark if the Registrant is a well-known seasoned issuer, as defined in Rule 405 of the Securities Act. Yes ¨ No þ
Indicate by check mark if the Registrant is not required to file reports pursuant to Section 13 or Section 15(d) of the Act. Yes ¨ No þ
Indicate by check mark whether the Registrant (1) has filed all reports required to be filed by Section 13 or 15(d) of the Securities Exchange Act of 1934 during the preceding 12 months (or for such shorter period that the Registrant was required to file such reports) and (2) has been subject to such filing requirements for the past 90 days. Yes þ No ¨
Indicate by check mark whether the Registrant has submitted electronically and posted on its corporate website, if any, every Interactive Data File required to be submitted and posted pursuant to Rule 405 of Regulation S-T (Section 232.405 of this chapter) during the preceding 12 months (or for such shorter period that the Registrant was required to submit and post such files). Yes þ No ¨
Indicate by check mark if disclosure of delinquent filers pursuant to Item 405 of Regulation S-K is not contained herein, and will not be contained, to the best of Registrant’s knowledge, in definitive proxy or information statements incorporated by reference in Part III of the Form 10-K or any amendment of this Form 10-K. ¨
Indicate by check mark whether the Registrant is a large accelerated filer, an accelerated filer, a non-accelerated filer, a smaller reporting company, or an emerging growth company. See definitions of “large accelerated filer,” “accelerated filer,” “smaller reporting company,” and “emerging growth company” in Rule 12b-2 of the Exchange Act. (Check one):
Large Accelerated Filer | ¨ | Accelerated Filer | ¨ |
Non-Accelerated Filer | þ (Do not check if a smaller reporting company) | Smaller reporting company | ¨ |
Emerging growth company | þ | ||
If an emerging growth company, indicate by check mark if the registrant has elected not to use the extended transition period for complying with any new or revised financial accounting standards provided pursuant to Section 13(a) of the Exchange Act. þ
Indicate by check mark whether the Registrant is a shell company (as defined in rule 12b-2 of the Securities Exchange Act). Yes ¨ No þ
There is no established public market for the Registrant’s shares of common stock. On May 9, 2017, the board of directors of the Registrant approved an estimated value per share of the Registrant’s common stock of $22.75 based substantially on the estimated market value of its portfolio of real estate properties as of March 31, 2017. For a full description of the methodologies used to establish the estimated value per share, see Part II, Item 5. Market for Registrant’s Common Equity, Related Stockholder Matters, and Issuer Purchases of Equity Securities - Market Information, of this Form 10-K. As of June 30, 2017, the last business day of the Registrant’s most recently completed second fiscal quarter, there were approximately 46.4 million shares of common stock held by non-affiliates.
As of March 15, 2018, there were 46.7 million outstanding shares of common stock of the Registrant.
Documents Incorporated by Reference: None
PHILLIPS EDISON GROCERY CENTER REIT II, INC.
FORM 10-K
TABLE OF CONTENTS
1
Cautionary Note Regarding Forward-Looking Statements
Certain statements contained in this Annual Report on Form 10-K of Phillips Edison Grocery Center REIT II, Inc. (“we,” the “Company,” “our,” or “us”) other than historical facts may be considered forward-looking statements within the meaning of Section 27A of the Securities Act of 1933, as amended (the “Securities Act”), and Section 21E of the Securities Exchange Act of 1934, as amended (the “Exchange Act”). We intend for all such forward-looking statements to be covered by the applicable safe harbor provisions for forward-looking statements contained in those acts. Such statements include, in particular, statements about our plans, strategies, and prospects and are subject to certain risks and uncertainties, including known and unknown risks, which could cause actual results to differ materially from those projected or anticipated. Therefore, such statements are not intended to be a guarantee of our performance in future periods. Such forward-looking statements can generally be identified by our use of forward-looking terminology such as “may,” “will,” “expect,” “intend,” “anticipate,” “estimate,” “believe,” “continue,” or other similar words. Readers are cautioned not to place undue reliance on these forward-looking statements, which speak only as of the date this report is filed with the U.S. Securities and Exchange Commission (“SEC”). We make no representations or warranties (expressed or implied) about the accuracy of any such forward-looking statements contained in this Annual Report on Form 10-K, and we do not intend to publicly update or revise any forward-looking statements, whether as a result of new information, future events, or otherwise.
Any such forward-looking statements are subject to risks, uncertainties, and other factors and are based on a number of assumptions involving judgments with respect to, among other things, future economic, competitive, and market conditions, all of which are difficult or impossible to predict accurately. To the extent that our assumptions differ from actual conditions, our ability to accurately anticipate results expressed in such forward-looking statements, including our ability to generate positive cash flows from operations, make distributions to stockholders, and maintain the value of our real estate properties, may be significantly hindered. See Item 1A. Risk Factors, herein, for a discussion of some of the risks and uncertainties, although not all of the risks and uncertainties, that could cause actual results to differ materially from those presented in our forward-looking statements. Except as required by law, we do not undertake any obligation to update or revise any forward-looking statements contained in this Form 10-K. Important factors that could cause actual results to differ materially from the forward-looking statements are disclosed in Item 1A. Risk Factors, Item 1. Business and Item 7. Management’s Discussion and Analysis of Financial Condition and Results of Operations.
All references to “Notes” throughout the document refer to the footnotes to the consolidated financial statements in Part II, Item 8. Financial Statements and Supplementary Data.
2
w PART I |
ITEM 1. BUSINESS
Overview
Phillips Edison Grocery Center REIT II, Inc. (“we,” the “Company,” “our,” or “us”) is a real estate investment trust (“REIT”) that invests primarily in well-occupied, grocery-anchored neighborhood and community shopping centers having a mix of creditworthy national and regional retailers selling necessity-based goods and services in strong demographic markets throughout the United States. In addition, we may invest in other retail properties including power and lifestyle shopping centers, multi-tenant shopping centers, free-standing single-tenant retail properties, and other real estate or real estate-related assets.
We were formed as a Maryland corporation in June 2013 and qualified as a REIT for the year ended December 31, 2014 and each year thereafter. Substantially all of our business is conducted through Phillips Edison Grocery Center Operating Partnership II, L.P. (the “Operating Partnership”), a Delaware limited partnership formed in June 2013. We are a limited partner of the Operating Partnership, and our wholly owned subsidiary, PE Grocery Center OP GP II LLC, is the sole general partner of the Operating Partnership. We closed our primary offering of shares of common stock on September 15, 2015.
Our advisor and property managers are owned by Phillips Edison & Company, Inc. and its subsidiaries (“PECO,” “Advisor” or “Manager”), formerly known as Phillips Edison Grocery Center REIT I, Inc. On October 4, 2017, PECO acquired our Advisor and Manager from Phillips Edison Limited Partnership. Under the terms of the advisory agreement (“Advisory Agreement”) and the master property management and master services agreements (“Management Agreements”) between subsidiaries of PECO and us, PECO is indirectly responsible for the management of our day-to-day activities and the implementation of our investment strategy.
As of December 31, 2017, we owned fee simple interests in 85 real estate properties, comprising 10.2 million square feet, acquired from third parties unaffiliated with us or PECO. In addition, we own a 20% equity interest in a joint venture that owned 14 properties as of December 31, 2017 (see Note 4).
Segment Data
In 2017, we modified our approach of evaluating operating segments. We internally evaluate the operating performance of our portfolio of properties and currently do not differentiate properties by geography, size, or type. As operating performance is reviewed at a portfolio level rather than at a property level, our entire portfolio of properties is considered to be one operating segment. Accordingly, we did not report any other segment disclosures in 2017.
Competition
We are subject to significant competition in seeking real estate investments and tenants. We compete with many third parties engaged in real estate investment activities including other REITs, specialty finance companies, savings and loan associations, banks, mortgage bankers, insurance companies, mutual funds, institutional investors, investment banking firms, lenders, hedge funds, governmental bodies, and other entities. Some of these competitors, including larger REITs, have substantially greater financial resources than we do and generally enjoy significant competitive advantages that result from, among other things, increased access to capital, lower cost of capital, and enhanced operating efficiencies.
Employees
We do not have any employees. In addition, all of our executive officers are also officers of PECO or one or more of its affiliates and are compensated by those entities, in part, for their service rendered to us. We do not separately compensate our executive officers for their service as officers.
Environmental Matters
As an owner of real estate, we are subject to various environmental laws of federal, state and local governments. Compliance with federal, state and local environmental laws has not had a material, adverse effect on our business, assets, results of operations, financial condition and ability to pay distributions, and we do not believe that our existing portfolio will require us to incur material expenditures to comply with these laws and regulations.
Access to Company Information
We electronically file our Annual Report on Form 10-K, Quarterly Reports on Form 10-Q, Current Reports on Form 8-K, Proxy and Information statements, and all amendments to those reports with the Securities and Exchange Commission (“SEC”). The public may read and copy any of the reports that are filed with the SEC at the SEC’s Public Reference Room at 100 F Street, NE, Washington, D.C. 20549, on official business days during the hours of 10:00 AM to 3:00 PM. The public may obtain information on the operation of the Public Reference Room by calling the SEC at (800) SEC-0330. The SEC maintains an Internet site at www.sec.gov that contains reports, proxy and information statements, and other information regarding issuers that file electronically. The contents of our website are not incorporated by reference.
We make available, free of charge, by responding to requests addressed to our investor relations group, the Annual Report on Form 10-K, Quarterly Reports on Form 10-Q, Current Reports on Form 8-K, and all amendments to those reports on our website, www.grocerycenterREIT2.com. These reports are available as soon as reasonably practicable after such material is electronically filed or furnished to the SEC.
3
ITEM 1A. RISK FACTORS
The factors described below represent our principal risks. Other factors may exist that we do not consider to be significant based on information that is currently available or that we are not currently able to anticipate. The occurrence of any of the risks discussed below could have a material adverse effect on our business, financial condition, results of operations and ability to pay distributions to our stockholders. Potential investors and our stockholders may be referred to as “they” “them” or “their” in this Item 1A. Risk Factors, section.
Risks Related to an Investment in Us
If we pay distributions from sources other than our cash flows from operations, we may not be able to sustain our distribution rate, we may have fewer funds available for investment in properties and other assets, and our stockholders’ overall returns may be reduced.
Our organizational documents permit us to pay distributions from sources other than cash flow from operations. Specifically, some or all of our distributions have been or may be paid from retained cash flow, from borrowings and from cash flow from investing activities, including the net proceeds from the sale of our assets, or from the net proceeds from the issuance of shares of our common stock. We have not established any limit on the extent to which we may use alternate sources to pay distributions. A portion of the distributions paid to stockholders to date have been paid from the net proceeds of the issuance of shares of our common stock or borrowings, which reduced the proceeds available for other purposes.
For the year ended December 31, 2017, we paid gross distributions to our common stockholders of $75.7 million, including distributions reinvested through the distribution reinvestment plan (the “DRIP”) of $36.5 million, or 48.2%, of our distributions paid. For the year ended December 31, 2017, our net cash provided by operating activities was $50.3 million, which represents a shortfall of $25.4 million, or 33.6%, of our distributions paid, while our funds from operations (“FFO”) was $63.6 million, which represents a shortfall of $12.1 million, or 15.9%, of the distributions paid. The shortfall was funded by proceeds from borrowings. To the extent we pay cash distributions, or a portion thereof, from sources other than cash flow from operations, we will have less capital available to invest in properties and other real estate-related assets, the book value per share may decline, and there will be no assurance that we will be able to sustain distributions at that level.
Because no public trading market for our shares currently exists, it is difficult for our stockholders to sell their shares and, if our stockholders are able to sell their shares, it will likely be at a substantial discount to the public offering price.
There is no public market for our shares. Until our shares are listed, if ever, stockholders may not sell their shares unless the buyer meets the applicable suitability and minimum purchase standards. Under the share repurchase program (“SRP”), we repurchase shares at a price in place at the time of the repurchase and not based on the price at which our stockholders initially purchased their shares. It is likely we will repurchase fewer shares than have been requested to be repurchased due to lack of readily available funds under the SRP. While we have a limited SRP, in its sole discretion, our board of directors could amend, suspend or terminate our SRP upon 30 days’ notice. Further, the SRP includes numerous restrictions that would limit a stockholder’s ability to sell his or her shares to us. These restrictions may limit our ability to repurchase shares submitted to us under the SRP.
Therefore, it is difficult for our stockholders to sell their shares promptly or at all. If a stockholder is able to sell his or her shares, it would likely be at a substantial discount to the public offering price. It is also likely that our shares would not be accepted as the primary collateral for a loan.
Because of the illiquid nature of our shares, investors should purchase our shares only as a long-term investment and be prepared to hold them for an indefinite period of time.
Our stockholders are limited in their ability to sell their shares pursuant to our SRP and may have to hold their shares for an indefinite period of time.
Our board of directors may amend the terms of our SRP without stockholder approval. Our board of directors also is free to suspend or terminate the program upon 30 days’ notice or to reject any request for repurchase. In addition, the SRP includes numerous restrictions that would limit our stockholder’s ability to sell their shares. Once our shares are transferred for value by a stockholder, the transferee and all subsequent holders of the shares are not eligible to participate in the SRP. The maximum amount of common stock that we may repurchase at the stockholder’s election during any calendar year is limited, among other things, to 5% of the weighted-average number of shares outstanding during the prior calendar year. The maximum amount is reduced each reporting period by the current year share repurchases to date. In addition, the cash available for repurchases on any particular date is generally limited to the proceeds from the DRIP during the preceding four fiscal quarters, less amounts already used for repurchases since the beginning of that period. These limits might prevent us from accommodating all repurchase requests made in any year. These restrictions severely limit your ability to sell your shares should you require liquidity, and limit your ability to recover the value you invested or the fair market value of your shares. As of December 31, 2017, we had surpassed the funding limits of the SRP and had approximately 573,000 shares of unfulfilled repurchase requests.
The actual value of shares that we repurchase under our SRP may be less than what we pay.
We repurchase shares under our SRP at the estimated value per share of our common stock, which was $22.75 as of December 31, 2017. This value is likely to differ from the price at which a stockholder could resell his or her shares. Thus, when we repurchase shares of our common stock, the repurchase may be dilutive to our remaining stockholders.
We may change our targeted investments without stockholder consent.
Our portfolio is primarily invested in well-occupied, grocery-anchored neighborhood and community shopping centers leased to a mix of national, regional, and local creditworthy tenants selling necessity-based goods and services in strong demographic markets throughout the United States. Though this is our current target portfolio, we may make adjustments to our target portfolio based on real estate market conditions and investment opportunities, and we may change our targeted
4
investments and investment guidelines at any time without the consent of our stockholders, which could result in our making investments that are different from, and possibly riskier than, our current targeted investments. A change in our targeted investments or investment guidelines may increase our exposure to interest rate risk, default risk and real estate market fluctuations, all of which could adversely affect the value of our common stock and our ability to make distributions to our stockholders.
Because we are dependent upon PECO and its affiliates to conduct our operations, any adverse changes in the financial health of PECO or its affiliates, or our relationship with them, could hinder our operating performance and the return on our stockholders’ investments.
We are dependent on PECO, which is responsible for our day-to-day operations and is primarily responsible for the selection of our investments. We are also dependent on PECO to manage our portfolio of real estate assets. PECO depends upon the fees and other compensation that it receives from us in connection with the purchase, management and sale of assets to conduct its operations. Any adverse changes in the financial condition of PECO or certain of their affiliates, or in our relationship with them, could hinder their ability to successfully manage our operations and our portfolio of investments.
The loss of or the inability to obtain key real estate professionals at PECO could delay or hinder implementation of our investment strategies, which could limit our ability to make distributions and decrease the value of our stockholders’ investments.
Our success depends to a significant degree upon the contributions of Jeffrey S. Edison, our chief executive officer, R. Mark Addy, our president and chief operating officer, and Devin I. Murphy, our chief financial officer. We do not have employment agreements with these individuals, and they may not remain associated with us. If any of these persons were to cease their association with us, our operating results could suffer. We do not intend to maintain key person life insurance on any person. Our future success depends, in large part, upon PECO and its affiliates’ ability to hire and retain highly skilled managerial, operational and marketing professionals. Competition for such professionals is intense, and PECO and its affiliates may be unsuccessful in attracting and retaining such skilled individuals. We may be unsuccessful in establishing strategic relationships with firms that have special expertise in certain services or detailed knowledge regarding real properties in certain geographic regions. Maintaining such relationships will be important for us to effectively compete with other investors for properties and tenants in such regions. We may be unsuccessful in establishing and retaining such relationships. If we lose or are unable to obtain the services of highly skilled professionals or do not establish or maintain appropriate strategic relationships, our ability to implement our investment strategies could be delayed or hindered, and the value of our stockholders’ investments may decline.
Our business and operations would suffer in the event of system failures.
Despite system redundancy, the implementation of security measures and the existence of a disaster recovery plan for our internal information technology systems, our systems are vulnerable to damages from any number of sources, including computer viruses, unauthorized access, energy blackouts, natural disasters, terrorism, war and telecommunication failures. Any system failure that causes interruptions in our operations could result in a material disruption to our business. We may also incur additional costs to remedy damages caused by such disruptions.
The occurrence of cyber incidents, or a deficiency in our cybersecurity or the cybersecurity of PECO and its affiliates, could negatively impact our business by causing a disruption to our operations, a compromise or corruption of our confidential information, and/or damage to our business relationships, all of which could negatively impact our financial results.
A cyber incident is considered to be any adverse event that threatens the confidentiality, integrity, or availability of our information resources. More specifically, a cyber incident is an intentional attack or an unintentional event that can include gaining unauthorized access to systems to disrupt operations, corrupt data, or steal confidential information. As our reliance on technology has increased, so have the risks posed to our systems, both internal and those we have outsourced. Our three primary risks that could directly result from the occurrence of a cyber incident include operational interruption, damage to our relationship with our tenants, and private data exposure. We have implemented processes, procedures and controls to help mitigate these risks, but these measures, as well as our increased awareness of a risk of a cyber incident, do not guarantee that our financial results will not be negatively impacted by such an incident.
Our board of directors may explore strategic alternatives for the Company. If we list our common stock on a national securities exchange, consummate a merger, or pursue another exit strategy in the near term, stockholders may not receive an amount per share equal to our estimated value per share.
Our estimated value per share of $22.75 did not take into account estimated disposition costs and fees for real estate properties, entity liquidation costs, and debt prepayment penalties that could apply upon the prepayment of certain of our debt obligations. These costs may be substantial. Thus, to the extent we list our common stock on a national securities exchange, consummate a merger, or pursue another exit strategy in the near term, stockholders may not recover the estimated value per share due to the impact of these fees and costs.
Risks Related to Conflicts of Interest
Our sponsor and its affiliates, including all of our executive officers, one of our directors and other key real estate professionals, face conflicts of interest caused by their compensation arrangements with us, which could result in actions that are not in the long-term best interests of our stockholders.
PECO and its affiliates receive substantial fees from us. These fees could influence PECO’s advice to us as well as their judgment with respect to:
• | the continuation, renewal or enforcement of our agreements with PECO and its affiliates, including the Advisory Agreement and the Management Agreements; |
5
• | sales of properties and other investments to third parties, which entitle PECO and the special limited partner to disposition fees and possible subordinated incentive fees; |
• | acquisitions of properties and other investments from other PECO-sponsored programs, which might entitle its affiliates to disposition fees and possible subordinated incentive fees and distributions in connection with its services for the seller; |
• | acquisitions of properties and other investments from third parties, which entitle PECO to acquisition and asset management compensation; |
• | borrowings to acquire properties and other investments, which borrowings increase the acquisition and asset management compensation payable to PECO; |
• | whether and when we seek to list our common stock on a national securities exchange, which listing could entitle the special limited partner to a subordinated incentive listing distribution; and |
• | whether and when we seek to sell the Company or its assets, which sale could entitle PECO to a subordinated participation in net sales proceeds. |
The fees PECO receives in connection with transactions involving the acquisition of assets are based initially on the cost of the investment, and are not based on the quality of the investment or the quality of the services rendered to us. This may influence PECO to recommend riskier transactions to us. In addition, because the fees are based on the cost of the investment, it may create an incentive for PECO to recommend that we purchase assets with more debt and at higher prices.
The management of multiple REITs by the officers of PECO may significantly reduce the amount of time the officers of PECO are able to spend on activities related to us and may cause other conflicts of interest, which may cause our operating results to suffer.
The officers of the Advisor are part of the senior management or are key personnel of PECO and Phillips Edison Grocery Center REIT III, Inc. (“REIT III”), a REIT sponsored by PECO. As a result, PECO and REIT III may have overlapping acquisition, operational, disposition and liquidation phases as us, which may cause conflicts of interest to arise throughout the life of our Company with respect to, among other things, locating and acquiring properties, entering into leases and disposing of properties. The conflicts of interest each of the officers of the Advisor faces due to the competing time demands may cause our operating results to suffer.
Our sponsor faces conflicts of interest relating to the acquisition of assets and leasing of properties, and such conflicts may not be resolved in our favor, meaning that we could invest in less attractive assets and obtain less creditworthy tenants, which could limit our ability to make distributions and reduce our stockholders’ overall investment returns.
We rely on our sponsor and the executive officers and other key real estate professionals at PECO to identify suitable investment opportunities for us. The other key real estate professionals of PECO are also the key real estate professionals at our sponsor and its other public and private programs. Many investment opportunities that are suitable for us may also be suitable for other PECO-sponsored programs. Thus, the executive officers and real estate processionals of PECO could direct attractive investment opportunities to other entities or investors. Such events could result in us investing in properties that provide less attractive returns, which may reduce our ability to make distributions. We and other PECO-sponsored programs also rely on these real estate professionals to supervise the property management and leasing of properties. If the Manager directs creditworthy prospective tenants to properties owned by another PECO-sponsored program when they could direct such tenants to our properties, our tenant base may have more inherent risk than might otherwise be the case. Further, these executive officers and key real estate professionals are not prohibited from engaging, directly or indirectly, in any business or from possessing interests in any other business venture or ventures, including businesses and ventures involved in the acquisition, development, ownership, leasing or sale of real estate investments.
PECO faces conflicts of interest relating to the incentive fee structure, which could result in actions that are not necessarily in the long-term best interests of our stockholders.
Under our Advisory Agreement and the limited partnership agreement of our Operating Partnership, or the partnership agreement, our special limited partner and its affiliates will be entitled to fees, distributions and other amounts that are structured in a manner intended to provide incentives to PECO to perform in our best interests and in the best interests of our stockholders. However, because PECO does not maintain a significant equity interest in us and is entitled to receive substantial minimum compensation regardless of performance, its interests are not wholly aligned with those of our stockholders. In that regard, PECO could be motivated to recommend riskier or more speculative investments in order for us to generate the specified levels of performance or sales proceeds that would entitle our special limited partner to fees. In addition, our special limited partner and its affiliates’ entitlement to fees and distributions upon the sale of our assets and to participate in sale proceeds could result in PECO recommending sales of our investments at the earliest possible time at which sales of investments would produce the level of return that would entitle PECO and its affiliates to compensation relating to such sales, even if continued ownership of those investments might be in our best long-term interest. The partnership agreement will require us to pay a performance-based termination distribution to PECO if we terminate the Advisory Agreement and an affiliate of PECO does not become our new advisor prior to the listing of our shares for trading on an exchange or, absent such listing, in respect of its participation in net sales proceeds. To avoid paying this fee, our independent directors may decide against terminating the Advisory Agreement prior to our listing of our shares or disposition of our investments even if, but for the termination distribution, termination of the Advisory Agreement would be in our best interest. In addition, the requirement to pay the distribution to our special limited partner at termination could cause us to make different investment or disposition decisions than we would otherwise make, in order to satisfy our obligation to pay the distribution to the terminated advisor. Moreover, PECO will have the right to terminate the Advisory Agreement upon a change of control of our Company and thereby trigger the payment of the termination distribution, which could have the effect of delaying, deferring or preventing the change of control. In addition, PECO will be entitled to an annual subordinated performance fee for any year in which our total return on stockholders’ capital exceeds 6% per annum. PECO will be entitled to 15% of the amount in excess of such 6%
6
per annum, provided that the amount paid to PECO does not exceed 10% of the aggregate total return for such year. For a more detailed discussion of the fees payable to PECO and its affiliates in connection with the management of our Company, see Note 12 to the consolidated financial statements.
PECO will face conflicts of interest relating to joint ventures that we may form with affiliates of our sponsor, which conflicts could result in a disproportionate benefit to the other venture partners at our expense.
If approved by a majority of our board of directors, including a majority of our independent directors not otherwise interested in the transaction, and as permitted under the best practices guidelines on affiliated transaction adopted by our board of directors, we may enter into joint venture agreements with other sponsor-affiliated programs or entities for the acquisition, development or improvement of properties or other investments. All of our executive officers, some of our directors and the key real estate professionals assembled by the Advisor are also executive officers, directors, managers, key professionals or holders of a direct or indirect controlling interest in PECO or other PECO-affiliated entities. These persons will face conflicts of interest in determining which PECO-affiliated program should enter into any particular joint venture agreement. These persons may also face a conflict in structuring the terms of the relationship between our interests and the interests of the PECO-affiliated co-venturer and in managing the joint venture. Any joint venture agreement or transaction between us and a PECO-affiliated co-venturer will not have the benefit of arm’s-length negotiation of the type normally conducted between unrelated co-venturers. The PECO-affiliated co-venturer may have economic or business interests or goals that are or may become inconsistent with our business interests or goals. These co-venturers may thus benefit to our and our stockholders detriment.
Our sponsor, our officers, PECO, and the real estate and other professionals assembled by PECO face competing demands relating to their time, and this may cause our operations and our stockholders’ investments to suffer.
We rely on PECO for the day-to-day operation of our business. In addition, PECO has the primary responsibility for the selection of our investments. PECO makes major decisions affecting us under the direction of our board of directors. Our officers are principals and executives of PECO and the affiliates that manage the assets of the other PECO-sponsored programs. As a result of their interests in other PECO-sponsored programs, their obligations to other investors and the fact that they engage in and they will continue to engage in other business activities, these individuals will continue to face conflicts of interest in allocating their time among us and other PECO-sponsored programs. The officers of PECO devote a substantial portion of their time to PECO and REIT III, and PECO and REIT III continue to acquire assets similar to the assets which we intend to acquire, and our officers will have to allocate their time and resources to acquiring assets for PECO and REIT III while we are seeking to acquire properties. Should PECO breach its fiduciary duties to us by inappropriately devoting insufficient time or resources to our business, the returns on our investments, and the value of our stockholders’ investments, may decline.
All of our executive officers, one of our directors and the key real estate and other professionals assembled by PECO face conflicts of interest related to their positions or interests in affiliates of our sponsor, which could hinder our ability to implement our business strategy and to generate returns to our stockholders.
All of our executive officers, one of our directors and the key real estate and other professionals assembled by PECO are also executive officers, directors, managers, key professionals or holders of a direct or indirect controlling interests in PECO, or other PECO-affiliated entities. Through our sponsor’s affiliates, some of these persons work on behalf of other PECO-sponsored public and private programs. As a result, they have loyalties to each of these entities, which loyalties could conflict with the fiduciary duties they owe to us and could result in action or inaction detrimental to our business. Conflicts with our business and interests are most likely to arise from (1) allocation of new investments and management time and services between us and the other entities, (2) our purchase of properties from, or sale of properties to, affiliated entities, (3) development of our properties by affiliates, (4) investments with affiliates of PECO, (5) compensation to PECO, and (6) our relationship with PECO. If we do not successfully implement our business strategy, we may be unable to generate the cash needed to make distributions to our stockholders and to maintain or increase the value of our assets.
Risks Related to Our Corporate Structure
We use an estimated value per share that is based on a number of assumptions that may not be accurate or complete.
To assist members of the Financial Industry Regulatory Authority (“FINRA”) and their associated persons that participated in our initial public offering, pursuant to applicable FINRA and National Association of Securities Dealers (“NASD”) conduct rules, we disclose in each annual report distributed to stockholders a per share estimated value of our shares, the method by which it was developed, and the date of the data used to develop the estimated value. For this purpose, PECO initially estimated the value of our common shares as $25.00 per share based on the offering price of our shares of common stock in our initial public offering of $25.00 per share (ignoring purchase price discounts for certain categories of purchasers). On May 9, 2017, our board of directors established an estimated value per share of our common stock of $22.75 based substantially on the estimated market value of our portfolio of real estate properties in various geographic locations in the United States as of March 31, 2017, as indicated in a third party valuation report. We expect to update the estimated value per share of our common stock annually.
Our estimated value per share is based upon a number of estimates and assumptions that may not be accurate or complete. Different parties with different assumptions and estimates could derive a different estimated value per share, and this difference could be significant. The estimated value per share is not audited and does not represent a determination of the fair value of our assets or liabilities based on U.S. generally accepted accounting principles (“GAAP”), nor does it represent a liquidation value of our assets and liabilities or the amount at which our shares of common stock would trade if they were listed on a national securities exchange. Accordingly, with respect to the estimated value per share, there can be no assurance that: (1) a stockholder would be able to resell his or her shares at the estimated value per share; (2) a stockholder would ultimately realize distributions per share equal to our estimated value per share upon liquidation of our assets and settlement of our liabilities or a sale of our Company; (3) our shares of common stock would trade at the estimated value per share on a national securities exchange; (4) a third party would offer the estimated value per share in an arm’s-length transaction to purchase all or substantially all of our shares of common stock; (5) an independent third-party appraiser or third-party
7
valuation firm would agree with our estimated value per share; or (6) the methodology used to calculate our estimated value per share would be acceptable to FINRA or for compliance with Employee Retirement Income Security Act of 1974 (“ERISA”) reporting requirements.
Further, we have not made any adjustments to the valuation to the estimated value per share for the impact of other transactions occurring subsequent to March 31, 2017, including, but not limited to, (1) the issuance of common stock under the DRIP, (2) net operating income earned and dividends declared, (3) the repurchase of shares and (4) changes in leases, tenancy or other business or operational changes. The value of our shares will fluctuate over time in response to developments related to individual real estate assets, the management of those assets and changes in the real estate and finance markets. Because of, among other factors, the high concentration of our total assets in real estate and the number of shares of our common stock outstanding, changes in the value of individual real estate assets or changes in valuation assumptions could have a very significant impact on the value of our shares. In addition, the estimated value per share does not reflect a discount for the fact that we are externally managed. The estimated value per share also does not take into account any disposition costs or fees for real estate properties, debt prepayment penalties that could apply upon the prepayment of certain of our debt obligations or the impact of restrictions on the assumption of debt. Accordingly, the estimated value per share of our common stock may or may not be an accurate reflection of the fair market value of our stockholders’ investments and will not likely represent the amount of net proceeds that would result from an immediate sale of our assets.
The limit on the number of shares a person may own may discourage a takeover that could otherwise result in a premium price to our stockholders.
Our charter, with certain exceptions, authorizes our directors to take such actions as are necessary and desirable to preserve our qualification as a REIT. Unless exempted by our board of directors, no person may own more than 9.8% in value of the aggregate of our outstanding shares of stock or more than 9.8% (in value or in number of shares, whichever is more restrictive) of any class or series of shares of our stock. This restriction may have the effect of delaying, deferring or preventing a change in control of us, including an extraordinary transaction (such as a merger, tender offer or sale of all or substantially all our assets) that might provide a premium price for holders of our common stock.
Our charter permits our board of directors to issue stock with terms that may subordinate the rights of common stockholders or discourage a third party from acquiring us in a manner that might result in a premium price to our stockholders.
Our charter permits our board of directors to issue up to 1.01 billion shares of stock. In addition, our board of directors, without any action by our stockholders, may amend our charter from time to time to increase or decrease the aggregate number of shares or the number of shares of any class or series of stock that we have authority to issue. Our board of directors may classify or reclassify any unissued common stock or preferred stock into other classes or series of stock and establish the preferences, conversion or other rights, voting powers, restrictions, limitations as to dividends or other distributions, qualifications and terms or conditions of redemption of any such stock. Thus, our board of directors could authorize the issuance of preferred stock with terms and conditions that could have a priority as to distributions and amounts payable upon liquidation over the rights of the holders of our common stock. Preferred stock could also have the effect of delaying, deferring or preventing a change in control of us, including an extraordinary transaction (such as a merger, tender offer or sale of all or substantially all our assets) that might provide a premium price for holders of our common stock.
Although we are not currently afforded certain protections of the Maryland General Corporation Law relating to deterring or defending hostile takeovers, our board of directors could opt into these provisions of Maryland law in the future, which may discourage others from trying to acquire control of us and may prevent our stockholders from receiving a premium price for their stock in connection with a business combination.
Under Maryland law, “business combinations” between a Maryland corporation and certain interested stockholders or affiliates of interested stockholders are prohibited for five years after the most recent date on which the interested stockholder becomes an interested stockholder. These business combinations include a merger, consolidation, share exchange, or, in circumstances specified in the statute, an asset transfer or issuance or reclassification of equity securities. Also under Maryland law, control shares of a Maryland corporation acquired in a control share acquisition have no voting rights except to the extent approved by stockholders by a vote of two-thirds of the votes entitled to be cast on the matter. Should our board opt into these provisions of Maryland law, it may discourage others from trying to acquire control of us and increase the difficulty of consummating any offer. Similarly, provisions of Title 3, Subtitle 8 of the Maryland General Corporation Law could provide similar anti-takeover protection.
Maryland law limits the ability of a third party to buy a large stake in us and exercise voting power in electing directors, which may discourage a takeover that could otherwise result in a premium price to our stockholders.
The Maryland Control Share Acquisition Act provides that “control shares” of a Maryland corporation acquired in a “control share acquisition” have no voting rights except to the extent approved by stockholders by a vote of two-thirds of the votes entitled to be cast on the matter. Shares of stock owned by the acquirer, by officers or by employees who are directors of the corporation, are excluded from shares entitled to vote on the matter. “Control shares” are voting shares of stock which, if aggregated with all other shares of stock owned by the acquirer or in respect of which the acquirer can exercise or direct the exercise of voting power (except solely by virtue of a revocable proxy), would entitle the acquirer to exercise voting power in electing directors within specified ranges of voting power. Control shares do not include shares the acquiring person is then entitled to vote as a result of having previously obtained stockholder approval. A “control share acquisition” means, subject to certain exceptions, the acquisition of issued and outstanding control shares. The control share acquisition statute does not apply (a) to shares acquired in a merger, consolidation or share exchange if the corporation is a party to the transaction, or (b) to acquisitions approved or exempted by the charter or bylaws of the corporation. Our bylaws contain a provision exempting from the Maryland Control Share Acquisition Act any and all acquisitions of our stock by any person. There can be no assurance that this provision will not be amended or eliminated at any time in the future.
8
Our stockholders have limited voting rights under our charter and Maryland law.
Pursuant to Maryland law and our charter, our stockholders are entitled to vote only on the following matters without concurrence of the board: (1) election or removal of directors; (2) amendment of the charter, as provided in Article XIII of the charter; (3) dissolution of us; and (4) to the extent required under Maryland law, merger or consolidation of us or the sale or other disposition of all or substantially all of our assets. With respect to all other matters, our board of directors must first adopt a resolution declaring that a proposed action is advisable and direct that such matter be submitted to our stockholders for approval or ratification. These limitations on voting rights may limit our stockholders’ ability to influence decisions regarding our business.
Our stockholders’ interests in us will be diluted if we issue additional shares, which could reduce the overall value of our stockholders’ investment.
Our common stockholders do not have preemptive rights to any shares we issue in the future. Our charter authorizes us to issue 1.01 billion shares of capital stock, of which 1 billion shares are classified as common stock and 0.01 billion shares are classified as preferred stock. Our board may elect to (1) sell additional shares in future public offerings, (2) issue equity interests in private offerings, (3) issue share-based awards to our independent directors or to our officers or employees or to the officers or employees of PECO or any of its affiliates, (4) issue shares to PECO or its successors or assigns in payment of an outstanding fee obligation or (5) issue shares of our common stock to sellers of properties or assets we acquire in connection with an exchange of limited partnership interests of the Operating Partnership. To the extent we issue additional equity interests, our stockholders’ percentage ownership interest in us will be diluted. In addition, depending upon the terms and pricing of any additional offerings and the value of our real estate investments, our investors may also experience dilution in the book value and fair value of their shares.
Payment of fees to PECO and its affiliates reduce cash available for investment and distribution and increases the risk that our stockholders will not be able to recover the amount of their investments in our shares.
PECO and its affiliates perform or performed services for us in connection with the sale of shares in our initial public offering, the selection and acquisition of our investments, the management and leasing of our properties and the administration of our other investments. We currently pay or have paid them substantial fees for these services, which results in immediate dilution to the value of our stockholders’ investments and reduces the amount of cash available for investment or distribution to stockholders. We may also pay significant fees during our listing/liquidation stage. Although most of the fees payable during our listing/liquidation stage are contingent on our stockholders first enjoying agreed upon investment returns, the investment-return thresholds may be reduced subject to approval by our conflicts committee and the other limitations in our charter.
Therefore, these fees increase the risk that the amount available for distribution to common stockholders upon a liquidation of our portfolio would be less than the price paid by our stockholders to purchase shares in our initial public offering. These substantial fees and other payments also increase the risk that our stockholders will not be able to resell their shares at a profit, even if our shares are listed on a national securities exchange.
General Risks Related to Investments in Real Estate
Our operating results will be affected by economic and regulatory changes that have an adverse impact on the real estate market in general, and we cannot assure our stockholders that we will be profitable or that we will realize growth in the value of our real estate properties.
Our operating results are subject to risks generally incident to the ownership of real estate, including:
• | changes in general economic or local conditions; |
• | changes in supply of or demand for similar or competing properties in an area; |
• | vacancies, changes in market rental rates and the need to periodically repair, renovate and re-let space; |
• | changes in interest rates and availability of permanent mortgage financing that may render the sale of a property difficult or unattractive; |
• | periods of high interest rates and tight money supply; |
• | changes in tax, real estate, environmental and zoning laws; and |
• | periods of high interest rates and tight money supply. |
These and other reasons may prevent us from being profitable or from realizing growth or maintaining the value of our real estate properties.
We depend on our tenants for revenue, and, accordingly, our revenue and our ability to make distributions to our stockholders is dependent upon the success and economic viability of our tenants.
We depend upon tenants for revenue. Rising vacancies across commercial real estate have resulted in increased pressure on real estate investors and their property managers to find new tenants and keep existing tenants. A property may incur vacancies either by the expiration of a tenant lease, the continued default of a tenant under its lease or the early termination of a lease by a tenant. If vacancies continue for a long period of time, we may suffer reduced revenues resulting in less cash available to distribute to stockholders. In order to maintain tenants, we may have to offer inducements, such as free rent and tenant improvements, to compete for attractive tenants. In addition, if we are unable to attract additional or replacement tenants, the resale value of the property could be diminished, even below our cost to acquire the property, because the market value of a particular property depends principally upon the value of the cash flow generated by the leases associated with that property. Such a reduction on the resale value of a property could also reduce the value of our stockholders’ investments.
9
Our revenue will be affected by the success and economic viability of our anchor retail tenants. Our reliance on single or significant tenants in certain buildings may decrease our ability to lease vacated space and adversely affect the returns on our stockholders’ investments.
In the retail sector, a tenant occupying all or a large portion of the gross leasable area of a retail center, commonly referred to as an anchor tenant, may become insolvent, may suffer a downturn in business, may decide not to renew its lease, or may decide to cease its operations at the retail center but continue to pay rent. Any of these events could result in a reduction or cessation in rental payments to us and could adversely affect our financial condition. A lease termination or cessation of operations by an anchor tenant could result in lease terminations or reductions in rent by other tenants whose leases may permit cancellation or rent reduction if another tenant terminates its lease or ceases its operations at that shopping center. In such event, we may be unable to re-lease the vacated space. Similarly, the leases of some anchor tenants may permit the anchor tenant to transfer its lease to another retailer. The transfer to a new anchor tenant could cause customer traffic in the retail center to decrease and thereby reduce the income generated by that retail center. A lease transfer to a new anchor tenant could also allow other tenants to make reduced rental payments or to terminate their leases. In the event that we are unable to re-lease the vacated space to a new anchor tenant, we may incur additional expenses in order to re-model the space to be able to re-lease the space to more than one tenant.
If we are unable to obtain funding for future capital needs, cash distributions to our stockholders and the value of our investments could decline.
When tenants do not renew their leases or otherwise vacate their space, we will often need to expend substantial funds for improvements to the vacated space in order to attract replacement tenants. Even when tenants do renew their leases, we may agree to make improvements to their space as part of our negotiation. If we need additional capital in the future to improve or maintain our properties or for any other reason, we may have to obtain financing from sources, beyond our funds from operations, such as borrowings or future equity offerings. These sources of funding may not be available on attractive terms or at all. If we cannot procure additional funding for capital improvements, our investments may generate lower cash flows or decline in value, or both, which would limit our ability to make distributions to our stockholders and could reduce the value of their investment.
A high concentration of our properties in a particular geographic area, with tenants in a similar industry, or a large number of tenants that are affiliated with a single company, would magnify the effects of downturns in that geographic area, industry, or company and have a disproportionate adverse effect on the value of our investments.
In the event that we have a concentration of properties in any particular geographic area, any adverse situation that disproportionately affects that geographic area would have a magnified adverse effect on our portfolio. Similarly, if tenants of our properties are concentrated in a certain industry or retail category or if we have a large number of tenants that are affiliated with a single company, any adverse effect to that industry, retail category or company generally would have a disproportionately adverse effect on our portfolio.
As of December 31, 2017, our real estate investments in Florida, California, and Georgia represented 15.1%, 13.4%, and 11.0% of our annualized base rent (“ABR”), respectively. As a result, the geographic concentration of our portfolio makes it particularly susceptible to adverse economic developments in those real estate markets. Any adverse economic or real estate developments in those markets, such as business layoffs or downsizing, industry slowdowns, relocations of businesses, changing demographics, natural disasters and other factors, or any decrease in demand for shopping center space resulting from the local business climate, could adversely affect our operating results and our ability to make distributions to stockholders.
Competition with other retail channels may reduce our profitability and the return on our stockholders investment.
Our retail tenants will face potentially changing consumer preferences and increasing competition from other forms of retailing, such as online retailers, discount shopping centers, outlet centers, upscale neighborhood strip centers, catalogues and other forms of direct marketing, discount shopping clubs, and telemarketing. Other retail centers within the market area of our properties will compete with our properties for customers, affecting their tenants’ cash flows and thus affecting their ability to pay rent. In addition, some of our tenants’ rent payments may be based on the amount of sales revenue that they generate. If these tenants experience competition, the amount of their rent may decrease, and our cash flow will decrease.
If we enter into long-term leases with retail tenants, those leases may not result in fair value over time, which could adversely affect our revenues and ability to make distributions.
Long-term leases do not typically allow for significant changes in rental payments and do not expire in the near term. If we do not accurately judge the potential for increases in market rental rates when negotiating these long-term leases, significant increases in future property operating costs could result in receiving less than fair value from these leases. These circumstances would adversely affect our revenues and funds available for distribution.
The bankruptcy or insolvency of a major tenant may adversely impact our operations and our ability to pay distributions to stockholders.
The bankruptcy or insolvency of a significant tenant or a number of smaller tenants may have an adverse impact on financial condition and our ability to pay distributions to our stockholders. Generally, under bankruptcy law, a debtor tenant has 120 days to exercise the option of assuming or rejecting the obligations under any unexpired lease for nonresidential real property, which period may be extended once by the bankruptcy court. If the tenant assumes its lease, the tenant must cure all defaults under the lease and may be required to provide adequate assurance of its future performance under the lease. If the tenant rejects the lease, we will have a claim against the tenant’s bankruptcy estate. Although rent owing for the period between filing for bankruptcy and rejection of the lease may be afforded administrative expense priority and paid in full, pre-bankruptcy arrears and amounts owing under the remaining term of the lease will be afforded general unsecured claim status (absent collateral securing the claim). Moreover, amounts owing under the remaining term of the lease will be capped. Other
10
than equity and subordinated claims, general unsecured claims are the last claims paid in a bankruptcy, and therefore funds may not be available to pay such claims in full. See Item 2. Properties, for information related to concentration of our tenants.
Competition with third parties in acquiring properties and other investments may reduce our profitability and the return on our stockholders’ investments.
We compete with many other entities engaged in real estate investment activities, including individuals, corporations, bank and insurance company investment accounts, other REITs, real estate limited partnerships, and other entities engaged in real estate investment activities, many of which have greater resources than we do. Larger REITs may enjoy significant competitive advantages that result from, among other things, a lower cost of capital and enhanced operating efficiencies. In addition, the number of entities and the amount of funds competing for suitable investments may increase. Any such increase would result in increased demand for these assets and therefore increased prices paid for them. If we pay higher prices for properties and other investments, our profitability will be reduced, and our stockholders may experience a lower return on their investment.
In our due diligence review of potential investments, we may rely on third-party consultants and advisors and representations made by sellers of potential portfolio properties, and we may not identify all relevant facts that may be necessary or helpful in evaluating potential investments.
Before making investments, PECO will typically conduct due diligence that we deem reasonable and appropriate based on the facts and circumstances applicable to each investment. Due diligence may entail evaluation of important and complex business, financial, tax, accounting, environmental and legal issues. Outside consultants, legal advisors, accountants, investment banks and other third parties may be involved in the due diligence process to varying degrees depending on the type of investment, the costs of which will be borne by us. Such involvement of third-party advisors or consultants may present a number of risks primarily relating to PECO’s reduced control of the functions that are outsourced. In addition, if PECO is unable to timely engage third-party providers, the ability to evaluate and acquire more complex targets could be adversely affected. When conducting due diligence and making an assessment regarding a potential investment, PECO will rely on the resources available to it, including information provided by the target of the investment and, in some circumstances, third-party investigations. The due diligence investigation that PECO carries out with respect to any investment opportunity may not reveal or highlight all relevant facts that may be necessary or helpful in evaluating such investment opportunity. Moreover, such an investigation will not necessarily result in the investment being successful. There can be no assurance that attempts to provide downside protection with respect to investments, including pursuant to risk management procedures described in this prospectus, will achieve their desired effect and potential investors should regard an investment in us as being speculative and having a high degree of risk.
There can be no assurance that PECO will be able to detect or prevent irregular accounting, employee misconduct or other fraudulent practices during the due diligence phase or during our efforts to monitor the investment on an ongoing basis or that any risk management procedures implemented by us will be adequate. In the event of fraud by the seller of any portfolio property, we may suffer a partial or total loss of capital invested in that property. An additional concern is the possibility of material misrepresentation or omission on the part of the seller. Such inaccuracy or incompleteness may adversely affect the value of our investments in such portfolio property. We will rely upon the accuracy and completeness of representations made by sellers of portfolio properties in the due diligence process to the extent reasonable when we make our investments, but cannot guarantee such accuracy or completeness.
We may be unable to successfully integrate and operate acquired properties, which may have a material adverse effect on our business and operating results.
Even if we are able to make acquisitions on favorable terms, we may not be able to successfully integrate and operate them. We may be required to invest significant capital and resources after an acquisition to maintain or grow the properties that we acquire. In addition, we may need to adapt our management, administrative, accounting, and operational systems, or hire and retain sufficient operational staff, to integrate and manage successfully any future acquisitions of additional assets. These and other integration efforts may disrupt our operations, divert PECO’s attention away from day-to-day operations and cause us to incur unanticipated costs. The difficulties of integration may be increased by the necessity of coordinating operations in geographically dispersed locations. Our failure to integrate successfully any acquisitions into our portfolio could have a material adverse effect on our business and operating results. Further, acquired properties may have liabilities or adverse operating issues that we fail to discover through due diligence prior to the acquisition. The failure to discover such issues prior to such acquisition could have a material adverse effect on our business and results of operations.
Changes in supply of or demand for similar real properties in a particular area may increase the price of real properties we seek to purchase and decrease the price of real properties when we seek to sell them.
The real estate industry is subject to market forces. We are unable to predict certain market changes including changes in supply of, or demand for, similar real properties in a particular area. Any potential purchase of an overpriced asset could decrease our rate of return on these investments and result in lower operating results and overall returns to our stockholders.
We may be unable to adjust our portfolio in response to changes in economic or other conditions or sell a property if or when we decide to do so, limiting our ability to pay cash distributions to our stockholders.
Many factors that are beyond our control affect the real estate market and could affect our ability to sell properties for the price, on the terms or within the time frame that we desire. These factors include general economic conditions, the availability of financing, interest rates and other factors, including supply and demand. Because real estate investments are relatively illiquid, we have a limited ability to vary our portfolio in response to changes in economic or other conditions. Further, before we can sell a property on the terms we want, it may be necessary to expend funds to correct defects or to make improvements. However, we can give no assurance that we will have the funds available to correct such defects or to make such improvements. We may be unable to sell our properties at a profit. Our inability to sell properties at the time and on the terms we want could reduce our cash flow and limit our ability to make distributions to our stockholders and could reduce the value of our stockholders’ investments. Moreover, in acquiring a property, we may agree to restrictions that prohibit the sale
11
of that property for a period of time or impose other restrictions, such as a limitation on the amount of debt that can be placed or repaid on that property. We cannot predict the length of time needed to find a willing purchaser and to close the sale of a property. Our inability to sell a property when we desire to do so may cause us to reduce our selling price for the property. Any delay in our receipt of proceeds, or diminishment of proceeds, from the sale of a property could adversely affect our ability to pay distributions to our stockholders.
We have acquired, and may continue to acquire or finance, properties with lock-out provisions, which may prohibit us from selling a property, or may require us to maintain specified debt levels for a period of years on some properties.
A lock-out provision is a provision that prohibits the prepayment of a loan during a specified period of time. Lock-out provisions may include terms that provide strong financial disincentives for borrowers to prepay their outstanding loan balance and exist in order to protect the yield expectations of lenders. We currently own properties, and may acquire additional properties in the future, that are subject to lock-out provisions. Lock-out provisions could materially restrict us from selling or otherwise disposing of or refinancing properties when we may desire to do so. Lock-out provisions may prohibit us from reducing the outstanding indebtedness with respect to any properties, refinancing such indebtedness on a non-recourse basis at maturity, or increasing the amount of indebtedness with respect to such properties. Lock-out provisions could impair our ability to take other actions during the lock-out period that could be in the best interests of our stockholders and, therefore, may have an adverse impact on the value of our shares relative to the value that would result if the lock-out provisions did not exist. In particular, lock-out provisions could preclude us from participating in major transactions that could result in a disposition of our assets or a change in control even though that disposition or change in control might be in the best interests of our stockholders.
Joint venture investments could be adversely affected by our lack of sole decision-making authority, our reliance on the financial condition of co-venturers and disputes between us and our co-venturers.
We may enter into joint ventures, partnerships and other co-ownership arrangements (including preferred equity investments) for the purpose of making investments. In such event, we would not be in a position to exercise sole decision-making authority regarding the joint venture. For example, in our joint venture with an affiliate of TPG Real Estate, our wholly-owned subsidiary has customary approval rights in respect of major decisions, but does not have the right to cause or prohibit various material transactions, including acquisitions, dispositions, financings, significant leasing, causing the joint venture to make distributions, significant capital expenditures and related investment decisions or actions in respect of litigation. Investments in joint ventures may, under certain circumstances, involve risks not present were a third party not involved, including the possibility that partners or co-venturers might become bankrupt or fail to fund their required capital contributions. Co-venturers may have economic or other business interests or goals which are inconsistent with our business interests or goals, and may be in a position to take actions contrary to our policies or objectives. Such investments may also have the potential risk of impasses on decisions, such as a sale, because neither we nor the co-venturer would have full control over the joint venture. Disputes between us and co-venturers may result in litigation or arbitration that would increase our expenses and prevent our officers and/or directors from focusing their time and effort on our business. Consequently, actions by or disputes with co-venturers might result in subjecting properties owned by the joint venture to additional risk. In addition, we may in certain circumstances be liable for the actions of our co-venturers.
If we set aside insufficient capital reserves, we may be required to defer necessary capital improvements.
If we do not have enough reserves for capital to supply needed funds for capital improvements throughout the life of the investment in a property and there is insufficient cash available from our operations, we may be required to defer necessary improvements to a property, which may cause that property to suffer from a greater risk of obsolescence or a decline in value, or a greater risk of decreased cash flow as a result of fewer potential tenants being attracted to the property. If this happens, we may not be able to maintain projected rental rates for affected properties, and our results of operations may be negatively impacted.
Our operating expenses may increase in the future and, to the extent such increases cannot be passed on to tenants, our cash flow and our operating results would decrease.
Operating expenses, such as expenses for fuel, utilities, labor and insurance, are not fixed and may increase in the future. There is no guarantee that we will be able to pass such increases on to our tenants. To the extent such increases cannot be passed on to tenants, any such increase would cause our cash flow and our operating results to decrease.
Our real properties are subject to property and other taxes that may increase in the future, which could adversely affect our cash flow.
Our real properties are subject to property and other taxes that may increase as tax rates change and as the real properties are assessed or reassessed by taxing authorities. We anticipate that certain of our leases will generally provide that the property taxes, or increases therein, are charged to the lessees as an expense related to the real properties that they occupy, while other leases will generally provide that we are responsible for such taxes. In any case, as the owner of the properties, we are ultimately responsible for payment of the taxes to the applicable government authorities. If taxes increase, our tenants may be unable to make the required tax payments, ultimately requiring us to pay the taxes even if otherwise stated under the terms of the lease. If we fail to pay any such taxes, the applicable taxing authority may place a lien on the real property and the real property may be subject to a tax sale. In addition, we are generally responsible for real property taxes related to any vacant space.
Uninsured losses relating to real property or excessively expensive premiums for insurance coverage could reduce our cash flows and the return on our stockholders’ investments.
There are types of losses, generally catastrophic in nature, such as losses due to wars, acts of terrorism, earthquakes, floods, hurricanes, pollution or environmental matters, which are uninsurable or not economically insurable, or may be insured subject to limitations, such as large deductibles or co-payments. Insurance risks associated with potential acts of terrorism could sharply increase the premiums we pay for coverage against property and casualty claims. Additionally, mortgage lenders
12
in some cases have begun to insist that commercial property owners purchase coverage against terrorism as a condition for providing mortgage loans. Such insurance policies may not be available at reasonable costs, if at all, which could inhibit our ability to finance or refinance our properties. In such instances, we may be required to provide other financial support, either through financial assurances or self-insurance, to cover potential losses. We may not have adequate, or any, coverage for such losses. Changes in the cost or availability of insurance could expose us to uninsured casualty losses. If any of our properties incur a casualty loss that is not fully insured, the value of our assets will be reduced by any such uninsured loss, which may reduce the value of our stockholders’ investments. In addition, other than any working capital reserve or other reserves we may establish, we have no source of funding to repair or reconstruct any uninsured property. Also, to the extent we must pay unexpectedly large amounts for insurance, we could suffer reduced earnings that would result in lower distributions to stockholders. The Terrorism Risk Insurance Act of 2002 is designed for a sharing of terrorism losses between insurance companies and the federal government.
Costs of complying with governmental laws and regulations related to environmental protection and human health and safety may reduce our net income and the cash available for distributions to our stockholders.
Real property and the operations conducted on real property are subject to federal, state and local laws and regulations relating to protection of the environment and human health. We could be subject to liability in the form of fines, penalties or damages for noncompliance with these laws and regulations. These laws and regulations generally govern wastewater discharges, air emissions, the operation and removal of underground and above-ground storage tanks, the use, storage, treatment, transportation and disposal of solid and hazardous materials, the remediation of contamination associated with the release or disposal of solid and hazardous materials, the presence of toxic building materials, and other health and safety-related concerns.
Some of these laws and regulations may impose joint and several liability on the tenants, owners or operators of real property for the costs to investigate or remediate contaminated properties, regardless of fault, whether the contamination occurred prior to purchase, or whether the acts causing the contamination were legal. Our tenants’ operations, the condition of properties at the time we buy them, operations in the vicinity of our properties, such as the presence of underground storage tanks, or activities of unrelated third parties may affect our properties.
The presence of hazardous substances, or the failure to properly manage or remediate these substances, may hinder our ability to sell, rent or pledge such property as collateral for future borrowings. Environmental laws also may impose liens on property or restrictions on the manner in which property may be used or businesses may be operated, and these restrictions may require substantial expenditures or prevent us from entering into leases with prospective tenants that may be impacted by such laws. Some of these laws and regulations have been amended so as to require compliance with new or more stringent standards as of future dates. Compliance with new or more stringent laws or regulations or stricter interpretation of existing laws may require us to incur material expenditures. Future laws, ordinances or regulations may impose material environmental liability. Any material expenditures, fines, penalties, or damages we must pay will reduce our ability to make distributions and may reduce the value of our stockholders’ investments.
We could become subject to liability for environmental violations, regardless of whether we caused such violations.
We could become subject to liability in the form of fines or damages for noncompliance with environmental laws and regulations. These laws and regulations generally govern wastewater discharges, air emissions, the operation and removal of underground and above-ground storage tanks, the use, storage, treatment, transportation and disposal of solid hazardous materials, the remediation of contaminated property associated with the disposal of solid and hazardous materials and other health and safety-related concerns. Some of these laws and regulations may impose joint and several liability on tenants, owners or managers for the costs of investigation or remediation of contaminated properties, regardless of fault or the legality of the original disposal. Under various federal, state and local environmental laws, ordinances, and regulations, a current or former owner or manager of real property may be liable for the cost to remove or remediate hazardous or toxic substances, wastes, or petroleum products on, under, from, or in such property. These costs could be substantial and liability under these laws may attach whether or not the owner or manager knew of, or was responsible for, the presence of such contamination. Even if more than one person may have been responsible for the contamination, each liable party may be held entirely responsible for all of the clean-up costs incurred.
In addition, third parties may sue the owner or manager of a property for damages based on personal injury, natural resources, or property damage and/or for other costs, including investigation and clean-up costs, resulting from the environmental contamination. The presence of contamination on one of our properties, or the failure to properly remediate a contaminated property, could give rise to a lien in favor of the government for costs it may incur to address the contamination, or otherwise adversely affect our ability to sell or lease the property or borrow using the property as collateral. In addition, if contamination is discovered on our properties, environmental laws may impose restrictions on the manner in which the property may be used or businesses may be operated, and these restrictions may require substantial expenditures or prevent us from entering into leases with prospective tenants. There can be no assurance that future laws, ordinances or regulations will not impose any material environmental liability, or that the environmental condition of our properties will not be affected by the operations of the tenants, by the existing condition of the land, by operations in the vicinity of the properties. There can be no assurance that these laws, or changes in these laws, will not have a material adverse effect on our business, results of operations or financial condition.
Compliance or failure to comply with the Americans with Disabilities Act could result in substantial costs and may decrease cash available for distributions.
Our properties are, or may become subject to the Americans with Disabilities Act of 1990, as amended, or the Disabilities Act. Under the Disabilities Act, all places of public accommodation are required to comply with federal requirements related to access and use by disabled persons. The Disabilities Act has separate compliance requirements for “public accommodations” and “commercial facilities” that generally require that buildings and services be made accessible and available to people with disabilities. The Disabilities Act’s requirements could require removal of access barriers and could result in the imposition of injunctive relief, monetary penalties or, in some cases, an award of damages. We will attempt to acquire properties that
13
comply with the Disabilities Act or place the burden on the seller or other third party, such as a tenant, to ensure compliance with the Disabilities Act. We cannot assure our stockholders that we will be able to acquire properties or allocate responsibilities in this manner. Any of our funds used for Disabilities Act compliance will reduce our net income and the amount of cash available for distributions to our stockholders.
Risks Associated with Debt Financing
We have incurred mortgage indebtedness, and we are likely to incur other indebtedness, which increases our business risks, could hinder our ability to pay distributions and could decrease the value of our stockholders’ investment.
We expect that in most instances, we will acquire real properties by using either existing financing or borrowing new funds. In addition, we may incur mortgage debt and pledge all or some of our real properties as security for that debt to obtain funds to acquire additional real properties. We may also borrow if we need funds to satisfy the REIT tax qualification requirement that we generally distribute annually to our stockholders at least 90% of our REIT taxable income (which does not equal net income as calculated in accordance with GAAP, determined without regard to the deduction for dividends paid and excluding net capital gain. We also may borrow if we otherwise deem it necessary or advisable to assure that we maintain our qualification as a REIT.
There is no limitation on the amount we may borrow under our charter. High debt levels would cause us to incur higher interest charges, would result in higher debt service payments and could be accompanied by restrictive covenants. These factors could limit the amount of cash we have available to distribute and could result in a decline in the value of our stockholders investment.
If there is a shortfall between the cash flow from a property and the cash flow needed to service mortgage debt on a property, then the amount available for distributions to stockholders may be reduced. In addition, incurring mortgage debt increases the risk of loss since defaults on indebtedness secured by a property may result in lenders initiating foreclosure actions. In that case, we could lose the property securing the loan that is in default, thus reducing the value of our stockholders investment. For U.S. federal income tax purposes, a foreclosure of any of our properties would be treated as a sale of the property for a purchase price equal to the outstanding balance of the debt secured by the mortgage. If the outstanding balance of the debt secured by the mortgage exceeds our tax basis in the property, we would recognize taxable income on foreclosure, but would not receive any cash proceeds. In such event, we may be unable to pay the amount of distributions required in order to maintain our REIT status. We may give full or partial guarantees to lenders of mortgage debt to the entities that own our properties. When we provide a guaranty on behalf of an entity that owns one of our properties, we will be responsible to the lender for satisfaction of the debt if it is not paid by such entity. If any mortgages contain cross-collateralization or cross-default provisions, a default on a single property could affect multiple properties. If any of our properties are foreclosed upon due to a default, our ability to pay cash distributions to our stockholders will be adversely affected which could result in our losing our REIT status and would result in a decrease in the value of our stockholders investment.
Increases in interest rates could increase the amount of our debt payments and adversely affect our ability to pay distributions to our stockholders.
We have incurred debt and we expect that we will incur additional debt in the future. To the extent that we incur variable rate debt, increases in interest rates would increase our interest costs, which could reduce our cash flows and our ability to pay distributions to our stockholders. In addition, if we need to repay existing debt during periods of rising interest rates, we could be required to liquidate one or more of our investments in properties at times that may not permit realization of the maximum return on such investments.
If mortgage debt is unavailable at reasonable rates, we may not be able to finance the purchase of properties. If we place mortgage debt on properties, we run the risk of being unable to refinance the properties when the debt becomes due or of being unable to refinance on favorable terms. If interest rates are higher when we refinance the properties, our income could be reduced. We may be unable to refinance properties. If any of these events occurs, our cash flow would be reduced. This, in turn, would reduce cash available for distribution to our stockholders and may hinder our ability to raise capital by issuing more stock or borrowing more money.
We may not be able to access financing sources on attractive terms, which could adversely affect our ability to execute our business plan.
We may finance our assets over the long-term through a variety of means, including repurchase agreements, credit facilities, issuance of commercial mortgage-backed securities, collateralized debt obligations and other structured financings. Our ability to execute this strategy will depend on various conditions in the markets for financing in this manner that are beyond our control, including lack of liquidity and greater credit spreads. We cannot be certain that these markets will remain an efficient source of long-term financing for our assets. If our strategy is not viable, we will have to find alternative forms of long-term financing for our assets, as secured revolving credit facilities and repurchase facilities may not accommodate long-term financing. This could subject us to more recourse indebtedness and the risk that debt service on less efficient forms of financing would require a larger portion of our cash flows, thereby reducing cash available for distribution to our stockholders and funds available for operations as well as for future business opportunities.
Lenders may require us to enter into restrictive covenants relating to our operations, which could limit our ability to make distributions to our stockholders.
When providing financing, a lender may impose restrictions on us that affect our distribution and operating policies and our ability to incur additional debt. Loan agreements we enter may contain covenants that limit our ability to further mortgage a property, discontinue insurance coverage or replace PECO. In addition, loan documents may limit our ability to replace a property’s property manager or terminate certain operating or lease agreements related to a property. These or other limitations would decrease our operating flexibility and our ability to achieve our operating objectives, which may adversely affect our ability to make distributions to our stockholders.
14
Our derivative financial instruments that we may use to hedge against interest rate fluctuations may not be successful in mitigating our risks associated with interest rates and could reduce the overall returns on our stockholders’ investments.
We may use derivative financial instruments to hedge exposures to changes in interest rates on loans secured by our assets, but no hedging strategy can protect us completely. We cannot assure our stockholders that our hedging strategy and the derivatives that we use will adequately offset the risk of interest rate volatility or that our hedging transactions will not result in losses. In addition, the use of such instruments may reduce the overall return on our investments. These instruments may also generate income that may not be treated as qualifying REIT income for purposes of the 75% gross income test or 95% gross income test.
Interest-only and adjustable rate indebtedness may increase our risk of default and ultimately may reduce our funds available for distribution to our stockholders.
We may finance our property acquisitions using interest-only mortgage indebtedness. During the interest-only period, the amount of each scheduled payment will be less than that of a traditional amortizing mortgage loan. The principal balance of the mortgage loan will not be reduced (except in the case of prepayments) because there are no scheduled monthly payments of principal during this period. After the interest-only period, we will be required either to make scheduled payments of amortized principal and interest or to make a lump-sum or balloon payment at maturity. These required principal or balloon payments will increase the amount of our scheduled payments and may increase our risk of default under the related mortgage loan. Our ability to make a balloon payment at maturity is uncertain and may depend upon our ability to obtain additional financing or our ability to sell the property. At the time the balloon payment is due, we may or may not be able to refinance the balloon payment on terms as favorable as the original loan or sell the property at a price sufficient to make the balloon payment. The effect of a refinancing or sale could affect the rate of return to stockholders and the projected time of disposition of our assets. In addition, payments of principal and interest made to service our debts may leave us with insufficient cash to pay the distributions that we are required to pay to maintain our qualification as a REIT. Any of these results would have a significant, negative impact on our stockholders’ investments.
Finally, if the mortgage loan has an adjustable interest rate, the amount of our scheduled payments also may increase at a time of rising interest rates. Increased payments and substantial principal or balloon maturity payments will reduce the funds available for distribution to our stockholders because cash otherwise available for distribution will be required to pay principal and interest associated with these mortgage loans.
U.S. Federal Income Tax Risks
Our failure to continue to qualify as a REIT would subject us to federal income tax and reduce cash available for distribution to our stockholders.
We elected to be taxed as a REIT under the Code commencing with our taxable year ended December 31, 2014. We intend to continue to operate in a manner so as to continue to qualify as a REIT for federal income tax purposes. Qualification as a REIT involves the application of highly technical and complex Code provisions for which only a limited number of judicial and administrative interpretations exist. Even an inadvertent or technical mistake could jeopardize our REIT status. Our continued qualification as a REIT will depend on our satisfaction of certain asset, income, organizational, distribution, stockholder ownership and other requirements on a continuing basis. Moreover, new tax legislation, administrative guidance or court decisions, in each instance potentially with retroactive effect, could make it more difficult or impossible for us to continue to qualify as a REIT. If we fail to continue to qualify as a REIT in any taxable year, we would be subject to federal and applicable state and local income tax on our taxable income at corporate rates, in which case we might be required to borrow or liquidate some investments in order to pay the applicable tax. Losing our REIT status would reduce our net income available for investment or distribution to you because of the additional tax liability. In addition, distributions to our stockholders would no longer qualify for the dividends-paid deduction and we would no longer be required to make distributions. Furthermore, if we fail to qualify as a REIT in any taxable year for which we have elected to be taxed as a REIT, we would generally be unable to elect REIT status for the four taxable years following the year in which our REIT status is lost.
Complying with REIT requirements may force us to borrow funds to make distributions to you or otherwise depend on external sources of capital to fund such distributions.
To continue to qualify as a REIT, we are required to distribute annually at least 90% of our taxable income, subject to certain adjustments, to our stockholders. To the extent that we satisfy the distribution requirement, but distribute less than 100% of our taxable income, we will be subject to federal corporate income tax on our undistributed taxable income. In addition, we may elect to retain and pay income tax on our net long-term capital gain. In that case, if we so elect, a stockholder would be taxed on its proportionate share of our undistributed long-term gain and would receive a credit or refund for its proportionate share of the tax we paid. A stockholder, including a tax-exempt or foreign stockholder, would have to file a federal income tax return to claim that credit or refund. Furthermore, we will be subject to a 4% nondeductible excise tax if the actual amount that we distribute to our stockholders in a calendar year is less than a minimum amount specified under federal tax laws.
From time-to-time, we may generate taxable income greater than our net income (loss) for GAAP. In addition, our taxable income may be greater than our cash flow available for distribution to you as a result of, among other things, investments in assets that generate taxable income in advance of the corresponding cash flow from the assets (for instance, if a borrower defers the payment of interest in cash pursuant to a contractual right or otherwise).
If we do not have other funds available in the situations described in the preceding paragraphs, we could be required to borrow funds on unfavorable terms, sell investments at disadvantageous prices or find another alternative source of funds to make distributions sufficient to enable us to distribute enough of our taxable income to satisfy the REIT distribution requirement and to avoid corporate income tax and the 4% excise tax in a particular year. These alternatives could increase our costs or reduce our equity.
15
Because of the distribution requirement, it is unlikely that we will be able to fund all future capital needs, including capital needs in connection with investments, from cash retained from operations. As a result, to fund future capital needs, we likely will have to rely on third-party sources of capital, including both debt and equity financing, which may or may not be available on favorable terms or at all. Our access to third-party sources of capital will depend upon a number of factors, including our current and potential future earnings and cash distributions.
Despite our qualification for taxation as a REIT for federal income tax purposes, we may be subject to other tax liabilities that reduce our cash flow and our ability to make distributions to our stockholders.
Despite our qualification for taxation as a REIT for federal income tax purposes, we may be subject to certain federal, state and local taxes on our income and assets, including taxes on any undistributed income or property. Any of these taxes would decrease cash available for distribution to our stockholders. For instance:
• | In order to continue to qualify as a REIT, we must distribute annually at least 90% of our REIT taxable income (which is determined without regard to the dividends paid deduction or net capital gain for this purpose) to our stockholders. |
• | To the extent that we satisfy the distribution requirement but distribute less than 100% of our REIT taxable income, we will be subject to federal corporate income tax on the undistributed income. |
• | We will be subject to a 4% nondeductible excise tax on the amount, if any, by which distributions we pay in any calendar year are less than the sum of 85% of our ordinary income, 95% of our capital gain net income and 100% of our undistributed income from prior years. |
• | If we have net income from the sale of foreclosure property that we hold primarily for sale to customers in the ordinary course of business or other non-qualifying income from foreclosure property, we must pay a tax on that income at the highest corporate income tax rate. |
• | If we sell an asset, other than foreclosure property, that we hold primarily for sale to customers in the ordinary course of business and do not qualify for a safe harbor in the Code, our gain would be subject to the 100% “prohibited transaction” tax. |
• | Any domestic taxable REIT subsidiary, or TRS, of ours will be subject to federal corporate income tax on its income, and on any non-arm’s-length transactions between us and any TRS, for instance, excessive rents charged to a TRS could be subject to a 100% tax. |
• | We may be subject to tax on income from certain activities conducted as a result of taking title to collateral. |
• | We may be subject to state or local income, property and transfer taxes, such as mortgage recording taxes. |
Complying with REIT requirements may cause us to forego otherwise attractive opportunities or liquidate otherwise attractive investments.
To continue to qualify as a REIT for federal income tax purposes, we must continually satisfy tests concerning, among other things, the sources of our income, the nature and diversification of our assets, the amounts we distribute to stockholders and the ownership of our stock. As discussed above, we may be required to make distributions to you at disadvantageous times or when we do not have funds readily available for distribution. Additionally, we may be unable to pursue investments that would be otherwise attractive to us in order to satisfy the requirements for qualifying as a REIT.
We must also ensure that at the end of each calendar quarter, at least 75% of the value of our assets consists of cash, cash items, government securities and qualified real estate assets, including certain mortgage loans and mortgage-backed securities. The remainder of our investment in securities (other than government securities and qualified real estate assets) generally cannot include more than 10% of the outstanding voting securities of any one issuer or more than 10% of the total value of the outstanding securities of any one issuer. In addition, in general, no more than 5% of the value of our assets can consist of the securities of any one issuer (other than government securities and qualified real estate assets) and no more than 20% of the value of our gross assets (25% for tax years before 2018) may be represented by securities of one or more TRSs. Finally, for the taxable years after 2015, no more than 25% of our assets may consist of debt investments that are issued by “publicly offered REITs” and would not otherwise be treated as qualifying real estate assets. If we fail to comply with these requirements at the end of any calendar quarter, we must correct such failure within 30 days after the end of the calendar quarter to avoid losing our REIT status and suffering adverse tax consequences, unless certain relief provisions apply. As a result, compliance with the REIT requirements may hinder our ability to operate solely on the basis of profit maximization and may require us to liquidate investments from our portfolio, or refrain from making, otherwise attractive investments. These actions could have the effect of reducing our income and amounts available for distribution to stockholders.
Complying with REIT requirements may limit our ability to hedge effectively.
The REIT provisions of the Code may limit our ability to hedge our operations effectively. Our aggregate gross income from non-qualifying hedges, fees and certain other non-qualifying sources cannot exceed 5% of our annual gross income. As a result, we might have to limit our use of advantageous hedging techniques or implement those hedges through a TRS. Any hedging income earned by a TRS would be subject to federal, state and local income tax at regular corporate rates. This could increase the cost of our hedging activities or expose us to greater risks associated with interest rate or other changes than we would otherwise incur.
Liquidation of assets may jeopardize our REIT qualification.
To continue to qualify as a REIT, we must comply with requirements regarding our assets and our sources of income. If we are compelled to liquidate our investments to satisfy our obligations to our lenders, we may be unable to comply with these requirements, ultimately jeopardizing our qualification as a REIT, or we may be subject to a 100% prohibited transaction tax on any resulting gain if we sell assets that are treated as dealer property or inventory.
16
The prohibited transactions tax may limit our ability to engage in transactions, including disposition of assets and certain methods of securitizing loans, which would be treated as sales for federal income tax purposes.
A REIT’s net income from prohibited transactions is subject to a 100% tax. In general, prohibited transactions are sales or other dispositions of dealer property, other than foreclosure property, but including loans held primarily for sale to customers in the ordinary course of business. We might be subject to the prohibited transaction tax if we were to dispose of or securitize loans in a manner that is treated as a sale of the loans, for federal income tax purposes. In order to avoid the prohibited transactions tax, we may choose not to engage in certain sales of loans and may limit the structures we use for any securitization financing transactions, even though such sales or structures might otherwise be beneficial to us. Additionally, we may be subject to the prohibited transaction tax upon a disposition of real property. Although a safe-harbor exception to prohibited transaction treatment is available, we cannot assure you that we can comply with such safe harbor or that we will avoid owning property that may be characterized as held primarily for sale to customers in the ordinary course of our trade or business. Consequently, we may choose not to engage in certain sales of real property or may conduct such sales through a TRS.
It may be possible to reduce the impact of the prohibited transaction tax by conducting certain activities through a TRS. However, to the extent that we engage in such activities through a TRS, the income associated with such activities will be subject to a corporate income tax. In addition, the IRS may attempt to ignore or otherwise recast such activities in order to impose a prohibited transaction tax on us, and there can be no assurance that such recast will not be successful.
We also may not be able to use secured financing structures that would create taxable mortgage pools, other than in a TRS or through a subsidiary REIT.
We may recognize substantial amounts of REIT taxable income, which we would be required to distribute to our stockholders, in a year in which we are not profitable under GAAP principles or other economic measures.
We may recognize substantial amounts of REIT taxable income in years in which we are not profitable under GAAP or other economic measures as a result of the differences between GAAP and tax accounting methods. For instance, certain of our assets will be marked-to-market for GAAP purposes but not for tax purposes, which could result in losses for GAAP purposes that are not recognized in computing our REIT taxable income. Additionally, we may deduct our capital losses only to the extent of our capital gains in computing our REIT taxable income for a given taxable year. Consequently, we could recognize substantial amounts of REIT taxable income and would be required to distribute such income to you, in a year in which we are not profitable under GAAP or other economic measures.
REIT distribution requirements could adversely affect our ability to execute our business plan.
We generally must distribute annually at least 90% of our REIT taxable income (which is determined without regard to the dividends paid deduction or net capital gain for this purpose) in order to continue to qualify as a REIT. We intend to make distributions to our stockholders to comply with the REIT requirements of the Code and to avoid corporate income tax and the 4% excise tax. We may be required to make distributions to stockholders at times when it would be more advantageous to reinvest cash in our business or when we do not have funds readily available for distribution. Thus, compliance with the REIT requirements may hinder our ability to operate solely on the basis of maximizing profits.
Our qualification as a REIT could be jeopardized as a result of an interest in joint ventures or investment funds.
We may hold certain limited partner or non-managing member interests in partnerships or limited liability companies that are joint ventures or investment funds. If a partnership or limited liability company in which we own an interest takes or expects to take actions that could jeopardize our qualification as a REIT or require us to pay tax, we may be forced to dispose of our interest in such entity. In addition, it is possible that a partnership or limited liability company could take an action which could cause us to fail a REIT gross income or asset test, and that we would not become aware of such action in time to dispose of our interest in the partnership or limited liability company or take other corrective action on a timely basis. In that case, we could fail to continue to qualify as a REIT unless we are able to qualify for a statutory REIT “savings” provision, which may require us to pay a significant penalty tax to maintain our REIT qualification.
Distributions paid by REITs do not qualify for the reduced tax rates that apply to other corporate distributions.
The maximum tax rate for “qualified dividends” paid by corporations to non-corporate stockholders is currently 20%. Distributions paid by REITs, however, generally are taxed at ordinary income rates (subject to a maximum rate of 37.0% for non-corporate stockholders), provided individuals may be able to deduct 20% of income received as ordinary REIT dividends, thus reducing the maximum effective federal income tax rate on such dividends, rather than the preferential rate applicable to qualified dividends.
Changes recently made to the U.S. tax laws could have a negative impact on our business.
The President signed a tax reform bill into law on December 22, 2017 (the “Tax Cuts and Jobs Act”). Among other things, the Tax Cuts and Jobs Act:
• | Reduces the corporate income tax rate from 35% to 21% (including with respect to our taxable REIT subsidiary); |
• | Reduces the rate of U.S. federal withholding tax on distributions made to non-U.S. stockholders by a REIT that are attributable to gains from the sale or exchange of U.S. real property interests from 35% to 21%; |
• | Allows an immediate 100% deduction of the cost of certain capital asset investments (generally excluding real estate assets), subject to a phase-down of the deduction percentage over time; |
• | Changes the recovery periods for certain real property and building improvements (for example, to 15 years for qualified improvement property under the modified accelerated cost recovery system, and to 30 years (previously 40 years) for residential real property and 20 years (previously 40 years) for qualified improvement property under the alternative depreciation system); |
17
• | Restricts the deductibility of interest expense by businesses (generally, to 30% of the business’ adjusted taxable income) except, among others, real property businesses electing out of such restriction; we have not yet determined whether we and/or our subsidiaries can and/or will make such an election; |
• | Requires the use of the less favorable alternative depreciation system to depreciate real property in the event a real property business elects to avoid the interest deduction restriction above; |
• | Restricts the benefits of like-kind exchanges that defer capital gains for tax purposes to exchanges of real property; |
• | Permanently repeals the “technical termination” rule for partnerships, meaning sales or exchanges of the interests in a partnership will be less likely to, among other things, terminate the taxable year of, and restart the depreciable lives of assets held by, such partnership for tax purposes; |
• | Requires accrual method taxpayers to take certain amounts in income no later than the taxable year in which such income is taken into account as revenue in an applicable financial statement prepared under GAAP, which, with respect to certain leases, could accelerate the inclusion of rental income; |
• | Eliminates the federal corporate alternative minimum tax; |
• | Reduces the highest marginal income tax rate for individuals to 37% from 39.6% (excluding, in each case, the 3.8% Medicare tax on net investment income); |
• | Generally allows a deduction for individuals equal to 20% of certain income from pass-through entities, including ordinary dividends distributed by a REIT (excluding capital gain dividends and qualified dividend income), generally resulting in a maximum effective federal income tax rate applicable to such dividends of 29.6% compared to 37% (excluding, in each case, the 3.8% Medicare tax on net investment income); and |
• | Limits certain deductions for individuals, including deductions for state and local income taxes, and eliminates deductions for miscellaneous itemized deductions (including certain investment expenses). |
Many of the provisions in the Tax Cuts and Jobs Act, in particular those affecting individual taxpayers, expire at the end of 2025.
As a result of the changes to U.S. federal tax laws implemented by the Tax Cuts and Jobs Act, our taxable income and the amount of distributions to our stockholders required in order to maintain our REIT status, and our relative tax advantage as a REIT, could change. As a REIT, we are required to distribute at least 90% of our taxable income to our stockholders annually.
The Tax Cuts and Jobs Act is a complex revision to the U.S. federal income tax laws with various impacts on different categories of taxpayers and industries, and will require subsequent rulemaking and interpretation in a number of areas. The long-term impact of the Tax Cuts and Jobs Act on the overall economy, government revenues, our tenants, us, and the real estate industry cannot be reliably predicted at this time. Furthermore, the Tax Cuts and Jobs Act may negatively impact certain of our tenants’ operating results, financial condition, and future business plans. The Tax Cuts and Jobs Act may also result in reduced government revenues, and therefore reduced government spending, which may negatively impact some of our tenants that rely on government funding. There can be no assurance that the Tax Cuts and Jobs Act will not negatively impact our operating results, financial condition, and future business operations.
Retirement Plan Risks
If the fiduciary of an employee benefit plan subject to ERISA (such as a profit sharing, Section 401(k) or pension plan) or an owner of a retirement arrangement subject to Section 4975 of the Code (such as an IRA) fails to meet the fiduciary and other standards under ERISA or the Code as a result of an investment in our stock, the fiduciary could be subject to penalties and other sanctions.
There are special considerations that apply to employee benefit plans subject to ERISA (such as profit sharing, Section 401(k) or pension plans) and other retirement plans or accounts subject to Section 4975 of the Code (such as an IRA) that are investing in our shares. Fiduciaries and IRA owners investing the assets of such a plan or account in our common stock should satisfy themselves that:
• | the investment is consistent with their fiduciary and other obligations under ERISA and the Code; |
• | the investment is made in accordance with the documents and instruments governing the plan or IRA, including the plan’s or account’s investment policy; |
• | the investment satisfies the prudence and diversification requirements of Sections 404(a)(1)(B) and 404(a)(1)(C) of ERISA and other applicable provisions of ERISA and the Code; |
• | the investment in our shares, for which no public market currently exists, is consistent with the liquidity needs of the plan or IRA; |
• | the investment will not produce an unacceptable amount of “unrelated business taxable income” for the plan or IRA; |
• | our stockholders will be able to comply with the requirements under ERISA and the Code to value the assets of the plan or IRA annually; and |
• | the investment will not constitute a prohibited transaction under Section 406 of ERISA or Section 4975 of the Code. |
Failure to satisfy the fiduciary standards of conduct and other applicable requirements of ERISA and the Code may result in the imposition of civil and criminal penalties and could subject the fiduciary to claims for damages or for equitable remedies, including liability for investment losses. In addition, if an investment in our shares constitutes a prohibited transaction under ERISA or the Code, the fiduciary or IRA owner who authorized or directed the investment may be subject to the imposition of excise taxes with respect to the amount invested. In addition, the investment transaction must be undone. In the case of a
18
prohibited transaction involving an IRA owner, the IRA may be disqualified as a tax-exempt account and all of the assets of the IRA may be deemed distributed and subjected to tax. ERISA plan fiduciaries and IRA owners should consult with counsel before making an investment in our common stock.
If our assets are deemed to be plan assets, PECO and we may be exposed to liabilities under Title I of ERISA and the Code.
In some circumstances where an ERISA plan holds an interest in an entity, the assets of the entity are deemed to be ERISA plan assets unless an exception applies. This is known as the “look-through rule.” Under those circumstances, the obligations and other responsibilities of plan sponsors, plan fiduciaries and plan administrators, and of parties in interest and disqualified persons, under Title I of ERISA or Section 4975 of the Code, may be applicable, and there may be liability under these and other provisions of ERISA and the Code. We believe that our assets should not be treated as plan assets because the shares should qualify as “publicly-offered securities” that are exempt from the look-through rules under applicable Treasury Regulations. We note, however, that because certain limitations are imposed upon the transferability of shares so that we may qualify as a REIT, and perhaps for other reasons, it is possible that this exemption may not apply. If that is the case, and if PECO or we are exposed to liability under ERISA or the Code, our performance and results of operations could be adversely affected.
If our stockholders invested in our shares through an IRA or other retirement plan, they may be limited in their ability to withdraw required minimum distributions.
If our stockholders established an IRA or other retirement plan through which they invested in our shares, federal law may require them to withdraw required minimum distributions, or RMDs, from such plan in the future. Our SRP limits the amount of repurchases (other than those repurchases as a result of a stockholder’s death or disability) that can be made in a given year. Additionally, our stockholders will not be eligible to have their shares repurchased until they have held their shares for at least one year. As a result, they may not be able to have their shares repurchased at a time in which they need liquidity to satisfy the RMD requirements under their IRA or other retirement plan. Even if they are able to have their shares repurchased, such repurchase may be at a price less than the price at which the shares were initially purchased, depending on how long they have held their shares. If they fail to withdraw RMDs from their IRA or other retirement plan, they may be subject to certain tax penalties.
ITEM 1B. UNRESOLVED STAFF COMMENTS
Not applicable.
19
ITEM 2. PROPERTIES
Real Estate Investments
As of December 31, 2017, we wholly-owned 85 properties throughout the United States, acquired from third parties unaffiliated with us or PECO. We also owned 14 properties through a joint venture in which we own a 20% equity interest. The following table presents information regarding the geographical location of our wholly-owned properties, by annual base rent (“ABR”), as of December 31, 2017 (dollars and square feet in thousands). For additional portfolio information, refer to Schedule III - Real Estate Assets and Accumulated Depreciation herein.
State | ABR(1) | % ABR | ABR/Leased Square Feet | GLA(2) | % GLA | %Leased | Number of Properties | ||||||||||||||||
Florida | $ | 18,528 | 15.1 | % | $ | 11.42 | 1,750 | 17.1 | % | 92.7 | % | 17 | |||||||||||
California | 16,349 | 13.4 | % | 16.05 | 1,049 | 10.3 | % | 97.1 | % | 11 | |||||||||||||
Georgia | 13,482 | 11.0 | % | 11.30 | 1,235 | 12.1 | % | 96.6 | % | 9 | |||||||||||||
Texas | 10,834 | 8.9 | % | 16.53 | 671 | 6.6 | % | 97.6 | % | 7 | |||||||||||||
Colorado | 7,553 | 6.2 | % | 14.78 | 554 | 5.4 | % | 92.3 | % | 4 | |||||||||||||
Ohio | 6,721 | 5.5 | % | 9.77 | 740 | 7.2 | % | 93.0 | % | 6 | |||||||||||||
Illinois | 6,593 | 5.4 | % | 12.91 | 551 | 5.4 | % | 92.7 | % | 4 | |||||||||||||
Wisconsin | 4,482 | 3.7 | % | 8.71 | 522 | 5.1 | % | 98.6 | % | 3 | |||||||||||||
Minnesota | 4,435 | 3.6 | % | 11.98 | 409 | 4.0 | % | 90.5 | % | 3 | |||||||||||||
Massachusetts | 3,990 | 3.3 | % | 15.02 | 272 | 2.7 | % | 97.5 | % | 2 | |||||||||||||
Connecticut | 3,574 | 3.0 | % | 12.81 | 298 | 2.9 | % | 93.8 | % | 3 | |||||||||||||
New Jersey | 3,353 | 2.7 | % | 21.03 | 161 | 1.6 | % | 99.0 | % | 1 | |||||||||||||
Kansas | 3,050 | 2.5 | % | 10.36 | 298 | 2.9 | % | 98.7 | % | 2 | |||||||||||||
South Carolina | 2,734 | 2.2 | % | 7.37 | 374 | 3.7 | % | 99.3 | % | 1 | |||||||||||||
Arizona | 2,313 | 1.9 | % | 11.68 | 221 | 2.2 | % | 89.8 | % | 2 | |||||||||||||
Pennsylvania | 2,218 | 1.8 | % | 16.01 | 153 | 1.5 | % | 90.5 | % | 1 | |||||||||||||
Maryland | 1,952 | 1.6 | % | 19.71 | 112 | 1.0 | % | 88.1 | % | 1 | |||||||||||||
Michigan | 1,892 | 1.5 | % | 9.88 | 199 | 1.9 | % | 96.3 | % | 2 | |||||||||||||
New York | 1,677 | 1.3 | % | 10.59 | 165 | 1.5 | % | 95.8 | % | 1 | |||||||||||||
Nevada | 1,659 | 1.4 | % | 18.58 | 89 | 0.9 | % | 100.0 | % | 1 | |||||||||||||
Missouri | 1,529 | 1.2 | % | 14.51 | 109 | 1.1 | % | 96.3 | % | 1 | |||||||||||||
Virginia | 1,408 | 1.2 | % | 17.54 | 80 | 0.8 | % | 100.0 | % | 1 | |||||||||||||
New Mexico | 1,396 | 1.1 | % | 10.04 | 139 | 1.4 | % | 100.0 | % | 1 | |||||||||||||
North Carolina | 662 | 0.5 | % | 10.30 | 72 | 0.7 | % | 89.7 | % | 1 | |||||||||||||
$ | 122,384 | 100.0 | % | $ | 12.59 | 10,223 | 100.0 | % | 95.1 | % | 85 | ||||||||||||
(1) | We calculate ABR as monthly contractual rent as of December 31, 2017, multiplied by 12 months. |
(2) | Gross leasable area (“GLA”) is defined as the portion of the total square feet of a building that is available for tenant leasing. |
20
Lease Expirations
The following chart shows, on an aggregate basis, all of the scheduled lease expirations after December 31, 2017, for each of the next ten years and thereafter for our 85 shopping centers. The chart shows the ABR and leased square feet represented by the applicable lease expirations (dollars and square feet in thousands):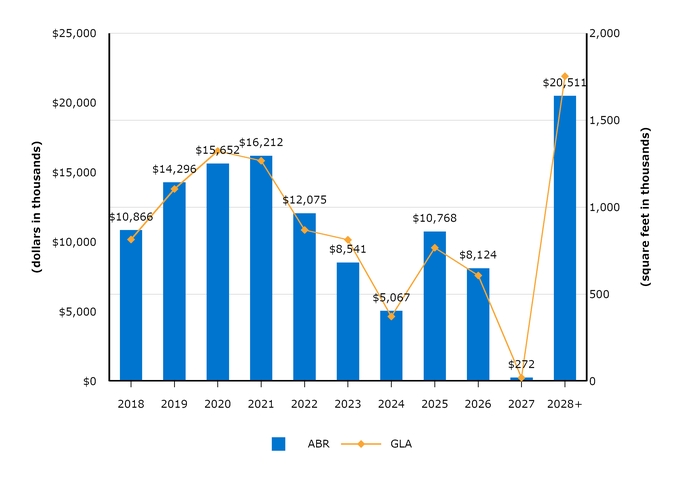
Subsequent to December 31, 2017, we renewed 146,657 total square feet and $2.3 million total ABR of the expiring leases.
During the year ended 2017, rent per square foot for renewed leases increased 12.0% when compared to rent per square foot prior to renewal. See Item 7. Management’s Discussion and Analysis of Financial Condition and Results of Operations - Results of Operations - Leasing Activity, for further discussion of leasing activity. Based on current market base rental rates, we believe we will achieve an overall positive increase in our average base rental income for leases expiring in 2018. However, changes in base rental income associated with individual signed leases on comparable spaces may be positive or negative, and we can provide no assurance that the base rents on new leases will continue to increase from current levels.
Portfolio Tenancy
Prior to the acquisition of a property, we assess the suitability of the grocery anchor tenant and other tenants in light of our investment objectives, namely, preserving capital and providing stable cash flows for distributions. Generally, we assess the strength of the tenant by consideration of company factors, such as its financial strength and market share in the geographic area of the shopping center, as well as location-specific factors, such as the store’s sales, local competition, and demographics. When assessing the tenancy of the non-anchor space at the shopping center, we consider the tenant mix at each shopping center in light of our portfolio, the proportion of national and national franchise tenants, the creditworthiness of specific tenants, and the timing of lease expirations. When evaluating non-national tenancy, we attempt to obtain credit enhancements to leases, which typically come in the form of deposits and/or guarantees from one or more individuals.
21
We define national tenants as those tenants that operate in at least three states. Regional tenants are defined as those tenants that have at least three locations. The following charts present the composition of our portfolio by tenant type as of December 31, 2017:
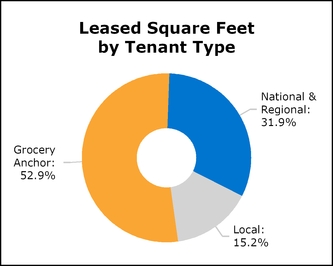
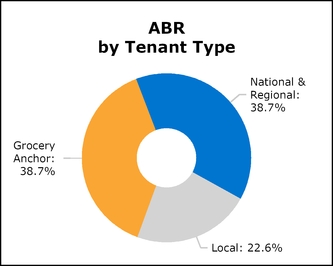
The following charts present the composition of our portfolio by tenant industry as of December 31, 2017:
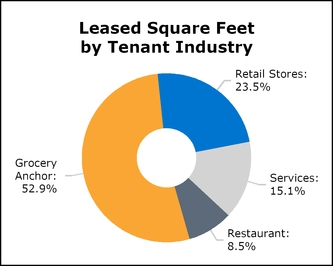
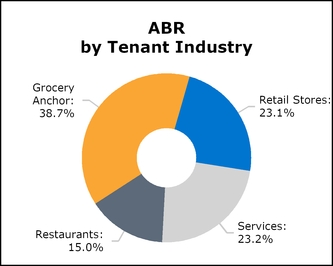
22
The following table presents our top ten tenants, grouped according to parent company, by ABR as of December 31, 2017 (dollars and square feet in thousands):
Tenant | ABR | % of ABR | Leased Square Feet | % of Leased Square Feet | Number of Locations | |||||||||||
Publix Super Markets | $ | 8,155 | 6.7 | % | 843 | 8.7 | % | 18 | ||||||||
Albertsons Companies | 7,151 | 5.8 | % | 716 | 7.4 | % | 12 | |||||||||
Ahold Delhaize | 6,374 | 5.2 | % | 389 | 4.0 | % | 6 | |||||||||
Kroger | 5,452 | 4.5 | % | 792 | 8.2 | % | 12 | |||||||||
Walmart | 5,410 | 4.4 | % | 845 | 8.7 | % | 6 | |||||||||
Giant Eagle | 2,776 | 2.3 | % | 273 | 2.8 | % | 4 | |||||||||
Sprouts Farmers Market | 1,815 | 1.5 | % | 109 | 1.1 | % | 4 | |||||||||
Save Mart | 1,750 | 1.4 | % | 208 | 2.1 | % | 4 | |||||||||
T.J. Maxx | 1,314 | 1.1 | % | 108 | 1.1 | % | 4 | |||||||||
Supervalu | 1,089 | 0.9 | % | 136 | 1.4 | % | 2 | |||||||||
$ | 41,286 | 33.8 | % | 4,419 | 45.5 | % | 72 | |||||||||
ITEM 3. LEGAL PROCEEDINGS
From time to time, we are party to legal proceedings, which arise in the ordinary course of our business. We are not currently involved in any legal proceedings of which the outcome is reasonably likely to have a material impact on our results of operations or financial condition, nor are we aware of any such legal proceedings contemplated by governmental authorities.
ITEM 4. MINE SAFETY DISCLOSURES
Not applicable.
w PART II |
ITEM 5. MARKET FOR REGISTRANT’S COMMON EQUITY, RELATED STOCKHOLDER MATTERS, AND ISSUER PURCHASES OF EQUITY SECURITIES
Stockholder Information
As of March 15, 2018, Phillips Edison Grocery Center REIT II, Inc. (“we,” the “Company,” “our,” or “us”) had approximately 46.7 million shares of common stock outstanding, held by a total of 24,397 stockholders of record.
Market Information
Our common stock is not currently traded on any exchange and there is no established trading market for our common stock. Therefore, there is a risk that a stockholder may not be able to sell our stock at a time acceptable to the stockholder, or at all. Pursuant to the terms of our charter, certain restrictions are imposed on the ownership and transfer of shares.
On May 9, 2017, our board of directors increased the estimated value per share of our common stock to $22.75 based substantially on the estimated market value of our portfolio of real estate properties in various geographic locations in the United States (the “Portfolio”) as of March 31, 2017. We provided this estimated value per share to assist broker-dealers that participated in our public offering in meeting their customer account statement reporting obligations under National Association of Securities Dealers Conduct Rule 2340 as required by the Financial Industry Regulatory Authority (“FINRA”). This valuation was performed in accordance with the provisions of Practice Guideline 2013-01, Valuations of Publicly Registered Non-Listed REITs, issued by the Investment Program Association (“IPA”) in April 2013 (the “IPA Valuation Guidelines”).
We engaged Duff & Phelps, LLC (“Duff & Phelps”) to provide a calculation of the range in estimated value per share of our common stock as of March 31, 2017. Duff & Phelps prepared a valuation report (the “Valuation Report”) that provided this range based substantially on its estimate of the “as is” market values of the Portfolio. Duff & Phelps made adjustments to the aggregate estimated value of the Portfolio to reflect balance sheet assets and liabilities provided by our management as of March 31, 2017, before calculating a range of estimated values based on the number of outstanding shares of our common stock as of March 31, 2017. These calculations produced an estimated value per share in the range of $21.84 to $24.43 as of March 31, 2017. The board of directors ultimately approved $22.75 as the estimated value per share of our common stock.
23
The following table summarizes the material components of the estimated value per share of our common stock as of March 31, 2017 (in millions, except per share amounts):
Low | High | ||||||
Investment in Real Estate Assets | $ | 1,646.9 | $ | 1,766.9 | |||
Other Assets | |||||||
Cash and cash equivalents | 4.2 | 4.2 | |||||
Restricted cash | 3.3 | 3.3 | |||||
Accounts receivable | 17.7 | 17.7 | |||||
Prepaid expenses and other assets | 4.6 | 4.6 | |||||
Total other assets | $ | 29.8 | $ | 29.8 | |||
Liabilities | |||||||
Notes payable and credit facility | $ | 655.5 | $ | 655.5 | |||
Mark to market of debt | 3.8 | 3.8 | |||||
Security deposits | 3.6 | 3.6 | |||||
Total liabilities | $ | 662.9 | $ | 662.9 | |||
Net Asset Value | $ | 1,013.8 | $ | 1,133.8 | |||
Common stock outstanding | 46.4 | 46.4 | |||||
Net Asset Value Per Share | $ | 21.84 | $ | 24.43 | |||
As with any valuation methodology, the methodologies used are based upon a number of assumptions and estimates that may not be accurate or complete. Different parties with different assumptions and estimates could derive a different estimated value per share, and these differences could be significant. These limitations are discussed further under “Limitations of Estimated Value per Share” below.
Valuation Methodologies
Our goal in calculating an estimated value per share is to arrive at a value that is reasonable and supportable using what we deem to be appropriate valuation and appraisal methodologies and assumptions and a process that is in accordance with the IPA Valuation Guidelines. The following is a summary of the valuation methodologies and components used to calculate the estimated value per share.
Real Estate Portfolio
Independent Valuation Firm
Duff & Phelps was recommended by our external advisor to the Conflicts Committee of our Board of Directors (the “Conflicts Committee”) to provide independent valuation services. The Conflicts Committee approved the engagement of Duff & Phelps for those services, and they are not affiliated with us or our advisor. The Duff & Phelps personnel who prepared the valuation have no present or prospective interest in the Portfolio and no personal interest with us or our advisor. Duff & Phelps has previously provided allocation of acquisition purchase price valuations for financial reporting purposes pertaining to the Portfolio acquisitions as well as completed the valuation of us as of March 31, 2016. They receive the usual and customary compensation for such services. Duff & Phelps may be engaged to provide professional services to us in the future.
Duff & Phelps’ engagement for its valuation services was not contingent upon developing or reporting predetermined results. In addition, Duff & Phelps’ compensation for completing the valuation services was not contingent upon the development or reporting of a predetermined value or direction in value that favors the cause of us, the amount of the value opinion, the attainment of a stipulated result, or the occurrence of a subsequent event directly related to the intended use of its Valuation Report. We have agreed to indemnify Duff & Phelps against certain liabilities arising out of this engagement.
Duff & Phelps’ analyses, opinions, or conclusions were developed, and the Valuation Report was prepared, in conformity with the Uniform Standards of Professional Appraisal Practice. The Valuation Report was reviewed, approved and signed by Duff & Phelps’ personnel with the professional designation of Member of the Appraisal Institute (the “MAI”). The use of the Valuation Report is subject to the requirements of the MAI relating to review by its duly authorized representatives.
In preparing the Valuation Report, Duff & Phelps relied on information provided by us and our advisor regarding the Portfolio. For example, we and our advisor provided information regarding building size, year of construction, land size and other physical, financial and economic characteristics. We and our advisor also provided lease information, such as current rent amounts, rent commencement and expiration dates, and rent increase amounts and dates. Duff & Phelps did not inspect the Portfolio properties as part of the valuation process.
Duff & Phelps did not investigate the legal description or legal matters relating to the Portfolio, including title or encumbrances, and title to the properties was assumed to be good and marketable. The Portfolio was also assumed to be free
24
and clear of liens, easements, encroachments and other encumbrances, and to be in full compliance with zoning, use, occupancy, environmental and similar laws unless otherwise stated by us. The Valuation Report contains other assumptions, qualifications and limitations that qualify the analysis, opinions and conclusions set forth therein. Furthermore, the prices at which our real estate properties may actually be sold could differ from their appraised values.
The foregoing is a summary of the standard assumptions, qualifications and limitations that generally apply to the Valuation Report.
Real Estate Valuation
Duff & Phelps estimated the “as is” market values of the Portfolio as of March 31, 2017, using various methodologies. Generally accepted valuation practice suggests assets may be valued using a range of methodologies. Duff & Phelps utilized the income capitalization approach with support from the sales comparison approach for each property. The income approach was the primary indicator of value, with secondary consideration given to the sales approach. Duff & Phelps performed a study of each market to measure current market conditions, supply and demand factors, growth patterns, and their effect on each of the subject properties.
The income capitalization approach simulates the reasoning of an investor who views the cash flows that would result from the anticipated revenue and expense on a property throughout its lifetime. Under the income capitalization approach, Duff & Phelps used an estimated net operating income (“NOI”) for each property, and then converted it to a value indication using a discounted cash flow analysis. The discounted cash flow analysis focuses on the operating cash flows expected from a property and the anticipated proceeds of a hypothetical sale at the end of an assumed holding period, with these amounts then being discounted to their present value. The discounted cash flow method is appropriate for the analysis of investment properties with multiple leases, particularly leases with cancellation clauses or renewal options, and especially in volatile markets.
The sales comparison approach estimates value based on what other purchasers and sellers in the market have agreed to as a price for comparable improved properties. This approach is based upon the principle of substitution, which states that the limits of prices, rents and rates tend to be set by the prevailing prices, rents and rates of equally desirable substitutes. Duff & Phelps gathered comparable sales data throughout various markets as secondary support for its valuation estimate.
The following summarizes the range of capitalization and discount rates that were used to arrive at the estimated market values of our Portfolio:
Range in Values | |
Overall capitalization rate | 6.25% - 6.70% |
Terminal capitalization rate | 6.96% - 7.43% |
Discount rate | 7.65% - 8.12% |
Sensitivity Analysis
While we believe that Duff & Phelps’ assumptions and inputs are reasonable, a change in these assumptions would impact the calculations of the estimated value of the Portfolio and our estimated value per share. The table below illustrates the impact on Duff & Phelps’ range in estimated value per share if the terminal capitalization rates or discount rates were adjusted by 25 basis points and assumes all other factors remain unchanged. Additionally, the table illustrates the impact of a 5% change in these rates in accordance with the IPA Valuation Guidelines. The table is only hypothetical to illustrate possible results if only one change in assumptions was made, with all other factors held constant. Further, each of these assumptions could change by more than 25 basis points or 5%.
Resulting Range in Estimated Value Per Share | |||||||
Increase of 25 Basis Points | Decrease of 25 Basis Points | Increase of 5% | Decrease of 5% | ||||
Terminal capitalization rate | $20.99 to $23.77 | $22.22 to $25.26 | $20.74 to $23.56 | $22.51 to $25.53 | |||
Discount rate | $20.98 to $23.84 | $22.20 to $25.17 | $20.63 to $23.52 | $22.57 to $25.51 | |||
Other Assets and Other Liabilities
Duff & Phelps made adjustments to the aggregate estimated values of our investments to reflect other assets and other liabilities of us based on balance sheet information provided by us and our advisor as of March 31, 2017.
Role of the Conflicts Committee and the Board of Directors
The Conflicts Committee is composed of all of our independent directors. It is responsible for the oversight of the valuation process, including the review and approval of the valuation process and methodologies used to determine our estimated value per share, the consistency of the valuation and appraisal methodologies with real estate industry standards and practices and the reasonableness of the assumptions used in the valuations and appraisals. The Conflicts Committee approved our engagement of Duff & Phelps to provide an estimation of the value per share as of March 31, 2017. The Conflicts Committee received a copy of the Valuation Report and discussed the report with representatives of Duff & Phelps. The Conflicts Committee also discussed the Valuation Report, the Portfolio, our assets and liabilities and other matters with senior management of our advisor. Our advisor recommended to the Conflicts Committee that $22.75 per share be approved as the estimated value per share of our common stock. The Conflicts Committee discussed the rationale for this value with our advisor.
25
Following the Conflicts Committee’s receipt and review of the Valuation Report, the recommendation of our advisor, and in light of other factors considered by the Conflicts Committee and its own extensive knowledge of our assets and liabilities, the Conflicts Committee concluded that the range in estimated value per share of $21.84 to $24.43 was appropriate. The Conflicts Committee then recommended to our Board of Directors that it select $22.75 as the estimated value per share of our common stock. Our Board of Directors unanimously agreed to accept the recommendation of the Conflicts Committee and approved $22.75 as the estimated value per share of our common stock as of March 31, 2017, which determination was ultimately and solely the responsibility of the Board of Directors.
Limitations of Estimated Value per Share
We provided this estimated value per share to assist broker-dealers that participated in our public offering in meeting their customer account statement reporting obligations. This valuation was performed in accordance with the provisions of the IPA Valuation Guidelines. The estimated value per share set forth above first appeared on our May 2017 customer account statements that were mailed in June 2017. As with any valuation methodology, the methodologies used are based upon a number of estimates and assumptions that may not be accurate or complete. Different parties with different assumptions and estimates could derive a different estimated value per share, and this difference could be significant. The estimated value per share is not audited and does not represent a determination of the fair value of our assets or liabilities based on generally accepted accounting policies (“GAAP”), nor does it represent a liquidation value of our assets and liabilities or the amount at which our shares of common stock would trade on a national securities exchange.
Accordingly, with respect to the estimated value per share, we can give no assurance that:
• | a stockholder would be able to resell his or her shares at the estimated value per share; |
• | a stockholder would ultimately realize distributions per share equal to our estimated value per share upon liquidation of our assets and settlement of our liabilities or a sale of us; |
• | our shares of common stock would trade at the estimated value per share on a national securities exchange; |
• | a third party would offer the estimated value per share in an arm’s-length transaction to purchase all or substantially all of our shares of common stock; |
• | another independent third-party appraiser or third-party valuation firm would agree with our estimated value per share; or |
• | the methodologies used to calculate our estimated value per share would be acceptable to FINRA or for compliance with Employee Retirement Income Security Act of 1974 reporting requirements. |
Further, the estimated value per share is based on the estimated value per share of the Company as of March 31, 2017. We did not make any adjustments to the valuation for the impact of other transactions occurring subsequent to March 31, 2017, including, but not limited to, (1) the issuance of common stock under the distribution reinvestment plan (“DRIP”), (2) net operating income earned and dividends declared, (3) the repurchase of shares and (4) changes in leases, tenancy or other business or operational changes. The value of our shares will fluctuate over time in response to developments related to individual assets in the Portfolio, the management of those assets and changes in the real estate and finance markets. Because of, among other factors, the high concentration of our total assets in real estate and the number of shares of our common stock outstanding, changes in the value of individual assets in the Portfolio or changes in valuation assumptions could have a very significant impact on the value of our shares. The estimated value per share does not reflect a portfolio premium or the fact that we are externally managed. The estimated value per share also does not take into account any disposition costs or fees for real estate properties, debt prepayment penalties that could apply upon the prepayment of certain of our debt obligations or the impact of restrictions on the assumption of debt.
Distribution Reinvestment Plan
We have adopted the DRIP through which our stockholders may elect to reinvest an amount equal to the distributions paid on their shares of common stock into shares of our common stock in lieu of receiving cash distributions. In accordance with the DRIP, participants in the DRIP acquire shares of common stock at a price equal to the estimated value per share. Prior to the establishment of the first estimated value per share, the purchase price per share under the DRIP was $23.75. Participants in the DRIP may purchase fractional shares so that 100% of the dividends may be used to acquire additional shares of our common stock. For the year ended December 31, 2017, 1.6 million shares were issued through the DRIP, resulting in proceeds of approximately $36.5 million. For the year ended December 31, 2016, 1.7 million shares were issued through the DRIP, resulting in proceeds of approximately $38.3 million.
Distribution Information
During the years ended December 31, 2017 and 2016, our board of directors authorized distributions based on daily record dates for each day during the periods from January 1 through December 31, 2017 and 2016. The authorized distributions for 2017 and 2016 were equal to a daily amount of $0.00445205 and $0.00443989 per share of common stock, respectively. Beginning January 1, 2018, we pay distributions to stockholders based on monthly record dates. The 2018 monthly distribution rate will result in the same annual distribution amount as the daily distribution rate.
26
The total distributions paid to common stockholders for the years ended December 31, 2017 and 2016, were as follows (in thousands):
2017 | 2016 | ||||||
Distributions paid to common stockholders | $ | 75,745 | $ | 75,127 | |||
Distributions were paid subsequent to December 31, 2017, as follows (in thousands):
Month(1) | Dates of Record | Distribution Amount per Share(2) | Date Distribution Paid | Gross Amount of Distribution Paid | ||||||||
December | 12/1/2017 - 12/31/2017 | $ | 0.00445205 | 1/2/2018 | $ | 6,432 | ||||||
January | 1/16/2018 | 0.13541652 | 2/1/2018 | 6,326 | ||||||||
February | 2/15/2018 | 0.13541652 | 3/1/2018 | 6,314 | ||||||||
(1) | The distribution for March, payable to shareholders of record as of March 15, 2018, will be paid on April 2, 2018. |
(2) | The December distribution amount per share is a daily amount, while the January and February amount per share is a monthly amount. The 2018 monthly distribution amount will result in the same annual distribution amount as the daily distribution amount. |
All distributions paid during the years ended December 31, 2017 and 2016, were funded by a combination of cash generated through operations or borrowings.
Unregistered Sales of Equity Securities
During 2017, we did not sell any equity securities that were not registered under the Securities Act.
Share Repurchase Program (“SRP”)
Our SRP may provide a limited opportunity for stockholders to have shares of common stock repurchased, subject to certain restrictions and limitations, at a price equal to or at a discount from the purchase price paid for the shares being repurchased. There are several limitations on our ability to repurchase shares under the program:
• | Unless the shares are being repurchased in connection with a stockholder’s death, “qualifying disability,” or “determination of incompetence,” we may not repurchase shares unless the stockholder has held the shares for one year. |
• | We limit the number of shares repurchased pursuant to our SRP during any calendar year to 5% of the weighted-average number of shares of common stock outstanding during the prior calendar year. |
• | We have no obligation to repurchase shares if the repurchase would violate the restrictions on distributions under Maryland law, which prohibits distributions that would cause a corporation to fail to meet statutory tests of solvency. |
• | The cash available for repurchases on any particular date will generally be limited to the proceeds from the DRIP during the preceding four fiscal quarters, less any cash already used for repurchases since the beginning of the same period; however, subject to the limitations described above, we may use other sources of cash at the discretion of the board of directors. The limitations described above do not apply to shares repurchased due to a stockholder’s death, “qualifying disability,” or “determination of incompetence.” |
• | Only those stockholders who purchased their shares from us or received their shares from us (directly or indirectly) through one or more non-cash transactions may be able to participate in the SRP. In other words, once our shares are transferred for value by a stockholder, the transferee and all subsequent holders of the shares are not eligible to participate in the SRP. |
• | The board of directors reserves the right, in its sole discretion, at any time and from time to time, to reject any request for repurchase. |
Effective May 9, 2017, the repurchase price per share for all stockholders is equal to the estimated value per share of $22.75, an increase from $22.50. Subject to certain funding limitations, repurchases of shares of common stock are generally made on the first business day of each month for written requests that were made in good order at least five business days prior to the repurchase date. Stockholders may withdraw their repurchase request at any time before five days prior to the repurchase date. If the repurchase request is not canceled before the applicable time described above, the stockholder will be contractually bound to the repurchase of the shares and will not be permitted to cancel the request prior to the payment of repurchase proceeds.
Our board of directors may amend, suspend or terminate the program upon 30 days’ notice. We may provide notice by including such information (a) in a current report on Form 8-K or in our annual or quarterly reports, all publicly filed with the Securities and Exchange Commission, or (b) in a separate mailing to the stockholders.
27
The following table presents the activities under our SRP for the years ended December 31, 2017 and 2016, (in thousands, except per share amounts):
2017 | 2016 | ||||||
Shares repurchased | 1,402 | 1,021 | |||||
Cost of repurchases | $ | 31,772 | $ | 23,031 | |||
Average repurchase price | $ | 22.66 | $ | 22.56 | |||
All of the shares that we repurchased during the quarter ended December 31, 2017 are provided below (shares in thousands):
Period | Total Number of Shares Redeemed | Average Price Paid per Share | Total Number of Shares Purchased as Part of a Publicly Announced Plan or Program(1) | Approximate Dollar Value of Shares Available That May Yet Be Redeemed Under the Program | ||||||
October 2017 | 326 | $ | 22.75 | 326 | (2) | |||||
November 2017 | 18 | 22.75 | 18 | (2) | ||||||
December 2017 | 19 | 22.75 | 19 | (2) | ||||||
(1) | All purchases of our equity securities by us in the three months ended December 31, 2017, were made pursuant to the SRP. We announced the commencement of the SRP on November 25, 2013, and it was subsequently amended effective May 15, 2016. |
(2) | We currently limit the dollar value and number of shares that may yet be repurchased under the SRP as described above. See below regarding funding limitations during 2017 and beyond. |
In 2017 repurchase requests surpassed the funding limits under the SRP. Repurchase requests in connection with a stockholder’s death, “qualifying disability,” or “determination of incompetence” were satisfied in full. The remaining repurchase requests that were in good order were satisfied on a pro rata basis. As of December 31, 2017, we had approximately 573,000 shares of unfulfilled repurchase requests, which will be treated as requests for repurchase during future months until satisfied or withdrawn.
Due to the program’s funding limits, the funds available for repurchases in 2018 are expected to be insufficient to meet all requests. When we are unable to fulfill all repurchase requests in a given month, we will honor requests on a pro rata basis to the extent funds are available. We will continue to fulfill repurchases sought upon a stockholder’s death, “qualifying disability,” or “determination of incompetence” in accordance with the terms of the SRP.
28
ITEM 6. SELECTED FINANCIAL DATA
As of and for the years ended December 31, | |||||||||||||||
(In thousands, except per share amounts) | 2017 | 2016 | 2015 | 2014 | |||||||||||
Balance Sheet Data:(1) | |||||||||||||||
Investment in property, at cost | $ | 1,741,536 | $ | 1,510,160 | $ | 1,066,509 | $ | 341,554 | |||||||
Cash and cash equivalents | 1,435 | 8,259 | 17,359 | 179,117 | |||||||||||
Total assets | 1,652,317 | 1,486,527 | 1,079,713 | 524,091 | |||||||||||
Debt obligations, net | 775,275 | 533,215 | 81,305 | 27,383 | |||||||||||
Operating Data: | |||||||||||||||
Total revenues | $ | 162,577 | $ | 129,796 | $ | 60,413 | $ | 8,445 | |||||||
Property operating expenses | (27,270 | ) | (22,226 | ) | (10,756 | ) | (1,651 | ) | |||||||
Real estate tax expenses | (25,154 | ) | (20,157 | ) | (9,592 | ) | (966 | ) | |||||||
General and administrative expenses | (19,352 | ) | (18,139 | ) | (3,744 | ) | (1,606 | ) | |||||||
Acquisition expenses(2) | (586 | ) | (10,754 | ) | (13,661 | ) | (5,449 | ) | |||||||
Interest expense, net | (22,494 | ) | (10,970 | ) | (3,990 | ) | (1,206 | ) | |||||||
Net loss | (9,531 | ) | (5,497 | ) | (6,698 | ) | (5,833 | ) | |||||||
Other Operational Data:(3)(4) | |||||||||||||||
NOI | $ | 105,256 | $ | 81,797 | $ | 36,849 | $ | 5,420 | |||||||
Funds from operations (“FFO”) | 63,575 | 48,419 | 19,080 | (2,317 | ) | ||||||||||
Modified funds from operations (“MFFO”) | 63,630 | 52,431 | 28,522 | 2,684 | |||||||||||
Cash Flow Data: | |||||||||||||||
Cash flows provided by (used in) operating activities | $ | 50,308 | $ | 45,353 | $ | 16,618 | $ | (1,311 | ) | ||||||
Cash flows used in investing activities | (199,088 | ) | (362,228 | ) | (618,854 | ) | (296,325 | ) | |||||||
Cash flows provided by financing activities | 141,956 | 307,775 | 440,478 | 476,653 | |||||||||||
Per Share Data: | |||||||||||||||
Net loss per share—basic and diluted | $ | (0.20 | ) | $ | (0.12 | ) | $ | (0.18 | ) | $ | (0.57 | ) | |||
Common distributions declared | $ | 1.62 | $ | 1.62 | $ | 1.62 | $ | 1.49 | |||||||
Weighted-average shares outstanding—basic | 46,544 | 46,228 | 36,538 | 10,302 | |||||||||||
Weighted-average shares outstanding—diluted | 46,544 | 46,230 | 36,538 | 10,302 | |||||||||||
(1) | Certain prior period balance sheet amounts have been restated to conform with the adoption of Accounting Standards Update (“ASU”) 2015-03, Simplifying the Presentation of Debt Issuance Costs. |
(2) | On January 1, 2017, we adopted ASU 2017-01, Business Combinations (Topic 805): Clarifying the Definition of a Business, which changed how we record most acquisition-related costs on our consolidated statements of operations. For a more detailed discussion of the effect of this adoption on our financial statements, see Note 2. |
(3) | See Item 7. Management's Discussion and Analysis of Financial Condition and Results of Operations - Non-GAAP Measures, for further discussion and for a reconciliation of the non-GAAP financial measures to net loss. |
(4) | Certain prior period amounts have been restated to conform with current year presentation. |
The selected financial data should be read in conjunction with the consolidated financial statements and notes appearing in this Annual Report on Form 10-K.
ITEM 7. MANAGEMENT’S DISCUSSION AND ANALYSIS OF FINANCIAL CONDITION AND RESULTS OF OPERATIONS
The following discussion and analysis should be read in conjunction with our accompanying consolidated financial statements and notes thereto. See also “Cautionary Note Regarding Forward-Looking Statements” preceding Part I.
Overview
We were formed as a Maryland corporation in June 2013, and elected to be taxed as a real estate investment trust (“REIT”) commencing with the taxable year ended December 31, 2014.
29
Below are statistical highlights of our portfolio:
Total Portfolio as of December 31, 2017 | Property Acquisitions During the Year Ended December 31, 2017 | ||||
Number of properties(1) | 85 | 11 | |||
Number of states | 24 | 7 | |||
Total square feet (in thousands) | 10,223 | 977 | |||
Leased % of rentable square feet | 95.1 | % | 94.2 | % | |
Average remaining lease term (in years)(2) | 5.5 | 5.2 | |||
(1) | The number of properties does not include additional real estate purchased adjacent to previously acquired centers, and those properties contributed to the joint venture. |
(2) | The average remaining lease term in years excludes future options to extend the term of the lease. |
Market Outlook—Real Estate and Real Estate Finance Markets
Management reviews a number of economic forecasts and market commentaries in order to evaluate general economic conditions and to formulate a view of the current environment’s effect on the real estate markets in which we operate.
According to the Bureau of Economic Analysis, as measured by the U.S. real gross domestic product (“GDP”), the U.S. economy’s growth increased 2.3% in 2017 as compared to 1.5% in 2016, according to preliminary estimates. The increase in real GDP in 2017 reflected positive contributions from personal consumption expenditures, nonresidential fixed investment, and exports. Imports, which are a subtraction in the calculation of GDP, increased. The acceleration in real GDP growth from 2016 to 2017 reflected upturns in nonresidential fixed investment and in exports, as well as a smaller decrease in private inventory investment. These upturns were offset partially by decelerations in residential fixed investment and in state and local government spending.
According to J.P. Morgan’s Global Economic Outlook Summary and 2018 REIT Outlook, real GDP is expected to grow approximately 2.5% in 2018. The U.S. retail real estate market displayed positive but decelerating fundamentals in 2017, with vacancy rates rising and increased emphasis on redevelopment pipelines.
Overall, retail real estate fundamentals remain strong but are expected to decelerate relative to previous years. Short-term interest rates are expected to increase in 2018 more than long-term interest rates. There is less occupancy to be gained in portfolios, new supply levels are below historical averages, and job growth is expected to be 1% monthly in 2018. Reductions to the corporate tax rate will add to economic growth, although commercial real estate is expected to benefit to a lesser extent than other sectors. Tax reform passed by Congress in 2017 is expected to have a minimal to slightly negative impact on REITs, although retailers should benefit from increased consumer spending. Stronger retailers should be better for shopping center owners as tenants can invest more to grow and improve their credit quality, reducing turnover.
Critical Accounting Policies and Estimates
Below is a discussion of our critical accounting policies and estimates. Our accounting policies have been established to conform with GAAP. We consider these policies critical because they involve significant management judgments and assumptions, require estimates about matters that are inherently uncertain and are important for understanding and evaluating our reported financial results. These judgments affect the reported amounts of assets and liabilities and our disclosure of contingent assets and liabilities at the dates of the consolidated financial statements, as well as the reported amounts of revenue and expenses during the reporting periods. With different estimates or assumptions, materially different amounts could be reported in our consolidated financial statements. Additionally, other companies may utilize different estimates that may impact the comparability of our results of operations to those of companies in similar businesses.
Real Estate Assets
Real Estate Acquisition Accounting—In January 2017, the Financial Accounting Standards Board (“FASB”) issued Accounting Standards Update (“ASU”) 2017-01, Business Combinations (Topic 805): Clarifying the Definition of a Business. This update amended existing guidance in order to clarify when an integrated set of assets and activities is considered a business. We adopted ASU 2017-01 on January 1, 2017, and applied it prospectively. Under this new guidance, most of our real estate acquisition activity is no longer considered a business combination and instead is classified as an asset acquisition. As a result, most acquisition-related costs that would have been recorded on our consolidated statements of operations prior to adoption have been capitalized and will be amortized over the life of the related assets.
We assess the acquisition-date fair values of all tangible assets, identifiable intangibles, and assumed liabilities using methods similar to those used by independent appraisers (e.g., discounted cash flow analysis and replacement cost) and that utilize appropriate discount and/or capitalization rates and available market information. Estimates of future cash flows are based on a number of factors including historical operating results, known and anticipated trends, and market and economic conditions. The fair value of tangible assets of an acquired property considers the value of the property as if it were vacant.
We generally determine the value of construction in progress based upon the replacement cost. However, for certain acquired properties that are part of a ground-up development, we determine fair value by using the same valuation approach as for all other properties and deducting the estimated cost to complete the development. During the remaining construction period, we capitalize interest expense until the development has reached substantial completion. Construction in progress, including capitalized interest, is not depreciated until the development has reached substantial completion.
30
We record above-market and below-market lease values for acquired properties based on the present value (using a discount rate that reflects the risks associated with the leases acquired) of the difference between (i) the contractual amounts to be paid pursuant to the in-place leases and (ii) management’s estimate of market lease rates for the corresponding in-place leases, measured over a period equal to the remaining non-cancelable term of the lease. We amortize any recorded above-market or below-market lease values as a reduction or increase, respectively, to rental income over the remaining non-cancelable terms of the respective lease. We also include fixed-rate renewal options in our calculation of the fair value of below-market leases and the periods over which such leases are amortized. If a tenant has a unilateral option to renew a below-market lease, we include such an option in the calculation of the fair value of such lease and the period over which the lease is amortized if we determine that the tenant has a financial incentive and wherewithal to exercise such option.
Intangible assets also include the value of in-place leases, which represents the estimated value of the net cash flows of the in-place leases to be realized, as compared to the net cash flows that would have occurred had the property been vacant at the time of acquisition and subject to lease-up. Acquired in-place lease value is amortized to depreciation and amortization expense over the average remaining non-cancelable terms of the respective in-place leases.
We estimate the value of tenant origination and absorption costs by considering the estimated carrying costs during hypothetical expected lease-up periods, considering current market conditions. In estimating carrying costs, management includes real estate taxes, insurance and other operating expenses, and estimates of lost rentals at market rates during the expected lease-up periods.
Estimates of the fair values of the tangible assets, identifiable intangibles, and assumed liabilities require us to estimate market lease rates, property operating expenses, carrying costs during lease-up periods, discount rates, market absorption periods, and the number of years the property will be held for investment. The use of inappropriate estimates would result in an incorrect valuation of our acquired tangible assets, identifiable intangibles and assumed liabilities, which would impact the amount of our net income.
We calculate the fair value of assumed long-term debt by discounting the remaining contractual cash flows on each instrument at the current market rate for those borrowings, which we approximate based on the rate at which we would expect to incur a replacement instrument on the date of acquisition, and recognize any fair value adjustments related to long-term debt as effective yield adjustments over the remaining term of the instrument.
Impairment of Real Estate and Related Intangible Assets—We monitor events and changes in circumstances that could indicate that the carrying amounts of our real estate and related intangible assets may be impaired. When indicators of potential impairment suggest that the carrying value of real estate and related intangible assets may be greater than fair value, we will assess the recoverability, considering recent operating results, expected net operating cash flow, and plans for future operations. If, based on this analysis of undiscounted cash flows, we do not believe that we will be able to recover the carrying value of the real estate and related intangible assets, we would record an impairment loss to the extent that the carrying value exceeds the estimated fair value of the real estate and related intangible assets as defined by Accounting Standards Codification (“ASC”) 360, Property, Plant, and Equipment. Particular examples of events and changes in circumstances that could indicate potential impairments are significant decreases in occupancy, rental income, operating income, and market values.
Revenue Recognition
We recognize minimum rent, including rental abatements and contractual fixed increases attributable to operating leases, on a straight-line basis over the terms of the related leases, and we include amounts expected to be received in later years in deferred rents receivable. Our policy for percentage rental income is to defer recognition of contingent rental income until the specified target (i.e., breakpoint) that triggers the contingent rental income is achieved.
We record property operating expense reimbursements due from tenants for common area maintenance, real estate taxes, and other recoverable costs in the period the related expenses are incurred. We make certain assumptions and judgments in estimating the reimbursements at the end of each reporting period. We do not expect the actual results to differ materially from the estimated reimbursement.
We make estimates of the collectability of our tenant receivables related to base rents, expense reimbursements, and other revenue or income. We specifically analyze accounts receivable and historical bad debts, customer creditworthiness, current economic trends, and changes in customer payment terms when evaluating the adequacy of the allowance for doubtful accounts. In addition, with respect to tenants in bankruptcy, we will make estimates of the expected recovery of pre-petition and post-petition claims in assessing the estimated collectability of the related receivable. In some cases, the ultimate resolution of these claims can exceed one year. These estimates have a direct impact on our net income because a higher bad debt reserve results in less net income.
We record lease termination income if there is a signed termination letter agreement, all of the conditions of the agreement have been met, collectability is reasonably assured and the tenant is no longer occupying the property. Upon early lease termination, we provide for losses related to unrecovered intangibles and other assets.
We will recognize gains on sales of real estate pursuant to the provisions of ASC 605-976, Accounting for Sales of Real Estate. The specific timing of a sale will be measured against various criteria in ASC 605-976 related to the terms of the transaction and any continuing involvement associated with the property. If the criteria for profit recognition under the full-accrual method are not met, we will defer gain recognition and account for the continued operations of the property by applying the percentage-of-completion, reduced profit, deposit, installment or cost recovery methods, as appropriate, until the appropriate criteria are met.
Impact of Recently Issued Accounting Pronouncements—Refer to Note 2 in this annual report on Form 10-K for discussion of the impact of recently issued accounting pronouncements.
31
Results of Operations
Summary of Operating Activities for the Years Ended December 31, 2017 and 2016
Favorable (Unfavorable) Change | |||||||||||||||||||
(In thousands, except per share amounts) | 2017 | 2016 | Change | Non-Same-Center | Same-Center | ||||||||||||||
Operating Data: | |||||||||||||||||||
Total revenues | $ | 162,577 | $ | 129,796 | $ | 32,781 | $ | 31,661 | $ | 1,120 | |||||||||
Property operating expenses | (27,270 | ) | (22,226 | ) | (5,044 | ) | (4,794 | ) | (250 | ) | |||||||||
Real estate tax expenses | (25,154 | ) | (20,157 | ) | (4,997 | ) | (5,036 | ) | 39 | ||||||||||
General and administrative expenses | (19,352 | ) | (18,139 | ) | (1,213 | ) | (1,537 | ) | 324 | ||||||||||
Acquisition expenses | (586 | ) | (10,754 | ) | 10,168 | 10,213 | (45 | ) | |||||||||||
Termination of affiliate arrangements | (5,962 | ) | — | (5,962 | ) | (5,962 | ) | — | |||||||||||
Depreciation and amortization | (71,200 | ) | (56,541 | ) | (14,659 | ) | (13,911 | ) | (748 | ) | |||||||||
Interest expense, net | (22,494 | ) | (10,970 | ) | (11,524 | ) | (11,524 | ) | — | ||||||||||
Gain on contribution of properties to unconsolidated joint venture | — | 3,341 | (3,341 | ) | (3,341 | ) | — | ||||||||||||
Other (loss) income, net | (90 | ) | 153 | (243 | ) | (239 | ) | (4 | ) | ||||||||||
Net loss attributable to stockholders | $ | (9,531 | ) | $ | (5,497 | ) | $ | (4,034 | ) | $ | (4,470 | ) | $ | 436 | |||||
Net loss per share—basic and diluted | $ | (0.20 | ) | $ | (0.12 | ) | $ | (0.08 | ) | ||||||||||
We wholly-owned 85 properties as of December 31, 2017, and 74 properties as of December 31, 2016. The Same-Center column in the table above includes the 51 properties that were owned and operational prior to January 1, 2016, which excludes six properties contributed to our joint venture in March 2016 (see Note 4). The Non-Same-Center column includes properties that were acquired after December 31, 2015, in addition to corporate-level income and expenses. In this section, we primarily explain fluctuations in activity shown in the Same-Center column as well as any notable fluctuations in the Non-Same-Center column related to corporate-level activity.
Total revenues—Of the $32.8 million increase in total revenues, $31.7 million was related to the properties acquired in 2016 and 2017. The remaining variance was the result of an increase in revenue among same-center properties, primarily due to a $1.6 million increase in minimum rent, which was driven by a $0.21 increase in same-center minimum rent per square foot and a 0.4% increase in same-center occupancy since December 31, 2016. Same-center tenant recovery income increased $0.9 million as a result of an increase in our overall recovery rate. The growth in rent and tenant recovery income were partially offset by a $0.8 million reduction in straight-line rent, as well as a $0.6 million decrease in lease buyout income.
Property operating expenses—These expenses include (i) operating and maintenance expense, which consists of property related costs including repairs and maintenance costs, landscaping, snow removal, utilities, property insurance costs, security and various other property-related expenses; (ii) bad debt expense; and (iii) property management fees and expenses. Of the $5.0 million increase in property operating expenses, $4.8 million was due to the acquisition of 34 properties in 2016 and 2017. The remaining $0.2 million is primarily related to a $0.4 million increase in bad debt reserves due to higher outstanding common area maintenance (“CAM”) receivables, which are unrelated to tenant bankruptcies, partially offset by a $0.2 million decrease in insurance expenses as a result of negotiating more favorable rates in 2017.
General and administrative expenses—The $1.2 million increase in general and administrative expenses was primarily attributable to a $2.0 million increase in asset management fees as a result of portfolio growth, partially offset by a decrease of $0.8 million in third party professional costs, including transfer agent expenses and investor relations custodial fees. In connection with the termination of the fee-sharing arrangements between American Realty Capital PECO II Advisors, LLC (“ARC”) and PECO in September 2017 as discussed below, the asset management fee has been reduced from 1% to 0.85% under the amended and restated advisory agreement.
Acquisition expenses—Acquisition expenses decreased $10.2 million as a result of adopting ASU 2017-01 in January 2017. Under this guidance, certain property acquisitions are now classified as asset acquisitions, and as a result, the majority of acquisition-related expenses are capitalized and amortized over the life of the related assets. For a more detailed discussion of this adoption, see Note 2.
Termination of affiliate arrangements—The $6.0 million termination of affiliate arrangements was related to the termination of our relationship with ARC. In exchange for a payment of $6.0 million, ARC sold the 77,243 Class B units it owned back to the Operating Partnership at our $22.75 NAV per share, redeemed all of its interests in a special limited partner interest co-owned with Phillips Edison Limited Partnership, and terminated all fee-sharing arrangements with PECO. As a result, our ongoing fees payable to the Advisor have been reduced by 15% (see Note 12).
32
Depreciation and amortization—Of the $14.7 million increase in depreciation and amortization expense, $13.9 million was related to the properties acquired in 2016 and 2017. The remaining variance was a combination of an increase in land improvements, building improvements, tenant improvements, and leasing commission amortization due to new leases and write-offs resulting from early lease terminations at certain same-center properties.
Interest expense, net—Of the $11.5 million increase in interest expense, $10.1 million is related to higher borrowings in 2017 on the term loans and revolving credit facility due to acquiring new properties in 2016 and 2017, as well as an increase of $0.6 million in amortization of deferred financing costs, related to new debt instruments. Additionally, $0.8 million of the increase is related to new mortgage loans assumed in connection with certain acquisitions throughout 2016 and 2017, partially offset by mortgages that have matured.
Gain on contribution of properties to unconsolidated joint venture—The $3.3 million decrease is due to the gain on the contribution of six properties to our joint venture in March 2016.
Summary of Operating Activities for the Years Ended December 31, 2016 and 2015
Favorable (Unfavorable) Change | |||||||||||||||||||
(In thousands, except per share amounts) | 2016 | 2015 | Change | Non-Same-Center | Same-Center | ||||||||||||||
Operating Data: | |||||||||||||||||||
Total revenues | $ | 129,796 | $ | 60,413 | $ | 69,383 | $ | 67,354 | $ | 2,029 | |||||||||
Property operating expenses | (22,226 | ) | (10,756 | ) | (11,470 | ) | (11,216 | ) | (254 | ) | |||||||||
Real estate tax expenses | (20,157 | ) | (9,592 | ) | (10,565 | ) | (10,350 | ) | (215 | ) | |||||||||
General and administrative expenses | (18,139 | ) | (3,744 | ) | (14,395 | ) | (14,467 | ) | 72 | ||||||||||
Acquisition expenses | (10,754 | ) | (13,661 | ) | 2,907 | 2,890 | 17 | ||||||||||||
Depreciation and amortization | (56,541 | ) | (25,778 | ) | (30,763 | ) | (29,645 | ) | (1,118 | ) | |||||||||
Interest expense, net | (10,970 | ) | (3,990 | ) | (6,980 | ) | (7,307 | ) | 327 | ||||||||||
Gain on contribution of properties to unconsolidated joint venture | 3,341 | — | 3,341 | 3,341 | — | ||||||||||||||
Other income, net | 153 | 410 | (257 | ) | (257 | ) | — | ||||||||||||
Net loss attributable to stockholders | $ | (5,497 | ) | $ | (6,698 | ) | $ | 1,201 | $ | 343 | $ | 858 | |||||||
Net loss per share—basic and diluted | $ | (0.12 | ) | $ | (0.18 | ) | $ | 0.06 | |||||||||||
We wholly-owned 74 properties as of December 31, 2016 and 57 properties as of December 31, 2015. The Same-Center column in the table above includes the 20 properties that were owned and operational prior to January 1, 2015. The Non-Same-Center column includes properties that were acquired after December 31, 2014, in addition to corporate-level income and expenses. In this section, we primarily explain fluctuations in activity shown in the Same-Center column as well as any notable fluctuations in the Non-Same-Center column related to corporate-level activity.
Total revenues—Of the $69.4 million increase in total revenues, $67.4 million was related to the properties acquired in 2015 and 2016. The remaining variance was the result of an increase in revenue among same-center properties, primarily due to a $1.2 million increase in rental income, which was primarily driven by a $0.22 increase in same-center minimum rent per square foot since December 31, 2015. We also had a $0.9 million increase in same-center tenant recovery income, which resulted from the combination of increases in real estate tax expense and our overall recovery rate.
General and administrative expenses—The $14.4 million increase in general and administrative expenses was primarily attributable to the $10.0 million increase in cash asset management fees, as a result of the change to our advisory fee structure as of January 1, 2016. Previously, the asset management fee had been deferred via the issuance of Class B units, which did not result in the recognition of expense under GAAP. The asset management fee percentage did not increase; however, 80% is now paid through cash and therefore recognized as expense under GAAP, with 20% remaining as Class B units. We also had increases of $1.0 million in transfer agent expense, $0.6 million of additional distributions on Class B units as a result of an increase in outstanding Class B units, and $2.8 million in professional fees that were primarily due to third-party valuation work for determination of our per share estimated value, higher costs for investor relations custodial fees, and an overall increase in the corporate-level costs associated with managing a larger portfolio.
Depreciation and amortization—Of the $30.8 million increase in depreciation and amortization expense, $29.6 million was related to the properties acquired in 2015 and 2016. The remaining variance was due to the combination of an increase in the tenant improvement on certain same-center properties, and accelerated depreciation and amortization caused by early termination of certain leases.
Interest expense, net—Of the $7.0 million increase in interest expense, net, $5.1 million is related to higher borrowings in 2016 on the revolving credit facility and the new term loans that we entered into in June 2016, as well as the amortization of deferred financing costs related to the new debt instruments. The remaining $1.9 million increase is related to mortgage loans assumed in connection with certain acquisitions throughout 2015 and 2016.
Gain on contribution of properties to unconsolidated joint venture—The $3.3 million increase is due to the gain on the contributions of six properties to our joint venture in March 2016.
33
Leasing Activity
Below is a summary of leasing activity for the years ended December 31, 2017 and 2016:
Total Deals | Inline Deals(1) | |||||||||||||||
2017 | 2016 | 2017 | 2016 | |||||||||||||
New leases: | ||||||||||||||||
Number of leases | 70 | 82 | 69 | 80 | ||||||||||||
Square footage (in thousands) | 157 | 213 | 142 | 183 | ||||||||||||
First-year base rental revenue (in thousands) | $ | 2,751 | $ | 3,599 | $ | 2,602 | $ | 3,363 | ||||||||
Average rent per square foot (“PSF”) | $ | 17.52 | $ | 16.93 | $ | 18.31 | $ | 18.37 | ||||||||
Average cost PSF of executing new leases(2)(3) | $ | 32.31 | $ | 33.68 | $ | 30.47 | $ | 36.75 | ||||||||
Weighted-average lease term (in years) | 7.7 | 7.9 | 7.4 | 8.2 | ||||||||||||
Renewals and options: | ||||||||||||||||
Number of leases | 178 | 172 | 173 | 162 | ||||||||||||
Square footage (in thousands) | 492 | 672 | 366 | 350 | ||||||||||||
First-year base rental revenue (in thousands) | $ | 9,078 | $ | 9,389 | $ | 7,881 | $ | 7,005 | ||||||||
Average rent PSF | $ | 18.45 | $ | 13.97 | $ | 21.54 | $ | 20.03 | ||||||||
Average rent PSF prior to renewals | $ | 16.45 | $ | 12.73 | $ | 19.12 | $ | 18.03 | ||||||||
Percentage increase in average rent PSF | 12.0 | % | 9.8 | % | 12.5 | % | 11.1 | % | ||||||||
Average cost PSF of executing renewals and options(2)(3) | $ | 3.77 | $ | 3.39 | $ | 4.57 | $ | 4.36 | ||||||||
Weighted-average lease term (in years) | 4.9 | 5.4 | 4.9 | 5.3 | ||||||||||||
Portfolio retention rate(4) | 87.8 | % | 85.8 | % | 83.7 | % | 81.5 | % | ||||||||
(1) | We consider an inline deal to be a lease for less than 10,000 square feet of gross leasable area (“GLA”). |
(2) | The cost of executing new leases, renewals, and options includes leasing commissions, tenant improvement costs, and tenant concessions. |
(3) | The costs associated with landlord improvements are excluded for repositioning and redevelopment projects. |
(4) | The portfolio retention rate is calculated by dividing (a) total square feet of retained tenants with current period lease expirations by (b) the square feet of leases expiring during the period. |
The average rent per square foot and cost of executing leases fluctuates based on the tenant mix, size of the space, and lease term. Leases with national and regional tenants generally require a higher cost per square foot than those with local tenants. However, such tenants will also pay for a longer term. As we continue to attract more of these national and regional tenants, our costs to lease may increase.
Non-GAAP Measures
Same-Center Net Operating Income
We present Same-Center NOI as a supplemental measure of our performance. We define NOI as total operating revenues less property operating expenses, real estate taxes, and non-cash revenue items. Same-Center NOI represents the NOI for the 51 properties that were wholly-owned and operational for the entire portion of both comparable reporting periods. We believe that NOI and Same-Center NOI provide useful information to our investors about our financial and operating performance because each provides a performance measure of the revenues and expenses directly involved in owning and operating real estate assets and provides a perspective not immediately apparent from net income. Because Same-Center NOI excludes the change in NOI from properties acquired after December 31, 2015, it highlights operating trends such as occupancy levels, rental rates, and operating costs on properties that were operational for both comparable periods. Other REITs may use different methodologies for calculating Same-Center NOI, and accordingly, our Same-Center NOI may not be comparable to other REITs.
Same-Center NOI should not be viewed as an alternative measure of our financial performance since it does not reflect the operations of our entire portfolio, nor does it reflect the impact of general and administrative expenses, acquisition expenses, interest expense, depreciation and amortization, other income, or the level of capital expenditures and leasing costs necessary to maintain the operating performance of our properties that could materially impact our results from operations.
34
The table below is a comparison of the Same-Center NOI for the years ended December 31, 2017 and 2016 (in thousands):
2017 | 2016 | $ Change | % Change | ||||||||||||
Revenues: | |||||||||||||||
Rental income(1) | $ | 70,929 | $ | 69,321 | $ | 1,608 | |||||||||
Tenant recovery income | 26,848 | 25,903 | 945 | ||||||||||||
Other property income | 534 | 413 | 121 | ||||||||||||
Total revenues | 98,311 | 95,637 | 2,674 | 2.8 | % | ||||||||||
Operating Expenses: | |||||||||||||||
Property operating expenses | 17,510 | 17,282 | 228 | ||||||||||||
Real estate taxes | 15,851 | 15,891 | (40 | ) | |||||||||||
Total operating expenses | 33,361 | 33,173 | 188 | 0.6 | % | ||||||||||
Total Same-Center NOI | $ | 64,950 | $ | 62,464 | $ | 2,486 | 4.0 | % | |||||||
(1) | Excludes straight-line rental income, net amortization of above- and below-market leases and lease buyout income. |
Below is a reconciliation of net loss to NOI and Same-Center NOI for the years ended December 31, 2017 and 2016 (in thousands):
2017 | 2016 | ||||||
Net loss: | $ | (9,531 | ) | $ | (5,497 | ) | |
Adjusted to exclude: | |||||||
Straight-line rental income | (2,407 | ) | (2,767 | ) | |||
Net amortization of above- and below-market leases | (2,365 | ) | (2,142 | ) | |||
Lease buyout income | (125 | ) | (707 | ) | |||
General and administrative expenses | 19,352 | 18,139 | |||||
Acquisition expenses | 586 | 10,754 | |||||
Termination of affiliate arrangements | 5,962 | — | |||||
Depreciation and amortization | 71,200 | 56,541 | |||||
Interest expense, net | 22,494 | 10,970 | |||||
Gain on contribution of properties to unconsolidated joint venture | — | (3,341 | ) | ||||
Other loss (income), net | 90 | (153 | ) | ||||
NOI | 105,256 | 81,797 | |||||
Less: NOI from centers excluded from Same-Center | 40,306 | 19,333 | |||||
Total Same-Center NOI | $ | 64,950 | $ | 62,464 | |||
Funds from Operations and Modified Funds from Operations
FFO is a non-GAAP performance financial measure that is widely recognized as a measure of REIT operating performance. We use FFO as defined by the National Association of Real Estate Investment Trusts (“NAREIT”) to be net income (loss) attributable to common shareholders computed in accordance with GAAP, excluding gains (or losses) from sales of property, plus depreciation and amortization, and after adjustments for unconsolidated partnerships and joint ventures. Adjustments for unconsolidated partnerships and joint ventures are calculated to reflect funds from operations on the same basis.
MFFO is an additional performance financial measure used by us as FFO includes certain non-comparable items that affect our performance over time. MFFO excludes the following items:
• | acquisition fees and expenses; |
• | straight-line rent amounts, both income and expense; |
• | amortization of above- or below-market intangible lease assets and liabilities; |
• | amortization of discounts and premiums on debt investments; |
• | gains or losses from the early extinguishment of debt; |
• | gains or losses on the extinguishment of derivatives, except where the trading of such instruments is a fundamental attribute of our operations; |
• | gains or losses related to fair value adjustments for derivatives not qualifying for hedge accounting; |
35
• | gains or losses related to consolidation from, or deconsolidation to, equity accounting; |
• | adjustments related to the above items for unconsolidated entities in the application of equity accounting; and |
• | costs to terminate affiliate arrangements. |
We believe that MFFO is helpful in assisting management and investors with the assessment of the sustainability of operating performance in future periods. Neither FFO nor MFFO should be considered as an alternative to net income (loss) or income (loss) from continuing operations under GAAP, nor as an indication of our liquidity, nor is either of these measures indicative of funds available to fund our cash needs, including our ability to fund distributions. MFFO may not be a useful measure of the impact of long-term operating performance on value if we do not continue to operate our business plan in the manner currently contemplated.
Accordingly, FFO and MFFO should be reviewed in connection with other GAAP measurements. FFO and MFFO should not be viewed as more prominent measures of performance than our net income or cash flows from operations prepared in accordance with GAAP. Our FFO and MFFO as presented may not be comparable to amounts calculated by other REITs.
The following section presents our calculation of FFO and MFFO and provides additional information related to our operations. As a result of the timing of the commencement of our initial public offering and our active real estate acquisitions, FFO and MFFO are not relevant to a discussion comparing operations for the periods presented. We expect revenues and expenses to increase in future periods as we acquire additional investments.
FFO AND MFFO
FOR THE YEARS ENDED DECEMBER 31, 2017, 2016, AND 2015
(Unaudited)(In thousands, except per share amounts)
2017 | 2016 | 2015 | |||||||||
Calculation of FFO | |||||||||||
Net loss | $ | (9,531 | ) | $ | (5,497 | ) | $ | (6,698 | ) | ||
Adjustments: | |||||||||||
Depreciation and amortization of real estate assets | 71,200 | 56,541 | 25,778 | ||||||||
Gain on contribution of properties to unconsolidated joint venture | — | (3,341 | ) | — | |||||||
Depreciation and amortization related to unconsolidated joint venture | 1,906 | 716 | — | ||||||||
FFO | $ | 63,575 | $ | 48,419 | $ | 19,080 | |||||
Calculation of MFFO | |||||||||||
FFO | $ | 63,575 | $ | 48,419 | $ | 19,080 | |||||
Adjustments: | |||||||||||
Net amortization of above- and below-market leases | (2,365 | ) | (2,142 | ) | (1,151 | ) | |||||
Straight-line rental income | (2,407 | ) | (2,767 | ) | (2,056 | ) | |||||
Acquisition expenses | 586 | 10,754 | 13,661 | ||||||||
Termination of affiliate arrangements | 5,962 | — | — | ||||||||
Amortization of market debt adjustment | (1,068 | ) | (866 | ) | (845 | ) | |||||
Loss (gain) on extinguishment of debt, net | (12 | ) | (80 | ) | (60 | ) | |||||
Change in fair value of derivative | (595 | ) | (1,076 | ) | (107 | ) | |||||
Adjustments related to unconsolidated joint venture | (46 | ) | 189 | — | |||||||
MFFO | $ | 63,630 | $ | 52,431 | $ | 28,522 | |||||
Earnings per common share | |||||||||||
Weighted-average common shares outstanding - basic | 46,544 | 46,228 | 36,538 | ||||||||
Weighted-average common shares outstanding - diluted(1) | 46,547 | 46,230 | 36,538 | ||||||||
FFO per share - basic and diluted | $ | 1.37 | $ | 1.05 | $ | 0.52 | |||||
MFFO per share - basic and diluted | $ | 1.37 | $ | 1.13 | $ | 0.78 | |||||
(1) | Restricted stock awards were dilutive to FFO/MFFO for the years ended December 31, 2017 and 2016, and, accordingly, were included in the weighted-average common shares used to calculate diluted FFO/MFFO per share. |
36
Liquidity and Capital Resources
General
Our principal cash demands are for real estate and real estate-related investments, capital expenditures, operating expenses, repurchases of common stock, distributions to stockholders, and principal and interest on our outstanding indebtedness. We intend to use our cash on hand, operating cash flows, proceeds from our DRIP, and proceeds from debt financings, including borrowings under our unsecured credit facility, as our primary sources of immediate and long-term liquidity. We continue to acquire additional investments to complete our portfolio. We expect that substantially all of the net cash generated from operations will be used to pay distributions to our stockholders after certain capital expenditures, including tenant improvements and leasing commissions, are funded; however, we have and may continue to use other sources to fund distributions as necessary, including borrowings.
As of December 31, 2017, we had cash and cash equivalents of $1.4 million. During the year ended December 31, 2017, we had a net cash decrease of $6.8 million, as discussed below.
Operating Activities
Our net cash provided by operating activities consists primarily of cash inflows from tenant rental and recovery payments and cash outflows for property operating expenses, real estate taxes, general and administrative expenses, acquisition expenses, and interest payments.
Our cash flows from operating activities were $50.3 million as of December 31, 2017, compared to $45.4 million from the same period in 2016, primarily due to an increase in the number of properties owned, the length of ownership of those properties, and a 4.0% increase in same-center NOI. Operating cash flows are expected to continue to increase as we grow income from our properties.
Investing Activities
Net cash used in investing activities is impacted by the nature, timing, and extent of improvements to and acquisition of real estate and real estate-related assets.
Cash paid for acquisitions decreased in 2017 compared to 2016. During the year ended December 31, 2017, we had a total cash outlay of $174.7 million related to the acquisition of eleven grocery-anchored shopping centers. During the same period in 2016, we acquired 23 grocery-anchored shopping centers and additional real estate adjacent to a previously acquired center for a total cash investment of $422.4 million.
In March 2016, we entered into a joint venture agreement under which we may contribute up to $50 million of equity. Our initial contribution was $6.9 million as we contributed six properties with a fair value of approximately $94.3 million and received a distribution of $87.4 million in cash. We contributed an additional $2.9 million and $7.7 million in cash to the joint venture during the years ended December 31, 2017 and 2016, respectively, to acquire eight additional assets. During the year ended December 31, 2017, we received $1.0 million in distributions from the joint venture. See Note 4 for more information regarding the joint venture.
In March 2017, our board of directors approved the issuance of certain short-term loans to the joint venture for their acquisition needs. The loans have a term of up to 60 days, and the total outstanding principal balance funded by us should not exceed $15 million at any given time. The interest rate on such loans shall be the greater of a) LIBOR plus 1.70% or b) the borrowing rate on our revolving credit facility. During the year ended December 31, 2017, we loaned the joint venture $1.3 million, which was subsequently repaid. There were no outstanding loans to the joint venture as of December 31, 2017.
Financing Activities
Net cash flows from financing activities are affected by payments of distributions, share repurchases, principal and other payments associated with our outstanding debt, and borrowings during the period. As our debt obligations mature, we intend to refinance the remaining balance, if possible, or pay off the balances at maturity using proceeds from operations and/or corporate-level debt.
As of December 31, 2017, our debt to total enterprise value was 42.2%. Debt to total enterprise value is calculated as net debt (total debt, excluding below-market debt adjustments and deferred financing costs, less cash and cash equivalents) as a percentage of enterprise value (equity value, calculated as total common shares outstanding multiplied by the estimated value per share of $22.75, plus net debt).
We have access to a revolving credit facility with a capacity of up to $350 million and a current interest rate of LIBOR plus 1.55%. As of December 31, 2017, $292.4 million was available for borrowing, from which we may draw funds to pay certain long-term debt obligations as they mature, increase our investment in real estate, or pay operating costs and expenses. The revolving credit facility matures in July 2018; however, we intend to exercise an option to extend the maturity date to January 2019. During the year ended December 31, 2017, we had an increase of $29.4 million in net borrowings from our revolving credit facility compared to an increase of $28.0 million for the same period in 2016.
In September 2017, we executed a new $200 million unsecured term loan facility, which matures in September 2024. Proceeds from this facility were used to pay down the revolving credit facility, enhancing our liquidity and line availability. In October 2017, we executed an interest rate swap that fixes LIBOR at 2.194% on the new $200 million term loan facility for a total fixed effective rate of 4.09%.
We offer an SRP that provides a limited opportunity for stockholders to have shares of common stock repurchased, subject to certain restrictions and limitations. For a more detailed discussion of our SRP, see Note 10. During the year ended December 31, 2017, we paid cash for repurchases of common stock in the amount of $31.3 million. Due to the program’s funding limits and current outstanding requests, the funds available for repurchases in 2018 are expected to be insufficient to meet all requests.
37
Activity related to distributions to our stockholders for the years ended December 31, 2017 and 2016, is as follows (in thousands):
2017 | 2016 | ||||||
Gross distributions paid | $ | 75,745 | $ | 75,127 | |||
Distributions reinvested through DRIP | 36,537 | 38,263 | |||||
Net cash distributions | $ | 39,208 | $ | 36,864 | |||
Net loss | $ | (9,531 | ) | $ | (5,497 | ) | |
Net cash provided by operating activities | $ | 50,308 | $ | 45,353 | |||
FFO(1) | $ | 63,575 | $ | 48,419 | |||
(1) See Item 7. Management's Discussion and Analysis of Financial Condition and Results of Operations - Non-GAAP Measures, for the definition of FFO, information regarding why we present FFO, as well as for a reconciliation of this non-GAAP financial measure to net loss on the consolidated statements of operations.
We paid distributions monthly and expect to continue paying distributions monthly unless our results of operations, our general financial condition, general economic conditions or other factors, as determined by our board of directors, make it imprudent to do so. The timing and amount of distributions are determined by our board of directors and are influenced in part by our intention to comply with REIT requirements of the Internal Revenue Code.
To maintain our qualification as a REIT, we must make aggregate annual distributions to our stockholders of at least 90% of our REIT taxable income (which is computed without regard to the dividends paid deduction or net capital gain and which does not necessarily equal net income as calculated in accordance with GAAP). If we meet the REIT qualification requirements, we generally will not be subject to U.S. federal income tax on the income that we distribute to our stockholders each year. However, we may be subject to certain state and local taxes on our income, property or net worth, respectively, and to federal income and excise taxes on our undistributed income.
We have not established a minimum distribution level, and our charter does not require that we make distributions to our stockholders.
Contractual Commitments and Contingencies
Our contractual obligations as of December 31, 2017, were as follows (in thousands):
Payments due by period | ||||||||||||||||||||||||||||
Total | 2018 | 2019 | 2020 | 2021 | 2022 | Thereafter | ||||||||||||||||||||||
Long-term debt obligations - principal payments | $ | 776,438 | $ | 83,725 | 83,725,000 | $ | 187,848 | $ | 187,985 | $ | 51,931 | $ | 19,666 | $ | 245,283 | |||||||||||||
Long-term debt obligations - interest payments (1) | 100,863 | 25,222 | 21,154 | 15,900 | 12,119 | 10,265 | 16,203 | |||||||||||||||||||||
Operating lease obligations | 1,092 | 364 | 364 | 364 | — | — | — | |||||||||||||||||||||
Total | $ | 878,393 | $ | 109,311 | $ | 209,366 | $ | 204,249 | $ | 64,050 | $ | 29,931 | $ | 261,486 | ||||||||||||||
(1) | Future variable-rate interest payments are based on interest rates as of December 31, 2017, including the impact of our swap arrangements. |
Our portfolio debt instruments and the unsecured revolving credit facility contain certain covenants and restrictions. The following is a list of certain restrictive covenants specific to the unsecured revolving credit facility that were deemed significant:
• | limits the ratio of debt to total asset value, as defined, to 60% or 65% for four consecutive periods following a material acquisition; |
• | requires the fixed charge ratio, as defined, to be 1.5 or greater or 1.4 for four consecutive periods following a material acquisition; and |
• | limits the ratio of cash dividend payments to a specified percentage of FFO that varies among the related debt agreements. |
As of December 31, 2017, we were in compliance with the restrictive covenants of our outstanding debt obligations. We expect to continue to meet the requirements of our debt covenants over the short- and long-term.
38
ITEM 7A. QUANTITATIVE AND QUALITATIVE DISCLOSURES ABOUT MARKET RISK
We utilize interest rate swaps in order to hedge a portion of our exposure to interest rate fluctuations. We do not intend to enter into derivative or interest rate transactions for speculative purposes. Our hedging decisions are determined based upon the facts and circumstances existing at the time of the hedge and may differ from our currently anticipated hedging strategy. Because we use derivative financial instruments to hedge against interest rate fluctuations, we may be exposed to both credit risk and market risk. Credit risk is the failure of the counterparty to perform under the terms of the derivative contract. If the fair value of a derivative contract is positive, the counterparty will owe us, which creates credit risk for us. If the fair value of a derivative contract is negative, we will owe the counterparty and, therefore, do not have credit risk. We seek to minimize the credit risk in derivative instruments by entering into transactions with high-quality counterparties. Market risk is the adverse effect on the value of a financial instrument that results from a change in interest rates. The market risk associated with interest-rate contracts is managed by establishing and monitoring parameters that limit the types and degree of market risk that may be undertaken.
As of December 31, 2017, we had five interest rate swaps that fixed LIBOR on $570 million of our unsecured term loan facilities (“Term Loans”). We were also party to two interest rate swaps that fixed the variable interest rate on $15.4 million of two of our variable-rate mortgage notes.
As of December 31, 2017, we had not fixed the interest rate on $57.4 million of our unsecured variable-rate debt through derivative financial instruments, and as a result, we are subject to the potential impact of rising interest rates, which could negatively impact our profitability and cash flows. The impact on our annual results of operations of a one-percentage point increase in interest rates on the outstanding balance of our variable-rate debt at December 31, 2017, would result in approximately $0.6 million of additional interest expense.
These amounts were determined based on the impact of hypothetical interest rates on our borrowing cost and assume no changes in our capital structure. As the information presented above includes only those exposures that exist as of December 31, 2017, it does not consider those exposures or positions that could arise after that date. Hence, the information represented herein has limited predictive value. As a result, the ultimate realized gain or loss with respect to interest rate fluctuations will depend on the exposures that arise during the period, the hedging strategies at the time, and the related interest rates.
We do not have any foreign operations, and thus we are not exposed to foreign currency fluctuations.
ITEM 8. FINANCIAL STATEMENTS AND SUPPLEMENTARY DATA
See the Index to Financial Statements at page F-1 of this report.
ITEM 9. CHANGES IN AND DISAGREEMENTS WITH ACCOUNTANTS ON ACCOUNTING AND FINANCIAL DISCLOSURE
None.
ITEM 9A. CONTROLS AND PROCEDURES
Evaluation of Disclosure Controls and Procedures
Our management has evaluated, with the participation of our principal executive and principal financial officers, the effectiveness of our disclosure controls and procedures (as defined in Rules 13a-15(e) and 15d-15(e) under the Exchange Act) as of the end of the period covered by this report. Based on that evaluation, the principal executive and principal financial officers have concluded that our disclosure controls and procedures were effective as of the end of the period covered by this report.
Management’s Report on Internal Control Over Financial Reporting
Our management is responsible for establishing and maintaining adequate internal control over financial reporting, as defined in Exchange Act Rule 13a-15(f). Under the supervision and with the participation of our management, including our principal executive officer and principal financial officers, we conducted an evaluation of the effectiveness of our internal control over financial reporting based on the framework in Internal Control - Integrated Framework issued by the Committee of Sponsoring Organizations of the Treadway Commission (“COSO”). Based on our evaluation under the framework in Internal Control - Integrated Framework (2013) issued by the COSO, our management concluded that our internal control over financial reporting was effective as of December 31, 2017.
Changes in Internal Control over Financial Reporting.
During the quarter ended December 31, 2017, there were no changes in our internal control over financial reporting that have materially affected, or are reasonably likely to materially affect, our internal control over financial reporting.
ITEM 9B. OTHER INFORMATION
None.
39
w PART III |
ITEM 10. DIRECTORS, EXECUTIVE OFFICERS, AND CORPORATE GOVERNANCE
Directors and Executive Officers. Phillips Edison Grocery Center REIT II, Inc. (“we,” the “Company,” “our,” or “us”) has provided below certain information about our executive officers and directors:
Name | Position(s) | Age* | Year First Became a Director | |||
Jeffrey S. Edison | Chairman of the Board of Directors and Chief Executive Officer | 57 | 2013 | |||
David W. Garrison | Independent Director | 62 | 2013 | |||
Mark D. McDade | Independent Director | 62 | 2013 | |||
John A. Strong | Independent Director | 57 | 2017 | |||
R. Mark Addy | President and Chief Operating Officer | 55 | N/A | |||
Devin I. Murphy | Chief Financial Officer, Treasurer and Secretary | 57 | N/A | |||
Jennifer L. Robison | Chief Accounting Officer | 41 | N/A | |||
* As of the date of this filing
Directors
Jeffrey S. Edison (Chairman of our Board of Directors and Chief Executive Officer)—Mr. Edison has been chairman of our board of directors and our chief executive officer since August 2013. Mr. Edison has served as chairman or co-chairman of the board of directors and chief executive officer of Phillips Edison & Company, Inc. (“PECO”) since December 2009, and as president of PECO since October 2017. Mr. Edison has also served as chairman of the board of directors and the chief executive officer of Phillips Edison Grocery Center REIT III, Inc. (“REIT III”) since April 2016. Mr. Edison, together with Michael C. Phillips, founded Phillips Edison Limited Partnership (“PELP”) in 1991 and served as a principal of PELP from 1995 until it was acquired by PECO in 2017. From 1991 to 1995, Mr. Edison was employed by Nations Bank’s South Charles Realty Corporation, serving as a senior vice president from 1993 until 1995 and as a vice president from 1991 until 1993. Mr. Edison was employed by Morgan Stanley Realty Incorporated from 1987 until 1990 and was employed by The Taubman Company from 1984 until 1987. Mr. Edison received his bachelor’s degree in mathematics and economics from Colgate University in 1982 and a master’s degree in business administration from Harvard Business School in 1984.
Among the most important factors that led to our board of directors’ recommendation that Mr. Edison serve as our director are Mr. Edison’s leadership skills, integrity, judgment, knowledge of our company, his prior experience as a director and chief executive officer, and his commercial real estate expertise.
David W. Garrison (Independent Director)—Mr. Garrison has served as one of our directors since September 2013. Mr. Garrison is currently chief navigator of Garrison Growth, an international consulting services firm. From October 2002 to June 2013, Mr. Garrison served as chief executive officer and director of iBahn Corp. (formerly STSN), a provider of broadband services for hotels. On September 6, 2013, iBahn Corp. filed for bankruptcy protection under the provisions of Chapter 11 of the United States Bankruptcy Code for the District of Delaware. Such action was dismissed by the court on February 3, 2015. From 2000 to 2001, Mr. Garrison was chairman and chief executive officer of Verestar, a satellite services company, where he also served on the board of Verestar's parent company, American Tower. From 1995 to 1998, Mr. Garrison was chairman and chief executive officer of Netcom, a pioneer Internet service provider. From January 2003 to July 2013, Mr. Garrison served as a director of SonicWall, Inc., where at various times he served on the Audit Committee, the Compensation Committee (Chair) and the Corporate Governance and Nominations Committee. From 1997 to 2002, Mr. Garrison served as an independent director of Ameritrade, the first online trading company, and he was also the chair of the compensation committee and lead independent director at different times. Mr. Garrison holds a bachelor of science degree from Syracuse University and a master of business administration degree from Harvard University. Among the most important factors that led to the board of directors’ recommendation that Mr. Garrison serve as our director are Mr. Garrison’s integrity, judgment, leadership skills, commercial business experience, public company director experience and independence from management, our sponsor and its affiliates.
Mark D. McDade (Independent Director)—Mr. McDade has served one of our directors since September 2013. Mr. McDade has served as executive vice president of Established Brands, Solutions and Supply for UCB from February 2013. He also served as chief operating officer of UCB, SA, located in Brussels, Belgium, until January 2017. From April 2008 to February 2013, Mr. McDade served as executive vice president of Global Operations for UCB. From 2002 until late 2007, Mr. McDade served as chief executive officer and a director of PDL Biopharma Inc., an antibody-based biopharmaceutical company located in Redwood City, California. Prior to 2002, he served as chief executive officer of Signature Bioscience Inc., located in San Francisco, California. Mr. McDade was founder and a director of Corixa Corporation, where he served as chief operating officer from September 1994 to December 1998 and as president and chief operating officer from January 1999 until his departure in late 2000 to join Signature Bioscience Inc. Before Corixa Corporation, Mr. McDade was chief operating officer of Boehringer Mannheim Therapeutics, the bio-pharmaceutical division of Corange Ltd., and prior to that he held several positions at Sandoz Ltd., including in business development, product management and general management. Mr. McDade received his bachelor of arts degree from Dartmouth College and his master of business administration degree from Harvard Business School. Among the most important factors that led to the board of directors’ recommendation that Mr. McDade serve as our director are Mr. McDade’s integrity, judgment, leadership skills, commercial business experience, public company director experience, and independence from management and our sponsor and its affiliates.
40
John A. Strong (Independent Director)—Dr. Strong has served as one of our directors since May 2017. Since July 2010, Dr. Strong has served as chairman and chief executive officer of Bankers Financial Corporation, a diversified financial services company for outsourcing solutions for claims, policy and flood products for insurers; insurance tracking for lenders; human resources solutions for small business; warranties for consumer electronics and new homes; insurance and maintenance services for properties, businesses and builders; and surety bonds for bail. Since 2007 he has served as a board member of Bankers Financial Corporation. From 2005 to 2010 he served as the president and managing partner of Greensboro Radiology. Dr. Strong holds a Doctor of Medicine degree from Michigan State University College of Human Medicine as well as his Residency and Fellowship in Radiology from Duke University, and a bachelor of arts in mathematics degree from Duke University. Among the most important factors that led to the board of directors’ recommendation that Dr. Strong serve as our director are Dr. Strong’s integrity, judgment, leadership skills, financial and management expertise, and independence from management, our sponsor and its affiliates.
Executive Officers
R. Mark Addy—Mr. Addy has served as our president or co-president and chief operating officer since August 2013. Mr. Addy has also served as the president and chief operating officer of REIT III since April 2016, as the president or co-president of PECO from April 2013 to October 2017, as well as the chief operating officer of PECO from October 2010 to October 2017, and as the executive vice president of PECO since October 2017. Mr. Addy served as chief operating officer for PELP from 2004 to October 2010. He served PELP as senior vice president from 2002 until 2004, when he became chief operating officer. Mr. Addy was the top executive in the Cincinnati, Ohio headquarters, responsible for implementing the company’s growth strategy. Prior to joining PELP, Mr. Addy practiced law with Santen & Hughes in the areas of commercial real estate, financing and leasing, mergers and acquisitions, and general corporate law from 1987 until 2002. Mr. Addy was the youngest law partner in the 50-year history of Santen & Hughes, and served as president of Santen & Hughes from 1996 through 2002. While at Santen & Hughes, he represented PELP from its inception in 1991 to 2002. Mr. Addy received his bachelor’s degree in environmental science and chemistry from Bowling Green State University, where he received the President’s Award for academic achievement and was a member of the Order of the Omega leadership honor society. Mr. Addy received his law degree from the University of Toledo, where he was a member of the Order of the Barristers.
Devin I. Murphy—Mr. Murphy has served as our chief financial officer, treasurer and secretary since August 2013. He also serves as the chief financial officer, treasurer and secretary of REIT III since April 2016, and of as a principal and chief financial officer of PECO since June 2013. From November 2009 to June 2013, he served as Vice chairman of Investment Banking at Morgan Stanley. He began his real estate career in 1986 when he joined the real estate group at Morgan Stanley as an associate. Prior to rejoining Morgan Stanley in June 2009, Mr. Murphy was a managing partner of Coventry Real Estate Advisors, (“Coventry”), a real estate private equity firm founded in 1998 which sponsors a series of institutional investment funds that acquire and develop retail properties. Prior to joining Coventry in March 2008, from February 2004 until November 2007, Mr. Murphy served as global head of real estate investment banking for Deutsche Bank Securities, Inc. (“Deutsche Bank”). At Deutsche Bank, Mr. Murphy ran a team of over 100 professionals located in eight offices in the United States, Europe and Asia. Prior to joining Deutsche Bank, Mr. Murphy was with Morgan Stanley for 15 years. He held a number of senior positions at Morgan Stanley including co-head of United States real estate investment banking and head of the private capital markets group. Mr. Murphy served on the investment committee of the Morgan Stanley Real Estate Funds from 1994 until his departure in 2004. Mr. Murphy has served as an advisory director for Hawkeye Partners, a real estate private equity firm headquartered in Austin, Texas, since March 2005 and for Trigate Capital, a real estate private equity firm headquartered in Dallas, Texas, since September 2007. Mr. Murphy received a master’s of business administration degree from the University of Michigan and a bachelor of arts degree with honors from the College of William and Mary. He is a member of the Urban Land Institute, the Pension Real Estate Association and the National Association of Real Estate Investment Trusts.
Jennifer L. Robison—Ms. Robison has served as our chief accounting officer since March 2015. Ms. Robison has also served as the chief accounting officer of REIT I since March 2015 and REIT III since April 2016. Ms. Robison has served as the senior vice president and chief accounting officer of PELP since July 2014. From February 2005 to July 2014, Ms. Robison served as vice president, financial reporting at Ventas, Inc., an S&P 500 company and one of the ten largest equity REITs in the country. Prior to her time at Ventas, Ms. Robison served as an audit manager at Mountjoy Chilton Medley LLP from September 2003 to February 2005. Ms. Robison began her career at Ernst & Young LLP, serving most recently as assurance manager, and was an employee there from February 1996 to September 2003. She received a bachelor of arts degree in accounting from Bellarmine University, where she graduated magna cum laude. Ms. Robison is a certified public accountant and a member of the American Institute of Certified Public Accountants, the National Association of Real Estate Investments Trusts and the SEC Professional Group.
Section 16(a) Beneficial Ownership Reporting Compliance—Under U.S. securities laws, directors, executive officers and any persons beneficially owning more than 10% of our common stock are required to report their initial ownership of the common stock and most changes in that ownership to the Securities and Exchange Commission (“SEC”). The SEC has designated specific due dates for these reports, and we are required to identify in this proxy statement those persons who did not file these reports when due. Based solely on our review of copies of the reports filed with the SEC and written representations of our directors and executive officers, one Form 3 for Dr. Strong and one Form 4 for each of Messrs. Garrison and McDade and Dr. Strong were inadvertently filed late.
Code of Ethics—We have adopted a Code of Ethics that applies to all of our executive officers and directors, including but not limited to, our Principal Executive Officer and Principal Financial Officer. Our Code of Ethics may be found on our website at www.grocerycenterreit2.com/investor-relations/governance.
Audit Committee—The Audit Committee’s primary function is to assist our board of directors in fulfilling its responsibilities by overseeing our independent auditors and reviewing the financial information to be provided to our stockholders and others, overseeing the system of internal control over financial reporting that our management has established, and overseeing our audit and financial reporting process. The Audit Committee is also responsible for overseeing our compliance with applicable laws and regulations and for establishing procedures for the ethical conduct of our business. The Audit Committee fulfills these responsibilities primarily by carrying out the activities enumerated in the Audit Committee Charter adopted by our board of
41
directors in 2013. The Audit Committee Charter is available on our website at www.grocerycenterreit2.com/investor-relations/governance.
The members of the Audit Committee currently are David W. Garrison (Chair), Mark D. McDade and John A. Strong. The board of directors has determined that Mr. Garrison, who is an independent director, qualifies as the Audit Committee “financial expert” within the meaning of SEC rules.
ITEM 11. EXECUTIVE COMPENSATION
Messrs. Edison, Addy and Murphy, and Ms. Robison, are our executive officers. They are not our employees and do not receive compensation from us. Our executive officers are employees of PECO. A subsidiary of PECO has entered into an advisory agreement with us whereby it is responsible for providing our day-to-day management (subject to the authority of our board of directors) and it is responsible for compensating its employees, including the executive officers.
Compensation of Directors—The following table sets forth information concerning the compensation of our independent directors for the year ended December 31, 2017:
Fees Earned or | |||||||||
Name | Paid in Cash ($) | Stock Awards ($) (1) | Total ($) | ||||||
David W. Garrison | 66,000 | 25,000 | 91,000 | ||||||
Mark D. McDade | 37,000 | 25,000 | 62,000 | ||||||
John A. Strong | 22,000 | 25,000 | 47,000 | ||||||
C. Ann Chao (2) | 24,000 | — | 24,000 | ||||||
Paul J. Massey, Jr. (2) | 21,000 | — | 21,000 | ||||||
(1) | Represents the aggregate grant date fair value of restricted stock awards made to our directors in 2017, calculated in accordance with Financial Accounting Standards Board (“FASB”) Accounting Standards Codification (“ASC”) Topic 718. Such aggregate grant date fair values do not take into account any estimated forfeitures related to service-vesting conditions. The amounts reported in this column reflect the accounting cost for these restricted stock awards, and do not correspond to the actual economic value that may be received by the director upon vesting of the awards. Assumptions used in the calculation of these amounts are included in Note 2 to the consolidated financial statements included elsewhere in this Annual Report on Form 10-K. |
(2) | Former Director that resigned in August 2017. |
As of December 31, 2017, the non-employee members of our Board held the following outstanding equity awards: Mr. Garrison held 1,934 shares of restricted stock, Mr. McDade held 1,934 shares of restricted stock and Mr. Strong held 1,100 shares of restricted stock.
Cash Compensation—We pay each of our independent directors:
• | an annual retainer of $30,000; |
• | $1,000 per each board meeting attended; |
• | $1,000 per each committee meeting attended; |
• | an annual retainer of $30,000 for the chair of the Audit Committee; and |
• | an annual retainer of $3,000 for the chair of the Conflicts Committee. |
All directors receive reimbursement of reasonable out-of-pocket expenses incurred in connection with attendance at meetings of the board of directors.
Equity Compensation Plan Information—The following table provides information as of December 31, 2017 regarding shares of common stock that may be issued under our equity compensation plans, consisting of our 2013 Long-Term Incentive Plan (the “2013 Plan”) and our 2013 Independent Director Stock Plan (the “Director Plan”).
Plan category | Number of securities to be issued upon exercise of outstanding options, warrants and rights (a) | Weighted Average exercise price of outstanding options, warrants and rights (b)($) | Number of securities remaining available for future issuance under equity compensation plan (excluding securities referenced in column (a)) (c) | |||||||||
Equity compensation plans approved by security holders: | 4,968 | $ | — | 4,195,032 | (1) | |||||||
Equity compensation plans not approved by security holders: | — | — | — | |||||||||
Total | 4,968 | $ | — | 4,195,032 | ||||||||
(1) | As of December 31, 2017, there were 4,000,000 shares available for grants under the 2013 Plan and 200,000 shares available for grants under the Director Plan. |
42
ITEM 12. SECURITY OWNERSHIP OF CERTAIN BENEFICIAL OWNERS AND MANAGEMENT AND RELATED STOCKHOLDER MATTERS
The following table shows, as of February 28, 2018, the amount of our common stock beneficially owned (unless otherwise indicated) by (1) any person who is known by us to be the beneficial owner of more than 5% of the outstanding shares of common stock, (2) our directors and director nominees, (3) our executive officers and (4) all of our directors, director nominees and executive officers as a group.
Name and Address of Beneficial Owner (1) | Amount and Nature of Beneficial Ownership (2) | Percentage | |||
Jeffrey S. Edison | 51,111 | * | |||
David W. Garrison | 1,771 | * | |||
Mark D. McDade | 3,434 | * | |||
John A. Strong | — | * | |||
R. Mark Addy | 2,874 | * | |||
Devin I. Murphy | — | * | |||
Jennifer L. Robison | — | * | |||
All officers, directors and director nominees as a group | 59,190 | * | |||
* Less than 1.0% | |||||
(1) | Address of each named beneficial owner is c/o Phillips Edison Grocery Center REIT II, Inc., 11501 Northlake Drive, Cincinnati, Ohio 45249. |
(2) | None of the shares are pledged as security. |
ITEM 13. CERTAIN RELATIONSHIPS AND RELATED TRANSACTIONS, AND DIRECTOR INDEPENDENCE
Director Independence
Although our shares are not listed for trading on any national securities exchange, a majority of our directors, and all of the members of the Audit Committee and Conflicts Committee are “independent” as defined by the New York Stock Exchange (the “NYSE”). The NYSE standards provide that to qualify as an independent director, in addition to satisfying certain bright-line criteria, the board of directors must affirmatively determine that a director has no material relationship with us (either directly or as a partner, stockholder, or officer of an organization that has a relationship with us). The board of directors has determined that each of David W. Garrison, Mark D. McDade, and John A. Strong, is “independent” as defined by the NYSE.
Transactions with Related Persons
Our Corporate Governance Guidelines require our Conflicts Committee to review and approve all transactions involving our affiliates and us. Prior to entering into a transaction with an affiliate that is not covered by the advisory agreement with our advisor, a majority of the Conflicts Committee must conclude that the transaction is fair and reasonable to us and on terms and conditions not less favorable to us than those available from unaffiliated third parties. In addition, our Code of Ethics lists examples of types of transactions with affiliates that would create prohibited conflicts of interest. Under the Code of Ethics, our officers and directors are required to bring potential conflicts of interest to the attention of the Chair of our Audit Committee promptly. There are no currently proposed material transactions with related persons other than those covered by the terms of the agreements described below.
Our Relationship with the Advisor—On December 3, 2015, we entered into an advisory agreement (the “Advisory Agreement”) with Phillips Edison NTR II LLC (the “Advisor”). Certain of our officers, Messrs. Edison, Addy, Murphy, and Ms. Robinson, serve as the executive officers of the Advisor. The Advisor is wholly owned by PECO. On September 1, 2017, we entered in an Amended and Restated Advisory Agreement with the Advisor (the “Amended Advisory Agreement”). Pursuant to the Advisory Agreement and the Amended Advisory Agreement, the Advisor is entitled to specified fees for certain services, including managing our day-to-day activities and implementing our investment strategy.
We pay the Advisor an acquisition fee related to services provided in connection with the selection and purchase or origination of real estate and real estate-related investments. The acquisition fee under the Advisory Agreement was equal to 1.0% of the cost of investments acquired or originated by us, including any debt attributable to such investments. The acquisition fee under the Amended Advisory Agreement is equal to 0.85% of the cost of investments acquired or originated by us, including any debt attributable to such investments. We incurred acquisition fees payable to the Advisor affiliates of approximately $1.9 million for the year ended December 31, 2017, all of which had been paid as of December 31, 2017.
In addition to acquisition fees, we reimbursed the Advisor for customary acquisition expenses, whether or not we ultimately acquire an asset. For the year ended December 31, 2017, we incurred acquisition expenses reimbursable to the Advisor of approximately $0.6 million.
During the year ended December 31, 2017, within 60 days after the end of each calendar quarter (subject to the approval of our board of directors), we, as the sole member of the general partner of Phillips Edison Grocery Center Operating Partnership II, L.P. (the “Operating Partnership”), caused the Operating Partnership to pay an asset management subordinated participation by issuing a number of restricted operating partnership units designated as Class B Units of our Operating Partnership (“Class B Units”) to the Advisor and American Realty Capital PECO II Advisors, LLC, our former advisor (“ARC”),
43
equal to: (i) (a) 0.05% prior to September 1, 2017 and (b) 0.045% on or after September 1, 2017, multiplied by the cost of assets divided by (ii) our per share NAV.
Class B Units are subject to forfeiture until such time as: (a) the value of the Operating Partnership's assets plus all distributions made equals or exceeds the total amount of capital contributed by investors plus a 6% cumulative, pretax, non-compounded annual return thereon, or the “economic hurdle”; (b) any one of the following events occurs concurrently with or subsequently to the achievement of the economic hurdle described above: (i) a listing of our common stock on a national securities exchange; (ii) a transaction to which we or our Operating Partnership shall be a party, as a result of which partnership units in our operating partnership or our common stock shall be exchanged for or converted into the right, or the holders of such securities shall otherwise be entitled, to receive cash, securities or other property or any combination thereof; or (iii) the termination of the Amended Advisory Agreement without cause, provided that we do not engage an affiliate of PECO as our new external advisor following such termination; and (c) the Advisor is providing services to us immediately prior to the occurrence of an event of the type described in clause (b) above, unless the failure to provide such services is attributable to the termination without cause of the Amended Advisory Agreement by an affirmative vote of a majority of our independent directors after the economic hurdle described above has been met.
Any outstanding Class B Units will be forfeited immediately if the Amended Advisory Agreement is terminated for any reason other than a termination without cause. Any outstanding Class B Units will be forfeited immediately if the Amended Advisory Agreement is terminated without cause by an affirmative vote of a majority of our board of directors before the economic hurdle described above has been met. During the year ended December 31, 2017, the Operating Partnership issued a total of 92,549 Class B Units to ARC and the Advisor for the asset management services performed during the period from October 1, 2016 through September 30, 2017. In March 2018, the Operating Partnership issued 19,727 Class B Units to the Advisor for the asset management services performed during the period from October 1, 2017 through December 31, 2017. The Class B Units are participating securities that receive distributions at the same rates and dates as the distributions paid to our common stockholders. These distributions are calculated as the product of the number of Class B Units issued to date and the stated distribution rate at the time such distribution is authorized.
We also pay the Advisor a monthly asset management fee at the rate of (i) 0.06667% prior to September 1, 2017 and (ii) 0.05667% on and after September 1, 2017 multiplied by the cost of our assets as of the last day of the preceding monthly period. During the year ended December 31, 2017, we paid $12.0 million of asset management fees to the Advisor.
Under the terms of a separate agreement between the Advisor and ARC that was in effect through August 31, 2017, the Advisor generally assigned to ARC 15% of all acquisition fees, asset management fees and disposition fees paid to the Advisor under the Advisory Agreement. This agreement was terminated on September 1, 2017.
Additionally, the Advisor incurred general and administrative expenses on our behalf for which the Advisor was entitled to reimbursement during the year ended December 31, 2017, of which approximately $119,000 remained due and payable as of December 31, 2017.
Joint Venture—On March 22, 2016, we entered into a joint venture through our indirect wholly-owned subsidiary, PE OP II Value Added Grocery, LLC (“REIT Member”), with a limited partnership (“Investor Member”) affiliated with TPG Real Estate, and with PECO Value Added Grocery Manager, LLC (“PECO Member”), a wholly-owned subsidiary of PECO and an affiliate of the Advisor. The joint venture was formed pursuant to the Limited Liability Company Agreement (the “Joint Venture Agreement”) of Phillips Edison Value Added Grocery Venture, LLC (the “Joint Venture”).
The Joint Venture Agreement provides for the ownership and operation of the Joint Venture, in which the REIT Member owns a 20% initial equity interest and Investor Member owns an 80% initial equity interest. Under the terms of the Joint Venture, REIT Member and Investor Member will contribute up to $50 million and $200 million of equity, respectively. The Joint Venture members expect to utilize leverage in an effort to maximize the returns on the capital contributions of the members.
The Joint Venture concentrates on investment opportunities that are outside our current core investment focus, targeting investments and properties that are more opportunistic and value-add. Potential investment opportunities of us and other affiliates of PECO Member that meet the Joint Venture’s target investment criteria will be subject to a right of first offer in favor of the Joint Venture until the earlier of either March 22, 2019 or the investment of all of the Joint Venture’s capital. Whether an investment opportunity is subject to this right of first offer will be based on a variety of factors, including the estimated risk and return characteristics of the opportunity, which are based initially on PECO Member’s diligence and underwriting and which are more typical of the opportunistic and value-add properties that are to be the focus of the Joint Venture.
PECO Member manages and conducts the day-to-day operations and affairs of the Joint Venture, subject to certain major decisions set forth in the Joint Venture Agreement that require either the consent of a majority in interest of the Joint Venture members or the unanimous consent of the Joint Venture members. Under these provisions of the Joint Venture Agreement, REIT Member has customary approval rights in respect of major decisions, but does not have the right to cause or prohibit various material transactions, including acquisitions, dispositions, financings, significant leasing, causing the Joint Venture to make distributions, significant capital expenditures and related investment decisions or actions in respect of litigation. TPG has the ability to remove PECO Member as manager of the Joint Venture under certain circumstances, including a default by PECO Member.
The Joint Venture’s income, losses and distributions are generally allocated based on the members’ respective ownership interests, including the PECO Member promote described below. Distributions of net cash are anticipated to be made on a monthly basis, as appropriate. Additional capital contributions in proportion to the members’ respective capital interests to the Joint Venture may be required. In addition to the contribution of the Initial Properties (as defined below), the REIT Member made additional capital contributions of $2.9 million to the Joint Venture during the year ended December 31, 2017.
Pursuant to the Joint Venture Agreement, PECO Member is entitled to a customary promote subject to a preferred return and a hurdle. With respect to REIT Member’s investment, PECO Member will receive 15% of net operating cash flow distributions after a 10% return, and then 22.5% after a 15% return. PECO Member will also be entitled to a quarterly asset management
44
fee equal to a percentage of the aggregate investment value of the property owned by the Joint Venture. The portion of the asset management fee payable with respect to REIT Member’s investment will be (1) 0.5% until an aggregate amount of $917,500 has been paid to PECO Member and (2) 1% thereafter. During the year ended December 31, 2017, the Joint Venture paid to PECO Member $395,000 in asset management fees, $79,000 of which was paid with respect to the REIT Member’s investment.
The Joint Venture Agreement contains certain restrictions on a member’s ability to transfer its interests in the Joint Venture, provisions providing for buy/sell procedures in certain circumstances (including in the event of a deadlock) and certain restrictions on PECO Member and certain of its affiliates, including us, in entering into new leasing arrangements with existing tenants of the Joint Venture’s properties.
The term of the Joint Venture will expire seven years after the date of the Joint Venture Agreement, unless otherwise extended by the members in accordance with the terms of the Joint Venture Agreement.
Simultaneously with the Joint Venture Agreement, the REIT Member entered into a Contribution Agreement with Investor Member and the Joint Venture (the “Contribution Agreement”), pursuant to which the REIT Member contributed to the Joint Venture its ownership interests in six grocery-anchored shopping center properties (the “Initial Properties”), valued at approximately $94.3 million. Each of the REIT Member and Investor Member made initial capital contributions in accordance with their respective ownership percentages toward the value of the Initial Properties, and the balance of the value of the Initial Properties was distributed to the REIT Member by the Joint Venture.
On March 22, 2016, the Joint Venture also entered into a Master Property Management, Leasing and Construction Management Agreement with Phillips Edison & Company, Ltd., pursuant to which Phillips Edison & Company, Ltd. acts as the property manager for the Initial Properties and has responsibility for the day-to-day management, operation and maintenance of the Initial Properties. Under the terms of this agreement, Phillips Edison & Company, Ltd. receives a monthly management fee equal to 4% of the gross revenues collected from the operation of each property, certain leasing and construction management fees at market rates for the geographic area in which any property is located and reimbursements for certain expenses and costs. During the year ended December 31, 2017, the Joint Venture paid to Phillips Edison & Company, Ltd. $912,000 in property management fees.
Our Relationship with the Manager—Prior to October 4, 2017, all of our real properties were managed and leased by Phillips Edison & Company, Ltd., a subsidiary of PECO. On October 4, 2017, we entered into separate Master Property Management and Master Services Agreements with Phillips Edison Grocery Center Operating Partnership I, L.P., another subsidiary of PECO, and Phillips Edison & Company, Ltd., respectively. Pursuant to these agreements, both of these entities now collectively perform all of the property management and leasing services previously provided solely by Phillips Edison & Company, Ltd. We refer to these entities collectively as our “Manager.”
We pay to our Manager monthly property management fees equal to 4% of the annualized gross revenues of the properties managed by our Manager. In addition to the property management fee, if our Manager provides leasing services with respect to a property, we pay our Manager leasing fees in an amount equal to the usual and customary leasing fees charged by unaffiliated persons rendering comparable services based on national market rates. We pay a leasing fee to our Manager in connection with a tenant’s exercise of an option to extend an existing lease, and the leasing fees payable to the Manager may be increased by up to 50% in the event that the Manager engages a co-broker to lease a particular vacancy. We reimburse the costs and expenses incurred by our Manager on our behalf, including legal, travel and other out-of-pocket expenses that are directly related to the management of specific properties, as well as fees and expenses of third-party accountants.
If we engage our Manager to provide construction management services with respect to a particular property, we will pay a construction management fee in an amount that is usual and customary for comparable services rendered to similar projects in the geographic market of the property.
Our Manager hires, directs and establishes policies for employees who have direct responsibility for the operations of each real property it manages, which may include, but is not limited, to on-site managers and building and maintenance personnel. Certain employees of our Manager may be employed on a part-time basis and may also be employed by the Advisor or certain of its affiliates. Our Manager also directs the purchase of equipment and supplies and supervises all maintenance activity.
For the year ended December 31, 2017, we incurred property management fees of approximately $6.0 million, leasing fees of approximately $3.3 million, and construction management fees of approximately $0.9 million due to our Manager. Additionally, our Manager incurred approximately $3.8 million of costs and expenses on our behalf for which our Manager was entitled to reimbursement during the year ended December 31, 2017, of which approximately $0.5 million remained due and payable as of December 31, 2017. Of these costs and expenses, $184,000 was attributable to travel related expenses for business purposes on aircraft owned by a company in which Mr. Edison has a 50% ownership interest. The aircraft were utilized to provide timely and cost-effective travel alternatives in connection with company related business activities at market rates.
Termination of ARC Agreements—On September 1, 2017, we entered into an agreement with ARC to terminate all remaining contractual and economic relationships between us and ARC. In exchange for a payment of $6 million, ARC sold their unvested Class B units and their interests in a special limited partner interest co-owned with PECO back to us, and terminated all fee-sharing arrangements with the Advisor.
ITEM 14. PRINCIPAL ACCOUNTANT FEES AND SERVICES
Independent Auditors—During the year ended December 31, 2017, Deloitte & Touche LLP served as our independent auditor and provided certain domestic tax and other services. Deloitte & Touche LLP has served as our independent auditor since our formation in 2013. The Audit Committee intends to engage Deloitte & Touche LLP as our independent auditor to audit our consolidated financial statements for the year ending December 31, 2018. The Audit Committee may, however, select new auditors at any time in the future in its discretion if it deems such decision to be in our best interest. Any decision to select new auditors would be disclosed to our stockholders in accordance with applicable securities laws.
45
Preapproval Policies—The Audit Committee charter imposes a duty on the Audit Committee to preapprove all auditing services performed for us by our independent auditors, as well as all permitted nonaudit services (including the fees and terms thereof) in order to ensure that the provision of such services does not impair the auditors’ independence. Unless a type of service to be provided by the independent auditors has received “general” preapproval, it will require “specific” preapproval by the Audit Committee. Additionally, any proposed services exceeding “general” preapproved cost levels will require specific preapproval by the Audit Committee.
All requests or applications for services to be provided by the independent auditor that do not require specific preapproval by the Audit Committee will be submitted to management and must include a detailed description of the services to be rendered. Management will determine whether such services are included within the list of services that have received the general preapproval of the Audit Committee. The Audit Committee will be informed on a timely basis of any such services rendered by the independent auditors.
Requests or applications to provide services that require specific preapproval by the Audit Committee will be submitted to the Audit Committee by both the independent auditors and the chief financial officer, and must include a joint statement as to whether, in their view, the request or application is consistent with the SEC’s rules on auditor independence. The Chair of the Audit Committee has been delegated the authority to specifically preapprove all services not covered by the general preapproval guidelines up to an amount not to exceed $75,000 per occurrence. Amounts requiring preapproval in excess of $75,000 per occurrence require specific preapproval by all members of the Audit Committee prior to engagement of our independent auditors. All amounts specifically preapproved by the Chair of the Audit Committee in accordance with this policy are to be disclosed to the full Audit Committee at the next regularly scheduled meeting. All services rendered by Deloitte & Touche LLP for the year ended December 31, 2017 were preapproved in accordance with the policies and procedures described above.
Principal Auditor Fees—The aggregate fees billed to us for professional accounting services, including the audit of our annual consolidated financial statements by our principal auditor for the year ended December 31, 2017 and 2016, are set forth in the table below:
2017 | 2016 | ||||||
Audit fees | $ | 475,000 | $ | 505,800 | |||
Audit-related fees | — | 19,000 | |||||
Tax fees | — | — | |||||
All other fees | — | — | |||||
Total | $ | 475,000 | $ | 524,800 | |||
For purposes of the preceding table, the principal auditor’s professional fees are classified as follows:
Audit fees—These are fees for professional services performed for the audit of our annual consolidated financial statements and the required review of quarterly consolidated financial statements and other procedures performed by the principal auditor in order for them to be able to form an opinion on our consolidated financial statements. These fees also cover services that are normally provided by independent auditors in connection with statutory and regulatory filings or engagements, including reviews of our consolidated financial statements included in the registration statements, as amended, related to our public offerings of common stock. Audit fees are presented for the period to which the audit work relates, regardless of whether the fees are actually billed during the period.
Audit-related fees—These are fees for assurance and related services that traditionally are performed by independent auditors that are reasonably related to the performance of the audit or review of the consolidated financial statements, such as due diligence related to acquisitions and dispositions, attestation services that are not required by statute or regulation, internal control reviews, and consultation concerning financial accounting and reporting standards.
Tax fees—These are fees for all professional services performed by professional staff in our independent auditor’s tax division, except those services related to the audit of our consolidated financial statements. These include fees for tax compliance, tax planning and tax advice, including federal, state, and local issues. Services also may include assistance with tax audits and appeals before the Internal Revenue Service and similar state and local agencies, as well as federal, state, and local tax issues related to due diligence. Tax fees are presented for the period in which the services were provided.
All other fees—These are fees for any services not included in the above-described categories.
46
w PART IV |
ITEM 15. EXHIBITS AND FINANCIAL STATEMENT SCHEDULES
(a) Financial Statement Schedules
See the Index to Financial Statements on page F-1 of this report.
(b) Exhibits
Ex. | Description |
Phillips Edison Value Added Grocery Venture, LLC | |
2.1 | |
2.2 | |
Articles of Amendment | |
3.1 | |
Bylaws | |
3.2 | |
3.3 | |
Agreement of Limited Partnership of Operating Partnership | |
4.1 | |
4.2 | |
4.3 | |
4.4 | |
Distribution Reinvestment Plan | |
4.5 | |
Advisory Agreement | |
10.1 | |
10.2 | |
10.3 | |
10.4 | |
Master Property Management, Leasing, and Construction Management Agreement | |
10.5 | |
10.6 | |
10.7 | |
47
10.8 | |
Independent Director Stock Plan | |
10.9 | |
Long-Term Incentive Plan | |
10.10 | |
Credit Agreement | |
10.11 | |
10.12 | |
10.13 | |
Interest Rate Derivative Agreements | |
10.14 | |
10.15 | |
10.16 | |
10.17 | |
10.18 | |
Other | |
21.1 | |
23.1 | |
31.1 | |
31.2 | |
32.1 | |
32.2 | |
99.1 | |
101.1 | The following information from the Company’s annual report on Form 10-K for the year ended December 31, 2017, formatted in XBRL (Extensible Business Reporting Language): (i) Consolidated Balance Sheets; (ii) Consolidated Statements of Operations and Comprehensive Loss; (iii) Consolidated Statements of Equity; and (iv) Consolidated Statements of Cash Flows* |
* Filed herewith
** Indicates compensatory plan or arrangement
ITEM 16. FORM 10-K SUMMARY
None.
48
INDEX TO CONSOLIDATED FINANCIAL STATEMENTS
Financial Statements | Page | |
* | All schedules other than the one listed in the index have been omitted as the required information is either not applicable or the information is already presented in the consolidated financial statements or the related notes. |
F-1
REPORT OF INDEPENDENT REGISTERED PUBLIC ACCOUNTING FIRM
To the Board of Directors and Stockholders of Phillips Edison Grocery Center REIT II, Inc.
Opinion on the Financial Statements
We have audited the accompanying consolidated balance sheets of Phillips Edison Grocery Center REIT II, Inc., and subsidiaries (the "Company") as of December 31, 2017 and 2016, the related consolidated statements of operations and comprehensive loss, equity, and cash flows for each of the three years in the period ended December 31, 2017, the related notes and the consolidated financial statement schedule listed in the Index at Item 15 (collectively referred to as the "consolidated financial statements"). In our opinion, the consolidated financial statements present fairly, in all material respects, the financial position of the Company as of December 31, 2017 and 2016, and the results of its operations and its cash flows for each of the three years in the period ended December 31, 2017, in conformity with accounting principles generally accepted in the United States of America.
Basis for Opinion
These consolidated financial statements are the responsibility of the Company's management. Our responsibility is to express an opinion on the Company's consolidated financial statements based on our audits. We are a public accounting firm registered with the Public Company Accounting Oversight Board (United States) (PCAOB) and are required to be independent with respect to the Company in accordance with the U.S. federal securities laws and the applicable rules and regulations of the Securities and Exchange Commission and the PCAOB.
We conducted our audits in accordance with the standards of the PCAOB. Those standards require that we plan and perform the audit to obtain reasonable assurance about whether the consolidated financial statements are free of material misstatement, whether due to error or fraud. The Company is not required to have, nor were we engaged to perform, an audit of its internal control over financial reporting. As part of our audits, we are required to obtain an understanding of internal control over financial reporting but not for the purpose of expressing an opinion on the effectiveness of the Company’s internal control over financial reporting. Accordingly, we express no such opinion.
Our audits included performing procedures to assess the risks of material misstatement of the consolidated financial statements, whether due to error or fraud, and performing procedures that respond to those risks. Such procedures included examining, on a test basis, evidence regarding the amounts and disclosures in the consolidated financial statements. Our audits also included evaluating the accounting principles used and significant estimates made by management, as well as evaluating the overall presentation of the consolidated financial statements. We believe that our audits provide a reasonable basis for our opinion.
/s/ Deloitte & Touche LLP
Cincinnati, Ohio
March 27, 2018
We have served as the Company's auditor since 2013.
F-2
PHILLIPS EDISON GROCERY CENTER REIT II, INC.
CONSOLIDATED BALANCE SHEETS
AS OF DECEMBER 31, 2017 AND 2016
(In thousands, except per share amounts)
2017 | 2016 | ||||||
ASSETS | |||||||
Investment in real estate: | |||||||
Land and improvements | $ | 520,526 | $ | 452,515 | |||
Building and improvements | 1,047,758 | 905,705 | |||||
Acquired in-place lease assets | 158,510 | 138,916 | |||||
Acquired above-market lease assets | 14,742 | 13,024 | |||||
Total investment in property | 1,741,536 | 1,510,160 | |||||
Accumulated depreciation and amortization | (157,290 | ) | (85,255 | ) | |||
Net investment in property | 1,584,246 | 1,424,905 | |||||
Investment in unconsolidated joint venture | 16,076 | 14,287 | |||||
Total investment in real estate assets, net | 1,600,322 | 1,439,192 | |||||
Cash and cash equivalents | 1,435 | 8,259 | |||||
Restricted cash | 4,382 | 2,829 | |||||
Other assets, net | 46,178 | 36,247 | |||||
Total assets | $ | 1,652,317 | $ | 1,486,527 | |||
LIABILITIES AND EQUITY | |||||||
Liabilities: | |||||||
Debt obligations, net | $ | 775,275 | $ | 533,215 | |||
Acquired below market lease intangibles, net | 54,994 | 53,196 | |||||
Accounts payable – affiliates | 1,808 | 3,499 | |||||
Accounts payable and other liabilities | 36,961 | 34,383 | |||||
Total liabilities | 869,038 | 624,293 | |||||
Commitments and contingencies (Note 8) | — | — | |||||
Equity: | |||||||
Preferred stock, $0.01 par value per share, 10,000 shares authorized, zero shares issued | |||||||
and outstanding at December 31, 2017 and 2016, respectively | — | — | |||||
Common stock, $0.01 par value per share, 1,000,000 shares authorized, 46,584 and 46,372 | |||||||
shares issued and outstanding at December 31, 2017 and 2016, respectively | 468 | 463 | |||||
Additional paid-in capital | 1,031,685 | 1,026,887 | |||||
Accumulated other comprehensive income | 6,459 | 4,390 | |||||
Accumulated deficit | (255,333 | ) | (169,506 | ) | |||
Total equity | 783,279 | 862,234 | |||||
Total liabilities and equity | $ | 1,652,317 | $ | 1,486,527 | |||
See notes to consolidated financial statements.
F-3
PHILLIPS EDISON GROCERY CENTER REIT II, INC.
CONSOLIDATED STATEMENTS OF OPERATIONS AND COMPREHENSIVE LOSS
FOR THE YEARS ENDED DECEMBER 31, 2017, 2016, AND 2015
(In thousands, except per share amounts)
2017 | 2016 | 2015 | |||||||||
Revenues: | |||||||||||
Rental income | $ | 119,444 | $ | 95,877 | $ | 44,494 | |||||
Tenant recovery income | 42,265 | 33,311 | 15,510 | ||||||||
Other property income | 868 | 608 | 409 | ||||||||
Total revenues | 162,577 | 129,796 | 60,413 | ||||||||
Expenses: | |||||||||||
Property operating | 27,270 | 22,226 | 10,756 | ||||||||
Real estate taxes | 25,154 | 20,157 | 9,592 | ||||||||
General and administrative | 19,352 | 18,139 | 3,744 | ||||||||
Acquisition expenses | 586 | 10,754 | 13,661 | ||||||||
Termination of affiliate arrangements | 5,962 | — | — | ||||||||
Depreciation and amortization | 71,200 | 56,541 | 25,778 | ||||||||
Total expenses | 149,524 | 127,817 | 63,531 | ||||||||
Other: | |||||||||||
Interest expense, net | (22,494 | ) | (10,970 | ) | (3,990 | ) | |||||
Gain on contribution of properties to unconsolidated joint venture | — | 3,341 | — | ||||||||
Other (loss) income, net | (90 | ) | 153 | 410 | |||||||
Net loss | $ | (9,531 | ) | $ | (5,497 | ) | $ | (6,698 | ) | ||
Per share information - basic and diluted: | |||||||||||
Loss per share - basic and diluted | $ | (0.20 | ) | $ | (0.12 | ) | $ | (0.18 | ) | ||
Weighted-average common shares outstanding: | |||||||||||
Basic | 46,544 | 46,228 | 36,538 | ||||||||
Diluted | 46,544 | 46,230 | 36,538 | ||||||||
Comprehensive loss: | |||||||||||
Net loss | $ | (9,531 | ) | $ | (5,497 | ) | $ | (6,698 | ) | ||
Other comprehensive income: | |||||||||||
Change in unrealized gain on interest rate swaps | 1,553 | 4,390 | — | ||||||||
Comprehensive loss | $ | (7,978 | ) | $ | (1,107 | ) | $ | (6,698 | ) | ||
See notes to consolidated financial statements.
F-4
PHILLIPS EDISON GROCERY CENTER REIT II, INC.
CONSOLIDATED STATEMENTS OF EQUITY
FOR THE YEARS ENDED DECEMBER 31, 2017, 2016, AND 2015
(In thousands, except per share amounts)
Common Stock | Additional Paid-In Capital | Accumulated Other Comprehensive Income | Accumulated Deficit | Total Equity | ||||||||||||||||||
Shares | Amount | |||||||||||||||||||||
Balance at January 1, 2015 | 22,548 | $ | 225 | $ | 490,996 | $ | — | $ | (22,720 | ) | $ | 468,501 | ||||||||||
Issuance of common stock | 22,136 | 221 | 549,054 | — | — | 549,275 | ||||||||||||||||
Share repurchases | (215 | ) | (2 | ) | (5,047 | ) | — | — | (5,049 | ) | ||||||||||||
Distribution Reinvestment Plan (“DRIP”) | 1,254 | 14 | 29,768 | — | — | 29,782 | ||||||||||||||||
Common distributions declared, $1.62 per share | — | — | — | — | (59,390 | ) | (59,390 | ) | ||||||||||||||
Offering costs | — | — | (53,136 | ) | — | — | (53,136 | ) | ||||||||||||||
Net loss | — | — | — | — | (6,698 | ) | (6,698 | ) | ||||||||||||||
Balance at December 31, 2015 | 45,723 | $ | 458 | $ | 1,011,635 | $ | — | $ | (88,808 | ) | $ | 923,285 | ||||||||||
Share repurchases | (1,021 | ) | (12 | ) | (23,019 | ) | — | — | (23,031 | ) | ||||||||||||
DRIP | 1,670 | 17 | 38,246 | — | — | 38,263 | ||||||||||||||||
Change in unrealized gain on interest rate swaps | — | — | — | 4,390 | — | 4,390 | ||||||||||||||||
Common distributions declared, $1.62 per share | — | — | — | — | (75,201 | ) | (75,201 | ) | ||||||||||||||
Share-based compensation | — | — | 25 | — | — | 25 | ||||||||||||||||
Net loss | — | — | — | — | (5,497 | ) | (5,497 | ) | ||||||||||||||
Balance at December 31, 2016, as reported | 46,372 | $ | 463 | $ | 1,026,887 | $ | 4,390 | $ | (169,506 | ) | $ | 862,234 | ||||||||||
Adoption of new accounting pronouncement (see Note 9) | — | — | — | 516 | (516 | ) | — | |||||||||||||||
Balance at January 1, 2017, as adjusted | 46,372 | $ | 463 | $ | 1,026,887 | $ | 4,906 | $ | (170,022 | ) | $ | 862,234 | ||||||||||
Share repurchases | (1,402 | ) | (13 | ) | (31,759 | ) | — | — | (31,772 | ) | ||||||||||||
DRIP | 1,613 | 18 | 36,519 | — | — | 36,537 | ||||||||||||||||
Change in unrealized gain on interest rate swaps | — | — | — | 1,553 | — | 1,553 | ||||||||||||||||
Common distributions declared, $1.62 per share | — | — | — | — | (75,780 | ) | (75,780 | ) | ||||||||||||||
Share-based compensation | 1 | — | 38 | — | — | 38 | ||||||||||||||||
Net loss | — | — | — | — | (9,531 | ) | (9,531 | ) | ||||||||||||||
Balance at December 31, 2017 | 46,584 | $ | 468 | $ | 1,031,685 | $ | 6,459 | $ | (255,333 | ) | $ | 783,279 | ||||||||||
See notes to consolidated financial statements.
F-5
PHILLIPS EDISON GROCERY CENTER REIT II, INC.
CONSOLIDATED STATEMENTS OF CASH FLOWS
FOR THE YEARS ENDED DECEMBER 31, 2017, 2016, AND 2015
(In thousands)
2017 | 2016 | 2015 | |||||||||
CASH FLOWS FROM OPERATING ACTIVITIES: | |||||||||||
Net loss | $ | (9,531 | ) | $ | (5,497 | ) | $ | (6,698 | ) | ||
Adjustments to reconcile net loss to net cash provided by operating activities: | |||||||||||
Depreciation and amortization | 69,937 | 55,219 | 24,889 | ||||||||
Net amortization of above- and below-market leases | (2,365 | ) | (2,142 | ) | (1,151 | ) | |||||
Amortization of deferred financing expense | 2,802 | 2,245 | 1,056 | ||||||||
Gain on contribution of properties | — | (3,341 | ) | — | |||||||
Changes in fair value of derivatives | (595 | ) | (1,076 | ) | (107 | ) | |||||
Straight-line rental income | (2,407 | ) | (2,767 | ) | (2,056 | ) | |||||
Equity in net loss of unconsolidated joint venture | 115 | 316 | — | ||||||||
Other | 184 | 407 | (45 | ) | |||||||
Changes in operating assets and liabilities: | |||||||||||
Accounts receivable and accounts payable – affiliates | (1,691 | ) | 2,365 | 1,890 | |||||||
Other assets | (9,323 | ) | (10,079 | ) | (10,541 | ) | |||||
Accounts payable and other liabilities | 3,182 | 9,703 | 9,381 | ||||||||
Net cash provided by operating activities | 50,308 | 45,353 | 16,618 | ||||||||
CASH FLOWS FROM INVESTING ACTIVITIES: | |||||||||||
Real estate acquisitions | (174,701 | ) | (422,416 | ) | (609,281 | ) | |||||
Capital expenditures | (20,930 | ) | (17,803 | ) | (8,660 | ) | |||||
Change in restricted cash and investments | (1,553 | ) | (1,680 | ) | (913 | ) | |||||
Investment in unconsolidated joint venture | (2,854 | ) | (7,715 | ) | — | ||||||
Return of investment in unconsolidated joint venture | 950 | — | — | ||||||||
Proceeds after contribution to unconsolidated joint venture | — | 87,386 | — | ||||||||
Principal disbursement on notes receivable - affiliates | (1,272 | ) | — | — | |||||||
Principal proceeds on notes receivable - affiliates | 1,272 | — | — | ||||||||
Net cash used in investing activities | (199,088 | ) | (362,228 | ) | (618,854 | ) | |||||
CASH FLOWS FROM FINANCING ACTIVITIES: | |||||||||||
Net change in credit facility | 29,357 | 28,000 | — | ||||||||
Proceeds from mortgages and loans payable | 200,000 | 370,000 | — | ||||||||
Payments on mortgages and loans payable | (14,460 | ) | (22,727 | ) | (20,745 | ) | |||||
Payments of deferred financing expenses | (2,400 | ) | (5,722 | ) | (1,192 | ) | |||||
Distributions paid, net of DRIP | (39,208 | ) | (36,864 | ) | (26,332 | ) | |||||
Repurchases of common stock | (31,333 | ) | (24,912 | ) | (3,250 | ) | |||||
Payment of offering costs | — | — | (57,278 | ) | |||||||
Proceeds from issuance of common stock | — | — | 549,275 | ||||||||
Net cash provided by financing activities | 141,956 | 307,775 | 440,478 | ||||||||
Net decrease in cash and cash equivalents | (6,824 | ) | (9,100 | ) | (161,758 | ) | |||||
CASH AND CASH EQUIVALENTS: | |||||||||||
Beginning of period | 8,259 | 17,359 | 179,117 | ||||||||
End of period | $ | 1,435 | $ | 8,259 | $ | 17,359 | |||||
SUPPLEMENTAL CASH FLOW DISCLOSURE, INCLUDING NON-CASH INVESTING AND FINANCING ACTIVITIES: | |||||||||||
Cash paid for interest | $ | 20,256 | $ | 9,347 | $ | 3,562 | |||||
Fair value of assumed debt | 29,015 | 80,956 | 74,553 | ||||||||
Assumed interest rate swaps | — | — | 1,517 | ||||||||
Initial investment in unconsolidated joint venture | — | 6,888 | — | ||||||||
Accrued capital expenditures | 2,385 | 2,490 | 5,873 | ||||||||
Change in offering costs payable to sponsor(s) | — | — | (4,142 | ) | |||||||
Change in distributions payable | 35 | 75 | 3,276 | ||||||||
Change in accrued share repurchase obligation | 439 | (1,881 | ) | 1,799 | |||||||
Distributions reinvested | 36,537 | 38,263 | 29,782 | ||||||||
See notes to consolidated financial statements.
F-6
Phillips Edison Grocery Center REIT II, Inc.
Notes to Consolidated Financial Statements
1. ORGANIZATION |
Phillips Edison Grocery Center REIT II, Inc. (“we,” the “Company,” “our,” or “us”) was formed as a Maryland corporation in June 2013. Substantially all of our business is conducted through Phillips Edison Grocery Center Operating Partnership II, L.P., (the “Operating Partnership”), a Delaware limited partnership formed in June 2013. We are a limited partner of the Operating Partnership, and our wholly owned subsidiary, PE Grocery Center OP GP II LLC, is the sole general partner of the Operating Partnership.
We invest primarily in well-occupied, grocery-anchored, neighborhood and community shopping centers that have a mix of creditworthy national and regional retailers selling necessity-based goods and services in strong demographic markets throughout the United States. In addition, we may invest in other retail properties including power and lifestyle shopping centers, multi-tenant shopping centers, free-standing single-tenant retail properties, and other real estate or real estate-related assets.
Our advisor and property managers are owned by Phillips Edison & Company, Inc. and its subsidiaries (“PECO,” “Advisor,” or “Manager”), formerly known as Phillips Edison Grocery Center REIT I, Inc. On October 4, 2017, PECO acquired our advisor and property managers from Phillips Edison Limited Partnership (“PELP”). Under the terms of the advisory agreement (“Advisory Agreement”) and the master property management and master services agreements (“Management Agreements”) between subsidiaries of PECO and us, PECO is responsible for the management of our day-to-day activities and the implementation of our investment strategy.
As of December 31, 2017, we wholly-owned fee simple interests in 85 real estate properties acquired from third parties unaffiliated with us or PECO. In addition, we owned a 20% equity interest in a joint venture that owned 14 real estate properties as of December 31, 2017 (see Note 4).
2. | SUMMARY OF SIGNIFICANT ACCOUNTING POLICIES |
Basis of Presentation and Principles of Consolidation—The accompanying consolidated financial statements include our accounts and the accounts of the Operating Partnership and its wholly-owned subsidiaries (over which we exercise financial and operating control). The financial statements of the Operating Partnership are prepared using accounting policies consistent with our accounting policies. All intercompany balances and transactions are eliminated upon consolidation.
Partially-Owned Entities—If we determine that we are an owner in a variable-interest entity (“VIE”), and we hold a controlling financial interest, then we will consolidate the entity as the primary beneficiary. For a partially-owned entity determined not to be a VIE, we analyze rights held by each partner to determine which would be the consolidating party. We will generally consolidate entities (in the absence of other factors when determining control) when we have over a 50% ownership interest in the entity. We will assess our interests in VIEs on an ongoing basis to determine whether or not we are the primary beneficiary. However, we will also evaluate who controls the entity even in circumstances in which we have greater than a 50% ownership interest. If we do not control the entity due to the lack of decision-making abilities, we will not consolidate the entity. We have determined that the Operating Partnership is considered a VIE. We are the primary beneficiary of the VIE and our partnership interest is considered a majority voting interest. As such, we have consolidated the Operating Partnership and its wholly-owned subsidiaries.
Use of Estimates—The preparation of the consolidated financial statements in conformity with U.S. generally accepted accounting principles (“GAAP”) requires management to make estimates and assumptions that affect the reported amounts of assets and liabilities and the disclosure of contingent assets and liabilities at the date of the consolidated financial statements and the reported amounts of revenues and expenses during the reporting periods. For example, significant estimates and assumptions have been made with respect to the useful lives of assets; recoverable amounts of receivables; initial valuations of tangible and intangible assets and liabilities and related amortization periods of deferred costs and intangibles, particularly with respect to property acquisitions, the valuation and nature of derivatives and their effectiveness as hedges; and other fair value measurement assessments required for the preparation of consolidated financial statements. Actual results could differ from those estimates.
Cash and Cash Equivalents—We consider all highly liquid investments purchased with an original maturity of three months or less to be cash equivalents. Cash equivalents may include cash and short-term investments. Short-term investments are stated at cost, which approximates fair value and may consist of investments in money market accounts and money market funds. The cash and cash equivalent balances at one or more of our financial institutions exceeds the Federal Depository Insurance Corporation (“FDIC”) insurance coverage.
Restricted Cash—Restricted cash primarily consists of escrowed tenant improvement funds, real estate taxes, capital improvement funds, insurance premiums, and other amounts required to be escrowed pursuant to loan agreements.
Investment in Property and Lease Intangibles—In January 2017, the Financial Accounting Standards Board (“FASB”) issued Accounting Standards Update (“ASU”) 2017-01, Business Combinations (Topic 805): Clarifying the Definition of a Business. This update amended existing guidance in order to clarify when an integrated set of assets and activities is considered a business. We adopted ASU 2017-01 on January 1, 2017, and applied it prospectively. Under this new guidance, most of our real estate acquisition activity is no longer considered a business combination and is instead classified as an asset acquisition. As a result, most acquisition-related costs that would have been recorded on our consolidated statements of
F-7
operations prior to adoption have been capitalized and will be amortized over the life of the related asset. Costs incurred related to properties that were not ultimately acquired were recorded as Acquisition Expenses on our consolidated statements of operations. As of December 31, 2017, none of our real estate acquisitions in 2017 met the definition of a business; therefore, we accounted for all as asset acquisitions.
Real estate assets are stated at cost less accumulated depreciation. The majority of acquisition-related costs are capitalized and allocated to the various classes of assets acquired. These costs are then amortized over the estimated useful lives associated with the assets acquired. Depreciation is computed using the straight-line method. The estimated useful lives for computing depreciation are generally not to exceed 5-7 years for furniture, fixtures and equipment, 15 years for land improvements, and 30 years for buildings and building improvements. Tenant improvements are amortized over the shorter of the respective lease term or the expected useful life of the asset. Major replacements that extend the useful lives of the assets are capitalized, and maintenance and repair costs are expensed as incurred.
Real estate assets are reviewed for impairment whenever events or changes in circumstances indicate that the carrying amount of the individual property may not be recoverable. In such an event, a comparison will be made of the projected operating cash flows of each property on an undiscounted basis to the carrying amount of such property. If deemed unrecoverable on an undiscounted basis, such carrying amount would be adjusted, if necessary, to estimated fair values to reflect impairment in the value of the asset. We recorded no impairments for the years ended December 31, 2017, 2016, and 2015.
We assess the acquisition-date fair values of all tangible assets, identifiable intangibles, and assumed liabilities using methods similar to those used by independent appraisers (e.g., discounted cash flow analysis and replacement cost) and that utilize appropriate discount and/or capitalization rates and available market information. Estimates of future cash flows are based on a number of factors including historical operating results, known and anticipated trends, and market and economic conditions. The fair value of tangible assets of an acquired property considers the value of the property as if it was vacant.
The fair values of buildings and improvements are determined on an as-if-vacant basis. The estimated fair value of acquired in-place leases is the cost we would have incurred to lease the properties to the occupancy level of the properties at the date of acquisition. Such estimates include leasing commissions, legal costs and other direct costs that would be incurred to lease the properties to such occupancy levels. Additionally, we evaluate the time period over which such occupancy levels would be achieved. Such evaluation includes an estimate of the net market-based rental revenues and net operating costs (primarily consisting of real estate taxes, insurance and utilities) that would be incurred during the lease-up period. Acquired in-place leases as of the date of acquisition are amortized over the weighted-average remaining lease terms.
Acquired above- and below-market lease values are recorded based on the present value (using discount rates that reflect the risks associated with the leases acquired) of the difference between the contractual amounts to be paid pursuant to the in-place leases and management’s estimate of the market lease rates for the corresponding in-place leases. The capitalized above- and below-market lease values are amortized as adjustments to rental income over the remaining terms of the respective leases. We also consider fixed rate renewal options in our calculation of the fair value of below-market leases and the periods over which such leases are amortized. If a tenant has a unilateral option to renew a below-market lease and we determine that the tenant has a financial incentive to exercise such option, we include such an option in the calculation of the fair value of such lease and the period over which the lease is amortized.
We estimate the value of tenant origination and absorption costs by considering the estimated carrying costs during hypothetical expected lease-up periods, considering current market conditions. In estimating carrying costs, management includes real estate taxes, insurance and other operating expenses and estimates of lost rentals at market rates during the expected lease-up periods.
We estimate the fair value of assumed mortgage notes payable based upon indications of then-current market pricing for similar types of debt with similar maturities. Assumed mortgage notes payable are initially recorded at their estimated fair value as of the assumption date, and the difference between such estimated fair value and the note’s outstanding principal balance is amortized over the life of the mortgage note payable as an adjustment to interest expense.
Deferred Financing Expenses—Deferred financing expenses are capitalized and amortized on a straight-line basis over the term of the related financing arrangement, which approximates the effective interest method. Deferred financing costs related to our term loan facilities and mortgages are in Debt Obligations, Net, while deferred financing costs related to our revolving credit facility are in Other Assets, Net, on our consolidated balance sheets. Deferred financing costs related to the revolving credit facility were $0.6 million and $1.8 million, as of December 31, 2017 and 2016, respectively, which are net of accumulated amortization of $3.4 million and $2.2 million, respectively.
Fair Value Measurement—Accounting Standard Codification (“ASC”) 820, Fair Value Measurement (“ASC 820”), defines fair value, establishes a framework for measuring fair value in accordance with GAAP and expands disclosures about fair value measurements. ASC 820 emphasizes that fair value is intended to be a market-based measurement, as opposed to a transaction-specific measurement. Fair value is defined by ASC 820 as the price that would be received to sell an asset or paid to transfer a liability in an orderly transaction between market participants at the measurement date. Depending on the nature of the asset or liability, various techniques and assumptions can be used to estimate the fair value. Assets and liabilities are measured using inputs from three levels of the fair value hierarchy, as follows:
Level 1—Inputs are quoted prices (unadjusted) in active markets for identical assets or liabilities that we have the ability to access at the measurement date. An active market is defined as a market in which transactions for the assets or liabilities occur with sufficient frequency and volume to provide pricing information on an ongoing basis.
Level 2—Inputs include quoted prices for similar assets and liabilities in active markets, quoted prices for identical or similar assets or liabilities in markets that are not active (markets with few transactions), inputs other than quoted prices that are observable for the asset or liability (i.e., interest rates, yield curves, etc.), and inputs that are derived principally from or corroborated by observable market data correlation or other means (market corroborated inputs).
F-8
Level 3—Unobservable inputs, only used to the extent that observable inputs are not available, reflect our assumptions about the pricing of an asset or liability.
Considerable judgment is necessary to develop estimated fair values of financial and non-financial assets and liabilities. Accordingly, the estimates presented herein are not necessarily indicative of the amounts we did or could actually realize upon disposition of the financial assets and liabilities previously sold or currently held.
Gain on Sale of Assets—We recognize sales of assets only upon the closing of the transaction with the purchaser. We recognize gains on assets sold upon closing if the collectibility of the sales price is reasonably assured, we are not obligated to perform any significant activities after the sale to earn the profit, we have received adequate initial investment from the purchaser, and other profit recognition criteria have been satisfied. We may defer recognition of gains in whole or in part until: (i) the profit is determinable, meaning that the collectibility of the sales price is reasonably assured or the amount that will not be collectible can be estimated; and (ii) the earnings process is virtually complete, meaning that we are not obliged to perform any significant activities after the sale to earn the profit. Gains and losses on transfers of operating properties resulting from the sale of a partial interest in properties to unconsolidated joint ventures are recognized using the partial sale provisions under ASC 360-20, Property, Plant & Equipment - Real Estate Sales.
Investment in Unconsolidated Joint Venture—We account for our investment in our unconsolidated joint venture using the equity method of accounting as we exercise significant influence over, but do not control, this entity. This investment was initially recorded at cost and is subsequently adjusted for contributions made to and distributions received from the joint venture. Earnings or loss for our investment are recognized in accordance with the terms of the applicable joint venture agreement, generally through a pro rata allocation. Under a pro rata allocation, net income or loss is allocated between the partners in the joint venture based on their respective stated ownership percentages.
To recognize the character of distributions from our unconsolidated joint venture, we review the nature of cash distributions received for purposes of determining whether such distributions should be classified as either a return on investment, which would be included in operating activities, or a return of investment, which would be included in investing activities on the consolidated statements of cash flows.
On a periodic basis, management assesses whether there are indicators, including the operating performance of the underlying real estate and general market conditions, that the value of our investment in our unconsolidated joint venture may be impaired. An investment’s value is impaired only if management’s estimate of the fair value of the investment is less than its carrying value and such difference is deemed to be other-than-temporary. To the extent impairment has occurred, the loss is measured as the excess of the carrying amount of the investment over its estimated fair value.
Management’s estimates of fair value are based upon a discounted cash flow model for each specific investment that includes all estimated cash inflows and outflows over a specified holding period and, where applicable, any estimated debt premiums, capitalization rates, discount rates and credit spreads used in these models are based upon rates we believe to be within a reasonable range of current market rates.
Revenue Recognition—We commence revenue recognition on our leases based on a number of factors. In most cases, revenue recognition under a lease begins when the lessee takes possession of or controls the physical use of the leased asset. The determination of who is the owner, for accounting purposes, of the tenant improvements determines the nature of the leased asset and when revenue recognition under a lease begins. If we are the owner, for accounting purposes, of the tenant improvements, then the leased asset is the finished space, and revenue recognition begins when the lessee takes possession of the finished space, typically when the improvements are substantially complete.
If we conclude that we are not the owner, for accounting purposes, of the tenant improvements (the lessee is the owner), then the leased asset is the unimproved space and any tenant allowances funded under the lease are treated as lease incentives, which reduce revenue recognized over the term of the lease. In these circumstances, we begin revenue recognition when the lessee takes possession of the unimproved space to construct their own improvements. We consider a number of different factors in evaluating whether we or the lessee is the owner of the tenant improvements for accounting purposes. These factors include:
• | whether the lease stipulates how and on what a tenant improvement allowance may be spent; |
• | whether the tenant or landlord retains legal title to the improvements; |
• | the uniqueness of the improvements; |
• | the expected economic life of the tenant improvements relative to the length of the lease; and |
• | who constructs or directs the construction of the improvements. |
We recognize rental income on a straight-line basis over the term of each lease. The difference between rental income earned on a straight-line basis and the cash rent due under the provisions of the lease agreements is recorded as deferred rent receivable and is included as a component of Other Assets, Net. Due to the impact of the straight-line adjustments, rental income generally will be greater than the cash collected in the early years and will be less than the cash collected in the later years of a lease. As of December 31, 2017 and 2016, the deferred rent receivable was $7.7 million and $5.1 million, respectively. Our policy for percentage rental income is to defer recognition of contingent rental income until the specified target (i.e. breakpoint) that triggers the contingent rental income is achieved.
Reimbursements from tenants for recoverable real estate tax and operating expenses are accrued as revenue in the period in which the applicable expenses are incurred. We make certain assumptions and judgments in estimating the reimbursements at the end of each reporting period. We do not expect the actual results to materially differ from the estimated reimbursements.
We periodically review the collectability of outstanding receivables, which were $21.4 million and $16.1 million as of December 31, 2017 and 2016, respectively. Allowances will be taken for those balances that we deem to be uncollectible, including any
F-9
amounts relating to straight-line rent receivables and/or receivables for recoverable expenses. As of December 31, 2017 and 2016, the bad debt reserve was $2.1 million and $1.0 million, respectively.
We record lease termination income if there is a signed termination agreement, all of the conditions of the agreement have been met, collectability is reasonably assured and the tenant is no longer occupying the property. Upon early lease termination, we provide for losses related to unrecovered tenant-specific intangibles and other assets.
Income Taxes—We have elected to be taxed as a real estate investment trust (“REIT”) under the Internal Revenue Code of 1986, as amended (the “Code”). Our qualification and taxation as a REIT depends on our ability, on a continuing basis, to meet certain organizational and operational qualification requirements imposed upon REITs by the Code. If we fail to qualify as a REIT for any reason in a taxable year, we will be subject to tax on our taxable income at regular corporate rates. We would not be able to deduct distributions paid to stockholders in any year in which we fail to qualify as a REIT. We will also be disqualified for the four taxable years following the year during which qualification was lost unless we are entitled to relief under specific statutory provisions. Even if we qualify for taxation as a REIT, we may be subject to certain state and local taxes on our income, property or net worth, respectively, and to federal income and excise taxes on our undistributed income. Additionally, GAAP prescribes a recognition threshold and measurement attribute for the financial statement recognition of a tax position taken, or expected to be taken, in a tax return. A tax position may only be recognized in the consolidated financial statements if it is more likely than not that the tax position will be sustained upon examination. We believe it is more likely than not that our tax positions will be sustained in any tax examinations. We are continuing to evaluate the impact of the Tax Cuts and Jobs Act on the organization as a whole. We do not expect the impact of the Tax Cuts and Jobs Act to have a material impact on the financial statements.
The tax composition of our distributions declared for the years ended December 31, 2017 and 2016, was as follows:
2017 | 2016 | ||||
Ordinary Income | 14.84 | % | 19.81 | % | |
Return of Capital | 85.16 | % | 80.19 | % | |
Total | 100.00 | % | 100.00 | % | |
Repurchase of Common Stock—We offer a share repurchase program (“SRP”) which may allow certain stockholders to have their shares repurchased subject to approval and certain limitations and restrictions (see Note 10). Under our SRP, the maximum amount of common stock that we may redeem, at the shareholder’s election, during any calendar year is limited, among other things, to 5% of the weighted-average number of shares outstanding during the prior calendar year. The maximum amount is reduced each reporting period by the current year share redemptions to date. In addition, the cash available for repurchases on any particular date is generally limited to the proceeds from the DRIP during the preceding four fiscal quarters, less amounts already used for repurchases since the beginning of that period.
Shares repurchased pursuant to our SRP are immediately retired upon purchase. Repurchased common stock is reflected as a reduction of stockholders’ equity. Our accounting policy related to share repurchases is to reduce common stock based on the par value of the shares and to reduce capital surplus for the excess of the repurchase price over the par value. Since the inception of the SRP, we have had an accumulated deficit balance; therefore, the excess over the par value has been applied to additional paid-in capital. Once we have retained earnings, the excess will be charged entirely to retained earnings.
Class B Units—We issue Class B units of the Operating Partnership as compensation for the asset management services provided by PECO under our Advisory Agreement. Under the limited partnership agreement of the Operating Partnership, as amended, the Class B units vests, and are no longer subject to forfeiture, at such time as the following events occur: (x) the value of the Operating Partnership’s assets plus all distributions made equals or exceeds the total amount of capital contributed by investors plus a 6% cumulative, pre-tax, non-compounded annual return thereon (the “economic hurdle” or the “market condition”); (y) any one of the following occurs: (1) the termination of our Advisory Agreement by an affirmative vote of a majority of our independent directors without cause, provided that we do not engage an affiliate of PECO as our new external advisor following such termination; (2) a listing event; or (3) another liquidity event; and (z) the advisor under such Advisory Agreement is still providing advisory services to us (the “service condition”). Such Class B units will be forfeited immediately if: (a) the Advisory Agreement is terminated for cause; or (b) the Advisory Agreement is terminated by an affirmative vote of a majority of our independent directors without cause before the economic hurdle has been met.
The Class B units have both a market condition and a service condition up to and through a Liquidity Event (“Liquidity Event”). A Liquidity Event is defined as being the first to occur of the following: (i) a listing, (ii) a termination without cause (as discussed above), or (iii) another liquidity event. Therefore, the vesting of Class B units occurs only upon completion of both the market condition and service condition. Additionally, PECO has no disincentive for nonperformance other than the forfeiture of Class B units, which is not a sufficiently large disincentive for nonperformance and, accordingly, no performance commitment exists. Because PECO can be terminated without cause before a Liquidity Event occurs, and at such time the market condition and service condition may not be satisfied, the Class B units may be forfeited. Additionally, if the market condition and service condition had been satisfied and a Liquidity Event had not occurred, the Class B unit holders could not control the Liquidity Event because each of the aforementioned events that represent a Liquidity Event must be approved unanimously by our independent directors. As a result, we have concluded that the service condition is not probable.
Because the satisfaction of the market and service conditions is not probable, no compensation will be recognized unless the market condition and service condition become probable. Based on our conclusion of the market condition and service condition not being probable, the Class B units will be treated as unissued for accounting purposes until the market condition, service condition and liquidity event have been achieved. However, as the Class B unit holders are not required to return the distributions if the Class B units are forfeited before they vest, the distributions will be treated as compensation expense. This expense will be calculated as the product of the number of unvested Class B units issued to date and the stated distribution rate at the time such distribution is authorized.
F-10
We have concluded that PECO’s performance under the Advisory Agreement is not complete until it has served as the advisor through the date of a Liquidity Event because, prior to such date, the Class B units are subject to forfeiture by the unit holders. As a result, we have concluded the measurement date occurs when a Liquidity Event has occurred and at such time PECO has continued providing advisory services, and that the Class B units are not considered issued until such a Liquidity Event.
Stock-based Compensation—We account for our stock-based compensation plan based on guidance which requires that compensation expense be recognized on the fair value of the stock awards less estimated forfeitures. Our restricted stock grants vest based upon the completion of a service period (“service-based grants”). Service-based grants are valued according to the determined value per share for our common stock at the date of grant. Awards of service-based grants of stock are expensed as compensation on a straight-line basis over the vesting period. These awards follow a graded vesting schedule over approximately four years. For the years ended December 31, 2017 and 2016, we recognized $38,000 and $25,000, respectively, of stock-based compensation expense as a component of General and Administrative Expense on the consolidated statements of operations. As of December 31, 2017, we had $74,000 of total unrecognized compensation cost related to unvested stock compensation. Such unrecognized compensation cost is expected to be recognized over a weighted average period of approximately two years.
Segment Reporting—In 2017, we modified our approach of evaluating operating segments. We internally evaluate the operating performance of our portfolio of properties and currently do not differentiate properties by geography, size, or type. As operating performance is reviewed at a portfolio level rather than at a property level, our entire portfolio of properties is considered to be one operating segment. Accordingly, we did not report any other segment disclosures in 2017.
Impact of Recently Issued Accounting Pronouncements—The following table provides a brief description of recent accounting pronouncements that could have a material effect on our financial statements:
Standard | Description | Date of Adoption | Effect on the Financial Statements or Other Significant Matters | |||
ASU 2017-05, Other Income - Gains and Losses from the Derecognition of Nonfinancial Assets (Subtopic 610-20) | This update amends existing guidance in order to provide consistency in accounting for the derecognition of a business or nonprofit activity. It is effective for annual reporting periods beginning after December 15, 2017, but early adoption is permitted. | January 1, 2018 | We adopted this standard concurrently with ASU 2014-09, listed below. We expect the adoption will impact our transactions that are subject to the amendments, which, although expected to be infrequent, would include a partial sale of real estate or contribution of a nonfinancial asset to form a joint venture. As it relates to gains on sale of real estate, we expect to recognize any gains when we transfer control of a property and will no longer apply existing sales criteria in ASC 360, Property, Plant, and Equipment. We have evaluated the impact of ASU 2017-05 on $0.5 million of deferred gains relating to the contribution of real estate assets in 2016 to our joint venture. We will recognize on January 1, 2018, through a cumulative effect adjustment to retained earnings, this deferred gain. Other than the cumulative effect adjustment relating to this deferred gain, the adoption of ASC 606 did not have a significant impact. | |||
ASU 2016-18, Statement of Cash Flows (Topic 230) | This update amends existing guidance in order to clarify the classification and presentation of restricted cash on the statement of cash flows. It is effective for annual reporting periods beginning after December 15, 2017, but early adoption is permitted. | January 1, 2018 | Upon adoption, we will include amounts generally described as restricted cash within the beginning-of-period and end-of-period total amounts on the statement of cash flows. This change will not have a material impact on the consolidated financial statements. | |||
ASU 2016-15, Statement of Cash Flows (Topic 230) | This update addresses the presentation of eight specific cash receipts and cash payments on the statement of cash flows. It is effective for annual reporting periods beginning after December 15, 2017, but early adoption is permitted. | January 1, 2018 | We have evaluated the impact the adoption of this standard will have on our consolidated financial statements. Of the eight specific cash receipts and cash payments listed within this guidance, only three would be applicable to our business as it stands currently: debt prepayment or debt extinguishment costs, proceeds from settlement of insurance claims, and distributions received from equity method investees. This change will not have a material impact on the consolidated financial statements. We will apply the guidance for all of the eight cash flow types to any future transactions when applicable. | |||
F-11
ASU 2016-02, Leases (Topic 842) | This update amends existing guidance by recognizing lease assets and lease liabilities on the balance sheet and disclosing key information about leasing arrangements. This update is effective for annual reporting periods beginning after December 15, 2018, but early adoption is permitted. | January 1, 2019 | We are currently evaluating the impact the adoption of this standard will have on our consolidated financial statements. We have identified areas within our accounting policies we believe could be impacted by the new standard. This standard impacts the lessor’s ability to capitalize certain costs related to leasing, which will result in a reduction in the amount of execution costs currently being capitalized in connection with leasing activities. In January 2018, the FASB issued a proposed ASU related to ASC 842. The update would allow lessors to use a practical expedient to account for non-lease components and related lease components as a single lease component instead of accounting for them separately, if certain conditions are met. This proposal is currently under consideration by regulators. We also expect to recognize right of use assets on our consolidated balance sheets related to certain ground leases where we are the lessee. We will continue to evaluate the effect the adoption of ASU 2016-02 will have on our consolidated financial statements. However, we currently believe that the adoption of ASU 2016-02 will not have a material impact on our consolidated financial statements. | |||
ASU 2014-09, Revenue from Contracts with Customers (Topic 606) | This update outlines a comprehensive model for entities to use in accounting for revenue arising from contracts with customers. ASU 2014-09 states that “an entity recognizes revenue to depict the transfer of promised goods or services to customers in an amount that reflects the consideration to which the entity expects to be entitled in exchange for those goods or services.” While ASU 2014-09 specifically references contracts with customers, it also applies to certain other transactions such as the sale of real estate or equipment. Expanded quantitative and qualitative disclosures are also required for contracts subject to ASU 2014-09. In 2015, the FASB provided for a one-year deferral of the effective date for ASU 2014-09, making it effective for annual reporting periods beginning after December 15, 2017. | January 1, 2018 | Our revenue-producing contracts are primarily leases that are not within the scope of this standard. As a result, the adoption of this standard did not have a material impact on our rental or reimbursement revenue. We are adopting this guidance on a modified retrospective basis. | |||
The following table provides a brief description of newly adopted accounting pronouncements and their effect on our financial statements:
Standard | Description | Date of Adoption | Effect on the Financial Statements or Other Significant Matters | |||
ASU 2017-12, Derivatives and Hedging (Topic 815) | This update amended existing guidance in order to better align a company’s financial reporting for hedging activities with the economic objectives of those activities. | September 2017 | Upon adoption, we included a disclosure related to the effect of our hedging activities on our consolidated statements of operations. This disclosure also eliminated the periodic measurement and recognition of hedging ineffectiveness. We adopted this guidance on a modified retrospective basis and applied an adjustment to Accumulated Other Comprehensive Income with a corresponding adjustment to the opening balance of Accumulated Deficit as of the beginning of 2017. For a more detailed discussion of this adoption, see Note 9. | |||
ASU 2017-01, Business Combinations (Topic 805) | This update amended existing guidance in order to clarify when an integrated set of assets and activities is considered a business. | January 1, 2017 | During the year ended December 31, 2017, we capitalized $4.5 million of acquisition costs as a result of this adoption. For a more detailed discussion of the effect of this adoption on our financial statements, refer to the Investment in Property and Lease Intangibles section above. | |||
F-12
Reclassification—The following line items on our consolidated balance sheet for the year ended December 31, 2016, were reclassified to conform to the current year presentation:
• | Restricted Cash was separately disclosed due to significance in the current period. In the previous period these amounts were included in Other Assets, Net. |
3. FAIR VALUE MEASUREMENTS |
The following describes the methods we use to estimate the fair value of our financial and non-financial assets and liabilities:
Cash and Cash Equivalents, Restricted Cash, Accounts Receivable, and Accounts Payable—We consider the carrying values of these financial instruments to approximate fair value because of the short period of time between origination of the instruments and their expected realization.
Real Estate Investments—The purchase prices of the investment properties, including related lease intangible assets and liabilities, were allocated at estimated fair value based on Level 3 inputs, such as discount rates, capitalization rates, comparable sales, replacement costs, income and expense growth rates, and current market rents and allowances as determined by management.
Debt Obligations—We estimate the fair value of our debt by discounting the future cash flows of each instrument at rates currently offered for similar debt instruments of comparable maturities by our lenders using Level 3 inputs. The discount rate used approximates current lending rates for loans or groups of loans with similar maturities and credit quality, assuming the debt is outstanding through maturity and considering the debt’s collateral (if applicable). We have utilized market information, as available, or present value techniques to estimate the amounts required to be disclosed.
The following is a summary of borrowings as of December 31, 2017 and 2016 (dollars in thousands):
2017 | 2016 | ||||||
Fair value | $ | 770,537 | $ | 527,167 | |||
Recorded value (1) | 780,545 | 537,736 | |||||
(1) | Recorded value does not include net deferred financing costs of $5.3 million and $4.5 million as of December 31, 2017 and 2016, respectively. |
Derivative Instruments—As of December 31, 2017, we had five interest rate swaps that fixed LIBOR on $570 million of our unsecured term loan facilities (“Term Loans”) and as of December 31, 2016, we had two interest rate swaps that fixed LIBOR on $243 million of the Term Loans. For a more detailed discussion of our cash flow hedges, see Note 9. As of December 31, 2017 and 2016, we were also party to two interest rate swaps that fixed the variable interest rate on $15.4 million and $15.8 million, respectively, of two of our variable-rate mortgage notes. The change in fair value of these instruments is recorded in Other (Loss) Income, Net on the consolidated statements of operations and was not material for the years ended December 31, 2017, 2016, or 2015.
All interest rate swap agreements are measured at fair value on a recurring basis. The valuation of these instruments is determined using widely accepted valuation techniques, including discounted cash flow analysis on the expected cash flows of each derivative. This analysis reflects the contractual terms of the derivatives, including the period to maturity, and uses observable market-based inputs, including interest rate curves and implied volatilities. The fair values of interest rate swaps are determined using the market standard methodology of netting the discounted future fixed cash receipts (or payments) and the discounted expected variable cash payments (or receipts). The variable cash payments (or receipts) are based on an expectation of future interest rates (forward curves) derived from observable market interest rate curves.
In accordance with ASC 820 Fair Value Measurement, we incorporate credit valuation adjustments to appropriately reflect both our own nonperformance risk and the respective counterparty’s nonperformance risk in the fair value measurements. In adjusting the fair value of our derivative contracts for the effect of nonperformance risk, we have considered the impact of netting and any applicable credit enhancements, such as collateral postings, thresholds, mutual puts, and guarantees.
Although we determined that the significant inputs used to value our derivatives fell within Level 2 of the fair value hierarchy, the credit valuation adjustments associated with our counterparties and our own credit risk utilize Level 3 inputs, such as estimates of current credit spreads, to evaluate the likelihood of default by us and our counterparties. However, as of December 31, 2017 and 2016, we have assessed the significance of the impact of the credit valuation adjustments on the overall valuation of our derivative positions and have determined that the credit valuation adjustments are not significant to the overall valuation of our derivatives. As a result, we have determined that our derivative valuations in their entirety are classified in Level 2 of the fair value hierarchy.
F-13
We record derivative assets as Other Assets, Net and derivative liabilities as Accounts Payable and Other Liabilities on our consolidated balance sheets. The fair value measurements of our derivative assets and liabilities as of December 31, 2017 and 2016 were as follows (in thousands):
2017 | 2016 | ||||||
Derivative asset: | |||||||
Interest rate swaps designated as hedging instruments - Term Loans | $ | 6,544 | $ | 5,369 | |||
Derivative liability: | |||||||
Interest rate swaps designated as hedging instruments - Term Loans | $ | 85 | $ | 463 | |||
Interest rate swaps not designated as hedging instruments - mortgage notes | 255 | 850 | |||||
Total | $ | 340 | $ | 1,313 | |||
4. INVESTMENT IN UNCONSOLIDATED JOINT VENTURE |
In March 2016, we entered into a joint venture (“Joint Venture”) where we may contribute up to $50 million of equity. In 2016, we made an initial net contribution of $6.9 million, consisting of six shopping centers valued at approximately $94.3 million in exchange for $87.4 million in cash. The contribution of properties was considered a partial sale, and as a result, we deferred 20% of the gain from the contribution and recognized an immediate net gain of $3.3 million. The following table summarizes our unconsolidated joint venture as of December 31, 2017 and 2016 (dollars in thousands):
Ownership Percentage | Number of Shopping Centers | Contributions | Distributions | ||||||||||||||||
2017 | 2016 | 2017 | 2016 | ||||||||||||||||
Joint Venture | 20% | 14 | $ | 2,854 | $ | 7,715 | $ | 950 | $ | — | |||||||||
In March 2017, our board of directors approved certain short-term loans (the “JV Loans”) that we may provide to the Joint Venture for its acquisition needs. The JV Loans have terms of up to 60 days, and are to be funded 20% by us. Our portion of the outstanding principal should not exceed $15 million at any given time. The JV Loans will incur interest at a rate equal to the greater of a) LIBOR plus 1.70%, or b) the borrowing rate on our revolving credit facility. In June 2017, we loaned the Joint Venture $1.3 million, which was subsequently repaid in July 2017. As of December 31, 2017, there were no outstanding loans between the Joint Venture and us.
5. REAL ESTATE ACQUISITIONS |
During the year ended December 31, 2017, we acquired eleven grocery-anchored shopping centers. During the year ended December 31, 2016, we acquired 23 grocery-anchored shopping centers and additional real estate adjacent to a previously acquired center.
For the years ended December 31, 2017 and 2016, we allocated the purchase prices to the fair value of the assets acquired and liabilities assumed as follows (in thousands):
2017 | 2016 | |||||||
Land and improvements | $ | 59,969 | $ | 156,577 | ||||
Building and improvements | 129,451 | 316,806 | ||||||
Acquired in-place leases | 19,594 | 48,554 | ||||||
Acquired above-market leases | 1,718 | 2,547 | ||||||
Acquired below-market leases | (6,394 | ) | (18,017 | ) | ||||
Total assets and lease liabilities acquired | 204,338 | 506,467 | ||||||
Less: Fair value of assumed debt at acquisition | 29,015 | 80,956 | ||||||
Net assets acquired | $ | 175,323 | $ | 425,511 | ||||
The weighted-average amortization periods for in-place, above-market, and below-market lease intangibles acquired during the years ended December 31, 2017 and 2016, are as follows (in years):
2017 | 2016 | |||
Acquired in-place leases | 11 | 12 | ||
Acquired above-market leases | 7 | 7 | ||
Acquired below-market leases | 19 | 16 | ||
F-14
6. ACQUIRED INTANGIBLE LEASES |
Acquired intangible lease assets and liabilities consisted of the following amounts as of December 31, 2017 and 2016 (in thousands):
2017 | 2016 | ||||||
In-place leases | $ | 158,510 | $ | 138,916 | |||
Above-market leases | 14,742 | 13,024 | |||||
Total intangible lease assets | 173,252 | 151,940 | |||||
Accumulated amortization | (42,124 | ) | (23,274 | ) | |||
Net intangible lease assets | $ | 131,128 | $ | 128,666 | |||
Below-market lease liabilities | $ | 65,953 | $ | 59,558 | |||
Accumulated amortization | (10,959 | ) | (6,362 | ) | |||
Net below-market lease liabilities | $ | 54,994 | $ | 53,196 | |||
Summarized below is the amortization recorded on the intangible assets and liabilities for the years ended December 31, 2017, 2016 and 2015, (in thousands):
2017 | 2016 | 2015 | |||||||||
In-place leases | $ | 16,618 | $ | 13,201 | $ | 6,665 | |||||
Above-market leases | 2,232 | 1,883 | 987 | ||||||||
Below-market leases | (4,597 | ) | (4,025 | ) | (2,138 | ) | |||||
Total | $ | 14,253 | $ | 11,059 | $ | 5,514 | |||||
Estimated future amortization of the respective acquired intangible lease assets and liabilities as of December 31, 2017, for each of the next five years is as follows (in thousands):
Year | In-Place Leases | Above-Market Leases | Below-Market Leases | ||||||||
2018 | $ | 16,477 | $ | 2,206 | $ | (4,616 | ) | ||||
2019 | 15,774 | 1,855 | (4,510 | ) | |||||||
2020 | 15,020 | 1,461 | (4,402 | ) | |||||||
2021 | 13,044 | 1,200 | (4,362 | ) | |||||||
2022 | 11,684 | 986 | (4,205 | ) | |||||||
7. DEBT OBLIGATIONS, NET |
The following is a summary of the outstanding principal balances of our debt obligations as of December 31, 2017 and 2016 (in thousands):
Interest Rate(1) | 2017 | 2016 | |||||||
Revolving credit facility(2) | 3.04% | $ | 57,357 | $ | 28,000 | ||||
Term loans(3) | 2.24%-4.09% | 570,000 | 370,000 | ||||||
Mortgages payable(4) | 3.45%-6.64% | 149,081 | 134,941 | ||||||
Assumed below-market debt adjustment, net(5) | 4,107 | 4,795 | |||||||
Deferred financing costs, net(6) | (5,270 | ) | (4,521 | ) | |||||
Total | $ | 775,275 | $ | 533,215 | |||||
(1) | Includes the effects of derivative financial instruments (see Notes 3 and 9). |
(2) | The revolving credit facility matures in July 2018. We intend to exercise an option to extend the maturity date to January 2019. Gross borrowings under our revolving credit facility were $313.0 million and gross payments on our revolving credit facility were $283.6 million during the year ended December 31, 2017. The revolving credit facility had a maximum capacity of $350 million as of December 31, 2017 and 2016. |
F-15
(3) | The term loans consist of a $185 million tranche maturing in 2019 and a $185 million tranche maturing in 2020, each of which have options to extend to 2021. A maturity date extension for the first or second tranche on the term loans requires the payment of an extension fee of 0.15% of the outstanding principal amount of the corresponding tranche. In September 2017, we executed a new $200 million term loan, which matures in 2024. |
(4) | Due to the non-recourse nature of our fixed-rate mortgages, the assets and liabilities of the related properties are neither available to pay the debts of the consolidated property-holding limited liability companies nor constitute obligations of such consolidated limited liability companies as of December 31, 2017. |
(5) | Net of accumulated amortization of $2.0 million and $1.3 million as of December 31, 2017 and 2016, respectively. |
(6) | Net of accumulated amortization of $2.6 million and $1.2 million as of December 31, 2017 and 2016, respectively. |
As of December 31, 2017 and 2016, the weighted-average interest rate for all of our debt obligations was 3.5% and 3.0%, respectively.
The allocation of total debt between fixed and variable-rate as well as between secured and unsecured, excluding market debt adjustments and deferred financing costs is summarized below (in thousands):
2017 | 2016 | ||||||
As to interest rate:(1) | |||||||
Fixed-rate debt | $ | 719,081 | $ | 377,941 | |||
Variable-rate debt | 57,357 | 155,000 | |||||
Total | $ | 776,438 | $ | 532,941 | |||
As to collateralization: | |||||||
Unsecured debt | $ | 627,357 | $ | 398,000 | |||
Secured debt | 149,081 | 134,941 | |||||
Total | $ | 776,438 | $ | 532,941 | |||
(1) | Includes the effects of derivative financial instruments (see Notes 3 and 9). |
Below is a listing of our maturity schedule with the respective principal payment obligations, excluding market debt adjustments and deferred financing costs (in thousands):
2018 | 2019 | 2020 | 2021 | 2022 | Thereafter | Total | |||||||||||||||||||||
Revolving credit facility(1) | $ | 57,357 | $ | — | $ | — | $ | — | $ | — | $ | — | $ | 57,357 | |||||||||||||
Term loans | — | 185,000 | 185,000 | — | — | 200,000 | 570,000 | ||||||||||||||||||||
Mortgages payable | 26,368 | 2,848 | 2,985 | 51,931 | 19,666 | 45,283 | 149,081 | ||||||||||||||||||||
Total maturing debt | $ | 83,725 | $ | 187,848 | $ | 187,985 | $ | 51,931 | $ | 19,666 | $ | 245,283 | $ | 776,438 | |||||||||||||
(1) | The revolving credit facility matures in July 2018. We intend to exercise an option to extend the maturity date to January 2019. |
8. COMMITMENTS AND CONTINGENCIES |
Litigation—We are involved in various claims and litigation matters arising in the ordinary course of business, some of which involve claims for damages. Many of these matters are covered by insurance, although they may nevertheless be subject to deductibles or retentions. Although the ultimate liability for these matters cannot be determined, based upon information currently available, we believe the resolution of such claims and litigation will not have a material adverse effect on our consolidated financial statements.
Environmental Matters—In connection with the ownership and operation of real estate, we may potentially be liable for costs and damages related to environmental matters. In addition, we may own or acquire certain properties that are subject to environmental remediation. Generally, the seller of the property, the tenant of the property, and/or another third party is responsible for environmental remediation costs related to a property. Additionally, in connection with the purchase of certain properties, the respective sellers and/or tenants may agree to indemnify us against future remediation costs. We also carry environmental liability insurance on our properties that provides limited coverage for any remediation liability and/or pollution liability for third-party bodily injury and/or property damage claims for which we may be liable. We are not aware of any environmental matters which we believe are reasonably likely to have a material effect on our consolidated financial statements.
Operating Lease—We lease land under a long-term lease at one property, which was acquired in 2016. The lease term expires in December 2020, at which time the lessor has the first option to sell the property to us, or otherwise we have the option to extend the lease. Total rental expense for the lease was $0.4 million and $0.3 million for the years ended December 31, 2017 and 2016, respectively. Approximate minimum rental commitments remaining under the noncancelable terms of the lease as of December 31, 2017, are as follows: (i) 2018, $364,000; (ii) 2019, $364,000; and (iii) 2020, $364,000. There is no rental commitment for 2021 or thereafter.
F-16
9. DERIVATIVES AND HEDGING ACTIVITIES |
In September 2017, we adopted ASU 2017-12, Derivatives and Hedging (Topic 815): Targeted Improvements to Accounting for Hedging Activities. This update amended existing guidance in order to better align a company’s financial reporting for hedging activities with the economic objectives of those activities. It requires us to disclose the effect of our hedging activities on our consolidated statements of operations and eliminated the periodic measurement and recognition of hedging ineffectiveness.
In accordance with the modified retrospective transition method required by ASU 2017-12, we recognized the cumulative effect of the change, representing the reversal of the $0.5 million cumulative ineffectiveness gain as of December 31, 2016, in the opening balance of Accumulated Other Comprehensive Income (“AOCI”) with a corresponding adjustment to the opening balance of Accumulated Deficit as of the beginning of 2017.
Risk Management Objective of Using Derivatives
We are exposed to certain risks arising from both our business operations and economic conditions. We principally manage our exposure to a wide variety of business and operational risks through management of our core business activities. We manage economic risks, including interest rate, liquidity, and credit risk, primarily by managing the amount, sources, and duration of our debt funding and the use of derivative financial instruments. Specifically, we enter into interest rate swaps to manage exposures that arise from business activities that result in the receipt or payment of future known and uncertain cash amounts, the value of which are determined by interest rates. Our derivative financial instruments are used to manage differences in the amount, timing, and duration of our known or expected cash receipts and our known or expected cash payments principally related to our investments and borrowings.
Cash Flow Hedges of Interest Rate Risk
Interest rate swaps designated as cash flow hedges involve the receipt of variable amounts from a counterparty in exchange for our making fixed-rate payments over the life of the agreements without exchange of the underlying notional amount.
The changes in the fair value of derivatives designated, and that qualify, as cash flow hedges are recorded in AOCI and are subsequently reclassified into earnings in the period that the hedged forecasted transaction affects earnings. During the years ended December 31, 2017 and 2016, such derivatives were used to hedge the variable cash flows associated with certain variable-rate debt. The ineffectiveness previously reported in earnings for the quarters ended March 31, 2017 and June 30, 2017, was adjusted to reflect application of the provisions of ASU 2017-12 as of the beginning of 2017 (as discussed above). This adjustment was not material.
Amounts reported in AOCI related to these derivatives will be reclassified to Interest Expense, Net as interest payments are made on the variable-rate debt. During the next twelve months, we estimate that an additional $1.9 million will be reclassified from Other Comprehensive Income to Interest Expense, Net.
The following is a summary of our interest rate swaps that were designated as cash flow hedges of interest rate risk as of December 31, 2017 and 2016 (notional amounts in thousands):
2017 | 2016(1) | ||
Count | 5 | 4 | |
Notional Amount | $570,000 | $370,000 | |
Fixed LIBOR | 0.7%-2.2% | 0.7%-1.7% | |
Maturity Date | 2019-2024 | 2019-2020 | |
(1) | Two of the interest rate swaps with a notional amount of $127 million were entered into in December 2016, but were not effective until January 2017. |
The table below details the location of the gain or loss recognized on interest rate derivatives designated as cash flow hedges in the consolidated statements of operations and comprehensive loss for the years ended December 31, 2017 and 2016 (in thousands). There were no cash flow hedges in 2015.
2017 | 2016 | ||||||
Amount of gain recognized in other comprehensive income on derivatives | $ | 1,451 | $ | 4,199 | |||
Amount of gain reclassified from AOCI into interest expense | 102 | 191 | |||||
Credit risk-related Contingent Features
We have agreements with our derivative counterparties that contain provisions where, if we either default or are capable of being declared in default on any of our indebtedness, we could also be declared to be in default on our derivative obligations. As of December 31, 2017, the fair value of our derivatives in a net liability position, which included accrued interest but excluded any adjustment for nonperformance risk related to these agreements, was approximately $0.3 million. As of December 31, 2017, we had not posted any collateral related to these agreements and were not in breach of any agreement provisions. If we had breached any of these provisions, we could have been required to settle our obligations under the agreements at their termination value of $0.3 million.
F-17
10. EQUITY |
General—The holders of common stock are entitled to one vote per share on all matters voted on by stockholders, including election of the board of directors. Our charter does not provide for cumulative voting in the election of directors.
On May 9, 2017, our board of directors increased its estimated value per share of our common stock to $22.75 based substantially on the estimated market value of our portfolio of real estate properties as of March 31, 2017. We engaged a third party valuation firm to provide a calculation of the range in estimated value per share of our common stock as of March 31, 2017, which reflected certain balance sheet assets and liabilities as of that date.
Distribution Reinvestment Plan—We have adopted a DRIP that allows stockholders to invest distributions in additional shares of our common stock. Before our board of directors approved an increased estimated value per share on May 9, 2017, shares were issued under the DRIP at a price of $22.50 per share. Subsequent to that date, participants acquired and continue to acquire shares of common stock through the DRIP at a price of $22.75 per share.
Share Repurchase Program—Our SRP provides an opportunity for stockholders to have shares of common stock repurchased, subject to certain restrictions and limitations. The cash available for repurchases on any particular date will generally be limited to the proceeds from the DRIP during the preceding four fiscal quarters, less amounts already used for repurchases since the beginning of that period. The board of directors reserves the right, in its sole discretion, at any time and from time to time, to reject any request for repurchase. Effective April 14, 2016, the repurchase price per share for all stockholders was equal to the estimated value per share of $22.50, which was subsequently increased to $22.75 on May 9, 2017.
During the year ended December 31, 2017, repurchase requests surpassed the funding limits under the SRP. Approximately 1.4 million shares of common stock were repurchased under our SRP during the year ended December 31, 2017. Due to the program’s funding limits, the funds available for repurchases in 2018 are expected to be insufficient to meet all requests. When we are unable to fulfill all repurchase requests in a given month, we will honor requests on a pro rata basis to the extent funds are available until the requests are satisfied or withdrawn. We will continue to fulfill all repurchases sought upon a stockholder’s death, “qualifying disability,” or “determination of incompetence” in accordance with the terms of the SRP.
Class B Units—The Operating Partnership issues limited partnership units that are designated as Class B units for asset management services provided by PECO. The vesting of Class B units is contingent upon a market condition and service condition. We had 0.4 million unvested Class B units outstanding as of December 31, 2017 and 2016.
In September 2017, we entered into an agreement with American Realty Capital PECO II Advisors, LLC (“ARC”) and its affiliates to terminate all remaining contractual and economic relationships between us and ARC. In exchange for a payment of $6 million, ARC and its affiliates sold their unvested Class B units and their interests in a special limited partner interest co-owned with PELP back to us, and terminated all fee-sharing arrangements with PECO. As a result, our ongoing fees payable to the Advisor have been reduced by 15% (see Note 12).
11. EARNINGS PER SHARE |
We use the two-class method of computing earnings per share (“EPS”), which is an earnings allocation formula that determines EPS for common stock and any participating securities according to dividends declared (whether paid or unpaid). Under the two-class method, basic EPS is computed by dividing the income available to common stockholders by the weighted-average number of common stock shares outstanding for the period. Diluted EPS reflects the potential dilution that could occur from share equivalent activity.
Restricted stock is granted under our 2013 Independent Director Stock Plan and is potentially dilutive. There were 4,968 and 4,448 shares of restricted stock outstanding as of December 31, 2017 and 2016, respectively. There were no shares of restricted stock outstanding as of December 31, 2015. During periods of net loss, these securities are anti-dilutive and, as a result, are excluded from the weighted-average common shares used to calculate diluted EPS.
Class B units are participating securities as they contain non-forfeitable rights to dividends or dividend equivalents, and are potentially dilutive due to their right of conversion to common stock upon vesting. There were 0.4 million, 0.4 million, and 0.2 million Class B units of the Operating Partnership outstanding as of December 31, 2017, 2016 and 2015, respectively. The vesting of the Class B units is contingent upon satisfaction of a market condition and service condition. Since the satisfaction of both conditions was not probable as of December 31, 2017, 2016, and 2015, the Class B units remained unvested and thus were not included in the diluted net income per share computations.
12. RELATED PARTY TRANSACTIONS |
Economic Dependency—We are dependent on PECO for certain services that are essential to us, including asset acquisition and disposition decisions, asset management, operating and leasing of our properties, and other general and administrative responsibilities. In the event that PECO is unable to provide such services, we would be required to find alternative service providers, which could result in higher costs and expenses.
Advisor—Effective September 1, 2017, we entered into the amended and restated Advisory Agreement. Pursuant to the Advisory Agreement, the Advisor is entitled to specified fees for certain services, including managing our day-to-day activities and implementing our investment strategy. The Advisor manages our day-to-day affairs and our portfolio of real estate investments subject to the board’s supervision. Prior to December 3, 2015, our advisor was ARC, who entered into a sub-
F-18
advisory agreement with the Advisor. The expenses reimbursed to ARC and the Advisor were reimbursed in proportion to the amount of expenses incurred on our behalf by ARC and the Advisor, respectively.
Organization and Offering Costs—Under the terms of the former advisory agreement, we were to reimburse, on a monthly basis, the Advisor, ARC, or their respective affiliates for cumulative organization and offering costs and future organization and offering costs they incurred on our behalf, but only to the extent that the reimbursement would not exceed 2% of gross proceeds raised in all primary offerings measured at the completion of such primary offering.
Summarized below are the cumulative organization and offering costs charged by and the cumulative costs reimbursed to the Advisor, ARC, and their affiliates as of December 31, 2017, 2016, and 2015, and any related amounts reimbursable to us as of December 31, 2017, 2016, and 2015 (in thousands):
2017 | 2016 | 2015 | |||||||||
Cumulative organization and offering costs charged | $ | 18,081 | $ | 18,081 | $ | 18,081 | |||||
Less: Cumulative organization and offering costs reimbursed | 18,081 | 18,081 | 19,020 | ||||||||
Total organization and offering costs receivable | $ | — | $ | — | $ | (939 | ) | ||||
Asset Management Fee and Subordinated Participation
Date | Rate | Payable | Description |
January 1, 2015 through December 31, 2015 | 1.00% | 100% in Class B units | The Class B units were issued on a quarterly basis at the rate of 0.25% multiplied by the lower of the cost of assets and the applicable quarterly NAV, divided by the per share NAV. |
January 1, 2016 through August 31, 2017 | 1.00% | 80% in cash; 20% in Class B units | The cash portion was paid on a monthly basis in arrears at the rate of 0.06667% multiplied by the cost of our assets as of the last day of the preceding monthly period. The Class B unit portion was issued on a quarterly basis at the rate of 0.05% multiplied by the lower of the cost of assets and the applicable quarterly NAV, divided by the per share NAV. |
September 1, 2017 through December 31, 2017 | 0.85% | 80% in cash; 20% in Class B units | The cash portion was paid on a monthly basis in arrears at the rate of 0.05667% multiplied by the cost of our assets as of the last day of the preceding monthly period. The Class B unit portion is issued on a quarterly basis at the rate of 0.0425% multiplied by the lower of the cost of assets and the applicable quarterly NAV, divided by the per share NAV. |
The Advisor is entitled to receive distributions on the Class B units at the same rate as distributions are paid to common stockholders. Such distributions are in addition to the incentive compensation that the Advisor and their affiliates may receive from us. During the years ended December 31, 2017 and 2016, the Operating Partnership issued 92,549 and 182,606 Class B units, respectively, to the Advisor and ARC under the Advisory Agreement for asset management services performed by the Advisor. The Advisor or one of its affiliates must continue to provide advisory services through the date that such economic hurdle is met. The economic hurdle will be met when (a) the value of the Operating Partnership’s assets, plus all distributions made equal or exceeds (b) the total amount of capital contributed by investors, plus a 6% cumulative, pre-tax, non-compounded annual return on the capital contributed.
Prior to September 2017, ARC also received the asset management fee and subordinated participation, as well as distributions on Class B units. For a more detailed discussion of the termination of our relationship with ARC, see Note 10.
F-19
Other Advisory Fees and Reimbursements Paid in Cash
Fee Type | Date | Rate | Description |
Acquisition fee | January 1, 2015 though August 31, 2017 | 1.00% | Equal to the product of (x) the rate and (y) the cost of investments we acquired or originated, including any debt attributable to such investments. |
September 1, 2017 through December 31, 2017 | 0.85% | ||
Acquisition expenses | January 1, 2015 through December 31, 2017 | N/A | Reimbursements for direct expenses incurred related to selecting, evaluating, and acquiring assets on our behalf, including certain personnel costs. |
Disposition fee | January 1, 2015 through August 31, 2017 | 2.00% | Equal to the lesser of: (i) the product of the rate and the contract sales price of each property or other investment sold; or (ii) one-half of the total brokerage commissions paid if a non-affiliated broker is also involved in the sale, provided that total real estate commissions paid (to the Advisor and others) in connection with the sale may not exceed the lesser of a competitive real estate commission or 6% of the contract sales price. |
September 1, 2017 through December 31, 2017 | 1.70% | ||
Financing fee | January 1, 2015 through December 31, 2015 | 0.75% | Equal to the product of (x) the rate and (y) all amounts made available under any loan or line of credit in connection with the origination or refinancing of any debt that we obtain and use to finance properties or other permitted investments. |
General and Administrative Expenses—As of December 31, 2017 and 2016, we owed the Advisor and their affiliates $119,000 and $43,000, respectively, for general and administrative expenses paid on our behalf.
Summarized below are the fees earned by and the expenses reimbursable to the Advisor and ARC under the Advisory Agreement and former advisory agreement, except for organization and offering costs and general and administrative expenses, which we disclose above, for the year ended December 31, 2017, 2016, and 2015, and any related amounts unpaid as of December 31, 2017 and 2016 (in thousands):
For the Period Ended | Unpaid Amount as of | ||||||||||||||||||
December 31, | December 31, | ||||||||||||||||||
2017 | 2016 | 2015 | 2017 | 2016 | |||||||||||||||
Acquisition fees(1) | $ | 1,898 | $ | 5,037 | $ | 6,841 | $ | — | $ | 179 | |||||||||
Acquisition expenses(1) | 625 | 1,008 | 1,227 | — | — | ||||||||||||||
Asset management fees(2) | 12,001 | 10,043 | — | 48 | 1,007 | ||||||||||||||
Class B unit distributions(3) | 702 | 684 | 82 | 56 | 57 | ||||||||||||||
Financing coordination fees(4) | — | — | 554 | — | — | ||||||||||||||
Total | $ | 15,226 | $ | 16,772 | $ | 8,704 | $ | 104 | $ | 1,243 | |||||||||
(1) | Prior to January 1, 2017, acquisition and due diligence fees were presented as Acquisition Expenses on the consolidated statements of operations. The majority of these costs are now capitalized and allocated to the related investment in real estate assets on the consolidated balance sheet based on the acquisition-date fair values of the respective assets and liabilities acquired. |
(2) | Asset management fees are presented as General and Administrative on the consolidated statements of operations. |
(3) | Represents the distributions paid to the Advisor and ARC as holders of Class B units of the Operating Partnership and is presented as General and Administrative on the consolidated statements of operations. |
(4) | Financing coordination fees are presented as Other Assets, Net or Debt Obligations, Net, on the consolidated balance sheets and amortized over the term of the related loan. As of January 1, 2016, we are no longer required to pay financing coordination fees. |
Annual Subordinated Performance Fee—We may pay the Advisor or its assignees an annual subordinated performance fee calculated on the basis of our total return to stockholders, payable annually in arrears, such that for any year in which our total return on stockholders’ capital exceeds 6% per annum, the Advisor will be entitled to 12.75% of the amount in excess of such 6% per annum, provided that the amount paid to the Advisor does not exceed 8.5% of the aggregate total return for that year. No such amounts have been incurred or payable to date.
Subordinated Participation in Net Sales Proceeds—The Operating Partnership may pay to a subsidiary of PECO a subordinated participation in the net sales proceeds of the sale of real estate assets equal to 12.75% of remaining net sales proceeds after return of capital contributions to stockholders plus payment to investors of a 6% cumulative, pre-tax non-compounded annual return on the capital contributed by stockholders. No sales of real estate assets have occurred to date.
Subordinated Incentive Listing Distribution—The Operating Partnership may pay to a subsidiary of PECO a subordinated incentive listing distribution upon the listing of our common stock on a national securities exchange. Such incentive listing distribution is equal to 12.75% of the amount by which the market value of all of our issued and outstanding common stock plus distributions exceeds the aggregate capital contributed by stockholders plus an amount equal to a 6% cumulative, pre-tax non-compounded annual return to stockholders.
Neither PECO, nor any of its affiliates, can earn both the subordinated participation in the net sales proceeds and the subordinated incentive listing distribution. No subordinated incentive listing distribution has been earned to date.
F-20
Subordinated Distribution Upon Termination of the Advisor Agreement—Upon termination or non-renewal of the Advisory Agreement, a subsidiary of PECO shall be entitled to a subordinated termination distribution in the form of a non-interest bearing promissory note equal to 12.75% of the amount by which the value of our assets owned at the time of such termination or non-renewal plus distributions exceeds the aggregate capital contributed by stockholders plus an amount equal to a 7% cumulative, pre-tax non-compounded annual return to stockholders. In addition, PECO may elect to defer its right to receive a subordinated distribution upon termination until either a listing on a national securities exchange or a liquidity event occurs. No such termination has occurred to date.
Manager—All of our properties are managed and leased by the Manager. The Manager also manages properties owned by PECO affiliates or other third parties. Below is a summary of fees charged by and expenses reimbursable to the Manager as outlined in the Management Agreements.
Manager Fees and Reimbursements Paid in Cash
Fee Type | Rate | Description |
Property Management | 4.00% | Equal to the product of (x) the monthly gross cash receipts from the properties managed and (y) the rate. |
Leasing Commissions | Market Rate | Fees for leasing services rendered with respect to a particular property, including if a tenant exercised an option to extend an existing lease. The fee may be increased by up to 50% if a co-broker is engaged to lease a particular vacancy. |
Construction Management | Market Rate | Paid for construction management services rendered with respect to a particular property. |
Other Expenses and Reimbursements | N/A | Costs and expenses incurred by the Manager on our behalf, including certain employee compensation, legal, travel, and other out-of-pocket expenses that were directly related to the management of specific properties and corporate matters, as well as fees and expenses of third-party accountants. |
Summarized below are the fees earned by and the expenses reimbursable to the Manager for the years ended December 31, 2017, 2016, and 2015, and any related amounts unpaid as of December 31, 2017 and 2016 (in thousands):
For the Period Ended | Unpaid Amount as of | ||||||||||||||||||
December 31, | December 31, | ||||||||||||||||||
2017 | 2016 | 2015 | 2017 | 2016 | |||||||||||||||
Property management fees(1) | $ | 6,035 | $ | 4,716 | $ | 2,085 | $ | 580 | $ | 423 | |||||||||
Leasing commissions(2) | 3,342 | 3,758 | 1,788 | 202 | 386 | ||||||||||||||
Construction management fees(2) | 941 | 1,059 | 377 | 260 | 185 | ||||||||||||||
Other fees and reimbursements(3) | 3,779 | 3,584 | 2,017 | 491 | 367 | ||||||||||||||
Total | $ | 14,097 | $ | 13,117 | $ | 6,267 | $ | 1,533 | $ | 1,361 | |||||||||
(1) | The property management fees are included in Property Operating on the consolidated statements of operations. |
(2) | Leasing commissions paid for leases with terms less than one year are expensed and included in Depreciation and Amortization on the consolidated statements of operations. Leasing commissions paid for leases with terms greater than one year, and construction management fees, are capitalized and amortized over the life of the related leases or assets. |
(3) | Other fees and reimbursements are included in Property Operating and General and Administrative on the consolidated statements of operations based on the nature of the expense. |
Dealer Manager—The dealer manager for our initial public offering was Realty Capital Securities, LLC (the “Dealer Manager”), an affiliate of ARC. The Dealer Manager provided certain sales, promotional and marketing services in connection with the distribution of the shares of common stock offered under our offering. Excluding shares sold pursuant to the “friends and family” program, the Dealer Manager was generally paid a sales commission equal to 7% of the gross proceeds from the sale of shares of the common stock sold in the primary offering and a dealer manager fee equal to 3% of the gross proceeds from the sale of shares of the common stock sold in the primary offering. The dealer manager agreement terminated upon termination of the initial public offering in September 2015.
Prior to February 2016, we utilized transfer agent services provided by an affiliate of the Dealer Manager. Fees incurred from this transfer agent represented amounts paid by PECO to the affiliate of the Dealer Manager for such services. We reimbursed PECO for these fees through the payment of organization and offering costs. The transfer agent ceased services and the agreement was terminated in connection with the bankruptcy of the transfer agent and its parent company.
F-21
The following table details total selling commissions, dealer manager fees, and service fees paid to the Dealer Manager and its affiliate related to the sale of common stock for the years ended December 31, 2017, 2016, and 2015, and any related amounts unpaid, which are included as a component of total unpaid organization and offering costs, as of December 31, 2017 and 2016 (in thousands):
For the Period Ended | Unpaid Amount as of | ||||||||||||||||||
December 31, | December 31, | ||||||||||||||||||
2017 | 2016 | 2015 | 2017 | 2016 | |||||||||||||||
Total commissions and fees incurred from Dealer Manager | $ | — | $ | — | $ | 51,213 | $ | — | $ | — | |||||||||
Transfer agent fees incurred related to offering costs | — | — | 1,254 | — | 140 | ||||||||||||||
Other fees expensed from the transfer agent | — | 140 | 559 | — | 560 | ||||||||||||||
Share Purchases by the Advisor—The Advisor made an initial investment in us through the purchase of 8,888 shares of our common stock and may not sell any of these shares while serving as our advisor. The Advisor purchased shares at a purchase price of $22.50 per share, reflecting no dealer manager fee nor selling commissions paid on such shares.
Unconsolidated Joint Venture—As of December 31, 2017 and 2016, we owed the Joint Venture approximately $52,000 and $152,000, respectively, primarily related to activity at the six properties contributed by us to the Joint Venture. See Note 4 for more information regarding the Joint Venture.
13. OPERATING LEASES |
The terms and expirations of our operating leases with our tenants vary. The lease agreements frequently contain options to extend the terms of leases and other terms and conditions as negotiated. We retain substantially all of the risks and benefits of ownership of the real estate assets leased to tenants.
Approximate future rentals to be received under non-cancelable operating leases in effect at December 31, 2017, assuming no new or renegotiated leases or option extensions on lease agreements, are as follows (in thousands):
Year | Amount | ||
2018 | $ | 119,185 | |
2019 | 107,463 | ||
2020 | 94,392 | ||
2021 | 78,473 | ||
2022 | 63,143 | ||
2023 and thereafter | 226,373 | ||
Total | $ | 689,029 | |
No single tenant comprised 10% or more of our aggregate annualized base rent (“ABR”) as of December 31, 2017. As of December 31, 2017, our real estate investments in Florida, California, and Georgia represented 15.1%, 13.4%, and 11.0% of our ABR, respectively. As a result, the geographic concentration of our portfolio makes it particularly susceptible to adverse economic developments in those real estate markets.
14. QUARTERLY FINANCIAL DATA (UNAUDITED) |
The following is a summary of the unaudited quarterly financial information for the years ended December 31, 2017 and 2016. We believe that all necessary adjustments, consisting only of normal recurring adjustments, have been included in the amounts stated below to present fairly, and in accordance with GAAP, the selected quarterly information.
2017 | |||||||||||||||
(in thousands, except per share amounts) | First Quarter | Second Quarter | Third Quarter(1) | Fourth Quarter | |||||||||||
Total revenue | $ | 38,801 | $ | 39,958 | $ | 40,971 | $ | 42,847 | |||||||
Net loss | (87 | ) | (1,252 | ) | (5,857 | ) | (2,335 | ) | |||||||
Net loss per share - basic and diluted | (0.00 | ) | (0.03 | ) | (0.13 | ) | (0.04 | ) | |||||||
(1) | The net loss in the third quarter was largely due to the termination of affiliate arrangements (see Note 10). |
F-22
2016 | |||||||||||||||
(in thousands, except per share amounts) | First Quarter | Second Quarter | Third Quarter | Fourth Quarter | |||||||||||
Total revenue | $ | 28,301 | $ | 31,378 | $ | 34,002 | $ | 36,115 | |||||||
Net income (loss) | 1,351 | (4,552 | ) | 48 | (2,344 | ) | |||||||||
Net income (loss) per share - basic and diluted | 0.03 | (0.10 | ) | 0.00 | (0.05 | ) | |||||||||
15. SUBSEQUENT EVENTS |
Distributions
Distributions were paid subsequent to December 31, 2017, as follows (in thousands):
Month | Dates of Record | Distribution Amount per Share(1) | Date Distribution Paid | Gross Amount of Distribution Paid | Distribution Reinvested through the DRIP | Net Cash Distribution | ||||||||||||
December | 12/1/2017 - 12/31/2017 | $0.00445205 | 1/2/2018 | $ | 6,432 | $ | 3,006 | $ | 3,426 | |||||||||
January | 1/16/2018 | $0.13541652 | 2/1/2018 | 6,326 | 2,922 | 3,404 | ||||||||||||
February | 2/15/2018 | $0.13541652 | 3/1/2018 | 6,314 | 2,898 | 3,416 | ||||||||||||
(1) | The December distribution amount per share is a daily amount, while the January and February amount per share is a monthly amount. The 2018 monthly distribution amount will result in the same annual distribution amount as the daily distribution amount. |
In March 2018, our board of directors authorized distributions to the stockholders of record as of March 15, 2018, April 16, 2018, and May 15, 2018. The authorized distributions equal an amount of $0.13541652 per share of common stock. We expect to pay these distributions on the first business day after the end of each month.
Acquisitions
Subsequent to December 31, 2017, we acquired the following property (dollars in thousands):
Property Name | Location | Anchor | Acquisition Date | Purchase Price | Square Footage | Leased % Rentable Square Feet at Acquisition | ||||||||||
Seville Commons | Arlington, TX | Walmart | 1/19/2018 | $ | 18,200 | 113,742 | 92.4 | % | ||||||||
Joint Venture
Subsequent to December 31, 2017, we received a distribution of $0.3 million from the Joint Venture.
F-23
SCHEDULE III—REAL ESTATE ASSETS AND ACCUMULATED DEPRECIATION | |||||||||||||||||||||||||||||||||||||
As of December 31, 2017 | |||||||||||||||||||||||||||||||||||||
(in thousands) | |||||||||||||||||||||||||||||||||||||
Initial Cost (1) | Cost Capitalized Subsequent to Acquisition | Gross Amount Carried at End of Period(2)(3) | |||||||||||||||||||||||||||||||||||
Property Name | City, State | Encumbrances | Land and Improvements | Buildings and Improvements | Land and Improvements | Buildings and Improvements | Total | Accumulated Depreciation | Date Constructed/ Renovated | Date Acquired | |||||||||||||||||||||||||||
Bethany Village Shopping Center | Alpharetta, GA | $ | — | $ | 4,833 | $ | 5,474 | $ | 380 | $ | 5,015 | $ | 5,672 | $ | 10,687 | $ | 1,042 | 2001 | 3/14/2014 | ||||||||||||||||||
Staunton Plaza | Staunton, VA | — | 4,311 | 10,035 | 204 | 4,428 | 10,122 | 14,550 | 1,626 | 2006 | 4/30/2014 | ||||||||||||||||||||||||||
Northpark Village | Lubbock, TX | — | 1,467 | 6,212 | 365 | 1,678 | 6,366 | 8,044 | 977 | 1990 | 7/25/2014 | ||||||||||||||||||||||||||
Spring Cypress Village | Houston, TX | — | 8,219 | 11,731 | 1,044 | 8,471 | 12,523 | 20,994 | 2,112 | 1982/2007 | 7/30/2014 | ||||||||||||||||||||||||||
Kipling Marketplace | Littleton, CO | — | 3,108 | 8,547 | 414 | 3,229 | 8,840 | 12,069 | 1,386 | 1983/2009 | 8/7/2014 | ||||||||||||||||||||||||||
Lake Washington Crossing | Melbourne, FL | — | 3,617 | 9,121 | 605 | 3,767 | 9,576 | 13,343 | 1,385 | 1987/2012 | 8/15/2014 | ||||||||||||||||||||||||||
MetroWest Village | Orlando, FL | — | 4,665 | 12,528 | 438 | 4,833 | 12,798 | 17,631 | 1,996 | 1990 | 8/20/2014 | ||||||||||||||||||||||||||
Kings Crossing | Sun City Center, FL | — | 4,064 | 8,918 | 537 | 4,286 | 9,233 | 13,519 | 1,414 | 2000 | 8/26/2014 | ||||||||||||||||||||||||||
Commonwealth Square | Folsom, CA | 6,576 | 6,811 | 12,962 | 1,174 | 7,136 | 13,811 | 20,947 | 2,732 | 1987 | 10/2/2014 | ||||||||||||||||||||||||||
Colonial Promenade | Winter Haven, FL | — | 9,132 | 21,733 | 553 | 9,184 | 22,234 | 31,418 | 3,870 | 1986/2008 | 10/10/2014 | ||||||||||||||||||||||||||
Point Loomis Shopping Center | Milwaukee, WI | — | 4,380 | 8,145 | 44 | 4,380 | 8,189 | 12,569 | 1,270 | 1965/1991 | 10/21/2014 | ||||||||||||||||||||||||||
Hilander Village | Roscoe, IL | — | 2,293 | 6,637 | 902 | 2,732 | 7,100 | 9,832 | 1,694 | 1994 | 10/22/2014 | ||||||||||||||||||||||||||
Milan Plaza | Milan, MI | — | 854 | 1,760 | 346 | 1,041 | 1,919 | 2,960 | 954 | 1960/1975 | 10/22/2014 | ||||||||||||||||||||||||||
Laguna 99 Plaza | Elk Grove, CA | — | 5,264 | 12,298 | 687 | 5,590 | 12,659 | 18,249 | 1,985 | 1992 | 11/10/2014 | ||||||||||||||||||||||||||
Southfield Shopping Center | St. Louis, MO | — | 5,307 | 12,781 | 464 | 5,506 | 13,046 | 18,552 | 2,038 | 1987 | 11/18/2014 | ||||||||||||||||||||||||||
Shasta Crossroads | Redding, CA | — | 5,818 | 19,148 | 1,738 | 6,373 | 20,331 | 26,704 | 2,930 | 1989 | 11/25/2014 | ||||||||||||||||||||||||||
Spivey Junction | Stockbridge, GA | — | 4,359 | 7,179 | 752 | 4,673 | 7,617 | 12,290 | 1,292 | 1998 | 12/5/2014 | ||||||||||||||||||||||||||
Quivira Crossings | Overland Park, KS | 8,239 | 6,784 | 10,113 | 674 | 7,188 | 10,383 | 17,571 | 1,739 | 1996 | 12/16/2014 | ||||||||||||||||||||||||||
Plaza Farmington | Farmington, NM | — | 8,564 | 6,074 | 833 | 8,716 | 6,755 | 15,471 | 1,380 | 2004 | 12/22/2014 | ||||||||||||||||||||||||||
Crossroads of Shakopee | Shakopee, MN | — | 10,180 | 13,602 | 544 | 10,436 | 13,890 | 24,326 | 2,666 | 1998 | 12/22/2014 | ||||||||||||||||||||||||||
Willimantic Plaza | Willimantic, CT | — | 3,429 | 9,166 | 299 | 3,599 | 9,295 | 12,894 | 1,699 | 1968/1990 | 1/30/2015 | ||||||||||||||||||||||||||
Harvest Plaza | Akron, OH | — | 1,022 | 6,063 | 1,065 | 1,314 | 6,836 | 8,150 | 974 | 1974/2000 | 2/9/2015 | ||||||||||||||||||||||||||
North Point Landing | Modesto, CA | — | 7,756 | 20,278 | 888 | 7,974 | 20,948 | 28,922 | 2,693 | 1964/2008 | 2/11/2015 | ||||||||||||||||||||||||||
Oakhurst Plaza | Seminole, FL | — | 2,586 | 3,152 | 446 | 2,601 | 3,583 | 6,184 | 701 | 1974/2001 | 2/27/2015 | ||||||||||||||||||||||||||
Glenwood Crossing | Cincinnati, OH | — | 4,191 | 2,538 | 489 | 4,505 | 2,713 | 7,218 | 830 | 1999 | 3/27/2015 | ||||||||||||||||||||||||||
Rosewick Crossing | La Plata, MD | — | 7,413 | 15,169 | 855 | 7,712 | 15,725 | 23,437 | 2,320 | 2008 | 4/2/2015 | ||||||||||||||||||||||||||
Waterford Park Plaza | Plymouth, MN | — | 4,150 | 14,453 | 846 | 4,606 | 14,843 | 19,449 | 2,190 | 1989 | 4/6/2015 | ||||||||||||||||||||||||||
Ocean Breeze | Jensen Beach, FL | — | 5,896 | 7,861 | 435 | 5,965 | 8,227 | 14,192 | 1,150 | 1993/2010 | 4/30/2015 | ||||||||||||||||||||||||||
Old Alabama Square | Alpharetta, GA | — | 9,712 | 13,937 | 1,622 | 10,225 | 15,046 | 25,271 | 1,893 | 2000 | 6/10/2015 | ||||||||||||||||||||||||||
Central Valley Market Place | Ceres, CA | — | 2,610 | 15,821 | 256 | 2,751 | 15,936 | 18,687 | 1,677 | 2005 | 6/29/2015 | ||||||||||||||||||||||||||
Meadows on the Parkway | Boulder, CO | — | 24,131 | 20,529 | 1,528 | 24,632 | 21,556 | 46,188 | 2,493 | 1989 | 7/16/2015 | ||||||||||||||||||||||||||
Broadlands Marketplace | Broomfield, CO | — | 6,395 | 8,280 | 509 | 6,549 | 8,635 | 15,184 | 1,186 | 2002 | 7/16/2015 | ||||||||||||||||||||||||||
West Acres Shopping Center | Fresno, CA | — | 3,386 | 6,069 | 235 | 3,474 | 6,216 | 9,690 | 1,046 | 1990 | 7/31/2015 | ||||||||||||||||||||||||||
Plano Market Street | Plano, TX | — | 15,121 | 28,920 | 305 | 15,190 | 29,156 | 44,346 | 3,183 | 2009 | 7/31/2015 | ||||||||||||||||||||||||||
Island Walk Plaza | Fernandina Beach, FL | — | 7,248 | 13,113 | 1,437 | 7,644 | 14,154 | 21,798 | 2,051 | 1987/2012 | 9/30/2015 | ||||||||||||||||||||||||||
North Pointe Plaza | North Charleston, SC | — | 9,182 | 28,118 | (323 | ) | 9,478 | 27,499 | 36,977 | 3,661 | 1989 | 9/30/2015 | |||||||||||||||||||||||||
Shoregate Center | Willowick, OH | — | 6,774 | 12,684 | 3,424 | 7,997 | 14,885 | 22,882 | 3,318 | 1958/2005 | 10/7/2015 | ||||||||||||||||||||||||||
Village Center | Racine, WI | — | 4,945 | 23,515 | 455 | 5,272 | 23,643 | 28,915 | 3,459 | 2002/2003 | 10/30/2015 | ||||||||||||||||||||||||||
Alico Commons | Fort Myers, FL | — | 3,636 | 14,340 | 93 | 3,671 | 14,398 | 18,069 | 1,417 | 2009 | 11/2/2015 | ||||||||||||||||||||||||||
Port St. John Plaza | Port St John, FL | — | 2,758 | 3,806 | 499 | 3,196 | 3,867 | 7,063 | 729 | 1986 | 11/2/2015 | ||||||||||||||||||||||||||
F-24
SCHEDULE III—REAL ESTATE ASSETS AND ACCUMULATED DEPRECIATION | |||||||||||||||||||||||||||||||||||||
As of December 31, 2017 | |||||||||||||||||||||||||||||||||||||
(in thousands) | |||||||||||||||||||||||||||||||||||||
Initial Cost (1) | Cost Capitalized Subsequent to Acquisition | Gross Amount Carried at End of Period(2)(3) | |||||||||||||||||||||||||||||||||||
Property Name | City, State | Encumbrances | Land and Improvements | Buildings and Improvements | Land and Improvements | Buildings and Improvements | Total | Accumulated Depreciation | Date Constructed/ Renovated | Date Acquired | |||||||||||||||||||||||||||
Rockledge Square | Rockledge, FL | — | 2,765 | 3,292 | 240 | 2,765 | 3,532 | 6,297 | 630 | 1985 | 11/2/2015 | ||||||||||||||||||||||||||
Windover Square | Melbourne, FL | — | 3,242 | 11,744 | 518 | 3,465 | 12,039 | 15,504 | 1,148 | 1984/2010 | 11/2/2015 | ||||||||||||||||||||||||||
51st and Olive | Glendale, AZ | 3,689 | 1,974 | 6,870 | 287 | 2,082 | 7,049 | 9,131 | 785 | 1975/2007 | 11/6/2015 | ||||||||||||||||||||||||||
Cocoa Commons | Cocoa, FL | — | 4,468 | 6,534 | 737 | 4,673 | 7,066 | 11,739 | 857 | 1986 | 11/19/2015 | ||||||||||||||||||||||||||
Sheffield Crossing | Sheffield Village, OH | 8,988 | 6,053 | 9,274 | 649 | 6,314 | 9,662 | 15,976 | 1,510 | 1989 | 12/17/2015 | ||||||||||||||||||||||||||
Amherst Marketplace | Amherst, OH | 6,420 | 2,916 | 8,213 | 100 | 3,010 | 8,219 | 11,229 | 760 | 1996 | 12/17/2015 | ||||||||||||||||||||||||||
Shoppes at Windmill Place | Batavia, IL | — | 7,980 | 14,873 | 612 | 8,394 | 15,071 | 23,465 | 1,506 | 1991/1997 | 12/17/2015 | ||||||||||||||||||||||||||
Hamilton Mill Village | Dacula, GA | — | 6,320 | 9,566 | 1,038 | 6,493 | 10,431 | 16,924 | 1,067 | 1996 | 12/22/2015 | ||||||||||||||||||||||||||
Normandale Village | Bloomington, MN | 12,390 | 7,107 | 10,880 | 989 | 7,647 | 11,329 | 18,976 | 1,375 | 1973 | 12/22/2015 | ||||||||||||||||||||||||||
Wyandotte Plaza | Kansas City, KS | — | 5,149 | 14,414 | 560 | 5,238 | 14,885 | 20,123 | 1,369 | 1961/2015 | 12/23/2015 | ||||||||||||||||||||||||||
Everybody's Plaza | Cheshire, CT | — | 2,336 | 8,453 | 218 | 2,475 | 8,532 | 11,007 | 779 | 1960/2005 | 12/30/2015 | ||||||||||||||||||||||||||
Carriagetown Station | Amesbury, MA | — | 6,811 | 13,885 | 233 | 6,985 | 13,944 | 20,929 | 1,225 | 2000 | 2/4/2016 | ||||||||||||||||||||||||||
Vineyard Center Station | Templeton, CA | 5,500 | 1,718 | 5,818 | 75 | 1,757 | 5,854 | 7,611 | 498 | 2007 | 2/17/2016 | ||||||||||||||||||||||||||
Glen Lakes Station | Weeki Wachee, FL | — | 3,030 | 5,712 | 70 | 3,043 | 5,769 | 8,812 | 558 | 2008 | 2/23/2016 | ||||||||||||||||||||||||||
Sanibel Station | Fort Myers, FL | — | 3,395 | 5,201 | 85 | 3,445 | 5,236 | 8,681 | 588 | 2003 | 2/23/2016 | ||||||||||||||||||||||||||
Fairfield Commons | Lakewood, CO | — | 7,706 | 24,427 | 1,146 | 8,431 | 24,848 | 33,279 | 1,888 | 1985 | 2/25/2016 | ||||||||||||||||||||||||||
Lakewood Station | Lakewood, OH | — | 1,585 | 9,589 | 623 | 1,893 | 9,904 | 11,797 | 729 | 1991 | 3/10/2016 | ||||||||||||||||||||||||||
Amherst Station II | Amherst, NY | — | 4,782 | 6,752 | 772 | 4,895 | 7,411 | 12,306 | 946 | 1980/1999 | 4/8/2016 | ||||||||||||||||||||||||||
Bartow Marketplace Station | Cartersville, GA | — | 12,349 | 21,159 | 496 | 12,427 | 21,577 | 34,004 | 2,332 | 1995 | 4/8/2016 | ||||||||||||||||||||||||||
Bloomingdale Hills Station | Riverview, FL | — | 3,719 | 4,773 | 160 | 3,790 | 4,862 | 8,652 | 540 | 2002/2012 | 4/4/2016 | ||||||||||||||||||||||||||
Stone Gate Station | Crowley, TX | 7,615 | 4,992 | 6,807 | 122 | 5,089 | 6,832 | 11,921 | 634 | 2003 | 4/15/2016 | ||||||||||||||||||||||||||
Broadway Pavilion Station | Santa Maria, CA | — | 8,125 | 18,138 | 404 | 8,383 | 18,284 | 26,667 | 1,394 | 1987 | 5/5/2016 | ||||||||||||||||||||||||||
Mckinney Station | Mckinney, TX | 3,901 | 9,756 | 12,172 | 141 | 9,808 | 12,261 | 22,069 | 1,072 | 2003 | 5/24/2016 | ||||||||||||||||||||||||||
Montville Station | Montville, CT | 9,470 | 12,603 | 11,926 | 440 | 12,910 | 12,059 | 24,969 | 1,252 | 2007 | 5/24/2016 | ||||||||||||||||||||||||||
Raynham Station | Raynham, MA | 17,000 | 7,618 | 25,811 | 914 | 7,954 | 26,389 | 34,343 | 1,971 | 1965/1991 | 5/24/2016 | ||||||||||||||||||||||||||
Suntree Station | Southlake, TX | 9,532 | 6,312 | 15,103 | 226 | 6,376 | 15,265 | 21,641 | 1,079 | 2000 | 5/24/2016 | ||||||||||||||||||||||||||
Crosscreek Village Station | St. Cloud, FL | — | 3,350 | 7,794 | 26 | 3,360 | 7,810 | 11,170 | 624 | 2008 | 5/20/2016 | ||||||||||||||||||||||||||
Market Walk Station | Savannah, GA | — | 19,426 | 25,565 | 971 | 19,758 | 26,204 | 45,962 | 2,099 | 2014/2015 | 5/11/2016 | ||||||||||||||||||||||||||
Green Valley Station | Henderson, NV | — | 7,028 | 13,607 | 471 | 7,199 | 13,907 | 21,106 | 1,063 | 1978/1982 | 5/31/2016 | ||||||||||||||||||||||||||
Livonia Station | Livonia, MI | — | 3,861 | 14,717 | 574 | 4,388 | 14,764 | 19,152 | 840 | 1988 | 9/20/2016 | ||||||||||||||||||||||||||
Franklin Station | Franklin, WI | 7,728 | 5,647 | 5,426 | 526 | 6,040 | 5,559 | 11,599 | 400 | 1994/2009 | 12/28/2016 | ||||||||||||||||||||||||||
Alameda Crossing Station | Avondale, AZ | 13,639 | 4,987 | 15,845 | 280 | 5,077 | 16,035 | 21,112 | 790 | 2006 | 12/2/2016 | ||||||||||||||||||||||||||
Shorewood Station | Shorewood, IL | — | 9,221 | 21,521 | 565 | 9,524 | 21,783 | 31,307 | 1,086 | 2001 | 12/15/2016 | ||||||||||||||||||||||||||
Palmer Town Station | Easton, PA | — | 7,216 | 21,828 | 583 | 7,377 | 22,250 | 29,627 | 1,013 | 2005 | 12/30/2016 | ||||||||||||||||||||||||||
Plaza 23 Station | Pompton Plains, NJ | — | 10,743 | 36,975 | 883 | 11,205 | 37,396 | 48,601 | 1,362 | 1963/1997 | 2/27/2017 | ||||||||||||||||||||||||||
Herndon Station | Fresno, CA | — | 6,196 | 10,165 | 241 | 6,391 | 10,211 | 16,602 | 602 | 2005 | 2/10/2017 | ||||||||||||||||||||||||||
Windmill Station | Clovis, CA | — | 2,638 | 6,317 | 155 | 2,749 | 6,361 | 9,110 | 258 | 2001 | 2/10/2017 | ||||||||||||||||||||||||||
Bells Fork Station | Greenville, NC | — | 2,474 | 5,518 | 303 | 2,587 | 5,708 | 8,295 | 227 | 2006 | 3/1/2017 | ||||||||||||||||||||||||||
Evans Station | Evans, GA | — | 3,902 | 7,385 | 444 | 3,934 | 7,797 | 11,731 | 247 | 1995 | 5/9/2017 | ||||||||||||||||||||||||||
Riverlakes Station | Bakersfield, CA | 14,112 | 7,857 | 14,732 | 160 | 7,892 | 14,857 | 22,749 | 335 | 1997 | 6/16/2017 | ||||||||||||||||||||||||||
F-25
SCHEDULE III—REAL ESTATE ASSETS AND ACCUMULATED DEPRECIATION | |||||||||||||||||||||||||||||||||||||
As of December 31, 2017 | |||||||||||||||||||||||||||||||||||||
(in thousands) | |||||||||||||||||||||||||||||||||||||
Initial Cost (1) | Cost Capitalized Subsequent to Acquisition | Gross Amount Carried at End of Period(2)(3) | |||||||||||||||||||||||||||||||||||
Property Name | City, State | Encumbrances | Land and Improvements | Buildings and Improvements | Land and Improvements | Buildings and Improvements | Total | Accumulated Depreciation | Date Constructed/ Renovated | Date Acquired | |||||||||||||||||||||||||||
Ormond Beach Station | Ormond Beach, FL | — | 4,940 | 7,345 | 136 | 4,996 | 7,425 | 12,421 | 156 | 1967/2010 | 7/12/2017 | ||||||||||||||||||||||||||
Mansfield Station | Mansfield, TX | — | 4,506 | 12,366 | 38 | 4,528 | 12,382 | 16,910 | 186 | 2015 | 9/6/2017 | ||||||||||||||||||||||||||
Heritage Plaza Station | Carol Stream, IL | 9,696 | 5,435 | 15,423 | 178 | 5,486 | 15,550 | 21,036 | 191 | 1988 | 9/28/2017 | ||||||||||||||||||||||||||
Mountain Crossing Station | Dacula, GA | 4,586 | 6,427 | 6,832 | (3 | ) | 6,425 | 6,831 | 13,256 | 37 | 1997 | 12/1/2017 | |||||||||||||||||||||||||
Loganville Station | Loganville, GA | — | 4,851 | 6,393 | — | 4,851 | 6,393 | 11,244 | — | 1997 | 12/22/2017 | ||||||||||||||||||||||||||
Totals | $ | 149,081 | $ | 501,887 | $ | 1,019,950 | $ | 46,447 | $ | 520,526 | $ | 1,047,758 | $ | 1,568,284 | $ | 115,166 | |||||||||||||||||||||
(1) | The initial cost to us represents the original purchase price of the property, including amounts incurred subsequent to acquisition which were contemplated at the time the property was acquired. |
(2) | The aggregate cost of real estate owned at December 31, 2017. |
(3) | The aggregate cost of real estate owned at December 31, 2017 for federal income tax purposes is $1.7 billion. |
Reconciliation of real estate owned:
2017 | 2016 | ||||||
Balance at January 1 | $ | 1,358,220 | $ | 954,698 | |||
Additions during the year: | |||||||
Real estate acquisitions | 189,420 | 473,383 | |||||
Net additions to/improvements of real estate | 20,644 | 15,233 | |||||
Deductions during the year: | |||||||
Real estate dispositions | — | (85,094 | ) | ||||
Balance at December 31 | $ | 1,568,284 | $ | 1,358,220 | |||
Reconciliation of accumulated depreciation:
2017 | 2016 | ||||||
Balance at January 1 | $ | 61,981 | $ | 21,315 | |||
Additions during the year: | |||||||
Depreciation expense | 53,185 | 42,247 | |||||
Deductions during the year: | |||||||
Accumulated depreciation of real estate dispositions | — | (1,581 | ) | ||||
Balance at December 31 | $ | 115,166 | $ | 61,981 | |||
* * * * *
F-26
SIGNATURES
Pursuant to the requirements of the Securities Exchange Act of 1934, the registrant has duly caused this report to be signed on its behalf by the undersigned thereunto duly authorized this 27th day of March 2018.
PHILLIPS EDISON GROCERY CENTER REIT II, INC. | ||
By: | /s/ JEFFREY S. EDISON | |
Jeffrey S. Edison | ||
Chairman of the Board and Chief Executive Officer | ||
Pursuant to the requirements of the Securities Exchange Act of 1934, this report has been signed by the following persons in the capacities and on the dates indicated.
Signature | Title | Date | ||
/s/ JEFFREY S. EDISON | Chairman of the Board and Chief Executive Officer (“Principal Executive Officer”) | March 27, 2018 | ||
Jeffrey S. Edison | ||||
/s/ DEVIN I. MURPHY | Chief Financial Officer (“Principal Financial Officer”) | March 27, 2018 | ||
Devin I. Murphy | ||||
/s/ JENNIFER L. ROBISON | Chief Accounting Officer (“Principal Accounting Officer”) | March 27, 2018 | ||
Jennifer L. Robison | ||||
/s/ DAVID W. GARRISON | Director | March 27, 2018 | ||
David W. Garrison | ||||
/s/ MARK D. MCDADE | Director | March 27, 2018 | ||
Mark D. McDade | ||||
/s/ JOHN A. STRONG | Director | March 27, 2018 | ||
John A. Strong | ||||
F-27