Attached files
| file | filename |
|---|---|
| 8-K - FORM 8-K - CONDOR HOSPITALITY TRUST, INC. | d505553d8k.htm |
Exhibit 99.1

Condor Hospitality Trust, Inc.
Post Transition Analysis | A Strong Foundation for Value Creation
Document Release Date: January 10, 2018
The management of Condor Hospitality Trust, Inc. [“Condor” or “the Company”] believes that the release of this information is appropriate at this time given the unique circumstances at this point in the Company’s transformation.
The Company urges caution in considering the information and outlook for the Company disclosed in this document, and investors should consult their financial advisors with respect to the Company’s equity securities. Please also see “Forward-Looking Information” appearing in this document.

Condor Hospitality Trust, Inc. [NYSE American: CDOR]
Post Transition Analysis | A Strong Foundation for Value Creation
Document Purpose: Management’s intent with this document is to provide: [1] a perspective on Condor’s current undervaluation, [2] an outlook for 2018, [3] clarity on the portfolio, and [4] a review of 2017 portfolio outperformance.
During the period from January 1, 2015 through December 31, 2017, the management team of Condor Hospitality Trust completed a dramatic transformation of the Company’s portfolio, equity capitalization, and debt structure. This transformation resulted in a higher-quality portfolio and an enhanced balance sheet but, management believes, also created challenges in assessing and valuing the Company. More specifically, given the simultaneous disposition of 53 legacy hotels either sold or under contract at year-end 2017, totaling $161 million in gross proceeds, and the acquisition of 14 new investment platform [“NIP”] hotels acquired or under contract for the same period, totaling $276 million in acquisitions, understanding the revenue and income generating potential of this newly established platform has been challenging for analysts and investors. Condor management believes it now has a strong foundation to pursue shareholder value creation and this document’s intent is to provide clarity on management’s view of valuation, 2018 outlook, the current portfolio, and 2017 outperformance.
Valuation Summary [Page 3 and Appendix A for further detail.]
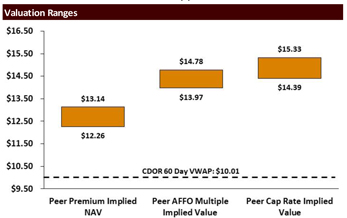
A valuation analysis indicates to management that Condor appears to be undervalued in the marketplace today. As shown in the below graph, three commonly-used valuation methodologies indicate a value estimate for Condor common stock [CDOR] to be between $12.26 and $15.33 per share, substantially higher than its 60-day VWAP price of $10.01 as of December 31, 2017. A discussion of the methodologies with calculations is included in Appendix A.
2018 Outlook [Appendix B for further detail.]
Condor expects its portfolio of high-quality, select-service assets with an average age of 4 years to continue to outperform in 2018. Condor’s forecasted 2018 RevPAR growth of 3.0% to 4.5% is greater than STR and CBRE 2018 U.S. RevPAR forecasts of 2.2% and 2.6%, respectively.
| 2018 Outlook (Millions, except per share amounts) |
Low | High | ||||||
| RevPAR Growth (13 New Investment Platform Hotels owned as of 12.31.2017) |
3.0 | % | 4.5 | % | ||||
| 2018 Outlook for 17-Hotel Portfolio |
||||||||
| Forecast Hotel Revenue |
$ | 74.0 | $ | 75.4 | ||||
| Forecast Net Earnings |
$ | 1.7 | $ | 2.5 | ||||
| Forecast Earnings Per Share - Diluted |
$ | 0.09 | $ | 0.16 | ||||
| Forecast Hotel EBITDA* |
$ | 28.8 | $ | 29.7 | ||||
| Forecast AFFO / Common Share and Partnership Unit - Diluted* |
$ | 1.13 | $ | 1.19 | ||||
| * | See Appendix for reconciliation to GAAP measures |
2018 Portfolio
Condor’s management believes the transitioned portfolio is poised for scale and growth in 2018. The outlook provided, excluding Revenue per Available Room [RevPAR], is forecast for Condor’s portfolio comprised of 15 premium-branded, select-service NIP assets (inclusive of two currently under contract) and two legacy assets. As previously communicated, the two remaining legacy assets are higher-quality legacy hotels that are being retained in order to maximize the potential sale prices of the assets.
| # |
Hotel Brand |
City |
State | Rooms | Acquisition Date | Age (yrs) | ||||||||||||||
| New Investment Platform | Owned as of Year-End 2017 |
|
|||||||||||||||||||
| 1 |
Hilton Garden Inn | Dowell/Solomons | MD | 100 | 5/25/2012 | 11 | ||||||||||||||
| 2 |
SpringHill Suites | San Antonio | TX | 116 | 10/1/2015 | 4 | ||||||||||||||
| 3 |
Courtyard by Marriott | Jacksonville | FL | 120 | 10/2/2015 | 4 | ||||||||||||||
| 4 |
Hotel Indigo | College Park | GA | 142 | 10/2/2015 | 8 | ||||||||||||||
| 5 |
Aloft | Atlanta | GA | 254 | 8/22/2016 | 4 | ||||||||||||||
| 6 |
Aloft | Leawood | KS | 156 | 12/14/2016 | 9 | ||||||||||||||
| 7 |
Home2 Suites | Lexington | KY | 103 | 3/24/2017 | 3 | ||||||||||||||
| 8 |
Home2 Suites | Round Rock | TX | 91 | 3/24/2017 | 3 | ||||||||||||||
| 9 |
Home2 Suites | Tallahassee | FL | 132 | 3/24/2017 | 3 | ||||||||||||||
| 10 |
Home2 Suites | Southaven | MS | 105 | 4/14/2017 | 5 | ||||||||||||||
| 11 |
Hampton Inn and Suites | Lake Mary | FL | 130 | 6/19/2017 | 2 | ||||||||||||||
| 12 |
Fairfield Inn and Suites | El Paso | TX | 124 | 8/31/2017 | 3 | ||||||||||||||
| 13 |
Residence Inn | Austin | TX | 120 | 8/31/2017 | 2 | ||||||||||||||
| Acquisitions Under Contract | Expected Close in 1Q18 |
|
|||||||||||||||||||
| 14 |
TownePlace Suites | Austin | TX | 122 | Expected 1Q18 | 1 | ||||||||||||||
| 15 |
Home2 Suites | Summerville | SC | 93 | Expected 1Q18 | 1 | ||||||||||||||
|
|
|
|||||||||||||||||||
| Legacy Hotels | Assumed Held for FY2018 |
|
NIP Average Age | 4 yrs | |||||||||||||||||
| 16 |
Quality Inn | Solomons | MD | 59 | N/A | N/A | ||||||||||||||
| 17 |
Super 8 | Creston | IA | 121 | N/A | N/A | ||||||||||||||
|
|
|
|||||||||||||||||||
| Total Forecast Portfolio |
2,088 | |||||||||||||||||||
|
|
|
|||||||||||||||||||
2017 Outperformance
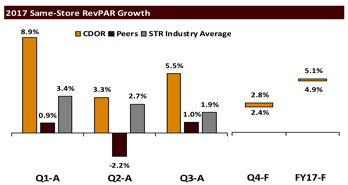
Condor’s new investment platform hotels achieved positive RevPAR growth in every quarter of 2017. FY2017 RevPAR growth for the same-store new investment platform hotels is estimated to be 4.9% to 5.1%. STR forecasts U.S. RevPAR in 2017 to be 2.5%. Condor’s fourth quarter RevPAR growth is estimated to be 2.4% to 2.8%.

Valuation Methodologies
Further detail on the valuation methodologies can be found in Appendix B. All valuations are based on the 2018 Outlook Forecast numbers for the 17-hotel portfolio. Appendix C details the calculation of all peer metrics, including Net Asset Value [NAV] premium, Adjusted Funds From Operations [AFFO] multiple, and implied cap rate.
[A] Peer Premium NAV Implied Valuation:
The table to the right details management’s perspective on the NAV of the 2018 portfolio. Management estimates that the NAV/share of the portfolio is between $12.22 and $13.09. This estimate is based on an 8% cap rate assumption for the new investment platform hotels and a 2.7x revenue multiple for the remaining two legacy assets, a cap rate and revenue multiple that management believes are reasonable and conservative. Management expects one of the legacy assets, the Quality Inn Solomons, to trade at a higher multiple due to the attractive redevelopment opportunity of the land and marina, and management believes the Atlanta Aloft likely has a substantially higher value than that attributed by an 8% cap rate given the recent market sales comparables.
Condor’s 60-day VWAP of $10.01 as of December 31, 2017 indicates to management that Condor trades at a discount in excess of 20% to its NAV while its peer group is currently trading at a premium. If Condor traded in line with the NAV premium of its peer group, CDOR stock price range would be $12.26 to $13.14, a substantially higher value than the current trading price.
Peer Premium NAV Implied Valuation Calculation:
| NAV (Millions, except per share amounts) |
Low | High | ||||||
| New Investment Platform Forecast 2018 NOI (15 Hotels) |
$ | 24.9 | $ | 25.6 | ||||
| Cap Rate |
8.0 | % | 8.0 | % | ||||
|
|
|
|
|
|||||
| New Investment Platform Value |
$ | 311.1 | $ | 320.2 | ||||
| Legacy Value [1] |
$ | 9.1 | $ | 9.6 | ||||
|
|
|
|
|
|||||
| Total Gross Asset Value |
$ | 320.2 | $ | 329.8 | ||||
|
|
|
|
|
|||||
| Net Asset Value (NAV) / Share |
$ | 12.22 | $ | 13.09 | ||||
|
|
|
|
|
|||||
| Average Peer Premium / Discount to NAV [2] |
0.3 | % | 0.3 | % | ||||
|
|
|
|
|
|||||
| Implied CDOR Price Based on Peer Average |
$ | 12.26 | $ | 13.14 | ||||
|
|
|
|
|
|||||
| 1 | | Represents a 2.7x revenue multiple on expected 2018 revenue for the two remaining legacy hotels held for use. |
| 2 | | Represents peer premium to Net Asset Value based on consensus NAV from S&P Global Market Intelligence and the 60-day trailing volume weighted average trading price as of 12/31/2017. |
[B] Peer AFFO Multiple Implied Valuation:
Management believes Condor’s 17-hotel portfolio will generate approximately $1.13 to $1.19 of AFFO in 2018. This indicates to management that Condor is currently trading at an 8.4x to 8.9x AFFO trading multiple, a substantial discount to its peer group average of 12.4x.
Applying the current peer average AFFO multiple to Condor’s 2018 AFFO range indicates a fair value of CDOR stock of $13.97 to $14.78, a substantially higher value than the current trading price.
Peer AFFO Multiple Implied Valuation Calculation:
| Adjusted Funds from Operations (AFFO) Valuation Analysis |
Low | High | ||||||
| CDOR 2018 Forecast AFFO / Diluted Share |
$ | 1.13 | $ | 1.19 | ||||
| CDOR VWA 60 Day Trading Price |
$ | 10.01 | $ | 10.01 | ||||
|
|
|
|
|
|||||
| Current CDOR Price / AFFO Multiple |
8.9 | x | 8.4 | x | ||||
| Peer Average Price / AFFO Multiple [1] |
12.4 | x | 12.4 | x | ||||
|
|
|
|
|
|||||
| Implied CDOR Price Based on Peer Average |
$ | 13.97 | $ | 14.78 | ||||
|
|
|
|
|
|||||
| 1 | | Represents peer trailing 60-day volume weighted average trading price as of 12/31/2017 to consensus 2018 AFFO per share estimates from S&P Global Market Intelligence. |
[C] Peer Cap Rate Implied Valuation:
Management forecasts Condor’s 2018 NOI for the 15-hotel NIP portfolio to be $24.9 to $25.6 million. Condor’s peers currently trade at an average implied cap rate of 7.3%. Applying this cap rate to Condor’s forecast NIP 2018 NOI, and adding an estimate for the value of the two legacy hotels, results in a value of CDOR stock of $14.39 to $15.33, a substantially higher value than Condor’s current trading price.
Attractive Dividend Yield and Coverage
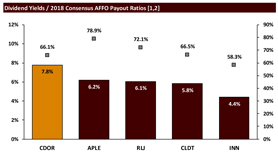
Condor’s annualized dividend of $0.78/share, paid quarterly, represents an attractive yield of 7.8%, currently the highest yield of its peer group. Importantly, this dividend is fully-covered by operating income and represents only a 66.1% AFFO payout ratio based on 2018 Forecasted AFFO/share.
Peer Cap Rate Implied Valuation Calculation:
| Implied Cap Rate Valuation Analysis (Millions, except per share amounts) |
Low | High | ||||||
| Forecast 2018 NOI New Investment Platform (15 Hotels) [1] |
$ | 24.9 | $ | 25.6 | ||||
|
|
|
|
|
|||||
| Gross Asset Value New Investment Platform |
$ | 311.1 | $ | 320.2 | ||||
| CDOR Applied Cap Rate |
8.0 | % | 8.0 | % | ||||
| Peer Average Implied Cap Rate [2] |
7.3 | % | 7.3 | % | ||||
|
|
|
|
|
|||||
| Implied CDOR NIP Gross Value Based on Peer Implied Cap Rate |
$ | 338.6 | $ | 348.5 | ||||
| Gross Asset Value Legacy Hotels |
$ | 9.1 | $ | 9.6 | ||||
| Less: Net Debt [3] |
$ | 165.1 | $ | 163.6 | ||||
|
|
|
|
|
|||||
| Implied Equity Value |
$ | 182.6 | $ | 194.5 | ||||
|
|
|
|
|
|||||
| Implied Condor Price Based on Peer Average |
$ | 14.39 | $ | 15.33 | ||||
|
|
|
|
|
|||||
| 1 | | Represents the Forecast Hotel EBITDA of the 15 new investment platform hotels less a 4% capex reserve based on the total revenue of these hotels. |
| 2 | | Represents weighted-average peer implied cap rate based on consensus NOI estimates from S&P Global Market Intelligence and enterprise value. |
| 1 | | Dividend yield is based on the most recent quarterly per share common dividend annualized and the 60-day trailing volume weighted average trading price as of 12/31/2017. |
| 2 | | Represents Condor’s guided Adjusted Funds from Operations per basic share midpoint and consensus 2018 Adjusted Funds from Operations estimates for Condor’s peers. |
| * | Management believes the entities listed on Appendix C to be Condor’s primary publicly-traded hotel REIT peers. |

Forward-Looking Information
The information contained within this document includes certain estimates, projections, and other forward-looking information as specified in the Private Securities Litigation Reform Act of 1995, and, as such, including the use of “believes,” “indicates,” “expects,” “desires,” and “estimates,” may involve known and unknown risks, uncertainties, and other factors that may cause the actual events, results, or performance to differ from those presented in the forward-looking statement. As you read and consider this document, you should understand that these statements are not guarantees of events, performance, or results. They involve risks, uncertainties (some of which are beyond the Company’s control), and assumptions. These forward-looking statements are based on assumptions that management has made in light of experience in the business in which the Company operates, as well as other factors management believes to be appropriate under the circumstances, including:
| • | forecasts are based on 11,833,573 shares of common stock outstanding as of December 31, 2017, and the forecasts may be materially affected by any future capital raises or acquisitions, |
| • | current outlook, including assuming RevPAR growth of 3.0% to 4.5% on the thirteen new investment platform hotels owned on December 31, 2017, |
| • | views and plans with respect to future events, |
| • | legislative and regulatory developments, |
| • | strategy, to acquire and own premium-branded upper-midscale and upscale select-service hotels, |
| • | capital expenditures, |
| • | dividend strategies, |
| • | effective tax rates, |
| • | financial performance and assumptions, |
| • | financial assumptions, |
| • | business model, |
| • | balance sheet, and |
| • | cash flow plans. |
Although management believes that these forward-looking statements are based on reasonable assumptions, you should be aware that many factors could affect events, performance, or results and cause them to differ materially from those anticipated in the forward-looking statements. These factors include, among other things, risk factors described from time to time in the Company’s filings with the Securities and Exchange Commission. The Company cautions that any forward-looking statement included in this document is made as of the date of this document and the Company does not undertake to update any forward-looking statement.

Appendix A | Detailed Valuation Methodology Tables
[A] Peer Premium Implied NAV Valuation:
| Condor NAV (Millions, except per share amounts) |
Low | High | ||||||
| New Investment Platform (15 Hotels) |
||||||||
| Forecast 2018 NOI [1] |
$ | 24.9 | $ | 25.6 | ||||
| Cap Rate |
8.0 | % | 8.0 | % | ||||
|
|
|
|
|
|||||
| Gross Asset Value New Investment Platform |
$ | 311.1 | $ | 320.2 | ||||
| Legacy Hotels (2 Hotels) |
||||||||
| Forecast 2018 Revenue |
$ | 3.4 | $ | 3.5 | ||||
| Revenue Multiple |
2.7 | x | 2.7 | x | ||||
|
|
|
|
|
|||||
| Gross Asset Value Legacy Hotels |
$ | 9.1 | $ | 9.6 | ||||
| Total Gross Asset Value |
$ | 320.2 | $ | 329.8 | ||||
| Year-End 2018 Cash |
$ | 6.2 | $ | 7.0 | ||||
| Year-End 2018 Debt Outstanding (Excluding IRSA Convertible Debt) |
$ | 171.3 | $ | 170.7 | ||||
| Less: Year-End 2018 Net Debt [2] |
$ | 165.1 | $ | 163.6 | ||||
|
|
|
|
|
|||||
| Net Asset Value (NAV) |
$ | 155.1 | $ | 166.1 | ||||
|
|
|
|
|
|||||
| Fully Diluted Shares Outstanding |
12.7 | 12.7 | ||||||
|
|
|
|
|
|||||
| Net Asset Value / Share |
$ | 12.22 | $ | 13.09 | ||||
|
|
|
|
|
|||||
| Peer Implied NAV Valuation Analysis |
Low | High | ||||||
| Net Asset Value / Share |
$ | 12.22 | $ | 13.09 | ||||
|
|
|
|
|
|||||
| CDOR 60-Day Volume Weighted Average (VWA) Trading Price (12.31.2017) |
$ | 10.01 | $ | 10.01 | ||||
| CDOR Discount to NAV |
-18.1 | % | -23.6 | % | ||||
| Average Peer Premium / Discount to NAV [3] |
0.3 | % | 0.3 | % | ||||
|
|
|
|
|
|||||
| Implied CDOR Price Based on Peer Average |
$ | 12.26 | $ | 13.14 | ||||
|
|
|
|
|
|||||
| 1 | | Represents the Forecast Hotel EBITDA of the 15 new investment platform hotels less a 4% capex reserve based on the total revenue of these hotels. |
| 2 | | Represents Year-End 2018 Debt Outstanding (Excluding IRSA Convertible Debt of $1.012 million) less estimated Year-End 2018 Cash. |
| 3 | | Represents peer premium to net asset value based on consensus NAV from S&P Global Market Intelligence and the 60-day trailing volume weighted average trading price as of 12/31/2017. |

Appendix A | Detailed Valuation Methodology Tables [continued]
[B] Peer AFFO Multiple Implied Valuation:
| Adjusted Funds from Operations (AFFO) Valuation Analysis |
Low | High | ||||||
| CDOR 2018 Forecast AFFO / Diluted Share |
$ | 1.13 | $ | 1.19 | ||||
| CDOR VWA 60 Day Trading Price |
$ | 10.01 | $ | 10.01 | ||||
|
|
|
|
|
|||||
| Current CDOR Price / AFFO Multiple |
8.9 | x | 8.4 | x | ||||
| Peer Average Price / AFFO Multiple [1] |
12.4 | x | 12.4 | x | ||||
|
|
|
|
|
|||||
| Implied CDOR Price Based on Peer Average |
$ | 13.97 | $ | 14.78 | ||||
|
|
|
|
|
|||||
| 1 | | Represents peer trailing 60-day volume weighted average trading price as of 12/31/2017 to consensus 2018 AFFO per share estimates from S&P Global Market Intelligence. |
[C] Peer Cap Rate Implied Valuation:
| Implied Cap Rate Valuation Analysis (Millions, except per share amounts) |
Low | High | ||||||
| Forecast 2018 NOI New Investment Platform (15 Hotels) [1] |
$ | 24.9 | $ | 25.6 | ||||
|
|
|
|
|
|||||
| Gross Asset Value New Investment Platform |
$ | 311.1 | $ | 320.2 | ||||
| CDOR Applied Cap Rate |
8.0 | % | 8.0 | % | ||||
| Peer Average Implied Cap Rate [2] |
7.3 | % | 7.3 | % | ||||
|
|
|
|
|
|||||
| Implied CDOR NIP Gross Value Based on Peer Implied Cap Rate |
$ | 338.6 | $ | 348.5 | ||||
| Gross Asset Value Legacy Hotels |
$ | 9.1 | $ | 9.6 | ||||
| Less: Net Debt [3] |
$ | 165.1 | $ | 163.6 | ||||
|
|
|
|
|
|||||
| Implied Equity Value |
$ | 182.6 | $ | 194.5 | ||||
|
|
|
|
|
|||||
| Implied Condor Price Based on Peer Average |
$ | 14.39 | $ | 15.33 | ||||
|
|
|
|
|
|||||
| 1 | | Represents the Forecast Hotel EBITDA of all 15 new investment platform hotels less a 4% capex reserve based on the total revenue of these hotels. |
| 2 | | Represents weighted-average peer implied cap rate based on consensus NOI estimates from S&P Global Market Intelligence and enterprise value. |
| 3 | | Represents Year-End 2018 Debt Outstanding (Excluding IRSA Convertible Debt of $1.012 million) less estimated Year-End 2018 Cash. |

Appendix B | Detailed 2018 Outlook
| 2018 Outlook (Millions, except per share amounts) |
Low | High | ||||||
| RevPAR Growth (13 New Investment Platform Hotels owned as of 12.31.2017) |
3.0 | % | 4.5 | % | ||||
| Hotel Revenue |
||||||||
| New Investment Platform (13 Hotels) |
$ | 63.8 | $ | 64.6 | ||||
| 2018 Acquisitions (2 Hotels) |
$ | 6.9 | $ | 7.2 | ||||
| Legacy (2 Hotels) |
$ | 3.4 | $ | 3.5 | ||||
|
|
|
|
|
|||||
| Forecast Hotel Revenue (17 Hotels) |
$ | 74.0 | $ | 75.4 | ||||
| Hotel EBITDA |
||||||||
| New Investment Platform (13 Hotels) |
$ | 25.0 | $ | 25.7 | ||||
| 2018 Acquisitions (2 Hotels) |
$ | 2.7 | $ | 2.8 | ||||
| Legacy (2 Hotels) |
$ | 1.1 | $ | 1.2 | ||||
|
|
|
|
|
|||||
| Forecast Hotel EBITDA |
$ | 28.8 | $ | 29.7 | ||||
| Cash General & Administrative (G&A) and Other Expenses [1] |
$ | 6.3 | $ | 6.3 | ||||
|
|
|
|
|
|||||
| Forecast Adjusted EBITDA |
$ | 22.5 | $ | 23.4 | ||||
| Cash Interest Expense |
$ | 8.3 | $ | 8.3 | ||||
| Preferred Dividends |
$ | 0.6 | $ | 0.6 | ||||
|
|
|
|
|
|||||
| AFFO Available to Common Shares & Partnership Units - Basic |
$ | 13.7 | $ | 14.5 | ||||
| Forecast AFFO / Common Share and Partnership Unit - Basic |
$ | 1.15 | $ | 1.21 | ||||
| Common Shares & Partnership Units [2] |
11.9 | 11.9 | ||||||
|
|
|
|
|
|||||
| AFFO Available to Common Shares & Partnership Units - Diluted |
$ | 14.3 | $ | 15.1 | ||||
| Forecast AFFO / Common Share and Partnership Unit - Diluted |
$ | 1.13 | $ | 1.19 | ||||
| Diluted Common Shares & Partnership Units [3] |
12.7 | 12.7 | ||||||
| 1 | | Represents general and administrative expenses, unallocated hotel expenses, and other expense (income), excludes stock compensation |
| 2 | | Common shares and units include common shares as of 12/31/2017 and outstanding common stock equivalent partnership units. |
| 3 | | Diluted common shares and partnership units include common shares as of 12/31/2017, outstanding common stock equivalent partnership units, the common stock equivalent conversion of the Series E preferred shares, and common stock equivalent of the Series D Convertible Note shares. |

Appendix C | Peer Valuation Metrics
| Peer Data |
VWA Price [1] | NAV [2] | Shares (M) | P/NAV | 2018 AFFO [3] | P/AFFO | Dividend [4] | Yield | AFFO Payout | 2018 Hotel NOI (M) | EV (M) | Implied Cap Rate | ||||||||||||||||||||||||||||||||||||
| Condor Hospitality Trust, Inc. (CDOR) |
$ | 10.01 | $ | 12.66 | 12.7 | 79.1 | % | $ | 1.16 | 8.6x | $ | 0.78 | 7.8 | % | 67.3 | % | $ | 25.3 | $ | 316 | 8.0 | % | ||||||||||||||||||||||||||
| Apple Hospitality REIT, Inc. (APLE) |
$ | 19.37 | $ | 18.61 | 223.1 | 104.1 | % | $ | 1.52 | 12.7x | $ | 1.20 | 6.2 | % | 78.9 | % | $ | 413.0 | $ | 5,664 | 7.3 | % | ||||||||||||||||||||||||||
| Chatham Lodging Trust (CLDT) |
$ | 22.64 | $ | 19.76 | 39.8 | 114.6 | % | $ | 1.99 | 11.4x | $ | 1.32 | 5.8 | % | 66.5 | % | $ | 121.3 | $ | 1,497 | 8.1 | % | ||||||||||||||||||||||||||
| Summit Hotel Properties (INN) |
$ | 15.45 | $ | 14.43 | 104.7 | 107.1 | % | $ | 1.17 | 13.2x | $ | 0.68 | 4.4 | % | 58.3 | % | $ | 187.5 | $ | 2,543 | 7.4 | % | ||||||||||||||||||||||||||
| RLJ Lodging Trust (RLJ) |
$ | 21.76 | $ | 23.77 | 175.7 | 91.5 | % | $ | 1.83 | 11.9x | $ | 1.32 | 6.1 | % | 72.1 | % | $ | 490.9 | $ | 6,796 | 7.2 | % | ||||||||||||||||||||||||||
|
|
|
|
|
|
|
|
|
|
|
|
|
|
|
|
|
|
|
|
|
|
|
|
|
|||||||||||||||||||||||||
| Weighted Peer Average |
$ | 19.62 | $ | 19.56 | 543.3 | 100.3 | % | $ | 1.59 | 12.4x | $ | 1.15 | 5.8 | % | 72.3 | % | $ | 1,212.7 | $ | 16,500 | 7.3 | % | ||||||||||||||||||||||||||
|
|
|
|
|
|
|
|
|
|
|
|
|
|
|
|
|
|
|
|
|
|
|
|
|
|||||||||||||||||||||||||
Data From S&P Global Market Intelligence
| 1 | | Represents trailing 60-day volume weighted average price as of 12/31/2017. |
| 2 | | Represents Condor’s guided net asset value midpoint and consensus net asset value for Condor’s peers. |
| 3 | | Represents Condor’s guided adjusted funds from operations midpoint and consensus 2018 adjusted funds from operations estimates for Condor’s peers. |
| 4 | | Represents most recent quarterly per share common dividend annualized. |

Appendix D | Reconciliation of Non-GAAP Measures
Non-GAAP Financial Measures
Non-GAAP financial measures are measures of our historical financial performance that are different from measures calculated and presented in accordance with accounting principles generally accepted in the United States of America (“GAAP”). We report Funds from Operations (“FFO”), Adjusted FFO (“AFFO”), Earnings Before Interest, Taxes, Depreciation, and Amortization (“EBITDA”), Adjusted EBITDA, and Hotel EBITDA, and Net Operating Income (“NOI”) as non-GAAP measures that we believe are useful to investors as key measures of our operating results and which management uses to facilitate a periodic evaluation of our operating results relative to those of our peers. Our non-GAAP measures should not be considered as an alternative to U.S. GAAP net earnings as an indication of financial performance or to U.S. GAAP cash flows from operating activities as a measure of liquidity. Additionally, these measures are not indicative of funds available to fund cash needs or our ability to make cash distributions as they have not been adjusted to consider cash requirements for capital expenditures, property acquisitions, debt service obligations, or other commitments.
We have also presented financial measures that take into account certain estimates on the timing of planned acquisitions and dispositions throughout 2018.
All amounts presented include our portion of the results of our unconsolidated Atlanta JV.
Earnings Before Interest, Taxes, Depreciation, and Amortization (“EBITDA”), Adjusted EBITDA, Hotel EBITDA, and Net Operating Income (“NOI”)
We calculate EBITDA and Adjusted EBITDA by adding back to net earnings or loss certain non-operating expenses and certain non-cash charges which are based on historical cost accounting that we believe may be of limited significance in evaluating current performance. We believe these adjustments can help eliminate the accounting effects of depreciation and amortization and financing decisions and facilitate comparisons of core operating profitability between periods. In calculating EBITDA, we add back to net earnings or loss interest expense, gain or loss on the disposal of assets, and depreciation and amortization expense. In calculating Adjusted EBITDA, we adjust EBITDA to add back acquisition expense, which is a cash charge, and stock –based compensation expense and the amortization of certain fees, which are non-cash charges. EBITDA and Adjusted EBITDA, as presented, may not be comparable to similarly titled measures of other companies.
We believe EBITDA and Adjusted EBITDA to be useful additional measures of our operating performance, excluding the impact of our capital structure (primarily interest expense), our asset base (primarily depreciation and amortization expense), and other items we do not believe are representative of the results from our core operations.
The Company further excludes general and administrative expenses, other non-operating income or expense, and certain hotel and property operations expenses that are not allocated to individual properties in assessing hotel performance (primarily certain general liability and other insurance costs, land lease costs, and office and banking fees) from Adjusted EBITDA to calculate Hotel EBITDA. The Company then reduces Hotel EBITDA by 4% of revenue to calculate NOI. Hotel EBITDA and NOI, as presented, may not be comparable to similarly titled measures of other companies.
Hotel EBITDA and NOI are intended to isolate property level operational performance over which the Company’s hotel operators have direct control. We believe Hotel EBITDA and NOI are helpful to investors as they better communicate the comparability of our hotels’ operating results for all of the Company’s hotel properties and are used by management to measure the performance of the Company’s hotels and the effectiveness of the operators of the hotels.

Appendix D | Reconciliation of Non-GAAP Measures (continued)
2018 Outlook Forecast EBITDA Reconciliation
| Low | High | |||||||
| Forecast Net Earnings |
$ | 1.7 | $ | 2.5 | ||||
| Interest Expense Including Deferred Financing Costs |
$ | 8.5 | $ | 8.5 | ||||
| Depreciation |
$ | 11.4 | $ | 11.4 | ||||
|
|
|
|
|
|||||
| Forecast EBITDA |
$ | 21.5 | $ | 22.4 | ||||
| Acquisition Costs |
$ | 0.0 | $ | 0.0 | ||||
| Stock Based Compensation |
$ | 1.0 | $ | 1.0 | ||||
| Gain on Disposition |
$ | 0.0 | $ | 0.0 | ||||
|
|
|
|
|
|||||
| Forecast Adjusted EBITDA |
$ | 22.5 | $ | 23.4 | ||||
| Cash G&A and Other Expenses |
$ | 6.3 | $ | 6.3 | ||||
|
|
|
|
|
|||||
| Forecast Hotel EBITDA (17 Hotels) |
$ | 28.8 | $ | 29.7 | ||||
|
|
|
|
|
|||||
| Forecast Hotel Revenue (17 Hotels) |
$ | 74.0 | $ | 75.4 | ||||
| Forecast Hotel EBITDA |
$ | 28.8 | $ | 29.7 | ||||
| Less: Capex Reserves (4% of Hotel Revenue) |
$ | 3.0 | $ | 3.0 | ||||
|
|
|
|
|
|||||
| Forecast 2018 NOI (17 Hotels) |
$ | 25.9 | $ | 26.7 | ||||
|
|
|
|
|
|||||
Disposition/Acquisition Timing-Adjusted 2018 EBITDA Reconciliation
Disposition/acquisition timing-adjusted measures take into consideration the estimated timing of acquisitions and dispositions throughout 2018.
| Low | High | |||||||
| Net Earnings |
$ | 3.3 | $ | 4.2 | ||||
| Interest Expense Including Deferred Financing Costs |
$ | 8.3 | $ | 8.3 | ||||
| Depreciation |
$ | 11.4 | $ | 11.4 | ||||
|
|
|
|
|
|||||
| EBITDA |
$ | 23.0 | $ | 23.8 | ||||
| Acquisition Costs |
$ | 0.4 | $ | 0.4 | ||||
| Stock Based Compensation |
$ | 1.0 | $ | 1.0 | ||||
| Gain on Disposition |
($ | 2.3 | ) | ($ | 2.3 | ) | ||
|
|
|
|
|
|||||
| Adjusted EBITDA |
$ | 22.1 | $ | 23.0 | ||||
| Cash G&A and Other Expenses |
$ | 6.3 | $ | 6.3 | ||||
|
|
|
|
|
|||||
| Hotel EBITDA |
$ | 28.4 | $ | 29.3 | ||||
|
|
|
|
|
|||||
| Hotel Revenue |
$ | 73.6 | $ | 75.0 | ||||
| Hotel EBITDA |
$ | 28.4 | $ | 29.3 | ||||
| Less: Capex Reserves (4% of Hotel Revenue) |
$ | 2.9 | $ | 3.0 | ||||
|
|
|
|
|
|||||
| Disposition/Acquisition Timing-Adjusted 2018 NOI (17 Hotels) |
$ | 25.5 | $ | 26.3 | ||||
|
|
|
|
|
|||||

Appendix D | Reconciliation of Non-GAAP Measures (continued)
Funds from Operations (“FFO”) and Adjusted FFO (“AFFO”)
We calculate FFO in accordance with the standards established by the National Association of Real Estate Investment Trusts (“NAREIT”), which defines FFO as net earnings or loss computed in accordance with GAAP, excluding gains or losses from sales of real estate assets and the depreciation and amortization of real estate assets. FFO is calculated both for the Company in total and as FFO attributable to common shares and partnership units, which is FFO reduced by preferred stock dividends. AFFO is FFO attributable to common shares and partnership units adjusted to exclude items we do not believe are representative of the results from our core operations, including non-cash stock-based compensation expense and the amortization of certain fees, and cash charges for acquisition costs. All REITs do not calculate FFO and AFFO in the same manner; therefore, our calculation may not be the same as the calculation of FFO and AFFO for similar REITs.
We consider FFO to be a useful additional measure of performance for an equity REIT because it facilitates an understanding of the operating performance of our properties without giving effect to real estate depreciation and amortization, which assumes that the value of real estate assets diminishes predictably over time. Since real estate values have historically risen or fallen with market conditions, we believe that FFO provides a meaningful indication of our performance. We believe that AFFO provides useful supplemental information to investors regarding our ongoing operating performance that, when considered with net income and FFO, is beneficial to an investor’s understanding of our operating performance.
2018 Outlook Forecast AFFO Reconciliation
| Low | High | |||||||
| Forecast Net Earnings |
$ | 1.7 | $ | 2.5 | ||||
| Depreciation |
$ | 11.4 | $ | 11.4 | ||||
| Gain on Disposition |
$ | 0.0 | $ | 0.0 | ||||
|
|
|
|
|
|||||
| Forecast FFO |
$ | 13.1 | $ | 13.9 | ||||
| Preferred Dividends |
($ | 0.6 | ) | ($ | 0.6 | ) | ||
|
|
|
|
|
|||||
| Forecast FFO Available to Common Shares and Partnership Units |
$ | 12.5 | $ | 13.3 | ||||
| Acquisition Expense |
$ | 0.0 | $ | 0.0 | ||||
| Stock Based Compensation |
$ | 1.0 | $ | 1.0 | ||||
| Amortization of Deferred Financing Costs |
$ | 0.2 | $ | 0.2 | ||||
|
|
|
|
|
|||||
| Forecast AFFO Attributable to Common Shares and Partnership Units |
$ | 13.7 | $ | 14.5 | ||||
|
|
|
|
|
|||||
Disposition/Acquisition Timing-Adjusted 2018 AFFO Reconciliation
Disposition/Acquisition timing-adjusted measures take into consideration the estimated timing of acquisitions and dispositions throughout 2018.
| Low | High | |||||||
| Net Earnings |
$ | 3.3 | $ | 4.2 | ||||
| Depreciation |
$ | 11.4 | $ | 11.4 | ||||
| Gain on Disposition |
($ | 2.3 | ) | ($ | 2.3 | ) | ||
|
|
|
|
|
|||||
| FFO |
$ | 12.4 | $ | 13.3 | ||||
| Preferred Dividends |
($ | 0.6 | ) | ($ | 0.6 | ) | ||
|
|
|
|
|
|||||
| FFO Available to Common Shares and Partnership Units |
$ | 11.9 | $ | 12.7 | ||||
| Acquisition Expense |
$ | 0.4 | $ | 0.4 | ||||
| Stock Based Compensation |
$ | 1.0 | $ | 1.0 | ||||
| Amortization of Deferred Financing Costs |
$ | 0.2 | $ | 0.2 | ||||
|
|
|
|
|
|||||
| AFFO Attributable to Common Shares and Partnership Units |
$ | 13.4 | $ | 14.3 | ||||
|
|
|
|
|
|||||

Appendix D | Reconciliation of Non-GAAP Measures (continued)
Key Assumptions Related to 2018 Forecast and Disposition/Acquisition Timing-Adjusted Figures:
| • | The Forecast 2018 Outlook assumes the following: |
| • | The two acquisitions currently under contract, the TownePlace Suites Austin North Tech Ridge in Austin, Texas and the Home2 Suites by Hilton in Summerville, South Carolina, are acquired on January 1, 2018 |
| • | The three remaining legacy hotels held for sale are assumed sold prior to January 1, 2018 |
| • | The two remaining legacy hotels held for use are held through 2018 |
| • | No additional acquisitions or dispositions in 2018 |
| • | No additional debt or equity raises in 2018 |
| • | $8.3 million of cash interest expense, which excludes deferred financing costs |
| • | The Acquisition/Disposition Timing-Adjusted 2018 Outlook assumes the following: |
| • | The two acquisitions currently under contract, the TownePlace Suites Austin North Tech Ridge and the Home2 Suites by Hilton in Summerville, SC, are acquired within the first quarter of 2018 |
| • | The three remaining legacy hotels held for sale are sold within the first quarter of 2018 |
| • | The two remaining legacy hotels held for use are held through 2018 |
| • | No additional acquisitions or dispositions in 2018 |
| • | No additional debt or equity raises in 2018 |
| • | $8.1 million of cash interest expense, which excludes deferred financing costs |
| • | Both the Forecast 2018 and Acquisition/Disposition Timing-Adjusted 2018 Outlook assume the following: |
| • | $3.2 million of capital expenditures which includes $2.2 million of PIP expense and $1.0 million of recurring, non-revenue enhancing capital expenditures |
| • | Annualized dividend remains $0.78 per common share in 2018 |
| • | No income tax expense |
| • | 12.7 million fully diluted shares when accounting for all partnership units and the potential conversion of the Convertible IRSA Series D debt and the Preferred Series E equity |
| • | Commons shares and units of 11.9 million |
| • | $6.3 million of cash G&A and other expenses, which excludes stock compensation |
| • | $0.6 million of Series E preferred equity expense |
