Attached files
| file | filename |
|---|---|
| EX-32.1 - EX-32.1 - CONDOR HOSPITALITY TRUST, INC. | c545-20161231xex32_1.htm |
| EX-31.2 - EX-31.2 - CONDOR HOSPITALITY TRUST, INC. | c545-20161231xex31_2.htm |
| EX-31.1 - EX-31.1 - CONDOR HOSPITALITY TRUST, INC. | c545-20161231xex31_1.htm |
| EX-23.1 - EX-23.1 - CONDOR HOSPITALITY TRUST, INC. | c545-20161231xex23_1.htm |
| EX-21.0 - EX-21.0 - CONDOR HOSPITALITY TRUST, INC. | c545-20161231xex21_0.htm |
| EX-3.1 - EX-3.1 - CONDOR HOSPITALITY TRUST, INC. | c545-20161231xex3_1.htm |
|
|
UNITED STATES
SECURITIES AND EXCHANGE COMMISSION
WASHINGTON D.C. 20549
FORM 10-K
|
|
(Mark one) |
|
☒ |
ANNUAL REPORT PURSUANT TO SECTION 13 OR 15(d) OF THE SECURITIES EXCHANGE ACT OF 1934 |
|
|
For the fiscal year ended December 31, 2016 |
|
or |
|
|
☐ |
TRANSITION REPORT PURSUANT TO SECTION 13 OR 15(d) OF THE SECURITIES EXCHANGE ACT OF 1934 |
|
|
For the transition period from _______________ to _________________ |
Commission file number: 001-34087
Condor Hospitality Trust, Inc.
(Exact name of registrant as specified in its charter)
|
Maryland |
52-1889548 |
|
(State or other jurisdiction of |
(I.R.S. Employer |
|
incorporation or organization) |
Identification No.) |
|
4800 Montgomery Lane Ste. 220, Bethesda, MD |
20814 |
|
(Address of principal executive offices) |
(Zip Code) |
(301) 861-3305
(Registrant’s telephone number, including area code)
Securities registered pursuant to Section 12(b) of the Act:
|
Title of each class |
|
Name of each exchange on which registered |
|
Common Stock, $.01 par value per share |
|
The NASDAQ Stock Market, LLC |
Securities registered pursuant to Section 12(g) of the Act: None
Indicate by check mark if the registrant is a well-known seasoned issuer, as defined in Rule 405 of the Securities Act. Yes [ ] No [X]
Indicate by check mark if the registrant is not required to file reports pursuant to Section 13 or Section 15(d) of the Exchange Act. Yes [ ] No [X]
Indicate by check mark whether the registrant (1) has filed all reports required to be filed by Section 13 or 15(d) of the Securities Exchange Act of 1934 during the preceding 12 months (or for such shorter period that the registrant was required to file such reports), and (2) has been subject to such filing requirements for the past 90 days. Yes [X] No [ ]
Indicate by check mark whether the registrant has submitted electronically and posted on its corporate Web site, if any, every Interactive Data File required to be submitted and posted pursuant to Rule 405 of Regulation S-T (§232.405 of this chapter) during the preceding 12 months (or for such shorter period that the registrant was required to submit and post such files). Yes [X] No [ ]
Indicate by check mark if disclosure of delinquent filers pursuant to Item 405 of Regulation S-K is not contained herein, and will not be contained, to the best of registrant’s knowledge, in definitive proxy or information statements incorporated by reference in Part III of this Form 10-K or any amendment to this Form 10-K. [X]
Indicate by check mark whether the registrant is a large accelerated filer, an accelerated filer, a non-accelerated filer, or a smaller reporting company. See definition of “accelerated filer and large accelerated filer” in Rule 12b-2 or the Exchange Act.
|
Large accelerated filer [ ] |
Accelerated filer [ ] |
|
|
Non-accelerated filer [ ] (Do not check if a smaller reporting company) |
Smaller reporting company [X] |
|
Indicate by check mark whether the registrant is a shell company (as defined in Rule 12b-2 of the Exchange Act). Yes [ ] No [X]
As of June 30, 2016 the aggregate market value of the registrant’s common stock held by non-affiliates of the registrant was $7.2 million based on the price at which the common stock was last sold on that date as reported on the Nasdaq Global Market. At February 28, 2017, there were 43,993,705 shares of the registrant’s common stock outstanding.
DOCUMENTS INCORPORATED BY REFERENCE
Portions of the Registrant’s definitive Proxy Statement for the Registrant’s 2017 Annual Meeting of Stockholders to be filed within 120 days of the fiscal year ended December 31, 2016, are incorporated into Part III.
|
|
|
|
||
|
|
Form 10-K |
|
|
|
Report |
|
|
Item No. |
Page |
|
|
|
PART I |
|
|
1 |
2 | |
|
1A. |
2 | |
|
1B. |
25 | |
|
2 |
26 | |
|
3 |
26 | |
|
4 |
26 | |
|
|
PART II |
|
|
5 |
27 | |
|
6 |
29 | |
|
7 |
Management’s Discussion and Analysis of Financial Condition and Results of Operations |
31 |
|
7A. |
49 | |
|
8 |
51 | |
|
9 |
Changes in and Disagreements with Accountants on Accounting and Financial Disclosure |
95 |
|
9A. |
95 | |
|
9B. |
95 | |
|
|
PART III |
|
|
10 |
96 | |
|
11 |
96 | |
|
12 |
Security Ownership of Certain Beneficial Owners and Management and Related Stockholder Matters |
96 |
|
13 |
Certain Relationships and Related Transactions, and Director Independence |
96 |
|
14 |
97 | |
|
|
PART IV |
|
|
15 |
97 |
1
Certain information both included and incorporated by reference in this Form 10-K may contain forward-looking statements within the meaning of Section 27A of the Securities Act of 1933, as amended, and Section 21E of the Securities Exchange Act of 1934, as amended, and as such may involve known and unknown risks, uncertainties, and other factors which may cause our actual results, performance, or achievements to be materially different from future results, performance, or achievements expressed or implied by such forward-looking statements. These forward-looking statements are based on assumptions that management has made in light of experience in the business in which we operate, as well as management’s perceptions of historical trends, current conditions, expected future developments, and other factors believed to be appropriate under the circumstances. These statements are not guarantees of performance or results. They involve risks, uncertainties (some of which are beyond our control), and assumptions. Management believes that these forward-looking statements are based on reasonable assumptions.
Forward-looking statements, which are based on certain assumptions and describe our future plans, strategies, and expectations are generally identifiable by use of the words “may,” “will,” “should,” “expect,” “anticipate,” “estimate,” “believe,” “intend,” or “project” or the negative thereof or other variations thereon or comparable terminology. Factors which could have a material adverse effect on our operations and future prospects include, but are not limited to, changes in economic conditions generally and the real estate market specifically, legislative/regulatory changes (including changes to laws governing the taxation of real estate investment trusts), availability of capital, risks associated with debt financing, interest rates, competition, supply and demand for hotel rooms in our current and proposed market areas, policies and guidelines applicable to real estate investment trusts, and other risks and uncertainties described herein, and in our filings with the Securities and Exchange Commission (“SEC”) from time to time. These risks and uncertainties should be considered in evaluating any forward-looking statements contained or incorporated by reference herein. We caution readers not to place undue reliance on any forward-looking statements included in this report which speak only as of the date of this report.
References to “we,” “our,” “us,” and the “Company” refer to Condor Hospitality Trust, Inc., including, as the context requires, its direct and indirect subsidiaries.
Overview
Condor Hospitality Trust, Inc. (“CDOR,” “Condor,” or the “Company”), which until July 15, 2015 was formerly named Supertel Hospitality, Inc., was incorporated in Virginia on August 23, 1994 and was reincorporated in Maryland on November 19, 2014. Our common stock began to trade on the Nasdaq Stock Market on October 30, 1996 and today trades under the symbol “CDOR”.
CDOR is a self-administered real estate investment trust (“REIT”) for federal income tax purposes that specializes in the investment and ownership of high-quality select-service, limited-service, extended stay, and compact full service hotels. As of December 31, 2016, the Company owned 19 hotels, representing 2,047 rooms, in 12 states, including one hotel owned through an 80% interest in an unconsolidated joint venture (the “Atlanta JV”).
Our significant events for 2016 include:
|
· |
On various dates throughout the year, the Company sold 25 hotels for total gross proceeds of $61.4 million and primarily used the net proceeds, after repayment of the underlying loans, to fund acquisitions, to build cash reserves for future hotel acquisitions, and for general corporate purposes. |
|
· |
On March 16, 2016, the Company raised $30.0 million in a private placement transaction with an affiliate of the StepStone Group. The investment, structured as a new Series D Preferred Stock, includes a 6.25% annual dividend, payable quarterly, and may be converted by the holders into shares of the Company’s common stock at a conversion price of $1.60 per share. Simultaneously with StepStone’s Series D Preferred Stock investment, the Company’s outstanding 6.25% Series C Cumulative Convertible Preferred Stock (“Series C Preferred Stock”), all of which was held by Real Estate Strategies L.P. (“RES”), was also
2
|
exchanged for the newly created Series D Preferred Stock. The Company used approximately $20.2 million of the proceeds from the $30.0 million raise to redeem all outstanding 8% Series A Cumulative Preferred Stock (“Series A Preferred Stock”) and 10% Series B Cumulative Preferred Stock (“Series B Preferred Stock”), including all unpaid accrued dividends, on April 15, 2016, resulting in one class of preferred stock for which the Company can require conversion entirely into common stock upon the occurrence of defined capital events. Excess proceeds were utilized by the Company to accelerate the strategic repositioning of its portfolio through the completion of acquisitions. |
|
· |
On May 26, 2016, the Company announced that it had moved its corporate headquarters to Bethesda, Maryland. The new corporate headquarters are located at 4800 Montgomery Lane, Suite 220, Bethesda, Maryland 20814. The Company continues to maintain leased office space in both Omaha and Norfolk, Nebraska. |
|
· |
On July 11, 2016, the Company reinstated common dividends for the first time since 2009. The Company declared a common stock dividend of $0.01 per share for the second quarter of 2016. |
|
· |
On August 22, 2016, the Company closed on the joint venture acquisition of the 254-room Aloft Atlanta located in downtown Atlanta at 300 Spring Street NW, Atlanta, GA. Condor entered into the Atlanta JV with Three Wall Capital (“TWC”), of which Condor owns 80% and TWC owns 20%, to acquire the hotel. The purchase price for the hotel was $43.6 million. The hotel is managed by Boast Hotel Management Company, LLC, an affiliate of TWC. |
|
· |
On September 16, 2016, the Company announced that it increased its common stock dividend to an annualized $0.12 per share for the third quarter of 2016. |
|
· |
On December 8, 2016, the Company declared its fourth quarter dividend of $0.03 per share. |
|
· |
On December 14, 2016, the Company closed on the acquisition of the 156-room Aloft Leawood / Overland Park (Kansas City) located within Park Place Village at 11620 Ash Street, Leawood, KS. The purchase price for the hotel was $22.5 million. The hotel is managed by Presidian Hotel and Resorts. |
Subsequent to the close of 2016, the Company announced the following significant events. These events are further discussed in the Subsequent Events footnote to the consolidated financial statements.
|
· |
On January 23, 2017 the Company executed an agreement to purchase a portfolio of four Home2 Suites hotels for $73.8 million. The portfolio includes the Home2 Suites Memphis / Southaven, the Home2 Suites Austin / Round Rock, the Home 2 Suites Lexington University / Medical Center (Kentucky), and the Home2 Suites Tallahassee State Capitol. The closing of these acquisitions is anticipated to occur in the first quarter of 2017, but is subject to customary closing conditions including accuracy of representations and warrants and compliance with covenants and obligations. |
|
· |
On February 8, 2017, the Company announced that it had received commitment letters from two banks, KeyBank and The Huntington National Bank, for a $90.0 million secured credit facility. This credit facility subsequently closed on March 1, 2017. The new credit facility significantly reduced the Company’s weighted average cost of debt and enabled the refinancing of all 2017 and 2018 maturities. |
|
· |
On February 28, 2017, the holders of the Series D Preferred Stock voluntarily converted their shares into 39,032,225 shares of common stock at $1.60 per share pursuant to the terms of the preferred stock. The terms of the Series D Preferred Stock provided for automatic conversion following certain future common stock offerings, and also provided for potential additional payments to the holders depending on the sales price of common stock in the offerings. As a result of the voluntary conversion, the holders are no longer entitled to the potential payments. To induce the holders of the Series D Preferred Stock to voluntarily convert their shares, the Company issued the holders a $9.3 million of a new series of preferred stock, the Series E Preferred Stock. |
We conduct our business through a traditional umbrella partnership REIT, or UPREIT, in which our hotel properties are owned by our operating partnership, Condor Hospitality Limited Partnership and its subsidiaries (“CHLP”), for which we serve as general partner. As of December 31, 2016, we owned an approximate 97.8% ownership interest in CHLP. In the future, CHLP may issue limited partnership interests to third parties from time to time in connection with our acquisition of hotel properties or the raising of capital. The Company’s 100% owned E&P Financing Limited Partnership no longer owns any assets or conducts any operations following the sale of its last remaining property in January 2016.
3
In order for the income from our hotel property investments to constitute “rents from real properties” for purposes of the gross income tests required by the Internal Revenue Service (“IRS”) for REIT qualification, the income we earn cannot be derived from the operation of any of our hotels. Therefore, CHLP and its subsidiaries lease our hotel properties to the Company’s wholly owned taxable REIT subsidiary, TRS Leasing, Inc., and its wholly owned subsidiaries (“the TRS”). The TRS in turn engages third-party eligible independent contractors to manage the hotels. CHLP, the TRS, and their respective subsidiaries are consolidated into the Company’s financial statements.
We are engaged primarily in the business of owning equity interests in hotel properties and therefore our business is disclosed as one reportable segment. See the consolidated financial statements and notes thereto included in Item 8 of this Annual Report on Form 10-K for certain financial information required in this Item 1.
Mission Statement
Our mission is to provide to our shareholders attractive total returns for the lodging sector through (1) disciplined investment in high-quality select-service, limited-service, extended stay, and compact full service hotels, and (2) intensive asset management to achieve enhanced results.
We achieve this mission through the disciplined and efficient execution of the following Core Strategies:
|
· |
Acquisition Strategy |
|
· |
Disposition Strategy |
|
· |
Asset Management Strategy |
|
· |
Financing Strategy |
We understand that we cannot achieve our mission alone and therefore work with the following independent businesses, who we refer to as Business Partners, in the execution of our mission:
|
· |
Franchise Partners |
|
· |
Hotel Management Company Partners |
Core Strategies
Acquisition Strategy
The objective of our acquisition strategy is to enable us to acquire assets that meet our target property characteristics and investment criteria at attractive valuations. We believe that our existing relationships with owners, operators, and developers of select-service hotels will provide us with access to certain off-market acquisition opportunities ahead of other real estate investors. Typically, off-market transactions lead to more attractive valuation outcomes. Our organizational documents do not limit the types of investments we can make; however, our intent is to execute the acquisition strategy as detailed herein.
We believe our target property characteristics and investment criteria, coupled with our ability to source off-market transactions, differentiates us from our peers and will enable us to achieve our mission to obtain attractive returns to our shareholders.
Target Property Characteristics
Our target properties are high-quality select-service, limited-service, extended stay, and compact full-service hotels located primarily in the top 100 Metropolitan Statistical Areas (“MSAs”), with a focus on the top 21 – 60 MSAs. From time to time, we may acquire assets outside these target MSAs if we are able to acquire the asset at an attractive valuation and have confidence in the value proposition of the property. If within a top 25 MSA, the asset will typically be located within an attractive sub- market of the larger MSA. The hotels we will look to acquire will be franchised under premium flags by brands such as Hilton, Marriott/Starwood, IHG, and Hyatt and operated by third-party management companies.
4
In 2016, we acquired two assets that meet our investment criteria: Aloft Atlanta Downtown and the Aloft Leawood. Subsequent to the close of 2016, we announced our intent to acquire four Home2 Suites hotels in the following markets: Austin-Round Rock (TX), Lexington (KY), Tallahassee (FL), and Memphis-Southaven (MS). We expect to close on the acquisition of these four assets in the first quarter of 2017, subject to customary closing conditions and diligence.
Investment Criteria
We perform thorough due diligence and utilize extensive research to evaluate any target market or property. This due diligence and research may include, but is not limited to, analyzing the long-term economic outlook of an MSA, reviewing trends in local lodging demand and supply, assessing property condition and required capital investment, and understanding historical property financial performance. Specific investment criteria for hotels we are looking to acquire may include but are not limited to:
|
· |
hotels that operate under leading premium franchise brands and possess key attributes such as building design and décor that is consistent with current generation brand standards; |
|
· |
hotels that are located within the top 100 MSAs, in close proximity to multiple demand drivers, including large corporations, regional hospitals, regional business hubs, recreational travel destinations, significant retail centers, and military installations, among others; |
|
· |
hotels that are located within markets that have favorable economic, job growth, and demographic factors; |
|
· |
hotels that have illustrated an ability to generate stabilized and dependable revenue and net operating income; |
|
· |
hotels that were constructed less than ten years prior to our acquisition or have been recently significantly renovated to current brand standards, and have significant time (generally ten or more years) remaining on the existing franchise license; |
|
· |
hotels that have some value-added growth potential through operating efficiencies, institutional asset management, repositioning, renovations, or rebranding; |
|
· |
hotels that can be acquired at a discount to replacement cost; and/or |
|
· |
hotels that can be acquired in off-market transactions. |
Disposition Strategy
We have been engaged in a process of transitioning our portfolio from economy hotels to high-quality select-service, limited-service, extended stay, and compact full service hotels. In order to achieve this objective, we have focused on disposing of legacy assets that do not meet the property characteristics and investment criteria discussed above. Since January 1, 2015, we have sold 42 hotels. The value unlocked from asset sales has been and will continue to be redeployed into newer, higher-quality assets meeting the acquisition strategy discussed above. Just as we carefully evaluate the hotels we plan to acquire, our asset management team has evaluated the timing and composition of the legacy hotels to be disposed of in a manner we believe will maximize returns for our shareholders. We are committed to a disciplined but timely monetization of the legacy assets in order to achieve the strategic repositioning of the portfolio. In 2017, we will continue to dispose of assets that do not fit the new strategic vision of our portfolio and have announced plans to sell seven additional legacy hotels in the first half of 2017.
Additionally, from time to time, we may undertake the sale of one or more hotels that meet the property characteristics and investment criteria discussed above. These disposition decisions are the result of a thorough analysis and typically in response to changes in market conditions, our current or projected return on our investment in the hotel, or other factors which we deem relevant to the disposition decision.
Asset Management Strategy
Through collaboration with our third-party operators, we seek to maximize value to our shareholders through improvements to our existing hotels’ operating results. We work toward this goal by constantly monitoring the performance of each individual hotel and identifying opportunities for value-enhancement through intensive asset management strategies. We will make recommendations to our third-party operators in all aspects of our hotels operations, including revenue management, physical design, guest experience, market positioning, and overall
5
property strategy. Fundamentally, all strategies are focused on growing the revenue of a hotel, controlling expenses, and/or maximizing the guest experience to drive returns.
We work with our third-party operators to develop short- and long-term capital investment plans that are focused on generating positive returns for our shareholders. The capital improvements may involve investments in expansions, additions, renovations, technology upgrades, and/or energy efficiency improvements.
Additionally, from time to time, we may come to the conclusion that a particular asset may provide greater returns to our shareholders after an extensive repositioning of the asset in the market. In these instances, capital investment in a greater amount than typical for an asset may be required to achieve the desired repositioning. These decisions will be made after a thorough analysis of the property, market conditions, and the potential for a positive return on investment that exceeds our investment hurdle rates.
Financing Strategy
Our financing strategy is to seek to minimize the cost of our capital in order to maximize the returns generated for our shareholders. We intend to finance our long-term growth with equity capital raises and debt financings that have staggered maturities. From time to time, when purchasing hotel properties, we may issue limited partnership interests in CHLP to third parties as full or partial consideration to sellers. Currently, our debt includes a recourse line of credit secured by certain hotels and mortgages secured by our hotel properties. In the future we plan on using a revolving credit facility, term loans, equity issuances, and mortgage debt financings to fund future acquisitions as well as for property redevelopments, return on investment initiatives, and working capital requirements.
Business Partners
Franchise Partners
We believe that in order to achieve our mission we must partner with the right franchisors of quality brands in our target segments. To this end, we have built strong relationships with many of who we believe are the leading franchisors of the strongest brands in the segments we target, including Hilton, Marriott/Starwood, IHG, and Hyatt. The franchisors provide a variety of benefits and value which include national advertising, marketing programs to increase brand awareness, personnel training, and centralized reservation systems. We are constantly monitoring and evaluating the performance of these franchisors and their respective brands so that, when necessary, we can adapt our franchise partner strategy to maximize returns to our shareholders.
Under our franchise agreements, we are required to pay franchise fees generally between 3.3% and 5.5% of room revenue, plus additional fees for marketing, central reservation systems, and other franchisor programs and services that amount to between 2.5% and 6.0% of room revenue. The franchise agreements typically have 10 to 25 year terms although certain agreements may be terminated by either party on certain anniversary dates specified in the agreements. Further, each agreement provides for early termination fees in the event the agreement is terminated before the stated term.
6
Our 19 hotels owned at December 31, 2016 operate under the following national and independent brands. Pursuant to our previously discussed strategy, we envision the composition of this brand portfolio to change dramatically as we continue to transition the portfolio.
|
|
||||
|
Franchise Brand |
Number of Hotels |
Number of Rooms |
||
|
Acquired In or Since 2012: |
||||
|
Aloft (1) |
2 | 410 | ||
|
Courtyard by Marriott (1) |
1 | 120 | ||
|
Hilton Garden Inn (2) |
1 | 100 | ||
|
Hotel Indigo (3) |
1 | 142 | ||
|
SpringHill Suites (1) |
1 | 116 | ||
|
Legacy Properties Owned Prior to 2012: |
||||
|
Super 8 (4) |
2 | 227 | ||
|
Comfort Inn/Comfort Suites (5) |
6 | 535 | ||
|
Quality Inn (5) |
2 | 140 | ||
|
Days Inn (4) |
1 | 176 | ||
|
Key West Inn (6) |
1 | 40 | ||
|
Supertel Inn (7)* |
1 | 41 | ||
|
Total |
19 | 2,047 |
(1) Courtyard by Marriott ®, Aloft ®, and SpringHill Suites ® are a registered trademarks of Marriott International
(2) Hilton Garden Inn® is a registered trademark of Hilton Hotels Corporation
(3) Hotel Indigo® is a registered trademark of InterContinental Hotels Group (IHG)
(4) Super 8® and Days Inn ® are registered trademarks of Wyndham Worldwide
(5) Comfort Inn ®, Comfort Suites ®, and Quality Inn® are registered trademarks of Choice Hotels International, Inc.
(6) Key West Inn ® is a registered trademark of Key West Inns
(7) Supertel Inn® is a registered trademark of Condor Hospitality Trust, Inc.
* Independent hotel brand unassociated with a national franchise brand
Hotel Management Company Partners
As a REIT, we are not permitted to directly operate any of our hotels. We partner closely with some of who we believe are the leading hotel management companies in order to operate our hotels with the ultimate objective of improving same-store hotel performance throughout our portfolio. Each management agreement provides for a set term and is subject to early termination upon the occurrence of defaults and certain other events. As required under the REIT qualification rules, each manager must qualify as an “eligible independent contractor” during the term of the management agreement.
7
Our 19 hotels owned at December 31, 2016 are operated by the following third-party management companies:
|
|
||||
|
Management Company |
Number of Hotels |
Number of Rooms |
||
|
Hospitality Management Advisors, Inc. |
7 | 672 | ||
|
Peachtree Hospitality Management, LLC |
3 | 378 | ||
|
Kinseth Hotel Corporation |
3 | 268 | ||
|
K Partners Hotel Management |
2 | 160 | ||
|
Boast Hotel Management Company |
1 | 254 | ||
|
Presidian Hotels |
1 | 156 | ||
|
Cherry Cove Hospitality Management, LLC |
2 | 159 | ||
|
Total |
19 | 2,047 | ||
|
|
Seasonality of Hotel Business
Historically, as a result of the geographic areas in which we operate, the operations of our hotels have been seasonal in nature. Generally, occupancy rates, revenue, and operating income have been greater in the second and third quarters of the calendar year than in the first and fourth quarters, with the exception of our hotels located in Florida, which experience peak demand in the first and fourth quarters of the year. The results of the recently acquired premium-branded select-service hotels, because of their locations and chain scale, are expected to be less seasonal in nature than our legacy portfolio of assets.
Competition
The hotel industry is highly competitive. Each of our hotels is located in a developed area that includes other hotel properties. The number of competitive hotel properties in a particular area could have a material adverse effect on revenue, occupancy, and the average daily room rate of our hotels or of hotel properties acquired in the future, and thus our financial results.
We may compete for investment opportunities with entities that have substantially greater financial resources than us. These entities generally may be able to accept more risk than we can prudently manage. Competition in general may reduce the number of suitable investment opportunities for us and increase the bargaining power of property owners seeking to sell.
Tax Status
The Company qualifies and intends to continue to qualify as a REIT under the applicable provisions of the Internal Revenue Code (the “Code”), as amended. In general, under such Code provisions, a trust which has made the required election and, in the taxable year, meets certain requirements and distributes to its shareholders at least 90% of its REIT taxable income, will not be subject to federal income tax to the extent of the income currently distributed to shareholders. If we fail to qualify as a REIT in any taxable year, we will be subject to federal income tax on our taxable income at regular corporate income tax rates and generally will be unable to re-elect REIT status until the fifth calendar year after the year in which we failed to qualify as a REIT, unless we satisfy certain relief provisions. Even if the Company qualifies for taxation as a REIT, the Company may be subject to certain state and local taxes on its income and property, and to federal income and excise taxes on its undistributed taxable income. Taxable income from non-REIT activities managed through the TRS, which is taxed as a C-Corporation, is subject to federal, state, and local income taxes.
Employees
At December 31, 2016, Condor had 14 employees. The staff at our hotels are employed by our third-party hotel managers.
8
Available Information
Our executive offices are located at 4800 Montgomery Lane, Suite 220, Bethesda, Maryland 20814, our telephone number is (301) 861-3305, and we maintain an Internet website located at www.condorhospitality.com. Our annual reports on Form 10-K and quarterly reports on Form 10-Q, current reports on Form 8-K, and amendments to these reports are available free of charge on our website as soon as reasonably practicable after they are filed with the SEC. We also make available the charters of our board committees and our Code of Business Conduct and Ethics on our website. Copies of these documents are available in print to any shareholder who requests them. Requests should be sent to Condor Hospitality Trust, Inc., 4800 Montgomery Lane, Suite 220, Bethesda, MD 20814, Attn: Corporate Secretary.
The following discussion concerns the risks associated with our business that should be reviewed and considered carefully. Our business faces many risks and the risks described below may not be the only risks we face. Other risks and uncertainties not presently known to us may also materially and adversely affect our business, the value of our shares, and our ability to pay dividends to our shareholders. Additionally, the risks detailed below are interrelated and should be considered as a whole. In connection with the forward-looking statements that appear in this Annual Report on Form 10-K, you should carefully review the section entitled “Forward-Looking Statements.”
For presentation purposes only, we categorize the risk factors into four broad categories:
|
· |
Risk Related to Our Business & Operations |
|
· |
Risks Related to the Hotel Industry |
|
· |
Risks Related to the Real Estate Industry |
|
· |
Risks Related to Our Structure & Organization |
Risks Related to Our Business & Operations
Failure of the economy to improve or remain stable may adversely affect our ability to execute our business strategies, which in turn would adversely affect our ability to make distributions to our stockholders.
Our ability to execute our business strategy is affected by economic conditions, and we cannot assure you that economic fundamentals will improve or remain stable. The housing market collapse and world events outside our control, such as terrorism, have adversely affected the economy in the recent past and contributed to our net losses of $16.3 million, $1.4 million, $10.2 million, and $17.5 million for our 2014, 2013, 2012, and 2011 fiscal years, respectively. If events like these reoccur, they may adversely affect the economy in the future. An economic recession could have a dramatic impact on our financial results. In the event conditions in the economy do not improve or remain stable, our ability to execute our business strategies will be adversely effected, which in turn would adversely affect our ability to make distributions to our stockholders.
The departure of any of our key personnel who have significant experience and relationships in the lodging industry, particularly our Chief Executive Officer, J. William Blackham, could materially and adversely affect us.
We depend on the experience and relationships of our executive officers, especially J. William Blackham, our Chief Executive Officer and a member of our board of directors, to manage our day-to-day operations and strategic business direction. Mr. Blackham has extensive experience in the lodging industry, during which time he has established an extensive network of lodging industry contacts and relationships, including relationships with national hotel brands, hotel owners, financiers, operators, commercial real estate brokers, developers and management companies. We can provide no assurances that Mr. Blackham, or any of our key personnel, will continue their employment with us. The loss of the services of any of the members of our management team, or any difficulty attracting and retaining other talented and experienced personnel, could adversely affect our ability to source potential investment opportunities, our relationship with national hotel brands and other industry participants and the execution of our business strategy. Our ability to replace key individuals may be difficult because of the
9
limited number of individuals with the breadth of skills and experience needed to excel in the hotel industry and there can be no assurance that we would be able to hire, train, retain, or motivate such individuals. Further, such a loss could be negatively perceived by investors, which could reduce the market value of our common shares.
If we are unable to successfully manage our growth, our operating results and financial condition could be adversely affected.
Our ability to implement our new business strategy and grow our business depends upon our senior executive officers’ business contacts and their ability to successfully hire, train, supervise and manage additional personnel.
We may not be able to hire and train sufficient personnel or develop management, information and operating systems suitable for our expected growth. If we are unable to manage any future growth effectively, our operating results and financial condition could be adversely affected.
Our future growth is dependent on obtaining new financing and if we cannot secure financing in the future, our growth will be limited.
The success of our growth strategy will depend on access to capital through use of excess cash flow, borrowings or subsequent issuances of common shares or other securities. Acquisitions of new hotel properties will require significant additional capital and existing hotels will require periodic capital improvement initiatives to remain competitive. We may not be able to fund acquisitions or capital improvements solely from cash provided from our operating activities because we must distribute at least 90% of our taxable income (determined before the deduction for dividends paid and excluding any net capital gains) each year to satisfy the requirements for qualification as a REIT for federal income tax purposes. As a result, our ability to fund capital expenditures for acquisitions through retained earnings is very limited. Our ability to grow through acquisitions of hotels will be limited if we cannot obtain satisfactory debt or equity financing, which will depend on capital markets conditions.
Our lack of industry, brand, and/or geographic diversification could have an adverse effect on results.
Historically, we have exclusively bought ownership interest in hotels in the United States. As a result, we are subject to the risks inherent in investing in a single industry. A downturn in the U.S. hotel industry may have a pronounced effect on the amount of funds available to us for distribution or on the value of Company’s assets. Our business is subject to the risks that are common to the hotel industry and that are out of our control. Additionally, we may face risks associated with any geographic concentration or franchisor concentration.
Our returns depend on management of our hotels by third parties.
In order to qualify as a REIT, we cannot operate any hotel or participate in the decisions effecting the daily operations of any hotel. Under the REIT Modernization Act of 1999, REITs are permitted to lease their hotels to TRSs. However, a TRS, such as our TRS, may not operate or manage the leased hotels and, therefore, must enter into management agreements with third-party eligible independent contractors to manage the hotels. Thus, an independent operator under a management agreement with our TRS controls the daily operations of each of our hotels.
Under the terms of our management agreements, our ability to participate in operating decisions regarding the hotels is limited. We depend on our management companies to adequately operate our hotels as provided in the management agreements. We do not have the authority to require any hotel to be operated in a particular manner or to govern any particular aspect of the daily operations of any hotel (for instance, setting room rates). Thus, even if we believe our hotels are being operated inefficiently or in a manner that does not result in satisfactory occupancy rates, revenue per available room, and average daily rates, we may not be able to force our management companies to change their methods of operation of our hotels. We can only seek redress if a management company violates the terms of the management agreement with our TRS, and then only to the extent of the remedies provided for under the terms of the applicable management agreement. If any of the foregoing occurs at franchised hotels, our relationship with the franchisors may be damaged, and we may be in breach of one or more of our franchise agreements. Additionally, in the event that we need to replace a management company due to the termination of an
10
existing management agreement, we may experience decreased occupancy and other significant disruptions at our hotels and in our operations generally.
We face competition for the acquisition of hotels and we may not be successful in identifying or completing hotel acquisitions that meet our criteria, which may impede our growth.
One component of our business strategy is expansion through acquisitions, and we may not be successful in identifying or completing acquisitions that are consistent with our strategy. We compete with institutional pension funds, private equity investors, other REITs, hotel companies, and others who are engaged in the acquisition of hotels, most of whom have greater financial resources than we do. This competition for hotel investments may increase the price we pay for hotels and these competitors may succeed in acquiring the hotels we seek to acquire. Furthermore, our potential acquisition targets may find our competitors to be more attractive suitors because they may have greater marketing and financial resources, may be willing to pay more, or may have a more compatible operating philosophy. In addition, the number of entities competing for suitable hotels may increase in the future, which would increase demand for these hotels and the prices we must pay to acquire them. If we pay higher prices for hotels, our returns on investment and profitability may be reduced. Future acquisitions may not yield the returns we expect and may result in stockholder dilution.
Future acquisitions may not yield the returns expected, may result in disruptions to our business, may strain management resources, may not be efficiently integrated into operations, and may result in stockholder dilution.
Our business strategy may not ultimately be successful and may not provide positive returns on our investments. Acquisitions may cause disruptions in our operations and divert management’s attention away from day-to-day operations. If the integration of our acquisitions into our management companies’ operations is not accomplished as efficiently as planned, we will not achieve the expected operating results from the acquisitions. The issuance of equity securities in connection with any acquisition could be substantially dilutive to our stockholders.
We may not be able to sell hotels on favorable terms.
Our business strategy may include the disposition of assets. We may not be able to sell such hotels on favorable terms, and such hotels may be sold at a loss. As with acquisitions, we face competition for buyers of our hotel properties. Other sellers of hotels may have the financial resources to dispose of their hotels on unfavorable terms that we would be unable to accept. If we cannot find buyers for any properties that are designated for sale, we will not be able to implement our disposition strategy. In the event that we cannot fully execute our disposition strategy or realize the benefits therefrom, we may not be able to fully execute our growth strategy.
We may record additional impairment charges on our properties which will negatively impact our results of operations.
We analyze our assets for impairment when events or circumstances occur that indicate an asset’s carrying value may not be recoverable. For impaired assets, we record an impairment charge equal to the excess of the property’s carrying value over its fair value. Our operating results for 2016, 2015, and 2014 include $1.5 million, $3.7 million, and $2.9 million, respectively, of total impairment charges related to our hotels. Factors, many of which are outside our control, such as increased local competition, age and condition of hotels, and national and local declines in the economy, may result in additional impairment charges, which will negatively affect our results of operations. We can provide no assurance that any impairment loss recognized would not be material to our results of operations.
We will likely seek to sell equity and/or debt securities to meet our need for additional cash, and we cannot assure you that such financing will be available and further, in connection with such sales our current shareholders could experience a material amount of dilution.
We may require additional cash resources based on business conditions and any acquisitions we may decide to pursue. We will likely seek to sell additional equity and/or debt securities. We cannot assure you that the sale of such securities will be available in amounts or on terms acceptable to us, if at all. If our board determines to sell
11
additional shares of common stock or other debt or equity securities, a material amount of dilution may cause the market price of the common stock to decline.
We face risks associated with the use of debt, including the ability to obtain debt financing and refinancing risk.
We may not be able to successfully obtain debt financing or we may not be able to extend, refinance, or repay our existing debt due to a number of factors, including decreased property valuations, limited availability of credit, tightened lending standards, or deteriorating economic conditions. If we are unable to refinance our debt on acceptable terms, we may be forced to dispose of hotel properties on disadvantageous terms, potentially resulting in losses. We have placed mortgages on certain of our hotel properties, have assumed mortgages on other hotels we acquired and may place additional mortgages on certain of our hotels to secure other debt. To the extent we cannot meet any future debt service obligations, we will risk losing some or all of our hotel properties that are pledged to secure our obligations to foreclosure. If we lack the ability to raise debt or refinance existing debt, our ability to execute our business strategy will be significantly hampered and our financial results may be significantly affected.
Our debt service obligations could adversely affect our operating results, may require us to liquidate our properties, and could limit our ability to make distributions to our stockholders.
We seek to maintain a total stabilized debt level of no more than 70% of our aggregate property investment at cost. We, however, may change or eliminate this target at any time without the approval of our stockholders. In the future, we and our subsidiaries may incur substantial additional debt, including secured debt. Incurring such debt could subject us to many risks, including the risks that:
|
· |
our cash flow from operations will be insufficient to make required payment of principal and interest; |
|
· |
we may be more vulnerable to adverse economic and industry conditions; |
|
· |
we may be more vulnerable to adverse economic and industry conditions; |
|
· |
we may be required to dedicate a substantial portion of our cash flow from operations to the repayment of our debt, thereby reducing the cash available for distribution to our stockholders, funds available for operations and capital expenditures, future investment opportunities, or other purposes; |
|
· |
the terms of any refinancing may not be as favorable as the terms of the debt being refinanced; and |
|
· |
the use of leverage could adversely affect our stock price and our ability to make distributions to our stockholders |
Our results may be negatively affected by interest rate fluctuations and our attempts to hedge this risk may not be effective.
Higher interest rates could increase our debt service requirements and could reduce the amounts available for distribution to our stockholders, as well as reduce funds available for our operations, future investment opportunities, or other purposes. We may obtain in the future one or more forms of interest rate protection—in the form of swap agreements, interest rate cap contracts, or similar agreements—to “hedge” against the possible negative effects of interest rate fluctuations. However, we cannot assure you that any hedging will adequately mitigate the adverse effects of interest rate increases or that counterparties under these agreements will honor their obligations. In addition, we may be subject to risks of default by hedging counterparties. Adverse economic conditions could also cause the terms on which we borrow to be unfavorable.
Operating our hotels under franchise agreements could adversely affect distributions to our shareholders.
At December 31, 2016, 18 of our hotels operate under third party franchise agreements and we are subject to the risks of concentrating our hotel investments in several franchise brands. These risks include reductions in business following negative publicity related to any one of our particular brands. Risks associated with our brands could adversely affect our lease revenues and the amounts available for distribution to our shareholders.
The maintenance of the franchise licenses for our hotels is subject to our franchisors’ operating standards and other terms and conditions. Our franchisors periodically inspect our hotels to ensure that we and the TRS follow their standards. Failure to maintain these standards or other terms and conditions could result in a franchise license being
12
canceled. As a condition of our continued holding of a franchise license, a franchisor could possibly require us to make capital expenditures, even if we do not believe the capital improvements are necessary or desirable or will result in an acceptable return on our investment. Nonetheless, we may risk losing a franchise license if we do not make franchisor-required capital expenditures.
If a franchisor terminates the franchise license, we may try either to obtain a suitable replacement franchise or to operate the hotel without a franchise license. The loss of a franchise license could materially and adversely affect the operations or the underlying value of the hotel because of the loss of associated name recognition, marketing support, and centralized reservation systems provided by the franchisor. Loss of a franchise license for several of our hotels could materially and adversely affect our revenue. This loss of revenue could, therefore, also adversely affect our cash available for distribution to shareholders.
Joint venture investments could be adversely affected by our lack of sole decision-making authority, our reliance on a co-venturer’s financial condition and disputes between us and our co-venturers.
We may co-invest in the future with third parties through partnerships, joint ventures or other entities, acquiring non-controlling interests in or sharing responsibility for managing the affairs of a property, partnership, joint venture or other entity. In such event, we would not be in a position to exercise sole decision-making authority regarding the property, partnership, joint venture or other entity. Investments in partnerships, joint ventures, or other entities may, under certain circumstances, involve risks not present were a third party not involved, including the possibility that partners or co-venturers might become bankrupt or fail to fund their share of required capital contributions. Investments in joint ventures may require that we provide the joint venture entity with the right of first offer or right of first refusal to acquire any new property we consider acquiring directly. Partners or co-venturers may have economic or other business interests or goals which are inconsistent with our business interests or goals, and may be in a position to take actions contrary to our policies or objectives. Such investments may also have the potential risk of impasses on decisions, such as a sale, because neither we nor the partner or co-venturer would have full control over the partnership or joint venture. Disputes between us and partners or co-venturers may result in litigation or arbitration that would increase our expenses and prevent our officers and/or directors from focusing their time and effort on our business. Consequently, actions by, or disputes with, partners or co-venturers might result in subjecting properties owned by the partnership or joint venture to additional risk. We may also, in certain circumstances, be liable for the actions of our third-party partners or co-venturers. For example, we may be required to guarantee indebtedness incurred by a partnership, joint venture or other entity for the purchase or renovation of a hotel property. Such a guarantee may be on a joint and several basis with our partner or co-venturer in which case we may be liable in the event such party defaults on its guaranty obligation.
Unanticipated expenses and insufficient demand for hotels we acquire in new geographic markets could adversely affect our profitability and our ability to make distributions to our stockholders.
We may develop or acquire hotels in geographic areas in which our management may have little or no operating experience and in which potential customers may not be familiar with our franchise brands. As a result, we may have to incur costs relating to the opening, operation and promotion of those new hotel properties that are substantially greater than those incurred in other areas. These hotels may attract fewer customers than our existing hotels, while at the same time, we may incur substantial additional costs with these new hotel properties. Unanticipated expenses and insufficient demand at a new hotel property, therefore, could adversely affect our profitability and our ability to make distributions to our stockholders.
The growth of Internet travel intermediaries could adversely affect the Company’s business and profitability.
Although a majority of rooms sold via the Internet are sold through hotel franchisor websites, some of the Company’s hotel rooms are booked through Internet travel intermediaries. These Internet travel intermediaries purchase rooms at a negotiated, net of fees, discount from participating hotels, which typically results in lower room rates than the Company’s franchisor or manager otherwise could have obtained. Although the Company’s managers and franchisors may have established agreements with many of these intermediaries that limit transaction fees for hotels, there be no assurance that the Company’s managers and franchisors will be able to renegotiate such agreements upon their expirations with terms as favorable as the provisions that exist today. An increase in the
13
growth of Internet travel intermediaries may negatively affect our hotel revenues.
We and our hotel managers rely on information technology in our operations, and any material failure, inadequacy, interruption or security failure of that technology could harm our business.
We and our hotel managers rely on information technology networks and systems, including the Internet, to process, transmit and store electronic information, and to manage or support a variety of business processes, including financial transactions and records, personal identifying information, reservations, billing and operating data. We purchase some of our information technology from vendors, on whom our systems depend. We rely on commercially available systems, software, tools and monitoring to provide security for processing, transmission and storage of confidential customer information, such as individually identifiable information, including information relating to financial accounts. Although we have taken steps to protect the security of our information systems and the data maintained in those systems, it is possible that our safety and security measures will not be able to prevent the systems’ improper functioning or damage, or the improper access or disclosure of personally identifiable information such as in the event of cyber-attacks. Security breaches, including physical or electronic break-ins, computer viruses, attacks by hackers and similar breaches, can create system disruptions, shutdowns or unauthorized disclosure of confidential information. Any failure to maintain proper function, security and availability of our information systems could interrupt our operations, damage our reputation, subject us to liability claims or regulatory penalties and could have a material adverse effect on our business, financial condition and results of operations and our ability to make distributions to our shareholders.
Uninsured and underinsured losses and our ability to satisfy our obligations could adversely affect our operating results and our ability to make distributions to our stockholders.
We intend to maintain comprehensive insurance on each of our hotel properties, including liability, fire, and extended coverage, of the type and amount we believe are customarily obtained for or by hotel owners. There are no assurances that current coverage will continue to be available at reasonable rates. Various types of catastrophic losses, like earthquakes and floods, or losses from foreign or domestic terrorist activities, may not be insurable or may not be economically insurable. Initially, we do not expect to obtain terrorism insurance on our hotel properties because it is costly. Lenders may require such insurance and our failure to obtain such insurance could constitute a default under loan agreements. Depending on our access to capital, liquidity and the value of the properties securing the effected loan in relation to the balance of the loan, a default could reduce our net income and limit our ability to obtain future financing.
In the event of a substantial loss, our insurance coverage may not be sufficient to cover the full current market value or replacement cost of our lost investment or the cash flows lost due to the interruption in operations. Should an uninsured loss or a loss in excess of insured limits occur, we could lose all or a portion of the capital we have invested in a hotel, as well as the anticipated future revenue from the hotel. In that event, we might nevertheless remain obligated for any mortgage debt or other financial obligations related to the property. Inflation, changes in building codes and ordinances, environmental considerations and other factors might also keep us from using insurance proceeds to replace or renovate a hotel after it has been damaged or destroyed. Under those circumstances, the insurance proceeds we receive might be inadequate to restore our economic position on the damaged or destroyed property.
Risks Related to the Hotel Industry
A recession could have a material adverse effect on the hotel industry and our results of operations.
The performance of the hotel industry usually follows the general economy. During the recession of 2008 and 2009, overall travel was reduced, which had a significant effect on our results of operations. Uncertainty in the strength and direction of the recovery have slowed the pace of the overall economic recovery. A stall in the economic recovery or a resurgent recession could have a material adverse effect on the hotel industry and, thus, on our results of operations.
14
Our ability to make distributions to our shareholders may be affected by factors in the hotel industry that are beyond our control.
Our hotels are subject to various operating risks found throughout the hotel industry. Many of these risks are beyond our control. These include, among other things, the following:
|
· |
competitors with substantially greater marketing and financial resources than us; |
|
· |
over-building in our markets, which adversely effects occupancy and revenues at our hotels; |
|
· |
dependence on business and commercial travelers and tourism; |
|
· |
terrorist incidents which may deter travel; |
|
· |
increases in hotel operating costs, energy costs, airline fares and other expenses, which may affect travel patterns and reduce the number of business and commercial travelers and tourists; and |
|
· |
adverse effects of general, regional and local economic conditions. |
These factors could adversely affect the amount of rent we receive from leasing our hotels and reduce the net operating profits of the TRS, which in turn could adversely affect our ability to make distributions to our shareholders. Decreases in room revenues of our hotels will result in reduced operating profits for the TRS and decreased lease revenues to our company under our current percentage leases with the TRS.
The hotel industry is seasonal in nature and may affect our cash flow.
Demand for our hotels is seasonal. We generally expect that we will have lower revenue, operating income, and cash flow in the first and fourth quarters and higher revenue, operating income and cash flow in the second and third quarters. These general trends are, however, influenced by overall economic cycles and the geographic locations of our hotels. To the extent that cash flow from operations is insufficient during any quarter, due to temporary or seasonal fluctuations in revenue, we expect to utilize cash on hand or borrowings under our credit facility to pay expenses, debt service or to make distributions to our equity holders.
The cyclical nature of the lodging industry may cause fluctuations in our operating performance, which could have a material adverse effect on us.
The hotel industry is highly cyclical in nature. Fluctuations in lodging demand and, therefore, operating performance, are caused largely by general economic and local market conditions, which subsequently affects levels of business and leisure travel. In addition to general economic conditions, hotel room supply growth is an important factor that can affect the lodging industry's performance. Overbuilding has in the past and will continue to have the potential to further exacerbate the negative impact of an economic recession. Room rates and occupancy, and thus Revenue per Available Room (“RevPAR”), tend to increase when demand growth exceeds supply growth. We can provide no assurances regarding whether, or the extent to which, lodging demand will rebound or whether any such rebound will be sustained. An adverse change in lodging fundamentals in our markets could result in returns that are substantially below our expectations or result in losses, which could have a material adverse effect on us.
Competition from other hotels in the markets in which we operate could have a material adverse effect on our results of operations.
The lodging industry is highly competitive. Our hotels compete with other hotels for guests in each market in which our hotels operate based on a number of factors, including location, convenience, brand affiliation, guestroom rates, range of services and guest amenities or accommodations offered and quality of customer service. Competition is often specific to the individual markets in which our hotels are located and includes competition from existing and new hotels. Our competitors may have an operating model that enables them to offer guestrooms at lower rates than we can, which could result in our competitors increasing their occupancy at our expense. Competition could adversely affect our occupancy, Average Daily Rate (“ADR”) and RevPAR, and may require us to provide additional amenities or make capital improvements that we otherwise would not have to make, which could reduce our profitability and could materially and adversely affect our results of operations.
The need for business-related travel and, thus, demand for rooms in our hotels may be materially and adversely
15
affected by the increased use of business-related technology.
The increased use of teleconference and video-conference technology by businesses could result in decreased business travel as companies increase the use of technologies that allow multiple parties from different locations to participate at meetings without traveling to a centralized meeting location, such as our hotels. To the extent that such technologies play an increased role in day-to-day business and the necessity for business-related travel decreases, demand for our hotel rooms may decrease and we could be materially and adversely affected.
The increasing use of Internet travel intermediaries by consumers may adversely affect our profitability.
Our hotel guestrooms are likely to be booked through Internet travel intermediaries, including, but not limited to Travelocity.com, Expedia.com and Priceline.com. As these Internet bookings increase, these intermediaries may be able to obtain higher commissions, reduced guestroom rates or other significant contract concessions from our management companies. Moreover, some of these Internet travel intermediaries are attempting to offer hotel guestrooms as a commodity, by increasing the importance of price and general indicators of quality (such as “three-star downtown hotel”) at the expense of brand identification. These agencies hope that consumers will eventually develop brand loyalties to their reservations system rather than to the brands under which our hotels are franchised. If the amount of sales made through Internet intermediaries increases significantly, guestroom revenue may flatten or decrease and our profitability may be adversely affected.
In the past, economic trends, terrorist acts, and military action have adversely affected the hotel industry generally, and similar future events could adversely affect the industry in the future.
Terrorist attacks and the after-effects (including the prospects for more terror attacks in the United States and abroad) have, in the past, substantially reduced business and leisure travel and lodging industry RevPAR generally. We cannot predict the extent to which these factors will directly or indirectly impact your investment in our securities, the lodging industry or our operating results in the future.
Declining RevPAR at our hotels would reduce our net income and restrict our ability to fund capital improvements at our hotels and our ability to make distributions to stockholders necessary to maintain our status as a REIT. Additional terrorist attacks, acts of war or similar events could have further material adverse effects on the markets on which shares of our stock will trade, as well as on the lodging industry in general and our operations in particular.
The hotel business is capital intensive.
Our hotels have an ongoing need for renovations and other capital improvements, including replacements, from time to time, of furniture, fixtures and equipment. The franchisors of our hotels also require periodic capital improvements as a condition of keeping the franchise licenses. The costs of all of these capital improvements could adversely affect our financial condition and reduce the amounts available for distribution to our shareholders. These renovations may give rise to the following risks:
|
· |
possible environmental problems; |
|
· |
construction cost overruns and delays; |
|
· |
a possible shortage of available cash to fund renovations and the related possibility that financing for these renovations may not be available to us on affordable terms; and |
|
· |
uncertainties as to market demand or a loss of market demand after renovations have begun |
The lenders under some of the mortgage debt that we will assume will require us to set aside varying amounts each year for capital improvements at our hotels. We may not be able to fund capital improvements or acquisitions solely from cash provided from our operating activities and, thus, may need to raise capital in order to finance any required capital expenditures.
Noncompliance with governmental regulations could adversely affect our operating results.
Environmental Matters
16
Our hotel properties are subject to various federal, state, and local environmental laws. Under these laws, courts and government agencies have the authority to require the owner of a contaminated property to clean up the property, even if the owner did not know of or was not responsible for the contamination. These laws also apply to persons who owned a property at the time it became contaminated. In addition to the costs of cleanup, contamination can affect the value of a property and, therefore, an owner’s ability to borrow funds using the property as collateral.
Under these environmental laws, courts and government agencies also have the authority to require that a person who sent waste to a waste disposal facility, like a landfill or an incinerator, pay for the clean-up of that facility if it becomes contaminated and threatens human health or the environment. Furthermore, court decisions have established that third parties may recover damages for injury caused by property contamination. For instance, a person exposed to asbestos while staying in a hotel may seek to recover damages if he suffers injury from the asbestos. Lastly, some of these environmental laws restrict the use of a property or place conditions on various activities at a property. One example is laws that require a business using chemicals to manage them carefully and to notify local officials that the chemicals are being used.
Our Company could be responsible for the costs discussed above if it found itself in one or more of these situations. The costs to clean up a contaminated property, to defend against a claim, or to comply with environmental laws could be material and could affect the funds available for distribution to our shareholders. To determine whether any costs of this nature might be required, we commission Phase I environmental site assessments, or “ESAs”, before we acquire our hotels, and at certain times have commissioned new ESAs for certain of our hotels in conjunction with a refinancing of the debt obligations of those hotels. These studies typically included a review of historical information and a site visit, but not soil or groundwater testing. We obtain the ESAs to help us identify whether we might be responsible for cleanup costs or other costs in connection with our hotels. The ESAs on our hotels did not reveal any environmental conditions that are likely to have a material adverse effect on our business, assets, results of operations, or liquidity. However, ESAs do not always identify all potential problems or environmental liabilities. Consequently, we may have material environmental liabilities of which we are unaware.
Americans with Disabilities Act and Other Changes in Governmental Rules and Regulations
Under the Americans with Disabilities Act of 1990, or ADA, all public accommodations must meet various federal requirements related to access and use by disabled persons. Compliance with the ADA’s requirements could require removal of access barriers and non-compliance could result in the U.S. government imposing fines or in private litigants obtaining damages. If we were required to make substantial modifications to our hotels, whether to comply with the ADA or other changes in governmental rules and regulations, our ability to make distributions to our shareholders and meet our other obligations could be adversely affected.
Risks Related to the Real Estate Industry
Illiquidity of real estate investments could significantly impede our ability to respond to adverse changes in the performance of our properties and harm our financial condition.
Because real estate investments are relatively illiquid, our ability to promptly sell one or more hotel properties or investments in our portfolio in response to changing economic, financial and investment conditions may be limited. The real estate market is affected by many factors that are beyond our control, including:
|
· |
adverse changes in international, national, regional and local economic and market conditions; |
|
· |
changes in interest rates and in the availability, cost and terms of debt financing; |
|
· |
changes in governmental laws and regulations, fiscal policies and zoning ordinances and the related costs of compliance with laws and regulations, fiscal policies and ordinances; |
|
· |
the ongoing need for capital improvements, particularly in older structures; |
|
· |
changes in operating expenses; and |
|
· |
civil unrest, acts of God, including earthquakes, floods and other natural disasters and acts of war or terrorism, including the consequences of terrorist acts such as those that occurred on September 11, 2001, which may result in uninsured losses. |
17
We cannot predict whether we will be able to sell any hotel property or investment for the price or on the terms set by us, or whether any price or other terms offered by a prospective purchaser would be acceptable to us. We also cannot predict the length of time needed to find a willing purchaser and to close the sale of a hotel property or loan.
We may be required to expend funds to correct defects or to make improvements before a hotel property can be sold. We cannot assure you that we will have funds available to correct those defects or to make those improvements. In acquiring a hotel property, we may agree to lock-out provisions that materially restrict us from selling that hotel property for a period of time or impose other restrictions, such as limitation on the amount of debt that can be placed or repaid on that hotel property. These facts and any others that would impede our ability to respond to adverse changes in the performance of our hotel properties could have a material adverse effect on our operating results and financial condition, as well as our ability to make distributions to stockholders.
Increases in property taxes would adversely affect our ability to make distributions to our shareholders.
Hotel properties are subject to real and personal property taxes. These taxes may increase as tax rates change and as the properties are assessed or reassessed by taxing authorities. In particular, our property taxes could increase following our hotel purchases as the acquired hotels are reassessed. If property taxes increase, our financial condition, results of operations, and our ability to make distributions to our shareholders could be materially and adversely affected.
Our hotels may contain or develop harmful environmental challenges which could lead to liability for adverse health effects and costs of remediating the problem.
Bed bug infestation can cause adverse health effects, including skin rashes, psychological effects and allergic symptoms. When excessive moisture accumulates in buildings or on building materials, mold growth may occur, particularly if the moisture problem remains undiscovered or is not addressed over a period of time. Some molds may produce airborne toxins or irritants. Concern about indoor exposure to mold has been increasing, as exposure to mold may cause a variety of adverse health effects and symptoms, including allergic or other reactions. As a result, the presence of significant mold or bed bugs at any of our properties could require us to undertake a costly remediation program to contain or remove the mold or remove the bed bugs from the effected property, the cost of which would reduce our cash available for distribution. In addition, the presence of significant mold or bed bugs could expose us to liability from our guests, employees or our management companies and others if property damage or health concerns arise.
Risks Related to our Organization and Structure
We cannot assure you that we will qualify, or remain qualified, as a REIT.
We currently are taxed as a REIT, and we expect to qualify as a REIT for future taxable years, but we cannot assure you that we will remain qualified as a REIT. If we fail to remain qualified as a REIT, all of our earnings will be subject to federal income taxation, which will reduce the amount of cash available for distribution to our stockholders, and we will not be required to distribute our income to our stockholders.
Our TRS lessee structure subjects us to the risk of increased operating expenses.
Operating Risks
Our hotels are subject to various operating risks found throughout the hotel industry. Many of these risks are beyond our control. These include, among other things, the following:
|
· |
competitors with substantially greater marketing and financial resources than us; |
|
· |
dependence on business and commercial travelers and tourism; |
|
· |
over-building of hotels in our markets, which could adversely affect occupancy and revenue at the hotels we acquire; |
18
|
· |
increases in energy costs and other expenses affecting travel, which may affect travel patterns and reduce the number of business and commercial travelers and tourists; |
|
· |
increases in operating costs, including increased real estate and personal property taxes, due to inflation and other factors that may not be offset by increased guestroom rates; |
|
· |
potential increases in labor costs at our hotels, including as a result of unionization of the labor force and increasing health care insurance expense; |
|
· |
adverse effects of international, national, regional and local economic and market conditions; |
|
· |
changes in governmental laws and regulations, fiscal policies and zoning ordinances and the related costs of compliance with laws and regulations, fiscal policies and ordinances; and |
|
· |
events beyond our control, such as instability in the national, European or global economy, terrorist attacks, travel related health concerns including pandemics and epidemics such as H1N1 influenza (swine flu), Zika virus, avian bird flu, Ebola and SARS, travel-related environmental concerns including water contamination and air pollution, political instability, regional hostilities, increases in fuel prices, imposition of taxes or surcharges by regulatory authorities and travel-related accidents and unusual weather patterns, including natural disasters such as hurricanes. |
These factors could adversely affect the amount of rent we receive from leasing our hotels and reduce the net operating profits of the TRS, which in turn could adversely affect our ability to make distributions to our stockholders. Decreases in room revenues of our hotels will result in reduced operating profits for the TRS and decreased lease revenues to our company under our current percentage leases with the TRS.
Competition and Financing for Acquisitions
We compete for investment opportunities with entities that have substantially greater financial resources than we do. These entities generally may be able to accept more risk than we can manage wisely. This competition may generally limit the number of suitable investment opportunities offered to us. This competition may also increase the bargaining power of property owners seeking to sell to us, making it more difficult for us to acquire new properties on attractive terms. Additionally, current economic conditions present difficult challenges to obtaining financing for acquisitions.
Seasonality of Hotel Business
Historically, as a result of the geographic areas in which we operate, the operations of our hotels have been seasonal in nature. Generally, occupancy rates, revenue, and operating income have been greater in the second and third quarters of the calendar year than in the first and fourth quarters, with the exception of our hotels located in Florida, which experience peak demand in the first and fourth quarters of the year.
Investment Concentration in Particular Segments of Single Industry
Our entire business is hotel-related. Although we intend to invest in premium-branded upper-midscale and upscale select-service properties in the future, our current hotel portfolio is concentrated in midscale and economy hotel properties. Therefore, a downturn in the hotel industry in general and our segments in particular will have a material adverse effect on our revenues and amounts available for distribution to our stockholders.
Capital Expenditures
Our hotels have an ongoing need for renovations and other capital improvements, including replacements, from time to time, of furniture, fixtures and equipment. The franchisors of our hotels also require periodic capital improvements as a condition of keeping the franchise licenses. The costs of all of these capital improvements could adversely affect our financial condition and reduce the amounts available for distribution to our stockholders. These renovations may give rise to the following risks:
|
· |
possible environmental problems; |
|
· |
construction cost overruns and delays; |
19
|
· |
a possible shortage of available cash to fund renovations and the related possibility that financing for these renovations may not be available to us on affordable terms; and |
|
· |
uncertainties as to market demand or a loss of market demand after renovations have begun. |
Our ability to make distributions on our common and preferred stock is subject to fluctuations in our financial performance, operating results, and capital improvement requirements.
As a REIT, we generally are required to distribute annually at least 90% of our REIT taxable income, determined without regard to the dividends paid deduction, to our stockholders. Downturns in our operating results and financial performance or unanticipated capital improvements to our hotel properties may affect our ability to declare or pay distributions to our stockholders. Further, we may not generate sufficient cash in order to fund distributions to our stockholders, which may require us to sell assets or borrow money to satisfy the REIT distribution requirements.
Among the factors which could adversely affect our results of operations and our distributions to stockholders are reduced net operating profits or operating losses, increased debt service requirements, and capital expenditures at our hotel properties. Among the factors which could reduce our net operating profits are decreases in hotel property revenue and increases in hotel property operating expenses. Hotel property revenue can decrease for a number of reasons, including increased competition from a new supply of rooms and decreased demand for rooms. These factors can reduce both occupancy and room rates at our hotel properties.
The timing and amount of distributions are at the sole discretion of our Board of Directors, which will consider, among other factors, our actual results of operations, debt service requirements, capital expenditure requirements for our properties, and our operating expenses. We cannot guarantee future distributions.
We have restrictive debt covenants that could adversely affect our ability to run our business.
We are required to meet or maintain quarterly loan covenants with certain of our lenders. Weakness in the economy and the lodging industry at large may result in non-compliance with our loan covenants. Such noncompliance with our loan covenants may result in our lenders restricting the use of our operating funds for capital improvements to our existing hotels, including improvements required by our franchise agreements, or causing the debt maturity to accelerate. We cannot assure you that we can maintain compliance with our loan covenants and maintain our business strategy.
Our restrictive debt covenants may jeopardize our tax status as a REIT.
To maintain our REIT status, we generally must distribute at least 90% of our REIT taxable income to our stockholders annually. In addition, we are subject to a 4% non-deductible excise tax if the actual amount distributed to stockholders in a calendar year is less than a minimum amount specified under federal income tax laws. In the event we do not comply with our debt service obligations, our lenders may limit our ability to make distributions to our stockholders, which could adversely affect our REIT status.
Joint venture investments could be adversely affected by our lack of sole decision-making authority, our reliance on a co-venturer’s financial condition and disputes between us and our co-venturers.
On August 22, 2016, we entered into a joint venture which acquired the 254-room Aloft hotel in downtown Atlanta, Georgia. Our joint venture partner has joint approval rights with us with respect to most major decisions regarding the hotel or the joint venture. In addition, we may co-invest in the future with third parties through partnerships, joint ventures or other entities, acquiring non-controlling interests in or sharing responsibility for managing the affairs of a property, partnership, joint venture or other entity. In such event, we may not be in a position to exercise sole decision-making authority regarding the property, partnership, joint venture or other entity. Investments in partnerships, joint ventures, or other entities may, under certain circumstances, involve risks not present were a third party not involved, including the possibility that partners or co-venturers might become bankrupt or fail to fund their share of required capital contributions. Investments in joint ventures may require that we provide the joint venture entity with the right of first offer or right of first refusal to acquire any new property we consider acquiring directly. Partners or co-venturers may have economic or other business interests or goals which are inconsistent with our
20
business interests or goals, and may be in a position to take actions contrary to our policies or objectives. Such investments may also have the potential risk of impasses on decisions, such as a sale, because neither we nor the partner or co-venturer would have full control over the partnership or joint venture.
Disputes between us and partners or co-venturers may result in litigation or arbitration that would increase our expenses and prevent our officers and directors from focusing their time and effort on our business. Consequently, actions by, or disputes with, partners or co-venturers might result in subjecting properties owned by the partnership or joint venture to additional risk. We may also, in certain circumstances, be liable for the actions of our third-party partners or co-venturers. If a joint venture partner becomes bankrupt or otherwise defaults on its obligations under a joint venture agreement, we and any other remaining joint venture partners would generally remain liable for the joint venture liabilities. For example, we may be required to guarantee indebtedness incurred by a partnership, joint venture or other entity for the purchase or renovation of a hotel property. Such a guarantee may be on a joint and several basis with our partner or co-venturer in which case we may be liable in the event such party defaults on its guaranty obligation. Furthermore, if a joint venture partner becomes bankrupt or otherwise defaults on its obligations under a joint venture agreement, we may be unable to continue the joint venture other than by purchasing such joint venture partner’s interests or the underlying assets at a premium to the market price. If any of the above risks are realized, it could materially adversely affect our business, financial condition and results of operations and our ability to make distributions to our stockholders.
Our two largest shareholders hold significant voting power and have the right to designate seven of our nine directors, which provides these shareholders with significant power to influence our business and affairs.
RES and its affiliates hold 49% and SREP III Flight-Investco, L.P. (“SREP”) and its affiliates hold 42.6% of the combined voting power of all Condor voting stock. RES and SREP each have a contractual preemptive right, but not the obligation, to purchase up to their pro rata share (based on their ownership on a fully diluted basis) of any equity securities we offer in future offerings on the same terms as other investors. RES has the right to appoint four directors to our board of directors and SREP has the right to appoint three directors to our board of directors.
As discussed further in the Subsequent Events footnote to the consolidated financial statements, on February 28, 2017, RES and SREP, the holders of the Series D Preferred Stock, voluntarily converted their shares into 39,032,225 shares of common stock at $1.60 per share pursuant to the terms of the preferred stock. The terms of the Series D Preferred Stock provided for automatic conversion following certain future common stock offerings, and also provided for potential additional payments to the holders depending on the sales price of common stock in the offerings. As a result of the voluntary conversion, the holders are no longer entitled to the potential payments. To induce the holders of the Series D Preferred Stock to voluntarily convert their shares, the Company issued the holders a $9.25 million in face amount of a new series of preferred stock, the Series E Preferred Stock. The Series D Preferred Stock, while it was outstanding, had the right to vote separately as a class to approve certain significant corporate events. Similarly, the Series E Preferred Stock votes as a class on matters generally affecting the Series E Preferred Stock, and as long as 434,750 shares of Series E Preferred Stock (47% of the originally issued shares of Series E Preferred Stock) remain outstanding, then 75% approval of the Series E Preferred Stock will be required to approve merger, consolidation, liquidation or winding up of Condor, related party transactions exceeding $120,000, payment of dividends on common stock except from funds from operations or to maintain REIT status, the grant of exemptions from Condor’s charter limitation on ownership of 9.9% of any class or series of its securities (exclusive of persons currently holding exemptions), issuance of preferred stock, or commitment or agreement to do any of the foregoing.
By virtue of their voting power and board designation rights, preemptive right to purchase additional equity securities in future stock offerings and approval rights, RES and SREP, collectively and separately, have the power to significantly influence our business and affairs and the outcome of matters required to be submitted to shareholders for approval, including the election of our directors, amendments to our charter, mergers, or sales of assets. Their influence over our business and affairs may not be consistent with the interests of some or all of our shareholders and might negatively affect the market price of our common stock.
The holders of the Series E Preferred Stock have rights senior to holders of common stock.
21
RES and SREP, our two largest shareholders, own all of the issued and outstanding shares our Series E Preferred Stock. The Series E Preferred Stock ranks senior to our common stock and any other preferred stock issuances and receives preferential cumulative cash dividends at a rate of 6.25% annually per annum of the $10.00 face value per share. If we fail to pay a dividend, then during the period that dividends are not paid, the dividend rate increases to 12.5%, if specific equity offering or offerings have not occurred, and increases 9.25% per annum if such equity or equity offerings have occurred. Dividends on the Series E Preferred Stock accrue whether or not we have earnings, whether or not there are funds legally available for the payment of such dividends, whether or not such dividends are declared, and whether or not such dividends are prohibited by agreement.
Our failure to qualify as a REIT under the federal tax laws would result in adverse tax consequences.
The federal income tax laws governing REITs are complex and subject to revision.
We currently operate as a REIT under the federal income tax laws. The REIT qualification requirements are extremely complex and interpretations of the federal income tax laws governing qualification as a REIT are limited. Accordingly, we cannot be certain that we would be successful in operating so that we can qualify as a REIT. At any time, new laws, interpretations, or court decisions may change the federal tax laws or the federal income tax consequences of our qualification as a REIT. We have not applied for or obtained rulings from the IRS that we will qualify as a REIT.
Failure to qualify as a REIT would subject us to federal income tax.
If we fail to qualify as a REIT in any taxable year, we will be subject to federal income tax on our taxable income. We might need to borrow money or sell assets in order to pay any such tax. If we cease to be a REIT, we no longer would be required to distribute most of our taxable income to our stockholders. Unless we were entitled to relief under certain federal income tax laws, we could not re-elect REIT status during the four calendar years after the year in which we failed to qualify as a REIT.
Failure to make required distributions would subject us to tax.
In order to qualify as a REIT, we generally are required to distribute at least 90% of our REIT taxable income, determined without regard to the dividends paid deduction, each year to our stockholders. To the extent that we satisfy this distribution requirement, but distribute less than 100% of our taxable income, we will be subject to federal income tax on our undistributed taxable income. In addition, we will be subject to a 4% non-deductible excise tax if the actual amount that we pay out to our stockholders in a calendar year is less than a minimum amount specified under federal tax laws. As a result, for example, of differences between cash flow and the accrual of income and expenses for tax purposes, or of nondeductible expenditures, our REIT taxable income in any given year could exceed our cash available for distribution. In addition, to the extent we may retain earnings of the TRS in those subsidiaries, such amount of cash would not be available for distribution to our stockholders to satisfy the 90% distribution requirement. Accordingly, we may be required to borrow money or sell assets to make distributions sufficient to enable us to pay out enough of our taxable income to satisfy the distribution requirement and to avoid federal corporate income tax and the 4% non-deductible excise tax in a particular year.
The formation of the TRS increases our overall tax liability.
The TRS is subject to federal and state income tax on its taxable income, which in the case of the TRS currently consists and generally will continue to consist of revenues from the hotel properties leased by the TRS, net of the operating expenses for such properties and rent payments to us. Accordingly, although our ownership of the allows us to participate in the operating income from our hotel properties in addition to receiving rent, that operating income is fully subject to income tax. Such taxes could be substantial. The after-tax net income of the TRS is available for distribution to us.
We incur a 100% excise tax on transactions with the TRS that are not conducted on an arm’s-length basis. For example, to the extent that the rent paid by the TRS exceeds an arm’s-length rental amount, such amount potentially
22
is subject to the excise tax. We intend that all transactions between us and the TRS will continue to be conducted on an arm’s-length basis and, therefore, that the rent paid by the TRS to us will not be subject to the excise tax.
We may be subject to adverse legislative or regulatory tax changes that could increase our tax liability, reduce our operating flexibility and reduce the market price of our shares.
At any time, the federal income tax laws governing REITs or the administrative and judicial interpretations of those laws may be amended or changed. We cannot predict when or if any new federal income tax law, regulation or administrative and judicial interpretation, or any amendment to any existing federal income tax law, regulation or administrative or judicial interpretation, will be adopted, promulgated or become effective and any such law, regulation or interpretation may take effect retroactively. We and our shareholders could be adversely affected by any such change in, or any new, federal income tax law, regulation or administrative and judicial interpretation.
If our hotel managers do not qualify as "eligible independent contractors” the Company would likely fail to qualify as a REIT.
Rent paid by a lessee that is a "related party tenant" of ours will not be qualifying income for purposes of the two gross income tests applicable to REITs. We lease substantially all of our hotels to our TRS. The TRS will not be treated as a "related party tenant," and will not be treated as directly operating a lodging facility to the extent the TRS leases properties from us that are managed by an "eligible independent contractor." In addition, our TRS holding companies will fail to qualify as “taxable REIT subsidiaries” if they lease or own a lodging facility that is not managed by an “eligible independent contractor.”
If our hotel managers do not qualify as "eligible independent contractors," we would fail to qualify as a REIT. Each of the hotel management companies that enters into a management contract with our TRS must qualify as an "eligible independent contractor" under the REIT rules in order for the rent paid to us by our TRS to be qualifying income for our REIT income test requirements and for our TRS holding companies to qualify as “taxable REIT subsidiaries”. Among other requirements, in order to qualify as an eligible independent contractor a manager must not own more than 35% of our outstanding shares (by value) and no person or group of persons can own more than 35% of our outstanding shares and the ownership interests of the manager, taking into account only owners of more than 5% of our shares and, with respect to ownership interests in such managers that are publicly traded, only holders of more than 5% of such ownership interests. Complex ownership attribution rules apply for purposes of these 35% thresholds. Although we intend to monitor ownership of our shares by our property managers and their owners, there can be no assurance that these ownership levels will not be exceeded.
If our leases with our TRS are not respected as true leases for federal income tax purposes, we would fail to qualify as a REIT.
To qualify as a REIT, we are required to satisfy two gross income tests, pursuant to which specified percentages of our gross income must be passive income, such as rent. For the rent paid pursuant to the hotel leases with our TRS, which should constitute substantially all of our gross income, to qualify for purposes of the gross income tests, the leases must be respected as true leases for federal income tax purposes and must not be treated as service contracts, joint ventures or some other type of arrangement. We have structured our leases, and intend to structure any future leases, so that the leases will be respected as true leases for federal income tax purposes, but there can be no assurance that the IRS will agree with this characterization, not challenge this treatment or that a court would not sustain such a challenge. If the leases were not respected as true leases for federal income tax purposes, we would not be able to satisfy either of the two gross income tests applicable to REITs and likely would fail to qualify for REIT status.
We may be subject to the 100% prohibited transaction tax on the gain recognized on the hotels we sold.
A REIT will incur a 100% tax on the net income derived from any sale or other disposition of property that the REIT holds primarily for sale to customers in the ordinary course of a trade or business. We undertook specific disposition programs beginning in 2001 (that included the sale of 23 hotels through December 31, 2004) and 2008 (that included the sale of 112 hotels through December 31, 2016). We held the disposed hotels for an average period
23
of 14.0 years and did not acquire the hotels for purposes of resale. We believe that such sales are not prohibited transactions. However, if the IRS would successfully assert that we held such hotels primarily for sale in the ordinary course of our business, the gain from such sales could be subject to a 100% prohibited transaction tax.
Complying with REIT requirements may cause us to forego attractive opportunities that could otherwise generate strong risk-adjusted returns and instead pursue less attractive opportunities, or none at all.
To continue to qualify as a REIT for federal income tax purposes, we must continually satisfy tests concerning, among other things, the sources of our income, the nature and diversification of our assets, the amounts we distribute to our stockholders and the ownership of our stock. Thus, compliance with the REIT requirements may hinder our ability to operate solely on the basis of generating strong risk-adjusted returns on invested capital for our stockholders.
Complying with REIT requirements may force us to liquidate otherwise attractive investments, which could result in an overall loss on our investments.
To continue to qualify as a REIT, we must also ensure that at the end of each calendar quarter at least 75% of the value of our assets consists of cash, cash items, government securities and qualified REIT real estate assets. The remainder of our investment in securities (other than government securities and qualified real estate assets) generally cannot include more than 10% of the outstanding voting securities of any one issuer or more than 10% of the total value of the outstanding securities of any one issuer. In addition, in general, no more than 5% of the value of our assets (other than government securities and qualified real estate assets) can consist of the securities of any one issuer, and no more than 25% of the value of our total securities can be represented by securities of one or more TRSs. If we fail to comply with these requirements at the end of any calendar quarter, we must correct such failure within 30 days after the end of the calendar quarter to avoid losing our REIT status and suffering adverse tax consequences. If we fail to comply with these requirements at the end of any calendar quarter, we may be able to preserve our REIT status by benefiting from certain statutory relief provisions. Except with respect to a de minimis failure of the 5% asset test or the 10% vote or value test, we can maintain our REIT status only if the failure was due to reasonable cause and not to willful neglect. In that case, we will be required to dispose of the assets causing the failure within six months after the last day of the quarter in which we identified the failure, and we will be required to pay an additional tax of the greater of $50,000 or the product of the highest applicable tax rate (currently 35%) multiplied by the net income generated on those assets. As a result, we may be required to liquidate otherwise attractive investments.
Taxation of dividend income could make our common stock less attractive to investors and reduce the market price of our common stock.
At any time, the federal income tax laws governing REITs or the administrative interpretations of those laws may be amended or changed. Any of those new laws or interpretations may take effect retroactively and could adversely affect us or you as a stockholder. Since 2013, the maximum tax rate on dividend income for certain taxpayers has been at 20% for qualified dividends and 39.6% on non-qualified dividends (plus a 3.8% net investment income tax). Generally, dividends from REITs do not qualify for reduced dividend tax rates because, as a result of the dividends paid deduction to which REITs are entitled, REITs generally do not pay corporate level tax on income that they distribute to stockholders. As a result of that legislation, individual, trust, and estate investors could view stocks of non-REIT corporations as more attractive relative to shares of REITs than was the case previously because the dividends paid by non-REIT corporations are subject to lower tax rates for such investors.
Provisions of our charter and substantial voting power held by two shareholders may limit the ability of a third party to acquire control of our company.
In order to maintain our REIT qualification, no more than 50% in value of our outstanding capital stock may be owned, directly or indirectly, by five or fewer individuals (as defined in the federal income tax laws to include various kinds of entities) during the last half of any taxable year. Our articles of incorporation contain the ownership limitation, which prohibits both direct and indirect ownership of more than 9.9% of the outstanding shares of our common stock or 9.9% of any series of our preferred stock by any person, subject to several exceptions. Generally,
24
any shares of our capital stock owned by affiliated owners will be added together for purposes of the ownership limitation.
Our articles of incorporation permit our board, in its sole discretion, to exempt a person from the 9.9% ownership limitation if the person provides representations and undertakings that enable our board to determine that granting the exemption would not result in the loss of our REIT qualification. Under the IRS rules, REIT shares owned by certain entities are considered owned proportionately by owners of the entities for REIT qualification purposes. RES and SREP each provided a letter at the time of the issuance of the Series D Preferred Stock that permitted our board to grant such an exemption. The stock ownership by RES and SREP, which was permitted with our board’s approval, represents such substantial voting power that it may limit the ability of a third party to acquire control of our company.
These ownership limitations may prevent an acquisition of control of our company by a third party without our board of directors’ approval, even if our stockholders believe the change of control is in their best interests. Our charter authorizes our board of directors to issue shares of common stock and shares of preferred stock, and to set the preferences, rights and other terms of the preferred stock. Furthermore, our board of directors may, without any action by the stockholders, amend our charter from time to time to increase or decrease the aggregate number of shares of stock of any class or series of preferred stock that we have authority to issue. Issuances of additional shares of stock may have the effect of delaying, deferring or preventing a transaction or a change in control of our company that might involve a premium to the market price of our common stock or otherwise be in our stockholders’ best interests.
Our ownership limitation may prevent a shareholder from engaging in certain transfers of our capital stock.
If anyone transfers shares in a way that would violate the ownership limitation described above or prevent us from continuing to qualify as a REIT under the federal income tax laws, we will consider the transfer to be null and void from the outset, and the intended transferee of those shares will be deemed never to have owned the shares. Those shares instead will be transferred to a trust for the benefit of a charitable beneficiary and will be either redeemed by our company or sold to a person whose ownership of the shares will not violate the ownership limitation. Anyone who acquires shares in violation of the ownership limitation or the other restrictions on transfer in our articles of incorporation bears the risk that he will suffer a financial loss when the shares are redeemed or sold if the market price of our stock falls between the date of purchase and the date of redemption or sale.
The ability of our board of directors to change our major corporate policies may not be in your interest.
Our board of directors determines our major corporate policies, including our acquisition, financing, growth, operations and distribution policies. Our board may amend or revise these and other policies from time to time without the vote or consent of our stockholders.
ITEM 1B. UNRESOLVED STAFF COMMENTS
None.
25
Our Company headquarters is located in Bethesda, Maryland, with additional office space in Omaha, Nebraska and Norfolk, Nebraska. The following table sets forth certain information with respect to the hotels owned by us as of December 31, 2016:
|
Brand |
City |
State |
Rooms |
|||
|
|
||||||
|
Upscale/Upper Midscale Select Service Hotels |
||||||
|
Hilton Garden Inn |
Dowell |
Maryland |
100 | |||
|
Hotel Indigo |
Atlanta (Airport) (2) |
Georgia |
142 | |||
|
SpringHill Suites |
San Antonio (Downtown) (2) |
Texas |
116 | |||
|
Courtyard by Marriott |
Jacksonville (2) |
Florida |
120 | |||
|
Aloft |
Leawood-Overland Park (2) |
Kansas |
156 | |||
|
Aloft |
Atlanta (Downtown) (3) |
Georgia |
254 | |||
|
|
888 | |||||
|
Legacy Hotels Held for Use |
||||||
|
Comfort Suites |
South Bend |
Indiana |
135 | |||
|
Comfort Suites |
Fort Wayne |
Indiana |
127 | |||
|
Comfort Inn & Suites |
Warsaw |
Indiana |
71 | |||
|
Quality Inn |
Solomons |
Maryland |
59 | |||
|
Super 8 |
Creston |
Iowa |
121 | |||
|
Supertel Inn |
Creston |
Iowa |
41 | |||
|
|
554 | |||||
|
Legacy Hotels Held for Sale |
||||||
|
Comfort Suites |
Lafayette |
Indiana |
62 | |||
|
Comfort Inn |
New Castle |
Pennsylvania |
79 | |||
|
Comfort Inn |
Harlan (1) |
Kentucky |
61 | |||
|
Quality Inn |
Morgantown |
West Virginia |
81 | |||
|
Days Inn |
Bossier City |
Louisiana |
176 | |||
|
Super 8 |
Billings |
Montana |
106 | |||
|
Key West Inn |
Key Largo |
Florida |
40 | |||
|
|
605 | |||||
|
|
Total Rooms |
2,047 |
|
(1) |
This property is subject to a long-term ground lease |
|
(2) |
Wholly owned property acquired in 2015 or 2016 |
|
(3) |
Joint venture property acquired in 2016 |
All of our properties are encumbered by either our revolving credit agreement or by mortgage debt at December 31, 2016. Additional property information is found in Item 8 Schedule III of this Annual Report on Form 10-K.
Various claims and legal proceedings arise in the ordinary course of business and may be pending against the Company and its properties. We are not currently involved in any material litigation, nor, to our knowledge, is any material litigation threatened against us. The Company has insurance to cover potential material losses and we believe it is not reasonably possible that such matters will have a material impact on our financial condition or results of operations.
ITEM 4. MINE SAFETY DISCLOSURES
Not applicable.
26
PART II
ITEM 5. MARKET FOR THE REGISTRANT’S COMMON EQUITY / RELATED STOCKHOLDER MATTERS AND ISSUER PURCHASES OF EQUITY SECURITIES
Market Information
Our common stock trades on the Nasdaq Global Market under the symbol “CDOR”. The closing sales price for the common stock on February 28, 2017 was $2.13 per share. The table below sets forth the high and low sales prices per share reported on the Nasdaq Global Market for the periods indicated:
|
|
Condor Hospitality Trust, Inc. |
|||||
|
Common Stock |
||||||
|
High |
Low |
|||||
|
2015 |
||||||
|
First quarter |
$ |
2.27 |
$ |
1.42 | ||
|
Second quarter |
$ |
3.70 |
$ |
1.61 | ||
|
Third quarter |
$ |
2.74 |
$ |
0.80 | ||
|
Fourth quarter |
$ |
1.59 |
$ |
1.00 | ||
|
|
||||||
|
2016 |
||||||
|
First quarter |
$ |
2.24 |
$ |
.70 |
||
|
Second quarter |
$ |
2.60 |
$ |
1.51 | ||
|
Third quarter |
$ |
3.14 |
$ |
1.70 | ||
|
Fourth quarter |
$ |
2.19 |
$ |
1.53 | ||
|
|
||||||
Shareholder Information
As of February 28, 2017, the approximate number of holders of record of our common stock was 51. However, because the vast majority of our common shares are held by brokers and other institutions on behalf of shareholders, we believe that there are considerably more beneficial holders of our common shares than record holders.
Distribution Information
Distributions to the extent of our current and accumulated earnings and profits for federal income tax purposes generally will be taxable to a shareholder as ordinary income. Distributions in excess of current and accumulated earnings and profits generally will be treated as a nontaxable reduction of the shareholder’s basis in such shareholder’s shares, to the extent thereof, and thereafter as taxable capital gain. Distributions that are treated as a reduction of the shareholder’s basis in its shares will have the effect of increasing the amount of gain, or reducing the amount of loss, recognized upon the sale of the shareholder’s shares.
The actual amount of future dividends will be determined by the Board of Directors based on the actual results of operations, economic conditions, capital expenditure requirements, the annual distribution requirements under the REIT provisions of the Code, and other factors that the Board of Directors deems relevant.
27
For income tax purposes, distributions paid per share in 2016 were characterized as follows:
|
|
|
|
|
|
|
|
For the year ended December 31, 2016 |
|||
|
|
Amount |
|
% |
|
|
Common Shares: |
|
|
|
|
|
Ordinary income |
$ |
0.070000 |
|
100% |
|
Capital gain |
|
- |
|
- |
|
Return of capital |
|
- |
|
- |
|
Total |
$ |
0.070000 |
|
100% |
|
|
|
|
|
|
|
Series C Preferred Stock: |
|
|
|
|
|
Ordinary income |
$ |
1.649124 |
|
100% |
|
Capital gain |
|
- |
|
- |
|
Return of capital |
|
- |
|
- |
|
Total |
$ |
1.649124 |
|
100% |
|
|
|
|
|
|
|
Series D Preferred Stock: |
|
|
|
|
|
Ordinary income |
$ |
0.494792 |
|
100% |
|
Capital gain |
|
- |
|
- |
|
Return of capital |
|
- |
|
- |
|
Total |
$ |
0.494792 |
|
100% |
The common and preferred share distributions declared on December 6, 2016 and paid on January 5, 2017 and January 3, 2017, respectively, were treated as 2016 dividend distributions for federal income tax purposes.
A portion of the redemption price of the Series A and B Preferred Stock that was redeemed for cash on April 15, 2016 included amounts equal to the accrued and unpaid dividends on such stock. However, the entire redemption price, inclusive of amounts equal to accrued and unpaid dividends, was treated as payment in exchange for the redeemed stock and none of the redemption price is treated as a distribution of dividends under the Code for federal income tax purposes.
No dividends on common stock or preferred stock were paid in or declared related to 2015 or 2014.
Shares Authorized for Issuance Under Equity Compensation Plans
See Part III, Item 12 for a description of securities authorized for issuance under our 2016 Stock Plan.
Share Performance
The following graph compares the yearly percentage change in the cumulative total shareholder return on our common stock for the period December 31, 2011 through December 31, 2016, with the cumulative total return on the SNL Securities Hotel REIT Index (“Hotel REITs Index”) and the Nasdaq Composite (“Nasdaq—Total US Index”) for the same period. The Hotel REIT Index is comprised of publicly traded REITs that focus on investments in hotel properties. The Nasdaq Composite is comprised of all United States common shares traded on the Nasdaq Stock Market. The comparison assumes a starting investment of $100 on December 31, 2011 in our common stock and in each of the indices shown and assumes that all dividends are reinvested. The performance graph is not necessarily indicative of future investment performance.
28
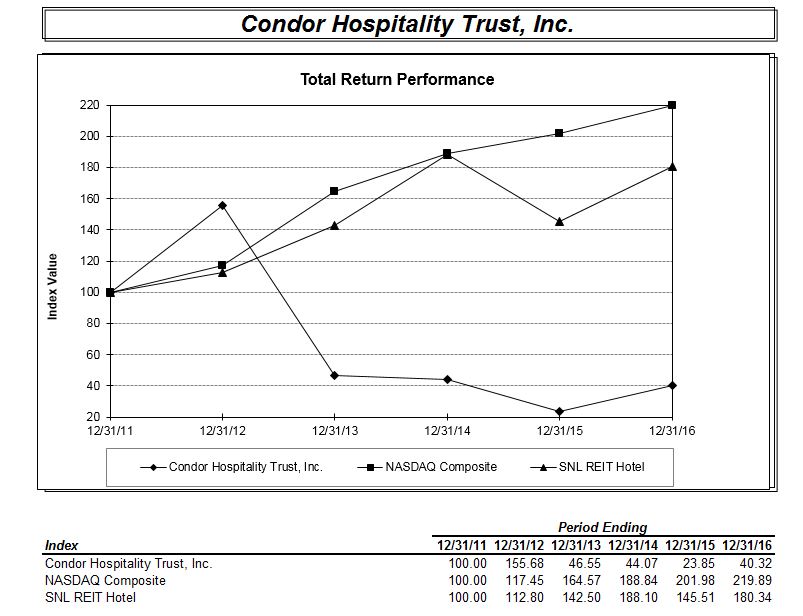
ITEM 6. SELECTED FINANCIAL DATA
The following sets forth selected financial and operating data on a historical consolidated basis. The following information should be read in conjunction with “Item 7. Management’s Discussion and Analysis of Financial Condition and Results of Operations” and our audited consolidated financial statements and related notes thereto, appearing elsewhere in this document.
29
|
|
As of and for the years ended December 31, |
|||||||||||||
|
In thousands, except share and per share data |
||||||||||||||
|
|
2016 |
2015 |
2014 |
2013 |
2012 |
|||||||||
|
|
||||||||||||||
|
Revenue |
||||||||||||||
|
Room rentals and other hotel services |
$ |
50,647 |
$ |
58,714 |
$ |
58,799 |
$ |
55,027 |
$ |
56,990 | ||||
|
Operating expense |
||||||||||||||
|
Hotel and property operations |
37,092 | 43,367 | 44,391 | 43,033 | 42,056 | |||||||||
|
Depreciation and amortization |
5,190 | 5,400 | 6,437 | 6,300 | 6,393 | |||||||||
|
General and administrative |
5,792 | 5,493 | 4,192 | 3,923 | 3,908 | |||||||||
|
Acquisitions and terminated transactions |
550 | 684 |
- |
713 | 240 | |||||||||
|
Terminated equity transactions |
- |
246 | 76 | 1,050 |
- |
|||||||||
|
Total operating expenses |
48,624 | 55,190 | 55,096 | 55,019 | 52,597 | |||||||||
|
Operating income |
2,023 | 3,524 | 3,703 | 8 | 4,393 | |||||||||
|
Net gain (loss) on disposition of assets |
23,132 | 4,798 | (1) | (47) | (9) | |||||||||
|
Equity in loss of joint venture |
(244) |
- |
- |
- |
- |
|||||||||
|
Unrealized derivative gain (loss) |
6,377 | 11,578 | (14,430) | 10,028 | (247) | |||||||||
|
Other income |
55 | 114 | 116 | 34 | 103 | |||||||||
|
Interest expense |
(4,710) | (5,522) | (7,116) | (5,620) | (5,283) | |||||||||
|
Loss on debt extinguishment |
(2,187) | (213) | (158) | (458) | (138) | |||||||||
|
Impairment loss |
(1,477) | (3,829) | (1,269) | (2,438) | (97) | |||||||||
|
Earnings (loss) from continuing operations before income taxes |
22,969 | 10,450 | (19,155) | 1,507 | (1,278) | |||||||||
|
Income tax (expense) benefit |
(125) |
- |
- |
- |
6,588 | |||||||||
|
Earnings (loss) from continuing operations |
22,844 | 10,450 | (19,155) | 1,507 | (7,866) | |||||||||
|
Gain (loss) from discontinued operations, net of tax |
678 | 3,872 | 2,896 | (2,860) | (2,354) | |||||||||
|
Net earnings (loss) |
23,522 | 14,322 | (16,259) | (1,353) | (10,220) | |||||||||
|
(Earnings) loss attributable to noncontrolling interest |
(727) | (1,197) | 23 | 2 | 10 | |||||||||
|
Net earnings (loss) attributable to controlling interests |
22,795 | 13,125 | (16,236) | (1,351) | (10,210) | |||||||||
|
Dividends declared and undeclared and in kind dividends deemed on preferred stock |
(20,748) | (3,632) | (3,452) | (3,349) | (3,169) | |||||||||
|
Net earnings (loss) attributable to common shareholders |
$ |
2,047 |
$ |
9,493 |
$ |
(19,688) |
$ |
(4,700) |
$ |
(13,379) | ||||
|
|
||||||||||||||
|
Weighted average number of common shares - basic |
4,947 | 4,886 | 3,897 | 2,890 | 2,885 | |||||||||
|
Weighted average number of common shares - diluted |
35,981 | 23,241 | 3,897 | 2,890 | 2,885 | |||||||||
|
|
||||||||||||||
|
Basic |
||||||||||||||
|
Basic EPS from continuing operations |
$ |
0.28 |
$ |
1.24 |
$ |
(5.79) |
$ |
(0.64) |
$ |
(3.82) | ||||
|
Basic EPS from discontinued operations |
0.13 | 0.70 | 0.74 | (0.99) | (0.81) | |||||||||
|
Total EPS Basic |
$ |
0.41 |
$ |
1.94 |
$ |
(5.05) |
$ |
(1.63) |
$ |
(4.63) | ||||
|
Diluted |
||||||||||||||
|
Diluted EPS from continuing operations |
$ |
0.12 |
$ |
(0.15) |
$ |
(5.79) |
$ |
(0.64) |
$ |
(3.82) | ||||
|
Diluted EPS from discontinued operations |
0.02 | 0.15 | 0.74 | (0.99) | (0.81) | |||||||||
|
Total EPS Diluted |
$ |
0.14 |
$ |
- |
$ |
(5.05) |
$ |
(1.63) |
$ |
(4.63) | ||||
|
Balance sheet data |
||||||||||||||
|
Total investment in hotel properties, net |
$ |
114,871 |
$ |
130,699 |
$ |
139,182 |
$ |
164,356 |
$ |
191,091 | ||||
|
Cash and cash equivalents |
$ |
8,326 |
$ |
4,870 |
$ |
173 |
$ |
45 |
$ |
891 | ||||
|
Total assets |
$ |
140,665 |
$ |
142,346 |
$ |
144,820 |
$ |
169,500 |
$ |
199,223 | ||||
|
Total debt, net of deferred financing costs, including convertible debt at fair value |
$ |
64,035 |
$ |
86,011 |
$ |
91,063 |
$ |
115,460 |
$ |
130,197 | ||||
|
Total equity |
$ |
70,799 |
$ |
34,495 |
$ |
19,092 |
$ |
32,726 |
$ |
36,651 | ||||
30
ITEM 7. MANAGEMENT’S DISCUSSION AND ANALYSIS OF FINANCIAL CONDITION AND RESULTS OF OPERATIONS
Overview
Condor Hospitality Trust, Inc. is a self-administered REIT for federal income tax purposes that specializes in the investment and ownership of high-quality select-service, limited-service, extended stay, and compact full service hotels. Substantially all of our operations are conducted through CHLP, our operating partnership, of which the Company is the sole general partner. As of December 31, 2016, the Company owned 19 hotels, representing 2,047 rooms, in 12 states, including one hotel owned through an 80% interest in an unconsolidated joint venture.
Condor experienced another year of positive transition in 2016 with significant enhancements to its portfolio composition, equity structure, debt profile, and brand. The Company’s new strategy enabled the Company to announce its first common dividend since 2009. The Company declared and paid three consecutive quarterly dividends commencing in the second quarter of 2016. Significant accomplishments for 2016 are summarized as follows:
Portfolio Composition: In 2016, the Company sold 25 legacy hotels generating $61.4 million of gross proceeds. These legacy asset sales were completed in individual transactions at valuations management believes were attractive. The net proceeds were recycled into two acquisitions. In August 2016, the Company closed on a joint venture to acquire the Aloft Atlanta Downtown for $43.6 million. In December 2016, the Company acquired the Aloft Leawood for $22.5 million. Both of these assets are representative of the Company’s new investment strategy to acquire high-quality, premium-branded, select-service assets. Subsequent to the close of the year, on January 23, 2017, the Company announced that it had executed an agreement to purchase a portfolio of four Home2 Suites hotels for $73.8 million. The transaction is expected to close in the first quarter of 2017, subject to customary closing conditions.
Equity Structure: On March 16, 2016, the Company closed on a $30.0 million private placement, enabling the full redemption, including accrued dividends, of the Series A and Series B Preferred Stock. Simultaneously with the sale and issuance of Condor’s Series D Preferred Stock in the $30.0 million private placement, the Company exchanged all of its outstanding Series C Preferred Stock for new Series D Preferred Stock. Subsequent to the close of 2016, on February 28, 2017, the holders of the Series D Preferred Stock voluntarily converted to common stock. At the time of conversion, the Series D holders were granted $9.3 million of newly created Series E Preferred Stock.
Debt Profile: Subsequent to the close of the year, on March 1, 2017, the Company closed a new $90.0 million secured credit facility. KeyBank and The Huntington National Bank served as the joint lead arrangers for the revolving credit facility. The new credit facility significantly reduced the Company’s weighted average cost of debt and enabled the refinancing of all 2017 and 2018 maturities. The credit facility also enables the Company to accelerate the closing of acquisitions. Management believes the new facility is a strong indicator of Condor’s credit-worthiness and the confidence of the debt community in the Company’s new strategic direction.
Rebranding: The Company completed a comprehensive rebranding in 2016. The Company launched a new website in March 2016 and revised all reporting materials to reflect the new strategic direction of the Company.
With the aforementioned successes serving as a foundation for future growth, Condor’s management is excited about 2017 and is confident in its ability to achieve the mission of providing attractive total returns in the lodging sector to Condor’s shareholders.
Condor remains cautiously optimistic on the outlook of the hospitality sector in 2017. The hospitality sector experienced its seventh straight year of positive RevPAR growth in 2016. The expected decline in the pace of RevPAR growth materialized in 2016 and is expected to continue into 2017. Most industry forecasts estimate that U.S. RevPAR will grow at a slower pace in 2017, generally between 2.0% - 3.0%. The slower pace of RevPAR growth we believe is primarily driven by concerns on new supply and concerns on slowing economic growth. Condor management believes the sectors and segments it targets will see growth in excess of these estimates. While many primary markets have a large influx of new supply, the markets Condor targets are experiencing less
31
aggressive supply growth. Additionally, the markets Condor targets are less affected, we believe, by alternative lodging platforms like Airbnb. These supply factors, combined with the possibility of continued positive economic growth, we believe should enable our hotels to experience growth in RevPAR in 2017.
We believe that the performance of the hotel industry is strongly correlated with the performance of the macro-economy. The equity markets have so far reacted favorably following the U.S. Presidential election. However, it is unknown if the new administration’s policies will have a position or negative impact on the economy. Additionally, the continued threat of terrorism and economic and geopolitical turbulence abroad could derail the macro-economy. Barring any major disruption to the U.S. economy, we expect a continued improvement in lodging fundamentals, with a more tepid improvement in lodging fundamentals in 2017 than in 2016. The manner in which the economy continues to grow, if at all, is not predictable and outside of our control. As a result, there can be no assurances that we will be able to grow our hotel revenue, ADR, occupancy, or RevPAR. Factors that might contribute to less than anticipated performance are detailed in “Item 1A. Risk Factors.” Condor’s management continually monitors the economic environment and works to adjust its strategy to seek to maximize value and returns to shareholders.
Hotel Property Portfolio Activity
Acquisitions
On August 1, 2016, the Company entered into a joint venture with TWC to acquire a 254-room Aloft hotel in downtown Atlanta, Georgia. The Company accounts for the Atlanta JV under the equity method. Condor owns 80% of the Atlanta JV with TWC owning the remaining 20%. The Atlanta JV is comprised of two companies: Spring Street Hotel Property II LLC, of which CHLP indirectly owns an 80% equity interest, and Spring Street Hotel OpCo II LLC, of which our TRS indirectly owns an 80% equity interest. TWC owns the remaining 20% equity interest in these two companies.
On August 22, 2016, the Atlanta JV closed on the acquisition of the Atlanta Aloft hotel for a purchase price of $43.6 million, subject to working capital and similar adjustments. A summary of this acquisition and its funding as completed by the Atlanta JV is as follows (in thousands):
|
|
|
|
|
|
|
|
|
|
|
|
|
|
|
|
|
|
|
|
|
|
|
|
Hotel |
|
Land |
|
Buildings, improvements, and vehicles |
|
Furniture and equipment |
|
Land option (1) |
|
Total purchase price |
|
Debt originated at acquisition |
|
Net cash |
|||||||
|
Aloft |
|
$ |
13,025 |
|
$ |
34,048 |
|
$ |
2,667 |
|
$ |
(6,190) |
|
$ |
43,550 |
|
$ |
33,750 |
|
$ |
9,800 |
|
Atlanta, GA |
|
|
|
|
|
|
|
|
|
|
|
|
|
|
|
|
|
|
|
|
|
|
(1) |
The purchase agreement includes a provision which permits the seller to purchase the surface parking lot north of the hotel exercisable for ten years at less than market rates |
The purchase price for the Atlanta Aloft was paid by the Atlanta JV with $9.8 million in cash, of which $7.8 million was contributed by Condor and $2.0 million was contributed by TWC, and $33.8 million of proceeds from a term loan secured by the property. Condor additionally contributed $1.4 million and TWC additionally contributed $0.4 million to the Atlanta JV to cover acquisition costs and to provide working capital to the entity.
On December 14, 2016, we also acquired one wholly-owned hotel, the 156-room Aloft Leawood / Overland Park (Kansas City) through a single-purpose bankruptcy remove entity 100% owned by CHLP. A summary of this acquisition and its funding is as follows (in thousands):
|
Hotel |
Land |
Buildings, improvements, and vehicles |
Furniture and equipment |
Total purchase price |
Debt originated at acquisition |
Issuance of CHLP common units |
Net cash |
||||||||||||||
|
Aloft |
$ |
3,339 |
$ |
18,046 |
$ |
1,115 |
$ |
22,500 |
$ |
15,925 |
$ |
50 |
$ |
6,525 |
|||||||
|
Leawood, KS |
|||||||||||||||||||||
32
The $22.5 million purchase price was funded with the proceeds of two mortgage loans provided by Great Western Bank totaling $15.9 million, approximately $6.5 million in cash, and the issuance of 213,904 operating units in CHLP with a value of $50,000.
During 2015, we acquired three wholly-owned premium select-service hotel properties through three single-purpose bankruptcy remote entities 100% owned by CHLP from affiliates of Peachtree Hotel Group II, LLC. A summary of these acquisitions and their funding is as follows (in thousands):
|
|
|
|
|
|
|
|
|
|
|
|
|
|
|
|
|
|
|
|
|
|
|
|
|
|
|
|
|
Hotel |
|
Acquisition date |
|
Land |
|
Building, improvements, and vehicles |
|
Furniture and equipment |
|
Total purchase price |
|
Assumption of debt |
|
Debt originated at acquisition |
|
Issuance of CHLP common units |
|
Net cash |
||||||||
|
Hotel Indigo |
|
10/2/2015 |
|
$ |
800 |
|
$ |
8,700 |
|
$ |
1,500 |
|
$ |
11,000 |
|
$ |
- |
|
$ |
5,000 |
|
$ |
150 |
|
$ |
5,850 |
|
Atlanta, GA |
|
|
|
|
|
|
|
|
|
|
|
|
|
|
|
|
|
|
|
|
|
|
|
|
|
|
|
Marriott Courtyard |
|
10/2/2015 |
|
|
2,100 |
|
|
11,050 |
|
|
850 |
|
|
14,000 |
|
|
- |
|
|
10,100 |
|
|
150 |
|
|
3,750 |
|
Jacksonville, FL |
|
|
|
|
|
|
|
|
|
|
|
|
|
|
|
|
|
|
|
|
|
|
|
|
|
|
|
SpringHill Suites |
|
10/1/2015 |
|
|
1,597 |
|
|
14,353 |
|
|
1,550 |
|
|
17,500 |
|
|
11,220 |
|
|
- |
|
|
150 |
|
|
6,130 |
|
San Antonio, TX |
|
|
|
|
|
|
|
|
|
|
|
|
|
|
|
|
|
|
|
|
|
|
|
|
|
|
|
Total |
|
|
|
$ |
4,497 |
|
$ |
34,103 |
|
$ |
3,900 |
|
$ |
42,500 |
|
$ |
11,220 |
|
$ |
15,100 |
|
$ |
450 |
|
$ |
15,730 |
|
|
|
|
|
|
|
|
|
|
|
|
|
|
|
|
|
|
|
|
|
|
|
|
|
|
|
|
The $42.5 million purchase price was funded with the assumption of one loan with an aggregate outstanding principal balance of $11.2 million and two newly originated GE Capital loans (sold to Western Alliance Bank (“WAB”) in April 2016) totaling $15.1 million. The remaining $16.2 million was funded with $14.9 million in cash, approximately $0.8 million of borrowings from the Company’s existing credit facility with Great Western Bank, and the issuance of operating units from CHLP representing limited partnership interest in that entity. A total of 2,298,879 operating units in CHLP were issued with a value of $450,000.
There were no hotel acquisitions in 2014.
Additionally, as discussed further in the Subsequent Events footnote to the consolidated financial statements, on January 23, 2017 the Company executed an agreement to purchase a portfolio of four Home2 Suites hotels for $73.8 million. The portfolio includes the Home2 Suites Memphis / Southaven, the Home2 Suites Austin / Round Rock, the Home2 Suites Lexington University / Medical Center (Kentucky), and the Home2 Suites Tallahassee State Capitol. The closing of these acquisitions is anticipated to occur in the first quarter of 2017, but is subject to customary closing conditions including accuracy of representations and warrants and compliance with covenants and obligations.
33
Dispositions
Pursuant to our disposition strategy, the following hotel sales were executed in 2016:
|
|
Number of |
Gross proceeds |
|||||||||
|
Date of sale |
Location |
Brand |
Condor lender |
rooms |
(in thousands) |
||||||
|
01/04/16 |
Kirksville, MO |
Super 8 |
Great Western |
61 |
$ |
1,525 | |||||
|
01/07/16 |
Lincoln, NE |
Super 8 |
Great Western |
133 | 2,800 | ||||||
|
01/08/16 |
Greenville, SC |
Savannah Suites |
Western Alliance Bank |
170 | 2,700 | ||||||
|
03/30/16 |
Portage, WI |
Super 8 |
Morgan Stanley |
61 | 2,375 | ||||||
|
04/25/16 |
O'Neill, NE |
Super 8 |
Morgan Stanley |
72 | 1,725 | ||||||
|
05/10/16 |
Culpeper, VA |
Quality Inn |
Morgan Stanley |
49 | 2,200 | ||||||
|
05/19/16 |
Storm Lake, IA |
Super 8 |
Morgan Stanley |
59 | 2,800 | ||||||
|
05/24/16 |
Cleveland, TN |
Clarion |
Morgan Stanley |
59 | 2,231 | ||||||
|
05/26/16 |
Coralville, IA |
Super 8 |
Morgan Stanley |
84 | 3,375 | ||||||
|
05/27/16 |
Keokuk, IA |
Super 8 |
Morgan Stanley |
61 | 2,153 | ||||||
|
06/06/16 |
Chambersburg, PA |
Comfort Inn |
Morgan Stanley |
63 | 2,150 | ||||||
|
08/08/16 |
Pittsburg, KS |
Super 8 |
Morgan Stanley |
64 | 1,620 | ||||||
|
09/09/16 |
Mt. Pleasant, IA |
Super 8 |
Morgan Stanley |
54 | 1,850 | ||||||
|
09/19/16 |
Danville, KY |
Quality Inn |
Morgan Stanley |
63 | 2,288 | ||||||
|
09/26/16 |
Menomonie, WI |
Super 8 |
Morgan Stanley |
81 | 3,000 | ||||||
|
10/14/16 |
Glasgow, KY |
Comfort Inn |
Western Alliance Bank |
60 | 2,400 | ||||||
|
11/04/16 |
Sioux Falls, SD |
Days Inn |
Western Alliance Bank |
86 | 2,095 | ||||||
|
11/07/16 |
Shelby, NC |
Comfort Inn |
Morgan Stanley |
76 | 4,090 | ||||||
|
11/17/16 |
Rocky Mount, VA |
Comfort Inn |
Morgan Stanley |
61 | 2,160 | ||||||
|
11/17/16 |
Farmville, VA |
Days Inn |
Morgan Stanley |
59 | 2,390 | ||||||
|
11/18/16 |
Marion, IN |
Comfort Suites |
Huntington |
62 | 2,992 | ||||||
|
11/30/16 |
Farmville, VA |
Comfort Inn |
Morgan Stanley |
50 | 2,573 | ||||||
|
12/05/16 |
Princeton, WV |
Quality Inn |
Morgan Stanley |
50 | 2,150 | ||||||
|
12/21/16 |
Burlington, IA |
Super 8 |
Morgan Stanley |
62 | 2,860 | ||||||
|
12/22/16 |
Atlanta, GA |
Savannah Suites |
Western Alliance Bank |
164 | 2,925 | ||||||
|
|
Total |
1,864 |
$ |
61,427 | |||||||
|
|
|||||||||||
Net proceeds, after expenses and debt repayment, totaled $19.2 million in 2016. In 2015, 17 hotels with 1,673 rooms were sold for gross proceeds of $54.7 million, and net proceeds, after expenses and debt repayment, of $25.3 million. In 2014, 13 hotels with 1,265 rooms were sold for gross proceeds of $22.3 million, and net proceeds, after expenses and debt repayment, of $2.6 million.
Based on the criteria discussed in the footnotes to the consolidated financial statements, as of December 31, 2016, the Company had seven hotels classified as held for sale. At the beginning of 2016, the Company had 16 hotels held for sale and during the year classified an additional 16 hotels as held for sale. Twenty-five of these hotels were sold during 2016. If a hotel is considered held for sale as of the most recent balance sheet presented or was sold in any period presented, the hotel property and the debt it collateralizes are shown as held for sale in all periods presented.
As discussed in the footnotes to the consolidated financial statements, as of October 1, 2014 we adopted ASU 2014-08 which changes the criteria for reporting a discontinued operation such that only disposals representing a strategic shift in operations should be presented as discontinued operations subsequent to adoption. As a result of this adoption, only the operations of hotels meeting the criteria to be considered held for sale prior to October 1, 2014 (excluding those subsequently reclassified as held for use), none of which remain unsold at December 31, 2016, are included in discontinued operations for all periods presented as no individual hotel disposition represents a strategic shift that has (or will have) a major effect on our operations or financial results.
34
Operating Performance Metrics
The following table presents our RevPAR, ADR, and occupancy for our same store operations. The comparisons for same store operations include all of our hotels owned as of December 31, 2016 with the exception of the three hotels we acquired in October 2015, the hotel acquired through our Atlanta JV in August 2016, and the hotel acquired in December 2016 (14 hotels included in same store results, seven of which are considered held for use (“HFU”) and seven of which are considered held for sale (“HFS”)). All hotels included in same store operations were owned throughout each of the periods presented. The performance metrics for the hotels acquired in 2015 and 2016 represent post-acquisition operations only and are separately presented. Performance metrics presented for the hotel owned through our Atlanta JV reflect 100% of the operating results of the property including our interest and the interest of our joint venture partner.
|
|
Year ended December 31, |
||||||||||||||||||||||
|
|
2016 |
2015 |
2014 |
||||||||||||||||||||
|
|
Occupancy |
ADR |
RevPAR |
Occupancy |
ADR |
RevPAR |
Occupancy |
ADR |
RevPAR |
||||||||||||||
|
Same store HFU |
65.52% |
$ |
83.96 |
$ |
55.00 | 67.71% |
$ |
82.33 |
$ |
55.75 |
67.83.% |
$ |
76.15 |
$ |
51.65 | ||||||||
|
Same store HFS |
56.93% | 70.43 | 40.10 | 60.45% | 67.84 | 41.01 | 68.84% | 63.12 | 43.45 | ||||||||||||||
|
Total same store |
61.41% |
$ |
77.96 |
$ |
47.87 | 64.22% |
$ |
75.79 |
$ |
48.67 | 68.31% |
$ |
69.85 |
$ |
47.72 | ||||||||
|
|
|||||||||||||||||||||||
|
October 2015 Acquisitions |
72.92% |
$ |
113.39 |
$ |
82.68 | 65.22% |
$ |
116.48 |
$ |
75.97 |
- |
$ |
- |
$ |
- |
||||||||
|
Aloft Atlanta JV |
69.87% |
$ |
136.97 |
$ |
95.70 |
- |
$ |
- |
$ |
- |
- |
$ |
- |
$ |
- |
||||||||
|
Aloft Leawood |
68.20% |
$ |
102.76 |
$ |
70.08 |
- |
$ |
- |
$ |
- |
- |
$ |
- |
$ |
- |
||||||||
In the same store HFU portfolio of hotels, 2016 RevPAR decreased 1.3%, driven by a decrease of 3.2% in occupancy partially offset by an increase of 2.0% in ADR. This decrease in occupancy was driven by market challenges facing these hotels as a result of declines in the oil and gas, rail, and fracking industries as well as renovation interruption at three of these hotels during the 2016. Despite the decrease in occupancy, the Company was able to increase ADR due to continued improvement in the economy and, to a lesser extent, decreases in inventory as a result of the ongoing renovations at certain hotels.
In the same store HFU portfolio of hotels, 2015 RevPAR increased 7.9% from 2014, driven by an increase in ADR of 8.1%. In 2015, the Company focused on increasing ADR in light of an improving economy and increasing leisure and transient travel.
Results of Operations
Comparison of the year ended December 31, 2016 to the year ended December 31, 2015 (in thousands, except per share amounts)
|
|
|
|
|
|
|
|
|
|
|
|
|
|
|
|
|
|
|
|
|
|
|
|
Year ended December 31, |
|||||||||||||||||||
|
|
2016 |
|
2015 |
|
|
|||||||||||||||
|
|
Continuing operations |
|
Discontinued operations |
|
Total |
|
Continuing operations |
|
Discontinued operations |
|
Total |
|
Continuing operations variance |
|||||||
|
Revenue |
$ |
50,647 |
|
$ |
6 |
|
$ |
50,653 |
|
$ |
58,714 |
|
|
2,923 |
|
$ |
61,637 |
|
$ |
(8,067) |
|
Hotel and property operations expense |
|
(37,092) |
|
|
(4) |
|
|
(37,096) |
|
|
(43,367) |
|
|
(1,946) |
|
|
(45,313) |
|
|
6,275 |
|
Depreciation and amortization expense |
|
(5,190) |
|
|
- |
|
|
(5,190) |
|
|
(5,400) |
|
|
- |
|
|
(5,400) |
|
|
210 |
|
General and administrative expense |
|
(5,792) |
|
|
- |
|
|
(5,792) |
|
|
(5,493) |
|
|
- |
|
|
(5,493) |
|
|
(299) |
|
Acquisition and terminated transactions expense |
|
(550) |
|
|
- |
|
|
(550) |
|
|
(684) |
|
|
- |
|
|
(684) |
|
|
134 |
|
Terminated equity transactions |
|
- |
|
|
- |
|
|
- |
|
|
(246) |
|
|
- |
|
|
(246) |
|
|
246 |
|
Net gain (loss) on disposition of assets |
|
23,132 |
|
|
681 |
|
|
23,813 |
|
|
4,798 |
|
|
2,997 |
|
|
7,795 |
|
|
18,334 |
|
Equity in loss of joint venture |
|
(244) |
|
|
- |
|
|
(244) |
|
|
- |
|
|
- |
|
|
- |
|
|
(244) |
|
Net gain on derivatives and convertible debt |
|
6,377 |
|
|
- |
|
|
6,377 |
|
|
11,578 |
|
|
- |
|
|
11,578 |
|
|
(5,201) |
|
Other income (expense) |
|
55 |
|
|
- |
|
|
55 |
|
|
114 |
|
|
- |
|
|
114 |
|
|
(59) |
|
Interest expense |
|
(4,710) |
|
|
(5) |
|
|
(4,715) |
|
|
(5,522) |
|
|
(223) |
|
|
(5,745) |
|
|
812 |
|
Loss on extinguishment of debt |
|
(2,187) |
|
|
- |
|
|
(2,187) |
|
|
(213) |
|
|
- |
|
|
(213) |
|
|
(1,974) |
|
Impairment (loss) recovery |
|
(1,477) |
|
|
- |
|
|
(1,477) |
|
|
(3,829) |
|
|
121 |
|
|
(3,708) |
|
|
2,352 |
|
Income tax expense |
|
(125) |
|
|
- |
|
|
(125) |
|
|
- |
|
|
- |
|
|
- |
|
|
(125) |
|
Net earnings |
$ |
22,844 |
|
$ |
678 |
|
$ |
23,522 |
|
$ |
10,450 |
|
$ |
3,872 |
|
$ |
14,322 |
|
$ |
12,394 |
35
Revenue
During 2016, revenue from continuing operations decreased by $8,067 between the periods. Revenue from properties acquired in and subsequent to the fourth quarter of 2015 increased $10,175 and revenue from our other held for use assets remained consistent, decreasing by $129. Revenue from held for sale and sold properties decreased by $18,113 driven by property sales during the periods presented.
Expenses
Hotel and property operations expense from continuing operations decreased by $6,275, driven by declines resulting from sold hotels partially offset by increases related to newly acquired properties. In totality, hotel and operations expenses from continuing operations decreased as a percentage of revenue by 0.6% because of increases in ADR and because the legacy hotels that remain in our portfolio and our recent acquisitions have higher operating margins than the hotels that were sold during the period.
Interest expense and depreciation expense from continuing operations decreased by $812 and $210, respectively, between the periods as a result of a net decrease in the size of the Company’s hotel portfolio and thus its debt levels. Additionally, interest expense was favorably impacted by a decrease in the weighted average interest rate on total debt outstanding between the periods, from 5.31% at December 31, 2015 to 4.86% at December 31, 2016, as a result of debt repaid upon the sale of properties and the lower than average interest rate obtained on the Great Western Bank debt obtained as part of the Leawood Aloft acquisition in December 2016.
The $299 increase in general and administrative expense was driven by increased compensation expense resulting from compensation arrangements put into place with the new management team in 2015 as well as increased professional fees associated with increased business activity in 2016. These increases were partially offset by decreased directors’ and officers’ insurance premiums and decreased employee recruiting costs following significant executive recruiting in 2015.
Acquisition and terminated transaction costs will fluctuate period to period based on our acquisition activities. Acquisition costs typically consist of transfer taxes, legal fees, and other costs associated with acquiring a hotel property as well as transactions that were terminated during the year.
The $246 of terminated equity transactions expense in 2015 consists of charges incurred in the preparation of an exchange offer commenced on August 6, 2015. This offer was withdrawn on September 17, 2015.
Impairment Losses
In 2016, we incurred $1,477 of impairment losses, all of which was included in continuing operations. In 2015, we incurred $3,708 of impairment losses, all of which was included in continuing operations with the exception of net recovery of $121 included in discontinued operations. All impairments recognized in both years related either to hotels held for sale at some point or sold during the year.
Dispositions
In 2016, twenty-four hotels were sold with gains totaling $24,256 and one hotel was sold with no gain as it had been previously impaired. In 2015, eight hotels were sold with gains totaling $7,759 and nine hotels were sold with no gain as they had been previously impaired.
Net Gain on Derivatives and Convertible Debt
The change in net gain on derivatives and convertible debt was driven by the change in fair value of the derivative liabilities for the current year compared to the year ended December 31, 2015. The fair value of the derivative liabilities decreased by an aggregate of $6,680 during 2016 and $11,578 during 2015. The decreases in fair value in both periods was primarily a result of a decrease in the Company’s stock price during the periods, which in turn
36
decreases the value assigned to the conversion feature of the Series C Preferred Stock and the outstanding common stock warrants throughout 2015 and while being marked to market in the first quarter of 2016.
Income Tax Expense
As of both December 31, 2016 and 2015, a full valuation allowance continued to be recorded against the net deferred tax asset due to the uncertainty of realization because of historical operating losses. As such, no income tax expense or benefit was recorded during either year with the exception of amounts totaling $125 for alternative minimum tax recorded in 2016 related to the use of net operating losses during the period. Management believes the combined federal and state income tax rate for the TRS will be approximately 38% and income tax benefit or expense will vary based on the taxable earnings or loss of the TRS.
Comparison of the year ended December 31, 2015 to the year ended December 31, 2014 (in thousands, except per share amounts)
|
|
|
|
|
|
|
|
|
|
|
|
|
|
|
|
|
|
|
|
|
|
|
|
Year ended December 31, |
|||||||||||||||||||
|
|
2015 |
|
2014 |
|
|
|||||||||||||||
|
|
Continuing operations |
|
Discontinued operations |
|
Total |
|
Continuing operations |
|
Discontinued operations |
|
Total |
|
Continuing operations variance |
|||||||
|
Revenue |
$ |
58,714 |
|
$ |
2,923 |
|
$ |
61,637 |
|
$ |
58,799 |
|
$ |
13,579 |
|
$ |
72,378 |
|
$ |
(85) |
|
Hotel and property operations expense |
|
(43,367) |
|
|
(1,946) |
|
|
(45,313) |
|
|
(44,391) |
|
|
(10,410) |
|
|
(54,801) |
|
|
1,024 |
|
Depreciation and amortization expense |
|
(5,400) |
|
|
- |
|
|
(5,400) |
|
|
(6,437) |
|
|
(112) |
|
|
(6,549) |
|
|
1,037 |
|
General and administrative expense |
|
(5,493) |
|
|
- |
|
|
(5,493) |
|
|
(4,192) |
|
|
- |
|
|
(4,192) |
|
|
(1,301) |
|
Acquisition and terminated transactions expense |
|
(684) |
|
|
- |
|
|
(684) |
|
|
- |
|
|
- |
|
|
- |
|
|
(684) |
|
Terminated equity transactions |
|
(246) |
|
|
- |
|
|
(246) |
|
|
(76) |
|
|
- |
|
|
(76) |
|
|
(170) |
|
Net gain on disposition of assets |
|
4,798 |
|
|
2,997 |
|
|
7,795 |
|
|
(1) |
|
|
2,751 |
|
|
2,750 |
|
|
4,799 |
|
Equity in loss of joint venture |
|
- |
|
|
- |
|
|
- |
|
|
- |
|
|
- |
|
|
- |
|
|
- |
|
Net gain on derivatives and convertible debt |
|
11,578 |
|
|
- |
|
|
11,578 |
|
|
(14,430) |
|
|
- |
|
|
(14,430) |
|
|
26,008 |
|
Other income |
|
114 |
|
|
- |
|
|
114 |
|
|
116 |
|
|
- |
|
|
116 |
|
|
(2) |
|
Interest expense |
|
(5,522) |
|
|
(223) |
|
|
(5,745) |
|
|
(7,116) |
|
|
(1,140) |
|
|
(8,256) |
|
|
1,594 |
|
Loss on extinguishment of debt |
|
(213) |
|
|
- |
|
|
(213) |
|
|
(158) |
|
|
(120) |
|
|
(278) |
|
|
(55) |
|
Impairment (loss) recovery |
|
(3,829) |
|
|
121 |
|
|
(3,708) |
|
|
(1,269) |
|
|
(1,652) |
|
|
(2,921) |
|
|
(2,560) |
|
Income tax expense |
|
- |
|
|
- |
|
|
- |
|
|
|
|
|
- |
|
|
- |
|
|
- |
|
Net earnings |
$ |
10,450 |
|
$ |
3,872 |
|
$ |
14,322 |
|
$ |
(19,155) |
|
$ |
2,896 |
|
$ |
(16,259) |
|
$ |
29,605 |
Revenue
During 2015, revenue from continuing operations remained stable, decreasing by $85 between the periods. Revenue from properties acquired in the fourth quarter of 2015 totaled $2,611 and revenue from our other held for use assets increased $1,117, largely driven by an improving economy and a mild winter in early 2015 which increased construction and special projects business at our properties. Revenue from held for sale and sold properties included in continuing operations decreased by $3,813 driven by property sales during the periods presented.
Expenses
Hotel and property operations expense from continuing operations decreased by $1,024, driven by declines resulting from sold hotels. The decrease in these expenses outpaced the decrease in revenue because of increases in ADR as discussed above and because the legacy hotels that remained in our portfolio in 2015 and our 2015 acquisitions have higher operating margins than the hotels that were sold during the period.
Interest expense from continuing operations and depreciation expense from continuing operations decreased by $1,594 and $1,037, respectively, between the periods as a result of a net decrease in the size of the Company’s hotel portfolio and thus its debt levels. Additionally, interest expense was favorably impacted by a decrease in the weighted average interest rate on total debt outstanding between the periods, from 6.48% at December 31, 2014 to 5.31% at December 31, 2015, as a result of debt repaid upon the sale of properties and debt refinancings during 2015.
37
The $1,301 increase in general and administrative expense was driven by increased compensation expense resulting from compensation arrangements put into place with the new management team in 2015 and severance accrued for management who left the Company during the year, as well as recruiting expenses incurred in relation to those transitions. Increased director and officer insurance premiums, increased travel, legal, and professional fees expense resulting from our name change, increased transactional activity during the year, and increased directors’ fees resulting from the increased size of our Board of Directors also contributed to this change.
Acquisition and terminated transaction costs will fluctuate period to period based on our acquisition activities. Acquisition costs typically consist of transfer taxes, legal fees, and other costs associated with acquiring a hotel property as well as expenses incurred related to transactions that were terminated during the year. The increase in these expenses in 2015 was a result of the three acquisitions consummated during the year as well as increased activity by management to review potential future transactions.
The $246 of terminated equity transactions expense in 2015 consists of charges incurred in the preparation of an exchange offer commenced on August 6, 2015. This offer was withdrawn on September 17, 2015.
Impairment (Loss) Recovery
In 2015, we incurred $3,708 of impairment losses, all of which were included in continuing operations with the exception of net recovery of $121 included in discontinued operations. In 2014, we incurred impairment losses totaling $2,921, of which $1,269 was in continuing operations and $1,652 was in discontinued operations. All impairments recognized in both years related either to hotels held for sale at some point or sold during the year.
Dispositions
In 2015, eight hotels were sold with gains totaling $7,759 and nine hotels were sold that had been previously impaired and as such had no gains. In 2014, five hotels were sold with gains totaling $2,749 and eight hotels were sold that had been previously impaired and as such had no gains.
Net Gain (Loss) on Derivatives and Convertible Debt
The change in net gain (loss) on derivatives and convertible debt was driven by the relative changes in derivative value between the years ended December 31, 2015 and 2014. The fair value of the derivative liabilities decreased by an aggregate of $11,578 during 2015 and increased by $14,430 during 2014. The decrease in fair value in 2015 was primarily a result of a decrease in the Company’s stock price in 2015, which in turn decreases the value assigned to the conversion feature of the Series C Preferred Stock and the outstanding common stock warrants. The increase in fair value in 2014 was primarily due to the change in exercise price of the related warrants adjusted downward from $9.60 to $1.92, and to a change in the conversion price of the Series C Preferred Stock from $8.00 to $1.60, the public offering price of the common stock in the Company’s subscription rights offering concluded on June 6, 2014.
Income Tax Expense
As of December 31, 2015 and 2014, a full valuation allowance continued to be recorded against the net deferred tax asset due to the uncertainty of realization because of historical operating losses. As such, no income tax expense or benefit was recorded for the years ended December 31, 2015 or 2014. Management believes the combined federal and state income tax rate for the TRS will be approximately 38% and income tax benefit or expense will vary based on the taxable earnings or loss of the TRS.
Non-GAAP Financial Measures
Non-GAAP financial measures are measures of our historical financial performance that are different from measures calculated and presented in accordance with accounting principles generally accepted in the United States of America (“GAAP”). We report Funds from Operations (“FFO”), Adjusted FFO (“AFFO”), Earnings Before Interest, Taxes, Depreciation, and Amortization (“EBITDA”), Adjusted EBITDA, and Hotel EBITDA as non-GAAP measures that we believe are useful to investors as key measures of our operating results and which management
38
uses to facilitate a periodic evaluation of our operating results relative to those of our peers. Our non-GAAP measures should not be considered as an alternative to U.S. GAAP net earnings as an indication of financial performance or to U.S. GAAP cash flows from operating activities as a measure of liquidity. Additionally, these measures are not indicative of funds available to fund cash needs or our ability to make cash distributions as they have not been adjusted to consider cash requirements for capital expenditures, property acquisitions, debt service obligations, or other commitments.
Funds from Operations (“FFO”) & Adjusted FFO (“AFFO”)
We calculate FFO in accordance with the standards established by the National Association of Real Estate Investment Trusts (“NAREIT”), which defines FFO as net earnings computed in accordance with GAAP, excluding gains or losses from sales of real estate assets, impairment, and the depreciation and amortization of real estate assets. FFO is calculated both for the Company in total and as FFO attributable to common shares and partnership units, which is FFO excluding preferred stock dividends. AFFO is FFO attributable to common shares and partnership units adjusted to exclude items we do not believe are representative of the results from our core operations, such as non-cash gains or losses on derivative liabilities and convertible debt and cash charges for acquisition or equity raising costs. All REITs do not calculate FFO and AFFO in the same manner; therefore, our calculation may not be the same as the calculation of FFO and AFFO for similar REITs.
We consider FFO and AFFO to be useful additional measures of performance for an equity REIT because they facilitate an understanding of the operating performance of our properties without giving effect to real estate depreciation and amortization, which assumes that the value of real estate assets diminishes predictably over time. Since real estate values have historically risen or fallen with market conditions, we believe that FFO and AFFO provide a meaningful indication of our performance.
The following table reconciles net earnings (loss) to FFO and AFFO for the years ended December 31 (in thousands). All amounts presented include both continuing and discontinued operations as well as our portion of the results of our unconsolidated Atlanta JV.
|
|
|
|
|
|
|
|
|
|
|
|
|
Year ended December 31, |
||||||||
|
Reconciliation of Net earnings (loss) to FFO and AFFO |
2016 |
|
2015 |
|
2014 |
|
|||
|
Net earnings (loss) |
$ |
23,522 |
|
$ |
14,322 |
|
$ |
(16,259) |
|
|
Depreciation and amortization expense |
|
5,190 |
|
|
5,400 |
|
|
6,549 |
|
|
Depreciation and amortization expense from JV |
|
377 |
|
|
- |
|
|
- |
|
|
Net gain on disposition of assets |
|
(23,813) |
|
|
(7,795) |
|
|
(2,750) |
|
|
Net loss on disposition of assets from JV |
|
2 |
|
|
- |
|
|
- |
|
|
Impairment loss |
|
1,477 |
|
|
3,708 |
|
|
2,921 |
|
|
FFO |
|
6,755 |
|
|
15,635 |
|
|
(9,539) |
|
|
Dividends declared and undeclared and in kind dividends deemed on preferred stock |
|
(20,748) |
|
|
(3,632) |
|
|
(3,452) |
|
|
FFO attributable to common shares and partnership units |
|
(13,993) |
|
|
12,003 |
|
|
(12,991) |
|
|
Net (gain) loss on derivatives and convertible debt |
|
(6,377) |
|
|
(11,578) |
|
|
14,430 |
|
|
Net loss on derivatives from JV |
|
5 |
|
|
- |
|
|
- |
|
|
Acquisitions and terminated transactions expense |
|
550 |
|
|
684 |
|
|
- |
|
|
Acquisition expense from JV |
|
239 |
|
|
- |
|
|
- |
|
|
Gain on debt conversion |
|
- |
|
|
- |
|
|
(88) |
|
|
Terminated equity transactions expense |
|
- |
|
|
246 |
|
|
76 |
|
|
AFFO attributable to common shares and partnership units |
$ |
(19,576) |
|
$ |
1,355 |
|
$ |
1,427 |
|
39
Earnings Before Interest, Taxes, Depreciation, and Amortization (“EBITDA”), Adjusted EBITDA, and Hotel EBITDA
We calculate EBITDA and Adjusted EBITDA by adding back to net earnings certain non-operating expenses and certain non-cash charges which are based on historical cost accounting that we believe may be of limited significance in evaluating current performance. We believe these adjustments can help eliminate the accounting effects of depreciation and amortization and financing decisions and facilitate comparisons of core operating profitability between periods. In calculating EBITDA, we add back to net earnings interest expense, loss on debt extinguishment, income tax expense, and depreciation and amortization expense. In calculating Adjusted EBITDA, we adjust EBITDA to add back net gain/loss on disposition of assets, acquisition and terminated transactions expense, and terminated equity transactions expense, which are cash charges. We also add back impairment and gain or loss on derivatives and convertible debt, which are non-cash charges. EBITDA and Adjusted EBITDA, as presented, may not be comparable to similarly titled measures of other companies.
We believe EBITDA and Adjusted EBITDA to be useful additional measures of our operating performance, excluding the impact of our capital structure (primarily interest expense), our asset base (primarily depreciation and amortization expense), and other items we do not believe are representative of the results from our core operations.
The Company further excludes general and administrative expenses, other non-operating income or expense, and certain hotel and property operations expenses that are not allocated to individual properties in assessing hotel performance (primarily certain general liability and other insurance costs, land lease costs, and office and banking fees) from Adjusted EBITDA to calculate Hotel EBITDA. Hotel EBITDA is similar to the non-GAAP measure of Property Operating Income (“POI”) presented in filings prior to the September 30, 2016 Form 10-Q except that Hotel EBITDA also excludes the unallocated hotel and property operations expenses previously included in POI. Hotel EBITDA, as presented, may not be comparable to similarly titled measures of other companies.
Hotel EBITDA is intended to isolate property level operational performance over which the Company’s hotel operators have direct control. We believe Hotel EBITDA is helpful to investors as it better communicates the comparability of our hotels’ operating results for all of the Company’s hotel properties and is used by management to measure the performance of the Company’s hotels and the effectiveness of the operators of the hotels.
The following table reconciles net earnings (loss) to EBITDA, Adjusted EBITDA, and Hotel EBITDA for the years ended December 31 (in thousands). All amounts presented include both continuing and discontinued operations as well as our portion of the results of our unconsolidated Atlanta JV.
40
|
|
|
|
|
|
|
|
|
|
|
|
Year ended December 31, |
|||||||
|
Reconciliation of Net earnings (loss) to EBITDA, Adjusted EBITDA, and Hotel EBITDA |
2016 |
|
2015 |
|
2014 |
|||
|
Net earnings (loss) |
$ |
23,522 |
|
$ |
14,322 |
|
$ |
(16,259) |
|
Interest expense |
|
4,715 |
|
|
5,745 |
|
|
8,256 |
|
Interest expense from JV |
|
618 |
|
|
- |
|
|
- |
|
Loss on debt extinguishment |
|
2,187 |
|
|
213 |
|
|
278 |
|
Income tax expense |
|
125 |
|
|
- |
|
|
- |
|
Depreciation and amortization expense |
|
5,190 |
|
|
5,400 |
|
|
6,549 |
|
Depreciation and amortization expense from JV |
|
377 |
|
|
- |
|
|
- |
|
EBITDA |
|
36,734 |
|
|
25,680 |
|
|
(1,176) |
|
Net gain on disposition of assets |
|
(23,813) |
|
|
(7,795) |
|
|
(2,750) |
|
Net loss on disposition of assets from JV |
|
2 |
|
|
- |
|
|
- |
|
Impairment loss |
|
1,477 |
|
|
3,708 |
|
|
2,921 |
|
Net (gain) loss on derivatives and convertible debt |
|
(6,377) |
|
|
(11,578) |
|
|
14,430 |
|
Net loss on derivatives from JV |
|
5 |
|
|
- |
|
|
- |
|
Acquisitions and terminated transactions expense |
|
550 |
|
|
684 |
|
|
- |
|
Acquisition expense from JV |
|
239 |
|
|
- |
|
|
- |
|
Gain on debt conversion |
|
- |
|
|
- |
|
|
(88) |
|
Terminated equity transactions expense |
|
- |
|
|
246 |
|
|
76 |
|
Adjusted EBITDA |
|
8,817 |
|
|
10,945 |
|
|
13,413 |
|
General and administrative expense |
|
5,792 |
|
|
5,493 |
|
|
4,192 |
|
Other income |
|
(55) |
|
|
(114) |
|
|
(28) |
|
Unallocated hotel and property operations expense |
|
467 |
|
|
495 |
|
|
319 |
|
Hotel EBITDA |
$ |
15,021 |
|
$ |
16,819 |
|
$ |
17,896 |
|
|
|
|
|
|
|
|
|
|
|
Revenue |
$ |
50,653 |
|
$ |
61,637 |
|
$ |
72,378 |
|
JV revenue |
|
2,962 |
|
|
- |
|
|
- |
|
Condor and JV revenue |
$ |
53,615 |
|
$ |
61,637 |
|
$ |
72,378 |
|
Hotel EBITDA as a percentage of revenue |
|
28% |
|
|
27% |
|
|
25% |
Liquidity and Capital Resources
Liquidity Requirements
We expect to meet our short-term liquidity requirements through net cash provided by operations, existing cash balances and working capital, short-term borrowings under our revolving credit agreement with Great Western Bank, and the release of restricted cash upon the satisfaction of usage requirements. At December 31, 2016, the Company had $8.3 million of cash and cash equivalents on hand and $1.2 million of unused availability under its revolving credit agreement. Our short-term liquidity requirements consist primarily of operating expenses and other expenditures directly associated with our hotel properties, recurring maintenance and capital expenditures necessary to maintain our hotels in accordance with brand standards, interest expense and scheduled principal payments on outstanding indebtedness, restricted cash funding obligations, and the payment of dividends in accordance with the REIT requirements of the Internal Revenue Code and as required in connection with our Series D Preferred Stock (which, as previously discussed, was converted to common stock with $9.3 million of a new class of preferred shares, Series E Preferred Stock, issued on February 28, 2017). We presently expect to invest approximately $4.0 million to $5.0 million in capital expenditures related to hotel properties we currently own through March 31, 2018.
To maintain our REIT tax status, we generally must distribute at least 90% of our taxable income to our shareholders annually. In addition, we are subject to a 4% non-deductible excise tax if the actual amount distributed to shareholders in a calendar year is less than a minimum amount specified under the federal income tax laws. We have a general dividend
41
policy of paying out approximately 100% of annual REIT taxable income. The actual amount of any future dividends will be determined by the Board of Directors based on our actual results of operations, economic conditions, capital expenditure requirements, and other factors that the Board of Directors deems relevant.
Our longer-term liquidity requirements consist primarily of the cost of acquiring additional hotel properties, renovations and other one-time capital expenditures that periodically are made related to our hotel properties, and scheduled debt payments, including maturing loans. Possible sources of liquidity to fund debt maturities and acquisitions and to meet other obligations include additional secured or unsecured debt financings and proceeds from public or private issuances of debt or equity securities.
Prior to the consideration of any asset sales or our ability to refinance debt subsequent to December 31, 2016, contractual principal payments on our debt outstanding, including normal amortization, total $15.8 million through March 31, 2018, including the February 1, 2017 maturity of one of our WAB loans with a balance at December 31, 2016 of $4.8 million, the November 6, 2017 maturity of our Cantor loan with a balance at December 31, 2016 of $5.7 million, the December 1, 2017 maturity of our Morgan Stanley loan with a balance at December 31, 2016 of $0.9 million, and the February 1, 2018 maturity of one of our WAB loans with a balance at December 31, 2016 of $2.8 million. As discussed further in the Subsequent Events footnote of the consolidated financial statements, on January 27, 2017, the WAB loan due February 1, 2017 was extended to February 1, 2018. Subsequently, on March 1, 2017, each of these pieces of debt was refinanced with a $90.0 million secured credit facility that matures on March 1, 2019. Following this refinancing, contractual principal payments on our debt outstanding at December 31, 2016 through March 31, 2018 totaled $1.1 million.
Sources and Uses of Cash
Cash provided by Operating Activities. Our cash provided by operations was $2.7 million, $5.0 million, and $5.5 million for the years ended December 31, 2016, 2015, and 2014, respectively. These changes in operating cash flows were driven by changes in net income, after adjusting for non-cash items, which decreased by $2.0 million in 2016 from 2015 and decreased by $0.9 million in 2015 from 2014. Other changes in operating cash flows between the periods were due to miscellaneous changes in property tax and insurance escrow balances and accounts receivable.
Cash provided by Investing Activities. Our cash provided by investing activities was $21.9 million, $5.4 million, and $17.9 million for the years ended December 31, 2016, 2015, and 2014, respectively. The lower cash flows in 2015 from the other periods presented was primarily a result of differences in the net cash spent on acquisitions and investment in joint venture less cash received from asset sales which, net, totaled $26.9 million in 2016, $10.7 million in 2015, and $21.3 million in 2014.
Cash used in Financing Activities. Our cash used by financing activities was $21.2 million, $5.7 million, and $23.3 million for the years ended December 31, 2016, 2015, and 2014, respectively. This increase in cash flows in 2016 was primarily related to cash received in the first quarter of 2016 related to the Series D Preferred Stock issuance less cash used to redeem the Series A and B Preferred Stock and cash dividends paid on the Series C and Series D Preferred Stock, which together had a net impact to financing cash flows of $5.1 million, as well as decreased net principal payments on long-term and revolving debt of $19.0 million as a result of decreased net revolver activity as well as decreased debt repayments required upon the sale of hotel properties. These increases were partially offset with prepayment penalties of $1.8 million paid in 2016 upon the sale of properties encumbered by certain of the Company’s debt. From 2014 to 2015, debt repayments increased due to increased property sales. However, this increase in debt repayments was offset by increased cash inflows for new debt obtained, including the debt obtained in connection with the 2015 acquisitions which totaled $15.1 million excluding debt assumed.
Outstanding Indebtedness
At December 31, 2016, we had long-term debt of $57.4 million associated with assets held for use with a weighted average term to maturity of 2.9 years and a weighted average interest rate of 4.89%. Of this total, at December 31, 2016, $26.1 million is fixed rate debt with a weighted average term to maturity of 2.8 years and a weighted average interest rate of 4.78% and $31.3 million is variable rate debt with a weighted average term to maturity of 2.9 years
42
and a weighted average interest rate of 4.98%. At December 31, 2015, we had long-term debt of $45.5 million associated with assets held for use with a weighted average term to maturity of 3.3 years and a weighted average interest rate of 4.98%. Of this total, at December 31, 2015, $12.5 million is fixed rate debt with a weighted average term to maturity of 1.6 years and a weighted average interest rate of 5.63% and $33.0 million is variable rate debt with a weighted average term to maturity of 3.9 years and a weighted average interest rate of 4.74%.
Debt is classified as held for sale if the properties collateralizing it are held for sale. Debt associated with assets held for sale is classified in the table below based on its contractual maturity although the balances are expected to be repaid within one year upon the sale of the related hotel properties. Aggregate annual principal payments on debt for the next five years and thereafter are as follows (in thousands):
|
|
|||||||||
|
|
Held for sale |
Held for use |
Total |
||||||
| 2017 |
$ |
1,574 |
$ |
11,333 |
$ |
12,907 | |||
| 2018 | 2,603 | 12,065 | 14,668 | ||||||
| 2019 | 52 | 1,120 | 1,172 | ||||||
| 2020 | 1,771 | 19,199 | 20,970 | ||||||
| 2021 |
- |
13,672 | 13,672 | ||||||
|
Total |
$ |
6,000 |
$ |
57,389 |
$ |
63,389 | |||
|
|
|||||||||
Financial Covenants
The Company’s debt agreements contain requirements as to the maintenance of minimum levels of debt service and fixed charge coverage and required loan-to-value and leverage ratios, and place certain restrictions on dividends. As of December 31, 2016, we were in compliance with our financial covenants.
If we fail to pay our indebtedness when due, fail to comply with covenants or otherwise default on our loans, unless waived, we could incur higher interest rates during the period of such loan defaults, be required to immediately pay our indebtedness, and ultimately lose our hotels through lender foreclosure if we are unable to obtain alternative sources of financing with acceptable terms. Our Great Western Bank and certain of our WAB facilities contain cross-default provisions which would allow Great Western Bank and WAB to declare a default and accelerate our indebtedness to them if we default on our other loans and such default would permit that lender to accelerate our indebtedness under any such loan. As of December 31, 2016, we are not in default of any of our loans.
Significant Debt Transactions
During 2016, the Company sold 25 hotel properties for combined gross sales proceeds of $61.4 million. Net proceeds were used to pay off the associated loans totaling $37.6 million, to fund acquisitions, to reduce the balance of the revolving credit facility with Great Western Bank, and for general corporate purposes. These dispositions, as well as adjustments required to remain in compliance with the required debt service ratio, decreased the total availability under the Great Western Bank revolver from $5.7 million at December 31, 2015 to $1.2 million at December 31, 2016.
On December 14, 2016, the purchase of the Aloft Leawood / Overland Park was financed, in part, with the proceeds of mortgage loans provided by Great Western Bank in an aggregate principal amount of $15.9 million. The loans require monthly principal and interest payments based on a 25-year amortization (in the case of the $14.3 million loan) and 7-year amortization (in the case of the $1.6 million loan), with the principal balances due and payable on December 1, 2021. The term of the loans may be extended for an additional two years subject to interest rate adjustments. The loans bear interest at a fixed rate of 4.33% per annum and are non-recourse, as long as a certain pre-dividend debt service coverage ratio is met and with the exception of losses resulting from fraud, theft, and involuntary bankruptcy.
Additionally, as discussed further in the Subsequent Events footnote to the consolidated financial statements, two significant debt events occurred in early 2017.
43
On January 27, 2017, the WAB loan with a balance of $4.8 million at December 31, 2016 due February 1, 2017 was extended to February 1, 2018.
On March 1, 2017, a significant portion of the Company’s debt (including all debt outstanding at December 31, 2016 with the exception of the two variable rate WAB loans and the two fixed rate Great Western Bank loans) was refinanced with a $90.0 million secured credit facility that matures on March 1, 2019. Following this refinancing, contractual debt maturities related to the debt outstanding at December 31, 2016 were as follows:
|
|
Held for sale |
Held for use |
Total |
||||||
| 2017 |
$ |
- |
$ |
916 |
$ |
916 | |||
| 2018 |
- |
930 | 930 | ||||||
| 2019 | 6,000 | 27,691 | 33,691 | ||||||
| 2020 |
- |
14,180 | 14,180 | ||||||
| 2021 |
- |
13,672 | 13,672 | ||||||
|
Total |
$ |
6,000 |
$ |
57,389 |
$ |
63,389 | |||
The credit agreement provides for a $90.0 million senior secured credit facility and includes an accordion feature that would allow the facility to be increased to $400.0 million with additional lender commitments. Availability under the facility is based on a borrowing base formula for the pool of hotel properties securing the facility. As of the closing date, the collateral pool consisted of 14 hotel properties. As of the closing date, four hotels were excluded from the borrowing base until certain conditions are satisfied and the availability under the facility was $34.3 million. The four hotels are expected to be added to the borrowing base within days after the closing and the availability under the facility is expected to increase to $41.0 million. The facility is guaranteed by the Company and its material subsidiaries that do not have stand-alone financing. Prior to the occurrence of specific capital achievements, borrowings under the facility accrue interest, at the Company’s option, at either LIBOR plus 3.95% or a base rate plus 2.95%. Thereafter, borrowings bear interest based on a leverage-based pricing grid, at the Company’s option, at either LIBOR plus a spread ranging from 2.25% to 3.00% (depending on leverage) or a base rate plus a spread ranging from 1.25% to 2.00% (depending on leverage). The facility matures in two years and has an automatic one-year extension upon the completion of specific capital achievements. The facility has two additional one-year extension options following additional capital achievements. The facility contains customary representations and warranties, covenants and events of default.
On March 1, 2017, the Company borrowed $34.3 million under the facility to repay existing indebtedness and pay reserves costs related to the closing of the facility. The Company anticipates using borrowings under the facility to acquire three out of the four Home2 Suites hotels currently under contract to be acquired, which will be added to the collateral pool for the facility. Borrowings under the facility can also be used for future acquisitions and general corporate purposes.
Significant Equity Transactions
On March 16, 2016, the Company entered into a series of agreements providing for:
|
· |
the issuance and sale of Condor’s Series D Preferred Stock under a private transaction to SREP, an affiliate of StepStone Group LP; |
|
· |
the exchange of all of Condor’s outstanding Series C Preferred Stock for Series D Preferred Stock; and |
|
· |
the cash redemption of all of Condor’s outstanding Series A Preferred Stock and Series B Preferred Stock. |
In connection with these transactions, the Company and SREP entered into a Stock Purchase Agreement (the “Stock Purchase Agreement”) dated March 16, 2016 pursuant to which Condor issued and sold 3,000,000 shares of Series D Preferred Stock to SREP on March 16, 2016 for an aggregate purchase price of $30.0 million. The Stock Purchase Agreement required that $20.2 million of the purchase price be deposited into an escrow account for the purpose of effecting the redemption of the Series A and Series B Preferred Stock and that the remaining amount of the purchase price be delivered to Condor.
44
Simultaneously, the Company entered into an agreement (the “Exchange Agreement”) with RES pursuant to which all 3,000,000 outstanding shares of Series C Preferred Stock were exchanged for 3,000,000 shares of Series D Preferred Stock. Under the Exchange Agreement, in lieu of payment of accrued and unpaid dividends in the amount of $4.9 million on the Series C Preferred Stock, Condor (a) paid to RES an amount of cash equal to $1.5 million, (b) issued to RES 245,156 shares of Series D Preferred Stock (such that RES, IRSA Inversiones y Representaciones Sociedad Anónima (“IRSA”), and their affiliates do not beneficially own in excess of 49% of the voting stock of Condor) and (c) issued to RES a convertible promissory note, bearing interest at 6.25% per annum, in the principal amount of $1.0 million.
Pursuant to the Stock Purchase Agreement, on April 15, 2016, Condor redeemed all of the outstanding Series A and Series B Preferred Stock, in accordance with redemption notices issued on March 16, 2016, as follows:
|
· |
all 803,270 outstanding shares of the Series A Preferred Stock at the redemption price of $10.00 per share plus $2.084940 per share in accrued and unpaid dividends (plus compounded interest) through the redemption date for a total redemption price of $9.7 million; and |
|
· |
all 332,500 outstanding shares of the Series B Preferred Stock at the redemption price of $25.00 per share plus $6.354167 per share in accrued and unpaid dividends through the redemption date for a total redemption price of $10.5 million. |
The terms of the convertible promissory note and the Series D Preferred Stock are discussed in Note 7, Convertible Debt at Fair Value, and Note 10, Preferred Stock, to our consolidated financial statements.
Additionally, on January 24, 2017, the Company exchanged 150,540 new warrants (the “New Warrants”) to purchase common stock of the Company for 3,750,000 warrants (the “Old Warrants”, see further discussion in Note 10, Preferred Stock, to our consolidated financial statements) held by RES. The number of New Warrants issued in exchange for the Old Warrants equals the number of shares of common stock issuable upon exercise of the Old Warrants pursuant to a cashless exercise provisions of the Old Warrants. The New Warrants are exercisable for 150,540 shares of common stock, have an exercise price of $.001 for each common share and expire on January 24, 2019.
As discussed further in the Subsequent Events footnote of the consolidated financial statements, on February 28, 2017, the holders of the Series D Preferred Stock voluntarily converted their shares into 39,032,225 shares of common stock at $1.60 per share pursuant to the terms of the preferred stock. The terms of the Series D Preferred Stock provided for automatic conversion following certain future common stock offerings, and also provided for potential additional payments to the holders depending on the sales price of common stock in the offerings. As a result of the voluntary conversion, the holders are no longer entitled to the potential payments. To induce the holders of the Series D Preferred Stock to voluntarily convert their shares, the Company issued the holders $9.3 million of a new series of preferred stock, the Series E Preferred Stock.
The Series E Preferred Stock ranks senior to the Company’s common stock and any other preferred stock issuances and receives preferential cumulative cash dividends at a rate of 6.25% per annum, payable quarterly of the $10.00 face value per share. If the Company fails to pay a dividend then during the period that dividends are not paid, the dividend rate increases to 12.5%, if specific equity offering or offerings have not occurred, and increases 9.50% per annum if such equity or equity offerings have occurred. Dividends on the Series E Preferred Stock accrue whether or not the Company has earnings, whether or not there are funds legally available for the payment of such dividends, whether or not such dividends are declared, and whether or not such dividends are prohibited by agreement. Subject to certain shareholder approvals, required under Nasdaq Marketplace Rules, which Condor will seek and expects to obtain at the next annual shareholders meeting, each share of Series E Preferred Stock is convertible, at the option of the holder, at any time on or after February 28, 2019, into a number of shares of common stock determined by dividing the conversion price of $2.13 into an amount equal to the $10.00 face value per share plus accrued and unpaid dividends, if any. Upon liquidation, each share of Series E Preferred Stock is entitled to $10.00 per share, accrued and unpaid dividends, and an additional amount based on liquidation preference that the holders may have foregone by converting their Series D Preferred Stock into common stock, as adjusted for stock appreciation and dividends paid on the common stock. The conversion price is subject to anti-dilution adjustments upon the occurrence of stock splits and stock dividends. Following a specific equity offering or offerings, from time to time a number of shares of Series E Preferred Stock automatically converts into common stock if the common stock trades
45
at 120% of the conversion price for 60 trading days, and the number of shares converted will be determined by certain trading volumes measures. The Company has rights, following a specific equity offering or offerings, to redeem up to 490,250 shares of the Series E Preferred Stock at prices from 110% to 130% of its liquidation value, and the holders have put rights commencing March 16, 2021 to put the Series E Preferred Stock to the Company at 130% of its liquidation preference, which the Company can satisfy with cash or common stock. The Series E Preferred Stock votes as a class on matters generally affecting the Series E Preferred Stock, and as long as 434,750 shares of Series E Preferred Stock (47% of the originally issued shares of Series E Preferred Stock) remain outstanding, then 75% approval of the Series E Preferred Stock will be required to approve merger, consolidation, liquidation or winding up of Condor, related party transactions exceeding $120,000, payment of dividends on common stock except from funds from operations or to maintain REIT status, the grant of exemptions from Condor’s charter limitation on ownership of 9.9% of any class or series of its securities (exclusive of persons currently holding exemptions), issuance of preferred stock, or commitment or agreement to do any of the foregoing.
To maintain our REIT tax status, we generally must distribute at least 90% of our taxable income to our shareholders annually. In addition, we are subject to a 4% non-deductible excise tax if the actual amount distributed to shareholders in a calendar year is less than a minimum amount specified under the federal income tax laws. We have a general dividend policy of paying out approximately 100% of annual REIT taxable income. The actual amount of any future dividends will be determined by the Board of Directors based on our actual results of operations, economic conditions, capital expenditure requirements, and other factors that the Board of Directors deems relevant.
Contractual Obligations
Below is a summary of certain obligations that will require capital as of December 31, 2016 (in thousands):
|
|
Payments due by period |
||||||||||||||
|
Contractual obligations |
Total |
2017 |
2018-2019 |
2020-2021 |
After 2021 |
||||||||||
|
Long-term debt including interest (1) |
$ |
64,905 |
$ |
13,788 |
$ |
16,378 |
$ |
34,739 |
$ |
- |
|||||
|
Corporate office leases |
561 | 156 | 297 | 108 |
- |
||||||||||
|
Total contractual obligations |
$ |
65,466 |
$ |
13,944 |
$ |
16,675 |
$ |
34,847 |
$ |
- |
|||||
|
|
|||||||||||||||
|
(1) |
Interest rate payments on our variable rate debt have been estimated using interest rates in effect at December 31, 2016 |
Long-term debt and land lease payments above include only amounts related to properties classified as held for use. Future debt payments, including interest, related to the seven held for sale properties that are expected to be sold within the next 12 months totaling $6.4 million and future obligations on the one land lease related to a held for sale property totaling $1.8 million are not included in the table above.
We have various standing or renewable contracts with vendors. These contracts are all cancelable with immaterial or no cancellation penalties. Contract terms are generally one year or less. We also have management agreements in place for the management and operation of our hotel properties.
Inflation
We rely on the performance of our hotels to increase revenues to keep pace with inflation. Generally, our hotel operators possess the ability to adjust room rates daily to reflect the effects of inflation. However, competitive pressures may limit the ability of our management companies to raise room rates.
Off Balance Sheet Financing Transactions
We have not entered into any off balance sheet financing transactions.
Critical Accounting Policies
46
Our consolidated financial statements have been prepared in conformity with U.S. GAAP, which requires management to make estimates and assumptions that effect the reported amount of assets and liabilities at the date of our financial statements and the reported amounts of revenues and expenses during the reporting period. While we do not believe the reported amounts would be materially different, application of these policies involves the exercise of judgment and the use of assumptions as to future uncertainties and, as a result, actual results could differ from these estimates. We evaluate our estimates and judgments on an ongoing basis. We base our estimates on experience and on various other assumptions that are believed to be reasonable under the circumstances.
Critical accounting policies are those that are both important to the presentation of our financial condition and results of operations and require management’s most difficult, complex, or subjective judgments. We have identified the following principal accounting policies that have a material effect on our consolidated financial statements.
Investment in Hotel Properties
At the time of acquisition, the Company allocates the purchase price of assets to asset classes based on the fair value of the acquired real estate, furniture, fixtures and equipment, and intangible assets, if any, and the fair value of liabilities assumed, including debt. Acquisition date fair values are determined based on replacement costs, appraised values, and estimated fair values using methods similar to those used by independent appraisers including discounted cash flows and capitalization rates. Acquisition costs are expensed as incurred.
The Company’s investments in hotel properties are recorded at cost and are depreciated using the straight-line method over an estimated useful life of 15 to 40 years for buildings and improvements and 3 to 12 years for furniture, fixtures, and equipment.
Development and construction costs of properties in development are capitalized including, where applicable, direct and indirect costs, including real estate taxes and interest costs. Development and construction costs and costs of significant improvements, replacements, or renovations are capitalized while costs of maintenance and repairs are expensed as incurred.
On a quarterly basis, the Company reviews the carrying value of each held for use hotel to determine if certain circumstances, known as triggering events, exist indicating impairment to the carrying value of the hotel or that depreciation periods should be modified. These triggering events include a significant change in the cash flows of or a significant adverse change in the business climate for a hotel. If facts or circumstances support the possibility of impairment, the Company will prepare an estimate of the undiscounted future cash flows, without interest charges, of the specific hotel and determine if the investment in such hotel is recoverable based on these undiscounted future cash flows. If the investment is not recoverable based on this analysis, an impairment charge will be taken, if necessary, to reduce the carrying value of the hotel to the hotel’s fair value.
Investment in Joint Venture
If it is determined that we do not have a controlling interest in a joint venture, either through our financial interest in a variable interest entity (“VIE”) or through our voting interest in a voting interest entity (“VOE”) and we have the ability to provide significant influence, the equity method of accounting is used. Under this method, the investment, originally recorded at cost, is adjusted to recognize our share of net earnings or losses of the affiliate as they occur, with losses limited to the extent of our investment in, advances to, and commitments to the investee. Pursuant to our Atlanta JV agreement, allocations of profits and losses of our Atlanta JV may be allocated disproportionately to nominal ownership percentages due to specified preferred return rate thresholds.
On an annual basis or at interim periods if events and circumstances indicate that the investment may be impaired, the Company reviews the carrying value of its investment in unconsolidated joint venture to determine if circumstances indicate impairment to the carrying value of the investment that is other than temporary. The investment is considered impaired if its estimated fair value is less than the carrying amount of the investment and that impairment is other than temporary.
47
Assets Held for Sale and Discontinued Operations
A hotel is considered held for sale (a) when a contract for sale is entered into, a substantial, nonrefundable deposit has been committed by the purchaser, and sale is expected to occur within one year, or (b) if management has committed to and is actively engaged in a plan sell the property, the property is available for sale in its current condition, and it is probable the sale will be completed within one year. If a hotel is considered held for sale as of the most recent balance sheet presented or was sold in any period presented, the hotel property and the debt it collateralizes are shown as held for sale in all periods presented.
Depreciation of our hotels is discontinued at the time they are considered held for sale. If the fair value of the held for sale property less costs to sell is lower than the carrying value of the hotel, the Company will record an impairment loss. Impairment losses on held for sale properties may be subsequently recovered up to the amount of the cumulative impairment losses taken while the property is held for sale should future revisions to fair value estimates be required. If active marketing ceases or the property no longer meets the criteria to be classified as held for sale, the property is reclassified to held for use and measured at the lower of its (a) carrying amount before the property was classified as held for sale, adjusted for any depreciation expense that would have been recognized had the property been continuously classified as held for use, or (b) its fair value at the date of the subsequent decision not to sell.
Historically, we have presented the results of operations of hotel properties that have been sold or considered held for sale as discontinued operations. In April 2014, the Financial Accounting Standards Board (“FASB”) issued Accounting Standards Update (“ASU”) 2014-08, Presentation of Financial Statements (Topic 205) and Property, Plant, and Equipment (Topic 360): Reporting Discontinued Operations and Disclosures of Disposals of Components of an Entity. The amendments in ASU 2014-08 change the criteria for reporting a discontinued operation and require new disclosures of both discontinued operations and certain other significant disposals that do not meet the definition of a discontinued operation. Only disposals representing a strategic shift in operations that have a major effect on an entity’s operations and financial results should be presented as discontinued operations subsequent to adoption. The Company adopted the pronouncement on October 1, 2014. As a result of this early adoption, only the operations of hotels meeting the criteria to be considered held for sale prior to October 1, 2014 are included in discontinued operations for all periods presented as no individual hotel disposition represents a strategic shift in operations or has a major effect on our operations or financial results.
Gains on the sale of real estate are recognized when a property is sold, provided that the profit is determinable, meaning that collectability of the sales price is reasonably assured or can be estimated, and that the earnings process is complete, meaning that the seller is not obligated to perform significant activities after the sale in order to earn the profit. If these criteria are not met, the timing of the sale is determined based on various criteria related to the terms of the transaction and any continuing involvement in the form of management or financial assistance associated with the property. If the sales criteria are not met, the gain is deferred and the finance, installment, or cost recovery method, as appropriate, is applied until the sales criteria are met. To the extent we sell a property and retain a partial ownership interest in the property, we generally recognize a gain to the extent of the third party ownership interest.
Income Taxes
The Company qualifies and intends to continue to qualify as a REIT under applicable provisions of the Internal Revenue Code (the “Code”), as amended. In general, under such Code provisions, a trust which has made the required election and, in the taxable year, meets certain requirements and distributes to its shareholders at least 90% of its REIT taxable income, will not be subject to federal income tax to the extent of the income currently distributed to shareholders. If we fail to quality as a REIT in any taxable year, we will be subject to federal income tax on our taxable income at regular corporate income tax rates and generally will be unable to re-elect REIT status until the fifth calendar year after the year in which we failed to qualify as a REIT, unless we satisfy certain relief provisions. Even if the Company qualifies for taxation as a REIT, the Company may be subject to certain state and local taxes on its income and property, and to federal income and excise taxes on its undistributed taxable income. Except with respect to the TRS, the Company does not believe that it will be liable for significant federal or state income taxes in future years.
48
A REIT will incur a 100% tax on the net gain derived from any sale or other disposition of property that the REIT holds primarily for sale to customers in the ordinary course of a trade or business. We do not believe any of our hotels were held primarily for sale in the ordinary course of our trade or business. However, if the IRS would successfully assert that we held such hotels primarily for sale in the ordinary course of our business, the gain from such sales could be subject to a 100% prohibited transaction tax.
Taxable income from non-REIT activities managed through the TRS, which is taxed as a C-Corporation, is subject to federal, state, and local income taxes. We account for the federal income taxes of our TRS using the asset and liability method. Under this method, deferred income taxes are recognized for temporary differences between the financial reporting bases of assets and liabilities of the TRS and their respective tax bases and for operating loss and tax credit carryforwards based on enacted tax rates expected to be in effect when such amounts are realized or settled. However, deferred tax assets are recognized only to the extent that it is more likely than not that they will be realized based on consideration of available evidence, including tax planning strategies and projections for future taxable income over the periods in which the remaining deferred tax assets are deductible. In assessing the realizability of deferred tax assets, the Company considers whether it is more likely than not that some portion or all of the deferred tax assets will not be realized. The ultimate realization of deferred tax assets is dependent upon the generation of future taxable income.
The Company may recognize a tax benefit from an uncertain tax position when it is more-likely-than-not (defined as a likelihood of more than 50%) that the position will be sustained upon examination, including resolution of any related appeals or litigation processes, based on its technical merits. If a tax position does not meet the more-likely-than-not recognition threshold, despite the Company’s belief that its filing position is supportable, the benefit of that tax position is not recognized in the statement of operations. The Company recognizes interest and penalties, as applicable, related to unrecognized tax benefits as a component of income tax expense. The Company recognizes unrecognized tax benefits in the period that the uncertainty is eliminated by either affirmative agreement to the uncertain tax position by the applicable taxing authority or by expiration of the applicable statute of limitations.
New Accounting Pronouncements
In May 2014, the FASB issued ASU 2014-09, Revenue from Contracts with Customers, which requires an entity to recognize the amount of revenue to which it expects to be entitled for the transfer of promised goods or services to customers. The ASU will replace most existing revenue recognition guidance in U.S. GAAP when it becomes effective. The original updated accounting guidance was effective for annual and interim reporting periods in fiscal years beginning after December 15, 2016, however, in July 2015, the FASB approved a one year delay of the effective date to fiscal years beginning after December 15, 2017. As such, the standard will be effective for the Company on January 1, 2018. The standard permits the use of either the retrospective or cumulative effect transition method. The Company has begun to evaluate each of its revenue streams under the new model. Based on preliminary assessments, the Company does not expect the adoption of this guidance to materially affect the amount or timing of revenue recognition for revenues from room, food and beverage, and other hotel level sales. Furthermore, for real estate sales to third parties, primarily a result of disposition of real estate in exchange for cash with few contingencies, we do not expect the standard to significantly impact the recognition of or accounting for these sales.
In February 2016, the FASB issued ASU 2016-02, Leases (Topic 842), which supersedes most existing lease guidance in U.S. GAAP when it becomes effective. ASU 2016-02 requires, among other changes to the lease accounting guidance, lessees to recognize most leases on-balance sheet via a right of use asset and lease liability and additional qualitative and quantitative disclosures. ASU 2016-02 is effective for the Company for annual periods in fiscal years beginning after December 15, 2019, permits early adoption, and mandates a modified retrospective transition method. The Company is required to adopt ASU 2016-02 on January 1, 2020. The Company is evaluating the effect that ASU 2016-02 will have on its consolidated financial statements and related disclosures.
In January 2017, the FASB issued ASU 2017-01, Business Combinations (Topic 805): Clarifying the Definition of a Business, which clarifies the definition of a business to assist entities with evaluating whether transactions should be accounted for as acquisitions of assets or business combinations. This standard will be effective for annual periods
49
beginning after December 15, 2017, although early adoption is permitted. We are evaluating the effect of ASU 2017-01 on our consolidated financial statements and related disclosures.
ITEM 7A. QUANTITATIVE AND QUALITATIVE DISCLOSURES ABOUT MARKET RISK
Market risk includes risks that arise from changes in interest rates, foreign currency exchange rates, commodity prices, equity prices, and other market changes that effect market-sensitive instruments. At December 31, 2016, our market risk arises primarily from interest rate risk relating to variable rate borrowings and the market risk related to our convertible debt that fair value will fluctuate following changes in the Company’s common stock price or changes in interest rates.
Interest Rate Sensitivity
We seek to limit the impact of interest rate changes on earnings and cash flows and to lower our overall borrowing costs by closely monitoring our variable rate debt and converting such debt to fixed rates when we deem such conversion advantageous. From time to time, we may enter into interest rate swap agreements or other interest rate hedging agreements. At December 31, 2016, we have an interest rate swap in place which effectively locks the variable interest rate on our Huntington Bank debt (balance of $7.4 million) at 4.13% and an interest rate cap in place which caps the 30-day LIBOR interest rate on our Latitude debt (December 31, 2016 balance of $11.1 million) at 1.0%. We do not intend to enter into derivative or interest rate transactions for speculative purposes.
The table below provides information about financial instruments that are sensitive to changes in interest rates. The table presents scheduled maturities, including the amortization of principal and related weighted-average interest rates for the debt maturing in each specified period, excluding $6.0 million of debt related to hotel properties held for sale (dollars in thousands):
|
|
|
|
|
|
|
|
|
|
|
|
|
|
|
|
|
|
|
|
|
|
|
|
|
|
|
|
|
2017 |
|
2018 |
|
2019 |
|
2020 |
|
2021 |
|
Total |
||||||||||||
|
Fixed rate debt |
|
$ |
10,700 |
|
|
$ |
545 |
|
|
$ |
569 |
|
|
$ |
593 |
|
|
$ |
13,672 |
|
|
$ |
26,079 |
|
|
Average fixed interest rate |
|
|
5.44 |
% |
|
|
4.33 |
% |
|
|
4.33 |
% |
|
|
4.33 |
% |
|
|
4.33 |
% |
|
|
4.78 |
% |
|
Variable rate debt |
|
$ |
633 |
|
|
$ |
11,520 |
|
|
$ |
551 |
|
|
$ |
18,606 |
|
|
$ |
- |
|
|
$ |
31,310 |
|
|
Average variable interest rate |
|
|
4.53 |
% |
|
|
6.86 |
% |
|
|
3.87 |
% |
|
|
3.87 |
% |
|
|
- |
% |
|
|
4.98 |
% |
|
Total debt |
|
$ |
11,333 |
|
|
$ |
12,065 |
|
|
$ |
1,120 |
|
|
$ |
19,199 |
|
|
$ |
13,672 |
|
|
$ |
57,389 |
|
|
Total average interest rate |
|
|
5.39 |
% |
|
|
6.74 |
% |
|
|
4.10 |
% |
|
|
3.88 |
% |
|
|
4.33 |
% |
|
|
4.89 |
% |
At December 31, 2016, approximately 54.9% of our outstanding debt, excluding debt related to hotel properties held for sale, is subject to fixed interest rates or effectively locked with an interest rate swap, while 45.1% of our debt is subject to floating rates. Assuming no increase in the level of our variable debt outstanding at December 31, 2016 and after giving effect to our interest rate swap, if interest rates increased by 1.0% our cash flow related to hotel properties held for use would decrease by approximately $0.3 million per year.
50
Condor Hospitality Trust, Inc. and Subsidiaries
Index to Consolidated Financial Statements and Schedule III
51
Report of Independent Registered Public Accounting Firm
The Board of Directors and Stockholders
Condor Hospitality Trust, Inc.:
We have audited the accompanying consolidated balance sheets of Condor Hospitality Trust, Inc. and subsidiaries (the Company) as of December 31, 2016 and 2015, and the related consolidated statements of operations, stockholders’ equity, and cash flows for each of the years in the three‑year period ended December 31, 2016. In connection with our audits of the consolidated financial statements, we have also audited the related financial statement schedule, Schedule III- Real Estate and Accumulated Depreciation These consolidated financial statements and the financial statement schedule are the responsibility of the Company’s management. Our responsibility is to express an opinion on these consolidated financial statements based on our audits.
We conducted our audits in accordance with the standards of the Public Company Accounting Oversight Board (United States). Those standards require that we plan and perform the audit to obtain reasonable assurance about whether the financial statements are free of material misstatement. An audit includes examining, on a test basis, evidence supporting the amounts and disclosures in the financial statements. An audit also includes assessing the accounting principles used and significant estimates made by management, as well as evaluating the overall financial statement presentation. We believe that our audits provide a reasonable basis for our opinion.
In our opinion, the consolidated financial statements referred to above present fairly, in all material respects, the financial position of Condor Hospitality Trust, Inc. and subsidiaries as of December 31, 2016 and 2015, and the results of their operations and their cash flows for each of the years in the three‑year period ended December 31, 2016, in conformity with U.S. generally accepted accounting principles. Also, in our opinion, the related financial statement schedule, when considered in relation to the basic consolidated financial statements taken as a whole, presents fairly, in all material respects, the information set forth therein.
As discussed in Note 1 to the consolidated financial statements, the Company has changed its method of accounting for discontinued operations as of October 1, 2014 on a prospective basis due to the adoption of Accounting Standards Update 2014-08.
(signed) KPMG LLP
McLean, Virginia
March 1, 2017
52
Condor Hospitality Trust, Inc. and Subsidiaries
Consolidated Balance Sheet
(In thousands, except share and per share data)
|
|
|
|
|
|
|
|
|
|
|
|
As of December 31, |
|||
|
|
|
2016 |
|
2015 |
||
|
|
|
|
|
|
|
|
|
Assets |
|
|
|
|
|
|
|
Investment in hotel properties, net |
|
$ |
96,158 |
|
$ |
75,899 |
|
Investment in unconsolidated joint venture |
|
|
9,036 |
|
|
- |
|
Cash and cash equivalents |
|
|
8,326 |
|
|
4,870 |
|
Restricted cash, property escrows |
|
|
5,350 |
|
|
3,776 |
|
Accounts receivable, net of allowance for doubtful accounts of $21 and $10 |
|
|
1,416 |
|
|
1,169 |
|
Prepaid expenses and other assets |
|
|
1,666 |
|
|
1,832 |
|
Investment in hotel properties held for sale, net |
|
|
18,713 |
|
|
54,800 |
|
Total Assets |
|
$ |
140,665 |
|
$ |
142,346 |
|
|
|
|
|
|
|
|
|
Liabilities and Equity |
|
|
|
|
|
|
|
|
|
|
|
|
|
|
|
Liabilities |
|
|
|
|
|
|
|
Accounts payable, accrued expenses, and other liabilities |
|
$ |
5,823 |
|
$ |
5,419 |
|
Derivative liabilities, at fair value |
|
|
8 |
|
|
8,759 |
|
Convertible debt, at fair value |
|
|
1,315 |
|
|
- |
|
Long-term debt, net of deferred financing costs |
|
|
56,775 |
|
|
44,667 |
|
Long-term debt related to hotel properties held for sale, net of deferred financing costs |
|
|
5,945 |
|
|
41,344 |
|
Total Liabilities |
|
|
69,866 |
|
|
100,189 |
|
|
|
|
|
|
|
|
|
Redeemable preferred stock: |
|
|
|
|
|
|
|
10% Series B, 800,000 shares authorized; $.01 par value, 332,500 shares outstanding, liquidation preference of $10,182 at December 31, 2015 |
|
|
- |
|
|
7,662 |
|
|
|
|
|
|
|
|
|
Equity |
|
|
|
|
|
|
|
Shareholders' Equity |
|
|
|
|
|
|
|
Preferred stock, 40,000,000 shares authorized: |
|
|
|
|
|
|
|
8% Series A, 2,500,000 shares authorized, $.01 par value, 803,270 shares outstanding, liquidation preference of $9,485 at December 31, 2015 |
|
|
- |
|
|
8 |
|
6.25% Series C, 3,000,000 shares authorized, $.01 par value, 3,000,000 shares outstanding, liquidation preference of $34,492 at December 31, 2015 |
|
|
- |
|
|
30 |
|
6.25% Series D, 6,700,000 shares authorized, $.01 par value, 6,245,156 shares outstanding, liquidation preference of $63,427 at December 31, 2016 |
|
|
61,333 |
|
|
- |
|
Common stock, $.01 par value, 200,000,000 shares authorized; 4,956,835 and 4,941,878 shares outstanding |
|
|
50 |
|
|
49 |
|
Additional paid-in capital |
|
|
118,613 |
|
|
138,387 |
|
Accumulated deficit |
|
|
(112,024) |
|
|
(105,858) |
|
Total Shareholders' Equity |
|
|
67,972 |
|
|
32,616 |
|
Noncontrolling interest in consolidated partnership (Condor Hospitality Limited Partnership), redemption value of $2,008 and $1,197 |
|
|
2,827 |
|
|
1,879 |
|
Total Equity |
|
|
70,799 |
|
|
34,495 |
|
|
|
|
|
|
|
|
|
Total Liabilities and Equity |
|
$ |
140,665 |
|
$ |
142,346 |
See accompanying notes to consolidated financial statements.
53
Condor Hospitality Trust, Inc. and Subsidiaries
Consolidated Statement of Operations
(In thousands, except per share data)
asd
|
|
Year ended December 31, |
||||||||
|
|
2016 |
2015 |
2014 |
||||||
|
Revenue |
|||||||||
|
Room rentals and other hotel services |
$ |
50,647 |
$ |
58,714 |
$ |
58,799 | |||
|
Operating expenses |
|||||||||
|
Hotel and property operations |
37,092 | 43,367 | 44,391 | ||||||
|
Depreciation and amortization |
5,190 | 5,400 | 6,437 | ||||||
|
General and administrative |
5,792 | 5,493 | 4,192 | ||||||
|
Acquisition and terminated transactions |
550 | 684 |
- |
||||||
|
Terminated equity transactions |
- |
246 | 76 | ||||||
|
Total operating expenses |
48,624 | 55,190 | 55,096 | ||||||
|
Operating income |
2,023 | 3,524 | 3,703 | ||||||
|
Net gain (loss) on disposition of assets |
23,132 | 4,798 | (1) | ||||||
|
Equity in loss of joint venture |
(244) |
- |
- |
||||||
|
Net gain (loss) on derivatives and convertible debt |
6,377 | 11,578 | (14,430) | ||||||
|
Other income |
55 | 114 | 116 | ||||||
|
Interest expense |
(4,710) | (5,522) | (7,116) | ||||||
|
Loss on debt extinguishment |
(2,187) | (213) | (158) | ||||||
|
Impairment loss |
(1,477) | (3,829) | (1,269) | ||||||
|
Earnings (loss) from continuing operations before income taxes |
22,969 | 10,450 | (19,155) | ||||||
|
Income tax expense |
(125) |
- |
- |
||||||
|
Earnings (loss) from continuing operations |
22,844 | 10,450 | (19,155) | ||||||
|
Gain from discontinued operations, net of tax |
678 | 3,872 | 2,896 | ||||||
|
Net earnings (loss) |
23,522 | 14,322 | (16,259) | ||||||
|
(Earnings) loss attributable to noncontrolling interest |
(727) | (1,197) | 23 | ||||||
|
Net earnings (loss) attributable to controlling interests |
22,795 | 13,125 | (16,236) | ||||||
|
Dividends declared and undeclared and in kind dividends deemed on preferred stock |
(20,748) | (3,632) | (3,452) | ||||||
|
Net earnings (loss) attributable to common shareholders |
$ |
2,047 |
$ |
9,493 |
$ |
(19,688) | |||
|
|
|||||||||
|
Earnings per Share |
|||||||||
|
Continuing operations - Basic |
$ |
0.28 |
$ |
1.24 |
$ |
(5.79) | |||
|
Discontinued operations - Basic |
0.13 | 0.70 | 0.74 | ||||||
|
Total - Basic Earnings per Share |
$ |
0.41 |
$ |
1.94 |
$ |
(5.05) | |||
|
|
|||||||||
|
Continuing operations - Diluted |
$ |
0.12 |
$ |
(0.15) |
$ |
(5.79) | |||
|
Discontinued operations - Diluted |
0.02 | 0.15 | 0.74 | ||||||
|
Total - Diluted Earnings per Share |
$ |
0.14 |
$ |
- |
$ |
(5.05) | |||
See accompanying notes to consolidated financial statements.
54
Condor Hospitality Trust, Inc. and Subsidiaries
Consolidated Statement of Equity
(In thousands)
|
|
|
|
|
|
|
|
|
|
|
|
|
|
|
|
|
|
|
|
|
|
|
|
|
|
|
|
|
|
Years ended December 31, 2016, 2015, and 2014 |
|||||||||||||||||||||||||
|
|
Shares of preferred stock |
|
Preferred stock |
|
Shares of common Stock |
|
Common stock |
|
Additional paid-in capital |
|
Accumulated Deficit |
|
Total shareholders' equity |
|
Noncontrolling interest |
|
Total equity |
|||||||||
|
|
|
|
|
|
|
|
|
|
|
|
|
|
|
|
|
|
|
|
|
|
|
|
|
|
|
|
|
Balance at December 31, 2013 |
|
3,803 |
|
$ |
38 |
|
|
2,898 |
|
$ |
29 |
|
$ |
135,293 |
|
$ |
(102,747) |
|
$ |
32,613 |
|
$ |
113 |
|
$ |
32,726 |
|
Stock-based compensation |
|
- |
|
|
- |
|
|
8 |
|
|
- |
|
|
34 |
|
|
- |
|
|
34 |
|
|
- |
|
|
34 |
|
Rights offering |
|
- |
|
|
- |
|
|
1,787 |
|
|
18 |
|
|
2,573 |
|
|
- |
|
|
2,591 |
|
|
- |
|
|
2,591 |
|
Net loss |
|
- |
|
|
- |
|
|
- |
|
|
- |
|
|
- |
|
|
(16,236) |
|
|
(16,236) |
|
|
(23) |
|
|
(16,259) |
|
Balance at December 31, 2014 |
|
3,803 |
|
$ |
38 |
|
|
4,693 |
|
$ |
47 |
|
$ |
137,900 |
|
$ |
(118,983) |
|
$ |
19,002 |
|
$ |
90 |
|
$ |
19,092 |
|
Stock-based compensation |
|
- |
|
|
- |
|
|
21 |
|
|
- |
|
|
143 |
|
|
- |
|
|
143 |
|
|
- |
|
|
143 |
|
Long-term incentive plan |
|
- |
|
|
- |
|
|
- |
|
|
- |
|
|
- |
|
|
- |
|
|
- |
|
|
142 |
|
|
142 |
|
Issuance of common stock |
|
- |
|
|
- |
|
|
228 |
|
|
2 |
|
|
344 |
|
|
- |
|
|
346 |
|
|
- |
|
|
346 |
|
Issuance of common units |
|
- |
|
|
- |
|
|
- |
|
|
- |
|
|
- |
|
|
- |
|
|
- |
|
|
450 |
|
|
450 |
|
Net income |
|
- |
|
|
- |
|
|
- |
|
|
- |
|
|
- |
|
|
13,125 |
|
|
13,125 |
|
|
1,197 |
|
|
14,322 |
|
Balance at December 31, 2015 |
|
3,803 |
|
$ |
38 |
|
|
4,942 |
|
$ |
49 |
|
$ |
138,387 |
|
$ |
(105,858) |
|
$ |
32,616 |
|
$ |
1,879 |
|
$ |
34,495 |
|
Stock-based compensation |
|
- |
|
|
- |
|
|
15 |
|
|
1 |
|
|
133 |
|
|
- |
|
|
134 |
|
|
- |
|
|
134 |
|
Long-term incentive plan |
|
- |
|
|
- |
|
|
- |
|
|
- |
|
|
- |
|
|
- |
|
|
- |
|
|
171 |
|
|
171 |
|
Issuance of common units |
|
- |
|
|
- |
|
|
- |
|
|
- |
|
|
- |
|
|
- |
|
|
- |
|
|
50 |
|
|
50 |
|
Common dividends declared ($0.07 per share) |
|
- |
|
|
- |
|
|
- |
|
|
- |
|
|
- |
|
|
(347) |
|
|
(347) |
|
|
- |
|
|
(347) |
|
Series D Preferred Stock dividends declared |
|
- |
|
|
- |
|
|
- |
|
|
- |
|
|
- |
|
|
(3,090) |
|
|
(3,090) |
|
|
- |
|
|
(3,090) |
|
Redemption of Series A and B Preferred Stock |
|
(803) |
|
|
(8) |
|
|
- |
|
|
- |
|
|
(7,390) |
|
|
(5,107) |
|
|
(12,505) |
|
|
- |
|
|
(12,505) |
|
Exchange of Series C and issuance of Series D Preferred Stock |
|
3,245 |
|
|
61,303 |
|
|
- |
|
|
- |
|
|
(12,517) |
|
|
(20,417) |
|
|
28,369 |
|
|
- |
|
|
28,369 |
|
Net income |
|
- |
|
|
- |
|
|
- |
|
|
- |
|
|
- |
|
|
22,795 |
|
|
22,795 |
|
|
727 |
|
|
23,522 |
|
Balance at December 31, 2016 |
|
6,245 |
|
$ |
61,333 |
|
|
4,957 |
|
$ |
50 |
|
$ |
118,613 |
|
$ |
(112,024) |
|
$ |
67,972 |
|
$ |
2,827 |
|
$ |
70,799 |
See accompanying notes to consolidated financial statements.
55
Condor Hospitality Trust, Inc. and Subsidiaries
Notes To Consolidated Financial Statements
(In thousands, except share and per share data)
|
|
Year ended December 31, |
|||||||
|
|
2016 |
2015 |
2014 |
|||||
|
Cash flows from operating activities: |
||||||||
|
Net earnings (loss) |
$ |
23,522 |
$ |
14,322 |
$ |
(16,259) | ||
|
Adjustments to reconcile net earnings (loss) to net cash provided by operating activities: |
||||||||
|
Depreciation and amortization expense |
5,190 | 5,400 | 6,549 | |||||
|
Net gain on disposition of assets |
(23,813) | (7,794) | (2,750) | |||||
|
Net (gain) loss on derivatives and convertible debt |
(6,377) | (11,578) | 14,430 | |||||
|
Equity in loss of joint venture |
244 |
- |
- |
|||||
|
Amortization of deferred financing costs |
597 | 714 | 1,292 | |||||
|
Amortization of debt discount |
- |
- |
38 | |||||
|
Loss on extinguishment of debt |
2,187 | 213 | 278 | |||||
|
Gain on debt conversion |
- |
- |
(88) | |||||
|
Impairment loss |
1,477 | 3,708 | 2,921 | |||||
|
Stock-based compensation and long term incentive plan expense |
305 | 285 | 34 | |||||
|
Amortization of warrant issuance cost |
12 | 58 | 58 | |||||
|
Changes in operating assets and liabilities: |
||||||||
|
(Increase) decrease in assets |
(244) | 442 | (63) | |||||
|
Decrease in liabilities |
(432) | (800) | (933) | |||||
|
Net cash provided by operating activities |
2,668 | 4,970 | 5,507 | |||||
|
|
||||||||
|
Cash flows from investing activities: |
||||||||
|
Additions to hotel properties |
(3,446) | (3,853) | (3,034) | |||||
|
Investment in joint venture |
(9,280) |
- |
- |
|||||
|
Acquisitions of hotel properties |
(22,450) | (42,592) |
- |
|||||
|
Proceeds from sale of hotel assets |
58,593 | 53,306 | 21,316 | |||||
|
Net changes in capital expenditure escrows |
(1,475) | (1,463) | (340) | |||||
|
Net cash provided by investing activities |
21,942 | 5,398 | 17,942 | |||||
|
|
||||||||
|
Cash flows from financing activities: |
||||||||
|
Deferred financing costs |
(136) | (865) | (485) | |||||
|
Principal payments on long-term debt |
(39,965) | (51,868) | (22,207) | |||||
|
Proceeds from long-term debt |
15,925 | 44,620 |
- |
|||||
|
Payments on revolving debt |
(10,305) | (39,056) | (30,843) | |||||
|
Proceeds from revolving debt |
10,198 | 41,152 | 29,692 | |||||
|
Debt early extinguishment penalties |
(1,752) |
- |
(120) | |||||
|
Series D Preferred Stock issuance |
28,881 |
- |
- |
|||||
|
Series A and B Preferred Stock redemption, including accumulated dividends |
(20,167) |
- |
- |
|||||
|
Cash dividends paid to common shareholders |
(198) |
- |
- |
|||||
|
Cash dividends paid to Series C and D Preferred shareholders |
(3,598) |
- |
- |
|||||
|
Proceeds from common stock issued in rights offering |
- |
346 | 860 | |||||
|
Rights offering issuance costs |
- |
- |
(218) | |||||
|
Other items |
(37) |
- |
- |
|||||
|
Net cash used in financing activities |
(21,154) | (5,671) | (23,321) | |||||
|
|
||||||||
|
Increase in cash and cash equivalents |
3,456 | 4,697 | 128 | |||||
|
Cash and cash equivalents, beginning of year |
4,870 | 173 | 45 | |||||
|
Cash and cash equivalents, end of year |
$ |
8,326 |
$ |
4,870 |
$ |
173 | ||
|
|
||||||||
|
Supplemental cash flow information |
||||||||
|
Interest paid, net of amounts capitalized |
$ |
4,229 |
$ |
5,085 |
$ |
7,119 | ||
|
Income taxes paid |
$ |
37 |
$ |
- |
$ |
- |
||
|
|
||||||||
|
Schedule of noncash investing and financing activities: |
||||||||
|
Unamortized debt discount |
$ |
- |
- |
$ |
113 | |||
|
Convertible loan embedded derivative |
$ |
- |
$ |
- |
$ |
(151) | ||
|
Debt converted to common stock |
$ |
- |
$ |
- |
$ |
(2,000) | ||
|
Common stock issued on conversion of debt |
$ |
- |
$ |
- |
$ |
1,950 | ||
|
Debt assumed in acquisitions |
$ |
$ |
11,220 |
$ |
- |
|||
|
Fair Value of CHLP operating units issued in acquisitions |
$ |
50 |
$ |
450 |
$ |
- |
||
|
In kind dividends deemed on preferred stock |
$ |
20,218 |
$ |
- |
$ |
- |
||
See accompanying notes to consolidated financial statements.
56
Condor Hospitality Trust, Inc. and Subsidiaries
Notes To Consolidated Financial Statements
(In thousands, except share and per share data)
NOTE 1. ORGANIZATION AND SUMMARY OF SIGNIFICANT ACCOUNTING POLICIES
Description of Business
Condor Hospitality Trust, Inc. (“CDOR,” “Condor,” or the “Company”), which until July 15, 2015 was formerly named Supertel Hospitality, Inc.,was incorporated in Virginia on August 23, 1994 and was reincorporated in Maryland on November 19, 2014. CDOR is a self-administered real estate investment trust (“REIT”) for federal income tax purposes that specializes in the investment and ownership of high-quality select-service, limited-service, extended stay, and compact full service hotels. As of December 31, 2016, the Company owned 19 hotels in 12 states, including one hotel owned through an 80% interest in an unconsolidated joint venture (the “Atlanta JV”).
CDOR, through its wholly owned subsidiary, Condor Hospitality REIT Trust (formerly Supertel Hospitality REIT Trust), owns a controlling interests in Condor Hospitality Limited Partnership (“CHLP”) (formerly Supertel Limited Partnership), for which we serve as general partner. CHLP, including its various subsidiary partnerships, holds substantially all of the Company’s assets (with the exception of the furniture and equipment of 14 properties held by TRS Leasing, Inc.) and conducts all of its operations. At December 31, 2016, the Company owned 97.8% of the common operating units (“common units”) of CHLP with the remaining common units owned by other limited partners and long-term incentive plan unit holders (see Note 12). The Company’s 100% owned E&P Financing Limited Partnership no longer owns any assets or conducts any operations following the sale of its last remaining property in January 2016.
In order for the income from our hotel property investments to constitute “rents from real properties” for purposes of the gross income tests required by the Internal Revenue Service (“IRS”) for REIT qualification, the income we earn cannot be derived from the operation of any of our hotels. Therefore, CHLP and its subsidiaries lease our hotel properties to the Company’s wholly owned taxable REIT subsidiary, TRS Leasing, Inc., and its wholly owned subsidiaries (the “TRS”). The TRS in turn engages third-party eligible independent contractors to manage the hotels. CHLP, the TRS, and their respective subsidiaries are consolidated into the Company’s financial statements.
References to “we,” “our,” and “us” herein refer to Condor Hospitality Trust, Inc., including as the context requires, its direct and indirect subsidiaries.
Historically, as a result of the geographic areas in which we operate, the operations of our hotels have been seasonal in nature. Generally, occupancy rates, revenue, and operating income have been greater in the second and third quarters of the calendar year than in the first and fourth quarters, with the exception of our hotels located in Florida, which experience peak demand in the first and fourth quarters of the year. The results of the hotels acquired in 2015 and 2016 (see Note 3), because of their locations and chain scale, are expected to be less seasonal in nature than our legacy portfolio of assets.
Basis of Presentation
The consolidated financial statements have been prepared in accordance with U.S. general accepted accounting principles (“U.S. GAAP”) and include the accounts of the Company, as well as the accounts of CHLP and its subsidiaries and our wholly owned TRS and its subsidiaries. All significant intercompany balances and transactions have been eliminated in consolidation.
Estimates, Risks, and Uncertainties
The preparation of the consolidated financial statements in conformity with U.S. GAAP requires management to make estimates and assumptions that effect the reported amounts of assets and liabilities and disclosure of contingent assets and liabilities at the date of the consolidated financial statements as well as revenue and expenses recognized during the reporting period. Actual results could differ from those estimates. Because the state of the
57
Condor Hospitality Trust, Inc. and Subsidiaries
Notes To Consolidated Financial Statements
(In thousands, except share and per share data)
economy and of the real estate market can significantly impact hotel operational performance and the estimated fair value of our assets, it is possible that the estimates and assumptions that have been utilized in the preparation of the consolidated financial statements could change.
Investment in Hotel Properties
At the time of acquisition, the Company allocates the purchase price of assets to asset classes based on the fair value of the acquired real estate, furniture, fixtures, and equipment, and intangible assets, if any, and the fair value of liabilities assumed, including debt. Acquisition date fair values are determined based on replacement costs, appraised values, and estimated fair values using methods similar to those used by independent appraisers including discounted cash flows and capitalization rates. Acquisition costs are expensed as incurred.
The Company’s investments in hotel properties are recorded at cost and are depreciated using the straight-line method over an estimated useful life of 15 to 40 years for buildings and improvements and 3 to 12 years for furniture and equipment.
Renovations and/or replacements that improve or extend the life of the hotel properties are capitalized and depreciated over their useful lives. Repairs and maintenance are expensed as incurred.
On a quarterly basis, the Company reviews the carrying value of each held for use hotel to determine if certain circumstances, known as triggering events, exist indicating impairment to the carrying value of the hotel or that depreciation periods should be modified. These triggering events include a significant change in the cash flows of or a significant adverse change in the business climate for a hotel. If facts or circumstances support the possibility of impairment, the Company will prepare an estimate of the undiscounted future cash flows, without interest charges, of the specific hotel and determine if the investment in such hotel is recoverable based on these undiscounted future cash flows. If the investment is not recoverable based on this analysis, an impairment charge will be taken, if necessary, to reduce the carrying value of the hotel to the hotel’s fair value.
Investment in Joint Venture
If it is determined that we do not have a controlling interest in a joint venture, either through our financial interest in a variable interest entity (“VIE”) or through our voting interest in a voting interest entity (“VOE”) and we have the ability to provide significant influence, the equity method of accounting is used. Under this method, the investment, originally recorded at cost, is adjusted to recognize our share of net earnings or losses of the affiliate as they occur, with losses limited to the extent of our investment in, advances to, and commitments to the investee. Pursuant to our Atlanta JV agreement, allocations of the profits and losses of our Atlanta JV may be allocated disproportionately to nominal ownership percentages due to specified preferred return rate thresholds.
Distributions received from a joint venture are classified in the statement of cash flows using the cumulative distributions approach. Distributions are classified as cash inflows from operating activities unless cumulative distributions, including those from prior periods not designated as a return of investment, exceed cumulative recognized equity in earnings of the joint venture. Excess distributions are classified as cash inflows from investing activities as a return of investment.
On an annual basis or at interim periods if events and circumstances indicate that the investment may be impaired, the Company reviews the carrying value of its investment in unconsolidated joint venture to determine if circumstances indicate impairment to the carrying value of the investment that is other than temporary. The investment is considered impaired if its estimated fair value is less than the carrying amount of the investment and that impairment is other than temporary.
58
Condor Hospitality Trust, Inc. and Subsidiaries
Notes To Consolidated Financial Statements
(In thousands, except share and per share data)
Assets Held for Sale and Discontinued Operations
A hotel is considered held for sale (a) when a contract for sale is entered into, a substantial, nonrefundable deposit has been committed by the purchaser, and sale is expected to occur within one year, or (b) if management has committed to and is actively engaged in a plan sell the property, the property is available for sale in its current condition, and it is probable the sale will be completed within one year. If a hotel is considered held for sale as of the most recent balance sheet presented or was sold in any period presented, the hotel property and the debt it collateralizes are shown as held for sale in all periods presented.
Depreciation of our hotels is discontinued at the time they are considered held for sale. If the fair value of the held for sale property less costs to sell is lower than the carrying value of the hotel, the Company will record an impairment loss. Impairment losses on held for sale properties may be subsequently recovered up to the amount of the cumulative impairment losses taken while the property is held for sale should future revisions to fair value estimates be required. If active marketing ceases or the property no longer meets the criteria to be classified as held for sale, the property is reclassified to held for use and measured at the lower of its (a) carrying amount before the property was classified as held for sale, adjusted for any depreciation expense that would have been recognized had the property been continuously classified as held for use, or (b) its fair value at the date of the subsequent decision not to sell.
Historically, we have presented the results of operations of hotel properties that have been sold or considered held for sale as discontinued operations. In April 2014, the Financial Accounting Standards Board (“FASB”) issued Accounting Standards Update (“ASU”) 2014-08, Presentation of Financial Statements (Topic 205) and Property, Plant, and Equipment (Topic 360): Reporting Discontinued Operations and Disclosures of Disposals of Components of an Entity. The amendments in ASU 2014-08 change the criteria for reporting a discontinued operation and require new disclosures of both discontinued operations and certain other significant disposals that do not meet the definition of a discontinued operation. Only disposals representing a strategic shift in operations that have a major effect on an entity’s operations and financial results should be presented as discontinued operations subsequent to adoption. The Company adopted the pronouncement on October 1, 2014. As a result of this adoption, only the operations of hotels meeting the criteria to be considered held for sale prior to October 1, 2014 are included in discontinued operations for all periods presented as no individual hotel disposition represents a strategic shift in operations or has a major effect on our operations or financial results.
Gains on the sale of real estate are recognized when a property is sold, provided that the profit is determinable, meaning that collectability of the sales price is reasonably assured or can be estimated, and that the earnings process is complete, meaning that the seller is not obligated to perform significant activities after the sale in order to earn the profit. If these criteria are not met, the timing of the sale is determined based on various criteria related to the terms of the transaction and any continuing involvement in the form of management or financial assistance associated with the property. If the sales criteria are not met, the gain is deferred and the finance, installment, or cost recovery method, as appropriate, is applied until the sales criteria are met. To the extent we sell a property and retain a partial ownership interest in the property, we generally recognize a gain to the extent of the third party ownership interest.
Cash and Cash Equivalents
Cash and cash equivalents includes cash and highly liquid investments with original maturities of three months or less when acquired, and are carried at cost which approximates fair value. The Company maintained a major portion of its deposits with Great Western Bank, a Nebraska Corporation, at December 31, 2016 and with US Bank at December 31, 2015. The balances on deposit at Great Western Bank and US Bank may at times exceed the federal deposit insurance limit, however, management believes that no significant credit risk exists with respect to the uninsured portion of these cash balances.
59
Condor Hospitality Trust, Inc. and Subsidiaries
Notes To Consolidated Financial Statements
(In thousands, except share and per share data)
Restricted Cash
Restricted cash consists of cash held in escrow for the replacement of furniture and fixtures or for real estate taxes and property insurance as required under certain loan agreements. For purposes of the statement of cash flows, changes in restricted cash caused by changes in required reserves for real estate taxes or property insurance are shown as operating activities. Changes in restricted cash caused by changes in required reserves for the replacement of furniture and fixtures are shown as investing activities.
Deferred Financing Cost
Direct costs incurred in financing transactions are capitalized as deferred financing costs and amortized to interest expense over the term of the related loan using the effective interest method. Deferred financing costs are presented on the balance sheet as a direct deduction from the associated debt liability.
Derivative Liabilities
In the normal course of business, the Company is exposed to the effects of interest rate changes, and the Company may enter into derivative instruments including interest rate swaps, caps, and collars to manage or economically hedge interest rate risk. Additionally, prior to the first quarter of 2016, the Company was required to include on the balance sheet certain bifurcated embedded derivative instruments such as conversion features in convertible instruments and certain common stock warrants.
All derivatives recognized by the Company are reported as derivative liabilities on the balance sheet and are adjusted to their fair value at each reporting date. Realized and unrealized gains and losses on derivative instruments are included in net gain (loss) on derivatives and convertible debt with the exception of realized gains and losses related to interest rate instruments which are included in interest expense on the statement of operations.
Noncontrolling Interest
Noncontrolling interest in CHLP represents the limited partners’ proportionate share of the equity in the operating partnership and long-term incentive plan (“LTIP”) units (see Note 12). Earnings and loss are allocated to noncontrolling interest in accordance with the weighted average percentage ownership of CHLP during the period.
Revenue Recognition
Revenue consists of amounts derived from hotel operations, including the sale of rooms, food and beverage, and other ancillary amenities. Revenue from the operation of the hotel properties is recognized when rooms are occupied and services have been rendered. Sales, use, occupancy, and similar taxes collected from customers and remitted to governmental authorities are accounted for on a net basis and therefore are excluded from revenue in the statement of operations.
Income Taxes
The Company qualifies and intends to continue to qualify as a REIT under applicable provisions of the Internal Revenue Code (the “Code”), as amended. In general, under such Code provisions, a trust which has made the required election and, in the taxable year, meets certain requirements and distributes to its shareholders at least 90% of its REIT taxable income, will not be subject to federal income tax to the extent of the income currently distributed to shareholders. If we fail to qualify as a REIT in any taxable year, we will be subject to federal income tax on our taxable income at regular corporate income tax rates and generally will be unable to re-elect REIT status until the fifth calendar year after the year in which we failed to qualify as a REIT, unless we satisfy certain relief provisions. Even if the Company qualifies for taxation as a REIT, the Company may be subject to certain state and local taxes on its income and property, and to federal income and excise taxes on its undistributed taxable income. Except with
60
Condor Hospitality Trust, Inc. and Subsidiaries
Notes To Consolidated Financial Statements
(In thousands, except share and per share data)
respect to the TRS, the Company does not believe that it will be liable for significant federal or state income taxes in future years.
A REIT will incur a 100% tax on the net gain derived from any sale or other disposition of property that the REIT holds primarily for sale to customers in the ordinary course of a trade or business. We do not believe any of our hotels were held primarily for sale in the ordinary course of our trade or business. However, if the IRS would successfully assert that we held such hotels primarily for sale in the ordinary course of our business, the gain from such sales could be subject to a 100% prohibited transaction tax.
Taxable income from non-REIT activities managed through the TRS, which is taxed as a C-Corporation, is subject to federal, state, and local income taxes. We account for the federal income taxes of our TRS using the asset and liability method. Under this method, deferred income taxes are recognized for temporary differences between the financial reporting bases of assets and liabilities of the TRS and their respective tax bases and for operating loss and tax credit carryforwards based on enacted tax rates expected to be in effect when such amounts are realized or settled. However, deferred tax assets are recognized only to the extent that it is more likely than not that they will be realized based on consideration of available evidence, including tax planning strategies and projections for future taxable income over the periods in which the remaining deferred tax assets are deductible. In assessing the realizability of deferred tax assets, the Company considers whether it is more likely than not (defined as a likelihood of more than 50%) that some portion or all of the deferred tax assets will not be realized. The ultimate realization of deferred tax assets is dependent upon the generation of future taxable income.
The Company may recognize a tax benefit from an uncertain tax position when it is more-likely-than-not (defined as a likelihood of more than 50%) that the position will be sustained upon examination, including resolution of any related appeals or litigation processes, based on its technical merits. If a tax position does not meet the more-likely-than-not recognition threshold, despite the Company’s belief that its filing position is supportable, the benefit of that tax position is not recognized in the statement of operations. The Company recognizes interest and penalties, as applicable, related to unrecognized tax benefits as a component of income tax expense. The Company recognizes unrecognized tax benefits in the period that the uncertainty is eliminated by either affirmative agreement to the uncertain tax position by the applicable taxing authority or by expiration of the applicable statute of limitations. For the years ended December 31, 2016, 2015, and 2014, the Company did not record any uncertain tax positions.
Fair Value Measurements
Fair value is defined as the price that would be received to sell an asset or paid to transfer a liability in an orderly transaction between market participants at the measurement date. Fair value measurements are utilized to determine the value of certain liabilities, to perform impairment assessments, to account for hotel acquisitions, and for disclosure purposes. Fair value measurements are classified into a three-tiered fair value hierarchy, which prioritizes the inputs used in measuring fair value as follows:
Level 1: Inputs are quoted prices (unadjusted) in active markets for identical assets or liabilities.
Level 2: Directly or indirectly observable inputs other than quoted prices included in Level 1. Level 2 inputs may include quoted prices for similar assets or liabilities in active markets, quoted prices for identical or similar assets or liabilities in markets that are not active, and model-derived valuations whose inputs are observable.
Level 3: Unobservable inputs for which there is little or no market data, which require a reporting entity to develop its own assumptions.
Our estimates of fair value were determined using available market information and appropriate valuation methods. Considerable judgment is necessary to interpret market data and develop estimated fair value. The use of different market assumptions or valuation techniques may have a material effect on estimated fair value measurements. We
61
Condor Hospitality Trust, Inc. and Subsidiaries
Notes To Consolidated Financial Statements
(In thousands, except share and per share data)
classify assets and liabilities in the fair value hierarchy based on the lowest level of input that is significant to the fair value measurement.
With the exception of fixed rate debt (see Note 8) and other financial instruments carried at fair value, the carrying amounts of the Company’s financial instruments approximates their fair values due to their short-term nature or variable market-based interest rates.
Fair Value Option
Under U.S. GAAP, the Company has the irrevocable option to report most financial assets and financial liabilities at fair value on an instrument by instrument basis, with changes in fair value reported in net earnings. This option was elected for the treatment of the Company’s convertible debt entered into on March 16, 2016 (see Note 7).
Stock-Based Compensation
Stock-based compensation for awards with a service condition only is measured based on the fair value of the award on the date of grant and recognized as compensation expense on a straight line basis over the service period. The compensation cost related to awards for which vesting is contingent upon achieving a market based criteria is measured at the fair value of the award on the date of grant, including consideration of the market criteria, and amortized on a straight line basis over the performance period. The fair value of the award at grant is measured using either the closing stock price on the date of grant (for vested and unvested share awards), the Black-Scholes model (for options and warrants), or a Monte Carlo simulation (for LTIP awards), as appropriate. Compensation cost is recognized as additional paid-in capital for awards of the Company’s common stock and as noncontrolling interest for LTIP awards of CHLP common units.
Recently Adopted Accounting Standards
In November 2014, the FASB issued ASU 2014-16, Derivatives and Hedging (Topic 815): Determining Whether the Host Contract in a Hybrid Financial Instrument Issued in the Form of a Share is More Akin to Debt or to Equity, which clarifies certain of the criteria for determining whether derivative features in a hybrid financial instrument should be separately recognized. ASU 2014-16 is effective for fiscal years beginning after December 15, 2015 and permits either a retrospective or cumulative effect transition method. ASU 2014-16 was adopted by the Company on January 1, 2016 and was utilized in determining the accounting for the 6.25% Series D Cumulative Convertible Preferred Stock (“Series D Preferred Stock”) issued in March 2016 (see Note 10).
In February 2015, the FASB issued ASU No. 2015-02, Consolidation - Amendments to the Consolidation Analysis, which amends the current consolidation guidance effecting both the VIE and VOE consolidation models. The standard does not add or remove any of the characteristics in determining if an entity is a VIE or VOE, but rather enhances the way the Company assesses some of these characteristics. The Company adopted this standard on January 1, 2016 and concluded that CHLP now meets the criteria to be considered a VIE of which the Company is the primary beneficiary and, accordingly, the Company continues to consolidate CHLP. The Company’s sole significant asset is its investment in CHLP, and consequently, substantially all of the Company’s assets and liabilities represent those assets and liabilities of CHLP. All of the Company’s debt is an obligation of CHLP. This ASU was also used in the determination of the accounting for the Atlanta JV entered into in August 2016 (see Note 5).
In April 2015, the FASB issued ASU 2015-03, Simplifying the Presentation of Debt Issuance Costs, which requires debt issuance costs to be presented in the balance sheet as a direct deduction from the associated debt liability. The Company adopted this standard on January 1, 2016 and presents all debt issuance costs, other than issuance costs related to its revolving credit facility, as a direct deduction from the carrying value of the debt liability. Adoption of this standard was applied retrospectively for all periods presented, effecting only the presentation of the balance
62
Condor Hospitality Trust, Inc. and Subsidiaries
Notes To Consolidated Financial Statements
(In thousands, except share and per share data)
sheet. The adoption of this standard did not have a material impact on the Company's financial position and had no impact on the results of operations or cash flows. For the amounts of the reclassification, see Note 6.
Recently Issued Accounting Standards
In May 2014, the FASB issued ASU 2014-09, Revenue from Contracts with Customers, which requires an entity to recognize the amount of revenue to which it expects to be entitled for the transfer of promised goods or services to customers. The ASU will replace most existing revenue recognition guidance in U.S. GAAP when it becomes effective. The original updated accounting guidance was effective for annual and interim reporting periods in fiscal years beginning after December 15, 2016, however, in July 2015, the FASB approved a one year delay of the effective date to fiscal years beginning after December 15, 2017. As such, the standard will be effective for the Company on January 1, 2018. The standard permits the use of either the retrospective or cumulative effect transition method. The Company has begun to evaluate each of its revenue streams under the new model. Based on preliminary assessments, the Company does not expect the adoption of this guidance to materially affect the amount or timing of revenue recognition for revenues from room, food and beverage, and other hotel level sales. Furthermore, for real estate sales to third parties, primarily a result of disposition of real estate in exchange for cash with few contingencies, we do not expect the standard to significantly impact the recognition of or accounting for these sales.
In February 2016, the FASB issued ASU 2016-02, Leases (Topic 842), which supersedes most existing lease guidance in U.S. GAAP when it becomes effective. ASU 2016-02 requires, among other changes to the lease accounting guidance, lessees to recognize most leases on-balance sheet via a right of use asset and lease liability and additional qualitative and quantitative disclosures. ASU 2016-02 is effective for the Company for annual periods in fiscal years beginning after December 15, 2019, permits early adoption, and mandates a modified retrospective transition method. The Company is required to adopt ASU 2016-02 on January 1, 2020. The Company is evaluating the effect that ASU 2016-02 will have on its consolidated financial statements and related disclosures.
In January 2017, the FASB issued ASU 2017-01, Business Combinations (Topic 805): Clarifying the Definition of a Business, which clarifies the definition of a business to assist entities with evaluating whether transactions should be accounted for as acquisitions of assets or business combinations. This standard will be effective for annual periods beginning after December 15, 2017, although early adoption is permitted. The Company is evaluating the effect that ASU 2017-01 will have on its consolidated financial statements and related disclosures.
Reclassifications
Certain amounts in prior year financial statements have been reclassified to conform to current year presentation.
Beginning in the first quarter of 2016, we have revised the classification of cash payments for debt prepayment or extinguishment penalties in our statements of cash flows from where they were previously presented as operating cash flows to financing cash flows. We have concluded that this classification is preferable as these payments are closely related to other financing cash flows, such as the repayment of debt, and reflect the impact of financing decisions made by management. This revised policy is also consistent with the ASU 2016-15, Statement of Cash Flows, which was issued in August 2016 and becomes effective for the Company on January 1, 2018. This revision in classification had the effect of increasing operating cash flows and decreasing financing cash flows by $1,752, $0, and $120 during the years ended December 31, 2016, 2015, and 2014, respectively.
Liquidity
The following disclosure and analysis is pursuant to ASU 2014-15, Disclosure of Uncertainties about an Entity’s Ability to Continue as a Going Concern. ASU 2014-15 requires the Company to evaluate whether there are conditions and events, considered in the aggregate, that raise substantial doubt about its ability to continue as a
63
Condor Hospitality Trust, Inc. and Subsidiaries
Notes To Consolidated Financial Statements
(In thousands, except share and per share data)
going concern within one year after the date the financial statements are issued. To satisfy the requirements of this standard, the Company’s evaluation considered a 15 month period beginning January 1, 2017.
We expect to meet our short-term liquidity requirements through net cash provided by operations, existing cash balances and working capital, short-term borrowings under our revolving credit agreement with Great Western Bank, and the release of restricted cash upon the satisfaction of usage requirements. At December 31, 2016, the Company had $8,326 million of cash and cash equivalents on hand and $1,234 of unused availability under its revolving credit agreement. Our short-term liquidity requirements consist primarily of operating expenses and other expenditures directly associated with our hotel properties, recurring maintenance and capital expenditures necessary to maintain our hotels in accordance with brand standards, interest expense and scheduled principal payments on outstanding indebtedness, restricted cash funding obligations, and the payment of dividends in accordance with the REIT requirements of the Internal Revenue Code and as required in connection with our Series D Preferred Stock (which, as discussed as a subsequent event (see Note 17), was converted to common stock with $9,250 of a new class of stock, Series E Preferred Stock, issued on February 28, 2017). We presently expect to invest approximately $4,000 to $5,000 in capital expenditures related to hotel properties we currently own through March 31, 2018.
To maintain our REIT tax status, we generally must distribute at least 90% of our taxable income to our shareholders annually. In addition, we are subject to a 4% non-deductible excise tax if the actual amount distributed to shareholders in a calendar year is less than a minimum amount specified under the federal income tax laws. We have a general dividend policy of paying out approximately 100% of annual REIT taxable income. The actual amount of any future dividends will be determined by the Board of Directors based on our actual results of operations, economic conditions, capital expenditure requirements, and other factors that the Board of Directors deems relevant.
Our longer-term liquidity requirements consist primarily of the cost of acquiring additional hotel properties, renovations and other one-time capital expenditures that periodically are made related to our hotel properties, and scheduled debt payments, including maturing loans. Possible sources of liquidity to fund debt maturities and acquisitions and to meet other obligations include additional secured or unsecured debt financings and proceeds from public or private issuances of debt or equity securities.
Prior to the consideration of any asset sales or our ability to refinance debt subsequent to December 31, 2016, contractual principal payments on our debt outstanding, including normal amortization, total $15,788 through March 31, 2018, including the February 1, 2017 maturity of one of our Western Alliance Bank (“WAB”) loans with a balance at December 31, 2016 of $4,806, the November 6, 2017 maturity of our Cantor loan with a balance at December 31, 2016 of $5,713, the December 1, 2017 maturity of our Morgan Stanley loan with a balance at December 31, 2016 of $912, and the February 1, 2018 maturity of one of our WAB loans with a balance at December 31, 2016 of $2,803. On January 27, 2017, the WAB loan due February 1, 2017 was extended to February 1, 2018. Subsequently, on March 1, 2017, each of these pieces of debt was refinanced with a $90,000 secured credit facility that matures on March 1, 2019. Following this refinancing, contractual principal payments on our debt outstanding at December 31, 2016 through March 31, 2018 totaled approximately $1,100.
NOTE 2. INVESTMENT IN HOTEL PROPERTIES
Investments in hotel properties consisted of the following at December 31:
|
|
|
|
|
|
|
|
|
|
|
|
|
|
|
|
|
|
|
|
|
|
|
As of December 31, |
||||||||||||||||
|
|
|
2016 |
|
2015 |
||||||||||||||
|
|
|
Held for sale |
|
Held for use |
|
Total |
|
Held for sale |
|
Held for use |
|
Total |
||||||
|
Land |
|
$ |
2,392 |
|
$ |
14,020 |
|
$ |
16,412 |
|
$ |
8,184 |
|
$ |
10,683 |
|
$ |
18,867 |
|
Acquired below market lease intangibles |
|
|
- |
|
|
- |
|
|
- |
|
|
883 |
|
|
- |
|
|
883 |
|
Buildings, improvements, vehicles |
|
|
23,118 |
|
|
85,565 |
|
|
108,683 |
|
|
70,932 |
|
|
67,174 |
|
|
138,106 |
|
Furniture and equipment |
|
|
5,427 |
|
|
12,776 |
|
|
18,203 |
|
|
19,170 |
|
|
11,418 |
|
|
30,588 |
|
Construction-in-progress |
|
|
23 |
|
|
63 |
|
|
86 |
|
|
322 |
|
|
133 |
|
|
455 |
|
Investment in hotel properties |
|
|
30,960 |
|
|
112,424 |
|
|
143,384 |
|
|
99,491 |
|
|
89,408 |
|
|
188,899 |
|
Less accumulated depreciation |
|
|
(12,247) |
|
|
(16,266) |
|
|
(28,513) |
|
|
(44,691) |
|
|
(13,509) |
|
|
(58,200) |
64
Condor Hospitality Trust, Inc. and Subsidiaries
Notes To Consolidated Financial Statements
(In thousands, except share and per share data)
|
Investment in hotel properties, net |
|
$ |
18,713 |
|
$ |
96,158 |
|
$ |
114,871 |
|
$ |
54,800 |
|
$ |
75,899 |
|
$ |
130,699 |
NOTE 3. ACQUISITION OF HOTEL PROPERTIES
On December 14, 2016, the Company acquired one wholly-owned hotel, the Aloft Leawood / Overland Park (Kansas City). The allocation of the purchase price based on fair value, which was determined using Level 3 fair value inputs, was as follows:
|
|
|
|
|
|
|
|
|
|
|
|
|
|
|
|
|
|
|
|
|
|
|
|
Hotel |
|
Land |
|
Buildings, improvements, and vehicles |
|
Furniture and equipment |
|
Total purchase price |
|
Debt originated at acquisition |
|
Issuance of CHLP common units |
|
Net cash |
|||||||
|
Aloft |
|
$ |
3,339 |
|
$ |
18,046 |
|
$ |
1,115 |
|
$ |
22,500 |
|
$ |
15,925 |
|
$ |
50 |
|
$ |
6,525 |
|
Leawood, KS |
|
|
|
|
|
|
|
|
|
|
|
|
|
|
|
|
|
|
|
|
|
The $22,500 purchase price was funded with the proceeds of two mortgage loans provided by Great Western Bank totaling $15,925, approximately $6,525 in cash, and the issuance of 213,904 common units from CHLP with a value of $50.
During 2015, the Company acquired three wholly-owned hotel properties. The allocation of the purchase price based on fair value, which was determined using Level 3 fair value inputs, was as follows:
|
|
|
|
|
|
|
|
|
|
|
|
|
|
|
|
|
|
|
|
|
|
|
|
|
|
|
|
|
Hotel |
|
Acquisition date |
|
Land |
|
Building, improvements, and vehicles |
|
Furniture and equipment |
|
Total purchase price |
|
Assumption of debt |
|
Debt originated at acquisition |
|
Issuance of CHLP common units |
|
Net cash |
||||||||
|
Hotel Indigo |
|
10/2/2015 |
|
$ |
800 |
|
$ |
8,700 |
|
$ |
1,500 |
|
$ |
11,000 |
|
$ |
- |
|
$ |
5,000 |
|
$ |
150 |
|
$ |
5,850 |
|
Atlanta, GA |
|
|
|
|
|
|
|
|
|
|
|
|
|
|
|
|
|
|
|
|
|
|
|
|
|
|
|
Marriott Courtyard |
|
10/2/2015 |
|
|
2,100 |
|
|
11,050 |
|
|
850 |
|
|
14,000 |
|
|
- |
|
|
10,100 |
|
|
150 |
|
|
3,750 |
|
Jacksonville, FL |
|
|
|
|
|
|
|
|
|
|
|
|
|
|
|
|
|
|
|
|
|
|
|
|
|
|
|
SpringHill Suites |
|
10/1/2015 |
|
|
1,597 |
|
|
14,353 |
|
|
1,550 |
|
|
17,500 |
|
|
11,220 |
|
|
- |
|
|
150 |
|
|
6,130 |
|
San Antonio, TX |
|
|
|
|
|
|
|
|
|
|
|
|
|
|
|
|
|
|
|
|
|
|
|
|
|
|
|
Total |
|
|
|
$ |
4,497 |
|
$ |
34,103 |
|
$ |
3,900 |
|
$ |
42,500 |
|
$ |
11,220 |
|
$ |
15,100 |
|
$ |
450 |
|
$ |
15,730 |
|
|
|
|
|
|
|
|
|
|
|
|
|
|
|
|
|
|
|
|
|
|
|
|
|
|
|
|
The $42,500 purchase price was funded with the assumption of one loan with an aggregate outstanding principal balance of $11,220 and two newly originated GE Capital loans totaling $15,100 (sold to WAB in April 2016). The remaining $16,180 was funded with approximately $14,900 in cash, approximately $830 of borrowings from the Company’s existing credit facility with Great Western Bank, and the issuance of common units from CHLP. A total of 2,298,879 common units were issued with a value of $450.
There were no hotel acquisitions in 2014.
Included in the statement of operations for the year ended December 31, 2016 and 2015 is total revenue of $12,786 and $2,611 and total operating income of $2,279 and $356, respectively, which represent the results of operations for these four hotels since the date of acquisition.
Pro Forma Results (Unaudited)
The following condensed pro forma financial data is presented as if all acquisitions completed during the years ended December 31, 2016 and 2015 (including the Atlanta JV acquisition subsequently discussed (see Note 5)) had been completed on January 1, 2015 and 2014, respectively. The pro forma results below exclude acquisition costs of $550 and $684 incurred during the years ended December 31, 2016 and 2015, respectively. The condensed pro forma financial data is not necessarily indicative of what actual results of operations of the Company would have been assuming the acquisitions had been consummated on January 1, 2015 and 2014, nor do they purport to represent the results of operations for future periods.
65
Condor Hospitality Trust, Inc. and Subsidiaries
Notes To Consolidated Financial Statements
(In thousands, except share and per share data)
|
|
Years ended December 31, |
||||
|
|
2016 |
2015 |
|||
|
Total revenue |
$ |
56,741 |
$ |
73,281 | |
|
Operating income |
$ |
3,970 |
$ |
6,774 | |
|
Net Income attributable to common shareholders |
$ |
3,755 |
$ |
10,816 | |
|
Net Income per share available to common shareholders-basic |
$ |
0.76 |
$ |
2.21 | |
|
Net Income per share available to common shareholders-diluted |
$ |
0.19 |
$ |
0.05 | |
NOTE 4: DISPOSITION OF HOTEL PROPERTIES AND DISCONTINUED OPERATIONS
As of December 31, 2016, the Company had seven hotels classified as held for sale. At the beginning of 2016, the Company had 16 hotels held for sale and during the year classified an additional 16 hotels as held for sale. Twenty-five of these hotels were sold during 2016. None of the hotels reclassified as held for sale since the Company’s adoption of ASU 2014-08 on October 1, 2014 represent a strategic shift that has (or will have) a major effect on the entity’s operations and financial results. As a result, only hotels classified as held for sale prior to October 1, 2014 (excluding those subsequent reclassified as held for use), none of which remain unsold at December 31, 2016, are included in discontinued operations with all other hotels, including those subsequently sold or classified as held for sale, reported in continuing operations.
In 2016, 2015, and 2014, the Company sold 25 hotels, 17 hotels, and 13 hotels, respectively, resulting in total gains of $24,256, $7,759, and $2,749, respectively, of which $23,575, $4,996, and $0, respectively, was included in continuing operations.
Included in these 2015 sales were two hotels in Alexandria, Virginia that were sold on July 13, 2015 for a combined gross sales price of $19,000. These hotels represent a significant disposition, and as such, their operating results are disclosed. The Alexandria Comfort Inn and Days Inn hotels had combined net earnings (loss) of ($665) and $761 for the years ended December 31, 2015 and 2014, respectively. Net earnings for the year ended December 31, 2015 includes impairment expense of $1,020 which was recognized following the hotels classification as held for sale. Earnings attributable to noncontrolling interest related to these properties for the years ended December 31, 2015 and 2014 were $3 and $1, respectively.
66
Condor Hospitality Trust, Inc. and Subsidiaries
Notes To Consolidated Financial Statements
(In thousands, except share and per share data)
The Company allocates interest expense to discontinued operations for debt that is to be assumed or that is required to be repaid as a result of the disposal transaction. The following table sets forth the components of discontinued operations for the years ended December 31, 2016, 2015 and 2014:
|
|
Year ended December 31, |
||||||||
|
|
2016 |
2015 |
2014 |
||||||
|
|
|||||||||
|
Revenue |
$ |
6 |
$ |
2,923 |
$ |
13,579 | |||
|
Hotel and property operations expense |
(4) | (1,946) | (10,410) | ||||||
|
Depreciation and amortization expense |
- |
- |
(112) | ||||||
|
General and administrative expense |
- |
- |
- |
||||||
|
Net gain on dispositions of assets |
681 | 2,997 | 2,751 | ||||||
|
Interest expense |
(5) | (223) | (1,140) | ||||||
|
Loss on extinguishment of debt |
- |
- |
(120) | ||||||
|
Impairment recovery (loss) |
- |
121 | (1,652) | ||||||
|
|
$ |
678 |
$ |
3,872 |
$ |
2,896 | |||
|
|
|||||||||
|
Capital expenditures |
$ |
- |
$ |
90 |
$ |
338 | |||
|
|
|||||||||
NOTE 5. INVESTMENT IN UNCONSOLIDATED JOINT VENTURE
On August 1, 2016, the Company entered into a joint venture with Three Wall Capital LLC and certain of its affiliates (“TWC”) to acquire a 254-room Aloft hotel in downtown Atlanta, Georgia. The Company accounts for the Atlanta JV under the equity method. Condor owns 80% of the Atlanta JV with TWC owning the remaining 20%. The Atlanta JV is comprised of two companies: Spring Street Hotel Property II LLC, of which CHLP indirectly owns an 80% equity interest, and Spring Street Hotel OpCo II LLC, of which our TRS indirectly owns an 80% equity interest. TWC owns the remaining 20% equity interest in these two companies.
On August 22, 2016, the Atlanta JV closed on the acquisition of the Atlanta Aloft for a purchase price of $43,550, subject to working capital and similar adjustments. The purchase price was allocated by the Atlanta JV based on fair value, which was determined using Level 3 fair value inputs, as documented in the table below:
|
|
|
|
|
|
|
|
|
|
|
|
|
|
|
|
|
|
|
|
|
|
|
|
Hotel |
|
Land |
|
Buildings, improvements, and vehicles |
|
Furniture and equipment |
|
Land option (1) |
|
Total purchase price |
|
Debt originated at acquisition |
|
Net cash |
|||||||
|
Aloft |
|
$ |
13,025 |
|
$ |
34,048 |
|
$ |
2,667 |
|
$ |
(6,190) |
|
$ |
43,550 |
|
$ |
33,750 |
|
$ |
9,800 |
|
Atlanta, GA |
|
|
|
|
|
|
|
|
|
|
|
|
|
|
|
|
|
|
|
|
|
|
(1) |
The purchase agreement includes a provision which permits the seller to purchase the surface parking lot north of the hotel exercisable for ten years at less than market rates |
The purchase price for the Atlanta Aloft was paid with $9,800 in cash, of which $7,840 was contributed by Condor and $1,960 was contributed by TWC, and $33,750 of proceeds from a term loan secured by the property. Condor additionally contributed $1,440 and TWC additionally contributed $360 to the Atlanta JV to cover acquisition costs and to provide working capital to the entity. The term loan, obtained from LoanCore Capital Credit REIT LLC, has an initial term of 24 months with three 12-month extension periods which may be exercised at the Atlanta JV’s option subject to certain conditions and fees. The interest rate is a floating rate calculated on the one-month LIBOR plus 5.0%, and as a condition to closing, the Atlanta JV purchased a LIBOR cap of 3.0%. The current interest rate on the loan is 5.75%. The loan is non-recourse to the Atlanta JV, subject to specified exceptions. The loan is also non-recourse to Condor, except for certain customary carve-outs which are guaranteed by the Company.
67
Condor Hospitality Trust, Inc. and Subsidiaries
Notes To Consolidated Financial Statements
(In thousands, except share and per share data)
Under the Atlanta JV agreement, the Atlanta JV is managed by TWC in accordance with business plans and budgets approved by both partners. Major decisions as detailed in the agreement also require joint approval. Condor may remove TWC as manager of the Atlanta JV and appoint a new manager only upon the occurrence of certain events. The Atlanta Aloft hotel is managed by Boast Hotel Management Company LLC (“Boast”), an affiliate of TWC. The Atlanta JV paid to Boast total management fees of $110 during the year ended December 31, 2016.
Net cash flow and profits from the Atlanta JV will be distributed each fiscal year first with a 10% preferred return on capital contributions to Condor, second with a 10% preferred return on capital contributions to TWC, and third with any remainder distributed to the partners based on their pro-rata equity ownership. Losses are allocated based on pro-rata equity ownership. The Atlanta JV agreement also includes buy-sell rights for both members (generally after three years of hotel ownership for Condor and after five years for TWC) and Condor has a purchase option for TWC’s Atlanta JV ownership interest exercisable between the third and fifth anniversary of the hotel closing.
The following tables represent the total assets, liabilities, equity, and components of net income (loss), including the Company’s share, of the Atlanta JV as of and for the year ended December 31, 2016:
68
Condor Hospitality Trust, Inc. and Subsidiaries
Notes To Consolidated Financial Statements
(In thousands, except share and per share data)
|
|
As of |
||
|
|
December 31, 2016 |
||
|
Investment in hotel properties, net |
$ |
49,305 | |
|
Cash and cash equivalents |
1,184 | ||
|
Restricted cash, property escrows |
464 | ||
|
Accounts receivable, prepaid expenses, and other assets |
320 | ||
|
Total Assets |
$ |
51,273 | |
|
Accounts payable, accrued expenses, and other liabilities |
$ |
633 | |
|
Land option liability |
6,190 | ||
|
Long-term debt, net of deferred financing costs |
33,155 | ||
|
Total Liabilities |
39,978 | ||
|
Condor equity |
9,036 | ||
|
TWC equity |
2,259 | ||
|
Total Equity |
11,295 | ||
|
Total Liabilities and Equity |
$ |
51,273 | |
|
|
|||
|
|
Year ended December 31, 2016 |
||
|
Revenue |
|||
|
Room rentals and other hotel services |
$ |
3,703 | |
|
Operating Expenses |
|||
|
Hotel and property operations |
2,457 | ||
|
Depreciation and amortization |
471 | ||
|
Acquisition |
299 | ||
|
Total operating expenses |
3,227 | ||
|
Operating income |
476 | ||
|
Net loss on disposition of assets |
(2) | ||
|
Net loss on derivative |
(6) | ||
|
Interest expense |
(773) | ||
|
Net loss |
$ |
(305) | |
|
|
|||
|
Condor allocated loss |
$ |
(244) | |
|
TWC allocated loss |
(61) | ||
|
Net loss |
$ |
(305) | |
69
Condor Hospitality Trust, Inc. and Subsidiaries
Notes To Consolidated Financial Statements
(In thousands, except share and per share data)
NOTE 6. LONG-TERM DEBT
Long-term debt, including debt related to hotel properties held for sale, consisted of the following loans payable at December 31:
|
|
|
|
|
|
|
|
|
|
|
|
|
|
|
|
|
|
|
|
|
|
|
|
|
|
|
|
|
|
|
|
|
|
|
|
|
|
|
|
|
|
|
|
|
|
|
|
|
Lender |
|
|
Balance at December 31, 2016 |
|
Interest rate at December 31, 2016 |
|
Maturity |
|
Amortization provision |
|
Properties encumbered at December 31, 2016 |
|
|
Balance at December 31, 2015 |
|
Fixed rate debt |
|
|
|
|
|
|
|
|
|
|
|
|
|
|
|
Western Alliance Bank |
|
$ |
4,806 |
|
7.17% |
|
02/2017 |
|
15 years |
|
2 |
|
$ |
10,819 |
|
Western Alliance Bank |
|
|
2,803 |
|
4.75% |
|
02/2018 |
|
15 years |
|
2 |
|
|
3,864 |
|
Cantor Commercial Real Estate Lending |
|
|
5,713 |
|
4.25% |
|
11/2017 |
|
30 years |
|
1 |
|
|
5,826 |
|
Morgan Stanley Mortgage Capital Holdings, LLC |
|
|
912 |
|
5.83% |
|
12/2017 |
|
25 years |
|
4 |
|
|
27,542 |
|
Great Western Bank (7) |
|
|
14,326 |
|
4.33% |
|
12/2021 |
|
25 years |
|
1 |
|
|
- |
|
Great Western Bank (7) |
|
|
1,599 |
|
4.33% |
|
12/2021 |
|
7 years |
|
- |
|
|
- |
|
Total fixed rate debt |
|
|
30,159 |
|
|
|
|
|
|
|
|
|
|
48,051 |
|
|
|
|
|
|
|
|
|
|
|
|
|
|
|
|
|
Variable rate debt |
|
|
|
|
|
|
|
|
|
|
|
|
|
|
|
Great Western Bank (6) |
|
|
- |
|
4.75% (1) |
|
06/2018 |
|
Interest only |
|
2 |
|
|
3,215 |
|
Western Alliance Bank |
|
|
4,882 |
|
4.18% (2) |
|
11/2020 |
|
25 years |
|
1 |
|
|
4,990 |
|
Western Alliance Bank |
|
|
9,863 |
|
4.18% (2) |
|
11/2020 |
|
25 years |
|
1 |
|
|
10,079 |
|
The Huntington National Bank |
|
|
7,361 |
|
2.87% (3) |
|
11/2020 |
|
25 years |
|
3 |
|
|
9,981 |
|
LMREC 2015 - CREI, Inc. (Latitude) |
|
|
11,124 |
|
7.00% (4) |
|
05/2018 |
|
$12 monthly (5) |
|
1 |
|
|
11,220 |
|
Total variable rate debt |
|
|
33,230 |
|
|
|
|
|
|
|
18 |
|
|
39,485 |
|
|
|
|
|
|
|
|
|
|
|
|
|
|
|
|
|
Total long-term debt |
|
$ |
63,389 |
|
|
|
|
|
|
|
|
|
$ |
87,536 |
|
Less: Deferred financing costs |
|
|
(669) |
|
|
|
|
|
|
|
|
|
|
(1,525) |
|
Total long-term debt, net of deferred financing costs |
|
|
62,720 |
|
|
|
|
|
|
|
|
|
|
86,011 |
|
Less: Long-term debt related to hotel properties held for sale, net of deferred financing costs of $55 and $736 |
|
|
(5,945) |
|
|
|
|
|
|
|
|
|
|
(41,344) |
|
|
|
|
|
|
|
|
|
|
|
|
|
|
|
|
|
Long-term debt related to hotel properties held for use, net of deferred financing costs of $614 and $789 |
|
$ |
56,775 |
|
|
|
|
|
|
|
|
|
$ |
44,667 |
(1) Prime rate plus 1%; was fixed rate debt at 4.5% prior to amendment on June 5, 2015
(2) 90-day LIBOR plus 3.25%
(3) 30-day LIBOR plus 2.25%, fixed at 4.13% after giving effect to interest rate swap
(4) 30-day LIBOR plus 6.25% 30-day LIBOR capped at 1.0% after giving effect to market rate cap (see Note 8)
(5) $12 monthly payment began May 2016
(6) Total availability under this revolving credit facility was $1,234 at December 31, 2015; commitment fee on unused facility is 0.25%
(7) Both loans are collateralized by Aloft Leawood
At December 31, 2016, we had long-term debt of $57,389 associated with assets held for use with a weighted average term to maturity of 2.9 years and a weighted average interest rate of 4.89%. Of this total, at December 31, 2016, $26,079 is fixed rate debt with a weighted average term to maturity of 2.8 years and a weighted average interest rate of 4.78% and $31,310 is variable rate debt with a weighted average term to maturity of 2.9 years and a weighted average interest rate of 4.98%. At December 31, 2015, we had long-term debt of $45,455 associated with assets held for use with a weighted average term to maturity of 3.3 years and a weighted average interest rate of 4.98%. Of this total, at December 31, 2015, $12,439 is fixed rate debt with a weighted average term to maturity of 1.6 years and a weighted average interest rate of 5.63% and $33,016 is variable rate debt with a weighted average term to maturity of 3.9 years and a weighted average interest rate of 4.74%.
Debt is classified as held for sale if the properties collateralizing it are held for sale. Debt associated with assets held for sale is classified in the table below based on its contractual maturity although the balances are expected to be
70
Condor Hospitality Trust, Inc. and Subsidiaries
Notes To Consolidated Financial Statements
(In thousands, except share and per share data)
repaid within one year upon the sale of the related hotel properties. Aggregate annual principal payments on debt for the next five years and thereafter are as follows:
|
|
|||||||||
|
|
Held for sale |
Held for use |
Total |
||||||
| 2017 |
$ |
1,574 |
$ |
11,333 |
$ |
12,907 | |||
| 2018 | 2,603 | 12,065 | 14,668 | ||||||
| 2019 | 52 | 1,120 | 1,172 | ||||||
| 2020 | 1,771 | 19,199 | 20,970 | ||||||
| 2021 |
- |
13,672 | 13,672 | ||||||
|
Total |
$ |
6,000 |
$ |
57,389 |
$ |
63,389 | |||
|
|
|||||||||
As discussed further in the Subsequent Events footnote (see Note 17), on January 27, 2017, the WAB loan with a balance of $4,806 at December 31, 2016 due February 1, 2017 was extended to February 1, 2018. On March 1, 2017 a significant portion of the Company’s debt (including all debt outstanding at December 31, 2016 with the exception of the two variable rate WAB loans and the two fixed rate Great Western Bank loans) was refinanced with a $90,000 secured credit facility that matures on March 1, 2019.
Financial Covenants
The Company’s debt agreements contain requirements as to the maintenance of minimum levels of debt service and fixed charge coverage and required loan-to-value and leverage ratios, and place certain restrictions on dividends. As of December 31, 2016, we were in compliance with our financial covenants.
If we fail to pay our indebtedness when due, fail to comply with covenants or otherwise default on our loans, unless waived, we could incur higher interest rates during the period of such loan defaults, be required to immediately pay our indebtedness, and ultimately lose our hotels through lender foreclosure if we are unable to obtain alternative sources of financing with acceptable terms. Our Great Western Bank and certain of our WAB facilities contain cross-default provisions which would allow Great Western Bank and WAB to declare a default and accelerate our indebtedness to them if we default on our other loans and such default would permit that lender to accelerate our indebtedness under any such loan. As of December 31, 2016, we are not in default of any of our loans.
2014 Convertible Loan
On January 9, 2014, we entered into an unsecured convertible loan agreement with Real Estate Strategies, L.P. (“RES”), for a revolving line of credit of up to $2,000 with an annual interest rate equal to LIBOR plus 7%. During the first quarter of 2014, the Company borrowed the full amount of $2,000 available under the loan agreement.
Upon issuance, it was determined that the conversion feature should be bifurcated from its host instrument and accounted for as a freestanding derivative liability as there was no explicit limit to the number of shares to be delivered upon settlement of the conversion option. The initial fair value of the conversion feature was determined to be $151 and was recorded as a derivative liability with the offset recorded as a debt discount against the convertible loan.
RES applied the amount owed to it under the loan to purchase 1,250,000 shares of newly issued common stock. On June 11, 2014, the effective purchase date, $1,950, the fair value of the shares issued, was recorded in equity, and a gain of $88 was recorded in other income to reflect the change in fair value from March 31, 2014 to the date of conversion of the convertible loan, amortized debt discount, and the separately accounted for embedded derivative.
NOTE 7: CONVERTIBLE DEBT AT FAIR VALUE
As part of an agreement entered into on March 16, 2016 (the “Exchange Agreement”) with RES (see Note 10), the Company issued to RES a Convertible Promissory Note (the “Note”), bearing interest at 6.25% per annum, in the
71
Condor Hospitality Trust, Inc. and Subsidiaries
Notes To Consolidated Financial Statements
(In thousands, except share and per share data)
principal amount of $1,012. If the Series D Preferred Stock is outstanding, RES at its option may at any time elect to convert the Note, in whole or part, by notice delivered to the Company, into a number of shares of Series D Preferred Stock determined by dividing the principal amount of the Note to be converted by $10.00. Any time the Series D Preferred Stock is required by its terms to be converted into common stock of the Company (see Note 10), the Note will be automatically converted into the number of shares of common stock that RES would have received had RES converted this Note into Series D Preferred Stock immediately prior to the conversion of the Series D Preferred Stock. Any such conversion shall be reduced such that RES, together with its affiliates, does not beneficially own more than 49% of the voting stock of the Company and shall reduce the principal amount of the Note proportionally.
The Company has made an irrevocable election to record this Note in its entirety at fair value utilizing the fair value option available under U.S. GAAP in order to more accurately reflect the economic value of this Note. As such, gains and losses on the Note are included in net gain (loss) on derivatives and convertible debt within net earnings each reporting period. Losses related to this Note were recognized totaling $303 during the year ended December 31, 2016. The fair value of the Note is determined using a Monte Carlo simulation model. The Monte Carlo simulation method is a generally accepted statistical method used to generate a defined number of stock price paths in order to develop a reasonable estimate of the range of future expected stock prices of the Company and its peer group and minimize standard error. The fair value of the Note on the date of issuance was determined to be equal to its principal amount. Interest expense related to this Note is recorded separately from other changes in its fair value within interest expense each period.
The following table represents the difference between the fair value and the unpaid principal balance of the Note as of December 31, 2016:
|
|
Fair value as of December 31, 2016 |
Unpaid principal balance as of December 31, 2016 |
Fair value carrying amount over/(under) unpaid principal |
|||||
|
6.25% Convertible Debt |
$ |
1,315 |
$ |
1,012 |
$ |
303 |
||
NOTE 8: FAIR VALUE MEASUREMENTS AND DERIVATIVE INSTRUMENTS
Our determination of fair value measurements is based on the assumptions that market participants would use in pricing the asset or liability. At December 31, 2016, the Company’s convertible debt (see Note 7) and certain derivative instruments were the only financial instruments measured in the financial statements at fair value on a recurring basis. Nonrecurring fair value measurements were utilized in the determination of the fair value of acquired hotel properties and related assumed debt in 2016 and 2015 (see Note 3), the acquisition accounting performed by the Atlanta JV in 2016 (see Note 5), the accounting for the equity transactions that occurred in March 2016 (see Note 10), and in the valuation of impaired hotels during the years ended December 31, 2016, 2015, and 2014.
Derivative Instruments
Currently, the Company uses derivatives, such as interest rate swaps and caps, to manage its interest rate risk. The fair value of interest rate positions is determined using the standard market methodology of netting the discounted expected future cash receipts and payments. Variable interest rates used in the calculation of projected receipts and payments on the positions are based on an expectation of future interest rates derived from observable market interest rate curves and volatilities. Derivatives expose the Company to credit risk in the event of non-performance by the counterparties under the terms of the agreements. The Company believes it minimizes this credit risk by transacting with major creditworthy financial institutions. These interest rate positions at December 31, 2016 and 2015 are as follows:
72
Condor Hospitality Trust, Inc. and Subsidiaries
Notes To Consolidated Financial Statements
(In thousands, except share and per share data)
|
|
|
|
|
|
|
|
|
|
|
|
|
|
|
|
|
Associated debt |
|
Type |
|
Terms |
|
Effective Date |
|
Maturity Date |
|
Notional amount at December 31, 2016 |
|
Notional amount at December 31, 2015 |
||
|
Huntington |
|
Swap |
|
Swaps 30-day LIBOR + 2.25% for fixed rate of |
|
11/2015 |
|
11/2020 |
|
$ |
7,361 (1) |
|
$ |
9,981 (1) |
|
|
|
|
|
4.13 %; cancellable at Company's option anytime |
|
|
|
|
|
|
|
|
|
|
|
|
|
|
|
after 11/01/2018 without penalty |
|
|
|
|
|
|
|
|
|
|
|
|
|
|
|
|
|
|
|
|
|
|
|
|
|
|
|
Latitude |
|
Cap |
|
Caps 30-day LIBOR at 1.0% |
|
03/2016 |
|
06/2017 |
|
$ |
11,124 (1) |
|
$ |
- |
|
|
|
|
|
|
|
|
|
|
|
|
|
|
|
|
|
Latitude |
|
Cap |
|
Caps 30-day LIBOR at 2.5% |
|
10/2015 |
|
05/2016 |
|
$ |
- |
|
$ |
11,220 (1) |
|
(1) |
Notional amounts amortize consistently with the principal amortization of the associated loans |
Additionally, prior to the execution of the Exchange Agreement (see Note 10) on March 16, 2016 which extinguished the instrument, the Company was required to bifurcate and include on the balance sheet at fair value the embedded conversion option in the 6.25% Series C Cumulative Convertible Preferred Stock (“Series C Preferred Stock”) due to the presence of an antidilution provision that required an adjustment in the common stock conversion ratio should subsequent issuances of the Company’s common stock be issued below the instrument’s original conversion price of $8.00 per share. As a result of a subscription rights offering by the Company which concluded on June 6, 2014 (see Note 9), the conversion price of the Series C Preferred Stock, pursuant to its terms, was adjusted to $1.60, the exercise price of the subscription rights for a share of common stock, where the conversion price remained until the instrument’s extinguishment.
Similarly, prior to the execution of the Exchange Agreement, the terms of the common stock warrants issued to the holders of the Series C Preferred Stock (see Note 10) also included an antidilution provision that required a reduction in the warrant’s exercise price of $9.60 should the conversion ratio of the Series C Preferred Stock be adjusted due to antidilution provisions. Accordingly, the warrants did not qualify for equity classification, and, as a result, the fair value of the derivative was shown as a derivative liability on the balance sheet. As a result of a subscription rights offering by the Company which concluded on June 6, 2014 (see Note 9), the exercise price of the warrants for a share of common stock was adjusted to $1.92, equal to 120% of the adjusted conversion price of the Series C Preferred Stock. With the execution of the Exchange Agreement, this provision of these warrants was effectively eliminated and the conversion price was locked permanently at $1.92. Following this modification of terms, the warrants qualify for equity classification and were reclassified to additional paid-in capital at their fair value of $611 on the date of the modification.
The fair value of the derivative liabilities recognized in connection with the Series C Preferred Stock was determined using the Monte Carlo simulation method.
All derivatives recognized by the Company are reported as derivative liabilities on the balance sheet and are adjusted to their fair value at each reporting date. All gains and losses on derivative instruments are included in net gain (loss) on derivatives and convertible debt and with the exception of realized gains and losses related to the interest rate instruments, which are included in interest expense on the statements of operations. Net gains (losses) of $6,680, $11,578, and ($14,430) were recognized related to derivative instruments for the years ended December, 2016, 2015, and 2014, respectively.
73
Condor Hospitality Trust, Inc. and Subsidiaries
Notes To Consolidated Financial Statements
(In thousands, except share and per share data)
Recurring Fair Value Measurements
The following tables provide the fair value of the Company’s financial liabilities carried at fair value and measured on a recurring basis:
There were no transfers between levels during the years ended December 31, 2016, 2015, or 2014.
|
|
Fair value at |
|||||||||||
|
|
December 31, 2016 |
Level 1 |
Level 2 |
Level 3 |
||||||||
|
Interest rate derivative |
$ |
8 |
$ |
- |
$ |
8 |
$ |
- |
||||
|
Convertible debt |
1,315 |
- |
- |
1,315 | ||||||||
|
|
$ |
1,323 |
$ |
- |
$ |
8 |
$ |
1,315 | ||||
|
|
Fair value at |
|||||||||||
|
|
December 31, 2015 |
Level 1 |
Level 2 |
Level 3 |
||||||||
|
Series C preferred embedded derivative |
$ |
6,271 |
$ |
- |
$ |
- |
$ |
6,271 | ||||
|
Warrant derivative |
2,411 |
- |
- |
2,411 | ||||||||
|
Interest rate derivatives |
77 |
- |
77 |
- |
||||||||
|
|
$ |
8,759 |
$ |
- |
$ |
77 |
$ |
8,682 | ||||
The following table presents a reconciliation of the beginning and ending balances of items measured at fair value on a recurring basis that use significant unobservable inputs (Level 3) and the related gains and losses recorded in the statement of operations during the periods:
|
|
|
|
|
|
|
|
|
|
|
|
|
|
|
|
|
|
|
|
|
|
|
|
|
|
Year ended December 31, |
|||||||||||||||||||
|
|
|
|
2016 |
|
2015 |
||||||||||||||||
|
|
|
Series C Preferred embedded derivative |
|
RES warrant derivative |
|
Convertible debt |
|
Total |
|
Series C Preferred embedded derivative |
|
RES warrant derivative |
|
Total |
|||||||
|
Fair value, beginning of period |
|
$ |
6,271 |
|
$ |
2,411 |
|
$ |
- |
|
$ |
8,682 |
|
$ |
13,804 |
|
$ |
6,533 |
|
$ |
20,337 |
|
Net (gains) losses recognized in earnings |
|
|
(4,848) |
|
|
(1,800) |
|
|
303 |
|
|
(6,345) |
|
|
(7,533) |
|
|
(4,122) |
|
|
(11,655) |
|
Purchase and issuances |
|
|
- |
|
|
- |
|
|
1,012 |
|
|
1,012 |
|
|
- |
|
|
- |
|
|
- |
|
Sales and settlements |
|
|
(1,423) |
|
|
- |
|
|
- |
|
|
(1,423) |
|
|
- |
|
|
- |
|
|
- |
|
Gross transfers into Level 3 |
|
|
- |
|
|
- |
|
|
- |
|
|
- |
|
|
- |
|
|
- |
|
|
- |
|
Gross transfers out of Level 3 (1) |
|
|
- |
|
|
(611) |
|
|
- |
|
|
(611) |
|
|
- |
|
|
- |
|
|
- |
|
Fair value, end of period |
|
$ |
- |
|
$ |
- |
|
$ |
1,315 |
|
$ |
1,315 |
|
$ |
6,271 |
|
$ |
2,411 |
|
$ |
8,682 |
|
|
|
|
|
|
|
|
|
|
|
|
|
|
|
|
|
|
|
|
|
|
|
|
Total unrealized (gains) losses during the period included in earnings related to instruments held at end of period |
|
$ |
- |
|
$ |
- |
|
$ |
303 |
|
$ |
303 |
|
$ |
(7,533) |
|
$ |
(4,122) |
|
$ |
(11,655) |
|
(1) |
RES warrants were permanently reclassified to additional paid-in capital as discussed above |
Fair Value of Debt
The Company estimates the fair value of its fixed rate debt by discounting the future cash flows of each instrument at estimated market rates or credit spreads consistent with the maturity of debt obligations with similar credit policies. Credit spreads take into consideration general market conditions and maturity. The inputs utilized in estimating the fair value of debt are classified in Level 2 of the fair value hierarchy. The carrying value, net of deferred financing costs, and estimated fair value of the Company’s debt, excluding convertible debt, which is presented in the balance sheet at fair value, is presented in the table below:
74
Condor Hospitality Trust, Inc. and Subsidiaries
Notes To Consolidated Financial Statements
(In thousands, except share and per share data)
|
|
||||||||||||
|
|
Carrying value at December 31, |
Estimated fair value at December 31, |
||||||||||
|
|
2016 |
2015 |
2016 |
2015 |
||||||||
|
|
||||||||||||
|
Held for use |
$ |
56,775 |
$ |
44,667 |
$ |
57,456 |
$ |
45,771 | ||||
|
Held for sale |
5,945 | 41,344 | 6,433 | 43,508 | ||||||||
|
Total |
$ |
62,720 |
$ |
86,011 |
$ |
63,889 |
$ |
89,279 | ||||
Impaired Hotel Properties
In the performance of impairment analysis for both held for sale and held for use properties, fair value is determined with the assistance of independent real estate brokers and through the use of revenue multiples based on the Company’s experience with hotel sales as well as available industry information. For held for sale properties, estimated selling costs are based on our experience with similar asset sales. These are considered Level 3 inputs. All impairment in the table below related to held for use properties relates to impairments taken when those properties were previously held for sale or upon their reclassification to held for use. The amount of impairment and recovery of previously recorded impairment recognized in the years ended December 31, 2016, 2015, and 2014 is shown in the table below:
|
|
|
|
|
|
|
|
|
|
|
|
|
|
|
|
|
|
|
|
Year ended December 31, |
|||||||||||||
|
|
|
2016 |
|
2015 |
|
2014 |
|||||||||
|
|
|
Number of hotels |
|
Impairment (loss) recovery |
|
Number of hotels |
|
Impairment (loss) recovery |
|
Number of hotels |
|
Impairment (loss) recovery |
|||
|
Continuing Operations: |
|
|
|
|
|
|
|
|
|
|
|
|
|
|
|
|
Held for sale hotels: |
|
|
|
|
|
|
|
|
|
|
|
|
|
|
|
|
Impairment loss |
|
4 |
|
$ |
(1,273) |
|
- |
|
$ |
- |
|
- |
|
$ |
- |
|
Sold hotels: |
|
|
|
|
|
|
|
|
|
|
|
|
|
|
|
|
Impairment loss |
|
1 |
|
|
(204) |
|
6 |
|
|
(3,914) |
|
2 |
|
|
(1,388) |
|
Recovery of impairment |
|
- |
|
|
- |
|
1 |
|
|
85 |
|
1 |
|
|
119 |
|
Net impairment loss reported in continuing operations |
|
5 |
|
$ |
(1,477) |
|
7 |
|
$ |
(3,829) |
|
3 |
|
$ |
(1,269) |
|
|
|
|
|
|
|
|
|
|
|
|
|
|
|
|
|
|
Discontinued Operations: |
|
|
|
|
|
|
|
|
|
|
|
|
|
|
|
|
Sold hotels: |
|
|
|
|
|
|
|
|
|
|
|
|
|
|
|
|
Impairment loss |
|
- |
|
$ |
- |
|
1 |
|
$ |
(117) |
|
8 |
|
$ |
(2,450) |
|
Recovery of impairment |
|
- |
|
|
- |
|
3 |
|
|
238 |
|
5 |
|
|
798 |
|
Net impairment loss reported in discontinued operations |
|
- |
|
$ |
- |
|
4 |
|
$ |
121 |
|
13 |
|
$ |
(1,652) |
|
|
|
|
|
|
|
|
|
|
|
|
|
|
|
|
|
|
Total net impairment: |
|
5 |
|
$ |
(1,477) |
|
11 |
|
$ |
(3,708) |
|
16 |
|
$ |
(2,921) |
|
|
|
|
|
|
|
|
|
|
|
|
|
|
|
|
|
75
Condor Hospitality Trust, Inc. and Subsidiaries
Notes To Consolidated Financial Statements
(In thousands, except share and per share data)
NOTE 9. COMMON STOCK
The Company’s common stock is duly authorized, full paid, and non-assessable.
On March 11, 2015, an executive officer exercised a warrant to purchase 227,894 shares at the price of $1.52 per share (see Note 12).
The Company concluded a subscription rights offering on June 6, 2014. Each subscription right entitled its holder to purchase one share of common stock of the Company for $1.60 per share. Subscription rights to purchase 1,787,204 shares of common stock were exercised for $2,860, of which $2,000 was paid by the conversion of a loan owed by the Company to RES (see Note 6). The Company incurred issuance costs of $218.
NOTE 10. PREFERRED STOCK
On March 16, 2016, the Company entered into a series of agreements providing for:
|
· |
the issuance and sale of Condor’s Series D Preferred Stock under a private transaction to SREP III Flight-Investco, L.P. (“SREP”), an affiliate of StepStone Group LP; |
|
· |
the exchange of all of Condor’s outstanding Series C Preferred Stock for Series D Preferred Stock; and |
|
· |
the cash redemption of all of Condor’s outstanding 8% Series A Cumulative Preferred Stock (“Series A Preferred Stock”) and 10% Series B Cumulative Preferred Stock (“Series B Preferred Stock”). |
In connection with these transactions, the Company and SREP entered into a Stock Purchase Agreement (the “Stock Purchase Agreement”) dated March 16, 2016 pursuant to which Condor issued and sold 3,000,000 shares of Series D Preferred Stock to SREP on the March 16, 2016 for an aggregate purchase price of $30,000. The Stock Purchase Agreement required that $20,147 of the purchase price be deposited into an escrow account for the purpose of effecting the redemption of the Series A and Series B Preferred Stock and that the remaining amount of the purchase price be delivered to Condor.
Simultaneously, the Company entered into the Exchange Agreement with RES pursuant to which all 3,000,000 outstanding shares of Series C Preferred Stock were exchanged for 3,000,000 shares of Series D Preferred Stock. Under the Exchange Agreement, in lieu of payment of accrued and unpaid dividends in the amount of $4,947 on the Series C Preferred Stock, Condor (a) paid to RES an amount of cash equal to $1,484, (b) issued to RES 245,156 shares of Series D Preferred Stock (such that RES, IRSA Inversiones y Representaciones Sociedad Anónima (“IRSA”), and their affiliates do not beneficially own in excess of 49% of the voting stock of Condor) and (c) issued to RES a convertible promissory note, bearing interest at 6.25% per annum, in the principal amount of $1,012 (see Note 7).
Pursuant to the Stock Purchase Agreement, on April 15, 2016, Condor redeemed all of the outstanding Series A and Series B Preferred Stock, in accordance with redemption notices issued on March 16, 2016, as follows:
|
· |
all 803,270 outstanding shares of the Series A Preferred Stock at the redemption price of $10.00 per share plus $2.084940 per share in accrued and unpaid dividends (plus compounded interest) through the redemption date for a total redemption price of $9,707; and |
|
· |
all 332,500 outstanding shares of the Series B Preferred Stock at the redemption price of $25.00 per share plus $6.354167 per share in accrued and unpaid dividends through the redemption date for a total redemption price of $10,425. |
The effect of these transactions on the Company’s preferred stock and the key terms of the remaining series of the Company’s preferred stock are discussed individually below.
76
Condor Hospitality Trust, Inc. and Subsidiaries
Notes To Consolidated Financial Statements
(In thousands, except share and per share data)
Series A Preferred Stock
On December 30, 2005, the Company offered and sold 1,521,258 shares of Series A Preferred Stock. At December 31, 2015, 803,270 shares of Series A Preferred Stock remained outstanding until the completion of the redemption on April 15, 2016.
Dividends on the Series A Preferred Stock were cumulative and payable monthly in arrears on the last day of each month, at the annual rate of 8% of the $10.00 liquidation preference per share, equivalent to a fixed annual amount of $.80 per share. The Company was able to redeem the Series A Preferred Stock, in whole or in part, at any time or from time to time for cash at a redemption price of $10.00 per share, plus all accrued and unpaid dividends. Commencing with dividends due on December 31, 2013, the Company suspended payment of dividends on its Series A Preferred Stock to preserve capital and improve liquidity. Unpaid dividends accumulated and bore additional dividends at 8%, compounded monthly. Accumulated but unpaid dividends were $1,452, or $1.807 per share, as of December 31, 2015. These dividends were not reflected as an obligation on the balance sheet.
Holders of the Series A Preferred Stock generally had no voting rights. However, if dividends on the Series A Preferred Stock were in arrears for six consecutive months or nine months (whether or not consecutive) in any twelve-month period, holders of the Series A Preferred Stock, voting together as a single class with all series of preferred stock for which like voting rights are exercisable, were entitled to elect two directors. At the Company’s annual meeting on June 10, 2015, holders of the Series A Preferred Stock and Series B Preferred Stock, voting as one class, elected two directors. With the issuance of the redemption notices on March 16, 2016 and the redemption funds deposited in escrow, all rights of the holders of the Series A Preferred Stock were terminated with the exception of the right to receive the redemption price, including the right to board representation.
The difference between the recorded value of the Series A Preferred Stock prior to the issuance of the redemption notice and the redemption value of the Series A Preferred Stock plus related expenses, a total of $2,326, was recorded as a reduction of accumulated deficit during the year ended December 31, 2016 as the amount is considered a deemed dividend on the Series A Preferred Stock. Of this amount, $874 was recorded as a reduction of net earnings attributable to common shareholders as the portion of this deemed dividends that was in excess of preferred dividends deducted to arrive at net earnings attributable to common shareholders in previous periods.
Series B Preferred Stock
At December 31, 2015, there were 332,500 shares of Series B Preferred Stock outstanding, originally sold on June 3, 2008, which remained outstanding until the completion of the redemption on April 15, 2016.
Dividends on the Series B Preferred Stock were cumulative and are payable quarterly in arrears on each March 31, June 30, September 30, and December 31, or, if not a business day, the next succeeding business day, at the annual rate of 10.0% of the $25.00 liquidation preference per share, equivalent to a fixed annual amount of $2.50 per share. The Company was able to redeem the Series B Preferred Stock, in whole or in part, at any time or from time to time for cash at a redemption price of $25.00 per share, plus all accrued and unpaid dividends. Also, upon a change of control, each outstanding share of the Company’s Series B Preferred Stock would be redeemed for cash at a redemption price of $25.00 per share, plus all accrued and unpaid dividends. Commencing with dividends due on December 31, 2013, the Company suspended payment of dividends on its Series B Preferred Stock to preserve capital and improve liquidity. Unpaid dividends on the Series B Preferred Stock did not bear interest. Unpaid dividends were $1,870 or $5.625 per share, as of December 31, 2015. These dividends were not reflected as an obligation on the balance sheet.
Holders of the Series B Preferred stock generally had no voting rights. However, if the dividends on the Series B Preferred Stock were in arrears for six or more quarterly periods (whether or not consecutive), holders of the Series B Preferred Stock, voting together as a single class with all series of preferred stock for which like voting rights are exercisable, would be entitled to elect two directors. At the Company’s annual meeting on June 10, 2015, holders of
77
Condor Hospitality Trust, Inc. and Subsidiaries
Notes To Consolidated Financial Statements
(In thousands, except share and per share data)
Series A Preferred Stock and Series B Preferred Stock, voting as one class, elected two directors. With the issuance of the redemption notices on March 16, 2016 and the redemption funds deposited in escrow, all rights of the holders of the Series B Preferred Stock were terminated with the exception of the right to receive the redemption price, including the right to board representation.
The difference between the recorded value of the Series B Preferred Stock prior to the issuance of the redemption notice and the redemption value of the Series B Preferred Stock, a total $2,781, was recorded as a reduction of accumulated deficit during the year ended December 31, 2016 as the amount is considered a deemed dividend on the Series B Preferred Stock. Of this amount, $911 was recorded as a reduction of net earnings attributable to common shareholders as the portion of this deemed dividend that was in excess of preferred dividends deducted to arrive at net earnings attributable to common shareholders in previous periods.
Series C Preferred Stock and RES Warrants
The Company entered into a Purchase Agreement dated November 16, 2011 for the issuance and sale of Series C Preferred Stock and warrants under a private transaction with RES. In two closings on February 1, 2012 and February 15, 2012, the Company completed the sale to RES of 3,000,000 shares of Series C Preferred Stock and 3,750,000 warrants to purchase shares of common stock. All of the Series C Preferred Stock remained outstanding prior to the execution of the Exchange Agreement on March 16, 2016. The 3,750,000 warrants remained outstanding at December 31, 2016 with a current exercise price of $1.92 per share (see Note 8) and an expiration date of January 31, 2017. As discussed further in Subsequent Events (see Note 17), these warrants were exchanged for newly issued warrants in January 2017.
Each of the 3,000,000 shares of Series C Preferred Stock was convertible, in whole or in part, at RES’s option, at any time, but subject to RES’s beneficial ownership limitation, into the number of shares of common stock equal to the $10.00 per share liquidation preference, divided by the conversion price then in effect, which is equal to the rate of 6.25 shares of common stock for each share of Series C Preferred Stock. As a result of the subscription rights offering concluded on June 6, 2014 (see Note 9), the conversion price was adjusted downward from $8.00 to $1.60, equal to the public offering price of our common stock in the subscription rights offering, where the conversion price remained until the instrument’s extinguishment. A holder of Series C Preferred Stock would not have conversion rights to the extent the conversion would cause the holder and its affiliates to beneficially own more than 34% of voting stock (the “Beneficial Ownership Limitation”). “Voting stock” means capital stock having the power to vote generally for the election of directors of the Company. A holder of warrants would similarly not have exercise rights to the extent the exercise of a warrant would cause the holder and its affiliates to own capital stock in an amount exceeding the Beneficial Ownership Limitation.
Each share of Series C Preferred Stock was entitled to a dividend of $0.625 per year payable in equal quarterly dividends. Commencing with dividends due on December 31, 2013, the Company suspended payment of dividends on its Series C Preferred Stock to preserve capital and improve liquidity. Unpaid dividends accumulated and bore additional dividends at 6.25%, compounded quarterly. Accumulated but unpaid dividends were $4,492, or $1.497 per share, as of December 31, 2015. These dividends are not reflected as an obligation on the balance sheet.
The Series C Preferred Stock voted with the common stock as one class, subject to certain voting limitations. For any vote, the voting power of the Series C Preferred Stock was equal to the lesser of: (a) 0.78625 vote per share or (b) an amount of votes per share such that the vote of all shares of Series C Preferred Stock in the aggregate equal 34% of the combined voting power of all the Company voting stock, minus an amount equal to the number of votes represented by the other shares of voting stock beneficially owned by RES and its affiliates.
On March 16, 2016, the Series C Preferred Stock was extinguished under the Exchange Agreement discussed above. Upon this extinguishment, the difference between the recorded value of the Series C Preferred Stock prior to the exchange and the fair value of the consideration received in the exchange, a total of $20,366, was recorded as a reduction of accumulated deficit as the amount is considered a deemed dividend on the Series C Preferred Stock. Of
78
Condor Hospitality Trust, Inc. and Subsidiaries
Notes To Consolidated Financial Statements
(In thousands, except share and per share data)
this amount, $15,874 was recorded as a reduction of net earnings attributable to common shareholders as the portion of this deemed dividend that was in excess of preferred dividends deducted to arrive at net earnings attributable to common shareholders in previous periods.
Series D Preferred Stock
Following the execution of the Stock Purchase Agreement and Exchange Agreement on March 16, 2016, there were 6,245,156 shares of Series D Preferred Stock outstanding.
The Series D Preferred stockholders rank senior to the Company’s common stock and any other preferred stock issuances and receive preferential cumulative cash dividends at a rate of 6.25% per annum, payable quarterly in arrears on each March 31, June 30, September 30, and December 31, or, if not a business day, the next succeeding business day, of the $10.00 face value per share. Dividends on the Series D Preferred Stock accrue whether or not the Company has earnings, whether or not there are funds legally available for the payment of such dividends, whether or not such dividends are declared, and whether or not such dividends are prohibited by agreement. Whenever the dividends on the Series D Preferred Stock are in arrears for four consecutive quarters, then upon notice by holders of in the aggregate not less than 40% of the outstanding Series D Preferred Stock, the Company will (a) take all appropriate action reasonably within its means to maximize the assets legally available for paying such dividends and to monetize such assets (for example, but without limiting the generality of the foregoing, by selling or liquidating all of some of the Company’s assets or by selling the Company as a going concern), (b) pay out of all such assets legally available (including any proceeds from any sale or liquidation of such assets) the maximum possible amount of such unpaid dividends, and (c) thereafter, at any time and from time to time when additional assets of the Company (including any proceeds from any sale or liquidation of such assets) become legally available to pay such unpaid dividends, pay such remaining unpaid dividends until all dividends accumulated on the Series D Preferred Stock have been fully paid. Dividends on the Series D Preferred Stock were paid on June 30, 2016, September 30, 2016, and January 3, 2017 which included all amounts due through those dates.
Each share of Series D Preferred Stock is convertible, at the option of the holder, at any time into a number of shares of common stock determined by dividing the conversion price of $1.60 into an amount equal to the $10.00 face value per share plus accrued and unpaid dividends, if any. The conversion price is subject to anti-dilution adjustments upon the occurrence of stock splits and stock dividends. Each outstanding share of Series D Preferred Stock will be converted into a number of shares of common stock determined by dividing the conversion price of $1.60 into the $10.00 face value per share, which is equal to a rate of 6.25 shares of common stock for each share of Series D Preferred Stock, automatically upon closing of a Qualified Offering (defined as a single offering of common stock of at least $50,000 or up to three offerings in the aggregate of at least $75,000, all with certain minimum prices per share and a potential make whole payment required in certain scenarios) without any further action by the holders of such shares or the Company.
The Series D Preferred Stock is redeemable by the Company at any time subject to certain restrictions, in whole or in a partial redemption of up to $30,000, at $12.00 per share on or before March 16, 2019, $13.00 per share from March 16, 2019 to March 16, 2020, and $14.00 per share on or after March 16, 2020, plus all accrued and unpaid dividends. If a Qualified Offering has not occurred on or before September 30, 2021, holders that hold in the aggregate not less than 40% of the outstanding shares of the Series D Preferred Stock have the right to elect to have the Company fully liquidate in a commercially reasonable manner as determined by the Board of Directors of the Company to provide for liquidation distributions to the holders of the Series D Preferred Stock in an amount per share equal to $14.00 in cash plus accrued and unpaid dividends. Once this right has been exercised and the Company has been notified, the dividend rate on the Series D Preferred Stock after September 30, 2021 will increase from 6.25% per annum to 12.5% per annum. The holders of Series D Preferred Stock vote their Series D Preferred Stock as a single class with the holders of the common stock on all matters submitted to such holders for vote or consent. For each such vote or consent, each share of Series D Preferred Stock entitles the holder to cast one vote for each whole vote (rounded to the nearest whole number) that such holder would be entitled to cast had such holder
79
Condor Hospitality Trust, Inc. and Subsidiaries
Notes To Consolidated Financial Statements
(In thousands, except share and per share data)
converted its Series D Preferred Stock into shares of common stock as of the date immediately prior to the record date for determining the shareholders of the Company eligible to vote on any such matter.
The fair value of the Series D Preferred Stock was determined to be equal to its face value on the date of issuance.
As discussed further as a subsequent event (see Note 17), on February 28, 2017, the holders of the Series D Preferred Stock voluntarily converted to common stock. At the time of conversion, the Series D holders were granted $9,250 of newly created Series E Preferred Stock.
Impact of Preferred Stock on Net Earnings (Loss) Attributable to Common Shareholders
The components of dividends declared and undeclared and in kind dividends deemed on preferred stock are as follows:
|
|
|
|
|
|
|
|
|
|
|
|
|
|
Year ended December 31, |
|||||||
|
|
|
2016 |
|
2015 |
|
2014 |
|||
|
Preferred A dividends accrued at stated rate |
|
$ |
222 |
|
$ |
727 |
|
$ |
671 |
|
Preferred A additional deemed dividends upon redemption |
|
|
652 |
|
|
- |
|
|
- |
|
Preferred B dividends accrued at stated rate |
|
|
243 |
|
|
831 |
|
|
831 |
|
Preferred B additional deemed dividends upon redemption |
|
|
668 |
|
|
- |
|
|
- |
|
Preferred C dividends accrued at stated rate |
|
|
455 |
|
|
2,074 |
|
|
1,950 |
|
Preferred C additional deemed dividends at exchange |
|
|
15,418 |
|
|
- |
|
|
- |
|
Preferred D dividends accrued at stated rate |
|
|
3,090 |
|
|
- |
|
|
- |
|
Dividends declared and undeclared and in kind dividends deemed on preferred stock |
|
$ |
20,748 |
|
$ |
3,632 |
|
$ |
3,452 |
NOTE 11. NONCONTROLLING INTEREST OF COMMON UNITS IN CHLP
At December 31, 2016 and 2015, 7,872,943 and 7,659,039 of CHLP’s common units were outstanding, respectively. These amounts include 2,609,791 and 2,395,887 common units held by limited partners at December 31, 2016 and 2015, respectively, and 5,263,152 LTIP units outstanding at December 31, 2016 and 2015 which were not yet earned at those dates (see Note 12). The combined redemption value for the common units and LTIP units was $2,008 and $1,197 at December 31, 2016 and 2015, respectively.
Our ownership interest in CHLP as of December 31, 2016, 2015, and 2014 was 97.8%, 90.1%, and 99.9%, respectively, which includes consideration of the common units of the limited partners as well as the LTIP units. The Company’s increased ownership interest in CHLP during 2016 was primarily the result of the contribution to CHLP of the proceeds from the Series D Preferred Stock issuance during the first quarter of 2016 which was partially offset by the proceeds used to redeem the Series A and B Preferred Stock, which were withdrawn from CHLP, in the second quarter of 2016 (see Note 10). The Company’s decreased ownership in CHLP during 2015 was a result of two events. On March 2, 2015, the Company granted an equity award of 5,263,152 LTIP units to an executive officer representing profit interests in the Company’s operating partnership (see Note 12). On October 1 and 2, 2015, as partial consideration for the purchase of hotels (see Note 3), 2,298,879 common units in CHLP were issued.
Each limited partner of CHLP may, subject to certain limitations, require that CHLP redeem all or a portion of his or her common units at any time after a specified period following the date the units were acquired, by delivering a redemption notice to CHLP. When a limited partner tenders common units for redemption, the Company can, at its sole discretion, choose to purchase the units for either (1) a number of shares of Company common stock at a rate of one share of common stock for each eight common units redeemed or (2) cash in an amount equal to the market
80
Condor Hospitality Trust, Inc. and Subsidiaries
Notes To Consolidated Financial Statements
(In thousands, except share and per share data)
value of the number of shares of Company common stock the limited partner would have received if the Company chose to purchase the units for common stock. No common units were redeemed in 2016, 2015, or 2014.
NOTE 12. STOCK-BASED COMPENSATION
The Company previously had a 2006 Stock Plan which had been approved by the Company’s shareholders. The 2006 Stock Plan authorized the grant of stock options, stock appreciation rights, restricted stock, and stock bonuses for up to 62,500 shares of common stock. The 2006 Stock Plan expired on December 31, 2015.
As a replacement for the 2006 Stock Plan, the Board of Directors adopted the Condor 2016 Stock Plan, which was approved by the Company’s shareholders at the annual shareholders meeting on June 15, 2016. The 2016 Stock Plan authorizes the issuance of stock options, stock appreciation rights, restricted stock, restricted stock units, performance shares, deferred stock units, and other forms of stock-based compensation. The maximum number of shares of the Company’s common stock that may be issued under the 2016 Stock Plan is 3,000,000, provided, however, that awards under this plan may not exceed 250,000 shares of common stock prior to the conversion into common stock of all shares of Series D Preferred Stock (see Note 10).
Options and Unvested Share Awards
At December 31, 2016, the Company had a total of 5,625 vested stock options outstanding with a weighted average exercise price of $7.53 per share and no unvested stock options or unvested share awards outstanding.
Warrants
On March 2, 2015, the Company granted a warrant to an executive officer of the Company outside of the 2006 Stock Plan as an inducement material to the executive’s acceptance of employment. The warrant entitles the executive to purchase a total of 657,894 authorized but previously unissued shares of the Company’s common stock with a grant date price at (i) $1.52 per share (the adjusted closing bid price of the common stock on Nasdaq on March 2, 2015) if at least one-third but not more than one-half of the shares were purchased on or prior to March 17, 2015, and (ii) $1.92 per share for shares purchased after. The warrant has a three-year term. The executive officer exercised the warrant in part to purchase 227,894 shares on March 11, 2015 at the price of $1.52 per share. The warrant remains exercisable for 430,000 shares at an exercise price of $1.92 per share. As of December 31, 2016, the total unrecognized compensation cost related to the warrants was approximately $115, which is expected to be recognized over the next 14 months.
The Company records compensation expense for warrants based on the estimated fair value of the warrants on the date of grant determined using the Black-Scholes option-pricing model. The Company uses historical data among other factors to estimate expected price volatility, expected warrant life, dividend rate, and expected forfeiture rate. The risk-free rate is based on the U.S. Treasury yield in effect at the time of grant for the estimated life of the warrants. The following table summarizes the estimates used in the Black-Scholes option-pricing model related to the warrants granted in 2015:
|
|
$1.52 Grant |
$1.92 Grant |
|||
|
|
March 2, 2015 |
March 2, 2015 |
|||
|
Volatility |
53.10 |
% |
78.60 |
% |
|
|
Expected forfeitures |
0.00 |
% |
0.00 |
% |
|
|
Expected term |
15 |
days |
3.00 |
years |
|
|
Risk free interest rate |
0.02 |
% |
1.06 |
% |
|
LTIP Awards
81
Condor Hospitality Trust, Inc. and Subsidiaries
Notes To Consolidated Financial Statements
(In thousands, except share and per share data)
On March 2, 2015, the Company granted an equity award of 5,263,152 LTIP units, representing profit interests in CHLP, to an executive officer of the company. The LTIP units are earned in one-third increments upon the Company’s common stock achieving price per share milestones of $3.50, $4.50, and $5.50 respectively. Earned LTIP units vest in March 2018, or earlier upon a change in control of the Company, and can be redeemed at the rate of one share of common stock for each eight earned LTIP units for up to 657,894 common shares. As of December 31, 2016, the total unrecognized compensation cost related to the LTIP units was $199, which is expected to be recognized over the next 14 months.
The Company records compensation expense for the LTIP units based on the estimated fair value of the units on the date of grant determined using the Monte Carlo simulation model. The Company uses historical data among other factors to estimate expected price volatility, expected LTIP life, volume weighted average price, and expected forfeiture rate. The risk-free rate is based on the U.S. Treasury yield in effect at the time of grant for the estimated life of the LTIP. The following table summarizes the estimates used in the Monte Carlo option-pricing model related to the LTIP grant in 2015:
|
|
Grant Date March 2, 2015 |
||
|
Volatility |
75.5 |
% |
|
|
Expected forfeitures |
0.00 |
% |
|
|
Weighted average price |
$ |
1.53 | |
|
Expected term |
3.00 |
years |
|
|
Risk free interest rate |
1.06 |
% |
|
Investment Committee Share Compensation
Independent directors serving as members of the Investment Committee of the Board of Directors receive their monthly Investment Committee fees in the form of shares of the Company’s common stock issued under the available stock plan, priced as the average of the closing price of the stock for the first 20 trading days of the calendar year. The shares issued to the independent directors of the Investment Committee for the year ended December 31, 2016 under the 2016 Stock Plan totaled 15,349. The shares issued for the years ended December 31, 2015 and 2014 under the 2006 Stock Plan totaled 21,422 and 9,711, respectively.
Stock-Based Compensation Expense
The expense recognized in the financial statements for stock-based compensation, including the LTIP, related to employees and directors for the years ended December 31, 2016, 2015, and 2014 was $305, $285, and $34, respectively, all of which is included in general and administrative expense.
NOTE 13. INCOME TAXES
The Company has recognized no current or deferred income tax expense or benefit from continuing operations or related to discontinued operations for the years ended December 31, 2016, 2015, and 2014 with the exception of Alternative Minimum Tax (“AMT”) recognized at both the REIT and the TRS during the year ended December 31, 2016. Income tax expense related to AMT totaled $35 for the REIT and $90 for the TRS and was the result of the application of limits on the use of net operating loss carryovers to offset AMT income.
82
Condor Hospitality Trust, Inc. and Subsidiaries
Notes To Consolidated Financial Statements
(In thousands, except share and per share data)
Actual income tax expense of the TRS for the years ended December 31, 2016, 2015, and 2014 differs from the “expected” income tax expense (benefit) (computed by applying the appropriate U.S. federal income tax rate of 34% to earnings before income taxes) as a result of the following:
|
|
Year ended December 31, |
||||||||
|
|
2016 |
2015 |
2014 |
||||||
|
Computed "expected" income tax (benefit) expense |
$ |
993 |
$ |
684 |
$ |
(118) | |||
|
State income taxes, net of federal income tax (benefit) expense |
139 | 82 | (14) | ||||||
|
(Decrease) increase in valuation allowance |
(1,082) | (722) | 132 | ||||||
|
Other |
(50) | (44) |
- |
||||||
|
Alternative minimum tax |
90 |
- |
- |
||||||
|
Total income tax expense |
$ |
90 |
$ |
- |
$ |
- |
|||
The tax effects of temporary differences that give rise to significant portions of deferred tax assets and deferred tax liabilities at December 31, 2016 and 2015 are as follows:
|
|
|
|
|
|
|
|
|
|
|
As of December 31, |
||||
|
|
|
2016 |
|
2015 |
||
|
Deferred Tax Assets |
|
|
|
|
|
|
|
Expenses accrued for consolidated financial statement purposes, nondeductible for tax return purposes |
|
$ |
99 |
|
$ |
113 |
|
Net operating losses carried forward for federal income tax purposes |
|
|
1,477 |
|
|
6,902 |
|
Book depreciation in excess of tax depreciation |
|
|
38 |
|
|
- |
|
Subtotal deferred tax assets |
|
|
1,614 |
|
|
7,015 |
|
Valuation allowance |
|
|
(1,551) |
|
|
(6,923) |
|
Total deferred tax assets |
|
|
63 |
|
|
92 |
|
|
|
|
|
|
|
|
|
Deferred Liabilities |
|
|
|
|
|
|
|
Tax depreciation in excess of book depreciation |
|
|
- |
|
|
92 |
|
JV basis difference |
|
|
63 |
|
|
- |
|
Total deferred tax liabilities |
|
|
63 |
|
|
92 |
|
Net deferred tax assets |
|
$ |
- |
|
$ |
- |
In assessing the realizability of deferred tax assets, the Company considers whether it is more likely than not that some portion or all of the deferred tax assets will not be realized. The Company considers projected reversals of deferred income tax liabilities, projected future taxable income, and tax planning strategies in making this assessment. Management uses historical experience and short and long-range business forecasts to develop such estimates. Further, we employ various prudent and feasible tax planning strategies to facilitate the recoverability of future deductions. A cumulative loss in recent years is a significant piece of evidence with respect to realizability that outweighs the other evidence, and the TRS incurred net losses in 2014 and had taxable income in 2016 and 2015 primarily due to taxable income generated from property sales during the year. As a result of this analysis, the Company believes that a full valuation allowance against the net deferred tax asset position is necessary at December 31, 2016 and 2015. The valuation of deferred tax assets requires judgment in assessing the likely future tax consequences of events that have been recognized in our financial statements or tax returns and future profitability. Our accounting for deferred taxes represents our best estimate of those future events. Changes in our current estimates, due to unanticipated events or otherwise, could have a material impact on our financial condition and results of operations.
After consideration of limitations related to a change in control as defined under Internal Revenue Code Section 382 following the Company’s 2012 transactions with RES (see Note 10), the TRS’s net operating loss carryforward at
83
Condor Hospitality Trust, Inc. and Subsidiaries
Notes To Consolidated Financial Statements
(In thousands, except share and per share data)
December 31, 2016 as determined for federal income tax purposes was $3,810. The availability of the loss carryforwards will expire in 2022 through 2035.
As of December 31, 2016, the tax years that remain subject to examination by major tax jurisdictions generally include 2013 through 2016.
Distributions to the extent of our current and accumulated earnings and profits for federal income tax purposes generally will be taxable to a shareholder as ordinary income. Distributions in excess of current and accumulated earnings and profits generally will be treated as a nontaxable reduction of the shareholder’s basis in such shareholder’s shares, to the extent thereof, and thereafter as taxable capital gain. Distributions that are treated as a reduction of the shareholder’s basis in its shares will have the effect of increasing the amount of gain, or reducing the amount of loss, recognized upon the sale of the shareholder’s shares.
For income tax purposes, distributions paid per share in 2016 were characterized as follows:
|
|
|
|
|
|
|
|
For the year ended December 31, 2016 |
|||
|
|
Amount |
|
% |
|
|
Common Shares: |
|
|
|
|
|
Ordinary income |
$ |
0.070000 |
|
100% |
|
Capital gain |
|
- |
|
- |
|
Return of capital |
|
- |
|
- |
|
Total |
$ |
0.070000 |
|
100% |
|
|
|
|
|
|
|
Series C Preferred Stock: |
|
|
|
|
|
Ordinary income |
$ |
1.649124 |
|
100% |
|
Capital gain |
|
- |
|
- |
|
Return of capital |
|
- |
|
- |
|
Total |
$ |
1.649124 |
|
100% |
|
|
|
|
|
|
|
Series D Preferred Stock: |
|
|
|
|
|
Ordinary income |
$ |
0.494792 |
|
100% |
|
Capital gain |
|
- |
|
- |
|
Return of capital |
|
- |
|
- |
|
Total |
$ |
0.494792 |
|
100% |
The common and preferred share distributions declared on December 6, 2016 and paid on January 5, 2017 and January 3, 2017, respectively, were treated as 2016 distributions for tax purposes.
A portion of the redemption price of the Series A and B Preferred Stock that was redeemed for cash on April 15, 2016 included amounts equal to the accrued and unpaid dividends on such stock. However, the entire redemption price, inclusive of amounts equal to accrued and unpaid dividends, was treated as payment in exchange for the redeemed stock and none of the redemption price is treated as a distribution of dividends under the Code for federal income tax purposes.
No dividends on common stock or preferred stock were paid in or declared related to 2015 or 2014.
NOTE 14. EARNINGS PER SHARE
Basic earnings per share (“EPS”) is computed by dividing net earnings (loss) attributable to common shareholders by the weighted average number of common shares outstanding. Diluted EPS is computed after adjusting the numerator and denominator of the basic EPS computation for the effects of any dilutive potential common shares
84
Condor Hospitality Trust, Inc. and Subsidiaries
Notes To Consolidated Financial Statements
(In thousands, except share and per share data)
outstanding during the period. These effects include adjustments to the numerator for any change in fair value included in net earnings (loss) attributed to the certain derivative liabilities (related to the Series C Preferred Stock and warrants) during the period the convertible securities are dilutive. The computation of basic and diluted EPS is presented below:
|
|
|
|
|
|
|
|
|
|
|
|
|
|
|
|
|
|
|
|
|
|
|
|
|
Year ended December 31, |
|||||||
|
|
|
2016 |
|
2015 |
|
2014 |
|||
|
Numerator: Basic (1) |
|
|
|
|
|
|
|
|
|
|
Net earnings (loss) attributable to common shareholders |
|
|
|
|
|
|
|
|
|
|
Continuing operations - Basic |
|
$ |
1,390 |
|
$ |
6,055 |
|
$ |
(22,581) |
|
Discontinued operations - Basic |
|
|
657 |
|
|
3,438 |
|
|
2,893 |
|
Total Basic |
|
$ |
2,047 |
|
$ |
9,493 |
|
$ |
(19,688) |
|
|
|
|
|
|
|
|
|
|
|
|
Numerator: Diluted (1) |
|
|
|
|
|
|
|
|
|
|
Net earnings (loss) attributable to common shareholders from continuing operations |
|
$ |
1,390 |
|
$ |
6,055 |
|
$ |
(22,581) |
|
Dividends on Series C Preferred Stock |
|
|
- |
|
|
2,074 |
|
|
- |
|
Dividends on Series D Preferred Stock |
|
|
3,090 |
|
|
- |
|
|
- |
|
Unrealized gain on warrant derivative |
|
|
- |
|
|
(4,122) |
|
|
- |
|
Unrealized gain on Series C Preferred Embedded Derivative |
|
|
- |
|
|
(7,533) |
|
|
- |
|
Continuing operations - Diluted |
|
|
4,480 |
|
|
(3,526) |
|
|
(22,581) |
|
Discontinued operations - Diluted |
|
|
657 |
|
|
3,438 |
|
|
2,893 |
|
Total Diluted |
|
$ |
5,137 |
|
$ |
(88) |
|
$ |
(19,688) |
|
|
|
|
|
|
|
|
|
|
|
|
Denominator |
|
|
|
|
|
|
|
|
|
|
Weighted average number of common shares - Basic |
|
|
4,947,234 |
|
|
4,885,625 |
|
|
3,897,092 |
|
Unvested stock |
|
|
- |
|
|
4,025 |
|
|
- |
|
Series C Preferred Stock |
|
|
- |
|
|
18,750,000 |
|
|
- |
|
Series D Preferred Stock |
|
|
31,033,818 |
|
|
- |
|
|
- |
|
Warrants - Employees |
|
|
- |
|
|
691 |
|
|
- |
|
Warrants - RES |
|
|
- |
|
|
(399,778) |
|
|
- |
|
Weighted average number of common shares - Diluted |
|
|
35,981,052 |
|
|
23,240,563 |
|
|
3,897,092 |
|
|
|
|
|
|
|
|
|
|
|
|
Earnings Per Share |
|
|
|
|
|
|
|
|
|
|
Continuing operations - Basic |
|
$ |
0.28 |
|
$ |
1.24 |
|
$ |
(5.79) |
|
Discontinued operations - Basic |
|
|
0.13 |
|
|
0.70 |
|
|
0.74 |
|
Total - Basic Earnings Per Share |
|
$ |
0.41 |
|
$ |
1.94 |
|
$ |
(5.05) |
|
|
|
|
|
|
|
|
|
|
|
|
Continuing operations - Diluted |
|
$ |
0.12 |
|
$ |
(0.15) |
|
$ |
(5.79) |
|
Discontinued operations - Diluted |
|
|
0.02 |
|
|
0.15 |
|
|
0.74 |
|
Total - Diluted Earnings Per Share |
|
$ |
0.14 |
|
$ |
- |
|
$ |
(5.05) |
|
|
|
|
|
|
|
|
|
|
|
(1) The loss (earnings) attributable to noncontrolling interest is allocated between continuing and discontinued operations for the purpose of the EPS calculation
85
Condor Hospitality Trust, Inc. and Subsidiaries
Notes To Consolidated Financial Statements
(In thousands, except share and per share data)
Potentially dilutive common shares, if any, have been excluded from the denominator if they are antidilutive to net earnings (loss) attributable to common shareholders. The following table summarizes the weighted average number of potentially dilutive securities that have been excluded from the denominator for the purpose of computing diluted EPS:
|
|
Year ended December 31, |
|||||
|
|
2016 |
2015 |
2014 |
|||
|
Outstanding stock options |
5,625 | 5,625 | 8,750 | |||
|
Unvested stock awards outstanding |
- |
- |
1,541 | |||
|
Warrants - RES |
3,750,000 |
- |
3,750,000 | |||
|
Warrants - Employees |
430,000 | 359,121 |
- |
|||
|
Series C preferred Stock |
3,893,443 |
- |
18,750,000 | |||
|
LTIP common units (1) |
657,894 | 549,747 |
- |
|||
|
Convertible debt |
502,690 |
- |
551,370 | |||
|
CHLP common units (1) |
300,728 | 84,556 | 12,126 | |||
|
Total potentially dilutive securities excluded from the denominator |
9,540,380 | 999,049 | 23,073,787 | |||
|
(1) |
LTIP and common units of CHLP have been omitted from the denominator for the purpose of computing diluted EPS since the effect of including these amounts in the numerator and denominator would have no impact on calculated EPS |
NOTE 15. COMMITMENTS AND CONTINGENCIES
Management Agreements
Our TRS engages eligible independent contractors as property managers for each of our hotels in accordance with the requirements for qualification as a REIT. The hotel management agreements provide that the management companies have control of all operational aspects of the hotels, including employee-related matters. The management companies must generally maintain each hotel under their management in good repair and condition and perform routine maintenance, repairs, and minor alterations. Additionally, the management companies must operate the hotels in accordance with the national franchise agreements that cover the hotels, which includes, as applicable, using franchisor sales and reservation systems and abiding by franchisors’ marketing standards. The management agreements generally require the TRS to fund debt service, working capital needs, and capital expenditures and to fund the management companies’ third-party operating expenses, except those expenses not related to the operation of hotels. The TRS also is responsible for obtaining and maintaining certain insurance policies with respect to the hotels.
Each of the management companies employed by the TRS at December 31, 2016 receive a base monthly management fee of 3.0% to 3.5% of gross hotel revenue, with incentives for performance which increase such fee to a maximum of 5.0%. For the years ended December 31, 2016, 2015, and 2014, base management fees incurred totaled $1,619, $2,466, and $3,101, respectively, of which $1,619, $2,348, and $2,521, respectively, was included in continuing operations as hotel and property operations expense. For the years ended December 31, 2016 and 2015, incentive management fees, included in continuing operations in their entirety, totaled $190 and $158, respectively.
The management agreements generally have initial terms of one to three years and renew for additional terms of one year unless either party to the agreement gives the other party written notice of termination at least 90 days before the end of a term. The Company may terminate a management agreement, subject to cure rights, if certain performance metrics tied to both individual hotel and total managed portfolio performance are not met. The Company may also terminate a management agreement with respect to a hotel at any time without reason upon payment of a termination fee. The management agreements terminate with respect to a hotel upon sale of the hotel, subject to certain notice requirements.
86
Condor Hospitality Trust, Inc. and Subsidiaries
Notes To Consolidated Financial Statements
(In thousands, except share and per share data)
Franchise Agreements
As of December 31, 2016, 17 of our 18 wholly owned properties operate under franchise licenses from national hotel companies. Under our franchise agreements, we are required to pay franchise fees generally between 3.3% and 5.5% of room revenue, plus additional fees for marketing, central reservation systems, and other franchisor programs and services that amount to between 2.5% and 6.0% of room revenue. The franchise agreements typically have 10 to 25 year terms although certain agreements may be terminated by either party on certain anniversary dates specified in the agreements. Further, each agreement provides for early termination fees in the event the agreement is terminated before the stated term. Franchise fee expense totaled $3,123, $3,883, and $4,691, for the years ended December 31, 2016, 2015, and 2014, respectively, of which $3,123, $3,853, and $4,051, respectively, was included in continuing operations as hotel and property operations expense. The initial fees incurred to enter into the franchise agreements are capitalized and amortized over the life of the franchise agreements.
Leases
The Company assumed a land lease agreement at the time of purchase related to one hotel owned at December 31, 2016. The lease requires monthly payments of the greater of $2 or 5% of room revenue and is associated with a property held for sale at December 31, 2016. Land lease expense totaled $105, $105, and $102 for the years ended December 31, 2016, 2015, and 2014, respectively, all of which is included in continuing operations as hotel and property operations expense.
The Company entered into three new office lease agreements in 2016, replacing all existing office lease agreements which expired in 2016. These leases expire in 2019 through 2021 and have combined rent expense of approximately $132 annually. Office lease expense totaled $199, $163, and $162 in the years ended December 31, 2016, 2015, and 2014, respectively, and is included in general and administrative expense.
As of December 31, 2016, the future minimum lease payments applicable to non-cancellable operating leases, excluding leases associated with properties held for sale at December 31, 2016, are as follows:
|
|
Lease rents |
||
| 2017 |
$ |
156 |
|
| 2018 |
159 |
||
| 2019 |
138 |
||
| 2020 |
61 |
||
| 2021 |
47 |
||
|
|
$ |
561 |
|
|
|
As of December 31, 2016, the Company had agreements with two restaurants and a cell tower operator for leased space at our hotel locations. Lease income totaled $86, $198, and $309 for the years ended December 31, 2016, 2015, and 2014, respectively, of which $86, $177, and $292, respectively, was included in continuing operations in room rentals and other hotel services revenue.
Obligation to RES
The Company had an obligation to RES to use $25,000 of the proceeds from its capital infusion in 2012 to pursue hotel acquisitions (see Note 10). There were no contractual restrictions or penalties related to the use of these funds for purposes other than acquisitions, but the Company was obligated to replace these funds promptly as it had the ability to do so. Following the completion of the hotel acquisitions in 2015 and 2016 (see Note 3) and the acquisition made through the Atlanta JV in August 2016 (see Note 5), the Company has satisfied this obligation.
87
Condor Hospitality Trust, Inc. and Subsidiaries
Notes To Consolidated Financial Statements
(In thousands, except share and per share data)
Benefit Plans
The Company has a qualified contributory retirement plan under Section 401(k) of the Code (the “401(k) Plan”) which covers all employees who meet certain eligibility requirements. Voluntary contributions may be made to the 401(k) Plan by employees. The 401(k) Plan is a Safe Harbor Plan and requires a mandatory employer contribution. The employer contribution expense for the years ended December 31, 2016, 2015, and 2014 was $73, $66, and $59, respectively, and is included in general and administrative expenses.
Litigation
Various claims and legal proceedings arise in the ordinary course of business and may be pending against the Company and its properties. We are not currently involved in any material litigation, nor, to our knowledge, is any material litigation threatened against us. The Company has insurance to cover potential material losses and we believe it is not reasonably possible that such matters will have a material impact on our financial condition or results of operations.
88
Condor Hospitality Trust, Inc. and Subsidiaries
Notes To Consolidated Financial Statements
(In thousands, except share and per share data)
NOTE 16. QUARTERLY OPERATING RESULTS (UNAUDITED)
|
|
Quarters ended (unaudited) |
||||||||||||||
|
|
March 31, |
June 30, |
September 30, |
December 31, |
Total |
||||||||||
|
|
2016 |
2016 |
2016 |
2016 |
2016 |
||||||||||
|
|
|||||||||||||||
|
Revenue |
$ |
12,503 |
$ |
14,155 |
$ |
13,519 |
$ |
10,470 |
$ |
50,647 | |||||
|
Operating expenses |
12,662 | 12,508 | 12,445 | 11,009 | 48,624 | ||||||||||
|
Operating income (loss) |
(159) | 1,647 | 1,074 | (539) | 2,023 | ||||||||||
|
|
|||||||||||||||
|
Net gain on dispositions of assets |
3,367 | 8,856 | 3,591 | 7,318 | 23,132 | ||||||||||
|
Equity in loss of joint venture |
- |
- |
(54) | (190) | (244) | ||||||||||
|
Net gain on derivatives and convertible debt |
6,117 | 162 | 26 | 72 | 6,377 | ||||||||||
|
Other income (expense) |
(21) | 23 | 85 | (32) | 55 | ||||||||||
|
Interest expense |
(1,329) | (1,248) | (1,127) | (1,006) | (4,710) | ||||||||||
|
Loss on debt extinguishment |
(173) | (976) | (399) | (639) | (2,187) | ||||||||||
|
Impairment loss |
(793) | (121) | (343) | (220) | (1,477) | ||||||||||
|
Earnings from continuing operations before income tax expense |
7,009 | 8,343 | 2,853 | 4,764 | 22,969 | ||||||||||
|
Income tax expense |
- |
- |
- |
(125) | (125) | ||||||||||
|
Earnings (loss) from continuing operations |
7,009 | 8,343 | 2,853 | 4,639 | 22,844 | ||||||||||
|
Gain from discontinued operations, net of tax |
678 |
- |
- |
- |
678 | ||||||||||
|
|
|||||||||||||||
|
Net earnings |
7,687 | 8,343 | 2,853 | 4,639 | 23,522 | ||||||||||
|
Earnings attributable to noncontrolling interest |
(389) | (178) | (61) | (99) | (727) | ||||||||||
|
Earnings attributable to controlling interests |
7,298 | 8,165 | 2,792 | 4,540 | 22,795 | ||||||||||
|
Dividends declared and undeclared and in kind dividends deemed on preferred stock |
(17,740) | (1,057) | (976) | (975) | (20,748) | ||||||||||
|
Net earnings (loss) attributable to common shareholders |
$ |
(10,442) |
$ |
7,108 |
$ |
1,816 |
$ |
3,565 |
$ |
2,047 | |||||
|
|
|||||||||||||||
|
Basic Earnings Per Share (1) |
|||||||||||||||
|
Basic EPS from continuing operations |
$ |
(2.25) |
$ |
1.44 |
$ |
0.37 |
$ |
0.72 |
$ |
0.28 | |||||
|
Basic EPS from discontinued operations |
0.14 |
- |
- |
- |
0.13 | ||||||||||
|
Total EPS Basic |
$ |
(2.11) |
$ |
1.44 |
$ |
0.37 |
$ |
0.72 |
$ |
0.41 | |||||
|
|
|||||||||||||||
|
Diluted Earnings Per Share (1) |
|||||||||||||||
|
Diluted EPS from continuing operations |
$ |
(2.25) |
$ |
0.18 |
$ |
0.06 |
$ |
0.10 |
$ |
0.12 | |||||
|
Diluted EPS from discontinued operations |
0.14 |
- |
- |
- |
0.02 | ||||||||||
|
Total EPS Diluted |
$ |
(2.11) |
$ |
0.18 |
$ |
0.06 |
$ |
0.10 |
$ |
0.14 | |||||
(1) Quarterly and total annual EPS are based on the weighted average number of shares outstanding during each quarter and the annual period. Due to rounding and differences in earnings and losses between the quarterly and annual periods, the sum of the quarterly EPS amounts may not equal the reported amounts for the year.
89
Condor Hospitality Trust, Inc. and Subsidiaries
Notes To Consolidated Financial Statements
(In thousands, except share and per share data)
|
|
Quarters ended (unaudited) |
||||||||||||||
|
|
March 31, |
June 30, |
September 30, |
December 31, |
Total |
||||||||||
|
|
2015 |
2015 |
2015 |
2015 |
2015 |
||||||||||
|
|
|||||||||||||||
|
Revenue |
$ |
12,692 |
$ |
16,733 |
$ |
15,895 |
$ |
13,394 |
$ |
58,714 | |||||
|
Operating expenses |
13,134 | 14,247 | 13,983 | 13,826 | 55,190 | ||||||||||
|
Operating income (loss) |
(442) | 2,486 | 1,912 | (432) | 3,524 | ||||||||||
|
|
|||||||||||||||
|
Net gain (loss) on dispositions of assets |
11 | (137) | 2,927 | 1,997 | 4,798 | ||||||||||
|
Net gain (loss) on derivatives and convertible debt |
4,823 | (4,710) | 7,895 | 3,570 | 11,578 | ||||||||||
|
Other income (expense) |
95 | 31 | (4) | (8) | 114 | ||||||||||
|
Interest expense |
(1,547) | (1,510) | (1,137) | (1,328) | (5,522) | ||||||||||
|
Loss on debt extinguishment |
(7) |
- |
(104) | (102) | (213) | ||||||||||
|
Impairment recovery (loss) |
(777) | (3,053) | 313 | (312) | (3,829) | ||||||||||
|
Earnings (loss) from continuing operations before income tax expense |
2,156 | (6,893) | 11,802 | 3,385 | 10,450 | ||||||||||
|
Income tax expense |
- |
- |
- |
- |
- |
||||||||||
|
Earnings (loss) from continuing operations |
2,156 | (6,893) | 11,802 | 3385 | 10,450 | ||||||||||
|
Gain from discontinued operations, net of tax |
1,294 | 994 | 152 | 1,432 | 3,872 | ||||||||||
|
|
|||||||||||||||
|
Net earnings (loss) |
3,450 | (5,899) | 11,954 | 4,817 | 14,322 | ||||||||||
|
(Earnings) loss attributable to noncontrolling interest |
(281) | 284 | (724) | (476) | (1,197) | ||||||||||
|
Earnings (loss) attributable to controlling interests |
3,169 | (5,615) | 11,230 | 4,341 | 13,125 | ||||||||||
|
Dividends declared and undeclared and in kind dividends deemed on preferred stock |
(891) | (902) | (914) | (925) | (3,632) | ||||||||||
|
Net earnings (loss) attributable to common shareholders |
$ |
2,278 |
$ |
(6,517) |
$ |
10,316 |
$ |
3,416 |
$ |
9,493 | |||||
|
|
|||||||||||||||
|
Basic Earnings Per Share (1) |
|||||||||||||||
|
Basic EPS from continuing operations |
$ |
0.24 |
$ |
(1.52) |
$ |
2.06 |
$ |
0.44 |
$ |
1.24 | |||||
|
Basic EPS from discontinued operations |
0.24 | 0.20 | 0.03 | 0.25 | 0.70 | ||||||||||
|
Total EPS Basic |
$ |
0.48 |
$ |
(1.32) |
$ |
2.09 |
$ |
0.69 |
$ |
1.94 | |||||
|
|
|||||||||||||||
|
Diluted Earnings Per Share (1) |
|||||||||||||||
|
Diluted EPS from continuing operations |
$ |
(0.14) |
$ |
(1.52) |
$ |
0.12 |
$ |
(0.04) |
$ |
(0.15) | |||||
|
Diluted EPS from discontinued operations |
0.05 | 0.20 | 0.01 | 0.05 | 0.15 | ||||||||||
|
Total EPS Diluted |
$ |
(0.09) |
$ |
(1.32) |
$ |
0.13 |
$ |
0.01 |
$ |
- |
|||||
(1) Quarterly and total annual EPS are based on the weighted average number of shares outstanding during each quarter and the annual period. Due to rounding and differences in earnings and losses between the quarterly and annual periods, the sum of the quarterly EPS amounts may not equal the reported amounts for the year.
90
Condor Hospitality Trust, Inc. and Subsidiaries
Notes To Consolidated Financial Statements
(In thousands, except share and per share data)
NOTE 17. SUBSEQUENT EVENTS
Subsequent Property Activity
On January 23, 2017 the Company executed an agreement to purchase a portfolio of four Home2 Suites hotels for $73,750. The portfolio includes the Home2 Suites Memphis / Southaven, the Home2 Suites Austin / Round Rock, the Home2 Suites Lexington University / Medical Center (Kentucky), and the Home2 Suites Tallahassee State Capitol. The closing of these acquisitions is anticipated to occur in the first quarter of 2017, but is subject to customary closing conditions including accuracy of representations and warrants and compliance with covenants and obligations.
Subsequent Debt Transactions
On January 27, 2017, the Company extended the maturity date on the WAB loan with a principal balance of $4,806 on December 31, 2016 from February 1, 2017 to February 1, 2018. This loan was subsequently repaid in full with the refinancing discussed below.
On March 1, 2017, a significant portion of the Company’s debt (including all debt outstanding at December 31, 2016 with the exception of the two variable rate WAB loans and the two fixed rate Great Western Bank loans) was refinanced with a secured credit facility that matures on March 1, 2019. Following this refinancing, contractual debt maturities on debt outstanding at December 31, 2016 were as follows:
|
|
Held for sale |
Held for use |
Total |
||||||
| 2017 |
$ |
- |
$ |
916 |
$ |
916 | |||
| 2018 |
- |
930 | 930 | ||||||
| 2019 | 6,000 | 27,691 | 33,691 | ||||||
| 2020 |
- |
14,180 | 14,180 | ||||||
| 2021 |
- |
13,672 | 13,672 | ||||||
|
Total |
$ |
6,000 |
$ |
57,389 |
$ |
63,389 | |||
The credit agreement provides for a $90,000 senior secured credit facility and includes an accordion feature that would allow the facility to be increased to $400,000 with additional lender commitments. Availability under the facility is based on a borrowing base formula for the pool of hotel properties securing the facility. As of the closing date, the collateral pool consisted of 14 hotel properties. As of the closing date, four hotels were excluded from the borrowing base until certain conditions are satisfied and the availability under the facility was $34,250. Those four hotels are expected to be added to the borrowing base within days after the closing and the availability under the facility is expected to increase to $41,050. The facility is guaranteed by the Company and its material subsidiaries that do not have stand-alone financing. Prior to the occurrence of specific capital achievements, borrowings under the facility accrue interest, at the Company’s option, at either LIBOR plus 3.95% or a base rate plus 2.95%. Thereafter, borrowings bear interest based on a leverage-based pricing grid, at the Company’s option, at either LIBOR plus a spread ranging from 2.25% to 3.00% (depending on leverage) or a base rate plus a spread ranging from 1.25% to 2.00% (depending on leverage). The facility matures in two years and has an automatic one-year extension upon the completion of specific capital achievements. The facility has two additional one-year extension options following additional capital achievements. The facility contains customary representations and warranties, covenants and events of default.
On March 1, 2017, the Company borrowed $34,250 under the facility to repay existing indebtedness and pay reserves costs related to closing of the facility. The Company anticipates using borrowings under the facility to acquire three out of the four Home2 Suites hotels currently under contract to be acquired, which will be added to the collateral pool for the facility. Borrowings under the facility can also be used for future acquisitions and general corporate purposes.
91
Condor Hospitality Trust, Inc. and Subsidiaries
Notes To Consolidated Financial Statements
(In thousands, except share and per share data)
Subsequent Equity Transactions
On January 24, 2017, the Company exchanged 150,540 new warrants (the “New Warrants”) to purchase common stock of the Company for 3,750,000 warrants (the “Old Warrants”, see Note 10) held by RES. The number of New Warrants issued in exchange for the Old Warrants equals the number of shares of common stock issuable upon exercise of the Old Warrants pursuant to a cashless exercise provisions of the Old Warrants. The New Warrants are exercisable for 150,540 shares of common stock, have an exercise price of $.001 for each common share and expire on January 24, 2019.
On February 28, 2017, the holders of the Series D Preferred Stock voluntarily converted their shares into 39,032,225 shares of common stock at $1.60 per share pursuant to the terms of the preferred stock. The terms of the Series D Preferred Stock provided for automatic conversion following certain future common stock offerings, and also provided for potential additional payments to the holders depending on the sales price of common stock in the offerings. As a result of the voluntary conversion, the holders are no longer entitled to the potential payments. To induce the holders of the Series D Preferred Stock to voluntarily convert their shares, the Company issued the holders $9,250 of a new series of preferred stock, the Series E Preferred Stock.
The Series E Preferred Stock ranks senior to the Company’s common stock and any other preferred stock issuances and receives preferential cumulative cash dividends at a rate of 6.25% per annum, payable quarterly of the $10.00 face value per share. If the Company fails to pay a dividend then during the period that dividends are not paid, the dividend rate increases to 12.5%, if specific equity offering or offerings have not occurred, and increases 9.50% per annum if such equity or equity offerings have occurred. Dividends on the Series E Preferred Stock accrue whether or not the Company has earnings, whether or not there are funds legally available for the payment of such dividends, whether or not such dividends are declared, and whether or not such dividends are prohibited by agreement. Subject to certain shareholder approvals, required under Nasdaq Marketplace Rules, which Condor will seek and expects to obtain at the next annual shareholders meeting, each share of Series E Preferred Stock is convertible, at the option of the holder, at any time on or after February 28, 2019, into a number of shares of common stock determined by dividing the conversion price of $2.13 into an amount equal to the $10.00 face value per share plus accrued and unpaid dividends, if any. Upon liquidation, each share of Series E Preferred Stock is entitled to $10.00 per share, accrued and unpaid dividends, and an additional amount based on liquidation preference that the holders may have foregone by converting their Series D Preferred Stock into common stock, as adjusted for stock appreciation and dividends paid on the common stock. The conversion price is subject to anti-dilution adjustments upon the occurrence of stock splits and stock dividends. Following a specific equity offering or offerings, from time to time a number of shares of Series E Preferred Stock automatically converts into common stock if the common stock trades at 120% of the conversion price for 60 trading days, and the number of shares converted will be determined by certain trading volumes measures. The Company has rights, following a specific equity offering or offerings, to redeem up to 490,250 shares of the Series E Preferred Stock at prices from 110% to 130% of its liquidation value, and the holders have put rights commencing March 16, 2021 to put the Series E Preferred Stock to the Company at 130% of its liquidation preference, which the Company can satisfy with cash or common stock. The Series E Preferred Stock votes as a class on matters generally affecting the Series E Preferred Stock, and as long as 434,750 shares of Series E Preferred Stock (47% of the originally issued shares of Series E Preferred Stock) remain outstanding, then 75% approval of the Series E Preferred Stock will be required to approve merger, consolidation, liquidation or winding up of Condor, related party transactions exceeding $120, payment of dividends on common stock except from funds from operations or to maintain REIT status, the grant of exemptions from Condor’s charter limitation on ownership of 9.9% of any class or series of its securities (exclusive of persons currently holding exemptions), issuance of preferred stock or commitment or agreement to do any of the foregoing.
92
Condor Hospitality Trust, Inc. and Subsidiaries
Schedule III Real Estate and Accumulated Depreciation
As of December 31, 2016
(In thousands)
|
|
|
|
|
|
|
|
|
|
|
|
|
|
|
|
|
|
|
|
|
|
|
|
|
|
|
|
|
|
|
|
|
|
|
|
|
|
|
|
|
|
|
|
|
|
|
|
|
|
|
|
|
|
|
|
|
|
|
Additions, (dispositions), |
|
|
|
|
|
|
|
|
|
|
|
|
|
|
|
|||||||
|
|
|
|
|
|
|
|
|
|
|
|
|
|
|
|
|
|
(impairments) |
|
|
|
|
|
|
|
|
|
|
|
|
|
|
|
|||||||
|
|
|
|
|
|
|
|
|
Initial cost |
|
Subsequent to acquisition |
|
Gross amount at December 31, 2016 |
|
|
|
||||||||||||||||||||||||
|
Brand |
|
Location |
|
Acquisition date |
|
Encumbrance |
|
Land |
|
Buildings & improvements |
|
Furniture & equipment |
|
Land |
|
Buildings & improvements |
|
Furniture & equipment |
|
Land |
|
Buildings & improvements |
|
Furniture & equipment |
|
Accumulated depreciation |
|
Net book value |
|||||||||||
|
Super 8 |
|
Creston, Iowa |
|
09/19/1978 |
|
GWBR |
|
$ |
56 |
|
$ |
765 |
|
$ |
76 |
|
$ |
90 |
|
$ |
1,574 |
|
$ |
892 |
|
$ |
146 |
|
$ |
2,339 |
|
$ |
968 |
|
$ |
(2,213) |
|
$ |
1,240 |
|
Quality Inn |
|
Solomons, Maryland |
|
06/01/1986 |
|
WAB |
|
|
2,304 |
|
|
2,719 |
|
|
269 |
|
|
- |
|
|
1,514 |
|
|
436 |
|
|
2,304 |
|
|
4,233 |
|
|
705 |
|
|
(3,220) |
|
|
4,022 |
|
Comfort Inn |
|
New Castle, Pennsylvania |
|
07/01/1987 |
|
MS |
|
|
57 |
|
|
3,732 |
|
|
369 |
|
|
(1) |
|
|
344 |
|
|
426 |
|
|
56 |
|
|
4,076 |
|
|
795 |
|
|
(2,550) |
|
|
2,377 |
|
Key West Inn |
|
Key Largo, Florida |
|
08/01/1987 |
|
MS |
|
|
339 |
|
|
2,947 |
|
|
292 |
|
|
- |
|
|
1,186 |
|
|
342 |
|
|
339 |
|
|
4,133 |
|
|
634 |
|
|
(2,553) |
|
|
2,553 |
|
Comfort Inn |
|
Harlan, Kentucky |
|
07/01/1993 |
|
WAB |
|
|
- |
|
|
2,684 |
|
|
265 |
|
|
- |
|
|
(1,265) |
|
|
512 |
|
|
- |
|
|
1,419 |
|
|
777 |
|
|
(532) |
|
|
1,664 |
|
Quality Inn |
|
Morgantown, West Virginia |
|
10/01/1996 |
|
MS |
|
|
398 |
|
|
3,749 |
|
|
347 |
|
|
- |
|
|
633 |
|
|
704 |
|
|
398 |
|
|
4,382 |
|
|
1,051 |
|
|
(2,732) |
|
|
3,099 |
|
Comfort Suites |
|
Ft. Wayne, Indiana |
|
11/07/2005 |
|
HUNT |
|
|
1,200 |
|
|
3,964 |
|
|
840 |
|
|
- |
|
|
1,037 |
|
|
591 |
|
|
1,200 |
|
|
5,001 |
|
|
1,431 |
|
|
(2,555) |
|
|
5,077 |
|
Comfort Suites |
|
Lafayette, Indiana |
|
11/07/2005 |
|
HUNT |
|
|
850 |
|
|
3,054 |
|
|
420 |
|
|
- |
|
|
375 |
|
|
301 |
|
|
850 |
|
|
3,429 |
|
|
721 |
|
|
(1,561) |
|
|
3,439 |
|
Comfort Inn & Suites |
|
Warsaw, Indiana |
|
11/07/2005 |
|
HUNT |
|
|
650 |
|
|
2,121 |
|
|
380 |
|
|
- |
|
|
380 |
|
|
438 |
|
|
650 |
|
|
2,501 |
|
|
818 |
|
|
(1,330) |
|
|
2,639 |
|
Comfort Suites |
|
South Bend, Indiana |
|
11/30/2005 |
|
WAB |
|
|
500 |
|
|
10,602 |
|
|
910 |
|
|
(250) |
|
|
(4,264) |
|
|
1,392 |
|
|
250 |
|
|
6,338 |
|
|
2,302 |
|
|
(1,691) |
|
|
7,199 |
|
Supertel Inn |
|
Creston, Iowa |
|
06/30/2006 |
|
MS |
|
|
235 |
|
|
2,364 |
|
|
344 |
|
|
- |
|
|
(16) |
|
|
65 |
|
|
235 |
|
|
2,348 |
|
|
409 |
|
|
(1,012) |
|
|
1,980 |
|
Super 8 |
|
Billings, Montana |
|
01/05/2007 |
|
WAB |
|
|
518 |
|
|
4,648 |
|
|
159 |
|
|
(27) |
|
|
(12) |
|
|
259 |
|
|
491 |
|
|
4,636 |
|
|
418 |
|
|
(1,507) |
|
|
4,038 |
|
Days Inn |
|
Bossier City, Louisiana |
|
04/04/2007 |
|
GWBR |
|
|
1,025 |
|
|
5,031 |
|
|
87 |
|
|
(768) |
|
|
(3,792) |
|
|
750 |
|
|
257 |
|
|
1,239 |
|
|
837 |
|
|
(813) |
|
|
1,520 |
|
Hilton Garden Inn |
|
Dowell, Maryland |
|
05/25/2012 |
|
CANTOR |
|
|
1,400 |
|
|
9,492 |
|
|
323 |
|
|
- |
|
|
621 |
|
|
348 |
|
|
1,400 |
|
|
10,113 |
|
|
671 |
|
|
(1,644) |
|
|
10,540 |
|
SpringHill Suites |
|
San Antonio, Texas |
|
10/01/2015 |
|
LAT |
|
|
1,597 |
|
|
14,353 |
|
|
1,550 |
|
|
- |
|
|
114 |
|
|
20 |
|
|
1,597 |
|
|
14,467 |
|
|
1,570 |
|
|
(786) |
|
|
16,848 |
|
Courtyard by Marriott |
|
Jacksonville, Florida |
|
10/02/2015 |
|
WABJ |
|
|
2,100 |
|
|
11,050 |
|
|
850 |
|
|
- |
|
|
152 |
|
|
3 |
|
|
2,100 |
|
|
11,202 |
|
|
853 |
|
|
(710) |
|
|
13,445 |
|
Hotel Indigo |
|
Atlanta, Georgia |
|
10/02/2015 |
|
WABA |
|
|
800 |
|
|
8,700 |
|
|
1,500 |
|
|
- |
|
|
86 |
|
|
141 |
|
|
800 |
|
|
8,786 |
|
|
1,641 |
|
|
(729) |
|
|
10,498 |
|
Aloft |
|
Leawood, Kansas |
|
12/14/2016 |
|
GWB |
|
|
3,339 |
|
|
18,046 |
|
|
1,115 |
|
|
- |
|
|
(5) |
|
|
- |
|
|
3,339 |
|
|
18,041 |
|
|
1,115 |
|
|
(57) |
|
|
22,438 |
|
Subtotal Hotel Properties |
|
|
|
|
|
|
|
|
17,368 |
|
|
110,021 |
|
|
10,096 |
|
|
(956) |
|
|
(1,338) |
- |
|
7,620 |
|
|
16,412 |
|
|
108,683 |
|
|
17,716 |
|
|
(28,195) |
|
|
114,616 |
|
Construction in progress |
|
|
|
|
|
|
|
|
- |
|
|
- |
|
|
|
|
|
- |
|
|
82 |
|
|
4 |
|
|
- |
|
|
82 |
|
|
4 |
|
|
- |
|
|
86 |
|
Office building |
|
|
|
|
|
|
|
|
69 |
|
|
1,517 |
|
|
- |
|
|
(69) |
|
|
(1,517) |
|
|
487 |
|
|
- |
|
|
- |
|
|
487 |
|
|
(318) |
|
|
169 |
|
Total |
|
|
|
|
|
|
|
$ |
17,437 |
|
$ |
111,538 |
|
$ |
10,096 |
|
$ |
(1,025) |
|
$ |
(2,773) |
|
$ |
8,111 |
|
$ |
16,412 |
|
$ |
108,765 |
|
$ |
18,207 |
|
$ |
(28,513) |
|
$ |
114,871 |
93
Condor Hospitality Trust, Inc. and Subsidiaries
Notes to Schedule III Real Estate and Accumulated Depreciation
As of December 31, 2016
(In thousands)
Encumbrance codes refer to the following lenders:
|
MS |
Morgan Stanley |
|
WAB |
Western Alliance Bank Fixed Rate Debt |
|
GWBR |
Great Western Bank Revolving Credit Facility |
|
HUNT |
Huntington |
|
LAT |
Latitude |
|
CANTOR |
Cantor |
|
WABA |
Western Alliance Bank Variable Rate Debt - $4.9m |
|
WABJ |
Western Alliance Bank Variable Rate Debt - $9.9m |
|
GWB |
Great Western Bank Fixed Rate Debt |
|
|
|
See Accompanying Report of Independent Registered Public Accounting Firm
94
|
|
||||
|
|
ASSET BASIS |
Total |
||
|
(a) |
Balance at January 1, 2014 |
$ |
248,468 | |
|
|
Additions |
3,058 | ||
|
|
Disposals |
(32,646) | ||
|
|
Impairment loss |
(4,295) | ||
|
|
Balance at December 31, 2014 |
214,585 | ||
|
|
Additions |
46,489 | ||
|
|
Disposals |
(65,802) | ||
|
|
Impairment loss |
(6,373) | ||
|
|
Balance at December 31, 2015 |
188,899 | ||
|
|
Additions |
25,618 | ||
|
|
Disposals |
(68,256) | ||
|
|
Impairment loss |
(2,877) | ||
|
|
Balance at December 31, 2016 |
$ |
143,384 | |
|
|
||||
|
|
ACCUMULATED DEPRECIATION |
Total |
||
|
(b) |
Balance at January 1, 2014 |
$ |
84,112 | |
|
|
Depreciation for the period ended December 31, 2014 |
6,549 | ||
|
|
Depreciation on assets sold or disposed |
(13,884) | ||
|
|
Impairment loss |
(1,374) | ||
|
|
Balance at December 31, 2014 |
75,403 | ||
|
|
Depreciation for the period ended December 31, 2015 |
5,400 | ||
|
|
Depreciation on assets sold or disposed |
(19,938) | ||
|
|
Impairment loss |
(2,665) | ||
|
|
Balance at December 31, 2015 |
58,200 | ||
|
|
Depreciation for the period ended December 31, 2016 |
5,190 | ||
|
|
Depreciation on assets sold or disposed |
(33,477) | ||
|
|
Impairment loss |
(1,400) | ||
|
|
Balance at December 31, 2016 |
$ |
28,513 | |
|
|
||||
|
(c) |
The aggregate cost of land, buildings, furniture and equipment for Federal income tax purposes is approximately $148.4 million (unaudited). |
|
(d) |
Depreciation is computed based upon the following useful lives: |
Buildings and improvements 15 - 40 years
Furniture and equipment 3 - 12 years
|
(e) |
The Company has mortgages payable on the properties as noted. Additional mortgage information can be found in Note 6 to the consolidated financial statements. |
95
ITEM 9. CHANGES IN AND DISAGREEMENTS WITH ACCOUNTANTS ON ACCOUNTING AND FINANCIAL DISCLOSURE
None.
ITEM 9A. CONTROLS AND PROCEDURES
Disclosure Controls and Procedures
An evaluation was performed under the supervision of management, with the participation of our Chief Executive Officer and Chief Financial Officer, of the effectiveness of the design and operation of our disclosure controls and procedures as defined in Rule 13a-15 of the rules promulgated under the Securities and Exchange Act of 1934, as amended. Based on that evaluation, the Chief Executive Officer and Chief Financial Officer have concluded that, as of the end of the period covered by this report, the Company’s disclosure controls and procedures were effective to provide reasonable assurance that information required to be disclosed by the Company in the reports the Company files or submits under the Securities Exchange Act of 1934 was (a) accumulated and communicated to management, including the Company’s Chief Executive Officer and Chief Financial Officer, to allow timely decisions regarding required disclosures and (b) recorded, processed, summarized, and reported within the time periods specified in the Securities and Exchange Commission’s rules and forms.
Other than as discussed below, no changes in the Company’s internal controls over financial reporting occurred during the last fiscal quarter covered by this report that have materially affected, or are reasonably likely to materially affect, the Company’s internal control over financial reporting.
Management’s Annual Report On Internal Control Over Financial Reporting
The Company’s management is responsible for establishing and maintaining adequate internal control over financial reporting as such term is defined in Securities Exchange Act Rule 13a-15(f). The Company carried out an evaluation under the supervision and with the participation of the Company’s management, including the Company’s Chief Executive Officer and Chief Financial Officer, of the effectiveness of the Company’s internal control over financial reporting as of December 31, 2016. The Company’s management used the framework in Internal Control—Integrated Framework (2013) issued by the Committee of Sponsoring Organizations (COSO) to perform this evaluation. Based on that evaluation, the Company’s management concluded that the Company’s internal control over financial reporting was effective as of December 31, 2016.
Because of its inherent limitations, internal control over financial reporting may not prevent or detect misstatements. Also, projections of any evaluation of effectiveness to future periods are subject to the risk that controls may become inadequate because of changes in conditions, or that the degree of compliance with policies or procedures may deteriorate.
This annual report does not include an attestation report of our registered public accounting firm regarding internal control over financial reporting. Internal control over financial reporting was not subject to attestation by our registered public accounting firm pursuant to rules of the Securities and Exchange Commission that permit us to provide only management’s report in this annual report.
Changes in Internal Control Over Financial Reporting
There have been no changes in our internal control over financial reporting that occurred during the last fiscal quarter that have materially affected, or are reasonably likely to materially affect, our internal control over financial reporting.
96
None.
PART III
ITEM 10. DIRECTORS, EXECUTIVE OFFICERS, AND CORPORATE GOVERNANCE
The information required by this item is incorporated by reference to the Company’s definitive Proxy Statement for the 2017 Annual Meeting of Stockholders.
ITEM 11. EXECUTIVE COMPENSATION
The information required by this item is incorporated by reference to the Company’s definitive Proxy Statement for the 2017 Annual Meeting of Stockholders.
ITEM 12. SECURITY OWNERSHIP OF CERTAIN BENEFICIAL OWNERS AND MANAGEMENT AND
RELATED STOCKHOLDER MATTERS
Certain of the information required by this item is incorporated by reference to the Company’s definitive Proxy Statement for the 2017 Annual Meeting of Stockholders.
Equity Compensation Plan Information
The following table provides information about the Company’s common stock that may be issued upon exercise of options, warrants, and rights under existing equity compensation plans as of December 31, 2016:
|
|
|
|
|
|
|
|
|
|
|
|
|
|
Plan category |
|
Number of securities |
|
|
Weighted average |
|
|
Number of securities |
|||
|
Equity compensation plans approved by security holders |
|
|
2,500 |
|
|
$ |
7.84 |
|
|
|
2,984,651 (1) |
|
Equity compensation plans not approved by security holders |
|
|
433,125 |
|
|
|
1.96 |
|
|
|
- |
|
Total |
435,625 |
$ |
2.00 |
- |
|||||||
|
(1) |
Represents shares issuable under the Company’s 2016 Stock Plan. The maximum number of shares of the Company’s common stock that may be issued under the 2016 Stock Plan is 3,000,000, provided, however, that awards under this plan may not exceed 250,000 shares of common stock prior to the conversion into common stock of all shares of Series D Preferred Stock. |
ITEM 13. CERTAIN RELATIONSHIPS AND RELATED TRANSACTIONS, AND DIRECTOR INDEPENDENCE
97
The information required by this item is incorporated by reference to the Company’s definitive Proxy Statement for the 2017 Annual Meeting of Stockholders.
ITEM 14. PRINCIPAL ACCOUNTANT FEES AND SERVICES
The information required by this item is incorporated by reference to the Company’s definitive Proxy Statement for the 2017 Annual Meeting of Stockholders.
PART IV
ITEM 15. EXHIBITS AND FINANCIAL STATEMENT SCHEDULES
Financial Statements and Financial Statement Schedules
The following financial statements and financial statement schedule are included in this report on the pages listed below:
All other schedules for which provision is made in Regulation S-X are either not required to be included herein pursuant to the related instructions are inapplicable, or the related information is included in the footnotes to the applicable financial statement, and, therefore, have been omitted from this Item 15.
Exhibits
3.1*Amended and Restated Articles of Incorporation of the Company, as amended.
3.2 Bylaws of the Company (incorporated herein by reference to Exhibit 3.2 to the Company’s Current Report on Form 8-K (Commission file number 001-34087) dated November 19, 2014).
10.1 Third Amended and Restated Agreement of Limited Partnership of Condor Hospitality Limited Partnership, as amended (incorporated herein by reference to Exhibit 10.1 to the Company’s Quarterly Report on Form 10-Q (Commission file number 001-34087) for the quarter ended September 30, 2016).
10.2 Amended and Restated Limited Liability Company Agreement of Spring Street Hotel Property II LLC dated as of August 22, 2016 (incorporated herein by reference to Exhibit 10.1 to the Company’s Current Report on Form 8-K (Commission file number 001-34087) dated August 22, 2016).
10.3Limited Liability Company Agreement of Spring Street Hotel OpCo II LLC dated as of August 22, 2016 (incorporated herein by reference to Exhibit 10.2 to the Company’s Current Report on Form 8-K (Commission file number 001-34087) dated August 22, 2016).
98
10.4 Hotel Management Agreement dated June 29, 2016 by and between TRS Leasing, Inc., TRS Subsidiary, LLC and Kinseth Hotel Corporation (incorporated herein by reference to Exhibit 10.1 to the Company’s Current Report on Form 8-K (Commission file number 001-34087) dated June 29, 2016).
10.5 Hotel Management Agreement dated June 29, 2016 by and between TRS Leasing, Inc., TRS Subsidiary, LLC and Strand Development Company, LLC (incorporated herein by reference to Exhibit 10.5 to the Company’s Current Report on Form 8-K (Commission file number 001-34087) dated June 29, 2016).
10.6 Hotel Management Agreement dated June 29, 2016 by and between TRS Leasing, Inc., TRS Subsidiary, LLC, SPPR TRS Subsidiary, LLC, BMI Alexandria TRS Subsidiary, LLC and Hospitality Management Advisors, Inc. (incorporated herein by reference to Exhibit 10.3 to the Company’s Current Report on Form 8-K (Commission file number 001-34087) dated June 29, 2016).
10.7 Hotel Management Agreement dated June 29, 2016 by and between SPPR-Dowell TRS Subsidiary, LLC and Cherry Cove Hospitality Management, LLC (incorporated herein by reference to Exhibit 10.4 to the Company’s Current Report on Form 8-K (Commission file number 001-34087) dated June 29, 2016).
10.8 Hotel Management Agreement dated October 1, 2015 between TRS San Spring, LLC and Peachtree Hospitality Management, LLC (incorporated herein by reference to Exhibit 10.4 to the Company’s Current Report on Form 8-K (Commission file number 001-34087) dated October 1, 2015).
10.9 Hotel Management Agreement dated October 1, 2015 between TRS Atl Indy, LLC and Peachtree Hospitality Management, LLC (incorporated herein by reference to Exhibit 10.5 to the Company’s Current Report on Form 8-K (Commission file number 001-34087) dated October 1, 2015).
10.10 Hotel Management Agreement dated October 1, 2015 between TRS Jax Court, LLC and Peachtree Hospitality Management, LLC (incorporated herein by reference to Exhibit 10.6 to the Company’s Current Report on Form 8-K (Commission file number 001-34087) dated October 1, 2015).
10.11Hotel Management Agreement, dated June 29, 2016, by and between TRS Leasing, Inc., TRS Subsidiary, LLC and K Partners Hospitality Group LP (incorporated herein by reference to Exhibit 10.2 to the Company’s Current Report on Form 8-K (Commission file number 001-34087) dated June 29, 2016).
10.12Agreement between Spring Street Hotel OpCo LLC and Boast Hotel Management Company LLC dated effective August 19, 2016 (incorporated herein by reference to Exhibit 10.3 to the Company’s Current Report on Form 8-K (Commission file number 001-34087) dated August 22, 2016).
10.13Hotel Management Agreement dated as of December 14, 2016 between TRS KCI Loft, LLC and Presidian Destinations, Ltd. (incorporated herein by reference to Exhibit 10.2 to the Company’s Current Report on Form 8-K (Commission file number 001-34087) dated December 14, 2016).
10.14 Amended and Restated Loan Agreement dated December 3, 2008 by and between the Company and Great Western Bank (incorporated herein by reference to Exhibit 10.9 to the Company’s Annual Report on Form 10-K (Commission file number 001-34087) for the year ended December 31, 2013).
10.15 First Amendment to Amended and Restated Loan Agreement dated February 4, 2009 between the Company and Great Western Bank (incorporated herein by reference to Exhibit 10.1 to the Company’s Quarterly Report on Form 10-Q (Commission file number 001-34087) for the quarter ended March 31, 2009).
10.16 Second Amendment to Amended and Restated Loan Agreement dated March 29, 2010 by and between the Company and Great Western Bank (incorporated herein by reference to Exhibit 10.1 to the Company’s
99
Quarterly Report on Form 10-Q (Commission file number 001-34087) for the quarter ended March 31, 2010).
10.17 Third Amendment to Amended and Restated Loan Agreement dated March 15, 2011 by and between the Company and Great Western Bank (incorporated herein by reference to Exhibit 10.1 to the Company’s Quarterly Report on Form 10-Q (Commission file number 001-34087) for the quarter ended March 31, 2011).
10.18 Fourth Amendment to Amended and Restated Loan Agreement dated December 9, 2011 by and between the Company and Great Western Bank (incorporated herein by reference to Exhibit 10.1 to the Company’s Current Report on Form 8-K (Commission file number 001-34087) dated December 9, 2011).
10.19Fifth Amendment to Amended and Restated Loan Agreement dated February 21, 2012 by and between the Company and Great Western Bank (incorporated herein by reference to Exhibit 10.1 to the Company’s Current Report on Form 8-K (Commission file number 001-34087) dated February 21, 2012).
10.20 Sixth Amendment to Amended and Restated Loan Agreement dated effective as of December 31, 2012 by and between the Company and Great Western Bank (incorporated herein by reference to Exhibit 10.1 to the Company’s Current Report on Form 8-K (Commission file number 001-34087) dated January 17, 2013).
10.21Seventh Amendment to Amended and Restated Loan Agreement dated March 26, 2013 by and between the Company and Great Western Bank (incorporated herein by reference to Exhibit 10.1 to the Company’s Current Report on Form 8-K (Commission file number 001-34087) dated March 26, 2013).
10.22 Eighth Amendment to Amended and Restated Loan Agreement dated July 31, 2013 by and between the Company and Great Western Bank (incorporated herein by reference to Exhibit 10.5 to the Company’s Quarterly Report on Form 10-Q (Commission file number 001-34087) for the quarter ended September 30, 2013).
10.23 Ninth Amendment to Amended and Restated Loan Agreement dated June 30, 2014 by and between the Company and Great Western Bank (incorporated herein by reference to Exhibit 10.1 to the Company’s Current Report on Form 8-K (Commission file number 001-34087) dated June 30, 2014).
10.24 Tenth Amendment and Written Consent to Amended and Restated Loan Agreement dated August 1, 2014 by and between the Company and Great Western Bank (incorporated herein by reference to Exhibit 10.1 to the Company’s Current Report on Form 8-K (Commission file number 001-34087) dated August 1, 2014).
10.25 Eleventh Amendment to Amended and Restated Loan Agreement dated August 1, 2014 by and between the Company and Great Western Bank (incorporated herein by reference to Exhibit 10.2 to the Company’s Current Report on Form 8-K (Commission file number 001-34087) dated August 1, 2014).
10.26 Twelfth Amendment to Amended and Restated Loan Agreement dated November 20, 2014 by and between the Company and Great Western Bank (incorporated herein by reference to Exhibit 10.1 to the Company’s Current Report on Form 8-K (Commission file number 001-34087) dated November 20, 2014).
10.27 Thirteenth Amendment to Amended and Restated Loan Agreement dated June 5, 2015 by and between the Company and Great Western Bank (incorporated herein by reference to Exhibit 10.1 to the Company’s Current Report on Form 8-K (Commission file number 001-34087) dated June 5, 2015).
10.28 Promissory Note, Loan Agreement and form of Mortgage, Assignment of Rents and Leases, Security Agreement and Fixture Filing dated January 5, 2007 by Condor Hospitality Limited Partnership to and for the benefit of Western Alliance Bank (incorporated herein by reference to Exhibit 10.19 to the Company’s
100
Annual Report on Form 10-K (Commission file number 001-34087) for the year ended December 31, 2012).
10.29 Amendment No. 1 to the Promissory Note dated January 5, 2007 by Condor Hospitality Limited Partnership to and for the benefit of Western Alliance Bank (incorporated herein by reference to Exhibit 10.22 to the Company’s Annual Report on Form 10-K (Commission file number 001-34087) for the year ended December 31, 2013).
10.30 Global Amendment and Consent dated March 16, 2009 between Condor Hospitality Limited Partnership, SPPR-South Bend, LLC and Western Alliance Bank (incorporated herein by reference to Exhibit 10.2 to the Company’s Quarterly Report on Form 10-Q (Commission file number 001-34087) for the quarter ended March 31, 2009).
10.31 Unconditional Guaranties of Payment and Performance dated March 16, 2009, by the Company and Condor Hospitality REIT Trust to and for the benefit of Western Alliance Bank (incorporated herein by reference to Exhibit 10.3 to the Company’s Quarterly Report on Form 10-Q (Commission file number 001-34087) for the quarter ended March 31, 2009).
10.32 Loan Modification Agreements dated as of September 30, 2009 by and between Western Alliance Bank, the Company, Condor Hospitality Limited Partnership, Condor Hospitality REIT Trust and SPPR-South Bend, LLC, (incorporated herein by reference to Exhibits 10.1 and 10.2 to the Company’s Quarterly Report on Form 10-Q (Commission file number 001-34087) for the quarter ended September 30, 2009).
10.33 Covenant Waiver dated as of November 9, 2009 by Western Alliance Bank to the Company, Condor Hospitality Limited Partnership, Condor Hospitality REIT Trust and SPPR-South Bend, LLC, (incorporated herein by reference to Exhibit 10.24 to the Company’s Annual Report on Form 10-K (Commission file number 001-34087) for the year ended December 31, 2009).
10.34 Loan Modification Agreement dated as of March 25, 2010 by and between Western Alliance Bank, Condor Hospitality Limited Partnership, SPPR-South Bend, LLC, Condor Hospitality REIT Trust and the Company (incorporated herein by reference to Exhibit 10.2 to the Company’s Quarterly Report on Form 10-Q (Commission file number 001-34087) for the quarter ended March 31, 2010).
10.35 Loan Modification Agreement dated as of March 29, 2012 by and between Condor Hospitality Limited Partnership, SPPR-South Bend, LLC, the Company and Condor Hospitality REIT Trust and Western Alliance Bank (incorporated herein by reference to Exhibit 10.1 to the Company’s Current Report on Form 8-K (Commission file number 001-34087) dated March 29, 2012).
10.36 Loan Waiver and Collateral Agreement dated as of November 14, 2012 by and between Condor Hospitality Limited Partnership, SPPR-South Bend, LLC, the Company and Condor Hospitality REIT Trust and Western Alliance Bank (incorporated herein by reference to Exhibit 10.30 to the Company’s Annual Report on Form 10-K (Commission file number 001-34087) for the year ended December 31, 2012).
10.37 Loan Modification Agreement dated as of August 13, 2013 by and between Condor Hospitality Limited Partnership, SPPR-South Bend, LLC, the Company and Condor Hospitality REIT Trust and Western Alliance Bank (incorporated herein by reference to Exhibit 10.8 to the Company’s Quarterly Report on Form 10-Q (Commission file number 001-34087) for the quarter ended June 30, 2013).
10.38 Loan Modification Agreement dated as of November 13, 2013 by and between Condor Hospitality Limited Partnership, SPPR-South Bend, LLC, the Company and Condor Hospitality REIT Trust and Western Alliance Bank (incorporated herein by reference to Exhibit 10.3 to the Company’s Quarterly Report on Form 10-Q (Commission file number 001-34087) for the quarter ended September 30, 2013).
101
10.39 Loan Modification Agreement dated as of March 14, 2014 by and between Condor Hospitality Limited Partnership, SPPR-South Bend, LLC, the Company and Condor Hospitality REIT Trust and Western Alliance Bank (incorporated herein by reference to Exhibit 10.1 to the Company’s Quarterly Report on Form 10-Q (Commission file number 001-34087) for the quarter ended June 30, 2014).
10.40 Loan Modification Agreement dated as of October 13, 2014 by and between Condor Hospitality Limited Partnership, SPPR-South Bend, LLC, the Company and Condor Hospitality REIT Trust and Western Alliance Bank (incorporated herein by reference to Exhibit 10.1 to the Company’s Quarterly Report on Form 10-Q (Commission file number 001-34087) for the quarter ended September 30, 2014).
10.41 Loan Modification Agreement dated as of December 30, 2014 by and between Condor Hospitality Limited Partnership, SPPR-South Bend, LLC, the Company and Condor Hospitality REIT Trust and Western Alliance Bank (incorporated herein by reference to Exhibit 10.1 to the Company’s Current Report on Form 8-K (Commission file number 001-34087) dated December 23, 2014).
10.42 Loan Modification Agreement dated as of February 17, 2015 by and between Condor Hospitality Limited Partnership, SPPR-South Bend, LLC, the Company and Condor Hospitality REIT Trust and Western Alliance Bank (incorporated herein by reference to Exhibit 10.1 to the Company’s Current Report on Form 8-K (Commission file number 001-34087) dated February 17, 2015).
10.43 Loan Agreement, dated as of November 2, 2012, between Solomons Beacon Inn Limited Partnership, TRS Subsidiary, LLC and Morgan Stanley Mortgage Capital Holdings LLC (incorporated herein by reference to Exhibit 10.1 to the Company’s Current Report on Form 8-K (Commission file number 001-34087) dated November 2, 2012).
10.44 First Amendment to Loan Agreement, dated as of January 3, 2013, between Solomons Beacon Inn Limited Partnership, TRS Subsidiary, LLC and Morgan Stanley Mortgage Capital Holdings LLC (incorporated herein by reference to Exhibit 10.32 to the Company’s Annual Report on Form 10-K (Commission file number 001-34087) for the year ended December 31, 2012).
10.45Second Amendment to Loan Agreement, dated as of April 15, 2016, between Solomons Beacon Inn Limited Partnership, TRS Subsidiary, LLC and U.S. Bank National Association, as Trustee for Morgan Stanley Bank of America Merrill Lynch Trust 2013-C7, Commercial Mortgage Pass-Through Certificates, Series 2013-C7 (incorporated herein by reference to Exhibit 10.7 to the Company’s Quarterly Report on Form 10-Q (Commission file number 001-34087) for the quarter ended June 30, 2016).
10.46 Guaranty of Recourse Obligations of Borrower, dated as of November 2, 2012, by the Company in favor of Morgan Stanley Mortgage Capital Holdings LLC (incorporated herein by reference to Exhibit 10.2 to the Company’s Current Report on Form 8-K (Commission file number 001-34087) dated November 2, 2012).
10.47 Cash Management Agreement, dated as of November 2, 2012, among Morgan Stanley Mortgage Capital Holdings LLC, Solomons Beacon Inn Limited Partnership, TRS Subsidiary, LLC, Hospitality Management Advisors, Inc., Kinseth Hotel Corporation and Strandco, Inc. (incorporated herein by reference to Exhibit 10.3 to the Company’s Current Report on Form 8-K (Commission file number 001-34087) dated November 2, 2012).
10.48 First Amendment to Cash Management Agreement, dated as of November 5, 2012, among Morgan Stanley Mortgage Capital Holdings LLC, Solomons Beacon Inn Limited Partnership, TRS Subsidiary, LLC, Hospitality Management Advisors, Inc., Kinseth Hotel Corporation and Strandco, Inc. (incorporated herein by reference to Exhibit 10.35 to the Company’s Annual Report on Form 10-K (Commission file number 001-34087) for the year ended December 31, 2012).
102
10.49 Loan Agreement dated October 2, 2015 between Western Alliance Bank and CDOR Atl Indy, LLC and TRS Atl Indy, LLC (incorporated herein by reference to Exhibit 10.9 to the Company’s Quarterly Report on Form 10-Q (Commission file number 001-34087) for the quarter ended September 30, 2015).
10.50 Loan Agreement dated October 2, 2015 between Western Alliance Bank and CDOR Jax Court, LLC and TRS Jax Court, LLC (incorporated herein by reference to Exhibit 10.10 to the Company’s Quarterly Report on Form 10-Q (Commission file number 001-34087) for the quarter ended September 30, 2015).
10.51 Term Loan Note dated October 2, 2015 by CDOR Atl Indy, LLC and TRS Atl Indy, LLC to the order of Western Alliance Bank (incorporated herein by reference to Exhibit 10.11 to the Company’s Quarterly Report on Form 10-Q (Commission file number 001-34087) for the quarter ended September 30, 2015).
10.52 Term Loan Note dated October 2, 2015 by CDOR Jax Court, LLC and TRS Jax Court, LLC to the order of Western Alliance Bank (incorporated herein by reference to Exhibit 10.12 to the Company’s Quarterly Report on Form 10-Q (Commission file number 001-34087) for the quarter ended September 30, 2015).
10.53 Guaranty dated October 2, 2015 by the Company for the benefit of Western Alliance Bank (incorporated herein by reference to Exhibit 10.13 to the Company’s Quarterly Report on Form 10-Q (Commission file number 001-34087) for the quarter ended September 30, 2015).
10.54 Guaranty dated October 2, 2015 by the Company for the benefit of Western Alliance Bank (incorporated herein by reference to Exhibit 10.14 to the Company’s Quarterly Report on Form 10-Q (Commission file number 001-34087) for the quarter ended September 30, 2015).
10.55 Assignment and Assumption of Deed of Trust and Other Loan Documents and Modification Agreement dated October 1, 2015 by and among PHG San Antonio, LLC, Jatin Desai, Mitul Patel, and Gregory M. Friedman, CDOR San Spring, LLC, TRS San Spring, LLC and the Company, and LMREC 2015-CRE1, Inc. (incorporated herein by reference to Exhibit 10.15 to the Company’s Quarterly Report on Form 10-Q (Commission file number 001-34087) for the quarter ended September 30, 2015).
10.56 Promissory Note (SpringHill Suites) dated April 21, 2014 by PHG San Antonio, LLC to the order of LMREC III Holdings III, Inc. (incorporated herein by reference to Exhibit 10.16 to the Company’s Quarterly Report on Form 10-Q (Commission file number 001-34087) for the quarter ended September 30, 2015).
10.57 Deed of Trust, Security Agreement and Financing Statement by PHG San Antonio, LLC to Cyrus N. Ansari, Esq. for the benefit of LMREC III Holdings III, Inc. (incorporated herein by reference to Exhibit 10.17 to the Company’s Quarterly Report on Form 10-Q (Commission file number 001-34087) for the quarter ended September 30, 2015).
10.58 Indemnity and Guarantee Agreement (SpringHill Suites) dated October 1, 2015 by the Company in favor of LMREC 2015-CRE 1, Inc. (incorporated herein by reference to Exhibit 10.18 to the Company’s Quarterly Report on Form 10-Q (Commission file number 001-34087) for the quarter ended September 30, 2015).
10.59 Lockbox and Security Agreement (SpringHill Suites) dated October 1, 2015 by CDOR San Spring, LLC and TRS San Spring, LLC in favor of LMREC 2015-CRE 1, Inc. (incorporated herein by reference to Exhibit 10.19 to the Company’s Quarterly Report on Form 10-Q (Commission file number 001-34087) for the quarter ended September 30, 2015).
10.60Loan Agreement dated as of August 22 2016 between Spring Street Hotel Property LLC, Spring Street Hotel Opco LLC and LoanCore Capital Credit REIT LLC (incorporated herein by reference to Exhibit 10.4 to the Company’s Current Report on Form 8-K (Commission file number 001-34087) dated August 22, 2016).
103
10.61Guaranty of Recourse Obligations by the Company and Alan Kanders and Raviraj Kiran Dave dated August 22, 2016 in favor of LoanCore Capital Credit REIT LLC (incorporated herein by reference to Exhibit 10.5 to the Company’s Current Report on Form 8-K (Commission file number 001-34087) dated August 22, 2016).
10.62Loan Agreement dated as of December 14, 2016 among CDOR KCI Loft, LLC, TRS KCI Loft, LLC and Great Western Bank (incorporated herein by reference to Exhibit 10.3 to the Company’s Current Report on Form 8-K (Commission file number 001-34087) dated December 14, 2016).
10.63Springing Unconditional Guaranty of Payment and Performance dated as of December 14, 2016 by the Company in favor of Great Western Bank (incorporated herein by reference to Exhibit 10.4 to the Company’s Current Report on Form 8-K (Commission file number 001-34087) dated December 14, 2016).
10.64Limited Guaranty of Payment and Performance dated as of December 14, 2016 by the Company in favor of Great Western Bank (incorporated herein by reference to Exhibit 10.5 to the Company’s Current Report on Form 8-K (Commission file number 001-34087) dated December 14, 2016).
10.65 Purchase Agreement, dated November 16, 2011, by and among the Company, Condor Hospitality Limited Partnership and Real Estate Strategies L.P. (incorporated herein by reference to Exhibit 10.1 to the Company’s Current Report on Form 8-K/A (Commission file number 001-34087) dated November 16, 2011).
10.66 Warrants issued to Real Estate Strategies L.P. dated February 1, 2012 and February 15, 2012 (incorporated herein by reference to Exhibit 10.39 to the Company’s Annual Report on Form 10-K (Commission file number 001-34087) for the year ended December 31, 2011).
10.67 Investor Rights and Conversion Agreement, dated February 1, 2012, by and among the Company, Real Estate Strategies L.P. and IRSA Inversiones y Representaciones Sociedad Anónima (incorporated herein by reference to Exhibit 10.3 to the Company’s Current Report on Form 8-K (Commission file number 001-34087) dated January 30, 2012).
10.68 Registration Rights Agreement, dated February 1, 2012, by and among the Company, Real Estate Strategies L.P. and IRSA Inversiones y Representaciones Sociedad Anónima (incorporated herein by reference to Exhibit 10.4 to the Company’s Current Report on Form 8-K (Commission file number 001-34087) dated January 30, 2012).
10.69 Directors Designation Agreement, dated February 1, 2012, by and among the Company, Real Estate Strategies L.P. and IRSA Inversiones y Representaciones Sociedad Anónima (incorporated herein by reference to Exhibit 10.5 to the Company’s Current Report on Form 8-K (Commission file number 001-34087) dated January 30, 2012).
10.70 Agreement, dated August 9, 2013, by and among the Company, Real Estate Strategies L.P. and IRSA Inversiones y Representaciones Sociedad Anonima (incorporated herein by reference to Exhibit 10.1 to the Company’s Current Report on Form 8-K (Commission file number 001-34087) dated August 9, 2013)
10.71 Agreement, dated July 23, 2015, between Real Estate Strategies L.P., IRSA Inversiones y Representaciones Sociedad Anonima and the Company (incorporated herein by reference to Exhibit 10.1 to the Company’s Current Report on Form 8-K (Commission file number 001-34087) dated July 23, 2015).
10.72Stock Purchase Agreement, dated as of March 16, 2016, between SREP III Flight-Investco, L.P. and the Company (incorporated herein by reference to Exhibit 10.1 to the Company’s Current Report on Form 8-K (Commission file number 001-34087) dated March 16, 2016).
104
10.73Investor Rights Agreement, dated as of March 16, 2016, by and among SREP III Flight-Investco, L.P., StepStone Group Real Estate LP and the Company (incorporated herein by reference to Exhibit 10.2 to the Company’s Current Report on Form 8-K (Commission file number 001-34087) dated March 16, 2016).
10.74Agreement, dated as of March 16, 2016, by and among Real Estate Strategies L.P., IRSA Inversiones y Representaciones Sociedad Anónima and the Company (incorporated herein by reference to Exhibit 10.3 to the Company’s Current Report on Form 8-K (Commission file number 001-34087) dated March 16, 2016).
10.75 The Company’s 2006 Stock Plan (incorporated herein by reference to Exhibit 10.31 to the Company’s Annual Report on Form 10-K (Commission file number 001-34087) for the year ended December 31, 2011).
10.76 Amendment to the Company’s 2006 Stock Plan dated May 28, 2009 (incorporated herein by reference to Exhibit 10.1 to the Company’s Current Report on Form 8-K (Commission file number 001-34087) dated May 28, 2009).
10.77 Amendment to the Company’s 2006 Stock Plan dated May 22, 2012 (incorporated herein by reference to Exhibit 10.1 to the Company’s Current Report on Form 8-K (Commission file number 001-34087) dated May 22, 2012).
10.78 Form of Stock Option Agreement (incorporated herein by reference to Exhibit 10.32 to the Company’s Annual Report on Form 10-K (Commission file number 001-34087) for the year ended December 31, 2011).
10.79The Company’s 2016 Stock Plan (incorporated herein by reference to Exhibit 10.1 to the Company’s Current Report on Form 8-K (Commission file number 001-34087) dated June 15, 2016).
10.80 Jeffrey W. Dougan Employment Agreement dated July 15, 2013 (incorporated herein by reference to Exhibit 10.1 to the Company’s Current Report on Form 8-K (Commission file number 001-34087) dated July 9, 2013).
10.81 Jeffrey W. Dougan Restricted Stock Agreement dated July 15, 2013 (incorporated herein by reference to Exhibit 10.2 to the Company’s Current Report on Form 8-K (Commission file number 001-34087) dated July 9, 2013).
10.82 Jeffrey W. Dougan Stock Option Agreement dated July 15, 2013 (incorporated herein by reference to Exhibit 10.3 to the Company’s Current Report on Form 8-K (Commission file number 001-34087) dated July 9, 2013).
10.83 Kelly Walters Letter Agreement dated January 29, 2015 (incorporated herein by reference to Exhibit 10.69 to the Company’s Annual Report on Form 10-K (Commission file number 001-34087) for the year ended December 31, 2014).
10.84 Amended and Restated Employment Agreement dated March 2, 2015 by and between the Company and J. William Blackham, as amended and restated on September 16, 2016 (incorporated herein by reference to Exhibit 10.1 to the Company’s Current Report on Form 8-K (Commission file number 001-34087) dated September 16, 2016).
10.85 Common Stock Purchase Warrant dated March 2, 2015 between the Company and J. William Blackham (incorporated herein by reference to Exhibit 10.3 to the Company’s Current Report on Form 8-K (Commission file number 001-34087) dated March 2, 2015).
105
10.86 Letter dated March 25, 2015 with Corrine L. Scarpello (incorporated herein by reference to Exhibit 10.1 to the Company’s Current Report on Form 8-K (Commission file number 001-34087) dated March 25, 2015).
10.87 Letter dated July 9, 2015 with Corrine L. Scarpello (incorporated herein by reference to Exhibit 10.1 to the Company’s Current Report on Form 8-K (Commission file number 001-34087) dated July 9, 2015).
10.88Form of Executive Officer and Director Indemnification Agreement (incorporated herein by reference to Exhibit 10.5 to the Company’s Quarterly Report on Form 10-Q (Commission file number 001-34087) for the quarter ended March 31, 2016).
10.89 Director and Named Executive Officers Compensation is incorporated herein by reference to the sections entitled “Compensation Discussion and Analysis”, “Compensation Committee Report”, “Summary Compensation Table”, “Grants of Plan-Based Awards for Fiscal Year 2016”, “Outstanding Equity Awards at Fiscal Year-End”, and “Director Compensation” in the Company’s Proxy Statement for the Annual Meeting of Stockholders for 2017.
10.90 Purchase and Sale Agreement dated July 14, 2015 between Condor Hospitality Limited Partnership and PHG College Park, LLC (incorporated herein by reference to Exhibit 10.1 to the Company’s Current Report on Form 8-K (Commission file number 001-34087) dated July 14, 2015).
10.91 Purchase and Sale Agreement dated July 14, 2015 between Condor Hospitality Limited Partnership and PHG Jax Flagler, LLC (incorporated herein by reference to Exhibit 10.2 to the Company’s Current Report on Form 8-K (Commission file number 001-34087) dated July 14, 2015).
10.92 Purchase and Sale Agreement dated July 14, 2015 between Condor Hospitality Limited Partnership and PHG San Antonio, LLC (incorporated herein by reference to Exhibit 10.3 to the Company’s Current Report on Form 8-K (Commission file number 001-34087) dated July 14, 2015).
10.93Agreement of Purchase and Sale dated as of August 29, 2016 between Leawood ADP, Ltd. and Condor Hospitality Limited Partnership (incorporated by reference to Exhibit 10.1 filed with the Company’s Form 8-K dated August 29, 2016 (001-34087)).
21.0* Subsidiaries.
23.1* Consent of KPMG LLP.
31.1* Section 302 Certification of Chief Executive Officer.
31.2* Section 302 Certification of Chief Financial Officer.
32.1* Section 906 Certifications.
101.1* The following materials from the Company’s Annual Report on Form 10-K for the year ended December 31, 2016, formatted in XBRL (eXtensible Business Reporting Language): (i) the Consolidated Balance Sheets, (ii) the Consolidated Statements of Operations, (iii) the Consolidated Statements of Equity, (iv) the Consolidated Statements of Cash Flows and (v) Notes to Consolidated Financial Statements.
Pursuant to Item 601 (b)(4) of Regulation S-K, certain instruments with respect to the Company’s long-term debt are not filed with this Form 10-K. The Company will furnish a copy of any such long-term debt agreement to the Securities and Exchange Commission upon request.
Management contracts and compensatory plans are set forth as Exhibits 10.75 through 10.89.
106
* Filed herewith.
107
|
|
|
|
|
|
|
|
|
|
Pursuant to the requirements of Section 13 or 15(d) of the Securities Exchange Act of 1934, the registrant has duly caused this report to be signed on its behalf by the undersigned, thereunto dually authorized |
|
||||
|
|
|
|
|
|
|
|
|
|
|
|
|
|
|
|
|
|
|
March 1, 2017 |
/s/J. William Blackham |
|
|
|
|
|
|
|
J. William Blackham |
|
|
|
|
|
|
|
Chief Executive Officer |
|
|
|
|
|
|
|
|
|
|
|
|
|
|
|
|
|
|
|
|
|
Pursuant to the requirements of the Securities and Exchange Act of 1934, this report has been signed by the following persons on behalf of the registrant and in the capacities and on the dates indicated. |
|
||||
|
|
|
|
|
|
|
|
|
|
|
|
|
|
|
|
|
|
Signature |
|
Title |
|
Date |
|
|
|
|
|
|
|
|
|
|
|
/s/J. William Blackham |
|
Chief Executive Officer |
|
March 1, 2017 |
|
|
|
J. William Blackham |
|
(Principal Executive Officer) |
|
|
|
|
|
|
|
|
|
|
|
|
|
/s/Jonathan J. Gantt |
|
Chief Financial Officer |
|
March 1, 2017 |
|
|
|
Jonathan J. Gantt |
|
(Principal Financial Officer) |
|
|
|
|
|
|
|
|
|
|
|
|
|
/s/Arinn A. Cavey |
|
Chief Accounting Officer |
|
March 1, 2017 |
|
|
|
Arinn A. Cavey |
|
(Principal Accounting Officer) |
|
|
|
|
|
|
|
|
|
|
|
|
|
/s/James H. Friend |
|
Chairmen of the Board |
|
March 1, 2017 |
|
|
|
James H. Friend |
|
|
|
|
|
|
|
|
|
|
|
|
|
|
|
/s/Daphne J. Dufresne |
|
Board Member |
|
March 1, 2017 |
|
|
|
Daphne J. Dufresne |
|
|
|
|
|
|
|
|
|
|
|
|
|
|
|
/s/Daniel R. Elsztain |
|
Board Member |
|
March 1, 2017 |
|
|
|
Daniel R. Elsztain |
|
|
|
|
|
|
|
|
|
|
|
|
|
|
|
/s/Jeff Giller |
|
Board Member |
|
March 1, 2017 |
|
|
|
Jeff Giller |
|
|
|
|
|
|
|
|
|
|
|
|
|
|
|
/s/Donald J. Landry |
|
Board Member |
|
March 1, 2017 |
|
|
|
Donald J. Landry |
|
|
|
|
|
|
|
|
|
|
|
|
|
|
|
/s/Mark Linehan |
|
Board Member |
|
March 1, 2017 |
|
|
|
Mark Linehan |
|
|
|
|
|
|
|
|
|
|
|
|
|
|
|
/s/Brendan MacDonald |
|
Board Member |
|
March 1, 2017 |
|
|
|
Brendan MacDonald |
|
|
|
|
|
|
|
|
|
|
|
|
|
|
|
/s/John M. Sabin |
|
Board Member |
|
March 1, 2017 |
|
|
|
John M. Sabin |
|
|
|
|
|
108