Attached files
| file | filename |
|---|---|
| EX-99.1 - EXHIBIT 99.1 - PRESS RELEASE - DYNEX CAPITAL INC | a2q17earningsrelease.htm |
| 8-K - 8-K - DYNEX CAPITAL INC | a2q17form8-kearningsrelease.htm |

Second Quarter 2017
Earnings Presentation
August 2, 2017

2
Safe Harbor Statement
NOTE:
This presentation contains certain statements that are not historical facts and that constitute “forward-looking statements” within the meaning of the Private Securities Litigation
Reform Act of 1995. Statements in this presentation addressing expectations, assumptions, beliefs, projections, estimates, future plans, strategies, and events, developments
that we expect or anticipate will occur in the future, and future operating results or financial condition are forward-looking statements. Forward-looking statements in this
presentation may include, but are not limited to, statements regarding future interest rates, our views on expected characteristics of future investment environments, prepayment
rates on our investment portfolio and risks posed by our investment portfolio, our future investment strategies, our future leverage levels and financing strategies, the use of
specific financing and hedging instruments and the future impacts of these strategies, future actions by the Federal Reserve, and the expected performance of our investments.
The words “will,” “believe,” “expect,” “forecast,” “anticipate,” “intend,” “estimate,” “assume,” “project,” “plan,” “continue,” and similar expressions also identify forward-looking
statements. These forward-looking statements reflect our current beliefs, assumptions and expectations based on information currently available to us, and are applicable only
as of the date of this presentation. Forward-looking statements are inherently subject to risks, uncertainties, and other factors, some of which cannot be predicted or quantified
and any of which could cause the Company’s actual results and timing of certain events to differ materially from those projected in or contemplated by these forward-looking
statements. Not all of these risks, uncertainties and other factors are known to us. New risks and uncertainties arise over time, and it is not possible to predict those risks or
uncertainties or how they may affect us. The projections, assumptions, expectations or beliefs upon which the forward-looking statements are based can also change as a result
of these risks and uncertainties or other factors. If such a risk, uncertainty, or other factor materializes in future periods, our business, financial condition, liquidity and results
of operations may differ materially from those expressed or implied in our forward-looking statements.
While it is not possible to identify all factors, some of the factors that may cause actual results to differ from historical results or from any results expressed or implied by our
forward-looking statements, or that may cause our projections, assumptions, expectations or beliefs to change, include the risks and uncertainties referenced in our Annual
Report on Form 10-K for the year ended December 31, 2016 and subsequent filings with the Securities and Exchange Commission, particularly those set forth under the caption
“Risk Factors”.

3
2Q17 Highlights
• Dividend of $0.18 per common share for the quarter
• Comprehensive income of $0.05 per common share and GAAP net loss of
$(0.20) per common share
• Core net operating income(1) of $0.19 per common share for the quarter
◦ CMBS prepayment income more than offset ARM premium
amortization
◦ Drop income on TBA securities of $0.03 per common share
• Economic return on book value(2) of 0.5% for the quarter and 7.8% year-to-
date
• Book value per common share of $7.38 at June 30, 2017 compared to $7.52
at March 31, 2017 and $7.18 at December 31, 2016
(1) Reconciliations for non-GAAP measures are presented in the Appendix.
(2) For second quarter, equals sum of dividend of $0.18 per common share plus the decrease in book value of $0.14 divided by beginning book value per share
for the quarter of $7.52. For year-to-date, equals sum of dividend of $0.36 per common share plus the increase in book value of $0.20 divided by beginning
book value per share for the quarter of $7.18.

4
2Q17 Highlights
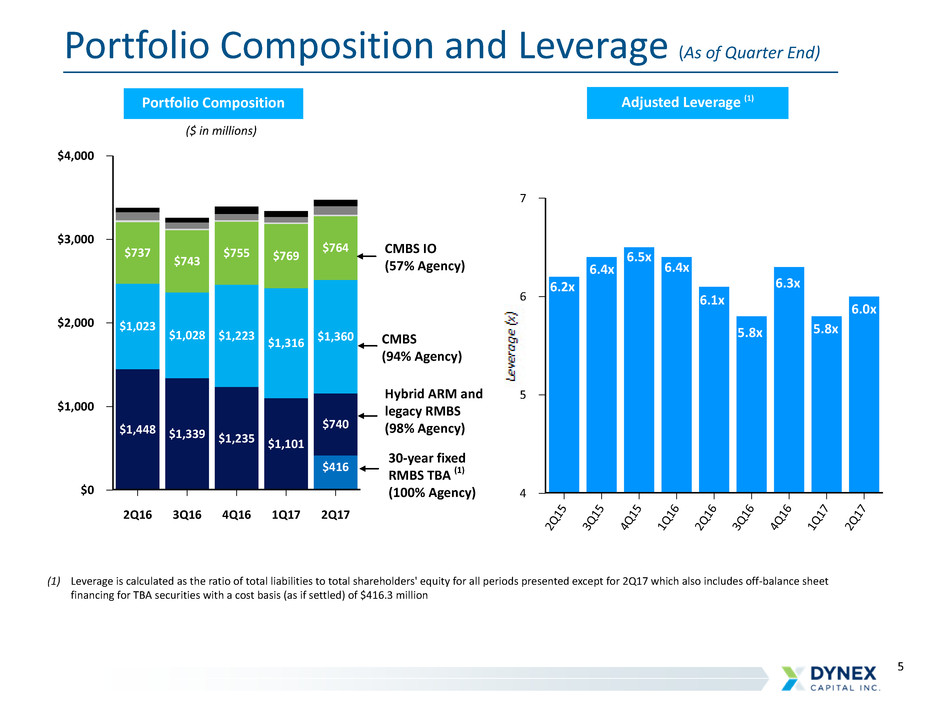
• Expanded allocation to fixed-rate Agency securities by investing in 30-year fixed-rate
Agency RMBS TBA securities with a cost basis of $416.3 million at June 30, 2017
◦ Combined with Agency CMBS (Fannie Mae DUS), the Company had $1.7 billion in
fixed-rate securities at June 30, 2017
◦ Increased adjusted leverage(1) to 6.0x at June 30, 2017 versus 5.8x at March 31,
2017
◦ Expect to continue increasing leverage and investing capital opportunistically for
the balance of 2017
• Reallocated capital away from short-duration lower yielding investments given the
flatter US Treasury curve and the prospect for faster prepayments. Sold $271.4 million
in short and current reset hybrid ARMs and had $63.7 million in paydowns
◦ Hybrid ARM balance has declined over $462 million, or almost 40%, since
December 31, 2016
• Increased interest rate swaps by a net $990 million to substantially mitigate the risk to
higher funding costs and short-term interest rates for the remainder of 2017, and
adjusted the hedge position for the addition of 30-year TBA securities
(1) Includes TBA positions at cost (as if settled) of $416.3 million as a liability representing the off-balance sheet financing risk related to TBA securities.
5
Portfolio Composition and Leverage (As of Quarter End)
Portfolio Composition Adjusted Leverage (1)
($ in millions)
$4,000
$3,000
$2,000
$1,000
$0
2Q16 3Q16 4Q16 1Q17 2Q17
$416
$1,448 $1,339 $1,235 $1,101
$740
$1,023
$1,028 $1,223 $1,316 $1,360
$737
$743 $755 $769
$764
(1) Leverage is calculated as the ratio of total liabilities to total shareholders' equity for all periods presented except for 2Q17 which also includes off-balance sheet
financing for TBA securities with a cost basis (as if settled) of $416.3 million
Hybrid ARM and
legacy RMBS
(98% Agency)
CMBS
(94% Agency)
CMBS IO
(57% Agency)
30-year fixed
RMBS TBA (1)
(100% Agency)
7
6
5
4
2Q
15
3Q
15
4Q
15
1Q
16
2Q
16
3Q
16
4Q
16
1Q
17
2Q
17
6.2x
6.4x
6.5x
6.4x
6.1x
5.8x
6.3x
5.8x
6.0x

6
Liquidity
Government
Issued AAA
Rated
AAA
Rated
AA – BBB
Rated
Below
Investment
Grade/ Non-
Rated
Agency MBS
RMBS*
RMBS-IO
CMBS
CMBS-IO
Non-Agency MBS
RMBS
RMBS-IO
CMBS
CMBS-IO
Non-Agency MBS
Non-Agency MBS
Loans/MSRs
Short
Term
Medium
Term
Permanent
~7-9 % Yield
Permanent
~9-14 % Yield
Repo/Dollar Rolls
Committed Repo
Warehouse Lines
Unsecured Notes
Convertible Notes
Preferred Stock
Common Stock
Emphasizing Higher Liquidity and Credit Quality
ASSETS CAPITAL
Over our 30 year history we have invested in every real estate debt asset
class. Today we are emphasizing higher liquidity and higher credit quality.
97%
of Dynex
portfolio
today
Dynex
sources
today
Dynex
sources
today
*specified pool or TBA

7
Investment Strategy
Diversified investment approach that performs in a variety of market environments
• Dynamic and disciplined capital allocation model enables capturing
long-term value
• Invest in a high quality, liquid asset portfolio of primarily Agency
investments, as of June 30, 2017
◦ 87% Agency guaranteed
◦ 97% AAA rated
• Diversification is a key benefit
◦ Balance between commercial and residential sectors provides
diversified cash flow and prepayment profile
◦ Agency CMBS protect the portfolio from extension risk. High
quality CMBS IO add yield and are intended to limit credit
exposure and prepayment volatility vs. lower rated tranches.
◦ Agency fixed rate RMBS will allow us to grow our balance sheet
opportunistically.
• Flexible portfolio duration position to reflect changing market
conditions

8
• This asset class offers the opportunity to earn an above average return over the long term
versus other sectors today. This is unique for Dynex as over the last ten years we have always
had more attractive alternatives in other sectors.
• The Federal Reserve balance sheet reduction has been well telegraphed and appears priced
into the market today. Additional spread widening would present an opportunity to reallocate
out of other sectors into Agency residential RMBS. We believe additional spread widening
would be limited by demand for these high quality assets from crossover buyers.
• The macroeconomic environment continues to be supportive for spread products. Two major
central banks (BoJ and ECB) continue to inject liquidity through large scale asset purchases
supporting valuations across sectors. This is a key risk factor and we continue to be vigilant on
this issue.
• Housing continues to be a major issue in the U.S. Housing finance reform debate is dominated
by the need for private capital as the GSEs' footprint shrinks in this market. Potential change
in government policy could present a major business opportunity for Dynex shareholders.
• The risk adjusted return and the liquidity of 30-year fixed-rate RMBS more than compensate
for the relatively higher duration drift vs. less liquid ARMs. The incremental liquidity also gives
us the ability to shrink or grow the balance sheet rapidly.
Fixed Rate 30-Year Strategy
9
Macroeconomic Themes
Our core macroeconomic views center around the following themes:
• Global economic fundamentals have improved - but still fragile
• U.S. fundamentals - inflation declining; GDP increasing; employment improving
• Government policy - monetary, regulatory, fiscal - will continue to drive returns and is
more uncertain today than at any point in the last decade
◦ Composition and culture of the Federal Reserve could change over the next 2
years
◦ Economic environment increases potential tightening/easing cycle by the Fed
similar to 1994-1995
◦ Fed intends to reduce MBS/Treasury portfolio
• High asset prices reflect global demand for yield and significant QE liquidity injections
from central banks
• Global debt and US debt are at all time high levels, creating a fragile global economy
vulnerable to exogenous events
• Globalization has created an irreversible connectedness between our economy and the
rest of the world
10
Long-Term Positive Trends
Our business model is supported by positive long-term trends:
• U.S. demographic trends are driving a significant increase in household
formation and therefore more demand in multifamily and single-family
housing
• Global demographic aging trends are driving a demand for income/yield
investments
• As government participation wanes there is a large need for private capital
and expertise in the housing finance system
• The outlook for the regulatory environment is improving and could provide
both investment and financing opportunities
11
Risk and Investment Posture
• Interest Rate Risk: We have structured the portfolio to be more interest rate neutral and we have now
included hedges incorporating the risk profile of 30-year fixed rate RMBS. There are many global factors
that will ultimately determine the level of interest rates. We expect to dynamically and opportunistically
manage our profile including the addition of other instruments such as options and swaptions.
• Spread Risk: Spreads on all major fixed income asset classes are close to their tightest levels since 2014.
Volatility in high quality asset spreads has been muted by central bank quantitative easing activities. The
return offered by Agency 30-year fixed rate RMBS is greater than that offered by riskier assets. While the
Fed's reinvestment policy could impact pricing in this sector, we have increased our allocation to this
investment as we believe long term returns are compelling and accretive. Asset spreads could be vulnerable
to widening due to changes in central bank involvement in these markets, which would present an
opportunity to add assets.
• Credit Risk: We remain invested in the highest quality assets, which includes Agency and AAA rated securities.
Credit spreads on lower rated tranches have tightened substantially and are vulnerable to economic
weakness and sector related default risk. This risk is further exacerbated when these positions are funded
with short term repo – a risk we do not believe offers long term value at these levels.
• Liquidity and Leverage Risk: We are focused on high quality earning assets that are highly liquid, which
gives us the flexibility to reallocate capital. We will also dynamically manage leverage and liquidity to
opportunistically increase the size of our portfolio, which we expect to ultimately drive earnings.
12
Strategic Focus
• Maintain investments in higher credit quality, more liquid assets with some
portion providing extension and prepayment protection
• Capitalize on opportunities for investing capital from shifts in government
and regulatory policy
• Positioned to reallocate/invest capital as market volatility creates attractive
risk adjusted return opportunities
• Continue to seek ways to diversify funding sources as the regulatory
environment becomes more favorable
• Continue commitment to disciplined risk management and capital allocation
decisions that maximize flexibility given the current environment

13
Summary
• Year to date we have paid $0.36 in dividends per common share and reported core
net income of $0.34 per common share.
• We continue to believe the diversified investment strategy will generate superior risk
adjusted returns given the complementary cash flow and risk profiles of the
commercial and residential sectors.
• There is a unique opportunity to generate returns in 30-year fixed rate RMBS. We are
allocating capital out of ARMs and have doubled our position in the 30-year sector
since June 30, 2017. We expect to continue to opportunistically invest in this sector,
which will help drive earnings for the remainder of the year.
• The risk adjusted returns and the liquidity of 30-year fixed rate RMBS more than
compensates for the relatively higher duration drift versus less liquid ARMs. The
incremental liquidity also gives us the ability to shrink or grow the balance sheet
rapidly.
• Global macro environment is still complex and asset prices are high and the potential
for spread widening is elevated.
• We have an experienced management team, an internally managed structure that
creates shareholder alignment, and a long-term history of disciplined capital
allocation.

14
Long-Term Value is Driven by Above Average Dividends
Source: SNL Financial
Total Return (%) January 1, 2008 - June 30, 2017

15
Market Snapshot
Common Stock Preferred Stocks
NYSE Ticker: DX DXPrA DXPrB
Shares Outstanding:
(as of 6/30/17) 49.23M 2.30M 3.05M
Q2 Dividends per share: $0.18 $0.53125 $0.4765625
Dividend Yield:
(annualized, based on 7/24/17 stock price) 10.53% 8.32% 7.76%
Share Price:
(at 7/24/17) $6.84 $25.54 $24.57
Market Capitalization:
(based on 6/30/17 shares outstanding and 7/24/17
stock price) $336.76 $58.74 $74.91
Price to Book:
(based on 6/30/17 book value and 7/24/17 stock price) 92.7% - -

Appendix

17
Asset Class 6/30/17 3/31/17 12/31/16 9/30/16 06/30/16 12/31/15 06/30/15 12/31/14
Agency DUS 68 67 76 80 94 89 60 59
Freddie K AAA IO 145 150 200 230 255 225 150 155
AAA CMBS 88 93 91 100 104 138 92 88
AAA CMBS IO 110 145 195 215 240 240 175 165
Freddie K B 165 220 295 265 325 350 157 170
Fixed 30yr FN 3% 33 31 36 22 30 34 24 17
Fixed 30yr FN 4% 28 24 31 11 26 32 25 2
Freddie K C 275 350 435 490 540 480 228 250
IG Corporates 123 128 138 159 157 172 146 132
High Yield 441 456 476 558 628 746 521 562
AA CMBS 132 129 128 160 186 223 163 141
A CMBS 182 182 230 255 304 348 230 203
BBB CMBS 357 439 485 560 604 562 388 358
10y swap spreads (2.4) (0.4) (13.0) (14.0) (10.6) (8.5) 9.8 11.8
CRT.M3-2014 162 236 297 311 415 478 425 475
Agency ARM 5/1
(new issue) 21 24 19 32 38 22 16 21
Fixed 30yr FN 3.5% 35 30 33 21 31 34 28 5
Credit Spreads (in bps)
Source: Blackrock, JP Morgan and Company data
Dynex
Portfolio

18
($ in thousands, except per share amounts) $ Amount
Per Common
Share
Common shareholders' equity, March 31, 2017 (1) $370,094 $7.52
GAAP net loss:
Core net operating income (2) 9,334 0.19
Realized loss on sale of MBS, net (3,709) (0.07)
Remaining GAAP income amounts 103 —
Change in fair value of derivatives (15,801) (0.32)
Unrealized gains on MBS 12,448 0.25
Dividends declared (8,862) (0.18)
Stock transactions (49) (0.01)
Common shareholders' equity, June 30, 2017 (1) $363,558 $7.38
(1) Common shareholders' equity represents total shareholders' equity less the liquidation value of preferred stock outstanding as of the date indicated.
(2) Reconciliations for non-GAAP measures are presented in the Appendix.
Book Value Rollforward
GAAP EPS:
$(0.20)

19
Portfolio Details* (as of June 30, 2017)
Portfolio Expected Maturity/Reset Distribution
$1,400
$1,200
$1,000
$800
$600
$400
$200
$0
Fa
ir
Va
lu
e
0-12 13-36 37-60 61-84 85-120 >120
Months to Maturity/Reset
Net Premium by Asset Type (1)
CMBS & CMBS IO: 96.3%
RMBS: 3.7%
* MBS investments only, excludes loans held for investment.
8% 7%
15%
18%
12%
41%
$762.1
$29
($ in millions) ($ in millions)
(1)CMBS & CMBS IO typically have prepayment protection. RMBS have no prepayment protection.

20
Funding Sources (as of June 30, 2017)
Active Counterparty by Region # % of all REPO
North America 9 70%
Asia 6 16%
Europe 3 14%
Total 18 100%
Active Counterparty by Type # % of all REPO
Broker/Dealers 4 19%
Domestic Banks 8 64%
Foreign Banks 6 17%
Total 18 100%
• We maintain a diversified funding platform with over 34 established counterparties, currently active with 18
counterparties
• Our funding is well diversified by counterparty and geography
• Repo markets remain highly liquid
Repo-Uncommitted:
$2,182
Repo-Committed: $359
($ in millions)

21
Q2 2017
TBA Dollar Roll (1)
Example:
Specified Agency
MBS Funded with
Repo
Dollar Roll Fund
Advantage
Agency MBS yield / dollar roll
net interest spread 3.05 % 3.05 % —%
Repurchase agreement cost (0.90)% (1.25)% 0.35%
2.15 % 1.80 % 0.35%
Interest rate swap cost (0.73)% (0.73)% —%
Net interest spread 1.42 % 1.07 % 0.35%
TBA Dollar Roll Funding Advantage
(1) Based on drop income of $1,351 on average TBA securities balance on an if-settled basis of $259,842.

22
Interest Rate Swaps-Payers,
Net of Receivers
Total Weighted Average Pay Rate, Net
$3,000
$2,500
$2,000
$1,500
$1,000
$500
$0
N
ot
io
na
l(
$
in
m
ill
io
ns
)
5.0%
4.0%
3.0%
2.0%
1.0%
0.0%
Re
m
ai
nd
er
of
20
17
20
18
20
19
20
20
20
21
20
22
20
23
20
24
20
25
20
26
$2,870
$2,623
$2,019
$1,660
$1,460
$1,078 $1,075 $1,075
$695
$466
1.41%
1.79% 1.93%
2.12%
2.21% 2.43%
2.45% 2.47% 2.43% 2.35%
Hedging Details
As of June 30, 2017

23
Risk Position
Treasury
Yields (1)
As of June 30,
2017 As of March 31, 2017
2Y 1.38% 1.26%
5Y 1.89% 1.92%
10Y 2.31% 2.39%
30Y 2.84% 3.01%
Parallel Change in
Treasury Yields
(bps)
Percentage Change in Projected Market Value of
Assets, Net of Hedges (2)
As of June 30, 2017 As of March 31, 2017
+100 (0.49)% (0.34)%
+50 (0.19)% (0.14)%
-50 0.06% 0.03%
Parallel Change in
Market Credit
Spreads
Percentage Change in Projected Market Value of Assets
As of June 30, 2017 As of March 31, 2017
+50 (1.99)% (2.26)%
+25 (1.00)% (1.14)%
-25 1.01% 1.15%
-50 2.03% 2.32%
(1)Treasury yields source: Bloomberg
(2) Source: Company models based on modeled option adjusted duration. Includes changes in market value of our investments and derivative instruments, including TBA
securities, but excludes changes in market value of our financings because they are not carried at fair value on our balance sheet. The projections for market value do not
assume any change in credit spreads.
Curve Shift
2 year Treasury
(bps)
Curve Shift
10 year Treasury
(bps)
Percentage Change in Projected Market Value of Assets, Net of Hedges (2)
As of June 30, 2017 As of March 31, 2017
0 -25 —% (0.15)%
-10 -50 —% (0.26)%
+25 +50 (0.14)% 0.07%
+50 +100 (0.38)% 0.07%
+25 +0 (0.06)% (0.23)%
+50 +25 (0.14)% (0.28)%
24
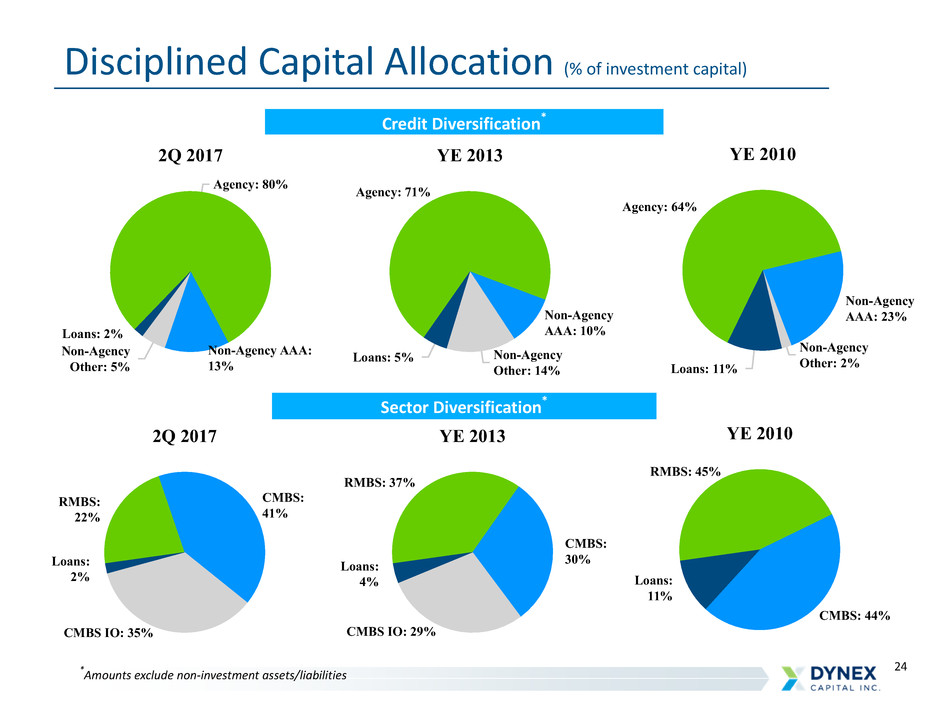
YE 2010
Agency: 64%
Non-Agency
AAA: 23%
Non-Agency
Other: 2%Loans: 11%
YE 2013
Agency: 71%
Non-Agency
AAA: 10%
Non-Agency
Other: 14%
Loans: 5%
YE 2010
RMBS: 45%
CMBS: 44%
Loans:
11%
2Q 2017
Agency: 80%
Non-Agency AAA:
13%
Non-Agency
Other: 5%
Loans: 2%
2Q 2017
RMBS:
22%
CMBS:
41%
CMBS IO: 35%
Loans:
2%
YE 2013
RMBS: 37%
CMBS:
30%
CMBS IO: 29%
Loans:
4%
Credit Diversification*
Sector Diversification*
Disciplined Capital Allocation (% of investment capital)
*Amounts exclude non-investment assets/liabilities

25
CMBS
(as of June 30, 2017)
AAA: 97%
AA: 1%A: 1%
Below A/NR: 0%
$1,200
$1,000
$800
$600
$400
$200
$0
Fa
ir
Va
lu
e
Prio
r to
200
9
200
9-20
12
201
3-20
14
201
5-20
16 201
7
$47
$164
$22
$914
$214
Vintage
CMBS IO
(as of June 30, 2017)
Vintage
AAA: 92%
AA: 7%
Below A/NR: 1%
$250
$200
$150
$100
$50
$0
Fa
ir
Va
lu
e
2010 2011 2012 2013 2014 2015 2016 2017
$8
$32
$86
$118
$191 $189
$88
$52
By Year of Origination By Year of Origination
($ in millions)
Credit QualityCredit Quality
26
($ in millions)
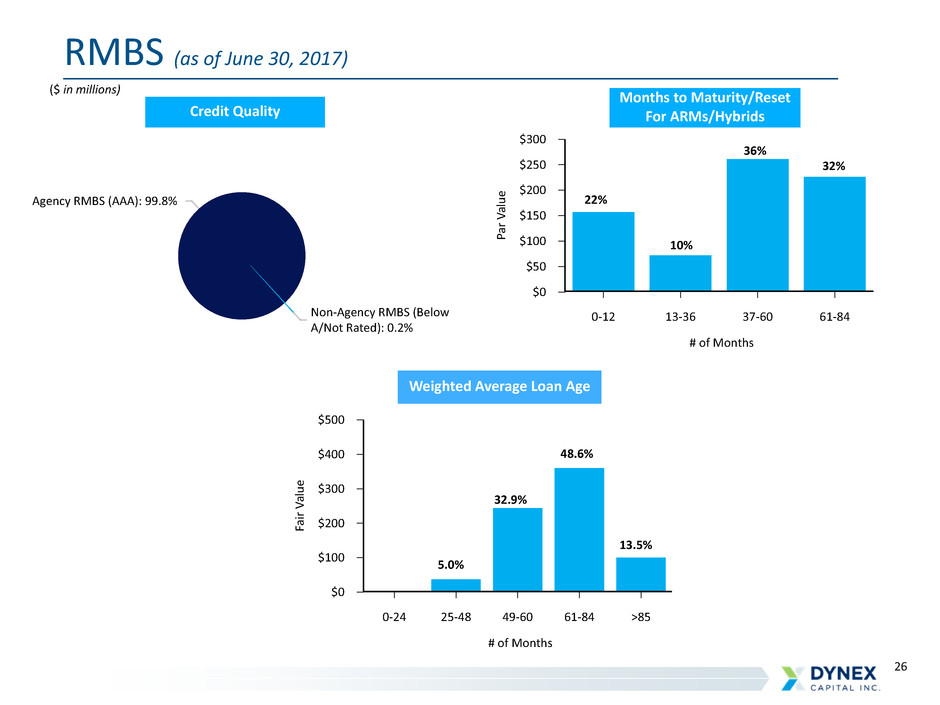
RMBS (as of June 30, 2017)
Credit Quality
Months to Maturity/Reset
For ARMs/Hybrids
Weighted Average Loan Age
Agency RMBS (AAA): 99.8%
Non-Agency RMBS (Below
A/Not Rated): 0.2%
$300
$250
$200
$150
$100
$50
$0
Pa
rV
al
ue
0-12 13-36 37-60 61-84
# of Months
$500
$400
$300
$200
$100
$0
Fa
ir
Va
lu
e
0-24 25-48 49-60 61-84 >85
# of Months
5.0%
32.9%
48.6%
13.5%
22%
10%
36%
32%

27
Financial Performance - Comparative Quarters
(1) Net periodic interest costs and change in fair value of derivatives are components of "gain (loss) on derivative instruments, net" reported in the
comprehensive income statement.
(2) Reconciliations for non-GAAP measures are presented in the Appendix.
2Q2017 1Q2017
($ in thousands, except per share amounts)
Income
(Expense)
Per Common
Share
Income
(Expense)
Per Common
Share
Interest income $24,856 $0.51 $22,419 0.45
Interest expense 8,714 0.18 7,519 0.15
GAAP net interest income 16,142 0.33 14,900 0.30
Add: drop income 1,351 0.03
Plus: net periodic interest costs (1) (1,352) (0.03) (615) (0.01)
Less: accretion of de-designated hedges (73) — (99) —
Adjusted net interest income (2) 16,068 0.33 14,186 0.29
Other income, net 4 — (46) —
G & A expenses (4,097) (0.08) (4,280) (0.09)
Preferred stock dividends (2,641) (0.06) (2,435) (0.05)
Core net operating income to common shareholders (2) 9,334 0.19 7,425 0.15
Change in fair value of derivatives (1) (15,801) (0.32) 790 0.02
Realized loss on sale of investments, net (3,709) (0.07) (1,708) (0.04)
Accretion of de-designated hedges 73 — 99 —
Fair value adjustments, net 30 — 10 —
GAAP net (loss) income to common shareholders (10,073) (0.20) 6,616 0.13
Unrealized gain on MBS 12,448 0.25 20,076 0.41
Accretion of de-designated hedges (73) — (99) —
Total comprehensive income $2,302 $0.05 $26,593 $0.54
28
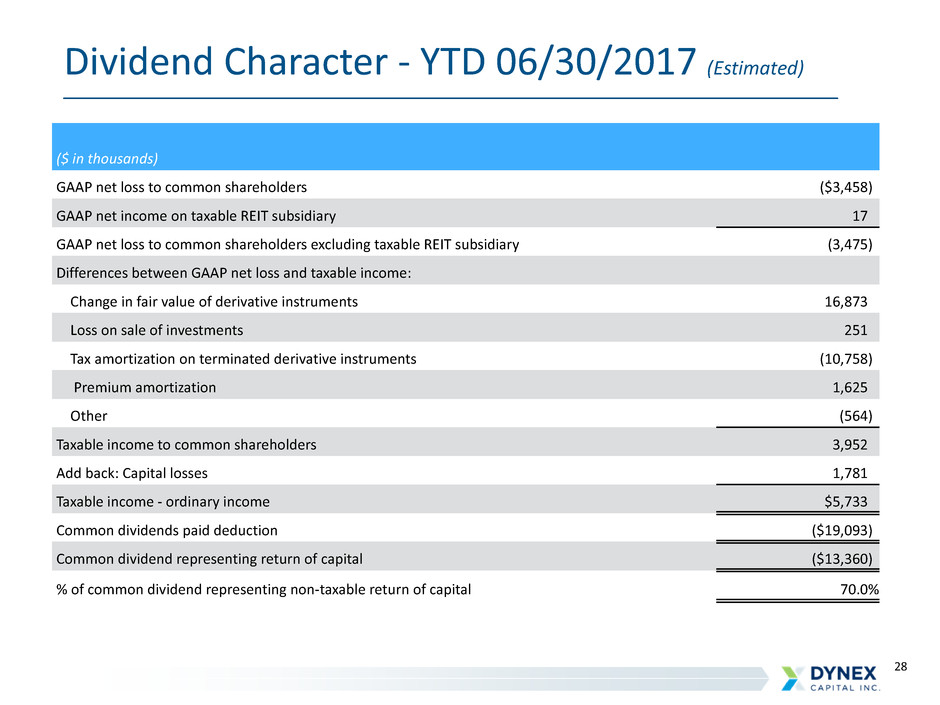
Dividend Character - YTD 06/30/2017 (Estimated)
($ in thousands)
GAAP net loss to common shareholders ($3,458)
GAAP net income on taxable REIT subsidiary 17
GAAP net loss to common shareholders excluding taxable REIT subsidiary (3,475)
Differences between GAAP net loss and taxable income:
Change in fair value of derivative instruments 16,873
Loss on sale of investments 251
Tax amortization on terminated derivative instruments (10,758)
Premium amortization 1,625
Other (564)
Taxable income to common shareholders 3,952
Add back: Capital losses 1,781
Taxable income - ordinary income $5,733
Common dividends paid deduction ($19,093)
Common dividend representing return of capital ($13,360)
% of common dividend representing non-taxable return of capital 70.0%

29
Reconciliation of GAAP Measures to Non-GAAP Measures
Quarter Ended
6/30/17 3/31/17 12/31/16 9/30/16 06/30/16
GAAP net interest income $16,142 $14,900 $16,105 $15,067 $16,716
Add: TBA drop income 1,351 — — — —
Add: net periodic interest costs (3) (1,352) (615) (140) (155) (486)
Less: de-designated hedge accretion (1) (73) (99) (99) (99) (80)
Non-GAAP adjusted net interest income $16,068 $14,186 $15,866 $14,813 $16,150
GAAP interest expense $8,714 $7,519 $6,753 $6,068 $6,100
Add: net periodic interest costs (3) 1,352 615 140 155 486
Less: de-designated hedge accretion (1) 73 99 99 99 80
Non-GAAP adjusted interest expense $10,139 $8,233 $6,992 $6,322 $6,666
(1) Amount recorded as a portion of "interest expense" in accordance with GAAP related to the accretion of the balance remaining in accumulated other comprehensive income as
a result of the Company's discontinuation of hedge accounting effective June 30, 2013.
(2) Amount represents net realized and unrealized gains and losses on derivatives and excludes net periodic interest costs related to these instruments.
(3) Amount represents net periodic interest costs on effective interest rate swaps outstanding during the period and exclude termination costs and changes in fair value.
($ in thousands except per share data)
Quarter Ended
6/30/17 3/31/17 12/31/16 9/30/16 06/30/16
GAAP net (loss) income to common shareholders ($10,073) $6,616 $66,758 $12,406 ($5,525)
Adjustments:
Accretion of de-designated cash flow hedges (1) (73) (99) (99) (99) (80)
Change in fair value of derivatives instruments, net (2) 15,801 (790) (56,686) (2,564) 15,811
Loss on sale of investments, net 3,709 1,708 — — 297
Fair value adjustments, net (30) (10) (17) (34) (28)
Core net operating income to common shareholders $9,334 $7,425 $9,956 $9,709 $10,475
Core net operating income per common share $0.19 $0.15 $0.20 $0.20 $0.21

30
MREIT Glossary of Terms
Commercial Mortgage-Backed Securities (CMBS) are a type of mortgage-backed security that is secured by the
loan on a commercial property.
Credit Risk is the risk of loss of principal stemming from a borrower’s failure to repay a loan.
Curve Twist Terms:
Bull Flattener: If the yield curve is exhibiting bull flattener behavior, the spread between the long-term
rate and the short-term rate is getting smaller because long-term rates are decreasing as short-term
rates are increasing. This could occur as more investors choose long-term bonds relative to short-term
bonds, which drives long-term bond prices up and reduces yields.
Bear Flattener: A yield-rate environment in which short-term interest rates are increasing at a faster rate
than long-term interest rates. This causes the yield curve to flatten as short-term and long-term rates
start to converge.
Bear Steepener: Widening of the yield curve caused by long-term rates increasing at a faster rate than
short-term rates. This causes a larger spread between the two rates as the long-term rate moves
further away from the short-term rate.
Bull Steepener: A change in the yield curve caused by short-term rates falling faster than long-term rates,
resulting in a higher spread between the two rates.
Duration is a measure of the sensitivity of the price of a fixed-income investment to a change in interest rates.
Duration is expressed as a number of years.
Interest Only Securities (IOs) are the interest only strips of mortgage, Treasury, or bond payments, which are
separated and sold individually from the principal portions.

31
MREIT Glossary of Terms
Interest Rate Risk is the risk that an investment’s value will change due to a change in the absolute level of
interest rates, in the spread between two rates, in the shape of the yield curve or in any other interest rate
relationship.
Leverage is the use of borrowed money to finance assets.
Prepayment Risk is the risk associated with the early unscheduled return of principal.
Repurchase Agreements are a short-term borrowing that uses loans or securities as collateral. The lender
advances only a percentage of the value of the asset (the advance rate). The inverse of the advance rate is the
equity contribution of the borrower (the haircut).
Residential Mortgage-Backed Securities (RMBS) are a type of mortgage-backed debt obligation whose cash
flows come from residential debt, such as mortgages, home-equity loans and subprime mortgages.
Spread Risk is the uncertainty in pricing resulting from the expansion and contraction of the risk premium over
the benchmark or the risk of how the spread of a security will react over the benchmarked security. treasury
curve.
TBA Securities are forward contracts for the purchase or sale of 15-year and 30-year generic Agency RMBS.

