Attached files
| file | filename |
|---|---|
| EX-12.1 - EXHIBIT 12.1 - DYNEX CAPITAL INC | a1q17form10-qexx121ratioof.htm |
| EX-32.1 - EXHIBIT 32.1 - DYNEX CAPITAL INC | a1q17form10-qexx321soxcert.htm |
| EX-31.2 - EXHIBIT 31.2 - DYNEX CAPITAL INC | a1q17form10-qexx312cfocert.htm |
| EX-31.1 - EXHIBIT 31.1 - DYNEX CAPITAL INC | a1q17form10-qexx311ceocert.htm |
UNITED STATES
SECURITIES AND EXCHANGE COMMISSION
Washington, DC 20549
FORM 10-Q
x | Quarterly Report Pursuant to Section 13 or 15(d) of the Securities Exchange Act of 1934 |
For the quarterly period ended March 31, 2017
or
o | Transition Report Pursuant to Section 13 or 15(d) of the Securities Exchange Act of 1934 |
Commission File Number: 1-9819
DYNEX CAPITAL, INC.
(Exact name of registrant as specified in its charter)
Virginia | 52-1549373 |
(State or other jurisdiction of | (I.R.S. Employer |
incorporation or organization) | Identification No.) |
4991 Lake Brook Drive, Suite 100, Glen Allen, Virginia | 23060-9245 |
(Address of principal executive offices) | (Zip Code) |
(804) 217-5800 (Registrant’s telephone number, including area code) | |
Indicate by check mark whether the registrant (1) has filed all reports required to be filed by Section 13 or 15(d) of the Securities Exchange Act of 1934 during the preceding 12 months (or for such shorter period that the registrant was required to file such reports), and (2) has been subject to such filing requirements for the past 90 days.
Yes x No o
Indicate by check mark whether the registrant has submitted electronically and posted on its corporate Web site, if any, every Interactive Data File required to be submitted and posted pursuant to Rule 405 of Regulation S-T (§232.405 of this chapter) during the preceding 12 months (or for such shorter period that the registrant was required to submit and post such files).
Yes x No o
Indicate by check mark whether the registrant is a large accelerated filer, an accelerated filer, a non-accelerated filer, or a smaller reporting company. See the definitions of “large accelerated filer,” “accelerated filer” and “smaller reporting company” in Rule 12b-2 of the Exchange Act.
Large accelerated filer | o | Accelerated filer | x |
Non-accelerated filer | o (Do not check if a smaller reporting company) | Smaller reporting company | o |
Emerging growth company | o | ||
If an emerging growth company, indicate by check mark if the registrant has elected not to use the extended transition period for complying with any new or revised financial accounting standards provided pursuant to Section 13(a) of the Exchange Act. o
Indicate by check mark whether the registrant is a shell company (as defined in Rule 12b-2 of the Exchange Act).
Yes o No x
On April 28, 2017, the registrant had 49,204,773 shares outstanding of common stock, $0.01 par value, which is the registrant’s only class of common stock.
DYNEX CAPITAL, INC.
FORM 10-Q
INDEX
Page | |||
Consolidated Balance Sheets as of March 31, 2017 (unaudited) and December 31, 2016 | |||
Consolidated Statements of Comprehensive Income for the three months ended March 31, 2017 (unaudited) and March 31, 2016 (unaudited) | |||
Consolidated Statement of Shareholders' Equity for the three months ended March 31, 2017 (unaudited) | |||
Consolidated Statements of Cash Flows for the three months ended March 31, 2017 (unaudited) and March 31, 2016 (unaudited) | |||
i
PART I. FINANCIAL INFORMATION
ITEM 1. FINANCIAL STATEMENTS
DYNEX CAPITAL, INC.
CONSOLIDATED BALANCE SHEETS
(amounts in thousands except share data)
March 31, 2017 | December 31, 2016 | ||||||
ASSETS | (unaudited) | ||||||
Mortgage-backed securities (including pledged of $3,070,435 and $3,150,610, respectively) | $ | 3,186,749 | $ | 3,212,084 | |||
Mortgage loans held for investment, net | 18,183 | 19,036 | |||||
Cash and cash equivalents | 65,943 | 74,120 | |||||
Restricted cash | 34,822 | 24,769 | |||||
Derivative assets | 272 | 28,534 | |||||
Principal receivable on investments | 4,558 | 11,978 | |||||
Accrued interest receivable | 22,849 | 20,396 | |||||
Other assets, net | 6,498 | 6,814 | |||||
Total assets | $ | 3,339,874 | $ | 3,397,731 | |||
LIABILITIES AND SHAREHOLDERS’ EQUITY | |||||||
Liabilities: | |||||||
Repurchase agreements | $ | 2,825,945 | $ | 2,898,952 | |||
Non-recourse collateralized financing | 6,075 | 6,440 | |||||
Derivative liabilities | 58 | 6,922 | |||||
Accrued interest payable | 2,628 | 3,156 | |||||
Accrued dividends payable | 10,934 | 12,268 | |||||
Other liabilities | 1,712 | 2,809 | |||||
Total liabilities | 2,847,352 | 2,930,547 | |||||
Shareholders’ equity: | |||||||
Preferred stock, par value $.01 per share; 50,000,000 shares authorized; 4,897,138 and 4,571,937 shares issued and outstanding, respectively ($122,428 and $114,298 aggregate liquidation preference, respectively) | $ | 117,473 | $ | 110,005 | |||
Common stock, par value $.01 per share, 200,000,000 shares authorized; 49,203,022 and 49,153,463 shares issued and outstanding, respectively | 492 | 492 | |||||
Additional paid-in capital | 727,503 | 727,369 | |||||
Accumulated other comprehensive loss | (12,632 | ) | (32,609 | ) | |||
Accumulated deficit | (340,314 | ) | (338,073 | ) | |||
Total shareholders' equity | 492,522 | 467,184 | |||||
Total liabilities and shareholders’ equity | $ | 3,339,874 | $ | 3,397,731 | |||
See notes to the unaudited consolidated financial statements.
1
DYNEX CAPITAL, INC.
CONSOLIDATED STATEMENTS OF COMPREHENSIVE INCOME
(UNAUDITED)
(amounts in thousands except per share data)
Three Months Ended | |||||||
March 31, | |||||||
2017 | 2016 | ||||||
Interest income | $ | 22,419 | 25,089 | ||||
Interest expense | 7,519 | 6,310 | |||||
Net interest income | 14,900 | 18,779 | |||||
Gain (loss) on derivative instruments, net | 175 | (48,264 | ) | ||||
Loss on sale of investments, net | (1,708 | ) | (3,941 | ) | |||
Fair value adjustments, net | 10 | 24 | |||||
Other (expense) income, net | (46 | ) | 63 | ||||
General and administrative expenses: | |||||||
Compensation and benefits | (2,245 | ) | (2,219 | ) | |||
Other general and administrative | (2,035 | ) | (1,873 | ) | |||
Net income (loss) | 9,051 | (37,431 | ) | ||||
Preferred stock dividends | (2,435 | ) | (2,294 | ) | |||
Net income (loss) to common shareholders | $ | 6,616 | $ | (39,725 | ) | ||
Other comprehensive income: | |||||||
Unrealized gain on available-for-sale investments, net | $ | 18,368 | $ | 37,760 | |||
Reclassification adjustment for loss on sale of investments, net | 1,708 | 3,941 | |||||
Reclassification adjustment for de-designated cash flow hedges | (99 | ) | 27 | ||||
Total other comprehensive income | 19,977 | 41,728 | |||||
Comprehensive income to common shareholders | $ | 26,593 | $ | 2,003 | |||
Net income (loss) per common share-basic and diluted | $ | 0.13 | $ | (0.81 | ) | ||
Weighted average common shares-basic and diluted | 49,176 | 49,041 | |||||
See notes to the unaudited consolidated financial statements.
2
DYNEX CAPITAL, INC.
CONSOLIDATED STATEMENT OF SHAREHOLDERS’ EQUITY
(UNAUDITED)
($ in thousands)
Preferred Stock | Common Stock | Additional Paid-in Capital | Accumulated Other Comprehensive (Loss) Income | Accumulated Deficit | Total Shareholders' Equity | ||||||||||||||||||||||
Shares | Amount | Shares | Amount | ||||||||||||||||||||||||
Balance as of December 31, 2016 | 4,571,937 | $ | 110,005 | 49,153,463 | $ | 492 | $ | 727,369 | $ | (32,609 | ) | $ | (338,073 | ) | $ | 467,184 | |||||||||||
Stock issuance | 325,201 | 7,504 | 18,680 | — | 127 | — | — | 7,631 | |||||||||||||||||||
Restricted stock granted, net of amortization | — | — | 108,446 | 1 | 536 | — | — | 537 | |||||||||||||||||||
Adjustments for tax withholding on share-based compensation | — | — | (77,567 | ) | (1 | ) | (520 | ) | — | — | (521 | ) | |||||||||||||||
Stock issuance costs | — | (36 | ) | — | — | (9 | ) | — | — | (45 | ) | ||||||||||||||||
Net income | — | — | — | — | — | — | 9,051 | 9,051 | |||||||||||||||||||
Dividends on preferred stock | — | — | — | — | — | — | (2,435 | ) | (2,435 | ) | |||||||||||||||||
Dividends on common stock | — | — | — | — | — | — | (8,857 | ) | (8,857 | ) | |||||||||||||||||
Other comprehensive income | — | — | — | — | — | 19,977 | — | 19,977 | |||||||||||||||||||
Balance as of March 31, 2017 | 4,897,138 | $ | 117,473 | 49,203,022 | $ | 492 | $ | 727,503 | $ | (12,632 | ) | $ | (340,314 | ) | $ | 492,522 | |||||||||||
3
DYNEX CAPITAL, INC.
CONSOLIDATED STATEMENTS OF CASH FLOWS
(UNAUDITED)
($ in thousands)
Three Months Ended | |||||||
March 31, | |||||||
2017 | 2016 | ||||||
Operating activities: | |||||||
Net income (loss) | $ | 9,051 | $ | (37,431 | ) | ||
Adjustments to reconcile net income (loss) to cash provided by operating activities: | |||||||
(Increase) decrease in accrued interest receivable | (2,453 | ) | 613 | ||||
(Decrease) increase in accrued interest payable | (528 | ) | 500 | ||||
(Gain) loss on derivative instruments, net | (175 | ) | 48,264 | ||||
Loss on sale of investments, net | 1,708 | 3,941 | |||||
Fair value adjustments, net | (10 | ) | (24 | ) | |||
Amortization of investment premiums, net | 39,862 | 37,547 | |||||
Other amortization and depreciation, net | 325 | 477 | |||||
Stock-based compensation expense | 538 | 829 | |||||
Decrease in other assets and liabilities, net | (1,210 | ) | (1,112 | ) | |||
Net cash and cash equivalents provided by operating activities | 47,108 | 53,604 | |||||
Investing activities: | |||||||
Purchase of investments | (141,436 | ) | (4,970 | ) | |||
Principal payments received on investments | 95,546 | 92,420 | |||||
Proceeds from sales of investments | 57,173 | 77,530 | |||||
Principal payments received on mortgage loans held for investment, net | 987 | 899 | |||||
Distributions received from limited partnership | — | 10,737 | |||||
Net payments on derivatives, including terminations | 21,573 | (5,992 | ) | ||||
Other investing activities | (146 | ) | (38 | ) | |||
Net cash and cash equivalents provided by investing activities | 33,697 | 170,586 | |||||
Financing activities: | |||||||
Borrowings under repurchase agreements | 21,748,733 | 5,403,089 | |||||
Repayments of repurchase agreement borrowings and FHLB advances | (21,821,740 | ) | (5,527,490 | ) | |||
Principal payments on non-recourse collateralized financing | (370 | ) | (305 | ) | |||
Increase in restricted cash | (10,053 | ) | (35,674 | ) | |||
Proceeds from issuance of preferred stock | 7,504 | — | |||||
Proceeds from issuance of common stock | 127 | 56 | |||||
Cash paid for stock issuance costs | (36 | ) | — | ||||
Cash paid for repurchases of common stock | — | (310 | ) | ||||
Payments related to tax withholding for stock-based compensation | (521 | ) | (485 | ) | |||
Dividends paid | (12,626 | ) | (14,066 | ) | |||
Net cash and cash equivalents used in financing activities | (88,982 | ) | (175,185 | ) | |||
Net increase in cash and cash equivalents | (8,177 | ) | 49,005 | ||||
Cash and cash equivalents at beginning of period | 74,120 | 33,935 | |||||
Cash and cash equivalents at end of period | $ | 65,943 | $ | 82,940 | |||
Supplemental Disclosure of Cash Activity: | |||||||
Cash paid for interest | $ | 8,141 | $ | 5,781 | |||
See notes to the unaudited consolidated financial statements.
4
NOTES TO THE UNAUDITED CONSOLIDATED FINANCIAL STATEMENTS
DYNEX CAPITAL, INC.
(amounts in thousands except share data)
NOTE 1 –ORGANIZATION AND SUMMARY OF SIGNIFICANT ACCOUNTING POLICIES
Organization
Dynex Capital, Inc., ("Company") was incorporated in the Commonwealth of Virginia on December 18, 1987 and commenced operations in February 1988. The Company primarily earns income from investing on a leveraged basis in mortgage-backed securities ("MBS") that are issued or guaranteed by the U.S. Government or U.S. Government sponsored agencies ("Agency MBS") and MBS issued by others ("non-Agency MBS").
Basis of Presentation
The accompanying unaudited consolidated financial statements of Dynex Capital, Inc. and its subsidiaries (together, “Dynex” or, as appropriate, the “Company”) have been prepared in accordance with accounting principles generally accepted in the United States of America (“GAAP”) for interim financial information and with the instructions to the Quarterly Report on Form 10-Q and Article 10, Rule 10-01 of Regulation S-X promulgated by the Securities and Exchange Commission (the “SEC”). Accordingly, they do not include all of the information and notes required by GAAP for complete financial statements. In the opinion of management, all significant adjustments, consisting of normal recurring accruals, considered necessary for a fair presentation of the consolidated financial statements have been included. Operating results for the three months ended March 31, 2017 are not necessarily indicative of the results that may be expected for any other interim periods or for the entire year ending December 31, 2017. The unaudited consolidated financial statements included herein should be read in conjunction with the audited financial statements and notes thereto included in the Company’s Annual Report on Form 10-K for the year ended December 31, 2016 filed with the SEC.
Reclassifications
Certain items in the prior periods' consolidated financial statements have been reclassified to conform to the current period's presentation. The Company has reclassified amortization of stock issuance costs which was previously recorded in "proceeds from issuance of common stock, net of issuance costs" in the financing activities section of the Company's consolidated statements of cash flows for three months ended March 31, 2016. Amortization of stock issuance costs is now presented within "other operating activities" in the operating activities section of the Company's consolidated statements of cash flows. This presentation change had no effect on reported financial condition or results of operations and did not have a material impact on cash flows from operating or financing activities.
Consolidation
The consolidated financial statements include the accounts of the Company and the accounts of its majority owned subsidiaries and variable interest entities ("VIE") for which it is the primary beneficiary. As a primary beneficiary, the Company has both the power to direct the activities that most significantly impact the economic performance of the VIE and a right to receive benefits or absorb losses of the entity that could be potentially significant to the VIE. The Company is required to reconsider its evaluation of whether to consolidate a VIE each reporting period, based upon changes in the facts and circumstances pertaining to the VIE. The Company consolidates certain trusts through which it has securitized mortgage loans as a result of not meeting the sale criteria under GAAP at the time the financial assets were transferred to the trust. All intercompany accounts and transactions have been eliminated in consolidation.
Use of Estimates
The preparation of financial statements in conformity with GAAP requires management to make estimates and assumptions that affect the reported amounts of assets and liabilities and the disclosure of contingent assets and liabilities at the date of the financial statements as well as the reported amounts of revenue and expenses during the reported period. Actual results could differ from those estimates. The most significant estimates used by management include, but are not limited to, amortization of premiums and discounts, fair value measurements of its investments, and other-than-temporary impairments. These items are discussed further below within this note to the consolidated financial statements.
5
NOTES TO THE UNAUDITED CONSOLIDATED FINANCIAL STATEMENTS
DYNEX CAPITAL, INC.
(amounts in thousands except share data)
Income Taxes
The Company has elected to be taxed as a real estate investment trust ("REIT") under the Internal Revenue Code of 1986 and the corresponding provisions of state law. To qualify as a REIT, the Company must meet certain tests including investing in primarily real estate-related assets and the required distribution of at least 90% of its annual REIT taxable income to stockholders after consideration of its net operating loss ("NOL") carryforward and not including taxable income retained in its taxable subsidiaries. As a REIT, the Company generally will not be subject to federal income tax on the amount of its income or capital gains that is distributed as dividends to shareholders.
The Company assesses its tax positions for all open tax years and determines whether the Company has any material unrecognized liabilities in accordance with Accounting Standards Codification ("ASC") Topic 740. The Company records these liabilities, if any, to the extent they are deemed more likely than not to have been incurred.
Net Income (Loss) Per Common Share
The Company calculates basic net income (loss) per common share by dividing net income (loss) to common shareholders for the period by weighted-average shares of common stock outstanding for that period. The Company did not have any potentially dilutive securities outstanding during the three months ended March 31, 2017 or March 31, 2016.
Holders of unvested shares of the Company's issued and outstanding restricted common stock are eligible to receive non-forfeitable dividends. As such, these unvested shares are considered participating securities as per ASC Topic 260-10 and therefore are included in the computation of basic net income (loss) per common share using the two-class method. Upon vesting, restrictions on transfer expire on each share of restricted stock, and each such share of restricted stock represents one unrestricted share of common stock.
Because the Company's 8.50% Series A Cumulative Redeemable Preferred Stock (the “Series A Preferred Stock”) and 7.625% Series B Cumulative Redeemable Preferred Stock (the “Series B Preferred Stock”) are redeemable at the Company's option for cash only and may convert into shares of common stock only upon a change of control of the Company, the effect of those shares and their related dividends is excluded from the calculation of diluted net income (loss) per common share.
Cash and Cash Equivalents
Cash and cash equivalents include cash on hand and highly liquid investments with original maturities of three months or less.
Restricted Cash
Restricted cash consists of cash the Company has pledged to cover initial and variation margin with its financing and derivative counterparties.
Mortgage-Backed Securities
The Company invests in Agency and non-Agency RMBS, CMBS and CMBS IO securities, all of which are designated as available-for-sale ("AFS"). All of the Company’s MBS are recorded at fair value on the consolidated balance sheet. Changes in unrealized gain (loss) on the Company's MBS are reported in other comprehensive income ("OCI") until each security is collected, disposed of, or determined to be other than temporarily impaired. Although the Company generally intends to hold its AFS securities until maturity, it may sell any of these securities as part of the overall management of its business. Upon the sale of an AFS security, any unrealized gain or loss is reclassified out of accumulated other comprehensive income ("AOCI") into net income as a realized "gain (loss) on sale of investments, net" using the specific identification method.
The Company’s MBS pledged as collateral against repurchase agreements and derivative instruments are included in MBS on the consolidated balance sheets with the fair value of the MBS pledged disclosed parenthetically.
6
NOTES TO THE UNAUDITED CONSOLIDATED FINANCIAL STATEMENTS
DYNEX CAPITAL, INC.
(amounts in thousands except share data)
Interest Income, Premium Amortization, and Discount Accretion. Interest income on MBS is accrued based on the outstanding principal balance (or notional balance in the case of interest-only, or "IO", securities) and their contractual terms. Premiums and discounts on Agency MBS as well as any non-Agency MBS rated 'AA' and higher at the time of purchase are amortized into interest income over the expected life of such securities using the effective yield method and adjustments to premium amortization are made for actual cash payments as well as changes in projected future cash payments. The Company's projections of future cash payments are based on input and analysis received from external sources and internal models, and include assumptions about the amount and timing of loan prepayment rates, fluctuations in interest rates, credit losses, and other factors. On at least a quarterly basis, the Company reviews and makes any necessary adjustments to its cash flow projections and updates the yield recognized on these assets.
The Company holds certain non-Agency MBS that had credit ratings of less than 'AA' at the time of purchase or were not rated by any of the nationally recognized credit rating agencies. A portion of these non-Agency MBS were purchased at discounts to their par value, which management does not believe to be substantial. The discount is accreted into income over the security's expected life, which reflects management's estimate of the security's projected cash flows. Future changes in the timing of projected cash flows or differences arising between projected cash flows and actual cash flows received may result in a prospective change in the effective yield on those securities.
Determination of MBS Fair Value. The Company estimates the fair value of the majority of its MBS based upon prices obtained from third-party pricing services and broker quotes. The remainder of the Company's MBS are valued by discounting the estimated future cash flows derived from cash flow models that utilize information such as the security's coupon rate, estimated prepayment speeds, expected weighted average life, collateral composition, estimated future interest rates, expected losses, and credit enhancements as well as certain other relevant information. Refer to Note 5 for further discussion of MBS fair value measurements.
Other-than-Temporary Impairment. MBS is considered impaired when its fair value is less than its amortized cost. The Company evaluates all of its impaired MBS for other-than-temporary impairments ("OTTI") on at least a quarterly basis. An impairment is considered other-than-temporary if: (1) the Company intends to sell the MBS; (2) it is more likely than not that the Company will be required to sell the MBS before its fair value recovers; or (3) the Company does not expect to recover the full amortized cost basis of the MBS. If either of the first two conditions is met, the entire amount of the impairment is recognized in earnings. If the impairment is solely due to the inability to fully recover the amortized cost basis, the security is further analyzed to quantify any credit loss, which is the difference between the present value of cash flows expected to be collected on the MBS and its amortized cost. The credit loss, if any, is then recognized in earnings, while the balance of impairment related to other factors is recognized in other comprehensive income.
Following the recognition of an OTTI through earnings, a new cost basis is established for the security. Any subsequent recoveries in fair value may be accreted back into the amortized cost basis of the MBS on a prospective basis through interest income. Please see Note 2 for additional information related to the Company's evaluation for OTTI.
Repurchase Agreements
The Company's repurchase agreements, which are used to finance its purchases of MBS, are accounted for as secured borrowings under which the Company pledges its securities as collateral to secure a loan, which is equal in value to a specified percentage of the estimated fair value of the pledged collateral. The Company retains beneficial ownership of the pledged collateral. At the maturity of a repurchase agreement, the Company is required to repay the loan and concurrently receives back its pledged collateral from the lender or, with the consent of the lender, the Company may renew the agreement at the then prevailing financing rate. A repurchase agreement lender may require the Company to pledge additional collateral in the event of a decline in the fair value of the collateral pledged. Repurchase agreement financing is recourse to the Company and the assets pledged. Most of the Company’s repurchase agreements are based on the September 1996 version of the Bond Market Association Master Repurchase Agreement, which generally provides that the lender, as buyer, is responsible for obtaining collateral valuations from a generally recognized source agreed to by both the Company and the lender, or, in an instance when such source is not available, the value determination is made by the lender.
7
NOTES TO THE UNAUDITED CONSOLIDATED FINANCIAL STATEMENTS
DYNEX CAPITAL, INC.
(amounts in thousands except share data)
Derivative Instruments
The Company's derivative instruments are accounted for at the fair value of their unit of account. Derivative instruments in a gain position are reported as derivative assets and derivative instruments in a loss position are reported as derivative liabilities on the Company's consolidated balance sheet. All periodic interest costs and changes in fair value of derivative instruments, including gains and losses realized upon termination or maturity, are recorded in "gain (loss) on derivative instruments, net" on the Company's consolidated statement of comprehensive income. Cash receipts and payments related to derivative instruments are classified in the investing activities section of our consolidated statements of cash flows in accordance with the underlying nature or purpose of the derivative transactions.
The majority of the Company's interest rate swaps are centrally cleared through the Chicago Mercantile Exchange ("CME") with the rest being subject to bilateral agreements between the Company and the swap counterparty. The Company's CME cleared swaps require that the Company post initial margin as determined by the CME, and in addition, variation margin is exchanged, typically in cash, for changes in the fair value of the CME cleared swaps. Beginning in January 2017, as a result of a change in the CME's rulebook, the exchange of variation margin for CME cleared swaps is legally considered to be the settlement of the derivative itself as opposed to a pledge of collateral. Accordingly, beginning in 2017, the Company accounts for the daily exchange of variation margin associated with its CME cleared interest rate swaps as a direct reduction to the carrying value of the related derivative asset or liability. The carrying value of CME cleared interest rate swaps in the Company's consolidated balance sheets is the unsettled fair value of those instruments.
Please refer to Note 4 for additional information regarding the Company's derivative instruments.
Although MBS have characteristics that meet the definition of a derivative instrument, ASC Topic 815 specifically excludes these instruments from its scope because they are accounted for as debt securities under ASC Topic 320.
Share-Based Compensation
Pursuant to the Company’s 2009 Stock and Incentive Plan, the Company may grant share-based compensation to eligible employees, directors or consultants or advisers to the Company, including stock awards, stock options, stock appreciation rights, dividend equivalent rights, performance shares, and restricted stock units. The Company's restricted stock currently issued and outstanding under this plan may be settled only in shares of its common stock, and therefore are treated as equity awards with their fair value measured at the grant date and recognized as compensation cost over the requisite service period with a corresponding credit to shareholders' equity. The requisite service period is the period during which an employee is required to provide service in exchange for an award, which is equivalent to the vesting period specified in the terms of the time-based restricted stock award. None of the Company's restricted stock awards have performance based conditions. The Company does not currently have any share-based compensation issued or outstanding other than restricted stock.
Contingencies
In the normal course of business, there may be various lawsuits, claims, and other contingencies pending against the Company. On a quarterly basis, the Company evaluates whether to establish provisions for estimated losses from those matters. The Company recognizes a liability for a contingent loss when: (a) the underlying causal event has occurred prior to the balance sheet date; (b) it is probable that a loss has been incurred; and (c) there is a reasonable basis for estimating that loss. A liability is not recognized for a contingent loss when it is only possible or remotely possible that a loss has been incurred, however, possible contingent losses shall be disclosed. If the contingent loss (or an additional loss in excess of any accrual) is at least a reasonable possibility and material, then the Company discloses a reasonable estimate of the possible loss or range of loss, if such reasonable estimate can be made. If the Company cannot make a reasonable estimate of the possible material loss, or range of loss, then that fact is disclosed.
8
NOTES TO THE UNAUDITED CONSOLIDATED FINANCIAL STATEMENTS
DYNEX CAPITAL, INC.
(amounts in thousands except share data)
Recent Accounting Pronouncements
The Financial Accounting Standards Board ("FASB") issued Accounting Standards Update ("ASU") No. 2017-08, Receivables-Nonrefundable Fees and Other Costs, which shortens the amortization period for certain callable debt securities held at a premium, requiring the premium to be amortized to the earliest call date. The amendments in this ASU are effective for fiscal years, and interim periods within those fiscal years, beginning after December 15, 2018 and early adoption is permitted. The amendments in this Update should be applied using the modified-retrospective transition approach and will require disclosures for the change in accounting principle. The Company is currently evaluating the impact of this ASU on its consolidated financial statements.
NOTE 2 – MORTGAGE-BACKED SECURITIES
The majority of the Company's MBS are pledged as collateral for the Company's secured borrowings. The following tables present the Company’s MBS by investment type as of the dates indicated:
March 31, 2017 | ||||||||||||||||||||||||||
Par | Net Premium (Discount) | Amortized Cost | Gross Unrealized Gain | Gross Unrealized Loss | Fair Value | WAC (1) | ||||||||||||||||||||
RMBS: | ||||||||||||||||||||||||||
Agency | $ | 1,033,735 | $ | 48,373 | $ | 1,082,108 | $ | 2,914 | $ | (10,343 | ) | $ | 1,074,679 | 3.04 | % | |||||||||||
Non-Agency | 26,442 | (10 | ) | 26,432 | 94 | (36 | ) | 26,490 | 3.85 | % | ||||||||||||||||
1,060,177 | 48,363 | 1,108,540 | 3,008 | (10,379 | ) | 1,101,169 | ||||||||||||||||||||
CMBS: | ||||||||||||||||||||||||||
Agency | 1,243,516 | 13,814 | 1,257,330 | 5,435 | (24,387 | ) | 1,238,378 | 3.10 | % | |||||||||||||||||
Non-Agency | 78,927 | (6,279 | ) | 72,648 | 5,155 | — | 77,803 | 4.71 | % | |||||||||||||||||
1,322,443 | 7,535 | 1,329,978 | 10,590 | (24,387 | ) | 1,316,181 | ||||||||||||||||||||
CMBS IO (2): | ||||||||||||||||||||||||||
Agency | — | 407,346 | 407,346 | 5,822 | (627 | ) | 412,541 | 0.78 | % | |||||||||||||||||
Non-Agency | — | 353,737 | 353,737 | 4,121 | (1,000 | ) | 356,858 | 0.71 | % | |||||||||||||||||
— | 761,083 | 761,083 | 9,943 | (1,627 | ) | 769,399 | ||||||||||||||||||||
Total AFS securities: | $ | 2,382,620 | $ | 816,981 | $ | 3,199,601 | $ | 23,541 | $ | (36,393 | ) | $ | 3,186,749 | |||||||||||||
(1) | The weighted average coupon ("WAC") is the gross interest rate of the pool of mortgages underlying the security weighted by the outstanding principal balance (or by notional balance in the case of an IO security). |
(2) | The notional balance for Agency CMBS IO and non-Agency CMBS IO was $13,680,888 and $11,172,716, respectively, as of March 31, 2017. |
9
NOTES TO THE UNAUDITED CONSOLIDATED FINANCIAL STATEMENTS
DYNEX CAPITAL, INC.
(amounts in thousands except share data)
December 31, 2016 | ||||||||||||||||||||||||||
Par | Net Premium (Discount) | Amortized Cost | Gross Unrealized Gain | Gross Unrealized Loss | Fair Value | WAC (1) | ||||||||||||||||||||
RMBS: | ||||||||||||||||||||||||||
Agency | $ | 1,157,258 | $ | 57,066 | $ | 1,214,324 | $ | 2,832 | $ | (15,951 | ) | $ | 1,201,205 | 3.05 | % | |||||||||||
Non-Agency | 33,572 | (24 | ) | 33,548 | 64 | (50 | ) | 33,562 | 3.58 | % | ||||||||||||||||
1,190,830 | 57,042 | 1,247,872 | 2,896 | (16,001 | ) | 1,234,767 | ||||||||||||||||||||
CMBS: | ||||||||||||||||||||||||||
Agency | 1,152,586 | 13,868 | 1,166,454 | 6,209 | (28,108 | ) | 1,144,555 | 3.12 | % | |||||||||||||||||
Non-Agency | 79,467 | (6,718 | ) | 72,749 | 5,467 | — | 78,216 | 4.72 | % | |||||||||||||||||
1,232,053 | 7,150 | 1,239,203 | 11,676 | (28,108 | ) | 1,222,771 | ||||||||||||||||||||
CMBS IO (2): | ||||||||||||||||||||||||||
Agency | — | 411,737 | 411,737 | 3,523 | (3,362 | ) | 411,898 | 0.67 | % | |||||||||||||||||
Non-Agency | — | 346,155 | 346,155 | 1,548 | (5,055 | ) | 342,648 | 0.61 | % | |||||||||||||||||
— | 757,892 | 757,892 | 5,071 | (8,417 | ) | 754,546 | ||||||||||||||||||||
Total AFS securities: | $ | 2,422,883 | $ | 822,084 | $ | 3,244,967 | $ | 19,643 | $ | (52,526 | ) | $ | 3,212,084 | |||||||||||||
(1) | The WAC is the gross interest rate of the pool of mortgages underlying the security weighted by the outstanding principal balance (or by notional balance in the case of an IO security). |
(2) | The notional balance for the Agency CMBS IO and non-Agency CMBS IO was $13,106,912 and $10,884,964, respectively, as of December 31, 2016. |
Actual maturities of MBS are affected by the contractual lives of the underlying mortgage collateral, periodic payments of principal, prepayments of principal, and the payment priority structure of the security; therefore, actual maturities are generally shorter than the securities' stated contractual maturities.
The following table presents information regarding the sales included in "loss on sale of investments, net" on the Company's consolidated statements of comprehensive income for the periods indicated:
Three Months Ended | |||||||||||||||
March 31, | |||||||||||||||
2017 | 2016 | ||||||||||||||
Proceeds Received | Realized Gain (Loss) | Proceeds Received | Realized Gain (Loss) | ||||||||||||
Agency RMBS | $ | 57,164 | $ | (1,708 | ) | $ | 43,890 | $ | (2,713 | ) | |||||
Non-Agency CMBS | — | — | 33,640 | (1,228 | ) | ||||||||||
$ | 57,164 | $ | (1,708 | ) | $ | 77,530 | $ | (3,941 | ) | ||||||
10
NOTES TO THE UNAUDITED CONSOLIDATED FINANCIAL STATEMENTS
DYNEX CAPITAL, INC.
(amounts in thousands except share data)
The following table presents certain information for those MBS in an unrealized loss position as of the dates indicated:
March 31, 2017 | December 31, 2016 | ||||||||||||||||||
Fair Value | Gross Unrealized Losses | # of Securities | Fair Value | Gross Unrealized Losses | # of Securities | ||||||||||||||
Continuous unrealized loss position for less than 12 months: | |||||||||||||||||||
Agency MBS | $ | 1,568,683 | $ | (29,494 | ) | 113 | $ | 1,738,094 | $ | (38,469 | ) | 133 | |||||||
Non-Agency MBS | 65,013 | (379 | ) | 13 | 205,484 | (2,773 | ) | 48 | |||||||||||
Continuous unrealized loss position for 12 months or longer: | |||||||||||||||||||
Agency MBS | $ | 384,677 | $ | (5,865 | ) | 60 | $ | 427,405 | $ | (8,952 | ) | 72 | |||||||
Non-Agency MBS | 38,726 | (658 | ) | 17 | 81,660 | (2,332 | ) | 26 | |||||||||||
Because the principal related to Agency MBS is guaranteed by the government-sponsored entities Fannie Mae and Freddie Mac which have the implicit guarantee of the U.S. government, the Company does not consider any of the unrealized losses on its Agency MBS to be credit related. Although the unrealized losses are not credit related, the Company assesses its ability and intent to hold any Agency MBS with an unrealized loss until the recovery in its value. This assessment is based on the amount of the unrealized loss and significance of the related investment as well as the Company’s current leverage and anticipated liquidity. Based on this analysis, the Company has determined that the unrealized losses on its Agency MBS as of March 31, 2017 and December 31, 2016 were temporary.
The Company reviews any non-Agency MBS in an unrealized loss position to evaluate whether any decline in fair value represents an OTTI. The evaluation includes a review of the credit ratings of these non-Agency MBS and the seasoning of the mortgage loans collateralizing these securities as well as the estimated future cash flows which include projected losses. The Company performed this evaluation for the non-Agency MBS in an unrealized loss position and has determined that there have not been any adverse changes in the timing or amount of estimated future cash flows that necessitate a recognition of OTTI amounts as of March 31, 2017 or December 31, 2016.
NOTE 3 – REPURCHASE AGREEMENTS
The Company’s repurchase agreements outstanding as of March 31, 2017 and December 31, 2016 are summarized in the following tables:
March 31, 2017 | December 31, 2016 | |||||||||||||||||||||
Collateral Type | Balance | Weighted Average Rate | Fair Value of Collateral Pledged | Balance | Weighted Average Rate | Fair Value of Collateral Pledged | ||||||||||||||||
Agency RMBS | $ | 1,020,367 | 0.90 | % | $ | 1,055,641 | $ | 1,157,302 | 0.82 | % | $ | 1,191,147 | ||||||||||
Non-Agency RMBS | 20,800 | 2.18 | % | 24,944 | 26,149 | 1.98 | % | 31,952 | ||||||||||||||
Agency CMBS | 1,068,251 | 0.90 | % | 1,146,915 | 1,005,726 | 0.82 | % | 1,095,002 | ||||||||||||||
Non-Agency CMBS | 65,327 | 1.85 | % | 77,198 | 66,881 | 1.63 | % | 77,840 | ||||||||||||||
Agency CMBS IO | 344,828 | 1.82 | % | 406,244 | 346,892 | 1.57 | % | 407,481 | ||||||||||||||
Non-Agency CMBS IO | 302,002 | 1.88 | % | 354,283 | 291,199 | 1.67 | % | 341,139 | ||||||||||||||
Securitization financing bond | 4,370 | 2.21 | % | 4,850 | 4,803 | 2.00 | % | 5,278 | ||||||||||||||
Total repurchase agreements | $ | 2,825,945 | 1.15 | % | $ | 3,070,075 | $ | 2,898,952 | 1.03 | % | $ | 3,149,839 | ||||||||||
11
NOTES TO THE UNAUDITED CONSOLIDATED FINANCIAL STATEMENTS
DYNEX CAPITAL, INC.
(amounts in thousands except share data)
As of March 31, 2017, the weighted average remaining term to maturity of our repurchase agreements was 18 days compared to 20 days as of December 31, 2016. The following table provides a summary of the original term to maturity of our secured borrowings as of March 31, 2017 and December 31, 2016:
Original Term to Maturity | March 31, 2017 | December 31, 2016 | ||||||
Less than 30 days | $ | 1,056,924 | $ | 910,937 | ||||
30 to 90 days | 1,717,686 | 533,112 | ||||||
91 to 180 days | 51,335 | 1,454,903 | ||||||
181 to 364 days | — | — | ||||||
1 year or longer | — | — | ||||||
$ | 2,825,945 | $ | 2,898,952 | |||||
The following table lists the counterparties with whom the Company had over 10% of its shareholders' equity at risk (defined as the excess of collateral pledged over the borrowings outstanding):
March 31, 2017 | |||||||||||
Counterparty Name | Balance | Weighted Average Rate | Equity at Risk | ||||||||
Wells Fargo Bank, N. A. and affiliates | $ | 358,267 | 1.85 | % | $ | 64,695 | |||||
Of the amount outstanding with Wells Fargo Bank, N.A. and affiliates, $345,672 is under a committed repurchase facility which has an aggregate maximum borrowing capacity of $350,000 and is scheduled to mature on August 6, 2018, subject to early termination provisions contained in the master repurchase agreement. The facility is collateralized primarily by CMBS IO, and its weighted average borrowing rate as of March 31, 2017 was 1.85%.
As of March 31, 2017, the Company had repurchase agreement amounts outstanding with 18 of its 31 available repurchase agreement counterparties. The Company's counterparties, as set forth in the master repurchase agreement with the counterparty, require the Company to comply with various customary operating and financial covenants, including, but not limited to, minimum net worth, maximum declines in net worth in a given period, and maximum leverage requirements as well as maintaining the Company's REIT status. In addition, some of the agreements contain cross default features, whereby default under an agreement with one lender simultaneously causes default under agreements with other lenders. To the extent that the Company fails to comply with the covenants contained in these financing agreements or is otherwise found to be in default under the terms of such agreements, the counterparty has the right to accelerate amounts due under the master repurchase agreement. The Company was in full compliance with all covenants as of March 31, 2017.
The Company's repurchase agreements are subject to underlying agreements with master netting or similar arrangements, which provide for the right of offset in the event of default or in the event of bankruptcy of either party to the transactions. The Company reports its repurchase agreements to these arrangements on a gross basis. The following tables present information regarding the Company's repurchase agreements as if the Company had presented them on a net basis as of March 31, 2017 and December 31, 2016:
Gross Amount of Recognized Liabilities | Gross Amount Offset in the Balance Sheet | Net Amount of Liabilities Presented in the Balance Sheet | Gross Amount Not Offset in the Balance Sheet (1) | Net Amount | |||||||||||||||||||
Financial Instruments Posted as Collateral | Cash Posted as Collateral | ||||||||||||||||||||||
March 31, 2017 | |||||||||||||||||||||||
Repurchase agreements | $ | 2,825,945 | $ | — | $ | 2,825,945 | $ | (2,825,945 | ) | $ | — | $ | — | ||||||||||
December 31, 2016: | |||||||||||||||||||||||
Repurchase agreements | $ | 2,898,952 | $ | — | $ | 2,898,952 | $ | (2,898,952 | ) | $ | — | $ | — | ||||||||||
12
NOTES TO THE UNAUDITED CONSOLIDATED FINANCIAL STATEMENTS
DYNEX CAPITAL, INC.
(amounts in thousands except share data)
(1) | Amounts disclosed for collateral received by or posted to the same counterparty include cash and the fair value of MBS up to and not exceeding the net amount of the asset or liability presented in the balance sheet. The fair value of the actual collateral received by or posted to the same counterparty may exceed the amounts presented. |
Please see Note 4 for information related to the Company's derivatives which are also subject to underlying agreements with master netting or similar arrangements.
NOTE 4 – DERIVATIVES
The Company utilizes derivative instruments to economically hedge a portion of its exposure to interest rate risk. As of March 31, 2017, the Company primarily uses pay-fixed interest rate swaps to hedge its exposure to changes in interest rates and uses receive-fixed interest rate swaps to offset a portion of its pay-fixed interest rate swaps in order to manage its overall hedge position. The objective of the Company's risk management strategy is to mitigate declines in book value resulting from fluctuations in the fair value of the Company's assets from changing interest rates and to protect some portion of the Company's earnings from rising interest rates. Please refer to Note 1 for information related to the Company's accounting policy for its derivative instruments.
The table below summarizes information about the Company’s derivative instruments treated as trading instruments on its consolidated balance sheet as of the dates indicated:
March 31, 2017 | December 31, 2016 | |||||||||||||||||||||||
Trading Instruments | Balance Sheet Location | Fair Value (1) | Notional | WAVG Net Pay-Fixed Rate (2) | Fair Value | Notional | WAVG Net Pay-Fixed Rate (2) | |||||||||||||||||
Interest rate swaps | Derivative assets | $ | 272 | $ | 3,695,000 | 1.61 | % | $ | 28,534 | $ | 2,670,000 | 1.41 | % | |||||||||||
Interest rate swaps | Derivative liabilities | (58 | ) | 850,000 | 2.13 | % | (6,922 | ) | 1,210,000 | 1.96 | % | |||||||||||||
(1) | Refer to Note 1 regarding information on a change in the CME rulebook. Amounts reported on the consolidated balance sheet as of March 31, 2017 reflect the netting of the derivative asset or liability with the related collateral received or posted, respectively. The gross amounts comparable to December 31, 2016 for the derivative asset and derivative liabilities as of March 31, 2017 were $24,828 and $(6,133), respectively. |
(2) | Weighted average net pay fixed rate is weighted by the notional amount of pay fixed interest rate swaps, net of receive-fixed interest rate swaps held as of date indicated. |
The notional amount of pay-fixed interest rate swaps included in the table above that were forward starting was $2,675,000 at a weighted average pay-fixed rate of 2.16% as of March 31, 2017 compared to $2,725,000 at a weighted average pay-fixed rate of 2.18% as of December 31, 2016.
The following table summarizes the notional activity related to derivative instruments for the period indicated:
Notional receive-fixed interest rate swaps | Notional pay-fixed interest rate swaps | Total Notional | |||||||||
As of December 31, 2016 | $ | 425,000 | $ | 3,455,000 | $ | 3,880,000 | |||||
Additions | $ | — | $ | 1,400,000 | $ | 1,400,000 | |||||
Settlements, terminations, or expirations | $ | (300,000 | ) | $ | (435,000 | ) | $ | (735,000 | ) | ||
As of March 31, 2017 | $ | 125,000 | $ | 4,420,000 | $ | 4,545,000 | |||||
The table below provides detail of the Company's "gain (loss) on derivative instruments, net" by type of derivative for the periods indicated:
13
NOTES TO THE UNAUDITED CONSOLIDATED FINANCIAL STATEMENTS
DYNEX CAPITAL, INC.
(amounts in thousands except share data)
Three Months Ended | ||||||||
March 31, | ||||||||
Type of Derivative Instrument | 2017 | 2016 | ||||||
Receive-fixed interest rate swaps | $ | (134 | ) | $ | 10,534 | |||
Pay-fixed interest rate swaps | 309 | (46,612 | ) | |||||
Eurodollar futures | — | (12,186 | ) | |||||
Gain (loss) on derivative instruments, net | $ | 175 | $ | (48,264 | ) | |||
There is a net unrealized gain of $572 remaining in AOCI on the Company's consolidated balance sheet as of March 31, 2017 which represents the activity related to interest rate swap agreements while they were previously designated as cash flow hedges, and this amount will be recognized in the Company's net income as an adjustment to "interest expense" over the remaining contractual life of the agreements. The Company estimates a credit of $217 will be reclassified to net income as a reduction of "interest expense" within the next 12 months.
A portion of the Company's interest rate swaps were entered into under bilateral agreements which contain cross-default provisions with other agreements between the parties. In addition, these bilateral agreements contain financial and operational covenants similar to those contained in our repurchase agreements as described in Note 3. The Company was in compliance with all covenants with respect to bilateral agreements under which interest rate swaps were entered into as of March 31, 2017.
The Company's derivatives are subject to underlying agreements with master netting or similar arrangements, which provide for the right of offset in the event of default or in the event of bankruptcy of either party to the transactions. The Company reports its derivative assets and liabilities subject to these arrangements on a gross basis. The following tables present information regarding those derivative assets and liabilities subject to such arrangements as if the Company had presented them on a net basis as of March 31, 2017 and December 31, 2016:
Offsetting of Assets | |||||||||||||||||||||||
Gross Amount of Recognized Assets | Gross Amount Offset in the Balance Sheet | Net Amount of Assets Presented in the Balance Sheet | Gross Amount Not Offset in the Balance Sheet (1) | Net Amount | |||||||||||||||||||
Financial Instruments Received as Collateral | Cash Received as Collateral | ||||||||||||||||||||||
March 31, 2017 | |||||||||||||||||||||||
Derivative assets | $ | 272 | $ | — | $ | 272 | $ | (29 | ) | $ | — | $ | 243 | ||||||||||
December 31, 2016: | |||||||||||||||||||||||
Derivative assets | $ | 28,534 | $ | — | $ | 28,534 | $ | (6,449 | ) | $ | (22,085 | ) | $ | — | |||||||||
Offsetting of Liabilities | |||||||||||||||||||||||
Gross Amount of Recognized Liabilities | Gross Amount Offset in the Balance Sheet | Net Amount of Liabilities Presented in the Balance Sheet | Gross Amount Not Offset in the Balance Sheet (1) | Net Amount | |||||||||||||||||||
Financial Instruments Posted as Collateral | Cash Posted as Collateral | ||||||||||||||||||||||
March 31, 2017 | |||||||||||||||||||||||
Derivative liabilities | $ | 58 | $ | — | $ | 58 | $ | (58 | ) | $ | — | $ | — | ||||||||||
December 31, 2016: | |||||||||||||||||||||||
Derivative liabilities | $ | 6,922 | $ | — | $ | 6,922 | $ | (6,913 | ) | $ | — | $ | 9 | ||||||||||
14
NOTES TO THE UNAUDITED CONSOLIDATED FINANCIAL STATEMENTS
DYNEX CAPITAL, INC.
(amounts in thousands except share data)
(1) | Amounts disclosed for collateral received by or posted to the same counterparty include cash and the fair value of MBS up to and not exceeding the net amount of the asset or liability presented in the balance sheet. The fair value of the actual collateral received by or posted to the same counterparty may exceed the amounts presented. |
Please see Note 3 for information related to the Company's repurchase agreements which are also subject to underlying agreements with master netting or similar arrangements.
NOTE 5 – FAIR VALUE OF FINANCIAL INSTRUMENTS
ASC Topic 820 defines fair value as the price that would be received to sell an asset or paid to transfer a liability in an orderly transaction between market participants at the measurement date. ASC Topic 820 clarifies that fair value should be based on the assumptions market participants would use when pricing an asset or liability and also requires an entity to consider all aspects of nonperformance risk, including the entity's own credit standing, when measuring fair value of a liability. ASC Topic 820 established a valuation hierarchy of three levels as follows:
• | Level 1 – Inputs are unadjusted, quoted prices in active markets for identical assets or liabilities as of the measurement date. |
• | Level 2 – Inputs include quoted prices in active markets for similar assets or liabilities; quoted prices in inactive markets for identical or similar assets or liabilities; or inputs either directly observable or indirectly observable through correlation with market data at the measurement date and for the duration of the instrument’s anticipated life. |
• | Level 3 – Unobservable inputs are supported by little or no market activity. The unobservable inputs represent management’s best estimate of how market participants would price the asset or liability at the measurement date. Consideration is given to the risk inherent in the valuation technique and the risk inherent in the inputs to the model. |
The Company reviews the classification of its financial instruments within the fair value hierarchy on a quarterly basis, and management may conclude that its financial instruments should be reclassified to a different level in the future if a change in type of inputs occurs.
The following table presents the fair value of the Company’s assets and liabilities presented on its consolidated balance sheets, segregated by the hierarchy level of the fair value estimate, that are measured at fair value on a recurring basis as of the dates indicated:
March 31, 2017 | |||||||||||||||
Fair Value | Level 1 - Unadjusted Quoted Prices in Active Markets | Level 2 - Observable Inputs | Level 3 - Unobservable Inputs | ||||||||||||
Assets: | |||||||||||||||
Mortgage-backed securities | $ | 3,186,749 | $ | — | $ | 3,176,247 | $ | 10,502 | |||||||
Derivative assets | 272 | — | 272 | — | |||||||||||
Total assets carried at fair value | $ | 3,187,021 | $ | — | $ | 3,176,519 | $ | 10,502 | |||||||
Liabilities: | |||||||||||||||
Derivative liabilities | $ | 58 | $ | — | $ | 58 | $ | — | |||||||
Total liabilities carried at fair value | $ | 58 | $ | — | $ | 58 | $ | — | |||||||
15
NOTES TO THE UNAUDITED CONSOLIDATED FINANCIAL STATEMENTS
DYNEX CAPITAL, INC.
(amounts in thousands except share data)
December 31, 2016 | |||||||||||||||
Fair Value | Level 1 - Unadjusted Quoted Prices in Active Markets | Level 2 - Observable Inputs | Level 3 - Unobservable Inputs | ||||||||||||
Assets: | |||||||||||||||
Mortgage-backed securities | $ | 3,212,084 | $ | — | $ | 3,201,157 | $ | 10,927 | |||||||
Derivative assets | 28,534 | — | 28,534 | — | |||||||||||
Total assets carried at fair value | $ | 3,240,618 | $ | — | $ | 3,229,691 | $ | 10,927 | |||||||
Liabilities: | |||||||||||||||
Derivative liabilities | $ | 6,922 | $ | — | $ | 6,922 | $ | — | |||||||
Total liabilities carried at fair value | $ | 6,922 | $ | — | $ | 6,922 | $ | — | |||||||
As of March 31, 2017 and December 31, 2016, the Company’s derivative assets and liabilities consisted only of interest rate swaps. Interest rate swaps are valued using the income approach with the primary input being the forward interest rate swap curve, which is considered an observable input, and thus their fair values are considered Level 2 measurements as of March 31, 2017 and December 31, 2016.
The fair value measurements for a majority of the Company's MBS are considered Level 2. These Level 2 securities are substantially similar to securities that either are actively traded or have been recently traded in their respective markets. The Company receives a price evaluation for each of its MBS from a primary pricing service selected by the Company. To determine each security's valuation, the primary pricing service uses either a market approach, which uses observable prices and other relevant information that is generated by market transactions of identical or similar securities, or an income approach, which uses valuation techniques to convert future amounts to a single, discounted present value amount. The Company also reviews the assumptions and inputs utilized in the valuation techniques of its primary pricing service. Examples of these observable inputs and assumptions include market interest rates, credit spreads, and projected prepayment speeds, among other things. The Company compares the price received from its primary pricing service to other prices received from additional third party pricing services and multiple broker quotes for reasonableness.
The Company owns certain non-Agency MBS for which there are not sufficiently recent trades of substantially similar securities, and their fair value measurements are thus considered Level 3. The Company determines the fair value of its Level 3 securities by discounting the estimated future cash flows derived from cash flow models using significant inputs which are determined by the Company when market observable inputs are not available. Information utilized in those pricing models include the security’s credit rating, coupon rate, estimated prepayment speeds, expected weighted average life, collateral composition, estimated future interest rates, expected credit losses, and credit enhancement as well as certain other relevant information. Significant changes in any of these inputs in isolation may result in a significantly different fair value measurement. Level 3 assets are generally most sensitive to the default rate and severity assumptions.
The table below presents quantitative information about the significant unobservable inputs used in the fair value measurement for the Company's Level 3 non-Agency CMBS and RMBS as of March 31, 2017:
Unobservable Inputs | ||||||||||
Prepayment Speed | Default Rate | Severity | Discount Rate | |||||||
Non-Agency CMBS (1) | 0 CPY | — | — | 10.7 | % | |||||
Non-Agency RMBS | 10 CPR | 1.0 | % | 20.0 | % | 6.3 | % | |||
(1) | As of March 31, 2017, there are too few loans collateralizing our non-Agency CMBS to reasonably apply average prepayment speed, average default rate, or average severity. The loans were individually evaluated for prepayment and default in projecting the cash flows. Based on that review, the loans are expected to pay as scheduled. |
16
NOTES TO THE UNAUDITED CONSOLIDATED FINANCIAL STATEMENTS
DYNEX CAPITAL, INC.
(amounts in thousands except share data)
The activity of the instruments measured at fair value on a recurring basis using Level 3 inputs is presented in the following table for the period indicated:
Level 3 Fair Value | |||||||||||
Non-Agency CMBS | Non-Agency RMBS | Total assets | |||||||||
Balance as of December 31, 2016 | $ | 9,669 | $ | 1,258 | $ | 10,927 | |||||
Unrealized loss included in OCI (1) | (377 | ) | (3 | ) | (380 | ) | |||||
Principal payments | (383 | ) | (44 | ) | (427 | ) | |||||
Accretion | 382 | — | 382 | ||||||||
Balance as of March 31, 2017 | $ | 9,291 | $ | 1,211 | $ | 10,502 | |||||
(1) | Amount included in "unrealized gain on available-for-sale investments, net" on consolidated statements of comprehensive income (loss). |
The following table presents a summary of the carrying value and estimated fair values of the Company’s financial instruments as of the dates indicated:
March 31, 2017 | December 31, 2016 | ||||||||||||||
Carrying Value | Fair Value | Carrying Value | Fair Value | ||||||||||||
Assets: | |||||||||||||||
Mortgage-backed securities | $ | 3,186,749 | $ | 3,186,749 | $ | 3,212,084 | $ | 3,212,084 | |||||||
Mortgage loans held for investment, net(1) | 18,183 | 15,120 | 19,036 | 15,971 | |||||||||||
Derivative assets | 272 | 272 | 28,534 | 28,534 | |||||||||||
Liabilities: | |||||||||||||||
Repurchase agreements (2) | $ | 2,825,945 | $ | 2,825,945 | $ | 2,898,952 | $ | 2,898,952 | |||||||
Non-recourse collateralized financing (1) | 6,075 | 6,024 | 6,440 | 6,357 | |||||||||||
Derivative liabilities | 58 | 58 | 6,922 | 6,922 | |||||||||||
(1) | The Company determines the fair value of its mortgage loans held for investment, net and its non-recourse collateralized financing using internally developed cash flow models with inputs similar to those used to estimate the fair value of the Company's Level 3 non-Agency MBS. |
(2) | The carrying value of repurchase agreements generally approximates fair value due to their short term maturities. |
NOTE 6 – SHAREHOLDERS' EQUITY AND SHARE-BASED COMPENSATION
Preferred Stock
The Company's articles of incorporation authorize the issuance of up to 50,000,000 shares of preferred stock, par value $0.01 per share, of which the Company's Board of Directors has designated 8,000,000 shares of 8.50% Series A Preferred Stock and 7,000,000 shares of 7.625% Series B Preferred Stock, (the Series A Preferred Stock and the Series B Preferred Stock collectively, the "Preferred Stock"). The Company had 2,300,000 shares of its Series A Preferred Stock and 2,597,138 shares of its Series B Preferred Stock issued and outstanding as of March 31, 2017 compared to 2,300,000 shares of Series A Preferred Stock and 2,271,937 shares of Series B Preferred Stock as of December 31, 2016.
The Preferred Stock has no maturity and will remain outstanding indefinitely unless redeemed or otherwise repurchased or converted into common stock pursuant to the terms of the Preferred Stock. Except under certain limited circumstances, the Company may not redeem the Series A Preferred Stock prior to July 31, 2017 or the Series B Preferred Stock prior to April 30, 2018. On or after these dates, at any time and from time to time, the Preferred Stock may be redeemed in whole, or in part, at the Company's option at a cash redemption price of $25.00 per share plus any accumulated and unpaid dividends. Because the Preferred Stock is redeemable only at the option of the issuer, it is classified as equity on the Company's consolidated balance sheet. The Series A Preferred Stock pays a cumulative cash dividend equivalent to 8.50% of the $25.00 liquidation preference
17
NOTES TO THE UNAUDITED CONSOLIDATED FINANCIAL STATEMENTS
DYNEX CAPITAL, INC.
(amounts in thousands except share data)
per share each year and the Series B Preferred Stock pays a cumulative cash dividend equivalent to 7.625% of the $25.00 liquidation preference per share each year. The Company announced that it will pay its regular quarterly dividends on its Preferred Stock for the first quarter on April 15, 2017 to shareholders of record as of April 1, 2017.
Common Stock
The Company declared a first quarter common stock dividend of $0.18 per share payable on April 28, 2017 to shareholders of record as of April 5, 2017.
2009 Stock and Incentive Plan. Of the 2,500,000 shares of common stock authorized for issuance under its 2009 Stock and Incentive Plan, the Company had 815,682 available for issuance as of March 31, 2017. Total stock-based compensation expense recognized by the Company for the three months ended March 31, 2017 was $538 compared to $829 for the three months ended March 31, 2016.
The following table presents a rollforward of the restricted stock activity for the periods indicated:
Three Months Ended | |||||||||||||
March 31, | |||||||||||||
2017 | 2016 | ||||||||||||
Shares | Weighted Average Grant Date Fair Value Per Share | Shares | Weighted Average Grant Date Fair Value Per Share | ||||||||||
Restricted stock outstanding as of beginning of period | 553,396 | $ | 7.55 | 696,597 | $ | 8.54 | |||||||
Restricted stock granted | 108,446 | 6.77 | 168,720 | 6.22 | |||||||||
Restricted stock vested | (275,691 | ) | 7.94 | (317,831 | ) | 8.87 | |||||||
Restricted stock outstanding as of end of period | 386,151 | $ | 7.05 | 547,486 | $ | 7.63 | |||||||
As of March 31, 2017, the grant date fair value of the Company’s remaining nonvested restricted stock is $2,334 which will be amortized into compensation expense over a weighted average period of 1.7 years.
NOTE 7 – SUBSEQUENT EVENTS
Management has evaluated events and circumstances occurring as of and through the date this Quarterly Report on Form 10-Q was filed with the SEC and has determined that there have been no significant events or circumstances that qualify as a "recognized" or "nonrecognized" subsequent event as defined by ASC Topic 855.
18
ITEM 2. | MANAGEMENT'S DISCUSSION AND ANALYSIS OF FINANCIAL CONDITION AND RESULTS OF OPERATIONS |
The following discussion should be read in conjunction with our unaudited financial statements and the accompanying notes included in Part 1, Item 1. “Financial Statements” in this Quarterly Report on Form 10-Q and our audited financial statements and the accompanying notes included in Part II, Item 8 in our Annual Report on Form 10-K for the year ended December 31, 2016. References herein to “Dynex,” the “Company,” “we,” “us,” and “our” include Dynex Capital, Inc. and its consolidated subsidiaries, unless the context otherwise requires. In addition to current and historical information, the following discussion and analysis contains forward-looking statements within the meaning of the Private Securities Litigation Reform Act of 1995. These statements relate to our future business, financial condition or results of operations. For a description of certain factors that may have a significant impact on our future business, financial condition or results of operations, see “Forward-Looking Statements” at the end of this discussion and analysis.
For a complete description of our business including our operating policies, investment philosophy and strategy, financing and hedging strategies, and other important information, please refer to Part I, Item 1 of our Annual Report on Form 10-K for the year ended December 31, 2016.
EXECUTIVE OVERVIEW
Company Overview
We are an internally managed mortgage real estate investment trust, or mortgage REIT, which invests in residential and commercial mortgage-backed securities on a leveraged basis. Our common stock is traded on the New York Stock Exchange ("NYSE") under the symbol "DX". Our objective is to provide attractive risk-adjusted returns to our shareholders over the long term that are reflective of a leveraged, high quality fixed income portfolio with a focus on capital preservation. We seek to provide returns to our shareholders primarily through regular quarterly dividends, and also through capital appreciation.
We also have two series of preferred stock outstanding, our 8.50% Series A Cumulative Redeemable Preferred Stock (the "Series A Preferred Stock") which is traded on the NYSE under the symbol "DXPRA", and our 7.625% Series B Cumulative Redeemable Preferred Stock (the "Series B Preferred Stock") which is traded on the NYSE under the symbol "DXPRB".
We invest in Agency and non-Agency mortgage-backed securities (“MBS”) consisting of residential MBS (“RMBS”), commercial MBS (“CMBS”) and CMBS interest-only ("IO") securities. Agency MBS have a guaranty of principal payment by an agency of the U.S. government or a U.S. government-sponsored entity ("GSE") such as Fannie Mae and Freddie Mac. Non-Agency MBS have no such guaranty of payment. Our investments in non-Agency MBS are generally higher quality senior or mezzanine classes (typically rated 'A' or better by one or more of the nationally recognized statistical rating organizations) because they are typically more liquid (i.e., they are more easily converted into cash either through sales or pledges as collateral for repurchase agreement borrowings) and have less exposure to credit losses than lower-rated non-Agency MBS.
We invest and manage our capital pursuant to Operating Policies approved by our Board of Directors. We use leverage to enhance the returns on our invested capital by pledging our investments as collateral for borrowings such as repurchase agreements as discussed further below. We also use derivative instruments to attempt to mitigate our exposure to adverse changes in interest rates as discussed further below.
RMBS. Our Agency RMBS investments include MBS collateralized by adjustable-rate mortgage loans ("ARMs"), which have interest rates that generally will adjust at least annually to an increment over a specified interest rate index, and hybrid adjustable-rate mortgage loans ("hybrid ARMs"), which are loans that have a fixed rate of interest for a specified period (typically three to ten years) and then adjust their interest rate at least annually to an increment over a specified interest rate index. Agency ARMs also include hybrid Agency ARMs that are past their fixed-rate periods or within twelve months of their initial reset period. We may also invest in fixed-rate Agency RMBS from time to time. Substantially all of our ARMs reset based on the one-year LIBOR index.
19
Non-Agency RMBS are collateralized by non-conforming residential mortgage loans and are tranched into different credit classes of securities with payments to junior classes subordinate to senior classes. We generally invest in senior classes of non-Agency RMBS which may include unrated securities. Some of the non-Agency RMBS that we invest in may be collateralized by loans which are delinquent, the repayment of which is expected to come from foreclosure and liquidation of the underlying real estate. We seek to invest in non-Agency RMBS that we judge to have sufficiently high collateralization to be likely to protect the principal balance of our investment from credit losses on the underlying loans.
CMBS. The majority of our CMBS investments are primarily fixed-rate Agency-issued securities backed by multifamily housing loans. The remainder of our CMBS portfolio contains both Agency and non-Agency issued securities backed by other commercial real estate property types such as office building, retail, hospitality, and health care. Loans underlying CMBS generally are geographically diverse, are fixed-rate, mature in eight to eighteen years and have amortization terms of up to 30 years. Typically these loans have some form of prepayment protection provisions (such as prepayment lock-out) or prepayment compensation provisions (such as yield maintenance or prepayment penalty). Yield maintenance and prepayment penalty requirements are intended to create an economic disincentive for the loans to prepay. Non-Agency CMBS also includes securities that are backed by pools of single-family rental homes which have variable-rates that reset monthly based on an index rate, such as LIBOR.
CMBS IO. CMBS IO are interest-only securities issued as part of a CMBS securitization and represent the right to receive a portion of the monthly interest payments (but not principal cash flows) on the unpaid principal balance of the underlying pool of commercial mortgage loans. We invest in both Agency-issued and non-Agency issued CMBS IO. The loans collateralizing CMBS IO pools are very similar in composition to the pools of loans that generally collateralize CMBS as discussed above. Since CMBS IO securities have no principal associated with them, the interest payments received are based on the unpaid principal balance of the underlying pool of mortgage loans, which is often referred to as the notional amount. Most loans in these securities have some form of prepayment protection from early repayment including absolute loan prepayment lock-outs, loan prepayment penalties, or yield maintenance requirements similar to CMBS described above. There are no prepayment protections, however, if the loan defaults and is partially or wholly repaid earlier as a result of loss mitigation actions taken by the underlying loan servicer, and therefore yields on CMBS IO investments are dependent upon the underlying loan performance. Because Agency-issued MBS generally contain higher credit quality loans, Agency CMBS IO are expected to have a lower risk of default than non-Agency CMBS IO.
Financing. We finance our investments primarily through the use of uncommitted repurchase agreements which are provided principally by major financial institutions and broker-dealers. We pledge our MBS as collateral to secure the amounts borrowed from our counterparties. These repurchase agreements generally have original terms to maturity of overnight to six months, though in some instances we may enter into longer-dated maturities depending on market conditions. We pay interest on our repurchase agreement borrowings at a rate usually based on a spread to LIBOR and fixed for the term of the borrowing. Borrowings under these repurchase agreements are renewable at the discretion of our lenders and do not contain guaranteed roll-over terms. One of our repurchase agreement lenders provides a committed repurchase agreement financing facility to us with an aggregate borrowing capacity of $350.0 million that expires on August 6, 2018.
Hedging. We use derivative instruments to hedge our exposure to changes in interest rates. Such exposure results from our ownership of primarily fixed-rate investments that are financed with repurchase agreements which have significantly shorter maturities than the weighted average life of our investments. Changes in interest rates can impact the market value of our investments (and therefore book value per common share), net interest income, and net income. In a period of rising interest rates, our earnings and cash flow may be negatively impacted by borrowing costs increasing faster than interest income from our assets, and our book value may decline as a result of declining market values of our MBS. Currently, we are using interest rate swap agreements in an attempt to mitigate our exposure to changes in interest rates.
Factors that Affect Our Results of Operations and Financial Condition
Our financial performance is driven by the performance of our investment portfolio and related funding and derivative hedging activity. Our financial performance is measured by net interest income, net income, comprehensive income, book value per common share and core net operating income (a non-GAAP measure). Our financial performance may be impacted by multiple factors, many of which are related to macroeconomic conditions, geopolitical conditions, central bank and government policy, and other factors beyond our control. These factors include, but are not limited to, the absolute level of interest rates, the
20
relative slope of interest rate curves, changes in market expectations of future interest rates, actual and estimated future prepayment rates on our investments, competition for investments, economic conditions and their impact on the credit performance of our investments, and market required yields as reflected by market credit spreads. All of these factors are influenced by market forces and generally are exacerbated during periods of market volatility.
The performance of our investment portfolio, the cost and availability of financing and the availability of investments at acceptable risk-adjusted returns could also be influenced by regulatory actions and regulatory policy measures of the U.S. government including, but not limited to, the Federal Housing Finance Administration ("FHFA"), the U. S. Department of the Treasury (the "Treasury"), and the Board of Governors of the Federal Reserve System (the "Federal Reserve") and could also be influenced by reactions in U.S. markets from activities of central banks around the world.
Our business model may also be impacted by other factors such as the availability and cost of financing and the state of the overall credit markets. Reductions in the availability of financing for our investments could significantly impact our business and force us to sell assets that we otherwise would not sell, potentially at losses depending on market conditions. Regulatory developments since the 2008 financial crisis have impacted large U.S. domiciled banks and their broker dealer subsidiaries by requiring such entities to hold more capital against their assets, including reverse repurchase agreements. In general, this has led to reduced lending capacity in the repurchase agreement market and higher costs. Other factors that could also impact our business include changes in regulatory requirements, including requirements to qualify for registration under the 1940 Act, and REIT requirements.
We believe that regulatory impacts on financial institutions, many of which are our trading and financing counterparties, continue to pose a threat to the overall liquidity in the capital markets. In particular, higher capital requirements under U.S. banking regulations and limitations on the proprietary trading activities of large U.S. financial institutions under the Dodd-Frank Wall Street Reform and Consumer Protection Act ("the "Dodd-Frank Act") could result in reduced liquidity in times of market stress. While the Federal Reserve continues to reinvest principal payments received on its Agency RMBS portfolio, we believe it is unlikely that this activity would provide enough liquidity to the market in times of stress, which could result in volatile asset prices. Further, the impact on market liquidity of our investments and the financing markets could be negatively impacted if the Federal Reserve's Federal Open Market Committee (or "FOMC") suddenly changes market expectations of the targeted Federal Funds Rate or takes other actions which have the effect of tightening monetary policy.
To complement the performance of our investment portfolio, we regularly review our existing operations to determine whether our investment strategy or business model should change, including through a change in our investment portfolio, our targeted investments, and our risk position. We may also consider reallocating our capital resources to other assets or portfolios that better align with our long-term strategy, expanding our capital base, or merger, acquisition or divestiture opportunities. We analyze and evaluate potential business opportunities that we identify or are presented to us, including possible merger, acquisition, or divestiture transactions, that are a strategic fit for our investment strategy or asset allocation or otherwise maximize value for our shareholders. Pursuing such an opportunity or transaction could require us to issue additional equity or debt securities.
As discussed above, investing in mortgage-related securities on a leveraged basis subjects us to a number of risks including interest rate risk, prepayment and reinvestment risk, credit risk, market value risk and liquidity risk, which are discussed in "Liquidity and Capital Resources" within this Item 2 and in Part I, Item 3 of this Quarterly Report on Form 10-Q as well as in Item 1A, "Risk Factors" of Part I of our Annual Report on Form 10-K for the year ended December 31, 2016. Please see these Items for a detailed discussion of these risks and the potential impact on our results of operations and financial condition.
Market Conditions and Recent Activity
During the first quarter of 2017, macroeconomic conditions continued to modestly improve in the U.S. and developed markets. As a result of improvement in the U.S., the FOMC increased its targeted Federal Funds Rate by 0.25% in March 2017 after increasing it by the same amount in December 2016. Although the FOMC increased interest rates, market volatility was generally lower than in recent quarters and credit spreads tightened as show in the following table:
21
Investment Type: | March 31, 2016 | June 30, 2016 | September 30, 2016 | December 31, 2016 | March 31, 2017 | |||||
Agency ARM 5/1 (Agency RMBS) | 32 | 38 | 32 | 19 | 24 | |||||
Agency DUS (Agency CMBS) | 86 | 94 | 80 | 76 | 67 | |||||
Freddie K AAA IO (Agency CMBS IO) | 260 | 255 | 230 | 200 | 150 | |||||
AAA CMBS IO (Non-Agency CMBS IO) | 265 | 240 | 215 | 195 | 145 | |||||
Freddie K B (Non-Agency CMBS) | 420 | 325 | 265 | 295 | 220 | |||||
The U.S. Treasury yield curve flattened during the first quarter of 2017 and interest rate swap spreads widened. The chart below shows the highest and lowest rates during the three months ended March 31, 2017 as well as the rates as of March 31, 2017 and December 31, 2016 for the indicated U.S. Treasury securities:
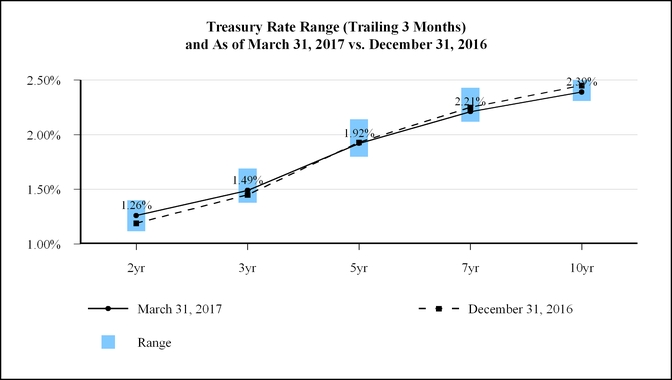
22
The chart below shows the highest and lowest swap rates during the three months ended March 31, 2017 as well as the swap rates as of March 31, 2017 and December 31, 2016:
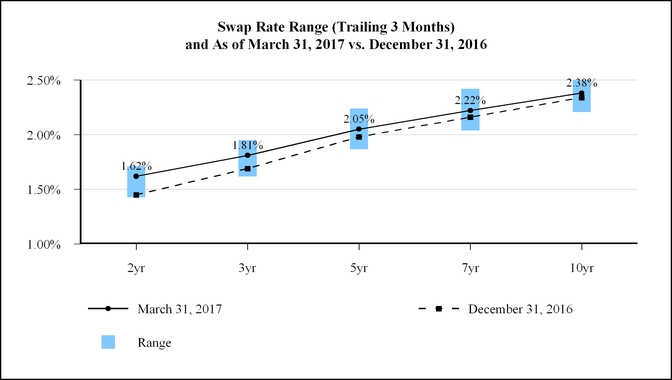
Highlights of the First Quarter of 2017
During the first quarter of 2017, comprehensive income to common shareholders of $26.6 million was comprised of net income to common shareholders of $6.6 million and other comprehensive income ("OCI") of $20.0 million. Net income to common shareholders included net interest income of $14.9 million, a decline of approximately 7.5% from the fourth quarter of 2016, primarily due to higher financing costs, lower prepayment penalty compensation from CMBS, and higher premium amortization on RMBS. Net income to common shareholders also included realized losses on sales of MBS of $(1.7) million, operating expenses of $(4.3) million, and preferred dividends of $(2.4) million. OCI consists primarily of changes in the fair value of MBS, which increased a net $18.4 million during the first quarter of 2017 as a result of credit spread tightening, as discussed above in "Market Conditions and Recent Activity".
Core net operating income to common shareholders is a non-GAAP measure management uses as an estimate of the net interest earnings of the Company's investments, including net periodic interest costs of current pay interest rate swaps, after operating expenses. Core net operating income declined $(2.5) million, or approximately 25%, from the fourth quarter of 2016 due to the decline in net interest income discussed in the preceding paragraph, an increase in net periodic interest cost on interest rate swaps and increases in operating expenses. Periodic interest costs on interest rate swaps increased as we added interest rate swaps with a notional of $665.0 million, net of terminated interest rate swaps in order to hedge our repurchase agreement financing costs, given the likelihood for higher short-term interest rates as a result of improving economic data in the U.S. Please see "Non-GAAP Financial Measures" at the end of "Executive Overview" for additional important information about non-GAAP measures as well as a reconciliation of GAAP net income to core net operating income for the periods discussed.
Book value per common share increased $0.34 to $7.52 as of March 31, 2017. This increase was driven primarily by the increase in fair value of MBS mentioned above, but partially offset by dividends declared in excess of core net operating income and capital stock activity. Economic return on book value was 7.2% for the first quarter of 2017. Economic return on book value is calculated by dividing (i) the sum of dividends declared per common share and the change in book value per common share by (ii) beginning book value per common share.
23
Management Outlook
The Company's outlook has changed little from the end of 2016. The U.S. economy continues to improve making capital markets more comfortable in investing in risk assets. Central bank and government policies (and in particular fiscal policy) continue to be dominating factors for interest rates and credit spreads. The FOMC appears to be on a path to increase the Federal Funds rate multiple times over the balance of 2017, which we expect to result in an increase in our cost of funds if these increases occur. We continue to believe that high levels of global debt will put pressure on growth and remain a destabilizing threat to the world economy, particularly if left unmanaged, and may ultimately impact the amount and timing of FOMC increases in the Federal Funds rate. The probability of a change in the Federal Reserve's MBS and U.S. Treasury securities portfolio reinvestment strategy has increased. Regulatory uncertainty remains elevated. For these reasons, we believe that there continues to be a high risk of interest rate and spread volatility in the near term. As such, we have maintained conservative leverage levels in light of our high credit quality investment portfolio in order to reduce market value risk to our capital and also to be in a position to invest capital if spreads widen.
We continue to believe that there are many tailwinds for our business model. Demographic trends in the U.S. are driving a significant increase in household formation, creating more demand in multifamily and single family housing. As government participation in the housing market shrinks, there will be an increased need for private capital and expertise in the housing finance system. Global demographic aging trends are driving demand for assets that generate income. Fundamentally, this supports the assets in which we invest and also could be a source of capital for us to potentially grow our portfolio. We also intend to capitalize on opportunities for investing capital as government and regulatory policies shift while realizing that such shifts may occur over a period of several years. We will continue seeking ways to diversify funding sources if the regulatory environment becomes more favorable, and we will also actively manage our hedge instruments to attempt to mitigate the impact on our costs of funds if the Federal Funds rate increases during 2017 as currently projected.
Non-GAAP Financial Measures
In addition to the Company's operating results presented in accordance with GAAP, the information presented within Item 2, "Management's Discussion and Analysis of Financial Condition and Results of Operations" of this Quarterly Report on Form 10-Q contains the following non-GAAP financial measures: core net operating income to common shareholders (including per common share), adjusted interest expense and adjusted cost of funds, and adjusted net interest income and spread. Management uses core net operating income (including per common share) as an estimate of the net interest earnings from our investments after operating expenses. In addition to core net operating income, management uses adjusted interest expense, adjusted cost of funds, adjusted net interest income, and adjusted net interest spread because management considers net periodic interest costs related to the Company's derivative instruments as an additional cost of using repurchase agreements to finance investments. Because these measures are used in the Company's internal analysis of financial and operating performance, management believes that they provide greater transparency to our investors of management's view of our economic performance. Management also believes that the presentation of these measures, when analyzed in conjunction with the Company's GAAP operating results, allows investors to more effectively evaluate and compare the performance of the Company to that of its peers even though peer companies may present non-GAAP measures on a different basis than the Company's. Because these non-GAAP financial measures exclude certain items used to compute GAAP net income to common shareholders and GAAP interest expense, these non-GAAP financial measures should be considered as a supplement to, and not as a substitute for, the Company's GAAP results as reported on its consolidated statements of comprehensive income. In addition, because not all companies use identical calculations, the Company's presentation of non-GAAP financial measures may not be comparable to other similarly-titled measures of other companies.
Schedules reconciling adjusted interest expense, adjusted cost of funds, adjusted net interest income, and adjusted net interest spread to their related GAAP financial measures are provided within "Results of Operations". The following table presents a reconciliation of our GAAP net income to common shareholders to our core net operating income to common shareholders for the periods presented:
24
Three Months Ended | |||||||
March 31, | December 31, | ||||||
($ in thousands, except per share amounts) | 2017 | 2016 | |||||
GAAP net income to common shareholders | $ | 6,616 | $ | 66,758 | |||
Less: | |||||||
Accretion of de-designated cash flow hedges (1) | (99 | ) | (99 | ) | |||
Change in fair value of derivative instruments, net | (790 | ) | (56,686 | ) | |||
Loss on sale of investments, net | 1,708 | — | |||||
Fair value adjustments, net | (10 | ) | (17 | ) | |||
Core net operating income to common shareholders | $ | 7,425 | $ | 9,956 | |||
Weighted average common shares outstanding | 49,176 | 49,151 | |||||
Core net operating income per common share | $ | 0.15 | $ | 0.20 | |||
comprehensive loss as of June 30, 2013 as a result of discontinuing cash flow hedge accounting.
CRITICAL ACCOUNTING POLICIES
The discussion and analysis of our financial condition and results of operations are based in large part upon our consolidated financial statements, which have been prepared in accordance with GAAP. The preparation of our consolidated financial statements requires management to make estimates, judgments and assumptions that affect the reported amounts of assets, liabilities, revenues and expenses and disclosure of contingent assets and liabilities. We base these estimates and judgments on historical experience and assumptions believed to be reasonable under current facts and circumstances. Actual results, however, may differ from the estimated amounts we have recorded.
Critical accounting policies are defined as those that require management's most difficult, subjective or complex judgments, and which may result in materially different results under different assumptions and conditions. Our accounting policies that require the most significant management estimates, judgments, or assumptions, or that management believes includes the most significant uncertainties, and are considered most critical to our results of operations or financial position relate to fair value measurements, amortization of investment premiums, and other-than-temporary impairments. Our critical accounting policies are discussed in Part II, Item 7, “Management’s Discussion and Analysis of Financial Condition and Results of Operations” of our Annual Report on Form 10-K for the year ended December 31, 2016 under “Critical Accounting Policies”. There have been no significant changes in our critical accounting policies during the three months ended March 31, 2017.
FINANCIAL CONDITION
The following chart presents the amortized cost of our MBS investments by collateral type as of the end of each period presented:
25
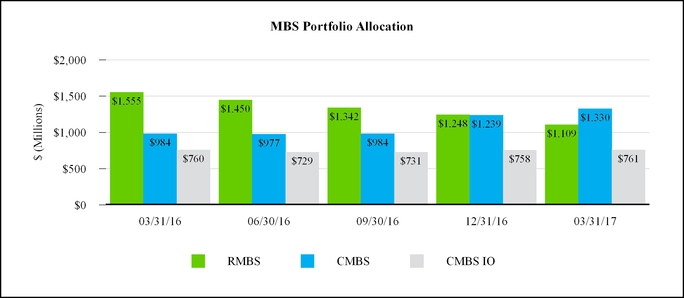
In addition to the sections below, please refer to Note 2 of the Notes to the Unaudited Consolidated Financial Statements contained within this Quarterly Report on Form 10-Q for additional information relating to our MBS. The following sections provide additional information on our investment portfolio as well as related financing.
During the first quarter of 2017, our portfolio composition continued to shift towards CMBS as we allocated capital returned on hybrid ARMs to primarily Agency CMBS. Our overall portfolio declined slightly from the end of 2016 as we reinvested less investment capital than we received back during the quarter. Subsequent to the end of the first quarter of 2017, we began modestly investing in to-be-announced forward contracts as a means of investing in Agency fixed-rate MBS given the attractive relative value opportunity in that asset.
CMBS
Our Agency CMBS are collateralized primarily by fixed rate mortgage loans secured by multifamily properties. Our non-Agency CMBS are collateralized by fixed rate mortgage loans secured by properties such as office, single-family rental, retail, and multifamily. Both Agency and non-Agency CMBS will generally have some form of prepayment protection provisions (such as prepayment lock-outs) or prepayment compensation provisions (such as yield maintenance or prepayment penalties) to prevent early voluntary prepayment of principal.
Activity related to our CMBS for the three months ended March 31, 2017 is as follows:
($ in thousands) | Agency CMBS | Non-Agency CMBS | Total | ||||||||
Balance as of December 31, 2016 | $ | 1,144,555 | $ | 78,216 | $ | 1,222,771 | |||||
Purchases | 103,139 | — | 103,139 | ||||||||
Principal payments | (11,222 | ) | (540 | ) | (11,762 | ) | |||||
Sales | — | — | — | ||||||||
(Premium amortization) discount accretion, net | (1,087 | ) | 439 | (648 | ) | ||||||
Change in fair value | 2,993 | (312 | ) | 2,681 | |||||||
Balance as of March 31, 2017 | $ | 1,238,378 | $ | 77,803 | $ | 1,316,181 | |||||
26
Since Agency CMBS are guaranteed by the GSEs with respect to return of principal, our credit exposure is limited to any premium on those securities. Non-Agency CMBS are not guaranteed and therefore our entire investment is exposed to credit losses from the underlying loans collateralizing the CMBS. The following table presents the par value, amortized cost, and weighted average months to estimated maturity of our CMBS investments as of the dates indicated by year of origination:
March 31, 2017 | December 31, 2016 | |||||||||||||||||||
($ in thousands) | Par Value | Amortized Cost | Months to Estimated Maturity (1) | Par Value | Amortized Cost | Months to Estimated Maturity (1) | ||||||||||||||
Year of Origination: | ||||||||||||||||||||
2008 and prior | $ | 50,141 | $ | 45,617 | 35 | $ | 57,771 | $ | 53,161 | 34 | ||||||||||
2009 to 2012 | 191,188 | 196,532 | 30 | 193,061 | 198,916 | 33 | ||||||||||||||
2013 to 2014 | 42,575 | 42,976 | 92 | 42,760 | 43,176 | 95 | ||||||||||||||
2015 | 681,745 | 685,175 | 108 | 683,680 | 687,214 | 111 | ||||||||||||||
2016 | 254,642 | 256,542 | 119 | 254,781 | 256,736 | 122 | ||||||||||||||
2017 | 102,152 | 103,136 | 121 | — | — | — | ||||||||||||||
$ | 1,322,443 | $ | 1,329,978 | 97 | $ | 1,232,053 | $ | 1,239,203 | 97 | |||||||||||
(1) | Months to estimated maturity is an average weighted by the amortized cost of the investment. |
The majority of the collateral underlying our non-Agency CMBS is comprised of single-family rental and multifamily properties. The following charts present the collateral underlying our non-Agency CMBS by property type as of the dates indicated:
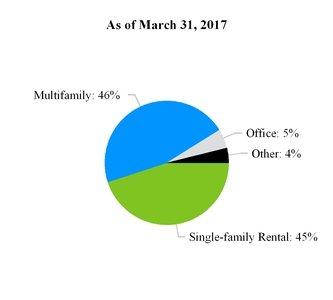
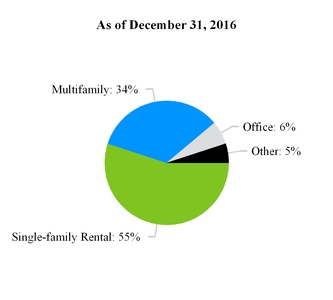
The collateral underlying our non-Agency CMBS investments is geographically dispersed in order to mitigate exposure to any particular region of the country. The U.S. state with the largest percentage of collateral underlying our non-Agency CMBS was Texas at 16% as of March 31, 2017, unchanged compared to December 31, 2016. The following charts present the geographic diversification of the collateral underlying our non-Agency CMBS by the top 5 states as of the dates indicated:
27
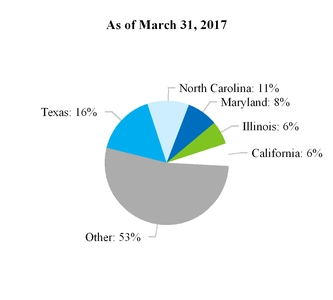
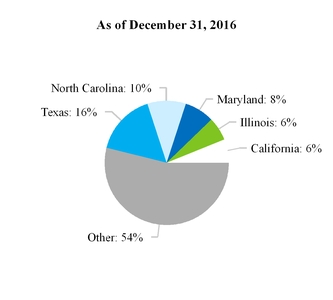
CMBS IO
The majority of our CMBS IO investments are collateralized primarily by fixed rate mortgage loans. Agency CMBS IO are exclusively collateralized by multifamily properties and are issued by securitization trusts sponsored by one of the GSEs. Non-Agency CMBS IO are secured by multifamily properties as well as office, retail, and hotel. Both types of CMBS IO have some form of prepayment protection (such as prepayment lock-outs or defeasance requirements) or prepayment compensation provisions (such as yield maintenance or prepayment penalties). Our CMBS IO investments are investment grade-rated with the majority rated 'AAA' by at least one of the nationally recognized statistical ratings organizations.
Activity related to our CMBS IO for the three months ended March 31, 2017 is as follows:
($ in thousands) (1) | Agency CMBS IO | Non-Agency CMBS IO | Total | ||||||||
Balance as of December 31, 2016 | $ | 411,898 | $ | 342,648 | $ | 754,546 | |||||
Purchases | 15,232 | 23,065 | 38,297 | ||||||||
Sales | — | — | — | ||||||||
Premium amortization, net | (19,623 | ) | (15,482 | ) | (35,105 | ) | |||||
Change in fair value | 5,034 | 6,627 | 11,661 | ||||||||
Balance as of March 31, 2017 | $ | 412,541 | $ | 356,858 | $ | 769,399 | |||||
(1) | Amounts shown for CMBS IO represent premium only and exclude underlying notional balances. |
Because income earned from CMBS IO is based on interest payments received on the underlying commercial mortgage loan pools, our return on these investments may be negatively impacted by any change in scheduled cash flows such as modifications of the mortgage loans or involuntary prepayments including defaults, foreclosures, and liquidations on or of the underlying mortgage loans prior to its contractual maturity date. In order to manage our exposure to credit performance, we generally invest in senior tranches of these securities and where we have evaluated the credit profile of the underlying loan pool and can monitor credit performance. In addition, to address changes in market fundamentals and the composition of mortgage loans collateralizing an investment, we consider the year of origination of the loans underlying CMBS IO in our selection of investments. The following table presents our CMBS IO investments as of March 31, 2017 by year of origination:
28
March 31, 2017 | December 31, 2016 | ||||||||||||||||||||
($ in thousands) | Amortized Cost | Fair Value | Remaining WAL (1) | Amortized Cost | Fair Value | Remaining WAL (1) | |||||||||||||||
Year of Origination: | |||||||||||||||||||||
2010 | $ | 8,656 | $ | 9,237 | 18 | $ | 9,456 | $ | 9,858 | 19 | |||||||||||
2011 | 32,640 | 34,415 | 22 | 35,130 | 36,897 | 23 | |||||||||||||||
2012 | 95,536 | 97,043 | 25 | 102,378 | 103,675 | 27 | |||||||||||||||
2013 | 122,835 | 123,952 | 32 | 128,891 | 129,011 | 33 | |||||||||||||||
2014 | 197,140 | 198,548 | 38 | 201,802 | 200,260 | 39 | |||||||||||||||
2015 | 192,351 | 193,814 | 44 | 198,016 | 194,886 | 45 | |||||||||||||||
2016 | 83,499 | 83,733 | 51 | 82,219 | 79,959 | 87 | |||||||||||||||
2017 | 28,426 | 28,657 | 53 | — | — | — | |||||||||||||||
$ | 761,083 | $ | 769,399 | 38 | $ | 757,892 | $ | 754,546 | 42 | ||||||||||||
(1) Remaining weighted average life ("WAL") represents an estimate of the number of months of interest earnings remaining for the investments by year of origination.
Approximately half of the collateral underlying our non-Agency CMBS IO is comprised of retail and multifamily properties. The following charts present the property type of the collateral underlying our non-Agency CMBS IO as of the dates indicated:
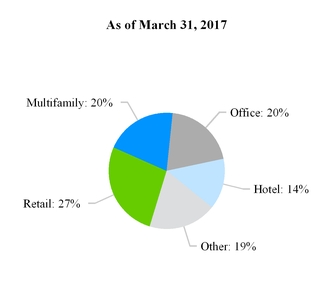
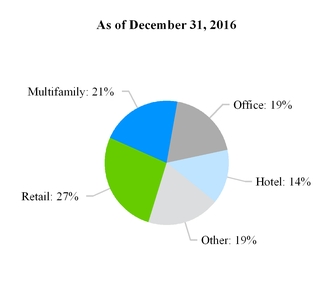
The collateral underlying our non-Agency CMBS IO investments is geographically dispersed in order to mitigate exposure to any particular region of the country. The U.S. state with the largest percentage of collateral underlying our non-Agency CMBS IO was California at 14% as of March 31, 2017, unchanged compared to December 31, 2016. The following charts present the geographic diversification of the collateral underlying our non-Agency CMBS IO by the top 5 states as of the dates indicated:
29
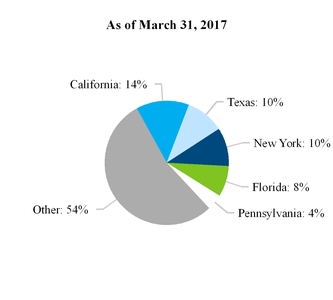
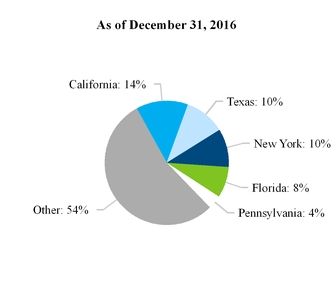
RMBS
Activity related to our RMBS for the three months ended March 31, 2017 is as follows:
($ in thousands) | Agency RMBS | Non-Agency RMBS | Total | ||||||||
Balance as of December 31, 2016 | $ | 1,201,205 | $ | 33,562 | $ | 1,234,767 | |||||
Purchases | — | — | — | ||||||||
Principal payments | (69,234 | ) | (7,130 | ) | (76,364 | ) | |||||
Sales | (58,872 | ) | — | (58,872 | ) | ||||||
Net (amortization) accretion | (4,110 | ) | 14 | (4,096 | ) | ||||||
Change in fair value | 5,690 | 44 | 5,734 | ||||||||
Balance as of March 31, 2017 | $ | 1,074,679 | $ | 26,490 | $ | 1,101,169 | |||||
Agency RMBS. As of March 31, 2017, the majority of our variable-rate Agency RMBS portfolio resets based on one-year LIBOR, which was approximately 1.80% as of March 31, 2017 compared to 1.69% as of December 31, 2016. Of these investments, approximately 30% will reset their coupon within the next twelve months at a weighted average margin of 1.79% above one-year LIBOR. During the three months ended March 31, 2017, we sold certain lower yielding Agency ARMs that were at or near their interest rate reset periods and expected to reset at interest rates lower than their current coupon.
The underlying mortgage loans for variable-rate RMBS are subject to periodic interest rate caps which limit the amount by which the security’s coupon rate may change during any given period and lifetime interest rate caps which limit the maximum interest rate on the loans collateralizing these securities. As shown in the table below, our variable-rate Agency RMBS are generally well within their periodic and lifetime interest rate caps. The following table presents certain interest rate information for these investments by weighted average months to reset ("MTR") as of the dates indicated:
30
March 31, 2017 | |||||||||||||||
($ in thousands) | Par Value | Reset Margin to LIBOR | WAC | WAVG Periodic Interest Cap | WAVG Life Interest Cap | ||||||||||
0-12 MTR | 314,145 | 1.79 | % | 3.24 | % | 2.97 | % | 9.54 | % | ||||||
13-36 MTR | 152,848 | 1.78 | % | 3.07 | % | 5.00 | % | 8.07 | % | ||||||
37-60 MTR | 197,687 | 1.81 | % | 3.38 | % | 5.00 | % | 8.38 | % | ||||||
61-84 MTR | 358,330 | 1.67 | % | 2.66 | % | 5.00 | % | 7.66 | % | ||||||
85-120 MTR | 10,725 | 1.62 | % | 3.17 | % | 5.00 | % | 8.17 | % | ||||||
Total | $ | 1,033,735 | 1.75 | % | 3.04 | % | 4.38 | % | 8.44 | % | |||||
December 31, 2016 | |||||||||||||||
Par Value | Reset Margin to LIBOR | WAC | WAVG Periodic Interest Cap | WAVG Life Interest Cap | |||||||||||
0-12 MTR | 335,476 | 1.80 | % | 3.17 | % | 2.98 | % | 9.59 | % | ||||||
13-36 MTR | 225,272 | 1.79 | % | 3.18 | % | 5.00 | % | 8.19 | % | ||||||
37-60 MTR | 151,578 | 1.80 | % | 3.51 | % | 5.00 | % | 8.51 | % | ||||||
61-84 MTR | 423,749 | 1.70 | % | 2.71 | % | 5.00 | % | 7.71 | % | ||||||
85-120 MTR | 21,183 | 1.59 | % | 3.13 | % | 5.00 | % | 8.13 | % | ||||||
Total | $ | 1,157,258 | 1.76 | % | 3.05 | % | 4.41 | % | 8.46 | % | |||||
Non-Agency RMBS. Our non-Agency RMBS portfolio consists primarily of senior tranches of securitizations collateralized by non-performing loans and re-performing loans which receive monthly principal and interest payments and have estimated average lives remaining in a range of one and two years. These securities have coupon step-up features of 3.0% if the securities are not fully repaid or redeemed by their expected maturity date which is generally three years from issuance. Although these investments do not have a credit rating issued by any of the nationally recognized statistical ratings organization, they have substantial credit enhancement within the securitization structure, and we have not experienced any losses of principal on these investments to date.
Derivative Assets and Liabilities
We use derivative instruments to hedge our earnings and book value exposure to fluctuations in interest rates. We regularly monitor and adjust our hedging portfolio in response to many factors including, but not limited to, changes in our investment portfolio, shifts in the yield curve, and our expectations with respect to the future path of interest rates and interest rate volatility.
The following graphs present the notional balance and net weighted average pay-fixed rate for our derivatives as of their effective dates:
31
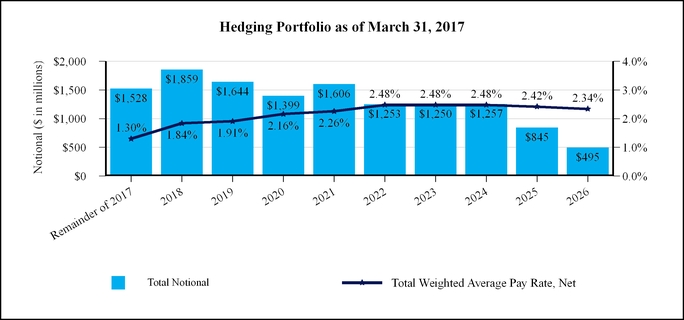
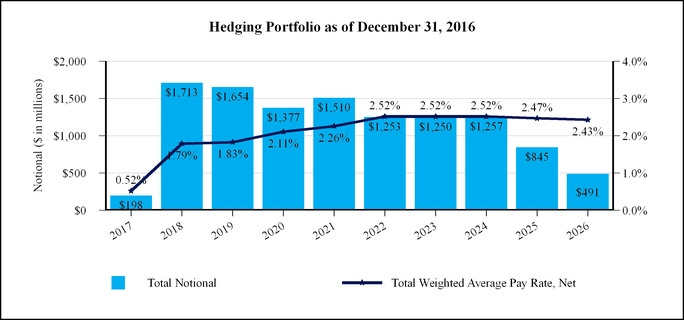
During the three months ended March 31, 2017, we added interest rate swaps with a combined notional of $1.4 billion at a net weighted average pay-fixed rate of 1.35%, including $1.3 billion in 1-year pay-fixed interest rate swaps with a weighted average pay-fixed rate of 1.27%. We terminated $0.4 million in pay-fixed interest rate swaps with a weighted average pay-fixed rate of 1.89%. In addition, we terminated $0.3 million receive fixed interest rate swaps with a weighted average receive rate of 1.89%. The derivative activity was a result of adjustments to our hedging portfolio in response to many market factors including, but not limited to, changes in our investment allocations, shifts in the yield curve, and expectations with respect to the future path of interest rates and interest rate volatility.
The following table summarizes the activity related to our net derivative asset or liability during the three months ended March 31, 2017:
32
($ in thousands) | March 31,2017 | ||
Beginning balance | $ | 21,612 | |
Net payment (receipt) upon termination | (2,409 | ) | |
Periodic net cash payments | (685 | ) | |
Settlement of variation margin (1) | (18,480 | ) | |
Change in fair value | 791 | ||
Accrued interest payable | (615 | ) | |
Ending balance | $ | 214 | |
(1) | As of January 2017 margin requirements from fluctuations in fair value of the Company's cleared interest rate swaps are settled daily with the Chicago Mercantile Exchange ("CME"). |
Repurchase Agreements
The majority of our repurchase agreement borrowings are collateralized with Agency MBS which have historically had lower liquidity risk than non-Agency MBS. The following table presents the amount pledged and leverage against the fair value of our non-Agency MBS investments by credit rating as of March 31, 2017 and December 31, 2016:
March 31, 2017 | December 31, 2016 | ||||||||||||||||||||||
($ in thousands) | Fair Value | Amount Pledged | Related Borrowings | Fair Value | Amount Pledged | Related Borrowings | |||||||||||||||||
Non-Agency CMBS: | |||||||||||||||||||||||
AAA | $ | 35,453 | $ | 35,145 | $ | 31,844 | $ | 35,405 | $ | 35,313 | $ | 32,266 | |||||||||||
AA | 14,094 | 14,067 | 11,619 | 14,127 | 14,105 | 11,665 | |||||||||||||||||
A | 18,565 | 18,491 | 15,722 | 18,614 | 18,549 | 15,831 | |||||||||||||||||
Below A/Not Rated | 9,691 | 9,494 | 6,142 | 10,070 | 9,873 | 7,119 | |||||||||||||||||
$ | 77,803 | $ | 77,197 | $ | 65,327 | $ | 78,216 | $ | 77,840 | $ | 66,881 | ||||||||||||
Non-Agency CMBS IO: | |||||||||||||||||||||||
AAA | $ | 297,454 | $ | 295,985 | $ | 251,548 | $ | 290,092 | $ | 289,608 | $ | 246,412 | |||||||||||
AA | 47,981 | 46,896 | 40,491 | 46,986 | 45,995 | 40,026 | |||||||||||||||||
A | 779 | 775 | 675 | — | — | — | |||||||||||||||||
Below A/Not Rated | 10,644 | 10,627 | 9,288 | 5,570 | 5,536 | 4,761 | |||||||||||||||||
$ | 356,858 | $ | 354,283 | $ | 302,002 | $ | 342,648 | $ | 341,139 | $ | 291,199 | ||||||||||||
Non-Agency RMBS: | |||||||||||||||||||||||
Below A/Not Rated | $ | 26,490 | $ | 24,944 | $ | 20,800 | $ | 33,562 | $ | 31,952 | $ | 26,149 | |||||||||||
$ | 26,490 | $ | 24,944 | $ | 20,800 | $ | 33,562 | $ | 31,952 | $ | 26,149 | ||||||||||||
Please refer to Note 3 of the Notes to the Unaudited Consolidated Financial Statements contained within this Quarterly Report on Form 10-Q as well as "Interest Expense and Cost of Funds" within "Results of Operations" and “Liquidity and Capital Resources” contained within this Item 2 for additional information relating to our borrowings.
Shareholder's Equity
Shareholder's equity increased 5.4% during the first quarter of 2017 primarily due to changes in accumulated other comprehensive loss ("AOCL"). The decrease in AOCL since December 31, 2016 resulted primarily from credit spread tightening for the majority of our MBS which increased their fair value during the first quarter of 2017 by $18.4 million, net of realized losses on sales of MBS recognized in GAAP net income. The increase in fair value of MBS during the first quarter of 2017, net of realized losses on sales of MBS, impacted book value per common share by approximately $0.37. The following table provides the accumulated unrealized holding gains (losses) by type of MBS and the remaining balance of de-designated cash flow hedges comprising AOCL as of the periods indicated:
33
($ in thousands) | March 31, 2017 | December 31, 2016 | |||||
Agency RMBS | $ | (7,429 | ) | $ | (13,119 | ) | |
Non-Agency RMBS | 58 | 14 | |||||
Agency CMBS | (19,303 | ) | (22,295 | ) | |||
Non-Agency CMBS | 5,155 | 5,467 | |||||
Agency CMBS IO | 5,195 | 161 | |||||
Non-Agency CMBS IO | 3,121 | (3,507 | ) | ||||
De-designated cash flow hedges | 571 | 670 | |||||
Accumulated other comprehensive loss | $ | (12,632 | ) | $ | (32,609 | ) | |
On March 31, 2017, the Company entered into an amended and restated equity distribution agreement pursuant to which the Company may offer and sell up to 7,416,520 shares of common stock of the Company from time to time through its sales agent in at-the-market ("ATM") offerings. We did not issue any shares of common pursuant to this agreement during the first quarter of 2017.
During the first quarter of 2017, we issued 325,201 shares of Series B Preferred Stock under our preferred stock ATM program at a discount of approximately 7.7% to the liquidation value of $25.00 per share. Cash proceeds were $7.5 million, net of 2% broker commissions and other fees, which impacted book value per common share by approximately $(0.01). We used the cash proceeds primarily to purchase additional CMBS and CMBS IO during the quarter.
RESULTS OF OPERATIONS
The discussions below provide information on items on our consolidated statements of comprehensive income. These discussions include both GAAP and non-GAAP financial measures which management utilizes in its internal analysis of financial and operating performance. Please read the section "Non-GAAP Financial Measures" at the end of "Executive Overview" in Part 1, Item 2 of this Quarterly Report on Form 10-Q for additional important information about these measures.
Net Interest Income and Net Interest Spread
The tables below present GAAP net interest income and related net interest spread for our interest-earning assets and interest-bearing liabilities and also present adjusted net interest income and adjusted net interest spread, which are non-GAAP measures. Adjusted net interest income and adjusted net interest spread include net periodic interest costs of derivative instruments as part of interest expense ("adjusted interest expense" which is discussed and reconciled later in this section) whereas GAAP net interest income and GAAP net interest spread do not.
Three Months Ended | |||||||||||||
March 31, | |||||||||||||
2017 | 2016 | ||||||||||||
($ in thousands) | Amount | Yield | Amount | Yield | |||||||||
GAAP interest income | $ | 22,419 | 2.79 | % | $ | 25,089 | 2.78 | % | |||||
GAAP interest expense | 7,519 | 1.06 | % | 6,310 | 0.81 | % | |||||||
GAAP net interest income/spread | 14,900 | 1.73 | % | 18,779 | 1.97 | % | |||||||
Less: (accretion) amortization of de-designated cash flow hedges (1) | (99 | ) | (0.01 | )% | 27 | — | % | ||||||
Add: net periodic interest costs of derivative instruments | (615 | ) | (0.09 | )% | (1,680 | ) | (0.21 | )% | |||||
Adjusted net interest income/spread | $ | 14,186 | 1.63 | % | $ | 17,126 | 1.76 | % | |||||
Average interest earning assets (2) | $ | 3,206,026 | $ | 3,429,875 | |||||||||
Average balance of borrowings (3) | $ | 2,850,092 | $ | 3,095,490 | |||||||||
(1) | Included in GAAP interest expense and relates to the amortization of the balance remaining in accumulated other comprehensive loss as of June 30, 2013 as a result of discontinuing cash flow hedge accounting. |
(2) | Average balances are calculated as a simple average of the daily amortized cost and exclude unrealized gains and losses as well as securities pending settlement if applicable. |
34
(3) | Average balances are calculated as a simple average of the daily borrowings outstanding for both repurchase agreement and non-recourse collateralized financing. |
Net interest income and adjusted net interest income decreased for the three months ended March 31, 2017 compared to the three months ended March 31, 2016 primarily due to a smaller investment portfolio, lower prepayment penalty compensation, and higher borrowing costs during the three months ended March 31, 2017. The impact of higher borrowing costs on adjusted net interest income was partially offset by a decrease of $1.1 million in net periodic interest costs on our derivative instruments for the first quarter of 2017 compared to the same period in 2016. The declines in net interest spread and adjusted net interest spread for the three months ended March 31, 2017 compared to the three months ended March 31, 2016 were due to higher borrowing costs during the first quarter of 2017. Details on these and other factors impacting the net interest earnings of our investment portfolio are provided below.
Interest Income and Effective Yields on MBS
Interest income includes gross interest earned from the coupon rate on the securities, premium amortization and discount accretion, and other interest income resulting from prepayment penalty income or other yield maintenance items on CMBS and CMBS IO securities. Effective yields are calculated by dividing gross interest income and scheduled premium amortization/discount accretion (both of which are annualized for any reporting period less than 12 months) by the average balance of investments outstanding during the reporting period. Effective yields also include prepayment penalty income as well as adjustments to premium amortization/discount accretion that arise when we change our prepayment projections and when actual prepayments differ from previously projected prepayments (collectively, "prepayment adjustments"); however, because these amounts are not annualized, they receive less weight when calculating effective yield as a percentage of the average balance than gross interest income and scheduled amortization. The following table presents details on average balances, interest income, and effective yields of MBS for the periods indicated:
Three Months Ended | |||||||||||||
March 31, | |||||||||||||
2017 | 2016 | ||||||||||||
($ in thousands) | Amount | Yield | Amount | Yield | |||||||||
CMBS: | |||||||||||||
Coupon and scheduled amortization | $ | 9,196 | 2.96 | % | $ | 8,266 | 3.22 | % | |||||
Prepayment adjustments (1) | 64 | 0.01 | % | 1,093 | 0.11 | % | |||||||
9,260 | 2.97 | % | 9,359 | 3.33 | % | ||||||||
Average balance | 1,240,857 | 1,017,593 | |||||||||||
CMBS IO: | |||||||||||||
Coupon and scheduled amortization | 7,224 | 3.81 | % | 7,404 | 3.82 | % | |||||||
Prepayment adjustments (1) | 1,097 | 0.14 | % | 257 | 0.03 | % | |||||||
8,321 | 3.96 | % | 7,661 | 3.85 | % | ||||||||
Average balance | 757,635 | 775,388 | |||||||||||
RMBS: | |||||||||||||
Coupon and scheduled amortization | 5,729 | 1.93 | % | 7,674 | 1.90 | % | |||||||
Prepayment adjustments (1) | (1,153 | ) | (0.10 | )% | 146 | 0.01 | % | ||||||
4,576 | 1.83 | % | 7,820 | 1.91 | % | ||||||||
Average balance | 1,188,616 | 1,613,104 | |||||||||||
Total MBS interest income and effective yield: | $ | 22,157 | 2.78 | % | $ | 24,840 | 2.78 | % | |||||
Total average balance: | $ | 3,187,108 | $ | 3,406,085 | |||||||||
(1) | Prepayment adjustments represent effective interest amortization adjustments related to changes in actual and projected prepayment speeds for RMBS and prepayment compensation, net of amortization for CMBS and CMBS IO. |
Interest income from MBS for the three months ended March 31, 2017 decreased compared to the three months ended March 31, 2016 primarily due to a lower average balance of RMBS, lower prepayment penalty compensation from CMBS, and
35
an increase in "catch up" premium amortization on RMBS as a result of changes in projected prepayment speeds. The following table presents the estimated impact of changes in average balances, yields, and prepayment adjustments on interest income for the three months ended March 31, 2017 compared to the three months ended March 31, 2016:
Three Months Ended | |||||||||||||||
March 31, 2017 vs. March 31, 2016 | |||||||||||||||
Increase (Decrease) in Interest Income | Due to Change In | ||||||||||||||
($ in thousands) | Average Balance | Coupon and Scheduled Amortization | Prepayment Adjustments (1) | ||||||||||||
CMBS | $ | (99 | ) | $ | 1,173 | $ | (243 | ) | $ | (1,029 | ) | ||||
CMBS IO | 660 | (177 | ) | (3 | ) | 840 | |||||||||
RMBS | (3,244 | ) | (2,089 | ) | 144 | (1,299 | ) | ||||||||
Total | $ | (2,683 | ) | $ | (1,093 | ) | $ | (102 | ) | $ | (1,488 | ) | |||
(1) | Prepayment adjustments represent effective interest amortization adjustments resulting from changes in actual and projected prepayment speeds including prepayment compensation received. |
Interest income from CMBS for the three months ended March 31, 2017 declined slightly compared to the three months ended March 31, 2016. Although our CMBS portfolio was approximately 22% larger for the first quarter of 2017 compared to same period in 2016, the effective yield earned on the current portfolio was lower due primarily to less prepayment penalty compensation during the first quarter of 2017. In addition, CMBS purchases since March 31, 2016 were at a lower average yield than the average CMBS yield as of March 31, 2016 as a result of lower rates and/or tighter spreads. The weighted yield on our Agency CMBS for the three months ended March 31, 2017 was 2.73% compared to 3.01% for the three months ended March 31, 2016.
Interest income and effective yield for CMBS IO for the three months ended March 31, 2017 increased compared to the three months ended March 31, 2016 despite having a lower average balance of CMBS IO during the first quarter of 2017. These increases were due to an increase in prepayment penalty income of $0.8 million for the three months ended March 31, 2017 versus the same period in 2016.
Interest income declined on RMBS primarily due to a decrease in the average balance of approximately (26)% for the three months ended March 31, 2017 compared to the same period in 2016. Effective yield on RMBS for the three months ended March 31, 2017 was 8 basis points lower compared to the same period in 2016 due to an increase in premium amortization adjustments on RMBS as a result of changes in projected prepayment speeds. The rate at which we amortize the premiums we pay for our investments is impacted by actual and forecasted prepayments, which is measured by the constant prepayment rate ("CPR") for Agency RMBS. We increased our projected CPR on our Agency RMBS for the second quarter of 2017. The following graph shows our actual 3 month average CPRs for Agency RMBS for the periods indicated:
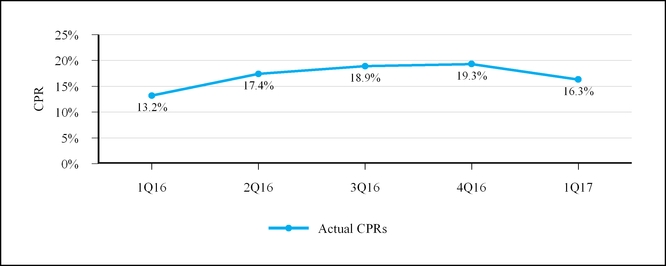
36
Interest Expense and Cost of Funds
The following table summarizes the components of interest expense as well as average balances and cost of funds for the periods indicated:
Three Months Ended | |||||||
March 31, | |||||||
($ in thousands) | 2017 | 2016 | |||||
Interest expense on repurchase agreement borrowings | $ | 7,596 | $ | 5,828 | |||
Interest expense on FHLB advances | — | 436 | |||||
(Accretion) amortization of de-designated cash flow hedges (1) | (99 | ) | 27 | ||||
Non-recourse collateralized financing | 22 | 19 | |||||
Total interest expense | $ | 7,519 | $ | 6,310 | |||
Average balance of repurchase agreements | $ | 2,843,733 | $ | 2,688,633 | |||
Average balance of FHLB advances | — | 398,560 | |||||
Average balance of non-recourse collateralized financing | 6,359 | 8,297 | |||||
Average balance of borrowings | $ | 2,850,092 | $ | 3,095,490 | |||
Cost of funds | 1.06 | % | 0.81 | % | |||
(1) | Amount recorded in accordance with GAAP related to accretion or amortization of the balance remaining in accumulated other comprehensive loss as of June 30, 2013 as a result of our discontinuation of cash flow hedge accounting. |
(2) | Cost of funds is calculated by dividing total interest expense by the total average balance of borrowings outstanding during the period with an assumption of 360 days in a year. |
The following table presents the estimated impact of the change in average balances and borrowing rates of secured borrowings as well as other differences in interest expense for the comparative periods presented:
($ in thousands) | Three Months Ended March 31, 2017 vs. March 31, 2016 | ||
Change in borrowing rates on repurchase agreements and FHLB advances | $ | 1,797 | |
Change in average balance of repurchase agreements and FHLB advances | (465 | ) | |
Decrease in amortization of de-designated cash flow hedges | (126 | ) | |
Decrease in non-recourse collateralized financing and other interest expense | 3 | ||
Total change in interest expense | $ | 1,209 | |
The increase in interest expense for the three months ended March 31, 2017 compared to the three months ended March 31, 2016 was primarily due to higher borrowing rates on our repurchase agreement financings. Our average borrowing rate on our repurchases agreements increased 21 basis points for the first quarter of 2017 compared to the same period in 2016. Our borrowing rates were impacted by increases in short-term interest rates, particularly one-month LIBOR which averaged 0.83% during the three months ended March 31, 2017 compared to 0.43% during the three months ended March 31, 2016. In addition, during the first quarter of 2016 we had financing available to us through the Federal Home Loan Bank ("FHLB") of Indianapolis, which allowed us to finance a portion of our MBS at lower financing rates than available to us from our traditional repurchase agreement counterparties. As a result of a final rule issued by the Federal Housing Finance Administration ("FHFA") in January 2016 regarding the exclusion of captive insurance entities from membership in the FHLB, our wholly owned subsidiary has terminated its membership in the FHLB of Indianapolis and is no longer permitted to borrow from this facility.
Adjusted Interest Expense and Adjusted Cost of Funds
Because we use derivative instruments as economic hedges of our interest rate risk exposure, management considers net periodic interest costs from derivative instruments to be an additional cost of financing investments. As such, management uses the non-GAAP financial measures "adjusted interest expense" and related "adjusted costs of funds" which include the net periodic interest costs of our effective derivative instruments excluded from GAAP interest expense. Please read the section "Non-GAAP
37
Financial Measures" at the end of "Executive Overview" in Part 1, Item 2 of this Quarterly Report on Form 10-Q for additional important information and for reconciliations of these measures to GAAP measures. The table below presents the reconciliation of GAAP interest expense and cost of funds to our adjusted interest expense and adjusted cost of funds for the periods indicated:
Three Months Ended | |||||||||||||
March 31, | |||||||||||||
2017 | 2016 | ||||||||||||
($ in thousands) | Amount | Rate | Amount | Rate | |||||||||
Interest expense/cost of funds | $ | 7,519 | 1.06 | % | $ | 6,310 | 0.81 | % | |||||
Less: accretion (amortization) of de-designated cash flow hedges (1) | 99 | 0.01 | % | (27 | ) | — | % | ||||||
Add: net periodic interest costs of derivative instruments | 615 | 0.09 | % | 1,680 | 0.21 | % | |||||||
Adjusted interest expense/adjusted cost of funds | $ | 8,233 | 1.16 | % | $ | 7,963 | 1.02 | % | |||||
(1) | Amount recorded as a portion of "interest expense" in accordance with GAAP and is related to the accretion (amortization) of the balance in accumulated other comprehensive loss as of June 30, 2013 related to the derivatives for which we discontinued cash flow hedge accounting. |
Adjusted interest expense was $0.3 million higher for the three months ended March 31, 2017 compared to the same period in the prior year due to the increase in repurchase agreement borrowing costs mentioned previously. This increase was partially offset by a decrease of $1.1 million in net periodic interest costs of derivative instruments which is discussed below in "Gain (Loss) on Derivative Instruments, Net".
Gain (Loss) on Derivative Instruments, Net
The following table provides information on the components of our "gain (loss) on derivative instruments, net" for the periods indicated:
Three Months Ended | |||||||||||||||||||||||
March 31, | |||||||||||||||||||||||
($ in thousands) | 2017 | 2016 | |||||||||||||||||||||
Type of Derivative Instrument | Net Periodic Interest Costs | Change in Fair Value (1) | Total | Net Periodic Interest Costs | Change in Fair Value (1) | Total | |||||||||||||||||
Receive-fixed interest rate swaps | $ | 697 | $ | (831 | ) | $ | (134 | ) | $ | 1,423 | $ | 9,111 | $ | 10,534 | |||||||||
Pay-fixed interest rate swaps | (1,312 | ) | 1,621 | 309 | (3,103 | ) | (43,509 | ) | (46,612 | ) | |||||||||||||
Eurodollar futures | — | — | — | — | (12,186 | ) | (12,186 | ) | |||||||||||||||
Gain (loss) on derivative instruments, net | $ | (615 | ) | $ | 790 | $ | 175 | $ | (1,680 | ) | $ | (46,584 | ) | $ | (48,264 | ) | |||||||
(1) | Amount shown includes unrealized gains (losses) from current and forward starting derivative instruments and realized gains (losses) from terminated derivative instruments. |
Gain (loss) on derivative instruments, net includes the change in fair value of current and forward-starting derivative instruments as well as net periodic interest costs of current receive-fixed and pay-fixed interest rate swaps held during the period. Changes in the fair value of derivative instruments and net periodic interest costs are impacted by changing market interest rates in any given period. In addition, because we continually monitor our hedge positioning and make changes based on management's view of the future path of interest rates and where we believe hedges will be most effective in relation to our capital allocation and interest rate risk, gains or losses on derivative instruments will also fluctuate based on the notional amount, maturity, and interest rate of our derivatives held during the period. Because of the changes made to derivatives in our hedging portfolio from one reporting period to the next, results of any given reporting period are generally not comparable to results of another.
As a result of our recent purchases of CMBS and in order to mitigate exposure to an increasing interest rate environment, we made changes to our hedging portfolio. During the three months ended March 31, 2017, we terminated derivatives with a fair value of $2.4 million. The fair value of our derivatives increased $0.8 million for the three months ended March 31, 2017 as a result of slightly higher interest rates compared to a decline in fair value of $(46.6) million for the three months ended March 31, 2016 due to the decline in interest rates primarily from 2019 and further out on the curve.
38
Net periodic interest costs for the three months ended March 31, 2017 were $1.1 million lower than the same period in 2016. Though our average notional balance of effective interest rate swaps outstanding was higher during the first quarter of 2017 compared to the first quarter of 2016, the weighted average pay-fixed rate was 9 basis points lower. In addition, because interest rates were higher during the first quarter of 2017 compared to the same period in 2016, we received more interest for the variable rate portion of our pay-fixed interest rate swaps during the first quarter of 2017 compared to the same period in 2016. The table below provides the average notional balances and weighted average net pay-fixed rates of our interest rate swaps effective during the periods indicated (excluding forward-starting interest rate swaps):
Three Months Ended | |||||||
March 31, | |||||||
($ in thousands) | 2017 | 2016 | |||||
Average notional balance | $ | 1,292,556 | $ | 936,593 | |||
Weighted average net pay-fixed rate | 1.16 | % | 1.25 | % | |||
Gain (Loss) on Sale of Investments, Net
Sales of our investments occur in the ordinary course of business as we manage our risk, capital and liquidity profiles, and as we allocate capital to preferred investment opportunities. The following tables provide information related to our loss on sale of investments, net for the periods indicated:
Three Months Ended | |||||||||||||||
March 31, | |||||||||||||||
2017 | 2016 | ||||||||||||||
($ in thousands) | Amortized cost basis sold | Loss on sale of investments, net | Amortized cost basis sold | Loss on sale of investments, net | |||||||||||
Agency RMBS | $ | 58,872 | $ | (1,708 | ) | $ | 46,603 | $ | (2,713 | ) | |||||
Non-Agency CMBS | — | — | 34,868 | (1,228 | ) | ||||||||||
$ | 58,872 | $ | (1,708 | ) | $ | 81,471 | $ | (3,941 | ) | ||||||
We sold lower yielding Agency RMBS during the first quarter of 2017 and used the sale proceeds primarily to reinvest into Agency CMBS. Agency RMBS we sold during the first quarter of 2016 were lower yielding ARMs that were at or near their interest rate reset periods and which were expected to reset at interest rates lower than their current coupon. Agency CMBS sold during the first quarter of 2016 were yielding significantly below the portfolio average. Sale proceeds were used to pay down repurchase agreement borrowings during the first quarter of 2016.
General and Administrative Expenses
General and administrative expenses for the three months ended March 31, 2017 were $0.2 million higher compared to the same period in 2016 primarily due to higher legal and litigation expenses. Additionally, compensation and benefits increased slightly related to bonus accrual adjustments.
Other Comprehensive Income
The following table provides detail on the changes in fair value by type of MBS which are recorded as unrealized gains (losses) in other comprehensive income on our consolidated statements of operations for the periods indicated:
39
Three Months Ended | |||||||
March 31, | |||||||
($ in thousands) | 2017 | 2016 | |||||
Agency RMBS | $ | 5,690 | $ | 11,135 | |||
Non-Agency RMBS | 44 | 198 | |||||
Agency CMBS | 2,993 | 28,581 | |||||
Non-Agency CMBS | (312 | ) | 1,591 | ||||
Agency CMBS IO | 5,034 | 997 | |||||
Non-Agency CMBS IO | 6,627 | (801 | ) | ||||
Unrealized gain on available-for-sale investments | $ | 20,076 | $ | 41,701 | |||
During the three months ended March 31, 2017, the increase in fair value of MBS of $20.1 million was due to credit spread tightening, particularly on CMBS IO investments. During the three months ended March 31, 2016, the increase in fair value of MBS of $41.7 million was due to increases in interest rates, partially offset by credit spread widening.
LIQUIDITY AND CAPITAL RESOURCES
Our primary sources of liquidity include borrowings under repurchase arrangements and monthly principal and interest payments we receive on our investments. Additional sources may also include proceeds from the sale of investments, equity offerings, and payments received from counterparties from interest rate swap agreements. We use our liquidity to manage our business including funding investment purchases and other operating costs, repaying borrowings and meeting margin calls from our lenders, making payments to counterparties as required under interest rate swap agreements, and to pay dividends on our preferred and common stock. We may also use liquidity to repurchase shares of our stock.
Our liquid assets fluctuate based on our investment activities and changes in the fair value of our MBS and derivative instruments. We seek to maintain sufficient liquidity to support our operations and to meet our anticipated liquidity demands, including potential margin calls from lenders (as discussed further below). We measure, manage, and forecast our liquidity on a daily basis. Our available liquid assets include unrestricted cash and cash equivalents, unencumbered Agency MBS, and certain unencumbered non-Agency MBS that can be pledged as collateral for margin calls or converted reasonably quickly into cash. As of March 31, 2017, our available liquid assets were $182.7 million, which consisted of unrestricted cash and cash equivalents of $65.9 million and unencumbered Agency MBS of $116.8 million, compared to $138.1 million as of December 31, 2016.
We perform sensitivity analysis on our liquidity based on changes in the fair value of our investments due to changes in interest rates, credit spreads, lender haircuts and prepayment speeds as well as changes in our derivative instruments due to changes in interest rates. In performing this analysis we will also consider the current state of the fixed income markets and the repurchase agreement markets in order to determine if market forces such as supply-demand imbalances or structural changes to these markets could change the liquidity of MBS or the availability of financing. The objective of our analysis is to assess the adequacy of our liquidity to withstand potential adverse events. We may change our leverage targets based on market conditions and our perceptions of the liquidity of our investments.
We closely monitor our debt-to-invested equity ratio (which is the ratio of debt financing to invested equity for any investment) as part of our liquidity management process as well as our overall enterprise level debt-to-equity ratio. We also monitor the ratio of our available liquidity to outstanding repurchase agreement borrowings, which fluctuates due to changes in the fair value of collateral we have pledged to our lenders. On an enterprise level basis, our current operating policies limit our total liabilities-to-shareholders' equity to 8 times our shareholders' equity. Our total liabilities decreased to 5.8 times shareholders' equity as of March 31, 2017 from 6.3 times as of December 31, 2016 due to lower total liabilities and higher total shareholders' equity. Our total liabilities declined during the first quarter of 2017 primarily because our payments on secured borrowings outpaced our financing of MBS purchases. Our total shareholders' equity increased primarily as a result of the increase in fair value of MBS recorded in accumulated other comprehensive loss as well as issuances of Series B Preferred Stock through our preferred stock ATM program during the quarter.
We have historically had ample sources of liquidity to fund our activities and operations. The ability to fund our operations in the future depends in large measure on the availability of credit through repurchase agreement financing and the liquidity of our investments. Credit markets have historically experienced brief periods of extreme volatility such as what occurred in 2008 and 2009. Such events are typically marked by concerns regarding counterparty credit, severe market illiquidity, and steep declines
40
in asset prices. In recent periods U.S. financial regulatory agencies (such as the Office of Financial Research in the U.S. Treasury and the Federal Reserve) have expressed some concern about the stability of repurchase agreement financing for mortgage REITs in a sharply rising interest rate environment, and regulatory reform in the form of certain provisions of the Basel III capital framework (and supplemental bank capital rules) and the Dodd-Frank Wall Street Reform and Consumer Protection Act could impact the overall availability of credit by restricting the number of repurchase agreement lenders and the credit made available by such lenders. In times of severe market stress, repurchase agreement availability could be rapidly reduced and the terms on which we can borrow could be materially altered, particularly given the focus on these markets by the federal financial and banking regulators. Competition from other REITs, banks, hedge funds, and the federal government for capacity with our repurchase agreement lenders could also reduce our repurchase agreement availability. While we do not anticipate such events in the near term, a reduction in our borrowing capacity could force us to sell assets in order to repay our lenders or could otherwise restrict our ability to operate our business.
Depending on our liquidity levels, investment opportunities, the condition of the credit markets, and other factors, we may from time to time consider the issuance of debt, equity, or other securities. We may also sell investments in order to provide additional liquidity for our operations. While we will attempt to avoid dilutive or otherwise costly issuances, depending on market conditions and in order to manage our liquidity, we could be forced to issue equity or debt securities which are dilutive to our capital base or our profitability.
Repurchase Agreements
The following table presents information regarding the balances of our repurchase agreement borrowings for the periods indicated:
($ in thousands) | Balance Outstanding As of Quarter End | Average Balance Outstanding For the Quarter Ended | Maximum Balance Outstanding During the Quarter Ended | ||||||||
March 31, 2017 | $ | 2,825,945 | $ | 2,843,733 | $ | 2,913,617 | |||||
December 31, 2016 | 2,898,952 | 2,768,769 | 2,938,745 | ||||||||
September 30, 2016 | 2,478,278 | 2,536,562 | 2,599,491 | ||||||||
June 30, 2016 | 2,600,480 | 2,645,431 | 2,722,019 | ||||||||
March 31, 2016 | 2,722,019 | 2,688,633 | 2,838,607 | ||||||||
Our repurchase agreement borrowings are generally renewable at the discretion of our lenders without guaranteed roll-over terms. Given the short-term and uncommitted nature of most of our repurchase agreement financing, we attempt to maintain unused capacity under our existing repurchase agreement credit lines with multiple counterparties which helps protect us in the event of a counterparty's failure to renew existing repurchase agreements either with favorable terms or at all. As of March 31, 2017, we had repurchase agreement borrowings outstanding with 18 of our 31 available repurchase agreement counterparties at a weighted average borrowing rate of 1.15% compared to 1.03% as of December 31, 2016. Our repurchase agreement borrowings generally carry a rate of interest based on a spread to an index such as LIBOR.
For our repurchase agreement borrowings, we are required to post and maintain margin to the lender (i.e., collateral in excess of the repurchase agreement financing) in order to support the amount of the financing. This excess collateral is often referred to as a "haircut" (and which we also refer to as equity at risk). As the collateral pledged is generally MBS, the fair value of the collateral can fluctuate with changes in market conditions. If the fair value of the collateral falls below the haircut required by the lender, the lender has the right to demand additional margin, or collateral, to increase the haircut back to the initial amount. These demands are typically referred to as "margin calls". Declines in the value of investments occur for any number of reasons including but not limited to changes in interest rates, changes in ratings on an investment, changes in actual or perceived liquidity of the investment, or changes in overall market risk perceptions. Additionally, values in Agency RMBS will also decline from the payment delay feature of those securities. Agency RMBS have a payment delay feature whereby Fannie Mae and Freddie Mac announce principal payments on Agency RMBS but do not remit the actual principal payments and interest for 20 days in the case of Fannie Mae and 40 days in the case of Freddie Mac. Because these securities are financed with repurchase agreements, the repurchase agreement lender generally makes a margin call for an amount equal to the product of their advance rate on the repurchase agreement and the announced principal payments on the Agency RMBS. This causes a temporary use of our liquidity to meet the margin call until we receive the principal payments and interest 20 to 40 days later.
41
The following table presents the weighted average minimum haircut contractually required by our counterparties for MBS pledged as collateral for our repurchase agreement borrowings as of the dates indicated:
March 31, 2017 | December 31, 2016 | September 30, 2016 | June 30, 2016 | March 31, 2016 | ||||||||||
Agency RMBS and CMBS | 5.0 | % | 5.0 | % | 5.1 | % | 4.9 | % | 5.1 | % | ||||
Non-Agency RMBS and CMBS | 15.8 | % | 16.3 | % | 17.0 | % | 15.8 | % | 16.0 | % | ||||
CMBS IO | 15.3 | % | 15.4 | % | 15.4 | % | 15.5 | % | 15.4 | % | ||||
The counterparties with whom we have the greatest amounts of equity at risk may vary significantly during any given period due to the short-term and generally uncommitted nature of the repurchase agreement borrowings. Equity at risk is defined as the amount pledged as collateral to the counterparty in excess of the borrowed amount outstanding. This equity at risk represents the potential loss to the Company if the counterparty is unable or unwilling to return collateral securing the repurchase agreement borrowing at its maturity. The following tables present the counterparties with whom we had greater than 5% of our equity at risk as of March 31, 2017 and December 31, 2016:
March 31, 2017 | |||||||
($ in thousands) | Amount Outstanding | Equity at Risk | |||||
Well Fargo Bank, N.A. and affiliates | $ | 358,267 | $ | 64,695 | |||
South Street Financial Corporation | 590,479 | 36,955 | |||||
JP Morgan Securities, LLC | 203,093 | 34,635 | |||||
$ | 1,151,839 | $ | 136,285 | ||||
December 31, 2016 | |||||||
($ in thousands) | Amount Outstanding | Equity at Risk | |||||
Well Fargo Bank, N.A. and affiliates | $ | 342,160 | $ | 62,041 | |||
JP Morgan Securities, LLC | 597,394 | 38,770 | |||||
South Street Financial Corporation | 212,921 | 35,658 | |||||
$ | 1,152,475 | $ | 136,469 | ||||
The following table discloses our repurchase agreement amounts outstanding and the value of the related collateral pledged by geographic region of our counterparties as of March 31, 2017 and December 31, 2016:
March 31, 2017 | December 31, 2016 | ||||||||||||||
($ in thousands) | Amount Outstanding | Market Value of Collateral Pledged | Amount Outstanding | Market Value of Collateral Pledged | |||||||||||
North America | $ | 2,107,387 | $ | 2,310,204 | $ | 2,105,337 | $ | 2,309,391 | |||||||
Asia | 322,147 | 338,899 | 421,991 | 443,098 | |||||||||||
Europe | 396,411 | 420,972 | 371,624 | 397,351 | |||||||||||
$ | 2,825,945 | $ | 3,070,075 | $ | 2,898,952 | $ | 3,149,840 | ||||||||
Certain of our repurchase agreement counterparties require us to comply with various operating and financial covenants. The financial covenants include requirements that we maintain minimum shareholders' equity (usually a set minimum, or a percentage of the highest amount of shareholders' equity since the date of the agreement), maximum decline in shareholders' equity (expressed as a percentage decline in any given period), and limits on maximum leverage (as a multiple of shareholders' equity). Operating requirements include, among other things, requirements to maintain our status as a REIT and to maintain our listing on the NYSE. Violations of one or more of these covenants could result in the lender declaring an event of default which would result in the termination of the repurchase agreement and immediate acceleration of amounts due thereunder. In addition, some of the agreements contain cross default features, whereby default with one lender simultaneously causes default under agreements with other lenders. Violations could also restrict us from paying dividends or engaging in other transactions that are necessary for us to maintain our REIT status.
42
We monitor and evaluate on an ongoing basis the impact these customary financial covenants may have on our operating and financing flexibility. Currently, we do not believe we are subject to any covenants that materially restrict our financing flexibility.
Derivative Instruments
Our derivative instruments require us to post initial margin at inception and variation margin based on subsequent changes in the fair value of the derivatives. The collateral posted as margin by us is typically in the form of cash or Agency MBS. Generally, as interest rates decline due to market changes, we will be required to post collateral with counterparties on our pay-fixed derivative instruments and receive collateral from our counterparties on our receive-fixed derivative instruments, and vice versa as interest rates increase. As of March 31, 2017, we had Agency MBS with a fair value of $0.4 million and cash of $34.8 million posted as credit support under these agreements.
As of March 31, 2017, approximately $345 million of the Company's interest rate swaps were entered into under bilateral agreements which contain cross-default provisions with other agreements between the parties. In addition, these bilateral agreements contain financial and operational covenants similar to those contained in our repurchase agreements, as described above. Currently, we do not believe we are subject to any covenants that materially restrict our hedging flexibility.
Dividends
As a REIT, we are required to distribute to our shareholders amounts equal to at least 90% of our REIT taxable income for each taxable year after consideration of our tax NOL carryforwards. We generally fund our dividend distributions through our cash flows from operations. If we make dividend distributions in excess of our operating cash flows during the period, whether for purposes of meeting our REIT distribution requirements or other strategic reasons, those distributions are generally funded either through our existing cash balances or through the return of principal from our investments (either through repayment or sale).
We have a net operating tax loss ("NOL") carryforward that we could use to offset our REIT taxable income distribution requirement. This NOL carryforward had an estimated balance of approximately $89.8 million as of March 31, 2017. We also have deferred tax hedge losses on terminated derivative instruments, which will be recognized over the original periods that were being hedged by the terminated derivatives. These losses have already been recognized in our GAAP earnings but will reduce taxable income over the next ten years as noted in the following table:
($ in thousands) | Tax Hedge Loss Deduction | ||
2017 | $ | 21,640 | |
2018 | 21,260 | ||
2019 | 17,023 | ||
2020 - 2026 | 12,963 | ||
$ | 72,886 | ||
If any of the deferred tax hedge losses for the years noted in the table above result in dividend distributions to our shareholders in excess of REIT taxable income, the excess dividends distributed will be considered a return of capital to the shareholder. As of March 31, 2017, we estimated that approximately 88% of our common stock dividends for the first quarter of 2017 will represent a return of capital to shareholders and not a distribution of REIT taxable income, principally as a result of the amount of the tax hedge loss deduction.
Contractual Obligations
The following table summarizes our contractual obligations by payment due date as of March 31, 2017:
43
($ in thousands) | Payments due by period | |||||||||||||||||||
Contractual Obligations: | Total | < 1 year | 1-3 years | 3-5 years | > 5 years | |||||||||||||||
Repurchase agreements (1) | $ | 2,825,945 | $ | 2,825,945 | $ | — | $ | — | $ | — | ||||||||||
Non-recourse collateralized financing (2) | 6,164 | 1,736 | 2,298 | 1,274 | 856 | |||||||||||||||
Operating lease obligations | 653 | 212 | 441 | — | — | |||||||||||||||
Total | $ | 2,832,762 | $ | 2,827,893 | $ | 2,739 | $ | 1,274 | $ | 856 | ||||||||||
(1) Includes estimated interest payments calculated using interest rates in effect as of March 31, 2017.
(2) Amounts shown are for principal only and exclude interest obligations as those amounts are not significant. Non-recourse collateralized financing represents securitization financing that is payable solely from loans and securities pledged as collateral. Payments due by period were estimated based on the principal repayments forecasted for the underlying loans and securities, substantially all of which is used to repay the associated financing outstanding.
Other Matters
As of March 31, 2017, we do not believe that any off-balance sheet arrangements exist that are reasonably likely to have a material effect on our current or future financial condition, results of operations, or liquidity. In addition, we do not have any material commitments for capital expenditures and have not obtained any commitments for funds to fulfill any capital obligations.
RECENT ACCOUNTING PRONOUNCEMENTS
Please refer to Note 1 to the Notes to the Unaudited Consolidated Financial Statements contained in this Quarterly Report on Form 10-Q for information regarding recently issued accounting pronouncements.
FORWARD-LOOKING STATEMENTS
Certain written statements in this Quarterly Report on Form 10-Q that are not historical facts constitute “forward-looking statements” within the meaning of Section 27A of the 1933 Act and Section 21E of the Exchange Act. Statements in this report addressing expectations, assumptions, beliefs, projections, future plans and strategies, future events, developments that we expect or anticipate will occur in the future, and future operating results are forward-looking statements. Forward-looking statements are based upon management’s beliefs, assumptions, and expectations as of the date of this report regarding future events and operating performance, taking into account all information currently available to us, and are applicable only as of the date of this report. Forward-looking statements generally can be identified by use of words such as “believe”, “expect”, “anticipate”, “estimate”, “plan” “may”, “will”, “intend”, “should”, “could” or similar expressions. We caution readers not to place undue reliance on our forward-looking statements, which are not historical facts and may be based on projections, assumptions, expectations, and anticipated events that do not materialize. Except as required by law, we are not obligated to, and do not intend to, update or revise any forward-looking statement whether as a result of new information, future events, or otherwise.
Forward-looking statements in this Quarterly Report on Form 10-Q may include, but are not limited to:
• | Our business and investment strategy including our ability to generate acceptable risk-adjusted returns and our target investment allocations; |
• | Our views on the effect of actual or proposed actions of the U.S. Federal Reserve and the FOMC with respect to monetary policy (including the targeted Federal Funds Rate), and the potential impact of these actions on interest rates, inflation or unemployment; |
• | The effect of regulatory initiatives of the Federal Reserve (including the FOMC) and other financial regulators; |
• | Our financing strategy including our target leverage ratios and anticipated trends in financing costs, and our hedging strategy including changes to the derivative instruments to which we are a party, and changes to government regulation of hedging instruments and our use of these instruments; |
• | Our investment portfolio composition and target investments; |
• | Our investment portfolio performance, including the fair value, yields, and forecasted prepayment speeds of our investments; |
• | Our liquidity and ability to access financing, and the anticipated availability and cost of financing; |
• | Our stock repurchase activity and the impact of stock repurchases; |
• | Our use of and restrictions on using our tax NOL carryforward; |
• | The status of pending litigation; |
44
• | The competitive environment in the future, including competition for investments and the availability of financing; |
• | Estimates of future interest expenses, including related to the Company's repurchase agreements and derivative instruments; |
• | The status of regulatory rule-making or review processes and the status of reform efforts and other business developments in the repurchase agreement financing market; |
• | Market, industry and economic trends, how these trends and related economic data may impact the behavior of market participants and financial regulators; and |
• | Market interest rates and market credit spreads. |
Forward-looking statements are inherently subject to risks, uncertainties and other factors that could cause our actual results to differ materially from historical results or from any results expressed or implied by such forward-looking statements. Not all of these risks and other factors are known to us. New risks and uncertainties arise over time, and it is not possible to predict those events or how they may affect us. The projections, assumptions, expectations or beliefs upon which the forward-looking statements are based can also change as a result of these risks or other factors. If such a risk or other factor materializes in future periods, our business, financial condition, liquidity and results of operations may vary materially from those expressed or implied in our forward-looking statements.
While it is not possible to identify all factors, some of the factors that may cause actual results to differ from historical results or from any results expressed or implied by forward-looking statements, or that may cause our projections, assumptions, expectations or beliefs to change, include the following:
• | the risks and uncertainties referenced in this Quarterly Report on Form 10-Q, particularly those set forth under and incorporated by reference into Part II, Item 1A, “Risk Factors”; |
• | our ability to find suitable reinvestment opportunities; |
• | changes in domestic economic conditions; |
• | changes in interest rates and interest rate spreads, including the repricing of interest-earning assets and interest-bearing liabilities; |
• | our investment portfolio performance particularly as it relates to cash flow, prepayment rates and credit performance; |
• | actual or anticipated changes in Federal Reserve monetary policy; |
• | adverse reactions in U.S. financial markets related to actions of foreign central banks or the economic performance of foreign economies including in particular China, Japan, the European Union, and the United Kingdom |
• | uncertainty concerning the long-term fiscal health and stability of the United States; |
• | the cost and availability of financing, including the future availability of financing due to changes to regulation of, and capital requirements imposed upon, financial institutions; |
• | the cost and availability of new equity capital; |
• | changes in our use of leverage; |
• | changes to our investment strategy, operating policies, dividend policy or asset allocations; |
• | the quality of performance of third-party servicer providers of our loans and loans underlying our securities; |
• | the level of defaults by borrowers on loans we have securitized; |
• | changes in our industry; |
• | increased competition; |
• | changes in government regulations affecting our business; |
• | changes in the repurchase agreement financing markets and other credit markets; |
• | changes to the market for interest rate swaps and other derivative instruments, including changes to margin requirements on derivative instruments; |
• | uncertainty regarding continued government support of the U.S financial system and U.S. housing and real estate markets; or to reform the U.S. housing finance system including the resolution of the conservatorship of Fannie Mae and Freddie Mac; |
• | the composition of the Board of Governors of the Federal Reserve System; |
• | ownership shifts under Section 382 that further limit the use of our tax NOL carryforward; and |
• | exposure to current and future claims and litigation. |
45
ITEM 3. QUANTITATIVE AND QUALITATIVE DISCLOSURES ABOUT MARKET RISK
We seek to manage various risks inherent in our business strategy, which include interest rate, prepayment, reinvestment, market value, credit, and liquidity risks. These risks can and do cause fluctuations in our net income, other comprehensive income, and book value. We attempt to manage these risks and earn an acceptable return for our shareholders as discussed below.
Interest Rate Risk
Investing in interest-rate sensitive investments on a leveraged basis subjects our results to interest rate risk primarily from the mismatch between interest-rate reset dates or maturity of our assets and the reset-dates or maturity of our liabilities. Borrowing costs on our liabilities are generally based on prevailing market rates and reset more frequently than interest rates on our assets. Changes in interest rates will also impact the market value of our investment portfolio and our derivative instruments which together will impact our book value per common share. While having interest rate risk is a basic tenet of our investment strategy, we attempt to manage our exposure to changes in interest rates by investing in instruments that have short maturities/interest reset dates and entering into derivative instruments (such as interest rate swaps and Eurodollar futures) to hedge this risk. We manage interest rate risk within tolerances set by our Board of Directors (as measured by the duration gap of the investment portfolio net of hedging instruments, which was no greater than 2 years as of March 31, 2017). Our portfolio duration changes based on the composition of our investment portfolio and our hedge positions as well as market factors. Duration is driven by model inputs and can be an imprecise measure of actual interest rate risk. In the case of Agency RMBS, the most important inputs include anticipated prepayment speeds. Estimates of prepayment speeds can vary significantly by investor for the same security and therefore estimates of security and portfolio duration can vary significantly.
During a period of rising interest rates (particularly short term rates in a flattening yield curve environment), our borrowing costs will increase faster than our asset yields, negatively impacting our net interest income. The amount of the impact will depend on the composition of our portfolio, our hedging strategy, and the effectiveness of our hedging instruments at the time as well as the magnitude and the duration of the increase in interest rates. In addition, our Agency RMBS reset based on one-year LIBOR and have limits or caps on the initial, aggregate, or periodic amount that an interest rate may reset while our liabilities do not have interest rate reset caps. As of March 31, 2017, we had a positive net duration gap in our investment portfolio, which means our liabilities mature or reset sooner than our investments, and we had not fully hedged this difference with derivative instruments. Therefore, increases in interest rates, particularly rapid changes, will negatively impact the market value of our investments, thereby reducing our book value. In addition to the information set forth in the tables below, see "Market Value Risk" below for further discussion of the risks to the market value of our investments. For further discussion of the reset features of our hybrid ARMs, please refer to "Financial Condition-RMBS" within Part I, Item 2 of this Quarterly Report on Form 10-Q.
Effect of Changes in Interest Rates on Adjusted Net Interest Income and Market Value. The table below shows the projected sensitivity of our adjusted net interest income and the market value of our investments and derivative instruments carried at fair value as they existed as of March 31, 2017 based on an instantaneous parallel shift in market interest rates as set forth in the table below. Our derivative instruments include currently effective and forward-starting interest rate swaps. In order to include the impact of changes in interest rates on our currently effective interest rate swaps, we present the "Percentage Change in Adjusted Net Interest Income" (instead of net interest income) because net interest income does not include the periodic net interest payments/receipts on these instruments. We believe this presentation better reflects the economic impact to the Company of parallel shifts in interest rates. In light of the low interest rate environment at March 31, 2017, the only declining rate scenario that we present is a downward shift of 50 basis points.
The "Percentage change in adjusted net interest income" includes the impact of changes in expected prepayment speeds on our investments and assumes that net proceeds received from pay downs on the investment portfolio are reinvested in MBS in amounts proportionate to the portfolio composition that existed as of March 31, 2017 and at yields consistent with those as of that date, adjusted for the parallel shift in the rates below. Changes in types of investments, the returns earned on these investments, future interest rates, credit spreads, the shape of the yield curve, the availability of financing, and/or the mix of our investments and financings including derivative instruments may cause actual results to differ significantly from the modeled results. There can be no assurance that assumed events used for the model below will occur, or that other events will not occur, that will affect the outcomes; therefore, the tables below and all related disclosures constitute forward-looking statements.
46
Parallel Shift in Interest Rates | Percentage change in market value (1) | Percentage change in adjusted net interest income | ||
+100 | (0.34)% | (16.99)% | ||
+50 | (0.14)% | (8.03)% | ||
-50 | 0.03% | 6.27% | ||
(1) | Includes changes in market value of our investments and derivative instruments, but excludes changes in market value of our financings because they are not carried at fair value on our balance sheet. The projections for market value do not assume any change in credit spreads. |
Adjustments to our hedge portfolio during the first quarter of 2017, particularly by adding $1.3 billion of 1-year pay fixed interest rate swaps, reduced our exposure to the impact of increasing short term interest rates, which exposure would have been related primarily to our investment financing costs, as of March 31, 2017 versus December 31, 2016. These adjustments have reduced the forecasted potential volatility of our adjusted net interest income over the next twelve months in the event of rapid changes in interest rates.
Management also considers changes in the shape of the interest rate curves in assessing and managing portfolio interest rate risk. Often interest rates do not move in a parallel fashion from quarter to quarter. The table below shows the projected change in market value of our investment portfolio net of derivative hedge instruments for instantaneous changes in the shape of the U.S. Treasury ("UST") curve (with similar changes to the interest rate swap curves) as of March 31, 2017.
Basis point change in 2-year UST | Basis point change in 10-year UST | Percentage change in market value (1) | ||
+25 | +50 | 0.07% | ||
+25 | +0 | (0.23)% | ||
+50 | +25 | (0.28)% | ||
+50 | +100 | 0.07% | ||
-10 | -50 | (0.26)% | ||
(1) | Includes changes in market value of our investments and derivative instruments, but excludes changes in market value of our financings because they are not carried at fair value on our balance sheet. The projections for market value do not assume any change in credit spreads. |
Market Value Risk
Our investments fluctuate in market value due to changes in credit spreads, spot and forward interest rates, actual and anticipated prepayments on our investments and many other factors. Changes in the market values of our investments are reflected in other comprehensive income, shareholders' equity, and book value per common share. Changes in credit spreads represent the market's valuation of the perceived riskiness of assets relative to risk-free rates, and widening credit spreads reduces the market value of our investments as market participants require additional yield to hold riskier assets. Credit spreads could change based on macroeconomic or systemic factors as well as the factors specific to a particular security such as prepayment performance or credit performance. Other factors that could impact credit spreads include technical issues such as supply and demand for a particular type of security or FOMC monetary policy. Likewise, most of our investments are fixed rate or reset in rate over a period of time, and as interest rates rise, we would expect the market value of these investments to decrease. We use derivative instruments to hedge our exposure to rising interest rates, though often not on a one-to-one basis. We do not seek to hedge our exposure to credit spreads, prepayments, or other factors other than through asset selection.
Fluctuations in credit spreads typically vary based on the type of investment. In general, Agency MBS credit spreads experience less volatility than non-Agency MBS credit spreads. This is due to the fact that market participants generally view
47
Agency MBS, given their guarantee of principal by GSEs, as more liquid (i.e., more easily converted into cash) than non-Agency MBS.
The table below is an estimate of the projected change in our portfolio market value given the indicated change in market credit spreads as of March 31, 2017:
Basis Point Change in Market Credit Spreads | Percentage change in market value of investments | |
+50 | (2.26)% | |
+25 | (1.14)% | |
-25 | 1.15% | |
-50 | 2.32% | |
Prepayment and Reinvestment Risk
Prepayment risk is the risk of an early, unscheduled return of principal on an investment. We are subject to prepayment risk from premiums paid on investments which we acquire. Purchase premiums on our investments are amortized as a reduction in interest income using the effective yield method under GAAP. Principal prepayments on our investments are influenced by changes in market interest rates and a variety of economic, geographic, government policy and other factors beyond our control.
We have prepayment risk for all of our investments which we own at a premium to their par value. The majority of the loans underlying our RMBS are ARMs or hybrid ARMs and do not have any specific prepayment protection. Prepayments on these loans generally accelerate in a declining interest rate environment, as the loans age, and as the loans near their respective interest rate reset dates, particularly the initial reset date or if expectations are that interest rates will rise. Our prepayment models anticipate acceleration of prepayments in these events. To the extent the actual prepayments exceed our modeled prepayments, or if we change our future prepayment expectations, we will record adjustments to our premium amortization which may negatively impact our net interest income and could impact the fair value of our RMBS.
As an indication of our prepayment risk on our RMBS portfolio, the following table summarizes information for our Agency RMBS portfolio regarding the net premium and weighted average coupon by months until interest rate reset ("MTR") or until maturity in the case of fixed-rate securities as of the end of the past four quarters:
March 31, 2017 | December 31, 2016 | September 30, 2016 | June 30, 2016 | ||||||||||||||||||||
($ in thousands) | Net Premium | WAC | Net Premium | WAC | Net Premium | WAC | Net Premium | WAC | |||||||||||||||
0-12 MTR | $ | 17,671 | 3.24% | $ | 19,593 | 3.17% | $ | 18,536 | 3.13% | $ | 18,456 | 3.05% | |||||||||||
13-36 MTR | 7,307 | 3.07% | 12,369 | 3.18% | 15,545 | 3.17% | 17,910 | 3.21% | |||||||||||||||
37-60 MTR | 11,651 | 3.38% | 10,441 | 3.51% | 9,536 | 3.60% | 6,141 | 3.61% | |||||||||||||||
> 60 MTR | 11,744 | 2.68% | 14,663 | 2.73% | 17,524 | 2.77% | 23,051 | 2.87% | |||||||||||||||
Total | $ | 48,373 | 3.04% | $ | 57,066 | 3.05% | $ | 61,141 | 3.04% | $ | 65,558 | 3.01% | |||||||||||
Par balance | $ | 1,033,735 | $ | 1,157,258 | $ | 1,239,856 | $ | 1,329,159 | |||||||||||||||
Premium, net as a % of par value | 4.7 | % | 4.9 | % | 4.9 | % | 4.9 | % | |||||||||||||||
Loans underlying our CMBS and CMBS IO securities typically have some form of prepayment protection provisions (such as prepayment lock-outs) or prepayment compensation provisions (such as yield maintenance or prepayment penalties). Yield maintenance and prepayment penalty requirements are intended to create an economic disincentive for the loans to prepay; however, the amount of the prepayment penalty required to be paid may decline over time, and as loans age, interest rates decline, or market values of collateral supporting the loans increase, prepayment penalties may lessen as an economic disincentive to the borrower. Generally, our experience has been that prepayment lock-out and yield maintenance provisions result in stable prepayment performance from period to period. There are no prepayment protections, however, if the loan defaults
48
and is partially or wholly repaid earlier as a result of loss mitigation actions taken by the underlying loan servicer. Historically, we have experienced low default rates on loans underlying CMBS and CMBS IO.
Because CMBS IO consist of rights to interest on the underlying commercial mortgage loan pools and do not have rights to principal payments on the underlying loans, prepayment risk on these securities would be particularly acute without these prepayment protection provisions. CMBS IO prepayment protection and compensation provisions vary by issuer of the security (i.e. Freddie Mac, Fannie Mae, Ginnie Mae, or non-Agency). The majority of our Agency CMBS IO are issued by Freddie Mac and these securities generally have initial prepayment lock-outs followed by a defeasance period which on average extends to within six months of the stated maturities of the underlying loans. Non-Agency CMBS IO generally have prepayment protection in the form of prepayment lock-outs and defeasance provisions. The following table details the fair value of our CMBS IO portfolio by issuer as of the end of the periods indicated:
($ in thousands) | March 31, 2017 | December 31, 2016 | |||||
Fannie Mae | $ | 17,604 | $ | 18,957 | |||
Freddie Mac | 394,937 | 392,941 | |||||
Non-Agency CMBS IO | 356,858 | 342,648 | |||||
$ | 769,399 | $ | 754,546 | ||||
We seek to manage our prepayment risk on our MBS by diversifying our investments, seeking investments which we believe will have superior prepayment performance, and investing in securities which have some sort of prepayment prohibition or yield maintenance (as is the case with CMBS and CMBS IO). With respect to RMBS, we will seek to invest in RMBS where we believe the underlying loans have favorable prepayment characteristics such as lower loan balances or favorable origination, borrower or geographic characteristics.
We are also subject to reinvestment risk as a result of the prepayment, repayment and sales of our investments. In order to maintain our investment portfolio size and our earnings, we need to reinvest capital received from these events into new interest-earning assets. If we are unable to find suitable reinvestment opportunities, interest income on our investment portfolio and investment cash flows could be negatively impacted. Yields on assets in which we have reinvested in recent periods have generally been lower than yields on existing assets due to lower overall interest rates and more competition for these as investment assets. As a result, our interest income has declined in recent periods and may continue to decline in the future. In addition, based on market conditions, our leverage, and our liquidity profile, we may decide to not reinvest the cash flows we receive from our investment portfolio even when attractive reinvestment opportunities are available, or we may decide to reinvest in assets with lower yield but greater liquidity. If we retain rather than reinvest capital as in the first six months of 2016, or if we invest it in lower yielding assets for liquidity reasons, the size of our investment portfolio and the amount of net interest income generated by our investment portfolio will likely decline.
Credit Risk
Credit risk is the risk that we will not receive all contractual amounts due on investments that we own due to default by the borrower or due to a deficiency in proceeds from the liquidation of the collateral securing the obligation. We are also particularly exposed to credit risk on investments that we own at a premium. For investments owned at premiums, defaults on the underlying loan typically result in the complete loss of any remaining unamortized premium we paid.
We attempt to mitigate our credit risk by purchasing Agency MBS and higher quality non-Agency MBS. Agency MBS have credit risk to the extent that Fannie Mae or Freddie Mac fails to remit payments on the MBS for which they have issued a guaranty of payment. Given the improved financial performance and conservatorship of these entities and the continued support of the U.S. government, we believe this risk is low. For our non-Agency MBS, we seek to purchase investment grade securities (rated 'BBB' or better by a least one of the nationally recognized statistical ratings organizations) or securities that we believe are short-duration and which will have strong credit performance. We do not currently seek to purchase heavily discounted, credit sensitive MBS.
49
The majority of our non-Agency securities are CMBS and CMBS IO. The return we earn on these securities is dependent on the credit performance of the underlying commercial loans. In particular, since investments in CMBS IO pay interest from the underlying commercial mortgage loan pools, returns are more negatively impacted by liquidations of loans in the underlying loan pool.
In order to manage our exposure to credit performance, we generally invest in securities with higher credit ratings and in securities where we have evaluated the credit profile of the underlying loan pool and can monitor its credit performance. With respect to non-Agency RMBS, our portfolio is primarily comprised of very short duration MBS backed by pools of re-performing or non-performing loans.
The following table presents information on our non-Agency MBS by credit rating as of March 31, 2017:
March 31, 2017 | ||||||||||||||||||
($ in thousands) | CMBS | CMBS IO | RMBS | Total | Percentage | |||||||||||||
AAA | $ | 35,453 | $ | 297,454 | $ | — | $ | 332,907 | 72.2 | % | ||||||||
AA | 14,094 | 47,981 | — | 62,075 | 13.5 | % | ||||||||||||
A | 18,565 | 779 | — | 19,344 | 4.2 | % | ||||||||||||
Below A or not rated | 9,691 | 10,644 | 26,490 | 46,825 | 10.1 | % | ||||||||||||
$ | 77,803 | $ | 356,858 | $ | 26,490 | $ | 461,151 | 100.0 | % | |||||||||
Liquidity Risk
We have liquidity risk principally from the use of recourse repurchase agreements to finance our ownership of securities. In general, our repurchase agreements provide a source of uncommitted short-term financing that finances a longer-term asset, thereby creating a mismatch between the maturity of the asset and of the associated financing. Our repurchase agreements are renewable at the discretion of our lenders and do not contain guaranteed roll-over terms. If we fail to repay the lender at maturity, the lender has the right to immediately sell the collateral and pursue us for any shortfall if the sales proceeds are inadequate to cover the repurchase agreement financing. In addition, repurchase agreements are collateral based and declines in the market value of our investments subject us to liquidity risk.
For further information, including how we attempt to mitigate liquidity risk and monitor our liquidity position, please refer to “Liquidity and Capital Resources” in Part I, Item 2 of this Quarterly Report on Form 10-Q.
50
ITEM 4. | CONTROLS AND PROCEDURES |
Disclosure controls and procedures.
Our management evaluated, with the participation of our Principal Executive Officer and Principal Financial Officer, the effectiveness of our disclosure controls and procedures, as defined in Exchange Act Rule 13a-15(e), as of the end of the period covered by this report. Based on that evaluation, our Principal Executive Officer and Principal Financial Officer concluded that our disclosure controls and procedures were effective as of March 31, 2017 to ensure that information required to be disclosed in the reports that we file or submit under the Exchange Act is recorded, processed, summarized and reported, within the time periods specified in the SEC’s rules and forms, and that such information is accumulated and communicated to our management, including our Principal Executive Officer and Principal Financial Officer, as appropriate, to allow timely decisions regarding required disclosure.
Changes in internal control over financial reporting.
Our management is also responsible for establishing and maintaining adequate internal control over financial reporting as defined in Exchange Act Rule 13a-15(f). There were no changes in our internal control over financial reporting during the three months ended March 31, 2017 that materially affected, or are reasonably likely to materially affect, our internal control over financial reporting.
51
PART II. | OTHER INFORMATION |
ITEM 1. | LEGAL PROCEEDINGS |
From time to time, the Company and its subsidiaries are parties to various legal proceedings. As of March 31, 2017, neither the Company nor any of its subsidiaries were a party to any material legal proceedings.
The Company was named as a defendant in a suit, case no. DC-17-04848 (the “Suit”), filed on April 26, 2017 in the 191st District Court of Dallas County, Texas, by Basic Capital Management, Inc., American Realty Trust, Inc. and Transcontinental Realty Investors, Inc. (together, the “Plaintiffs”). The Company removed the case to the United States District Court for the Northern District of Texas. DCI Commercial, Inc. (“DCI”), a former affiliate of the Company and formerly known as Dynex Commercial, Inc., was named as a co-defendant. As noted in previous filings, the Company and DCI were defendants in litigation filed by the Plaintiffs in 1999 regarding the activities of DCI while it was an operating subsidiary of an affiliate of the Company. This litigation concluded in 2004 and after various appeals by the Plaintiffs, no judgment was entered against the Company. Final judgment in the principal amount of $46.5 million, including damages of $25.6 million and attorneys' fees and post-judgment interest of $20.9 million, was entered in the litigation against DCI (the “Judgment”) in 2015. The Suit represents Plaintiffs’ attempt to enforce the Judgment against the Company and alleges that the Company and DCI cooperated to fraudulently transfer DCI assets to the Company and to commit related acts to defraud the Plaintiffs with respect to recovery on the Judgment. The Suit also alleges that the Company and DCI are a single business enterprise. The Suit seeks monetary and exemplary damages, attorneys’ fees and other relief.
The Company believes that the Suit against it is baseless and without merit and intends to defend itself vigorously in this action. The Company believes, based upon information currently available, that the Suit will be resolved without a material adverse effect on the Company’s consolidated financial statements as a whole. The outcome, however, of any legal proceeding, including the Suit, cannot be predicted with certainty. As such, no assurances can be given that the Company will be successful in its defense of this action on the merits or otherwise. If the Company is not successful in its defense efforts, the resolution of this matter could have a material adverse effect on the Company’s consolidated financial statements as a whole in a given quarter.
Other than as described above, to the Company’s knowledge, there are no threatened legal proceedings, which, in management’s opinion, individually or in the aggregate, would have a material adverse effect on the Company’s results of operations or financial condition. There have been no material changes during the three months ended March 31, 2017 with respect to the garnishment action related to DCI discussed in the Annual Report on Form 10-K for the year ended December 31, 2016.
ITEM 1A. RISK FACTORS
Risks and uncertainties identified in our forward-looking statements contained in this Quarterly Report on Form 10-Q together with those previously disclosed in the Annual Report on Form 10-K for the year ended December 31, 2016 or those that are presently unforeseen could result in significant adverse effects on our financial condition, results of operations and cash flows. See “Forward-Looking Statements” contained in Part I, Item 2, “Management’s Discussion and Analysis of Financial Condition and Results of Operations” within this Quarterly Report on Form 10-Q as well as Part I, Item 1A, “Risk Factors” in our Annual Report on Form 10-K for the year ended December 31, 2016.
We may invest in to-be-announced forward contracts ("TBA") as a means of investing in and financing Agency RMBS. TBA contracts enable us to economically invest in Agency RMBS with implicit financing costs, even without owning the outright Agency RMBS. It could be uneconomical to roll our TBA contracts or we may be unable to meet margin calls on our TBA contracts, which could negatively affect our financial condition and results of operations.
TBA contracts enable us to purchase or sell, for future delivery, Agency RMBS with certain terms and types of collateral, but the actual Agency RMBS to be delivered are not identified until shortly before the TBA settlement date. Prior to settlement of the TBA contract, we may choose to move the settlement of the securities out to a later date by entering into an offsetting position, net settling the paired off positions for cash, and simultaneously purchasing a similar TBA contract with a later settlement
52
date, collectively referred to as a "dollar roll." The Agency RMBS purchased for forward settlement are typically priced at a discount to Agency RMBS for settlement in the current month. This difference is referred to as the "price drop." The price drop is the economic equivalent of net interest income on the underlying Agency RMBS over the roll period (interest income less implied financing cost) and is commonly referred to as "dollar roll income." Consequently, dollar roll transactions and such forward purchases of Agency RMBS represent a form of off-balance sheet financing and increase the total amount of leverage on our capital.
Under certain market conditions, TBA dollar roll transactions may result in negative net interest income whereby the Agency RMBS purchased for forward settlement under a TBA contract are priced at a premium to Agency RMBS for settlement in the current month. Market conditions could also adversely impact the dollar roll market, and in particular the announcement by the Federal Reserve of its intention to reduce its reinvestment in or to sell some or all of its holdings of Agency RMBS would likely adversely impact the dollar roll market. Under such conditions, it may be uneconomical to roll our TBA positions prior to the settlement date, and we could have to take physical delivery of the underlying securities and settle our obligations for cash. We may not have sufficient funds or alternative financing sources available to settle such obligations. In addition, pursuant to the margin provisions established by the Mortgage-Backed Securities Division ("MBSD") of the Fixed Income Clearing Corporation we are subject to margin calls on our TBA contracts and our trading counterparties may require us to post additional margin above the levels established by the MBSD. Negative income on TBA dollar roll transactions or failure to procure adequate financing to settle our obligations or meet margin calls under our TBA contracts could result in defaults or force us to sell assets under adverse market conditions or through foreclosure and adversely affect our financial condition and results of operations.
Our ability to invest in and dispose of TBAs could be limited by our REIT status, and we could lose our REIT status as a result of these investments.
We account for TBAs and the related dollar roll transactions as purchases and sales. The Internal Revenue Code is unclear regarding whether TBA contracts are qualifying assets for the 75% asset test and whether income and gains from dispositions of TBA contracts are qualifying income for the 75% gross income test. In addition, there is uncertainty under the Code pursuant to the “5% asset test,” whereby ownership of any stocks or securities that do not qualify under the 75% asset test must be limited, in respect of any single non-governmental issuer, to an amount not greater than 5% of the value of our total assets (excluding ownership of any taxable REIT subsidiaries). Given the uncertainty regarding the tax treatment of TBAs, we will seek to limit our investment in TBA contracts and any other non-qualifying assets to no more than 25% of our assets at the end of any calendar quarter and will limit our investments in TBAs with a single counterparty to no more than 5% of our total assets at the end of any calendar quarter. Further, we will attempt to limit our gains from dispositions of contracts for TBA transactions and any other non-qualifying income to no more than 25% of our gross income for each calendar year. Accordingly, our ability to invest utilizing TBAs and dollar roll transactions could be limited. If at some point in the future we receive a written opinion that TBAs are more likely than not to be qualifying assets for the 75% asset test and to generate qualifying income for the 75% gross income test, we may subsequently increase our investment in TBAs.
Moreover, even if we receive an opinion that TBAs and the related transactions should be treated as qualifying assets or that income and gains from dispositions of TBAs should be treated as qualifying income, the IRS could successfully challenge that position. In that event, we could be subject to a penalty tax or we could fail to qualify as a REIT if (i) the value of our TBAs, together with our other non-qualifying assets for the 75% asset test, exceeded 25% of our gross assets at the end of any calendar quarter or if the value of our investments in TBAs with a single counterparty exceeded 5% of our total assets at the end of any calendar quarter or (ii) our income and gains from the disposition of TBAs, together with our other non-qualifying income for the 75% gross income test, exceeded 25% of our gross income for any taxable year. Any such penalty tax or failure to qualify as a REIT could adversely affect our business operations, financial condition or results of operations.
ITEM 2. UNREGISTERED SALES OF EQUITY SECURITIES AND USE OF PROCEEDS
Issuer Purchases of Equity Securities
The Company has been authorized by its Board of Directors to repurchase up to $40 million of its outstanding shares of common stock through December 31, 2018. Subject to applicable securities laws and the terms of the Series A Preferred Stock
53
designation and the Series B Preferred Stock designation, both of which are contained in our Articles of Incorporation, future repurchases of common stock will be made at times and in amounts as the Company deems appropriate, provided that the repurchase price per share is less than the Company's estimate of the current net book value of a share of common stock. Repurchases may be suspended or discontinued at any time. During the three months ended March 31, 2017 the Company did not repurchase any shares of common stock under this repurchase authorization.
The following table summarizes repurchases of our common stock that occurred during the three months ended March 31, 2017:
Total Number of Shares Purchased (1) | Average Price Paid per Share | Total Number of Shares Purchased as Part of Publicly Announced Plans or Programs | Maximum Number (or Approximate Dollar Value) of Shares that May Yet Be Purchased Under the Plans or Programs | ||||||||||
(in thousands) | |||||||||||||
January 1, 2017 - January 31, 2017 | 5,260 | $ | — | — | $ | 8,518 | |||||||
February 1, 2017 - February 28, 2017 | 65,828 | — | — | 8,518 | |||||||||
March 1, 2017 - March 31, 2017 | 6,479 | $ | — | — | 8,518 | ||||||||
Total | 77,567 | $ | — | — | |||||||||
(1) | These shares were withheld from certain employees to satisfy tax withholding obligations arising upon the vesting of restricted shares. Accordingly, these shares are not included in the calculation of approximate dollar value of shares that may yet be purchased under the $40 million repurchase plan authorized by the Company's Board of Directors. |
ITEM 3. DEFAULTS UPON SENIOR SECURITIES
None.
ITEM 4. MINE SAFETY DISCLOSURES
None.
ITEM 5. OTHER INFORMATION
None.
54
ITEM 6. EXHIBITS
Exhibit No. | Description |
3.1 | Restated Articles of Incorporation, effective June 2, 2014 (incorporated herein by reference to Exhibit 3.1 to Dynex's Registration Statement on Form S-8 filed September 17, 2014). |
3.2 | Amended and Restated Bylaws adopted as of February 28, 2017 (incorporated herein by reference to Exhibit 3.2 to Dynex's Annual Report on Form 10-K for the year ended December 31, 2016). |
10.31 | Form of Restricted Stock Agreement for Executive Officers under the Dynex Capital, Inc. 2009 Stock and Incentive Plan (incorporated herein by reference to Exhibit 10.31 to Dynex's Current Report on Form 8-K filed February 13, 2017). |
10.32 | Employment Agreement, dated as of March 3, 2017, between Dynex Capital, Inc. and Stephen J. Benedetti (incorporated herein by reference to Exhibit 10.32 to Dynex’s Current Report on Form 8-K filed March 8, 2017). |
10.33 | Employment Agreement, dated as of March 3, 2017, between Dynex Capital, Inc. and Smriti L. Popenoe (incorporated herein by reference to Exhibit 10.33 to Dynex’s Current Report on Form 8-K filed March 8, 2017. |
10.34 | Amended and Restated Equity Distribution Agreement between Dynex Capital, Inc. and JMP Securities LLC, dated March 31, 2017 (incorporated herein by reference to Exhibit 10.34 to Dynex's Current Report on Form 8-K filed April 3, 2017). |
12.1 | Statement Regarding Computation of Ratio of Earnings to Fixed Charges and Ratio of Earnings to Combined Fixed Charges and Preferred Stock Dividends (filed herewith). |
31.1 | Certification of principal executive officer pursuant to Section 302 of the Sarbanes-Oxley Act of 2002 (filed herewith). |
31.2 | Certification of principal financial officer pursuant to Section 302 of the Sarbanes-Oxley Act of 2002 (filed herewith). |
32.1 | Certification of principal executive officer and principal financial officer pursuant to Section 906 of the Sarbanes-Oxley Act of 2002 (filed herewith). |
101 | The following materials from Dynex Capital, Inc.'s Quarterly Report on Form 10-Q for the three months ended March 31, 2017, formatted in XBRL (Extensible Business Reporting Language), filed herewith: (i) Consolidated Balance Sheets (unaudited), (ii) Consolidated Statements of Comprehensive Income (unaudited), (iii) Consolidated Statement of Shareholders' Equity (unaudited), (iv) Consolidated Statements of Cash Flows (unaudited), and (v) Notes to the Unaudited Consolidated Financial Statements. |
55
SIGNATURES
Pursuant to the requirements of the Securities Exchange Act of 1934, the registrant has duly caused this report to be signed on its behalf by the undersigned thereunto duly authorized.
DYNEX CAPITAL, INC. | ||
Date: | May 10, 2017 | /s/ Byron L. Boston |
Byron L. Boston | ||
Chief Executive Officer, President, | ||
Co-Chief Investment Officer, and Director | ||
(Principal Executive Officer) | ||
Date: | May 10, 2017 | /s/ Stephen J. Benedetti |
Stephen J. Benedetti | ||
Executive Vice President, Chief Financial Officer and Chief Operating Officer | ||
(Principal Financial Officer) | ||
56