Attached files
| file | filename |
|---|---|
| EX-21.1 - EXHIBIT 21.1 - DYNEX CAPITAL INC | a2016form10-kexx211console.htm |
| EX-31.2 - EXHIBIT 31.2 - DYNEX CAPITAL INC | a2016form10-kexx312cfocert.htm |
| EX-32.1 - EXHIBIT 32.1 - DYNEX CAPITAL INC | a2016form10-kexx321soxcert.htm |
| EX-31.1 - EXHIBIT 31.1 - DYNEX CAPITAL INC | a2016form10-kexx311ceocert.htm |
| EX-23.1 - EXHIBIT 23.1 - DYNEX CAPITAL INC | a2016form10-kexx231bdocons.htm |
| EX-10.17 - EXHIBIT 10.17 - DYNEX CAPITAL INC | a2016form10-kexx1017execof.htm |
| EX-3.2 - EXHIBIT 3.2 - DYNEX CAPITAL INC | a2016form10-kexx32bylaws.htm |
UNITED STATES
SECURITIES AND EXCHANGE COMMISSION
Washington, DC 20549
FORM 10-K
x | Annual Report Pursuant to Section 13 or 15(d) of the Securities Exchange Act of 1934 |
For the fiscal year ended December 31, 2016
or
o | Transition Report Pursuant to Section 13 or 15(d) of the Securities Exchange Act of 1934 |
Commission File Number: 1-9819
DYNEX CAPITAL, INC.
(Exact name of registrant as specified in its charter)
Virginia | 52-1549373 |
(State or other jurisdiction of | (I.R.S. Employer |
incorporation or organization) | Identification No.) |
4991 Lake Brook Drive, Suite 100, Glen Allen, Virginia | 23060-9245 |
(Address of principal executive offices) | (Zip Code) |
(804) 217-5800 (Registrant’s telephone number, including area code) | |
Securities registered pursuant to Section 12(b) of the Act: | |
Title of each class | Name of each exchange on which registered |
Common Stock, $.01 par value | New York Stock Exchange |
8.50% Series A Cumulative Redeemable Preferred Stock, par value $0.01 per share | New York Stock Exchange |
7.625% Series B Cumulative Redeemable Preferred Stock, par value $0.01 per share | New York Stock Exchange |
Securities registered pursuant to Section 12(g) of the Act: None | |
Indicate by check mark if the registrant is a well-known seasoned issuer, as defined in Rule 405 of the Securities Act.
Yes o No x
Indicate by check mark if the registrant is not required to file reports pursuant to Section 13 or 15(d) of the Act.
Yes o No x
Indicate by check mark whether the registrant (1) has filed all reports required to be filed by Section 13 or 15(d) of the Securities Exchange Act of 1934 during the preceding 12 months (or for such shorter period that the registrant was required to file such reports), and (2) has been subject to such filing requirements for the past 90 days.
Yes x No o
Indicate by check mark whether the registrant has submitted electronically and posted on its corporate Web site, if any, every Interactive Data File required to be submitted and posted pursuant to Rule 405 of Regulation S-T (§232.405 of this chapter) during the preceding 12 months (or for such shorter period that the registrant was required to submit and post such files).
Yes x No o
Indicate by check mark if disclosure of delinquent filers pursuant to Item 405 of Regulation S-K (§229.405 of this chapter) is not contained herein, and will not be contained, to the best of registrant's knowledge, in definitive proxy or information statements incorporated by reference in Part III of this Form 10-K or any amendment to this Form 10-K. o
Indicate by check mark whether the registrant is a large accelerated filer, an accelerated filer, a non-accelerated filer, or a smaller reporting company. See the definitions of “large accelerated filer,” “accelerated filer” and “smaller reporting company” in Rule 12b-2 of the Exchange Act.
Large accelerated filer | o | Accelerated filer | x |
Non-accelerated filer | o (Do not check if a smaller reporting company) | Smaller reporting company | o |
Indicate by check mark whether the registrant is a shell company (as defined in Rule 12b-2 of the Exchange Act).
Yes o No x
As of June 30, 2016, the aggregate market value of the voting stock held by non-affiliates of the registrant was approximately $310,217,722 based on the closing sales price on the New York Stock Exchange of $6.94.
On February 28, 2017, the registrant had 49,192,310 shares outstanding of common stock, $0.01 par value, which is the registrant’s only class of common stock.
DOCUMENTS INCORPORATED BY REFERENCE
Portions of the Definitive Proxy Statement for the registrant's 2017 annual meeting of shareholders, expected to be filed pursuant to Regulation 14A within 120 days from December 31, 2016, are incorporated by reference into Part III.
DYNEX CAPITAL, INC.
FORM 10-K
TABLE OF CONTENTS
Page | |||
Item 1. | Business | ||
Item 1A. | Risk Factors | ||
Item 1B. | Unresolved Staff Comments | ||
Item 2. | Properties | ||
Item 3. | Legal Proceedings | ||
Item 4. | Mine Safety Disclosures | ||
PART II. | |||
Item 5. | Market for Registrant’s Common Equity, Related Stockholder Matters and Issuer Purchases of Equity Securities | ||
Item 6. | Selected Financial Data | ||
Item 7. | Management’s Discussion and Analysis of Financial Condition and Results of Operations | ||
Item 7A. | Quantitative and Qualitative Disclosures About Market Risk | ||
Item 8. | Financial Statements and Supplementary Data | ||
Item 9. | Changes in and Disagreements with Accountants on Accounting and Financial Disclosure | ||
Item 9A. | Controls and Procedures | ||
Item 9B. | Other Information | ||
PART III. | |||
Item 10. | Directors, Executive Officers and Corporate Governance | ||
Item 11. | Executive Compensation | ||
Item 12. | Security Ownership of Certain Beneficial Owners and Management and Related Stockholder Matters | ||
Item 13. | Certain Relationships and Related Transactions, and Director Independence | ||
Item 14. | Principal Accountant Fees and Services | ||
PART IV. | |||
Item 15. | Exhibits, Financial Statement Schedules | ||
Item 16. | Form 10-K Summary | ||
SIGNATURES | |||
i
CAUTIONARY STATEMENT – This Annual Report on Form 10-K may contain “forward-looking” statements within the meaning of Section 27A of the Securities Act of 1933, as amended (or “1933 Act”), and Section 21E of the Securities Exchange Act of 1934, as amended (or “Exchange Act”). We caution that any such forward-looking statements made by us are not guarantees of future performance, and actual results may differ materially from those expressed or implied in such forward-looking statements. Some of the factors that could cause actual results to differ materially from estimates expressed or implied in our forward-looking statements are set forth in this Annual Report on Form 10-K for the year ended December 31, 2015. See Item 1A. “Risk Factors” as well as “Forward-Looking Statements” set forth in Item 7. “Management’s Discussion and Analysis of Financial Condition and Results of Operations” of this Annual Report on Form 10-K.
In this Annual Report on Form 10-K, we refer to Dynex Capital, Inc. and its subsidiaries as “the Company,” “we,” “us,” or “our,” unless we specifically state otherwise or the context indicates otherwise.
PART I.
ITEM 1. | BUSINESS |
COMPANY OVERVIEW
We are an internally managed mortgage real estate investment trust, or mortgage REIT, which invests in residential and commercial mortgage-backed securities on a leveraged basis. Our common stock is traded on the New York Stock Exchange ("NYSE") under the symbol "DX". Our objective is to provide attractive risk-adjusted returns to our shareholders over the long term that are reflective of a leveraged, high quality fixed income portfolio with a focus on capital preservation. We seek to provide returns to our shareholders primarily through regular quarterly dividends, and also through capital appreciation.
We also have two series of preferred stock outstanding, our 8.50% Series A Cumulative Redeemable Preferred Stock (the "Series A Preferred Stock") which is traded on the NYSE under the symbol "DXPRA", and our 7.625% Series B Cumulative Redeemable Preferred Stock (the "Series B Preferred Stock") which is traded on the NYSE under the symbol "DXPRB".
We invest in Agency and non-Agency mortgage-backed securities (“MBS”) consisting of residential MBS (“RMBS”), commercial MBS (“CMBS”) and CMBS interest-only ("IO") securities. Agency MBS have a guaranty of principal payment by an agency of the U.S. government or a U.S. government-sponsored entity ("GSE") such as Fannie Mae and Freddie Mac. Non-Agency MBS have no such guaranty of payment. Our investments in non-Agency MBS are generally higher quality senior or mezzanine classes (typically rated 'A' or better by one or more of the nationally recognized statistical rating organizations) because they are typically more liquid (i.e., they are more easily converted into cash either through sales or pledges as collateral for repurchase agreement borrowings) and have less exposure to credit losses than lower-rated non-Agency MBS.
We invest and manage our capital pursuant to Operating Policies approved by our Board of Directors. We use leverage to enhance the returns on our invested capital by pledging our investments as collateral for borrowings such as repurchase agreements as discussed further below under Financing Strategy. We also use derivative instruments to attempt to mitigate our exposure to adverse changes in interest rates at discussed further below under Hedging Strategy.
Our election to be treated as a REIT for U.S. federal income tax purposes requires us to meet certain investment and operating tests and annual distribution requirements. We generally will not be subject to U.S. federal income taxes on our taxable income to the extent that we annually distribute all of our net taxable income to stockholders (subject to net operating loss carryforwards), do not participate in prohibited transactions, and maintain our intended qualification as a REIT.
RMBS. Our Agency RMBS investments include MBS collateralized by adjustable-rate mortgage loans ("ARMs"), which have interest rates that generally will adjust at least annually to an increment over a specified interest rate index, and hybrid adjustable-rate mortgage loans ("hybrid ARMs"), which are loans that have a fixed rate of interest for a specified period (typically three to ten years) and then adjust their interest rate at least annually to an increment over a specified interest rate index. Agency ARMs also include hybrid Agency ARMs that are past their fixed-rate periods or within twelve months of their initial reset period. We may also invest in fixed-rate Agency RMBS from time to time.
1
Non-Agency RMBS are collateralized by non-conforming residential mortgage loans and are tranched into different credit classes of securities with payments to junior classes subordinate to senior classes. We generally invest in senior classes of non-Agency RMBS which may include unrated securities. Some of the non-Agency RMBS that we invest in may be collateralized by loans which are delinquent, the repayment of which is expected to come from foreclosure and liquidation of the underlying real estate. We seek to invest in non-Agency RMBS that we judge to have sufficiently high collateralization to be likely to protect the principal balance of our investment from credit losses on the underlying loans.
CMBS. The majority of our CMBS investments are primarily fixed-rate Agency-issued securities backed by multifamily housing loans. The remainder of our CMBS portfolio contains both Agency and non-Agency issued securities backed by other commercial real estate property types such as office building, retail, hospitality, and health care. Loans underlying CMBS generally are geographically diverse, are fixed-rate, mature in eight to eighteen years and have amortization terms of up to 30 years. Typically these loans have some form of prepayment protection provisions (such as prepayment lock-out) or prepayment compensation provisions (such as yield maintenance or prepayment penalty). Yield maintenance and prepayment penalty requirements are intended to create an economic disincentive for the loans to prepay. Non-Agency CMBS also includes securities that are backed by pools of single-family rental homes which have variable-rates that reset monthly based on an index rate, such as LIBOR.
CMBS IO. CMBS IO are interest-only securities issued as part of a CMBS securitization and represent the right to receive a portion of the monthly interest payments (but not principal cash flows) on the unpaid principal balance of the underlying pool of commercial mortgage loans. We invest in both Agency-issued and non-Agency issued CMBS IO. The loans collateralizing CMBS IO pools are very similar in composition to the pools of loans that generally collateralize CMBS as discussed above. Since CMBS IO securities have no principal associated with them, the interest payments received are based on the unpaid principal balance of the underlying pool of mortgage loans, which is often referred to as the notional amount. Most loans in these securities have some form of prepayment protection from early repayment including absolute loan prepayment lock-outs, loan prepayment penalties, or yield maintenance requirements similar to CMBS described above. There are no prepayment protections, however, if the loan defaults and is partially or wholly repaid earlier as a result of loss mitigation actions taken by the underlying loan servicer, and therefore yields on CMBS IO investments are dependent upon the underlying loan performance. Because Agency-issued MBS generally contain higher credit quality loans, Agency CMBS IO are expected to have a lower risk of default than non-Agency CMBS IO.
Operating Policies and Risk Management
Our Operating Policies set forth investment and risk limitations as they relate to the Company's investment activities and set parameters for the Company's investment and capital allocation decisions. They require that we manage our operations and investments to comply with various REIT limitations (as discussed further below in “Federal Income Tax Considerations”) and to avoid qualifying as an investment company as such term is defined in the Investment Company Act of 1940 (the "1940 Act") or as a commodity pool operator under the Commodity Exchange Act.
Our Operating Policies limit the overall leverage of the Company (currently limited to a maximum of eight times shareholders’ equity capital) and place limits on certain risks to which we are exposed, such as interest rate and convexity risk, earnings at risk, and shareholders’ equity at risk from changes in fair value of our investment securities as a result of changes in interest rates, prepayment rates, investment prices and spreads, and others items. As part of our risk management process, our Operating Policies require us to perform a variety of stress tests to model the effect of adverse market conditions on our investment portfolio value and our liquidity.
Our Operating Policies limit our investment in non-Agency MBS that are rated BBB+ or lower at the time of purchase by any of the nationally recognized statistical ratings organizations to $250 million in market value and limit our shareholders’ equity at risk to a maximum of $50 million. We also conduct our own independent evaluation of the credit risk on any non-Agency MBS, such that we do not rely solely on the security’s credit rating. In addition, our purchases of non-rated MBS in recent years have been shorter duration securities which we believe to have less credit risk than typical non-rated MBS.
Within the overall limits established by our Operating Policies, our investment and capital allocation decisions depend on prevailing market conditions and other factors and may change over time in response to opportunities available in different
2
economic and capital market environments. The Board may adjust the Operating Policies of the Company from time to time based on macroeconomic expectations, market conditions, and risk tolerances.
Investment Philosophy and Strategy
Our investment philosophy encompasses a macroeconomic, top-down approach that focuses on the expected risk-adjusted outcome of any investment. Key points of our investment philosophy include the following:
• | understanding macroeconomic conditions including the current state of the U.S. and global economies; |
• | understanding the regulatory environment, competition for assets, and the terms and availability of financing; |
• | sector analysis including understanding absolute returns, relative returns and risk-adjusted returns; |
• | security and financing analysis including sensitivity analysis on credit, interest rate volatility, and market value risk; and |
• | managing performance and portfolio risks, including interest rate, credit, prepayment, and liquidity risks. |
Our investment philosophy will dictate our investment strategy. In executing our strategy, we seek to balance the risks of owning various types of mortgage assets with the earnings opportunity on the investments. We believe our investment strategy provides superior diversification of these risks across our investment portfolio and therefore provides ample opportunities to generate attractive risk-adjusted returns while protecting our shareholders’ capital.
The performance of our investment portfolio will depend on many factors including but not limited to interest rates, trends of interest rates, the steepness of interest rate curves, prepayment rates on our investments, demand for our investments, general market liquidity, and economic conditions and their impact on the credit performance of our investments. In addition, our business model may be impacted by other factors such as the state of the overall credit markets, which could impact the availability and costs of financing. See “Factors that Affect Our Results of Operations and Financial Condition” below and "Risk Factors-Risks Related to Our Business" in Item 1A of Part I of this Annual Report on Form 10-K for further discussion.
Financing Strategy
We finance our investment activities primarily by pledging investment securities to lending counterparties under short-term recourse repurchase agreements. These repurchase agreements generally have original terms to maturity of overnight to six months, though in some instances we may enter into longer-dated maturities depending on market conditions. We pay interest on our repurchase agreement borrowings at a rate usually based on a spread to LIBOR and fixed for the term of the borrowing. Borrowings under these repurchase agreements are renewable at the discretion of our lenders and do not contain guaranteed roll-over terms. One of our repurchase agreement lenders provides a committed repurchase agreement financing facility to us with an aggregate borrowing capacity of $350.0 million that expires on August 6, 2018.
The amount borrowed under a repurchase agreement is limited by the lender to a percentage of the lender's estimated market value of the pledged collateral, which is generally up to 95% of the estimated market value for Agency MBS, up to 90% for higher credit quality non-Agency MBS, and up to 85% for CMBS IO and for non-rated or lower credit quality non-Agency MBS. The difference between the lender's estimated market value of the pledged MBS collateral and the amount of the repurchase agreement is the amount of equity we have in the position (or "haircut") and is intended to provide the lender some protection against fluctuations of value in the collateral and/or the failure by us to repay the borrowing at maturity. If the estimated fair value of the MBS pledged as collateral declines below the lender's required haircut, the lender has the right to initiate a margin call which requires us to pledge additional assets to collateralize the outstanding repurchase agreement borrowings. If we fail to meet any margin call, our lenders also have the right to terminate the repurchase agreement and sell any collateral pledged. Therefore, we attempt to maintain cash and other liquid securities in sufficient amounts to manage our exposure to margin calls by lenders. The lender also has the right to change the required haircut at maturity of the repurchase agreement (if the term is renewed) which would require us to post additional collateral to the lender.
Repurchase agreement financing is provided principally by major financial institutions and broker-dealers acting as financial intermediaries for money market funds and securities lenders that provide funds for the repurchase agreement markets. Repurchase agreement financing exposes us to counterparty risk to such financial intermediaries, principally related to the excess of our collateral pledged over the amount borrowed. To mitigate this risk, we enter into repurchase agreement financings with
3
multiple lenders. In limited instances, a money market fund or securities lender has directly provided funds to us without the involvement of a financial intermediary typically at a lower cost than we would incur borrowing from the financial intermediary. Borrowing directly from these sources also reduces our risk to the financial intermediaries.
Please refer to "Risk Factors-Risks Related to Our Business" in Item 1A of Part 1 of this Annual Report on Form 10-K for additional information regarding significant risks related to our repurchase agreement financing.
Hedging Strategy
We use derivative instruments to hedge our exposure to changes in interest rates. Such exposure results from our ownership of investments which are primarily fixed rate and which are financed with repurchase agreements which have significantly shorter maturities than the weighted average life of our investments. Changes in interest rates can impact the market value of our investments (and therefore book value per common share), net interest income, and net income. In a period of rising interest rates, our earnings and cash flow may be negatively impacted by borrowing costs increasing faster than interest income from our assets, and our book value may decline as a result of declining market values of our MBS. We attempt to mitigate our exposure to changes in interest rates by utilizing interest rate swap agreements to hedge interest rate risk, but may also utilize Eurodollar futures, interest rate cap or floor agreements, put and call options on securities or securities underlying futures contracts, forward rate agreements, or swaptions. Our hedging activity is in large part driven by our views of macroeconomic fundamentals, though we may occasionally manage our hedging instruments based on market activities.
In conducting our hedging activities, we intend to comply with REIT and tax limitations on our hedging instruments which could limit our activities and the instruments that we may use. We also intend to enter into derivative contracts only with the counterparties that we believe have a strong credit rating to help mitigate the risk of counterparty default or insolvency.
Factors that Affect Our Results of Operations and Financial Condition
Our financial performance is driven by the performance of our investment portfolio and related funding and derivative hedging activity. Our financial performance is measured by net interest income, net income, comprehensive income, book value per common share and core net operating income (a non-GAAP measure). Our financial performance may be impacted by multiple factors, many of which are related to macroeconomic conditions, geopolitical conditions, central bank and government policy, and other factors beyond our control. These factors include, but are not limited to, the absolute level of interest rates, the relative slope of interest rate curves, changes in market expectations of future interest rates, actual and estimated future prepayment rates on our investments, competition for investments, economic conditions and their impact on the credit performance of our investments, and market required yields as reflected by market credit spreads. All of these factors are influenced by market forces and generally are exacerbated during periods of market volatility.
The performance of our investment portfolio, the cost and availability of financing and the availability of investments at acceptable risk-adjusted returns could also be influenced by regulatory actions and regulatory policy measures of the U.S. government including, but not limited to, the Federal Housing Finance Administration ("FHFA"), the U. S. Department of the Treasury (the "Treasury"), and the Board of Governors of the Federal Reserve System (the "Federal Reserve") and could also be influenced by reactions in U.S. markets from activities of central banks around the world.
Our business model may also be impacted by other factors such as the availability and cost of financing and the state of the overall credit markets. Reductions in the availability of financing for our investments could significantly impact our business and force us to sell assets that we otherwise would not sell, potentially at losses depending on market conditions. Regulatory developments since the 2008 financial crisis have impacted large U.S. domiciled banks and their broker dealer subsidiaries by requiring such entities to hold more capital against their assets, including reverse repurchase agreements. In general, this has led to reduced lending capacity in the repurchase agreement market and higher costs. Other factors that could also impact our business include changes in regulatory requirements, including requirements to qualify for registration under the 1940 Act, and REIT requirements.
We believe that regulatory impacts on financial institutions, many of which are our trading and financing counterparties, continue to pose a threat to the overall liquidity in the capital markets. In particular, higher capital requirements under U.S. banking regulations and limitations on the proprietary trading activities of large U.S. financial institutions under the Dodd-Frank
4
Wall Street Reform and Consumer Protection Act ("the "Dodd-Frank Act") could result in reduced liquidity in times of market stress. While the Federal Reserve continues to reinvest principal payments received on its Agency RMBS portfolio, it is unlikely that this activity will provide enough liquidity to the market in times of stress, which could result in volatile asset prices. Further, the impact on market liquidity of our investments and the financing markets could be negatively impacted if the Federal Reserve's Federal Open Market Committee (or "FOMC") suddenly changes market expectations of the targeted Federal Funds Rate or takes other actions which have the effect of tightening monetary policy.
To complement the performance of our investment portfolio, we regularly review our existing operations to determine whether our investment strategy or business model should change, including through a change in our investment portfolio, our targeted investments, and our risk position. We may also consider merger, acquisition, or divestiture opportunities and whether we should reallocate our capital resources to other assets or portfolios that better align with our long-term strategy. We analyze and evaluate potential business opportunities that we identify or are presented to us, including possible merger, acquisition, or divestiture transactions, that are a strategic fit for our investment strategy or asset allocation or otherwise maximize value for our shareholders. Pursuing such an opportunity or transaction could require us to issue additional equity or debt securities.
As discussed above, investing in mortgage-related securities on a leveraged basis subjects us to a number of risks including interest rate risk, prepayment and reinvestment risk, credit risk, market value risk and liquidity risk. Please refer to Part I, Item 1A, "Risk Factors" as well as Part II, Item 7, "Management's Discussion and Analysis of Financial Condition and Results of Operations" and Item 7A, "Quantitative and Qualitative Disclosures about Market Risk" of this Annual Report on Form 10-K for a detailed discussion of these factors and others that have the potential to impact our results of operations and financial condition.
INDUSTRY OVERVIEW
Mortgage REITs provide liquidity to the U.S. real estate markets through the purchase of RMBS and CMBS and through the origination or purchase of mortgage loans. The business models of mortgage REITs range from investing only in Agency MBS to investing substantially in non-investment grade MBS and originating and securitizing mortgage loans and investing in mortgage servicing rights. Some mortgage REITs will invest in RMBS and related investments only, some in CMBS and related investments only, and some in a mix. Each mortgage REIT will assume risks in its investment strategy. We invest in a mix of high quality MBS to mitigate credit risk, and our investments in hybrid Agency RMBS and CMBS IO help mitigate interest rate risk. In addition, our hybrid Agency RMBS and CMBS help mitigate extension risk in an increasing interest rate environment while CMBS and CMBS IO help mitigate prepayment risk in a decreasing interest rate environment.
As a continuing consequence of the 2008 financial crisis, the U.S. Congress is exploring ways to reform the housing finance system, and in particular the roles of Fannie Mae and Freddie Mac (together, the GSEs), and to move toward a housing finance system with larger participation by private entities. Given the uncertainty of federal housing policy with the new administration of President Trump, we believe that an immediate or near-term reform of the GSEs is unlikely. As Fannie Mae and Freddie Mac remain under federal conservatorship, they must continue to reduce their investment portfolios of mortgage assets but may continue issuing guarantees on pools of qualified loans. Moreover, in order to reduce exposure to the U.S. taxpayer, their regulator, the Federal Housing Finance Administration, continues to pressure the GSEs to develop credit risk transfer structures to share or outright transfer credit risk in their portfolios to the private markets, and the GSEs have issued securities with credit risk transfer features. Over the longer term, we believe the GSE's role in the housing finance system will change and could evolve in such a way that will present opportunities for industry participants who understand and are willing to hold long-term credit and assume interest rate risk of the U.S. housing market. Ultimately, we believe the cost of credit to the U.S. housing market may increase which will improve yields on investments in RMBS and CMBS.
Uncertainty around regulation of financial institutions under the Dodd-Frank Act, minimum capital standards implemented under the Basel III Accord (and associated implementing regulations) and related regulatory reform initiatives, increased risk-weightings for certain types of mortgage loans held by depository institutions, increased regulatory requirements related to origination of certain types of residential mortgage loans, and other potential regulatory changes, may further impact capital formation in the U.S. mortgage market in ways that could favor mortgage REITs. There are potential negative consequences to increased regulation of financial institutions, however, including increasing borrowing costs or reduced availability of repurchase agreement financing and the need to post more capital to leverage our investments and/or enter into derivative instruments.
5
COMPETITION
The financial services industry in which we compete is a highly competitive market. In purchasing investments and obtaining financing, we compete with other mortgage REITs, broker dealers and investment banking firms, mutual funds, banks, hedge funds, mortgage bankers, insurance companies, governmental bodies, and other entities, many of which have greater financial resources and a lower cost of capital than we do. Increased competition in the market may reduce the available supply of investments and may drive prices of investments to unacceptable levels which would negatively impact our ability to earn an acceptable amount of income from these investments. Competition can also reduce the availability of borrowing capacity at our repurchase agreement counterparties as such capacity is not unlimited, and many of our repurchase agreement counterparties limit the amount of financing they offer to the mortgage REIT industry.
FEDERAL INCOME TAX CONSIDERATIONS
As a REIT, we are required to abide by certain requirements for qualification as a REIT under the Internal Revenue Code of 1986, as amended (the “Code”). To retain our REIT status, the REIT rules generally require that we invest primarily in real estate-related assets, that our activities be passive rather than active and that we distribute annually to our shareholders substantially all of our taxable income, after certain deductions, including deductions for our tax net operating loss (“NOL”) carryforward. We could be subject to income tax if we failed to satisfy those requirements. We use the calendar year for both tax and financial reporting purposes.
We may utilize our NOL carryforward to offset our taxable earnings after taking the REIT distribution requirements into account. As a result of our public offering of common stock in February 2012, we incurred an "ownership change" as such term is defined in Section 382 of the Code. Because of this ownership change, the amount of the NOL carryforward that we may use each year is limited to approximately $13.5 million, and portions of this amount not utilized are accumulated and rolled forward to the following year. Our NOL carryforward begins to expire substantially in 2020. The following table provides a rollforward of our NOL carryforward for the periods indicated:
NOL Available for Use | Total NOL | ||||||
As of December 31, 2013: | $ | 24,700 | $ | 116,187 | |||
NOL limitation release for the years ended: | |||||||
December 31, 2014 | 13,451 | ||||||
December 31, 2015 | 13,451 | ||||||
December 31, 2016 | 13,451 | ||||||
NOL used for the years ended: | |||||||
December 31, 2014 | (26,412 | ) | (26,412 | ) | |||
December 31, 2015 | — | — | |||||
December 31, 2016 (1) | — | — | |||||
As of December 31, 2016 | $ | 38,641 | $ | 89,775 | |||
(1) Subject to completion of our 2016 federal income tax return.
There may be differences between taxable income and net income computed in accordance with U.S. generally accepted accounting principles (“GAAP”). These differences primarily arise from timing differences in the recognition of revenue and expense for tax and GAAP purposes.
Failure to satisfy certain Code requirements could cause us to lose our status as a REIT. If we failed to qualify as a REIT for any taxable year, we may be subject to federal income tax (including any applicable alternative minimum tax) at regular corporate rates and would not receive deductions for dividends paid to shareholders. We could, however, utilize our NOL carryforward to offset all or part of our taxable income to the extent the NOL is available to us based on the limitations described above. If we lost or otherwise surrendered our status as a REIT, we could not elect REIT status again for five years. Several of
6
our investments in securitized mortgage loans have ownership restrictions limiting their ownership to REITs. Therefore, if we fail to maintain our REIT status, we would have to sell these investments or otherwise provide for REIT ownership of these investments. In addition, many of our repurchase agreement lenders and interest rate swap counterparties require us to maintain our REIT status. If we were to lose our REIT status, these lenders would have the right to terminate any repurchase agreement borrowings and interest rate swaps outstanding at that time.
Qualification as a REIT
Qualification as a REIT requires that we satisfy a variety of tests relating to our income, assets, distributions and ownership. The significant tests are summarized below.
Sources of Income. To continue qualifying as a REIT, we must satisfy two distinct tests with respect to the sources of our income: the “75% income test” and the “95% income test.” The 75% income test requires that we derive at least 75% of our gross income (excluding gross income from prohibited transactions) from certain real estate-related sources. In order to satisfy the 95% income test, 95% of our gross income for the taxable year must consist of either income that qualifies under the 75% income test or certain other types of passive income.
If we fail to meet either the 75% income test or the 95% income test, or both, in a taxable year, we might nonetheless continue to qualify as a REIT, if our failure was due to reasonable cause and not willful neglect and the nature and amounts of our items of gross income were properly disclosed to the Internal Revenue Service. However, in such a case we would be required to pay a tax equal to 100% of any excess non-qualifying income.
Nature and Diversification of Assets. At the end of each calendar quarter, we must meet multiple asset tests. Under the “75% asset test”, at least 75% of the value of our total assets must represent cash or cash items (including receivables), government securities or real estate assets. Under the “10% asset test,” we may not own more than 10% of the outstanding voting power or value of securities of any single non-governmental issuer, provided such securities do not qualify under the 75% asset test or relate to taxable REIT subsidiaries. Under the “5% asset test,” ownership of any stocks or securities that do not qualify under the 75% asset test must be limited, in respect of any single non-governmental issuer, to an amount not greater than 5% of the value of our total assets (excluding ownership of any taxable REIT subsidiaries).
If we inadvertently fail to satisfy one or more of the asset tests at the end of a calendar quarter, such failure would not cause us to lose our REIT status, provided that (i) we satisfied all of the asset tests at the close of the preceding calendar quarter and (ii) the discrepancy between the values of our assets and the standards imposed by the asset tests either did not exist immediately after the acquisition of any particular asset or was not wholly or partially caused by such an acquisition. If the condition described in clause (ii) of the preceding sentence was not satisfied, we still could avoid disqualification by eliminating any discrepancy within 30 days after the close of the calendar quarter in which it arose.
Ownership. In order to maintain our REIT status, we must not be deemed to be closely held and must have more than 100 shareholders. The closely held prohibition requires that not more than 50% of the value of our outstanding shares be owned by five or fewer persons at any time during the last half of our taxable year. The "more than 100 shareholders" rule requires that we have at least 100 shareholders for 335 days of a twelve-month taxable year. In the event that we failed to satisfy the ownership requirements we would be subject to fines and be required to take curative action to meet the ownership requirements in order to maintain our REIT status.
EMPLOYEES
As of December 31, 2016, we have 18 employees and one corporate office in Glen Allen, Virginia. None of our employees are covered by any collective bargaining agreements, and we are not aware of any union organizing activity relating to our employees.
7
Executive Officers of the Company
Name (Age) | Current Title | Business Experience | ||
Byron L. Boston (58) | Chief Executive Officer, President, Co-Chief Investment Officer, and Director | Chief Executive Officer and Co-Chief Investment Officer effective January 1, 2014; President and Director since 2012; Chief Investment Officer since 2008. | ||
Stephen J. Benedetti (54) | Executive Vice President, Chief Financial Officer, and Chief Operating Officer | Executive Vice President and Chief Operating Officer since 2005; Executive Vice President and Chief Financial Officer from 2001 to 2005 and beginning again in 2008. | ||
Smriti L. Popenoe (48) | Executive Vice President and Co-Chief Investment Officer | Executive Vice President and Co-Chief Investment Officer effective January 1, 2014; Chief Risk Officer of PHH Corporation between 2010 and 2013; Senior Vice President, Balance Sheet Management, of Wachovia Bank, from 2006 to 2009. | ||
AVAILABLE INFORMATION
We are subject to the reporting requirements of the Exchange Act and its rules and regulations. The Exchange Act requires us to file reports, proxy statements, and other information with the SEC. Copies of these reports, proxy statements, and other information can be read and copied at:
SEC Public Reference Room
100 F Street, N.E.
Washington, D.C. 20549
Information on the operation of the Public Reference Room may be obtained by calling the SEC at 1-800-SEC-0330. The SEC maintains a website that contains reports, proxy statements, and other information regarding issuers that file electronically with the SEC. These materials may be obtained electronically by accessing the SEC’s home page at www.sec.gov.
Our website can be found at www.dynexcapital.com. Our annual reports on Form 10-K, our quarterly reports on Form 10-Q, our current reports on Form 8-K, and amendments to those reports, filed or furnished pursuant to Section 13(a) or 15(d) of the Exchange Act, are made available free of charge through our website as soon as reasonably practicable after such material is electronically filed with or furnished to the SEC.
We have adopted a Code of Business Conduct and Ethics (“Code of Conduct”) that applies to all of our employees, officers and directors. Our Code of Conduct is also available free of charge on our website, along with our Audit Committee Charter, our Nominating and Corporate Governance Committee Charter, and our Compensation Committee Charter. We will post on our website amendments to the Code of Conduct or waivers from its provisions, if any, which are applicable to any of our directors or executive officers in accordance with SEC or NYSE requirements.
ITEM 1A. RISK FACTORS
The following is a summary of the risk factors that we believe are most relevant to our business. These are factors which, individually or in the aggregate, we think could cause our actual results to differ significantly from anticipated or historical results. In addition to understanding the key risks described below, investors should understand that it is not possible to predict or identify all risk factors, and consequently, the following is not a complete discussion of all potential risks or uncertainties.
8
RISKS RELATED TO OUR BUSINESS
We use leverage in order to enhance returns to our shareholders which increases the risk of volatility in our results and could lead to material decreases in net interest income, dividends, book value per common share, and liquidity.
The use of leverage in our business increases the risk of volatility in returns to our shareholders and increases the risk of a material decline in our book value and liquidity. Leverage increases returns on our invested capital if we can earn a greater return on investments than our cost of borrowing, but can decrease returns if borrowing costs increase and we have not adequately hedged against such an increase. In addition, using leverage magnifies the potential losses to shareholders' equity (and book value per common share) when the market value of our investments, net of hedges, declines. We also have increased liquidity risk stemming from the potential for margin calls by our lenders for fluctuations in investment collateral values, or if the lender fails to renew or roll over the financing.
Our ability to access leverage sufficient to generate acceptable returns to our shareholders is impacted by the following:
• | market conditions and overall market volatility and liquidity; |
• | regulation of our lenders; |
• | the liquidity of our investments; |
• | the market value of our investments; |
• | the advance rates by our lenders on investment collateral pledged, and; |
• | the willingness of our lenders to finance the types of investments we choose. |
Many of these factors are beyond our control and are difficult to predict, which could lead to sudden and material adverse effects on our results of operations, financial condition, business, liquidity, and ability to make distributions to shareholders, and could force us to sell assets at significantly depressed prices to maintain adequate liquidity.
For more information about our operating policies regarding leverage and historic leverage levels, please see “Liquidity and Capital Resources” within Part II, Item 7, “Management’s Discussion and Analysis of Financial Condition and Results of Operation.”
Repurchase agreements are generally uncommitted short-term financings and changes to terms of such financing may adversely affect our profitability and our liquidity.
The majority of our repurchase agreements are uncommitted financings from lenders with an average term of ninety days or less. Because repurchase agreements are short-term financing commitments, changes in conditions in the repurchase markets may make it more difficult for us to secure continued financing particularly in periods of high volatility. Additionally, regulatory capital requirements imposed on our lenders by financial and banking regulators have changed significantly in recent years, and as a result, the cost of financing has increased and may continue to increase. In addition, many lenders may find it unprofitable to lend against certain collateral types due to higher regulatory costs and regulatory capital requirements, and thus restrict their lending against such collateral. Because we rely heavily on borrowings under repurchase agreements to finance our investments, our ability to achieve our investment and profitability objectives can depend on our ability to access repurchase agreement financing in sufficient amounts and on favorable terms, and to renew or replace maturing financings on a continuing basis. If the terms on which we borrow change in a meaningful way, or if borrowings are not available, we may be forced to sell assets or our borrowing costs could increase, potentially reducing our profitability and dividends to our shareholders.
We invest in assets that are traded in over-the-counter (OTC) markets which are less liquid and have less price transparency than securities exchanges. Owning securities that are traded in OTC markets may increase our liquidity risk, particularly in a volatile market environment, because our assets may be more difficult to borrow against or sell in a prompt manner and on terms acceptable to us, and we may not realize the full value at which we previously recorded the investments and/or may incur additional losses upon sale.
Though Agency MBS are generally deemed to be very liquid securities, turbulent market conditions in the past have at times significantly and negatively impacted the liquidity of these assets, resulting in reductions in their market value. Non-Agency MBS are typically more difficult to value, less liquid, and experience greater price volatility than Agency MBS. In
9
addition, market values for non-Agency MBS are typically more subjective than Agency MBS. As a result of these factors, the number of lenders willing to provide financing for non-Agency MBS or accept them as collateral has generally been limited compared to Agency MBS. Given the trading of our investments in OTC markets, in an extreme case of market stress, a market may not exist for certain of our assets at any price. If the MBS market were to experience a severe or extended period of illiquidity, lenders may refuse to accept our assets as collateral for repurchase agreement financing, which could have a material adverse effect on our results of operations, financial condition and business. A sudden reduction in the liquidity of our investments could limit our ability to finance or could make it difficult to sell investments if the need arises. If we are required to liquidate all or a portion of our portfolio quickly, we may realize significantly less than the fair value at which we have previously recorded our investments which would result in lower than anticipated gains or higher losses.
Risks related to the market value of our investments could negatively impact our net income, comprehensive income, shareholders' equity, book value per common share, and liquidity.
Our investments fluctuate in value due to changes in credit spreads, spot and forward interest rates, actual and anticipated prepayments and other factors. Changes in the market values of our investments are reflected in other comprehensive income, shareholders' equity and book value per common share. Changes in credit spreads represent the market's valuation of the perceived riskiness of assets relative to risk-free rates, and widening credit spreads reduce the market value of our investments as market participants require additional yield to hold riskier assets. Credit spreads could change based on macro-economic or systemic factors specific to a particular security such as prepayment performance or credit performance. Other factors that could impact credit spreads include technical issues such as supply and demand for a particular type of security, market psychology, and FOMC monetary policy. In addition, most of our investments are fixed rate or reset in rate over a period of time, and as interest rates rise, the market value of these investments will decrease. If market values decrease significantly, we may be forced to sell assets at losses in order to maintain liquidity and repay or renew repurchase agreements at maturity.
Fluctuations in interest rates may have various negative effects on us and could lead to reduced net interest income, comprehensive income, and a lower book value per common share.
Fluctuations in interest rates impact us in a number of ways. For example, in a period of rising rates, particularly increases in the targeted Federal Funds Rate, we may experience a decline in our profitability from borrowing rates increasing faster than interest coupons on our investments reset or our investments mature. We may also experience a decline in profitability from our investments adjusting less frequently or relative to a different index (e.g., six month or one-year LIBOR) from our borrowings (repurchase agreements are typically based on short-term rates like one-month or three-month LIBOR). Once the Federal Reserve announces a higher targeted range or if markets determine that the Federal Reserve is likely to announce a higher targeted range for the Federal Funds Rate, our borrowing costs are likely to immediately increase, thereby negatively impacting our results of operations, financial condition, and book value per common share.
The mortgage loans collateralizing ARMs typically have periodic (or interim) and lifetime interest rate caps. Periodic interest rate caps limit the amount interest rates can adjust on a loan during any given period. Lifetime interest rate caps limit the amount interest rates can adjust from inception through maturity of a loan. Because of these caps, the amount of gross interest income earned by ARMs may become limited in a sustained period of rising interest rates or in any period in which interest rates rise rapidly. We may also experience price volatility as ARMs approach their interest rate caps. In addition, we could experience additional declines in net interest income as the repurchase agreements financing ARMs do not have periodic or lifetime interest rate caps.
Fluctuations in interest rates may also negatively affect the market value of our securities. Since our securities are fixed rate or adjust generally over longer-term periods, rising interest rates will reduce the market value of our MBS as a result of higher yield requirements by the market for these types of securities. In some instances, increases in short-term interest rates are rapid enough that short-term interest rates equal or exceed medium/long-term interest rates, resulting in a flat or inverted yield curve. Any fixed-rate or hybrid ARM investment will generally be more negatively affected by these increases than ARMs (which have interest-rates that adjust more frequently). Reductions in the market value of our securities could result in margin calls from our lenders, potentially forcing us to sell securities at a loss. Conversely, while declining interest rates are more favorable for us, we may experience increasing prepayments, resulting in reduced profitability due to reinvestment of our capital in lower yielding investments.
10
A shift in U.S. monetary policy with respect to the reinvestment of principal payments on securities held by the Federal Reserve Bank of New York ("FRBNY") could negatively impact the value of our investments, comprehensive income, and book value per common share.
The FOMC of the Federal Reserve provided in prior years monetary stimulus with large-scale purchases of Treasury securities and Agency RMBS (which the market has referred to as quantitative easing, or "QE"). While the FRBNY, on behalf of the FOMC, is not actively purchasing additional securities under the QE program, it continues to reinvest principal repayments received on the securities which it owns in order to maintain an accommodative monetary policy.
The potential market volatility from the Federal Reserve's withdrawal of its accommodative monetary policy through its reinvestment of principal payments received may be extreme. Further, significant price volatility could occur following large asset sales (or anticipation thereof) by the FRBNY. In such a case, it is likely that prices on our investments would decline which would cause a decline in our book value and also could result in margin calls by our lenders on Agency MBS pledged as collateral for repurchase agreements. If declines in prices are substantial, we could be forced to sell assets at a loss or at an otherwise inopportune time in order to meet margin calls or repay lenders.
Our repurchase agreements and agreements governing certain interest rate swaps may contain financial and non-financial covenants. Our inability to meet these covenants could adversely affect our financial condition, results of operations and cash flows.
In connection with certain of our repurchase agreements and interest rate swap agreements, we are required to maintain certain financial and non-financial covenants. As of February 28, 2017, the most restrictive financial covenants require that we have (i) a minimum of $30 million of liquidity; (ii) maintain a minimum Equity Capital in an amount equal to the greater of 60% of highest historical equity capital level at any time; and (iii) declines in shareholders' equity no greater than 25% in any quarter and 35% in any year. In addition, virtually all of our repurchase agreements and interest rate swap agreements require us to maintain our status as a REIT and to be exempted from the provisions of the 1940 Act. Compliance with these covenants depends on market factors and the strength of our business and operating results. Various risks, uncertainties and events beyond our control, including significant fluctuations in interest rates and changes in market conditions, could affect our ability to comply with these covenants. Failure to comply with these covenants could result in an event of default, termination of an agreement, acceleration of all amounts owed under an agreement, and generally would give the counterparty the right to exercise certain other remedies under the repurchase agreement, including the sale of the asset subject to repurchase at the time of default, unless we were able to negotiate a waiver in connection with any such default related to failure to comply with a covenant. Any such waiver could be conditioned on an amendment to the underlying agreement and any related guaranty agreement on terms that may be unfavorable to us. If we are unable to negotiate a covenant waiver or replace or refinance our assets under a new repurchase facility on favorable terms or at all, our financial condition, results of operations and cash flows could be adversely affected. Further, certain of our repurchase agreements and interest rate swap agreements have cross-default, cross-acceleration or similar provisions, such that if we were to violate a covenant under one agreement, that violation could lead to defaults, accelerations, or other adverse events under other agreements, as well.
Prepayment rates on the mortgage loans underlying our investments may adversely affect our profitability and the market value of our investments. Changes in prepayment rates may also subject us to reinvestment risk.
We are subject to prepayment risk to the extent that we own investments at premiums to their par value or at yields at a premium to current market yields. Our investment portfolio consists substantially of RMBS and CMBS owned at premiums, and CMBS IO securities which have no principal amounts outstanding and consist only of the right to receive interest payments on the underlying pools of CMBS loans included in the securitization trust. We amortize the premiums we pay on a security using the effective yield method, which is impacted by actual and projected borrower prepayments of principal on the loans. Prepayments on our investments can occur both on a voluntary and involuntary (i.e., a loan default and subsequent foreclosure and liquidation) basis. Voluntary prepayments tend to increase when interest rates are declining or, in the case of ARMs or hybrid ARMs, based on the shape of the yield curve. CMBS and CMBS IO are generally protected from voluntary prepayment for a portion of their expected lives either by an absolute prepayment lock-out on the loan or by yield maintenance or prepayment penalty provisions which serve as full or partial compensation for future lost interest income on the loan. RMBS provide no specific protection from voluntary prepayment. The actual level of prepayments on our investments will be impacted by economic and market conditions, the absolute levels of interest rates and relative levels of interest rates versus our investments, the general
11
availability of mortgage credit, and other factors. We have no protection from involuntary prepayments which tend to increase in periods of economic stress and may occur for any of our investment types. If we experience actual prepayments in excess of our projections or increase our expectations of future prepayment activity, we will amortize investment premiums at an accelerated rate which will reduce our interest income. In addition, we may reinvest prepayments in lower yielding investments which could lead to lower net interest income and reduced profitability.
Increases in actual prepayment rates or market expectations of prepayment rates could also negatively impact the market value of our investments. Faster prepayments generally negatively impact the market value of RMBS due to less predictability of payments on the underlying mortgage loans and will increase the required market yield on such security. Faster prepayments will also negatively impact the market value of CMBS IO, depending on the amount of prepayment protection for a given security. Increasing prepayments will typically reduce the value of our securities owned at premiums which will negatively impact our book value. We are also more likely to experience margin calls from our lenders as a result of the decline in value of our securities.
In certain circumstances, compensation for voluntary prepayment on CMBS IO securities may not be sufficient to compensate us for the loss of future excess interest as a result of the prepayment, thereby adversely affecting our results of operations. Also, the amount of prepayment penalties on loans underlying CMBS and CMBS IO decline over time, and as loans age, interest rates decline, or market values of the collateral supporting the loan increase, prepayment penalties may not serve as a sufficient economic disincentive to prevent the borrower from prepaying.
Prepayments on large balance, single loan Agency CMBS could result in margin calls by lenders in excess of our available liquidity. As such, we may be at risk of defaulting on a repurchase agreement which could force us to sell assets at a loss.
We may own large balance Agency CMBS which are collateralized by a single-loan. While these Agency CMBS have some form of prepayment protection such as yield maintenance which would compensate us for the prepayment, these securities are collateralizing repurchase agreements. If the single loan CMBS prepays, typically there is a 20 day delay between the announcement of such prepayment and the receipt of cash from the prepayment; however, the repurchase agreement lender may initiate a margin call when the prepayment is announced. If the margin call were large enough, we might not be able to meet such margin call from available liquidity, and we could be forced to sell assets quickly and on terms unfavorable to us to meet the margin call. If we cannot meet the margin call, we may be in default under the repurchase agreement until we receive the cash from the prepayment. Because some of our repurchase agreement borrowings contain cross-default provisions, such default could trigger defaults on and margin calls with respect to other of our repurchase agreement borrowings.
Global sovereign credit risk could have a material adverse effect on our business, financial condition and liquidity.
Sovereign credit in recent years, including the United States and Europe, has come under pressure as a result of large budget deficits, fiscal imbalances, political instability and below trend growth or negative growth. While we do not borrow directly from any sovereign, global risk appetite is impacted by changes in actual or perceived credit risk of the United States, Europe,Asia, and other developed and emerging markets. Adverse changes in sovereign credit ratings or credit outlook could have a material adverse impact on financial markets and economic conditions in the United States and worldwide, in some cases causing a material reduction in risk appetite by market participants, which may have a negative effect on the availability of financing as well as the value of securities that we own. Any such adverse impact could have a material adverse effect on our liquidity, financial condition, book value and results of operations.
Provisions requiring yield maintenance charges, prepayment penalties, defeasance, or lock-outs in CMBS IO securities may not be enforceable.
Provisions in loan documents for mortgages in CMBS IO securities in which we invest requiring yield maintenance charges, prepayment penalties, defeasance, or lock-out periods may not be enforceable in some states and under federal bankruptcy law. Provisions in the loan documents requiring yield maintenance charges and prepayment penalties may also be interpreted as constituting the collection of interest for usury purposes. Accordingly, we cannot be assured that the obligation of a borrower to pay any yield maintenance charge or prepayment penalty under a loan document in a CMBS IO security will be enforceable. Also, we cannot be assured that foreclosure proceeds under a loan document in a CMBS IO security will be sufficient to pay an enforceable yield maintenance charge. If yield maintenance charges and prepayment penalties are not collected, or if a lock-out
12
period is not enforced, we may incur losses to write-down the value of the CMBS IO security for the present value of the amounts not collected, and we will experience lower yields and lower interest income. This would also likely cause margin calls from any lender on the CMBS IO impacted which could have a material adverse effect on our liquidity.
We invest in securities guaranteed by Fannie Mae and Freddie Mac which are currently under conservatorship by the FHFA. As conservator, the FHFA has assumed all the powers of the shareholders, directors and officers of the GSEs with the goal of preserving and conserving their assets. Both Fannie Mae's and Freddie Mac's solvency is being supported by the Treasury through their committed purchases of Fannie Mae and Freddie Mac preferred stock. The ultimate impact on the operations of Fannie Mae and Freddie Mac from the conservatorships and the support they receive from the U.S. government is not determinable and could affect Fannie Mae and Freddie Mac in such a way that our business, operations and financial condition may be adversely affected.
In 2008, the FHFA placed Fannie Mae and Freddie Mac under federal conservatorship. As its conservator, the FHFA has broad regulatory powers over Fannie Mae and Freddie Mac and has entered into Preferred Stock Purchase Agreements, as amended, (“PSPAs”) pursuant to which the Treasury ensures that Fannie Mae and Freddie Mac will separately maintain a positive net worth by committing to purchase preferred stock of Fannie Mae and Freddie Mac. The FHFA as the regulator of the GSEs has proposed several reforms including, among other things, building a common, single, securitization platform between the two entities and gradually contracting their presence in the mortgage marketplace. In addition, the U.S. Congress at various times has considered structural changes to the GSEs, including winding down the GSEs and replacing them with a privately capitalized system that is intended to preserve market liquidity and protect taxpayers from future GSE losses due to economic downturns.
The outcome of the conservatorship and the scope and nature of actions that may ultimately be taken by the U.S. Congress to reform the GSEs and the housing finance system, are not predictable at this point. Actions limiting the guarantee on future Agency MBS could impact the amount of Agency MBS available to be purchased which could lead to increased competition and reduced returns from these assets. It could also negatively impact our ability to comply with the provisions of the 1940 Act (see further discussion below regarding the 1940 Act).
Both Fannie Mae and Freddie Mac have returned to profitability as a result of the housing market recovery but their long-term financial viability is highly dependent on governmental support. If the Treasury withdraws its support, the value of Agency MBS could significantly decline, which would make it difficult for us to obtain repurchase agreement financing and could force us to sell assets at substantial losses. In addition, future policies that change the relationship between Fannie Mae and Freddie Mac and the U.S. government, including those that result in their winding down, release from conservatorship, nationalization, privatization, or elimination, may create market uncertainty and have the effect of reducing the actual or perceived credit quality of securities issued or guaranteed by Fannie Mae and Freddie Mac. As a result, such policies could increase the risk of loss on investments in Agency MBS. It also is possible that such policies could adversely impact the market for such securities and spreads at which they trade, and thereby adversely impact the profitability of our investments.
All of the foregoing could materially adversely affect the availability, pricing, liquidity, market value and financing of our assets and materially adversely affect our business, operations and financial condition.
Our investment strategy includes investing in non-Agency MBS with credit risk. Many of these securities have some form of subordinate credit enhancement within the security structure. The performance of these securities is dependent in large part on the performance of the underlying mortgage loans relative to the amount of the subordinate credit enhancement within the security structure. These mortgage loans are subject to defaults, foreclosure timeline extension, fraud, price depreciation, and unfavorable modification of loan principal amount, interest rate, and premium, any of which could result in losses to us.
Non-Agency MBS are secured by mortgage loans (generally single family residential properties for RMBS and pools of commercial mortgage loans for CMBS) that have no guarantee of repayment. Typically, non-Agency MBS have non-rated or low rated tranches or classes that are subordinate to principal payments to higher rated classes and absorb losses on the liquidation of the underlying loans. We own securities that generally have some form of credit subordination to our investment with respect to credit losses on the underlying mortgage loans. We bear a risk of loss of principal on our security to the extent losses experienced on the loans in these securities are in excess of such subordination.
13
Commercial mortgage loans that collateralize CMBS and CMBS IO generally have a higher principal balance, and the ability of a borrower to repay a loan secured by an income-producing property typically is dependent upon the successful operation of the property rather than upon the existence of independent income or assets of the borrower. If the net operating income of a commercial property is reduced, the borrower's ability to repay the loan may be impaired. Net operating income of an income-producing property can be affected by, among other things, economic conditions, tenancy, location and condition, property management decisions, competition, regulations, environmental conditions, occupancy rates, interest rates and real estate tax rates and other operating expenses. Losses on underlying commercial mortgage loans will potentially impact the yield on the CMBS and CMBS IO securities we own and could also negatively impact their market value. Negative impacts on yields will reduce our net income and reductions in market values could lead to margin calls by our lenders which, if significant, could force us to sell assets possibly at losses to meet margin calls.
RMBS securities are generally collateralized by pools of single family mortgage loans which have less idiosyncratic risk than CMBS and CMBS IO. The ability of a borrower to repay a mortgage loan secured by a residential property is dependent upon the income or assets of the borrower. A number of factors may impair borrowers’ abilities to repay their loans, including among other things, their employment situation, economic conditions, and the availability of refinancing. In the event of defaults on the residential mortgage loans that underlie our investments in RMBS and the exhaustion of any underlying or any additional credit support, we may not realize our anticipated return on our investments and we may incur a loss on these investments.
We may change our investment strategy, operating policies, dividend policy, and/or asset allocations without shareholder consent and/or in a manner in which shareholders, analysts, and capital markets may not agree, which could adversely affect our financial condition, results of operations, the market price of our common stock, and our ability to pay dividends to our shareholders.
A change in our investment strategy or asset allocation may materially change our exposure to interest rate and/or credit risk, default risk and real estate market fluctuations. These changes could have a material impact on our ability to continue to pay a dividend at a level that we had previously paid before the change in strategy. Furthermore, if any change in investment strategy, asset allocation, operating or dividend policy is perceived negatively by the markets or analysts covering our stock, our stock price may decline.
Competition may prevent us from acquiring new investments at favorable yields, and we may not be able to achieve our investment objectives which may potentially have a negative impact on our profitability.
Our net income will largely depend on our ability to acquire mortgage-related assets with acceptable risk-return profiles at favorable spreads over our borrowing costs. The availability of mortgage-related assets meeting our investment criteria depends upon, among other things, the level of activity in the real estate market and the quality of and demand for securities in the mortgage securitization and secondary markets. The size and level of activity in real estate lending markets depends on various factors, including interest rates, regional and national economic conditions, and real estate values. In acquiring investments, we may compete with other purchasers of these types of investments, including but not limited to other mortgage REITs, broker-dealers, hedge funds, banks, insurance companies, mutual funds, and other entities that purchase assets similar to ours, many of which have greater financial resources than we do. As a result of all of these factors, we may not be able to acquire sufficient assets at acceptable spreads to our borrowing costs, which would adversely affect our profitability.
In order to maintain our portfolio size and our earnings, we must reinvest the cash flows we receive from our existing investment portfolio, including monthly principal and interest payments and proceeds from sales. If the assets we acquire in the future earn lower yields than the assets we currently own, our reported earnings per share will likely decline over time as the older assets pay down or are sold. In addition, based on market conditions, our leverage, and our liquidity profile, we may decide to not reinvest the cash flows we receive from our investment portfolio. If we retain, rather than reinvest, these cash flows, the size of our investment portfolio and the amount of net interest income generated by our investment portfolio will likely decline.
Our use of hedging strategies to mitigate our interest rate exposure may not be effective and may adversely affect our income and book value.
14
We use interest rate swap agreements, Eurodollar futures, interest rate caps, and other derivative transactions (collectively, “hedging instruments”) to help mitigate increased financing costs and volatility in book value from adverse changes in interest rates. Our hedging activity will vary in scope based on our portfolio construction and objectives, the actual and implied level and volatility of interest rates, our forecast of future interest rates, and financing sources used. No hedging strategy, however, can completely insulate us from the interest rate risks to which we are exposed, and there can be no assurance that the implementation of any hedging strategy will have the desired impact on our results of operations or financial condition. In addition, hedging instruments that we use may adversely affect our results of operations and book value (particularly if interest rates decline) as the fair value of hedging instruments fluctuate with changes in rates (and require us to post margin to counterparties) and also involve an expense that we will incur regardless of the effectiveness of the hedging activity.
Our hedging instruments can be traded on an exchange or administered through a clearing house, or are administered under bilateral agreements between us and a counterparty. Bilateral agreements expose us to increased counterparty risk, and we may be at risk of loss of any collateral held by a hedging counterparty if the counterparty becomes insolvent or files for bankruptcy.
Interest rate hedging may fail to protect or could adversely affect us because, among other things:
• | The performance of instruments used to hedge may not completely correlate with the performance of the assets or liabilities being hedged; |
• | Interest rate hedging can be expensive, particularly during periods of volatile interest rates; |
• | Available hedging instruments may not correspond directly with the interest rate risk from which we seek protection; |
• | The duration of the hedge may not match the duration of the related asset or liability given management's expectation of future changes in interest rates or a result of the inaccuracies of models in forecasting cash flows on the asset being hedged; |
• | The value of derivatives used for hedging will be adjusted from time to time in accordance with GAAP to reflect changes in fair value, and downward adjustments, or “mark-to-market losses,” would reduce our earnings, shareholders’ equity, and book value; |
• | The amount of income that a REIT may earn from hedging transactions (other than through taxable REIT subsidiaries) to offset interest rate losses may be limited by U.S. federal income tax provisions governing REITs; |
• | The credit quality of the party owing money on the hedge may be downgraded to such an extent that it impairs our ability to sell or assign our side of the hedging transaction; and |
• | The party owing money in the hedging transaction may default on its obligation to pay. |
Our hedging transactions, which are intended to limit losses, may actually adversely affect our earnings, which could reduce our ability to pay dividends to our shareholders.
Clearing facilities or exchanges may increase the margin requirements we are required to post when entering into derivative instruments, which may negatively impact our ability to hedge and our liquidity.
We are required to post margin when entering into a hedging instrument which is traded on an exchange or administered through a clearing house. The amount of margin is set for each derivative by the exchange or clearinghouse and in prior periods, exchanges have required additional margin in response to events having or expected to have adverse economic consequences. In the event that future adverse economic developments or market uncertainty (including those due to governmental, regulatory, or legislative action or inaction) result in increased margin requirements for our hedging instruments, it could materially adversely affect our liquidity position, business, financial condition and results of operations.
We may be subject to the risks associated with inadequate or untimely services from third-party service providers, which may negatively impact our results of operations. We also rely on corporate trustees to act on behalf of us and other holders of securities in enforcing our rights.
Loans underlying non-Agency MBS we own are serviced by third-party service providers. These servicers provide for the primary and special servicing of these securities. In that capacity these service providers control all aspects of loan collection, loss mitigation, default management and ultimate resolution of a defaulted loan including as applicable the foreclosure
15
and sale of the real estate owned. The servicer has a fiduciary obligation to act in the best interest of the securitization trust, but significant latitude exists with respect to certain of its servicing activities. We have no contractual rights with respect to these servicers, and our risk management operations may not be successful in limiting future delinquencies, defaults, and losses. If a third party servicer fails to perform its duties under the securitization documents, this may result in a material increase in delinquencies or losses to the securities. As a result, the value of the securities may be impacted, and we may incur losses on our investment.
In addition, should a servicer experience financial difficulties, it may not be able to perform its obligations. Due to application of provisions of bankruptcy law, servicers who have sought bankruptcy protection may not be required to make advance payments required under the terms of the agreements governing the securities of amounts due from loan borrowers. Even if a servicer were able to advance amounts in respect of delinquent loans, its obligation to make the advances may be limited to the extent that is does not expect to recover the advances due to the deteriorating credit of the delinquent loans.
We also rely on corporate trustees to act on behalf of us and other holders of securities in enforcing our rights. Under the terms of most securities we hold we do not have the right to directly enforce remedies against the issuer of the security, but instead must rely on a trustee to act on behalf of us and other security holders. Should a trustee not be required to take action under the terms of the securities, or fail to take action, we could experience losses.
Credit ratings assigned to debt securities by the credit rating agencies may not accurately reflect the risks associated with those securities. Changes in credit ratings for securities we own or for similar securities might negatively impact the market value of these securities.
Rating agencies rate securities based upon their assessment of the safety of the receipt of principal and interest payments on the securities. Rating agencies do not consider the risks of fluctuations in fair value or other factors that may influence the value of securities and, therefore, the assigned credit rating may not fully reflect the true risks of an investment in securities. Also, rating agencies may fail to make timely adjustments to credit ratings based on available data or changes in economic outlook or may otherwise fail to make changes in credit ratings in response to subsequent events, so our investments may be better or worse than the ratings indicate. We attempt to reduce the impact of the risk that a credit rating may not accurately reflect the risks associated with a particular debt security by not relying solely on credit ratings as the indicator of the quality of an investment. We make our acquisition decisions after factoring in other information that we have obtained about the loans underlying the security and the credit subordination structure of the security. Despite these efforts, our assessment of the quality of an investment may also prove to be inaccurate and we may incur credit losses in excess of our initial expectations.
Credit rating agencies may change their methods of evaluating credit risk and determining ratings on securities backed by real estate loans and securities. These changes may occur quickly and often. The market’s ability to understand and absorb these changes, and the impact to the securitization market in general, are difficult to predict. Such changes may have a negative impact on the value of securities that we own.
If a lender to us in a repurchase transaction defaults on its obligation to resell the underlying security back to us at the end of the transaction term, or if we default on our obligations under a repurchase agreement, we will incur losses.
Repurchase agreement transactions are legally structured as the sale of a security to a lender in return for cash from the lender. These transactions are accounted for as financing agreements because the lenders are obligated to resell the same securities back to us at the end of the transaction term. Because the cash we receive from the lender when we initially sell the securities to the lender is less than the value of those securities, if the lender defaults on its obligation to resell the same securities back to us, we would incur a loss on the transaction equal to the difference between the value of the securities sold and the amount borrowed from the lender. The lender may default on its obligation to resell if it experiences financial difficulty or if the lender has re-hypothecated the security to another party who fails to transfer the security back to the lender. Additionally, if we default on one of our obligations under a repurchase agreement, the lender can terminate the transaction, sell the underlying collateral and cease entering into any other repurchase transactions with us. Any losses we incur on our repurchase transactions could adversely affect our earnings and reduce our ability to pay dividends to our shareholders.
16
In the event of bankruptcy either by ourselves or one or more of our third party lenders, under the U.S. Bankruptcy Code, assets pledged as collateral under repurchase agreements may not be recoverable by us. We may incur losses equal to the excess of the collateral pledged over the amount of the associated repurchase agreement borrowing.
In the event that one of our lenders under a repurchase agreement files for bankruptcy, it may be difficult for us to recover our assets pledged as collateral to such lender. In addition, if we ever file for bankruptcy, lenders under our repurchase agreements may be able to avoid the automatic stay provisions of the U.S. Bankruptcy Code and take possession of and liquidate our collateral under our repurchase agreements without delay. In the event of a bankruptcy by one of our lenders, or us, we may incur losses in amounts equal to the excess of our collateral pledged over the amount of repurchase agreement borrowing due to the lender.
If we fail to properly conduct our operations we could become subject to regulation under the 1940 Act. Conducting our business in a manner so that we are exempt from registration under and compliance with the 1940 Act may reduce our flexibility and could limit our ability to pursue certain opportunities.
We seek to conduct our operations so as to avoid falling under the definition of an investment company pursuant to the 1940 Act. Specifically, we seek to conduct our operations under the exemption provided under Section 3(c)(5)(C) of the 1940 Act, a provision available to companies primarily engaged in the business of purchasing and otherwise acquiring mortgages and other liens on and interests in real estate. According to SEC no-action letters, companies relying on this exemption must ensure that at least 55% of their assets are mortgage loans and other qualifying assets, and at least 80% of their assets are real estate-related. The 1940 Act requires that we and each of our subsidiaries evaluate our qualification for exemption under the Act. Our subsidiaries will rely either on Section 3(c)(5)(C) or other sections that provide exemptions from registering under the 1940 Act, including Sections 3(a)(1)(C) and 3(c)(7). The SEC issued a concept release in 2011 announcing that it was reviewing the Section 3(c)(5)(C) exemption, particularly as it relates to mortgage REITs, but has not taken any action or issued any interpretive guidance since that time. We believe that we are operating our business in accordance with the exemption requirements of Section 3(c)(5)(C).
Under the 1940 Act, an investment company is required to register with the SEC and is subject to extensive restrictive and potentially adverse regulations relating to, among other things, operating methods, management, capital structure, leverage, dividends, and transactions with affiliates. If we were determined to be an investment company, our ability to use leverage and conduct business as we do today would be substantially impaired.
If we fail to abide by certain Commodity Futures Trading Commission (“CFTC”) rules and regulations, we may be subject enforcement action by the CFTC.
On December 7, 2012, the CFTC’s Division of Swap Dealer and Intermediary Oversight (the “Division”) issued no-action relief from commodity pool operator (“CPO”) registration to mortgage REITs that use CFTC-regulated products (“commodity interests”) and that satisfy certain enumerated criteria. Pursuant to the no-action letter, the Division will not recommend that the CFTC take enforcement action against a mortgage REIT if its operator fails to register as a CPO, provided that the mortgage REIT (i) submits a claim to take advantage of the relief and (ii) the mortgage REIT: (a) limits the initial margin and premiums required to establish its commodity interest positions to no greater than 5 percent of the fair market value of the mortgage REIT’s total assets; (b) limits the net income derived annually from its commodity interest positions, excluding the income from commodity interest positions that are “qualifying hedging transactions,” to less than 5 percent of its annual gross income; (c) does not market interests in the mortgage REIT to the public as interests in a commodity pool or otherwise in a vehicle for trading in the commodity futures, commodity options or swaps markets; and (d) either: (A) identified itself as a “mortgage REIT” in Item G of its last U.S. income tax return on Form 1120-REIT; or (B) if it has not yet filed its first U.S. income tax return on Form 1120-REIT, it discloses to its shareholders that it intends to identify itself as a “mortgage REIT” in its first U.S. income tax return on Form 1120-REIT.
We believe that we have complied with all of the requirements set forth above as of and for the year ended December 31, 2016. If we fail to satisfy the criteria set forth above, or if the criteria change, we may become subject to CFTC regulation or enforcement action, the consequences of which could have a material adverse effect on our financial condition or results of operations.
17
RISKS RELATED TO REGULATORY POLICY
The effects of legislative and regulatory changes on our business, the housing finance industry, and the markets in which we invest and borrow are uncertain and may be adverse to our business, results of operations, and financial condition.
As a result of the financial crisis in 2007-2008, Congress passed the Dodd-Frank Act in July 2010 which significantly increased the regulation of, and as a result significantly reduced certain activities of affected financial institutions. It also created agencies such as the Consumer Financial Protection Bureau ("CFPB") and expanded certain powers of government regulatory agencies in an effort to enhance oversight of the financial services industry, including the housing finance industry. Although much of the Dodd-Frank Act has been implemented, there are some key aspects of the legislation not yet implemented. There is significant uncertainty regarding the legislative and regulatory changes that will be implemented or proposed by the administration of President Trump and the current U.S. Congress, particularly regarding the possible repeal of portions of the Dodd-Frank Act, housing policy and housing finance reform in the U.S., and the future roles of regulatory agencies such as the CFPB. Due to this uncertainty, it is not possible for us to predict how legislative or regulatory changes will affect our business, and there can be no assurance that these regulations will not have an adverse impact on our business, results of operations, or financial condition.
In addition, there is an ongoing debate over the degree and kind of regulation that should be applied to entities that participate in what is popularly referred to as “shadow banking.” While there is no authoritative definition of what “shadow banking” is, it generally refers to financial intermediation involving entities and activities outside of the traditional depositary banking system, such as mortgage REITs, repurchase agreement financing, securitizations, private equity funds and hedge funds. A general policy concern is that an aspect or component of shadow banking that is not subject to banking regulation - such as safety and soundness regulation and capital requirements - or other government oversight could be a source of financial instability or pose systemic risk to the broader banking and financial markets. Several organizations, including the Financial Stability Board (an international organization comprised of representatives from national financial authorities, central banks and international finance organizations primarily from the Group of Twenty Nations) and the Financial Stability Oversight Council (established by the Dodd-Frank Act) have issued policy recommendations to strengthen oversight and regulation of shadow banking. While at this stage it is difficult to predict the type and scope of any new regulations that may be adopted, if such regulations were to extend the regulatory and supervisory requirements currently applicable to banks, such as capital and liquidity standards, to our business or that of our financing counterparties or mortgage originators, or were to otherwise classify all or a portion of our business (including financing strategy) as shadow banking, our regulatory and operating costs, particularly borrowing costs, could increase, which may have a material adverse effect on our business.
The Federal Reserve and other U.S. regulators have in recent years adopted regulations to improve the financial strength of the U.S. and international banking systems. Such regulation has limited certain activities of banks and other financial institutions and also has increased liquidity and capitalization requirements, particularly those applied to the largest financial institutions.
Banking regulators and the Basel Committee on Banking Supervision (the “Basel Committee”) continue to take steps to require financial institutions, and particularly the largest bank holding companies and their subsidiary banks and affiliates, to strengthen their funding and leverage positions in an effort to address factors that contributed to financial distress from 2007 through 2009. Several recently adopted regulations and rules that are expected to be proposed may significantly impact the future availability of repurchase agreement financing, which could impact our business model.
U.S. banking regulators adopted final rules in 2014 to implement a supplemental leverage ratio (“SLR”) and a liquidity coverage ratio (“LCR”) and have published proposed rules for a net stable funding ratio ("NSFR"). The SLR applies to U.S. bank holding companies with $700 billion or more in consolidated assets, or over $10 trillion in assets under custody, and their bank subsidiaries. The SLR requires that a covered institution maintain a regulatory leverage buffer of 2% above the minimum leverage ratio that is otherwise required (3%), for a total of 5%, and covered bank subsidiaries must maintain a 6% leverage ratio to be considered well-capitalized. The LCR applies and the NSFR will apply to all banking organizations with $250 billion or more in total consolidated assets, or $10 billion or more in foreign exposure on the organization’s balance sheet, and a less stringent LCR applies, and a less stringent NSFR will apply, to a banking organization with $50 billion or more in consolidated assets that does not meet the other tests. The LCR creates a minimum liquidity standard that requires a banking organization to
18
hold high quality, liquid assets that would meet net cash outflows during a 30-day stress period. The NSFR is designed to address funding and maturity mismatches and requires a covered banking organization to obtain and rely more on funding sources that are stable and longer-term in nature as a regulatory tool to reduce a banking organization's reliance on more unstable, short-term funding (including short-term wholesale funding. The SLR will be effective on January 1, 2018, the LCR will be effective on January 1, 2017, and the NSFR is proposed to be effective on January 1, 2018. These regulations could significantly impact a banking organization’s short-term liquidity and longer-term liquidity requirements, funding sources and funding risks.
The complete impact of the SLR and the LCR, when fully implemented, and the NSFR, if adopted as proposed by the U.S. banking regulators and when fully implemented, is not currently known. Application of these regulatory requirements and ratios would impact the leverage and funding profiles of large financial institutions and their affiliates, including many broker-dealers and other subsidiaries that are affiliated with large banking organizations and from which we obtain financing, and could lead to an increase in our cost of financing and reduce the amount of repurchase agreement financing made available to the financing markets.
U.S. regulators have recently introduced capitalization standards for U.S. domiciled broker dealers of foreign banks. When fully implemented, these regulations and capitalization standards may impact the future availability of repurchase agreement financing which could impact our business model and adversely affect our financial conditions and results of operations.
In addition to the SLR, and LCR, and the NSFR if adopted as proposed, the Federal Reserve has adopted rules that will require foreign bank holding companies with combined U.S. assets of more than $50 billion to establish an intermediate holding company (“IHC”) that is headquartered in the U.S. over the company’s U.S. subsidiaries. Any such IHC will be subject to regulatory capital and leverage requirements, including the SLR and LCR, and the NSFR if adopted, subject to meeting relevant asset thresholds, as well as regulatory capital planning and stress testing requirements. This increased regulatory oversight could further limit the repurchase agreement financing made available by these foreign IHCs and their subsidiaries and affiliates, which could further increase our cost of financing. If the SLR, LCR or NSFR, including the application of these ratios to IHCs, causes the availability of repurchase agreement financing to decline, we may have fewer financing options in the future which could lead to lower profitability and could adversely affect our financial condition.
During 2015, U.S. federal banking regulators adopted final rules to impose a capital surcharge on U.S. banks that are global systemically important banks. This capital surcharge began in 2016 and will continue being phased in until 2019 and requires these institutions to hold from 1.0% to 4.5% additional common equity Tier 1 capital, depending on the institution’s systemic importance calculated as provided in the final rules, over the minimum risk-based capital requirements. During 2016, U.S. federal banking regulators adopted final rules to impose loss absorbency requirements, or a measure of combined eligible Tier 1 capital and eligible long-term debt, on U.S. banks that are global systemically important banks. These rules also require these institutions to maintain an outstanding amount of eligible long-term debt based on either risk-weighted assets or average total consolidated assets. These final rules aim to increase covered institutions’ capital and leverage ratios and to increase the capital available to support or resolve these institutions in periods of severe market stress or in the event of resolution. Application of the capital surcharge and loss absorbency requirements may change the leverage and funding profiles of the largest U.S. banks and their affiliates and counterparties, including entities from which we obtain financing, and could lead to a reduction in the amount of repurchase financing made available to the financing markets.
The Treasury and Congress continue to seek ways to support the U.S. housing market and the overall U.S. economy, including seeking ways to make it easier to refinance loans owned or guaranteed by Fannie Mae or Freddie Mac where the borrower may have negative equity. In addition, mortgage loan modification programs and future legislative action may adversely affect the value of and the return on Agency RMBS securities in which we invest. Since we own our Agency RMBS at premiums to their par balance, we could incur substantial losses on our Agency RMBS if there in an increase in mortgage loan refinancing.
The Treasury and the Department of Housing and Urban Development ("HUD") have implemented the Home Affordable Refinance Program (or "HARP"), which allows borrowers who are current on their mortgage payments to refinance loans originated on or before May 31, 2009, with current loan-to-value ratios exceeding 80%, in order to reduce their monthly mortgage payments. HARP specifically targets borrowers that are current on their mortgage payment but who have negative equity in their home and, as a result, have been unable to refinance into a lower cost mortgage (given the decline in current mortgage rates compared to pre-May 31, 2009). If refinance activity increases for Agency RMBS as a result of these or other government
19
programs or efforts, or if we increase forecasted prepayments on our Agency RMBS, our net interest income would be negatively impacted by the additional amortization of premium on our Agency RMBS. In addition, we may experience significant volatility in the market value of Agency RMBS as the market resets prepayment expectations on Agency RMBS. Such volatility could lead to margin calls from our repurchase agreement lenders and could force us to sell these securities under unfavorable conditions and possibly at a loss.
The Treasury and HUD have also created a number of different programs intended to assist borrowers that are struggling to make their mortgage payment that may involve, among other things, the modification of mortgage loans to reduce the principal amount of the loans (through forbearance and/or forgiveness) and/or the rate of interest payable on the loans, or to extend the payment terms of the loans. Loan modifications such as these could result in our ultimately receiving less than we are contractually due on certain of our investments. A significant number of loan modifications with respect to a given security could negatively impact the realized yields and cash flows on such security. These loan modification programs, future legislative or regulatory actions, including new mortgage loan modification programs and possible amendments to the bankruptcy laws, which result in the modification of outstanding residential mortgage loans, as well as changes in the requirements necessary to qualify for refinancing mortgage loans with Fannie Mae, Freddie Mac or Ginnie Mae, may adversely affect the value of, and the returns on, our securitized single-family mortgage loans and Agency RMBS.
RISKS RELATED TO OUR TAXATION AS A REIT AND OTHER TAX RELATED MATTERS
Qualifying as a REIT involves highly technical and complex provisions of the Code, and a technical or inadvertent violation could jeopardize our REIT qualification. Maintaining our REIT status may reduce our flexibility to manage our operations.
Qualification as a REIT involves the application of highly technical and complex Code provisions for which only limited judicial and administrative authorities exist. Even a technical or inadvertent violation could jeopardize our REIT qualification. Our qualification as a REIT will depend on our satisfaction of certain asset, income, organizational, distribution, stockholder ownership and other requirements on a continuing basis. Our operations and use of leverage also subjects us to interpretations of the Code, and technical or inadvertent violations of the relevant requirements under the Code could cause us to lose our REIT status or to pay significant penalties and interest. In addition, our ability to satisfy the requirements to qualify as a REIT depends in part on the actions of third parties over which we have no control or only limited influence, including in cases where we own an equity interest in an entity that is classified as a partnership for U.S. federal income tax purposes.
Maintaining our REIT status may limit flexibility in managing our operations. For instance:
• | If we make frequent asset sales from our REIT entities to persons deemed customers, we could be viewed as a “dealer,” and thus subject to 100% prohibited transaction taxes or other entity level taxes on income from such transactions. |
• | Compliance with the REIT income and asset requirements may limit the type or extent of hedging that we can undertake. |
• | Our ability to own non-real estate related assets and earn non-real estate related income is limited. Our ability to own equity interests in other entities is limited. If we fail to comply with these limits, we may be forced to liquidate attractive assets on short notice on unfavorable terms in order to maintain our REIT status. |
• | Our ability to invest in taxable subsidiaries is limited under the REIT rules. Maintaining compliance with this limitation could require us to constrain the growth of future taxable REIT affiliates. |
• | Notwithstanding our NOL carryforward, meeting minimum REIT dividend distribution requirements could reduce our liquidity. Earning non-cash REIT taxable income could necessitate our selling assets, incurring debt, or raising new equity in order to fund dividend distributions. |
• | Stock ownership tests may limit our ability to raise significant amounts of equity capital from one source. |
If we do not qualify as a REIT or fail to remain qualified as a REIT, we may be subject to tax as a regular corporation and could face a tax liability, which would reduce the amount of cash available for distribution to our shareholders.
We intend to operate in a manner that will allow us to qualify as a REIT for federal income tax purposes. Our qualification as a REIT will depend on our satisfaction of certain asset, income, organizational, distribution, stockholder ownership and other
20
requirements on a continuing basis. Our ability to satisfy the asset tests depends upon our analysis of the characterization and fair market values of our assets, some of which are not susceptible to a precise determination, and for which we will not obtain independent appraisals. Our compliance with the REIT income and quarterly asset requirements also depends upon our ability to successfully manage the composition of our income and assets on an ongoing basis.
If we were to fail to qualify as a REIT in any taxable year, we would be subject to federal income tax, after consideration of our NOL carryforward but not considering any dividends paid to our shareholders during the respective tax year. If we could not otherwise offset this taxable income with our NOL carryforward, the resulting corporate tax liability could be material to our results and would reduce the amount of cash available for distribution to our shareholders, which in turn could have an adverse impact on the value of our common stock. Unless we were entitled to relief under certain Code provisions, we also would be disqualified from taxation as a REIT until the fifth taxable year following the year for which we failed to qualify as a REIT.
Our future use of our tax NOL carryforward is limited under Section 382 of the Code, which could result in higher taxable income and greater distribution requirements in order to maintain our REIT status. Further, if we unknowingly undergo another ownership change pursuant to Section 382, or miscalculate the limitations imposed by a known ownership change, and utilize an impermissible amount of the NOL, we may fail to meet the distribution requirements of a REIT and therefore we could lose our REIT status.
We can use our tax NOL carryforward to offset our taxable earnings after taking the REIT distribution requirements into account. Section 382 of the Code limits the amount of NOL that could be used to offset taxable earnings after an “ownership change” occurs. A Section 382 ownership change generally occurs if one or more shareholders who own at least 5% of our stock, or certain groups of shareholders, increase their aggregate ownership by more than 50 percentage points over their lowest ownership percentage within a rolling three-year period.
In 2012, we experienced an ownership change under Section 382 and based on management's analysis and expert third-party advice, which necessarily includes certain assumptions regarding the application of Section 382, we determined that the ownership change under Section 382 will limit our ability to use our NOL carryforward to offset our taxable income to an estimated maximum amount of $13.5 million per year. Because NOLs generally may be carried forward for up to 20 years, this annual limitation may effectively limit the cumulative amount of pre-ownership change losses and certain recognized built-in losses that we may utilize. This would result in higher taxable income and greater distribution requirements in order to maintain REIT qualification than if such limitation were not in effect.
We may incur additional ownership changes under Section 382 in the future, in which case the use of our NOL could be further limited. If further ownership changes occur, Section 382 would impose stricter annual limits on the amount of pre-ownership change NOLs and other losses we could use to reduce our taxable income.
If we unknowingly undergo another ownership change under Section 382, or miscalculate the limitations imposed by a known ownership change, the use of the NOL could be limited more than we have determined and we may utilize (or may have utilized) more of the NOL than we otherwise may have been allowed. In such an instance we may be required to pay taxes, penalties and interest on the excess amount of NOL used, or we may be required to declare a deficiency dividend to our shareholders for the excess amount. In addition, if any impermissible use of the NOL led to a failure to comply with the REIT distribution requirements, we could fail to qualify as a REIT.
We have not established a minimum dividend payment level and we cannot assure you of our ability to pay dividends in the future.
We intend to pay quarterly dividends to our common stockholders and to make distributions to our shareholders in amounts such that all or substantially all of our taxable income, subject to certain adjustments including utilization of our NOL, is distributed. However, we have not established a minimum dividend payment level, and the amount of our dividend will fluctuate. Our ability to pay dividends may be adversely affected by the risk factors described herein. All distributions will be made at the discretion of our Board of Directors and will depend on our GAAP and tax earnings, our financial condition, the requirements for REIT qualification and such other factors as our Board of Directors may deem relevant from time to time. We may not be able to make distributions, or our Board of Directors may change our dividend policy in the future. To the extent
21
that we decide to pay dividends in excess of our current and accumulated tax earnings and profits, such distributions would generally be considered a return of capital for federal income tax purposes. A return of capital reduces the basis of a stockholder's investment in our common stock to the extent of such basis and is treated as capital gain thereafter.
The failure of investments subject to repurchase agreements to qualify as real estate assets could adversely affect our ability to qualify as a REIT.
Repurchase agreement financing arrangements are structured legally as a sale and repurchase whereby we sell certain of our investments to a counterparty and simultaneously enter into an agreement to repurchase these securities at a later date in exchange for a purchase price. Economically, these agreements are financings which are secured by the investments sold pursuant thereto. We believe that we would be treated for REIT asset and income test purposes as the owner of the securities that are the subject of any such sale and repurchase agreement, notwithstanding that such agreement may legally transfer record ownership of the securities to the counterparty during the term of the agreement. It is possible, however, that the IRS could assert that we did not own the securities during the term of the sale and repurchase agreement, in which case we could fail to qualify as a REIT.
Even if we remain qualified as a REIT, we may face other tax liabilities that reduce our cash flow and our profitability.
Even if we remain qualified for taxation as a REIT, we may be subject to certain federal, state and local taxes on our income and assets, including taxes on any undistributed income, tax on income from some activities conducted as a result of a foreclosure or considered prohibited transactions under the Code, and state or local income taxes. Any of these taxes would decrease cash available for distribution to our shareholders. In addition, in order to meet the REIT qualification requirements, or to avert the imposition of a 100% tax that applies to certain gains derived by a REIT from prohibited transactions, we may hold some of our assets through a taxable REIT subsidiary (“TRS”) or other subsidiary corporations that will be subject to corporate-level income tax at regular rates to the extent that such TRS does not have an NOL carryforward. Any of these taxes would decrease cash available for distribution to our shareholders.
Recognition of excess inclusion income by us could have adverse consequences to us or our shareholders.
Certain of our securities have historically generated excess inclusion income and may continue to do so in the future. Certain categories of shareholders, such as foreign shareholders eligible for treaty or other benefits, shareholders with NOLs, and certain tax-exempt shareholders that are subject to unrelated business income tax, could be subject to increased taxes on a portion of their dividend income from us that is attributable to excess inclusion income. In addition, to the extent that our stock is owned by tax-exempt “disqualified organizations,” such as certain government-related entities and charitable remainder trusts that are not subject to tax on unrelated business income, we may incur a corporate level tax on a portion of our income. In that case, we may reduce the amount of our distributions to any disqualified organization whose stock ownership gave rise to the tax.
Dividends payable by REITs do not qualify for the reduced tax rates available for some dividends.
The maximum tax rate applicable to income from “qualified dividends” payable to domestic shareholders that are individuals, trusts and estates may be either15% or 20%, depending on the taxpayer's income tax bracket. Dividends payable by REITs, however, generally are not qualifying dividends and are therefore not eligible for the reduced rates. The more favorable rates applicable to regular corporate qualified dividends could cause investors who are individuals, trusts and estates to perceive investments in REITs to be relatively less attractive than investments in the stocks of non-REIT corporations that pay dividends, which could adversely affect the value of the stock of REITs, including our common stock.
RISKS RELATED TO OUR CORPORATE STRUCTURE
The stock ownership limit imposed by the Code for REITs and our Articles of Incorporation may restrict our business combination opportunities. The stock ownership limitation may also result in reduced liquidity in our stock and may result in losses to an acquiring shareholder.
To qualify as a REIT under the Code, not more than 50% in value of our outstanding stock may be owned, directly or indirectly, by five or fewer individuals (as defined in the Code to include certain entities) at any time during the last half of each
22
taxable year. Our Articles of Incorporation, with certain exceptions, authorize our Board of Directors to take the actions that are necessary and desirable to qualify as a REIT. Pursuant to our Articles of Incorporation, no person may beneficially or constructively own more than 9.8% of our capital stock (including our common stock, Series A Preferred Stock, and Series B Preferred Stock). Our Board of Directors may grant an exemption from this 9.8% stock ownership limitation, in its sole discretion, subject to such conditions, representations and undertakings as it may determine are reasonably necessary.
Whether we would waive the ownership limitation for any other shareholder will be determined by our Board of Directors on a case by case basis. Our Articles of Incorporation’s constructive ownership rules are complex and may cause the outstanding stock owned by a group of related individuals or entities to be deemed as constructively owned by one individual or entity. As a result, the acquisition of less than these percentages of the outstanding stock by an individual or entity could cause that individual or entity to own constructively in excess of these percentages of the outstanding stock and thus be subject to the ownership limit. The Board of Directors has the right to refuse to transfer any shares of our capital stock in a transaction that would result in ownership in excess of the ownership limit. In addition, we have the right to redeem shares of our capital stock held in excess of the ownership limit.
The ownership limits imposed by the tax law are based upon direct or indirect ownership by “individuals,” but only during the last half of a tax year. The ownership limits contained in our Articles of Incorporation apply to the ownership at any time by any “person,” which includes entities, and are intended to assist us in complying with the tax law requirements and to minimize administrative burdens. However, these ownership limits might also delay or prevent a transaction or a change in our control that might involve a premium price for our stock or otherwise be in the best interest of our shareholders.
The stock ownership limit imposed by the Code for REITs and our Articles of Incorporation may impair the ability of holders to convert shares of our Series A Preferred Stock or Series B Preferred Stock into shares of our common stock upon a change of control.
The terms of our Series A Preferred Stock and Series B Preferred Stock provide that, upon occurrence of a change of control (as defined in the Articles of Incorporation), each holder of Series A Preferred Stock or Series B Preferred Stock will potentially have the right to convert in conjunction with a change in control all or part of the Series A Preferred Stock and Series B Preferred Stock held by such holder into a number of shares of our common stock per share of Series A Preferred Stock or Series B Preferred Stock, respectively, based on formulas set forth in our Articles of Incorporation. However, the stock ownership restrictions in our Articles of Incorporation also restrict ownership of shares of our Series A Preferred Stock and Series B Preferred Stock. As a result, no holder of Series A Preferred Stock or Series B Preferred Stock will be entitled to convert such stock into our common stock to the extent that receipt of our common stock would cause the holder to exceed the ownership limitations contained in our Articles of Incorporation, endanger the tax status of one or more real estate mortgage investment conduits ("REMICs") in which we have or plan to have an interest, or result in the imposition of a direct or indirect penalty tax on us. These provisions may limit the ability of a holder of Series A Preferred Stock or Series B Preferred Stock to convert shares of Series A Preferred Stock or Series B Preferred Stock into our common stock upon a change of control, which could adversely affect the market price of shares of our Series A Preferred Stock or of our Series B Preferred Stock.
ITEM 1B. | UNRESOLVED STAFF COMMENTS |
There are no unresolved comments from the SEC Staff.
ITEM 2. | PROPERTIES |
We lease one facility located at 4991 Lake Brook Drive, Suite 100, Glen Allen, Virginia 23060 which provides 9,350 square feet of office space for our executive officers and employees. The term of the lease expires in March 2020, but may be renewed at our option for four additional periods of one year each at a rental rate 2.5% greater than the rate in effect during the preceding 12-month period or for one additional five-year period at the fair market rental rate for the time period such determination is being made for office space of comparable condition and location.
23
ITEM 3. | LEGAL PROCEEDINGS |
From time to time, the Company and its subsidiaries are parties to various legal proceedings. As of December 31, 2016, neither the Company nor any of its subsidiaries were a party to any material legal proceedings.
As noted in previous filings, DCI Commercial, Inc. (“DCI”), a former affiliate of the Company and formerly known as Dynex Commercial, Inc., was named a party to several lawsuits in 1999 and 2000 regarding the activities of DCI while it was an operating subsidiary of an affiliate of the Company. In certain instances, the Company was also a party to the lawsuit due to its affiliation with DCI. The Company is no longer a defendant in any litigation related to the activities of DCI. In 2013, in the conclusion of litigation that was tried in 2004, plaintiffs in that case (the “DCI Plaintiffs”) were awarded a judgment of $26.5 million against DCI (the “DCI Judgment”). In 2014, third parties were awarded a judgment against certain of the DCI Plaintiffs in a matter not involving the Company or DCI. Those parties are now pursuing a garnishment action against the DCI Judgment. Those parties have requested from the Company certain information related to DCI while it was an affiliate of the Company and certain other information related to the activities of DCI.
If such requests were to lead to legal proceedings of any nature, the outcome of any such legal proceeding could not be predicted with certainty. The Company believes, however, based on current knowledge, that the resolution of any such proceeding would not have a material adverse effect on the Company’s consolidated financial condition or liquidity. However, the resolution of any such proceeding could have a material impact on consolidated results of operations or cash flows in a given future reporting period as the proceeding is resolved.
Other than as described above, to the Company’s knowledge, there are no threatened legal proceedings, which, in management’s opinion, individually or in the aggregate, would have a material adverse effect on the Company’s results of operations or financial condition.
ITEM 4. | MINE SAFETY DISCLOSURES |
None.
24
PART II.
ITEM 5. MARKET FOR REGISTRANT'S COMMON EQUITY, RELATED STOCKHOLDER MATTERS, AND ISSUER PURCHASES OF EQUITY SECURITIES
Our common stock is traded on the New York Stock Exchange under the trading symbol “DX”. The common stock was held by approximately 18,911 holders of record as of February 28, 2017. On that date, the closing price of our common stock on the New York Stock Exchange was $6.86 per share. The high and low common stock prices and cash dividends declared on our common stock, our Series A Preferred Stock, and our Series B Preferred Stock for each quarter during the last two years were as follows:
Dividends Declared | |||||||||
High | Low | Common Stock | Series A Preferred Stock | Series B Preferred Stock | |||||
2016: | |||||||||
First quarter | $6.92 | $5.22 | $0.21 | $0.53125 | $0.4765625 | ||||
Second quarter | $7.00 | $6.33 | $0.21 | $0.53125 | $0.4765625 | ||||
Third quarter | $7.61 | $6.56 | $0.21 | $0.53125 | $0.4765625 | ||||
Fourth quarter | $7.21 | $6.49 | $0.21 | $0.53125 | $0.4765625 | ||||
2015: | |||||||||
First quarter | $8.56 | $8.07 | $0.24 | $0.53125 | $0.4765625 | ||||
Second quarter | $8.29 | $7.62 | $0.24 | $0.53125 | $0.4765625 | ||||
Third quarter | $7.67 | $6.40 | $0.24 | $0.53125 | $0.4765625 | ||||
Fourth quarter | $6.96 | $6.10 | $0.24 | $0.53125 | $0.4765625 | ||||
When declaring dividends, the Board of Directors considers the requirements for maintaining our REIT status and maintaining compliance with dividend requirements of the Series A Preferred Stock and Series B Preferred Stock. In addition, the Board considers, among other things, the Company's long-term outlook, the Company’s financial conditions and results of operations during recent financial periods, and trends in the investment and financing markets.
The following table summarizes dividends declared per share and their related tax characterization for the years ended December 31, 2016 and December 31, 2015:
Tax Characterization | Total Dividends Declared Per Share | ||||||||||||||
Ordinary | Capital Gain | Return of Capital | |||||||||||||
Common dividends declared: | |||||||||||||||
Year ended December 31, 2016 | $ | 0.2572877 | $ | — | $ | 0.5827123 | $ | 0.8400 | |||||||
Year ended December 31, 2015 | $ | 0.8419484 | $ | — | $ | 0.1180516 | $ | 0.9600 | |||||||
Preferred Series A dividends declared: | |||||||||||||||
Year ended December 31, 2016 | $ | 2.1250000 | $ | — | $ | — | $ | 2.1250 | |||||||
Year ended December 31, 2015 | $ | 2.1250000 | $ | — | $ | — | $ | 2.1250 | |||||||
Preferred Series B dividends declared: | |||||||||||||||
Year ended December 31, 2016 | $ | 1.9062500 | $ | — | $ | — | $ | 1.9063 | |||||||
Year ended December 31, 2015 | $ | 1.9062500 | $ | — | $ | — | $ | 1.9063 | |||||||
25
The following graph is a five year comparison of cumulative total returns for the shares of our common stock, the Standard & Poor’s 500 Stock Index (“S&P 500”), the Bloomberg Mortgage REIT Index, and the SNL U.S. Finance REIT Index. The table below assumes $100 was invested at the close of trading on December 31, 2011 in each of our common stock, the S&P 500, the Bloomberg Mortgage REIT Index, and the SNL U.S. Finance REIT Index and assumes reinvestment of dividends.
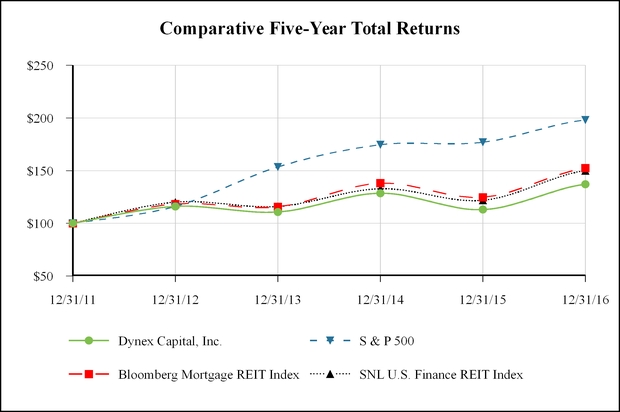
Cumulative Total Stockholder Returns as of December 31, | ||||||||||||||||||
Index | 2011 | 2012 | 2013 | 2014 | 2015 | 2016 | ||||||||||||
Dynex Capital, Inc. Common Stock | $ | 100.00 | $ | 116.04 | $ | 110.82 | $ | 128.52 | $ | 113.05 | $ | 137.05 | ||||||
S&P 500 | $ | 100.00 | $ | 116.00 | $ | 153.57 | $ | 174.60 | $ | 177.01 | $ | 198.18 | ||||||
Bloomberg Mortgage REIT Index | $ | 100.00 | $ | 118.40 | $ | 115.70 | $ | 138.18 | $ | 124.65 | $ | 152.42 | ||||||
SNL U.S. Finance REIT Index | $ | 100.00 | $ | 120.09 | $ | 115.98 | $ | 132.82 | $ | 121.80 | $ | 150.03 | ||||||
The sources of this information are Bloomberg, SNL Financial, and Standard & Poor’s, which management believes to be reliable sources. The historical information set forth above is not necessarily indicative of future performance. Accordingly, we do not make or endorse any predictions as to future share performance.
The Company has been authorized by its Board of Directors to repurchase up to $40 million of its outstanding shares of common stock through December 31, 2018. Subject to applicable securities laws and the terms of the Series A Preferred Stock designation and the Series B Preferred Stock designation, both of which are contained in our Articles of Incorporation, future repurchases of common stock will be made at times and in amounts as the Company deems appropriate, provided that the repurchase price per share is less than the Company's estimate of the current net book value of a share of common stock. Repurchases may be suspended or discontinued at any time. The Company did not repurchase any shares during the three months ended December 31, 2016.
26
ITEM 6. SELECTED FINANCIAL DATA
Our selected financial data presented below is derived from our audited financial statements and should be read in conjunction with our consolidated financial statements and the accompanying notes included under Item 8 of this Annual Report on Form 10-K.
As of/For the Year Ended December 31, | |||||||||||||||||||
2016 | 2015 | 2014 | 2013 | 2012 | |||||||||||||||
Balance Sheet Data: | ($ in thousands except share and per share data) | ||||||||||||||||||
Mortgage-backed securities | $ | 3,212,084 | $ | 3,493,701 | $ | 3,516,239 | $ | 4,018,161 | $ | 4,103,981 | |||||||||
Total assets | 3,397,731 | 3,670,048 | 3,688,311 | 4,217,137 | 4,280,229 | ||||||||||||||
Repurchase agreements | 2,898,952 | 2,589,420 | 3,013,110 | 3,580,754 | 3,564,128 | ||||||||||||||
Total liabilities | 2,930,547 | 3,178,023 | 3,081,009 | 3,631,261 | 3,663,519 | ||||||||||||||
Shareholders’ equity | 467,184 | 492,025 | 607,302 | 585,876 | 616,710 | ||||||||||||||
Common shares outstanding | 49,153,463 | 49,047,335 | 54,739,111 | 54,310,484 | 54,268,915 | ||||||||||||||
Book value per common share | $ | 7.18 | $ | 7.71 | $ | 9.02 | $ | 8.69 | $ | 10.30 | |||||||||
Statement of Comprehensive Income Data: | |||||||||||||||||||
Interest income | $ | 91,898 | $ | 100,244 | $ | 105,644 | $ | 127,132 | $ | 113,548 | |||||||||
Interest expense (1) | 25,231 | 22,605 | 25,915 | 39,028 | 35,147 | ||||||||||||||
Net interest income (1) | 66,667 | 77,639 | 79,729 | 88,104 | 78,401 | ||||||||||||||
Loss on derivative instruments, net (1) | (5,606 | ) | (43,128 | ) | (53,393 | ) | (10,076 | ) | (908 | ) | |||||||||
(Loss) gain on sale of investments, net | (4,238 | ) | (978 | ) | 16,223 | 3,354 | 8,461 | ||||||||||||
General and administrative expenses | (14,707 | ) | (17,668 | ) | (16,007 | ) | (13,058 | ) | (12,736 | ) | |||||||||
Net income to common shareholders (1) | 33,914 | 7,368 | 18,630 | 60,167 | 72,006 | ||||||||||||||
Comprehensive income (loss) to common shareholders | 14,073 | (26,716 | ) | 73,762 | (26,160 | ) | 127,772 | ||||||||||||
Average common shares outstanding | 49,114,497 | 52,847,197 | 54,701,485 | 54,647,643 | 53,146,416 | ||||||||||||||
Net income per common share-basic and diluted | $ | 0.69 | $ | 0.14 | $ | 0.34 | $ | 1.10 | $ | 1.35 | |||||||||
Comprehensive income (loss) per common share-basic and diluted | $ | 0.29 | $ | (0.51 | ) | $ | 1.35 | $ | (0.48 | ) | $ | 2.40 | |||||||
Dividends declared per share: | |||||||||||||||||||
Common | $ | 0.84 | $ | 0.96 | $ | 1.00 | $ | 1.12 | $ | 1.15 | |||||||||
Series A Preferred | $ | 2.13 | $ | 2.13 | $ | 2.13 | $ | 2.13 | $ | 0.97 | |||||||||
Series B Preferred | $ | 1.91 | $ | 1.91 | $ | 1.91 | $ | 0.94 | $ | — | |||||||||
(1) Results for these amounts for the years ended December 31, 2013 and 2012 are not directly comparable to other periods presented because the Company discontinued cash flow hedge accounting for its derivative instruments effective June 30, 2013.
27
For the Year Ended December 31, | |||||||||||||||||||
2016 | 2015 | 2014 | 2013 | 2012 | |||||||||||||||
Other Data Including Non-GAAP Financial Measures: | ($ in thousands except per share data) | ||||||||||||||||||
Adjusted interest expense (1) | $ | 27,943 | $ | 24,836 | $ | 27,345 | $ | 42,783 | $ | 35,801 | |||||||||
Adjusted net interest income (1) | 63,955 | 75,408 | 78,299 | 84,349 | 77,747 | ||||||||||||||
Core net operating income to common shareholders (1) | 40,943 | 49,174 | 54,162 | 63,786 | 63,064 | ||||||||||||||
Core net operating income per common share(1) | $ | 0.83 | $ | 0.93 | $ | 0.99 | $ | 1.17 | $ | 1.19 | |||||||||
Average interest earning assets | $ | 3,236,903 | $ | 3,685,936 | $ | 3,822,870 | $ | 4,290,073 | $ | 3,492,158 | |||||||||
Average balance of borrowings | 2,912,426 | 3,269,711 | 3,347,701 | 3,797,845 | 3,069,348 | ||||||||||||||
Weighted average effective yield (2) | 2.82 | % | 2.71 | % | 2.76 | % | 2.96 | % | 3.25 | % | |||||||||
Cost of funds (2) | 0.85 | % | 0.68 | % | 0.76 | % | 1.01 | % | 1.12 | % | |||||||||
Net interest spread | 1.97 | % | 2.03 | % | 2.00 | % | 1.95 | % | 2.13 | % | |||||||||
Adjusted cost of funds (1) | 0.94 | % | 0.75 | % | 0.81 | % | 1.10 | % | 1.14 | % | |||||||||
Adjusted net interest spread (3) | 1.88 | % | 1.96 | % | 1.95 | % | 1.86 | % | 2.11 | % | |||||||||
Weighted average effective yield by MBS type: | |||||||||||||||||||
Agency RMBS | 1.71 | % | 1.71 | % | 1.81 | % | 1.99 | % | 2.24 | % | |||||||||
Non-Agency RMBS | 3.61 | % | 3.64 | % | 6.93 | % | 5.22 | % | 5.74 | % | |||||||||
Agency CMBS | 2.95 | % | 3.08 | % | 3.62 | % | 3.59 | % | 3.69 | % | |||||||||
Non-Agency CMBS | 6.43 | % | 5.74 | % | 5.44 | % | 5.63 | % | 6.06 | % | |||||||||
Agency CMBS IO | 4.24 | % | 3.88 | % | 4.35 | % | 4.95 | % | 5.02 | % | |||||||||
Non-Agency CMBS IO | 4.11 | % | 3.98 | % | 4.08 | % | 4.82 | % | 5.39 | % | |||||||||
(1) Represents a non-GAAP financial measure. See reconciliations provided below.
(2) Recalculation of weighted average effective yields using interest income and cost of funds using interest expense may not be possible because certain income and expense items are based on a 360-day year for the calculation while others are based on actual number of days in the year.
(3) Adjusted net interest spread is a non-GAAP financial measure and is equal to the weighted average effective yield less the adjusted cost of funds, both of which are included in the table above.
Non-GAAP Financial Measures
In addition to the Company's operating results presented in accordance with GAAP, the information presented above and within Item 7, "Management's Discussion and Analysis of Financial Condition and Results of Operations" of this Annual Report on Form 10-K contains the following non-GAAP financial measures: core net operating income to common shareholders (including per common share), adjusted interest expense and adjusted cost of funds, and adjusted net interest income and spread. Management uses core net operating income (including per common share) as an estimate of the net interest earnings from our investments after operating expenses. In addition to core net operating income, management uses adjusted interest expense, adjusted cost of funds, adjusted net interest income, and adjusted net interest spread because management considers net periodic interest costs related to the Company's derivative instruments as an additional cost of using repurchase agreements to finance investments. Because these measures are used in the Company's internal analysis of financial and operating performance, management believes that they provide greater transparency to our investors of management's view of our economic performance. Management also believes that the presentation of these measures, when analyzed in conjunction with the Company's GAAP operating results, allows investors to more effectively evaluate and compare the performance of the Company to that of its peers even though peer companies may present non-GAAP measures on a different basis than the Company's. Because these non-
28
GAAP financial measures exclude certain items used to compute GAAP net income to common shareholders and GAAP interest expense, these non-GAAP financial measures should be considered as a supplement to, and not as a substitute for, the Company's GAAP results as reported on its consolidated statements of comprehensive income. In addition, because not all companies use identical calculations, the Company's presentation of non-GAAP financial measures may not be comparable to other similarly-titled measures of other companies.
For the Year Ended December 31, | |||||||||||||||||||
2016 | 2015 | 2014 | 2013 | 2012 | |||||||||||||||
Reconciliations of GAAP to Non-GAAP Financial Measures: | ($ in thousands except share data) | ||||||||||||||||||
GAAP net income to common shareholders | $ | 33,914 | $ | 7,368 | $ | 18,630 | $ | 60,167 | $ | 72,006 | |||||||||
Less: | |||||||||||||||||||
(Accretion) amortization of de-designated cash flow hedges (1) | (251 | ) | 3,499 | 6,788 | 5,193 | — | |||||||||||||
Change in fair value of derivative instruments, net (2) | 3,145 | 37,398 | 45,175 | 1,128 | 254 | ||||||||||||||
Loss (gain) on sale of investments, net | 4,238 | 978 | (16,223 | ) | (3,354 | ) | (8,461 | ) | |||||||||||
Fair value adjustments, net | (103 | ) | (69 | ) | (208 | ) | 652 | (735 | ) | ||||||||||
Core net operating income to common shareholders | $ | 40,943 | $ | 49,174 | $ | 54,162 | $ | 63,786 | $ | 63,064 | |||||||||
Average common shares outstanding | 49,114,497 | 52,847,197 | 54,701,485 | 54,647,643 | 53,146,416 | ||||||||||||||
Core net operating income per common share | $ | 0.83 | $ | 0.93 | $ | 0.99 | $ | 1.17 | $ | 1.19 | |||||||||
GAAP interest expense | $ | 25,231 | $ | 22,605 | $ | 25,915 | $ | 39,028 | $ | 35,147 | |||||||||
Less: accretion (amortization) of de-designated cash flow hedges (1) | 251 | (3,499 | ) | (6,788 | ) | (5,193 | ) | — | |||||||||||
Add: net periodic interest costs of derivative instruments | 2,461 | 5,730 | 8,218 | 8,948 | 654 | ||||||||||||||
Adjusted interest expense | $ | 27,943 | $ | 24,836 | $ | 27,345 | $ | 42,783 | $ | 35,801 | |||||||||
GAAP cost of funds | 0.85 | % | 0.68 | % | 0.76 | % | 1.01 | % | 1.12 | % | |||||||||
Less: effect of amortization of de-designated cash flow hedges (1) | 0.01 | % | (0.11 | )% | (0.20 | )% | (0.15 | )% | — | % | |||||||||
Add: effect of net periodic interest costs of derivative instruments | 0.08 | % | 0.18 | % | 0.25 | % | 0.24 | % | 0.02 | % | |||||||||
Adjusted cost of funds | 0.94 | % | 0.75 | % | 0.81 | % | 1.10 | % | 1.14 | % | |||||||||
GAAP interest income | $ | 91,898 | $ | 100,244 | $ | 105,644 | $ | 127,132 | $ | 113,548 | |||||||||
Adjusted interest expense | 27,943 | 24,836 | 27,345 | 42,783 | 35,801 | ||||||||||||||
Adjusted net interest income | $ | 63,955 | $ | 75,408 | $ | 78,299 | $ | 84,349 | $ | 77,747 | |||||||||
(1) | Amount recorded as a portion of "interest expense" in accordance with GAAP related to the amortization of the balance remaining in accumulated other comprehensive loss as of June 30, 2013 as a result of the Company's discontinuation of cash flow hedge accounting. |
(2) | Represents net realized and unrealized gains and losses on derivatives and excludes net periodic interest costs related to these instruments. |
29
ITEM 7. MANAGEMENT'S DISCUSSION AND ANALYSIS OF FINANCIAL CONDITION AND RESULTS OF OPERATIONS
The following discussion should be read in conjunction with our financial statements and the related notes included in Item 8, "Financial Statements and Supplementary Data” in this Annual Report on Form 10-K.
This discussion contains forward-looking statements that involve risks and uncertainties. Our actual results could differ materially from those anticipated in these forward-looking statements as a result of various factors including, but not limited to, those disclosed in Item 1A, “Risk Factors” elsewhere in this Annual Report on Form 10-K and in other documents filed with the SEC and otherwise publicly disclosed. Please refer to “Forward-Looking Statements” contained within this Item 7 for additional information. This discussion also contains non-GAAP financial measures. Please refer to Item 6 of this Annual Report on Form 10-K for reconciliations of these non-GAAP measures and additional information about why management believes these non-GAAP measures are useful for shareholders.
For a complete description of our business including our operating policies, investment philosophy and strategy, financing and hedging strategies, and other important information, please refer to Item 1 of Part 1 of this Annual Report on Form 10-K.
EXECUTIVE OVERVIEW
The Company and U.S. fixed income markets as a whole faced another challenging environment during 2016. The year began with significant market volatility primarily as a result of concerns over global growth, China's slowing economy, and plunging oil prices, among other factors. The concerns over economic growth, the impact of the increase of 0.25% in the U.S. Federal Funds rate announced in late December 2015, and the efficacy of central bank stimulus measures caused risk premiums to widen which drove declines in asset prices, including MBS, during the first quarter of 2016. Most of the second quarter of 2016 marked a calmer period of lower interest rates and reduced volatility in the credit markets. At the very end of the second quarter, however, markets reacted to unexpected results of the Brexit vote, which resulted in a sharp rally of U.S. interest rates as the yield curve flattened. Yields on many assets remained at or near their all-time lows. Once again, as initial market shocks from the Brexit vote subsided, the markets calmed, and most of the third quarter saw a period of increasing interest rates and tightening credit spreads. Market conditions during the fourth quarter of 2016 reflected the unexpected results of the U.S. Presidential election, which initially roiled the markets, but eventually resulted in a stock market rally as investors anticipated deregulation, lower taxes, inflation, and infrastructure spending. In addition, the Federal Open Market Committee ("FOMC") announced another increase of 0.25% in the U.S. Federal Funds rate effective in December 2016, citing higher home prices, low unemployment, and improving confidence in the economy as signals of a growing U.S. economy. As a result, 2016 ended with interest rates near a twelve-month high and tighter credit spreads overall relative to December 31, 2015.
30
The chart below shows the highest and lowest rates during the year ended December 31, 2016 as well as the rates as of December 31, 2016 for the indicated U.S. Treasury securities:
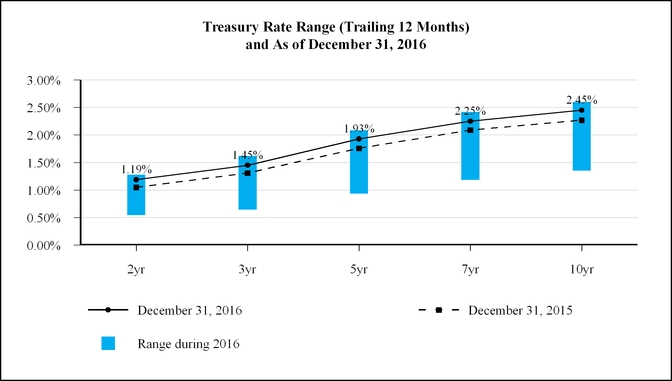
The table below shows examples of credit spreads in basis points for certain investment types in our MBS portfolio as of the end of each quarter since December 31, 2015:
Investment Type: | 12/31/2015 | 3/31/2016 | 6/30/2016 | 9/30/2016 | 12/31/2016 | ||||||||||
Agency ARM 5/1 (Agency RMBS) | 29 | 32 | 38 | 32 | 19 | ||||||||||
Agency DUS (Agency CMBS) | 89 | 86 | 94 | 80 | 76 | ||||||||||
Freddie K AAA IO (Agency CMBS IO) | 225 | 260 | 255 | 230 | 200 | ||||||||||
AAA CMBS IO (Non-Agency CMBS IO) | 240 | 265 | 240 | 215 | 195 | ||||||||||
Freddie K B (Non-Agency CMBS) | 350 | 420 | 325 | 265 | 295 | ||||||||||
In response to the market events discussed above, management made certain decisions regarding leverage, liquidity, and reinvestment throughout 2016. During the first half of 2016, we focused on building capital in lieu of reinvestment and reducing balance sheet leverage. We also sold certain MBS with significant price volatility that we believed would underperform in the current interest rate environment. As the second half of 2016 began to show more stability, we began selectively reinvesting some of our capital, primarily into Agency CMBS and CMBS IO, as the yields on these assets rose and the assets exhibited more attractive risk-adjusted returns relative to earlier in 2016. As a result, we increased our leverage during the fourth quarter of 2016, though it remained lower at 6.3 times shareholders' equity as of December 31, 2016 versus 6.5 as of December 31, 2015. We kept our leverage relatively low, given our perception that the market environment would remain unpredictable and subject to heightened volatility. In addition, we repositioned our hedging portfolio by significantly reducing the average rate and notional amount of derivatives effective during 2017 while increasing hedges effective in 2018 and beyond at overall lower rates than were projected a year ago.
As a result of the changing market conditions throughout 2016 discussed above, we experienced significant variability in the market values of our MBS and hedging instruments, and as a result, our net income and comprehensive income to common
31
shareholders fluctuated considerably from quarter to quarter. Because our reinvestment into MBS was slower as a whole during 2016 relative to recent prior periods, our average balance of MBS declined until the fourth quarter of 2016 which led to declining interest income quarter over quarter throughout the first nine months of the year. Similarly, our average balance of repurchase agreement borrowings also declined until the fourth quarter of 2016, which resulted in declining interest expense quarter over quarter throughout the first nine months of the year and partial offset the declining interest income experienced during the same periods. Though interest expense trended downward during the majority of 2016, our cost of financing as a percentage of the average balance of repurchase agreement borrowings increased. This increase in cost of financing was primarily due to increases in short-term interest rates, particularly one-month LIBOR.
We maintained a positive duration gap throughout 2016 which generated solid cash flows substantially covering our dividends; however, this positive duration gap contributed to a decline in book value of $0.53 per common share, or approximately (6.9)%, as the overall increase in interest rates during 2016 negatively impacted the fair value of our MBS. This negative impact on fair value was partially offset by credit spread tightening on our short-duration hybrid ARMs and Agency CMBS, which mitigated the decline in our book value. Our dividends declared in excess of our book value decline resulted in a total economic return on book value of over 4% while our total shareholder return for 2016 was approximately 21%.
Management's Outlook for 2017
At this point, management views the U.S. economy as relatively solid with the potential for higher inflation and a stronger labor market during 2017. This could put upward pressure on interest rates during 2017. Central bank and government policy, and in particular fiscal policy, will continue to be dominating factors for interest rates and credit spreads, and hence will be an important driver of investment opportunities and economic returns for our shareholders. Subsequent to December 31, 2016, markets have priced in multiple 25 basis point increases in the Federal Funds rate during 2017 which will result in an increase in our cost of funds if these increases occur. We believe that high levels of global debt may continue to put pressure on growth and remain a destabilizing threat to the world economy, particularly if left unmanaged. In addition, we believe that the risk that exogenous events may introduce increased levels of interest rate and spread volatility remains elevated.
Despite these factors, looking ahead into 2017 we see opportunities for reinvestment and/or reallocation of capital. Demographic trends in the U.S. are driving a significant increase in household formation, creating more demand in multifamily and single family housing. As government participation in the housing market shrinks, there will be an increased need for private capital and expertise in the housing finance system. Global demographic aging trends are driving demand for assets that generate income. Fundamentally, this supports the assets in which we invest,and also could be a source of capital for us to use to potentially grow our portfolio. We also intend to capitalize on opportunities for investing capital as government and regulatory policies shift while realizing that such shifts may occur over a period of several years. We will continue seeking ways to diversify funding sources if the regulatory environment becomes more favorable, and we will also actively manage our hedge instruments to attempt to mitigate the impact on our costs of funds if the Federal Funds rate increases as currently projected for 2017.
CRITICAL ACCOUNTING POLICIES
The discussion and analysis of our financial condition and results of operations are based in large part upon our consolidated financial statements, which have been prepared in accordance with GAAP. The preparation of our consolidated financial statements requires management to make estimates, judgments and assumptions that affect the reported amounts of assets, liabilities, revenues and expenses and disclosure of contingent assets and liabilities. We base these estimates and judgments on historical experience and assumptions believed to be reasonable under current facts and circumstances. Actual results, however, may differ from the estimated amounts we have recorded.
Critical accounting policies are defined as those that require management's most difficult, subjective or complex judgments, and which may result in materially different results under different assumptions and conditions. The following discussion provides information on our accounting policies that require the most significant management estimates, judgments, or assumptions, or that management believes includes the most significant uncertainties, and are considered most critical to our results of operations or financial position.
32
Fair Value Measurements. Our Agency MBS, as well a majority of our non-Agency MBS, are substantially similar to securities that either are actively traded or have been recently traded in their respective market. Pricing services and brokers have access to observable market information through trading desks and various information services. We receive a price evaluation for each of our MBS from a primary pricing service selected by the Company. To determine each security's valuation, the primary pricing service uses either a market approach or income approach, both of which rely on observable market data. The market approach uses prices and other relevant information that is generated by market transactions of identical or similar securities, while the income approach uses valuation techniques to convert estimated future cash flows to a discounted present value. Management reviews the assumptions and inputs utilized in the valuation techniques. Examples of these observable inputs and assumptions include market interest rates, credit spreads, and projected prepayment speeds, among other things. The Company compares the price received from its primary pricing service to other prices received from additional third party pricing services and multiple broker quotes for reasonableness.
We typically receive a total of three to six bid-side prices from pricing services and brokers for each of our securities; prices obtained from brokers are not binding on either the broker or us. Management does not adjust the prices received, but, for securities on which we receive five or more prices, the high and low prices are excluded from the calculation of the average price. In addition, management reviews the prices received for each security by comparing those prices to actual purchase and sale transactions, our internally modeled prices that are calculated based on observable market rates and credit spreads, and the prices that our borrowing counterparties use in financing our securities. Management reviews prices which vary significantly from the pricing service and may exclude such prices from its calculation of fair value. The decision to exclude any price from use in the calculation of the fair values used in our consolidated financial statements is reviewed and approved by management independent of the pricing process. The average of the remaining prices received is used for the fair values included in our consolidated financial statements. If the price of a security is obtained from quoted prices for similar instruments or model-derived valuations whose inputs are observable, the security is classified as a level 2 security. The security is classified as a level 3 security if the inputs are unobservable, resulting in an estimate of fair value based primarily on management's judgment. As of December 31, 2016, less than 3% of our non-Agency MBS (and less than 1% of our total MBS) are level 3 securities. Please refer to Note 7 of the Notes to our Consolidated Financial Statements contained within Part II, Item 8 of this Annual Report on Form 10-K for additional information on fair value measurements.
Amortization of Investment Premiums. We amortize premiums and accrete discounts associated with the purchase of our MBS into interest income over the projected lives of our securities, including contractual payments and estimated prepayments, using the effective yield method. If prepayments increase (or are expected to increase), we will accelerate the rate of amortization (accretion) on the premiums (discounts). Conversely, if prepayments decrease (or are expected to decrease), we will decelerate the rate of amortization (accretion) on the premiums (discounts). Estimates and judgments related to future levels of prepayments are critical to the determination of how much premium or discount to amortize or accrete, and the determination of the rate of amortization or accretion and future levels of prepayment are difficult for management to predict. With respect to both RMBS and CMBS, mortgage prepayment expectations can change based on how changes in current and projected interest rates impact a borrower's likelihood of refinancing as well as other factors, including but not limited to real estate prices, borrowers' credit quality, changes in the stringency of loan underwriting practices, and lending industry capacity constraints. With respect to RMBS, modifications to existing government refinance programs, or the implementation of new programs can have a significant impact on the rate of prepayments. Further, GSE buyouts of loans in imminent risk of default, loans that have been modified, or loans that have defaulted will generally be reflected as prepayments on our securities and increase the uncertainty around management's estimates. We utilize various third party services to assist in estimating projected prepayments on our MBS. We review these estimates monthly and compare the results to any available market consensus prepayment speeds. We also consider historical prepayment rates and current market conditions to assess the reasonableness of the prepayment rates estimated by the third party service. Actual and anticipated prepayment experience is reviewed monthly and effective yields are adjusted for differences between the previously estimated future prepayments and the amounts actually received as well as changes in estimated future prepayments.
Other-than-Temporary Impairments. When the fair value of an available-for-sale security is less than its amortized cost as of the reporting date, the security is considered impaired. We assess our securities for impairment on at least a quarterly basis and determine if the impairments are either temporary or other-than-temporary. We assess our ability to hold any Agency MBS or non-Agency MBS with an unrealized loss until the recovery in its value. Our ability to hold any such MBS is based on our current investment strategy and significance of the related investment as well as our current leverage and anticipated liquidity. Although Fannie Mae and Freddie Mac are not explicitly backed by the full faith and credit of the United States, given their
33
guarantee and commitments for support received from the Treasury as well as the credit quality inherent in Agency MBS, we do not typically consider any of the unrealized losses on our Agency MBS to be credit-related. For our non-Agency MBS, we review the credit ratings of these MBS and the seasoning of the mortgage loans collateralizing these securities as well as the estimated future cash flows, which include any projected losses, in order to evaluate whether we believe any portion of the unrealized loss at the reporting date is related to credit losses.
The determination as to whether an other-than-temporary impairment ("OTTI") exists, as well as its amount, is subjective, as such determinations are based not only on factual information available at the time of assessment but also on management’s estimates of future performance and cash flow projections. As a result, the timing and amount of any OTTI may constitute a material estimate that is susceptible to significant change. Our expectations with respect to our securities in an unrealized loss position may change over time, given, among other things, the dynamic nature of markets and other variables. For example, although we believe that the conservatorship of Fannie Mae and Freddie Mac has further strengthened their creditworthiness, there can be no assurance that these actions will be adequate for their needs. Accordingly, if these government actions are inadequate and the GSEs suffer losses or cease to exist, our view of the credit worthiness of our Agency MBS could materially change, which may affect our assessment of OTTI for Agency MBS in future periods. Future sales or changes in our expectations with respect to Agency or non-Agency securities in an unrealized loss position could result in us recognizing other-than-temporary impairment charges or realizing losses on sales of MBS in the future.
FINANCIAL CONDITION
In 2016, we increased our investments in prepayment protected CMBS and CMBS IO versus RMBS which carry a higher risk of prepayment and less predictable cash flows in a relatively low interest rate environment. During the majority of 2016, we used principal payments on our investments and proceeds from sales to reduce balance sheet leverage. We also sold certain MBS that we believed would underperform in an environment in which interest rates remained range-bound for an extended period and where asset prices remained volatile within that range. In the second half of 2016, we began selectively reinvesting some of our capital, primarily in Agency CMBS and CMBS IO, as we were able to purchase assets at higher and more attractive risk-adjusted returns than seen earlier in 2016, while keeping our leverage relatively low given the potentially volatile market environment. The chart below presents the amortized cost of our MBS investments by collateral type as of the end of each period presented:
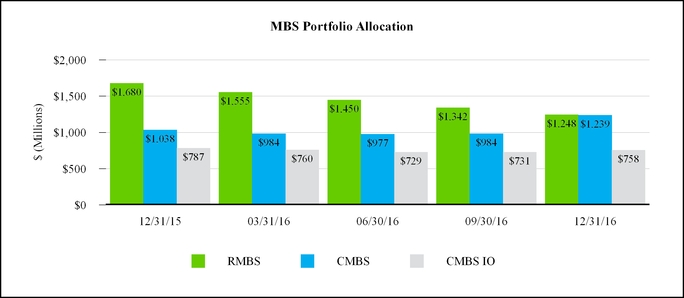
In addition to the sections below, please refer to Note 2 of the Notes to the Consolidated Financial Statements contained within this Annual Report on Form 10-K for additional information relating to our MBS. The following sections provide additional information on our investment portfolio as well as related financing.
34
CMBS
Our Agency CMBS are collateralized primarily by fixed rate mortgage loans secured by multifamily properties. Our non-Agency CMBS are collateralized by fixed rate mortgage loans secured by properties such as office, single-family rental, retail, and multifamily. Both Agency and non-Agency CMBS will generally have some form of prepayment protection provisions (such as prepayment lock-outs) or prepayment compensation provisions (such as yield maintenance or prepayment penalties) to prevent early voluntary prepayment of principal.
Activity related to our CMBS for the year ended December 31, 2016 is as follows:
($ in thousands) | Agency CMBS | Non-Agency CMBS | Total | ||||||||
Balance as of December 31, 2015 | $ | 885,931 | $ | 154,183 | $ | 1,040,114 | |||||
Purchases | 334,999 | — | 334,999 | ||||||||
Principal payments | (53,552 | ) | (41,851 | ) | (95,403 | ) | |||||
Sales | — | (34,868 | ) | (34,868 | ) | ||||||
Premium/discount (amortization)/accretion, net | (6,183 | ) | 1,383 | (4,800 | ) | ||||||
Change in fair value | (16,640 | ) | (631 | ) | (17,271 | ) | |||||
Balance as of December 31, 2016 | $ | 1,144,555 | $ | 78,216 | $ | 1,222,771 | |||||
All of our Agency CMBS purchases were during the second half of 2016, primarily in the fourth quarter, as higher interest rates drove yields higher on these investments relative to prior periods.
Since Agency CMBS are guaranteed by the GSEs with respect to return of principal, our credit exposure is limited to any premium on those securities. Non-Agency CMBS are not guaranteed and therefore our entire investment is exposed to credit losses from the underlying loans collateralizing the CMBS. The following table presents the par value, amortized cost, and weighted average months to estimated maturity of our CMBS investments as of the dates indicated by year of origination:
December 31, 2016 | December 31, 2015 | ||||||||||||||||||
($ in thousands) | Par Value | Amortized Cost | Months to Estimated Maturity (1) | Par Value | Amortized Cost | Months to Estimated Maturity (1) | |||||||||||||
Year of Origination: | |||||||||||||||||||
2008 and prior | $ | 57,771 | $ | 53,161 | 34 | $ | 83,396 | $ | 78,766 | 38 | |||||||||
2009 to 2012 | 193,061 | 198,916 | 33 | 254,870 | 264,087 | 40 | |||||||||||||
2013 to 2014 | 42,760 | 43,176 | 95 | 78,501 | 78,931 | 63 | |||||||||||||
2015 to 2016 | 938,461 | 943,950 | 114 | 616,202 | 616,304 | 120 | |||||||||||||
$ | 1,232,053 | $ | 1,239,203 | 97 | $ | 1,032,969 | $ | 1,038,088 | 89 | ||||||||||
(1) | Months to estimated maturity is an average weighted by the amortized cost of the investment. |
35
The majority of the collateral underlying our non-Agency CMBS is comprised of single-family rental and multifamily properties. The following charts present the collateral underlying our non-Agency CMBS by property type as of the dates indicated:
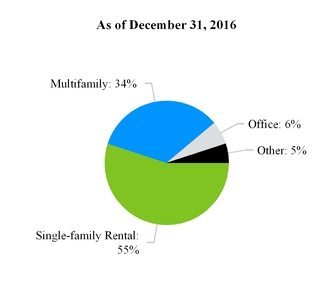
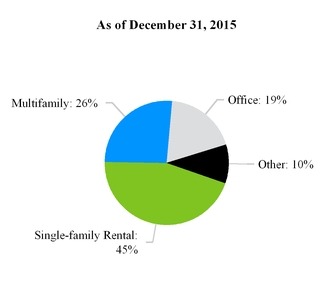
The collateral underlying our non-Agency CMBS investments is geographically dispersed in order to mitigate exposure to any particular region of the country. The U.S. state with the largest percentage of collateral underlying our non-Agency CMBS was Texas at 16% as of December 31, 2016 compared to Florida at 32% as of December 31, 2015. The following charts present the geographic diversification of the collateral underlying our non-Agency CMBS by the top 5 states as of the dates indicated:
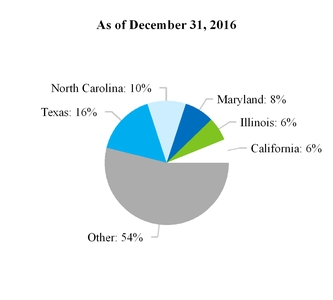
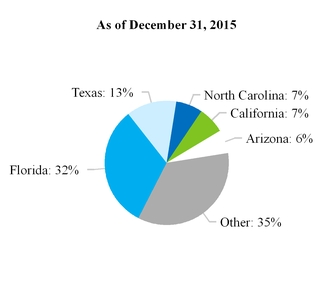
CMBS IO
The majority of our CMBS IO investments are collateralized primarily by fixed rate mortgage loans. Agency CMBS IO are exclusively collateralized by multifamily properties and are issued by securitization trusts sponsored by one of the GSEs. Non-Agency CMBS IO are secured by multifamily properties as well as office, retail, and hotel. Both types of CMBS IO have some form of prepayment protection (such as prepayment lock-outs or defeasance requirements) or prepayment compensation provisions (such as yield maintenance or prepayment penalties). Our CMBS IO investments are investment grade-rated with the majority rated 'AAA' by at least one of the nationally recognized statistical ratings organizations.
Activity related to our CMBS IO for the year ended December 31, 2016 is as follows:
36
($ in thousands) (1) | Agency CMBS IO | Non-Agency CMBS IO | Total | ||||||||
Balance as of December 31, 2015 | $ | 426,128 | $ | 363,727 | $ | 789,855 | |||||
Purchases | 64,195 | 35,852 | 100,047 | ||||||||
Sales | — | — | — | ||||||||
Premium amortization, net | (74,315 | ) | (55,251 | ) | (129,566 | ) | |||||
Change in fair value | (4,110 | ) | (1,680 | ) | (5,790 | ) | |||||
Balance as of December 31, 2016 | $ | 411,898 | $ | 342,648 | $ | 754,546 | |||||
(1) | Amounts shown for CMBS IO represent premium only and exclude underlying notional balances. |
Because income earned from CMBS IO is based on interest payments received on the underlying commercial mortgage loan pools, our return on these investments may be negatively impacted by any change in scheduled cash flows such as modifications of the mortgage loans or involuntary prepayments including defaults, foreclosures, and liquidations on or of the underlying mortgage loans prior to its contractual maturity date. In order to manage our exposure to credit performance, we generally invest in senior tranches of these securities and where we have evaluated the credit profile of the underlying loan pool and can monitor credit performance. In addition, to address changes in market fundamentals and the composition of mortgage loans collateralizing an investment, we consider the year of origination of the loans underlying CMBS IO in our selection of investments. The following table presents our CMBS IO investments as of December 31, 2016 by year of origination:
December 31, 2016 | December 31, 2015 | ||||||||||||||||||||
($ in thousands) | Amortized Cost | Fair Value | Remaining WAL (1) | Amortized Cost | Fair Value | Remaining WAL (1) | |||||||||||||||
Year of Origination: | |||||||||||||||||||||
2010 | $ | 9,456 | $ | 9,858 | 19 | $ | 12,843 | $ | 13,472 | 24 | |||||||||||
2011 | 35,130 | 36,897 | 23 | 45,731 | 48,482 | 28 | |||||||||||||||
2012 | 102,378 | 103,675 | 27 | 131,085 | 133,086 | 31 | |||||||||||||||
2013 | 128,891 | 129,011 | 33 | 154,445 | 155,299 | 38 | |||||||||||||||
2014 | 201,802 | 200,260 | 39 | 223,542 | 221,933 | 44 | |||||||||||||||
2015 | 198,016 | 194,886 | 45 | 219,765 | 217,583 | 50 | |||||||||||||||
2016 | 82,219 | 79,959 | 87 | — | — | — | |||||||||||||||
$ | 757,892 | $ | 754,546 | 42 | $ | 787,411 | $ | 789,855 | 41 | ||||||||||||
(1) Remaining weighted average life ("WAL") represents an estimate of the number of months of interest earnings remaining for the investments by year of origination.
37
Approximately half of the collateral underlying our non-Agency CMBS IO is comprised of retail and multifamily properties. The following charts present the property type of the collateral underlying our non-Agency CMBS IO as of the dates indicated:
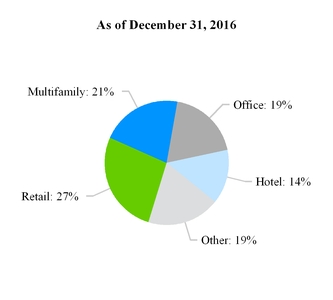
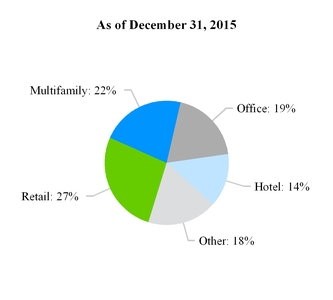
The collateral underlying our non-Agency CMBS IO investments is geographically dispersed in order to mitigate exposure to any particular region of the country. The U.S. state with the largest percentage of collateral underlying our non-Agency CMBS IO was California at 14% as of December 31, 2016 and 12% as of December 31, 2015. The following charts present the geographic diversification of the collateral underlying our non-Agency CMBS IO by the top 5 states as of the dates indicated:
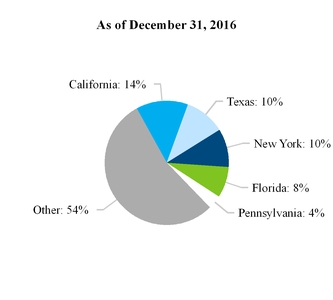
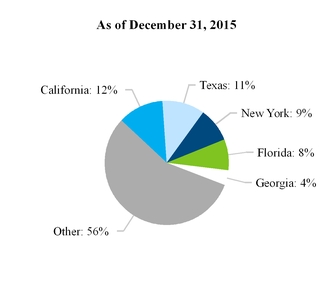
RMBS
Activity related to our RMBS for the year ended December 31, 2016 is as follows:
38
($ in thousands) | Agency RMBS | Non-Agency RMBS | Total | ||||||||
Balance as of December 31, 2015 | $ | 1,598,522 | $ | 65,210 | $ | 1,663,732 | |||||
Purchases | — | — | — | ||||||||
Principal payments | (326,519 | ) | (32,431 | ) | (358,950 | ) | |||||
Sales | (57,187 | ) | — | (57,187 | ) | ||||||
Net (amortization) accretion | (16,320 | ) | 21 | (16,299 | ) | ||||||
Change in fair value | 2,709 | 762 | 3,471 | ||||||||
Balance as of December 31, 2016 | $ | 1,201,205 | $ | 33,562 | $ | 1,234,767 | |||||
Agency RMBS. As of December 31, 2016, the majority of our variable-rate Agency RMBS portfolio resets based on one-year LIBOR, which was approximately 1.69% as of December 31, 2016 compared to 1.18% as of December 31, 2015. Of these investments, approximately 29% will reset their coupon within the next twelve months at a weighted average margin of 1.80% above one-year LIBOR. During the year ended December 31, 2016, we sold certain lower yielding Agency ARMs that were at or near their interest rate reset periods and which were expected to reset at interest rates lower than their current coupon.
The underlying mortgage loans for variable-rate RMBS are subject to periodic interest rate caps which limit the amount by which the security’s coupon rate may change during any given period and lifetime interest rate caps which limit the maximum interest rate on the loans collateralizing these securities. As shown in the table below, our variable-rate Agency RMBS are generally well within their periodic and lifetime interest rate caps. The following table presents certain interest rate information for these investments by weighted average months to reset ("MTR") as of the dates indicated:
December 31, 2016 | |||||||||||||||
($ in thousands) | Par Value | Reset Margin to LIBOR | WAC | WAVG Periodic Interest Cap | WAVG Life Interest Cap | ||||||||||
0-12 MTR | 335,476 | 1.80 | % | 3.17 | % | 2.98 | % | 9.59 | % | ||||||
13-36 MTR | 225,272 | 1.79 | % | 3.18 | % | 5.00 | % | 8.19 | % | ||||||
37-60 MTR | 151,578 | 1.80 | % | 3.51 | % | 5.00 | % | 8.51 | % | ||||||
61-84 MTR | 423,749 | 1.70 | % | 2.71 | % | 5.00 | % | 7.71 | % | ||||||
85-120 MTR | 21,183 | 1.59 | % | 3.13 | % | 5.00 | % | 8.13 | % | ||||||
Total | $ | 1,157,258 | 1.76 | % | 3.05 | % | 4.41 | % | 8.46 | % | |||||
December 31, 2015 | |||||||||||||||
Par Value | Reset Margin to LIBOR | WAC | WAVG Periodic Interest Cap | WAVG Life Interest Cap | |||||||||||
0-12 MTR | $ | 309,826 | 1.79 | % | 2.75 | % | 2.40 | % | 10.00 | % | |||||
13-36 MTR | 380,455 | 1.79 | % | 3.47 | % | 5.00 | % | 9.01 | % | ||||||
37-60 MTR | 91,769 | 1.80 | % | 2.97 | % | 5.00 | % | 8.35 | % | ||||||
61-84 MTR | 541,720 | 1.76 | % | 3.09 | % | 5.00 | % | 8.48 | % | ||||||
85-120 MTR | 197,473 | 1.62 | % | 2.56 | % | 5.00 | % | 7.78 | % | ||||||
ARMs and Hybrid ARMs | 1,521,243 | 1.76 | % | 3.04 | % | 4.47 | % | 8.82 | % | ||||||
Fixed | 15,490 | n/a | 2.50 | % | n/a | n/a | |||||||||
Total | $ | 1,536,733 | 3.03 | % | |||||||||||
Non-Agency RMBS. Our non-Agency RMBS portfolio consists primarily of senior tranches of securitizations collateralized by non-performing loans and re-performing loans which receive monthly principal and interest payments and have estimated average lives remaining in a range of one and two years. These securities have coupon step-up features of 3.0% if the securities are not fully repaid or redeemed by their expected maturity date which is generally three years from issuance. Although these investments do not have a credit rating issued by any of the nationally recognized statistical ratings organization, they have
39
substantial credit enhancement within the securitization structure, and we have not experienced any losses of principal on these investments to date.
Derivative Assets and Liabilities
Our derivative assets and liabilities are used to hedge our earnings and book value exposure to fluctuations in interest rates. As of December 31, 2016, our derivatives consisted of only pay-fixed and receive-fixed interest rate swaps while our hedging portfolio as of December 31, 2015 consisted of interest rate swaps as well as Eurodollar futures. We regularly monitor and adjust our hedging portfolio in response to many factors including, but not limited to, changes in our investment portfolio, shifts in the yield curve, and our expectations with respect to the future path of interest rates and interest rate volatility.
The following graphs present the notional balance and net weighted average pay-fixed rate for our derivatives as of their effective dates:
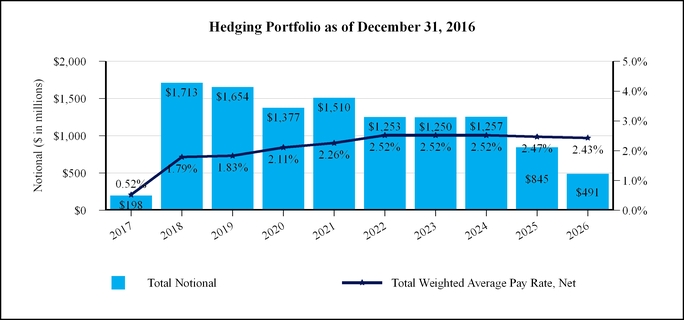
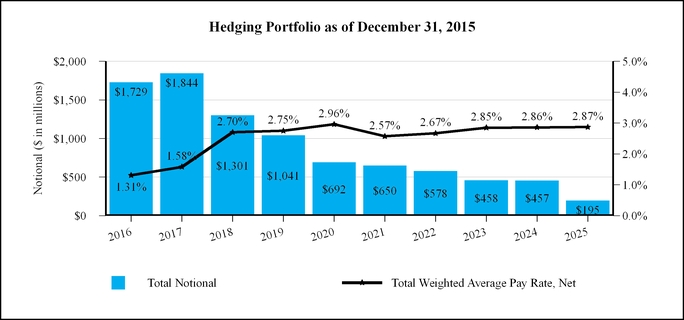
During 2016, we terminated a combined notional of $6.3 billion in Eurodollar futures with a weighted average pay rate of 3.87% which were initiated primarily in 2013 when management was anticipating a more immediate increase in interest rates. We also terminated a notional of $3.0 billion in pay-fixed interest rate swaps with a weighted average pay-fixed rate of 1.23%
40
and replaced these with interest rate swaps with a combined notional of $3.5 billion at a weighted average pay-fixed rate of 1.77%. Of the combined notional of $3.9 billion of interest rate swaps outstanding as of December 31, 2016, $2.7 billion were pay-fixed forward starting interest rate swaps with effective dates ranging from mid-December 2017 through 2021.
The following table summarizes the net activity related to our derivative assets and liabilities during the year ended December 31, 2016:
($ in thousands) | Interest Rate Swaps | Eurodollar Futures | Total Derivative Asset, Net of Derivative Liability | ||||||||
Balance as of December 31, 2015 | $ | (4,273 | ) | $ | (29,097 | ) | $ | (33,370 | ) | ||
Net payment upon termination | 24,825 | 33,912 | 58,737 | ||||||||
Periodic net cash payments | 1,851 | — | 1,851 | ||||||||
Change in fair value | 1,670 | (4,815 | ) | (3,145 | ) | ||||||
Accrued interest payable | (2,461 | ) | — | (2,461 | ) | ||||||
Balance as of December 31, 2016 | $ | 21,612 | $ | — | $ | 21,612 | |||||
Secured Borrowings
As of December 31, 2016, our secured borrowings consist entirely of repurchase agreements. Due to the final rule issued by the FHFA in January 2016, we cannot obtain new FHLB advances or renewals of existing advances, so during 2016 we replaced all of our FHLB advances used to finance our MBS with repurchase agreement financing.
The majority of our repurchase agreement borrowings are collateralized with Agency MBS which have historically had lower liquidity risk than non-Agency MBS. The following table presents the amount pledged and leverage against the fair value of our non-Agency MBS investments by credit rating as of December 31, 2016 and December 31, 2015:
December 31, 2016 | December 31, 2015 | ||||||||||||||||||||||
($ in thousands) | Fair Value | Amount Pledged | Related Borrowings | Fair Value | Amount Pledged | Related Borrowings | |||||||||||||||||
Non-Agency CMBS: | |||||||||||||||||||||||
AAA | $ | 35,405 | $ | 35,313 | $ | 32,266 | $ | 60,192 | $ | 53,589 | $ | 48,400 | |||||||||||
AA | 14,127 | 14,105 | 11,665 | 51,599 | 51,599 | 45,870 | |||||||||||||||||
A | 18,614 | 18,549 | 15,831 | 34,771 | 34,771 | 29,211 | |||||||||||||||||
Below A/Not Rated | 10,070 | 9,873 | 7,119 | 7,621 | 3,826 | 2,897 | |||||||||||||||||
$ | 78,216 | $ | 77,840 | $ | 66,881 | $ | 154,183 | $ | 143,785 | $ | 126,378 | ||||||||||||
Non-Agency CMBS IO: | |||||||||||||||||||||||
AAA | $ | 290,092 | $ | 289,608 | $ | 246,412 | $ | 294,712 | $ | 303,659 | $ | 255,652 | |||||||||||
AA | 46,986 | 45,995 | 40,026 | 53,974 | 53,111 | 44,940 | |||||||||||||||||
Below A/Not Rated | 5,570 | 5,536 | 4,761 | 15,041 | 2,581 | 2,179 | |||||||||||||||||
$ | 342,648 | $ | 341,139 | $ | 291,199 | $ | 363,727 | $ | 359,351 | $ | 302,771 | ||||||||||||
Non-Agency RMBS: | |||||||||||||||||||||||
Below A/Not Rated | $ | 33,562 | $ | 31,952 | $ | 26,149 | $ | 65,210 | $ | 64,286 | $ | 52,128 | |||||||||||
$ | 33,562 | $ | 31,952 | $ | 26,149 | $ | 65,210 | $ | 64,286 | $ | 52,128 | ||||||||||||
Please refer to Note 4 of the Notes to the Consolidated Financial Statements contained within this Annual Report on Form 10-K as well as "Interest Expense and Cost of Funds" within "Results of Operations" and “Liquidity and Capital Resources” contained within this Item 7 for additional information relating to our borrowings.
41
Shareholder's Equity
In November 2016, the Company entered into an equity distribution agreement (also known as an "at the market" agreement, or "ATM") whereby the Company may offer and sell through its sales agents, Ladenburg Thalmann & Co. Inc. and JonesTrading Institutional Services LLC (collectively, the “Agents”) up to $50.0 million of aggregate value of shares of the Company’s Series A Preferred Stock and Series B Preferred Stock. The Company issued 21,937 shares of its Series B Preferred Stock at an aggregate value of $0.5 million, net of $11 thousand in broker commissions, under its Preferred Stock ATM agreement during the three months ended December 31, 2016.
In December 2016, our Board of Directors authorized the repurchase of up to $40.0 million of outstanding shares of common stock through December 31, 2018. This stock repurchase plan replaced the Company's prior repurchase plan which authorized the purchase of up to $50.0 million of the Company's common stock through December 31, 2016.
The following table provides the accumulated unrealized holding gains (losses) by type of MBS and the remaining balance of de-designated cash flow hedges comprising "accumulated other comprehensive loss" as of the periods indicated:
($ in thousands) | December 31, 2016 | December 31, 2015 | |||||
Agency RMBS | $ | (13,119 | ) | $ | (15,828 | ) | |
Non-Agency RMBS | 14 | (748 | ) | ||||
Agency CMBS | (22,295 | ) | (5,655 | ) | |||
Non-Agency CMBS | 5,467 | 6,098 | |||||
Agency CMBS IO | 161 | 4,271 | |||||
Non-Agency CMBS IO | (3,507 | ) | (1,827 | ) | |||
De-designated cash flow hedges | 670 | 921 | |||||
Accumulated other comprehensive loss | $ | (32,609 | ) | $ | (12,768 | ) | |
RESULTS OF OPERATIONS
The discussions below include both GAAP and non-GAAP financial measures which management utilizes in its internal analysis of financial and operating performance. Please read the section "Non-GAAP Financial Measures" in Item 6 of this Annual Report on Form 10-K for additional important information and for reconciliations of these measures to GAAP measures.
For the year ended December 31, 2016, we recorded comprehensive income of $14.1 million, which consisted of net income to common shareholders of $33.9 million and other comprehensive loss of $(19.8) million. Net income to common shareholders consisted substantially of net interest income of $66.7 million, loss on sale of investments, net of $(4.2) million, loss on derivative instruments, net of $(5.6) million, general and administrative expenses of $(14.7) million, and preferred dividends of $(9.2) million.
Core net operating income to common shareholders, a non-GAAP measure management uses as an estimate of the net interest earnings of the Company's portfolio after operating expenses, was $40.9 million for the year ended December 31, 2016, which consisted substantially of adjusted net interest income, a non-GAAP measure, of $64.0 million, general and administrative expenses of $(14.7) million, and preferred dividends of $(9.2) million.
The following sections provide more information on these items and others on our consolidated statements of comprehensive income (loss).
Net Interest Income and Net Interest Spread
The tables below present GAAP net interest income and related net interest spread for our interest-earning assets and interest-bearing liabilities and also present adjusted net interest income and adjusted net interest spread, which are non-GAAP measures. Adjusted net interest income and adjusted net interest spread include net periodic interest costs of derivative instruments as part of interest expense ("adjusted interest expense" which is discussed later in this section) whereas GAAP net interest income and GAAP net interest spread do not.
42
Year Ended | ||||||||||||||||||||
December 31, | ||||||||||||||||||||
2016 | 2015 | 2014 | ||||||||||||||||||
($ in thousands) | Amount | Yield | Amount | Yield | Amount | Yield | ||||||||||||||
GAAP interest income | $ | 91,898 | 2.82 | % | $ | 100,244 | 2.71 | % | $ | 105,644 | 2.76 | % | ||||||||
GAAP interest expense | 25,231 | 0.85 | % | 22,605 | 0.68 | % | 25,915 | 0.76 | % | |||||||||||
GAAP net interest income/spread | 66,667 | 1.97 | % | 77,639 | 2.03 | % | 79,729 | 2.00 | % | |||||||||||
Less: (accretion) amortization of de-designated cash flow hedges (1) | (251 | ) | (0.01 | )% | 3,499 | 0.11 | % | 6,788 | 0.20 | % | ||||||||||
Add: net periodic interest costs of derivative instruments | (2,461 | ) | (0.08 | )% | (5,730 | ) | (0.18 | )% | (8,218 | ) | (0.25 | )% | ||||||||
Adjusted net interest income/spread | $ | 63,955 | 1.88 | % | $ | 75,408 | 1.96 | % | $ | 78,299 | 1.95 | % | ||||||||
Average interest earning assets (2) | $ | 3,236,903 | $ | 3,685,936 | $ | 3,822,870 | ||||||||||||||
Average balance of borrowings (3) | $ | 2,912,426 | $ | 3,269,711 | $ | 3,347,701 | ||||||||||||||
(1) | Included in GAAP interest expense and relates to the amortization of the balance remaining in accumulated other comprehensive loss as of June 30, 2013 as a result of discontinuing cash flow hedge accounting. |
(2) | Average balances are calculated as a simple average of the daily amortized cost and exclude unrealized gains and losses as well as securities pending settlement if applicable. |
(3) | Average balances are calculated as a simple average of the daily borrowings outstanding for both repurchase agreement and non-recourse collateralized financing. |
Net interest income and adjusted net interest income decreased for the year ended December 31, 2016 compared to the year ended December 31, 2015 primarily due to a smaller investment portfolio and higher borrowing costs during the year ended December 31, 2016. Net interest income and adjusted net interest income decreased for the year ended December 31, 2015 compared to the year ended December 31, 2014 primarily as a result of a lower weighted average effective yield earned on our MBS portfolio. Details on these and other factors impacting the net interest earnings of our investment portfolio are provided below.
Interest Income and Effective Yields on MBS
Interest income includes gross interest earned from the coupon rate on the securities, premium amortization and discount accretion, and other interest income resulting from prepayment penalty income or other yield maintenance items on CMBS and CMBS IO securities. Effective yields are calculated by dividing interest income by the average balance of investments outstanding during the reporting period. The following table presents details on interest income and effective yields of MBS for the periods indicated:
43
Year Ended | ||||||||||||||||||||
December 31, | ||||||||||||||||||||
2016 | 2015 | 2014 | ||||||||||||||||||
Amount | Yield | Amount | Yield | Amount | Yield | |||||||||||||||
CMBS: | ||||||||||||||||||||
Coupon and scheduled amortization | $ | 32,918 | 3.18 | % | $ | 31,405 | 3.29 | % | $ | 28,781 | 4.46 | % | ||||||||
Prepayment adjustments (1) | 1,256 | 0.12 | % | 3,179 | 0.33 | % | 387 | 0.06 | % | |||||||||||
34,174 | 3.30 | % | 34,584 | 3.62 | % | 29,168 | 4.52 | % | ||||||||||||
Average balance | $ | 1,021,960 | $ | 946,214 | $ | 642,101 | ||||||||||||||
CMBS IO: | ||||||||||||||||||||
Coupon and scheduled amortization | $ | 28,172 | 3.77 | % | $ | 29,115 | 3.83 | % | $ | 27,146 | 4.07 | % | ||||||||
Prepayment adjustments (1) | 2,895 | 0.39 | % | 671 | 0.09 | % | 1,194 | 0.18 | % | |||||||||||
31,067 | 4.16 | % | 29,786 | 3.92 | % | 28,340 | 4.25 | % | ||||||||||||
Average balance | $ | 746,458 | $ | 758,921 | $ | 666,288 | ||||||||||||||
RMBS: | ||||||||||||||||||||
Coupon and scheduled amortization | $ | 27,670 | 1.91 | % | $ | 36,441 | 1.87 | % | $ | 45,648 | 1.85 | % | ||||||||
Prepayment adjustments (1) | (1,962 | ) | (0.13 | )% | (1,875 | ) | (0.10 | )% | (275 | ) | (0.01 | )% | ||||||||
25,708 | 1.78 | % | 34,566 | 1.77 | % | 45,373 | 1.84 | % | ||||||||||||
Average balance | $ | 1,446,479 | $ | 1,951,178 | $ | 2,463,686 | ||||||||||||||
Total MBS interest income and effective yield: | $ | 90,949 | 2.82 | % | $ | 98,936 | 2.70 | % | $ | 102,881 | 2.72 | % | ||||||||
Total average balance: | $ | 3,214,897 | $ | 3,656,313 | $ | 3,772,075 | ||||||||||||||
(1) | Prepayment adjustments represent effective interest amortization adjustments related to changes in actual and projected prepayment speeds for RMBS and prepayment compensation, net of amortization for CMBS and CMBS IO. |
2016 vs. 2015. Interest income from MBS for the year ended December 31, 2016 decreased compared to the same periods in 2015 primarily due to our lower average balance of investments. As mentioned under "Financial Condition", we focused on capital preservation and reducing leverage throughout most of 2016, purchasing the majority of our MBS during the fourth quarter of 2016. The increase of 12 basis points in effective yield on our MBS portfolio to 2.82% for the year ended December 31, 2016 compared to 2.70% for the year ended December 31, 2015 is due to the shift in our portfolio composition toward CMBS and CMBS IO which are typically higher yielding assets relative to RMBS. The following table presents the estimated impact of changes in average balances, yields, and prepayment adjustments on interest income for the year ended December 31, 2016 compared to the year ended December 31, 2015:
Year Ended | |||||||||||||||
December 31, 2016 vs. December 31, 2015 | |||||||||||||||
Increase (Decrease) in Interest Income | Due to Change In | ||||||||||||||
($ in thousands) | Average Balance | Coupon and Scheduled Amortization | Prepayment Adjustments (1) | ||||||||||||
CMBS | $ | (410 | ) | $ | 2,492 | $ | (979 | ) | $ | (1,923 | ) | ||||
CMBS IO | 1,281 | (477 | ) | (466 | ) | 2,224 | |||||||||
RMBS | (8,858 | ) | (9,426 | ) | 655 | (87 | ) | ||||||||
Total | $ | (7,987 | ) | $ | (7,411 | ) | $ | (790 | ) | $ | 214 | ||||
(1) | Prepayment adjustments represent effective interest amortization adjustments resulting from changes in actual and projected prepayment speeds including prepayment compensation received. |
44
Although the average balance of our CMBS portfolio during 2016 was larger than the average balance outstanding during 2015, interest income from CMBS for the year ended December 31, 2016 declined slightly compared to the year ended December 31, 2015 because we purchased CMBS since December 31, 2015 at lower effective yields given the lower interest rate environment. The weighted average gross coupon rate earned on our CMBS for the year ended December 31, 2016 was 3.47% compared to 3.74% for the year ended December 31, 2015. In addition, we earned $1.9 million less in net prepayment penalty income from CMBS during 2016 compared to 2015. Lower coupons and lower prepayment penalty income on CMBS resulted in a decline of 32 basis points in our effective yield on CMBS for the year ended December 31, 2016 compared to the prior year.
Interest income and effective yield for CMBS IO for the year ended December 31, 2016 increased compared to the prior year despite having a lower average balance of CMBS IO during 2016. These increases were due to an increase in prepayment penalty income of $2.2 million for the year ended December 31, 2016 versus the same period in 2015.
Interest income declined on RMBS due to the lower investment balance during 2016. Effective yield on RMBS for the year ended December 31, 2016 was relatively unchanged compared to the year ended December 31, 2015. The yield on RMBS excluding prepayment adjustments increased 4 basis points to 1.91% for the year ended December 31, 2016 compared to 1.87% for the prior year primarily because we sold lower yielding ARMs that were at or near their interest rate reset periods and which were expected to reset at interest rates lower than their current coupon.
The rate at which we amortize the premiums we pay for our investments is impacted by actual and forecasted prepayments, which is measured by the constant prepayment rate ("CPR") for Agency RMBS. We are projecting a 3 month average CPR of 16.7% on our Agency RMBS for the first quarter of 2017. The following graph shows our actual 3 month average CPRs for Agency RMBS for the periods indicated:
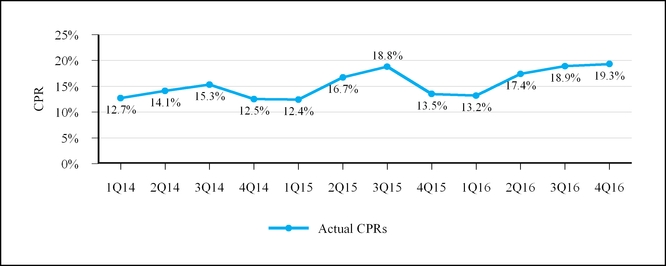
2015 vs. 2014. Our interest income from MBS for the year ended December 31, 2015 decreased compared to the year ended December 31, 2014 due to a decrease in the weighted average effective yield earned on our MBS portfolio to 2.70% for the year ended December 31, 2015 compared to 2.72% for the year ended December 31, 2014. The lower weighted average effective yield was primarily due to the lower average gross coupon we earned on our MBS. This decrease was partially offset by the replacement of a portion of our RMBS with higher yielding CMBS and CMBS IO. Although our overall average balance of MBS was lower for the year ended December 31, 2015 compared to the year ended December 31, 2014, CMBS and CMBS IO increased 12% as a percentage of the total average balance for the year ended December 31, 2015 and earned a combined weighted average effective yield of 3.76% compared to the RMBS sold during 2015 which earned 1.32%.The following table presents the estimated impact of changes in average balances, yields, and prepayment adjustments on interest income for the year ended December 31, 2015 compared to the year ended December 31, 2014:
45
Year Ended | |||||||||||||||
December 31, 2015 vs. December 31, 2014 | |||||||||||||||
Increase (Decrease) in Interest Income | Due to Change In | ||||||||||||||
Average Balance | Coupon and Scheduled Amortization | Prepayment Adjustments (1) | |||||||||||||
CMBS | $ | 5,416 | $ | 8,393 | $ | (5,769 | ) | $ | 2,792 | ||||||
CMBS IO | 1,446 | 3,774 | (1,805 | ) | (523 | ) | |||||||||
RMBS | (10,807 | ) | (9,496 | ) | 289 | (1,600 | ) | ||||||||
Total | $ | (3,945 | ) | $ | 2,671 | $ | (7,285 | ) | $ | 669 | |||||
(1) | Prepayment adjustments represent effective interest amortization adjustments resulting from changes in actual and projected prepayment speeds including prepayment compensation received. |
Interest Expense and Cost of Funds
The following table summarizes the components of interest expense as well as average balances and cost of funds for the periods indicated:
Year Ended | |||||||||||
December 31, | |||||||||||
($ in thousands) | 2016 | 2015 | 2014 | ||||||||
Interest expense on repurchase agreement borrowings | $ | 24,191 | $ | 18,467 | $ | 19,033 | |||||
Interest expense on FHLB advances | 1,193 | 541 | — | ||||||||
(Accretion) amortization of de-designated cash flow hedges (1) | (251 | ) | 3,499 | 6,788 | |||||||
Non-recourse collateralized financing and other interest expense | 98 | 98 | 94 | ||||||||
Total interest expense | $ | 25,231 | $ | 22,605 | $ | 25,915 | |||||
Average balance of repurchase agreements | $ | 2,659,809 | $ | 3,096,888 | $ | 3,335,786 | |||||
Average balance of FHLB advances | 244,967 | 163,489 | — | ||||||||
Average balance of non-recourse collateralized financing | 7,650 | 9,334 | 11,915 | ||||||||
Average balance of borrowings | $ | 2,912,426 | $ | 3,269,711 | $ | 3,347,701 | |||||
Cost of funds | 0.85 | % | 0.68 | % | 0.76 | % | |||||
(1) Amount recorded in accordance with GAAP related to accretion or amortization of the balance remaining in accumulated other comprehensive loss as of June 30, 2013 as a result of our discontinuation of cash flow hedge accounting.
(2) | Cost of funds is calculated by dividing total interest expense by the total average balance of borrowings outstanding during the period with an assumption of 360 days in a year. |
The following table presents the estimated impact of the change in average balances and borrowing rates of repurchase agreement and FHLB borrowings as well as other differences in interest expense for the comparative periods presented:
($ in thousands) | Year Ended December 31, 2016 vs. December 31, 2015 | Year Ended December 31, 2015 vs. December 31, 2014 | |||||
Change in borrowing rates on repurchase agreements and FHLB advances | $ | 8,449 | $ | (425 | ) | ||
Change in average balance of repurchase agreements and FHLB advances | (2,073 | ) | 400 | ||||
Decrease in amortization of de-designated cash flow hedges | (3,750 | ) | (3,289 | ) | |||
Decrease in non-recourse collateralized financing and other interest expense | — | 4 | |||||
Total change in interest expense | $ | 2,626 | $ | (3,310 | ) | ||
46
2016 vs. 2015. The increase in our interest expense for the year ended December 31, 2016 compared to the year ended December 31, 2015 was due to higher borrowing rates on our repurchase agreement financings. Our average borrowing rate on our repurchases agreements increased 30 basis points to 0.89% for the year ended December 31, 2016 compared to 0.59% for the year ended December 31, 2015. Our borrowing rates were impacted by increases in short-term interest rates, particularly one-month LIBOR which had an average of 0.50% for the year ended December 31, 2016 compared to 0.20% for the year ended December 31, 2015. The increase in borrowing rates was partially offset by a lower average balance of borrowings in 2016 compared to the prior year, as the Company focused on capital preservation and reducing leverage during the first nine months.
2015 vs. 2014. The majority of the decrease in our interest expense for the year ended December 31, 2015 compared to the prior year was due to lower amortization expense from our de-designated cash flow hedges. Interest expense also decreased because we carried a lower average balance of borrowings during 2015 compared to the prior year. Although our interest expense decreased, our average borrowing rate on our repurchase agreements increased 3 basis points to 0.59% for the year ended December 31, 2015 from 0.56% for the year ended December 31, 2014. This increase in borrowing rate increased interest expense by approximately $0.4 million for the year ended December 31, 2015 as shown in the table above. In 2015, the volatile interest rate environment negatively impacted the availability and cost of repurchase agreement borrowings and the original term to maturity dates of our repurchase agreements shortened. In addition, during the second half of 2015, repurchase agreement borrowings that matured were rolled over into new agreements in a higher interest rate environment than when initially borrowed as lenders began in the third quarter of 2015 to price in expectations for increases to the Federal Funds Rate.
Adjusted Interest Expense and Adjusted Cost of Funds
Because we use derivative instruments as economic hedges of our interest rate risk exposure, management considers net periodic interest costs from derivative instruments to be an additional cost of financing investments. As such, management uses the non-GAAP financial measures "adjusted interest expense" and related "adjusted costs of funds" which include the net periodic interest costs of our effective derivative instruments excluded from GAAP interest expense. Please read the section "Non-GAAP Financial Measures" in Item 6 of this Annual Report on Form 10-K for additional important information and for reconciliations of these measures to GAAP measures.
2016 vs. 2015. Adjusted interest expense was $3.1 million higher for the year ended December 31, 2016 versus the year ended December 31, 2015 due primarily to the increase in repurchase agreement borrowing costs mentioned previously which was partially offset by a decrease of $3.3 million in net periodic interest costs of derivative instruments. Please refer to "Loss on Derivative Instruments, Net" for more information on net periodic interest costs.
2015 vs. 2014. Adjusted interest expense was $2.5 million lower for the year ended December 31, 2015 versus the year ended December 31, 2014 due to lower net periodic interest costs from our interest rate swaps. During the year ended December 31, 2015, we terminated pay-fixed interest rate swaps with a notional of $830.0 million with a weighted average pay-fixed rate of 2.19% and added current receive-fixed and current pay-fixed interest rate swaps with a combined notional of $1.0 billion at a lower net weighted average pay-fixed rate of 1.22%.
Loss on Derivative Instruments, Net
The following table provides information on the components of our "loss on derivative instruments, net" for the periods indicated:
47
Year Ended | |||||||||||||||||||||||
December 31, | |||||||||||||||||||||||
2016 | 2015 | ||||||||||||||||||||||
Type of Derivative Instrument | Net Periodic Interest Costs | Change in Fair Value (1) | Total | Net Periodic Interest Costs | Change in Fair Value (1) | Total | |||||||||||||||||
Receive-fixed interest rate swaps | $ | 5,072 | $ | (2,557 | ) | $ | 2,515 | $ | 5,036 | $ | 1,486 | $ | 6,522 | ||||||||||
Pay-fixed interest rate swaps | (7,533 | ) | 4,227 | (3,306 | ) | (10,766 | ) | (17,921 | ) | (28,687 | ) | ||||||||||||
Eurodollar futures | — | (4,815 | ) | (4,815 | ) | — | (20,963 | ) | (20,963 | ) | |||||||||||||
Loss on derivative instruments, net | $ | (2,461 | ) | $ | (3,145 | ) | $ | (5,606 | ) | $ | (5,730 | ) | $ | (37,398 | ) | $ | (43,128 | ) | |||||
Year Ended | |||||||||||||||||||||||
December 31, 2014 | |||||||||||||||||||||||
Net Periodic Interest Costs | Change in Fair Value (1) | Total | |||||||||||||||||||||
Receive-fixed interest rate swaps | $ | 1,436 | $ | 3,476 | $ | 4,912 | |||||||||||||||||
Pay-fixed interest rate swaps | (9,654 | ) | (21,100 | ) | (30,754 | ) | |||||||||||||||||
Eurodollar futures | — | (27,551 | ) | (27,551 | ) | ||||||||||||||||||
Loss on derivative instruments, net | $ | (8,218 | ) | $ | (45,175 | ) | $ | (53,393 | ) | ||||||||||||||
(1) | Amount shown includes unrealized gains (losses) from current and forward starting derivative instruments and realized gains (losses) from terminated derivative instruments. |
Loss on derivative instruments, net includes the change in fair value of current and forward-starting derivative instruments as well as net periodic interest costs of current receive-fixed and pay-fixed interest rate swaps held during the period. Changes in the fair value of derivative instruments and net periodic interest costs are impacted by changing market interest rates in any given period. In addition, because we continually monitor our hedge positioning and make changes based on management's view of the future path of interest rates and where we believe hedges will be most effective in relation to our capital allocation and interest rate risk, gains or losses on derivative instruments will also fluctuate based on the notional amount, maturity, and interest rate of our derivatives held during the period. Because of the changes made to derivatives in our hedging portfolio from one reporting period to the next, results of any given reporting period are generally not comparable to results of another.
Due to hedge repositioning during the year ended December 31, 2016, we terminated derivatives which had a change in fair value of $(25.2) million, net of periodic interest. As the interest rate market evolved in the latter part of the year, we increased our hedge positions to mitigate rising interest rates. As a result of the increase in interest rates during the second half of 2016, our derivatives, including the additional positions added, increased in fair value by $19.6 million, net of periodic costs, which partially offset losses related to the decline in fair value of our terminated derivative positions. During the years ended December 31, 2015 and December 31, 2014, repositioning of our hedges resulted in terminated derivatives with a change in fair value of $(22.5) million and $(2.3) million, net of periodic interest.
The table below provides additional information regarding the average notional balances and weighted average net pay-fixed rates of our receive-fixed and pay-fixed interest rate swaps effective during the periods indicated:
Year Ended | |||||||||||
December 31, | |||||||||||
($ in thousands) | 2016 | 2015 | 2014 | ||||||||
Average notional balance (1) | $ | 488,128 | $ | 567,767 | $ | 610,041 | |||||
Weighted average net pay-fixed rate (1) | 0.99 | % | 1.23 | % | 1.48 | % | |||||
(1) Amounts exclude forward-starting interest rate swaps.
48
Gain (Loss) on Sale of Investments, Net
Sales of our investments occur in the ordinary course of business as we manage our risk, capital and liquidity profiles, and as we allocate capital to preferred investment opportunities. The following tables provide information related to our loss on sale of investments, net for the periods indicated:
Year Ended | |||||||||||||||||||||||
December 31, | |||||||||||||||||||||||
2016 | 2015 | 2014 | |||||||||||||||||||||
($ in thousands) | Amortized cost basis sold | (Loss) gain on sale of investments, net | Amortized cost basis sold | (Loss) gain on sale of investments, net | Amortized cost basis sold | (Loss) gain on sale of investments, net | |||||||||||||||||
Agency RMBS | $ | 57,187 | $ | (3,010 | ) | $ | 177,430 | $ | (2,865 | ) | $ | 143,112 | $ | (5,762 | ) | ||||||||
Agency CMBS | — | — | 149,964 | (604 | ) | — | — | ||||||||||||||||
Non-Agency CMBS | 34,868 | (1,228 | ) | 31,341 | (566 | ) | 226,066 | 19,773 | |||||||||||||||
Agency CMBS IO | — | — | 43,398 | 1,698 | 106,005 | 1,630 | |||||||||||||||||
Non-Agency CMBS IO | — | — | 48,766 | 1,359 | 12,512 | 582 | |||||||||||||||||
$ | 92,055 | $ | (4,238 | ) | $ | 450,899 | $ | (978 | ) | $ | 487,695 | $ | 16,223 | ||||||||||
Agency RMBS we sold during the year ended December 31, 2016 were lower yielding ARMs that were at or near their interest rate reset periods and which were expected to reset at interest rates lower than their current coupon. Non-Agency CMBS sold during the year ended December 31, 2016 were yielding significantly below the portfolio average. Sale proceeds were primarily used to pay down repurchase agreement borrowings throughout the majority of 2016. During the fourth quarter of 2016, we began reinvesting a portion of sale proceeds primarily in Agency CMBS and CMBS IO as yields on available investments and risk adjusted returns improved relative to earlier in 2016.
We sold Agency RMBS during 2014 and 2015 in order to reduce our exposure to prepayment risk. In addition, we also sold certain Agency RMBS in the first half of 2014 that were at or near their interest rate reset periods and which were expected to reset at interest rates lower than their current coupon. We sold lower credit quality non-Agency CMBS during the third and fourth quarters of 2014 and used the sale proceeds to selectively reinvest during the first half of 2015 into higher credit quality Agency CMBS in order to minimize our portfolio exposure to credit spread widening. The majority of our Agency CMBS sales during the year ended December 31, 2015 were completed during the second quarter in order to manage our liquidity and leverage.
General and Administrative Expenses
General and administrative expenses for the year ended December 31, 2016 decreased $3.0 million compared to the year ended December 31, 2015 due to lower compensation and benefits expenses as well as lower legal expenses.
General and administrative expenses for the year ended December 31, 2015 increased $1.7 million compared to the year ended December 31, 2014 due primarily to increases in legal fees and contract services and consulting.
Other Comprehensive Income (Loss)
The following table provides detail on the changes in fair value by type of MBS which are recorded as unrealized gains (losses) in other comprehensive income on our consolidated statements of operations for the periods indicated:
49
Year Ended | |||||||||||
December 31, | |||||||||||
($ in thousands) | 2016 | 2015 | 2014 | ||||||||
Agency RMBS | $ | 2,709 | $ | (2,085 | ) | $ | 39,896 | ||||
Non-Agency RMBS | 762 | (781 | ) | (225 | ) | ||||||
Agency CMBS | (16,640 | ) | (19,048 | ) | 3,497 | ||||||
Non-Agency CMBS | (631 | ) | (101 | ) | (5,655 | ) | |||||
Agency CMBS IO | (4,110 | ) | (7,902 | ) | 5,612 | ||||||
Non-Agency CMBS IO | (1,680 | ) | (7,666 | ) | 5,219 | ||||||
Unrealized (loss) gain on available-for-sale investments | $ | (19,590 | ) | $ | (37,583 | ) | $ | 48,344 | |||
During the year ended December 31, 2016, the decrease in fair value of MBS of $(19.6) million was primarily due to the overall increase in interest rates from December 31, 2015 to December 31, 2016, which occurred primarily in the fourth quarter of 2016. During the year ended December 31, 2015, the decrease in fair value of MBS of $(37.6) million was due to increase in interest rates as well as overall widening in credit spreads. The $48.3 million increase in fair value of MBS for the year ended December 31, 2014 was due to overall credit spread tightening.
LIQUIDITY AND CAPITAL RESOURCES
Our primary sources of liquidity include borrowings under repurchase arrangements and monthly principal and interest payments we receive on our investments. Additional sources may also include proceeds from the sale of investments, equity offerings, and payments received from counterparties from interest rate swap agreements. We use our liquidity to manage our business including funding investment purchases and other operating costs, repaying borrowings and meeting margin calls from our lenders, making payments to counterparties as required under interest rate swap agreements, and to pay dividends on our preferred and common stock. We may also use liquidity to repurchase shares of our stock.
Our liquid assets fluctuate based on our investment activities and changes in the fair value of our MBS and derivative instruments. We seek to maintain sufficient liquidity to support our operations and to meet our anticipated liquidity demands, including potential margin calls from lenders (as discussed further below). We measure, manage, and forecast our liquidity on a daily basis. Our available liquid assets include unrestricted cash and cash equivalents, unencumbered Agency MBS, and certain unencumbered non-Agency MBS that can be pledged as collateral for margin calls or converted reasonably quickly into cash. As of December 31, 2016, our available liquid assets were $138.1 million, which consisted of unrestricted cash and cash equivalents of $74.1 million and unencumbered Agency MBS of $64.0 million, compared to $150.3 million as of December 31, 2015.
We perform sensitivity analysis on our liquidity based on changes in the fair value of our investments due to changes in interest rates, credit spreads, lender haircuts and prepayment speeds as well as changes in our derivative instruments due to changes in interest rates. In performing this analysis we will also consider the current state of the fixed income markets and the repurchase agreement markets in order to determine if market forces such as supply-demand imbalances or structural changes to these markets could change the liquidity of MBS or the availability of financing. The objective of our analysis is to assess the adequacy of our liquidity to withstand potential adverse events. We may change our leverage targets based on market conditions and our perceptions of the liquidity of our investments.
We closely monitor our debt-to-invested equity ratio (which is the ratio of debt financing to invested equity for any investment) as part of our liquidity management process as well as our overall enterprise level debt-to-equity ratio. We also monitor the ratio of our available liquidity to outstanding repurchase agreement borrowings, which fluctuates due to changes in the fair value of collateral we have pledged to our lenders. On an enterprise level basis, our current operating policies limit our total liabilities-to-shareholders' equity to 8 times our shareholders' equity. Our total liabilities decreased to 6.3 times shareholders' equity as of December 31, 2016 from 6.5 times as of December 31, 2015 due to lower total liabilities and lower total shareholders' equity. Our total liabilities declined during the year primarily because our payments on secured borrowings outpaced our financing of MBS purchases. Our total shareholders' equity declined primarily as a result of the decline in fair value of MBS recorded in accumulated other comprehensive loss.
We have historically had ample sources of liquidity to fund our activities and operations. The ability to fund our operations in the future depends in large measure on the availability of credit through repurchase agreement financing and the liquidity of
50
our investments. Credit markets have historically experienced brief periods of extreme volatility such as what occurred in 2008 and 2009. Such events are typically marked by concerns regarding counterparty credit, severe market illiquidity, and steep declines in asset prices. In recent periods U.S. financial regulatory agencies (such as the Office of Financial Research in the U.S. Treasury and the Federal Reserve) have expressed some concern about the stability of repurchase agreement financing for mortgage REITs in a sharply rising interest rate environment, and regulatory reform in the form of certain provisions of the Basel III capital framework (and supplemental bank capital rules) and the Dodd-Frank Wall Street Reform and Consumer Protection Act could impact the overall availability of credit by restricting the number of repurchase agreement lenders and the credit made available by such lenders. In times of severe market stress, repurchase agreement availability could be rapidly reduced and the terms on which we can borrow could be materially altered, particularly given the focus on these markets by the federal financial and banking regulators. Competition from other REITs, banks, hedge funds, and the federal government for capacity with our repurchase agreement lenders could also reduce our repurchase agreement availability. While we do not anticipate such events in the near term, a reduction in our borrowing capacity could force us to sell assets in order to repay our lenders or could otherwise restrict our ability to operate our business.
Depending on our liquidity levels, investment opportunities, the condition of the credit markets, and other factors, we may from time to time consider the issuance of debt, equity, or other securities. We may also sell investments in order to provide additional liquidity for our operations. While we will attempt to avoid dilutive or otherwise costly issuances, depending on market conditions, in order to manage our liquidity we could be forced to issue equity or debt securities which are dilutive to our capital base or our profitability.
Repurchase Agreements
The following table presents information regarding the balances of our repurchase agreement borrowings for the periods indicated:
($ in thousands) | Balance Outstanding As of Quarter End | Average Balance Outstanding For the Quarter Ended | Maximum Balance Outstanding During the Quarter Ended | ||||||||
December 31, 2016 | $ | 2,898,952 | $ | 2,768,769 | $ | 2,938,745 | |||||
September 30, 2016 | 2,478,278 | 2,536,562 | 2,599,491 | ||||||||
June 30, 2016 | 2,600,480 | 2,645,431 | 2,722,019 | ||||||||
March 31, 2016 | 2,722,019 | 2,688,633 | 2,838,607 | ||||||||
December 31, 2015 | 2,589,420 | 2,766,755 | 3,097,492 | ||||||||
September 30, 2015 | 3,055,069 | 3,220,391 | 3,405,692 | ||||||||
June 30, 2015 | 3,402,964 | 3,301,590 | 3,447,628 | ||||||||
March 31, 2015 | 3,185,843 | 3,101,133 | 3,239,247 | ||||||||
Our repurchase agreement borrowings are generally renewable at the discretion of our lenders without guaranteed roll-over terms. Given the short-term and uncommitted nature of most of our repurchase agreement financing, we attempt to maintain unused capacity under our existing repurchase agreement credit lines with multiple counterparties which helps protect us in the event of a counterparty's failure to renew existing repurchase agreements either with favorable terms or at all. As of December 31, 2016, we had repurchase agreement borrowings outstanding with 19 of our 32 available repurchase agreement counterparties at a weighted average borrowing rate of 1.03% compared to 0.75% as of December 31, 2015. Our repurchase agreement borrowings generally carry a rate of interest based on a spread to an index such as LIBOR.
For our repurchase agreement borrowings, we are required to post and maintain margin to the lender (i.e., collateral in excess of the repurchase agreement financing) in order to support the amount of the financing. This excess collateral is often referred to as a "haircut" (and which we also refer to as equity at risk). As the collateral pledged is generally MBS, the fair value of the collateral can fluctuate with changes in market conditions. If the fair value of the collateral falls below the haircut required by the lender, the lender has the right to demand additional margin, or collateral, to increase the haircut back to the initial amount. These demands are typically referred to as "margin calls". Declines in the value of investments occur for any number of reasons including but not limited to changes in interest rates, changes in ratings on an investment, changes in actual or perceived liquidity of the investment, or changes in overall market risk perceptions. Additionally, values in Agency RMBS will also decline from the payment delay feature of those securities. Agency RMBS have a payment delay feature whereby Fannie Mae and Freddie Mac announce principal payments on Agency RMBS but do not remit the actual principal payments and interest for 20 days in the case of Fannie Mae and 40 days in the case of Freddie Mac. Because these securities are financed with repurchase agreements,
51
the repurchase agreement lender generally makes a margin call for an amount equal to the product of their advance rate on the repurchase agreement and the announced principal payments on the Agency RMBS. This causes a temporary use of our liquidity to meet the margin call until we receive the principal payments and interest 20 to 40 days later.
The following table presents the weighted average minimum haircut contractually required by our counterparties for MBS pledged as collateral for our repurchase agreement borrowings as of the dates indicated:
December 31, 2016 | September 30, 2016 | June 30, 2016 | March 31, 2016 | December 31, 2015 | ||||||||||
Agency RMBS and CMBS | 5.0 | % | 5.1 | % | 4.9 | % | 5.1 | % | 5.0 | % | ||||
Non-Agency RMBS and CMBS | 16.3 | % | 17.0 | % | 15.8 | % | 16.0 | % | 14.5 | % | ||||
CMBS IO | 15.4 | % | 15.4 | % | 15.5 | % | 15.4 | % | 15.4 | % | ||||
The counterparties with whom we have the greatest amounts of equity at risk may vary significantly during any given period due to the short-term and generally uncommitted nature of the repurchase agreement borrowings. Equity at risk is defined as the amount pledged as collateral to the counterparty in excess of the borrowed amount outstanding. This equity at risk represents the potential loss to the Company if the counterparty is unable or unwilling to return collateral securing the repurchase agreement borrowing at its maturity. The following tables present the counterparties with whom we had greater than 5% of our equity at risk as of December 31, 2016 and December 31, 2015:
December 31, 2016 | |||||||
($ in thousands) | Amount Outstanding | Equity at Risk | |||||
Well Fargo Bank, N.A. and affiliates | $ | 342,160 | $ | 62,041 | |||
South Street Financial Corporation | 597,394 | 38,770 | |||||
JP Morgan Securities, LLC | 212,921 | 35,658 | |||||
$ | 1,152,475 | $ | 136,469 | ||||
December 31, 2015 | |||||||
($ in thousands) | Amount Outstanding | Equity at Risk | |||||
Well Fargo Bank, N.A. and affiliates | $ | 297,916 | $ | 56,193 | |||
JP Morgan Securities, LLC | 298,823 | 46,197 | |||||
South Street Financial Corporation | 431,950 | 25,952 | |||||
$ | 1,028,689 | $ | 128,342 | ||||
The following table discloses our repurchase agreement amounts outstanding and the value of the related collateral pledged by geographic region of our counterparties as of December 31, 2016:
($ in thousands) | Amount Outstanding | Market Value of Collateral Pledged | |||||
North America | $ | 2,105,337 | $ | 2,309,391 | |||
Asia | 421,991 | 443,098 | |||||
Europe | 371,624 | 397,351 | |||||
$ | 2,898,952 | $ | 3,149,840 | ||||
Certain of our repurchase agreement counterparties require us to comply with various operating and financial covenants. The financial covenants include requirements that we maintain minimum shareholders' equity (usually a set minimum, or a percentage of the highest amount of shareholders' equity since the date of the agreement), maximum decline in shareholders' equity (expressed as a percentage decline in any given period), and limits on maximum leverage (as a multiple of shareholders' equity). Operating requirements include, among other things, requirements to maintain our status as a REIT and to maintain our listing on the NYSE. Violations of one or more of these covenants could result in the lender declaring an event of default which would result
52
in the termination of the repurchase agreement and immediate acceleration of amounts due thereunder. In addition, some of the agreements contain cross default features, whereby default with one lender simultaneously causes default under agreements with other lenders. Violations could also restrict us from paying dividends or engaging in other transactions that are necessary for us to maintain our REIT status.
We monitor and evaluate on an ongoing basis the impact these customary financial covenants may have on our operating and financing flexibility. Currently, we do not believe we are subject to any covenants that materially restrict our financing flexibility.
Derivative Instruments
Our derivative instruments require us to post initial margin at inception and variation margin based on subsequent changes in the fair value of the derivatives. The collateral posted as margin by us is typically in the form of cash or Agency MBS. Generally, as interest rates decline due to market changes, we will be required to post collateral with counterparties on our pay-fixed derivative instruments and receive collateral from our counterparties on our receive-fixed derivative instruments, and vice versa as interest rates increase. As of December 31, 2016, we had Agency MBS with a fair value of $0.8 million and cash of $24.8 million posted as credit support under these agreements.
As of December 31, 2016, approximately $370 million of the Company's interest rate swaps were entered into under bilateral agreements which contain cross-default provisions with other agreements between the parties. In addition, these bilateral agreements contain financial and operational covenants similar to those contained in our repurchase agreements, as described above. Currently, we do not believe we are subject to any covenants that materially restrict our hedging flexibility.
Dividends
As a REIT, we are required to distribute to our shareholders amounts equal to at least 90% of our REIT taxable income for each taxable year after consideration of our tax NOL carryforwards. We generally fund our dividend distributions through our cash flows from operations. If we make dividend distributions in excess of our operating cash flows during the period, whether for purposes of meeting our REIT distribution requirements or other strategic reasons, those distributions are generally funded either through our existing cash balances or through the return of principal from our investments (either through repayment or sale).
We have a net operating tax loss ("NOL") carryforward that we could use to offset our REIT taxable income distribution requirement. This NOL carryforward had an estimated balance of approximately $89.8 million as of December 31, 2016. We also have deferred tax hedge losses on terminated derivative instruments, which will be recognized over the original periods that were being hedged by the terminated derivatives. These losses have already been recognized in our GAAP earnings but will reduce taxable income over the next ten years as noted in the following table:
($ in thousands) | Tax Hedge Loss Deduction | ||
2017 | $ | 22,750 | |
2018 | 22,472 | ||
2019 | 17,705 | ||
2020 - 2026 | 12,368 | ||
$ | 75,295 | ||
If any of the deferred tax hedge losses for the years noted in the table above result in dividend distributions to our shareholders in excess of REIT taxable income, the excess dividends distributed will be considered a return of capital to the shareholder. As of December 31, 2016, we estimated that approximately 70% of our 2016 common stock dividends will represent a return of capital to shareholders and not a distribution of REIT taxable income, principally as a result of the amount of the tax hedge loss deduction.
Contractual Obligations
The following table summarizes our contractual obligations by payment due date as of December 31, 2016:
53
($ in thousands) | Payments due by period | |||||||||||||||||||
Contractual Obligations: | Total | < 1 year | 1-3 years | 3-5 years | > 5 years | |||||||||||||||
Repurchase agreements (1) | $ | 2,900,567 | $ | 2,900,567 | $ | — | $ | — | $ | — | ||||||||||
Non-recourse collateralized financing (2) | 6,533 | 1,746 | 2,463 | 1,369 | 955 | |||||||||||||||
Operating lease obligations | 704 | 210 | 438 | 56 | — | |||||||||||||||
Total | $ | 2,907,804 | $ | 2,902,523 | $ | 2,901 | $ | 1,425 | $ | 955 | ||||||||||
(1) Includes estimated interest payments calculated using interest rates in effect as of December 31, 2016.
(2) Amounts shown are for principal only and exclude interest obligations as those amounts are not significant. Non-recourse collateralized financing represents securitization financing that is payable solely from loans and securities pledged as collateral. Payments due by period were estimated based on the principal repayments forecasted for the underlying loans and securities, substantially all of which is used to repay the associated financing outstanding.
Other Matters
As of December 31, 2016, we do not believe that any off-balance sheet arrangements exist that are reasonably likely to have a material effect on our current or future financial condition, results of operations, or liquidity. In addition, we do not have any material commitments for capital expenditures and have not obtained any commitments for funds to fulfill any capital obligations.
RECENT ACCOUNTING PRONOUNCEMENTS
There are no recently issued accounting pronouncements which have had or are currently expected to have a material impact on the Company's consolidated financial statements. Please refer to Note 1 to the Notes to the Consolidated Financial Statements contained in this Annual Report on Form 10-K for information regarding recently issued accounting pronouncements.
FORWARD-LOOKING STATEMENTS
Certain written statements in this Annual Report on Form 10-K that are not historical facts constitute “forward-looking statements” within the meaning of Section 27A of the 1933 Act and Section 21E of the Exchange Act. Statements in this report addressing expectations, assumptions, beliefs, projections, future plans and strategies, future events, developments that we expect or anticipate will occur in the future, and future operating results are forward-looking statements. Forward-looking statements are based upon management’s beliefs, assumptions, and expectations as of the date of this report regarding future events and operating performance, taking into account all information currently available to us, and are applicable only as of the date of this report. Forward-looking statements generally can be identified by use of words such as “believe”, “expect”, “anticipate”, “estimate”, “plan” “may”, “will”, “intend”, “should”, “could” or similar expressions. We caution readers not to place undue reliance on our forward-looking statements, which are not historical facts and may be based on projections, assumptions, expectations, and anticipated events that do not materialize. Except as required by law, we are not obligated to, and do not intend to, update or revise any forward-looking statement whether as a result of new information, future events, or otherwise.
Forward-looking statements in this Annual Report on Form 10-K may include, but are not limited to:
• | Our business and investment strategy including our ability to generate acceptable risk-adjusted returns and our target investment allocations; |
• | Monetary policy, including targeted rates and economic indicators, and regulatory initiatives of the Federal Reserve (including the FOMC) and other financial regulators; |
• | Our financing strategy including our target leverage ratios and anticipated trends in financing costs, and our hedging strategy including changes to the derivative instruments to which we are a party, and changes to government regulation of hedging instruments and our use of these instruments; |
• | Our investment portfolio composition and target investments; |
• | Our investment portfolio performance, including the fair value, yields, and forecasted prepayment speeds of our investments; |
• | Our liquidity and ability to access financing, and the anticipated availability and cost of financing; |
• | Our stock repurchase activity and the impact of stock repurchases; |
• | Our use of and restrictions on using our tax NOL carryforward; |
• | The status of pending litigation; |
54
• | The competitive environment in the future, including competition for investments and the availability of financing; |
• | Estimates of future interest expenses, including related to the Company's repurchase agreements and derivative instruments; |
• | The status of regulatory rule-making or review processes and the status of reform efforts and other business developments in the repurchase agreement financing market; |
• | Market, industry and economic trends, how these trends and related economic data may impact the behavior of market participants and financial regulators; and |
• | Interest rates. |
Forward-looking statements are inherently subject to risks, uncertainties and other factors that could cause our actual results to differ materially from historical results or from any results expressed or implied by such forward-looking statements. Not all of these risks and other factors are known to us. New risks and uncertainties arise over time, and it is not possible to predict those events or how they may affect us. The projections, assumptions, expectations or beliefs upon which the forward-looking statements are based can also change as a result of these risks or other factors. If such a risk or other factor materializes in future periods, our business, financial condition, liquidity and results of operations may vary materially from those expressed or implied in our forward-looking statements.
While it is not possible to identify all factors, some of the factors that may cause actual results to differ from historical results or from any results expressed or implied by forward-looking statements, or that may cause our projections, assumptions, expectations or beliefs to change, include the following:
• | the risks and uncertainties referenced in this Annual Report on Form 10-K, particularly those set forth under and incorporated by reference into Part II, Item 1A, “Risk Factors”; |
• | our ability to find suitable reinvestment opportunities; |
• | changes in economic conditions; |
• | changes in interest rates and interest rate spreads, including the repricing of interest-earning assets and interest-bearing liabilities; |
• | our investment portfolio performance particularly as it relates to cash flow, prepayment rates and credit performance; |
• | actual or anticipated changes in Federal Reserve monetary policy; |
• | adverse reactions in financial markets related to the budget deficit or national debt of the United States government; potential or actual default by the United States government on Treasury securities; and potential or actual downgrades to the sovereign credit rating of the United States; |
• | the cost and availability of financing, including the future availability of financing due to changes to regulation of, and capital requirements imposed upon, financial institutions; |
• | the cost and availability of new equity capital; |
• | changes in our use of leverage; |
• | changes to our investment strategy, operating policies, dividend policy or asset allocations; |
• | the quality of performance of third-party servicer providers of our loans and loans underlying our securities; |
• | the level of defaults by borrowers on loans we have securitized; |
• | changes in our industry; |
• | increased competition; |
• | changes in government regulations affecting our business; |
• | changes in the repurchase agreement financing markets and other credit markets; |
• | changes to the market for interest rate swaps and other derivative instruments, including changes to margin requirements on derivative instruments; |
• | government initiatives to support the U.S financial system and U.S. housing and real estate markets; or to reform the U.S. housing finance system including by imposing standards for originating residential mortgage loans; |
• | GSE reform or other government policies and actions; |
• | ownership shifts under Section 382 that further limit the use of our tax NOL carryforward; and |
• | exposure to current and future claims and litigation. |
55
ITEM 7A. QUANTITATIVE AND QUALITATIVE DISCLOSURES ABOUT MARKET RISK
We seek to manage various risks inherent in our business strategy, which include interest rate, prepayment, reinvestment, market value, credit, and liquidity risks. These risks can and do cause fluctuations in our net income, other comprehensive income, and book value. We attempt to manage these risks and earn an acceptable return for our shareholders as discussed below.
Interest Rate Risk
Investing in interest-rate sensitive investments on a leveraged basis subjects our results to interest rate risk primarily from the mismatch between interest-rate reset dates or maturity of our assets and the reset-dates or maturity of our liabilities. Borrowing costs on our liabilities are generally based on prevailing market rates and reset more frequently than interest rates on our assets. Changes in interest rates will also impact the market value of our investment portfolio and our derivative instruments which together will impact our book value per common share. While having interest rate risk is a basic tenet of our investment strategy, we attempt to manage our exposure to changes in interest rates by investing in instruments that have short maturities/interest reset dates and entering into derivative instruments (such as interest rate swaps and Eurodollar futures) to hedge this risk. We manage interest rate risk within tolerances set by our Board of Directors (as measured by the duration gap of the investment portfolio net of hedging instruments, which was no greater than 2 years as of December 31, 2016). Our portfolio duration changes based on the composition of our investment portfolio and our hedge positions as well as market factors. Duration is driven by model inputs and can be an imprecise measure of actual interest rate risk. In the case of Agency RMBS, the most important inputs include anticipated prepayment speeds. Estimates of prepayment speeds can vary significantly by investor for the same security and therefore estimates of security and portfolio duration can vary significantly.
During a period of rising interest rates (particularly short term rates in a flattening yield curve environment), our borrowing costs will increase faster than our asset yields, negatively impacting our net interest income. The amount of the impact will depend on the composition of our portfolio, our hedging strategy and the effectiveness of our hedging instruments at the time, as well as the magnitude and the duration of the increase in interest rates. In addition, our Agency RMBS reset based on one-year LIBOR and have limits or caps on the initial, aggregate, or periodic amount that an interest rate may reset while our liabilities do not have interest rate reset caps. As of December 31, 2016, we had a positive net duration gap in our investment portfolio, which means our liabilities mature or reset sooner than our investments, and we had not fully hedged this difference with derivative instruments. Therefore, increases in interest rates, particularly rapid changes, will negatively impact the market value of our investments, thereby reducing our book value. In addition to the information set forth in the tables below, see "Market Value Risk" below for further discussion of the risks to the market value of our investments. For further discussion of the reset features of our hybrid ARMs, please refer to "Financial Condition-RMBS" within Part II, Item 7 of this Annual Report on Form 10-K.
Effect of Changes in Interest Rates on Adjusted Net Interest Income and Market Value. The table below shows the projected sensitivity of our adjusted net interest income and the market value of our investments and derivative instruments carried at fair value as they existed as of December 31, 2016 based on an instantaneous parallel shift in market interest rates as set forth in the table below. In order to include the impact of changes in interest rates on our effective derivative instruments, we are presenting the percentage change in adjusted net interest income (instead of net interest income) because net interest income does not include the net interest payments/receipts on these instruments. In light of the low interest rate environment at December 31, 2016, the only declining rate scenario that we present is a downward shift of 50 basis points.
The "percentage change in adjusted net interest income" includes the impact of changes in expected prepayment speeds on our investments and assumes that net proceeds received from pay downs on the investment portfolio are reinvested in MBS in amounts proportionate to the portfolio composition that existed as of December 31, 2016 and at yields consistent with those as of that date, adjusted for the parallel shift in the rates below. Changes in types of investments, the returns earned on these investments, future interest rates, credit spreads, the shape of the yield curve, the availability of financing, and/or the mix of our investments and financings including derivative instruments may cause actual results to differ significantly from the modeled results. There can be no assurance that assumed events used for the model below will occur, or that other events will not occur, that will affect the outcomes; therefore, the tables below and all related disclosures constitute forward-looking statements.
56
Parallel Shift in Interest Rates | Percentage change in market value (1) | Percentage change in adjusted net interest income | ||
+100 | (0.6)% | (42.4)% | ||
+50 | (0.3)% | (20.7)% | ||
-50 | 0.2% | 18.7% | ||
(1) | Includes changes in market value of our investments and derivative instruments, but excludes changes in market value of our financings because they are not carried at fair value on our balance sheet. The projections for market value do not assume any change in credit spreads. |
Given the projected increases in the Federal Funds rate during 2017 as discussed in "Executive Overview", we have adjusted our hedging portfolio subsequent to December 31, 2016 in order to offset a portion of our exposure to changes in our adjusted net interest income reflected in the table above.
Management also considers changes in the shape of the interest rate curves in assessing and managing portfolio interest rate risk. Often interest rates do not move in a parallel fashion from quarter to quarter. The table below shows the projected change in market value of our investment portfolio net of derivative hedge instruments for instantaneous changes in the shape of the U.S. Treasury ("UST") curve (with similar changes to the interest rate swap curves) as of December 31, 2016.
Basis point change in 2-year UST | Basis point change in 10-year UST | Percentage change in market value (1) | ||
+25 | +50 | 0.07% | ||
+25 | +0 | (0.35)% | ||
+50 | +25 | (0.47)% | ||
+50 | +100 | 0.05% | ||
-10 | -50 | (0.32)% | ||
(1) | Includes changes in market value of our investments and derivative instruments, but excludes changes in market value of our financings because they are not carried at fair value on our balance sheet. The projections for market value do not assume any change in credit spreads. |
Management's adjustments to our hedge portfolio over the year, which are discussed in more detail in "Financial Condition", reduced our portfolio's exposure to a steepening in the U.S. Treasury ("UST") curve as of December 31, 2016 versus December 31, 2015 and increased our exposure to a flatter UST curve, both as measured by the difference in the 2-year UST versus the 10-year UST. Management has structured its duration position to mitigate risk in a rising interest rate environment in 2017 led by the 10-year UST as a result of improving economic data in the U.S. and globally.
Market Value Risk
Our investments fluctuate in market value due to changes in credit spreads, spot and forward interest rates, actual and anticipated prepayments on our investments and many other factors. Changes in the market values of our investments are reflected in other comprehensive income, shareholders' equity, and book value per common share. Changes in credit spreads represent the market's valuation of the perceived riskiness of assets relative to risk-free rates, and widening credit spreads reduces the market value of our investments as market participants require additional yield to hold riskier assets. Credit spreads could change based on macroeconomic or systemic factors as well as the factors specific to a particular security such as prepayment performance or credit performance. Other factors that could impact credit spreads include technical issues such as supply and demand for a particular type of security or FOMC monetary policy. Likewise, most of our investments are fixed rate or reset in rate over a period of time, and as interest rates rise, we would expect the market value of these investments to decrease. We use derivative instruments to hedge our exposure to rising interest rates, though often not on a one-to-one basis. We do not seek to hedge our exposure to credit spreads, prepayments, or other factors other than through asset selection.
57
Fluctuations in credit spreads typically vary based on the type of investment. In general, Agency MBS credit spreads experience less volatility than non-Agency MBS credit spreads. This is due to the fact that market participants generally view Agency MBS, given their guarantee of principal by GSEs, as more liquid (i.e., more easily converted into cash) than non-Agency MBS.
The table below is an estimate of the projected change in our portfolio market value given the indicated change in market credit spreads as of December 31, 2016:
Basis Point Change in Market Credit Spreads | Percentage change in market value of investments | |
+50 | (2.2)% | |
+25 | (1.1)% | |
-25 | 1.1% | |
-50 | 2.3% | |
Prepayment and Reinvestment Risk
Prepayment risk is the risk of an early, unscheduled return of principal on an investment. We are subject to prepayment risk from premiums paid on investments which we acquire. Purchase premiums on our investments are amortized as a reduction in interest income using the effective yield method under GAAP. Principal prepayments on our investments are influenced by changes in market interest rates and a variety of economic, geographic, government policy and other factors beyond our control.
We have prepayment risk for all of our investments which we own at a premium to their par value. The majority of the loans underlying our RMBS are ARMs or hybrid ARMs and do not have any specific prepayment protection. Prepayments on these loans generally accelerate in a declining interest rate environment, as the loans age, and as the loans near their respective interest rate reset dates, particularly the initial reset date or if expectations are that interest rates will rise. Our prepayment models anticipate acceleration of prepayments in these events. To the extent the actual prepayments exceed our modeled prepayments, or if we change our future prepayment expectations, we will record adjustments to our premium amortization which may negatively impact our net interest income and could impact the fair value of our RMBS.
As an indication of our prepayment risk on our RMBS portfolio, the following table summarizes information for our Agency RMBS portfolio regarding the net premium and weighted average coupon by months until interest rate reset ("MTR") or until maturity in the case of fixed-rate securities as of the end of the past four quarters:
December 31, 2016 | September 30, 2016 | June 30, 2016 | March 31, 2016 | ||||||||||||||||||||
($ in thousands) | Net Premium | WAC | Net Premium | WAC | Net Premium | WAC | Net Premium | WAC | |||||||||||||||
0-12 MTR | $ | 19,593 | 3.17% | $ | 18,536 | 3.13% | $ | 18,456 | 3.05% | $ | 14,715 | 2.65% | |||||||||||
13-36 MTR | 12,369 | 3.18% | 15,545 | 3.17% | 17,910 | 3.21% | 24,000 | 3.32% | |||||||||||||||
37-60 MTR | 10,441 | 3.51% | 9,536 | 3.60% | 6,141 | 3.61% | 3,630 | 3.68% | |||||||||||||||
> 60 MTR | 14,663 | 2.73% | 17,524 | 2.77% | 23,051 | 2.87% | 27,911 | 2.91% | |||||||||||||||
Total | $ | 57,066 | 3.05% | $ | 61,141 | 3.04% | $ | 65,558 | 3.01% | $ | 70,256 | 3.01% | |||||||||||
Par balance | $ | 1,157,258 | $ | 1,239,856 | $ | 1,329,159 | $ | 1,423,270 | |||||||||||||||
Premium, net as a % of par value | 4.9 | % | 4.9 | % | 4.9 | % | 4.9 | % | |||||||||||||||
Loans underlying our CMBS and CMBS IO securities typically have some form of prepayment protection provisions (such as prepayment lock-outs) or prepayment compensation provisions (such as yield maintenance or prepayment penalties). Yield maintenance and prepayment penalty requirements are intended to create an economic disincentive for the loans to prepay; however, the amount of the prepayment penalty required to be paid may decline over time, and as loans age, interest rates decline, or market values of collateral supporting the loans increase, prepayment penalties may lessen as an economic disincentive to the borrower. Generally, our experience has been that prepayment lock-out and yield maintenance provisions
58
result in stable prepayment performance from period to period. There are no prepayment protections, however, if the loan defaults and is partially or wholly repaid earlier as a result of loss mitigation actions taken by the underlying loan servicer. Historically, we have experienced low default rates on loans underlying CMBS and CMBS IO.
Because CMBS IO consist of rights to interest on the underlying commercial mortgage loan pools and do not have rights to principal payments on the underlying loans, prepayment risk on these securities would be particularly acute without these prepayment protection provisions. CMBS IO prepayment protection and compensation provisions vary by issuer of the security (i.e. Freddie Mac, Fannie Mae, Ginnie Mae, or non-Agency). The majority of our Agency CMBS IO are issued by Freddie Mac and these securities generally have initial prepayment lock-outs followed by a defeasance period which on average extends to within six months of the stated maturities of the underlying loans. Non-Agency CMBS IO generally have prepayment protection in the form of prepayment lock-outs and defeasance provisions. The following table details the fair value of our CMBS IO portfolio by issuer as of the end of the periods indicated:
($ in thousands) | December 31, 2016 | December 31, 2015 | |||||
Fannie Mae | $ | 18,957 | $ | 24,177 | |||
Freddie Mac | 392,941 | 401,951 | |||||
Non-Agency CMBS IO | 342,648 | 363,727 | |||||
$ | 754,546 | $ | 789,855 | ||||
We seek to manage our prepayment risk on our MBS by diversifying our investments, seeking investments which we believe will have superior prepayment performance, and investing in securities which have some sort of prepayment prohibition or yield maintenance (as is the case with CMBS and CMBS IO). With respect to RMBS, we will seek to invest in RMBS where we believe the underlying loans have favorable prepayment characteristics such as lower loan balances or favorable origination, borrower or geographic characteristics.
We are also subject to reinvestment risk as a result of the prepayment, repayment and sales of our investments. In order to maintain our investment portfolio size and our earnings, we need to reinvest capital received from these events into new interest-earning assets. If we are unable to find suitable reinvestment opportunities, interest income on our investment portfolio and investment cash flows could be negatively impacted. Yields on assets in which we have reinvested in recent periods have generally been lower than yields on existing assets due to lower overall interest rates and more competition for these as investment assets. As a result, our interest income has declined in recent periods and may continue to decline in the future. In addition, based on market conditions, our leverage, and our liquidity profile, we may decide to not reinvest the cash flows we receive from our investment portfolio even when attractive reinvestment opportunities are available, or we may decide to reinvest in assets with lower yield but greater liquidity. If we retain rather than reinvest capital as in the first six months of 2016, or if we invest it in lower yielding assets for liquidity reasons, the size of our investment portfolio and the amount of net interest income generated by our investment portfolio will likely decline.
Credit Risk
Credit risk is the risk that we will not receive all contractual amounts due on investments that we own due to default by the borrower or due to a deficiency in proceeds from the liquidation of the collateral securing the obligation. We are also particularly exposed to credit risk on investments that we own at a premium. For investments owned at premiums, defaults on the underlying loan typically result in the complete loss of any remaining unamortized premium we paid.
We attempt to mitigate our credit risk by purchasing Agency MBS and higher quality non-Agency MBS. Agency MBS have credit risk to the extent that Fannie Mae or Freddie Mac fails to remit payments on the MBS for which they have issued a guaranty of payment. Given the improved financial performance and conservatorship of these entities and the continued support of the U.S. government, we believe this risk is low. For our non-Agency MBS, we seek to purchase investment grade securities (rated 'BBB' or better by a least one of the nationally recognized statistical ratings organizations) or securities that we believe are short-duration and which will have strong credit performance. We do not currently seek to purchase heavily discounted, credit sensitive MBS.
59
The majority of our non-Agency securities are CMBS and CMBS IO. The return we earn on these securities is dependent on the credit performance of the underlying commercial loans. In particular, since investments in CMBS IO pay interest from the underlying commercial mortgage loan pools, returns are more negatively impacted by liquidations of loans in the underlying loan pool.
In order to manage our exposure to credit performance, we generally invest in securities with higher credit ratings and in securities where we have evaluated the credit profile of the underlying loan pool and can monitor its credit performance. With respect to non-Agency RMBS, our portfolio is primarily comprised of very short duration MBS backed by pools of re-performing or non-performing loans.
The following table presents information on our non-Agency MBS by credit rating as of December 31, 2016:
December 31, 2016 | ||||||||||||||||||
($ in thousands) | CMBS | CMBS IO | RMBS | Total | Percentage | |||||||||||||
AAA | $ | 35,405 | $ | 290,092 | $ | — | $ | 325,497 | 71.6 | % | ||||||||
AA | 14,127 | 46,986 | — | 61,113 | 13.5 | % | ||||||||||||
A | 18,614 | — | — | 18,614 | 4.1 | % | ||||||||||||
Below A or not rated | 10,070 | 5,570 | 33,562 | 49,202 | 10.8 | % | ||||||||||||
$ | 78,216 | $ | 342,648 | $ | 33,562 | $ | 454,426 | 100.0 | % | |||||||||
Liquidity Risk
We have liquidity risk principally from the use of recourse repurchase agreements to finance our ownership of securities. In general, our repurchase agreements provide a source of uncommitted short-term financing that finances a longer-term asset, thereby creating a mismatch between the maturity of the asset and of the associated financing. Our repurchase agreements are renewable at the discretion of our lenders and do not contain guaranteed roll-over terms. If we fail to repay the lender at maturity, the lender has the right to immediately sell the collateral and pursue us for any shortfall if the sales proceeds are inadequate to cover the repurchase agreement financing. In addition, repurchase agreements are collateral based and declines in the market value of our investments subject us to liquidity risk.
For further information, including how we attempt to mitigate liquidity risk and monitor our liquidity position, please refer to “Liquidity and Capital Resources” in Part II, Item 7 of this Annual Report on Form 10-K.
60
ITEM 8. | FINANCIAL STATEMENTS AND SUPPLEMENTARY DATA |
Our consolidated financial statements and the related notes, together with the Reports of the Independent Registered Public Accounting Firm thereon, are set forth beginning on page F-1 of this Annual Report on Form 10-K.
ITEM 9. | CHANGES IN AND DISAGREEMENTS WITH ACCOUNTANTS ON ACCOUNTING AND FINANCIAL DISCLOSURE |
None.
ITEM 9A. | CONTROLS AND PROCEDURES |
Disclosure Controls and Procedures
Our management evaluated, with the participation of our Principal Executive Officer and Principal Financial Officer, the effectiveness of our disclosure controls and procedures, as defined in Exchange Act Rule 13a-15(e), as of the end of the period covered by this report. Based on that evaluation, our Principal Executive Officer and Principal Financial Officer concluded that our disclosure controls and procedures were effective as of December 31, 2016 to ensure that information required to be disclosed in the reports that we file or submit under the Exchange Act is recorded, processed, summarized and reported, within the time periods specified in the SEC’s rules and forms, and that such information is accumulated and communicated to our management, including our Principal Executive Officer and Principal Financial Officer, as appropriate, to allow timely decisions regarding required disclosure.
Changes in Internal Control over Financial Reporting
There were no changes in our internal control over financial reporting during the three months ended December 31, 2016 that materially affected, or are reasonably likely to materially affect, our internal control over financial reporting.
Management’s Report on Internal Control over Financial Reporting
Our management is responsible for establishing and maintaining adequate internal control over financial reporting as defined in Rule 13a-15(f) of the Exchange Act. Because of inherent limitations, a system of internal control over financial reporting may not prevent or detect misstatements. Also, projections of any evaluation of effectiveness to future periods are subject to the risk that controls may become inadequate due to a change in conditions, or that the degree of compliance with policies or procedures may deteriorate.
Our management evaluated, with the participation of our principal executive officer and principal financial officer, the effectiveness of our internal control over financial reporting using the criteria set forth by the Committee of Sponsoring Organizations of the Treadway Commission (“COSO”) (2013) in “Internal Control-Integrated Framework.” Based on that evaluation, our principal executive officer and principal financial officer concluded that our internal control over financial reporting was effective as of the end of the period covered by this report.
The Company’s internal control over financial reporting as of December 31, 2016 has been audited by BDO USA, LLP, the independent registered public accounting firm that also audited the Company’s consolidated financial statements included in this Annual Report on Form 10-K. The attestation report of BDO USA, LLP on the effectiveness of the Company’s internal control over financial reporting appears on page F-4 herein.
ITEM 9B. | OTHER INFORMATION |
None.
61
PART III.
ITEM 10. | DIRECTORS, EXECUTIVE OFFICERS AND CORPORATE GOVERNANCE |
The information about our executive officers required by this item is included in Part I, Item I of this Annual Report on Form 10-K under the caption “Executive Officers of the Company”. The remaining information required by Item 10 will be included in our definitive proxy statement for use in connection with our 2017 Annual Meeting of Shareholders (“2017 Proxy Statement”) under the captions “Election of Directors,” “Committees of the Board,” “Code of Ethics” and “Section 16(a) Beneficial Ownership Reporting Compliance,” and is incorporated herein by reference.
ITEM 11. | EXECUTIVE COMPENSATION |
The information required by Item 11 will be included in the 2017 Proxy Statement under the captions “Executive Compensation” and “Directors’ Compensation” and is incorporated herein by reference.
ITEM 12. | SECURITY OWNERSHIP OF CERTAIN BENEFICIAL OWNERS AND MANAGEMENT AND RELATED STOCKHOLDER MATTERS |
The following table sets forth information as of December 31, 2016 with respect to our equity compensation plans under which shares of our common stock are authorized for issuance.
Number of Securities to Be Issued upon Exercise of Outstanding Options, Warrants and Rights | Weighted-Average Exercise Price of Outstanding Options, Warrants and Rights | Number of Securities Remaining Available for Future Issuance Under Equity Compensation Plans (1) | |||||||
Equity Compensation Plans Approved by Shareholders: | |||||||||
2009 Stock and Incentive Plan | — | — | 860,106 | ||||||
Equity Compensation Plans Not Approved by Shareholders (2) | — | — | — | ||||||
Total | — | $ | — | 860,106 | |||||
(1) | Reflects shares available to be granted under the 2009 Stock and Incentive Plan in the form of stock options, stock appreciation rights, stock awards, dividend equivalent rights, performance share awards, stock units and incentive awards. |
(2) | The Company does not have any equity compensation plans that have not been approved by shareholders. |
The remaining information required by Item 12 will be included in the 2017 Proxy Statement under the caption “Ownership of Stock” and is incorporated herein by reference.
ITEM 13. | CERTAIN RELATIONSHIPS AND RELATED TRANSACTIONS, AND DIRECTOR INDEPENDENCE |
The information required by Item 13 will be included in the 2017 Proxy Statement under the captions “Related Person Transactions” and “Director Independence,” and is incorporated herein by reference.
ITEM 14. | PRINCIPAL ACCOUNANT FEES AND SERVICES |
The information required by Item 14 will be included in the 2017 Proxy Statement under the caption “Audit Information,” and is incorporated herein by reference.
62
PART IV.
ITEM 15. EXHIBITS, FINANCIAL STATEMENT SCHEDULES
(a) Documents filed as part of this report:
1. and 2. | Financial Statements and Schedules: The information required by this section of Item 15 is set forth in the Consolidated Financial Statements and Reports of Independent Registered Public Accounting Firm beginning at page F-1 of this Annual Report on Form 10-K. The index to the Financial Statements is set forth at page F-2 of this Annual Report on Form 10-K. |
Exhibit No. | Description |
3.1 | Restated Articles of Incorporation, effective June 2, 2014 (incorporated herein by reference to Exhibit 3.1 to Dynex’s Registration Statement on Form S-8 filed September 17, 2014). |
3.2 | Amended and Restated Bylaws adopted as of February 28, 2017 (filed herewith). |
10.5* | Severance Agreement between Dynex Capital, Inc. and Stephen J. Benedetti dated June 11, 2004 (incorporated herein by reference to Exhibit 10.5 to Dynex’s Annual Report on Form 10-K for the year ended December 31, 2007). |
10.5.1* | 409A Amendment to Severance Agreement between Dynex Capital, Inc. and Stephen J. Benedetti, dated December 31, 2008 (incorporated herein by reference to Exhibit 10.1.1 to Dynex’s Annual Report on Form 10-K for the year ended December 31, 2008). |
10.11* | Dynex Capital, Inc. 2009 Stock and Incentive Plan, effective as of May 13, 2009 (incorporated herein by reference to Appendix A to Dynex’s Proxy Statement filed April 3, 2009). |
10.14 | Equity Distribution Agreement between Dynex Capital, Inc. and JMP Securities LLC, dated June 24, 2010 (incorporated herein by reference to Exhibit 10.14 to Dynex’s Current Report on Form 8-K filed June 24, 2010). |
10.14.1 | Amendment No. 1 to Equity Distribution Agreement between Dynex Capital, Inc. and JMP Securities LLC, dated December 23, 2011 (incorporated herein by reference to Exhibit 10.14.1 to Dynex's Current Report on Form 8-K filed December 23, 2011). |
10.16* | Form of Restricted Stock Agreement for Executive Officers under the Dynex Capital, Inc. 2009 Stock and Incentive Plan (incorporated herein by reference to Exhibit 10.16 to Dynex’s Annual Report on Form 10-K for the year ended December 31, 2010). |
10.17* | Base salaries for executive officers of Dynex Capital, Inc. (filed herewith). |
10.18* | Non-employee directors’ annual compensation for Dynex Capital, Inc. (incorporated herein by reference to Exhibit 10.18 to Dynex's Annual Report on Form 10-K for the year ended December 31, 2015). |
10.23 | Master Repurchase and Securities Contract dated as of August 6, 2012 between Issued Holdings Capital Corporation, Dynex Capital, Inc. (as guarantor) and Wells Fargo Bank, National Association (incorporated herein by reference to Exhibit 10.23 to Dynex's Current Report on Form 8-K filed August 8, 2012). |
10.23.1 | Amendment No. 1 to Master Repurchase and Securities Contract dated as of October 1, 2013 between Issued Holdings Capital Corporation, Dynex Capital, Inc. (as guarantor) and Wells Fargo Bank, N.A. (incorporated herein by reference to Exhibit 10.23.1 to Dynex’s Current Report on Form 8-K filed October 7, 2013). |
10.23.2 | Amendment No. 2 to Master Repurchase and Securities Contract dated as of February 5, 2015 between Issued Holdings Capital Corporation, Dynex Capital, Inc. (as guarantor) and Wells Fargo Bank, N.A. (incorporated herein by reference to Exhibit 10.23.2 to Dynex’s Current Report on Form 8-K filed February 11, 2015). |
10.23.3 | Amendment No. 3 to Master Repurchase and Securities Contract dated as of April 29, 2016 between Issued Holdings Capital Corporation, Dynex Capital, Inc. (as guarantor) and Wells Fargo Bank, N.A. (incorporated herein by reference to Exhibit 10.23.3 to Dynex’s Current Report on Form 8-K filed May 3, 2016). |
63
10.24 | Guarantee Agreement dated as of August 6, 2012 by Dynex Capital, Inc. in favor of Wells Fargo Bank, National Association (incorporated herein by reference to Exhibit 10.24 to Dynex's Current Report on Form 8-K filed August 8, 2012). |
10.25* | Form of Restricted Stock Agreement for Non-Employee Directors under the Dynex Capital, Inc. 2009 Stock and Incentive Plan (incorporated herein by reference to Exhibit 10.25 to Dynex’s Quarterly Report on Form 10-Q for the quarter ended June 30, 2016). |
10.27 | Underwriting Agreement, dated April 11, 2013, by and among Dynex Capital, Inc., J.P. Morgan Securities LLC, and Keefe, Bruyette & Woods, Inc. (incorporated herein by reference to Exhibit 1.1 to Dynex's Current Report on Form 8-K filed April 16, 2013). |
10.28* | Dynex Capital, Inc. Executive Incentive Plan (as adopted December 29, 2015) (incorporated herein by reference to Exhibit 10.28 to Dynex's Current Report on Form 8-K filed January 5, 2016). |
10.29 | Equity Distribution Agreement among Dynex Capital, Inc., Ladenburg Thalmann & Co. Inc. and JonesTrading Institutional Services LLC, dated November 21, 2016 (incorporated herein by reference to Exhibit 10.29 to Dynex’s Current Report on Form 8-K filed November 22, 2016). |
10.30* | Employment Agreement, dated as of December 8, 2016, between Dynex Capital, Inc. and Byron L. Boston (incorporated herein by reference to Exhibit 10.30 to Dynex’s Current Report on Form 8-K filed December 9, 2016). |
10.31* | Form of Restricted Stock Agreement for Executive Officers under the Dynex Capital, Inc. 2009 Stock and Incentive Plan (incorporated herein by reference to Exhibit 10.31 to Dynex's Current Report on Form 8-K filed February 13, 2017). |
10.32* | Employment Agreement, dated as of March 3, 2017, between Dynex Capital, Inc. and Stephen J. Benedetti (incorporated herein by reference to Exhibit 10.32 to Dynex’s Current Report on Form 8-K filed March 8, 2017). |
10.33* | Employment Agreement, dated as of March 3, 2017, between Dynex Capital, Inc. and Smriti L. Popenoe (incorporated herein by reference to Exhibit 10.33 to Dynex’s Current Report on Form 8-K filed March 8, 2017). |
21.1 | List of consolidated entities of Dynex (filed herewith). |
23.1 | Consent of BDO USA, LLP (filed herewith). |
31.1 | Certification of principal executive officer pursuant to Section 302 of the Sarbanes-Oxley Act of 2002 (filed herewith). |
31.2 | Certification of principal financial officer pursuant to Section 302 of the Sarbanes-Oxley Act of 2002 (filed herewith). |
32.1 | Certification of principal executive officer and principal financial officer pursuant to Section 906 of the Sarbanes-Oxley Act of 2002 (filed herewith). |
101 | The following materials from Dynex Capital, Inc.'s Annual Report on Form 10-K for the year ended December 31, 2016, formatted in XBRL (Extensible Business Reporting Language), filed herewith: (i) Consolidated Balance Sheets, (ii) Consolidated Statements of Comprehensive Income (Loss), (iii) Consolidated Statements of Shareholder's Equity, (iv) Consolidated Statements of Cash Flows, and (v) Notes to Consolidated Financial Statements. |
* Denotes management contract.
(b) Exhibits: See Item 15(a)(3) above.
(c) Financial Statement Schedules: None.
ITEM 16. FORM 10-K SUMMARY
None.
64
SIGNATURES
Pursuant to the requirements of Section 13 or 15(d) of the Securities Exchange Act of 1934, the registrant has duly caused this report to be signed on its behalf by the undersigned, thereunto duly authorized.
DYNEX CAPITAL, INC. | ||
(Registrant) | ||
March 15, 2017 | /s/ Stephen J. Benedetti | |
Stephen J. Benedetti, Executive Vice President, Chief Financial Officer and Chief Operating Officer | ||
Pursuant to the requirements of the Securities Exchange Act of 1934, this report has been signed below by the following persons on behalf of the registrant and in the capacities and on the dates indicated.
Signature | Title | Date |
/s/ Byron L. Boston | Chief Executive Officer, President, | March 15, 2017 |
Byron L. Boston | Co-Chief Investment Officer, and Director | |
(Principal Executive Officer) | ||
/s/ Stephen J. Benedetti | Executive Vice President, Chief Financial | March 15, 2017 |
Stephen J. Benedetti | Officer and Chief Operating Officer | |
(Principal Financial Officer) | ||
/s/ Jeffrey L. Childress | Vice President and Controller | March 15, 2017 |
Jeffrey L. Childress | (Principal Accounting Officer) | |
/s/ Thomas B. Akin | Chairperson of the Board, Director | March 15, 2017 |
Thomas B. Akin | ||
/s/ Michael R. Hughes | Director | March 15, 2017 |
Michael R. Hughes | ||
/s/ Barry A. Igdaloff | Director | March 15, 2017 |
Barry A. Igdaloff | ||
/s/ Valerie A. Mosley | Director | March 15, 2017 |
Valerie A. Mosley | ||
/s/ Robert A. Salcetti | Director | March 15, 2017 |
Robert A. Salcetti | ||
DYNEX CAPITAL, INC.
CONSOLIDATED FINANCIAL STATEMENTS AND
REPORTS OF INDEPENDENT REGISTERED PUBLIC ACCOUNTING FIRM
For Inclusion in Form 10-K
Annual Report Filed with
Securities and Exchange Commission
December 31, 2016
DYNEX CAPITAL, INC.
INDEX TO FINANCIAL STATEMENTS
Page | |
Reports of Independent Registered Public Accounting Firm | |
Consolidated Balance Sheets – As of December 31, 2016 and December 31, 2015 | |
Consolidated Statements of Comprehensive Income (Loss) – For the Years Ended December 31, 2016, December 31, 2015, and December 31, 2014 | |
Consolidated Statements of Shareholders’ Equity – For the Years Ended December 31, 2016, December 31, 2015, and December 31, 2014 | |
Consolidated Statements of Cash Flows – For the Years Ended December 31, 2016, December 31, 2015, and December 31, 2014 | |
Notes to the Consolidated Financial Statements | |
Report of Independent Registered Public Accounting Firm
Board of Directors and Stockholders
Dynex Capital, Inc.
Glen Allen, Virginia
We have audited the accompanying consolidated balance sheets of Dynex Capital, Inc. as of December 31, 2016 and 2015 and the related consolidated statements of comprehensive income (loss), shareholders’ equity, and cash flows for each of the three years in the period ended December 31, 2016. These financial statements are the responsibility of the Company’s management. Our responsibility is to express an opinion on these financial statements based on our audits.
We conducted our audits in accordance with the standards of the Public Company Accounting Oversight Board (United States). Those standards require that we plan and perform the audit to obtain reasonable assurance about whether the financial statements are free of material misstatement. An audit also includes examining, on a test basis, evidence supporting the amounts and disclosures in the financial statements, assessing the accounting principles used and significant estimates made by management, as well as evaluating the overall financial statement presentation. We believe that our audits provide a reasonable basis for our opinion.
In our opinion, the consolidated financial statements referred to above present fairly, in all material respects, the financial position of Dynex Capital, Inc. at December 31, 2016 and 2015, and the results of its operations and its cash flows for each of the three years in the period ended December 31, 2016, in conformity with accounting principles generally accepted in the United States of America.
We also have audited, in accordance with the standards of the Public Company Accounting Oversight Board (United States), Dynex Capital, Inc.'s internal control over financial reporting as of December 31, 2016, based on criteria established in Internal Control - Integrated Framework (2013) issued by the Committee of Sponsoring Organizations of the Treadway Commission (COSO) and our report dated March 15, 2017 expressed an unqualified opinion thereon.
/s/ BDO USA, LLP
Richmond, Virginia
March 15, 2017
F-3
Report of Independent Registered Public Accounting Firm
Board of Directors and Stockholders
Dynex Capital, Inc.
Glen Allen, VA
We have audited Dynex Capital, Inc.’s internal control over financial reporting as of December 31, 2016, based on criteria established in Internal Control - Integrated Framework (2013) issued by the Committee of Sponsoring Organizations of the Treadway Commission (the COSO criteria). Dynex Capital, Inc.’s management is responsible for maintaining effective internal control over financial reporting and for its assessment of the effectiveness of internal control over financial reporting, included in the accompanying Item 9A, Management’s Report on Internal Control Over Financial Reporting. Our responsibility is to express an opinion on the company’s internal control over financial reporting based on our audit.
We conducted our audit in accordance with the standards of the Public Company Accounting Oversight Board (United States). Those standards require that we plan and perform the audit to obtain reasonable assurance about whether effective internal control over financial reporting was maintained in all material respects. Our audit included obtaining an understanding of internal control over financial reporting, assessing the risk that a material weakness exists, and testing and evaluating the design and operating effectiveness of internal control based on the assessed risk. Our audit also included performing such other procedures as we considered necessary in the circumstances. We believe that our audit provides a reasonable basis for our opinion.
A company’s internal control over financial reporting is a process designed to provide reasonable assurance regarding the reliability of financial reporting and the preparation of financial statements for external purposes in accordance with generally accepted accounting principles. A company’s internal control over financial reporting includes those policies and procedures that (1) pertain to the maintenance of records that, in reasonable detail, accurately and fairly reflect the transactions and dispositions of the assets of the company; (2) provide reasonable assurance that transactions are recorded as necessary to permit preparation of financial statements in accordance with generally accepted accounting principles, and that receipts and expenditures of the company are being made only in accordance with authorizations of management and directors of the company; and (3) provide reasonable assurance regarding prevention or timely detection of unauthorized acquisition, use, or disposition of the company’s assets that could have a material effect on the financial statements.
Because of its inherent limitations, internal control over financial reporting may not prevent or detect misstatements. Also, projections of any evaluation of effectiveness to future periods are subject to the risk that controls may become inadequate because of changes in conditions, or that the degree of compliance with the policies or procedures may deteriorate.
In our opinion, Dynex Capital, Inc. maintained, in all material respects, effective internal control over financial reporting as of December 31, 2016, based on the COSO criteria.
We also have audited, in accordance with the standards of the Public Company Accounting Oversight Board (United States), the consolidated balance sheets of Dynex Capital, Inc. as of December 31, 2016 and 2015, and the related consolidated statements of comprehensive income (loss), shareholders’ equity, and cash flows for each of the three years in the period ended December 31, 2016 and our report dated March 15, 2017 expressed an unqualified opinion thereon.
/s/ BDO USA, LLP
Richmond, Virginia
March 15, 2017
F-4
DYNEX CAPITAL, INC.
CONSOLIDATED BALANCE SHEETS
($ in thousands except share data)
December 31, 2016 | December 31, 2015 | ||||||
ASSETS | |||||||
Mortgage-backed securities (including pledged of $3,150,610 and $3,361,635, respectively) | $ | 3,212,084 | $ | 3,493,701 | |||
Mortgage loans held for investment, net | 19,036 | 24,145 | |||||
Investment in limited partnership | — | 10,835 | |||||
Investment in FHLB stock | 9 | 11,475 | |||||
Cash and cash equivalents | 74,120 | 33,935 | |||||
Restricted cash | 24,769 | 51,190 | |||||
Derivative assets | 28,534 | 7,835 | |||||
Principal receivable on investments | 11,978 | 6,193 | |||||
Accrued interest receivable | 20,396 | 22,764 | |||||
Other assets, net | 6,805 | 7,975 | |||||
Total assets | $ | 3,397,731 | $ | 3,670,048 | |||
LIABILITIES AND SHAREHOLDERS’ EQUITY | |||||||
Liabilities: | |||||||
Repurchase agreements | $ | 2,898,952 | $ | 2,589,420 | |||
FHLB advances | — | 520,000 | |||||
Non-recourse collateralized financing | 6,440 | 8,442 | |||||
Derivative liabilities | 6,922 | 41,205 | |||||
Accrued interest payable | 3,156 | 1,743 | |||||
Accrued dividends payable | 12,268 | 13,709 | |||||
Other liabilities | 2,809 | 3,504 | |||||
Total liabilities | 2,930,547 | 3,178,023 | |||||
Shareholders’ equity: | |||||||
Preferred stock, par value $.01 per share; 50,000,000 shares authorized; 4,571,937 and 4,550,000 shares issued and outstanding, respectively ($114,298 and $113,750 aggregate liquidation preference, respectively) | $ | 110,005 | $ | 109,658 | |||
Common stock, par value $.01 per share, 200,000,000 shares authorized; 49,153,463 and 49,047,335 shares issued and outstanding, respectively | 492 | 490 | |||||
Additional paid-in capital | 727,369 | 725,358 | |||||
Accumulated other comprehensive loss | (32,609 | ) | (12,768 | ) | |||
Accumulated deficit | (338,073 | ) | (330,713 | ) | |||
Total shareholders' equity | 467,184 | 492,025 | |||||
Total liabilities and shareholders’ equity | $ | 3,397,731 | $ | 3,670,048 | |||
See notes to the consolidated financial statements.
F-5
DYNEX CAPITAL, INC.
CONSOLIDATED STATEMENTS OF COMPREHENSIVE INCOME (LOSS)
(amounts in thousands except per share data)
Year Ended | |||||||||||
December 31, | |||||||||||
2016 | 2015 | 2014 | |||||||||
Interest income | $ | 91,898 | 100,244 | $ | 105,644 | ||||||
Interest expense | 25,231 | 22,605 | 25,915 | ||||||||
Net interest income | 66,667 | 77,639 | 79,729 | ||||||||
Loss on derivative instruments, net | (5,606 | ) | (43,128 | ) | (53,393 | ) | |||||
(Loss) gain on sale of investments, net | (4,238 | ) | (978 | ) | 16,223 | ||||||
Fair value adjustments, net | 103 | 69 | 208 | ||||||||
Other income, net | 880 | 610 | 1,046 | ||||||||
General and administrative expenses: | |||||||||||
Compensation and benefits | (7,550 | ) | (9,103 | ) | (9,509 | ) | |||||
Other general and administrative | (7,157 | ) | (8,565 | ) | (6,498 | ) | |||||
Net income | 43,099 | 16,544 | 27,806 | ||||||||
Preferred stock dividends | (9,185 | ) | (9,176 | ) | (9,176 | ) | |||||
Net income to common shareholders | $ | 33,914 | $ | 7,368 | $ | 18,630 | |||||
Other comprehensive income: | |||||||||||
Change in net unrealized gain on available-for-sale investments | $ | (23,828 | ) | $ | (38,561 | ) | $ | 64,567 | |||
Reclassification adjustment for loss (gain) on sale of investments, net | 4,238 | 978 | (16,223 | ) | |||||||
Reclassification adjustment for de-designated cash flow hedges | (251 | ) | 3,499 | 6,788 | |||||||
Total other comprehensive (loss) income | (19,841 | ) | (34,084 | ) | 55,132 | ||||||
Comprehensive income (loss) to common shareholders | $ | 14,073 | $ | (26,716 | ) | $ | 73,762 | ||||
Net income per common share-basic and diluted | $ | 0.69 | $ | 0.14 | $ | 0.34 | |||||
Weighted average common shares-basic and diluted | 49,114 | 52,847 | 54,701 | ||||||||
See notes to the consolidated financial statements.
F-6
DYNEX CAPITAL, INC.
CONSOLIDATED STATEMENTS OF SHAREHOLDERS’ EQUITY
($ in thousands)
Preferred Stock | Common Stock | Additional Paid-in Capital | Accumulated Other Comprehensive (Loss) Income | Accumulated Deficit | Total Shareholders' Equity | ||||||||||||||||||||||
Shares | Amount | Shares | Amount | ||||||||||||||||||||||||
Balance as of December 31, 2013 | 4,550,000 | $ | 109,658 | 54,310,484 | $ | 543 | $ | 761,550 | $ | (33,816 | ) | $ | (252,059 | ) | $ | 585,876 | |||||||||||
Stock issuance | — | — | 16,753 | 1 | 251 | — | — | 252 | |||||||||||||||||||
Restricted stock granted, net of amortization | — | — | 471,210 | 4 | 2,715 | — | — | 2,719 | |||||||||||||||||||
Adjustments for tax withholding on share-based compensation | — | — | (59,336 | ) | (1 | ) | (506 | ) | — | — | (507 | ) | |||||||||||||||
Stock issuance costs | — | — | — | — | (75 | ) | — | — | (75 | ) | |||||||||||||||||
Net income | — | — | — | — | — | — | 27,806 | 27,806 | |||||||||||||||||||
Dividends on preferred stock | — | — | — | — | — | — | (9,176 | ) | (9,176 | ) | |||||||||||||||||
Dividends on common stock | — | — | — | — | — | — | (54,725 | ) | (54,725 | ) | |||||||||||||||||
Other comprehensive income | — | — | — | — | — | 55,132 | — | 55,132 | |||||||||||||||||||
Balance as of December 31, 2014 | 4,550,000 | $ | 109,658 | 54,739,111 | $ | 547 | $ | 763,935 | $ | 21,316 | $ | (288,154 | ) | $ | 607,302 | ||||||||||||
Stock issuance | — | — | 22,607 | — | 166 | — | — | 166 | |||||||||||||||||||
Restricted stock granted, net of amortization | — | — | 263,829 | 3 | 2,962 | — | — | 2,965 | |||||||||||||||||||
Adjustments for tax withholding on share-based compensation | — | — | (67,296 | ) | (1 | ) | (556 | ) | — | — | (557 | ) | |||||||||||||||
Stock issuance costs | — | — | — | — | (37 | ) | — | — | (37 | ) | |||||||||||||||||
Common stock repurchased | — | — | (5,910,916 | ) | (59 | ) | (41,112 | ) | — | — | (41,171 | ) | |||||||||||||||
Net income | — | — | — | — | — | — | 16,544 | 16,544 | |||||||||||||||||||
Dividends on preferred stock | — | — | — | — | — | — | (9,176 | ) | (9,176 | ) | |||||||||||||||||
Dividends on common stock | — | — | — | — | — | — | (49,927 | ) | (49,927 | ) | |||||||||||||||||
Other comprehensive loss | — | — | — | — | — | (34,084 | ) | — | (34,084 | ) | |||||||||||||||||
Balance as of December 31, 2015 | 4,550,000 | $ | 109,658 | 49,047,335 | $ | 490 | $ | 725,358 | $ | (12,768 | ) | $ | (330,713 | ) | $ | 492,025 | |||||||||||
Stock issuance | 21,937 | 548 | 20,582 | 1 | 136 | — | — | 685 | |||||||||||||||||||
Restricted stock granted, net of amortization | — | — | 214,878 | 2 | 2,707 | — | — | 2,709 | |||||||||||||||||||
Adjustments for tax withholding on share-based compensation | — | — | (80,888 | ) | (1 | ) | (484 | ) | — | — | (485 | ) | |||||||||||||||
Stock issuance costs | — | (201 | ) | — | — | (38 | ) | — | — | (239 | ) | ||||||||||||||||
Common stock repurchased | — | — | (48,444 | ) | — | (310 | ) | — | — | (310 | ) | ||||||||||||||||
Net income | — | — | — | — | — | — | 43,099 | 43,099 | |||||||||||||||||||
Dividends on preferred stock | — | — | — | — | — | — | (9,185 | ) | (9,185 | ) | |||||||||||||||||
Dividends on common stock | — | — | — | — | — | — | (41,274 | ) | (41,274 | ) | |||||||||||||||||
F-7
Other comprehensive loss | — | — | — | — | — | (19,841 | ) | — | (19,841 | ) | |||||||||||||||||
Balance as of December 31, 2016 | 4,571,937 | $ | 110,005 | 49,153,463 | $ | 492 | $ | 727,369 | $ | (32,609 | ) | $ | (338,073 | ) | $ | 467,184 | |||||||||||
F-8
DYNEX CAPITAL, INC.
CONSOLIDATED STATEMENTS OF CASH FLOWS
($ in thousands)
Year Ended | |||||||||||
December 31, | |||||||||||
2016 | 2015 | 2014 | |||||||||
Operating activities: | |||||||||||
Net income | $ | 43,099 | $ | 16,544 | $ | 27,806 | |||||
Adjustments to reconcile net income to cash provided by operating activities: | |||||||||||
Decrease (increase) in accrued interest receivable | 2,368 | (1,607 | ) | 546 | |||||||
Increase (decrease) in accrued interest payable | 1,413 | (204 | ) | (600 | ) | ||||||
Loss on derivative instruments, net | 5,606 | 43,128 | 53,393 | ||||||||
Loss (gain) on sale of investments, net | 4,238 | 978 | (16,223 | ) | |||||||
Fair value adjustments, net | (103 | ) | (69 | ) | (208 | ) | |||||
Amortization of investment premiums, net | 150,729 | 152,308 | 137,837 | ||||||||
Other amortization and depreciation, net | 1,502 | 5,338 | 8,900 | ||||||||
Stock-based compensation expense | 2,709 | 2,965 | 2,719 | ||||||||
Other operating activities | (1,047 | ) | (2,430 | ) | 306 | ||||||
Net cash and cash equivalents provided by operating activities | 210,514 | 216,951 | 214,476 | ||||||||
Investing activities: | |||||||||||
Purchase of investments | (435,046 | ) | (1,122,970 | ) | (599,381 | ) | |||||
Principal payments received on investments | 448,567 | 494,275 | 518,303 | ||||||||
Proceeds from sales of investments | 99,284 | 449,921 | 503,918 | ||||||||
Principal payments received on mortgage loans held for investment, net | 4,953 | 15,570 | 16,787 | ||||||||
Payment to acquire interest in limited partnership | — | (6,000 | ) | (4,000 | ) | ||||||
Distributions received from limited partnership | 10,835 | — | — | ||||||||
Net payments on derivatives, including terminations | (60,588 | ) | (39,929 | ) | (11,415 | ) | |||||
Other investing activities | (37 | ) | (237 | ) | (7 | ) | |||||
Net cash and cash equivalents provided by (used in) investing activities | 67,968 | (209,370 | ) | 424,205 | |||||||
Financing activities: | |||||||||||
Borrowings under repurchase agreements and FHLB advances | 40,594,639 | 23,555,007 | 22,547,991 | ||||||||
Repayments of repurchase agreement borrowings and FHLB advances | (40,805,107 | ) | (23,458,697 | ) | (23,115,878 | ) | |||||
Principal payments on non-recourse collateralized financing | (2,039 | ) | (2,395 | ) | (2,167 | ) | |||||
Decrease (increase) in restricted cash | 26,421 | (8,927 | ) | (28,878 | ) | ||||||
Proceeds from issuance of preferred stock | 548 | — | — | ||||||||
Proceeds from issuance of common stock | 137 | 166 | 252 | ||||||||
Cash paid for stock issuance costs | (201 | ) | — | — | |||||||
Cash paid for repurchases of common stock | (310 | ) | (41,171 | ) | — | ||||||
Payments related to tax withholding for stock-based compensation | (485 | ) | (557 | ) | (507 | ) | |||||
Dividends paid | (51,900 | ) | (61,016 | ) | (64,880 | ) | |||||
Net cash and cash equivalents used in financing activities | (238,297 | ) | (17,590 | ) | (664,067 | ) | |||||
Net increase (decrease) in cash and cash equivalents | 40,185 | (10,009 | ) | (25,386 | ) | ||||||
Cash and cash equivalents at beginning of period | 33,935 | 43,944 | 69,330 | ||||||||
Cash and cash equivalents at end of period | $ | 74,120 | $ | 33,935 | $ | 43,944 | |||||
Supplemental Disclosure of Cash Activity: | |||||||||||
Cash paid for interest | $ | 24,033 | $ | 19,260 | $ | 19,445 | |||||
See notes to the consolidated financial statements.
F-9
NOTES TO THE CONSOLIDATED FINANCIAL STATEMENTS
DYNEX CAPITAL, INC.
($ in thousands except share and per share data)
NOTE 1 –ORGANIZATION AND SUMMARY OF SIGNIFICANT ACCOUNTING POLICIES
Organization
Dynex Capital, Inc., ("Company”) was incorporated in the Commonwealth of Virginia on December 18, 1987 and commenced operations in February 1988. The Company primarily earns income from investing on a leveraged basis in mortgage-backed securities ("MBS") that are issued or guaranteed by the U.S. Government or U.S. Government sponsored agencies ("Agency MBS") and MBS issued by others ("non-Agency MBS").
Basis of Presentation
The accompanying consolidated financial statements of Dynex Capital, Inc. and its subsidiaries (together, “Dynex” or, as appropriate, the “Company”) have been prepared in accordance with U.S. generally accepted accounting principles (“GAAP”) the instructions to the Annual Report on Form 10-K and Article 3 of Regulation S-X promulgated by the Securities and Exchange Commission (the “SEC”).
Reclassifications
Certain items in the prior periods' consolidated financial statements have been reclassified to conform to the current period's presentation. The Company's equity in income of limited partnership for the year ended December 31, 2015 is now included within "other income, net" on the Company's consolidated statements of comprehensive income (loss). The Company has reclassified amortization of stock issuance costs which was previously recorded in "proceeds from issuance of common stock, net of issuance costs" in the financing activities section of the Company's consolidated statements of cash flows for the years ended December 31, 2015 and December 31, 2014. Amortization of stock issuance costs is now presented within "other operating activities" in the operating activities section of the Company's consolidated statements of cash flows. These presentation changes have no effect on reported financial condition or results of operations, and did not have a material impact on cash flows from operating or financing activities.
Consolidation
The consolidated financial statements include the accounts of the Company and the accounts of its majority owned subsidiaries and variable interest entities ("VIE") for which it is the primary beneficiary. As a primary beneficiary, the Company has both the power to direct the activities that most significantly impact the economic performance of the VIE and a right to receive benefits or absorb losses of the entity that could be potentially significant to the VIE. The Company is required to reconsider its evaluation of whether to consolidate a VIE each reporting period, based upon changes in the facts and circumstances pertaining to the VIE. The Company consolidates certain trusts through which it has securitized mortgage loans as a result of not meeting the sale criteria under GAAP at the time the financial assets were transferred to the trust. All intercompany accounts and transactions have been eliminated in consolidation.
Use of Estimates
The preparation of financial statements in conformity with GAAP requires management to make estimates and assumptions that affect the reported amounts of assets and liabilities and the disclosure of contingent assets and liabilities at the date of the financial statements as well as the reported amounts of revenue and expenses during the reported period. Actual results could differ from those estimates. The most significant estimates used by management include, but are not limited to, amortization of premiums and discounts, fair value measurements of its investments, and other-than-temporary impairments. These items are discussed further below within this note to the consolidated financial statements.
F-10
NOTES TO THE CONSOLIDATED FINANCIAL STATEMENTS
DYNEX CAPITAL, INC.
($ in thousands except share and per share data)
Income Taxes
The Company has elected to be taxed as a real estate investment trust ("REIT") under the Internal Revenue Code of 1986 and the corresponding provisions of state law. To qualify as a REIT, the Company must meet certain tests including investing in primarily real estate-related assets and the required distribution of at least 90% of its annual REIT taxable income to stockholders after consideration of its net operating loss ("NOL") carryforward and not including taxable income retained in its taxable subsidiaries. As a REIT, the Company generally will not be subject to federal income tax on the amount of its income or capital gains that is distributed as dividends to shareholders.
The Company assesses its tax positions for all open tax years and determines whether the Company has any material unrecognized liabilities in accordance with Accounting Standards Codification ("ASC") Topic 740. The Company records these liabilities, if any, to the extent they are deemed more likely than not to have been incurred.
Net Income (Loss) Per Common Share
The Company calculates basic net income (loss) per common share by dividing net income (loss) to common shareholders for the period by weighted-average shares of common stock outstanding for that period. The Company did not have any potentially dilutive securities outstanding during the years ended December 31, 2016, December 31, 2015, or December 31, 2014.
Holders of unvested shares of the Company's issued and outstanding restricted common stock are eligible to receive non-forfeitable dividends. As such, these unvested shares are considered participating securities as per ASC Topic 260-10 and therefore are included in the computation of basic net income (loss) per common share using the two-class method. Upon vesting, restrictions on transfer expire on each share of restricted stock, and each such share of restricted stock represents one unrestricted share of common stock.
Because the Company's 8.50% Series A Cumulative Redeemable Preferred Stock (the “Series A Preferred Stock”) and 7.625% Series B Cumulative Redeemable Preferred Stock (the “Series B Preferred Stock”) are redeemable at the Company's option for cash only and may convert into shares of common stock only upon a change of control of the Company, the effect of those shares and their related dividends is excluded from the calculation of diluted net income (loss) per common share.
Cash and Cash Equivalents
Cash and cash equivalents include cash on hand and highly liquid investments with original maturities of three months or less.
Restricted Cash
Restricted cash consists of cash the Company has pledged to cover initial and variation margin with its financing and derivative counterparties.
Mortgage-Backed Securities
The Company invests in Agency and non-Agency RMBS, CMBS and CMBS IO securities, all of which are designated as available-for-sale ("AFS"). All of the Company’s MBS are recorded at fair value on the consolidated balance sheet. Changes in unrealized gain (loss) on the Company's MBS are reported in other comprehensive income ("OCI") until each security is collected, disposed of, or determined to be other than temporarily impaired. Although the Company generally intends to hold its AFS securities until maturity, it may sell any of these securities as part of the overall management of its business. Upon the sale of an AFS security, any unrealized gain or loss is reclassified out of accumulated other comprehensive income ("AOCI") into net income as a realized "gain (loss) on sale of investments, net" using the specific identification method.
The Company’s MBS pledged as collateral against repurchase agreements and derivative instruments are included in MBS on the consolidated balance sheets with the fair value of the MBS pledged disclosed parenthetically.
F-11
NOTES TO THE CONSOLIDATED FINANCIAL STATEMENTS
DYNEX CAPITAL, INC.
($ in thousands except share and per share data)
Interest Income, Premium Amortization, and Discount Accretion. Interest income on MBS is accrued based on the outstanding principal balance (or notional balance in the case of interest-only, or "IO", securities) and their contractual terms. Premiums and discounts on Agency MBS as well as any non-Agency MBS rated 'AA' and higher at the time of purchase are amortized into interest income over the expected life of such securities using the effective yield method and adjustments to premium amortization are made for actual cash payments as well as changes in projected future cash payments. The Company's projections of future cash payments are based on input and analysis received from external sources and internal models, and include assumptions about the amount and timing of loan prepayment rates, fluctuations in interest rates, credit losses, and other factors. On at least a quarterly basis, the Company reviews and makes any necessary adjustments to its cash flow projections and updates the yield recognized on these assets.
The Company holds certain non-Agency MBS that had credit ratings of less than 'AA' at the time of purchase or were not rated by any of the nationally recognized credit rating agencies. A portion of these non-Agency MBS were purchased at discounts to their par value, which management does not believe to be substantial. The discount is accreted into income over the security's expected life, which reflects management's estimate of the security's projected cash flows. Future changes in the timing of projected cash flows or differences arising between projected cash flows and actual cash flows received may result in a prospective change in the effective yield on those securities.
Determination of MBS Fair Value. The Company estimates the fair value of the majority of its MBS based upon prices obtained from third-party pricing services and broker quotes. The remainder of the Company's MBS are valued by discounting the estimated future cash flows derived from cash flow models that utilize information such as the security's coupon rate, estimated prepayment speeds, expected weighted average life, collateral composition, estimated future interest rates, expected losses, and credit enhancements as well as certain other relevant information. Refer to Note 7 for further discussion of MBS fair value measurements.
Other-than-Temporary Impairment. MBS is considered impaired when its fair value is less than its amortized cost. The Company evaluates all of its impaired MBS for other-than-temporary impairments ("OTTI") on at least a quarterly basis. An impairment is considered other-than-temporary if: (1) the Company intends to sell the MBS; (2) it is more likely than not that the Company will be required to sell the MBS before its fair value recovers; or (3) the Company does not expect to recover the full amortized cost basis of the MBS. If either of the first two conditions is met, the entire amount of the impairment is recognized in earnings. If the impairment is solely due to the inability to fully recover the amortized cost basis, the security is further analyzed to quantify any credit loss, which is the difference between the present value of cash flows expected to be collected on the MBS and its amortized cost. The credit loss, if any, is then recognized in earnings, while the balance of impairment related to other factors is recognized in other comprehensive income.
Following the recognition of an OTTI through earnings, a new cost basis is established for the security. Any subsequent recoveries in fair value may be accreted back into the amortized cost basis of the MBS on a prospective basis through interest income. Please see Note 2 for additional information related to the Company's evaluation for OTTI.
Secured Borrowings
The Company's repurchase agreements which are used to finance its purchases of MBS, are accounted for, and Federal Home Loan Bank (or "FHLB") advances, which were previously used to finance the Company’s purchase of MBS, were accounted for as secured borrowings under which the Company pledges its securities as collateral to secure a loan, which is equal in value to a specified percentage of the estimated fair value of the pledged collateral. The Company retains beneficial ownership of the pledged collateral. At the maturity of a repurchase agreement, the Company is required to repay the loan and concurrently receives back its pledged collateral from the lender or, with the consent of the lender, the Company may renew the agreement at the then prevailing financing rate. A repurchase agreement lender may require the Company to pledge additional collateral in the event of a decline in the fair value of the collateral pledged. Repurchase agreement financing is recourse to the Company and the assets pledged. Most of the Company’s repurchase agreements are based on the September 1996 version of the Bond Market Association Master Repurchase Agreement, which generally provides that the lender, as buyer, is responsible for obtaining collateral valuations from a generally recognized source agreed to by both the Company and the lender, or, in an instance when such source is not available, the value determination is made by the lender.
F-12
NOTES TO THE CONSOLIDATED FINANCIAL STATEMENTS
DYNEX CAPITAL, INC.
($ in thousands except share and per share data)
Derivative Instruments
The Company's derivative instruments are accounted for at fair value. Derivative instruments in a gain position are reported as derivative assets and derivative instruments in a loss position are reported as derivative liabilities on the Company's consolidated balance sheet. All periodic interest costs and changes in fair value of derivative instruments, including gains and losses realized upon termination or maturity, are recorded in "gain (loss) on derivative instruments, net" on the Company's consolidated statement of comprehensive income. Cash receipts and payments related to derivative instruments are classified in the investing activities section of our consolidated statements of cash flows in accordance with the underlying nature or purpose of the derivative transactions. Please refer to Note 5 for additional information regarding the Company's accounting for its derivative instruments.
Although MBS have characteristics that meet the definition of a derivative instrument, ASC Topic 815 specifically excludes these instruments from its scope because they are accounted for as debt securities under ASC Topic 320.
Share-Based Compensation
Pursuant to the Company’s 2009 Stock and Incentive Plan, the Company may grant share-based compensation to eligible employees, directors or consultants or advisers to the Company, including stock awards, stock options, stock appreciation rights, dividend equivalent rights, performance shares, and restricted stock units. The Company's restricted stock currently issued and outstanding under this plan may be settled only in shares of its common stock, and therefore are treated as equity awards with their fair value measured at the grant date and recognized as compensation cost over the requisite service period with a corresponding credit to shareholders' equity. The requisite service period is the period during which an employee is required to provide service in exchange for an award, which is equivalent to the vesting period specified in the terms of the time-based restricted stock award. None of the Company's restricted stock awards have performance based conditions. The Company does not currently have any share-based compensation issued or outstanding other than restricted stock.
Recent Accounting Pronouncements
The Financial Accounting Standards Board ("FASB") issued Accounting Standards Update ("ASU") No. 2014-09, Revenue from Contracts with Customers, which is a comprehensive revenue recognition standard that supersedes virtually all existing revenue guidance under U.S. GAAP. The standard’s core principle is that an entity will recognize revenue when it transfers promised goods or services to customers in an amount that reflects the consideration to which the entity expects to be entitled in exchange for those goods and services. Revenue recognition with respect to financial instruments is not within the scope of ASU 2014-09, and, therefore, the Company does not expect this ASU will have a material impact on its consolidated financial statements. The Company will continue to assess the impact of ASU 2014-09, which is effective on January 1, 2018.
The FASB issued ASU No. 2016-02, Leases, which includes the following amendments:
• | for operating and finance leases, a lessee is required to recognize a right-of-use asset and a lease liability, initially measured at the present value of the lease payments in its consolidated balance sheet; |
• | for finance leases, a lessee is required to recognize interest on the lease liability separately from amortization of the right-of-use asset in the statement of comprehensive income; |
• | for finance leases, a lessee is required to classify repayments of the principal portion of the lease liability within financing activities and payments of interest on the lease liability and variable lease payments within operating activities in the statement of cash flows; |
• | for operating leases, a lessee is required to recognize a single lease cost, calculated so that the cost of the lease is allocated over the lease term on a generally straight-line basis in the statement of comprehensive income; and |
• | for operating leases, a lessee is required to classify all cash payments within operating activities in the statement of cash flows. |
Under the new guidance, lessor accounting is largely unchanged. ASU No. 2016-02 is effective for public companies for fiscal years beginning after December 15, 2018, and early adoption is permitted. The Company does not expect this ASU to have a
F-13
NOTES TO THE CONSOLIDATED FINANCIAL STATEMENTS
DYNEX CAPITAL, INC.
($ in thousands except share and per share data)
material impact on the Company's consolidated financial statements because the Company does not currently have any material lease agreements.
The FASB issued ASU No. 2016-09, Compensation - Stock Compensation, which simplifies several aspects of the accounting for share-based payment award transactions, including income tax consequences, classification of awards as either equity or liabilities, and classification on the statement cash flows. The amendments are effective for public companies for fiscal years beginning after December 15, 2016, and early adoption is permitted. The Company has adopted the amendments in this ASU, and it did not have a material impact on the Company's consolidated financial statements.
The FASB issued ASU No. 2016-13, Financial Instruments - Credit Losses, which replaces the incurred loss impairment methodology in current GAAP with a methodology that reflects expected credit losses and requires consideration of a broader range of reasonable and supportable information to inform credit loss estimates. For assets measured at amortized cost, the amendments in this ASU eliminate the probable initial recognition threshold in current GAAP and broaden the information that an entity must consider in developing its expected credit loss estimate to include the use of forecasted information. For assets classified as available-for-sale with changes in fair value recorded in other comprehensive income, measurement of credit losses will be similar to current GAAP. However, the amendments in this ASU require that credit losses be presented as an allowance rather than as a write-down, which is referred to in current GAAP as an other-than-temporary impairment. An entity will be able to record reversals of credit losses, if credit loss estimates decline, in net income for the current period. The amendments in this ASU will not permit an entity to use the length of time a debt security has been in an unrealized loss position to avoid recording a credit loss and removes the requirements to consider historical and implied volatility of the fair value of a security as well as recoveries or declines in fair value after the balance sheet date. The amendments in this ASU will affect an entity by varying degrees depending on the credit quality of the assets held by the entity, their duration, and how the entity applies current GAAP. These amendments will become effective for fiscal years beginning after December 15, 2019, including interim periods within those fiscal years, and early adoption will be permitted as of the fiscal years beginning after December 15, 2018, including interim periods within those fiscal years. An entity will apply the amendments in this ASU through a cumulative-effect adjustment to retained earnings as of the beginning of the first reporting period in which the guidance is effective. Based on the credit quality of the Company's investments as of December 31, 2016, the Company does not currently anticipate this ASU having a material impact on its consolidated financial statements. The Company continuously monitors for credit losses on its investments and will adopt the changes in this ASU as deemed applicable in the future.
The FASB issued ASU No. 2016-15, Statement of Cash Flows (Topic 230) - Classification of Certain Cash Receipts and Cash Payments, in order to provide guidance for eight cash flow classification issues which are either unclear or do not have specific guidance under current GAAP. The issues identified are as follows:
• | debt prepayment or debt extinguishment costs; |
• | settlement of zero-coupon debt instruments or other debt instruments with coupon interest rates insignificant in relation to the effective interest rate of the borrowing; |
• | contingent consideration payments made after a business combination; |
• | proceeds from the settlement of insurance claims; |
• | proceeds from settlement of corporate-owned life insurance policies; |
• | distributions received from equity method investees; |
• | beneficial interests in securitization transactions; and |
• | separately identifiable cash flows and application of the predominance principle. |
The amendments in this ASU will become effective for fiscal years beginning after December 15, 2017, including interim periods within those fiscal years, and early adoption is permitted. The amendments in this ASU should be applied using a retrospective transition method to each period presented. This ASU does not change accounting principles and only impacts presentation requirements on the statement of cash flows. As such, the Company does not expect this ASU to have a material impact on the Company's consolidated financial statements.
The FASB issued ASU No. 2016-18, Statement of Cash Flows (Topic 230) - Restricted Cash, which requires amounts generally described as restricted cash or restricted cash equivalents to be included with cash and cash equivalents when reconciling the beginning of period and end of period total amounts shown on statement of cash flows. This amendment will become effective for fiscal years beginning after December 15, 2017, and interim periods within those fiscal years, and early adoption is permitted.
F-14
NOTES TO THE CONSOLIDATED FINANCIAL STATEMENTS
DYNEX CAPITAL, INC.
($ in thousands except share and per share data)
This ASU does not change accounting principles and only impacts presentation requirements on the statement of cash flows. As such, the Company does not expect this ASU to have a material impact on the Company's consolidated financial statements.
NOTE 2 – MORTGAGE-BACKED SECURITIES
The majority of the Company's MBS are pledged as collateral for the Company's secured borrowings. The following tables present the Company’s MBS by investment type as of the dates indicated:
December 31, 2016 | ||||||||||||||||||||||||||
Par | Net Premium (Discount) | Amortized Cost | Gross Unrealized Gain | Gross Unrealized Loss | Fair Value | WAC (1) | ||||||||||||||||||||
RMBS: | ||||||||||||||||||||||||||
Agency | $ | 1,157,258 | $ | 57,066 | $ | 1,214,324 | $ | 2,832 | $ | (15,951 | ) | $ | 1,201,205 | 3.05 | % | |||||||||||
Non-Agency | 33,572 | (24 | ) | 33,548 | 64 | (50 | ) | 33,562 | 3.58 | % | ||||||||||||||||
1,190,830 | 57,042 | 1,247,872 | 2,896 | (16,001 | ) | 1,234,767 | ||||||||||||||||||||
CMBS: | ||||||||||||||||||||||||||
Agency | 1,152,586 | 13,868 | 1,166,454 | 6,209 | (28,108 | ) | 1,144,555 | 3.12 | % | |||||||||||||||||
Non-Agency | 79,467 | (6,718 | ) | 72,749 | 5,467 | — | 78,216 | 4.72 | % | |||||||||||||||||
1,232,053 | 7,150 | 1,239,203 | 11,676 | (28,108 | ) | 1,222,771 | ||||||||||||||||||||
CMBS IO (2): | ||||||||||||||||||||||||||
Agency | — | 411,737 | 411,737 | 3,523 | (3,362 | ) | 411,898 | 0.67 | % | |||||||||||||||||
Non-Agency | — | 346,155 | 346,155 | 1,548 | (5,055 | ) | 342,648 | 0.61 | % | |||||||||||||||||
— | 757,892 | 757,892 | 5,071 | (8,417 | ) | 754,546 | ||||||||||||||||||||
Total AFS securities: | $ | 2,422,883 | $ | 822,084 | $ | 3,244,967 | $ | 19,643 | $ | (52,526 | ) | $ | 3,212,084 | |||||||||||||
(1) | The weighted average coupon ("WAC") is the gross interest rate of the pool of mortgages underlying the security weighted by the outstanding principal balance (or by notional balance in the case of an IO security). |
(2) | The notional balance for Agency CMBS IO and non-Agency CMBS IO was $13,106,912 and $10,884,964, respectively, as of December 31, 2016. |
F-15
NOTES TO THE CONSOLIDATED FINANCIAL STATEMENTS
DYNEX CAPITAL, INC.
($ in thousands except share and per share data)
December 31, 2015 | ||||||||||||||||||||||||||
Par | Net Premium (Discount) | Amortized Cost | Gross Unrealized Gain | Gross Unrealized Loss | Fair Value | WAC (1) | ||||||||||||||||||||
RMBS: | ||||||||||||||||||||||||||
Agency | $ | 1,536,733 | $ | 77,617 | $ | 1,614,350 | $ | 4,362 | $ | (20,190 | ) | $ | 1,598,522 | 3.03 | % | |||||||||||
Non-Agency | 66,003 | (45 | ) | 65,958 | 70 | (818 | ) | 65,210 | 3.25 | % | ||||||||||||||||
1,602,736 | 77,572 | 1,680,308 | 4,432 | (21,008 | ) | 1,663,732 | ||||||||||||||||||||
CMBS: | ||||||||||||||||||||||||||
Agency | 876,751 | 13,252 | 890,003 | 10,542 | (14,614 | ) | 885,931 | 3.45 | % | |||||||||||||||||
Non-Agency | 156,218 | (8,133 | ) | 148,085 | 7,039 | (941 | ) | 154,183 | 4.29 | % | ||||||||||||||||
1,032,969 | 5,119 | 1,038,088 | 17,581 | (15,555 | ) | 1,040,114 | ||||||||||||||||||||
CMBS IO (2): | ||||||||||||||||||||||||||
Agency | — | 421,857 | 421,857 | 5,922 | (1,651 | ) | 426,128 | 0.80 | % | |||||||||||||||||
Non-Agency | — | 365,554 | 365,554 | 1,992 | (3,819 | ) | 363,727 | 0.71 | % | |||||||||||||||||
— | 787,411 | 787,411 | 7,914 | (5,470 | ) | 789,855 | ||||||||||||||||||||
Total AFS securities: | $ | 2,635,705 | $ | 870,102 | $ | 3,505,807 | $ | 29,927 | $ | (42,033 | ) | $ | 3,493,701 | |||||||||||||
(1) | The weighted average coupon ("WAC") is the gross interest rate of the pool of mortgages underlying the security weighted by the outstanding principal balance (or by notional balance in the case of an IO security). |
(2) | The notional balance for the Agency CMBS IO and non-Agency CMBS IO was $12,180,291 and $10,328,628, respectively, as of December 31, 2015. |
Actual maturities of MBS are affected by the contractual lives of the underlying mortgage collateral, periodic payments of principal, prepayments of principal, and the payment priority structure of the security; therefore, actual maturities are generally shorter than the securities' stated contractual maturities.
The following table presents information regarding the sales included in "(loss) gain on sale of investments, net" on the Company's consolidated statements of comprehensive income (loss) for the periods indicated:
Year Ended | |||||||||||||||||||||||
December 31, | |||||||||||||||||||||||
2016 | 2015 | 2014 | |||||||||||||||||||||
Proceeds Received | Realized Gain (Loss) | Proceeds Received | Realized Gain (Loss) | Proceeds Received | Realized Gain (Loss) | ||||||||||||||||||
Agency RMBS | $ | 54,178 | $ | (3,010 | ) | $ | 174,565 | $ | (2,865 | ) | $ | 137,350 | $ | (5,762 | ) | ||||||||
Agency CMBS | — | — | 149,360 | (604 | ) | — | — | ||||||||||||||||
Non-Agency CMBS | 33,640 | (1,228 | ) | 30,775 | (566 | ) | 245,839 | 19,773 | |||||||||||||||
Agency CMBS IO | — | — | 45,096 | 1,698 | 107,635 | 1,630 | |||||||||||||||||
Non-Agency CMBS IO | — | — | 50,125 | 1,359 | 13,094 | 582 | |||||||||||||||||
$ | 87,818 | $ | (4,238 | ) | $ | 449,921 | $ | (978 | ) | $ | 503,918 | $ | 16,223 | ||||||||||
F-16
NOTES TO THE CONSOLIDATED FINANCIAL STATEMENTS
DYNEX CAPITAL, INC.
($ in thousands except share and per share data)
The following table presents certain information for those MBS in an unrealized loss position as of the dates indicated:
December 31, 2016 | December 31, 2015 | ||||||||||||||||||
Fair Value | Gross Unrealized Losses | # of Securities | Fair Value | Gross Unrealized Losses | # of Securities | ||||||||||||||
Continuous unrealized loss position for less than 12 months: | |||||||||||||||||||
Agency MBS | $ | 1,738,094 | $ | (38,469 | ) | 133 | $ | 1,332,849 | $ | (19,062 | ) | 109 | |||||||
Non-Agency MBS | 205,484 | (2,773 | ) | 48 | 351,650 | (5,347 | ) | 72 | |||||||||||
Continuous unrealized loss position for 12 months or longer: | |||||||||||||||||||
Agency MBS | $ | 427,405 | $ | (8,952 | ) | 72 | $ | 775,484 | $ | (17,393 | ) | 72 | |||||||
Non-Agency MBS | 81,660 | (2,332 | ) | 26 | 8,306 | (231 | ) | 7 | |||||||||||
Because the principal related to Agency MBS is guaranteed by the government-sponsored entities Fannie Mae and Freddie Mac which have the implicit guarantee of the U.S. government, the Company does not consider any of the unrealized losses on its Agency MBS to be credit related. Although the unrealized losses are not credit related, the Company assesses its ability and intent to hold any Agency MBS with an unrealized loss until the recovery in its value. This assessment is based on the amount of the unrealized loss and significance of the related investment as well as the Company’s current leverage and anticipated liquidity. Based on this analysis, the Company has determined that the unrealized losses on its Agency MBS as of December 31, 2016 and December 31, 2015 were temporary.
The Company reviews any non-Agency MBS in an unrealized loss position to evaluate whether any decline in fair value represents an OTTI. The evaluation includes a review of the credit ratings of these non-Agency MBS and the seasoning of the mortgage loans collateralizing these securities as well as the estimated future cash flows which include projected losses. The Company performed this evaluation for the non-Agency MBS in an unrealized loss position and has determined that there have not been any adverse changes in the timing or amount of estimated future cash flows that necessitate a recognition of OTTI amounts as of December 31, 2016 or December 31, 2015.
NOTE 3 – MORTGAGE LOANS HELD FOR INVESTMENT, NET AND RELATED NON-RECOURSE COLLATERALIZED FINANCING
The majority of the Company's mortgage loans held for investment, net are securitized single-family mortgage loans which were originated or purchased by the Company from 1992 through 1998 and reported at an amortized cost of $19,317 as of December 31, 2016 compared to $24,337 as of December 31, 2015. The unpaid principal balance of the Company's single-family mortgage loans identified as seriously delinquent as of December 31, 2016 was $1,094 compared to $1,343 as of December 31, 2015. The Company continues to accrue interest on its seriously delinquent securitized single-family mortgage loans because the primary servicer continues to advance the interest and/or principal due on the loan.
An allowance has been established for currently existing and probable losses on the Company's mortgage loans held for investment, which was $281 as of December 31, 2016 compared to $192 as of December 31, 2015. The Company's single-family mortgage loans are considered homogeneous and are evaluated on a pool basis for a general allowance. The Company considers various factors in determining its general allowance requirement, including whether a loan is delinquent, the Company’s historical experience with similar types of loans, historical cure rates of delinquent loans, and historical and anticipated loss severity of the mortgage loans as they are liquidated. The allowance for loan losses is evaluated and adjusted periodically by management based on the actual and estimated timing and amount of probable credit losses, using the above factors, as well as industry loss experience. The Company recorded $130, $180, and $0 as provision for loan losses for the years ended December 31, 2016, 2015, and 2014, respectively, which is included within "other income, net" on the Company's consolidated statements of comprehensive income (loss).
F-17
NOTES TO THE CONSOLIDATED FINANCIAL STATEMENTS
DYNEX CAPITAL, INC.
($ in thousands except share and per share data)
The majority of the Company's mortgage loans held for investment, net are pledged as collateral for the one remaining class of the Company's single-family securitization financing bond, which is recorded on the Company's balance sheet as "non-recourse collateralized financing". The interest rate on this bond is based on 1-month LIBOR plus 0.30% and is expected to mature on January 31, 2025 based on scheduled principal payments projected as of December 31, 2016. As of December 31, 2016, $7,200 of the principal balance of the single-family mortgage loans held for investment was pledged as collateral for the Company's non-recourse collateralized financing which had a remaining principal balance of $6,533. As of December 31, 2015, $9,220 of the principal balance of the Company's mortgage loans held for investment was pledged as collateral for the remaining principal balance of the outstanding bonds of $8,573.
NOTE 4 – SECURED BORROWINGS
The Company’s secured borrowings that were outstanding as of December 31, 2016 and December 31, 2015 are summarized in the following tables:
December 31, 2016 | |||||||||||
Collateral Type | Balance | Weighted Average Rate | Fair Value of Collateral Pledged | ||||||||
Agency RMBS | $ | 1,157,302 | 0.82 | % | $ | 1,191,147 | |||||
Non-Agency RMBS | 26,149 | 1.98 | % | 31,952 | |||||||
Agency CMBS | 1,005,726 | 0.82 | % | 1,095,002 | |||||||
Non-Agency CMBS | 66,881 | 1.63 | % | 77,840 | |||||||
Agency CMBS IO | 346,892 | 1.57 | % | 407,481 | |||||||
Non-Agency CMBS IO | 291,199 | 1.67 | % | 341,139 | |||||||
Securitization financing bond | 4,803 | 2.00 | % | 5,278 | |||||||
Total repurchase agreements | $ | 2,898,952 | 1.03 | % | $ | 3,149,839 | |||||
FHLB advances | — | — | % | — | |||||||
Total secured borrowings | $ | 2,898,952 | 1.03 | % | $ | 3,149,839 | |||||
December 31, 2015 | |||||||||||
Collateral Type | Balance | Weighted Average Rate | Fair Value of Collateral Pledged | ||||||||
Agency RMBS | $ | 1,439,436 | 0.47 | % | $ | 1,483,152 | |||||
Non-Agency RMBS | 52,128 | 1.77 | % | 64,286 | |||||||
Agency CMBS | 301,427 | 0.49 | % | 345,728 | |||||||
Non-Agency CMBS | 126,378 | 1.26 | % | 143,785 | |||||||
Agency CMBS IOs | 360,245 | 1.24 | % | 421,285 | |||||||
Non-Agency CMBS IOs | 302,771 | 1.33 | % | 359,351 | |||||||
Securitization financing bond | 7,035 | 1.65 | % | 8,054 | |||||||
Total repurchase agreements | $ | 2,589,420 | 0.75 | % | $ | 2,825,641 | |||||
FHLB advances (1) | 520,000 | 0.40 | % | 541,771 | |||||||
Total secured borrowings | $ | 3,109,420 | 0.69 | % | $ | 3,367,412 | |||||
(1) FHLB advances were collateralized primarily with Agency CMBS as of December 31, 2015.
As a result of a final rule issued by the Federal Housing Finance Administration ("FHFA") in January 2016 regarding the exclusion of captive insurance entities from membership in the FHLB, the Company's wholly owned subsidiary, Mackinaw Insurance Company, LLC ("Mackinaw"), must terminate its membership in the FHLB of Indianapolis by February 19, 2017
F-18
NOTES TO THE CONSOLIDATED FINANCIAL STATEMENTS
DYNEX CAPITAL, INC.
($ in thousands except share and per share data)
and is no longer permitted new advances or renewals of existing advances. The Company has repaid all FHLB advances as of December 31, 2016.
As of December 31, 2016, the weighted average remaining term to maturity of our repurchase agreements was 20 days compared to 22 days as of December 31, 2015. The following table provides a summary of the original term to maturity of our secured borrowings as of December 31, 2016 and December 31, 2015:
Original Term to Maturity | December 31, 2016 | December 31, 2015 | ||||||
Less than 30 days | $ | 910,937 | $ | 551,643 | ||||
30 to 90 days | 533,112 | 782,393 | ||||||
91 to 180 days | 1,454,903 | 1,512,384 | ||||||
181 to 364 days | — | — | ||||||
1 year or longer | — | 263,000 | ||||||
$ | 2,898,952 | $ | 3,109,420 | |||||
The following table lists the counterparties with whom the Company had over 10% of its shareholders' equity at risk (defined as the excess of collateral pledged over the borrowings outstanding):
December 31, 2016 | |||||||||||
Counterparty Name | Balance | Weighted Average Rate | Equity at Risk | ||||||||
Wells Fargo Bank, N. A. and affiliates | $ | 342,160 | 1.64 | % | $ | 62,041 | |||||
Of the amount outstanding with Wells Fargo Bank, N.A. and affiliates, $329,424 is under a committed repurchase facility which has an aggregate maximum borrowing capacity of $350,000 and is scheduled to mature on August 6, 2018, subject to early termination provisions contained in the master repurchase agreement. The facility is collateralized primarily by CMBS IO, and its weighted average borrowing rate as of December 31, 2016 was 1.64%.
As of December 31, 2016, the Company had repurchase agreement amounts outstanding with 19 of its 32 available repurchase agreement counterparties. The Company's counterparties, as set forth in the master repurchase agreement with the counterparty, require the Company to comply with various customary operating and financial covenants, including, but not limited to, minimum net worth, maximum declines in net worth in a given period, and maximum leverage requirements as well as maintaining the Company's REIT status. In addition, some of the agreements contain cross default features, whereby default under an agreement with one lender simultaneously causes default under agreements with other lenders. To the extent that the Company fails to comply with the covenants contained in these financing agreements or is otherwise found to be in default under the terms of such agreements, the counterparty has the right to accelerate amounts due under the master repurchase agreement. The Company was in full compliance with all covenants as of December 31, 2016.
Please see Note 6 for the Company's disclosures related to offsetting assets and liabilities.
NOTE 5 – DERIVATIVES
The Company utilizes derivative instruments to economically hedge a portion of its exposure to interest rate risk. As of December 31, 2016, the Company primarily uses pay-fixed interest rate swaps to hedge its exposure to changes in interest rates and uses receive-fixed interest rate swaps to offset a portion of its pay-fixed interest rate swaps in order to manage its overall hedge position. The objective of the Company's risk management strategy is to mitigate declines in book value resulting from fluctuations in the fair value of the Company's assets from changing interest rates and to protect some portion of the Company's earnings from rising interest rates. Please refer to Note 1 for information related to the Company's accounting policy for its derivative instruments.
F-19
NOTES TO THE CONSOLIDATED FINANCIAL STATEMENTS
DYNEX CAPITAL, INC.
($ in thousands except share and per share data)
The table below summarizes information about the Company’s derivative instruments treated as trading instruments on its consolidated balance sheet as of the dates indicated:
December 31, 2016 | ||||||||||||||||
Derivative Assets | Derivative Liabilities | |||||||||||||||
Trading Instruments | Fair Value | Notional | Fair Value | Notional | ||||||||||||
Interest rate swaps | $ | 28,534 | $ | 2,670,000 | $ | (6,922 | ) | $ | 1,210,000 | |||||||
Eurodollar futures (1) | — | — | — | — | ||||||||||||
Total | $ | 28,534 | $ | 2,670,000 | $ | (6,922 | ) | $ | 1,210,000 | |||||||
December 31, 2015 | ||||||||||||||||
Derivative Assets | Derivative Liabilities | |||||||||||||||
Trading Instruments | Fair Value | Notional | Fair Value | Notional | ||||||||||||
Interest rate swaps | $ | 7,835 | $ | 460,000 | $ | (12,108 | ) | $ | 2,920,000 | |||||||
Eurodollar futures (1) | — | — | (29,097 | ) | 6,300,000 | |||||||||||
Total | $ | 7,835 | $ | 460,000 | $ | (41,205 | ) | $ | 9,220,000 | |||||||
(1) | The Eurodollar futures aggregate notional amount represents the total notional of the 3-month contracts with expiration dates from 2017 to 2020. The maximum notional outstanding for any future 3-month period did not exceed $725,000 as of December 31, 2015. |
The following table summarizes the notional activity related to derivative instruments for the period indicated:
For the year ended December 31, 2016: | Beginning of Period Notional Amount | Additions | Settlement, Termination, Expiration or Exercise | End of Period Notional Amount | |||||||||||
Receive-fixed interest rate swaps | $ | 425,000 | $ | — | $ | — | $ | 425,000 | |||||||
Pay-fixed interest rate swaps (1) | 2,955,000 | 3,500,000 | (3,000,000 | ) | 3,455,000 | ||||||||||
Eurodollar futures | 6,300,000 | — | (6,300,000 | ) | — | ||||||||||
$ | 9,680,000 | $ | 3,500,000 | $ | (9,300,000 | ) | $ | 3,880,000 | |||||||
(1) The notional amount of pay-fixed interest rate swaps that were forward starting as of December 31, 2016 was $2,725,000.
The table below provides detail of the Company's "loss on derivative instruments, net" by type of derivative for the periods indicated:
Year Ended | |||||||||||
December 31, | |||||||||||
Type of Derivative Instrument | 2016 | 2015 | 2014 | ||||||||
Receive-fixed interest rate swaps | $ | 2,515 | $ | 6,522 | $ | 4,912 | |||||
Pay-fixed interest rate swaps | (3,306 | ) | (28,687 | ) | (30,754 | ) | |||||
Eurodollar futures | (4,815 | ) | (20,963 | ) | (27,551 | ) | |||||
Loss on derivative instruments, net | $ | (5,606 | ) | $ | (43,128 | ) | $ | (53,393 | ) | ||
There is a net unrealized gain of $670 remaining in AOCI on the Company's consolidated balance sheet as of December 31, 2016 which represents the activity related to interest rate swap agreements while they were previously designated as cash flow hedges, and this amount will be recognized in the Company's net income as a portion of "interest expense" over the remaining contractual life of the agreements. The Company estimates a credit of $268 will be reclassified to net income as a reduction of "interest expense" within the next 12 months.
F-20
NOTES TO THE CONSOLIDATED FINANCIAL STATEMENTS
DYNEX CAPITAL, INC.
($ in thousands except share and per share data)
A portion of the Company's interest rate swaps were entered into under bilateral agreements which contain cross-default provisions with other agreements between the parties. In addition, these bilateral agreements contain financial and operational covenants similar to those contained in our repurchase agreements as described in Note 4. The Company was in compliance with all covenants with respect to bilateral agreements under which interest rate swaps were entered into as of December 31, 2016.
Please see Note 6 for the Company's disclosures related to offsetting assets and liabilities.
NOTE 6 – OFFSETTING ASSETS AND LIABILITIES
The Company's repurchase agreements and derivatives are subject to underlying agreements with master netting or similar arrangements, which provide for the right of offset in the event of default or in the event of bankruptcy of either party to the transactions. The Company reports its assets and liabilities subject to these arrangements on a gross basis. The following tables present information regarding those assets and liabilities subject to such arrangements as if the Company had presented them on a net basis as of December 31, 2016 and December 31, 2015:
Offsetting of Assets | |||||||||||||||||||||||
Gross Amount of Recognized Assets | Gross Amount Offset in the Balance Sheet | Net Amount of Assets Presented in the Balance Sheet | Gross Amount Not Offset in the Balance Sheet (1) | Net Amount | |||||||||||||||||||
Financial Instruments Received as Collateral | Cash Received as Collateral | ||||||||||||||||||||||
December 31, 2016 | |||||||||||||||||||||||
Derivative assets | $ | 28,534 | $ | — | $ | 28,534 | $ | (6,449 | ) | $ | (22,085 | ) | $ | — | |||||||||
December 31, 2015: | |||||||||||||||||||||||
Derivative assets | $ | 7,835 | $ | — | $ | 7,835 | $ | (7,835 | ) | $ | — | $ | — | ||||||||||
Offsetting of Liabilities | |||||||||||||||||||||||
Gross Amount of Recognized Liabilities | Gross Amount Offset in the Balance Sheet | Net Amount of Liabilities Presented in the Balance Sheet | Gross Amount Not Offset in the Balance Sheet (1) | Net Amount | |||||||||||||||||||
Financial Instruments Posted as Collateral | Cash Posted as Collateral | ||||||||||||||||||||||
December 31, 2016 | |||||||||||||||||||||||
Derivative liabilities | $ | 6,922 | $ | — | $ | 6,922 | $ | (6,913 | ) | $ | — | $ | 9 | ||||||||||
Repurchase agreements | 2,898,952 | — | 2,898,952 | (2,898,952 | ) | — | — | ||||||||||||||||
$ | 2,905,874 | $ | — | $ | 2,905,874 | $ | (2,905,865 | ) | $ | — | $ | 9 | |||||||||||
December 31, 2015: | |||||||||||||||||||||||
Derivative liabilities | $ | 41,205 | $ | — | $ | 41,205 | $ | (9,079 | ) | $ | (32,111 | ) | $ | 15 | |||||||||
Repurchase agreements | 2,589,420 | — | 2,589,420 | (2,589,420 | ) | — | — | ||||||||||||||||
$ | 2,630,625 | $ | — | $ | 2,630,625 | $ | (2,598,499 | ) | $ | (32,111 | ) | $ | 15 | ||||||||||
(1) | Amounts disclosed for collateral received by or posted to the same counterparty include cash and the fair value of MBS up to and not exceeding the net amount of the asset or liability presented in the balance sheet. The fair value of the actual collateral received by or posted to the same counterparty may exceed the amounts presented. |
F-21
NOTES TO THE CONSOLIDATED FINANCIAL STATEMENTS
DYNEX CAPITAL, INC.
($ in thousands except share and per share data)
NOTE 7 – FAIR VALUE OF FINANCIAL INSTRUMENTS
ASC Topic 820 defines fair value as the price that would be received to sell an asset or paid to transfer a liability in an orderly transaction between market participants at the measurement date. ASC Topic 820 clarifies that fair value should be based on the assumptions market participants would use when pricing an asset or liability and also requires an entity to consider all aspects of nonperformance risk, including the entity's own credit standing, when measuring fair value of a liability. ASC Topic 820 established a valuation hierarchy of three levels as follows:
• | Level 1 – Inputs are unadjusted, quoted prices in active markets for identical assets or liabilities as of the measurement date. |
• | Level 2 – Inputs include quoted prices in active markets for similar assets or liabilities; quoted prices in inactive markets for identical or similar assets or liabilities; or inputs either directly observable or indirectly observable through correlation with market data at the measurement date and for the duration of the instrument’s anticipated life. |
• | Level 3 – Unobservable inputs are supported by little or no market activity. The unobservable inputs represent management’s best estimate of how market participants would price the asset or liability at the measurement date. Consideration is given to the risk inherent in the valuation technique and the risk inherent in the inputs to the model. |
The Company reviews the classification of its financial instruments within the fair value hierarchy on a quarterly basis, and management may conclude that its financial instruments should be reclassified to a different level in the future if a change in type of inputs occurs.
The following table presents the fair value of the Company’s assets and liabilities presented on its consolidated balance sheets, segregated by the hierarchy level of the fair value estimate, that are measured at fair value on a recurring basis as of the dates indicated:
December 31, 2016 | |||||||||||||||
Fair Value | Level 1 - Unadjusted Quoted Prices in Active Markets | Level 2 - Observable Inputs | Level 3 - Unobservable Inputs | ||||||||||||
Assets: | |||||||||||||||
Mortgage-backed securities | $ | 3,212,084 | $ | — | $ | 3,201,157 | $ | 10,927 | |||||||
Derivative assets | 28,534 | — | 28,534 | — | |||||||||||
Total assets carried at fair value | $ | 3,240,618 | $ | — | $ | 3,229,691 | $ | 10,927 | |||||||
Liabilities: | |||||||||||||||
Derivative liabilities | $ | 6,922 | $ | — | $ | 6,922 | $ | — | |||||||
Total liabilities carried at fair value | $ | 6,922 | $ | — | $ | 6,922 | $ | — | |||||||
F-22
NOTES TO THE CONSOLIDATED FINANCIAL STATEMENTS
DYNEX CAPITAL, INC.
($ in thousands except share and per share data)
December 31, 2015 | |||||||||||||||
Fair Value | Level 1 - Unadjusted Quoted Prices in Active Markets | Level 2 - Observable Inputs | Level 3 - Unobservable Inputs | ||||||||||||
Assets: | |||||||||||||||
Mortgage-backed securities | $ | 3,493,701 | $ | — | $ | 3,477,266 | $ | 16,435 | |||||||
Derivative assets | 7,835 | — | 7,835 | — | |||||||||||
Total assets carried at fair value | $ | 3,501,536 | $ | — | $ | 3,485,101 | $ | 16,435 | |||||||
Liabilities: | |||||||||||||||
Derivative liabilities | $ | 41,205 | $ | 29,097 | $ | 12,108 | $ | — | |||||||
Total liabilities carried at fair value | $ | 41,205 | $ | 29,097 | $ | 12,108 | $ | — | |||||||
The Company did not have assets or liabilities measured at fair value on a non-recurring basis as of December 31, 2016 or December 31, 2015.
As of December 31, 2016, the Company's derivative assets and liabilities consisted only of interest rate swaps as the Company terminated all positions in Eurodollar futures during the fourth quarter of 2016. Eurodollar futures as of December 31, 2015 were valued based on closing exchange prices and were thus classified as Level 1 measurements. Interest rate swaps are valued using the income approach with the primary input being the forward interest rate swap curve, which is considered an observable input, and thus their fair values are considered Level 2 measurements as of December 31, 2016 and December 31, 2015.
The fair value measurements for a majority of the Company's MBS are considered Level 2. These Level 2 securities are substantially similar to securities that either are actively traded or have been recently traded in their respective markets. The Company receives a price evaluation for each of its MBS from a primary pricing service selected by the Company. To determine each security's valuation, the primary pricing service uses either a market approach, which uses observable prices and other relevant information that is generated by market transactions of identical or similar securities, or an income approach, which uses valuation techniques to convert future amounts to a single, discounted present value amount. The Company also reviews the assumptions and inputs utilized in the valuation techniques of its primary pricing service. Examples of these observable inputs and assumptions include market interest rates, credit spreads, and projected prepayment speeds, among other things. The Company compares the price received from its primary pricing service to other prices received from additional third party pricing services and multiple broker quotes for reasonableness.
The Company owns certain non-Agency MBS for which there are not sufficiently recent trades of substantially similar securities, and their fair value measurements are thus considered Level 3. The Company determines the fair value of its Level 3 securities by discounting the estimated future cash flows derived from cash flow models using significant inputs which are determined by the Company when market observable inputs are not available. Information utilized in those pricing models include the security’s credit rating, coupon rate, estimated prepayment speeds, expected weighted average life, collateral composition, estimated future interest rates, expected credit losses, and credit enhancement as well as certain other relevant information. Significant changes in any of these inputs in isolation may result in a significantly different fair value measurement. Level 3 assets are generally most sensitive to the default rate and severity assumptions.
The table below presents quantitative information about the significant unobservable inputs used in the fair value measurement for the Company's Level 3 non-Agency CMBS and RMBS as of December 31, 2016:
F-23
NOTES TO THE CONSOLIDATED FINANCIAL STATEMENTS
DYNEX CAPITAL, INC.
($ in thousands except share and per share data)
Unobservable Inputs | ||||||||||
Prepayment Speed | Default Rate | Severity | Discount Rate | |||||||
Non-Agency CMBS (1) | 0 CPY | — | — | 9.8 | % | |||||
Non-Agency RMBS | 10 CPR | 1.0 | % | 20.0 | % | 6.3 | % | |||
(1) | As of December 31, 2016, there are too few loans collateralizing our non-Agency CMBS to reasonably apply average prepayment speed, average default rate, or average severity. The loans were individually evaluated for prepayment and default in projecting the cash flows. Based on that review, the loans are expected to pay as scheduled. |
The activity of the instruments measured at fair value on a recurring basis using Level 3 inputs is presented in the following table for the period indicated:
Level 3 Fair Value | |||||||||||
Non-Agency CMBS | Non-Agency RMBS | Total assets | |||||||||
Balance as of December 31, 2015 | $ | 14,903 | $ | 1,532 | $ | 16,435 | |||||
Unrealized loss included in OCI (1) | (1,055 | ) | (2 | ) | (1,057 | ) | |||||
Principal payments | (5,747 | ) | (272 | ) | (6,019 | ) | |||||
Accretion | 1,568 | — | 1,568 | ||||||||
Balance as of December 31, 2016 | $ | 9,669 | $ | 1,258 | $ | 10,927 | |||||
(1) | Amount included in "change in net unrealized gain on available-for-sale investments" on consolidated statements of comprehensive income (loss). |
The following table presents a summary of the carrying value and estimated fair values of the Company’s financial instruments as of the dates indicated:
December 31, 2016 | December 31, 2015 | ||||||||||||||
Carrying Value | Fair Value | Carrying Value | Fair Value | ||||||||||||
Assets: | |||||||||||||||
Mortgage-backed securities | $ | 3,212,084 | $ | 3,212,084 | $ | 3,493,701 | $ | 3,493,701 | |||||||
Mortgage loans held for investment, net(1) | 19,036 | 15,971 | 24,145 | 20,849 | |||||||||||
Investment in FHLB stock | 9 | 9 | 11,475 | 11,475 | |||||||||||
Derivative assets | 28,534 | 28,534 | 7,835 | 7,835 | |||||||||||
Liabilities: | |||||||||||||||
Repurchase agreements (2) | $ | 2,898,952 | $ | 2,898,952 | $ | 2,589,420 | $ | 2,589,420 | |||||||
FHLB advances (2) | — | — | 520,000 | 520,000 | |||||||||||
Non-recourse collateralized financing (1) | 6,440 | 6,357 | 8,442 | 8,102 | |||||||||||
Derivative liabilities | 6,922 | 6,922 | 41,205 | 41,205 | |||||||||||
(1) | The Company determines the fair value of its mortgage loans held for investment, net and its non-recourse collateralized financing using internally developed cash flow models with inputs similar to those used to estimate the fair value of the Company's Level 3 non-Agency MBS. |
(2) | The carrying value of repurchase agreements and FHLB advances generally approximates fair value due to their short term maturities. |
F-24
NOTES TO THE CONSOLIDATED FINANCIAL STATEMENTS
DYNEX CAPITAL, INC.
($ in thousands except share and per share data)
NOTE 8 – SHAREHOLDERS' EQUITY AND SHARE-BASED COMPENSATION
Preferred Stock
The Company's articles of incorporation authorize the issuance of up to 50,000,000 shares of preferred stock, par value $0.01 per share, of which the Company's Board of Directors has designated 8,000,000 shares of 8.50% Series A Preferred Stock and 7,000,000 shares of 7.625% Series B Preferred Stock, (the Series A Preferred Stock and the Series B Preferred Stock collectively, the "Preferred Stock"). The Company had 2,300,000 shares of its Series A Preferred Stock and 2,271,937 shares of its Series B Preferred Stock issued and outstanding as of December 31, 2016 compared to 2,300,000 shares of Series A Preferred Stock and 2,250,000 shares of Series B Preferred Stock as of December 31, 2015. The Company's Preferred Stock has no maturity and will remain outstanding indefinitely unless redeemed or otherwise repurchased or converted into common stock pursuant to the terms of the Preferred Stock. Except under certain limited circumstances intended to preserve the Company's REIT status, upon the occurrence of a change in control as defined in Article IIIA, Section 7(d) of the Company’s Articles of Incorporation, or to avoid the direct or indirect imposition of a penalty tax in respect of, or to protect the tax status of, any of the Company’s real estate mortgage investment conduits (“REMIC”) interests or a REMIC in which the Company may acquire an interest (as permitted by the Company’s Articles of Incorporation), the Company may not redeem the Series A Preferred Stock prior to July 31, 2017 or the Series B Preferred Stock prior to April 30, 2018. On or after these dates, at any time and from time to time, the Preferred Stock may be redeemed in whole, or in part, at the Company's option at a cash redemption price of $25.00 per share plus any accumulated and unpaid dividends. Because the Preferred Stock is redeemable only at the option of the issuer, it is classified as equity on the Company's consolidated balance sheet. The Series A Preferred Stock pays a cumulative cash dividend equivalent to 8.50% of the $25.00 liquidation preference per share each year and the Series B Preferred Stock pays a cumulative cash dividend equivalent to 7.625% of the $25.00 liquidation preference per share each year. The Company announced that it will pay its regular quarterly dividends on its Preferred Stock for the fourth quarter on January 16, 2017 to shareholders of record as of January 1, 2017.
Common Stock
The Company declared a fourth quarter common stock dividend of $0.21 per share payable on January 31, 2017 to shareholders of record as of December 30, 2016.
In December 2016, the Company's Board of Directors authorized the repurchase of up to $40,000 of its outstanding shares of common stock through December 31, 2018. This stock repurchase plan replaced the Company's prior repurchase plan which was authorized through December 31, 2016. The Company did not repurchase any shares under with plan during the three months ended December 31, 2016.
2009 Stock and Incentive Plan. Of the 2,500,000 shares of common stock authorized for issuance under its 2009 Stock and Incentive Plan, the Company had 860,106 available for issuance as of December 31, 2016. Total stock-based compensation expense recognized by the Company for the year ended December 31, 2016 was $2,709 compared to $2,965 and $2,719 for the years ended December 31, 2015 and December 31, 2014, respectively.
The following table presents a rollforward of the restricted stock activity for the periods indicated:
F-25
NOTES TO THE CONSOLIDATED FINANCIAL STATEMENTS
DYNEX CAPITAL, INC.
($ in thousands except share and per share data)
Year Ended | ||||||||||||||||||||
December 31, | ||||||||||||||||||||
2016 | 2015 | 2014 | ||||||||||||||||||
Shares | Weighted Average Grant Date Fair Value Per Share | Shares | Weighted Average Grant Date Fair Value Per Share | Shares | Weighted Average Grant Date Fair Value Per Share | |||||||||||||||
Restricted stock outstanding as of beginning of period | 696,597 | $ | 8.54 | 731,809 | $ | 8.89 | 520,987 | $ | 10.26 | |||||||||||
Restricted stock granted | 214,878 | 6.28 | 263,829 | 8.21 | 457,538 | 8.09 | ||||||||||||||
Restricted stock vested | (358,079 | ) | 8.71 | (299,041 | ) | 9.12 | (246,716 | ) | 10.29 | |||||||||||
Restricted stock outstanding as of end of period | 553,396 | $ | 7.55 | 696,597 | $ | 8.54 | 731,809 | $ | 8.89 | |||||||||||
As of December 31, 2016, the grant date fair value of the Company’s remaining nonvested restricted stock is $2,137 which will be amortized into compensation expense over a weighted average period of 1.4 years.
NOTE 9 – INCOME TAXES
The Company's estimated REIT taxable income before consideration of its NOL carryforward was $21,702 for the year ended December 31, 2016, $52,964 for the year ended December 31, 2015, and $79,229 for the year ended December 31, 2014. After common and preferred dividend distributions during those years as well as utilization of the Company's NOL carryforward to offset taxable earnings, the Company does not expect to incur any income tax liability for the year ended December 31, 2016 and did not incur any material income tax liability for the years ending December 31, 2015 or December 31, 2014.
The Company's estimated NOL carryforward as of December 31, 2016 is $89,775. Because the Company incurred an "ownership change" under Section 382 of the Internal Revenue Code ("Section 382"), the Company's ability to utilize its NOL carryforward to offset its taxable income after any required dividend distributions is limited to approximately $13,451 per year with any unused amounts being accumulated and carried forward for use in subsequent years. As of December 31, 2016, the Company had $38,641 of NOL that is not subject to the existing Section 382 limitations available to offset any future taxable income. The NOL will expire beginning in 2020 to the extent it is not used.
After reviewing for any potentially uncertain income tax positions, the Company has concluded that it does not have any uncertain tax positions that meet the recognition or measurement criteria of ASC 740 as of December 31, 2016, December 31, 2015, or December 31, 2014, although its tax returns for those tax years are open to examination by the IRS. In the event that the Company incurs income tax related interest and penalties, its policy is to classify them as a component of provision for income taxes.
NOTE 10 – RELATED PARTY TRANSACTIONS
As noted in previous filings, DCI Commercial, Inc. (“DCI”), a former affiliate of the Company and formerly known as Dynex Commercial, Inc., was named a party to several lawsuits in 1999 and 2000 regarding the activities of DCI while it was an operating subsidiary of an affiliate of the Company. In certain instances, the Company was also a party to the lawsuit due to its affiliation with DCI. In December 2000, the Company and DCI entered into a Litigation Cost Sharing Agreement whereby the parties set forth how the costs of defending against such litigation would be shared, and whereby the Company agreed to advance DCI's portion of the costs of defending against such litigation. The Company is no longer a defendant in any litigation related to the activities of DCI. In 2013, in the conclusion of litigation that was tried in 2004, plaintiffs in that case (the “DCI Plaintiffs”) were awarded a judgment of $26.5 million against DCI (the “DCI Judgment”). In 2014, third parties were awarded a judgment against certain of the DCI Plaintiffs in a matter not involving the Company or DCI. Those parties are now pursuing a garnishment action against the DCI Judgment. Those parties have requested from the Company certain information
F-26
NOTES TO THE CONSOLIDATED FINANCIAL STATEMENTS
DYNEX CAPITAL, INC.
($ in thousands except share and per share data)
related to DCI while it was an operating subsidiary of an affiliate of the Company and certain other information related to the activities of DCI.
The Litigation Cost Sharing Agreement remained in effect as of December 31, 2016. DCI costs advanced by the Company are loans and bear simple interest at the rate of Prime plus 8.0% per annum. The Company's advances to cover DCI's costs during the years ended December 31, 2016, 2015, and 2014 were $173, $228, and $237, respectively. The total amount due to the Company under the Litigation Cost Sharing Agreement including interest was $10,240 as of December 31, 2016 compared to $9,630 as of December 31, 2015. Because DCI does not currently have any assets, the amount due as of December 31, 2016 has been fully reserved for collectibility by the Company. DCI is currently wholly owned by a company unaffiliated with the Company. An executive of the Company is the sole shareholder of this unaffiliated company.
F-27
NOTES TO THE CONSOLIDATED FINANCIAL STATEMENTS
DYNEX CAPITAL, INC.
($ in thousands except share and per share data)
NOTE 11 - SELECTED QUARTERLY INFORMATION (UNAUDITED)
Year Ended December 31, 2016 | |||||||||||||||
First Quarter | Second Quarter | Third Quarter | Fourth Quarter | ||||||||||||
Operating results: | |||||||||||||||
Interest income | $ | 25,089 | $ | 22,816 | $ | 21,135 | $ | 22,858 | |||||||
Interest expense | 6,310 | 6,100 | 6,068 | 6,753 | |||||||||||
Net interest income | 18,779 | 16,716 | 15,067 | 16,105 | |||||||||||
(Loss) gain on derivatives instruments, net | (48,264 | ) | (16,297 | ) | 2,409 | 56,546 | |||||||||
Loss on sale of investments, net | (3,941 | ) | (297 | ) | — | — | |||||||||
Fair value adjustments and other income (expense) amounts, net | 87 | 318 | 579 | (1 | ) | ||||||||||
General and administrative expenses | (4,092 | ) | (3,671 | ) | (3,355 | ) | (3,589 | ) | |||||||
Preferred stock dividends | (2,294 | ) | (2,294 | ) | (2,294 | ) | (2,303 | ) | |||||||
Net (loss) income to common shareholders | (39,725 | ) | (5,525 | ) | 12,406 | 66,758 | |||||||||
Other comprehensive income (loss) | 41,728 | 22,947 | 670 | (85,186 | ) | ||||||||||
Comprehensive income (loss) to common shareholders | $ | 2,003 | $ | 17,422 | $ | 13,076 | $ | (18,428 | ) | ||||||
Net (loss) income per common share | $ | (0.81 | ) | $ | (0.11 | ) | $ | 0.25 | $ | 1.36 | |||||
Dividends declared per common share | $ | 0.21 | $ | 0.21 | $ | 0.21 | $ | 0.21 | |||||||
Year Ended December 31, 2015 | |||||||||||||||
First Quarter | Second Quarter | Third Quarter | Fourth Quarter | ||||||||||||
Operating results: | |||||||||||||||
Interest income | $ | 24,099 | $ | 24,527 | $ | 26,096 | $ | 25,522 | |||||||
Interest expense | 5,371 | 5,542 | 5,859 | 5,833 | |||||||||||
Net interest income | 18,728 | 18,985 | 20,237 | 19,689 | |||||||||||
(Loss) gain on derivatives instruments, net | (25,323 | ) | 17,090 | (52,749 | ) | 17,854 | |||||||||
Gain (loss) on sale of investments, net | 1,308 | (1,491 | ) | 113 | (908 | ) | |||||||||
Fair value adjustments and other income (expense) amounts, net | 72 | 632 | (199 | ) | 174 | ||||||||||
General and administrative expenses | (4,257 | ) | (4,754 | ) | (4,379 | ) | (4,278 | ) | |||||||
Preferred stock dividends | (2,294 | ) | (2,294 | ) | (2,294 | ) | (2,294 | ) | |||||||
Net (loss) income to common shareholders | (11,766 | ) | 28,168 | (39,271 | ) | 30,237 | |||||||||
Other comprehensive income (loss) | 23,054 | (39,679 | ) | 27,418 | (44,877 | ) | |||||||||
Comprehensive income (loss) to common shareholders | $ | 11,288 | $ | (11,511 | ) | $ | (11,853 | ) | $ | (14,640 | ) | ||||
Net (loss) income per common share | $ | (0.21 | ) | $ | 0.52 | $ | (0.74 | ) | $ | 0.61 | |||||
Dividends declared per common share | $ | 0.24 | $ | 0.24 | $ | 0.24 | $ | 0.24 | |||||||
NOTE 12 – SUBSEQUENT EVENTS
Management has evaluated events and circumstances occurring as of and through the date this Annual Report on Form 10-K was filed with the SEC and has determined that there have been no significant events or circumstances that qualify as a "recognized" or "nonrecognized" subsequent event as defined by ASC Topic 855.
F-28