Attached files
| file | filename |
|---|---|
| 8-K - 8-K - HERITAGE FINANCIAL CORP /WA/ | form8-kxq22017investorpres.htm |
Q2 2017 Investor Presentation

FORWARD – LOOKING STATEMENT
2
This presentation contains forward-looking statements that are subject to risks and uncertainties, including, but not limited to:
• The expected revenues, cost savings, synergies and other benefits from our other merger and acquisition activities might not be realized within the anticipated time frames or at all, and
costs or difficulties relating to integration matters, including but not limited to, customer and employee retention might be greater than expected;
• The credit and concentration risks of lending activities;
• Changes in general economic conditions, either nationally or in our market areas;
• Competitive market pricing factors and interest rate risks;
• Market interest rate volatility;
• Balance sheet (for example, loans) concentrations;
• Fluctuations in demand for loans and other financial services in our market areas;
• Changes in legislative or regulatory requirements or the results of regulatory examinations;
• The ability to recruit and retain key management and staff;
• Risks associated with our ability to implement our expansion strategy and merger integration;
• Stability of funding sources and continued availability of borrowings;
• Adverse changes in the securities markets;
• The inability of key third-party providers to perform their obligations to us;
• The proposed merger with Puget Sound Bancorp, Inc. (“Puget Sound”) may not close when expected or at all because required regulatory, shareholder or other approvals and
conditions to closing are not received or satisfied on a timely basis or at all, which may have an effect on the trading prices of the Company’s stock;
• Changes in accounting policies and practices and the use of estimates in determining fair value of certain of our assets, which estimates may prove to be incorrect and result in
significant declines in valuation; and
• These and other risks as may be detailed from time to time in our filings with the Securities and Exchange Commission.
The Company cautions readers not to place undue reliance on any forward-looking statements. Moreover, you should treat these statements as speaking only as of the date they are made
and based only on information then actually known to the Company. The Company does not undertake and specifically disclaims any obligation to revise any forward-looking statements to
reflect the occurrence of anticipated or unanticipated events or circumstances after the date of such statements. These risks could cause our actual results for the third quarter of 2017 and
beyond to differ materially from those expressed in any forward-looking statements by, or on behalf of, us, and could negatively affect the Company’s operating and stock price performance.
Additional Information
Heritage Financial Corporation (“Heritage”) will file a registration statement on Form S-4 with the SEC in connection with the proposed transaction. The registration statement will include a
proxy statement of Puget Sound that also constitutes a prospectus of Heritage, which will be sent to the shareholders of Puget Sound. Puget Sound shareholders are advised to read the
proxy statement/prospectus when it becomes available because it will contain important information about Heritage, Puget Sound and the proposed transaction. When filed, this document and
other documents relating to the merger filed by Heritage can be obtained free of charge from the SEC’s website at www.sec.gov. These documents also can be obtained free of charge by
accessing Heritage’s website at www.hf-wa.com under the tab “Investor Relations” and then under “SEC Filings.” Alternatively, these documents, when available, can be obtained free of
charge from Heritage upon written request to Heritage Financial Corporation, Attn: Investor Relations, 201 Fifth Avenue S.W., Olympia, Washington 98501 or by calling (360) 943-1500 or from
Puget Sound, upon written request to Puget Sound Bancorp, Inc., Attn: Investor Relations, 10500 NE 8th Street, #1500, Bellevue, Washington 98004.
Participants In The Solicitation
Heritage, Puget Sound and certain of their respective directors and executive officers may be deemed to be participants in the solicitation of proxies from Puget Sound shareholders in
connection with the proposed transaction under the rules of the SEC. Information about the directors and executive officers of Heritage may be found in the definitive proxy statement of
Heritage filed with the SEC by Heritage on March 23, 2017. This definitive proxy statement can be obtained free of charge from the sources indicated above. Information about the directors
and executive officers of Puget Sound will be included in the proxy statement/prospectus when filed with the SEC. Additional information regarding the interests of these participants will also be
included in the proxy statement/prospectus regarding the proposed transaction when it becomes available.
3
COMPANY OVERVIEW
OVERVIEW
4
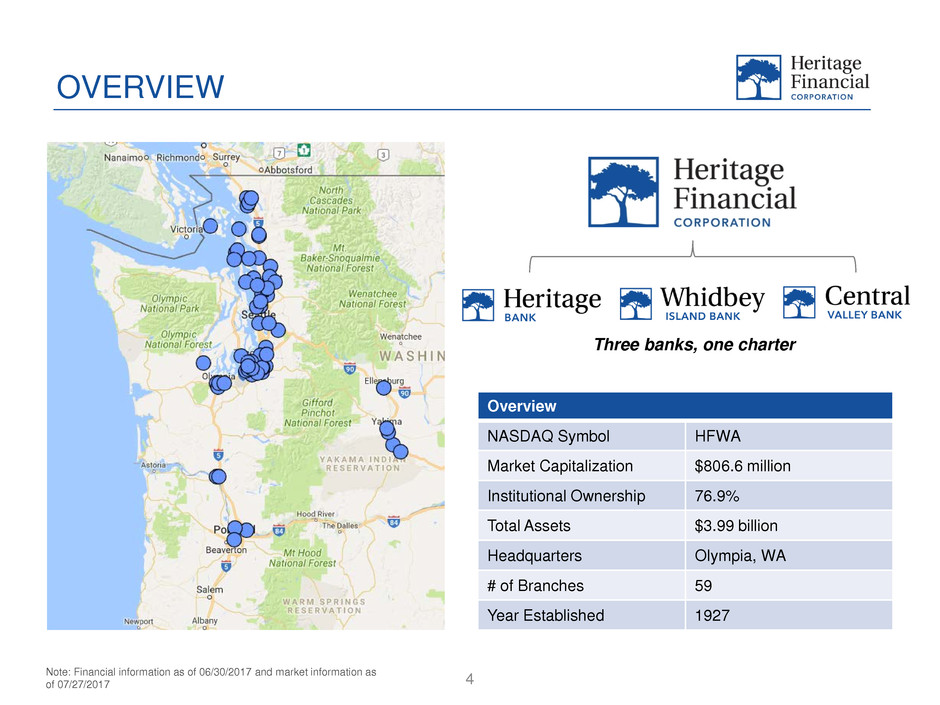
Overview
NASDAQ Symbol HFWA
Market Capitalization $806.6 million
Institutional Ownership 76.9%
Total Assets $3.99 billion
Headquarters Olympia, WA
# of Branches 59
Year Established 1927
Note: Financial information as of 06/30/2017 and market information as
of 07/27/2017
Three banks, one charter
$4
01
$4
50
$5
74
$6
10
$5
95
$6
41
$6
97
$7
51
$7
96
$8
86
$9
46
$1
,0
15
$8
12
$1
,3
69
$1
,3
46
$1
,3
40
$1
,7
12
$3
,6
51
$3
,8
79
$3
,9
91
$74 $61
$57 $556
$319
$1,747
$567
$-
$500
$1,000
$1,500
$2,000
$2,500
$3,000
$3,500
$4,000
$4,500
$5,000
1998 1999 2000 2001 2002 2003 2004 2005 2006 2007 2008 2009 2010 2011 2012 2013 2014 2015 2016 Q2
2017*
Organic Acquired Assets
5
HISTORICAL GROWTH – ORGANIC AND ACQUISITIVE
Source: Company financials, as of 06/30/2017
Note: All dollars in millions
Acquired North Pacific
Bancorporation
Acquired Washington
Independent
Bancshares Inc.
Acquired Western
Washington Bancorp
Completed 2 FDIC deals -
Pierce Commercial Bank and
Cowlitz Bank acquiring $211M
and $345M in assets,
respectively
Acquired Valley Community
Bancshares, Inc. with $254M in
assets and Northwest
Commercial Bank with $65M in
assets
Merger with Washington
Banking Company
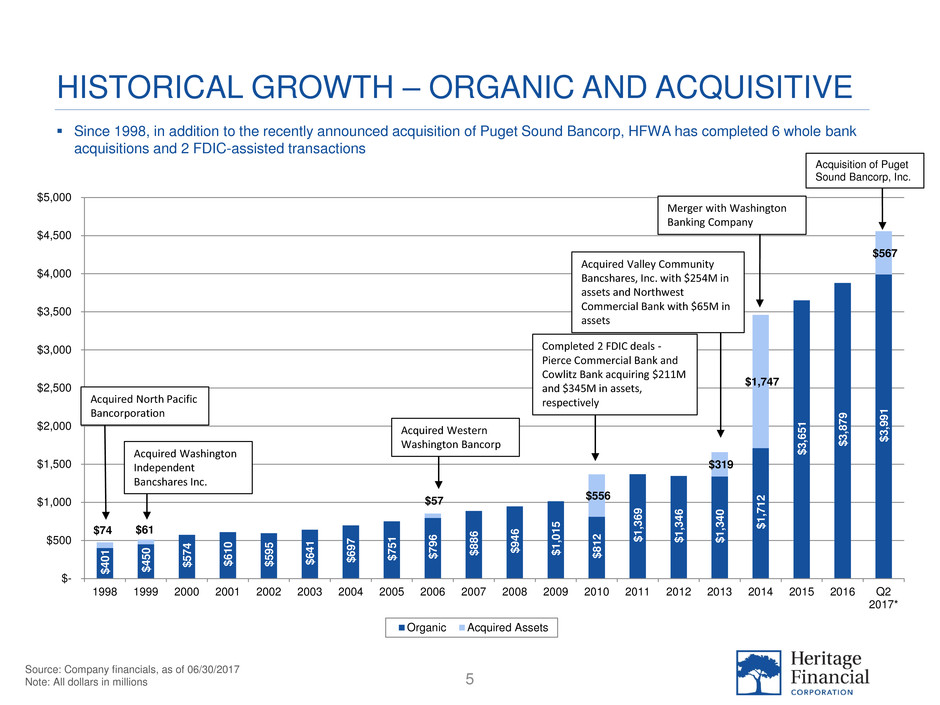
Since 1998, in addition to the recently announced acquisition of Puget Sound Bancorp, HFWA has completed 6 whole bank
acquisitions and 2 FDIC-assisted transactions
Acquisition of Puget
Sound Bancorp, Inc.

6
FINANCIAL UPDATE
FINANCIAL UPDATE – Q2 2017
7
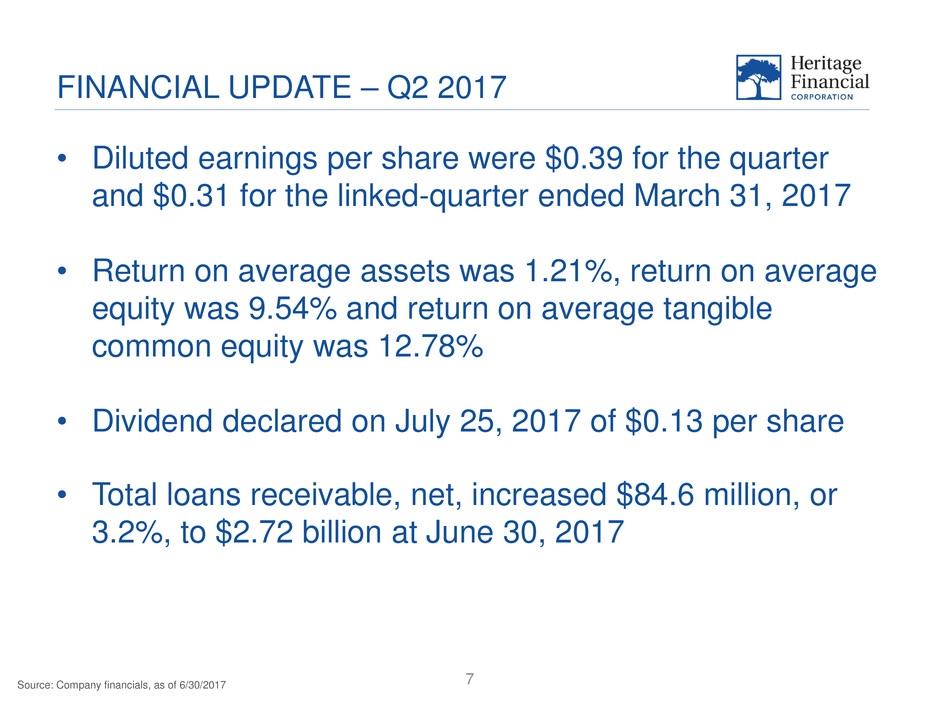
• Diluted earnings per share were $0.39 for the quarter
and $0.31 for the linked-quarter ended March 31, 2017
• Return on average assets was 1.21%, return on average
equity was 9.54% and return on average tangible
common equity was 12.78%
• Dividend declared on July 25, 2017 of $0.13 per share
• Total loans receivable, net, increased $84.6 million, or
3.2%, to $2.72 billion at June 30, 2017
Source: Company financials, as of 6/30/2017
8
LOAN PORTFOLIO
Loan Portfolio TrendsLoan Portfolio Mix - % of Total
Source: Company financials, as of 6/30/2017
Note: All dollars in millions
*Excludes impact from incremental accretion on purchased loans
**Includes loans held for sale
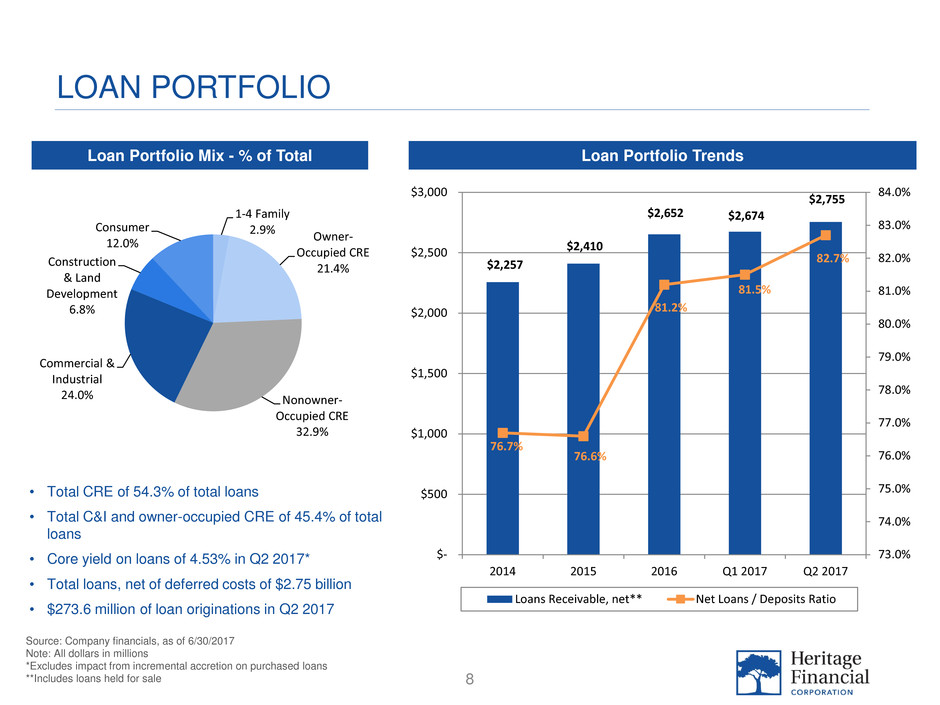
• Total CRE of 54.3% of total loans
• Total C&I and owner-occupied CRE of 45.4% of total
loans
• Core yield on loans of 4.53% in Q2 2017*
• Total loans, net of deferred costs of $2.75 billion
• $273.6 million of loan originations in Q2 2017
$2,257
$2,410
$2,652 $2,674
$2,755
76.7%
76.6%
81.2%
81.5%
82.7%
73.0%
74.0%
75.0%
76.0%
77.0%
78.0%
79.0%
80.0%
81.0%
82.0%
83.0%
84.0%
$-
$500
$1,000
$1,500
$2,000
$2,500
$3,000
2014 2015 2016 Q1 2017 Q2 2017
Loans Receivable, net** Net Loans / Deposits Ratio
1-4 Family
2.9% Owner-
Occupied CRE
21.4%
Nonowner-
Occupied CRE
32.9%
Commercial &
Industrial
24.0%
Construction
& Land
Development
6.8%
Consumer
12.0%
9
DEPOSIT PROFILE
Deposit TrendsDeposit Mix - % of Total
Source: Company financials, as of 6/30/2017
Note: All dollars in millions
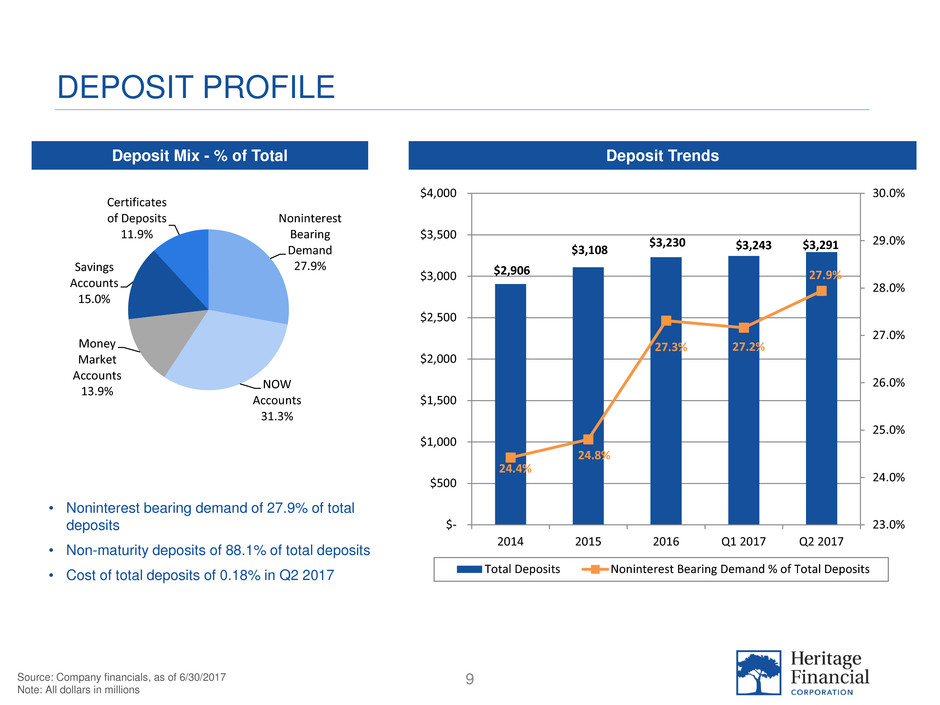
• Noninterest bearing demand of 27.9% of total
deposits
• Non-maturity deposits of 88.1% of total deposits
• Cost of total deposits of 0.18% in Q2 2017
Noninterest
Bearing
Demand
27.9%
NOW
Accounts
31.3%
Money
Market
Accounts
13.9%
Savings
Accounts
15.0%
Certificates
of Deposits
11.9%
$2,906
$3,108
$3,230 $3,243 $3,291
24.4%
24.8%
27.3% 27.2%
27.9%
23.0%
24.0%
25.0%
26.0%
27.0%
28.0%
29.0%
30.0%
$-
$500
$1,000
$1,500
$2,000
$2,500
$3,000
$3,500
$4,000
2014 2015 2016 Q1 2017 Q2 2017
Total Deposits Noninterest Bearing Demand % of Total Deposits
10
NET INTEREST MARGIN TRENDS
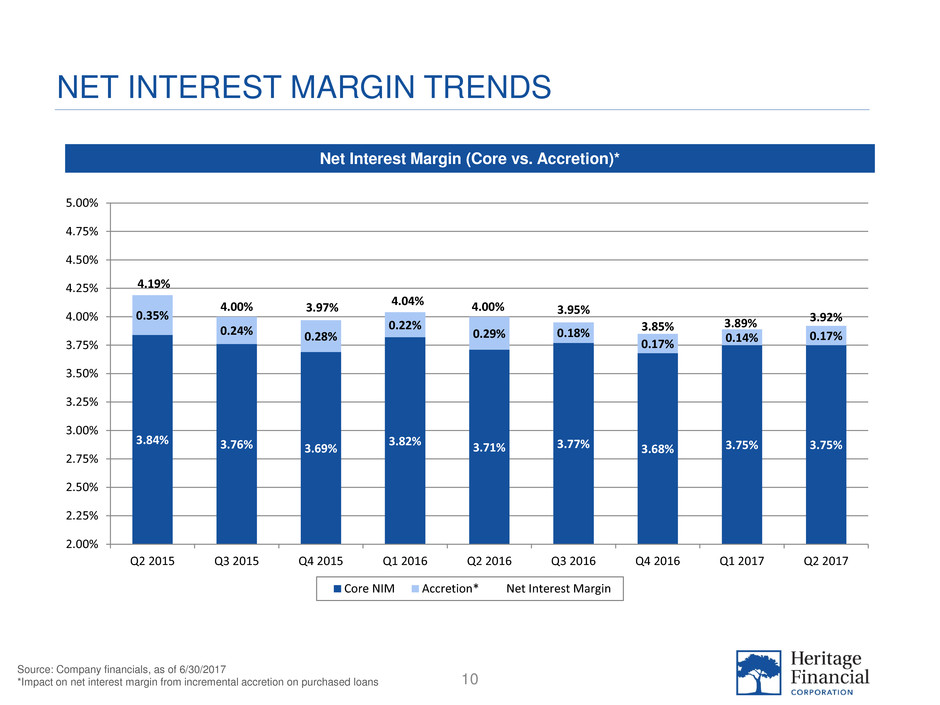
Net Interest Margin (Core vs. Accretion)*
Source: Company financials, as of 6/30/2017
*Impact on net interest margin from incremental accretion on purchased loans
3.84% 3.76% 3.69%
3.82% 3.71% 3.77% 3.68% 3.75% 3.75%
0.35%
0.24% 0.28%
0.22%
0.29% 0.18%
0.17% 0.14%
0.17%
4.19%
4.00% 3.97% 4.04% 4.00% 3.95%
3.85% 3.89%
3.92%
2.00%
2.25%
2.50%
2.75%
3.00%
3.25%
3.50%
3.75%
4.00%
4.25%
4.50%
4.75%
5.00%
Q2 2015 Q3 2015 Q4 2015 Q1 2016 Q2 2016 Q3 2016 Q4 2016 Q1 2017 Q2 2017
Core NIM Accretion* Net Interest Margin

11
CASH, INTEREST EARNING DEPOSITS & INVESTMENT SECURITIES
Cash, Interest Earning Deposits & Investment SecuritiesInvestment Portfolio Mix
Source: Company financials, as of 6/30/2017
Note: All dollars in millions
• Total cash, interest earning deposits and investment
securities of $914.8 million, or 22.9% of total assets
• Average yield on taxable investment securities of
2.22% in Q2 2017
• Average yield on non-taxable investment securities of
2.33% in Q2 2017 (tax equivalent yield of 3.58%)
$779 $812 $795 $783 $791
$132
$133
$104 $104 $124
$-
$100
$200
$300
$400
$500
$600
$700
$800
$900
$1,000
2014 2015 2016 Q1 2017 Q2 2017
Total Investment Securities Cash & Interest Earning Deposits
MBS &
CMOs U.S.
Gov't
Agency
62.0%
Municipal
Securities
30.9%
US Treasury
& U.S. Gov't
Agency
1.2%
Corporate &
CLOs
2.6%
Other
3.3%
12
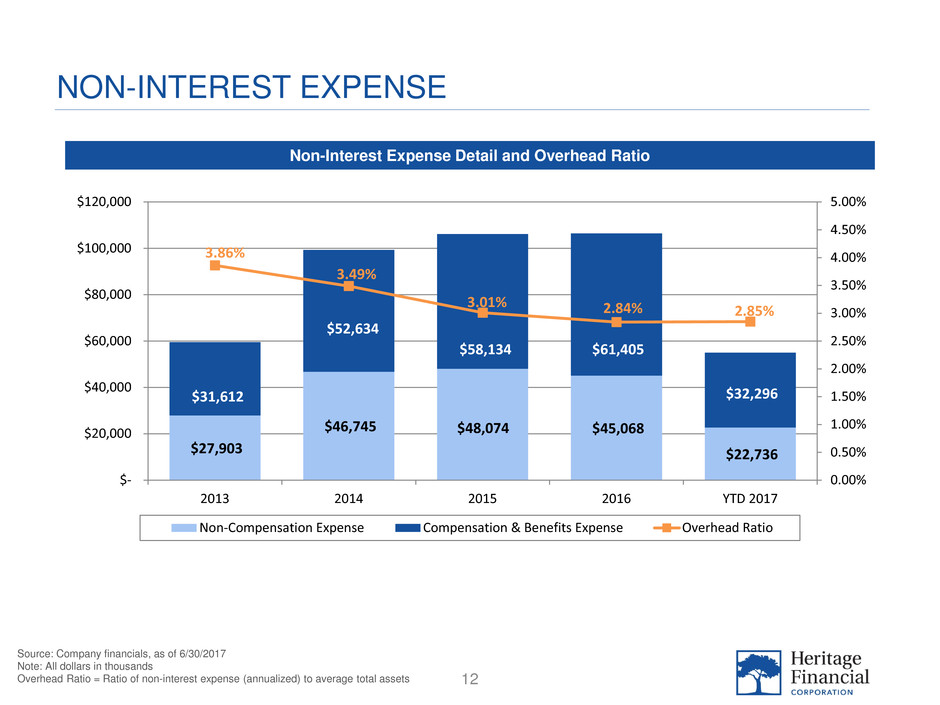
NON-INTEREST EXPENSE
Source: Company financials, as of 6/30/2017
Note: All dollars in thousands
Overhead Ratio = Ratio of non-interest expense (annualized) to average total assets
Non-Interest Expense Detail and Overhead Ratio
$27,903
$46,745 $48,074 $45,068
$22,736
$31,612
$52,634
$58,134 $61,405
$32,296
3.86%
3.49%
3.01% 2.84% 2.85%
0.00%
0.50%
1.00%
1.50%
2.00%
2.50%
3.00%
3.50%
4.00%
4.50%
5.00%
$-
$20,000
$40,000
$60,000
$80,000
$100,000
$120,000
2013 2014 2015 2016 YTD 2017
Non-Compensation Expense Compensation & Benefits Expense Overhead Ratio
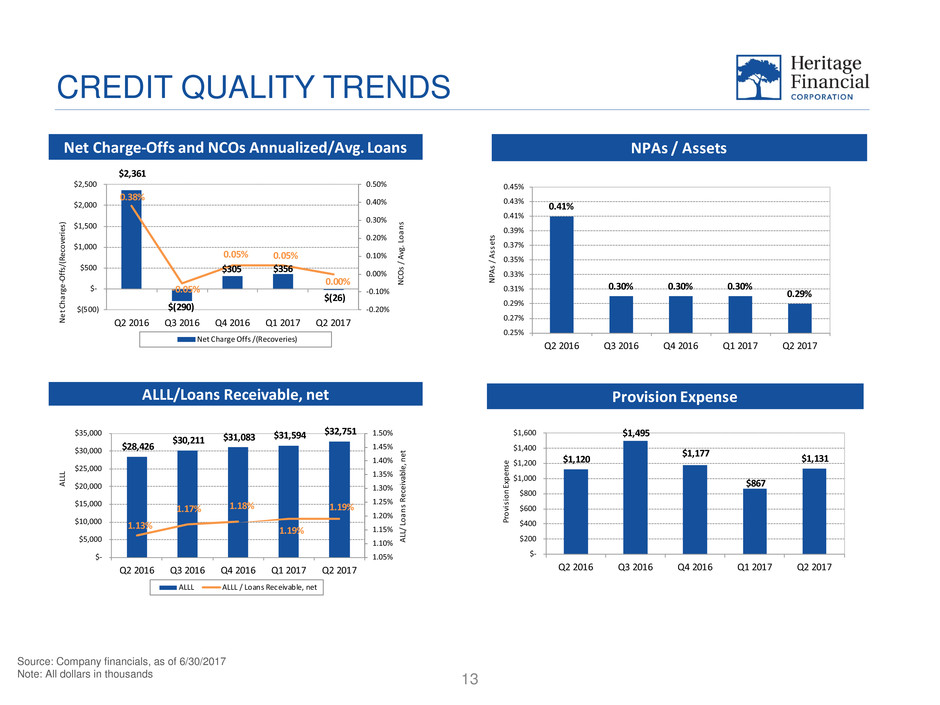
CREDIT QUALITY TRENDS
13
Source: Company financials, as of 6/30/2017
Note: All dollars in thousands
- -
- -
$28,426
$30,211
$31,083 $31,594 $32,751
1.13%
1.17%
1.18%
1.19%
1.19%
1.05%
1.10%
1.15%
1.20%
1.25%
1.30%
1.35%
1.40%
1.45%
1.50%
$-
$5,000
$10,000
$15,000
$20,000
$25,000
$30,000
$35,000
Q2 2016 Q3 2016 Q4 2016 Q1 2017 Q2 2017
A
LL
L/
L
o
a
n
s,
n
et
A
LL
L
ALLL ALLL / Loans Receivable, net
ALLL/Loans Receivable, net
$28,426
$30,211 $31,083 $31,594
$32,751
1.13%
1.17% 1.18%
1.19%
1.19%
1.05%
1.10%
1.15%
1.20%
1.25%
1.30%
1.35%
1.40%
1.45%
1.50%
$-
$5,000
$10,000
$15,000
$20,000
$25,000
$30,000
$35,000
Q2 2016 Q3 2016 Q4 2016 Q1 2017 Q2 2017
A
LL
/
Lo
a
n
s
R
ec
ei
va
bl
e,
n
et
A
LL
L
ALLL ALLL / Loans Receivable, net
$2,361
$(290)
$305 $356
$(26)
0.38%
-0.05%
0.05% 0.05%
0.00%
-0.20%
-0.10%
0.00%
0.10%
0.20%
0.30%
0.40%
0.50%
$(500)
$-
$500
$1,000
$1,500
$2,000
$2,500
Q2 2016 Q3 2016 Q4 2016 Q1 2017 Q2 2017
N
CO
s
/
A
vg
. L
o
a
n
s
N
e
t C
h
a
rg
e
-O
ff
s/
(R
ec
o
ve
ri
es
)
Net Charge Offs /(Recoveries)
Net Charge-Offs and NCOs Annualized/Avg. Loans NPAs / Assets
$1,120
$1,495
$1,177
$867
$1,131
$-
$200
$400
$600
$800
$1,000
$1,200
$1,400
$1,600
Q2 2016 Q3 2016 Q4 2016 Q1 2017 Q2 2017
Pr
o
vi
si
o
n
Ex
p
en
se
Provision Expense
0.41%
0.30% 0.30% 0.30%
0.29%
0.25%
0.27%
0.29%
0.31%
0.33%
0.35%
0.37%
0.39%
0.41%
0.43%
0.45%
Q2 2016 Q3 2016 Q4 2016 Q1 2017 Q2 2017
N
PA
s
/
A
ss
et
s
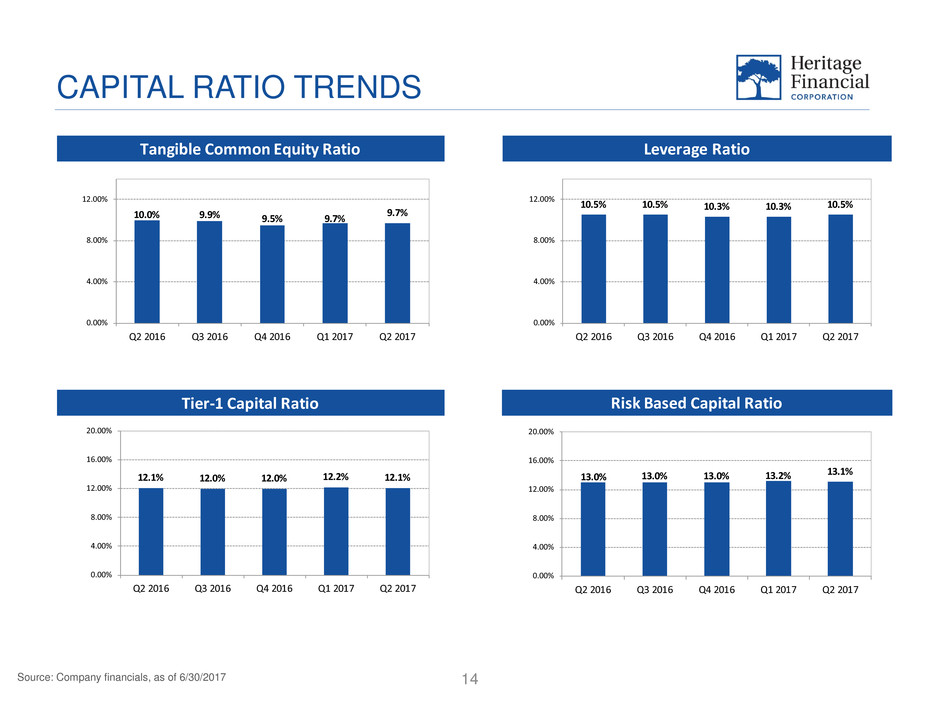
CAPITAL RATIO TRENDS
14Source: Company financials, as of 6/30/2017
- -
- -
Tier-1 Capital Ratio
10.5% 10.5% 10.3% 10.3% 10.5%
0.00%
4.00%
8.00%
12.00%
Q2 2016 Q3 2016 Q4 2016 Q1 2017 Q2 2017
10.0% 9.9% 9.5% 9.7%
9.7%
0.00%
4.00%
8.00%
12.00%
Q2 2016 Q3 2016 Q4 2016 Q1 2017 Q2 2017
12.1% 12.0% 12.0% 12.2% 12.1%
0.00%
4.00%
8.00%
12.00%
16.00%
20.00%
Q2 2016 Q3 2016 Q4 2016 Q1 2017 Q2 2017
13.0% 13.0% 13.0% 13.2% 13.1%
0.00%
4.00%
8.00%
12.00%
16.00%
20.00%
Q2 2016 Q3 2016 Q4 2016 Q1 2017 Q2 2017
Tangible Common Equity Ratio
Risk Based Capital Ratio
Leverage Ratio

PROFITABILITY TRENDS
15
Source: Company financials, as of 6/30/2017
Note: All dollars in thousands, except per share
Return on Average Assets and Return on Average Tangible Common Equity
Ratios are annualized
- -
- -
- -
Diluted Earnings Per Share
$0.30
$0.37
$0.33
$0.31
$0.39
$-
$0.05
$0.10
$0.15
$0.20
$0.25
$0.30
$0.35
$0.40
$0.45
Q2 2016 Q3 2016 Q4 2016 Q1 2017 Q2 2017
Return on Average Assets
$8,895
$11,039
$9,893 $9,316
$11,828
$-
$2,000
$4,000
$6,000
$8,000
$10,000
$12,000
$14,000
Q2 2016 Q3 2016 Q4 2016 Q1 2017 Q2 2017
Dividends Per Share*
0.96%
1.16%
1.03%
0.97%
1.21%
0.00%
0.20%
0.40%
0.60%
0.80%
1.00%
1.20%
1.40%
Q2 2016 Q3 2016 Q4 2016 Q1 2017 Q2 2017
10.03%
11.99%
10.84% 10.51%
12.78%
0.00%
2.00%
4.00%
6.00%
8.00%
10.00%
12.00%
14.00%
Q2 2016 Q3 2016 Q4 2016 Q1 2017 Q2 2017
Return on Average Tangible Common Equity
Net Income
16
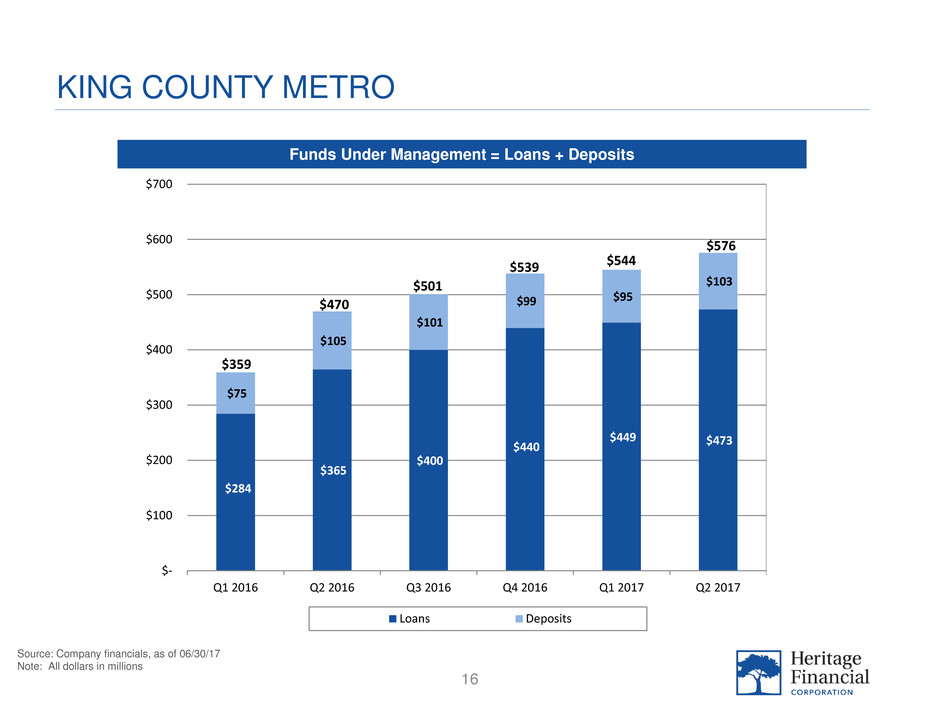
KING COUNTY METRO
Source: Company financials, as of 06/30/17
Note: All dollars in millions
Funds Under Management = Loans + Deposits
$284
$365
$400
$440
$449 $473
$75
$105
$101
$99 $95
$103
$-
$100
$200
$300
$400
$500
$600
$700
Q1 2016 Q2 2016 Q3 2016 Q4 2016 Q1 2017 Q2 2017
Loans Deposits
$359
$470
$501
$539 $544
$576
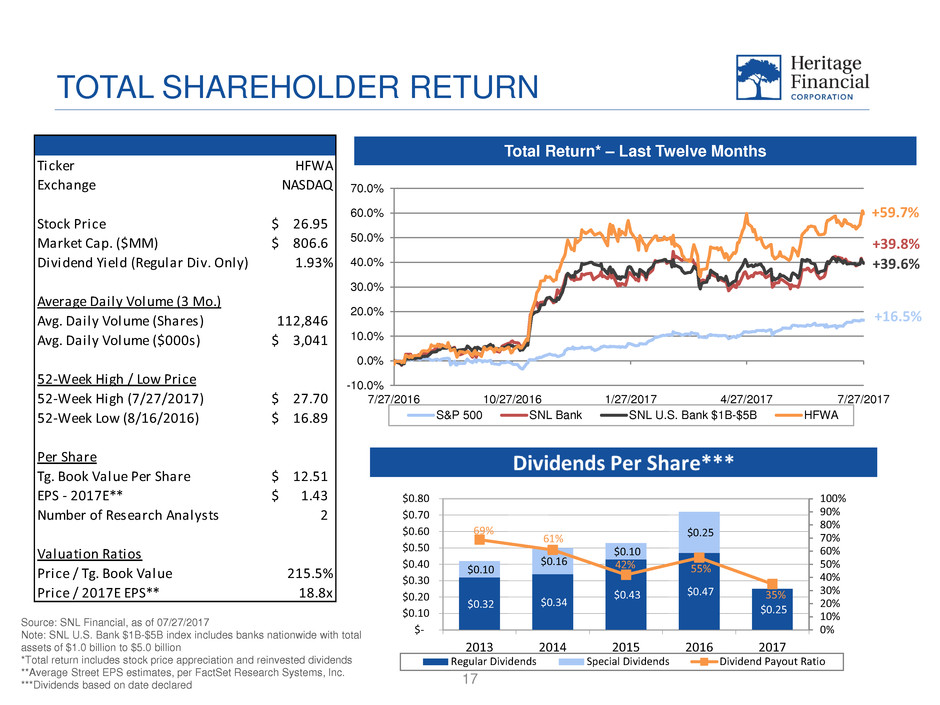
TOTAL SHAREHOLDER RETURN
17
Total Return* – Last Twelve Months
Source: SNL Financial, as of 07/27/2017
Note: SNL U.S. Bank $1B-$5B index includes banks nationwide with total
assets of $1.0 billion to $5.0 billion
*Total return includes stock price appreciation and reinvested dividends
**Average Street EPS estimates, per FactSet Research Systems, Inc.
***Dividends based on date declared
+16.5%
+39.6%
+59.7%
- -
Dividends Per Share***
+39.8%
-10.0%
0.0%
10.0%
20.0%
30.0%
40.0%
50.0%
60.0%
70.0%
7/27/2016 10/27/2016 1/27/2017 4/27/2017 7/27/2017
S&P 500 SNL Bank SNL U.S. Bank $1B-$5B HFWA
Ticker HFWA
Exchange NASDAQ
Stock Price 26.95$
Market Cap. ($MM) 806.6$
Dividend Yield (Regular Div. Only) 1.93%
Average Daily Volume (3 Mo.)
Avg. Daily Volume (Shares) 112,846
Avg. Daily Volume ($000s) 3,041$
52-Week High / Low Price
52-Week High (7/27/2017) 27.70$
52-Week Low (8/16/2016) 16.89$
Per Share
Tg. Book Value Per Share 12.51$
EPS - 2017E** 1.43$
Number of Research Analysts 2
Valuation Ratios
Price / Tg. Book Value 215.5%
Price / 2017E EPS** 18.8x
$0.32 $0.34
$0.43 $0.47
$0.25
$0.10
$0.16
$0.10
$0.25 69% 61%
42% 55%
35%
0%
10%
20%
30%
40%
50%
60%
70%
80%
90%
100%
$-
$0.10
$0.20
$0.30
$0.40
$0.50
$0.60
$0.70
$0.80
2013 2014 2015 2016 2017
Regular Dividends Special Dividends Dividend Payout Ratio
Heritage Financial Corporation to Acquire Puget Sound Bancorp, Inc.
NASDAQ: HFWA OTCQB: PUGB
“Pure Play” Business Banking Franchise
in Desirable Seattle-Bellevue Market
18
19
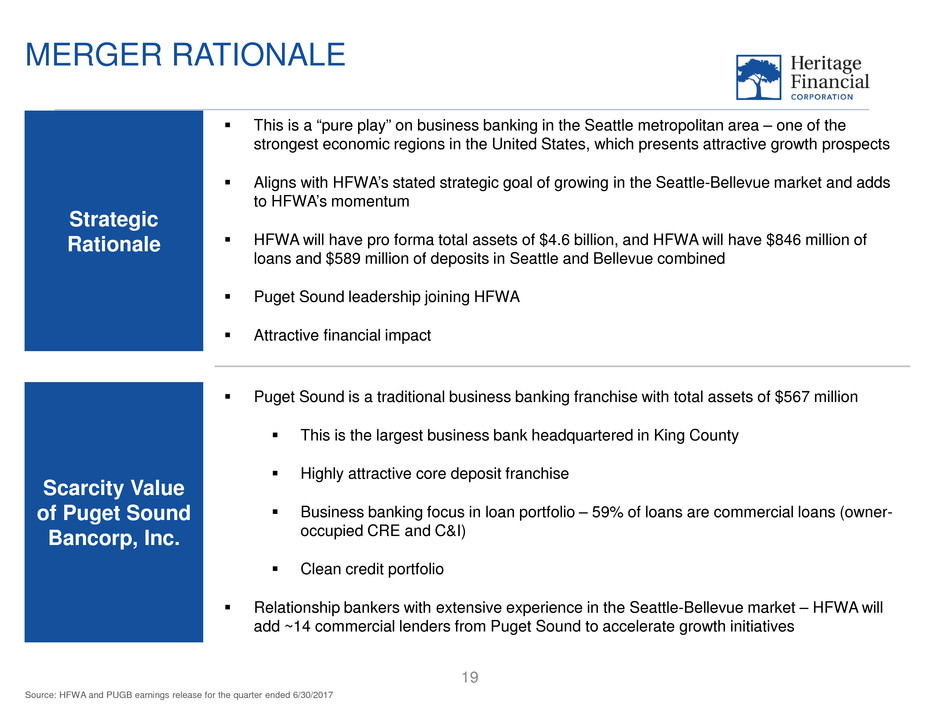
This is a “pure play” on business banking in the Seattle metropolitan area – one of the
strongest economic regions in the United States, which presents attractive growth prospects
Aligns with HFWA’s stated strategic goal of growing in the Seattle-Bellevue market and adds
to HFWA’s momentum
HFWA will have pro forma total assets of $4.6 billion, and HFWA will have $846 million of
loans and $589 million of deposits in Seattle and Bellevue combined
Puget Sound leadership joining HFWA
Attractive financial impact
MERGER RATIONALE
Strategic
Rationale
Scarcity Value
of Puget Sound
Bancorp, Inc.
Puget Sound is a traditional business banking franchise with total assets of $567 million
This is the largest business bank headquartered in King County
Highly attractive core deposit franchise
Business banking focus in loan portfolio – 59% of loans are commercial loans (owner-
occupied CRE and C&I)
Clean credit portfolio
Relationship bankers with extensive experience in the Seattle-Bellevue market – HFWA will
add ~14 commercial lenders from Puget Sound to accelerate growth initiatives
Source: HFWA and PUGB earnings release for the quarter ended 6/30/2017
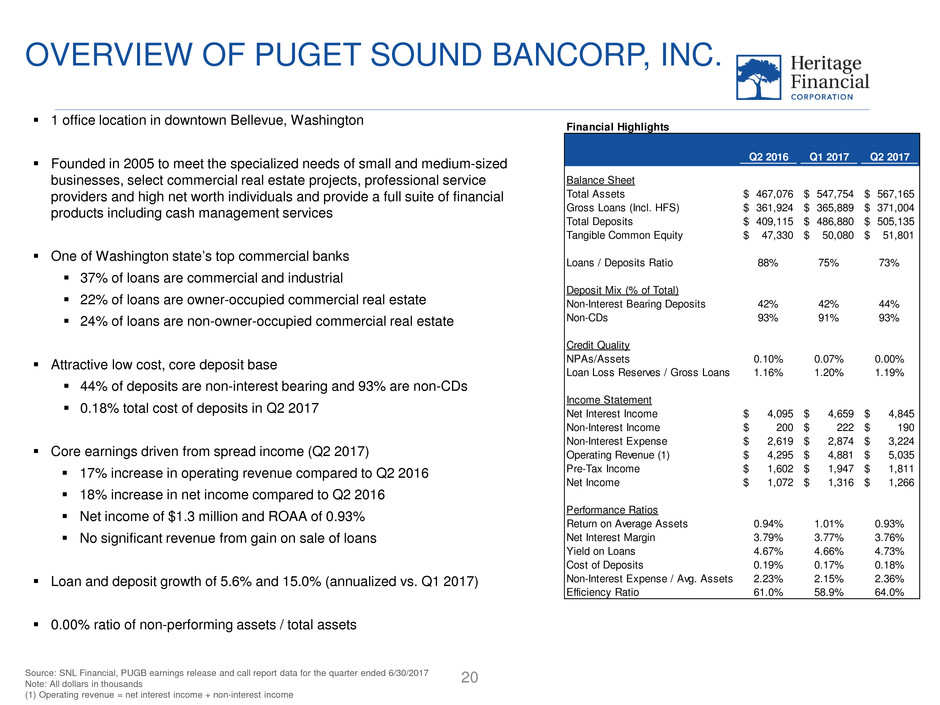
OVERVIEW OF PUGET SOUND BANCORP, INC.
20
1 office location in downtown Bellevue, Washington
Founded in 2005 to meet the specialized needs of small and medium-sized
businesses, select commercial real estate projects, professional service
providers and high net worth individuals and provide a full suite of financial
products including cash management services
One of Washington state’s top commercial banks
37% of loans are commercial and industrial
22% of loans are owner-occupied commercial real estate
24% of loans are non-owner-occupied commercial real estate
Attractive low cost, core deposit base
44% of deposits are non-interest bearing and 93% are non-CDs
0.18% total cost of deposits in Q2 2017
Core earnings driven from spread income (Q2 2017)
17% increase in operating revenue compared to Q2 2016
18% increase in net income compared to Q2 2016
Net income of $1.3 million and ROAA of 0.93%
No significant revenue from gain on sale of loans
Loan and deposit growth of 5.6% and 15.0% (annualized vs. Q1 2017)
0.00% ratio of non-performing assets / total assets
Source: SNL Financial, PUGB earnings release and call report data for the quarter ended 6/30/2017
Note: All dollars in thousands
(1) Operating revenue = net interest income + non-interest income
Financial Highlights
Q2 2016 Q1 2017 Q2 2017
Balance Sheet
Total Assets 467,076$ 547,754$ 567,165$
Gross Loans (Incl. HFS) 361,924$ 365,889$ 371,004$
Total Deposits 409,115$ 486,880$ 505,135$
Tangible Common Equity 47,330$ 50,080$ 51,801$
Loans / Deposits Ratio 88% 75% 73%
Deposit Mix (% of Total)
Non-Interest Bearing Deposits 42% 42% 44%
Non-CDs 93% 91% 93%
Credit Quality
NPAs/Assets 0.10% 0.07% 0.00%
Loan Loss Reserves / Gross Loans 1.16% 1.20% 1.19%
Income Statement
Net Interest Income 4,095$ 4,659$ 4,845$
Non-Interest Income 200$ 222$ 190$
Non-Interest Expense 2,619$ 2,874$ 3,224$
Operating Revenue (1) 4,295$ 4,881$ 5,035$
Pre-Tax Income 1,602$ 1,947$ 1,811$
Net Income 1,072$ 1,316$ 1,266$
Performance Ratios
Return on Average Assets 0.94% 1.01% 0.93%
Net Interest Margin 3.79% 3.77% 3.76%
Yield on Loans 4.67% 4.66% 4.73%
Cost of Deposits 0.19% 0.17% 0.18%
Non-Interest Expense / Avg. Assets 2.23% 2.15% 2.36%
Efficiency Ratio 61.0% 58.9% 64.0%
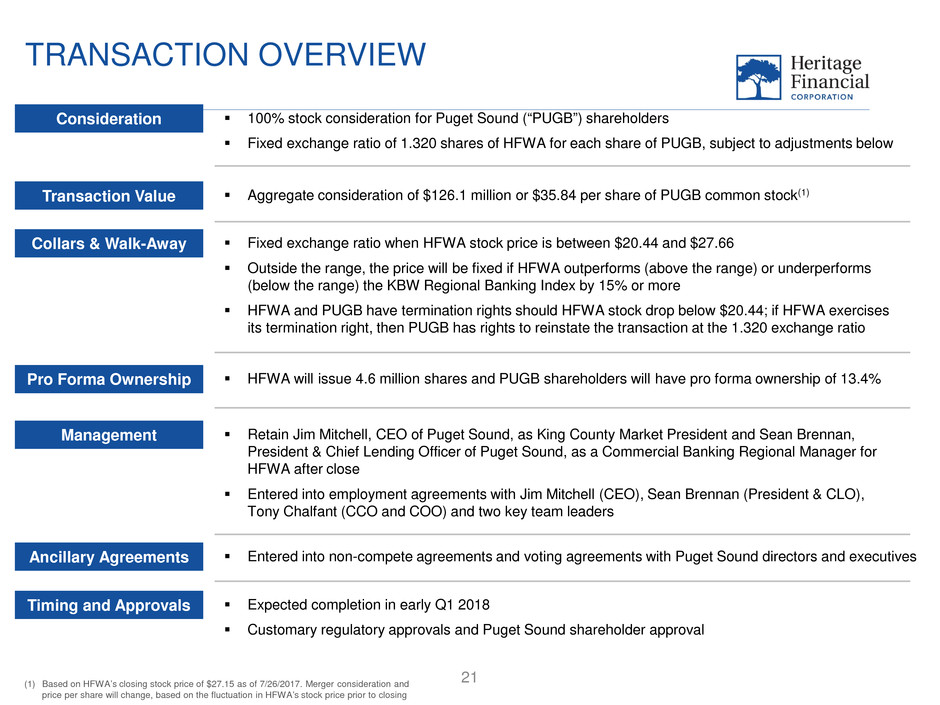
TRANSACTION OVERVIEW
21
Transaction Value Aggregate consideration of $126.1 million or $35.84 per share of PUGB common stock(1)
Timing and Approvals Expected completion in early Q1 2018
Customary regulatory approvals and Puget Sound shareholder approval
Ancillary Agreements Entered into non-compete agreements and voting agreements with Puget Sound directors and executives
Consideration 100% stock consideration for Puget Sound (“PUGB”) shareholders
Fixed exchange ratio of 1.320 shares of HFWA for each share of PUGB, subject to adjustments below
Collars & Walk-Away Fixed exchange ratio when HFWA stock price is between $20.44 and $27.66
Outside the range, the price will be fixed if HFWA outperforms (above the range) or underperforms
(below the range) the KBW Regional Banking Index by 15% or more
HFWA and PUGB have termination rights should HFWA stock drop below $20.44; if HFWA exercises
its termination right, then PUGB has rights to reinstate the transaction at the 1.320 exchange ratio
Pro Forma Ownership HFWA will issue 4.6 million shares and PUGB shareholders will have pro forma ownership of 13.4%
(1) Based on HFWA’s closing stock price of $27.15 as of 7/26/2017. Merger consideration and
price per share will change, based on the fluctuation in HFWA’s stock price prior to closing
Management Retain Jim Mitchell, CEO of Puget Sound, as King County Market President and Sean Brennan,
President & Chief Lending Officer of Puget Sound, as a Commercial Banking Regional Manager for
HFWA after close
Entered into employment agreements with Jim Mitchell (CEO), Sean Brennan (President & CLO),
Tony Chalfant (CCO and COO) and two key team leaders
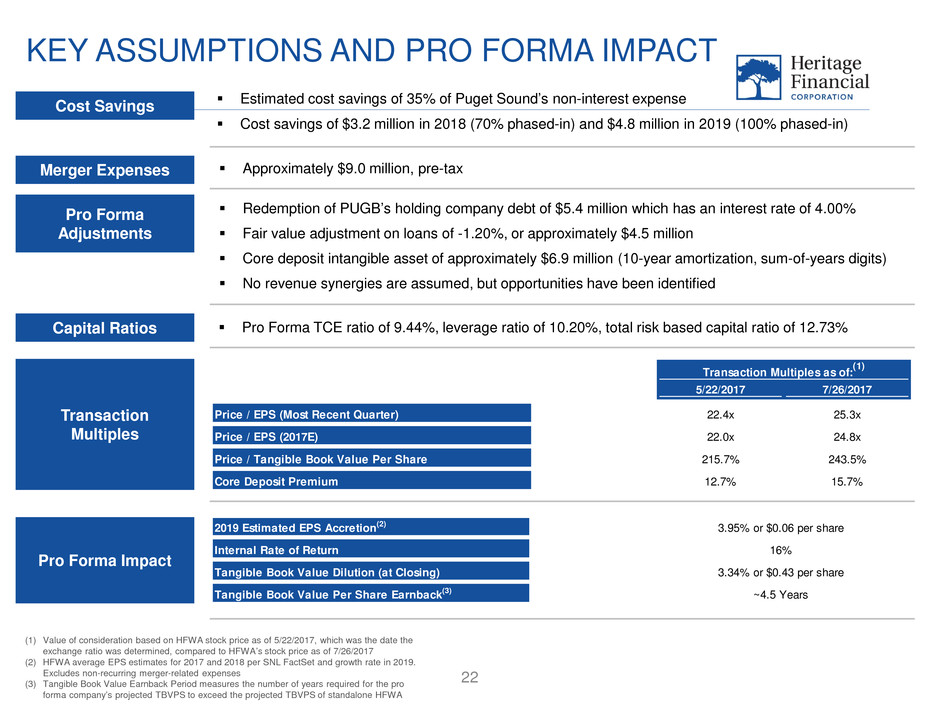
2019 Estimated EPS Accretion(2) 3.95% or $0.06 per share
Internal Rate of Return 16%
Tangible Book Value Dilution (at Closing) 3.34% or $0.43 per share
Tangible Book Value Per Share Earnback(3) ~4.5 Years
5/22/2017 7/26/2017
Price / EPS (Most Recent Quarter) 22.4x 25.3x
Price / EPS (2017E) 22.0x 24.8x
Price / Tangible Book Value Per Share 215.7% 243.5%
Core Deposit Premium 12.7% 15.7%
Transaction Multiples as of:(1)
KEY ASSUMPTIONS AND PRO FORMA IMPACT
22
(1) Value of consideration based on HFWA stock price as of 5/22/2017, which was the date the
exchange ratio was determined, compared to HFWA’s stock price as of 7/26/2017
(2) HFWA average EPS estimates for 2017 and 2018 per SNL FactSet and growth rate in 2019.
Excludes non-recurring merger-related expenses
(3) Tangible Book Value Earnback Period measures the number of years required for the pro
forma company’s projected TBVPS to exceed the projected TBVPS of standalone HFWA
Cost Savings Estimated cost savings of 35% of Puget Sound’s non-interest expense
Cost savings of $3.2 million in 2018 (70% phased-in) and $4.8 million in 2019 (100% phased-in)
Merger Expenses Approximately $9.0 million, pre-tax
Pro Forma
Adjustments
Redemption of PUGB’s holding company debt of $5.4 million which has an interest rate of 4.00%
Fair value adjustment on loans of -1.20%, or approximately $4.5 million
Core deposit intangible asset of approximately $6.9 million (10-year amortization, sum-of-years digits)
No revenue synergies are assumed, but opportunities have been identified
Transaction
Multiples
Pro Forma Impact
Pro Forma TCE ratio of 9.44%, leverage ratio of 10.20%, total risk based capital ratio of 12.73%Capital Ratios
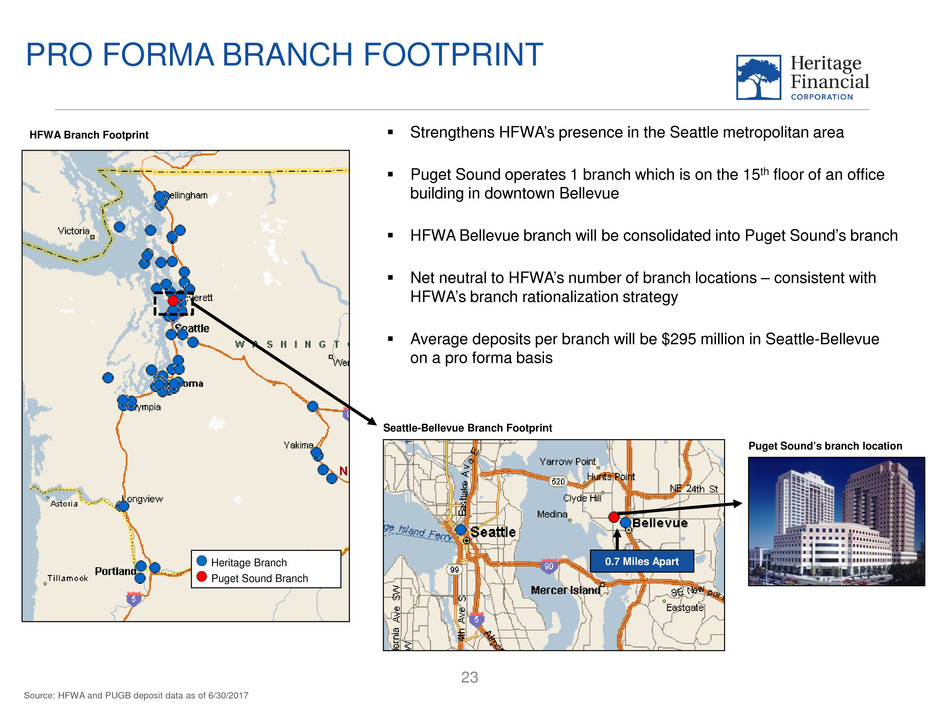
PRO FORMA BRANCH FOOTPRINT
23
Heritage Branch
Puget Sound Branch
Strengthens HFWA’s presence in the Seattle metropolitan area
Puget Sound operates 1 branch which is on the 15th floor of an office
building in downtown Bellevue
HFWA Bellevue branch will be consolidated into Puget Sound’s branch
Net neutral to HFWA’s number of branch locations – consistent with
HFWA’s branch rationalization strategy
Average deposits per branch will be $295 million in Seattle-Bellevue
on a pro forma basis
0.7 Miles Apart
Source: HFWA and PUGB deposit data as of 6/30/2017
HFWA Branch Footprint
Seattle-Bellevue Branch Footprint
Puget Sound’s branch location
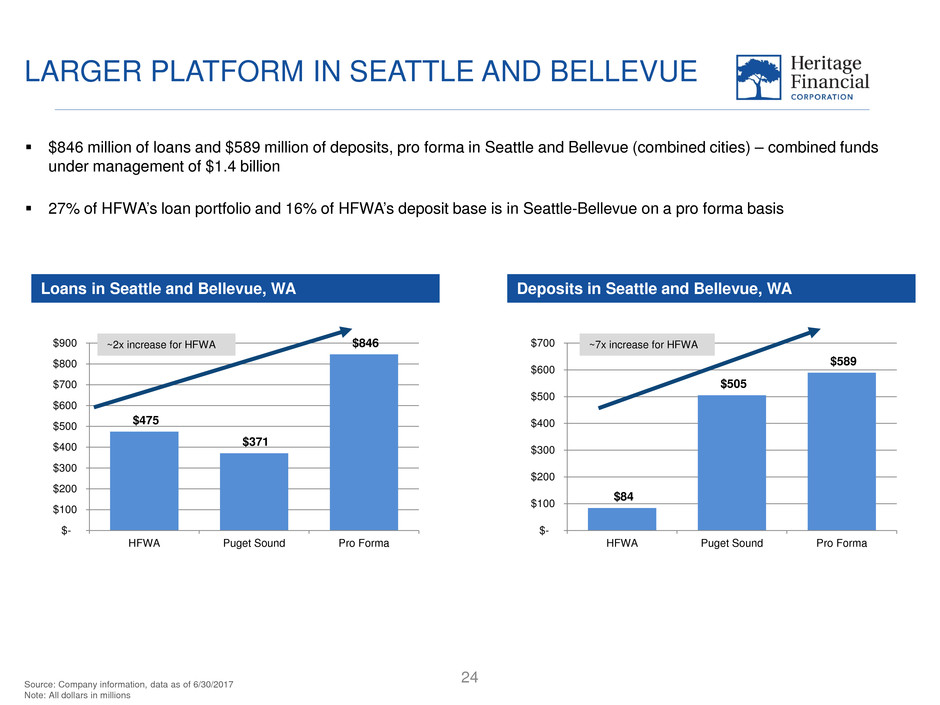
$475
$371
$846
$-
$100
$200
$300
$400
$500
$600
$700
$800
$900
HFWA Puget Sound Pro Forma
$84
$505
$589
$-
$100
$200
$300
$400
$500
$600
$700
HFWA Puget Sound Pro Forma
LARGER PLATFORM IN SEATTLE AND BELLEVUE
24
Loans in Seattle and Bellevue, WA
$846 million of loans and $589 million of deposits, pro forma in Seattle and Bellevue (combined cities) – combined funds
under management of $1.4 billion
27% of HFWA’s loan portfolio and 16% of HFWA’s deposit base is in Seattle-Bellevue on a pro forma basis
~2x increase for HFWA
Source: Company information, data as of 6/30/2017
Note: All dollars in millions
Deposits in Seattle and Bellevue, WA
~7x increase for HFWA

Seattle, WA and Bellevue, WA (Combined Cities)
Rank
Total
In-Market
HQ Institution (State)
Number of
Branches
Deposits in
Market
Market
Share
1 Bank of America Corp. (NC) 46 16,529,180$ 28.9%
2 Wells Fargo & Co. (CA) 35 7,845,087$ 13.7%
3 U.S. Bancorp (MN) 31 7,084,457$ 12.4%
4 JPMorgan Chase & Co. (NY) 41 5,851,757$ 10.2%
5 KeyCorp (OH) 34 4,876,303$ 8.5%
6 1 Washington Federal Inc. (WA) 18 2,361,085$ 4.1%
7 2 HomeStreet Inc. (WA) 14 2,159,250$ 3.8%
8 Mitsubishi UFJ Financial 6 1,652,375$ 2.9%
9 W.T.B. Financial Corp. (WA) 3 1,335,868$ 2.3%
10 East West Bancorp Inc. (CA) 4 1,242,090$ 2.2%
11 Columbia Banking System Inc. (WA) 5 1,033,851$ 1.8%
12 Umpqua Holdings Corp. (OR) 12 1,005,138$ 1.8%
13 Zions Bancorp. (UT) 1 898,744$ 1.6%
14 HSBC Holdings 2 744,044$ 1.3%
15 Banner Corp. (WA) 7 516,037$ 0.9%
16 Pro Forma HFWA 2 497,681$ 0.9%
16 3 Puget Sound Bancorp Inc. (WA) 1 409,466$ 0.7%
17 Cathay General Bancorp (CA) 2 291,831$ 0.5%
18 Opus Bank (CA) 3 215,363$ 0.4%
19 4 Seattle Bank (WA) 1 168,452$ 0.3%
20 5 First Sound Bank (WA) 1 120,460$ 0.2%
21 Peoples Bancorp (WA) 3 120,295$ 0.2%
22 BayCom Corp. (CA) 2 101,501$ 0.2%
23 6 Sound Financial Bancorp Inc. (WA) 1 98,900$ 0.2%
24 Northern Trust Corp. (IL) 1 88,958$ 0.2%
25 Heritage Financial Corp. (WA) 2 88,215$ 0.2%
Total For Institutions In Market 293 $ 57,107,753
Out of 40 Institutions
STRENGTHENING MARKET SHARE
25
Puget Sound has significant scarcity value
in this market
Puget Sound is the largest business
bank in Seattle or Bellevue
3rd largest deposit market share
among banks headquartered in
Seattle or Bellevue
Limited opportunities to acquire a quality
franchise in Seattle-Bellevue
Source: SNL Financial, FDIC deposit data as of 6/30/2016
Note: All dollars in thousands
Note: Information for Seattle MSA, where available
(1) www.cnbc.com
(2) Bureau of Economic Analysis
(3) Nielsen U.S. Census data
(4) www.zillow.com
STRONG AND DIVERSE ECONOMIC LANDSCAPE
26
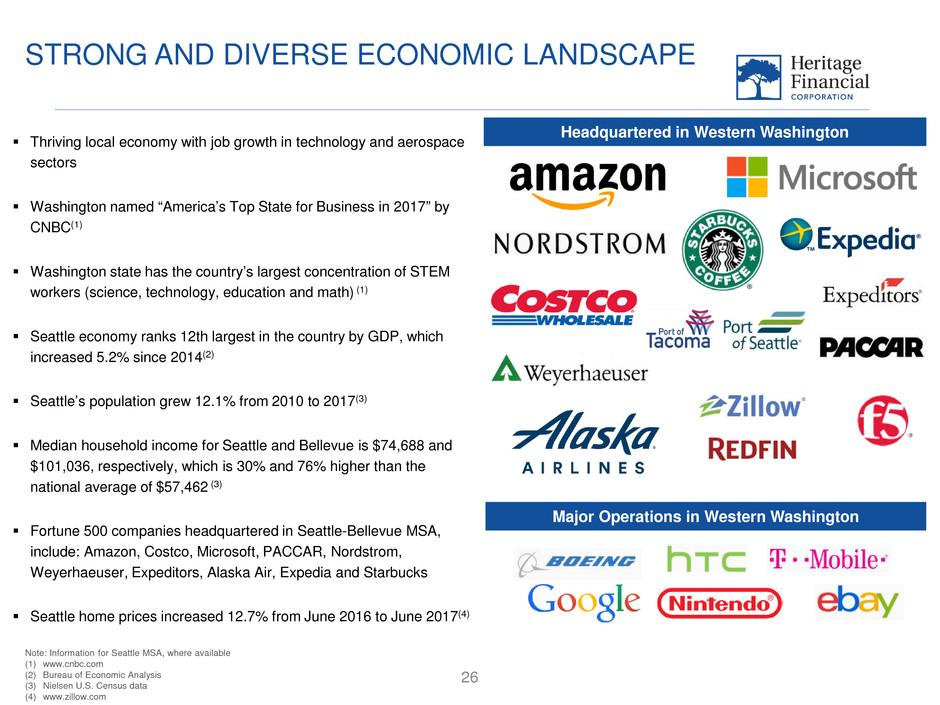
Thriving local economy with job growth in technology and aerospace
sectors
Washington named “America’s Top State for Business in 2017” by
CNBC(1)
Washington state has the country’s largest concentration of STEM
workers (science, technology, education and math) (1)
Seattle economy ranks 12th largest in the country by GDP, which
increased 5.2% since 2014(2)
Seattle’s population grew 12.1% from 2010 to 2017(3)
Median household income for Seattle and Bellevue is $74,688 and
$101,036, respectively, which is 30% and 76% higher than the
national average of $57,462 (3)
Fortune 500 companies headquartered in Seattle-Bellevue MSA,
include: Amazon, Costco, Microsoft, PACCAR, Nordstrom,
Weyerhaeuser, Expeditors, Alaska Air, Expedia and Starbucks
Seattle home prices increased 12.7% from June 2016 to June 2017(4)
Headquartered in Western Washington
Major Operations in Western Washington
HFWA INVESTMENT THESIS
27
• Western Washington geographic footprint with vibrant
economy and attractive long-term demographics
• Management team with proven skills in both organic
growth as well as the acquisition and integration of whole
banks and commercial banking teams
• Disciplined credit and capital management
• Strong financial performance
28
APPENDIX
HISTORICAL FINANCIAL HIGHLIGHTS
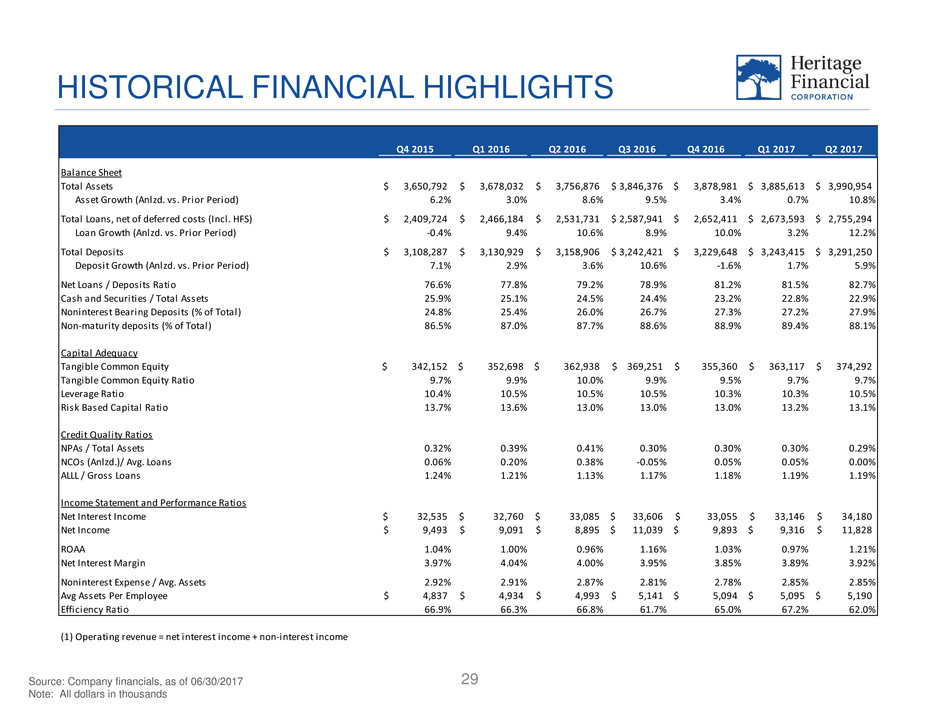
29Source: Company financials, as of 06/30/2017
Note: All dollars in thousands
Q4 2015 Q1 2016 Q2 2016 Q3 2016 Q4 2016 Q1 2017 Q2 2017
Balance Sheet
Total Assets 3,650,792$ 3,678,032$ 3,756,876$ 3,846,376$ 3,878,981$ 3,885,613$ 3,990,954$
Asset Growth (Anlzd. vs. Prior Period) 6.2% 3.0% 8.6% 9.5% 3.4% 0.7% 10.8%
Total Loans, net of deferred costs (Incl. HFS) 2,409,724$ 2,466,184$ 2,531,731$ 2,587,941$ 2,652,411$ 2,673,593$ 2,755,294$
Loan Growth (Anlzd. vs. Prior Period) -0.4% 9.4% 10.6% 8.9% 10.0% 3.2% 12.2%
Total Deposits 3,108,287$ 3,130,929$ 3,158,906$ 3,242,421$ 3,229,648$ 3,243,415$ 3,291,250$
Deposit Growth (Anlzd. vs. Prior Period) 7.1% 2.9% 3.6% 10.6% -1.6% 1.7% 5.9%
Net Loans / Deposits Ratio 76.6% 77.8% 79.2% 78.9% 81.2% 81.5% 82.7%
Cash and Securities / Total Assets 25.9% 25.1% 24.5% 24.4% 23.2% 22.8% 22.9%
Noninterest Bearing Deposits (% of Total) 24.8% 25.4% 26.0% 26.7% 27.3% 27.2% 27.9%
Non-maturity deposits (% of Total) 86.5% 87.0% 87.7% 88.6% 88.9% 89.4% 88.1%
Capital Adequacy
Tangible Common Equity 342,152$ 352,698$ 362,938$ 369,251$ 355,360$ 363,117$ 374,292$
Tangible Common Equity Ratio 9.7% 9.9% 10.0% 9.9% 9.5% 9.7% 9.7%
Leverage Ratio 10.4% 10.5% 10.5% 10.5% 10.3% 10.3% 10.5%
Risk Based Capital Ratio 13.7% 13.6% 13.0% 13.0% 13.0% 13.2% 13.1%
Credit Quality Ratios
NPAs / Total Assets 0.32% 0.39% 0.41% 0.30% 0.30% 0.30% 0.29%
NCOs (Anlzd.)/ Avg. Loans 0.06% 0.20% 0.38% -0.05% 0.05% 0.05% 0.00%
ALLL / Gross Loans 1.24% 1.21% 1.13% 1.17% 1.18% 1.19% 1.19%
Income Statement and Performance Ratios
Net Interest Income 32,535$ 32,760$ 33,085$ 33,606$ 33,055$ 33,146$ 34,180$
Net Income 9,493$ 9,091$ 8,895$ 11,039$ 9,893$ 9,316$ 11,828$
ROAA 1.04% 1.00% 0.96% 1.16% 1.03% 0.97% 1.21%
Net Interest Margin 3.97% 4.04% 4.00% 3.95% 3.85% 3.89% 3.92%
Noninterest Expense / Avg. Assets 2.92% 2.91% 2.87% 2.81% 2.78% 2.85% 2.85%
Avg Assets Per Employee 4,837$ 4,934$ 4,993$ 5,141$ 5,094$ 5,095$ 5,190$
Efficiency Ratio 66.9% 66.3% 66.8% 61.7% 65.0% 67.2% 62.0%
(1) Operating revenue = net interest income + non-interest income
DISCOUNTS ON ACQUIRED LOANS
30
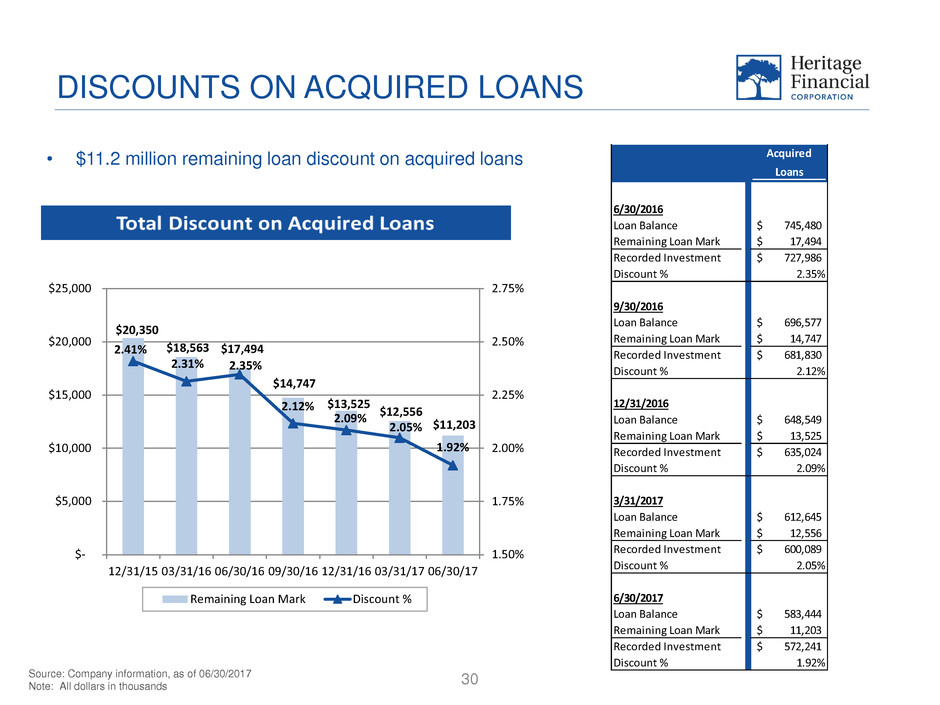
• $11.2 million remaining loan discount on acquired loans
Source: Company information, as of 06/30/2017
Note: All dollars in thousands
Acquired
Loans
6/30/2016
Loan Balance 745,480$
Remaining Loan Mark 17,494$
Recorded Investment 727,986$
Discount % 2.35%
9/30/2016
Loan Balance 696,577$
Remaining Loan Mark 14,747$
Recorded Investment 681,830$
Discount % 2.12%
12/31/2016
Loan Balance 648,549$
Remaining Loan Mark 13,525$
Recorded Investment 635,024$
Discount % 2.09%
3/31/2017
Loan Balance 612,645$
Remaining Loan Mark 12,556$
Recorded Investment 600,089$
Discount % 2.05%
6/30/2017
Loan Balance 583,444$
Remaining Loan Mark 11,203$
Recorded Investment 572,241$
Discount % 1.92%
$20,350
$18,563 $17,494
$14,747
$13,525
$12,556
$11,203
2.41%
2.31% 2.35%
2.12%
2.09%
2.05%
1.92%
1.50%
1.75%
2.00%
2.25%
2.50%
2.75%
$-
$5,000
$10,000
$15,000
$20,000
$25,000
12/31/15 03/31/16 06/30/16 09/30/16 12/31/16 03/31/17 06/30/17
Remaining Loan Mark Discount %
31
32
33
