Attached files
| file | filename |
|---|---|
| EX-32.1 - EXHIBIT 32.1 - HERITAGE FINANCIAL CORP /WA/ | ex-32110k123117.htm |
| EX-31.2 - EXHIBIT 31.2 - HERITAGE FINANCIAL CORP /WA/ | ex-31210k123117.htm |
| EX-31.1 - EXHIBIT 31.1 - HERITAGE FINANCIAL CORP /WA/ | ex-31110k123117.htm |
| EX-24.0 - EXHIBIT 24.0 - HERITAGE FINANCIAL CORP /WA/ | ex-24010k123117.htm |
| EX-23.0 - EXHIBIT 23.0 - HERITAGE FINANCIAL CORP /WA/ | ex-23010k123117.htm |
| EX-21.0 - EXHIBIT 21.0 - HERITAGE FINANCIAL CORP /WA/ | ex-21010k123117.htm |
UNITED STATES
SECURITIES AND EXCHANGE COMMISSION
WASHINGTON, D.C. 20549
FORM 10-K
x ANNUAL REPORT PURSUANT TO SECTION 13 OR 15(d) OF THE SECURITIES EXCHANGE ACT OF 1934
For the fiscal year ended December 31, 2017 or
¨ TRANSITION REPORT PURSUANT TO SECTION 13 OR 15(d) OF THE SECURITIES EXCHANGE ACT OF 1934
For the transition period from __________ to __________
Commission File Number 000-29480
HERITAGE FINANCIAL CORPORATION
(Exact name of registrant as specified in its charter)
Washington | 91-1857900 | |
(State or other jurisdiction of incorporation or organization) | (I.R.S. Employer Identification No.) | |
201 Fifth Avenue SW, Olympia, WA | 98501 | |
(Address of principal executive offices) | (Zip Code) | |
(360) 943-1500
(Registrant’s telephone number, including area code)
Securities registered pursuant to Section 12(b) of the Act:
Title of each class | Name of each exchange on which registered | |
Common Stock | NASDAQ Stock Market LLC | |
Securities registered pursuant to Section 12(g) of the Act: None
Indicate by check mark if the registrant is a well-known seasoned issuer, as defined in Rule 405 of the Securities Act. Yes ¨ No ý
Indicate by check mark if the registrant is not required to file reports pursuant to Section 13 or Section 15(d) of the Act. Yes ¨ No ý
Indicate by check mark whether the registrant (1) has filed all reports required to be filed by Section 13 or 15(d) of the Securities Exchange Act of 1934 during the preceding 12 months (or for such shorter period that the registrant was required to file such reports), and (2) has been subject to such filing requirements for the past 90 days. Yes ý No ¨
Indicate by check mark whether the registrant has submitted electronically and posted on its corporate Web site, if any, every Interactive Data File required to be submitted and posted pursuant to Rule 405 of Regulation S-T (§232.405 of this chapter) during the preceding 12 months (or for such shorter period that the registrant was required to submit and post such files). Yes ý No ¨
Indicate by check mark if disclosure of delinquent filers pursuant to Item 405 of Regulation S-K (§229.405 of this chapter) is not contained herein, and will not be contained, to the best of the registrant’s knowledge, in definitive proxy or information statements incorporated by reference in Part III of this Form 10-K or any amendment to this Form 10-K. ¨
Indicate by check mark whether the registrant is a large accelerated filer, an accelerated filer, a non-accelerated filer, smaller reporting company, or an emerging growth company. See the definitions of "large accelerated filer", "accelerated filer", "smaller reporting company," and "emerging growth company" in Rule 12b-2 of the Exchange Act
Large accelerated filer ý | Accelerated filer ¨ | |||
Non-accelerated filer ¨ (Do not check if a smaller reporting company) | Smaller reporting company ¨ | |||
Emerging growth company ¨ | ||||
If an emerging growth company, indicate by check mark if the registrant has elected not to use the extended transition period for complying with any new or revised financial accounting standards pursuant to Section 13(a) of the Exchange Act. ¨
Indicate by check mark whether the registrant is a shell company (as defined in Rule 12b-2 of the Exchange Act). Yes ¨ No ý
The aggregate market value of the voting and non-voting common equity held by non-affiliates of the registrant as of June 30, 2017, based on the closing price of its common stock on such date, on the NASDAQ Global Select Market, of $26.50 per share, and 29,335,571 shares held by non-affiliates was $777,392,632. The registrant had 34,013,263 shares of common stock outstanding as of February 20, 2018.
DOCUMENTS INCORPORATED BY REFERENCE
Portions of the registrant’s definitive Proxy Statement for the 2018 Annual Meeting of Shareholders will be incorporated by reference into Part III of this Form 10-K.
HERITAGE FINANCIAL CORPORATION AND SUBSIDIARIES
FORM 10-K
December 31, 2017
TABLE OF CONTENTS
Page | ||
ITEM 1. | ||
ITEM 1A. | ||
ITEM 1B. | ||
ITEM 2. | ||
ITEM 3. | ||
ITEM 4. | ||
ITEM 5. | ||
ITEM 6. | ||
ITEM 7. | ||
ITEM 7A. | ||
ITEM 8. | ||
ITEM 9. | ||
ITEM 9A. | ||
ITEM 9B. | ||
ITEM 10. | ||
ITEM 11. | ||
ITEM 12. | ||
ITEM 13. | ||
ITEM 14. | ||
ITEM 15. | ||
ITEM 16. | ||
2
CAUTIONARY NOTE REGARDING FORWARD-LOOKING STATEMENTS
This Annual Report on Form 10-K ("Form 10-K") may contain forward-looking statements within the meaning of the Private Securities Litigation Reform Act of 1995. Forward-looking statements often include the words “believes,” “expects,” “anticipates,” “estimates,” “forecasts,” “intends,” “plans,” “targets,” “potentially,” “probably,” “projects,” “outlook” or similar expressions or future or conditional verbs such as “may,” “will,” “should,” “would” and “could.” These forward-looking statements are subject to known and unknown risks, uncertainties and other factors that could cause actual results to differ materially from the results anticipated, including:
• | our ability to successfully integrate any assets, liabilities, customers, systems, and management personnel from our recent merger with Puget Sound Bancorp, Inc., or may in the future acquire, into our operations and our ability to realize related revenue synergies and cost savings within expected time frames or at all, and any goodwill charges related thereto and costs or difficulties relating to integration matters, including but not limited to customer and employee retention, which might be greater than expected; |
• | the credit risks of lending activities, including changes in the level and trend of loan delinquencies and write-offs and changes in our allowance for loan losses and provision for loan losses that may be impacted by deterioration in the housing and commercial real estate markets, which may lead to increased losses and non-performing assets in our loan portfolio, and may result in our allowance for loan losses not being adequate to cover actual losses, and require us to increase our allowance for loan losses and increase our provision for loan losses; |
• | changes in general economic conditions, either nationally or in our market areas; |
• | changes in the levels of general interest rates, and the relative differences between short and long term interest rates, deposit interest rates, our net interest margin and funding sources; |
• | risks related to acquiring assets in or entering markets in which we have not previously operated and may not be familiar; |
• | fluctuations in the demand for loans, the number of unsold homes and other properties and fluctuations in real estate values in our market areas; |
• | results of examinations of us by the bank regulators, including the possibility that any such regulatory authority may, among other things, require us to increase our allowance for loan losses, write-down assets, change our regulatory capital position, affect our ability to borrow funds or maintain or increase deposits, or impose additional requirements on us, any of which could affect our ability to continue our growth through mergers, acquisitions or similar transactions and adversely affect our liquidity and earnings; |
• | legislative or regulatory changes that adversely affect our business including but not limited to, the Dodd-Frank Wall Street Reform and Consumer Protection Act of 2010 (“Dodd-Frank Act") and implementing regulations, changes in regulatory policies and principles, or the interpretation of regulatory capital or other rules as a result of Basel III; |
• | our ability to control operating costs and expenses; |
• | increases in premiums for deposit insurance; |
• | the use of estimates in determining fair value of certain of our assets, which estimates may prove to be incorrect and result in significant declines in valuation; |
• | staffing fluctuations in response to product demand or the implementation of corporate strategies that affect our workforce and potential associated charges; |
• | disruptions, security breaches, or other adverse events, failures or interruptions in, or attacks on, our information technology systems or on the third-party vendors who perform several of our critical processing functions; |
• | our ability to retain key members of our senior management team; |
• | costs and effects of litigation, including settlements and judgments; |
• | our ability to implement our growth strategies; |
• | increased competitive pressures among financial service companies; |
• | changes in consumer spending, borrowing and savings habits; |
• | the availability of resources to address changes in laws, rules, or regulations or to respond to regulatory actions; |
• | adverse changes in the securities markets; |
• | inability of key third-party providers to perform their obligations to us; |
• | changes in accounting policies and practices, as may be adopted by the financial institution regulatory agencies or the Financial Accounting Standards Board (“FASB"), including additional guidance and interpretation on accounting issues and details of the implementation of new accounting methods; and |
3
• | other economic, competitive, governmental, regulatory, and technological factors affecting our operations, pricing, products and services and the other risks described elsewhere in this Form 10-K. |
Some of these and other factors are discussed in this Form 10-K under the caption “Item 1A. Risk Factors” and elsewhere in this Form 10-K. Such developments could have a material adverse impact on our business, financial position and results of operations.
We caution readers not to place undue reliance on any forward-looking statements on any forward-looking statements discussed in this Form 10-K. Moreover, you should treat these statements as speaking only as of the date they are made and based only on information then actually known to us. We do not undertake and specifically disclaim any obligation to revise any forward-looking statements to reflect the occurrence of anticipated or unanticipated events or circumstances after the date of such statements. These risks could cause our actual results for future periods to differ materially from those expressed in any forward-looking statements by, or on behalf of, us, and could negatively affect our operating results and stock price performance.
As used throughout this report, the terms “we”, “our”, “us”, “Heritage” or the “Company” refers to Heritage Financial Corporation and its consolidated subsidiaries, unless the context otherwise requires.
PART I
ITEM 1. BUSINESS
General
Heritage Financial Corporation is a bank holding company that was incorporated in the State of Washington in August 1997. We are primarily engaged in the business of planning, directing, and coordinating the business activities of our wholly owned subsidiary, Heritage Bank (the "Bank"). The deposits of the Bank are insured by the Federal Deposit Insurance Corporation (“FDIC").
Heritage Bank is headquartered in Olympia, Washington and conducts business from its 60 branch offices located primarily along the I-5 corridor in the western Washington and the greater Portland, Oregon area, including one branch acquired in our merger with Puget Sound Bank in January 2018. We additionally have offices located in central Washington, primarily in Yakima County.
Our business consists primarily of commercial lending and deposit relationships with small and medium sized businesses and their owners in our market areas, and attracting deposits from the general public. We also make real estate construction and land development loans and consumer loans. The Bank also originates for sale or investment purposes one-to-four family residential loans on residential properties located primarily in our market.
Business Strategy
Our business strategy is to be a community bank, seeking deposits from our communities and making loans to customers with local ties to our markets. We believe we have an innovative team providing financial services and focusing on the success of our customers. We are committed to being the leading community bank in the Pacific Northwest by continuously improving customer satisfaction, employee empowerment, community investment and shareholder value. Our commitment defines our relationships, sets expectations for our actions and directs decision-making in these four fundamental areas. We will seek to achieve our business goals through the following strategies:
Expand geographically as opportunities present themselves. We are committed to continuing the controlled expansion of our franchise through strategic acquisitions designed to increase our market share and enhance franchise value. We believe that consolidation across the community bank landscape will continue to take place and further believe that, with our capital and liquidity positions, our approach to credit management, and our extensive acquisition experience, we are well-positioned to take advantage of acquisitions or other business opportunities in our market areas. In markets where we wish to enter or expand our business, we will also consider opening de novo branches. In the past, we have successfully integrated acquired institutions and opened de novo branches. We will continue to be disciplined and opportunistic as it pertains to future acquisitions and de novo branching, focusing on the Pacific Northwest markets we know and understand.
Focus on Asset Quality. A strong credit culture is a high priority for us. We have a well-developed credit approval structure that has enabled us to maintain a standard of asset quality that we believe is conservative while at the same time maintaining our lending objectives. We will continue to focus on loan types and markets that we know well and where we have a historical record of success. We focus on loan relationships that are well-diversified in both size and industry types. With respect to commercial business lending, which is our predominant lending activity, we view ourselves as cash-flow lenders obtaining additional support from realistic collateral values, personal guarantees
4
and secondary sources of repayment. We have a problem loan resolution process that is focused on quick detection and feasible solutions. We seek to maintain strong internal controls and subject our loans to periodic internal loan reviews.
Maintain Strong Balance Sheet. In addition to our focus on underwriting, we believe that the strength of our balance sheet has allowed us to endure the economic downturn experienced by the Pacific Northwest more successfully than many of our competitors. As of December 31, 2017, the ratio of our allowance for loan losses to loans receivable, net was 1.13% and the ratio of the allowance for loan losses to nonperforming loans was 299.79%. Our liquidity position was also strong, with $103.0 million in cash and cash equivalents as of December 31, 2017. As of December 31, 2017, the regulatory capital ratios of our subsidiary bank were well in excess of the levels required for “well-capitalized” status, and our consolidated common equity tier 1 capital to risk-weighted assets, total risk-based capital, Tier 1 risk-based capital and leverage capital ratios were 11.3%, 12.8% 11.8% and 10.2%, respectively.
Deposit Growth. Our strategic focus is to continuously grow deposits with emphasis on total relationship banking with our business and retail customers. We continue to seek to increase our market share in the communities we serve by providing exceptional customer service, focusing on relationship development with local businesses and strategic branch expansion. Our primary focus is to maintain a high level of non-maturity deposits to internally fund our loan growth with a low reliance on maturity (certificate) deposits. At December 31, 2017, as a percentage of our total deposits, non-maturity deposits were 88.3%. We maintain state-of-the-art technology-based products, including on-line personal financial management, business cash management and business remote deposit products that enable us to compete effectively with banks of all sizes. Our retail management team is well-seasoned and has strong ties to the communities we serve with a strong focus on relationship building and customer service.
Emphasize business relationships with a focus on commercial lending. We will continue to market primarily commercial business loans and consumer loans with an emphasis on owner-occupied commercial real estate loans and the deposit balances that accompany these relationships. Our seasoned lending staff has extensive knowledge and can add value through a focused advisory role that we believe strengthens our customer relationships and develops loyalty. We currently have and will seek to maintain a diversified portfolio of lending relationships without concentrations in any industry.
Recruit and retain highly competent personnel to execute our strategies. Our compensation and staff development programs are aligned with our strategies to grow our loans and core deposits while maintaining our focus on asset quality. Our incentive systems are designed to achieve balanced, high quality asset growth while maintaining appropriate mechanisms to reduce or eliminate incentive payments when appropriate. Our equity compensation programs and retirement benefits are designed to build and encourage employee ownership at all levels of the Company and we align employee performance objectives with corporate growth strategies and shareholder value. We have a strong corporate culture, which is supported by our commitment to internal development and promotion from within as well as the retention of management and officers in key roles.
History
Heritage celebrated its 90th anniversary during 2017. The Bank was established in 1927 as a federally charted mutual savings bank. In 1992, the Bank converted to a state charted mutual savings bank under the name Heritage Savings Bank. Through the mutual holding company reorganization of the Bank and the subsequent conversion of the mutual holding company, the Bank became a stock savings bank and a wholly-owned subsidiary of the Company effective August 1997. Effective September 1, 2004, Heritage Savings Bank switched its charter from a state chartered savings bank to a state chartered commercial bank and changed its legal name from Heritage Savings Bank to Heritage Bank.
The Company acquired North Pacific Bancorporation in June 1998 and Washington Independent Bancshares and its wholly-owned subsidiary, Central Valley Bank, in March 1999. In June 2006, the Company completed the acquisition of Western Washington Bancorp and its wholly owned subsidiary, Washington State Bank, N.A., at which time Washington State Bank, N.A. was merged into Heritage Bank.
Effective July 30, 2010, Heritage Bank entered into a definitive agreement with the FDIC, pursuant to which Heritage Bank acquired certain assets and assumed certain liabilities of Cowlitz Bank, a Washington state-chartered commercial bank headquartered in Longview, Washington. The acquisition included nine branches of Cowlitz Bank, including its division Bay Bank, which opened as branches of Heritage Bank on August 2, 2010. The acquisition also included the Trust Services Division of Cowlitz Bank.
Effective November 5, 2010, Heritage Bank entered into a definitive agreement with the FDIC, pursuant to which Heritage Bank acquired certain assets and assumed certain liabilities of Pierce Commercial Bank, a Washington state-chartered commercial bank headquartered in Tacoma, Washington. The acquisition included one branch, which opened as a branch of Heritage Bank on November 8, 2010.
5
On September 14, 2012, the Company announced that it had entered into a definitive agreement along with Heritage Bank, to acquire Northwest Commercial Bank, a full service commercial bank headquartered in Lakewood, Washington that operated two branch locations in Washington State. The acquisition was completed on January 9, 2013, at which time Northwest Commercial Bank was merged with and into Heritage Bank.
On March 11, 2013, the Company entered into a definitive agreement to acquire Valley Community Bancshares, Inc. and its wholly-owned subsidiary, Valley Bank, both headquartered in Puyallup, Washington and its eight branches. The acquisition was completed on July 15, 2013.
On April 8, 2013, the Company announced the proposed merger of its two wholly-owned bank subsidiaries Central Valley Bank and Heritage Bank, with Central Valley Bank merging into Heritage Bank. The common control merger was completed on June 19, 2013. Central Valley Bank now operates as a division of Heritage Bank.
On October 23, 2013, the Company, the Bank, Washington Banking Company and its wholly owned subsidiary bank, Whidbey Island Bank, jointly announced the signing of a definitive merger agreement pursuant to which Heritage and Washington Banking Company entered into a strategic merger with Washington Banking Company merging into Heritage ("Washington Banking Merger"). Washington Banking Company branches adopted the Heritage Bank name in all markets, with the exception of six branches in Whidbey Island markets which continue to operate using the Whidbey Island Bank name, as a division of Heritage Bank. The Washington Banking Merger was completed on May 1, 2014.
On July 26, 2017, the Company announced the execution of a definitive agreement to purchase Puget Sound Bancorp, Inc., ("Puget Sound"), the holding company of Puget Sound Bank, a business bank headquartered in downtown Bellevue, Washington with one branch location (the "Puget Sound Merger"). Effective January 16, 2018, the Company completed the Puget Sound Merger. Heritage issued an aggregate of approximately 4.1 million shares of its common stock in the transaction. As of the acquisition date, Puget Sound merged into Heritage and Puget Sound Bank merged into Heritage Bank. As of December 31, 2017, Puget Sound had $556.0 million in total assets, $388.3 million in total loans and $491.9 million in total deposits. For additional information regarding the transaction, see Note (24) Subsequent Events of the Notes to Consolidated Financial Statements included in "Item 8 Financial Statements And Supplementary Data".
Retail Banking
We offer a full range of products and services to customers for personal and business banking needs designed to attract both short-term and long-term deposits. Deposits are our primary source of funds. Our personal and business banking customers have the option of selecting from a variety of accounts. The major categories of deposit accounts that we offer are described below. These accounts, with the exception of noninterest demand accounts, generally earn interest at rates established by management based on competitive market factors and management’s desire to increase or decrease certain types or maturities of deposits.
Noninterest Demand Deposits. Noninterest demand deposits are noninterest bearing and may be charged service fees based on activity and balances.
Interest Bearing Demand Deposits. Interest bearing demand deposits are interest bearing and may be charged service fees based on activity and balances. Interest bearing demand deposits pay interest, but require a higher minimum balance to avoid service charges.
Money Market Accounts. Money market accounts pay an interest rate that is tiered depending on the balance maintained in the account. Minimum opening balances vary.
Savings Accounts. We offer savings accounts that allow for unlimited deposits and withdrawals, provided that a $300 minimum balance is maintained.
Certificate of Deposit Accounts. We offer several types of certificate of deposit accounts with maturities ranging from three months to five years, which require a minimum deposit of $2,500. Jumbo certificate of deposit accounts are offered in amounts of $100,000 or more for terms of 30 days to five years.
Personal checking accounts feature an array of benefits and options, including online banking and statements, mobile banking, mobile remote deposits, VISA debit cards and access to more than 25,000 surcharge free Automated Teller Machines ("ATMs") through the MoneyPass network.
We also offer trust services through trust powers in the states of Washington and Oregon, and a Wealth Management department that provides objective advice from trusted advisors.
6
Lending Activities
Our lending activities are conducted through Heritage Bank. While our focus is on commercial business lending, we also originate consumer loans, real estate construction and land development loans and one-to-four family residential loans. Our loans are originated under policies that are reviewed and approved annually by our Board of Directors. In addition, we have established internal lending guidelines that are updated as needed. These policies and guidelines address underwriting standards, structure and rate considerations, and compliance with laws, regulations and internal lending limits. We conduct post-approval reviews on selected loans and routinely perform internal loan reviews of our loan portfolio to confirm credit quality, proper documentation and compliance with laws and regulations. Loan repayments are considered one of the primary sources of funding for the Bank.
The Company has acquired loans through mergers and acquisitions, which are designated as "purchased" loans. Prior to August 2015, certain purchased loans were covered under FDIC shared-loss agreements and were identified as "covered". The Company and the FDIC terminated the FDIC shared-loss agreements effective August 4, 2015. For additional information, see Note (5) FDIC Indemnification Asset of the Notes to Consolidated Financial Statements included in "Item 8 Financial Statements And Supplementary Data".
Commercial Business Lending
We offer different types of commercial business loans, including lines of credit, term equipment financing and term owner-occupied and non-owner occupied commercial real estate loans. We also originate loans that are guaranteed by the U.S. Small Business Administration (“SBA”), for which Heritage Bank is a “preferred lender.” Before extending credit to a business we review and analyze the borrower’s management ability, financial history, including cash flow of the borrower and all guarantors, and the liquidation value of the collateral. Emphasis is placed on having a comprehensive understanding of the borrower’s global cash flow and performing necessary financial due diligence.
At December 31, 2017 we had $2.25 billion, or 79.1%, of our total loans receivable in commercial business loans with an average outstanding loan balance of approximately $417,000 at December 31, 2017, excluding loans with no outstanding balance.
We originate commercial real estate loans within our primary market areas with a preference for loans secured by owner-occupied properties. Our underwriting standards require that commercial real estate loans not exceed 75% of the lower of appraised value at origination or cost of the underlying collateral. Cash flow debt coverage requirements range from 1.15 times to 1.25 times, depending on the type of property. We also stress test debt coverage using an “underwriting” interest rate that is higher than the note rate.
Commercial real estate loans typically involve a greater degree of risk than one-to-four family residential loans. Payments on loans secured by commercial real estate properties are dependent on successful operation and management of the properties and repayment of these loans may be affected by adverse conditions in the real estate market or the economy. We seek to minimize these risks by determining the financial condition of the borrower, the quality and value of the collateral, and the management of the property securing the loan. We also generally obtain personal guarantees from the owners of the collateral after a thorough review of personal financial statements. In addition, we review our commercial real estate loan portfolio annually for performance of individual loans, and stress-test loans for potential changes in interest rates, occupancy, and collateral values.
See “Item 1A. Risk Factors—Our loan portfolio is concentrated in loans with a higher risk of loss—Repayment of our commercial business loans, consisting of commercial and industrial loans as well as owner-occupied and non-owner occupied commercial real estate loans, is often dependent on the cash flows of the borrower, which may be unpredictable, and the collateral securing these loans may fluctuate in value.” See also “Item 1A. Risk Factors—Our loan portfolio is concentrated in loans with a higher risk of loss—Our non-owner occupied commercial real estate loans, which includes five or more family residential real estate loans, may involve higher principal amounts than other loans and repayment of these loans may be dependent on factors outside our control or the control of our borrowers.”
Beginning in third quarter of 2015, the Bank began entering into non-hedging interest rate swap contracts with its commercial customers to accommodate the business needs of borrowers. For additional information, see Note (15) Derivative Financial Instruments of the Notes to Consolidated Financial Statements included in "Item 8 Financial Statements And Supplementary Data".
One-to-Four Family Residential Loans, Originations and Sales
At December 31, 2017, one-to-four family residential loans totaled $87.0 million. The majority of our one-to-four family residential loans are secured by single-family residences located in our primary market areas. Our underwriting standards require that one-to-four family residential loans generally are owner-occupied and do not exceed 80% of the lower of appraised value at origination or cost of the underlying collateral. Terms typically range from 15 to 30 years.
7
As part of our asset/liability management strategy, we typically sell a significant portion of our one-to-four family residential loans in the secondary market with no recourse and servicing released. See "Item 7 Management’s Discussion And Analysis Of Financial Condition And Results Of Operations"—Asset/Liability Management. We did not service any of these sold loans during the years ended December 31, 2017 or 2016.
Real Estate Construction and Land Development
At December 31, 2017, we had $149.5 million of real estate construction and land development loans. We originate one-to-four family residential construction loans for the construction of custom homes (where the home buyer is the borrower). We also provide financing to builders for the construction of pre-sold homes and, in selected cases, to builders for the construction of speculative residential property. Because of the higher risks present in the residential construction industry, our lending to builders is limited to those who have demonstrated a favorable record of performance and who are building in markets that management understands.
We further endeavor to limit our construction lending risk through adherence to strict underwriting guidelines and procedures. Speculative construction loans are short term in nature and have a variable rate of interest. We require builders to have tangible equity in each construction project and have prompt and thorough documentation of all draw requests, and we inspect the project prior to paying any draw requests.
See “Item 1A. Risk Factors—Our loan portfolio is concentrated in loans with a higher risk of loss—Our real estate construction and land development loans are based upon estimates of costs and value associated with the completed project. These estimates may be inaccurate.”
Consumer
At December 31, 2017, we had $355.1 million of consumer loans. We originate consumer loans and lines of credit that are both secured and unsecured. The majority of our consumer loans are for relatively small amounts disbursed among many individual borrowers.
We also originate indirect consumer loans. These loans are for new and used automobile and recreational vehicles that are originated indirectly by selected dealers located in our market areas. We have limited our indirect loans purchased primarily to dealerships that are established and well-known in their market areas and to applicants that are not classified as sub-prime.
Liquidity
As indicated above, our primary sources of funds are deposits and loan repayments. Scheduled loan repayments are a relatively stable source of funds, while deposits and unscheduled loan prepayments, which are influenced significantly by general interest rate levels, interest rates available on other investments, competition, economic conditions and other factors, may not be stable. Customer deposits remain an important source of funding, but these balances have been influenced in the past by adverse market conditions in the industry and may be affected by future developments such as interest rate fluctuations and new competitive pressures. In addition to customer deposits, management may utilize brokered deposits on an as-needed basis and repurchase agreements. At December 31, 2017 we had securities sold under agreement to repurchase of $31.8 million which were secured by investment securities available for sale.
As secondary sources of funding, we might utilize other borrowings on a short-term basis to compensate for reductions in other sources of funds (such as deposit inflows at less than projected levels). Borrowings may also be used on a longer-term basis to support expanded lending activities and match the maturity of repricing intervals of assets. Other borrowings include advances from Federal Home Loan Bank (“FHLB”) of Des Moines and other credit facilities.
Federal Home Loan Bank:
The Bank is a member of the FHLB of Des Moines which is one of 11 regional FHLBs that administer the home financing credit function of savings institutions. Each FHLB serves as a reserve or central bank for its member financial institutions within its assigned region. It is funded primarily from proceeds derived from the sale of consolidated obligations of the FHLB system. It makes loans or advances to members in accordance with policies and procedures, established by the Board of Directors of the FHLB, which are subject to the oversight of the Federal Housing Finance Agency. We rely upon advances from the FHLB to supplement our supply of lendable funds and meet deposit withdrawal requirements. The FHLB of Des Moines serves as one of our secondary sources of liquidity. Advances are made pursuant to several different programs. Each credit program has its own interest rate and range of maturities. Depending on the program, limitations on the amount of advances are based on a percentage of an institution’s assets or on the FHLB’s assessment of the institution’s creditworthiness. Under its current credit policies, the FHLB of Des Moines limits advances to 35% of the Bank's assets.
8
Advances from the FHLB of Des Moines are typically secured by our first lien one-to-four family residential loans, commercial real estate loans and stock issued by the FHLB, which is owned by us. At December 31, 2017, the Bank maintained a credit facility with the FHLB of Des Moines in the amount of $881.1 million, of which $92.5 million was advanced.
For membership purposes, the Bank is required to maintain an investment in the stock of the FHLB of Des Moines in an amount equal to 0.12% of the Bank's assets as calculated on an annual basis. At December 31, 2017 the Bank had an investment in FHLB stock carried at a cost basis (par value) of $8.3 million. In addition to the FHLB stock required for membership, the Bank must purchase activity stock equal to 4.0% of all outstanding borrowing balances. The activity stock is automatically redeemed in amounts equal to the FHLB advance balances as they are repaid.
Other borrowings:
In addition to liquidity provided by FHLB, the Bank maintained an uncommitted credit facility with the Federal Reserve Bank of San Francisco of $82.5 million, of which there were no advances or borrowings outstanding as of December 31, 2017. The Bank also maintains advance lines with Wells Fargo Bank, US Bank, The Independent Bankers Bank and Pacific Coast Bankers’ Bank to purchase federal funds of up to $90.0 million, of which there were no advances or borrowings outstanding as of December 31, 2017.
Supervision and Regulation
We are subject to extensive Federal and Washington State legislation, regulation, and supervision, which are primarily intended to protect depositors, the FDIC and shareholders. The laws and regulations affecting banks and bank holding companies have changed significantly particularly in connection with the enactment of the Dodd-Frank Act. Among other changes, the Dodd-Frank Act established the Consumer Protection Financial Bureau (“CFPB”) as an independent bureau of the Board of Governors of the Federal Reserve System (“Federal Reserve”). The CFPB assumed responsibility for the implementation of the federal financial consumer protection and fair lending laws and regulations and has authority to impose new requirements. See “—Other Regulatory Developments—The Dodd-Frank Act” herein for a discussion of this legislation. Any change in applicable laws, regulations, or regulatory policies may have a material effect on our business, operations, and prospects. We cannot predict the nature or the extent of the effects on our business and earnings that any fiscal or monetary policies or new Federal or State legislation may have in the future.
The following is a summary discussion of certain laws and regulations applicable to Heritage and Heritage Bank which is qualified in its entirety by reference to the actual laws and regulations.
Heritage Financial
As a registered bank holding company with the Federal Reserve, we are subject to comprehensive regulation and supervision by the Federal Reserve under the Bank Holding Company Act of 1956, as amended ("BHCA"), and the regulations of the Federal Reserve. This regulation and supervision is generally intended to ensure that we limit our activities to those allowed by law and that we operate in a safe and sound manner without endangering the financial health of Heritage Bank. As a bank holding company supervised by the Federal Reserve, we are required to file annual and periodic reports with the Federal Reserve and provide additional information as the Federal Reserve may require. The Federal Reserve may examine us, and any of our subsidiaries, and assess us for the cost of such examination.
The Federal Reserve has extensive enforcement authority over bank holding companies, including, among other things, the ability to assess civil money penalties, to issue cease and desist or removal orders, or require that a holding company divest subsidiaries (including its bank subsidiary). In general, enforcement actions may be initiated for violations of laws and regulations and unsafe or unsound practices. The Company is also required to file certain reports with, and otherwise comply with, the rules and regulations of the Securities and Exchange Commission ("SEC"). The Federal Reserve may also order termination of non-banking activities by non-banking subsidiaries of bank holding companies, or divestiture of ownership and control of a non-banking subsidiary by a bank holding company. Some violations may also result in criminal penalties.
Under the BHCA, we are supervised by the Federal Reserve. The Federal Reserve has a policy that a bank holding company is required to serve as a source of financial and managerial strength to its subsidiary banks and may not conduct its operations in an unsafe or unsound manner. In addition, the Dodd Frank Act and Federal Reserve policy provides that a bank holding company should serve as a source of strength to its subsidiary bank by having the ability to provide financial assistance to its subsidiary bank during periods of financial distress. A bank holding company’s failure to meet its obligation to serve as a source of strength to its subsidiary banks is generally considered by the Federal Reserve to be an unsafe and unsound banking practice or a violation of the Federal Reserve’s regulations or both.
9
Under the prompt corrective action provisions of the Federal Deposit Insurance Act ("FDIA"), a bank holding company with an undercapitalized subsidiary bank must guarantee, within limitations, the capital restoration plan that is required to be implemented for its undercapitalized subsidiary bank. If an undercapitalized subsidiary bank fails to file an acceptable capital restoration plan or fails to implement an accepted plan the Federal Reserve may among other restrictions prohibit the bank holding company or its undercapitalized subsidiary bank from paying any dividend or making any other form of capital distribution without the prior approval of the Federal Reserve. Federal Reserve policy also provides that a bank holding company may pay cash dividends only to the extent that the company’s net income for the past year is sufficient to cover both the cash dividend and a rate of earnings retention that is consistent with the company’s capital needs, asset quality and overall financial condition. A bank holding company or bank that does not meet the capital conservation buffer requirement is subject to restrictions on the payment of dividends. See “—Capital Adequacy” below. In addition, under Washington corporate law, companies generally may not pay dividends if after that payment the company would not be able to pay its liabilities as they become due in the usual course of business, or its total assets would be less than its total liabilities.
We, and any subsidiaries which we may control, are considered “affiliates” within the meaning of the Federal Reserve Act, and transactions between our bank subsidiary and affiliates are subject to numerous restrictions. With some exceptions, we and our subsidiaries are prohibited from tying the provision of various products or services, such as extensions of credit, to other products or services offered by us, or our affiliates.
Bank regulations require bank holding companies and banks to maintain a minimum “leverage” ratio of core capital to adjusted quarterly average total assets of at least 4%. In addition, banking regulators have adopted risk-based capital guidelines under which risk percentages are assigned to various categories of assets and off-balance sheet items to calculate minimum required risk-weighted capital ratios. Common equity Tier 1 (“CET1”) generally consists of common stock, retained earnings and certain other items. Tier 1 capital generally consists of common stockholders’ equity (which does not include unrealized gains and losses on investment securities available for sale), less goodwill and certain identifiable intangible assets. Tier 2 capital includes Tier 1 capital plus the allowance for loan losses and subordinated debt, both subject to some limitations. Risk-based capital regulations require CET1 of 4.5% of risk-weighted assets, Tier 1 capital of 6% of risk-weighted assets and minimum total capital (combined Tier 1 and Tier 2) of 8% of risk-weighted assets. For additional information, see “—Capital Adequacy” below.
Subsidiary Bank
Heritage Bank is a Washington-chartered commercial bank, the deposits of which are insured by the FDIC. Heritage Bank is subject to regulation by the FDIC and the Division of Banks of the Washington State Department of Financial Institutions ("Division").
Applicable Federal and State statutes and regulations which govern a bank’s operations relate to minimum capital requirements, required reserves against deposits, investments, loans, legal lending limits, mergers and consolidation, borrowings, issuance of securities, payment of dividends, establishment of branches, and other aspects of its operations, among other things. The Division and the FDIC also have authority to prohibit banks under their supervision from engaging in what they consider to be unsafe and unsound practices.
The Bank is required to file periodic reports with the FDIC and the Division, and is subject to periodic examinations and evaluations by those regulatory authorities. Based upon these evaluations, the regulators may revalue the assets of an institution and require that it establish specific reserves to compensate for the differences between the determined value and the book value of such assets. These examinations must be conducted every 12 months, with the exception that well-capitalized banks may be examined every 18 months. The FDIC and the Division may each accept the results of an examination by the other in lieu of conducting an independent examination.
Dividends paid by the Bank provide substantially all of our cash flow. The FDIC and the Division also have the general authority to restrict capital distributions by the Bank, including dividends paid by the Bank to Heritage. Such restrictions are tied to the Bank’s capital levels after giving effect to such distributions. For additional information regarding the restrictions on the payment of dividends, see "Item 5 Market For Registrant’s Common Equity, Related Stockholder Matters And Issuer Purchases Of Equity Securities" herein.
Capital Adequacy
The Federal Reserve and FDIC have issued substantially similar risk-based and leverage capital guidelines applicable to bank holding companies and banks. In addition, these regulatory agencies may from time to time require that a bank holding company or bank maintain capital above the minimum levels, based on its financial condition or actual or anticipated growth.
Effective January 1, 2015 (with some changes transitioned into full effectiveness over several years), the Company and the Bank became subject to new capital regulations adopted by the Federal Reserve and the FDIC,
10
which establish minimum required risk-based ratios for CET1 capital, Tier 1 and total capital, as well as a minimum leverage ratio risk-weightings of assets and certain other assets for purposes of the risk-based capital ratios; require an additional capital conservation buffer over the minimum required risk-based capital ratios; and define what qualifies as capital for purposes of meeting the capital requirements. These regulations implement the regulatory capital reforms required by the Dodd-Frank Act and the “Basel III” requirements.
Under these capital regulations, the minimum capital ratios are: (1) a CET1 capital ratio of 4.5% of risk-weighted assets; (2) a Tier 1 capital ratio of 6.0% of risk-weighted assets; (3) a total capital ratio of 8.0% of risk-weighted assets; and (4) a leverage ratio (the ratio of Tier 1 capital to average total adjusted assets) of 4.0%. CET1 generally consists of common stock; retained earnings; accumulated other comprehensive income (“AOCI”) unless an institution elects to exclude AOCI from regulatory capital; and certain minority interests; all subject to applicable regulatory adjustments and deductions. Tier 1 capital generally consists of CET1 and noncumulative perpetual preferred stock. Tier 2 capital generally consists of other preferred stock and subordinated debt meeting certain conditions plus an amount of the allowance for loan and lease losses up to 1.25% of assets. Total capital is the sum of Tier 1 and Tier 2 capital.
In addition to the minimum CET1, Tier 1, leverage ratio and total capital ratios, the Company and the Bank must maintain a capital conservation buffer consisting of additional CET1 capital greater than 2.5% of risk-weighted assets above the required minimum risk-based capital levels in order to avoid limitations on paying dividends, repurchasing shares, and paying discretionary bonuses. The new capital conservation buffer requirement began to be phased in on January 1, 2016, when requiring a buffer greater than 0.625% of risk-weighted assets, was required which amount increases 0.625% each year until the buffer requirement is fully implemented on January 1, 2019.
To be considered "well capitalized," a bank holding company must have, on a consolidated basis, a total risk-based capital ratio of 10.0% or greater and a Tier 1 risk-based capital ratio of 6.0% or greater and must not be subject to an individual order, directive or agreement under which the Federal Reserve requires it to maintain a specific capital level. To be considered “well capitalized,” a depository institution must have a Tier 1 risk-based capital ratio of at least 8%, a total risk-based capital ratio of at least 10%, a CET1 capital ratio of at least 6.5% and a leverage ratio of at least 5% and not be subject to an individualized order, directive or agreement under which its primary federal banking regulator requires it to maintain a specific capital level. As of December 31, 2017, the Company and the Bank met the requirements to be "well capitalized" and the fully phased-in capital conservation buffer requirement.
For a complete description of the Company’s and the Bank's required and actual capital levels as of December 31, 2017, see Note (21) Regulatory Capital Requirements of the Notes to Consolidated Financial Statements included in "Item 8 Financial Statements And Supplementary Data".
Prompt Corrective Action
Federal statutes establish a supervisory framework for FDIC-insured institutions based on five capital categories: well capitalized, adequately capitalized, undercapitalized, significantly undercapitalized and critically undercapitalized. An institution’s category depends upon where its capital levels are in relation to relevant capital measures. The well capitalized category is described above. An institution that is not well capitalized is subject to certain restrictions on brokered deposits, including restrictions on the rates it can offer on its deposits generally. To be considered adequately capitalized, an institution must have the minimum capital ratios described above. Any institution which is neither well capitalized nor adequately capitalized is considered undercapitalized.
Undercapitalized institutions are subject to certain prompt corrective action requirements, regulatory controls and restrictions which become more extensive as an institution becomes more severely undercapitalized. Failure by Heritage Bank to comply with applicable capital requirements would result in progressively more severe restrictions on its activities and lead to enforcement actions, including, but not limited to, the issuance of a capital directive to ensure the maintenance of required capital levels and, ultimately, the appointment of the FDIC as receiver or conservator. Banking regulators will take prompt corrective action with respect to depository institutions that do not meet minimum capital requirements. Additionally, approval of any regulatory application filed for their review may be dependent on compliance with capital requirements.
As of December 31, 2017, the Bank met the requirements to be classified as “well capitalized.” See Note (21) Regulatory Capital Requirements of the Notes to Consolidated Financial Statements included in "Item 8 Financial Statements And Supplementary Data".
Classification of Loans
Federal regulations require the Bank to periodically evaluate the risks inherent in its loan portfolio. In addition, the Division and the FDIC have the authority to identify problem loans and, if appropriate, require them to be reclassified. There are three classifications for problem loans: Substandard, Doubtful, and Loss. Substandard loans have one or more defined weaknesses and are characterized by the distinct possibility that the institution will sustain some loss if
11
the deficiencies are not corrected. Doubtful loans have the weaknesses of Substandard loans, with additional characteristics that the weaknesses make collection or liquidation in full on the basis of currently existing facts, conditions, and values questionable. There is a high probability of some loss in loans classified as Doubtful. A loan classified as Loss is considered uncollectible and of such little value that continuance as a loan of the institution is not warranted. If a loan or a portion of the loan is classified as Loss, the institution must charge-off this amount.
Deposit Insurance and Other FDIC Programs
The deposits of the Bank are insured up to $250,000 per separately insured depositor by the Deposit Insurance Fund, which is administered by the FDIC. The FDIC is an independent federal agency that insures the deposits, up to applicable limits, of depository institutions. As insurer of the Bank's deposits, the FDIC has supervisory and enforcement authority over Heritage Bank and this insurance is backed by the full faith and credit of the United States government. As insurer, the FDIC imposes deposit insurance premiums and is authorized to conduct examinations of and to require reporting by institutions insured by the FDIC. It also may prohibit any FDIC-insured institution from engaging in any activity determined by regulation or order to pose a serious risk to the institution and the Deposit Insurance Fund. The FDIC also has the authority to initiate enforcement actions and may terminate the deposit insurance if it determines that an institution has engaged in unsafe or unsound practices or is in an unsafe or unsound condition.
The Dodd-Frank Act requires the FDIC’s deposit insurance assessments to be based on assets instead of deposits. The FDIC issued rules under which the assessment base for a bank is equal to its total average consolidated assets less average tangible capital. Under current rules, initial base assessment rates now range from three basis points to 30 basis points and will increase as the reserve ratio increases. The reserve ratio is the ratio of the net worth of the Deposit Insurance Fund to aggregate insured deposits. When the reserve ratio for the prior assessment period is equal to, or greater than 2.0% and less than 2.5%, the initial base assessment rates will range from two basis points to 28 basis points and when the prior assessment period is greater than 2.5%, the initial base assessment rates will range from one basis point to 25 basis points. All initial base assessment rates are case subject to adjustments for unsecured debt issued by a bank, unsecured debt issued by other FDIC-insured institutions and held by the bank, and brokered deposits held by a bank. No institution may pay a dividend if it is in default on its federal deposit insurance assessment.
Other Regulatory Developments
Significant federal legislation affecting banking has been enacted in recent years. The following summarizes some of such recent significant federal legislation.
The Dodd-Frank Act. The Dodd-Frank-Act imposes new restrictions and an expanded framework of regulatory oversight for financial institutions, including depository institutions and implements new capital regulations that we are subject to and that are discussed above under “—Capital Adequacy.”
The federal banking and securities regulators have issued final rules to implement Section 619 of the Dodd-Frank Act, commonly known as the “Volcker Rule” pursuant to the Dodd-Frank Act. Generally, subject to a transition period and certain exceptions, the Volcker Rule restricts insured depository institutions and their affiliated companies from engaging in short-term proprietary trading of certain securities, investing in funds with collateral comprised of any loans that are not registered with the SEC and from engaging in hedging activities that do not hedge a specific identified risk. In accordance with the transition period, the Volcker Rule prohibitions and restrictions apply to banking entities, including the Company and the Bank, unless an exception applies. We are continuously reviewing our investment portfolio to determine if changes to our investment strategies may be required in order to comply with the various provisions of the Volcker Rule.
In addition, among other changes, the Dodd-Frank Act requires public companies, like us, to (i) provide their shareholders with a non-binding vote (a) at least once every three years on the compensation paid to executive officers and (b) at least once every six years on whether they should have a “say on pay” vote every one, two or three years; (ii) have a separate, non-binding shareholder vote regarding golden parachutes for named executive officers when a shareholder vote takes place on mergers, acquisitions, dispositions or other transactions that would trigger the parachute payments; (iii) provide disclosure in annual proxy materials concerning the relationship between the executive compensation paid and the financial performance of the issuer; and (iv) amend Item 402 of Regulation S-K to require companies to disclose the ratio of the Chief Executive Officer's annual total compensation to the median annual total compensation of all other employees.
12
Sarbanes-Oxley Act. As a public company that files periodic reports with the SEC, under the Securities Exchange Act of 1934, Heritage is subject to the Sarbanes-Oxley Act of 2002 ("Sarbanes-Oxley Act"), which addresses, among other issues, corporate governance, auditing and accounting, executive compensation and enhanced and timely disclosure of corporate information.
The Sarbanes-Oxley Act represents significant federal involvement in matters traditionally left to state regulatory systems, such as the regulation of the accounting profession, and to state corporate law, such as the relationship between a board of directors and management and between a board of directors and its committees. Our policies and procedures have been updated to comply with the requirements of the Sarbanes-Oxley Act.
Website Access to Company Reports
We post publicly available reports required to be filed with the SEC on our website, www.hf-wa.com, as soon as reasonably practicable after filing such reports. The required reports are available free of charge through our website.
Code of Ethics
We have adopted a Code of Ethics that applies to our principal executive officer, principal financial officer and controller. We have posted the text of our Code of Ethics at www.hf-wa.com in the section titled Overview: Governance Documents. Any waivers of the code of ethics will be publicly disclosed to shareholders.
Competition
We compete for loans and deposits with other commercial banks, credit unions, mortgage bankers, and other institutions in the scope and type of services offered, interest rates paid on deposits, pricing of loans, and number and locations of branches, among other things. Many of our competitors have substantially greater resources than we do. Particularly in times of high or rising interest rates, we also face significant competition for investors’ funds from short-term money market securities and other corporate and government securities.
We compete for loans principally through the range and quality of the services we provide, interest rates and loan fees, and the locations of our Bank's branches. We actively solicit deposit-related clients and compete for deposits by offering depositors a variety of savings accounts, checking accounts, cash management and other services.
Employees
We had 735 full-time equivalent employees at December 31, 2017. We believe that employees play a vital role in the success of a service company. Employees are provided with a variety of benefits such as medical, vision, dental and life insurance, a retirement plan, and paid vacations and sick leave. None of our employees are covered by a collective bargaining agreement.
Executive Officers
The following table sets forth certain information with respect to the executive officers of the Company at December 31, 2017.
Name | Age as of December 31, 2017 | Position | Has Served the Company or Heritage Bank Since | ||||
Brian L. Vance | 63 | President and Chief Executive Officer of Heritage; Chief Executive Officer of Heritage Bank | 1996 | ||||
Jeffrey J. Deuel | 59 | Executive Vice President of Heritage; President and Chief Operating Officer of Heritage Bank | 2010 | ||||
Donald J. Hinson | 56 | Executive Vice President and Chief Financial Officer of Heritage and Heritage Bank | 2005 | ||||
David A. Spurling | 64 | Executive Vice President and Chief Credit Officer of Heritage and Heritage Bank | 2001 | ||||
Bryan McDonald (1) | 46 | Executive Vice President and Chief Lending Officer of Heritage Bank | 2014 | ||||
(1) Former executive officer of Washington Banking Company.
The business experience of each executive officer is set forth below.
13
Brian L. Vance is the President and Chief Executive Officer of Heritage and Chief Executive Officer of Heritage Bank as well as a director of Heritage. Mr. Vance was appointed President and Chief Executive Officer of Heritage and Heritage Bank in 2006. In 2003, Mr. Vance was appointed President and Chief Executive Officer of Heritage Bank and in 1998, Mr. Vance was named President and Chief Operating Officer of Heritage Bank. Mr. Vance joined Heritage Bank in 1996 as its Executive Vice President and Chief Credit Officer. Prior to joining Heritage Bank, Mr. Vance was employed for 24 years with West One Bank, a bank with offices in Idaho, Utah, Oregon and Washington. Prior to leaving West One, he was Senior Vice President and Regional Manager of Banking Operations for the south Puget Sound region.
Jeffrey J. Deuel was promoted to President and Chief Operating Officer of Heritage Bank and Executive Vice President of Heritage in September 2012. In November 2010, Mr. Deuel was named Executive Vice President and Chief Operating Officer of Heritage Bank and Executive Vice President of the Company. Mr. Deuel joined Heritage Bank in February 2010 as Executive Vice President. Mr. Deuel came to the Company with 28 years of banking experience and most recently held the position of Executive Vice President Commercial Operations with JPMorgan Chase, formerly Washington Mutual. Prior to joining Washington Mutual, Mr. Deuel was based in Philadelphia where he worked for Bank United, First Union Bank, CoreStates Bank, and First Pennsylvania Bank. During his career Mr. Deuel held a variety of leadership positions in commercial banking including lending, retail and support services, corporate strategies, credit administration, and portfolio management. He earned his Bachelor’s degree at Gettysburg College.
Donald J. Hinson became Executive Vice President and Chief Financial Officer of Heritage and Heritage Bank in September 2012. In 2007, Mr. Hinson was appointed the Senior Vice President and Chief Financial Officer of Heritage and Heritage Bank. Mr. Hinson joined Heritage Bank in 2005 as Vice President and Controller. Prior to that, he served in the banking audit practice of local and national accounting firms of Knight, Vale and Gregory and RSM McGladrey from 1994 to 2005. Mr. Hinson holds a Bachelor's of Science degree in Accounting from Central Washington University and is a licensed Certified Public Accountant.
David A. Spurling became Executive Vice President and Chief Credit Officer of Heritage and Heritage Bank in January 2014. Prior to that, he was the Senior Vice President and Chief Credit Officer of Heritage Bank beginning in 2007. Mr. Spurling joined Heritage Bank in 2001 as a commercial lender, followed by a role as a commercial team leader. He began his banking career as a middle market lender at Seafirst Bank, followed by positions as a commercial lender at Bank of America in Small Business Banking and as a regional manager for Bank of America’s government-guaranteed lending division. Mr. Spurling holds a Master’s Degree in Business Administration from the University of Washington and is Credit Risk Certified by the Risk Management Association.
Bryan McDonald became Executive Vice President and Chief Lending Officer of Heritage Bank upon completion of the Washington Banking Merger effective on May 1, 2014. Prior to that, Mr. McDonald had served as President and Chief Executive Officer of Whidbey Island Bank since January 1, 2012. Mr. McDonald joined Whidbey Island Bank in 2006 as Commercial Banking Manager and he served as Senior Vice President and Chief Operating Officer of Whidbey Island Bank from April 1, 2010 until his promotion to Executive Vice President on August 26, 2010. Mr. McDonald has been serving in the banking industry since 1994, including in regional commercial lending management roles since 1996 for Washington Mutual and Peoples Bank. Mr. McDonald holds a Bachelor's and Master’s Degree in Business Administration from Washington State University.
ITEM 1A. RISK FACTORS
We assume and manage a certain degree of risk in order to conduct our business strategy. The following provides a discussion of certain risks that management believes are specific to our business. This discussion should not be viewed as an all-inclusive list or in any particular order.
Our strategy of pursuing acquisitions and de novo branching exposes us to financial and operational risks that could adversely affect us.
We are pursuing a strategy of supplementing organic growth by acquiring other financial institutions or their businesses that we believe will help us fulfill our strategic objectives and enhance our earnings. There are risks associated with this strategy, however, including the following:
• | we may be exposed to potential asset quality issues or unknown or contingent liabilities of the banks, businesses, assets and liabilities we acquire. If these issues or liabilities exceed our estimates, our results of operations and financial condition may be materially negatively affected; |
• | higher than expected deposit attrition; |
• | potential diversion of our management's time and attention; |
14
• | prices at which acquisitions can be made fluctuate with market conditions. We have experienced times during which acquisitions could not be made in specific markets at prices we considered acceptable and expect that we may continue to experience this condition in the future; |
• | the acquisition of other entities generally requires integration of systems, procedures and personnel of the acquired entity into our company to make the transaction economically successful. This integration process is complicated and time consuming and can also be disruptive to the customers of the acquired business. If the integration process is not conducted successfully and with minimal effect on the acquired business and its customers, we may not realize the anticipated economic benefits of an acquisition within the expected time frame, and we may lose customers or employees of the acquired business. We may also experience greater than anticipated customer losses even if the integration process is successful. These risks may be present in our merger with Puget Sound that was completed during the first quarter of 2018; |
• | to finance an acquisition, we may borrow funds, thereby increasing our leverage and diminishing our liquidity, or raise additional capital, which could dilute the interests of our existing shareholders; |
• | from 2006 through 2017, we completed six acquisitions or mergers, including one acquisition in 2006, two acquisitions during 2010, two acquisitions during 2013 and one merger in 2014 that enhanced our rate of growth. In addition, we completed the Puget Sound Merger during the first quarter of 2018. We may not be able to continue to sustain our past rate of growth or to grow at all in the future; |
• | we expect our net income will increase following our acquisitions; however, we also expect our general and administrative expenses and consequently our efficiency ratios will also increase. Ultimately, we would expect our efficiency ratio to improve; however, if we are not successful in our integration process, this may not occur, and our acquisitions or branching activities may not be accretive to earnings in the short or long-term; and |
• | to the extent our costs of an acquisition exceed the fair value of the net assets acquired, the acquisition will generate goodwill. As discussed below under “-If the goodwill we have recorded in connection with acquisitions become impaired, our earnings and capital could be reduced,” we are required to assess our goodwill for impairment at least annually, and any goodwill impairment charge could have a material adverse effect on our results of operations and financial condition. |
Our business strategy includes significant growth plans, and our financial condition and results of operations could be negatively affected if we are not successful in executing this strategy or if we fail to grow or manage our growth effectively.
We intend to pursue a growth strategy for our business. We regularly evaluate potential acquisitions and expansion opportunities. If appropriate opportunities present themselves, we expect to engage in selected acquisitions of financial institutions in the future, including branch acquisitions, or other business growth initiatives or undertakings. There can be no assurance that we will successfully identify appropriate opportunities, that we will be able to negotiate or finance such activities or that such activities, if undertaken, will be successful.
Our growth initiatives may require us to recruit experienced personnel to assist in such initiatives, which will increase our compensation costs. In addition, the failure to identify and retain such personnel would place significant limitations on our ability to successfully execute our growth strategy. To the extent we expand our lending beyond our current market areas, we also could incur additional risk related to those new market areas. We may not be able to expand our market presence in our existing market areas or successfully enter new markets.
If we do not successfully execute our acquisition growth plan, it could adversely affect our business, financial condition, results of operations, reputation and growth prospects. In addition, if we were to conclude that the value of an acquired business had decreased and that the related goodwill had been impaired, that conclusion would result in an impairment of goodwill charge to us, which would adversely affect our results of operations. While we believe we have the executive management resources and internal systems in place to successfully manage our future growth, there can be no assurance that suitable growth opportunities will be available or that we will successfully manage our growth. See “-If the goodwill we have recorded in connection with acquisitions becomes impaired, our earnings and capital could be reduced” and “-Our strategy of pursuing acquisitions and de novo branching exposes us to financial and operational risks that could adversely affect us” for additional risks related to our acquisition strategy.
The required accounting treatment of purchased loans we acquire through acquisitions could result in higher net interest margins and interest income in current periods and lower net interest margins and interest income in future periods.
15
Under generally accepted accounting principles ("GAAP"), we are required to record purchased loans acquired through acquisitions at fair value, which may differ from the outstanding balance of such loans. Estimating the fair value of such loans requires management to make estimates based on available information and facts and circumstances on the acquisition date. Actual performance could differ from management’s initial estimates. If these loans outperform our original fair value estimates, the difference between our original estimate and the actual performance of the loan (the “discount”) is accreted into net interest income. This accretable yield may change due to changes in expected timing and amount of future cash flows. The yields on our loans could decline as our acquired loan portfolio pays down or matures, and we expect downward pressure on our interest income to the extent that the runoff on our acquired loan portfolio is not replaced with comparable high-yielding loans. This could result in higher net interest margins and interest income in current periods and lower net interest rate margins and lower interest income in future periods.
We operate in a highly regulated environment and may be adversely affected by changes in federal and state laws and regulations that increase our costs of operations.
The financial services industry is extensively regulated. We are subject to extensive examination, supervision and comprehensive regulation by the Federal Reserve, and Heritage Bank is subject to examination, supervision and comprehensive regulation by the FDIC and the Division. The Federal Reserve, FDIC and Division govern the activities in which we may engage, primarily for the protection of depositors and the Deposit Insurance Fund. These regulatory authorities have extensive discretion in connection with their supervisory and enforcement activities, including the ability to impose requirements for additional capital, restrictions on operations, the reclassification of assets, and the determination of the adequacy of the allowance for loan losses and level of deposit insurance premiums assessed. These bank regulators also have the ability to impose conditions in the approval of merger and acquisition transactions.
As discussed under Item 1 "Business"—Capital Adequacy of this Form 10-K, the Dodd-Frank Act has significantly changed the bank regulatory structure and affected the lending, deposit, investment, trading and operating activities of financial institutions and their holding companies. The Dodd-Frank Act requires various federal agencies to adopt a broad range of new implementing rules and regulations, and to prepare numerous studies and reports for Congress. The federal agencies have significant discretion in drafting and implementing rules and regulations. It is difficult at this time to predict when or how any new standards will ultimately be applied to us or what specific impact the Dodd-Frank Act and the yet to be written implementing rules and regulations will have on community banks. The current administration has indicated that it would like to see changes made to certain financial reform regulations, including the Dodd-Frank Act, which has resulted in increased regulatory uncertainty, and we are assessing the potential impact on financial and economic markets and on our business. Changes in federal policy and at regulatory agencies are expected to occur over time through policy and personnel changes, which could lead to changes involving the level of oversight and focus on the financial services industry. The nature, timing and economic and political effects of potential changes to the current legal and regulatory framework affecting financial institutions remain highly uncertain. If changes to the Dodd-Frank Act or the rules and regulations implementing the Act are made, such changes could offset the otherwise anticipated increase in operating and compliance costs (included in noninterest expense); however, no assurance can be given as to whether such changes will occur or what may result from such changes.
Our loan portfolio is concentrated in loans with a higher risk of loss.
Repayment of our commercial business loans, consisting of commercial and industrial loans as well as owner-occupied and non-owner occupied commercial real estate loans, is often dependent on the cash flows of the borrower, which may be unpredictable, and the collateral securing these loans may fluctuate in value. We offer different types of commercial loans to a variety of businesses with a focus on real estate related industries and businesses in agricultural, healthcare, legal, and other professions. The types of commercial loans offered are business lines of credit, term equipment financing and term real estate loans. We also originate loans that are guaranteed by the SBA, and are a “preferred lender” of the SBA. Commercial business lending involves risks that are different from those associated with real estate lending. Real estate lending is generally considered to be collateral based lending with loan amounts established on predetermined loan to collateral values and liquidation of the underlying real estate collateral being viewed as the primary source of repayment in the event of borrower default. Our commercial business loans are primarily made based on our assessment of the cash flow of the borrower and secondarily on the underlying collateral provided by the borrower. The borrower's cash flow may be unpredictable, and collateral securing these loans may fluctuate in value. Although commercial business loans are often collateralized by equipment, inventory, accounts receivable or other business assets, the liquidation of collateral in the event of default is often an insufficient source of repayment because accounts receivable may be uncollectible and inventories may be obsolete or of limited use, among other things. Accordingly, the repayment of commercial business loans depends primarily on the cash flow and creditworthiness of the borrower and secondarily on the underlying collateral provided by the borrower. In addition, as part of our commercial business lending activities, we originate agricultural loans. Agricultural lending
16
involves a greater degree of risk and typically involves higher principal amounts than other types of loans. Payments on agricultural loans are typically dependent on the profitable operation or management of the related farm property. The success of the farm may be affected by many factors outside the control of the borrower, including adverse weather conditions that prevent the planting of a crop or limit crop yields (such as hail, drought and floods), declines in market prices for agricultural products (both domestically and internationally) and the impact of government regulations (including changes in price supports, subsidiaries and environmental regulations). In addition, many farms are dependent on a limited number of key individuals whose injury or death may significantly affect the successful operation of the farm. If the cash flow from a farming operation is diminished, the borrower’s ability to repay the loan may be impaired.
At December 31, 2017, our commercial business loans (consisting of commercial and industrial loans, owner-occupied commercial real estate loans and non-owner occupied commercial real estate loans) totaled $2.25 billion, or approximately 79.1% of our total loan portfolio. Approximately $9.1 million, or 0.4%, of our total commercial business loans were nonperforming at December 31, 2017. The majority of the nonperforming commercial business loans were owner-occupied commercial real estate loans.
Our non-owner occupied commercial real estate loans, which include five or more family residential real estate loans, involve higher principal amounts than other loans and repayment of these loans may be dependent on factors outside our control or the control of our borrowers. We originate commercial and five or more family residential real estate loans for individuals and businesses for various purposes, which are secured by commercial properties. These loans typically involve higher principal amounts than other types of loans, and repayment is dependent upon income generated, or expected to be generated, by the property securing the loan in amounts sufficient to cover operating expenses and debt service, which may be adversely affected by changes in the economy or local market conditions. For example, if the cash flow from the borrower’s project is reduced as a result of leases not being obtained or renewed, the borrower’s ability to repay the loan may be impaired.
Commercial and five or more family residential real estate loans also expose us to greater credit risk than loans secured by one-to-four family residential real estate because the collateral securing these loans typically cannot be sold as easily as one-to-four family residential real estate. In addition, many of our commercial and five or more family residential real estate loans are not fully amortizing and contain large balloon payments upon maturity. Such balloon payments may require the borrower to either sell or refinance the underlying property in order to make the payment, which may increase the risk of default or non-payment. If we foreclose on a commercial and five or more family residential real estate loan, our holding period for the collateral typically is longer than for one-to-four family residential loans because there are fewer potential purchasers of the collateral. Additionally, commercial and five or more family residential real estate loans generally have relatively large balances to single borrowers or related groups of borrowers. Accordingly, if we make any errors in judgment regarding the collectability of our commercial and five or more family residential real estate loans, any resulting charge-offs may be larger on a per loan basis than those incurred with our residential or consumer loan portfolios.
As of December 31, 2017, our non-owner occupied commercial real estate loans totaled $986.6 million, or 34.6% of our total loan portfolio. Approximately $1.9 million, or 0.2%, of our non-owner occupied commercial real estate loans were nonperforming at December 31, 2017.
Our real estate construction and land development loans are based upon estimates of costs and the related value associated with the completed project. These estimates may be inaccurate. Construction lending can involve a higher level of risk than other types of lending because funds are advanced partially based upon the value of the project, which is uncertain prior to the project’s completion. Changes in demand for new housing and higher than anticipated building costs may cause actual results to vary significantly from those estimated. Because of the uncertainties inherent in estimating construction costs as well as the market value of a completed project and the effects of governmental regulation of real property, our estimates with regards to the total funds required to complete a project and the related loan-to-value ratio may vary from actual results. If the estimate of value upon completion proves to be inaccurate, we may be confronted at, or prior to, the maturity of the loan with a project the value of which is insufficient to assure full repayment. In addition, speculative construction loans to a builder are often associated with homes that are not pre-sold, and thus pose a greater potential risk to us than construction loans to individuals on their personal residences. Loans on land under development or held for future construction also pose additional risk because of the lack of income being produced by the property and the potential illiquid nature of the collateral. These risks can be significantly impacted by supply and demand. As a result, this type of lending often involves the disbursement of substantial funds with repayment dependent, in part, on the success of the ultimate project and the ability of the borrower to sell or lease the property or refinance the indebtedness, rather than the ability of the borrower or guarantor to independently repay principal and interest. If our estimate of the value of a project at completion proves to be overstated, we may have inadequate security for repayment of the loan and may incur a loss.
17
As of December 31, 2017, our real estate construction and land development loans totaled $149.5 million, or 5.2% of our total loan portfolio. Of these loans, $52.0 million, or 1.8% of our total loan portfolio, were one-to-four family residential construction related and $97.5 million, or 3.4% of our total loan portfolio, were five or more family residential and commercial property construction related. Approximately $1.2 million, or 0.8%, of our total construction and land development loans were nonperforming at December 31, 2017.
Our allowance for loan losses may prove to be insufficient to absorb losses in our loan portfolio.
Lending money is a substantial part of our business. Every loan carries a certain risk that it will not be repaid in accordance with its terms or that any underlying collateral will not be sufficient to assure repayment. This risk is affected by, among other things:
• | the cash flow of the borrower, guarantors and/or the project being financed; |
• | the changes and uncertainties as to the future value of the collateral, in the case of a collateralized loan; |
• | the character and creditworthiness of a particular borrower or guarantor; |
• | changes in economic and industry conditions; and |
• | the duration of the loan. |
We maintain an allowance for loan losses, which is a reserve established through a provision for loan losses charged against earnings, which we believe is appropriate to absorb probable incurred losses in our loan portfolio. The amount of this allowance is determined by our management through a periodic comprehensive review and consideration of several factors, including, but not limited to:
• | our general reserve, based on our historical default and loss experience; |
• | our specific reserve, based on our evaluation of impaired loans and their underlying collateral or discounted cash flows; and |
• | current macroeconomic factors, regulatory requirements and management’s expectation of future events. |
The determination of the appropriate level of the allowance for loan losses inherently involves a high degree of subjectivity and requires us to make significant estimates of current credit risks and future trends, all of which may undergo material changes. Deterioration in economic conditions affecting borrowers, new information regarding existing loans, identification of additional problem loans and other factors, both within and outside of our control, may require an increase in the allowance for loan losses. If current conditions in the housing and real estate markets weaken, we expect we will experience increased delinquencies and credit losses. In addition, bank regulatory agencies periodically review our allowance for loan losses and may require an increase in the provision for loan losses or the recognition of further loan charge-offs, based on their judgments about information available to them at the time of their examination. In addition, if charge-offs in future periods exceed the allowance for loan losses we will need additional provisions to increase the allowance for loan losses.
The FASB has adopted a new accounting standard that will be effective for our first fiscal year beginning after December 15, 2019. This standard, referred to as Current Expected Credit Loss ("CECL") will require financial institutions to determine periodic estimates of lifetime expected credit losses on loans and recognize the expected credit losses as allowances for credit losses. This will change the current method of providing allowances for credit losses that are probable, which may require us to increase our allowance for loan losses, and may greatly increase the types of data we would need to collect and review to determine the appropriate level of the allowance for credit losses. Any increases in the allowance for loan losses will result in a decrease in net income and possibly capital, and may have a material adverse effect on our financial condition and results of operations.
If our allowance for loan losses is not adequate, we may be required to make further increases in our provision for loan losses and charge-off additional loans, which could adversely affect our results of operations and our capital.
For the year ended December 31, 2017 we recorded a provision for loan losses of $4.2 million compared to $4.9 million for the year ended December 31, 2016. We recorded net charge-offs of loans of $3.2 million for the year ended December 31, 2017 compared to $3.6 million for the year ended December 31, 2016. At December 31, 2017 our total nonperforming loans were $10.7 million, or 0.38% of loans receivable, net, compared to $10.9 million or 0.41% of loans receivable, net, at December 31, 2016. Generally, our nonperforming loans reflect operating difficulties of individual borrowers, which may be the result of current economic conditions. If economic conditions deteriorate, we expect that we could experience significantly higher delinquencies and loan charge-offs. As a result, we may be required to make further increases in our provision for loan losses in the future, which could adversely affect our financial condition and results of operations, perhaps materially.
18
General economic conditions tend to impact loan segments at varying degrees. At December 31, 2017, our owner-occupied commercial real estate loans had the greatest percentage of nonaccrual loans of 38.2% as the borrowers are primarily business owners whose business results are influenced by economic conditions. Our commercial and industrial loan portfolio, which contained 29.1% of our nonaccrual loans at December 31, 2017, generally has a large percentage of nonperforming loans because of the same reason as owner-occupied commercial real estate loans noted above as well as impact of the types of collateral generally securing these loans which are less marketable than commercial real estate. Our non-owner occupied portfolio, which contained 17.7% of our nonaccrual loans at December 31, 2017, also has a large percentage of nonperforming loans because of the same reason as owner-occupied commercial real estate loans noted above.
The current economic condition in the market areas we serve may adversely impact our earnings and could increase the credit risk associated with our loan portfolio.
Substantially all of our loans are to businesses and individuals in the states of Washington and Oregon. A decline in the economies of our primary market areas of the Pacific Northwest in which we operate could have a material adverse effect on our business, financial condition, results of operations and prospects. In addition, weakness in the global economy has adversely affected many businesses operating in our markets that are dependent upon international trade and it is not known how the withdrawal by the United States from the Trans-Pacific Partnership trade agreement may affect these businesses.
While real estate values and unemployment rates have improved, a deterioration in economic conditions in our market areas of the Pacific Northwest could result in the following consequences, any of which could have a materially adverse impact on our business, financial condition and results of operations:
• | loan delinquencies, problem assets and foreclosures may increase; |
• | the sale of foreclosed assets may be slow; |
• | our provision for loan losses may increase; |
• | demand for our products and services may decline, possibly resulting in a decrease in our total loans; |
• | collateral for loans made may decline further in value, exposing us to increased risk of loss on existing loans; |
• | the net worth and liquidity of loan guarantors may decline, impairing their ability to honor commitments to us; and |
• | the amount of our deposits may decrease and the composition of our deposits may be adversely affected. |
Many of the loans in our portfolio are secured by real estate. Deterioration in the real estate markets where collateral for a mortgage loan is located could negatively affect the borrower’s ability to repay the loan and the value of the collateral securing the loan. Real estate values are affected by various other factors, including changes in general or regional economic conditions, governmental rules or policies and natural disasters such as earthquakes and flooding.
Adverse changes in the regional and general economy could reduce our growth rate, impair our ability to collect loans and generally have a negative effect on our financial condition and results of operations.
If the goodwill we have recorded in connection with acquisitions becomes impaired, our earnings and capital could be reduced.
Accounting standards require that we account for acquisitions using the purchase method of accounting. Under purchase accounting, if the purchase price of an acquired company exceeds the fair value of its net assets, the excess is carried on the acquirer’s balance sheet as goodwill. In accordance with GAAP, our goodwill is evaluated for impairment on an annual basis or more frequently if events or circumstances indicate that a potential impairment exists. The evaluation is based on a variety of factors, including the quoted price of our common stock, market prices of common stock of other banking organizations, common stock trading multiples, discounted cash flows, and data from comparable acquisitions. At December 31, 2017, we had goodwill with a carrying amount of $119.0 million.
Declines in our stock price or a prolonged weakness in the operating environment of the financial services industry may result in a future impairment charge. Any such impairment charge could have a material adverse effect on our operating results and financial condition.
Fluctuating interest rates can adversely affect our profitability.
Our profitability is dependent to a large extent upon net interest income, which is the difference (or “spread”) between the interest earned on loans, securities and other interest earning assets and the interest paid on deposits, borrowings, and other interest bearing liabilities. Because of the differences in maturities and repricing characteristics of our interest earning assets and interest bearing liabilities, changes in interest rates do not produce equivalent changes in interest income earned on interest earning assets and interest paid on interest bearing liabilities. We
19
principally manage interest rate risk by managing our volume and mix of our earning assets and funding liabilities. Thus, in a changing interest rate environment, we may not be able to manage this risk effectively. Accordingly, fluctuations in interest rates could adversely affect our interest rate spread, and, in turn, our profitability.
Interest rates are highly sensitive to many factors that are beyond our control, including general economic conditions and policies of various governmental and regulatory agencies and, in particular, the Federal Reserve. In an attempt to help the overall economy, during the past several years it has been the policy of the Federal Reserve to maintain interest rates at historically low levels through its targeted federal funds rate and the purchase of mortgage-backed securities. As a result, market rates on the loans we have originated and the yields on securities we have purchased have been at lower levels than available prior to 2008. The Federal Reserve increased the targeted federal funds rate by 75 basis points and 25 basis points in 2017 and 2016, respectively. It is anticipated that the Federal Reserve will make additional increases in interest rates during 2018 subject to economic conditions. As the Federal Reserve increases the targeted federal funds rates, overall interest rates will likely rise, which may negatively impact both the housing markets by reducing refinancing activity and new home purchases and the U.S. economic recovery.
A sustained increase in market interest rates could adversely affect our earnings. As a result of the exceptionally low interest rate environment, an increasing percentage of our deposits have been comprised of deposits bearing no or a relatively low rate of interest and having a shorter duration than our assets. We would incur a higher cost of funds to retain these deposits in a rising interest rate environment. If the interest rates paid on deposits and other borrowings increase at a faster rate than the interest rates received on loans and other investments, our net interest income, and therefore earnings, could be adversely affected.
Changes in interest rates also affect the value of our interest-earning assets and in particular our securities portfolio. Generally, the fair value of fixed-rate securities fluctuates inversely with changes in interest rates. Unrealized gains and losses on securities available for sale are reported as a separate component of equity, net of tax. Decreases in the fair value of securities available for sale resulting from increases in interest rates could have an adverse effect on stockholders’ equity.
Although management believes it has implemented effective asset and liability management strategies to reduce the potential effects of changes in interest rates on our results of operations, any substantial, unexpected or prolonged change in market interest rates could have a material adverse effect on our financial condition and results of operations. Also, our interest rate risk modeling techniques and assumptions likely may not fully predict or capture the impact of actual interest rate changes on our balance sheet.
Changes in the method of determining the London Interbank Offered Rate ("LIBOR") or other reference rates may adversely impact the value of loans receivable and other financial instruments we hold that are linked to LIBOR or other reference rates in ways that are difficult to predict and could adversely impact our financial condition or results of operations.
In recent years, concerns have been raised about the accuracy of the calculation of LIBOR. Aspects of the method for determining how LIBOR is formulated and its use in the market have changed and may continue to change. Recent changes to LIBOR administration have included the introduction of statutory regulation of LIBOR by U.K. regulatory authorities; reducing the currencies for which LIBOR is calculated to five; reducing the tenors for which LIBOR is calculated to seven; delaying the publication of individual banks’ LIBOR submissions for three months from submission; requiring banks to provide LIBOR submissions based on an effective methodology on the basis of relevant criteria and information, including observable market transactions where possible; and during July 2017, the Financial Conduct Authority, the financial regulatory body in the United Kingdom which oversees the LIBOR benchmark rate, announced that the LIBOR will be replaced at the end of 2021 and that they will work towards developing an alternative benchmark. Each such change and any future changes could impact the availability and volatility of LIBOR. Similar changes have occurred or may occur with respect to other reference rates. It is not currently possible to determine whether, or to what extent, any such changes would impact the value of any loans, derivatives and other financial obligations or extensions of credit we hold or that are due to us, that are linked to LIBOR or other reference rates, or whether, or to what extent, such changes would impact our financial condition or results of operations.
Our securities portfolio may be negatively impacted by fluctuations in market value and interest rates.
Our securities portfolio may be impacted by fluctuations in market value, potentially reducing accumulated other comprehensive income and/or earnings. Fluctuations in market value may be caused by changes in market interest rates, rating agency actions in respect of the securities, defaults by the issuer or with respect to the underlying securities, lower market prices for securities and limited investor demand. Our securities portfolio is evaluated for other-than-temporary impairment. If this evaluation shows impairment to the actual or projected cash flows associated with one or more securities, a potential loss to earnings may occur. Changes in interest rates can also have an adverse effect on our financial condition, as our available-for-sale securities are reported at their estimated fair value, and
20
therefore are impacted by fluctuations in interest rates. We increase or decrease our shareholders' equity by the amount of change in the estimated fair value of the available-for-sale securities, net of taxes. There can be no assurance that the declines in market value will not result in other-than-temporary impairments of these assets, which would lead to accounting charges that could have a material adverse effect on our net income and capital levels.
Decreased volumes and lower gains on sales of mortgage loans sold could adversely impact our noninterest income.
We originate and sell one-to-four family residential loans. Our mortgage banking income is a significant portion of our noninterest income. We generate gains on the sale of one-to-four family residential loans pursuant to programs currently offered by the Federal Home Loan Mortgage Corporation ("Freddie Mac") and other secondary market purchasers. Any future changes in their purchase programs, our eligibility to participate in such programs, the criteria for loans to be accepted or laws that significantly affect the activity of such entities could, in turn, materially adversely affect our results of operations. Further, in a rising or higher interest rate environment, our originations of mortgage loans may decrease, resulting in fewer loans that are available to be sold to investors. This would result in a decrease in mortgage banking revenues and a corresponding decrease in noninterest income. In addition, our results of operations are affected by the amount of noninterest expense associated with mortgage banking activities, such as salaries and employee benefits, occupancy, equipment and data processing expense and other operating costs. During periods of reduced loan demand, our results of operations may be adversely affected to the extent that we are unable to reduce expenses commensurate with the decline in loan originations.
Conditions in the financial markets may limit our access to additional funding to meet our liquidity needs which could adversely affect our earnings and capital levels.
Liquidity is essential to our business. We rely on a number of different sources in order to meet our potential liquidity demands. We require sufficient liquidity to meet customer loan requests, customer deposit maturities and withdrawals, payments on our debt obligations as they come due and other cash commitments under both normal operating conditions and other unpredictable circumstances, including events causing industry or general financial market stress. A tightening of the credit markets and the inability to obtain adequate funding may negatively affect our liquidity, asset growth and, consequently, our earnings capability and capital levels. In addition to any deposit growth, and the sale of loans or investment securities, maturity of investment securities and loan payments, we rely from time to time on advances from the FHLB of Des Moines, and certain other wholesale funding sources to meet liquidity demands. Our liquidity position could be significantly constrained if we were unable to access funds from the FHLB of Des Moines or other wholesale funding sources. Factors that could detrimentally impact our access to liquidity sources include a decrease in the level of our business activity as a result of a downturn in the markets in which our loans are concentrated, negative operating results, or adverse regulatory action against us. Our ability to borrow could also be impaired by factors that are not specific to us, such as a disruption in the financial markets or negative views and expectations about the prospects for the financial services industry or deterioration in credit markets. Any decline in available funding could adversely impact our ability to originate loans, invest in securities, meet our expenses, or fulfill obligations such as repaying our borrowings or meeting deposit withdrawal demands, any of which could, in turn, have a material adverse effect on our business, financial condition and results of operations.
Additionally, collateralized public funds are bank deposits of state and local municipalities. These deposits are required to be secured by certain investment grade securities to ensure repayment, which on the one hand tends to reduce our contingent liquidity risk by making these funds somewhat less credit sensitive, but on the other hand reduces standby liquidity by restricting the potential liquidity of the pledged collateral. Although these funds historically have been a relatively stable source of funds for us, availability depends on the individual municipality's fiscal policies and cash flow needs.
Our growth or future losses may require us to raise additional capital in the future, but that capital may not be available when it is needed or the cost of that capital may be very high; further, the resulting dilution of our equity may adversely affect the market price of our common stock.
We are required by federal and state regulatory authorities to maintain adequate levels of capital to support our operations. At some point we may need to raise additional capital to support our continued internal growth and growth through acquisitions or be required by our regulators to increase our capital resources. Our ability to raise additional capital, however, will depend on conditions in the capital markets at that time, which are outside our control, and on our financial condition and performance. If we are able to raise capital it may not be on terms that are acceptable to us. If we cannot raise additional capital when needed, our ability to further expand our operations through internal growth and acquisitions could be materially impaired and our financial condition and liquidity could be materially and adversely affected. Accordingly, we cannot make assurances that we will be able to raise additional capital when needed.
21
We are not restricted from issuing additional common stock or preferred stock, including any securities that are convertible into or exchangeable for, or that represent the right to receive, common stock or preferred stock or any substantially similar securities. The market price of our common stock could decline as a result of sales of a large number of shares of common stock or preferred stock or similar securities in the market or from the perception that such sales could occur.
Our Board of Directors is authorized generally to cause us to issue additional common stock, as well as series of preferred stock, without any action on the part of our shareholders except as may be required under the listing requirements of the NASDAQ Stock Market. In addition, our Board has the power, without shareholder approval, to set the terms of any such series of preferred stock that may be issued, including voting rights, dividend rights and preferences over the common stock with respect to dividends or upon the liquidation, dissolution or winding-up of our business and other terms.
In addition, if we issue preferred stock in the future that has a preference over the common stock with respect to the payment of dividends or upon liquidation, dissolution or winding-up, or if we issue preferred stock with voting rights that dilute the voting power of the common stock, the rights of holders of the common stock or the market price of the common stock could be adversely affected.
Non-compliance with the USA PATRIOT Act, Bank Secrecy Act, or other laws and regulations could result in fines or sanctions and limit our ability to get regulatory approval of acquisitions.
The USA PATRIOT and Bank Secrecy Acts require financial institutions to develop programs to prevent financial institutions from being used for money laundering and terrorist activities. If such activities are detected, financial institutions are obligated to file suspicious activity reports with the U.S. Treasury’s Office of Financial Crimes Enforcement Network. These rules require financial institutions to establish procedures for identifying and verifying the identity of customers seeking to open new financial accounts. Failure to comply with these regulations could result in fines or sanctions and limit our ability to get regulatory approval of acquisitions. While we have developed policies and procedures designed to assist in compliance with these laws and regulations, no assurance can be given that these policies and procedures will be effective in preventing violations of these laws and regulations. If our policies and procedures are deemed deficient, we would be subject to liability, including fines and regulatory actions, which may include restrictions on our ability to pay dividends and the denial of regulatory approvals to proceed with certain aspects of our business plan, including our acquisition plans.
Failure to maintain and implement adequate programs to combat money laundering and terrorist financing could also have serious reputational consequences for us. Any of these results could have a material adverse effect on our business, financial condition, results of operations and growth prospects.
Our operations rely on numerous external vendors.
We rely on numerous external vendors to provide us with products and services necessary to maintain our day-to-day operations. Accordingly, our operations are exposed to risk that these vendors will not perform in accordance with the contracted arrangements under service level agreements. The failure of an external vendor to perform in accordance with the contracted arrangements under service level agreements because of changes in the vendor's organizational structure, financial condition, support for existing products and services or strategic focus or for any other reason, could be disruptive to our operations, which in turn could have a material negative impact on our financial condition and results of operations. We also could be adversely affected to the extent such an agreement is not renewed by the third party vendor or is renewed on terms less favorable to us.
We are subject to certain risks in connection with our use of technology.
Our security measures may not be sufficient to mitigate the risk of a cyber-attack. Communications and information systems are essential to the conduct of our business, as we use such systems to manage our customer relationships, our general ledger and virtually all other aspects of our business. Our operations rely on the secure processing, storage, and transmission of confidential and other information in our computer systems and networks. Although we take protective measures and endeavor to modify them as circumstances warrant, the security of our computer systems, software, and networks may be vulnerable to breaches, unauthorized access, misuse, computer viruses, or other malicious code and cyber-attacks that could have a security impact. If one or more of these events occur, this could jeopardize our or our customers' confidential and other information processed and stored in, and transmitted through, our computer systems and networks, or otherwise cause interruptions or malfunctions in our operations or the operations of our customers or counterparties. We may be required to expend significant additional resources to modify our protective measures or to investigate and remediate vulnerabilities or other exposures, and we may be subject to litigation and financial losses that are either not insured against or not fully covered through any insurance maintained by us. We could also suffer significant reputational damage.
22
Security breaches in our internet banking activities could further expose us to possible liability and damage our reputation. Any compromise of our security also could deter customers from using our internet banking services that involve the transmission of confidential information. We rely on standard internet security systems to provide the security and authentication necessary to effect secure transmission of data. These precautions may not protect our systems from compromises or breaches of our security measures and could result in significant legal liability and significant damage to our reputation and our business. We have experienced no known material breaches.
Our security measures may not protect us from system failures or interruptions. While we have established policies and procedures to prevent or limit the impact of systems failures and interruptions, there can be no assurance that such events will not occur or that they will be adequately addressed if they do. In addition, we outsource certain aspects of our data processing and other operational functions to certain third-party providers. If our third-party providers encounter difficulties, or if we have difficulty in communicating with them, our ability to adequately process and account for transactions could be affected, and our business operations could be adversely impacted. Threats to information security also exist in the processing of customer information through various other vendors and their personnel.
The occurrence of any failures or interruptions may require us to identify alternative sources of such services, and we cannot assure you that we could negotiate terms that are as favorable to us or could obtain services with similar functionality as found in our existing systems without the need to expend substantial resources, if at all. Further, the occurrence of any systems failure or interruption could damage our reputation and result in a loss of customers and business, could subject us to additional regulatory scrutiny, or could expose us to legal liability. Any of these occurrences could have a material adverse effect on our financial condition and results of operations.
If our enterprise risk management framework is not effective at mitigating risk and loss to us, we could suffer unexpected losses and our results of operations could be materially adversely affected.
Our enterprise risk management framework seeks to achieve an appropriate balance between risk and return, which is critical to optimizing stockholder value. We have established processes and procedures intended to identify, measure, monitor, report, analyze and control the types of risk to which we are subject. These risks include liquidity risk, credit risk, market risk, interest rate risk, operational risk, legal and compliance risk, and reputational risk, among others. We also maintain a compliance program to identify, measure, assess, and report on our adherence to applicable laws, policies and procedures. While we assess and improve these programs on an ongoing basis, there can be no assurance that our risk management or compliance programs, along with other related controls, will effectively mitigate all risk and limit losses in our business. However, as with any risk management framework, there are inherent limitations to our risk management strategies as there may exist, or develop in the future, risks that we have not appropriately anticipated or identified. If our risk management framework proves ineffective, we could suffer unexpected losses and our business, financial condition and results of operations could be materially adversely affected.
We are subject to certain risks in connection with our data management or aggregation.
We are reliant on our ability to manage data and our ability to aggregate data in an accurate and timely manner to ensure effective risk reporting and management. Our ability to manage data and aggregate data may be limited by the effectiveness of our policies, programs, processes and practices that govern how data is acquired, validated, stored, protected and processed. While we continuously update our policies, programs, processes and practices, many of our data management and aggregation processes are manual and subject to human error or system failure. Failure to manage data effectively and to aggregate data in an accurate and timely manner may limit our ability to manage current and emerging risks, as well as to manage changing business needs.
We rely on dividends from Heritage Bank for substantially all of our revenue at the holding company level.
We are an entity separate and distinct from our subsidiary, Heritage Bank, and derive substantially all of our revenue at the holding company level in the form of dividends from that subsidiary. Accordingly, we are, and will be, dependent upon dividends from Heritage Bank to pay the principal of and interest on our indebtedness, to satisfy our other cash needs and to pay dividends on our common stock. Heritage Bank's ability to pay dividends is subject to its ability to earn net income and to meet certain regulatory requirements. In the event Heritage Bank is unable to pay dividends to us, we may not be able to pay dividends on our common stock. Also, our right to participate in a distribution of assets upon a subsidiary's liquidation or reorganization is subject to the prior claims of the subsidiary's creditors.
23
Our business may be adversely affected by an increasing prevalence of fraud and other financial crimes.
Our loans to businesses and individuals and our deposit relationships and related transactions are subject to exposure to the risk of loss due to fraud and other financial crimes. Nationally, reported incidents of fraud and other financial crimes have increased. We have also experienced losses due to apparent fraud and other financial crimes, although such losses have been relatively insignificant to date. While we have policies and procedures designed to prevent such losses, there can be no assurance that such losses will not occur.
Changes in accounting standards may affect how we record and report our performance.
Our accounting policies and methods are fundamental to how we record and report our financial condition and results of operations. From time to time there are changes in the financial accounting and reporting standards that govern the preparation of our financial statements. These changes can be difficult to predict and can materially impact how we report and record our financial condition and results of operations. In some cases, we could be required to apply a new or revised standard retroactively, resulting in a retrospective adjustment to prior financial statements.
We are dependent on key personnel and the loss of one or more of those key personnel may materially and adversely affect our prospects.
Competition for qualified employees and personnel in the banking industry is intense and there are a limited number of qualified persons with knowledge of, and experience in, the community banking industry where we conduct our business. The process of recruiting personnel with the combination of skills and attributes required to carry out our strategies is often lengthy. Our success depends to a significant degree upon our ability to attract and retain qualified management, loan origination, finance, administrative, marketing and technical personnel and upon the continued contributions of our management and personnel. In particular, our success has been and continues to be highly dependent upon the abilities of key executives, including our President and Chief Executive Officer, Mr. Brian L. Vance, and certain other employees. The loss of key personnel could adversely affect our ability to successfully conduct our business.
ITEM 1B. UNRESOLVED STAFF COMMENTS
The Company has no unresolved staff comments from the SEC as it relates to the Company's financial information as reported on Form 10-K.
ITEM 2. PROPERTIES
24
Our executive offices and the main office of Heritage Bank are located in approximately 22,000 square feet of the headquarters building and adjacent office space and main branch office which are owned by Heritage Bank and located in downtown Olympia. The Company's branch network at December 31, 2017 was comprised of 59 branches located throughout Washington and Oregon. The number of branches per county, as well as occupancy type, is detailed in the following table.
Occupancy Type | |||||||||||
County | State | Number of Branches | Owned | Leased | |||||||
Clark | WA | 2 | 1 | 1 | |||||||
Cowlitz | WA | 2 | 2 | — | |||||||
Island | WA | 7 | 6 | 1 | |||||||
Kittitas | WA | 1 | 1 | — | |||||||
King | WA | 8 | 3 | 5 | |||||||
Mason | WA | 1 | 1 | — | |||||||
Multnomah | OR | 1 | — | 1 | |||||||
Pierce | WA | 13 | 8 | 5 | |||||||
San Juan | WA | 1 | — | 1 | |||||||
Skagit | WA | 3 | 3 | — | |||||||
Snohomish | WA | 8 | 6 | 2 | |||||||
Thurston | WA | 4 | 3 | 1 | |||||||
Whatcom | WA | 4 | 3 | 1 | |||||||
Yakima | WA | 4 | 4 | — | |||||||
Total | 59 | 41 | 18 | ||||||||
One Island County Branch, one Skagit County Branch, one Thurston County branch and the one branch in Kittitas County have land leases, which are not included in the leased section above as the building is owned.
As part of the Company's strategic initiatives, certain measures were taken to transform the Company's branching system during the year ended December 31, 2017. Four branches operating at December 31, 2016 were consolidated into existing Heritage Bank branches in April 2017. Three of these branches were subsequently sold and one branch is held for sale as of December 31, 2017.
For additional information concerning our premises and equipment and lease obligations, see Note (7) Premises and Equipment and Note (14) Commitments and Contingencies of the Notes to Consolidated Financial Statements included in "Item 8 Financial Statements And Supplementary Data".
ITEM 3. LEGAL PROCEEDINGS
We, and our Bank, are not a party to any material pending legal proceedings other than ordinary routine litigation incidental to the business of the Bank.
ITEM 4. MINE SAFETY DISCLOSURES
Not applicable
PART II
ITEM 5. MARKET FOR THE REGISTRANT'S COMMON EQUITY, RELATED STOCKHOLDER MATTERS AND ISSUER PURCHASES OF EQUITY SECURITIES
25
Our common stock is traded on the NASDAQ Global Select Market under the symbol HFWA. At December 31, 2017, we had approximately 1,332 shareholders of record (not including the number of persons or entities holding stock in nominee or street name through various brokerage firms) and 29,927,746 outstanding shares of common stock. This total does not reflect the number of persons or entities who hold stock in nominee or “street” name through various brokerage firms. The last reported sales price on February 20, 2018 was $31.18 per share. The following tables provides sales information per share of our common stock as reported on the NASDAQ Global Select Market for the indicated quarters.
2017 Quarter ended, | ||||||||||||||||
March 31 | June 30 | September 30 | December 31 | |||||||||||||
High | $ | 26.98 | $ | 27.30 | $ | 30.00 | $ | 33.25 | ||||||||
Low | $ | 22.50 | $ | 23.00 | $ | 25.25 | $ | 28.60 | ||||||||
2016 Quarter ended, | ||||||||||||||||
March 31 | June 30 | September 30 | December 31 | |||||||||||||
High | $ | 19.61 | $ | 18.71 | $ | 18.71 | $ | 26.48 | ||||||||
Low | $ | 16.42 | $ | 16.40 | $ | 16.76 | $ | 17.66 | ||||||||
For the interim period subsequent to the 2017 fiscal year through the last reported sales price on February 20, 2018, the high and low sales information price per share of our common stock as reported on the NASDAQ Global Selected Market was $32.15 and $28.46, respectively.
Quarterly, the Company reviews the potential payment of cash dividends to common shareholders. The timing and amount of cash dividends paid on our common stock depends on the Company’s earnings, capital requirements, financial condition and other relevant factors.
The dividend activities for the years ended December 31, 2017 and 2016 and through the date of this filing are listed below:
Declared | Cash Dividend per Share | Record Date | Paid | |||||
January 27, 2016 | $0.11 | February 10, 2016 | February 24, 2016 | |||||
April 20, 2016 | $0.12 | May 5, 2016 | May 19, 2016 | |||||
July 20, 2016 | $0.12 | August 4, 2016 | August 18, 2016 | |||||
October 26, 2016 | $0.12 | November 8, 2016 | November 22, 2016 | |||||
October 26, 2016 | $0.25 | November 8, 2016 | November 22, 2016 | * | ||||
January 25, 2017 | $0.12 | February 9, 2017 | February 23, 2017 | |||||
April 25, 2017 | $0.13 | May 10, 2017 | May 24, 2017 | |||||
July 25, 2017 | $0.13 | August 10, 2017 | August 24, 2017 | |||||
October 25, 2017 | $0.13 | November 8, 2017 | November 22, 2017 | |||||
October 25, 2017 | $0.10 | November 8, 2017 | November 22, 2017 | * | ||||
January 24, 2018 | $0.15 | February 7, 2018 | February 21, 2018 | |||||
* Denotes special dividend.
The primary source for dividends paid to our shareholders are dividends paid to us from Heritage Bank. There are regulatory restrictions on the ability of the Bank to pay dividends. Under federal regulations, the dollar amount of dividends the Bank may pay depends upon its capital position and recent net income. Generally, if an institution satisfies its regulatory capital requirements, it may make dividend payments up to the limits prescribed under state law and FDIC regulations. However, an institution that has converted to the stock form of ownership, as Heritage Bank has done, may not declare or pay a dividend on, or repurchase any of, its common stock if the effect thereof would cause the regulatory capital of the institution to be reduced below the amount required for the liquidation account which was established in connection with the mutual to stock conversion.
As a bank holding company, our ability to pay dividends is subject to the guidelines of the Federal Reserve regarding capital adequacy and dividends. The Federal Reserve’s policy is that a bank holding company should pay cash dividends only to the extent that its net income for the past year is sufficient to cover both the cash dividends and a rate of earnings retention that is consistent with the holding company’s capital needs, asset quality and overall
26
financial condition, and that it is inappropriate for a bank holding company experiencing serious financial problems to borrow funds to pay dividends. Under Washington law, we are prohibited from paying a dividend if, after making such dividend payment, we would be unable to pay our debts as they become due in the usual course of business, or if our total liabilities, plus the amount that would be needed, in the event we were to be dissolved at the time of the dividend payment, to satisfy preferential rights on dissolution of holders of preferred stock ranking senior in right of payment to the capital stock on which the applicable distribution is to be made exceed our total assets.
The Company has had various stock repurchase programs since March 1999. On October 23, 2014, the Company's Board of Directors authorized the repurchase of up to 5% of the Company's outstanding common shares, or approximately 1,513,000 shares, under the eleventh stock repurchase plan. At December 31, 2017, there were approximately 933,000 shares remaining to be purchased under the eleventh stock repurchase plan. The number, timing and price of shares repurchased will depend on business and market conditions, and other factors, including opportunities to deploy the Company's capital.
The following table provides total repurchased shares and average share prices under the plan for the periods indicated:
Years Ended December 31, | |||||||||||||||
2017 | 2016 | 2015 | Plan Total (1) | ||||||||||||
Eleventh Plan | |||||||||||||||
Repurchased shares | — | 138,000 | 441,966 | 579,966 | |||||||||||
Stock repurchase average share price | $ | — | $ | 17.16 | $ | 16.64 | $ | 16.76 | |||||||
(1) Represents shares repurchased and average price per share paid during the duration of the plan.
During the years ended December 31, 2017, 2016 and 2015, the Company repurchased 29,429, 29,512 and 22,300 shares at an average price per share of $25.01, $17.82 and $17.09 to pay withholding taxes on the vesting of restricted stock that vested during the years ended December 31, 2017, 2016 and 2015, respectively, which are not considered repurchased as part of the applicable repurchase plans.
The following table sets forth information about the Company’s purchases of its outstanding common stock during the quarter ended December 31, 2017.
Period | Total Number of Shares Purchased (1) | Average Price Paid Per Share (1) | Cumulative Total Number of Shares Purchased as Part of Publicly Announced Plans or Programs | Maximum Number of Shares that May Yet Be Purchased Under the Plans or Programs | |||||||||
October 1, 2017—October 31, 2017 | — | $ | — | 7,893,389 | 935,034 | ||||||||
November 1, 2017—November 30, 2017 | — | — | 7,893,389 | 935,034 | |||||||||
December 1, 2017—December 31, 2017 | 1,718 | 31.35 | 7,893,389 | 935,034 | |||||||||
Total | 1,718 | $ | 31.35 | ||||||||||
(1) All of the common shares repurchased by the Company between October 1, 2017 and December 31, 2017, were shares of restricted stock that represented the cancellation of stock to pay withholding taxes.
The information regarding the Company’s equity compensation plan is contained under “Item 12. Security Ownership of Certain Beneficial Owners and Management and Related Stockholder Matters” of this Form 10-K and is incorporated by reference herein.
27
Stock Performance Graph
The following graph depicts total return to shareholders during the five-year period beginning December 31, 2012 and ending December 31, 2017. Total return includes appreciation or depreciation in market value of the Company’s common stock as well as actual cash and stock dividends paid to common shareholders. The graph additionally shows the five-year comparison of the total return to shareholders of the Company’s common stock as compared to the NASDAQ Composite Index and the SNL U.S. Bank NASDAQ Index. The NASDAQ Composite Index is a comparative broad market index comprised of all domestic and international common stocks listed on the Nasdaq Stock Market. The SNL U.S. Bank NASDAQ Index is a comparative peer index comprised of banks and related holding companies listed on the NASDAQ Stock Market. The graph assumes that the value of the investment in Heritage’s common stock and each of the three indices was $100 on December 31, 2012, and that all dividends were reinvested.
.
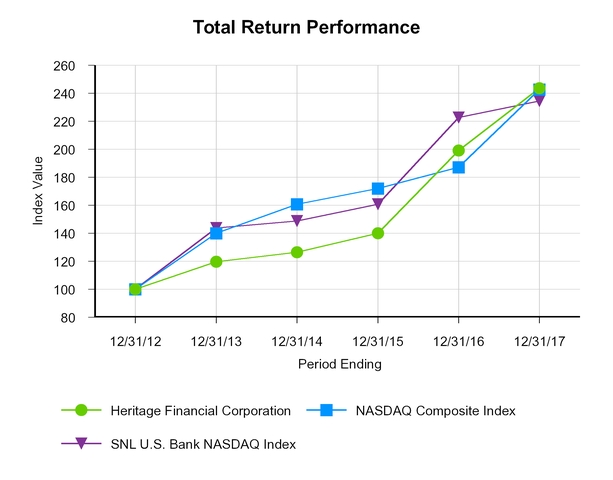
Years Ended December 31, | ||||||||||||||||||||||||
Index | 2012 | 2013 | 2014 | 2015 | 2016 | 2017 | ||||||||||||||||||
Heritage Financial Corporation | $ | 100.00 | $ | 119.67 | $ | 126.54 | $ | 139.99 | $ | 199.20 | $ | 243.60 | ||||||||||||
NASDAQ Composite Index | 100.00 | 140.12 | 160.78 | 171.97 | 187.22 | 242.71 | ||||||||||||||||||
SNL U.S. Bank NASDAQ Index | 100.00 | 143.73 | 148.86 | 160.70 | 222.81 | 234.58 | ||||||||||||||||||
*Information for the graph was provided by S&P Global Market Intelligence.
ITEM 6. SELECTED FINANCIAL DATA
The following tables set forth certain information concerning our consolidated financial position and results of operations at and for the dates indicated and have been derived from our audited Consolidated Financial Statements. The information below is qualified in its entirety by the detailed information included elsewhere herein and should be read along with “Item 7. Management’s Discussion and Analysis of Financial Condition and Results of Operations” and “Item 8. Financial Statements and Supplementary Data.”
28
Matters affecting comparability in the five-year summary detailed below include the Valley and NCB Acquisitions in 2013, and the Washington Banking Merger in 2014 as discussed below.
Year Ended December 31, | ||||||||||||||||||||
2017 | 2016 | 2015 | 2014 | 2013 | ||||||||||||||||
(Dollars in thousands, except per share amounts) | ||||||||||||||||||||
Operations Data: | ||||||||||||||||||||
Interest income | $ | 147,880 | $ | 138,512 | $ | 135,739 | $ | 121,106 | $ | 71,428 | ||||||||||
Interest expense | 8,346 | 6,006 | 6,120 | 5,681 | 3,724 | |||||||||||||||
Net interest income | 139,534 | 132,506 | 129,619 | 115,425 | 67,704 | |||||||||||||||
Provision for loan losses | 4,220 | 4,931 | 4,372 | 4,594 | 3,672 | |||||||||||||||
Noninterest income | 35,408 | 31,619 | 32,268 | 16,467 | 9,651 | |||||||||||||||
Noninterest expense | 110,575 | 106,473 | 106,208 | 99,379 | 59,515 | |||||||||||||||
Income tax expense (5) | 18,356 | 13,803 | 13,818 | 6,905 | 4,593 | |||||||||||||||
Net income | 41,791 | 38,918 | 37,489 | 21,014 | 9,575 | |||||||||||||||
Earnings per common share | ||||||||||||||||||||
Basic | $ | 1.39 | $ | 1.30 | $ | 1.25 | $ | 0.82 | $ | 0.61 | ||||||||||
Diluted | 1.39 | 1.30 | 1.25 | 0.82 | 0.61 | |||||||||||||||
Dividend payout ratio to common shareholders (1) | 43.9 | % | 55.4 | % | 42.4 | % | 61.0 | % | 68.9 | % | ||||||||||
Performance Ratios: | ||||||||||||||||||||
Net interest spread (2) | 3.83 | % | 3.89 | % | 4.04 | % | 4.45 | % | 4.69 | % | ||||||||||
Net interest margin (3) | 3.92 | 3.96 | 4.11 | 4.53 | 4.80 | |||||||||||||||
Efficiency ratio (4) | 63.21 | 64.87 | 65.61 | 75.35 | 76.94 | |||||||||||||||
Noninterest expense to average assets | 2.78 | 2.84 | 3.01 | 3.49 | 3.86 | |||||||||||||||
Return on average assets | 1.05 | 1.04 | 1.06 | 0.74 | 0.62 | |||||||||||||||
Return on average common equity | 8.36 | 8.01 | 8.08 | 5.61 | 4.58 | |||||||||||||||
(1) Dividend payout ratio is declared dividends per common share divided by diluted earnings per common share.
(2) Net interest spread is the difference between the average yield on interest earning assets and the average cost of interest bearing liabilities.
(3) Net interest margin is net interest income divided by average interest earning assets.
(4) The efficiency ratio is noninterest expense divided by the sum of net interest income and noninterest income.
(5) The current year results were impacted by the Tax Cuts and Jobs Act enacted December 22, 2017, which required a revaluation of our deferred tax assets and liabilities to account for the future impact of the decrease in corporate income tax rate to 21% from 35% and other provisions of the legislation. Income tax expense increased $2.6 million as a result of our estimated revaluation of the net deferred tax asset.
29
December 31, | ||||||||||||||||||||
2017 | 2016 | 2015 | 2014 | 2013 | ||||||||||||||||
(Dollars in thousands) | ||||||||||||||||||||
Balance Sheet Data: | ||||||||||||||||||||
Total assets | $ | 4,113,270 | $ | 3,878,981 | $ | 3,650,792 | $ | 3,457,750 | $ | 1,659,038 | ||||||||||
Total loans receivable, net | 2,816,985 | 2,609,666 | 2,372,296 | 2,223,348 | 1,203,096 | |||||||||||||||
Investment securities | 810,530 | 794,645 | 811,869 | 778,660 | 199,288 | |||||||||||||||
FDIC indemnification asset | — | — | — | 1,116 | 4,382 | |||||||||||||||
Goodwill and other intangible assets | 125,117 | 126,403 | 127,818 | 129,918 | 30,980 | |||||||||||||||
Deposits | 3,393,060 | 3,229,648 | 3,108,287 | 2,906,331 | 1,399,189 | |||||||||||||||
Federal Home Loan Bank advances | 92,500 | 79,600 | — | — | — | |||||||||||||||
Junior subordinated debentures | 20,009 | 19,717 | 19,424 | 19,082 | — | |||||||||||||||
Securities sold under agreement to repurchase | 31,821 | 22,104 | 23,214 | 32,181 | 29,420 | |||||||||||||||
Stockholders’ equity | 508,305 | 481,763 | 469,970 | 454,506 | 215,762 | |||||||||||||||
Financial Measures: | ||||||||||||||||||||
Book value per common share | $ | 16.98 | $ | 16.08 | $ | 15.68 | $ | 15.02 | $ | 13.31 | ||||||||||
Stockholders' equity to assets ratio | 12.4 | % | 12.4 | % | 12.9 | % | 13.1 | % | 13.0 | % | ||||||||||
Net loans to deposits (1) | 84.0 | % | 81.8 | % | 77.3 | % | 77.5 | % | 88.0 | % | ||||||||||
Capital Ratios: | ||||||||||||||||||||
Total risk-based capital ratio | 12.8 | % | 13.0 | % | 13.7 | % | 15.1 | % | 16.8 | % | ||||||||||
Tier 1 risk-based capital ratio | 11.8 | 12.0 | 12.7 | 13.9 | 15.5 | |||||||||||||||
Leverage ratio | 10.2 | 10.3 | 10.4 | 10.2 | 11.3 | |||||||||||||||
Common equity Tier 1 capital to risk-weighted assets | 11.3 | 11.4 | 12.0 | N/A | N/A | |||||||||||||||
Asset Quality Ratios: | ||||||||||||||||||||
Nonperforming loans to loans receivable, net (2) | 0.38 | % | 0.41 | % | 0.40 | % | 0.51 | % | 0.63 | % | ||||||||||
Allowance for loan losses to loans receivable, net (2) | 1.13 | 1.18 | 1.24 | 1.23 | 2.34 | |||||||||||||||
Allowance for loan losses to nonperforming loans (2) | 299.79 | 284.93 | 307.67 | 239.62 | 372.16 | |||||||||||||||
Nonperforming assets to total assets (2) | 0.26 | 0.30 | 0.32 | 0.43 | 0.74 | |||||||||||||||
Net charge-off on loans to average loans receivable, net | 0.12 | 0.14 | 0.10 | 0.30 | 0.31 | |||||||||||||||
Other Data: | ||||||||||||||||||||
Number of banking offices | 59 | 63 | 67 | 66 | 35 | |||||||||||||||
Number of full-time equivalent employees | 735 | 760 | 717 | 748 | 373 | |||||||||||||||
Deposits per branch | 57,509 | 51,264 | 46,392 | 44,035 | 39,977 | |||||||||||||||
Assets per full-time equivalent | 5,596 | 5,104 | 5,092 | 4,623 | 4,448 | |||||||||||||||
(1) Loans receivable, net of deferred costs divided by deposits.
(2) At December 31, 2017, 2016, 2015, 2014 and 2013, $1.9 million, $2.8 million $1.3 million, $1.6 million and $1.7 million of nonaccrual loans were guaranteed by government agencies, respectively.
The Company has focused on expanding its business over the past several years. In 2013, the Company completed two open-bank acquisitions of Northwest Commercial Bank in January 2013 and Valley Community Bancshares in July 2013. In May 2014, the Company completed the merger with Washington Banking Company. Subsequent to December 31, 2017, the Company completed the Puget Sound Merger in January 2018. These acquisitions and mergers, together with organic growth of the business, have significantly increased the Company's assets and liabilities.
30
During the period from December 31, 2013 through December 31, 2017 total assets have increased $2.45 billion, or 147.9%, to $4.11 billion as of December 31, 2017 from $1.66 billion at December 31, 2013. The total loans receivable, net of allowance for loan losses increased $1.61 billion, or 134.1%, to $2.82 billion as of December 31, 2017 from $1.20 billion at December 31, 2013. Loan increases during the five-year period are also attributable to the Washington Banking Merger with the acquisition of loans with fair value of $1.0 billion at the May 1, 2014 merger date. Our emphasis in increasing our commercial business loan portfolio, in addition to mergers and acquisitions, resulted in an increase in commercial business loans of $1.18 billion, or 110.4%, since December 31, 2013.
Deposits increased $1.99 billion, or 142.5%, to $3.39 billion at December 31, 2017 from $1.40 billion at December 31, 2013. Deposit increases during the five-year period are also attributable to the Washington Banking Merger with the assumptions of deposits with fair value of $1.4 billion at the May 1, 2014 merger date. From December 31, 2013 to December 31, 2017, non-maturity deposits (total deposits less certificate of deposit accounts) increased $1.90 billion, or 174.8%, to $2.99 billion at December 31, 2017. The percentage of certificate of deposit accounts to total deposits decreased to 11.7% at December 31, 2017 from 22.1% at December 31, 2013.
Stockholders’ equity increased by $292.5 million, or 135.6%, to $508.3 million at December 31, 2017 from $215.8 million at December 31, 2013 due primarily to a combination of earnings and issuances of common stock, partially offset by repurchases of common stock and declarations of cash dividends. Our net income increased$32.2 million, or 336.5%, to $41.8 million for the year ended December 31, 2017 from $9.6 million for the year ended December 31, 2013 as a result of growth in the Company due primarily through acquisitions and mergers. Net interest income increased $71.8 million, or 106.1%, to $139.5 million for the year ended December 31, 2017 from $67.7 million during the year ended December 31, 2013. The increase in net interest income was primarily a result of an increase in interest income of $76.5 million, or 107.0%, to $147.9 million for the year ended December 31, 2017 from $71.4 million for the year ended December 31, 2013. Additionally, the increase in net income includes an increase in noninterest income of $25.8 million, or 266.9%, to $35.4 million for the year ended December 31, 2017 compared to $9.7 million for the year ended December 31, 2013. The increase in net income was partially offset by an increase in noninterest expense of $51.1 million, or 85.8%, to $110.6 million for the year ended December 31, 2017 from $59.5 million for the year ended December 31, 2013 as a result of the growth of the Company.
ITEM 7. | MANAGEMENT'S DISCUSSION AND ANALYSIS OF FINANCIAL CONDITION AND RESULTS OF OPERATIONS |
The following discussion is intended to assist in understanding the financial condition and results of operations of the Company. The information contained in this section should be read with the December 31, 2017 audited Consolidated Financial Statements and Notes thereto included in "Item 8. Financial Statements and Supplementary Data" of this Form 10-K.
Critical Accounting Policies
The Company’s Consolidated Financial Statements have been prepared in accordance with accounting principles generally accepted in the United States of America. Companies may apply certain critical accounting policies requiring management to make subjective or complex judgments, often as a result of the need to estimate the effect of matters that are inherently uncertain.
The Company considers its most critical accounting estimates to be the allowance for loan losses, estimations of expected cash flows related to purchased credit impaired loans, business combinations, other-than-temporary impairments in the fair value of investments and consideration of potential impairment of goodwill.
Allowance for Loan Losses
The allowance for loan losses is established through a provision for loan losses charged against earnings. The balance of the allowance for loan losses is maintained at the amount management believes will be appropriate to absorb probable incurred credit losses in the loan portfolio at the balance sheet date. The allowance for loan losses is determined by applying estimated loss factors to the credit exposure from outstanding loans.
We assess the estimated credit losses inherent in our loan portfolio by considering a number of elements including:
• | historical loss experience in the loan portfolio; |
• | impact of environmental factors, including: |
◦ | levels of and trends in delinquencies, classified and impaired loans; |
◦ | levels of and trends in charge-offs and recoveries; |
◦ | trends in volume and terms of loans; |
31
◦ | effects of changes in risk selection and underwriting standards, and other changes in lending policies, procedures and practices; |
◦ | experience, ability, and depth of lending management and other relevant staff; |
◦ | national and local economic trends and conditions; |
◦ | other external factors such as competition, legal and regulatory; |
◦ | effects of changes in credit concentrations; and |
◦ | other factors |
We calculate an appropriate allowance for loan losses for the loans in our loan portfolio by applying historical loss factors for homogeneous classes of the portfolio, adjusted for changes to the above-noted environmental factors. We may record specific provisions for impaired loans, including loans on nonaccrual status and troubled-debt restructured ("TDR") loans, after a careful analysis of each loan’s credit and collateral factors. Our analysis of an appropriate allowance for loan losses combines the provisions made for our non-impaired loans and the specific provisions made for each impaired loan.
While we believe we use the best information available to determine the allowance for loan losses, our results of operations could be significantly affected if circumstances differ substantially from the assumptions used in determining the allowance. A decline in national and local economic conditions, or other factors, could result in a material increase in the allowance for loan losses and may adversely affect the Company’s financial condition and results of operations. In addition, the determination of the amount of the allowance for loan losses is subject to review by bank regulators, as part of their routine examination process, which may result in the establishment of additional allowance for loan losses based upon their judgment of information available to them at the time of their examination.
For additional information regarding the allowance for loan losses, its relation to the provision for loan losses, its risk related to asset quality and lending activity, see “—Results of Operations for the Years Ended December 31, 2017 and 2016—Provision for Loan Losses” and “—Consolidated Financial Condition —Allowance for Loan Losses” below, “Item 1A. Risk Factors —Our allowance for loan losses may prove to be insufficient to absorb losses in our loan portfolio” as well as Note (4) Allowance for Loan Losses of the Notes to Consolidated Financial Statements included in “Item 8. Financial Statements and Supplementary Data.”
Estimated Expected Cash Flows related to Purchased Credit Impaired ("PCI") Loans
Loans purchased in an acquisition with evidence of credit deterioration since origination for which it is probable that all contractually required payments will not be collected are accounted for under FASB Accounting Standards Codification ("ASC") 310-30, Loans and Debt Securities Acquired with Deteriorated Credit Quality. In situations where such PCI loans have similar risk characteristics, loans may be aggregated into pools to estimate cash flows. A pool is accounted for as a single asset with a single interest rate, cumulative loss rate and cash flow expectation.
The cash flows expected over the life of the PCI loan or pool are estimated using an external cash flow model that projects cash flows and calculates the carrying values, book yields, effective interest income and impairment, if any, based on loan or pool level events. Assumptions as to default rates, loss severity and prepayment speeds are utilized to calculate the expected cash flows.
Expected cash flows at the acquisition date in excess of the fair value of loans are considered to be accretable yield, which is recognized as interest income over the life of the loan or pool using a level yield method if the timing and amounts of the future cash flows of the loan or pool are reasonably estimable. Subsequent to the acquisition date, any increases in cash flow over those expected at purchase date in excess of fair value are recorded as interest income prospectively. Any subsequent decreases in cash flow over those expected at purchase date are recognized by recording an allowance for loan losses. Any disposals of loans in pools, including sales of loans, payments in full or foreclosures result in the removal of the loan from the loan pool at the carrying amount and recognition of income if the proceeds from such activity is in excess of the carrying amount removed from the pool.
Business Combinations
The Company applies the acquisition method of accounting for business combinations. Under the acquisition method, the acquiring entity in a business combination recognizes all of the identifiable assets acquired and liabilities assumed at their acquisition date fair values. Management utilizes prevailing valuation techniques appropriate for the asset or liability being measured in determining these fair values. Any excess of the purchase price over amounts allocated to assets acquired, including identifiable intangible assets, and liabilities assumed is recorded as goodwill. Where amounts allocated to assets acquired and liabilities assumed is greater than the purchase price, a bargain purchase gain is recognized. Acquisition-related costs are expensed as incurred unless they are directly attributable to the issuance of the Company's common stock in a business combination.
32
Other-Than-Temporary Impairments in the Fair Value of Investments
Unrealized losses on investment securities available for sale and held to maturity are evaluated at least quarterly to determine whether declines in value should be considered “other than temporary” and therefore be subject to immediate loss recognition in income. Although these evaluations involve significant judgment, an unrealized loss in the fair value of a debt security is generally deemed to be temporary when the fair value of the security is below the carrying value primarily due to changes in interest rates, there has not been significant deterioration in the financial condition of the issuer, and it is not more likely than not that the Company will be required to sell the security before the anticipated recovery of its remaining carrying value. An unrealized loss in the value of an equity security is generally considered temporary when the fair value of the security is below the carrying value primarily due to current market conditions and not deterioration in the financial condition of the issuer and it is not more likely than not that the Company will be required to sell the security before the anticipated recovery of its remaining carrying value. Other factors that may be considered in determining whether a decline in the value of either a debt or an equity security is “other than temporary” include ratings by recognized rating agencies; actions of commercial banks or other lenders relative to the continued extension of credit facilities to the issuer of the security; the financial condition, capital strength and near-term prospects of the issuer and recommendations of investment advisors or market analysts. Therefore, continued deterioration of market conditions could result in additional impairment losses recognized within the investment portfolio.
Goodwill
The Company’s goodwill is assigned to Heritage Bank and is evaluated for impairment at the Heritage Bank level (reporting unit). Goodwill is reviewed for impairment annually and between annual tests if an event occurs or circumstances change that might indicate the Company’s recorded value is more than its implied value. Such indicators may include, among others: a significant adverse change in legal factors or in the general business climate; significant decline in the Company’s stock price and market capitalization; unanticipated competition; and an adverse action or assessment by a regulator. Any adverse changes in these factors could have a significant impact on the recoverability of goodwill and could have a material impact on the Company’s Consolidated Financial Statements.
The testing for impairment may begin with an assessment of qualitative factors to determine whether the existence of events or circumstances leads to a determination that the fair value of goodwill is less than carrying value. The qualitative assessment includes adverse events or circumstances identified that could negatively affect the reporting unit's fair value as well as positive and mitigating events. When required, the goodwill impairment test involves a two-step process. The first test for goodwill impairment is done by comparing the reporting unit’s aggregate fair value to its carrying value. Absent other indicators of impairment, if the aggregate fair value exceeds the carrying value, goodwill is not considered impaired and no additional analysis is necessary. If the carrying value of the reporting unit were to exceed the aggregate fair value, a second test would be performed to measure the amount of impairment loss, if any. To measure any impairment loss the implied fair value would be determined in the same manner as if the reporting unit were being acquired in a business combination. If the implied fair value of goodwill is less than the recorded goodwill an impairment charge would be recorded for the difference.
For the year ended December 31, 2017, the Company completed step one of the two-step process of the goodwill impairment test. Based on the results of the test, the Company concluded that the reporting unit’s fair value was greater than its carrying value and there was no impairment of goodwill.
For additional information regarding goodwill, see Note (8) Goodwill and Other Intangible Assets of the Notes to Consolidated Financial Statements included in “Item 8. Financial Statements and Supplementary Data.”
33
Financial Overview
Heritage Financial Corporation is a bank holding company which primarily engages in the business activities of our wholly-owned financial institution subsidiary, Heritage Bank. We provide financial services to our local communities with an ongoing strategic focus on our commercial banking relationships, market expansion and asset quality.
Consolidated Financial Condition
The Company’s total assets increased $234.3 million, or 6.0%, to $4.11 billion at December 31, 2017 from $3.88 billion at December 31, 2016. The increase was primarily due to a $207.3 million, or 7.9%, increase in total loans receivable, net. The asset balances at December 31, 2017 and 2016 and the changes in those balances are included in the following table:
December 31, 2017 | December 31, 2016 | Change 2017 vs. 2016 | Percent Change 2017 vs. 2016 | |||||||||||
(Dollars in thousands) | ||||||||||||||
Cash and cash equivalents | $ | 103,015 | $ | 103,745 | $ | (730 | ) | (0.7 | )% | |||||
Investment securities available for sale | 810,530 | 794,645 | 15,885 | 2.0 | ||||||||||
Loans held for sale | 2,288 | 11,662 | (9,374 | ) | (80.4 | ) | ||||||||
Total loans receivable, net | 2,816,985 | 2,609,666 | 207,319 | 7.9 | ||||||||||
Other real estate owned | — | 754 | (754 | ) | (100.0 | ) | ||||||||
Premises and equipment, net | 60,325 | 63,911 | (3,586 | ) | (5.6 | ) | ||||||||
FHLB stock, at cost | 8,347 | 7,564 | 783 | 10.4 | ||||||||||
Bank owned life insurance | 75,091 | 70,355 | 4,736 | 6.7 | ||||||||||
Accrued interest receivable | 12,244 | 10,925 | 1,319 | 12.1 | ||||||||||
Prepaid expenses and other assets | 99,328 | 79,351 | 19,977 | 25.2 | ||||||||||
Other intangible assets, net | 6,088 | 7,374 | (1,286 | ) | (17.4 | ) | ||||||||
Goodwill | 119,029 | 119,029 | — | — | ||||||||||
Total assets | $ | 4,113,270 | $ | 3,878,981 | $ | 234,289 | 6.0 | % | ||||||
Investment Activities
Our investment policy is established by the Board of Directors and monitored by the Risk Committee of the Board of Directors. It is designed primarily to provide and maintain liquidity, generate a favorable return on investments without incurring undue interest rate and credit risk, and complements the Bank's lending activities. The policy dictates the criteria for classifying securities as either available for sale or held to maturity. The policy permits investment in various types of liquid assets permissible under applicable regulations, which include U.S. Treasury obligations, U.S. Government agency obligations, some certificates of deposit of insured banks, mortgage-backed and mortgage related securities, corporate notes, municipal bonds, and federal funds. Investment in non-investment grade bonds and stripped mortgage-backed securities is not permitted under the policy.
Investment securities available for sale increased $15.9 million, or 2.0%, to $810.5 million at December 31, 2017 from $794.6 million at December 31, 2016. The increase was due primarily to purchases of investment securities of $149.9 million during the year ended December 31, 2017. The increase was partially offset by maturities, calls and payments of investment securities of $98.9 million and sales of investment securities of $31.0 million during the year ended December 31, 2017.
34
The following table provides information regarding our investment securities available for sale at the dates indicated.
December 31, 2017 | December 31, 2016 | December 31, 2015 | ||||||||||||||||||
Fair Value | % of Total Investments | Fair Value | % of Total Investments | Fair Value | % of Total Investments | |||||||||||||||
(Dollars in thousands) | ||||||||||||||||||||
U.S. Treasury and U.S. Government-sponsored agencies | $ | 13,442 | 1.7 | % | $ | 1,569 | 0.2 | % | $ | 35,577 | 4.4 | % | ||||||||
Municipal securities | 250,015 | 30.8 | 237,256 | 29.9 | 220,993 | 27.2 | ||||||||||||||
Mortgage-backed securities and collateralized mortgage obligations(1): | ||||||||||||||||||||
Residential | 280,211 | 34.5 | 309,176 | 38.9 | 352,024 | 43.4 | ||||||||||||||
Commercial | 217,079 | 26.8 | 208,318 | 26.2 | 179,011 | 22.0 | ||||||||||||||
Collateralized loan obligations | 4,580 | 0.6 | 10,478 | 1.3 | 15,097 | 1.9 | ||||||||||||||
Corporate obligations | 16,770 | 2.1 | 16,706 | 2.1 | 9,113 | 1.1 | ||||||||||||||
Other securities(2) | 28,433 | 3.5 | 11,142 | 1.4 | 54 | — | ||||||||||||||
Total | $ | 810,530 | 100.0 | % | $ | 794,645 | 100.0 | % | $ | 811,869 | 100.0 | % | ||||||||
(1) Issued and guaranteed by U.S. Government-sponsored agencies.
(2) Primarily asset-backed securities issued and guaranteed by U.S. Government-sponsored agencies.
The following table provides information regarding our investment securities available for sale, by contractual maturity, at December 31, 2017. Equity securities totaling $146,000 are excluded because they have no stated maturity dates.
One Year or Less | Over One to Five Years | Over Five to Ten Years | Over Ten Years | ||||||||||||||||||||||||
Fair Value | Weighted Average Yield(2) | Fair Value | Weighted Average Yield(2) | Fair Value | Weighted Average Yield(2) | Fair Value | Weighted Average Yield (2) | ||||||||||||||||||||
(Dollars in thousands) | |||||||||||||||||||||||||||
U.S. Treasury and U.S. Government-sponsored agencies | $ | — | — | % | $ | 552 | 2.03 | % | $ | 6,902 | 2.78 | % | $ | 5,988 | 2.01 | % | |||||||||||
Municipal securities | 8,982 | 3.77 | 69,160 | 3.27 | 41,357 | 3.56 | 130,516 | 3.84 | |||||||||||||||||||
Mortgage-backed securities and collateralized mortgage obligations (1): | |||||||||||||||||||||||||||
Residential | — | — | 2,549 | 1.69 | 62,318 | 2.24 | 215,344 | 2.39 | |||||||||||||||||||
Commercial | 57,154 | 2.10 | 109,768 | 2.42 | 50,157 | 2.45 | |||||||||||||||||||||
Collateralized loan obligations | — | — | — | — | 4,580 | 2.71 | — | — | |||||||||||||||||||
Corporate obligations | — | — | 3,082 | 3.08 | 13,688 | 2.55 | — | — | |||||||||||||||||||
Other securities (3) | — | — | — | — | — | — | 28,287 | 2.41 | |||||||||||||||||||
Total | $ | 8,982 | 3.77 | % | $ | 132,497 | 2.73 | % | $ | 238,613 | 2.59 | % | $ | 430,292 | 2.83 | % | |||||||||||
(1) Issued and guaranteed by U.S. Government-sponsored agencies.
(2) Taxable equivalent weighted average yield.
(3) Primarily asset-backed securities issued and guaranteed by U.S. Government-sponsored agencies.
35
Loan Portfolio
The Bank is a full service commercial bank, which originates a wide variety of loans with a focus on commercial business loans. Total loans receivable, net of allowance for loan losses, increased $207.3 million, or 7.9%, to $2.82 billion at December 31, 2017 from $2.61 billion at December 31, 2016. The increase in loans receivable was primarily in the non-owner occupied commercial real estate loan class which increased $105.7 million, or 12.0%, to $986.6 million during the year ended December 31, 2017 and in the owner-occupied commercial real estate loan class which increased $64.1 million, or 11.5%, to $622.2 million during the same period.
The following table provides information about our loan portfolio by type of loan at the dates indicated. These balances are prior to deduction for the allowance for loan losses.
December 31, | ||||||||||||||||||||||||||||||||||
2017 | 2016 | 2015 | 2014 | 2013 | ||||||||||||||||||||||||||||||
Balance | % of Total(3) | Balance | % of Total(3) | Balance | % of Total(3) | Balance | % of Total(3) | Balance | % of Total(3) | |||||||||||||||||||||||||
(Dollars in thousands) | ||||||||||||||||||||||||||||||||||
Commercial business: | ||||||||||||||||||||||||||||||||||
Commercial and industrial | $ | 645,396 | 22.7 | % | $ | 637,773 | 24.2 | % | $ | 596,726 | 24.8 | % | $ | 570,453 | 25.3 | % | $ | 351,230 | 28.5 | % | ||||||||||||||
Owner-occupied commercial real estate | 622,150 | 21.8 | 558,035 | 21.1 | 572,609 | 23.8 | 574,687 | 25.5 | 303,073 | 24.6 | ||||||||||||||||||||||||
Non-owner occupied commercial real estate | 986,594 | 34.6 | 880,880 | 33.4 | 753,986 | 31.4 | 663,935 | 29.5 | 417,206 | 33.9 | ||||||||||||||||||||||||
Total commercial business | 2,254,140 | 79.1 | 2,076,688 | 78.7 | 1,923,321 | 80.0 | 1,809,075 | 80.3 | 1,071,509 | 87.0 | ||||||||||||||||||||||||
One-to-four family residential (1) | 86,997 | 3.1 | 77,391 | 2.9 | 72,548 | 3.0 | 69,530 | 3.1 | 47,859 | 3.9 | ||||||||||||||||||||||||
Real estate construction and land development: | ||||||||||||||||||||||||||||||||||
One-to-four family residential | 51,985 | 1.8 | 50,414 | 1.9 | 51,752 | 2.2 | 49,195 | 2.2 | 21,280 | 1.7 | ||||||||||||||||||||||||
Five or more family residential and commercial properties | 97,499 | 3.4 | 108,764 | 4.1 | 55,325 | 2.3 | 64,920 | 2.9 | 48,655 | 3.9 | ||||||||||||||||||||||||
Total real estate construction and land development (2) | 149,484 | 5.2 | 159,178 | 6.0 | 107,077 | 4.5 | 114,115 | 5.1 | 69,935 | 5.6 | ||||||||||||||||||||||||
Consumer | 355,091 | 12.5 | 325,140 | 12.3 | 298,167 | 12.4 | 259,294 | 11.5 | 45,287 | 3.7 | ||||||||||||||||||||||||
Gross loans receivable | 2,845,712 | 99.9 | 2,638,397 | 99.9 | 2,401,113 | 99.9 | 2,252,014 | 100.0 | 1,234,590 | 100.2 | ||||||||||||||||||||||||
Net deferred loan costs (fees) | 3,359 | 0.1 | 2,352 | 0.1 | 929 | 0.1 | (937 | ) | — | (2,670 | ) | (0.2 | ) | |||||||||||||||||||||
Loans receivable, net | $ | 2,849,071 | 100.0 | % | $ | 2,640,749 | 100.0 | % | $ | 2,402,042 | 100.0 | % | $ | 2,251,077 | 100.0 | % | $ | 1,231,920 | 100.0 | % | ||||||||||||||
(1) Excludes loans held for sale of $2.3 million, $11.7 million, $7.7 million and $5.6 million as of December 31, 2017, 2016, 2015 and 2014 respectively. There were no loans held for sale at December 31, 2013.
(2) Balances are net of undisbursed loan proceeds.
(3) Percent of loans receivable, net.
36
The following table presents at December 31, 2017 (i) the aggregate contractual maturities of loans in the named categories of our loan portfolio and (ii) the aggregate amounts of fixed rate and variable or adjustable rate loans in the named categories.
Maturing | ||||||||||||||||
One Year or Less | Over One to Five Years | Over Five Years | Total | |||||||||||||
(In thousands) | ||||||||||||||||
Commercial business | $ | 280,477 | $ | 427,001 | $ | 1,546,662 | $ | 2,254,140 | ||||||||
One-to-four family residential | 2,313 | 2,577 | 82,107 | 86,997 | ||||||||||||
Real estate construction and land development | 123,802 | 22,133 | 3,549 | 149,484 | ||||||||||||
Consumer | 15,975 | $ | 114,215 | $ | 224,901 | 355,091 | ||||||||||
Gross loans receivable | $ | 422,567 | $ | 565,926 | $ | 1,857,219 | $ | 2,845,712 | ||||||||
Fixed rate loans | $ | 109,545 | $ | 394,561 | $ | 500,726 | $ | 1,004,832 | ||||||||
Variable or adjustable rate loans | 313,022 | 171,365 | 1,356,493 | 1,840,880 | ||||||||||||
Total | $ | 422,567 | $ | 565,926 | $ | 1,857,219 | $ | 2,845,712 | ||||||||
Included in the balance of variable or adjustable rate loans with maturity over five years in the table above are certain commercial loans in which the Bank entered into non-hedge interest rate swap contracts with the borrower and a third party. Under these derivative contract arrangements, the Bank effectively earns a variable rate of interest based on one-month LIBOR plus various margins while the customer pays a fixed rate of interest. At December 31, 2017, the Bank had 39 separate interest rate swap contracts with borrowers with notional value of $146.5 million compared to 28 separate interest rate swap contracts with borrowers with notional value of $102.7 million at December 31, 2016.
37
The following table provides information about our nonaccrual loans, other real estate owned and performing TDR loans for the indicated dates.
December 31, | ||||||||||||||||||||
2017 | 2016 | 2015 | 2014 | 2013 | ||||||||||||||||
(Dollars in thousands) | ||||||||||||||||||||
Nonaccrual loans: | ||||||||||||||||||||
Commercial business | $ | 9,098 | $ | 8,580 | $ | 7,122 | $ | 8,596 | $ | 5,675 | ||||||||||
One-to-four family residential | 81 | 94 | 38 | — | 340 | |||||||||||||||
Real estate construction and land development | 1,247 | 2,008 | 2,414 | 2,831 | 1,045 | |||||||||||||||
Consumer | 277 | 227 | 94 | 145 | 685 | |||||||||||||||
Total nonaccrual loans(1)(2) | 10,703 | 10,909 | 9,668 | 11,572 | 7,745 | |||||||||||||||
Other real estate owned | — | 754 | 2,019 | 3,355 | 4,559 | |||||||||||||||
Total nonperforming assets | $ | 10,703 | $ | 11,663 | $ | 11,687 | $ | 14,927 | $ | 12,304 | ||||||||||
Allowance for loan losses | $ | 32,086 | $ | 31,083 | $ | 29,746 | $ | 27,729 | $ | 28,824 | ||||||||||
Nonperforming loans to loans receivable, net | 0.38 | % | 0.41 | % | 0.40 | % | 0.51 | % | 0.63 | % | ||||||||||
Allowance for loan losses to loans receivable, net | 1.13 | % | 1.18 | % | 1.24 | % | 1.23 | % | 2.34 | % | ||||||||||
Allowance for loan losses to nonperforming loans | 299.79 | % | 284.93 | % | 307.67 | % | 239.62 | % | 372.16 | % | ||||||||||
Nonperforming assets to total assets | 0.26 | % | 0.30 | % | 0.32 | % | 0.43 | % | 0.74 | % | ||||||||||
Performing TDR loans: | ||||||||||||||||||||
Commercial business | $ | 25,729 | $ | 19,837 | $ | 17,345 | $ | 14,421 | $ | 19,496 | ||||||||||
One-to-four family residential | 218 | 227 | 236 | 245 | 702 | |||||||||||||||
Real estate construction and land development | 645 | 2,141 | 3,014 | 3,927 | 6,043 | |||||||||||||||
Consumer | 165 | 83 | 100 | 66 | 101 | |||||||||||||||
Total performing TDR loans(3) | $ | 26,757 | $ | 22,288 | $ | 20,695 | $ | 18,659 | $ | 26,342 | ||||||||||
Accruing loans past due 90 days or more(4) | $ | — | $ | — | $ | — | $ | — | $ | 6 | ||||||||||
Potential problem loans(5) | 83,543 | 87,762 | 110,357 | 162,930 | 67,662 | |||||||||||||||
(1) At December 31, 2017, 2016, 2015, 2014 and 2013, $5.2 million $6.9 million, $6.3 million, $7.3 million and $2.6 million of nonaccrual loans were considered TDR loans, respectively.
(2) At December 31, 2017, 2016, 2015, 2014 and 2013, $1.9 million, $2.8 million $1.3 million, $1.6 million and $1.7 million of nonaccrual loans were guaranteed by government agencies, respectively.
(3) At December 31, 2017, 2016, 2015, 2014 and 2013, $1.4 million, $682,000, $491,000, $751,000 and $1.2 million of performing TDR loans were guaranteed by government agencies, respectively.
(4) Loans that are past due 90 days or more and still accruing interest are those that are both well-secured and in the process of collection. There were no accruing loans past due 90 days or more that were guaranteed by government agencies at December 31, 2017, 2016, 2015 and 2014. There were accruing loans past due 90 days or more of $6,000 guaranteed by government agencies at December 31, 2013.
(5) Potential problem loans are those loans that are currently accruing interest and are not considered impaired, but which are being monitored because the financial information of the borrower causes the Company concern as to the borrower’s ability to comply with their loan repayment terms. At December 31, 2017, 2016, 2015, 2014 and 2013, $3.1 million, $1.1 million, $3.0 million, $2.0 million and $1.8 million of potential problem loans were guaranteed by government agencies, respectively.
Nonperforming Assets. Nonperforming assets consist of nonaccrual loans and other real estate owned. Nonperforming assets decreased $1.0 million to $10.7 million, or 0.26% of total assets at December 31, 2017 from $11.7 million, or 0.30% of total assets, at December 31, 2016 due to the decrease in nonaccrual loans discussed below
38
as well as a decrease in other real estate owned. The Bank had no other real estate owned at December 31, 2017, a decrease of $754,000 from December 31, 2016. The decrease in other real estate owned was due to the disposition of all other real estate owned properties during the year ended December 31, 2017.
Nonaccrual Loans. Nonaccrual loans decreased $206,000 to $10.7 million, or 0.38% of loans receivable, net, at December 31, 2017 from $10.9 million, or 0.41% of loans receivable, net, at December 31, 2016. The decrease was due to net principal payments of $5.2 million, net charge-offs of $1.2 million and loans transferred from nonaccrual to a status of accruing of $1.0 million. The decrease in total nonaccrual loans at December 31, 2017 was offset by additions to nonaccrual loans of $7.2 million, of which $3.3 million and $1.6 million were previously potential problem loans and performing TDR loans, respectively, that were transferred to nonaccrual status. Nonaccrual loans totaling $3.8 million at December 31, 2017 had a related allowance for loan losses of $720,000 compared to nonaccrual loans of $4.6 million at December 31, 2016 with related allowance for loan losses of $770,000.
Troubled Debt Restructured Loans. TDR loans are considered impaired and are separately measured for impairment whether on accrual or nonaccrual status. At December 31, 2017, nonperforming TDR loans included in the nonaccrual loan balance was $5.2 million and had a related allowance for loan losses of $379,000. At December 31, 2016, nonperforming TDR loans of $6.9 million had a related allowance for loan losses of $437,000.
The performing TDR loans are not considered nonperforming assets as they continue to accrue interest despite being considered impaired due to the restructured status. Performing TDR loans as of December 31, 2017 and December 31, 2016 were $26.8 million and $22.3 million, respectively. The $4.5 million increase in performing TDR loans during the year ended December 31, 2017 was primarily due to loans restructured during the year ended December 31, 2017 of $15.4 million and principal additions of $712,000, offset partially by net principal reductions of $10.1 million, loans transferred to nonaccrual status of $1.6 million and net charge-offs of $16,000. The related allowance for loan losses on performing TDR loans was $2.6 million as of December 31, 2017 and $2.0 million as of December 31, 2016.
Potential Problem Loans. Potential problem loans decreased $4.2 million, or 4.8%, to $83.5 million at December 31, 2017 from $87.8 million at December 31, 2016 primarily due to net loan payments of $37.6 million, upgrade of potential problem loans to pass rated loans of $5.3 million, a potential problem loan transferred to held-for-sale of $5.8 million, potential problem loans transferred to impaired status of $6.0 million, potential problem loans restructured as TDRs of $841,000, and net charge-offs of $700,000, offset partially by loan downgrades to potential problem loans of $52.0 million during the year ended December 31, 2017.
39
Allowance for Loan Losses
The following table provides information regarding changes in our allowance for loan losses at and for the indicated years:
At or For the Years Ended December 31, | ||||||||||||||||||||
2017 | 2016 | 2015 | 2014 | 2013 | ||||||||||||||||
(Dollars in thousands) | ||||||||||||||||||||
Allowance for loan losses at beginning of the year | $ | 31,083 | $ | 29,746 | $ | 27,729 | $ | 28,824 | $ | 28,594 | ||||||||||
Provision for loan losses | 4,220 | 4,931 | 4,372 | 4,594 | 3,672 | |||||||||||||||
Charge-offs: | ||||||||||||||||||||
Commercial business | (2,438 | ) | (4,153 | ) | (1,676 | ) | (5,252 | ) | (3,073 | ) | ||||||||||
One-to-four family residential | (30 | ) | — | — | (31 | ) | (52 | ) | ||||||||||||
Real estate construction and land development | (556 | ) | (154 | ) | (106 | ) | (345 | ) | (565 | ) | ||||||||||
Consumer | (1,814 | ) | (1,778 | ) | (1,700 | ) | (969 | ) | (681 | ) | ||||||||||
Total charge-offs | (4,838 | ) | (6,085 | ) | (3,482 | ) | (6,597 | ) | (4,371 | ) | ||||||||||
Recoveries: | ||||||||||||||||||||
Commercial business | 947 | 1,844 | 476 | 716 | 808 | |||||||||||||||
One-to-four family residential | 2 | 2 | 13 | 7 | — | |||||||||||||||
Real estate construction and land development | 202 | 83 | 100 | 43 | 32 | |||||||||||||||
Consumer | 470 | 562 | 538 | 142 | 89 | |||||||||||||||
Total recoveries | 1,621 | 2,491 | 1,127 | 908 | 929 | |||||||||||||||
Net charge-offs | (3,217 | ) | (3,594 | ) | (2,355 | ) | (5,689 | ) | (3,442 | ) | ||||||||||
Allowance for loan losses at end of the year | $ | 32,086 | $ | 31,083 | $ | 29,746 | $ | 27,729 | $ | 28,824 | ||||||||||
Gross loans receivable at end of the year (1) | $ | 2,845,712 | $ | 2,638,397 | $ | 2,401,113 | $ | 2,252,014 | $ | 1,234,590 | ||||||||||
Average loans receivable during the year (1) | 2,703,934 | 2,489,730 | 2,316,175 | 1,871,696 | 1,124,828 | |||||||||||||||
Ratio of net charge-offs on loans to average loans receivable | (0.12 | )% | (0.14 | )% | (0.10 | )% | (0.30 | )% | (0.31 | )% | ||||||||||
(1) Excludes loans held for sale.
40
The following table shows the allocation of the allowance for loan losses at the indicated dates. The allocation is based upon an evaluation of defined loan problems, historical loan loss ratios, and industry-wide and other factors that affect loan losses in the categories shown below:
December 31, | ||||||||||||||||||||||||||||||||||
2017 | 2016 | 2015 | 2014 | 2013 | ||||||||||||||||||||||||||||||
Allowance for Loan Losses | % of Total (1) | Allowance for Loan Losses | % of Total (1) | Allowance for Loan Losses | % of Total (1) | Allowance for Loan Losses | % of Total (1) | Allowance for Loan Losses | % of Total (1) | |||||||||||||||||||||||||
(Dollars in thousands) | ||||||||||||||||||||||||||||||||||
Commercial business | $ | 21,999 | 79.1 | % | $ | 22,382 | 78.8 | % | $ | 22,064 | 80.1 | % | $ | 20,186 | 80.3 | % | $ | 22,853 | 86.7 | % | ||||||||||||||
One-to-four family residential | 1,056 | 3.1 | 1,015 | 2.9 | 1,157 | 3.0 | 1,200 | 3.1 | 1,100 | 3.9 | ||||||||||||||||||||||||
Real estate construction | 2,052 | 5.3 | 2,156 | 6.0 | 1,871 | 4.5 | 2,758 | 5.1 | 2,673 | 5.7 | ||||||||||||||||||||||||
Consumer | 6,081 | 12.5 | 5,024 | 12.3 | 4,309 | 12.4 | 2,769 | 11.5 | 1,597 | 3.7 | ||||||||||||||||||||||||
Unallocated | 898 | — | 506 | — | 345 | — | 816 | — | 601 | — | ||||||||||||||||||||||||
Total allowance for loan losses | $ | 32,086 | 100.0 | % | $ | 31,083 | 100.0 | % | $ | 29,746 | 100.0 | % | $ | 27,729 | 100.0 | % | $ | 28,824 | 100.0 | % | ||||||||||||||
(1) Represents the percent of loans receivable by loan category to total gross loans receivable.
The allowance for loan losses increased $1.0 million, or 3.2%, to $32.1 million at December 31, 2017 from $31.1 million at December 31, 2016 due to a provision for loan losses of $4.2 million, offset by net charge-offs of $3.2 million recognized during the year ended December 31, 2017. Net charge-offs for the years ended December 31, 2017 and 2016 included PCI pool closure charge-offs of $1.7 million and $1.0 million, respectively.
As of December 31, 2017, the Bank identified $10.7 million of nonperforming loans and $26.8 million of performing TDR loans for a total of $37.5 million of impaired loans. Of these impaired loans, $10.4 million had no allowances for loan losses as their estimated collateral value or discounted expected cash flow is equal to or exceeds their carrying costs. The remaining $27.1 million had related allowances for loan losses totaling $3.4 million. As of December 31, 2016, the Bank identified $10.9 million of nonperforming loans and $22.3 million of performing TDR loans for a total of $33.2 million of impaired loans. Of these impaired loans, $10.1 million had no allowances for loan losses as their estimated collateral value or discounted expected cash flow is equal to or exceeds their carrying costs. The remaining $23.1 million had related allowances for loan losses totaling $2.7 million.
41
The following table outlines the allowance for loan losses and related outstanding loan balances on loans at December 31, 2017 and 2016:
December 31, 2017 | December 31, 2016 | ||||||
(Dollars in thousands) | |||||||
General Valuation Allowance: | |||||||
Allowance for loan losses | $ | 24,732 | $ | 21,791 | |||
Gross loans, excluding PCI and impaired loans | 2,767,650 | 2,540,751 | |||||
Percentage | 0.89 | % | 0.86 | % | |||
PCI Allowance: | |||||||
Allowance for loan losses | $ | 3,999 | $ | 6,558 | |||
Gross PCI loans | 40,603 | 64,448 | |||||
Percentage | 9.85 | % | 10.18 | % | |||
Specific Valuation Allowance: | |||||||
Allowance for loan losses | $ | 3,355 | $ | 2,734 | |||
Gross impaired loans | 37,459 | 33,198 | |||||
Percentage | 8.96 | % | 8.24 | % | |||
Total Allowance for Loan Losses: | |||||||
Allowance for loan losses | $ | 32,086 | $ | 31,083 | |||
Gross loans receivable | 2,845,712 | 2,638,397 | |||||
Percentage | 1.13 | % | 1.18 | % | |||
Based on the Bank's established comprehensive methodology, management deemed the allowance for loan losses of $32.1 million at December 31, 2017 (1.13% of loans receivable, net and 299.79% of nonperforming loans) appropriate to provide for probable incurred credit losses based on an evaluation of known and inherent risks in the loan portfolio at that date. This compares to an allowance for loan losses at December 31, 2016 of $31.1 million (1.18% of loans receivable, net and 284.93% of nonperforming loans).
While the Bank believes it has established its existing allowance for loan losses in accordance with GAAP, there can be no assurance that regulators, in reviewing the Bank's loan portfolios, will not request the Bank to increase its allowance for loan losses. In addition, because future events affecting borrowers and collateral cannot be predicted with certainty, there can be no assurance that the existing allowance for loan losses is appropriate or that increased provisions will not be necessary should the quality of the loans deteriorate. Any material increase in the allowance for loan losses would adversely affect the Company’s financial condition and results of operations.
Deposits
Total deposits increased $163.4 million, or 5.1%, to $3.39 billion at December 31, 2017 from $3.23 billion at December 31, 2016 due primarily to a $87.9 million, or 9.1%, increase in interest bearing demand deposits to $1.05 billion at December 31, 2017 from $963.8 million at December 31, 2016 and a $62.7 million, or 7.1%, increase in noninterest demand deposits to $944.8 million at December 31, 2017 from $882.1 million at December 31, 2016. Non-maturity deposits as a percentage of total deposits decreased to 88.3% at December 31, 2017 from 88.9% at December 31, 2016. The decrease in this ratio was primarily due to a lower proportional increase of total non-maturity deposits compared to the increase in certificate of deposit accounts. Certificate of deposit accounts increased $41.0 million, or 11.5%, to $398.4 million at December 31, 2017 from $357.4 million at December 31, 2016.
42
The following table provides the balances outstanding for each major category of deposits at the dates indicated:
December 31, 2017 | December 31, 2016 | December 31, 2015 | |||||||||||||||||||
Amount | Percent of Total | Amount | Percent of Total | Amount | Percent of Total | ||||||||||||||||
(Dollars in thousands) | |||||||||||||||||||||
Noninterest demand deposits | $ | 944,791 | 27.8 | % | $ | 882,091 | 27.3 | % | $ | 770,927 | 24.8 | % | |||||||||
Interest bearing demand deposits | 1,051,752 | 31.1 | 963,821 | 29.8 | 917,859 | 29.5 | |||||||||||||||
Money market accounts | 499,618 | 14.7 | 523,875 | 16.2 | 545,342 | 17.6 | |||||||||||||||
Savings accounts | 498,501 | 14.7 | 502,460 | 15.6 | 453,826 | 14.6 | |||||||||||||||
Total non-maturity deposits | 2,994,662 | 88.3 | 2,872,247 | 88.9 | 2,687,954 | 86.5 | |||||||||||||||
Certificate of deposit accounts | 398,398 | 11.7 | 357,401 | 11.1 | 420,333 | 13.5 | |||||||||||||||
Total deposits | $ | 3,393,060 | 100.0 | % | $ | 3,229,648 | 100.0 | % | $ | 3,108,287 | 100.0 | % | |||||||||
The following table provides the average balances outstanding and the weighted average interest rates for each major category of deposits for the years indicated:
Years Ended December 31, | |||||||||||||||||||||
2017 | 2016 | 2015 | |||||||||||||||||||
Average Balance | Average Yield/Rate | Average Balance | Average Yield/Rate | Average Balance | Average Yield/Rate | ||||||||||||||||
(Dollars in thousands) | |||||||||||||||||||||
Interest bearing demand deposits and money market accounts | $ | 1,498,619 | 0.17 | % | $ | 1,464,198 | 0.16 | % | $ | 1,374,757 | 0.17 | % | |||||||||
Savings accounts | 499,435 | 0.26 | 485,482 | 0.16 | 405,633 | 0.11 | |||||||||||||||
Certificate of deposit accounts | 378,044 | 0.59 | 388,286 | 0.50 | 464,277 | 0.51 | |||||||||||||||
Total interest bearing deposits | 2,376,098 | 0.25 | 2,337,966 | 0.21 | 2,244,667 | 0.23 | |||||||||||||||
Noninterest demand deposits | 902,716 | — | 829,912 | — | 740,718 | — | |||||||||||||||
Total deposits | $ | 3,278,814 | 0.18 | % | $ | 3,167,878 | 0.16 | % | $ | 2,985,385 | 0.18 | % | |||||||||
The following table shows the amount and maturity of certificate of deposit accounts of $250,000 or more:
December 31, 2017 | |||
(In thousands) | |||
Remaining maturity: | |||
Three months or less | $ | 26,199 | |
Over three months through twelve months | 56,897 | ||
Over twelve months through three years | 19,388 | ||
Over three years | 11,214 | ||
Total | $ | 113,698 | |
Borrowings
Borrowed funds provide an additional source of funding for loan growth. Our borrowed funds consist primarily of borrowings from the FHLB of Des Moines as well as securities repurchase agreements. The FHLB advances are
43
typically secured by first lien one-to-four family residential loans, commercial real estate loans and stock issued by the FHLB, which is owned by us. Securities repurchase agreements are secured by investment securities.
At December 31, 2017, the Bank maintained a credit facility with the FHLB of Des Moines in the amount of $881.1 million, of which $92.5 million was advanced. At December 31, 2016 there were FHLB advances outstanding of $79.6 million. During the years ended December 31, 2017 and 2016, the Bank had average balances of FHLB advances of $105.6 million and $13.3 million, respectively.
At December 31, 2017 and 2016, the Bank had securities sold under agreement to repurchase of $31.8 million and $22.1 million, respectively.
Stockholders' Equity and Capital
Total stockholders’ equity increased $26.5 million, or 5.5%, to $508.3 million at December 31, 2017 from $481.8 million at December 31, 2016. This increase was primarily due to net income of $41.8 million, stock-based compensation expense of $2.1 million and accumulated other comprehensive loss, net of tax of $1.5 million, partially offset by cash dividends in the amount of $18.3 million.
Quarterly, the Company reviews the potential payment of cash dividends to common shareholders. The timing and amount of cash dividends paid on our common stock depends on the Company’s earnings, capital requirements, financial condition and other relevant factors. Dividends on common stock from the Company depend substantially upon receipt of dividends from the Bank, which is the Company’s predominant source of income. The following table sets forth the dividends paid per common share and the dividend payout ratio:
Year Ended December 31, | |||||||||||
2017 | 2016 | 2015 | |||||||||
(In thousands | |||||||||||
Dividends paid per common share | $ | 0.61 | $ | 0.72 | $ | 0.53 | |||||
Dividend payout ratio (1) | 43.9 | % | 55.4 | % | 42.4 | % | |||||
(1) Dividends paid per common share as a percentage of earnings per diluted common share.
Subsequent to year end, on January 24, 2018, the Company’s Board of Directors declared a dividend of $0.15 per share which was paid on February 21, 2018 to shareholders of record as of February 7, 2018.
See “Item 6. Selected Financial Data” for our return on average assets, return on average equity and average equity to average assets ratios for all reported periods.
The Company and the Bank are subject to various regulatory capital requirements as prescribed by the Federal Reserve and by the FDIC, respectively. As of December 31, 2017, the Company and the Bank were classified as “well capitalized” institutions under the criteria established by these banking regulators. For additional information regarding the Company’s and the Bank’s regulatory capital requirements, see “Supervision and Regulation-Capital Adequacy” in “Item 1. Business” and Note (21) Regulatory Capital Requirements included in “Item 8. Financial Statements and Supplementary Data.”
Off-Balance Sheet Arrangements
In the ordinary course of business, we enter into various types of transactions that include commitments to extend credit that are not included in our Consolidated Financial Statements. We apply the same credit standards to these commitments as we use in all our lending activities and have included these commitments in our lending risk evaluations. Our exposure to credit loss under commitments to extend credit is represented by the amount of these commitments. The Company had off-balance sheet loan commitments, including letters of credit, aggregating $713.2 million at December 31, 2017, an increase of $87.2 million, or 13.9%, from $626.0 million at December 31, 2016. For additional information, see Note (14) Commitments and Contingencies included in “Item 8. Financial Statements and Supplementary Data.”
44
Average Balances, Yields and Rates Paid for the Years Ended December 31, 2017, 2016 and 2015
Our core profitability depends primarily on our net interest income, which is the difference between the income we receive on our loan and investment portfolios, and our cost of funds, which consists of interest paid on deposits and borrowed funds. Like most financial institutions, our interest income and cost of funds are affected significantly by general economic conditions, particularly changes in market interest rates and government policies.
Changes in net interest income result from changes in volume, net interest spread, and net interest margin. Volume refers to the average dollar amounts of interest earning assets and interest bearing liabilities. Net interest spread refers to the difference between the average yield on interest earning assets and the average cost of interest bearing liabilities. Net interest margin refers to net interest income divided by average interest earning assets and is influenced by the level and relative mix of interest earning assets and interest bearing and noninterest bearing liabilities.
The following table provides relevant net interest income information for selected periods. The average daily loan balances presented in the table are net of allowances for loan losses. Nonaccrual loans have been included in the tables as loans carrying a zero yield. Yields on tax-exempt securities and loans have not been presented on a tax-equivalent basis.
Year Ended December 31, | ||||||||||||||||||||||||||||||||
2017 | 2016 | 2015 | ||||||||||||||||||||||||||||||
Average Balance | Interest Earned/ Paid | Average Yield/ Rate | Average Balance | Interest Earned/ Paid | Average Yield/ Rate | Average Balance | Interest Earned/ Paid | Average Yield/ Rate | ||||||||||||||||||||||||
(Dollars in thousands) | ||||||||||||||||||||||||||||||||
Assets: | ||||||||||||||||||||||||||||||||
Total loans receivable, net | $ | 2,703,934 | $ | 129,213 | 4.78 | % | $ | 2,489,730 | $ | 122,147 | 4.91 | % | $ | 2,316,175 | $ | 121,687 | 5.25 | % | ||||||||||||||
Taxable securities | 570,969 | 12,688 | 2.22 | 589,867 | 11,215 | 1.90 | 548,787 | 9,578 | 1.75 | |||||||||||||||||||||||
Nontaxable securities | 226,934 | 5,269 | 2.32 | 221,708 | 4,870 | 2.20 | 204,443 | 4,196 | 2.05 | |||||||||||||||||||||||
Other interest earning assets | 54,758 | 710 | 1.30 | 44,951 | 280 | 0.62 | 80,882 | 278 | 0.34 | |||||||||||||||||||||||
Total interest earning assets | 3,556,595 | 147,880 | 4.16 | 3,346,256 | 138,512 | 4.14 | 3,150,287 | 135,739 | 4.31 | |||||||||||||||||||||||
Noninterest earning assets | 424,757 | 399,279 | 377,228 | |||||||||||||||||||||||||||||
Total assets | $ | 3,981,352 | $ | 3,745,535 | $ | 3,527,515 | ||||||||||||||||||||||||||
Liabilities and Stockholders' Equity: | ||||||||||||||||||||||||||||||||
Certificate of deposit accounts | $ | 378,044 | $ | 2,244 | 0.59 | % | $ | 388,286 | $ | 1,936 | 0.50 | % | $ | 464,277 | $ | 2,386 | 0.51 | % | ||||||||||||||
Savings accounts | 499,435 | 1,311 | 0.26 | 485,482 | 756 | 0.16 | 405,633 | 445 | 0.11 | |||||||||||||||||||||||
Interest bearing demand and money market accounts | 1,498,619 | 2,494 | 0.17 | 1,464,198 | 2,318 | 0.16 | 1,374,757 | 2,398 | 0.17 | |||||||||||||||||||||||
Total interest bearing deposits | 2,376,098 | 6,049 | 0.25 | 2,337,966 | 5,010 | 0.21 | 2,244,667 | 5,229 | 0.23 | |||||||||||||||||||||||
Junior subordinated debentures | 19,860 | 1,014 | 5.11 | 19,565 | 880 | 4.50 | 19,271 | 827 | 4.29 | |||||||||||||||||||||||
45
Year Ended December 31, | ||||||||||||||||||||||||||||||||
2017 | 2016 | 2015 | ||||||||||||||||||||||||||||||
Average Balance | Interest Earned/ Paid | Average Yield/ Rate | Average Balance | Interest Earned/ Paid | Average Yield/ Rate | Average Balance | Interest Earned/ Paid | Average Yield/ Rate | ||||||||||||||||||||||||
(Dollars in thousands) | ||||||||||||||||||||||||||||||||
FHLB advances and other borrowings | 105,648 | 1,226 | 1.16 | 13,349 | 74 | 0.55 | 1,777 | 6 | 0.34 | |||||||||||||||||||||||
Securities sold under agreement to repurchase | 25,434 | 57 | 0.22 | 20,392 | 42 | 0.21 | 23,522 | 58 | 0.25 | |||||||||||||||||||||||
Total interest bearing liabilities | 2,527,040 | 8,346 | 0.33 | 2,391,272 | 6,006 | 0.25 | 2,289,237 | 6,120 | 0.27 | |||||||||||||||||||||||
Demand and other noninterest bearing deposits | 902,716 | 829,912 | 740,718 | |||||||||||||||||||||||||||||
Other noninterest bearing liabilities | 51,820 | 38,474 | 33,458 | |||||||||||||||||||||||||||||
Stockholders’ equity | 499,776 | 485,877 | 464,102 | |||||||||||||||||||||||||||||
Total liabilities and stockholders’ equity | $ | 3,981,352 | $ | 3,745,535 | $ | 3,527,515 | ||||||||||||||||||||||||||
Net interest income | $ | 139,534 | $ | 132,506 | $ | 129,619 | ||||||||||||||||||||||||||
Net interest spread | 3.83 | % | 3.89 | % | 4.04 | % | ||||||||||||||||||||||||||
Net interest margin | 3.92 | % | 3.96 | % | 4.11 | % | ||||||||||||||||||||||||||
Average interest earning assets to average interest bearing liabilities | 140.74 | % | 139.94 | % | 137.61 | % | ||||||||||||||||||||||||||
46
The following table provides the amount of change in our net interest income attributable to changes in volume and changes in interest rates. Changes attributable to the combined effect of volume and interest rates have been allocated proportionately for changes due specifically to volume and interest rates.
Year Ended December 31, | ||||||||||||||||||||||||
2017 Compared to 2016 Increase (Decrease) Due to | 2016 Compared to 2015 Increase (Decrease) Due to | |||||||||||||||||||||||
Volume | Rate | Total | Volume | Rate | Total | |||||||||||||||||||
(In thousands) | ||||||||||||||||||||||||
Interest Earning Assets: | ||||||||||||||||||||||||
Loans | $ | 10,236 | $ | (3,170 | ) | $ | 7,066 | $ | 8,515 | $ | (8,055 | ) | $ | 460 | ||||||||||
Taxable securities | (420 | ) | 1,893 | 1,473 | 781 | 856 | 1,637 | |||||||||||||||||
Nontaxable securities | 121 | 278 | 399 | 379 | 295 | 674 | ||||||||||||||||||
Other interest earning assets | 127 | 303 | 430 | (224 | ) | 226 | 2 | |||||||||||||||||
Interest income | $ | 10,064 | $ | (696 | ) | $ | 9,368 | $ | 9,451 | $ | (6,678 | ) | $ | 2,773 | ||||||||||
Interest Bearing Liabilities: | ||||||||||||||||||||||||
Certificate of deposit accounts | $ | (61 | ) | $ | 369 | $ | 308 | $ | (379 | ) | $ | (71 | ) | $ | (450 | ) | ||||||||
Savings accounts | 37 | 518 | 555 | 124 | 187 | 311 | ||||||||||||||||||
Interest bearing demand and money market accounts | 57 | 119 | 176 | 142 | (222 | ) | (80 | ) | ||||||||||||||||
Total interest bearing deposits | 33 | 1,006 | 1,039 | (113 | ) | (106 | ) | (219 | ) | |||||||||||||||
Junior subordinated debentures | 15 | 119 | 134 | 13 | 40 | 53 | ||||||||||||||||||
Securities sold under agreement to repurchase | 11 | 4 | 15 | (6 | ) | (10 | ) | (16 | ) | |||||||||||||||
FHLB advances and other borrowings | 1,071 | 81 | 1,152 | 64 | 4 | 68 | ||||||||||||||||||
Interest expense | $ | 1,130 | $ | 1,210 | $ | 2,340 | $ | (42 | ) | $ | (72 | ) | $ | (114 | ) | |||||||||
Net Interest Income | $ | 8,934 | $ | (1,906 | ) | $ | 7,028 | $ | 9,493 | $ | (6,606 | ) | $ | 2,887 | ||||||||||
Results of Operations for the Years Ended December 31, 2017 and 2016
Earnings Summary
Net income was $41.8 million, or $1.39 per diluted common share, for the year ended December 31, 2017 compared to $38.9 million, or $1.30 per diluted common share, for the year ended December 31, 2016. The increase in net income of $2.9 million, or 7.4%, for the year ended December 31, 2017 compared to the year ended December 31, 2016 was primarily the result of an increase in net interest income of $7.0 million, or 5.3%, and an increase in total noninterest income of $3.8 million, or 12.0%, partially offset by an increase in income tax expense of $4.6 million, or 33.0%, and an increase in total noninterest expense of $4.1 million, or 3.9%.
The net interest margin decreased four basis points to 3.92% for the year ended December 31, 2017 compared to 3.96% for the same period in 2016 primarily due to a decrease in loan yields, which is included in the table below.
The efficiency ratio consists of noninterest expense divided by the sum of net interest income before provision for loan losses plus noninterest income. The Company’s efficiency ratio improved to 63.21% for the year ended December 31, 2017 from 64.87% for the year ended December 31, 2016. The improvement in the efficiency ratio for the year ended December 31, 2017 compared to the year ended December 31, 2016 was primarily attributable to the increases in net interest income and noninterest income.
Noninterest expense as a percentage of average assets (or overhead ratio) is a metric utilized by the Bank to monitor its performance exclusive of the impact of market conditions on net interest margin. The Company's noninterest expense ratio decreased to 2.78% for the year ended December 31, 2017 from 2.84% during year ended December 31, 2016. The decrease reflects the Company's growth in average assets and its efforts to reduce discretionary operating costs.
47
Net Interest Income
One of the Company's key sources of earnings is net interest income. There are several factors that affect net interest income including, but not limited to, the volume, pricing, mix and maturity of interest earning assets and interest bearing liabilities; the volume of noninterest bearing deposits and other liabilities and stockholders' equity; the volume of noninterest earning assets; market interest rate fluctuations; and asset quality. Net interest income increased $7.0 million, or 5.3%, to $139.5 million for the year ended December 31, 2017 compared to $132.5 million for the year ended December 31, 2016. The increase in net interest income was primarily due to increases in average interest earning assets and yields on interest earning assets.
Interest Income
Total interest income increased $9.4 million, or 6.8%, to $147.9 million for the year ended December 31, 2017 compared to $138.5 million for the year ended December 31, 2016. The balance of average interest earning assets increased $210.3 million, or 6.3%, to $3.56 billion for the year ended December 31, 2017 from $3.35 billion for the year ended December 31, 2016. The yield on total interest earning assets increased two basis points to 4.16% for the year ended December 31, 2017 from 4.14% for the year ended December 31, 2016.
Interest income from interest and fees on loans increased $7.1 million, or 5.8%, to $129.2 million for the year ended December 31, 2017 from $122.1 million for the same period in 2016 due primarily to an increase in average loans receivable, offset partially by a decrease in average loan yields. Average loans receivable increased $214.2 million, or 8.6%, to $2.70 billion for the year ended December 31, 2017 compared to $2.49 billion for the year ended December 31, 2016 as a result of loan growth. Average loan yields decreased 13 basis points to 4.78% for the year ended December 31, 2017 from 4.91% for the year ended December 31, 2016. While variable indexed rates had increased during 2017, loan yield, excluding incremental accretion on purchased loans, decreased seven basis points to 4.55% for the year ended December 31, 2017 compared to 4.62% for the year ended 2016 due primarily to a combination of lower consumer indirect loan yields during 2017, fewer payments in 2017 to resolve nonperforming or charged-off loans and lower prepayment penalties received in 2017 as compared to 2016. Average loan yields secondarily decreased as a result of a decrease in incremental accretion income on purchased loans, which had the impact of loan yields of 0.23% for the year ended December 31, 2017 compared to 0.29% for the year ended December 31, 2017. Incremental accretion income was $6.3 million and $7.2 million for the years ended December 31, 2017 and 2016, respectively. The decrease in the incremental accretion was primarily a result of a continued decline in the purchased loan balances and a decrease in the prepayments of purchased loans during the year ended December 31, 2017 compared to the same period in 2016. The incremental accretion and the impact to loan yield will change during any period based on the volume of prepayments, but is expected to decrease over time as the balance of the purchased loans continues to decrease.
The following table presents the average loan yield and effects of the incremental accretion on purchased loans for the year ended December 31, 2017 and 2016:
Year Ended December 31, | ||||||||
2017 | 2016 | |||||||
(Dollars in thousands) | ||||||||
Loan yield, excluding incremental accretion on purchased loans (1) | 4.55 | % | 4.62 | % | ||||
Impact on loan yield from incremental accretion on purchased loans (1) | 0.23 | 0.29 | ||||||
Loan yield | 4.78 | % | 4.91 | % | ||||
Incremental accretion on purchased loans (1) | $ | 6,320 | $ | 7,155 | ||||
(1) As of the dates of the completion of each of the merger and acquisition transactions, purchased loans were recorded at their estimated fair value, including our estimate of future expected cash flows until the ultimate resolution of these credits. The difference between the contractual loan balance and the fair value represents the purchased discount. The purchased discount is modified quarterly as a result of cash flow re-estimation. The incremental accretion income represents the amount of income recorded on the purchased loans in excess of the contractual stated interest rate in the individual loan notes.
Total interest income increased primarily due to the increase in interest and fees on loans discussed above and secondarily due to an increase in interest income on investment securities of $1.9 million, or 11.6%, to $18.0 million during the year ended December 31, 2017 from $16.1 million for the year ended December 31, 2016. The increase in interest income on investment securities was the result of an increase in average investment yields for the year ended December 31, 2017 compared to the same period in 2016, offset partially by a decrease in the average balance of investment securities. Average yields on taxable securities increased 32 basis points to 2.22% for the year
48
ended December 31, 2017 from 1.90% for the same period in 2016. The increase is primarily the result of the rise in interest rates on the adjustable rate investment securities. Average yields on nontaxable securities increased 12 basis points to 2.32% for the year ended December 31, 2017 from 2.20% for the same period in 2016. The average balance of investment securities decreased $13.7 million, or 1.7%, to $797.9 million during the year ended December 31, 2017 from $811.6 million during the year ended December 31, 2016. The Company has actively managed its investment securities portfolio to mitigate declines in loan yields.
Average other interest earning assets increased $9.8 million, or 21.8%, to $54.8 million for the year ended December 31, 2017 compared to $45.0 million for the year ended December 31, 2016. The increase was due primarily to an increase in interest earning deposits, as the Bank held more funds in interest earning accounts at the Federal Reserve Bank of San Francisco compared to the same period in 2016.
Interest Expense
Total interest expense increased $2.3 million, or 39.0%, to $8.3 million for the year ended December 31, 2017 compared to $6.0 million for the same period in 2016. The average cost of interest bearing liabilities increased eight basis points to 0.33% for the year ended December 31, 2017 from 0.25% for the year ended December 31, 2016. Total average interest bearing liabilities increased $135.8 million, or 5.7%, to $2.53 billion for the year ended December 31, 2017 from $2.39 billion for the year ended December 31, 2016. The increase in costs from the prior year was primarily a result of increases in market rates and the increased use of higher cost borrowings to fund asset growth.
The average cost of interest bearing deposits increased four basis points to 0.25% for the year ended December 31, 2017 from 0.21% for the same period in 2016 due primarily to an increase in the cost of savings accounts.
Interest expense on savings accounts increased $555,000, or 73.4%, to $1.3 million for the year ended December 31, 2017 from $756,000 for the same period in 2016 due to increases in both the average balance and cost of savings accounts. The average balance of savings accounts increased $14.0 million, or 2.9%, to $499.4 million for the year ended December 31, 2017 from $485.5 million for the same period in 2016. The cost of savings accounts increased ten basis points to 0.26% for the year ended December 31, 2017 from 0.16% for the same period in 2016.
Interest expense of certificate of deposit accounts increased $308,000, or 15.91%, to $2.2 million for the year ended December 31, 2017. The average balance of certificate of deposit accounts decreased $10.2 million, or 2.64%, to $378.0 million for the year ended December 31, 2017 compared to $388.3 million for the year ended December 31, 2016 while the cost of certificate of deposit accounts increased to 0.59% for the year ended December 31, 2017 from 0.50% for the same period in 2016.
Interest expense on FHLB advances and other borrowings increased $1.2 million to $1.2 million for the year ended December 31, 2017 from $74,000 for the year ended December 31, 2016 due to a combination of an increase in average balances and an increase in the cost of funds. The average balance for FHLB advances and other borrowings increased $92.3 million to $105.6 million for the year ended December 31, 2017 from $13.3 million for the same period in 2016, due primarily to fund loan growth. The average rate of the FHLB advances and other borrowings increased 61 basis points for the year ended December 31, 2017 to 1.16% from 0.55% for the same period in 2016.
The average rate of the junior subordinated debentures, including the effects of accretion of the discount established as of the date of the merger with Washington Banking Company, was 5.11% for the year ended December 31, 2017, an increase of 61 basis points from 4.50% for the same period in 2016. The rate increase on the debentures was due primarily to an increase in the three-month LIBOR rate to 1.69% at December 31, 2017 from 1.00% on December 31, 2016.
Net Interest Margin
Net interest margin for the year ended December 31, 2017 decreased four basis points to 3.92% from 3.96% for the same period in 2016 primarily due to the above mentioned decrease in the loan yields (both including and excluding the impact of incremental accretion on purchased loans) and increase in cost of funds, offset partially by the increase in average loan receivable balances and the increase in yields on taxable and nontaxable securities. The net interest spread for the year ended December 31, 2017 decreased six basis points to 3.83% from 3.89% for the same period in 2016.
49
Net interest margin is impacted by the incremental accretion on purchased loans. The following table presents the net interest margin and effects of the incremental accretion on purchased loans for the year ended December 31, 2017 and 2016:
Year Ended December 31, | |||||
2017 | 2016 | ||||
Net interest margin, excluding incremental accretion on purchased loans (1) | 3.74 | % | 3.75 | % | |
Impact on net interest margin from incremental accretion on purchased loans (1) | 0.18 | 0.21 | |||
Net interest margin | 3.92 | % | 3.96 | % | |
(1) As of the dates of the completion of each of the merger and acquisition transactions, purchased loans were recorded at their estimated fair value, including our estimate of future expected cash flows until the ultimate resolution of these credits. The difference between the contractual loan balance and the fair value represents the purchased discount. The purchased discount is modified quarterly as a result of cash flow re-estimation. The incremental accretion income represents the amount of income recorded on the purchased loans in excess of the contractual stated interest rate in the individual loan notes.
Provision for Loan Losses
The Bank has established a comprehensive methodology for determining its allowance for loan losses. The allowance for loan losses is increased by provisions for loan losses charged to expense, and is reduced by loans charged-off, net of loan recoveries or a recovery of previous provision. The amount of the provision expense recognized during the years ended December 31, 2017 and 2016 was calculated in accordance with the Bank's methodology. For additional information, see “—Critical Accounting Policies” above.
The provision for loan losses is dependent on the Bank’s ability to manage asset quality and control the level of net charge-offs through prudent underwriting standards. In addition, a decline in general economic conditions could increase future provisions for loan losses and have a material effect on the Company’s net income.
The provision for loan losses decreased $711,000, or 14.4% to $4.2 million for the year ended December 31, 2017 from $4.9 million for the year ended December 31, 2016. The decrease in the provision for loan losses for the year ended December 31, 2017 from the same period in 2016 was primarily the result of continued improvements in our asset quality, changes in the volume and mix of loans, changes in certain environmental factors and improvements in certain historical loss factors, partially offset by the impact of loan growth. Based on a thorough review of the loan portfolio, the Bank determined that the provision for loan losses for the year ended December 31, 2017 was appropriate as it was calculated in accordance with the Bank's methodology for determining the allowance for loan losses.
Noninterest Income
Total noninterest income increased $3.8 million, or 12.0%, to $35.4 million for the year ended December 31, 2017 compared to $31.6 million for the year ended December 31, 2015. The following table presents the change in the key components of noninterest income for the periods noted.
Year Ended December 31, | ||||||||||||||
2017 | 2016 | Change 2017 vs. 2016 | Percentage Change | |||||||||||
(Dollars in thousands) | ||||||||||||||
Service charges and other fees | $ | 18,004 | $ | 14,354 | $ | 3,650 | 25.4 | % | ||||||
Gain on sale of investment securities, net | 6 | 1,315 | (1,309 | ) | (99.5 | ) | ||||||||
Gain on sale of loans, net | 7,696 | 6,994 | 702 | 10.0 | ||||||||||
Interest rate swap fees | 1,045 | 1,854 | (809 | ) | (43.6 | ) | ||||||||
Other income | 8,657 | 7,102 | 1,555 | 21.9 | ||||||||||
Total noninterest income | $ | 35,408 | $ | 31,619 | $ | 3,789 | 12.0 | % | ||||||
Service charges and other fees increased $3.7 million, or 25.4% to $18.0 million for the year ended December 31, 2017 compared to $14.4 million for the same period in 2016, due primarily to an increase in deposit balances and changes in fee structures on deposit accounts, including a consumer deposit account consolidation process completed at the end of 2016 and a business deposit consolidation process completed during second quarter 2017.
Other income increased $1.6 million, or 21.9%, to $8.7 million for the year ended December 31, 2017 compared to $7.1 million for the same period in 2016, due primarily to net gain on sales of two former Heritage
50
Bank branches held for sale of $682,000 recognized during the year ended December 31, 2017 and increases in recoveries of zero balance purchased loan notes which were charged-off prior to the consummation of the related merger acquisition.
Gain on sale of loans, net increased $702,000, or 10.0% to $7.7 million for the year ended December 31, 2017 compared to $7.0 million for the same period in 2016, due primarily to an increase in gain on sale of other loans of $743,000. During both years ended December 31, 2017 and 2016, the Bank sold one loan previously classified as purchased credit impaired for gain on sale. Secondarily, gain on sale of guaranteed portion of SBA loans, net increased $270,000 due primarily to an increase in proceeds from sale of the guaranteed portion of SBA loans of $3.3 million, or 19.4%, to $20.1 million for the year ended December 31, 2017 compared to $16.8 million for the same period in 2016. The detail of gain on sale of loans, net is included in the following schedule.
Year Ended December 31, | ||||||||||||||
2017 | 2016 | Change 2017 vs. 2016 | Percentage Change | |||||||||||
(Dollars in thousands) | ||||||||||||||
Gain on sale of mortgage loans, net | $ | 3,412 | $ | 3,723 | $ | (311 | ) | (8.4 | )% | |||||
Gain on sale of guaranteed portion of SBA loans, net | 1,286 | 1,016 | 270 | 26.6 | ||||||||||
Gain on sale of other loans, net | 2,998 | 2,255 | 743 | 32.9 | ||||||||||
Gain on sale of loans, net | $ | 7,696 | $ | 6,994 | $ | 702 | 10.0 | % | ||||||
The increase in noninterest income was partially offset by a decrease in gain on sale of investment securities, net of $1.3 million, or 99.5%, to $6,000 for the year ended December 31, 2017 from $1.3 million for the year ended December 31, 2016. The decrease was primarily the result of fewer sales as the Bank actively managed its investment portfolio. The proceeds from sale of investment securities was $31.0 million for the year ended December 31, 2017 compared to $140.4 million for the same period in 2016.
Noninterest Expense
Noninterest expense increased $4.1 million, or 3.9%, to $110.6 million for the year ended December 31, 2017 compared to $106.5 million for the year ended December 31, 2016. The following table presents changes in the key components of noninterest expense for the periods noted.
Year Ended December 31, | ||||||||||||||
2017 | 2016 | Change 2016 vs. 2015 | Percentage Change | |||||||||||
(Dollars in thousands) | ||||||||||||||
Compensation and employee benefits | $ | 64,268 | $ | 61,405 | $ | 2,863 | 4.7 | % | ||||||
Occupancy and equipment | 15,396 | 15,763 | (367 | ) | (2.3 | ) | ||||||||
Data processing | 8,176 | 7,312 | 864 | 11.8 | ||||||||||
Marketing | 2,943 | 2,835 | 108 | 3.8 | ||||||||||
Professional services | 4,777 | 3,606 | 1,171 | 32.5 | ||||||||||
State and local taxes | 2,461 | 2,616 | (155 | ) | (5.9 | ) | ||||||||
Federal deposit insurance premium | 1,435 | 1,620 | (185 | ) | (11.4 | ) | ||||||||
Other real estate owned, net | (70 | ) | 334 | (404 | ) | (121.0 | ) | |||||||
Amortization of intangible assets | 1,286 | 1,415 | (129 | ) | (9.1 | ) | ||||||||
Other expense | 9,903 | 9,567 | 336 | 3.5 | ||||||||||
Total noninterest expense | $ | 110,575 | $ | 106,473 | $ | 4,102 | 3.9 | % | ||||||
Compensation and employee benefits increased $2.9 million, or 4.7%, to $64.3 million during the year ended December 31, 2017 from $61.4 million during the year ended December 31, 2016. The increase in the year ended December 31, 2017 compared to 2016 was primarily due to senior level staffing increases, including the addition of the new Portland, Oregon lending team members who started in May 2017, and standard salary increases.
Professional services increased $1.2 million, or 32.5%, to $4.8 million during the year ended December 31, 2017 from $3.6 million during the year ended December 31, 2016. The increase in the year ended December 31, 2017
51
compared to 2016 was primarily due to due to benefit-based consulting fees related to the consumer deposit account consolidation process, which correspondingly generated an increase in service charges and other fees. Professional services also increased as a result of Trust-related expenses based on a renegotiated contract for 2017, which also increased other noninterest income, and costs incurred for our recent merger with Puget Sound of $810,000 during the year ended December 31, 2017.
Data processing increased $864,000, or 11.8%, to $8.2 million during the year ended December 31, 2017 from $7.3 million during the year ended December 31, 2016 primarily due to higher transactional activity in the core operating system and internet banking as a result of the growth in loans and deposits.
Other real estate owned, net decreased $404,000 or 121.0%, to income of $70,000 during the year ended December 31, 2017 compared to expense of $334,000 during the year ended December 31, 2016. The Bank had no other real estate owned at year ended December 31, 2017 compared to $754,000 at year ended December 31, 2016. The income recorded during the year ended December 31, 2017 was due to gain on sale of properties of $144,000, partially offset by maintenance expense of $75,000. For the year ended December 31, 2016, the Bank recorded a valuation adjustment of $383,000 and maintenance expense of $124,000, which was partially offset by the gain on sale of properties of $173,000.
The ratio of noninterest expense to average assets was 2.78% for the year ended December 31, 2017, compared to 2.84% for the year ended December 31, 2016. The decrease was primarily a result of an increase in assets and cost efficiencies gained through efforts by the Company to manage discretionary expenses.
Income Tax Expense
Income tax expense increased by $4.6 million, or 33.0%, to $18.4 million for the year ended December 31, 2017 from $13.8 million for the year ended December 31, 2016. The increase in the income tax expense during the year ended December 31, 2017 was primarily due to higher pre-tax net income and the Tax Cuts and Jobs Act enacted December 22, 2017, which required a revaluation of deferred tax assets and liabilities to account for the future impact of the decrease in corporate tax rate to 21% from 35% and other provisions of the legislation. The estimated revaluation of the net deferred tax asset increased income tax expense by $2.6 million for the year ended December 31, 2017. Certain amounts of the revaluation are considered reasonable estimates of the impact of the legislation as of December 31, 2017. As a result, the amounts could be adjusted during the measurement period, which will end in December 2018.
The effective tax rate was 30.5% for the year ended December 31, 2017 compared to 26.2% for the same period in 2016. The increase in the effective tax rate during the year ended December 31, 2017 compared to the same period in 2016 was due primarily to the revaluation of net deferred tax asset as a result of the Tax Cuts and Jobs Act and a lower proportion of tax-exempt income to total pre-tax income. For additional information, see Note (20) Income Taxes of the Notes to Consolidated Financial Statements included in “Item 8. Financial Statements and Supplementary Data.”
Results of Operations for the Years Ended December 31, 2016 and 2015
Earnings Summary
Net income was $38.9 million, or $1.30 per diluted common share, for the year ended December 31, 2016 compared to $37.5 million, or $1.25 per diluted common share, for the year ended December 31, 2015. The $1.4 million, or 3.8% increase in net income for the year ended December 31, 2016 compared to the year ended December 31, 2015 was primarily the result of a $2.9 million, or 2.2%, increase in net interest income, primarily as a result of the increase in interest earning assets, offset partially by a decrease in the net interest margin. The net interest margin decreased 15 basis points to 3.96% for the year ended December 31, 2016 compared to 4.11% for the same period in 2015.
The Company’s efficiency ratio decreased to 64.9% for the year ended December 31, 2016 from 65.6% for the year ended December 31, 2015. The decrease in the efficiency ratio for the year ended December 31, 2016 compared to the year ended December 31, 2015 is attributable primarily to the above mentioned increase in net interest income.
The Company's noninterest expense ratio decreased to 2.84% for the year ended December 31, 2016 from 3.01% during the year ended December 31, 2015. The decrease reflects the Company's growth in average assets and its efforts to reduce discretionary operating costs.
Net Interest Income
52
Net interest income increased $2.9 million, or 2.2%, to $132.5 million for the year ended December 31, 2016 compared to $129.6 million for the year ended December 31, 2015. The increase in net interest income was primarily due to an increase in average interest earning assets, partially offset by a decrease in the yield on average interest earning assets during the year ended December 31, 2016.
Interest Income
Total interest income increased $2.8 million, or 2.0%, to $138.5 million for the year ended December 31, 2016 compared to $135.7 million for the year ended December 31, 2015. The balance of average interest earning assets increased $196.0 million, or 6.2%, to $3.35 billion for the year ended December 31, 2016 from $3.15 billion for the year ended December 31, 2015. The yield on total interest earning assets decreased 17 basis points to 4.14% for the year ended December 31, 2016 from 4.31% for the year ended December 31, 2015.
Total interest income increased primarily due to the $2.3 million, or 16.8%, increase in interest income on investment securities to $16.1 million during the year ended December 31, 2016 from $13.8 million for the year ended December 31, 2015 as a result of both an increase in average balances and an increase in investment yields for the for the year ended December 31, 2016 compared to the year ended December 31, 2015. The average balances of taxable and nontaxable securities increased $58.3 million, or 7.7%, to $811.6 million for the year ended December 31, 2016 from $753.2 million for the year ended December 31, 2015, primarily as a result of purchases of investment securities. The yields on taxable securities increased 15 basis points to 1.90% for the year ended December 31, 2016 from 1.75% for the same period in 2015 and the yields on nontaxable securities increased 15 basis points to 2.20% for the year ended December 31, 2016 from 2.05% for the same period in 2015. The Company is actively managing its investment securities portfolio to mitigate declining loan yields.
Interest income on loans increased $460,000, or 0.4%, to $122.1 million for the year ended December 31, 2016 from $121.7 million for the same period in 2015 due primarily to a $173.6 million, or 7.5%, increase in the average balance of loans receivable to $2.49 billion for the year ended December 31, 2016 compared to $2.32 billion for the year ended December 31, 2015 as a result of loan growth. The impact on interest income as a result of the increase in average loan balances was partially offset by a decrease in loan yields, which was the result of a decrease in the contractual loan note rates and a decrease in the effects of incremental accretion income. Loan yields decreased 34 basis points to 4.91% for the year ended December 31, 2016 compared to 5.25% for the year ended December 31, 2015.
The following table presents the loan yield and effects of the incremental accretion on purchased loans for the years ended December 31, 2016 and 2015:
Year Ended December 31, | ||||||||
2016 | 2015 | |||||||
(Dollars in thousands) | ||||||||
Loan yield, excluding incremental accretion on purchased loans (1) | 4.62 | % | 4.81 | % | ||||
Impact on loan yield from incremental accretion on purchased loans (1) | 0.29 | 0.44 | ||||||
Loan yield | 4.91 | % | 5.25 | % | ||||
Incremental accretion on purchased loans (1) | $ | 7,155 | $ | 10,293 | ||||
(1) As of the dates of the completion of each of the merger and acquisition transactions, purchased loans were recorded at their estimated fair value, including our estimate of future expected cash flows until the ultimate resolution of these credits. The difference between the contractual loan balance and the fair value represents the purchased discount. The purchased discount is modified quarterly as a result of cash flow re-estimation. The incremental accretion income represents the amount of income recorded on the purchased loans in excess of the contractual stated interest rate in the individual loan notes.
The incremental accretion income was $7.2 million and $10.3 million for the years ended December 31, 2016 and 2015, respectively. The effect on loan yields from incremental accretion income decreased 15 basis points to 0.29% for the year ended December 31, 2016 from 0.44% for the year ended December 31, 2015 primarily a result of a decrease in the prepayments of purchased loans, consisting primarily of loans from the Washington Banking Merger, during the year ended December 31, 2016 compared to the same period in 2015, and a continued decline in the purchased loan balances.
53
The decrease in loan yields is also the result of an increase in LIBOR-based lending during the year ended December 31, 2016. The Bank began entering into non-hedge interest rate swap contracts to accommodate the business needs of its lending customers during the third quarter of 2015. Under these derivative contract arrangements with the borrower and a third party, the Bank effectively earns a variable rate of interest while the customer pays a fixed rate of interest. These derivatives were all written using 1-month LIBOR as the variable indexed rate. At December 31, 2016, the Bank had 28 separate interest rate swap contracts with borrowers with a notional value of $102.7 million compared to four interest rate swap contracts with borrowers with notional value of $20.7 million at December 31, 2015. The $82.0 million, or 396.1%, increase in these LIBOR-based loans during 2016 resulted in a lower loan yield during the year ended December 31, 2016 as compared to the year ended December 31, 2015 as these variable rate loans earn less interest income than comparable fixed rate loans at the time of origination. These LIBOR-based loans, however, will improve overall loan performance in a rising rate environment.
Interest Expense
Total interest expense decreased by $114,000, or 1.9%, to $6.0 million for the year ended December 31, 2016 from $6.1 million for the year ended December 31, 2015. The average cost of interest bearing liabilities decreased two basis points to 0.25% for the year ended December 31, 2016 from 0.27% for the year ended December 31, 2015. Total average interest bearing liabilities increased by $102.0 million, or 4.5%, to $2.39 billion for the year ended December 31, 2016 from $2.29 billion for the year ended December 31, 2015.
Total interest expense on interest bearing deposits decreased $219,000, or 4.2%, to $5.0 million during the year ended December 31, 2016 from $5.2 million the same period in 2015. The average total cost of interest bearing deposits decreased two basis points to 0.21% for the year ended December 31, 2016 from 0.23% for the same period in 2015.
The decrease in interest expense was primarily due to a $76.0 million, or 16.4%, decrease in the average balance of certificate of deposit accounts to $388.3 million during the year ended December 31, 2016 from $464.3 million during the same period in 2015 and a one basis point decrease in the cost on certificate of deposit accounts to 0.50% from 0.51% for the same respective periods. Based on the change in the average balance and cost of certificate of deposit accounts, the interest expense on certificate of deposit accounts decreased $450,000, or 18.9%, to $1.9 million for the year ended December 31, 2016 from $2.4 million for the same period in 2015.
The decrease in interest expense on certificate of deposit accounts was offset by a $311,000, or 69.9%, increase in the cost of savings accounts to $756,000 for the year ended December 31, 2016 from $445,000 for the same period in 2015. The increase in the cost of savings accounts during the year ended December 31, 2016 was due to the combination of a $79.8 million, or 19.7%, increase in the average balance of savings accounts to $485.5 million for the year ended December 31, 2016 from $405.6 million for the same period in 2015 and an increase of five basis points in the average cost of savings accounts to 0.16% for the year ended December 31, 2016 from 0.11% for the year ended December 31, 2015.
The average rate of the junior subordinated debentures, including the effects of accretion of the discount established as of the date of the Washington Banking Merger, for the year ended December 31, 2016 was 4.50%, an increase of 21 basis points from 4.29% for the same period in 2015.
Net Interest Margin
Net interest margin for the year ended December 31, 2016 decreased 15 basis points to 3.96% from 4.11% for the same period in 2015. The net interest spread for the year ended December 31, 2016 decreased 15 basis points to 3.89% from 4.04% for the same period in 2015. The decreases are primarily due to the above mentioned decrease in the loan yields (both including and excluding the impact of incremental accretion on purchased loans), offset partially by the above mentioned increase in average balances of loans receivable and investment securities and increases in yields on investment securities.
The following table presents the net interest margins and effects of the incremental accretion on purchased loans for the years ended December 31, 2016 and December 31, 2015:
Year Ended December 31, | |||||
2016 | 2015 | ||||
Net interest margin, excluding incremental accretion on purchased loans (1) | 3.75 | % | 3.78 | % | |
Impact on net interest margin from incremental accretion on purchased loans (1) | 0.21 | 0.33 | |||
Net interest margin | 3.96 | % | 4.11 | % | |
(1) As of the dates of the completion of each of the merger and acquisition transactions, purchased loans were recorded at their estimated fair value, including our estimate of future expected cash flows until the ultimate resolution of these credits. The difference
54
between the contractual loan balance and the fair value represents the purchased discount. The purchased discount is modified quarterly as a result of cash flow re-estimation. The incremental accretion income represents the amount of income recorded on the purchased loans in excess of the contractual stated interest rate in the individual loan notes.
Provision for Loan Losses
The provision for loan losses increased $559,000, or 12.8%, to $4.9 million for the year ended December 31, 2016 from $4.4 million for the year ended December 31, 2015. The increase in provision expense was due primarily the result of a $1.2 million increase in net charge-offs during 2016 in addition to changes in the volume and mix of loans, offset by the decrease in certain historical loss factors. The Bank had net charge-offs on loans of $3.6 million for the year ended December 31, 2016 compared to $2.4 million for the year ended December 31, 2015. The ratio of net charge-offs to average total loans outstanding was 0.14% for the year ended December 31, 2016 and 0.10% for the year ended December 31, 2015. Total gross loans receivable at December 31, 2016 and 2015 were $2.64 billion and $2.40 billion, respectively. Based on a thorough review of the loan portfolio, the Bank determined that the provision for loan losses for the year ended December 31, 2016 was appropriate as it was calculated in accordance with the Bank's methodology for determining allowance for loan losses.
Noninterest Income
Total noninterest income decreased $649,000, or 2.0%, to $31.6 million for the year ended December 31, 2016 compared to $32.3 million for the year ended December 31, 2015. The components of noninterest income and the changes from prior year are as follows:
Year Ended December 31, | ||||||||||||||
2016 | 2015 | Change 2016 vs. 2015 | Percentage Change | |||||||||||
(Dollars in thousands) | ||||||||||||||
Service charges and other fees | $ | 14,354 | $ | 14,179 | $ | 175 | 1.2 | % | ||||||
Gain on sale of investment securities, net | 1,315 | 1,516 | (201 | ) | (13.3 | ) | ||||||||
Gain on sale of loans, net | 6,994 | 4,683 | 2,311 | 49.3 | ||||||||||
Gain on termination of FDIC shared-loss agreements | — | 1,747 | (1,747 | ) | (100.0 | ) | ||||||||
Gain on sale of Merchant Visa portfolio | — | 2,198 | (2,198 | ) | (100.0 | ) | ||||||||
Interest rate swap fees | 1,854 | 452 | 1,402 | 310.2 | ||||||||||
Other income | 7,102 | 7,493 | (391 | ) | (5.2 | ) | ||||||||
Total noninterest income | $ | 31,619 | $ | 32,268 | $ | (649 | ) | (2.0 | )% | |||||
Gain on the sale of loans, net increased $2.3 million, or 49.3%, to $7.0 million for the year ended December 31, 2016 compared to the same period in 2015. The following table details the components of the gain on sale of loans:
Year Ended December 31, | ||||||||||||||
2016 | 2015 | Change 2016 vs. 2015 | Percentage Change | |||||||||||
(Dollars in thousands) | ||||||||||||||
Gain on sale of mortgage loans, net | $ | 3,723 | $ | 3,150 | $ | 573 | 18.2 | % | ||||||
Gain on sale of guaranteed portion of SBA loans, net | 1,016 | 1,533 | (517 | ) | (33.7 | ) | ||||||||
Gain on sale of other loans, net | 2,255 | — | 2,255 | 100.0 | ||||||||||
Gain on sale of loans, net | $ | 6,994 | $ | 4,683 | $ | 2,311 | 49.3 | % | ||||||
The increase in the net gain on the sale of mortgage loans was primarily due to an increase in the volume of loans sold to $141.1 million for the year ended December 31, 2016 from $130.8 million for the same period in 2015. The decrease of net gain on the sale of the government guaranteed portion of certain SBA loans is a result of a decrease in SBA guarantee sales activities due to competitive pressures. The net gain on sale of other loans was a result of the sale of two previously classified purchased credit impaired loans.
The Bank recorded a $1.7 million gain on termination of FDIC shared-loss agreements for the year ended December 31, 2015 as the Bank entered into an agreement terminating the shared-loss agreements for all three of the FDIC-assisted acquisitions during the year ended December 31, 2015. No similar gain was recorded by the Bank
55
during the year ended December 31, 2016. For additional information see Note (5) FDIC Indemnification Asset of the Notes to Consolidated Financial Statements included in “Item 8. Financial Statements and Supplementary Data.”
The Bank sold its Merchant Visa portfolio in January 2015, resulting in a gain on sale of Merchant VISA portfolio of $2.2 million for the year ended December 31, 2015. The effects of this sale resulted in lower Merchant Visa income and a decrease in total noninterest income.
Interest rate swap fees increased $1.4 million, or 310.2%, to $1.9 million for the year ended December 31, 2016 compared to $452,000 the same period in 2015, due primarily to an increase in the number of interest rate swap contracts executed during 2016. The Bank began executing these types of contracts during the third quarter of 2015. At December 31, 2016, the Bank had 28 contracts with borrowers with a notional value of $102.7 million compared to four contracts with borrowers with a notional value of $20.8 million at December 31, 2015.
Other income decreased $391,000, or 5.2%, to $7.1 million for year ended December 31, 2016 from $7.5 million for year ended December 31, 2015 due primarily to a decrease of $1.1 million in cash payments received on purchased loans charged-off prior to commencement of the acquisition or merger dates . The decrease in other income was offset partially an FDIC indemnification was not recorded during the year ended December 31, 2016 because of the above-mentioned termination of the FDIC shared-loss agreements as compared to a reduction of income of $497,000 recorded during the year ended December 31, 2015. The Bank also experienced an increase in fee income from annuities of $210,000 for the year ended December 31, 2016 compared to the same period in 2015.
Noninterest Expense
Noninterest expense increased $265,000, or 0.2%, to $106.5 million for the year ended December 31, 2016 compared to $106.2 million for the year ended December 31, 2015.
The following table presents the key components of noninterest expense and the changes from prior year:
Year Ended December 31, | ||||||||||||||
2016 | 2015 | Change 2016 vs. 2015 | Percentage Change | |||||||||||
(Dollars in thousands) | ||||||||||||||
Compensation and employee benefits | $ | 61,405 | $ | 58,134 | $ | 3,271 | 5.6 | % | ||||||
Occupancy and equipment | 15,763 | 15,846 | (83 | ) | (0.5 | ) | ||||||||
Data processing | 7,312 | 7,700 | (388 | ) | (5.0 | ) | ||||||||
Marketing | 2,835 | 3,066 | (231 | ) | (7.5 | ) | ||||||||
Professional services | 3,606 | 3,536 | 70 | 2.0 | ||||||||||
State and local taxes | 2,616 | 2,378 | 238 | 10.0 | ||||||||||
Federal deposit insurance premium | 1,620 | 2,046 | (426 | ) | (20.8 | ) | ||||||||
Other real estate owned, net | 334 | 1,007 | (673 | ) | (66.8 | ) | ||||||||
Amortization of intangible assets | 1,415 | 2,100 | (685 | ) | (32.6 | ) | ||||||||
Other expense | 9,567 | 10,395 | (828 | ) | (8.0 | ) | ||||||||
Total noninterest expense | $ | 106,473 | $ | 106,208 | $ | 265 | 0.2 | % | ||||||
Compensation and employee benefits increased $3.3 million, or 5.6%, to $61.4 million during the year ended December 31, 2016 compared to $58.1 million during the year ended December 31, 2015. The increase was primarily due to the results of increased staffing in the metro markets, including Seattle and Bellevue, Washington and standard salary increases.
Data processing decreased $388,000, or 5.0% to $7.3 million during the year ended December 31, 2016 from $7.7 million during the year ended December 31, 2015. The decrease was primarily a result of a $429,000 cancellation fee incurred during the year ended December 31, 2015 as a result of the early termination of a data processing contract.
Federal deposit insurance premium decreased $426,000, or 20.8% to $1.6 million during the year ended December 31, 2016 from $2.0 million during the year ended December 31, 2015. The decrease was primarily a result of the FDIC's new assessment rate schedule that became effective beginning in the third quarter of 2016 due to the levels achieved in the Deposit Insurance Fund reserve. Effective July 1, 2016, the range of initial base assessment rates for all insured institutions was reduced based on current reserve levels.
56
Other real estate owned, net decreased $673,000, or 66.8%, to $334,000 during the year ended December 31, 2016 compared to $1.0 million during the year ended December 31, 2015. The Bank had $754,000 other real estate owned at December 31, 2016 compared to $2.0 million at December 31, 2015. The decrease in other real estate owned, net was due to net gains on the sale of other real estate owned of $173,000 during the year ended December 31, 2016 compared to net losses on sale of other real estate owned of $97,000 during the year ended December 31, 2015 and a $146,000, or 27.6%, decrease in the valuation adjustment to $383,000 in fiscal year 2016 from $529,000 in fiscal year 2015.
Amortization of intangible assets decreased $685,000, or 32.6%, during the year ended December 31, 2016 as the useful life of core deposit intangibles for certain acquisitions was reached, resulting in either a decrease in amortization for fiscal year 2016 or no further amortization expense recorded during the year ended December 31, 2016.
Other expense decreased $828,000, or 8.0%, to $9.6 million for the year ended December 31, 2016 from $10.4 million for the same period in 2015. The decrease was primarily the result of a decrease in courier services as the Company discontinued its regular scheduled service during 2015. The Company also experienced decreases in other employee-related expenses such as travel expenses, office supplies, and other business expenses as a result of a concerted effort of the Company to reduce other discretionary expenses.
The ratio of noninterest expense to average assets was 2.84% for the year ended December 31, 2016, compared to 3.01% for the year ended December 31, 2015. The decrease was primarily a result of an increase in assets due to the Bank's organic growth in addition to a relatively constant noninterest expense year-over-year due to the above mentioned efforts by the Company to reduce noninterest expenses.
Income Tax Expense
Income tax expense remained constant at $13.8 million for both the years ended December 31, 2016 and 2015. The Company’s effective tax rate was 26.2% for the year ended December 31, 2016 compared to 26.9% for the same period in 2015. The decrease in the Company's effective tax rate during the year ended December 31, 2016 compared to the same period in 2015 is primarily due to an increase in tax exempt loans and investment securities as compared to the increase in pre-tax net income and an increase in bank-owned life insurance ("BOLI") income, offset partially by the effects of the resolution of certain Washington Banking tax liabilities during the year ended December 31, 2015. For additional information, see Note (20) Income Taxes of the Notes to Consolidated Financial Statements included in “Item 8. Financial Statements and Supplementary Data.”
Liquidity and Capital Resources
Our primary sources of funds are customer and local government deposits, loan principal and interest payments, loan sales, interest earned on and proceeds from sales and maturities of investment securities. These funds, together with retained earnings, equity and other borrowed funds, are used to make loans, acquire investment securities and other assets, and fund continuing operations. While maturities and scheduled amortization of loans are a predictable source of funds, deposit flows and loan prepayments are greatly influenced by the level of interest rates, economic conditions, and competition.
We must maintain an adequate level of liquidity to ensure the availability of sufficient funds to fund loan originations and deposit withdrawals, satisfy other financial commitments, and fund operations. We generally maintain sufficient cash and investments to meet short-term liquidity needs. At December 31, 2017, cash and cash equivalents totaled $103.0 million, or 2.5%, of total assets. Investment securities available for sale totaled $810.5 million at December 31, 2017, of which $267.2 million were pledged to secure public deposits, borrowing arrangements or repurchase agreements. Management considers unpledged investment securities available for sale to be a viable source of liquidity. The fair value of investment securities available for sale that were not pledged to secure public deposits, borrowing arrangements or repurchase agreements totaled $543.4 million, or 13.2%, of total assets at December 31, 2017. The fair value of investment securities available for sale with maturities of one year or less amounted to $9.0 million, or 0.22%, of total assets. At December 31, 2017, the Bank maintained credit facilities with the FHLB of Des Moines for $881.1 million, of which there were $92.5 million of borrowings outstanding as of December 31, 2017, and credit facilities with the Federal Reserve Bank of San Francisco for $82.5 million, of which there were no borrowings outstanding as of December 31, 2017. The Bank also maintains advance lines with Wells Fargo Bank, US Bank, The Independent Bankers Bank and Pacific Coast Bankers’ Bank to purchase federal funds totaling $90.0 million as of December 31, 2017. As of December 31, 2017, there were no overnight federal funds purchased.
57
Our strategy has been to acquire core deposits (which we define to include all deposits except public funds, brokered certificate of deposit accounts and other wholesale deposits) from our retail accounts, acquire noninterest bearing demand deposits from our commercial customers and use our available borrowing capacity to fund growth in assets. We anticipate that we will continue to rely on the same sources of funds in the future and use those funds primarily to make loans and purchase investment securities.
Contractual Obligations
The following table provides the amounts due under specified contractual obligations for the periods indicated as of December 31, 2017:
December 31, 2017 | ||||||||||||||||||||||||
One Year or Less | One to Three Years | Over Three to Five Years | Over Five Years | Other (1) | Total | |||||||||||||||||||
(In thousands) | ||||||||||||||||||||||||
Contractual payments by period: | ||||||||||||||||||||||||
Deposits | $ | 258,657 | $ | 103,808 | $ | 35,877 | $ | 56 | $ | 2,994,662 | $ | 3,393,060 | ||||||||||||
Junior subordinated debentures | — | — | — | 25,000 | — | 25,000 | ||||||||||||||||||
Operating leases | 3,074 | 5,066 | 2,569 | 2,241 | — | 12,950 | ||||||||||||||||||
Total contractual obligations | $ | 261,731 | $ | 108,874 | $ | 38,446 | $ | 27,297 | $ | 2,994,662 | $ | 3,431,010 | ||||||||||||
(1) Represents interest bearing and noninterest bearing checking, money market and checking accounts which can generally be withdrawn on demand and thereby have an undefined maturity.
Asset/Liability Management
Our primary financial objective is to achieve long-term profitability while controlling our exposure to fluctuations in market interest rates. To accomplish this objective, we have formulated an interest rate risk management policy that attempts to manage the mismatch between asset and liability maturities while maintaining an acceptable interest rate sensitivity position. The principal strategies which we employ to control our interest rate sensitivity are: originating certain commercial business loans and real estate construction and land development loans at variable interest rates repricing for terms generally one year or less; and offering noninterest bearing demand deposit accounts to businesses and individuals. The longer-term objective is to increase the proportion of noninterest bearing demand deposits, low-rate interest bearing demand deposits, money market accounts, and savings deposits relative to certificate of deposit accounts to reduce our overall cost of funds.
A number of measures are used to monitor and manage interest rate risk, including income simulations, interest sensitivity (gap) analysis and economic value of equity sensitivity. An income simulation model is the primary tool used to assess the direction and magnitude of changes in net interest income resulting from changes in interest rates. Key assumptions in the model include prepayment speeds on loans and investment securities, decay rates on non-maturity deposits, and pricing on investment securities, loans, deposits and borrowings. In order to measure the interest rate risk sensitivity as of December 31, 2017, this simulation model uses a “no growth” assumption and assumes an instantaneous and sustained uniform change in market interest rates at all maturities. These assumptions are inherently uncertain and, as a result, the net interest income projections should be viewed as an estimate of the net interest income sensitivity at the time of the analysis. Actual results will differ from simulated results due to timing, magnitude and frequency of interest rate changes and changes in market conditions and management strategies, among other factors.
Based on the results of the simulation model as of December 31, 2017, we would expect increases in net interest income of $6.4 million and $12.1 million in year one and year two, respectively, if interest rates increased from current rates by 100 basis points. We would expect an increase in net interest income of $12.6 million and $23.9 million in year one and year two, respectively, if interest rates increased from current rates by 200 basis points.
Our asset and liability management strategies have resulted in a negative less than 3 month “gap” of 38.8% as of December 31, 2017. This “gap” measures the difference between the dollar amount of our interest earning assets and interest bearing liabilities that mature or reprice within the designated period (three months or less) as a percentage
58
of total interest earning assets, based on certain estimates and assumptions as discussed below. We believe that the implementation of our operating strategies has reduced the potential effects of changes in market interest rates on our results of operations. The negative gap for the less than three month period indicates that decreases in market interest rates may favorably affect our results over that period.
The following table provides the estimated maturity or repricing and the resulting interest rate sensitivity gap of our interest earning assets and interest bearing liabilities at December 31, 2017. We used certain assumptions in presenting this data so the amounts may not be consistent with other financial information prepared in accordance with generally accepted accounting principles. The amounts in the tables also could be significantly affected by external factors, such as changes in prepayment assumptions, early withdrawal of deposits and competition.
December 31, 2017 | ||||||||||||||||||||||||
Estimated Maturity or Repricing Within | ||||||||||||||||||||||||
Three Months or Less | Over Three Months to 12 Months | Over One to Five Years | Over Five to 15 Years | Over 15 Years | Total | |||||||||||||||||||
(Dollars in thousands) | ||||||||||||||||||||||||
Interest Earnings Assets: | ||||||||||||||||||||||||
Loans Receivable (1) | $ | 698,768 | $ | 217,713 | $ | 1,308,690 | $ | 554,376 | $ | 66,165 | $ | 2,845,712 | ||||||||||||
Investment securities (2) | 111,331 | 34,100 | 188,242 | 303,472 | 173,385 | 810,530 | ||||||||||||||||||
FHLB stock | 8,347 | — | — | — | — | 8,347 | ||||||||||||||||||
Interest earning deposits | 24,722 | — | — | — | — | 24,722 | ||||||||||||||||||
Total interest earning assets | $ | 843,168 | $ | 251,813 | $ | 1,496,932 | $ | 857,848 | $ | 239,550 | $ | 3,689,311 | ||||||||||||
Percentage of interest earning assets | 22.9 | % | 6.8 | % | 40.6 | % | 23.2 | % | 6.5 | % | 100.0 | % | ||||||||||||
Interest Bearing Liabilities: | ||||||||||||||||||||||||
Total interest bearing deposits (3) | $ | 2,129,183 | $ | 180,045 | $ | 138,985 | $ | 56 | $ | — | $ | 2,448,269 | ||||||||||||
Federal Home Loan Bank advances | 92,500 | — | — | — | — | 92,500 | ||||||||||||||||||
Junior subordinated debentures | 20,009 | — | — | — | — | 20,009 | ||||||||||||||||||
Securities sold under agreement to repurchase | 31,821 | — | — | — | — | 31,821 | ||||||||||||||||||
Total interest bearing liabilities | $ | 2,273,513 | $ | 180,045 | $ | 138,985 | $ | 56 | $ | — | $ | 2,592,599 | ||||||||||||
Interest bearing liabilities, as a percentage of total interest earning assets | 61.6 | % | 4.9 | % | 3.8 | % | — | % | — | % | 70.3 | % | ||||||||||||
Interest rate sensitivity gap | $ | (1,430,345 | ) | $ | 71,768 | $ | 1,357,947 | $ | 857,792 | $ | 239,550 | $ | 1,096,712 | |||||||||||
Interest rate sensitivity gap, as a percentage of total interest earning assets | (38.8 | )% | 1.9 | % | 36.8 | % | 23.3 | % | 6.5 | % | 29.7 | % | ||||||||||||
Cumulative interest rate sensitivity gap | $ | (1,430,345 | ) | $ | (1,358,577 | ) | $ | (630 | ) | $ | 857,162 | $ | 1,096,712 | |||||||||||
Cumulative interest rate sensitivity gap, as a percentage of total interest earning assets | (38.8 | )% | (36.8 | )% | — | % | 23.2 | % | 29.7 | % | ||||||||||||||
(1) Excludes net deferred loan costs and allowance for loan losses.
(2) Interest earning investment securities with no stated maturity date are included in less than three months as prices may adjust immediately.
(3) Adjustable-rate liabilities are included in the period in which interest rates are next scheduled to adjust rather than in the period they are due to mature. Although regular savings, demand, NOW, and money market deposit accounts are
59
subject to immediate withdrawal, based on historical experience management considers a substantial amount of such accounts to be core deposits having significantly longer maturities.
Certain shortcomings are inherent in the method of analysis presented in the foregoing table. For example, although certain assets and liabilities may have similar maturities or periods to repricing, they may react in different degrees to changes in market interest rates. Also, the interest rates on some types of assets and liabilities may fluctuate in advance of changes in market interest rates, while interest rates on other types may lag behind changes in market interest rates. Additionally, some assets, such as adjustable rate mortgages, have features, which restrict changes in the interest rates of those assets both on a short-term basis and over the lives of such assets. Further, if a change in market interest rates occurs, prepayment and early withdrawal levels could deviate significantly from those assumed in calculating the tables. Finally, the ability of many borrowers to service their adjustable rate debt may decrease if market interest rates increase substantially.
The table below provides information about our financial instruments that are sensitive to changes in interest rates as of December 31, 2017. The table presents principal cash flows and related weighted average interest rates by expected maturity dates. The expected maturity is the contractual maturity or earlier call date of the instrument. The data in this table may not be consistent with the amounts in the preceding table, which represents amounts by the estimated repricing date or maturity date, whichever occurs sooner.
By Expected Maturity Date | ||||||||||||||||||||||||||||
Year Ended December 31, 2017 | ||||||||||||||||||||||||||||
Three Months or Less | Over Three Months to 12 Months | Over One Year to Five Years | Over Five Years to 15 Years | Over 15 Years | Total | Fair Value | ||||||||||||||||||||||
(Dollars in thousands) | ||||||||||||||||||||||||||||
Investment Securities(1) | ||||||||||||||||||||||||||||
Amounts maturing: | ||||||||||||||||||||||||||||
Fixed rate | $ | 21,530 | $ | 7,982 | $ | 170,389 | $ | 297,543 | $ | 173,385 | $ | 670,829 | ||||||||||||||||
Weighted average interest rate | 3.64 | % | 3.75 | % | 2.86 | % | 2.98 | % | 2.44 | % | 2.84 | % | ||||||||||||||||
Adjustable rate | $ | 4,212 | $ | — | $ | 10,694 | $ | 34,748 | $ | 89,901 | $ | 139,555 | ||||||||||||||||
Weighted average interest rate | 2.96 | % | — | % | 2.55 | % | 2.27 | % | 2.33 | % | 2.35 | % | ||||||||||||||||
Total | $ | 25,742 | $ | 7,982 | $ | 181,083 | $ | 332,291 | $ | 263,286 | $ | 810,384 | $ | 810,384 | ||||||||||||||
Loans (2) | ||||||||||||||||||||||||||||
Amounts maturing: | ||||||||||||||||||||||||||||
Fixed rate | $ | 41,599 | $ | 67,945 | $ | 394,561 | $ | 434,562 | $ | 66,165 | $ | 1,004,832 | ||||||||||||||||
Weighted average interest rate | 4.42 | % | 4.56 | % | 4.37 | % | 4.00 | % | 4.50 | % | 4.23 | % | ||||||||||||||||
Adjustable rate | $ | 116,945 | $ | 196,078 | $ | 171,364 | $ | 1,239,161 | $ | 117,332 | $ | 1,840,880 | ||||||||||||||||
Weighted average interest rate | 5.51 | % | 5.13 | % | 5.07 | % | 4.36 | % | 4.35 | % | 4.58 | % | ||||||||||||||||
Total | $ | 158,544 | $ | 264,023 | $ | 565,925 | $ | 1,673,723 | $ | 183,497 | $ | 2,845,712 | $ | 2,810,401 | ||||||||||||||
Certificate of Deposit Accounts | ||||||||||||||||||||||||||||
Amounts maturing: | ||||||||||||||||||||||||||||
Fixed rate | $ | 76,389 | $ | 182,267 | $ | 139,686 | $ | 56 | $ | — | $ | 398,398 | $ | 397,039 | ||||||||||||||
Weighted average interest rate | 0.44 | % | 0.63 | % | 1.04 | % | 0.45 | % | — | % | 0.74 | % | ||||||||||||||||
Junior Subordinated Debentures | ||||||||||||||||||||||||||||
Amounts maturing: | ||||||||||||||||||||||||||||
Adjustable rate | $ | — | $ | — | $ | — | $ | — | $ | 20,009 | $ | 20,009 | $ | 18,500 | ||||||||||||||
Weighted average interest rate (3) | — | % | — | % | — | % | — | % | 5.11 | % | 5.11 | % | ||||||||||||||||
(1) Balances represent carrying value, and excludes investment securities with no stated maturity.
(2) Excludes deferred loan costs (fees), net and allowance for loan losses.
60
(3) The contractual interest rate of the junior subordinated debentures was 3.25% at December 31, 2017. The weighted average interest rate includes the effects of the discount accretion for the Washington Banking Merger purchase accounting adjustment.
Impact of Inflation and Changing Prices
Inflation affects our operations by increasing operating costs and indirectly by affecting the operations and cash flow of our customers. Unlike most industrial companies, virtually all the assets and liabilities of a financial institution are monetary in nature. As a result, changes in interest rates generally have a more significant impact on a financial institution’s performance than the effects of general levels of inflation. Although interest rates do not necessarily move in the same direction or the same extent as the prices of goods and services, increases in inflation generally have resulted in increased interest rates.
ITEM 7A. QUANTITATIVE AND QUALITATIVE DISCLOSURES ABOUT MARKET RISK
We are exposed to interest rate risk through our lending and deposit gathering activities. For a discussion of how this exposure is managed and the nature of changes in our interest rate risk profile during the past year, see “Item 7. Management’s Discussion and Analysis of Financial Condition and Results of Operations—Asset/Liability Management.”
Neither we, nor the Bank, maintain a trading account for any class of financial instrument, nor do we, or the Bank, engage in hedging activities or purchase high risk derivative instruments. Moreover, neither we, nor the Bank, are subject to foreign currency exchange rate risk or commodity price risk.
ITEM 8. FINANCIAL STATEMENTS AND SUPPLEMENTARY DATA
Report of Independent Registered Public Accounting Firm
Stockholders and the Board of Directors of Heritage Financial Corporation
Olympia, Washington
Opinions on the Financial Statements and Internal Control over Financial Reporting
We have audited the accompanying consolidated statements of financial condition of Heritage Financial Corporation and subsidiaries (the "Company") as of December 31, 2017 and 2016, the related consolidated statements of income, comprehensive income, stockholders’ equity, and cash flows for each of the years in the three-year period ended December 31, 2017, and the related notes (collectively referred to as the "financial statements"). We also have audited the Company’s internal control over financial reporting as of December 31, 2017, based on criteria established in the 2013 Internal Control - Integrated Framework issued by the Committee of Sponsoring Organizations of the Treadway Commission (COSO).
In our opinion, the financial statements referred to above present fairly, in all material respects, the financial position of the Company as of December 31, 2017 and 2016, and the results of its operations and its cash flows for each of the years in the three-year period ended December 31, 2017 in conformity with accounting principles generally accepted in the United States of America. Also in our opinion, the Company maintained, in all material respects, effective internal control over financial reporting as of December 31, 2017, based on criteria established in the 2013 Internal Control - Integrated Framework issued by COSO.
Basis for Opinions
The Company’s management is responsible for these financial statements, for maintaining effective internal control over financial reporting, and for its assessment of the effectiveness of internal control over financial reporting, included in the accompanying Management’s Report on Internal Control over Financial Reporting. Our responsibility is to express an opinion on the Company’s financial statements and an opinion on the Company’s internal control over financial reporting based on our audits. We are a public accounting firm registered with the Public Company Accounting Oversight Board (United States) ("PCAOB") and are required to be independent with respect to the Company in accordance with the U.S. federal securities laws and the applicable rules and regulations of the Securities and Exchange Commission and the PCAOB.
61
We conducted our audits in accordance with the standards of the PCAOB. Those standards require that we plan and perform the audits to obtain reasonable assurance about whether the financial statements are free of material misstatement, whether due to error or fraud, and whether effective internal control over financial reporting was maintained in all material respects.
Our audits of the financial statements included performing procedures to assess the risks of material misstatement of the financial statements, whether due to error or fraud, and performing procedures that respond to those risks. Such procedures included examining, on a test basis, evidence regarding the amounts and disclosures in the financial statements. Our audits also included evaluating the accounting principles used and significant estimates made by management, as well as evaluating the overall presentation of the financial statements. Our audit of internal control over financial reporting included obtaining an understanding of internal control over financial reporting, assessing the risk that a material weakness exists, and testing and evaluating the design and operating effectiveness of internal control based on the assessed risk. Our audits also included performing such other procedures as we considered necessary in the circumstances. We believe that our audits provide a reasonable basis for our opinions.
Definition and Limitations of Internal Control Over Financial Reporting
A company’s internal control over financial reporting is a process designed to provide reasonable assurance regarding the reliability of financial reporting and the preparation of financial statements for external purposes in accordance with generally accepted accounting principles. A company’s internal control over financial reporting includes those policies and procedures that (1) pertain to the maintenance of records that, in reasonable detail, accurately and fairly reflect the transactions and dispositions of the assets of the company; (2) provide reasonable assurance that transactions are recorded as necessary to permit preparation of financial statements in accordance with generally accepted accounting principles, and that receipts and expenditures of the company are being made only in accordance with authorizations of management and directors of the company; and (3) provide reasonable assurance regarding prevention or timely detection of unauthorized acquisition, use, or disposition of the company’s assets that could have a material effect on the financial statements.
Because of its inherent limitations, internal control over financial reporting may not prevent or detect misstatements. Also, projections of any evaluation of effectiveness to future periods are subject to the risk that controls may become inadequate because of changes in conditions, or that the degree of compliance with the policies or procedures may deteriorate.
/s/ Crowe Horwath LLP
Sacramento, California
February 28, 2018
We have served as the Company's auditor since 2012.
62
HERITAGE FINANCIAL CORPORATION AND SUBSIDIARIES
CONSOLIDATED STATEMENTS OF FINANCIAL CONDITION
(in thousands, except shares)
December 31, 2017 | December 31, 2016 | ||||||
ASSETS | |||||||
Cash on hand and in banks | $ | 78,293 | $ | 77,117 | |||
Interest earning deposits | 24,722 | 26,628 | |||||
Cash and cash equivalents | 103,015 | 103,745 | |||||
Investment securities available for sale, at fair value | 810,530 | 794,645 | |||||
Loans held for sale | 2,288 | 11,662 | |||||
Loans receivable, net | 2,849,071 | 2,640,749 | |||||
Allowance for loan losses | (32,086 | ) | (31,083 | ) | |||
Total loans receivable, net | 2,816,985 | 2,609,666 | |||||
Other real estate owned | — | 754 | |||||
Premises and equipment, net | 60,325 | 63,911 | |||||
Federal Home Loan Bank stock, at cost | 8,347 | 7,564 | |||||
Bank owned life insurance | 75,091 | 70,355 | |||||
Accrued interest receivable | 12,244 | 10,925 | |||||
Prepaid expenses and other assets | 99,328 | 79,351 | |||||
Other intangible assets, net | 6,088 | 7,374 | |||||
Goodwill | 119,029 | 119,029 | |||||
Total assets | $ | 4,113,270 | $ | 3,878,981 | |||
LIABILITIES AND STOCKHOLDERS' EQUITY | |||||||
Deposits | $ | 3,393,060 | $ | 3,229,648 | |||
Federal Home Loan Bank advances | 92,500 | 79,600 | |||||
Junior subordinated debentures | 20,009 | 19,717 | |||||
Securities sold under agreement to repurchase | 31,821 | 22,104 | |||||
Accrued expenses and other liabilities | 67,575 | 46,149 | |||||
Total liabilities | 3,604,965 | 3,397,218 | |||||
Stockholders’ equity: | |||||||
Preferred stock, no par value, 2,500,000 shares authorized; no shares issued and outstanding at December 31, 2017 and 2016 | — | — | |||||
Common stock, no par value, 50,000,000 shares authorized; 29,927,746 and 29,954,931 shares issued and outstanding at December 31, 2017 and 2016, respectively | 360,590 | 359,060 | |||||
Retained earnings | 149,013 | 125,309 | |||||
Accumulated other comprehensive loss, net | (1,298 | ) | (2,606 | ) | |||
Total stockholders’ equity | 508,305 | 481,763 | |||||
Total liabilities and stockholders’ equity | $ | 4,113,270 | $ | 3,878,981 | |||
See accompanying Notes to Consolidated Financial Statements.
63
HERITAGE FINANCIAL CORPORATION AND SUBSIDIARIES
CONSOLIDATED STATEMENTS OF INCOME
(in thousands, except per share amounts)
Year Ended December 31, | |||||||||||
2017 | 2016 | 2015 | |||||||||
INTEREST INCOME: | |||||||||||
Interest and fees on loans | $ | 129,213 | $ | 122,147 | $ | 121,687 | |||||
Taxable interest on investment securities | 12,688 | 11,215 | 9,578 | ||||||||
Nontaxable interest on investment securities | 5,269 | 4,870 | 4,196 | ||||||||
Interest and dividends on other interest earning assets | 710 | 280 | 278 | ||||||||
Total interest income | 147,880 | 138,512 | 135,739 | ||||||||
INTEREST EXPENSE: | |||||||||||
Deposits | 6,049 | 5,010 | 5,229 | ||||||||
Junior subordinated debentures | 1,014 | 880 | 827 | ||||||||
Other borrowings | 1,283 | 116 | 64 | ||||||||
Total interest expense | 8,346 | 6,006 | 6,120 | ||||||||
Net interest income | 139,534 | 132,506 | 129,619 | ||||||||
Provision for loan losses | 4,220 | 4,931 | 4,372 | ||||||||
Net interest income after provision for loan losses | 135,314 | 127,575 | 125,247 | ||||||||
NONINTEREST INCOME: | |||||||||||
Service charges and other fees | 18,004 | 14,354 | 14,179 | ||||||||
Gain on sale of investment securities, net | 6 | 1,315 | 1,516 | ||||||||
Gain on sale of loans, net | 7,696 | 6,994 | 4,683 | ||||||||
Gain on termination of FDIC shared-loss agreements | — | — | 1,747 | ||||||||
Gain on sale of Merchant Visa portfolio | — | — | 2,198 | ||||||||
Interest rate swap fees | 1,045 | 1,854 | 452 | ||||||||
Other income | 8,657 | 7,102 | 7,493 | ||||||||
Total noninterest income | 35,408 | 31,619 | 32,268 | ||||||||
NONINTEREST EXPENSE: | |||||||||||
Compensation and employee benefits | 64,268 | 61,405 | 58,134 | ||||||||
Occupancy and equipment | 15,396 | 15,763 | 15,846 | ||||||||
Data processing | 8,176 | 7,312 | 7,700 | ||||||||
Marketing | 2,943 | 2,835 | 3,066 | ||||||||
Professional services | 4,777 | 3,606 | 3,536 | ||||||||
State and local taxes | 2,461 | 2,616 | 2,378 | ||||||||
Federal deposit insurance premium | 1,435 | 1,620 | 2,046 | ||||||||
Other real estate owned, net | (70 | ) | 334 | 1,007 | |||||||
Amortization of intangible assets | 1,286 | 1,415 | 2,100 | ||||||||
Other expense | 9,903 | 9,567 | 10,395 | ||||||||
Total noninterest expense | 110,575 | 106,473 | 106,208 | ||||||||
Income before income taxes | 60,147 | 52,721 | 51,307 | ||||||||
Income tax expense | 18,356 | 13,803 | 13,818 | ||||||||
Net income | $ | 41,791 | $ | 38,918 | $ | 37,489 | |||||
Basic earnings per common share | $ | 1.39 | $ | 1.30 | $ | 1.25 | |||||
Diluted earnings per common share | $ | 1.39 | $ | 1.30 | $ | 1.25 | |||||
Dividends declared per common share | $ | 0.61 | $ | 0.72 | $ | 0.53 | |||||
See accompanying Notes to Consolidated Financial Statements.
64
HERITAGE FINANCIAL CORPORATION AND SUBSIDIARIES
CONSOLIDATED STATEMENTS OF COMPREHENSIVE INCOME
(In thousands)
Year Ended December 31, | |||||||||||
2017 | 2016 | 2015 | |||||||||
Net income | $ | 41,791 | $ | 38,918 | $ | 37,489 | |||||
Change in fair value of investment securities available for sale, net of tax of $826, $(2,316) and $(306), respectively | 1,530 | (4,311 | ) | (559 | ) | ||||||
Reclassification adjustment of net gain from sale of investment securities available for sale included in income, net of tax of $(2), $(461) and $(574), respectively | (4 | ) | (854 | ) | (1,067 | ) | |||||
Accretion of other-than-temporary impairment on investment securities, net of tax of $0, $0 and $4, respectively | — | — | 108 | ||||||||
Reclassification of remaining unaccreted other-than-temporary impairment upon sale of investment securities held to maturity included in income, net of tax of $0, $0 and $44, respectively | — | — | 81 | ||||||||
Transfer of investment securities from held to maturity to available for sale, net of tax of $0, $0 and $334, respectively | — | — | 618 | ||||||||
Other comprehensive income (loss) | 1,526 | (5,165 | ) | (819 | ) | ||||||
Comprehensive income | $ | 43,317 | $ | 33,753 | $ | 36,670 | |||||
See accompanying Notes to Consolidated Financial Statements.
65
HERITAGE FINANCIAL CORPORATION AND SUBSIDIARIES
CONSOLIDATED STATEMENTS OF STOCKHOLDERS' EQUITY
(in thousands, except per share amounts)
Number of common shares | Common stock | Retained earnings | Accumulated other comprehensive income (loss), net | Total stock- holders’ equity | ||||||||||||||
Balance at December 31, 2014 | 30,260 | $ | 364,741 | $ | 86,387 | $ | 3,378 | $ | 454,506 | |||||||||
Restricted and unrestricted stock awards granted, net of forfeitures | 118 | — | — | — | — | |||||||||||||
Exercise of stock options (including excess tax benefits from nonqualified stock options) | 61 | 765 | — | — | 765 | |||||||||||||
Restricted stock compensation expense | — | 1,555 | — | — | 1,555 | |||||||||||||
Net excess tax benefits from vesting of restricted stock | — | 126 | — | — | 126 | |||||||||||||
Common stock repurchased | (464 | ) | (7,736 | ) | — | — | (7,736 | ) | ||||||||||
Net income | — | — | 37,489 | — | 37,489 | |||||||||||||
Other comprehensive loss, net of tax | — | — | — | (819 | ) | (819 | ) | |||||||||||
Cash dividends declared on common stock ($0.53 per share) | — | — | (15,916 | ) | — | (15,916 | ) | |||||||||||
Balance at December 31, 2015 | 29,975 | 359,451 | 107,960 | 2,559 | 469,970 | |||||||||||||
Restricted stock awards granted, net of forfeitures | 110 | — | — | — | — | |||||||||||||
Exercise of stock options (including excess tax benefits from nonqualified stock options) | 38 | 560 | — | — | 560 | |||||||||||||
Stock-based compensation expense | — | 1,840 | — | — | 1,840 | |||||||||||||
Net excess tax benefits from vesting of restricted stock | — | 103 | — | — | 103 | |||||||||||||
Common stock repurchased | (168 | ) | (2,894 | ) | — | — | (2,894 | ) | ||||||||||
Net income | — | — | 38,918 | — | 38,918 | |||||||||||||
Other comprehensive loss, net of tax | — | — | — | (5,165 | ) | (5,165 | ) | |||||||||||
Cash dividends declared on common stock ($0.72 per share) | — | — | (21,569 | ) | — | (21,569 | ) | |||||||||||
Balance at December 31, 2016 | 29,955 | 359,060 | 125,309 | (2,606 | ) | 481,763 | ||||||||||||
Restricted stock awards forfeited | (10 | ) | — | — | — | — | ||||||||||||
Exercise of stock options | 13 | 164 | — | — | 164 | |||||||||||||
Stock-based compensation expense | — | 2,103 | — | — | 2,103 | |||||||||||||
Common stock repurchased | (30 | ) | (737 | ) | — | — | (737 | ) | ||||||||||
Net income | — | — | 41,791 | — | 41,791 | |||||||||||||
Other comprehensive income, net of tax | — | — | — | 1,526 | 1,526 | |||||||||||||
Cash dividends declared on common stock ($0.61 per share) | — | — | (18,305 | ) | — | (18,305 | ) | |||||||||||
ASU 2018-02 Implementation | — | — | 218 | (218 | ) | — | ||||||||||||
Balance at December 31, 2017 | 29,928 | $ | 360,590 | $ | 149,013 | $ | (1,298 | ) | $ | 508,305 | ||||||||
See accompanying Notes to Consolidated Financial Statements.
66
HERITAGE FINANCIAL CORPORATION AND SUBSIDIARIES
CONSOLIDATED STATEMENTS OF CASH FLOWS
(in thousands)
Year Ended December 31, | |||||||||||
2017 | 2016 | 2015 | |||||||||
Cash flows from operating activities: | |||||||||||
Net income | $ | 41,791 | $ | 38,918 | $ | 37,489 | |||||
Adjustments to reconcile net income to net cash provided by operating activities: | |||||||||||
Depreciation and amortization | 10,704 | 12,709 | 13,967 | ||||||||
Changes in net deferred loan costs, net of amortization | (1,007 | ) | (1,422 | ) | (1,866 | ) | |||||
Provision for loan losses | 4,220 | 4,931 | 4,372 | ||||||||
Net change in accrued interest receivable, FDIC indemnification asset, prepaid expenses and other assets, and accrued expenses and other liabilities | 11,634 | 2,147 | (78 | ) | |||||||
Stock-based compensation expense | 2,103 | 1,840 | 1,555 | ||||||||
Net excess tax benefit from exercise of stock-based compensation | — | (123 | ) | (140 | ) | ||||||
Amortization of intangible assets | 1,286 | 1,415 | 2,100 | ||||||||
Origination of loans held for sale | (108,696 | ) | (145,107 | ) | (132,932 | ) | |||||
Proceeds from sale of loans | 121,482 | 148,121 | 135,515 | ||||||||
Earnings on bank owned life insurance | (1,424 | ) | (1,460 | ) | (1,354 | ) | |||||
Valuation adjustment on other real estate owned | — | 383 | 529 | ||||||||
Gain on sale of loans, net | (7,696 | ) | (6,994 | ) | (4,683 | ) | |||||
Gain on sale of investment securities, net | (6 | ) | (1,315 | ) | (1,516 | ) | |||||
Gain on sale of assets held for sale | (747 | ) | — | — | |||||||
(Gain) loss on sale of other real estate owned, net | (144 | ) | (173 | ) | 97 | ||||||
Gain on termination of FDIC shared-loss agreements | — | — | (1,747 | ) | |||||||
Loss on sale or write-off of furniture, equipment and leasehold improvements | 13 | 110 | 89 | ||||||||
Net cash provided by operating activities | 73,513 | 53,980 | 51,397 | ||||||||
Cash flows from investing activities: | |||||||||||
Loans originated, net of principal payments | (235,154 | ) | (263,387 | ) | (184,862 | ) | |||||
Maturities of other interest earning deposits | — | 6,709 | 3,346 | ||||||||
Maturities, calls and payments of investment securities available for sale | 98,894 | 129,408 | 124,592 | ||||||||
Maturities, calls and payments of investment securities held to maturity | — | — | 5,221 | ||||||||
Purchase of investment securities available for sale | (149,914 | ) | (267,657 | ) | (290,499 | ) | |||||
Purchase of premises and equipment | (3,063 | ) | (6,722 | ) | (1,821 | ) | |||||
Purchase of other real estate owned | — | — | (188 | ) | |||||||
Proceeds from sales of other loans | 28,874 | 21,077 | 30,751 | ||||||||
Proceeds from sales of other real estate owned | 930 | 2,486 | 3,555 | ||||||||
Proceeds from sales of investment securities available for sale | 31,028 | 140,373 | 116,332 | ||||||||
Proceeds from sales of investment securities held to maturity | — | — | 972 | ||||||||
Proceeds from sales of assets held for sale | 1,849 | — | — | ||||||||
Proceeds from redemption of FHLB stock | 30,018 | 23,732 | 8,040 | ||||||||
Purchases of FHLB stock | (30,801 | ) | (27,148 | ) | — | ||||||
Proceeds from sales of premises and equipment | — | 659 | 815 | ||||||||
Purchase of bank owned life insurance | (4,394 | ) | (8,000 | ) | (25,019 | ) | |||||
Proceeds from BOLI death benefit | 1,101 | — | — | ||||||||
Capital contributions to low-income housing tax credit partnerships and new market tax credit partnerships, net | (10,762 | ) | (4,456 | ) | (746 | ) | |||||
Net cash used for termination of FDIC shared-loss agreements | — | — | (7,110 | ) | |||||||
Net cash used in investing activities | (241,394 | ) | (252,926 | ) | (216,621 | ) | |||||
67
Year Ended December 31, | |||||||||||
2017 | 2016 | 2015 | |||||||||
Cash flows from financing activities: | |||||||||||
Net increase in deposits | 163,412 | 121,361 | 201,956 | ||||||||
FHLB advances | 763,350 | 660,900 | — | ||||||||
Repayments of FHLB advances | (750,450 | ) | (581,300 | ) | — | ||||||
Common stock cash dividends paid | (18,305 | ) | (21,569 | ) | (15,916 | ) | |||||
Net increase (decrease) in securities sold under agreement to repurchase | 9,717 | (1,110 | ) | (8,967 | ) | ||||||
Proceeds from exercise of stock options | 164 | 540 | 751 | ||||||||
Net excess tax benefit from exercise of stock-based compensation | — | 123 | 140 | ||||||||
Repurchase of common stock | (737 | ) | (2,894 | ) | (7,736 | ) | |||||
Net cash provided by financing activities | 167,151 | 176,051 | 170,228 | ||||||||
Net (decrease) increase in cash and cash equivalents | (730 | ) | (22,895 | ) | 5,004 | ||||||
Cash and cash equivalents at beginning of year | 103,745 | 126,640 | 121,636 | ||||||||
Cash and cash equivalents at end of year | $ | 103,015 | $ | 103,745 | $ | 126,640 | |||||
Supplemental disclosures of cash flow information: | |||||||||||
Cash paid for interest | $ | 8,399 | $ | 5,998 | $ | 6,324 | |||||
Cash paid for income taxes | 2,045 | 11,500 | 15,286 | ||||||||
Supplemental non-cash disclosures of cash flow information: | |||||||||||
Transfers of loans receivable to other real estate owned | $ | 32 | $ | 1,431 | $ | 2,657 | |||||
Transfers of premises and equipment, net to prepaid expenses and other assets for properties held for sale | 2,687 | — | — | ||||||||
Investment in low income housing tax credit partnership and related funding commitment | 33,171 | 19,663 | — | ||||||||
Settlement of investment securities available for sale not settled at year end | — | — | (1,288 | ) | |||||||
Transfer from investment securities held to maturity to available for sale | — | — | 29,370 | ||||||||
Receivable due from bank owned life insurance contract | — | — | 445 | ||||||||
See accompanying Notes to Consolidated Financial Statements.
68
HERITAGE FINANCIAL CORPORATION AND SUBSIDIARIES
NOTES TO CONSOLIDATED FINANCIAL STATEMENTS
For the Years Ended December 31, 2017, 2016 and 2015
(1) | Description of Business, Basis of Presentation, Significant Accounting Policies and Recently Issued Accounting Pronouncements |
(a) Description of Business
Heritage Financial Corporation ("Heritage" or the “Company”) is a bank holding company that was incorporated in the State of Washington in August 1997. The Company is primarily engaged in the business of planning, directing and coordinating the business activities of its wholly-owned subsidiary, Heritage Bank (the “Bank”). The Bank is a Washington-chartered commercial bank and its deposits are insured by the FDIC. The Bank is headquartered in Olympia, Washington and conducts business from its 60 branch offices located throughout Washington State and the greater Portland, Oregon area, including one branch acquired in the Puget Sound Merger in January 2018. The Bank’s business consists primarily of commercial lending and deposit relationships with small businesses and their owners in its market areas and attracting deposits from the general public. The Bank also makes real estate construction and land development loans, consumer loans and originates first mortgage loans on residential properties primarily located in its market areas.
On January 16, 2018, the Company completed the acquisition of Puget Sound Bancorp, Inc. (“Puget Sound”), the holding company for Puget Sound Bank, both of Bellevue, Washington (“Puget Sound Merger”). As of December 31, 2017, Puget Sound had $556.0 million in total assets, $388.3 million in total loans and $491.9 million in total deposits. Costs incurred by Heritage for the Puget Sound Merger totaled $810,000 during the year ended December 31, 2017. See Note (24) Subsequent Events for additional information.
(b) Basis of Presentation
The accounting and reporting policies of the Company and its subsidiaries conform to U.S. Generally Accepted Accounting Principles (“GAAP”). In preparing the Consolidated Financial Statements, management makes estimates and assumptions that affect the reported amounts of assets and liabilities and disclosure of contingent assets and liabilities at the date of the financial statements and the reported amounts of income and expenses during the reporting periods. Actual results could differ from these estimates.
The accompanying Consolidated Financial Statements include the accounts of the Company and its wholly owned subsidiary, the Bank. All significant intercompany balances and transactions among the Company and the Bank have been eliminated in consolidation.
Certain prior year amounts have been reclassified to conform to the current year’s presentation. Reclassifications had no effect on the prior years' net income or stockholders’ equity.
(c) Significant Accounting Policies
Cash and Cash Equivalents
For purposes of reporting cash flows, cash and cash equivalents includes cash on hand and in banks, interest earning deposits with original maturities of 90 days or less, and federal funds sold. Net cash flows are reported for customer loan and deposit transactions, other interest bearing deposits, federal funds sold and repurchase agreements.
Investment Securities
The Company identifies investments as held to maturity or available for sale at the time of acquisition. Securities are classified as held to maturity when the Company has the ability and positive intent to hold them to maturity. Securities classified as available for sale are available for future liquidity requirements and may be sold prior to maturity. As of December 31, 2017 and December 31, 2016 the Bank does not hold any securities classified as held to maturity. See Note (2) Investment Securities for additional information.
Securities available for sale are carried at fair value. Interest income includes amortization of purchase premiums or accretion of purchase discounts using the interest method. Unrealized gains and losses on securities available for sale are generally excluded from earnings and are reported in other comprehensive income (loss), net of related income taxes. Realized gains and losses on sale of investment securities are computed on the specific identification method. Transfers of securities between the available for sale and held to maturity categories are accounted for at fair value.
Management evaluates securities for other-than-temporary impairment on at least a quarterly basis, and more frequently when economic or market conditions warrant such an evaluation. Although these evaluations involve
69
significant judgment, an unrealized loss in the fair value of a debt security is generally deemed to be temporary when the fair value of the security is below the carrying value primarily due to changes in interest rates, there has not been significant deterioration in the financial condition of the issuer, and it is not more likely than not that the Company will be required to, nor does it have the intent to sell the security before the anticipated recovery of its remaining carrying value. If any of these criteria is not met, the impairment is split into two components as follows: 1) other-than-temporary impairment related to credit loss, which must be recognized in the income statement and 2) other-than-temporary impairment related to other factors, which is recognized in other comprehensive income (loss). The credit loss is defined as the difference between the present value of the cash flows expected to be collected and the amortized cost basis. For debt securities with other-than-temporary impairment, the previous amortized cost basis less the other-than-temporary impairment recognized in earnings shall be the new amortized cost basis of the security. In subsequent periods, the Company accretes into interest income the difference between the new amortized cost basis and cash flows expected to be collected prospectively over the life of the debt security. Continued deterioration of market conditions could result in additional impairment losses recognized within the investment portfolio.
Other factors that may be considered in determining whether a decline in the value of either a debt or an equity security is “other-than-temporary” include ratings by recognized rating agencies; actions of commercial banks or other lenders relative to the continued extension of credit facilities to the issuer of the security; the financial condition, capital strength and near-term prospects of the issuer and recommendations of investment advisors or market analysts.
Loans Held for Sale
Mortgage loans held for sale are carried at the lower of amortized cost or fair value. Any loan that management does not have the intent and ability to hold for the foreseeable future or until maturity or payoff is classified as held for sale at the time of origination, purchase or securitization, or when such decision is made. Unrealized losses on such loans are recorded as a valuation allowance and included in income.
Loans Receivable and Loan Commitments
Loans receivable include loans originated by the Bank as well as loans acquired in business combinations. Loans acquired in a business combination are designated as “purchased” loans. These loans are recorded at their fair value at acquisition date, factoring in credit losses expected to be incurred over the life of the loan. Accordingly, an allowance for loan losses is not carried over or recorded as of the acquisition date.
Loans purchased with evidence of credit deterioration since origination for which it is probable that all contractually required payments will not be collected are accounted for under FASB ASC 310-30, Loans and Debt Securities Acquired with Deteriorated Credit Quality. These loans are identified as purchased credit impaired ("PCI") loans. In situations where such loans have similar risk characteristics, loans may be aggregated into pools to estimate cash flows. A pool is accounted for as a single asset with a single interest rate, cumulative loss rate and cash flow expectation. Expected cash flows at the acquisition date in excess of the fair value of loans are considered to be accretable yield, which is recognized as interest income over the life of the loan or pool using a level yield method if the timing and amount of the future cash flows of the loan or pool is reasonably estimable.
The cash flows expected over the life of the PCI loan or pool are estimated quarterly using an external cash flow model that projects cash flows and calculates the carrying values of the loans or pools, book yields, effective interest income and impairment, if any, based on loan or pool level events. Assumptions as to default rates, loss severity and prepayment speeds are utilized to calculate the expected cash flows. To the extent actual or projected cash flows are less than previously estimated, additional provisions for loan losses on the purchased loan portfolios will be recognized immediately into earnings. To the extent actual or projected cash flows are more than previously estimated, the increase in cash flows is recognized immediately as a recapture of provision for loan losses up to the amount of any provision previously recognized for that loan or pool, if any, then prospectively recognized in interest income as a yield adjustment. Any disposals of a loan in a pool, including sale of a loan, payment in full or foreclosure results in the removal of the loan from the loan pool at the carrying amount.
Loans accounted for under FASB ASC 310-30 are generally considered accruing and performing loans as the loans accrete interest income over the estimated life of the loan when cash flows are reasonably estimable. Accordingly, PCI loans that are contractually past due are still considered to be accruing and performing loans. If the timing and amount of cash flows is not reasonably estimable, the loans may be classified as nonaccrual loans and interest income may be recognized on a cash basis or all cash payments may be accounted for a as a reduction of the principal amount outstanding.
Loans purchased that are not accounted for under FASB ASC 310-30 are accounted for under FASB ASC 310-20, Receivables—Nonrefundable fees and Other Costs. These loans are identified as non-PCI loans, and are initially recorded at their fair value, which is estimated using an external cash flow model and assumptions similar to the FASB ASC 310-30 loans. The difference between the estimated fair value and the unpaid principal balance at
70
acquisition date is recognized as interest income over the life of the loan using an effective interest method for non-revolving credits or a straight-line method, which approximates the effective interest method, for revolving credits. Any unrecognized discount for a loan that is subsequently repaid in full will be recognized immediately into income.
Loans are generally recorded at the unpaid principal balance, net of premiums, unearned discounts and net deferred loan origination fees and costs. The premiums and unearned discounts may include values determined in purchase accounting. Interest on loans is calculated using the simple interest method based on the daily balance of the principal amount outstanding and is credited to income as earned. Loans are considered past due or delinquent when principal or interest payments are past due 30 days or more.
Covered Loans:
Purchased loans subject to FDIC shared-loss agreements were historically identified as “covered” on the Consolidated Financial Statements. The FDIC shared-loss agreements were terminated during the year ended December 31, 2015 and as such the covered designation was removed. For further information see Note (5) FDIC Indemnification Asset. The covered loans included the majority of loans from the Company's acquisition of Cowlitz Bank and certain loans from the Washington Banking Merger, which included loans from Washington Banking Company's acquisitions of City Bank and North County Bank. The same accounting principles that apply to loans receivable applied to covered loans receivable, with the added benefit of shared-loss agreements.
Delinquent Loans:
Delinquencies in the commercial business loan portfolio are handled by the assigned loan officer. Loan officers are responsible for collecting loans they originate or which are assigned to them. The Bank sends a borrower a delinquency notice 15 days after the due date when the borrower fails to make a required payment on a loan. If the delinquency is not brought current, additional delinquency notices are mailed at 30 and 45 days for commercial loans. Additional written and oral contacts are made with the borrower between 60 and 90 days after the due date.
If a real estate loan payment is past due for 45 days or more, the collection manager may perform a review of the condition of the property. Depending on the nature of the loan and the type of collateral securing the loan, the Bank may negotiate and accept a modified payment program with the borrower, accept a voluntary deed in lieu of foreclosure or, when considered necessary, begin foreclosure proceedings. If foreclosed on, real property is generally sold at a public sale and the Bank may bid on the property to protect its interest. A decision as to whether and when to begin foreclosure proceedings is based on such factors as the amount of the outstanding loan relative to the value of the property securing the original indebtedness, the extent of the delinquency, and the borrower’s ability and willingness to cooperate in resolving the delinquency.
Nonaccrual Loans:
The Company's policies for placing loans on nonaccrual status, recording payments received on nonaccrual loans, resuming accrual of interest, determining past due or delinquency status and charging off uncollectible loans generally do not differ by loan segments or classes.
Loans on which the accrual of interest has been discontinued are designated as nonaccrual loans. Delinquent loans may remain on accrual status between 30 days and 89 days past due. The accrual of interest is generally discontinued at the time the loan is 90 days delinquent unless the credit is well secured and in the process of collection. Loans are placed on nonaccrual at an earlier date if collection of the contractual principal or interest is doubtful. All interest accrued but not collected on loans deemed nonaccrual during the period is reversed against interest income in that period. The interest payments received on nonaccrual loans are generally accounted for on the cost-recovery method whereby the interest payment is applied to the principal balances. Loans may be returned to accrual status when improvements in credit quality eliminate the doubt as to the full collectability of both interest and principal and a period of sustained performance has occurred. Substantially all loans that are nonaccrual are also considered impaired. Income recognition on impaired loans conforms to that used on nonaccrual loans.
Loans are generally charged-off if collection of the contractual principal or interest as scheduled in the loan agreement is doubtful. Credit card loans and other consumer loans are typically charged-off no later than 180 days past due.
71
Impaired Loans:
The Bank routinely tests its problem loans for potential impairment. Problem loans that may be impaired are identified using the Bank's normal loan review procedures, which include post-approval reviews, quarterly reviews by credit administration of criticized loan reports, scheduled internal reviews, underwriting during extensions and renewals and the analysis of information routinely received on a borrower’s financial performance. A loan is considered impaired when, based on current information and events, it is probable the Bank will be unable to collect the scheduled payments of principal or interest when due according to the original contractual terms of the loan agreement. Factors considered by management in determining impairment include payment status, collateral value, and the probability of collecting scheduled principal and interest payments when due. Loans that experience insignificant payment delays and payment shortfalls generally are not classified as impaired. Management determines the significance of payment delays and payment shortfalls on a case-by-case basis, taking into consideration all of the circumstances surrounding the loan and the borrowers, including length of the delay, the reasons for the delay, the borrower’s prior payment record, and the amounts of the shortfall in relation to the principal and interest owed. Impairment is measured on a loan-by-loan basis by either the present value of expected future cash flows discounted at the loan’s effective interest rate, or as a practical expedient the loan’s observable market price or the fair value of the collateral (less cost to sell) if the loan is collateral dependent. Income recognition on impaired loans conforms to that used on nonaccrual loans.
Subsequent to an initial measure of impairment, if there is a significant change in the amount or timing of a loan’s expected future cash flows or a change in the value of collateral or market price of a loan, based on new information received, the impairment is recalculated. However, the net carrying value of a loan never exceeds the recorded investment in the loan.
Troubled Debt Restructures:
A troubled debt restructured loan (“TDR”) is a restructuring in which the Bank, for economic or legal reasons related to a borrower’s financial difficulties, grants a concession to a borrower that it would not otherwise consider. These concessions may include changes of the interest rate, forbearance of the outstanding principal or accrued interest, extension of the maturity date, delay in the timing of the regular payment, or any other actions intended to minimize potential losses. The Bank does not forgive principal for a majority of its TDRs, but in those situations where principal is forgiven, the entire amount of such principal forgiveness is immediately charged off to the extent not done so prior to the modification. The Bank also considers insignificant delays in payments when determining if a loan should be classified as a TDR.
The Company has implemented more stringent definitions of concessions and impairment measures for PCI loans which are not in pools as these loans have known credit deteriorations and are generally accreting income at a lower discounted rate as compared to the contractual note rate based on the guidance of FASB ASC 310-30. Modifications of PCI loans which are not in pools are considered TDRs if they result in a decrease in expected cash flows when compared to the pre-modification expected cash flows, without any other changes to the agreement to consider.
A loan that has been placed on nonaccrual status that is subsequently restructured will usually remain on nonaccrual status until the borrower is able to demonstrate repayment performance in compliance with the restructured terms for a sustained period, typically for six months. A restructured loan may return to accrual status sooner based on other significant events or mitigating circumstances. A loan that has not been placed on nonaccrual status may be restructured and such loan may remain on accrual status after such restructuring. In these circumstances, the borrower has made payments before the restructuring and is expected to continue to perform after the restructuring. Generally, this type of restructuring involves a reduction in the loan interest rate and/or a change to interest-only payments for a period of time. The restructured loan is considered impaired despite the accrual status and a specific valuation allowance, if any, is calculated in the manner previously described.
A TDR is considered defaulted if, during the 12-month period after the restructure, the loan has not performed in accordance to the restructured terms. Defaults include loans whose payments are 90 days or more past due and loans whose revised maturity date passed and no further modifications will be granted for that borrower.
A loan may subsequently be excluded from the TDR disclosures if: (i) the restructured interest rate was greater than or equal to the interest rate of a new loan with comparable risk at the time of the restructure, and (ii) the loan is no longer impaired based on the terms of the restructured agreement. The Bank's policy is that the borrower must demonstrate a sustained period, typically six consecutive months, of payments in accordance with the modified loan before it can be reviewed for removal from the TDR disclosure under the second criteria. However, the loan must be reported as a TDR in at least one annual report on Form 10-K. Once a loan has been classified as a TDR, it will continue to be disclosed as an impaired loan until paid off or charged-off, even if the loan subsequently is no longer disclosed as a TDR.
72
Unfunded Loan Commitments:
Unfunded loan commitments are generally related to the unused portion of the total commitment of a loan or providing credit facilities to clients of the Bank and are not actively traded financial instruments. These unfunded commitments are disclosed as financial instruments with off-balance sheet risk in Note (14) Commitments and Contingencies and Note (18) Fair Value in the Notes to Consolidated Financial Statements.
Loan Fees and Costs
Loan origination fees and certain direct origination costs are deferred and amortized as an adjustment of the yields of the loans over their contractual lives, adjusted for prepayment of the loans, using the effective interest method or the straight-line method, when the straight-line method approximates the effective interest method. In the event loans are sold, the unamortized net deferred loan origination fees or costs are recognized as a component of the gains or losses on the sales of loans.
Allowance for Loan Losses
Allowance for Loan Losses:
The allowance for loan losses is a reserve established through a provision for loan losses charged to expense, which represents management’s best estimate of probable losses that have been incurred within the existing portfolio of loans. Loan losses are charged against the allowance when management believes the uncollectibility of a loan balance is confirmed. Subsequent recoveries, if any, are credited to the allowance. The allowance for loan losses on loans designated as non-PCI loans is similar to the methodology described below except that for non-PCI loans, the remaining unaccreted discounts resulting from the fair value adjustments recorded at the time the loans were purchased are additionally factored into the allowance methodology. The allowance for loan losses on PCI loans is described in the “Allowance for Loan Losses on Purchased Credit Impaired Loans” section below.
The allowance, in the judgment of management, is necessary to reserve for estimated loan losses from risks inherent in the loan portfolio. The Company’s allowance for loan losses methodology includes allowance allocations calculated in accordance with FASB ASC 310, Receivables and allowance allocations calculated in accordance with FASB ASC 450, Contingencies. Accordingly, the methodology is based on historical loss experience by type of credit and internal risk grade, specific homogeneous risk pools and specific loss allocations, with adjustments for current events and conditions. The Company’s process for determining the appropriate level of the allowance for loan losses is designed to account for credit deterioration as it occurs. The provision for loan losses reflects loan quality trends, including the levels of and trends related to nonaccrual loans, past due loans, potential problem loans, criticized loans and net charge-offs or recoveries, among other factors. The provision for loan losses also reflects all actions taken on all loans for a particular period. Therefore, the amount of the provision reflects not only the necessary increases in the allowance for loan losses related to newly identified criticized loans, but it also reflects actions taken related to other loans including, among other things, any necessary increases or decreases in specific valuation allowances for impaired loans or loan pools.
The level of the allowance reflects management’s continuing evaluation of known and inherent risks in the loan portfolio. Portions of the allowance may be allocated for specific credits; however, the entire allowance is available for any credit that, in management’s judgment, could be charged off.
Loans which management determines are impaired are individually evaluated for impairment, and specific valuation allowances are recorded, if any, on these loans based on the methodology previously described. Loans that are determined not to meet management's definition of impaired are collectively evaluated for impairment based on (i) historical loss factors determined in accordance with FASB ASC 450 based on historical loan loss experience for similar loans with similar characteristics and trends; and (ii) environmental loss factors that reflect the impact of current conditions, as determined in accordance with FASB ASC 450 based on general economic conditions and other qualitative risk factors both internal and external to the Company. The historical loss factors and environmental loss factors are combined and multiplied against the outstanding principal balances of loans in pools of similar loans with similar characteristics.
The Company evaluates specific loans for credit quality indicators and performs regular analysis and evaluation of problem loans. Loans are classified based on an internal credit risk grading process that evaluates, among other things: (i) the obligor’s ability to repay; (ii) the underlying collateral, if any; and (iii) the economic environment and industry in which the borrower operates. This analysis is performed at the loan officer level for all loans. When a loan is performing but has an assigned risk grade other than pass, the loan officer analyzes the loan to determine an appropriate monitoring and collection strategy. When a loan is nonperforming or has been classified as a nonaccrual loan, a member from the special assets department will analyze the loan to determine if it is impaired. If the loan is considered impaired, the special assets department will evaluate the need for a specific valuation allowance on the
73
loan. Specific valuation allowances are determined by analyzing the borrower’s ability to repay amounts owed, collateral deficiencies and economic conditions affecting the borrower’s industry, among other things.
Historical loss factors are calculated based on the historical loss experience and recovery experience of specific classes of loans. The Company calculates historical loss ratios for the classes of loans based on the proportion of actual charge-offs and recoveries experienced to the total loans in the pool for a rolling twelve-quarter average.
Environmental loss factors are based on general economic conditions and other qualitative risk factors both internal and external to the Company. In general, such valuation allowances are determined by evaluating, among other things: (i) levels of and trends in delinquencies, classified and impaired loans; (ii) levels of and trends in charge-offs and recoveries; (iii) trends in volume and terms of loans (iv) effects of changes in risk selection and underwriting standards, and other changes in lending policies, procedures, and practices; (v) experience, ability, and depth of lending management and other relevant staff; (vi) national and local economic trends and conditions; (vii) other external factors such as competition, legal, and regulatory; (viii) effects of changes in credit concentrations, and (ix) other factors. Management evaluates the degree of risk that each one of these components has on the quality of the loan portfolio on a quarterly basis. Each component is determined to be on a scale of risk. The results are then utilized in a matrix to determine an appropriate environmental loss factor for each class of loan.
The allowance for loan losses evaluation is inherently subjective, as it requires estimates that are susceptible to significant revision as more information becomes available. While management utilizes its best judgment and information available to recognize losses on loans, future additions to the allowance may be necessary based on declines in local and national economic conditions. In addition, various regulatory agencies, as an integral part of their examination process, periodically review the Bank’s allowance for loan losses. Such agencies may require the Bank to make adjustments to the allowance based on their judgments about information available to them at the time of their examinations. The Company believes the allowance for loan losses is appropriate given all of the above considerations.
Allowance for Loan Losses on Purchased Credit Impaired Loans:
The PCI loans acquired in the Company's mergers and acquisitions are subject to the Company’s internal and external credit review. Under the accounting guidance of FASB ASC 310-30, the allowance for loan losses on PCI loans is measured at each financial reporting period, or measurement date, based on expected cash flows. If and when credit deterioration, or decreases in expected cash flows previously estimated, occurs subsequent to the acquisition date, a provision for loan losses will be charged to earnings as of the measurement date. Prior to the termination of the FDIC shared-loss agreements, a provision for loan losses on PCI loans was charged to earnings for the full amount without regard to the FDIC shared-loss agreements, and the portion of the loss reimbursable from the FDIC was recorded in noninterest income and increased the FDIC indemnification asset.
Allowance for Losses on Unfunded Commitments:
The Bank is also party to financial instruments with off-balance sheet risk in the normal course of business to meet the financing needs of its customers. These financial instruments include commitments to extend credit and standby letters of credit. Those instruments involve, to varying degrees, elements of credit risk in excess of the disbursed amounts recognized in the Consolidated Statements of Financial Condition. The Company has a policy in which it evaluates the risk on a quarterly basis, and provides for an allowance for credit losses, as necessary. The methodology is similar to the allowance for loan losses, and includes an estimate of the probability of drawdown of the loan commitment. Based on its analysis, the Company has recorded an allowance for off-balance sheet financial instruments of $170,000 as of both December 31, 2017 and 2016. This allowance is reported within accrued expenses and other liabilities on the Company's Consolidated Statements of Financial Condition.
Mortgage Banking Operations
The Company sells one-to-four family residential loans on a servicing-released basis and recognizes a cash gain or loss. A cash gain or loss is recognized to the extent that the sale proceeds of the loan sold differs from the net book value at the time of sale. Income from one-to-four family residential loans brokered to other lenders is recognized into income on date of loan closing.
Commitments to sell one-to-four family residential loans are made primarily during the period between the taking of the loan application and the closing of the loan. The timing of making these sale commitments is dependent upon the timing of the borrower’s election to lock-in the mortgage interest rate and fees prior to loan closing. Most of these sale commitments are made on a best-efforts basis whereby the Bank is only obligated to sell the loan if the loan is approved and closed by the Bank. Commitments to fund one-to-four family residential loans (interest rate locks) to be sold into the secondary market and forward commitments for the future delivery of these loans are accounted for as free standing derivatives. Fair values of these mortgage derivatives are estimated based on changes in mortgage
74
interest rates between the date the interest on the loan was locked and the balance sheet date. The Company enters into forward commitments for the future delivery of one-to-four family residential loans when interest rate locks are entered into, in order to hedge the interest rate risk resulting from its commitments to fund the loans. Changes in the fair values of these derivatives are included in other income. The fair value of these derivative instruments was not significant at December 31, 2017 and 2016.
FDIC Indemnification Asset
The FDIC indemnification asset represented the present value of the estimated loan losses to be reimbursed by the FDIC. The termination of the FDIC shared-loss agreements during the year ended December 31, 2015 eliminated this asset. See Note (5) FDIC Indemnification Asset for further information on the termination agreement.
The FDIC indemnification asset was measured at estimated fair value at acquisition dates on the same basis as the loans. The present value was calculated using the shorter of the shared-loss agreement terms or the life of the loan. Under the terms of the FDIC shared-loss agreements, the FDIC absorbed 80% of losses and received 80% of loss recoveries for the loans during the terms of the agreements. Certain shared-loss agreements had loss minimums or tranches which reduced the shared-loss percentages during the coverage period. The FDIC indemnification asset was reduced as losses were recognized on loans and shared-loss payments were received from the FDIC. Since the FDIC indemnification asset was initially recorded at estimated fair value using a discount rate, a portion of the discount was accreted into noninterest income during each reporting period.
The FDIC indemnification asset was evaluated quarterly. Realized losses in excess of prior estimates immediately increased the FDIC indemnification asset by a credit to noninterest income. Conversely, if realized losses were less than prior estimates, the FDIC indemnification asset was reduced by a charge to noninterest income on a prospective basis, and any change in value was limited to the contractual terms of the shared-loss agreements.
Other Real Estate Owned
Other real estate acquired by the Company in partial or full satisfaction of a loan obligation is classified as held for sale. When acquired, the property is recorded at the estimated fair value (less the costs to sell) at the date of acquisition, not to exceed net realizable value, and any resulting write-down is charged to the allowance for loan losses. Physical possession of residential real estate property collateralizing a consumer mortgage loan occurs when legal title is obtained upon completion of foreclosure or when the borrower conveys all interest in the properly to satisfy the loan through completion of a deed in lieu of foreclosure or through a similar legal agreement.
After acquisition, all costs incurred in maintaining the property are expensed. Costs relating to the development and improvement of the property, however, are capitalized to the extent of the property’s net realizable value. If the estimated realizable value of the other real estate owned property declines after the acquisition date, the adjustment to the value is charged to other real estate owned expense, net.
Premises and Equipment
Premises and equipment, including leasehold improvements, are stated at cost less accumulated depreciation. Depreciation is computed using the straight-line method over the estimated useful lives of the assets or the lease period, whichever is shorter. The estimated useful lives used to compute depreciation and amortization for buildings and building improvements is 15 to 39 years; and for furniture, fixtures and equipment is three to seven years. The Company reviews buildings, leasehold improvements and equipment for impairment whenever events or changes in the circumstances indicate that the undiscounted cash flows for the property are less than its carrying value. If identified, an impairment loss is recognized through a charge to earnings based on the fair value of the property.
Bank Owned Life Insurance
The Company has bank owned life insurance (“BOLI”) of $75.1 million at December 31, 2017. These policies insure the lives of certain current or former Bank officers, and name the Bank as beneficiary. Noninterest income is generated tax-free (subject to certain limitations) from the increase in the policies' underlying investments made by the insurance company. The Bank utilizes BOLI to partially offset costs associated with employee compensation and benefit programs with the earnings on the BOLI. The Company records BOLI at the amount that can be realized under the insurance contract at the statement of financial condition date, which is the cash surrender value adjusted for other charges or other amounts due that are probable at settlement.
Other Intangible Assets
The other intangible assets represents the Core Deposit Intangible (“CDI”) acquired in business combinations. The fair value of the CDI stemming from any given business combination is based on the present value of the expected cost savings attributable to the core deposit funding, relative to an alternative source of funding. The CDI is amortized over an estimated useful life which approximates the existing deposit relationships acquired on an accelerated method.
75
The Company evaluates such identifiable intangibles for impairment when an indication of impairment exists.
Goodwill
The Company’s goodwill represents the excess of the purchase price over the fair value of net assets acquired in acquisitions. In accordance with Accounting Standards Update ("ASU") 2011-08 Intangibles – Goodwill and Other (Topic 350), an entity is not required to calculate the fair value of a reporting unit unless the entity determines that it is more likely than not that its fair value is less than its carrying amount. In other words, before the first step of the existing guidance, the entity has the option to first assess qualitative factors to determine whether the existence of events or circumstances leads to a determination that the fair value of goodwill is less than carrying value. The qualitative assessment includes adverse events or circumstances identified that could negatively affect the reporting units’ fair value as well as positive and mitigating events. Such indicators may include, among others: a significant change in legal factors or in the general business climate; significant change in the Company’s stock price and market capitalization; unanticipated competition; and an action or assessment by a regulator. If, after assessing the totality of events or circumstances, an entity determines it is not more likely than not that the fair value of a reporting unit is less than its carrying amount, then performing the two-step process is unnecessary. The entity has the option to bypass the qualitative assessment step for any reporting unit in any period and proceed directly to the first step of the two-step process. The entity can resume performing the qualitative assessment in any subsequent period.
The first step of the goodwill impairment test is performed, when considered necessary, by comparing the reporting unit’s aggregate fair value to its carrying value. Absent other indicators of impairment, if the aggregate fair value exceeds the carrying value, goodwill is not considered impaired and no additional analysis is necessary. If the carrying value of the reporting unit were to exceed the aggregate fair value, a second step would be performed to measure the amount of impairment loss, if any. To measure any impairment loss the implied fair value would be determined in the same manner as if the reporting unit were being acquired in a business combination. If the implied fair value of goodwill is less than the recorded goodwill, an impairment charge would be recorded for the difference.
Income Taxes
The Company and the Bank file a United States consolidated federal income tax return and an Oregon State income tax return. Income tax expense is the total of the current year income tax due or refundable and the change in deferred tax assets and liabilities. Deferred tax assets and liabilities are recognized for the future tax consequences attributable to differences between the consolidated financial statement carrying amounts of existing assets and liabilities and their respective tax bases. Deferred tax assets and liabilities are measured using enacted tax rates applicable to taxable income in the periods in which those temporary differences are expected to be recovered or settled. The effect on deferred tax assets and liabilities of a change in tax rate is recognized in income in the period that includes the enactment date. A valuation allowance, if needed, reduces deferred tax assets to the amounts expected to be realized.
A tax position is recognized as a benefit only if it is “more likely than not” that the tax position would be sustained in a tax examination, with a tax examination being presumed to occur. The amount recognized is the largest amount of tax benefit that is greater than 50% likely of being realized on examination. For tax positions not meeting the “more likely than not” test, no tax benefit is recorded.
The Company’s policy is to recognize interest and penalties on unrecognized tax benefits in “income taxes” in the Consolidated Statements of Income as the amounts are generally insignificant each year.
Stock-Based Compensation
The Company maintains a number of stock-based incentive programs, which are discussed in more detail in Note (19) Stock-Based Compensation. Compensation cost is recognized for stock options, restricted stock awards and restricted stock units issued to employees and directors, based on the fair value of these awards at the date of grant. Compensation cost is recognized over the requisite service period, generally defined as the vesting period, on a straight-line basis. Compensation cost for restricted stock units with market-based vesting is recognized over the service period to the extent the restricted stock units are expected to vest. With the adoption of FASB ASU 2016-09 on January 1, 2017, forfeitures are recognized as they occur.
The market price of the Company’s common stock at the date of grant is used to determine the fair value of the restricted stock awards and restricted stock units. The fair value of stock options granted is estimated based on the date of grant using the Black-Scholes-Merton option pricing model. Certain restricted stock unit grants are subject to performance-based vesting as well as other approved vesting conditions and cliff vest based on those conditions, and the fair value is estimated using a Monte Carlo simulation pricing model. The assumptions used in the Black-Scholes-Merton option pricing model and the Monte Carlo simulation pricing model include the expected term based on the valuation date and the remaining contractual term of the award; the risk-free interest rate based on the U.S.
76
Treasury curve at the valuation date of the award; the expected dividend yield based on expected dividends being payable to the holders; and the expected stock price volatility over the expected term based on the historical volatility over the equivalent historical term.
Deferred Compensation Plan
The Company has adopted a Deferred Compensation Plan and has entered into arrangements with certain executive officers. Under the Plan, participants are permitted to elect to defer compensation and the Company has the discretion to make additional contributions to the Plan on behalf of any participant based on a number of factors. Such discretionary contributions are generally approved by the Compensation Committee of the Company's Board of Directors. The notional account balances of participants under the Plan earn interest on an annual basis. The applicable interest rate is the Moody’s Seasoned Aaa Corporate Bond Yield as of January 1 of each year. Generally, a participant’s account is payable upon the earliest of the participant’s separation from service with the Company, the participant’s death or disability, or a specified date that is elected by the participant in accordance with applicable rules of the Internal Revenue Code. The Company’s obligation to make payments under the Plan is a general obligation of the Company and is to be paid from the Company’s general assets. As such, participants are general unsecured creditors of the Company with respect to their participation under the Plan. The Company records a liability within accrued expenses and other liabilities on the Consolidated Statements of Financial Condition and records compensation expense in a systematic and rational manner. Since the amounts earned are generally based on the Company’s annual performance, the Company records deferred compensation expense each year for an amount calculated based on that year’s financial performance.
Earnings per Share
The two-class method is used in the calculation of basic and diluted earnings per common share. Basic earnings per common share is net income allocated to common shareholders divided by the weighted average number of common shares outstanding during the period. All outstanding unvested share-based payment awards that contain rights to nonforfeitable dividends are considered participating securities for this calculation. Dividends and undistributed earnings allocated to participating securities are excluded from net income allocated to common shareholders and participating securities are excluded from weighted average common shares outstanding. Diluted earnings per common share is calculated using the treasury stock method and includes the dilutive effect of additional potential common shares issuable under stock options. Earnings and dividends per share are restated for all stock splits and stock dividends through the date of issuance of the financial statements.
Derivative Financial Instruments
The Company utilizes interest rate swap derivative contracts to facilitate the needs of its customers. Under these transactions, the Company enters into an interest rate swap with a customer while at the same time entering into an offsetting interest rate swap with another financial institution. In connection with each swap transaction, the Company agrees to pay interest to the customer on a notional amount at a variable interest rate and receive interest from the customer on a similar notional amount at a fixed interest rate. At the same time, the Company agrees to pay another financial institution the same fixed interest rate on the same notional amount and receive the same variable interest rate on the same notional amount. The transaction allows the Company’s customer to effectively convert a variable rate loan to a fixed rate. Because the Company acts as an intermediary for its customer, changes in the fair value of the underlying derivative contracts for the most part offset each other and do not significantly impact the Company’s results of operations. These interest rate swaps are not designated as hedging instruments.
The fair value of derivative positions outstanding is included in prepaid expenses and other assets and accrued expenses and other liabilities in the Company's Consolidated Statements of Financial Condition and the net change in each of these financial statement line items is included in the Consolidated Statements of Cash Flows. For non-hedging derivative instruments, gains and losses due to changes in fair value and all cash flows are included in other noninterest income in the Company's Consolidated Statements of Income, but net to zero for the years ended December 31, 2017 and 2016 based on the identical back-to-back interest rate swaps.
Operating Segments
While the Company’s chief decision-makers monitor the revenue streams of the various products and services, operations are managed and financial performance is evaluated on a Company-wide basis. Operating segments are aggregated into one as operating results for all segments are similar. Accordingly, all of the financial service operations are considered by management to be aggregated in one reportable operating segment.
77
(d) Recently Issued Accounting Pronouncements
FASB ASU 2014-09, Revenue from Contracts with Customers, was issued in May 2014. Under this Update, FASB created a new Topic 606 which is in response to a joint initiative of FASB and the International Accounting Standards Board to clarify the principles for recognizing revenue and to develop a common revenue standard for U.S. GAAP and international financial reporting standards that would:
• | Remove inconsistencies and weaknesses in revenue requirements. |
• | Provide a more robust framework for addressing revenue issues. |
• | Improve comparability of revenue recognition practices across entities, industries, jurisdictions and capital markets. |
• | Provide more useful information to users of financial statements through improved disclosure requirements. |
• | Simplify the preparation of financial statements by reducing the number of requirements to which an entity must refer. |
The original effective date for this Update was deferred in FASB ASU 2015-14 below.
FASB ASU 2015-14, Revenue from Contracts with Customers (Topic 606), was issued in August 2015 and defers the effective date of the above-mentioned FASB ASU 2014-09 for certain entities. Public business entities, certain not-for-profit entities and certain employee benefit plans should apply the guidance in Update 2014-09 to annual reporting periods beginning after December 15, 2017, including interim reporting periods within that reporting period. Earlier application is permitted, but only as of annual reporting periods beginning after December 15, 2016, including interim reporting periods within that reporting period. The Company adopted the revenue recognition guidance on January 1, 2018 using the modified retrospective approach. A significant amount of the Company’s revenues are derived from interest income on financial assets, which are excluded from the scope of the amended guidance. With respect to noninterest income and related disclosures, the Company has identified and evaluated the revenue streams and underlying revenue contracts within the scope of the guidance. The Company has not identified any significant changes in the timing of revenue recognition when considering the amended accounting guidance and it is implementing processes and procedures to ensure it is fully compliant with the disclosure requirements that are required beginning with the quarterly reporting period as of March 31, 2018. The Company has elected to adopt the new guidance under the modified retrospective approach and, except for certain disclosure requirements, does not expect the new guidance to have a material impact on its Consolidated Financial Statements.
FASB ASU 2016-01, Recognition and Measurement of Financial Assets and Financial Liabilities (Subtopic 825-10), was issued in January 2016, to enhance the reporting model for financial instruments to provide users of financial statements with more decision-useful information. This Update contains several provisions, including but not limited to 1) requiring equity investments, with certain exceptions, to be measured at fair value with changes in fair value recognized in net income; 2) simplifying the impairment assessment of equity investments without readily determinable fair values by requiring a qualitative assessment to identify impairment; 3) eliminating the requirement to disclose the method(s) and significant assumptions used to estimate fair value; and 4) requiring separate presentation of financial assets and liabilities by measurement category and form of financial asset on the balance sheet or the accompanying notes to the financial statements. The Update also changes certain financial statement disclosure requirements, including requiring disclosures of the fair value of financial instruments be made on the basis of exit price. The Update is effective for public entities for fiscal years beginning after December 15, 2017, including interim periods within those fiscal years. This Update will not have a significant impact on the Company’s statements of financial condition or income and the Company is implementing processes and procedures to ensure it is fully compliant with the disclosures requirements of this Update related to fair value of its financial instruments beginning with the quarterly reporting period as of March 31, 2018.
FASB ASU 2016-02, Leases (Topic 842) was originally issued in February 2016, to increase transparency and comparability of leases among organizations and to disclose key information about leasing arrangements. The Update sets out the principles for the recognition, measurement, presentation and disclosure of leases for both lessees and lessors. The Update requires lessees to apply a dual approach, classifying leases as either a finance or operating lease. This classification will determine whether the lease expense is recognized based on an effective interest method or on a straight-line basis over the term of the lease. A lessee is also required to record a right-of-use asset and a lease liability for all leases with a term greater than 12 months regardless of their classification. All cash payments will be classified within operating activities in the statement of cash flows. In transition, lessees and lessors are required to recognize and measure leases at the beginning of the earliest period presented using a modified retrospective approach. The Update is effective for public entities for fiscal years beginning after December 15, 2018, including
78
interim periods within those fiscal years. The Company anticipates adopting the Update on January 1, 2019. Upon adoption of the guidance, the Company expects to report increased assets and increased liabilities on its Consolidated Statements of Financial Condition as a result of recognizing right-of-use assets and lease liabilities related to certain banking offices and certain equipment under noncancelable operating lease agreements, which currently are not reflected in its Consolidated Statements of Financial Condition. During 2017, management developed its methodology to estimate the right-of use assets and lease liabilities. The Company anticipates electing an exclusion accounting policy for lease assets and lease liabilities for leases with a term of twelve months or less. The Company was committed to $13.0 million of minimum lease payments under noncancelable operating lease agreements at December 31, 2017. The Company does not expect the adoption of this amendment will have a significant impact to its Consolidated Financial Statements.
FASB ASU 2016-08, Revenue from Contracts with Customers (Topic 606): Principal versus Agent Considerations, was issued in March 2016 and it clarifies the implementation guidance of the above-mentioned FASB ASU 2014-09 as it relates to principal versus agent considerations. The Update addresses identifying the unit of account and nature of the goods or services as well as applying the control principle and interactions with the control principle. The amendments to the Update do not change the core principle of the guidance. The effective date, transition requirements and impact on the Company's Consolidated Financial Statements for this Update are the same as those described in FASB ASU 2015-14 above.
FASB ASU 2016-09, Stock Compensation (Topic 718), issued in March 2016, is intended to simplify several aspects of the accounting for share-based payment award transactions. For public business entities, the guidance is effective for annual periods after December 15, 2016, including interim periods within those annual periods with early adoption permitted. Certain amendments are required to be applied using a modified retrospective transition method by means of a cumulative-effect adjustment to equity as of the beginning of the period in which the guidance is adopted. Other amendments are applied retroactively (such as presentation of employee taxes paid on the statement of cash flows) or prospectively (such as recognition of excess tax benefits on the income statement). The Company adopted this standard effective January 1, 2017. The Company made an accounting policy election upon adoption to account for forfeitures as they occur, and this change resulted in a cumulative adjustment that was immaterial to all periods presented. Changes to the statement of cash flows have been applied prospectively and the Company recorded excess tax benefits in its income tax expense. Adoption of all other changes under this Update did not have a material impact on the Consolidated Financial Statements.
FASB ASU 2016-10, Revenue from Contracts with Customers (Topic 606): Identifying Performance Obligations and Licensing, was issued in April 2016 which clarifies the implementation guidance of the above-mentioned FASB ASU 2014-09 as it relates to identifying performance obligations and licensing. The effective date, transition requirements and impact on the Company's Consolidated Financial Statements for this Update are the same as those described in FASB ASU 2015-14 above.
FASB ASU 2016-12, Revenue from Contracts with Customers (Topic 606): Narrow-scope Improvements and Practical Expedients, was issued in May 2016. The amendments in this Update do not change the core principle of the guidance in Topic 606. Rather, the amendments in this Update affect only the narrow aspects of Topic 606. The effective date, transition requirements and impact on the Company's Consolidated Financial Statements for this Update are the same as those described in FASB ASU 2015-14 above.
FASB ASU 2016-13, Financial Instruments: Credit Losses (Topic 326): Measurement of Credit Losses on Financial Instruments, was issued in June 2016. Commonly referred to as the current expected credit loss model ("CECL"), this Update requires financial assets measured at amortized cost basis to be presented at the net amount expected to be collected. The allowance for credit losses is a valuation account that is deducted from the amortized cost basis of the financial asset to present the net carrying value at the amount expected to be collected on the financial asset. The measurement of expected credit losses is based on relevant information about past events including historical experience, current conditions and reasonable and supportable forecasts that affect the collectibility of the reported amount. The amendment affects loans, debt securities, trade receivables, net investments in leases, off-balance-sheet credit exposures, reinsurance receivables and any other financial asset not excluded from the scope that have the contractual right to receive cash. The Update replaces the incurred loss impairment methodology, which generally only considered past events and current conditions, with a methodology that reflects the expected credit losses and required consideration of a broader range of reasonable and supportable information to estimate all expected credit losses. The Update additionally addresses purchased assets and introduces the purchased financial asset with a more-than-insignificant amount of credit deterioration since origination ("PCD"). The accounting for these PCD assets is similar to the existing accounting guidance of FASB ASC 310-30, Loans and Debt Securities Acquired with Deteriorated Credit Quality, for PCI assets, except the subsequent improvements in estimated cash flows will be immediately recognized into income, similar to the immediate recognition of subsequent deteriorations in cash flows.
79
Current guidance only allows for the prospective recognition of these cash flow improvements. Because the terminology has been changed to a "more-than-insignificant" amount of credit deterioration, the presumption is that more assets might qualify for this accounting under the Update than those under current guidance. For public business entities, the Update is effective for fiscal years beginning after December 15, 2019, including interim periods within those fiscal years with early adoption permitted for fiscal years after December 15, 2018. An entity will apply the Update through a cumulative-effect adjustment to retained earnings as of the beginning of the first reporting period in which the guidance is adopted. A prospective transition approach is required for debt securities. An entity that has previously applied the guidance of FASB ASC 310-30 will prospectively apply the guidance in this Update for PCD assets. A prospective transition approach should be used for PCD assets where upon adoption, the amortized cost basis should be adjusted to reflect the addition of the allowance for credit losses. The Company is anticipating adopting the Update on January 1, 2020. Upon adoption, the Company expects a change in the processes, internal controls and procedures to calculate the allowance for loan losses, including changes in assumptions and estimates to consider expected credit losses over the life of the loan versus the current accounting practice that utilizes the incurred loss model. The new guidance may result in an increase in the allowance for loan losses which will also reflect the new requirement to include the nonaccretable principal differences on PCI loans; however, the Company is still in the process of determining the magnitude of the increase and its impact on the Consolidated Financial Statements. In addition, the current accounting policy and procedures for other-than-temporary impairment on investment securities available for sale will be replaced with an allowance approach. During 2017, the Company's management created a CECL steering committee which has begun developing and implementing processes and procedures to ensure it is fully compliant with the amendments at the adoption date. To date, the CECL steering committee has selected a vendor to assist the Company in the adoption and has begun the implementation discovery sessions.
FASB ASU 2016-15, Statement of Cash Flows (Topic 230): Classification of Certain Cash Receipts and Cash Payments, was issued in August 2016. The Update addresses eight specific cash flow issues with the objective of reducing the existing diversity in practice. For public business entities, the guidance is effective for fiscal years beginning after December 15, 2017, including interim periods within those fiscal years. Early adoption is permitted and must be applied using a retrospective transitional method to each period presented. The Company has evaluated the new guidance and does not anticipate that its adoption of this Update on January 1, 2018 will have a significant impact on its Consolidated Financial Statements.
FASB ASU 2017-03, Accounting Changes and Error Corrections (Topic 250) and Investments—Equity Method and Joint Ventures (Topic 323): Amendments to SEC Paragraphs Pursuant to Staff Announcements at the September 22, 2016 and November 17, 2016 EITF Meetings (SEC Update), was issued in January 2017. The SEC staff view is that a registrant should evaluate FASB ASC Updates that have not yet been adopted to determine the appropriate financial disclosures about the potential material effects of the updates on the financial statements when adopted. If a registrant does not know or cannot reasonably estimate the impact of an update, then in addition to making a statement to that effect, the registrant should consider additional qualitative financial statement disclosures to assist the reader in assessing the significance of the impact. The staff expects the additional qualitative disclosures to include a description of the effect of the accounting policies expected to be applied compared to current accounting policies. Also, the registrant should describe the status of its process to implement the new standards and the significant implementation matters yet to be addressed. The amendments specifically addressed recent FASB ASC amendments to Topic 326, Financial Instruments - Credit Losses; Topic 842, Leases; and Topic 606, Revenue from Contracts with Customers; although, the amendments apply to any subsequent amendments to guidance in the FASB ASC. The Company adopted the amendments in this Update during the fourth quarter of 2016 and appropriate disclosures have been included in this Note for each recently issued accounting standard.
FASB ASU 2017-04, Goodwill (Topic 350), was issued in January 2017 and eliminates Step 2 from the goodwill impairment test. Under the amendments, an entity should perform its goodwill impairment test by comparing the fair value of a reporting unit with its carrying amount. An entity should recognize an impairment charge for the amount by which the carrying amount exceeds the reporting unit’s fair value. The loss recognized, however, should not exceed the total amount of goodwill allocated to that reporting unit. Additionally, an entity should consider income tax effects from any tax deductible goodwill on the carrying amount of the reporting unit when measuring the goodwill impairment loss, if applicable. The Update is effective for annual periods or any interim goodwill impairment tests beginning after December 15, 2019 using a prospective transition method and early adoption is permitted. The Company does not expect the Update will have a material impact on its Consolidated Financial Statements.
FASB ASU 2017-08, Receivables—Nonrefundable Fees and Other Costs (Subtopic 310-20): Premium Amortization on Purchased Callable Debt Securities was issued in March 2017 and changes the accounting for certain purchased callable debt securities held at a premium to shorten the amortization period for the premium to the earliest call date rather than to the maturity date. Accounting for purchased callable debt securities held at a discount does not change. The discount would continue to amortize to the maturity date. The Update is effective for reporting periods
80
beginning after December 15, 2018, with early adoption permitted. The Company does not expect the Update will have a material impact on its Consolidated Financial Statements as the Company had been accounting for premiums as prescribed under this guidance. The Company adopted this Update in January 2018.
FASB ASU 2017-09, Compensation—Stock Compensation (Topic 718): Scope of Modification Accounting was issued in May 2017 to provide clarity as to when to apply modification accounting when there is a change in the terms or conditions of a share-based payment award. According to this Update, an entity should account for the effects of a modification unless the fair value, vesting conditions and balance sheet classification of the award is the same after the modification as compared to the original award prior to the modification. The Update is effective for reporting periods beginning after December 15, 2017, with early adoption permitted. The Company does not expect the Update will have a material impact on its Consolidated Financial Statements.
FASB ASU 2018-02, Income Statement — Reporting Comprehensive Income (Topic 220): Reclassification of Certain Tax Effects from Accumulated Other Comprehensive Income” was issued to address the income tax accounting treatment of the stranded tax effects within other comprehensive income due to the prohibition of backward tracing due to an income tax rate change that was initially recorded in other comprehensive income. This issue came about from the enactment of the Tax Cuts and Jobs Act on December 22, 2017 that changed the Company’s income tax rate from 35% to 21%. The Update changed current accounting whereby an entity may elect to reclassify the stranded tax effect from accumulated other comprehensive income to retained earnings. The Update is effective for periods beginning after December 15, 2018 although early adoption is permitted. The Company early adopted ASU 2018-02 effective December 31, 2017 and elected a portfolio policy to reclassify the stranded tax effects of the change in the federal corporate tax rate of the net unrealized gains on our available-for-sale investment securities from accumulated other comprehensive loss, net to retained earnings.
Application of US GAAP in Accounting for the Tax Cuts and Jobs Act
On December 22, 2017, the SEC staff issued Staff Accounting Bulletin No. 118 (SAB 118) to address the application of US GAAP in situations when a registrant does not have the necessary information available, prepared, or analyzed (including computations) in reasonable detail to complete the accounting for certain income tax effects of the 2017 Tax Act. SAB 118 provides guidance to registrants under three scenarios: (1) Measurement of certain income tax effects is complete, (2) Measurement of certain income tax effects can be reasonable estimated and (3) Measurement of certain income tax effects cannot be reasonably estimated. SAB 118 provides a one year measurement period for the registrant to complete its accounting for certain income tax effects that are considered provisional or for which reasonable estimates cannot be made. The Company recognized the income tax effects of the 2017 Tax Act in its 2017 financial statements in accordance with SAB 118.
(2) | Investment Securities |
The Company’s investment policy is designed primarily to provide and maintain liquidity, generate a favorable return on assets without incurring undue interest rate and credit risk, and complement the Bank’s lending activities.
81
(a) Securities by Type and Maturity
The amortized cost, gross unrealized gains, gross unrealized losses and fair values of investment securities available for sale at the dates indicated were as follows:
Amortized Cost | Gross Unrealized Gains | Gross Unrealized Losses | Fair Value | ||||||||||||
(In thousands) | |||||||||||||||
December 31, 2017 | |||||||||||||||
U.S. Treasury and U.S. Government-sponsored agencies | $ | 13,460 | $ | 6 | $ | (24 | ) | $ | 13,442 | ||||||
Municipal securities | 247,358 | 3,720 | (1,063 | ) | 250,015 | ||||||||||
Mortgage-backed securities and collateralized mortgage obligations (1): | |||||||||||||||
Residential | 282,724 | 422 | (2,935 | ) | 280,211 | ||||||||||
Commercial | 219,696 | 444 | (3,061 | ) | 217,079 | ||||||||||
Collateralized loan obligations | 4,561 | 19 | — | 4,580 | |||||||||||
Corporate obligations | 16,594 | 220 | (44 | ) | 16,770 | ||||||||||
Other securities (2) | 27,781 | 652 | — | 28,433 | |||||||||||
Total | $ | 812,174 | $ | 5,483 | $ | (7,127 | ) | $ | 810,530 | ||||||
December 31, 2016 | |||||||||||||||
U.S. Treasury and U.S. Government-sponsored agencies | $ | 1,563 | $ | 6 | $ | — | $ | 1,569 | |||||||
Municipal securities | 237,305 | 2,427 | (2,476 | ) | 237,256 | ||||||||||
Mortgage-backed securities and collateralized mortgage obligations (1): | |||||||||||||||
Residential | 310,391 | 985 | (2,200 | ) | 309,176 | ||||||||||
Commercial | 211,259 | 599 | (3,540 | ) | 208,318 | ||||||||||
Collateralized loan obligations | 10,505 | 4 | (31 | ) | 10,478 | ||||||||||
Corporate obligations | 16,611 | 104 | (9 | ) | 16,706 | ||||||||||
Other securities (2) | 11,005 | 156 | (19 | ) | 11,142 | ||||||||||
Total | $ | 798,639 | $ | 4,281 | $ | (8,275 | ) | $ | 794,645 | ||||||
(1) Issued and guaranteed by U.S. Government-sponsored agencies.
(2) Primarily asset-backed securities issued and guaranteed by U.S. Government-sponsored agencies.
There were no securities classified as trading or held to maturity at December 31, 2017 or December 31, 2016.
The amortized cost and fair value of investment securities available for sale at December 31, 2017, by contractual maturity, are set forth below. Actual maturities may differ from contractual maturities because certain borrowers have the right to call or prepay obligations with or without call or prepayment penalties.
Amortized Cost | Fair Value | ||||||
(In thousands) | |||||||
Due in one year or less | $ | 8,922 | $ | 8,982 | |||
Due after one year through five years | 132,271 | 132,497 | |||||
Due after five years through ten years | 240,089 | 238,613 | |||||
Due after ten years | 430,847 | 430,292 | |||||
Investment securities with no stated maturities | 45 | 146 | |||||
Total | $ | 812,174 | $ | 810,530 | |||
82
(b) Unrealized Losses and Other-Than-Temporary Impairments
The following table shows the gross unrealized losses and fair value of the Company's investment securities available for sale that are not deemed to be other-than-temporarily impaired, aggregated by investment category and length of time that the individual securities have been in continuous unrealized loss positions as of December 31, 2017 and December 31, 2016:
Less than 12 Months | 12 Months or Longer | Total | |||||||||||||||||||||
Fair Value | Unrealized Losses | Fair Value | Unrealized Losses | Fair Value | Unrealized Losses | ||||||||||||||||||
(In thousands) | |||||||||||||||||||||||
December 31, 2017 | |||||||||||||||||||||||
U.S. Treasury and U.S. Government-sponsored agencies | $ | 11,436 | $ | (24 | ) | $ | — | $ | — | $ | 11,436 | $ | (24 | ) | |||||||||
Municipal securities | 39,298 | (384 | ) | 26,509 | (679 | ) | 65,807 | (1,063 | ) | ||||||||||||||
Mortgage-backed securities and collateralized mortgage obligations (1): | |||||||||||||||||||||||
Residential | 175,847 | (1,296 | ) | 66,380 | (1,639 | ) | 242,227 | (2,935 | ) | ||||||||||||||
Commercial | 75,121 | (700 | ) | 90,822 | (2,361 | ) | 165,943 | (3,061 | ) | ||||||||||||||
Corporate obligations | 3,472 | (44 | ) | — | — | 3,472 | (44 | ) | |||||||||||||||
Total | $ | 305,174 | $ | (2,448 | ) | $ | 183,711 | $ | (4,679 | ) | $ | 488,885 | $ | (7,127 | ) | ||||||||
December 31, 2016 | |||||||||||||||||||||||
Municipal securities | $ | 90,188 | $ | (2,476 | ) | $ | — | $ | — | $ | 90,188 | $ | (2,476 | ) | |||||||||
Mortgage-backed securities and collateralized mortgage obligations (1): | |||||||||||||||||||||||
Residential | 181,562 | (2,148 | ) | 10,854 | (52 | ) | 192,416 | (2,200 | ) | ||||||||||||||
Commercial | 157,055 | (3,446 | ) | 12,597 | (94 | ) | 169,652 | (3,540 | ) | ||||||||||||||
Collateralized loan obligations | 2,976 | (1 | ) | 2,969 | (30 | ) | 5,945 | (31 | ) | ||||||||||||||
Corporate obligations | 4,032 | (9 | ) | — | — | 4,032 | (9 | ) | |||||||||||||||
Other securities (2) | 6,998 | (19 | ) | — | — | 6,998 | (19 | ) | |||||||||||||||
Total | $ | 442,811 | $ | (8,099 | ) | $ | 26,420 | $ | (176 | ) | $ | 469,231 | $ | (8,275 | ) | ||||||||
(1) Issued and guaranteed by U.S. Government-sponsored agencies.
(2) Primarily asset-backed securities issued and guaranteed by U.S. Government-sponsored agencies.
The Company has evaluated these investment securities available for sale as of December 31, 2017 and December 31, 2016 and has determined that the decline in their value is not other-than-temporary. The unrealized losses are primarily due to increases in market interest rates. The fair value of these securities is expected to recover as the securities approach their maturity date. None of the underlying issuers of the municipal securities had credit ratings that were below investment grade levels at December 31, 2017 or December 31, 2016. The Company has the ability and intent to hold the investments until recovery of the securities' amortized cost which may be the maturity date of the securities.
For the years ended December 31, 2017, 2016 and 2015 there were no other-than-temporary charges recorded to net income.
83
(c) Realized Gains and Losses
The following table presents the gross realized gains and losses on the sale of securities available for sale for the years ended December 31, 2017, 2016 and 2015:
Year ended December 31, | |||||||||||
2017 | 2016 | 2015 | |||||||||
(In thousands) | |||||||||||
Gross realized gains | $ | 193 | $ | 1,518 | $ | 2,109 | |||||
Gross realized losses | (187 | ) | (203 | ) | (593 | ) | |||||
Net realized gains | $ | 6 | $ | 1,315 | $ | 1,516 | |||||
(d) Pledged Securities
The following table summarizes the amortized cost and fair value of investment securities available for sale that are pledged as collateral for the following obligations at December 31, 2017 and December 31, 2016:
December 31, 2017 | December 31, 2016 | ||||||||||||||
Amortized Cost | Fair Value | Amortized Cost | Fair Value | ||||||||||||
(In thousands) | |||||||||||||||
Washington and Oregon state to secure public deposits | $ | 206,377 | $ | 206,425 | $ | 214,834 | $ | 215,247 | |||||||
Repurchase agreements | 48,750 | 48,237 | 29,481 | 29,294 | |||||||||||
Other securities pledged | 12,484 | 12,498 | 3,557 | 3,546 | |||||||||||
Total | $ | 267,611 | $ | 267,160 | $ | 247,872 | $ | 248,087 | |||||||
(3) | Loans Receivable |
The Company originates loans in the ordinary course of business and has also acquired loans through FDIC-assisted and open bank transactions. Disclosures related to the Company's recorded investment in loans receivable generally exclude accrued interest receivable and net deferred fees or costs because they are insignificant.
(a) Loan Origination/Risk Management
The Company categorizes loans in one of the four segments of the total loan portfolio: commercial business, one-to-four family residential, real estate construction and land development and consumer. Within these segments are classes of loans for which management monitors and assesses credit risk in the loan portfolios. The Company has certain lending policies and procedures in place that are designed to maximize loan income within an acceptable level of risk. Management reviews and approves these policies and procedures on a regular basis. A reporting system supplements the review process by providing management with frequent reports related to loan production, loan quality, concentrations of credit, loan delinquencies and nonperforming and criticized loans. The Company also conducts internal loan reviews and validates the credit risk assessment on a periodic basis and presents the results of these reviews to management. The loan review process complements and reinforces the risk identification and assessment decisions made by loan officers and credit personnel, as well as the Company’s policies and procedures.
A discussion of the risk characteristics of each loan portfolio segment is as follows:
Commercial Business:
There are three significant classes of loans in the commercial business portfolio segment: commercial and industrial, owner-occupied commercial real estate and non-owner occupied commercial real estate. The owner and non-owner occupied commercial real estate classes are both considered commercial real estate loans. As the commercial and industrial loans carry different risk characteristics than the commercial real estate loans, they are discussed separately below.
Commercial and industrial. Commercial and industrial loans are primarily made based on the identified cash flows of the borrower and secondarily on the underlying collateral provided by the borrower. The cash flows of borrowers, however, may not be as expected and the collateral securing these loans may fluctuate in value. Most commercial and
84
industrial loans are secured by the assets being financed or other business assets such as accounts receivable or inventory and may include a personal guarantee; however, some short-term loans may be made on an unsecured basis. In the case of loans secured by accounts receivable, the availability of funds for the repayment of these loans may be substantially dependent on the ability of the borrower to collect amounts due from its customers. Commercial and industrial loans carry more risk than other loans because the borrowers’ cash flow is less predictable, and in the event of a default, the amount of loss is potentially greater and more difficult to quantify because the value of the collateral securing these loans may fluctuate, may be uncollectible, or may be obsolete or of limited use, among other things.
Commercial real estate. The Company originates commercial real estate loans primarily within its primary market areas. These loans are subject to underwriting standards and processes similar to commercial and industrial loans in that these loans are viewed primarily as cash flow loans and secondarily as loans secured by real estate properties. Commercial real estate lending typically involves higher loan principal amounts and payments on loans, and repayment is dependent on successful operation and management of the properties. The value of the real estate securing these loans can be adversely affected by conditions in the real estate market or the economy. There is little difference in risk between owner-occupied commercial real estate loans and non-owner occupied commercial real estate loans.
One-to-Four Family Residential:
The majority of the Company’s one-to-four family residential loans are secured by single-family residences located in its primary market areas. The Company’s underwriting standards require that single-family portfolio loans generally are owner-occupied and do not exceed 80% of the lower of appraised value at origination or cost of the underlying collateral. Terms of maturity typically range from 15 to 30 years. The Company sells most of its single-family loans in the secondary market and retains a smaller portion in its loan portfolio.
Real Estate Construction and Land Development:
The Company originates construction loans for one-to-four family residential and for five or more family residential and commercial properties. The one-to-four family residential construction loans generally include construction of custom homes whereby the home buyer is the borrower. The Company also provides financing to builders for the construction of pre-sold homes and, in selected cases, to builders for the construction of speculative residential property. Substantially all construction loans are short-term in nature and priced with variable rates of interest. Construction lending can involve a higher level of risk than other types of lending because funds are advanced partially based upon the value of the project, which is uncertain prior to the project’s completion. Because of the uncertainties inherent in estimating construction costs as well as the market value of a completed project and the effects of governmental regulation of real property, the Company’s estimates with regard to the total funds required to complete a project and the related loan-to-value ratio may vary from actual results. As a result, construction loans often involve the disbursement of substantial funds with repayment dependent, in part, on the success of the ultimate project and the ability of the borrower to sell or lease the property or refinance the indebtedness. If the Company’s estimate of the value of a project at completion proves to be overstated, it may have inadequate security for repayment of the loan and may incur a loss if the borrower does not repay the loan. Sources of repayment for these types of loans may be pre-committed permanent loans from approved long-term lenders, sales of developed property or an interim loan commitment from the Company until permanent financing is obtained. These loans are closely monitored by on-site inspections and are considered to have higher risks than other real estate loans due to their ultimate repayment being dependent upon successful completion of the construction project, interest rate changes, government regulation of real property, general economic conditions and the availability of long-term financing.
Consumer:
The Company originates consumer loans and lines of credit that are both secured and unsecured. The underwriting process for these loans ensures a qualifying primary and secondary source of repayment. Underwriting standards for home equity loans are significantly influenced by statutory requirements, which include, but are not limited to, a maximum loan-to-value percentage of 80%, collection remedies, the number of such loans a borrower can have at one time and documentation requirements. To monitor and manage consumer loan risk, policies and procedures are developed and modified, as needed. The majority of consumer loans are for relatively small amounts disbursed among many individual borrowers which reduces the credit risk for this type of loan. To further reduce the risk, trend reports are reviewed by management on a regular basis.
The Company also originates indirect consumer loans. These loans are for new and used automobile and recreational vehicles that are originated indirectly by selected dealers located in the Company's market areas. The Company has limited its purchase of indirect loans primarily to dealerships that are established and well-known in their market areas and to applicants that are not classified as sub-prime.
85
Loans receivable at December 31, 2017 and December 31, 2016 consisted of the following portfolio segments and classes:
December 31, 2017 | December 31, 2016 | ||||||
(In thousands) | |||||||
Commercial business: | |||||||
Commercial and industrial | $ | 645,396 | $ | 637,773 | |||
Owner-occupied commercial real estate | 622,150 | 558,035 | |||||
Non-owner occupied commercial real estate | 986,594 | 880,880 | |||||
Total commercial business | 2,254,140 | 2,076,688 | |||||
One-to-four family residential | 86,997 | 77,391 | |||||
Real estate construction and land development: | |||||||
One-to-four family residential | 51,985 | 50,414 | |||||
Five or more family residential and commercial properties | 97,499 | 108,764 | |||||
Total real estate construction and land development | 149,484 | 159,178 | |||||
Consumer | 355,091 | 325,140 | |||||
Gross loans receivable | 2,845,712 | 2,638,397 | |||||
Net deferred loan costs | 3,359 | 2,352 | |||||
Loans receivable, net | 2,849,071 | 2,640,749 | |||||
Allowance for loan losses | (32,086 | ) | (31,083 | ) | |||
Total loans receivable, net | $ | 2,816,985 | $ | 2,609,666 | |||
(b) Concentrations of Credit
Most of the Company’s lending activity occurs within its primary market areas which are concentrated along the I-5 corridor from Whatcom County to Clark County in Washington State and Multnomah County in Oregon, as well as other contiguous markets. The majority of the Company’s loan portfolio consists of (in order of balances at December 31, 2017) non-owner occupied commercial real estate, commercial and industrial and owner-occupied commercial real estate. As of December 31, 2017 and December 31, 2016, there were no concentrations of loans related to any single industry in excess of 10% of the Company’s total loans.
(c) Credit Quality Indicators
As part of the on-going monitoring of the credit quality of the Company’s loan portfolio, management tracks certain credit quality indicators including trends related to (i) the risk grade of the loans, (ii) the level of classified loans, (iii) net charge-offs, (iv) nonperforming loans and (v) the general economic conditions of the United States of America, and specifically the states of Washington and Oregon. The Company utilizes a risk grading matrix to assign a risk grade to each of its loans. Loans are graded on a scale of 1 to 10. A description of the general characteristics of the risk grades is as follows:
• | Grades 1 to 5: These grades are considered “pass grade” and include loans with negligible to above average but acceptable risk. These borrowers generally have strong to acceptable capital levels and consistent earnings and debt service capacity. Loans with the higher grades within the “pass” category may include borrowers who are experiencing unusual operating difficulties, but have acceptable payment performance to date. Increased monitoring of financial information and/or collateral may be appropriate. Loans with this grade show no immediate loss exposure. |
• | Grade 6: This grade includes "Watch" loans and is considered a “pass grade”. The grade is intended to be utilized on a temporary basis for pass grade borrowers where a potentially significant risk-modifying action is anticipated in the near term. |
• | Grade 7: This grade includes “Other Assets Especially Mentioned” (“OAEM”) loans in accordance with regulatory guidelines, and is intended to highlight loans with elevated risks. Loans with this grade show signs of deteriorating profits and capital, and the borrower might not be strong enough to sustain a major setback. The borrower is typically higher than normally leveraged, and outside support might be modest and likely illiquid. The loan is at risk of further decline unless active measures are taken to correct the situation. |
86
• | Grade 8: This grade includes “Substandard” loans in accordance with regulatory guidelines, which the Company has determined have a high credit risk. These loans also have well-defined weaknesses which make payment default or principal exposure likely, but not yet certain. The borrower may have shown serious negative trends in financial ratios and performance. Such loans may be dependent upon collateral liquidation, a secondary source of repayment or an event outside of the normal course of business. Loans with this grade can be placed on accrual or nonaccrual status based on the Company’s accrual policy. |
• | Grade 9: This grade includes “Doubtful” loans in accordance with regulatory guidelines, and the Company has determined these loans to have excessive credit risk. Such loans are placed on nonaccrual status and may be dependent upon collateral having a value that is difficult to determine or upon some near-term event which lacks certainty. Additionally, these loans generally have a specific valuation allowance or have been partially charged-off for the amount considered uncollectible. |
• | Grade 10: This grade includes “Loss” loans in accordance with regulatory guidelines, and the Company has determined these loans have the highest risk of loss. Such loans are charged-off or charged-down when payment is acknowledged to be uncertain or when the timing or value of payments cannot be determined. “Loss” is not intended to imply that the loan or some portion of it will never be paid, nor does it in any way imply that there has been a forgiveness of debt. |
Numerical loan grades for loans are established at the origination of the loan. Loan grades are reviewed on a quarterly basis, or more frequently if necessary, by the credit department. The Bank follows the FDIC’s Uniform Retail Credit Classification and Account Management Policy for subsequent classification in the event of payment delinquencies or default. Typically, an individual loan grade will not be changed from the prior period unless there is a specific indication of credit deterioration or improvement. Credit deterioration is evidenced by delinquency, direct communications with the borrower, or other borrower information that becomes known to management. Credit improvements are evidenced by known facts regarding the borrower or the collateral property.
The loan grades relate to the likelihood of losses in that the higher the grade, the greater the loss potential. Loans with a pass grade may have some estimated inherent losses, but to a lesser extent than the other loan grades. The OAEM loan grade is transitory in that the Company is waiting on additional information to determine the likelihood and extent of the potential loss. The likelihood of loss for OAEM graded loans, however, is greater than Watch graded loans because there has been measurable credit deterioration. Loans with a Substandard grade are generally loans for which the Company has individually analyzed for potential impairment. For Doubtful and Loss graded loans, the Company is almost certain of the losses, and the outstanding principal balances are generally charged-off to the realizable value.
87
The following tables present the balance of the loans receivable by credit quality indicator as of December 31, 2017 and December 31, 2016.
December 31, 2017 | |||||||||||||||||||
Pass | OAEM | Substandard | Doubtful/Loss | Total | |||||||||||||||
(In thousands) | |||||||||||||||||||
Commercial business: | |||||||||||||||||||
Commercial and industrial | $ | 597,697 | $ | 19,536 | $ | 28,163 | $ | — | $ | 645,396 | |||||||||
Owner-occupied commercial real estate | 595,455 | 12,668 | 14,027 | — | 622,150 | ||||||||||||||
Non-owner occupied commercial real estate | 955,450 | 10,494 | 20,650 | — | 986,594 | ||||||||||||||
Total commercial business | 2,148,602 | 42,698 | 62,840 | — | 2,254,140 | ||||||||||||||
One-to-four family residential | 85,762 | — | 1,235 | — | 86,997 | ||||||||||||||
Real estate construction and land development: | |||||||||||||||||||
One-to-four family residential | 49,925 | 537 | 1,523 | — | 51,985 | ||||||||||||||
Five or more family residential and commercial properties | 96,404 | 707 | 388 | — | 97,499 | ||||||||||||||
Total real estate construction and land development | 146,329 | 1,244 | 1,911 | — | 149,484 | ||||||||||||||
Consumer | 349,590 | — | 4,976 | 525 | 355,091 | ||||||||||||||
Gross loans receivable | $ | 2,730,283 | $ | 43,942 | $ | 70,962 | $ | 525 | $ | 2,845,712 | |||||||||
December 31, 2016 | |||||||||||||||||||
Pass | OAEM | Substandard | Doubtful/Loss | Total | |||||||||||||||
(In thousands) | |||||||||||||||||||
Commercial business: | |||||||||||||||||||
Commercial and industrial | $ | 601,273 | $ | 5,048 | $ | 31,452 | $ | — | $ | 637,773 | |||||||||
Owner-occupied commercial real estate | 532,585 | 4,437 | 21,013 | — | 558,035 | ||||||||||||||
Non-owner occupied commercial real estate | 841,383 | 14,573 | 24,924 | — | 880,880 | ||||||||||||||
Total commercial business | 1,975,241 | 24,058 | 77,389 | — | 2,076,688 | ||||||||||||||
One-to-four family residential | 76,020 | — | 1,371 | — | 77,391 | ||||||||||||||
Real estate construction and land development: | |||||||||||||||||||
One-to-four family residential | 44,752 | 500 | 5,162 | — | 50,414 | ||||||||||||||
Five or more family residential and commercial properties | 105,723 | 1,150 | 1,891 | — | 108,764 | ||||||||||||||
Total real estate construction and land development | 150,475 | 1,650 | 7,053 | — | 159,178 | ||||||||||||||
Consumer | 320,140 | — | 5,000 | — | 325,140 | ||||||||||||||
Gross loans receivable | $ | 2,521,876 | $ | 25,708 | $ | 90,813 | $ | — | $ | 2,638,397 | |||||||||
Potential problem loans are loans classified as OAEM or worse that are currently accruing interest and are not considered impaired, but which management is monitoring because the financial information of the borrower causes concern as to their ability to meet their loan repayment terms. Potential problem loans may include PCI loans as these loans continue to accrete loan discounts established at acquisition based on the guidance of FASB ASC 310-30. Potential problem loans as of December 31, 2017 and December 31, 2016 were $83.5 million and $87.8 million, respectively. The balance of potential problem loans guaranteed by a governmental agency, which guarantee reduces
88
the Company's credit exposure, was $3.1 million and $1.1 million as of December 31, 2017 and December 31, 2016, respectively.
(d) Nonaccrual Loans
Nonaccrual loans, segregated by segments and classes of loans, were as follows as of December 31, 2017 and December 31, 2016:
December 31, 2017 | December 31, 2016 | ||||||
(In thousands) | |||||||
Commercial business: | |||||||
Commercial and industrial | $ | 3,110 | $ | 3,531 | |||
Owner-occupied commercial real estate | 4,090 | 3,728 | |||||
Non-owner occupied commercial real estate | 1,898 | 1,321 | |||||
Total commercial business | 9,098 | 8,580 | |||||
One-to-four family residential | 81 | 94 | |||||
Real estate construction and land development: | |||||||
One-to-four family residential | 1,247 | 2,008 | |||||
Total real estate construction and land development | 1,247 | 2,008 | |||||
Consumer | 277 | 227 | |||||
Nonaccrual loans | $ | 10,703 | $ | 10,909 | |||
The Company had $1.9 million and $2.8 million of nonaccrual loans guaranteed by governmental agencies at December 31, 2017 and December 31, 2016, respectively.
PCI loans are not included in the nonaccrual loan table above because these loans are accounted for under FASB ASC 310-30, which provides that accretable yield is calculated based on a loan's expected cash flow even if the loan is not performing under its contractual terms.
(e) Past due loans
The Company performs an aging analysis of past due loans using the categories of 30-89 days past due and 90 or more days past due. This policy is consistent with regulatory reporting requirements.
The balances of past due loans, segregated by segments and classes of loans, as of December 31, 2017 and December 31, 2016 were as follows:
December 31, 2017 | |||||||||||||||||||
30-89 Days | 90 Days or Greater | Total Past Due | Current | Total | |||||||||||||||
(In thousands) | |||||||||||||||||||
Commercial business: | |||||||||||||||||||
Commercial and industrial | $ | 2,993 | $ | 1,172 | $ | 4,165 | $ | 641,231 | $ | 645,396 | |||||||||
Owner-occupied commercial real estate | 1,277 | 1,225 | 2,502 | 619,648 | 622,150 | ||||||||||||||
Non-owner occupied commercial real estate | 870 | 3,314 | 4,184 | 982,410 | 986,594 | ||||||||||||||
Total commercial business | 5,140 | 5,711 | 10,851 | 2,243,289 | 2,254,140 | ||||||||||||||
One-to-four family residential | 513 | — | 513 | 86,484 | 86,997 | ||||||||||||||
Real estate construction and land development: | |||||||||||||||||||
One-to-four family residential | 84 | 1,331 | 1,415 | 50,570 | 51,985 | ||||||||||||||
Five or more family residential and commercial properties | 40 | — | 40 | 97,459 | 97,499 | ||||||||||||||
Total real estate construction and land development | 124 | 1,331 | 1,455 | 148,029 | 149,484 | ||||||||||||||
Consumer | 1,939 | 687 | 2,626 | 352,465 | 355,091 | ||||||||||||||
Gross loans receivable | $ | 7,716 | $ | 7,729 | $ | 15,445 | $ | 2,830,267 | $ | 2,845,712 | |||||||||
89
December 31, 2016 | |||||||||||||||||||
30-89 Days | 90 Days or Greater | Total Past Due | Current | Total | |||||||||||||||
(In thousands) | |||||||||||||||||||
Commercial business: | |||||||||||||||||||
Commercial and industrial | $ | 2,687 | $ | 1,733 | $ | 4,420 | $ | 633,353 | $ | 637,773 | |||||||||
Owner-occupied commercial real estate | 1,807 | 2,915 | 4,722 | 553,313 | 558,035 | ||||||||||||||
Non-owner occupied commercial real estate | 733 | — | 733 | 880,147 | 880,880 | ||||||||||||||
Total commercial business | 5,227 | 4,648 | 9,875 | 2,066,813 | 2,076,688 | ||||||||||||||
One-to-four family residential | 523 | — | 523 | 76,868 | 77,391 | ||||||||||||||
Real estate construction and land development: | |||||||||||||||||||
One-to-four family residential | 90 | 2,008 | 2,098 | 48,316 | 50,414 | ||||||||||||||
Five or more family residential and commercial properties | — | 377 | 377 | 108,387 | 108,764 | ||||||||||||||
Total real estate construction and land development | 90 | 2,385 | 2,475 | 156,703 | 159,178 | ||||||||||||||
Consumer | 2,292 | 105 | 2,397 | 322,743 | 325,140 | ||||||||||||||
Gross loans receivable | $ | 8,132 | $ | 7,138 | $ | 15,270 | $ | 2,623,127 | $ | 2,638,397 | |||||||||
There were no loans 90 days or more past due that were still accruing interest as of December 31, 2017 or 2016, excluding PCI loans.
(f) Impaired loans
Impaired loans include nonaccrual loans and performing TDR loans. The balances of impaired loans as of December 31, 2017 and December 31, 2016 are set forth in the following tables.
December 31, 2017 | |||||||||||||||||||
Recorded Investment With No Specific Valuation Allowance | Recorded Investment With Specific Valuation Allowance | Total Recorded Investment | Unpaid Contractual Principal Balance | Related Specific Valuation Allowance | |||||||||||||||
(In thousands) | |||||||||||||||||||
Commercial business: | |||||||||||||||||||
Commercial and industrial | $ | 2,127 | $ | 9,872 | $ | 11,999 | $ | 12,489 | $ | 1,326 | |||||||||
Owner-occupied commercial real estate | 2,452 | 4,356 | 6,808 | 7,054 | 621 | ||||||||||||||
Non-owner occupied commercial real estate | 4,722 | 11,297 | 16,019 | 16,172 | 1,222 | ||||||||||||||
Total commercial business | 9,301 | 25,525 | 34,826 | 35,715 | 3,169 | ||||||||||||||
One-to-four family residential | — | 299 | 299 | 308 | 93 | ||||||||||||||
Real estate construction and land development: | |||||||||||||||||||
One-to-four family residential | 938 | 309 | 1,247 | 2,200 | 2 | ||||||||||||||
Five or more family residential and commercial properties | — | 645 | 645 | 645 | 37 | ||||||||||||||
Total real estate construction and land development | 938 | 954 | 1,892 | 2,845 | 39 | ||||||||||||||
Consumer | 160 | 282 | 442 | 466 | 54 | ||||||||||||||
Total | $ | 10,399 | $ | 27,060 | $ | 37,459 | $ | 39,334 | $ | 3,355 | |||||||||
90
December 31, 2016 | |||||||||||||||||||
Recorded Investment With No Specific Valuation Allowance | Recorded Investment With Specific Valuation Allowance | Total Recorded Investment | Unpaid Contractual Principal Balance | Related Specific Valuation Allowance | |||||||||||||||
(In thousands) | |||||||||||||||||||
Commercial business: | |||||||||||||||||||
Commercial and industrial | $ | 1,739 | $ | 10,636 | $ | 12,375 | $ | 13,249 | $ | 1,199 | |||||||||
Owner-occupied commercial real estate | 1,150 | 3,574 | 4,724 | 5,107 | 511 | ||||||||||||||
Non-owner occupied commercial real estate | 4,905 | 6,413 | 11,318 | 11,386 | 797 | ||||||||||||||
Total commercial business | 7,794 | 20,623 | 28,417 | 29,742 | 2,507 | ||||||||||||||
One-to-four family residential | — | 321 | 321 | 325 | 97 | ||||||||||||||
Real estate construction and land development: | |||||||||||||||||||
One-to-four family residential | 2,243 | 828 | 3,071 | 3,755 | 6 | ||||||||||||||
Five or more family residential and commercial properties | — | 1,079 | 1,079 | 1,079 | 60 | ||||||||||||||
Total real estate construction and land development | 2,243 | 1,907 | 4,150 | 4,834 | 66 | ||||||||||||||
Consumer | 48 | 262 | 310 | 325 | 64 | ||||||||||||||
Total | $ | 10,085 | $ | 23,113 | $ | 33,198 | $ | 35,226 | $ | 2,734 | |||||||||
The Company had governmental guarantees of $3.2 million and $3.5 million related to the impaired loan balances at December 31, 2017 and December 31, 2016, respectively.
The average recorded investment of impaired loans for the years ended December 31, 2017, 2016 and 2015 are set forth in the following table.
Year Ended December 31, | |||||||||||
2017 | 2016 | 2015 | |||||||||
(In thousands) | |||||||||||
Commercial business: | |||||||||||
Commercial and industrial | $ | 11,310 | $ | 10,207 | $ | 9,781 | |||||
Owner-occupied commercial real estate | 5,401 | 4,540 | 4,346 | ||||||||
Non-owner occupied commercial real estate | 12,162 | 11,709 | 9,257 | ||||||||
Total commercial business | 28,873 | 26,456 | 23,384 | ||||||||
One-to-four family residential | 309 | 279 | 257 | ||||||||
Real estate construction and land development: | |||||||||||
One-to-four family residential | 2,315 | 3,305 | 3,841 | ||||||||
Five or more family residential and commercial properties | 903 | 1,656 | 2,008 | ||||||||
Total real estate construction and land development | 3,218 | 4,961 | 5,849 | ||||||||
Consumer | 351 | 645 | 171 | ||||||||
Total | $ | 32,751 | $ | 32,341 | $ | 29,661 | |||||
For the years ended December 31, 2017, 2016 and 2015 no interest income was recognized subsequent to a loan’s classification as nonaccrual. For the years ended December 31, 2017, 2016 and 2015, the Bank recorded $1.2 million, $651,000 and $780,000, respectively, of interest income related to performing TDR loans.
91
(g) Troubled Debt Restructured Loans
A TDR loan is a restructuring in which the Bank, for economic or legal reasons related to a borrower’s financial difficulties, grants a concession to the borrower that it would not otherwise consider. TDR loans are considered impaired and are separately measured for impairment under FASB ASC 310-10-35, whether on accrual ("performing") or nonaccrual ("nonperforming") status. The Company has more stringent definitions of concessions and impairment measures for PCI loans as these loans have known credit deterioration and are generally accreting income at a lower discounted rate as compared to the contractual note rate based on the guidance of FASB ASC 310-30.
The majority of the Bank’s TDR loans are a result of granting extensions of maturity on troubled credits which have already been adversely classified. The Bank grants such extensions to reassess the borrower’s financial status and to develop a plan for repayment. The second most prevalent concessions are certain modifications with extensions that also include interest rate reductions. Certain TDR loans were additionally re-amortized over a longer period of time. These modifications would all be considered a concession for a borrower that could not obtain similar financing terms from another source other than from the Bank.
The financial effects of each modification will vary based on the specific restructure. For the majority of the Bank’s TDR loans, the loans were interest-only with a balloon payment at maturity. If the interest rate is not adjusted and the modified terms are consistent with other similar credits being offered, the Bank may not experience any loss associated with the restructure. If, however, the restructure involves forbearance agreements or interest rate modifications, the Bank may not collect all the principal and interest based on the original contractual terms. The Bank estimates the necessary allowance for loan losses on TDR loans using the same guidance as used for other impaired loans.
The recorded investment balance and related allowance for loan losses of performing and nonaccrual TDR loans as of December 31, 2017 and December 31, 2016 were as follows:
December 31, 2017 | December 31, 2016 | ||||||||||||||
Performing TDR Loans | Nonaccrual TDR Loans | Performing TDR Loans | Nonaccrual TDR Loans | ||||||||||||
(In thousands) | |||||||||||||||
TDR loans | $ | 26,757 | $ | 5,193 | $ | 22,288 | $ | 6,900 | |||||||
Allowance for loan losses on TDR loans | 2,635 | 379 | 1,965 | 437 | |||||||||||
The unfunded commitment to borrowers related to TDR loans was $1.2 million and $249,000 at December 31, 2017 and December 31, 2016, respectively.
92
Loans that were modified as TDR loans during the years ended December 31, 2017, 2016 and 2015 are set forth in the following table:
Year Ended December 31, | ||||||||||||||||||||
2017 | 2016 | 2015 | ||||||||||||||||||
Number of Contracts (1) | Outstanding Principal Balance(1)(2) | Number of Contracts (1) | Outstanding Principal Balance(1)(2) | Number of Contracts (1) | Outstanding Principal Balance(1)(2) | |||||||||||||||
(Dollars in thousands) | ||||||||||||||||||||
Commercial business: | ||||||||||||||||||||
Commercial and industrial | 19 | $ | 7,212 | 19 | $ | 7,398 | 25 | $ | 6,312 | |||||||||||
Owner-occupied commercial real estate | 3 | 1,366 | 2 | 569 | 4 | 1,311 | ||||||||||||||
Non-owner occupied commercial real estate | 4 | 9,574 | 2 | 2,121 | 4 | 7,496 | ||||||||||||||
Total commercial business | 26 | 18,152 | 23 | 10,088 | 33 | 15,119 | ||||||||||||||
Real estate construction and land development: | ||||||||||||||||||||
One-to-four family residential | 2 | 938 | 5 | 2,206 | 4 | 2,291 | ||||||||||||||
Five or more family residential and commercial properties | — | — | 1 | 1,078 | — | — | ||||||||||||||
Total real estate construction and land development | 2 | 938 | 6 | 3,284 | 4 | 2,291 | ||||||||||||||
Consumer | 8 | 110 | 6 | 66 | 1 | 37 | ||||||||||||||
Total TDR loans | 36 | $ | 19,200 | 35 | $ | 13,438 | 38 | $ | 17,447 | |||||||||||
(1) Number of contracts and outstanding principal balance represent loans which have balances as of period end as certain loans may have been paid-down or charged-off during the years ended December 31, 2017, 2016 and 2015.
(2) Includes subsequent payments after modifications and reflects the balance as of period end. As the Bank did not forgive any principal or interest balance as part of the loan modification, the Bank’s recorded investment in each loan at the date of modification (pre-modification) did not change as a result of the modification (post-modification), except when the modification was the initial advance on a one-to-four family residential real estate construction and land development loan under a master guidance line. There were no advances on these types of loans during the years ended December 31, 2017, 2016 and 2015.
Of the 36 loans modified during the year ended December 31, 2017, 21 loans with a total outstanding principal balance of $12.1 million had no prior modifications. The remaining loans included in the table above for the year ended December 31, 2017 were previously reported as TDR loans. The Bank typically grants shorter extension periods to continually monitor the TDR loans despite the fact that the extended date might not be the date the Bank expects sufficient cash flow from these borrowers. The Bank does not consider these modifications a subsequent default of a TDR as new loan terms, specifically new maturity dates, were granted. The potential losses related to these loans would have been considered in the period the loan was first reported as a TDR loan and are adjusted, as necessary, in the current period based on more recent information. The related specific valuation allowance at December 31, 2017 was $1.8 million for loans that were modified as TDR loans during the year ended December 31, 2017.
Of the 35 loans modified during the year ended December 31, 2016, 17 loans with a total outstanding principal balance of $7.2 million had no prior modifications. Of the 38 loans modified during the year ended December 31, 2015, 18 loans with a total outstanding principal balance of $7.0 million had no prior modifications. Similar to the year ended December 31, 2017 discussion above, the majority of the modifications in prior periods was the result of the Bank granting shorter extension periods to continually monitor the troubled credits, which resulted in TDR classification. The related specific valuation allowance for loans that were modified as TDR loans during the years ended December 31, 2016 and 2015 was $1.0 million and $1.7 million, respectively.
93
The loans modified during the previous twelve months that subsequently defaulted during the years ended December 31, 2017, 2016 and 2015 are included in the following table:
Year Ended December 31, | ||||||||||||||||||||
2017 | 2016 | 2015 | ||||||||||||||||||
Number of Contracts | Outstanding Principal Balance | Number of Contracts | Outstanding Principal Balance | Number of Contracts | Outstanding Principal Balance | |||||||||||||||
(Dollars in thousands) | ||||||||||||||||||||
Commercial business: | ||||||||||||||||||||
Commercial and industrial | 1 | $ | 283 | — | $ | — | 2 | $ | 1,755 | |||||||||||
Owner-occupied commercial real estate | 1 | 80 | 1 | 488 | — | — | ||||||||||||||
Total commercial business | 2 | 363 | 1 | 488 | 2 | 1755 | ||||||||||||||
Real estate construction and land development: | ||||||||||||||||||||
One-to-four family residential | 2 | 938 | 2 | 1,143 | — | — | ||||||||||||||
Total real estate construction and land development | 2 | 938 | 2 | 1,143 | — | — | ||||||||||||||
Consumer | 1 | 7 | — | — | — | — | ||||||||||||||
Total | 5 | $ | 1,308 | 3 | $ | 1,631 | 2 | $ | 1,755 | |||||||||||
During the year ended December 31, 2017, there were four loans that defaulted because they were past their modified maturity dates, and the borrowers have not subsequently repaid the credits. The Bank has chosen not to extend the maturities on these loans. The one consumer loan defaulted during the year ended December 31, 2017 as it was greater than 90 days past due its modified terms, but the loan became current as of December 31, 2017. The Bank had a specific valuation allowance of $1,000 at December 31, 2017 related to the credits which defaulted during the year ended December 31, 2017.
During the year ended December 31, 2016, all three loans defaulted because they were past their modified maturity dates, and the borrowers had not repaid the credits. At December 31, 2016, the Bank was in the process of granting addition extensions on these loans. At December 31, 2015, there was one commercial and industrial loan totaling $1.7 million that was modified during the previous twelve months and subsequently defaulted because the borrower did not make specific curtailment, or additional, payments on the loan during the year. The borrower was 30-89 days past due as of December 31, 2015. The other commercial and industrial loan included in the above table that defaulted during the year ended December 31, 2015 defaulted because the borrower was past its modified maturity date, and had not repaid the credits. The Bank had a specific valuation allowance of $111,000 and $191,000 at December 31, 2016 and 2015, respectively, related to the credits which defaulted during the related year ends.
(h) Purchased Credit Impaired Loans
The Company acquired loans and designated them as PCI loans, which are accounted for under FASB ASC 310-30.
94
The following table reflects the outstanding principal balance and recorded investment of the PCI loans at December 31, 2017 and December 31, 2016:
December 31, 2017 | December 31, 2016 | ||||||||||||||
Outstanding Principal | Recorded Investment | Outstanding Principal | Recorded Investment | ||||||||||||
(In thousands) | |||||||||||||||
Commercial business: | |||||||||||||||
Commercial and industrial | $ | 8,818 | $ | 2,912 | $ | 13,067 | $ | 9,317 | |||||||
Owner-occupied commercial real estate | 12,230 | 11,515 | 17,639 | 15,973 | |||||||||||
Non-owner occupied commercial real estate | 14,295 | 13,342 | 25,037 | 23,360 | |||||||||||
Total commercial business | 35,343 | 27,769 | 55,743 | 48,650 | |||||||||||
One-to-four family residential | 4,120 | 5,255 | 5,120 | 4,905 | |||||||||||
Real estate construction and land development: | |||||||||||||||
One-to-four family residential | 841 | 89 | 2,958 | 2,123 | |||||||||||
Five or more family residential and commercial properties | 2,361 | 2,035 | 2,614 | 2,488 | |||||||||||
Total real estate construction and land development | 3,202 | 2,124 | 5,572 | 4,611 | |||||||||||
Consumer | 3,974 | 5,455 | 5,296 | 6,282 | |||||||||||
Gross PCI loans | $ | 46,639 | $ | 40,603 | $ | 71,731 | $ | 64,448 | |||||||
On the acquisition dates, the amount by which the undiscounted expected cash flows of the PCI loans exceeded the estimated fair value of the loan is the “accretable yield.” The accretable yield is then measured at each financial reporting date and represents the difference between the remaining undiscounted expected cash flows and the current carrying value of the PCI loans.
The following table summarizes the accretable yield on the PCI loans for the years ended December 31, 2017, 2016 and 2015.
Year Ended December 31, | ||||||||||||
2017 | 2016 | 2015 | ||||||||||
(In thousands) | ||||||||||||
Balance at the beginning of the year | $ | 13,860 | $ | 17,592 | $ | 21,092 | ||||||
Accretion | (3,471 | ) | (4,962 | ) | (6,993 | ) | ||||||
Disposal and other | (2,758 | ) | (3,329 | ) | (3,111 | ) | ||||||
Change in accretable yield | 3,593 | 4,559 | 6,604 | |||||||||
Balance at the end of the year | $ | 11,224 | $ | 13,860 | $ | 17,592 | ||||||
95
(i) Related Party Loans
In the ordinary course of business, the Company has granted loans to certain directors, executive officers and their affiliates (collectively referred to as “related parties”).
Activity in related party loans for the years ended December 31, 2017, 2016 and 2015 was as follows:
Year Ended or As of December 31, | ||||
(in thousands) | ||||
Balance outstanding at December 31, 2014 | $ | 9,164 | ||
Principal additions | 12,189 | |||
Principal reductions | (578 | ) | ||
Balance outstanding at December 31, 2015 | 20,775 | |||
Principal additions | 738 | |||
Principal reductions | (1,596 | ) | ||
Balance outstanding at December 31, 2016 | 19,917 | |||
Elimination of outstanding loan balance due to change in related party status | (10,930 | ) | ||
Principal additions | — | |||
Principal reductions | (527 | ) | ||
Balance outstanding at December 31, 2017 | $ | 8,460 | ||
The Company had $750,000 and $891,000 of unfunded commitments to related parties as of December 31, 2017 and 2016, respectively. The Company did not have any borrowings from related parties at December 31, 2017 or 2016.
(j) Mortgage Banking Activities
The Bank originates certain one-to-four family residential loans to be sold on the secondary market. The Bank does not retain servicing on loans sold in the secondary market. At December 31, 2017 and 2016, the balance of loans held for sale was $2.3 million and $11.7 million, respectively.
The following table presents information concerning the origination and sale of the Bank's one-to-four family residential loans and the gains from the sale of loans as a result of the Bank's mortgage banking activities.
Year Ended December 31, | ||||||||||||
2017 | 2016 | 2015 | ||||||||||
(In thousands) | ||||||||||||
One-to-four family residential loans: | ||||||||||||
Originated (1) | $ | 144,066 | $ | 178,169 | $ | 164,974 | ||||||
Sold | 113,786 | 141,127 | 132,365 | |||||||||
Gains on sales of loans, net (2) | 3,412 | 3,723 | 3,150 | |||||||||
(1) Includes loans originated for sale in the secondary market or for the Bank's loan portfolio.
(2) Excludes net gains on sales of SBA and other loans.
96
The Bank may additionally make commitments to fund one-to-four family residential loans (interest rate locks) to be sold into the secondary market. The contractual amounts of commitments to sell and fund with off-balance sheet risk at December 31, 2017 and 2016 were as follows:
December 31, 2017 | December 31, 2016 | |||||||
(In thousands) | ||||||||
Commitments to sell mortgage loans | $ | 10,140 | $ | 18,166 | ||||
Commitments to fund mortgage loans (at interest rates approximating market rates) for portfolio or for sale: | ||||||||
Fixed rate | $ | 10,894 | $ | 19,301 | ||||
Variable or adjustable rate | 56 | 4,189 | ||||||
Total commitments to fund mortgage loans | $ | 10,950 | $ | 23,490 | ||||
The fair values of freestanding derivatives related to the commitments to fund mortgage loans and sell at locked interest rates were not significant at December 31, 2017 or 2016.
(k) SBA Loan Sales
The Company may choose to sell the conditionally guaranteed portion of certain loans guaranteed by the Small Business Administration or the U.S. Department of Agriculture (collectively referred to as "SBA loans") and retain a participating interest in the unguaranteed portion of the loans and the servicing of the loans. The retained unguaranteed portions of these loans are carried at cost net of discounts related to accounting for the sold and retained portions of the loans using the allocation of their carrying amounts based on their relative fair values. The Company does not sell SBA loans with servicing retained unless it retains a participating interest. Details of certain SBA loans serviced are as follows:
December 31, 2017 | December 31, 2016 | |||||||
(In thousands) | ||||||||
SBA loans serviced for others with participating interest, gross loan balance | $ | 53,809 | $ | 48,359 | ||||
SBA loans serviced for others with participating interest, participation balance owned by Bank (1) | 12,394 | 11,218 | ||||||
(1) Included in the balances of total loans receivable, net on the Company's Consolidated Statements of Financial Condition.
The Company recognized $467,000, $460,000 and $392,000 of servicing fee income and fees from SBA loans serviced for others for the years ended December 31, 2017, 2016 and 2015, respectively. Servicing fee income is reported in other income on the Company's Consolidated Statements of Income.
(4) | Allowance for Loan Losses |
The allowance for loan losses is maintained at a level deemed appropriate by management to provide for probable incurred credit losses in the loan portfolio.
The FDIC shared-loss agreements terminated on August 4, 2015. Prior to their termination, when a credit deterioration occurred subsequent to the acquisition to a loan that was covered by the FDIC shared-loss agreements, a provision for loan losses was charged to earnings for the full amount of the impairment, without regard to the coverage of the FDIC shared-loss agreements.
97
A summary of the changes in the allowance for loan losses during the years ended December 31, 2017, 2016 and 2015 is as follows:
Year Ended December 31, | |||||||||||
2017 | 2016 | 2015 | |||||||||
(In thousands) | |||||||||||
Balance at the beginning of the year | $ | 31,083 | $ | 29,746 | $ | 27,729 | |||||
Charge-offs | (4,838 | ) | (6,085 | ) | (3,482 | ) | |||||
Recoveries of loans previously charged-off | 1,621 | 2,491 | 1,127 | ||||||||
Provision for loan losses | 4,220 | 4,931 | 4,372 | ||||||||
Balance at the end of the year | $ | 32,086 | $ | 31,083 | $ | 29,746 | |||||
The following table details the activity in the allowance for loan losses disaggregated by segment and class for the year ended December 31, 2017:
Balance at Beginning of Year | Charge-offs | Recoveries | Provision for Loan Losses | Balance at End of Year | |||||||||||||||
(In thousands) | |||||||||||||||||||
Commercial business: | |||||||||||||||||||
Commercial and industrial | $ | 10,968 | $ | (859 | ) | $ | 792 | $ | (991 | ) | $ | 9,910 | |||||||
Owner-occupied commercial real estate | 3,661 | (1,579 | ) | 155 | 1,755 | 3,992 | |||||||||||||
Non-owner occupied commercial real estate | 7,753 | — | — | 344 | 8,097 | ||||||||||||||
Total commercial business | 22,382 | (2,438 | ) | 947 | 1,108 | 21,999 | |||||||||||||
One-to-four family residential | 1,015 | (30 | ) | 2 | 69 | 1,056 | |||||||||||||
Real estate construction and land development: | |||||||||||||||||||
One-to-four family residential | 797 | (556 | ) | 202 | 419 | 862 | |||||||||||||
Five or more family residential and commercial properties | 1,359 | — | — | (169 | ) | 1,190 | |||||||||||||
Total real estate construction and land development | 2,156 | (556 | ) | 202 | 250 | 2,052 | |||||||||||||
Consumer | 5,024 | (1,814 | ) | 470 | 2,401 | 6,081 | |||||||||||||
Unallocated | 506 | — | — | 392 | 898 | ||||||||||||||
Total | $ | 31,083 | $ | (4,838 | ) | $ | 1,621 | $ | 4,220 | $ | 32,086 | ||||||||
98
The following table details the allowance for loan losses disaggregated on the basis of the Company's impairment method as of December 31, 2017.
Loans Individually Evaluated for Impairment | Loans Collectively Evaluated for Impairment | PCI Loans | Total Allowance for Loan Losses | ||||||||||||
(In thousands) | |||||||||||||||
Commercial business: | |||||||||||||||
Commercial and industrial | $ | 1,326 | $ | 7,558 | $ | 1,026 | $ | 9,910 | |||||||
Owner-occupied commercial real estate | 621 | 2,557 | 814 | 3,992 | |||||||||||
Non-owner occupied commercial real estate | 1,222 | 5,919 | 956 | 8,097 | |||||||||||
Total commercial business | 3,169 | 16,034 | 2,796 | 21,999 | |||||||||||
One-to-four family residential | 93 | 798 | 165 | 1,056 | |||||||||||
Real estate construction and land development: | |||||||||||||||
One-to-four family residential | 2 | 635 | 225 | 862 | |||||||||||
Five or more family residential and commercial properties | 37 | 1,064 | 89 | 1,190 | |||||||||||
Total real estate construction and land development | 39 | 1,699 | 314 | 2,052 | |||||||||||
Consumer | 54 | 5,303 | 724 | 6,081 | |||||||||||
Unallocated | — | 898 | — | 898 | |||||||||||
Total | $ | 3,355 | $ | 24,732 | $ | 3,999 | $ | 32,086 | |||||||
The following table details the recorded investment balance of the loan receivables disaggregated on the basis of the Company’s impairment method as of December 31, 2017:
Loans Individually Evaluated for Impairment | Loans Collectively Evaluated for Impairment | PCI Loans | Total Gross Loans Receivable | ||||||||||||
(In thousands) | |||||||||||||||
Commercial business: | |||||||||||||||
Commercial and industrial | $ | 11,999 | $ | 630,485 | $ | 2,912 | $ | 645,396 | |||||||
Owner-occupied commercial real estate | 6,808 | 603,827 | 11,515 | 622,150 | |||||||||||
Non-owner occupied commercial real estate | 16,019 | 957,233 | 13,342 | 986,594 | |||||||||||
Total commercial business | 34,826 | 2,191,545 | 27,769 | 2,254,140 | |||||||||||
One-to-four family residential | 299 | 81,443 | 5,255 | 86,997 | |||||||||||
Real estate construction and land development: | |||||||||||||||
One-to-four family residential | 1,247 | 50,649 | 89 | 51,985 | |||||||||||
Five or more family residential and commercial properties | 645 | 94,819 | 2,035 | 97,499 | |||||||||||
Total real estate construction and land development | 1,892 | 145,468 | 2,124 | 149,484 | |||||||||||
Consumer | 442 | 349,194 | 5,455 | 355,091 | |||||||||||
Total | $ | 37,459 | $ | 2,767,650 | $ | 40,603 | $ | 2,845,712 | |||||||
99
The following table details the activity in the allowance for loan losses disaggregated by segment and class for the year ended December 31, 2016:
Balance at Beginning of Year | Charge-offs | Recoveries | Provision for Loan Losses | Balance at End of Year | |||||||||||||||
(In thousands) | |||||||||||||||||||
Commercial business: | |||||||||||||||||||
Commercial and industrial | $ | 9,972 | $ | (3,265 | ) | $ | 1,844 | $ | 2,417 | $ | 10,968 | ||||||||
Owner-occupied commercial real estate | 4,370 | (538 | ) | — | (171 | ) | 3,661 | ||||||||||||
Non-owner occupied commercial real estate | 7,722 | (350 | ) | — | 381 | 7,753 | |||||||||||||
Total commercial business | 22,064 | (4,153 | ) | 1,844 | 2,627 | 22,382 | |||||||||||||
One-to-four family residential | 1,157 | — | 2 | (144 | ) | 1,015 | |||||||||||||
Real estate construction and land development: | |||||||||||||||||||
One-to-four family residential | 1,058 | (100 | ) | 83 | (244 | ) | 797 | ||||||||||||
Five or more family residential and commercial properties | 813 | (54 | ) | — | 600 | 1,359 | |||||||||||||
Total real estate construction and land development | 1,871 | (154 | ) | 83 | 356 | 2,156 | |||||||||||||
Consumer | 4,309 | (1,778 | ) | 562 | 1,931 | 5,024 | |||||||||||||
Unallocated | 345 | — | — | 161 | 506 | ||||||||||||||
Total | $ | 29,746 | $ | (6,085 | ) | $ | 2,491 | $ | 4,931 | $ | 31,083 | ||||||||
The following table details the allowance for loan losses disaggregated on the basis of the Company's impairment method as of December 31, 2016:
Loans Individually Evaluated for Impairment | Loans Collectively Evaluated for Impairment | PCI Loans | Total Allowance for Loan Losses | ||||||||||||
(In thousands) | |||||||||||||||
Commercial business: | |||||||||||||||
Commercial and industrial | $ | 1,199 | $ | 8,048 | $ | 1,721 | $ | 10,968 | |||||||
Owner-occupied commercial real estate | 511 | 1,834 | 1,316 | 3,661 | |||||||||||
Non-owner occupied commercial real estate | 797 | 5,142 | 1,814 | 7,753 | |||||||||||
Total commercial business | 2,507 | 15,024 | 4,851 | 22,382 | |||||||||||
One-to-four family residential | 97 | 643 | 275 | 1,015 | |||||||||||
Real estate construction and land development: | |||||||||||||||
One-to-four family residential | 6 | 538 | 253 | 797 | |||||||||||
Five or more family residential and commercial properties | 60 | 1,168 | 131 | 1,359 | |||||||||||
Total real estate construction and land development | 66 | 1,706 | 384 | 2,156 | |||||||||||
Consumer | 64 | 3,912 | 1,048 | 5,024 | |||||||||||
Unallocated | — | 506 | — | 506 | |||||||||||
Total | $ | 2,734 | $ | 21,791 | $ | 6,558 | $ | 31,083 | |||||||
100
The following table details the recorded investment balance of the loan receivables disaggregated on the basis of the Company’s impairment method as of December 31, 2016:
Loans Individually Evaluated for Impairment | Loans Collectively Evaluated for Impairment | PCI Loans | Total Gross Loans Receivable | ||||||||||||
(In thousands) | |||||||||||||||
Commercial business: | |||||||||||||||
Commercial and industrial | $ | 12,375 | $ | 616,081 | $ | 9,317 | $ | 637,773 | |||||||
Owner-occupied commercial real estate | 4,724 | 537,338 | 15,973 | 558,035 | |||||||||||
Non-owner occupied commercial real estate | 11,318 | 846,202 | 23,360 | 880,880 | |||||||||||
Total commercial business | 28,417 | 1,999,621 | 48,650 | 2,076,688 | |||||||||||
One-to-four family residential | 321 | 72,165 | 4,905 | 77,391 | |||||||||||
Real estate construction and land development: | |||||||||||||||
One-to-four family residential | 3,071 | 45,220 | 2,123 | 50,414 | |||||||||||
Five or more family residential and commercial properties | 1,079 | 105,197 | 2,488 | 108,764 | |||||||||||
Total real estate construction and land development | 4,150 | 150,417 | 4,611 | 159,178 | |||||||||||
Consumer | 310 | 318,548 | 6,282 | 325,140 | |||||||||||
Total | $ | 33,198 | $ | 2,540,751 | $ | 64,448 | $ | 2,638,397 | |||||||
The following table details the activity in the allowance for loan losses disaggregated by segment and class for the year ended December 31, 2015:
Balance at Beginning of Year | Charge-offs | Recoveries | Provision for Loan Losses | Balance at End of Year | |||||||||||||||
(In thousands) | |||||||||||||||||||
Commercial business: | |||||||||||||||||||
Commercial and industrial | $ | 10,553 | $ | (1,488 | ) | $ | 476 | $ | 431 | $ | 9,972 | ||||||||
Owner-occupied commercial real estate | 4,032 | — | — | 338 | 4,370 | ||||||||||||||
Non-owner occupied commercial real estate | 5,601 | (188 | ) | — | 2,309 | 7,722 | |||||||||||||
Total commercial business | 20,186 | (1,676 | ) | 476 | 3,078 | 22,064 | |||||||||||||
One-to-four family residential | 1,200 | — | 13 | (56 | ) | 1,157 | |||||||||||||
Real estate construction and land development: | |||||||||||||||||||
One-to-four family residential | 1,786 | (106 | ) | 100 | (722 | ) | 1,058 | ||||||||||||
Five or more family residential and commercial properties | 972 | — | — | (159 | ) | 813 | |||||||||||||
Total real estate construction and land development | 2,758 | (106 | ) | 100 | (881 | ) | 1,871 | ||||||||||||
Consumer | 2,769 | (1,700 | ) | 538 | 2,702 | 4,309 | |||||||||||||
Unallocated | 816 | — | — | (471 | ) | 345 | |||||||||||||
Total | $ | 27,729 | $ | (3,482 | ) | $ | 1,127 | $ | 4,372 | $ | 29,746 | ||||||||
101
(5) | FDIC Indemnification Asset |
On August 4, 2015, the Bank and the FDIC entered into an agreement terminating the FDIC shared-loss agreements for all three of the FDIC-assisted acquisitions (Cowlitz Bank and Washington Banking Company's acquisitions of City Bank and North County Bank). The Bank paid consideration of $7.1 million to the FDIC for the termination of the shared-loss agreements related to these acquisitions. The termination of the shared-loss agreements resulted in a pre-tax gain of $1.7 million and the elimination of the FDIC indemnification asset and the FDIC clawback liability (included in “accrued expenses and other liabilities” in the Consolidated Statements of Financial Condition) which was recorded as of the termination date. The FDIC indemnification asset and FDIC clawback liability amounts were $388,000 and $9.3 million, respectively, as of June 30, 2015. All rights and obligations of the parties under the FDIC shared-loss agreements, including the clawback provisions, were eliminated under the termination agreement. It is not anticipated that the termination of the FDIC shared-loss agreements will have any impact on the yields for the loans that were previously covered under these agreements. All future charge-offs, recoveries, gains, losses and expenses related to previously covered assets will now be recognized entirely by the Bank since the FDIC will no longer be sharing in such charge-offs, recoveries, gains, losses and expenses.
The following table provides changes in the FDIC indemnification asset during the year ended December 31, 2015. The years ended December 31, 2017 and 2016 are not included because of the above-mentioned termination.
Year Ended December 31, | |||
2015 | |||
(In thousands) | |||
Balance at the beginning of the year | $ | 1,116 | |
Cash payments received or receivable from the FDIC | (231 | ) | |
FDIC share of additional estimated gains | (352 | ) | |
Net amortization | (145 | ) | |
Change due to termination of FDIC shared-loss agreements | (388 | ) | |
Balance at the end of the year | $ | — | |
(6) | Other Real Estate Owned |
Changes in other real estate owned during the years ended December 31, 2017, 2016 and 2015 were as follows:
Year Ended December 31, | |||||||||||
2017 | 2016 | 2015 | |||||||||
(In thousands | |||||||||||
Balance at the beginning of the year | $ | 754 | $ | 2,019 | $ | 3,355 | |||||
Additions | 32 | 1,431 | 2,845 | ||||||||
Proceeds from dispositions | (930 | ) | (2,486 | ) | (3,555 | ) | |||||
Gain (loss) on sales, net | 144 | 173 | (97 | ) | |||||||
Valuation adjustment | — | (383 | ) | (529 | ) | ||||||
Balance at the end of the year | $ | — | $ | 754 | $ | 2,019 | |||||
At December 31, 2017, there was no other real estate owned that was the result of foreclosure and obtaining physical possession of residential real estate properties . At December 31, 2017, the recorded investment of consumer mortgage loans secured by residential real estate properties (included in the one-to-four family residential loan class in Note (3) Loans Receivable) for which formal foreclosure proceedings were in process was $660,000.
102
(7) Premises and Equipment
A summary of premises and equipment is as follows:
December 31, 2017 | December 31, 2016 | |||||||
(In thousands) | ||||||||
Land | $ | 21,483 | $ | 22,677 | ||||
Buildings and building improvements | 50,984 | 52,432 | ||||||
Furniture, fixtures and equipment | 20,894 | 18,723 | ||||||
Total premises and equipment | 93,361 | 93,832 | ||||||
Accumulated depreciation | 33,036 | 29,921 | ||||||
Premises and equipment, net | $ | 60,325 | $ | 63,911 | ||||
Total depreciation expense on premises and equipment was $3.9 million, $3.9 million and $4.0 million for the years ended December 31, 2017, 2016 and 2015, respectively.
(8) | Goodwill and Other Intangible Assets |
(a) Goodwill
The Company’s goodwill represents the excess of the purchase price over the fair value of net assets acquired in the Washington Banking Merger on May 1, 2014, and the acquisitions of Valley Community Bancshares on July 15, 2013, Western Washington Bancorp in 2006 and North Pacific Bank in 1998. The Company’s goodwill is assigned to the Bank and is evaluated for impairment at the Bank level (reporting unit).
There were no additions to goodwill during the years ended December 31, 2017, 2016 and 2015.
At December 31, 2017, the Company’s step-one analysis concluded that the reporting unit’s fair value was greater than its carrying value and therefore no goodwill impairment charges were required, or recorded, for the year ended December 31, 2017. Similarly, no goodwill impairment charges were required, or recorded, for the years ended December 31, 2016 and 2015. Even though there was no goodwill impairment at December 31, 2017, adverse events may impact the recoverability of goodwill and could result in a future impairment charge which could have a material impact on the Company’s operating results.
(b) Other Intangible Assets
The other intangible assets represent the core deposit intangible ("CDI") acquired in business combinations. The useful life of the CDI related to the Washington Banking Merger and the acquisitions of Valley Community Bancshares, Northwest Commercial Bank, and Cowlitz Bank were estimated to be ten, ten, five and nine years, respectively.
The following table presents the change in the other intangible assets for the periods indicated:
Year Ended December 31, | |||||||||||
2017 | 2016 | 2015 | |||||||||
(In thousands) | |||||||||||
Balance at the beginning of the year | $ | 7,374 | $ | 8,789 | $ | 10,889 | |||||
Less: Amortization | 1,286 | 1,415 | 2,100 | ||||||||
Balance at the end of the year | $ | 6,088 | $ | 7,374 | $ | 8,789 | |||||
103
The estimated aggregate amortization expense related to these intangible assets for future years is as follows:
Year Ending December 31, | ||||
(In thousands) | ||||
2018 | $ | 1,122 | ||
2019 | 1,043 | |||
2020 | 989 | |||
2021 | 938 | |||
2022 | 887 | |||
Thereafter | 1,109 | |||
$ | 6,088 | |||
(9) | Deposits |
Deposits consisted of the following:
December 31, 2017 | December 31, 2016 | |||||||||||||
Amount | Percent | Amount | Percent | |||||||||||
(Dollars in thousands) | ||||||||||||||
Noninterest demand deposits | $ | 944,791 | 27.8 | % | $ | 882,091 | 27.3 | % | ||||||
Interest bearing demand deposits | 1,051,752 | 31.1 | 963,821 | 29.8 | ||||||||||
Money market accounts | 499,618 | 14.7 | 523,875 | 16.2 | ||||||||||
Savings accounts | 498,501 | 14.7 | 502,460 | 15.6 | ||||||||||
Total non-maturity deposits | 2,994,662 | 88.3 | 2,872,247 | 88.9 | ||||||||||
Certificate of deposit accounts | 398,398 | 11.7 | 357,401 | 11.1 | ||||||||||
Total deposits | $ | 3,393,060 | 100.0 | % | $ | 3,229,648 | 100.0 | % | ||||||
Accrued interest payable on deposits was $124,000 and $186,000 as of December 31, 2017 and 2016, respectively and is included in accrued expenses and other liabilities in the Consolidated Statements of Financial Condition.
Interest expense, by category, was as follows:
Year Ended December 31, | ||||||||||||
2017 | 2016 | 2015 | ||||||||||
(In thousands) | ||||||||||||
Interest bearing demand deposits | $ | 1,812 | $ | 1,569 | $ | 1,476 | ||||||
Money market accounts | 682 | 749 | 922 | |||||||||
Savings accounts | 1,311 | 756 | 445 | |||||||||
Certificate of deposit accounts | 2,244 | 1,936 | 2,386 | |||||||||
$ | 6,049 | $ | 5,010 | $ | 5,229 | |||||||
Scheduled maturities of certificates of deposit for future years are as follows:
Year Ending December 31, | ||||
(In thousands) | ||||
2018 | $ | 258,657 | ||
2019 | 81,407 | |||
2020 | 22,401 | |||
2021 | 10,708 | |||
2022 | 25,169 | |||
Thereafter | 56 | |||
$ | 398,398 | |||
104
Certificates of deposit issued in denominations equal to or in excess of $250,000 totaled $113.7 million and $54.8 million as of December 31, 2017 and 2016, respectively.
(10) | Junior Subordinated Debentures |
As part of the Washington Banking Merger, the Company assumed trust preferred securities and junior subordinated debentures with a total fair value of $18.9 million at the May 1, 2014 merger date.
Washington Banking Master Trust, a Delaware statutory business trust, was a wholly-owned subsidiary of the Washington Banking Company created for the exclusive purposes of issuing and selling capital securities and utilizing sale proceeds to acquire junior subordinated debentures issued by the Washington Banking Company. During 2007, the Trust issued $25.0 million of trust preferred securities with a 30-year maturity, callable after the fifth year by the Washington Banking Company. The trust preferred securities have a quarterly adjustable rate based upon the three-month London Interbank Offered Rate ("LIBOR") plus 1.56%. On the Washington Banking Merger date of May 1, 2014, the Company acquired the Trust, which retained the Washington Banking Master Trust name, and assumed the performance and observance of the covenants under the indenture related to the trust preferred securities.
The adjustable rate of the trust preferred securities at December 31, 2017 was 3.25%. The weighted average rate of the junior subordinated debentures was 5.11% and 4.50% for the years ended December 31, 2017 and 2016, respectively. The weighted average rate includes the accretion of the discount established at the merger date which is amortized over the life of the trust preferred securities.
The junior subordinated debentures are the sole assets of the Trust, and payments under the junior subordinated debentures are the sole revenues of the Trust. At December 31, 2017 and 2016, the balance of the junior subordinated debentures, net of unaccreted discount, was $20.0 million and $19.7 million, respectively. All of the common securities of the Trust are owned by the Company. Heritage has fully and unconditionally guaranteed the capital securities along with all obligations of the Trust under the trust agreements. For financial reporting purposes, the Company's investment in the Master Trust is accounted for under the equity method and is included in prepaid expenses and other assets on the Company's Consolidated Statements of Financial Condition. The junior subordinated debentures issued and guaranteed by the Company and held by the Master Trust are reflected as liabilities on the Company's Consolidated Statements of Financial Condition.
(11) | Repurchase Agreements |
The Company utilizes repurchase agreements with one-day maturities as a supplement to funding sources. Repurchase agreements are secured by pledged investment securities available for sale. Under the repurchase agreements, the Company is required to maintain an aggregate market value of securities pledged greater than the balance of the repurchase agreements. The Company is required to pledge additional securities to cover any declines below the balance of the repurchase agreements. For additional information on the total value of investment securities pledged for repurchase agreements see Note (2) Investment Securities.
The following table presents the Company's repurchase agreement obligations by class of collateral pledged:
December 31, 2017 | December 31, 2016 | ||||||
(In thousands) | |||||||
U.S. Treasury and U.S. Government-sponsored agencies | $ | — | $ | 2,944 | |||
Mortgage-backed securities and collateralized mortgage obligations (1): | |||||||
Residential | 11,239 | 5,191 | |||||
Commercial | 20,582 | 13,969 | |||||
Total repurchase agreements | $ | 31,821 | $ | 22,104 | |||
(1) Issued and guaranteed by U.S. Government-sponsored agencies.
(12) | Other Borrowings |
(a) FHLB Advances
The Federal Home Loan Bank ("FHLB") of Des Moines functions as a member-owned cooperative providing credit for member financial institutions. Advances are made pursuant to several different programs. Each credit program has its own interest rate and range of maturities. Limitations on the amount of advances are based on a percentage of the Bank's assets or on the FHLB’s assessment of the institution’s creditworthiness. At December 31, 2017, the
105
Bank maintained a credit facility with the FHLB of Des Moines for $881.1 million and had short-term FHLB advances outstanding of $92.5 million with maturity dates within 30 days. At December 31, 2016 there were FHLB advances outstanding of $79.6 million.
The following table sets forth the details of FHLB advances during and as of the years ended December 31, 2017 and 2016:
December 31, 2017 | December 31, 2016 | ||||||
(In thousands) | |||||||
FHLB Advances: | |||||||
Average balance during the year | $ | 105,646 | $ | 13,349 | |||
Maximum month-end balance during the year | $ | 137,450 | $ | 79,600 | |||
Weighted average rate during the year | 1.16 | % | 0.55 | % | |||
Weighted average rate at end of year | 1.56 | % | 0.81 | % | |||
Advances from the FHLB are collateralized by a blanket pledge on FHLB stock owned by the Bank, deposits at the FHLB, certain one-to-four single family residential loans or other assets, investment securities which are obligations of or guaranteed by the United States or other assets. In accordance with the pledge agreement, the Company must maintain unencumbered collateral in an amount equal to varying percentages ranging from 100% to 160% of outstanding advances depending on the type of collateral.
(b) Federal Funds Purchased
The Bank maintains advance lines with Wells Fargo Bank, US Bank, The Independent Bankers Bank and Pacific Coast Bankers’ Bank to purchase federal funds of up to $90.0 million as of December 31, 2017. The lines generally mature annually or are reviewed annually. As of December 31, 2017 and 2016, there were no federal funds purchased.
(c) Credit Facilities
The Bank maintains a credit facility with the Federal Reserve Bank of San Francisco for $82.5 million as of December 31, 2017, of which there were no borrowings outstanding as of December 31, 2017 or 2016. Any advances on the credit facility would have to be first secured by the Bank's investment securities or loans receivable.
(13) | Employee Benefit Plans |
(a) 401(k) Plan
The Company provides its eligible employees with a 401(k) plan called "Heritage Financial Corporation 401(k) Profit Sharing Plan and Trust" (the “Plan”). The Company funds certain Plan costs as accrued.
The Plan includes the Company’s salary savings 401(k) plan for its employees. All employees hired may participate in the Plan the first of the month following thirty days of service. Participants may contribute a portion of their salary, which is matched by the Company at 50%, not to be greater than 3% of eligible compensation, up to certain Internal Revenue Service limits. A Roth feature was added to the plan in 2016. All participants are 100% vested in all accounts at all times. Employer matching contributions for the years ended December 31, 2017, 2016 and 2015 were $1.1 million, $1.0 million and $954,000, respectively.
The profit sharing portion of the Plan is a defined contribution retirement plan. All profit sharing and discretionary contributions are completely discretionary. Participants are eligible for profit sharing contributions upon credit of 1,000 hours of service during the plan year, the attainment of 18 years of age, and employment on the last day of the year. Employees are vested in profit sharing contributions in the same manner as employer matching contributions discussed above. For the years ended December 31, 2017, 2016 and 2015, the Company made no employer profit sharing contributions.
(b) Employment Agreements
The Company has entered into contracts with certain senior officers that provide benefits under certain conditions following termination without cause, and/or following a change in control of the Company.
(c) Deferred Compensation Plan
During 2012, the Company adopted a Deferred Compensation Plan, which provides its directors and select executive officers with the opportunity to defer current compensation. Under the Plan, participants are permitted to
106
elect to defer compensation and the Company has the discretion to make additional contributions to the Plan on behalf of any participant based on a number of factors. Compensation expense under the Deferred Compensation Plan totaled $652,000, $540,000 and $570,000 for the years ended December 31, 2017, 2016 and 2015, respectively. The Company’s contributions totaled $453,000, $521,000 and $296,000 for the years ended December 31, 2017, 2016 and 2015, respectively. As of December 31, 2017 and 2016, the carrying value of the obligation related to the deferred compensation plans was $2.8 million and $2.2 million, respectively.
(d) Split-Dollar Life Insurance Benefit Plan
In conjunction with the Washington Banking Merger, the Company assumed the split-dollar life insurance benefit plan previously maintained by Washington Banking. Life insurance policies are maintained for current or former officers of the Bank or former Washington Banking officers that are subject to split-dollar life insurance agreements, which continue after the participant's employment and retirement. All participants are fully vested in their split-dollar life insurance benefits. The accrued benefit liability for the split-dollar life insurance agreements represents the present value of the future death benefits payable to the participants' beneficiaries.
The split-dollar life insurance projected benefit obligation is included in accrued expenses and other liabilities on the Company's Consolidated Statements of Financial Condition. As of December 31, 2017 and 2016, the carrying value of the obligation was $250,000 and $1.1 million, respectively.
(14) | Commitments and Contingencies |
(a) Lease Commitments
The Bank leases certain premises and equipment under operating leases. Rental expense of leased premises and equipment was $3.8 million, $4.4 million and $4.6 million for the years ended December 31, 2017, 2016 and 2015, respectively, which is included in occupancy and equipment expense on the Company's Consolidated Statements of Income.
The estimated future minimum annual rental commitments under noncancelable leases having an original or remaining term of more than one year are as follows:
Year Ending December 31, | ||||
(In thousands) | ||||
2018 | $ | 3,074 | ||
2019 | 2,681 | |||
2020 | 2,385 | |||
2021 | 1,640 | |||
2022 | 929 | |||
Thereafter | 2,241 | |||
$ | 12,950 | |||
The leases contain various provisions for increases in rental rates, based either on changes in the published Consumer Price Index or a predetermined escalation schedule. Substantially all of the leases provide the Company with the option to extend the lease term one or more times following expiration of the initial term.
(b) Commitments to Extend Credit
In the ordinary course of business, the Company may enter into various types of transactions that include commitments to extend credit that are not included in the Consolidated Financial Statements. The Company applies the same credit standards to these commitments as it uses in all its lending activities and has included these commitments in its lending risk evaluations. The majority of the commitments presented below are variable rate. The Company’s exposure to credit and market risk under commitments to extend credit is represented by the amount of these commitments.
107
The following table presents outstanding commitments to extend credit, including letters of credit, at the dates indicated:
December 31, 2017 | December 31, 2016 | |||||||
(In thousands) | ||||||||
Commercial business: | ||||||||
Commercial and industrial | $ | 363,272 | $ | 368,308 | ||||
Owner-occupied commercial real estate | 6,815 | 3,443 | ||||||
Non-owner occupied commercial real estate | 13,543 | 8,732 | ||||||
Total commercial business | 383,630 | 380,483 | ||||||
One-to-four family residential | — | — | ||||||
Real estate construction and land development: | ||||||||
One-to-four family residential | 38,160 | 23,004 | ||||||
Five or more family residential and commercial properties | 86,787 | 78,121 | ||||||
Total real estate construction and land development | 124,947 | 101,125 | ||||||
Consumer | 204,625 | 144,405 | ||||||
Total outstanding commitments | $ | 713,202 | $ | 626,013 | ||||
(c) Variable Interests
The Company has two equity investments in Low-Income Housing Tax Credit partnerships ("LIHTCs") which are indirect federal subsidies that finance low-income housing projects. The Company reported the investments in the unconsolidated LIHTCs as prepaid expenses and other assets on the Company’s Statements of Financial Condition with carrying values of $54.0 million and $23.3 million as of December 31, 2017 and 2016, respectively. As a limited liability investor in these partnerships, the Company receives tax benefits in the form of tax deductions from partnership operating losses and federal income tax credits. The federal income tax credits are earned over a 10-year period as a result of the investment properties meeting certain criteria and are subject to recapture for noncompliance with such criteria over a 15-year period. The Company accounts for the LIHTCs under the proportional amortization method and amortizes the initial cost of the investment in proportion to the tax credits and other tax benefits received and recognizes the net investment performance on the Company's Consolidated Statements of Income as a component of income tax expense. During the years ended December 31, 2017, 2016, and 2015 the Company recognized tax benefits of $2.9 million, $640,000 and $273,000, respectively. See Note (20) Income Taxes for further information on tax benefits.
The maximum exposure to loss in the LIHTCs is the amount of equity invested and credit extended by the Company. Loans to these entities are underwritten in substantially the same manner as are other loans and are generally secured. The Company has evaluated the variable interests held by the Company in each LIHTC investment and determined that the Company does not have controlling financial interests in such investments, and is not the primary beneficiary.
Total unfunded contingent commitments related to the Company’s LIHTC investments totaled $39.8 million and $18.3 million at December 31, 2017 and 2016, respectively, and is reported as accrued expenses and other liabilities on the Company's Statements of Financial Condition. The Company expects to fund LIHTC commitments of $8.6 million during the year ended December 31, 2018 and $26.0 million during the year ended December 31, 2019, with the remaining commitments of $5.2 million paid by December 31, 2034. There were no impairment losses on the Company’s LIHTC investments during the years ended December 31, 2017, 2016 or 2015.
The Company also made a total of $25.0 million of Qualified Equity Investments ("QEIs") into three Certified Development Entities (“CDEs”) in May 2014 and is eligible to receive New Markets Tax Credits (“NMTC”) on the QEIs. The NMTC program provides federal tax incentives to investors to make investments in distressed communities and promotes economic improvements through the development of successful businesses in these communities. The NMTC is available to investors over a seven-year period and is subject to recapture if certain events occur during such period. Gross tax credits related to the Company's CDEs totaling $9.8 million are available through 2020. The Company is required to fund 85 percent of a tranche to claim the entire tax credit, and it had until May 15, 2015 to complete the funding. The tranche was funded in 2015 before the deadline.
108
The Company accounts for its NMTC on the equity method and reported the investment balance as prepaid expenses and other assets on the Company’s Statements of Financial Condition with carrying value of $25.8 million and $26.8 million at December 31, 2017 and December 31, 2016, respectively. The Company recorded investment income of $735,000, $740,000 and $562,000 during the years ended December 31, 2017, 2016 and 2015, respectively, in other income on the Company's Statements of Income.
(15) | Derivative Financial Instruments |
The Company has entered into certain interest rate swap contracts that are not designated as hedging instruments. The purpose of these derivative contracts is primarily to provide commercial business loan customers the ability to convert their loans from variable to fixed interest rates. Upon the origination of a derivative contract with a customer, the Company simultaneously enters into an offsetting derivative contract with a third party in order to offset its exposure on the variable and fixed rate components of the customer agreement. The Company recognizes immediate income based upon the difference in the bid/ask spread of the underlying transactions with its customers and the third party, which is recorded in interest rate swap fees on the Consolidated Statements of Income. Because the Company acts only as an intermediary for its customer, subsequent changes in the fair value of the underlying derivative contracts offset each other and do not significantly impact the Company’s results of operations.
The notional amounts and estimated fair values of interest rate derivative contracts outstanding at December 31, 2017 and December 31, 2016 are presented in the following table.
December 31, 2017 | December 31, 2016 | ||||||||||||||
Notional Amounts | Estimated Fair Value | Notional Amounts | Estimated Fair Value | ||||||||||||
(In thousands) | |||||||||||||||
Non-hedging interest rate derivatives | |||||||||||||||
Interest rate swaps with customer (1) | $ | 146,537 | $ | (882 | ) | $ | 102,709 | $ | (1,099 | ) | |||||
Interest rate swap with third party (1) | 146,537 | 882 | 102,709 | 1,099 | |||||||||||
(1) The estimated fair value of the derivative included in prepaid and other assets on the Consolidated Statements of Financial Condition was $3.4 million and $2.8 million as of December 31, 2017 and 2016, respectively. The estimated fair value of the derivative included in accrued expenses and other liabilities on the Consolidated Statements of Financial Condition was $3.4 million and $2.8 million as of December 31, 2017 and 2016, respectively.
(16) | Stockholders’ Equity |
(a) Earnings Per Common Share
The following table illustrates the reconciliation of weighted average shares used for earnings per common share computations for the years ended December 31, 2017, 2016 and 2015:
Year Ended December 31, | |||||||||||
2017 | 2016 | 2015 | |||||||||
(Dollars in thousands) | |||||||||||
Net income: | |||||||||||
Net income | $ | 41,791 | $ | 38,918 | $ | 37,489 | |||||
Less: Dividends and undistributed earnings allocated to participating securities | (293 | ) | (358 | ) | (328 | ) | |||||
Net income allocated to common shareholders | $ | 41,498 | $ | 38,560 | $ | 37,161 | |||||
Basic: | |||||||||||
Weighted average common shares outstanding | 29,937,400 | 29,963,365 | 30,057,558 | ||||||||
Less: Restricted stock awards | (179,581 | ) | (285,063 | ) | (267,943 | ) | |||||
Total basic weighted average common shares outstanding | 29,757,819 | 29,678,302 | 29,789,615 | ||||||||
Diluted: | |||||||||||
Basic weighted average common shares outstanding | 29,757,819 | 29,678,302 | 29,789,615 | ||||||||
Effect of potentially dilutive common shares(1) | 91,512 | 13,851 | 22,725 | ||||||||
Total diluted weighted average common shares outstanding | 29,849,331 | 29,692,153 | 29,812,340 | ||||||||
(1) Represents the effect of the assumed exercise of stock options and vesting of restricted stock awards and units.
109
Potential dilutive shares are excluded from the computation of earnings per share if their effect is anti-dilutive. For the year ended December 31, 2017, there were no anti-dilutive shares outstanding related to options to acquire common stock. For the years ended December 31, 2016 and 2015, anti-dilutive shares outstanding related to options to acquire common stock totaled 436 and 4,320, respectively. Anti-dilution occurs when the exercise price of a stock option or the unrecognized compensation cost per share of a restricted stock award exceeds the market price of the Company’s stock.
(b) Dividends
The timing and amount of cash dividends paid on the Company's common stock depends on the Company’s earnings, capital requirements, financial condition and other relevant factors. Dividends on common stock from the Company depend substantially upon receipt of dividends from the Bank, which is the Company’s predominant source of income.
The following table summarizes the dividend activity for the years ended December 31, 2017, 2016 and 2015.
Declared | Cash Dividend per Share | Record Date | Paid Date | |||||
January 28, 2015 | $0.10 | February 10, 2015 | February 24, 2015 | |||||
April 22, 2015 | $0.11 | May 7, 2015 | May 21, 2015 | |||||
July 22, 2015 | $0.11 | August 6, 2015 | August 20, 2015 | |||||
October 21, 2015 | $0.11 | November 4, 2015 | November 18, 2015 | |||||
October 21, 2015 | $0.10 | November 4, 2015 | November 18, 2015 | * | ||||
January 27, 2016 | $0.11 | February 10, 2016 | February 24, 2016 | |||||
April 20, 2016 | $0.12 | May 5, 2016 | May 19, 2016 | |||||
July 20, 2016 | $0.12 | August 4, 2016 | August 18, 2016 | |||||
October 26, 2016 | $0.12 | November 8, 2016 | November 22, 2016 | |||||
October 26, 2016 | $0.25 | November 8, 2016 | November 22, 2016 | * | ||||
January 25, 2017 | $0.12 | February 9, 2017 | February 23, 2017 | |||||
April 25, 2017 | $0.13 | May 10, 2017 | May 24, 2017 | |||||
July 25, 2017 | $0.13 | August 10, 2017 | August 24, 2017 | |||||
October 25, 2017 | $0.13 | November 8, 2017 | November 22, 2017 | |||||
October 25, 2017 | $0.10 | November 8, 2017 | November 22, 2017 | * | ||||
* Denotes a special dividend.
The FDIC and the Washington State Department of Financial Institutions, Division of Banks have the authority under their supervisory powers to prohibit the payment of dividends by the Bank to the Company. Additionally, current guidance from the Board of Governors of the Federal Reserve System ("Federal Reserve") provides, among other things, that dividends per share on the Company’s common stock generally should not exceed earnings per share, measured over the previous four fiscal quarters. Current regulations allow the Company and the Bank to pay dividends on their common stock if the Company’s or the Bank’s regulatory capital would not be reduced below the statutory capital requirements set by the Federal Reserve and the FDIC.
110
(c) Stock Repurchase Program
The Company has had various stock repurchase programs since March 1999. On October 23, 2014, the Company's Board of Directors authorized the repurchase of up to 5% of the Company's outstanding common shares, or approximately 1,513,000 shares, under the eleventh stock repurchase plan. The number, timing and price of shares repurchased will depend on business and market conditions, and other factors, including opportunities to deploy the Company's capital.
The following table provides total repurchased shares and average share prices under the plan for the periods indicated:
Year Ended December 31, | |||||||||||||||
2017 | 2016 | 2015 | Plan Total (1) | ||||||||||||
Eleventh Plan | |||||||||||||||
Repurchased shares | — | 138,000 | 441,966 | 579,966 | |||||||||||
Stock repurchase average share price | $ | — | $ | 17.16 | $ | 16.64 | $ | 16.76 | |||||||
(1) Represents shares repurchased and average price per share paid during the duration of the plan.
In addition to the stock repurchases disclosed in the table above, the Company repurchased shares to pay withholding taxes on the vesting of restricted stock. During the years ended December 31, 2017, 2016 and 2015, the Company repurchased 29,429, 29,512 and 22,300 shares at an average price of $25.01, $17.82 and $17.09 respectively, to pay withholding taxes on the vesting of restricted stock that vested during the respective periods.
(d) Issuance of Common Stock
No common stock was issued during the years ended December 31, 2017, 2016 and 2015 other than common stock related to the exercise of stock options and issuance of restricted stock awards as further described in Note (19) Stock-Based Compensation.
(17) | Accumulated Other Comprehensive Income (Loss) |
The changes in accumulated other comprehensive income (loss) (“AOCI”) by component, during the years ended December 31, 2017, 2016 and 2015 are as follows:
December 31, 2017 | December 31, 2016 | ||||||
(In thousands) | |||||||
Balance of AOCI at the beginning of the year | $ | (2,606 | ) | $ | 2,559 | ||
Other comprehensive income (loss) before reclassification (1) | 1,530 | (4,311 | ) | ||||
Amounts reclassified from AOCI for gain on sale of investment securities included in net income (1) | (4 | ) | (854 | ) | |||
Net current period other comprehensive income (loss) | 1,526 | (5,165 | ) | ||||
ASU 2018-02 Implementation | (218 | ) | — | ||||
Balance of AOCI at the end of the year | $ | (1,298 | ) | $ | (2,606 | ) | |
(1) | All amounts are due to the changes in fair value of available for sale securities and are net of tax. |
111
December 31, 2015 | |||||||||||
Changes in fair value of available for sale securities (1) | Accretion of other-than- temporary impairment on held to maturity securities (1) | Total | |||||||||
(In thousands) | |||||||||||
Balance of AOCI at the beginning of the year | $ | 3,567 | $ | (189 | ) | $ | 3,378 | ||||
Other comprehensive (loss) income before reclassification | (559 | ) | 108 | (451 | ) | ||||||
Amounts reclassified from AOCI for gain on sale of investment securities available for sale included in net income | (1,067 | ) | 81 | (986 | ) | ||||||
Held to maturity transfer to available for sale | 618 | — | 618 | ||||||||
Net current period other comprehensive (loss) income | (1,008 | ) | 189 | (819 | ) | ||||||
Balance of AOCI at the end of the year | $ | 2,559 | $ | — | $ | 2,559 | |||||
(1) | All amounts are net of tax. |
(18) | Fair Value Measurements |
Fair value is the exchange price that would be received for an asset or paid to transfer a liability (exit price) in the principal or most advantageous market for the asset or liability in an orderly transaction between market participants on the measurement date. There are three levels of inputs that may be used to measure fair values:
Level 1: Valuations for assets and liabilities traded in active exchange markets, or interest in open-end mutual funds that allow the Company to sell its ownership interest back to the fund at net asset value on a daily basis. Valuations are obtained from readily available pricing sources for market transactions involving identical assets, liabilities, or funds.
Level 2: Valuations for assets and liabilities traded in less active dealer or broker markets, such as quoted prices for similar assets or liabilities, quoted prices in markets that are not active, or valuations using methodologies with observable inputs.
Level 3: Valuations for assets and liabilities that are derived from other valuation methodologies, such as option pricing models, discounted cash flow models and similar techniques using unobservable inputs, and not based on market exchange, dealer, or broker traded transactions. Level 3 valuations incorporate certain assumptions and projections in determining the fair value assigned to such assets or liabilities.
(a) Recurring and Nonrecurring Basis
The Company used the following methods and significant assumptions to measure the fair value of certain assets on a recurring and nonrecurring basis:
Investment Securities Available for Sale:
The fair values of all investment securities are based upon the assumptions that market participants would use in pricing the security. If available, fair values of investment securities are determined by quoted market prices (Level 1). For investment securities where quoted market prices are not available, fair values are calculated based on market prices on similar securities (Level 2). For investment securities where quoted prices or market prices of similar securities are not available, fair values are calculated by using observable and unobservable inputs such as discounted cash flows or other market indicators (Level 3). Security valuations are obtained from third party pricing services for comparable assets or liabilities.
Impaired Loans:
At the time a loan is considered impaired, its impairment is measured based on either the present value of expected future cash flows discounted at the loan’s effective interest rate, the observable market price, or the fair market value of the collateral (less costs to sell) if the loan is collateral-dependent. Impaired loans for which impairment is measured using the discounted cash flow approach are not considered to be measured at fair value because the loan’s effective interest rate is generally not a fair value input, and for the purposes of fair value disclosures, the fair value of these loans are measured commensurate with non-impaired loans. If the Company utilizes the fair market value of the collateral method, the fair value used to measure impairment is commonly based on recent real estate
112
appraisals. These appraisals may utilize a single valuation approach or a combination of approaches including comparable sales and the income approach. Adjustments are routinely made in the appraisal process by independent appraisers to adjust for differences between the comparable sales and income data available. Such adjustments are usually significant and typically result in a Level 3 classification of the inputs for determining fair value. Non-real estate collateral may be valued using an appraisal, net book value based on the borrower’s financial statements, or aging reports, adjusted or discounted based on management’s historical knowledge, changes in market conditions from the time of the valuation and management’s expertise and knowledge of the client and client’s business (Level 3). Impaired loans are evaluated on a quarterly basis and impairment is adjusted accordingly.
Other Real Estate Owned:
Assets acquired through or instead of loan foreclosure are initially recorded at fair value less costs to sell when acquired, establishing a new cost basis. These assets are subsequently accounted for at lower of cost or fair value less costs to sell. Fair value is commonly based on recent real estate appraisals. These appraisals may utilize a single valuation approach or a combination of approaches including comparable sales and the income approach. Adjustments are routinely made in the appraisal process by independent appraisers to adjust for differences between the comparable sales and income data available. Such adjustments are usually significant and typically result in Level 3 classification of the inputs for determining fair value.
Appraisals for both collateral-dependent impaired loans and other real estate owned are performed by certified general appraisers for commercial properties or certified residential appraisers for residential properties whose qualifications and licenses have been reviewed and verified by the Company. Once received, the Company reviews the assumptions and approaches utilized in the appraisal as well as the resulting fair value in comparison with independent data sources such as recent market data or industry-wide statistics. On a quarterly basis, the Company compares the actual selling price of collateral that has been liquidated to the most recent appraised value to determine what additional adjustment should be made to the appraisal value to arrive at fair value.
Derivative Financial Instruments:
The Company obtains broker or dealer quotes to value its interest rate derivative contracts, which use valuation models using observable market data as of the measurement date (Level 2).
The following tables summarize the balances of assets and liabilities measured at fair value on a recurring basis as of December 31, 2017 and December 31, 2016.
December 31, 2017 | |||||||||||||||
Total | Level 1 | Level 2 | Level 3 | ||||||||||||
(In thousands) | |||||||||||||||
Assets | |||||||||||||||
Investment securities available for sale: | |||||||||||||||
U.S. Treasury and U.S. Government-sponsored agencies | $ | 13,442 | $ | — | $ | 13,442 | $ | — | |||||||
Municipal securities | 250,015 | — | 250,015 | — | |||||||||||
Mortgage backed securities and collateralized mortgage obligations: | |||||||||||||||
Residential | 280,211 | — | 280,211 | — | |||||||||||
Commercial | 217,079 | — | 217,079 | — | |||||||||||
Collateralized loan obligations | 4,580 | — | 4,580 | — | |||||||||||
Corporate obligations | 16,770 | — | 16,770 | — | |||||||||||
Other securities | 28,433 | 146 | 28,287 | — | |||||||||||
Total investment securities available for sale | 810,530 | 146 | 810,384 | — | |||||||||||
Derivative assets - interest rate swaps | 3,418 | — | 3,418 | — | |||||||||||
Liabilities | |||||||||||||||
Derivative liabilities - interest rate swaps | $ | 3,418 | $ | — | $ | 3,418 | $ | — | |||||||
113
December 31, 2016 | |||||||||||||||
Total | Level 1 | Level 2 | Level 3 | ||||||||||||
(In thousands) | |||||||||||||||
Assets | |||||||||||||||
Investment securities available for sale: | |||||||||||||||
U.S. Treasury and U.S. Government-sponsored agencies | $ | 1,569 | $ | — | $ | 1,569 | $ | — | |||||||
Municipal securities | 237,256 | — | 237,256 | — | |||||||||||
Mortgage backed securities and collateralized mortgage obligations: | |||||||||||||||
Residential | 309,176 | — | 309,176 | — | |||||||||||
Commercial | 208,318 | — | 208,318 | — | |||||||||||
Collateralized loan obligations | 10,478 | — | 10,478 | — | |||||||||||
Corporate obligations | 16,706 | — | 16,706 | — | |||||||||||
Other securities | 11,142 | 123 | 11,019 | — | |||||||||||
Total investment securities available for sale | 794,645 | 123 | 794,522 | — | |||||||||||
Derivative assets - interest rate swaps | 2,804 | — | 2,804 | — | |||||||||||
Liabilities | |||||||||||||||
Derivative liabilities - interest rate swaps | $ | 2,804 | $ | — | $ | 2,804 | $ | — | |||||||
There were no transfers between Level 1 and Level 2 during the years ended December 31, 2017 and 2016.
The Company may be required to measure certain financial assets and liabilities at fair value on a nonrecurring basis. These adjustments to fair value usually result from application of lower-of-cost-or-market accounting or write-downs of individual assets.
The tables below represent assets measured at fair value on a nonrecurring basis at December 31, 2017 and December 31, 2016 and the net losses (gains) recorded in earnings during years ended December 31, 2017 and 2016.
Basis(1) | Fair Value at December 31, 2017 | ||||||||||||||||||||||
Total | Level 1 | Level 2 | Level 3 | Net Losses (Gains) Recorded in Earnings During the Year Ended December 31, 2017 | |||||||||||||||||||
(In thousands) | |||||||||||||||||||||||
Impaired loans: | |||||||||||||||||||||||
Real estate construction and land development: | |||||||||||||||||||||||
One-to-four family residential | $ | 976 | $ | 307 | $ | — | $ | — | $ | 307 | $ | (558 | ) | ||||||||||
Total assets measured at fair value on a nonrecurring basis | $ | 976 | $ | 307 | $ | — | $ | — | $ | 307 | $ | (558 | ) | ||||||||||
(1) | Basis represents the unpaid principal balance of impaired loans. |
114
Basis(1) | Fair Value at December 31, 2016 | ||||||||||||||||||||||
Total | Level 1 | Level 2 | Level 3 | Net Losses (Gains) Recorded in Earnings During the Year Ended December 31, 2016 | |||||||||||||||||||
(In thousands) | |||||||||||||||||||||||
Impaired loans: | |||||||||||||||||||||||
Commercial business: | |||||||||||||||||||||||
Commercial and industrial | $ | 205 | $ | 200 | $ | — | $ | — | $ | 200 | $ | 5 | |||||||||||
Owner-occupied commercial real estate | 780 | 603 | — | — | 603 | (145 | ) | ||||||||||||||||
Total commercial business | 985 | 803 | — | — | 803 | (140 | ) | ||||||||||||||||
Real estate construction and land development: | |||||||||||||||||||||||
One-to-four family residential | 828 | 822 | — | — | 822 | (23 | ) | ||||||||||||||||
Total real estate construction and land development | 828 | 822 | — | — | 822 | (23 | ) | ||||||||||||||||
Consumer | 16 | 9 | — | — | 9 | 6 | |||||||||||||||||
Total assets measured at fair value on a nonrecurring basis | $ | 1,829 | $ | 1,634 | $ | — | $ | — | $ | 1,634 | $ | (157 | ) | ||||||||||
(1) | Basis represents the unpaid principal balance of impaired loans. |
The following table presents quantitative information about Level 3 fair value measurements for financial instruments measured at fair value on a non-recurring basis at December 31, 2017 and December 31, 2016.
December 31, 2017 | |||||||||
Fair Value | Valuation Technique(s) | Unobservable Input(s) | Range of Inputs; Weighted Average | ||||||
(Dollars in thousands) | |||||||||
Impaired loans | $ | 307 | Market approach | Adjustment for differences between the comparable sales | (91.5%) - (14.4%); (44.0.%) | ||||
December 31, 2016 | |||||||||
Fair Value | Valuation Technique(s) | Unobservable Input(s) | Range of Inputs; Weighted Average | ||||||
(Dollars in thousands) | |||||||||
Impaired loans | $ | 1,634 | Market approach | Adjustment for differences between the comparable sales | (23.8%) - 63.9%; 20.4% | ||||
(b) Fair Value of Financial Instruments
Because broadly traded markets do not exist for most of the Company’s financial instruments, the fair value calculations attempt to incorporate the effect of current market conditions at a specific time. These determinations are subjective in nature, involve uncertainties and matters of significant judgment and do not include tax ramifications; therefore, the results cannot be determined with precision, substantiated by comparison to independent markets and may not be realized in an actual sale or immediate settlement of the instruments. There may be inherent weaknesses in any calculation technique, and changes in the underlying assumptions used, including discount rates and estimates of future cash flows, could significantly affect the results. For all of these reasons, the aggregation of the fair value calculations presented herein do not represent, and should not be construed to represent, the underlying value of the Company.
115
The tables below present the carrying value amount of the Company’s financial instruments and their corresponding estimated fair values at the dates indicated.
December 31, 2017 | |||||||||||||||||||
Carrying Value | Fair Value | Fair Value Measurements Using: | |||||||||||||||||
Level 1 | Level 2 | Level 3 | |||||||||||||||||
(In thousands) | |||||||||||||||||||
Financial Assets: | |||||||||||||||||||
Cash and cash equivalents | $ | 103,015 | $ | 103,015 | $ | 103,015 | $ | — | $ | — | |||||||||
Investment securities available for sale | 810,530 | 810,530 | 146 | 810,384 | — | ||||||||||||||
Federal Home Loan Bank stock | 8,347 | N/A | N/A | N/A | N/A | ||||||||||||||
Loans held for sale | 2,288 | 2,364 | — | 2,364 | — | ||||||||||||||
Total loans receivable, net | 2,816,985 | 2,810,401 | — | — | 2,810,401 | ||||||||||||||
Accrued interest receivable | 12,244 | 12,244 | 23 | 3,772 | 8,449 | ||||||||||||||
Derivative assets - interest rate swaps | 3,418 | 3,418 | — | 3,418 | — | ||||||||||||||
Financial Liabilities: | |||||||||||||||||||
Noninterest deposits, interest bearing demand deposits, money market accounts and savings accounts | $ | 2,994,662 | $ | 2,994,662 | $ | 2,994,662 | $ | — | $ | — | |||||||||
Certificate of deposit accounts | 398,398 | 397,039 | — | 397,039 | — | ||||||||||||||
Federal Home Loan Bank advances | 92,500 | 92,500 | — | 92,500 | — | ||||||||||||||
Securities sold under agreement to repurchase | 31,821 | 31,821 | 31,821 | — | — | ||||||||||||||
Junior subordinated debentures | 20,009 | 18,500 | — | — | 18,500 | ||||||||||||||
Accrued interest payable | 162 | 162 | 45 | 79 | 38 | ||||||||||||||
Derivative liabilities - interest rate swaps | 3,418 | 3,418 | — | 3,418 | — | ||||||||||||||
116
December 31, 2016 | |||||||||||||||||||
Carrying Value | Fair Value | Fair Value Measurements Using: | |||||||||||||||||
Level 1 | Level 2 | Level 3 | |||||||||||||||||
(In thousands) | |||||||||||||||||||
Financial Assets: | |||||||||||||||||||
Cash and cash equivalents | $ | 103,745 | $ | 103,745 | $ | 103,745 | $ | — | $ | — | |||||||||
Investment securities available for sale | 794,645 | 794,645 | 123 | 794,522 | — | ||||||||||||||
Federal Home Loan Bank stock | 7,564 | N/A | N/A | N/A | N/A | ||||||||||||||
Loans held for sale | 11,662 | 11,988 | — | 11,988 | — | ||||||||||||||
Loans receivable, net of allowance for loan losses | 2,609,666 | 2,675,811 | — | — | 2,675,811 | ||||||||||||||
Accrued interest receivable | 10,925 | 10,925 | 3 | 3,472 | 7,450 | ||||||||||||||
Derivative assets - interest rate swaps | 2,804 | 2,804 | — | 2,804 | — | ||||||||||||||
Financial Liabilities: | |||||||||||||||||||
Noninterest deposits, interest bearing demand deposits, money market accounts and savings accounts | $ | 2,872,247 | $ | 2,872,247 | $ | 2,872,247 | $ | — | $ | — | |||||||||
Certificate of deposit accounts | 357,401 | 357,536 | — | 357,536 | — | ||||||||||||||
Federal Home Loan Bank advances | 79,600 | 79,600 | — | 79,600 | — | ||||||||||||||
Securities sold under agreement to repurchase | 22,104 | 22,104 | 22,104 | — | — | ||||||||||||||
Junior subordinated debentures | 19,717 | 15,000 | — | — | 15,000 | ||||||||||||||
Accrued interest payable | 215 | 215 | 44 | 142 | 29 | ||||||||||||||
Derivative liabilities - interest rate swaps | 2,804 | 2,804 | — | 2,804 | — | ||||||||||||||
The methods and assumptions, not previously presented, used to estimate fair value are described as follows:
Cash and Cash Equivalents:
The fair value of financial instruments that are short-term or reprice frequently and that have little or no risk are considered to have a fair value equal to carrying value (Level 1).
Federal Home Loan Bank Stock:
FHLB stock is not publicly traded; thus, it is not practicable to determine the fair value of FHLB stock due to restrictions placed on its transferability.
Loans Held for Sale:
The fair value of loans held for sale is estimated based upon binding contracts or quotes from third party investors for similar loans. (Level 2).
Loans Receivable:
Except for certain impaired loans discussed previously, fair value is based on discounted cash flows using current market rates applied to the estimated life (Level 3). While these methodologies are permitted under U.S. GAAP, they are not based on the exit price concept of the fair value required under FASB ASC 820-10, Fair Value Measurements and Disclosures, and generally produce a higher value.
Accrued Interest Receivable/Payable:
The fair value of accrued interest receivable/payable balances approximates the carrying value. The fair value measurements are commensurate with the asset or liability from which the accrued interest is generated (Level 1, Level 2 and Level 3).
117
Deposits:
For deposits with no contractual maturity, the fair value is assumed to equal the carrying value (Level 1). The fair value of certificate of deposit accounts is based on discounted cash flows using the difference between the deposit rate and the rates offered by the Company for deposits of similar remaining maturities (Level 2).
Federal Home Loan Bank advances:
The fair value of FHLB advances is estimated based on discounting the future cash flows using the market rate currently offered (Level 2).
Securities Sold Under Agreement to Repurchase:
Securities sold under agreement to repurchase are short-term in nature and they reprice on a daily basis. Fair value financial instruments that are short-term or reprice frequently and that have little or no risk are considered to have a fair value equal to carrying value (Level 1).
Junior Subordinated Debentures:
The fair value is estimated using discounted cash flow analysis based on current rates for similar types of debt, which many be unobservable, and considering recent trading activity of similar instruments in markets which can be inactive (Level 3).
Off-Balance Sheet Financial Instruments:
The majority of our commitments to extend credit, standby letters of credit and commitments to sell mortgage loans carry current market interest rates if converted to loans. As such, no premium or discount was ascribed to these commitments (Level 1). They are excluded from the preceding tables.
(19) | Stock-Based Compensation |
Stock options generally vest ratably over three years and expire five years after they become exercisable or vest ratably over four years and expire ten years from date of grant. Restricted stock awards granted generally have a four-year cliff vesting or four-year ratable vesting schedule. Restricted stock units granted generally vest ratably over three years. Performance restricted stock units granted generally have a three-year cliff vesting schedule. Additionally, performance restricted stock unit grants may be subject to performance-based vesting as well as other approved vesting conditions. The Company issues new shares of common stock to satisfy share option exercises and restricted stock awards.
On July 24, 2014, the Company's shareholders approved the Heritage Financial Corporation 2014 Omnibus Equity Plan that provides for the issuance of 1,500,000 shares of the Company's common stock in the form of stock options, stock appreciation rights, stock awards (which includes restricted stock units, restricted stock, performance units, performance shares or bonus shares) and cash incentive awards. Under the Company's stock-based compensation plan, 1,072,809 shares remain available for future issuance as of December 31, 2017.
(a) Stock Option Awards
For the years ended December 31, 2017, 2016 and 2015, the Company did not recognize any compensation expense or related tax benefit related to stock options as all of the compensation expense related to the outstanding stock options had been previously recognized. The intrinsic value from options exercised during the years ended December 31, 2017, 2016 and 2015 was $161,000, $177,000 and $299,000, respectively. The cash proceeds from options exercised during the years ended December 31, 2017, 2016 and 2015 were $164,000, $540,000 and $751,000, respectively.
118
The following table summarizes the stock option activity for the years ended December 31, 2017, 2016 and 2015:
Shares | Weighted-Average Exercise Price | Weighted-Average Remaining Contractual Term (In years) | Aggregate Intrinsic Value (In thousands) | |||||||||
Outstanding at December 31, 2014 | 156,407 | $ | 13.59 | |||||||||
Exercised | (61,529 | ) | 12.15 | |||||||||
Forfeited or expired | (15,470 | ) | 16.27 | |||||||||
Outstanding at December 31, 2015 | 79,408 | 14.19 | ||||||||||
Exercised | (37,713 | ) | 14.31 | |||||||||
Forfeited or expired | (4,200 | ) | 16.80 | |||||||||
Outstanding at December 31, 2016 | 37,495 | 13.77 | ||||||||||
Exercised | (12,662 | ) | 12.97 | |||||||||
Forfeited or expired | (1,602 | ) | 13.76 | |||||||||
Outstanding, vested and expected to vest and exercisable at December 31, 2017 | 23,231 | $ | 14.21 | 2.14 | $ | 385 | ||||||
(b) Restricted Stock Awards
For the years ended December 31, 2017, 2016 and 2015 the Company recognized compensation expense related to restricted stock awards of $1.4 million, $1.8 million and $1.6 million, respectively, and a related tax benefit of $488,000, $644,000 and $546,000, respectively. As of December 31, 2017, the total unrecognized compensation expense related to non-vested restricted stock awards was $1.5 million and the related weighted average period over which the compensation expense is expected to be recognized is approximately 1.6 years. The vesting date fair value of the restricted stock awards that vested during the years ended December 31, 2017, 2016 and 2015 was $2.9 million, $2.0 million and $1.6 million, respectively.
The following table summarizes the restricted stock award activity for the years ended December 31, 2017, 2016 and 2015:
Shares | Weighted-Average Grant Date Fair Value | |||||
Nonvested at December 31, 2014 | 238,669 | $ | 15.20 | |||
Granted | 121,320 | 16.72 | ||||
Vested | (92,486 | ) | 15.12 | |||
Forfeited | (2,982 | ) | 15.73 | |||
Nonvested at December 31, 2015 | 264,521 | 15.92 | ||||
Granted | 121,039 | 17.60 | ||||
Vested | (112,516 | ) | 15.62 | |||
Forfeited | (11,748 | ) | 16.62 | |||
Nonvested at December 31, 2016 | 261,296 | 16.80 | ||||
Granted | — | — | ||||
Vested | (113,479 | ) | 16.55 | |||
Forfeited | (10,418 | ) | 16.80 | |||
Nonvested at December 31, 2017 | 137,399 | $ | 17.00 | |||
(c) Restricted Stock Units
During 2017, performance-based stock-settled restricted stock unit awards ("PRSU") and stock-settled restricted stock unit awards ("RSU") were granted with a performance period of three years. The number of shares of actually delivered pursuant to the PRSUs depends on the performance of the Company's Total Shareholder Return and Return on Average Assets over the performance period in relation to the performance of the common stock of a predetermined peer group. The conditions of the grants allow for an actual payout ranging between no payout and 150% of target. The payout level is calculated based on actual performance achieved during the performance
119
period compared to a defined peer group. The fair value of such PRSUs was determined using a Monte Carlo simulation and will be recognized over the next three years. The Monte-Carlo simulation model uses the same input assumptions as the Black-Scholes model; however, it also further incorporates into the fair value determination the possibility that the market condition may not be satisfied. Compensation costs related to these awards are recognized regardless of whether the market condition is satisfied, provided that the requisite service has been provided.
Expected volatilities in the model were estimated using a historical period consistent with the performance period of approximately three years. The risk-free interest rate was based on the United States Treasury rate for a term commensurate with the expected life of the grant. The Company used the following assumptions to estimate the fair value of PRSUs granted during February 2017:
2017 | ||
Shares issued | 6,089 | |
Expected Term in Years | 2.85 | |
Weighted-Average Risk Free Interest Rate | 1.40 | % |
Expected Dividend Yield | — | % |
Weighted-Average Fair Value | 24.39 | |
Correlation coefficient | ABA NASDAQ Community Bank Index | |
Range of peer company volatilities | 17.8% - 63.1% | |
Range of peer company correlation coefficients | 8.24% - 89.79% | |
Heritage volatility | 21.8 | % |
Heritage correlation coefficient | 75.93 | % |
For the year ended December 31, 2017, the Company recognized compensation expense related to RSUs of $712,000, and a related tax benefit of $249,000. As of December 31, 2017, the total unrecognized compensation expense related to non-vested restricted stock units was $1.6 million and the related weighted average period over which the compensation expense is expected to be recognized is approximately 2.02 years.
The following table summarizes the RSU activity for the year ended December 31, 2017:
Units | Weighted-Average Grant Date Fair Value | |||||
Nonvested at December 31, 2016 | — | $ | — | |||
Granted | 92,356 | 25.31 | ||||
Vested | — | — | ||||
Forfeited | (1,812 | ) | 25.35 | |||
Nonvested at December 31, 2017 | 90,544 | $ | 25.31 | |||
(20) | Income Taxes |
Income tax expense is substantially due to Federal income taxes as the provision for the state of Oregon income taxes is insignificant. Income tax expense for the years ended December 31, 2017, 2016 and 2015 consisted of the following:
Year Ended December 31, | ||||||||||||
2017 | 2016 | 2015 | ||||||||||
(In thousands) | ||||||||||||
Current tax expense | $ | 12,171 | $ | 6,885 | $ | 9,760 | ||||||
Deferred tax expense | 6,185 | 6,918 | 4,058 | |||||||||
Income tax expense | $ | 18,356 | $ | 13,803 | $ | 13,818 | ||||||
120
A reconciliation of the Company's effective income tax rate with the Federal statutory income tax rate of 35% is as follows:
Year Ended December 31, | ||||||||||||
2017 | 2016 | 2015 | ||||||||||
(In thousands) | ||||||||||||
Income tax expense at Federal statutory rate | $ | 21,051 | $ | 18,452 | $ | 17,957 | ||||||
Tax-exempt instruments | (3,212 | ) | (3,198 | ) | (2,482 | ) | ||||||
Non-deductible acquisition costs | 210 | — | — | |||||||||
Federal tax credits and other benefits (1) | (1,510 | ) | (931 | ) | (880 | ) | ||||||
Effects of BOLI | (531 | ) | (511 | ) | (474 | ) | ||||||
Revaluation of net deferred tax assets | 2,568 | — | — | |||||||||
Tax resolutions (2) | — | — | (300 | ) | ||||||||
Other, net | (220 | ) | (9 | ) | (3 | ) | ||||||
Income tax expense | $ | 18,356 | $ | 13,803 | $ | 13,818 | ||||||
(1) Federal tax credits are provided for under the NMTC program and LIHTC programs as described in Note (14) Commitments and Contingencies. Tax benefits related to these credits were recognized for financial reporting purposes in the same period that the credits were recognized in the Company's income tax returns. Other benefits include the proportional amortization of the LIHTC of $2.2 million, $523,000 and $209,000, for the years ended December 31, 2017, 2016 and 2015, respectively.
(2) Washington Banking Company had recorded tax-related liabilities prior to the merger effective date, which the Company assumed as part of the Washington Banking Merger. These tax-related liabilities were resolved during the year ended December 31, 2015, resulting in a decrease of the Company's income tax expense for the year ended December 31, 2015.
On December 22, 2017, the U.S. Government enacted comprehensive tax legislation commonly referred to as the Tax Cuts and Jobs Act (the "Tax Act"). The Tax Act amends the Internal Revenue Code to reduce tax rates and modify policies, credits, and deductions for individuals and businesses. For businesses, the Tax Act reduces the corporate federal tax rate from a maximum of 35% to a flat 21% rate. The corporate tax rate reduction was effective January 1, 2018. The Tax Act required a revaluation the Company’s deferred tax assets and liabilities to account for the future impact of lower corporate tax rates and other provisions of the legislation. As a result of the Company's revaluation, the net deferred tax asset was reduced through an increase to the provision for income tax.
121
The following table presents major components of the deferred income tax asset (liability) resulting from differences between financial reporting and tax basis:
December 31, 2017 | December 31, 2016 | |||||||
(In thousands) | ||||||||
Deferred tax assets: | ||||||||
Allowance for loan losses | $ | 3,330 | $ | 4,739 | ||||
Accrued compensation | 1,779 | 2,685 | ||||||
Stock compensation | 660 | 910 | ||||||
Net unrealized losses charged to other comprehensive income on securities | 347 | 1,388 | ||||||
Market discount on purchased loans | 3,908 | 10,506 | ||||||
Foregone interest on nonaccrual loans | 471 | 1,536 | ||||||
Net operating loss carryforward acquired from NCB | 270 | 483 | ||||||
Other deferred tax assets | 763 | 1,483 | ||||||
Total deferred tax assets | 11,528 | 23,730 | ||||||
Deferred tax liabilities: | ||||||||
Deferred loan fees, net | (2,518 | ) | (3,736 | ) | ||||
Premises and equipment | (1,091 | ) | (1,660 | ) | ||||
FHLB stock | (557 | ) | (926 | ) | ||||
Goodwill and other intangible assets | (304 | ) | (740 | ) | ||||
Federal tax credits | (1,107 | ) | (1,314 | ) | ||||
Junior subordinated debentures | (1,215 | ) | (2,122 | ) | ||||
Other deferred tax liabilities | (847 | ) | (1,223 | ) | ||||
Total deferred tax liabilities | (7,639 | ) | (11,721 | ) | ||||
Deferred tax asset, net | $ | 3,889 | $ | 12,009 | ||||
In assessing the realizability of deferred tax assets, management considers whether it is more likely than not that some portion or all of the deferred tax assets will not be realized. A valuation allowance is required to be recognized for the portion of the deferred tax asset that will not be realized. The ultimate realization of deferred tax assets is dependent upon the generation of future taxable income during the periods in which those temporary differences become deductible. As of December 31, 2017, based upon the level of historical taxable income and projections for future taxable income over the periods in which the deferred tax assets are deductible, management expects to realize the benefits of these deductible differences.
The Company had a net operating loss carryforward of $1.3 million and $1.4 million at December 31, 2017 and 2016, respectively, that will expire in 2033. The Company is limited to the amount of the net operating loss carryforward that it can deduct each year. A tax planning strategy has been developed that management believes will enable the Company to deduct all of the net operating loss carryforwards prior to the expiration date. Based on these estimates, management has not recorded a valuation allowance as of December 31, 2017 and 2016.
As of December 31, 2017 and 2016, the Company had an insignificant amount of unrecognized tax benefits, none of which would materially affect its effective tax rate if recognized. The Company does not anticipate that the amount of unrecognized tax benefits will significantly increase or decrease in the next 12 months. The amount of interest and penalties accrued as of December 31, 2017 and 2016 and for the years ended December 31, 2017, 2016 and 2015 were immaterial.
The Company has qualified under provisions of the Internal Revenue Code to compute income taxes after deductions of additions to the bad debt reserves when it was registered as a Savings Bank. At December 31, 2017, the Company had a taxable temporary difference of approximately $2.8 million that arose before 1988 (base-year amount). In accordance with FASB ASC 740, a deferred tax liability of an estimated $980,000 has not been recognized for the temporary difference. Management does not expect this temporary difference to reverse in the foreseeable future.
122
The Company and its subsidiary file a United States consolidated federal income tax return and an Oregon State income tax return, and the tax years subject to examination by the Internal Revenue Service are the years ended December 31, 2017, 2016, 2015 and 2014.
(21) | Regulatory Capital Requirements |
The Company is a bank holding company under the supervision of the Federal Reserve Bank of San Francisco. Bank holding companies are subject to capital adequacy requirements of the Federal Reserve under the Bank Holding Company Act of 1956, as amended, and the regulations of the Federal Reserve. Heritage Bank is a federally insured institution and thereby is subject to the capital requirements established by the FDIC. The Federal Reserve capital requirements generally parallel the FDIC requirements. Failure to meet minimum capital requirements can initiate certain mandatory, and possibly additional discretionary, actions by regulators that, if undertaken, could have a direct material effect on the Company’s consolidated financial statements and operations. Management believes as of December 31, 2017, the Company and the Bank meet all capital adequacy requirements to which they are subject.
As of December 31, 2017 and December 31, 2016, the most recent regulatory notifications categorized the Bank as well capitalized under the regulatory framework for prompt corrective action. There are no conditions or events since that notification that management believes have changed the Bank's categories.
123
Minimum Requirements | Well- Capitalized Requirements | Actual | |||||||||||||||||
$ | % | $ | % | $ | % | ||||||||||||||
(Dollars in thousands) | |||||||||||||||||||
As of December 31, 2017: | |||||||||||||||||||
The Company consolidated | |||||||||||||||||||
Common equity Tier 1 capital to risk-weighted assets | $ | 154,522 | 4.5 | % | N/A | N/A | $ | 386,689 | 11.3 | % | |||||||||
Tier 1 leverage capital to average assets | 159,494 | 4.0 | N/A | N/A | 406,687 | 10.2 | |||||||||||||
Tier 1 capital to risk-weighted assets | 206,029 | 6.0 | N/A | N/A | 406,687 | 11.8 | |||||||||||||
Total capital to risk-weighted assets | 274,706 | 8.0 | N/A | N/A | 439,044 | 12.8 | |||||||||||||
Heritage Bank | |||||||||||||||||||
Common equity Tier 1 capital to risk-weighted assets | 154,400 | 4.5 | 223,023 | 6.5 | 391,092 | 11.4 | |||||||||||||
Tier 1 leverage capital to average assets | 159,300 | 4.0 | 199,125 | 5.0 | 391,092 | 9.8 | |||||||||||||
Tier 1 capital to risk-weighted assets | 205,867 | 6.0 | 274,490 | 8.0 | 391,092 | 11.4 | |||||||||||||
Total capital to risk-weighted assets | 274,490 | 8.0 | 343,112 | 10.0 | 423,348 | 12.3 | |||||||||||||
As of December 31, 2016: | |||||||||||||||||||
The Company consolidated | |||||||||||||||||||
Common equity Tier 1 capital to risk-weighted assets | 142,688 | 4.5 | N/A | N/A | 362,350 | 11.4 | |||||||||||||
Tier 1 leverage capital to average assets | 148,144 | 4.0 | N/A | N/A | 381,989 | 10.3 | |||||||||||||
Tier 1 capital to risk-weighted assets | 190,250 | 6.0 | N/A | N/A | 381,989 | 12.0 | |||||||||||||
Total capital to risk-weighted assets | 253,667 | 8.0 | N/A | N/A | 413,320 | 13.0 | |||||||||||||
Heritage Bank | |||||||||||||||||||
Common equity Tier 1 capital to risk-weighted assets | 142,573 | 4.5 | 205,938 | 6.5 | 369,915 | 11.7 | |||||||||||||
Tier 1 leverage capital to average assets | 148,024 | 4.0 | 185,030 | 5.0 | 369,915 | 10.0 | |||||||||||||
Tier 1 capital to risk-weighted assets | 190,097 | 6.0 | 253,462 | 8.0 | 369,915 | 11.7 | |||||||||||||
Total capital to risk-weighted assets | 253,462 | 8.0 | 316,828 | 10.0 | 401,168 | 12.7 | |||||||||||||
Effective January 1, 2015 (with some changes transitioned into full effectiveness over two to four years), the Company became subject to new capital adequacy requirements approved by the Federal Reserve and the FDIC that implement the revised standards of the Basel Committee on Banking Supervision, commonly called Basel III, and address relevant provisions of the Dodd-Frank Act.
Under the new capital requirements both the Company and the Bank are required to have a common equity Tier 1 capital ratio of 4.5%. In addition, both the Company and the Bank are required to have a Tier 1 leverage ratio of 4.0%, a Tier 1 risk-based ratio of 6.0% and a total risk-based ratio of 8.0%. Both the Company and the Bank are required to establish a “conservation buffer”, consisting of common equity Tier 1 capital of more than 2.5% above the minimum risk-based capital ratios. The capital conservation buffer is designed to ensure that banks build up capital buffers outside periods of stress which can be drawn down as losses are incurred. An institution that does not meet the conservation buffer will be subject to restrictions on certain activities including payment of dividends, stock
124
repurchases and discretionary bonuses to executive officers. The conservation buffer is being phased in beginning in 2016 and will take full effect on January 1, 2019. Certain calculations under the rules will also have phase-in periods. The capital conservation buffer requirement began to be phased-in on January 1, 2016 when more than 0.625% of risk-weighted assets was required, and increases by 0.625% on each subsequent January 1, until it is fully phased-in on January 1, 2019. At December 31, 2017, the capital conservation buffer was 4.71% and 4.26% for the Company and the Bank, respectively.
(22) | Heritage Financial Corporation (Parent Company Only) |
Following is the condensed financial statements of the Parent Company.
HERITAGE FINANCIAL CORPORATION
(PARENT COMPANY ONLY)
Condensed Statements of Financial Condition
December 31, 2017 | December 31, 2016 | |||||||
(In thousands) | ||||||||
ASSETS | ||||||||
Cash and interest earning deposits | $ | 11,904 | $ | 10,568 | ||||
Investment in subsidiary bank | 512,655 | 489,388 | ||||||
Other assets | 4,696 | 2,601 | ||||||
Total assets | $ | 529,255 | $ | 502,557 | ||||
LIABILITIES AND STOCKHOLDERS’ EQUITY | ||||||||
Junior subordinated debentures | $ | 20,009 | $ | 19,717 | ||||
Other liabilities | 941 | 1,077 | ||||||
Total stockholders’ equity | 508,305 | 481,763 | ||||||
Total liabilities and stockholders’ equity | $ | 529,255 | $ | 502,557 | ||||
125
HERITAGE FINANCIAL CORPORATION
(PARENT COMPANY ONLY)
Condensed Statements of Income
Year Ended December 31, | ||||||||||||
2017 | 2016 | 2015 | ||||||||||
(In thousands) | ||||||||||||
INTEREST INCOME: | ||||||||||||
Interest and dividends on interest earning deposits and other assets | $ | 44 | $ | 34 | $ | 28 | ||||||
Total interest income | 44 | 34 | 28 | |||||||||
INTEREST EXPENSE: | ||||||||||||
Junior subordinated debentures | 1,014 | 880 | 827 | |||||||||
Total interest expense | 1,014 | 880 | 827 | |||||||||
Net interest expense | (970 | ) | (846 | ) | (799 | ) | ||||||
NONINTEREST INCOME: | ||||||||||||
Dividends from subsidiary bank | 23,000 | 30,000 | 22,000 | |||||||||
Equity in undistributed income of subsidiary bank | 21,755 | 11,848 | 18,131 | |||||||||
Total noninterest income | 44,755 | 41,848 | 40,131 | |||||||||
NONONTEREST EXPENSE: | ||||||||||||
Professional services | 768 | 385 | 263 | |||||||||
Other expense | 3,726 | 3,437 | 3,120 | |||||||||
Total noninterest expense | 4,494 | 3,822 | 3,383 | |||||||||
Income before income taxes | 39,291 | 37,180 | 35,949 | |||||||||
Income tax benefit | (2,500 | ) | (1,738 | ) | (1,540 | ) | ||||||
Net income | $ | 41,791 | $ | 38,918 | $ | 37,489 | ||||||
126
HERITAGE FINANCIAL CORPORATION
(PARENT COMPANY ONLY)
Condensed Statements of Cash Flows
Year Ended December 31, | ||||||||||||
2017 | 2016 | 2015 | ||||||||||
(In thousands) | ||||||||||||
Cash flows from operating activities: | ||||||||||||
Net income | $ | 41,791 | $ | 38,918 | $ | 37,489 | ||||||
Adjustments to reconcile net income to net cash provided by operating activities: | ||||||||||||
Equity in undistributed income of subsidiary bank | (21,755 | ) | (11,848 | ) | (18,131 | ) | ||||||
Net excess tax benefit from exercise of stock options and vesting of restricted stock | — | (123 | ) | (140 | ) | |||||||
Stock-based compensation expense | 2,103 | 1,840 | 1,555 | |||||||||
Net change in other assets and liabilities | (1,925 | ) | (1,141 | ) | (125 | ) | ||||||
Net cash provided by operating activities | 20,214 | 27,646 | 20,648 | |||||||||
Cash flows from financing activities: | ||||||||||||
Common stock cash dividends paid | (18,305 | ) | (21,569 | ) | (15,916 | ) | ||||||
Proceeds from exercise of stock options | 164 | 540 | 751 | |||||||||
Net excess tax benefit from exercise of stock options and vesting of restricted stock | — | 123 | 140 | |||||||||
Repurchase of common stock | (737 | ) | (2,894 | ) | (7,736 | ) | ||||||
Net cash used in financing activities | (18,878 | ) | (23,800 | ) | (22,761 | ) | ||||||
Net increase (decrease) in cash and cash equivalents | 1,336 | 3,846 | (2,113 | ) | ||||||||
Cash and cash equivalents at beginning of year | 10,568 | 6,722 | 8,835 | |||||||||
Cash and cash equivalents at end of year | $ | 11,904 | $ | 10,568 | $ | 6,722 | ||||||
127
(23) | Selected Quarterly Financial Data (Unaudited) |
Results of operations on a quarterly basis were as follows:
Year Ended December 31, 2017 | ||||||||||||||||
First Quarter | Second Quarter | Third Quarter | Fourth Quarter | |||||||||||||
(Dollars in thousands, except per share amounts) | ||||||||||||||||
Interest income | $ | 34,863 | $ | 36,087 | $ | 37,324 | $ | 39,606 | ||||||||
Interest expense | 1,717 | 1,907 | 2,333 | 2,389 | ||||||||||||
Net interest income | 33,146 | 34,180 | 34,991 | 37,217 | ||||||||||||
Provision for loan losses | 867 | 1,131 | 884 | 1,338 | ||||||||||||
Net interest income after provision for loan losses | 32,279 | 33,049 | 34,107 | 35,879 | ||||||||||||
Noninterest income | 7,349 | 10,663 | 8,394 | 9,002 | ||||||||||||
Noninterest expense | 27,223 | 27,809 | 27,955 | 27,588 | ||||||||||||
Income before provision for income taxes | 12,405 | 15,903 | 14,546 | 17,293 | ||||||||||||
Income tax expense | 3,089 | 4,075 | 3,922 | 7,270 | ||||||||||||
Net income | $ | 9,316 | $ | 11,828 | $ | 10,624 | $ | 10,023 | ||||||||
Basic earnings per common share | $ | 0.31 | $ | 0.40 | $ | 0.35 | $ | 0.33 | ||||||||
Diluted earnings per common share | 0.31 | 0.40 | 0.35 | 0.33 | ||||||||||||
Cash dividends declared on common stock | 0.12 | 0.13 | 0.13 | 0.23 | ||||||||||||
Year Ended December 31, 2016 | ||||||||||||||||
First Quarter | Second Quarter | Third Quarter | Fourth Quarter | |||||||||||||
(Dollars in thousands, except per share amounts) | ||||||||||||||||
Interest income | $ | 34,235 | $ | 34,592 | $ | 35,114 | $ | 34,571 | ||||||||
Interest expense | 1,475 | 1,507 | 1,508 | 1,516 | ||||||||||||
Net interest income | 32,760 | 33,085 | 33,606 | 33,055 | ||||||||||||
Provision for loan losses | 1,139 | 1,120 | 1,495 | 1,177 | ||||||||||||
Net interest income after provision for loan losses | 31,621 | 31,965 | 32,111 | 31,878 | ||||||||||||
Noninterest income | 6,990 | 6,576 | 9,867 | 8,186 | ||||||||||||
Noninterest expense | 26,369 | 26,477 | 26,818 | 26,809 | ||||||||||||
Income before provision for income taxes | 12,242 | 12,064 | 15,160 | 13,255 | ||||||||||||
Income tax expense | 3,151 | 3,169 | 4,121 | 3,362 | ||||||||||||
Net income | $ | 9,091 | $ | 8,895 | $ | 11,039 | $ | 9,893 | ||||||||
Basic earnings per common share | $ | 0.30 | $ | 0.30 | $ | 0.37 | $ | 0.33 | ||||||||
Diluted earnings per common share | 0.30 | 0.30 | 0.37 | 0.33 | ||||||||||||
Cash dividends declared on common stock | 0.11 | 0.12 | 0.12 | 0.37 | ||||||||||||
(24) | Subsequent Events |
(a) Puget Sound Merger
On January 16, 2018, the Company completed the Puget Sound Merger. Pursuant to the terms of the merger agreement, Puget Sound shareholders received 1.1688 shares of Heritage common stock per share of Puget Sound stock at the per share, closing date price on January 12, 2018 of $31.80. Heritage issued an aggregate of 4,112,347 shares of its common stock in the transaction for total consideration paid of $130.8 million. As of the acquisition date, Puget Sound merged into Heritage and Puget Sound Bank merged into Heritage Bank.
128
The acquisition of the net assets constitutes a business acquisition as defined by FASB ASC 805, Business Combinations. The Business Combinations topic establishes principles and requirements for how the acquirer of a business recognizes and measures in its financial statements the identifiable assets acquired and the liabilities assumed. Accordingly, the estimated fair values of the acquired assets, including the identifiable intangible assets, and the assumed liabilities in the acquisition will be measured and recorded as of the acquisition date.
The operating results of the Company for the year ended December 31, 2017 do not include the operating results produced by the acquired assets and assumed liabilities from Puget Sound as the Puget Sound Merger did not close until January 16, 2018. It is not practical to present financial information related to the assets acquired and liabilities assumed from Puget Sound at this time because the initial fair value information is not available.
(b) DOR Preliminary Findings
In June 2016, the Company received preliminary findings from the Washington State Department of Revenue ("DOR") regarding its business and occupation ("B&O") tax audit on the B&O tax returns of Whidbey Island Bank for the years 2010-2014. A substantial portion of the preliminary findings related to the receipt of FDIC shared-loss payments from the FDIC to Washington Banking Company in connection with its acquisitions of City Bank in April 2010 and North County Bank in September 2010. The total amount of the preliminary finding, along with calculated back interest, was approximately $1.6 million. In January 2018, the Company received notification from the DOR that the B&O tax audit was considered resolved with no payment due. This matter is now considered closed.
ITEM 9. CHANGES IN AND DISAGREEMENTS WITH ACCOUNTANTS ON ACCOUNTING AND FINANCIAL DISCLOSURE
None
ITEM 9A. CONTROLS AND PROCEDURES
Disclosure Controls and Procedures.
Our disclosure controls and procedures are designed to ensure that information the Company must disclose in its reports filed or submitted under the Securities Exchange Act of 1934, as amended (the “Exchange Act”), is recorded, processed, summarized, and reported on a timely basis. Our management has evaluated, with the participation and under the supervision of our chief executive officer (“CEO”) and chief financial officer (“CFO”), the effectiveness of our disclosure controls and procedures (as defined in Rules 13a-15(e) and 15d-15(e) of the Exchange Act) as of the end of the period covered by this report. Based on this evaluation, our CEO and CFO have concluded that, as of such date, the Company’s disclosure controls and procedures are effective in ensuring that information relating to the Company, including its consolidated subsidiaries, required to be disclosed in reports that it files under the Exchange Act is (1) recorded, processed, summarized and reported within the time periods specified in the SEC’s rules and forms, and (2) accumulated and communicated to our management, including our CEO and CFO, as appropriate to allow timely decisions regarding required disclosure.
Internal Control Over Financial Reporting.
(a) Management’s report on internal control over financial reporting.
The Company’s management is responsible for establishing and maintaining adequate internal control over financial reporting. The Company’s internal control system is designed to provide reasonable assurance to our management and the board of directors regarding the preparation and fair presentation of published financial statements. Nonetheless, all internal control systems, no matter how well designed, have inherent limitations. Even systems determined to be effective as of a particular date can provide only reasonable assurance with respect to financial statement preparation and presentation and may not eliminate the need for restatements.
The Company’s management assessed the effectiveness of the Company’s internal control over financial reporting as of December 31, 2017. In making this assessment, management used the criteria set forth by the Committee of Sponsoring Organizations of the Treadway Commission in the 2013 Internal Control—Integrated Framework. Based on our assessment, we believe that, as of December 31, 2017, the Company’s internal control over financial reporting is effective based on these criteria.
Crowe Horwath LLP, an independent registered public accounting firm, has audited the effectiveness of our internal control over financial reporting as of December 31, 2017, and their report is included in “Item 8. Financial Statements and Supplementary Data.”
(b) Attestation report of the registered public accounting firm.
129
See “Item 8. Financial Statements and Supplementary Data.”
(c) Changes in internal control over financial reporting.
There were no significant changes in the Company’s internal control over financial reporting during the fourth quarter of the period covered by this Annual Report on Form 10-K that materially affected, or are reasonably likely to materially affect, the Company’s internal control over financial reporting.
ITEM 9B. OTHER INFORMATION
None
PART III
ITEM 10. DIRECTORS, EXECUTIVE OFFICERS AND CORPORATE GOVERNANCE
Information concerning directors of the registrant is incorporated by reference to the section entitled “Proposal 1 - Election of Directors” of our definitive proxy statement for the annual meeting of shareholders to be held on May 2, 2018 (“Proxy Statement”).
For information regarding the executive officers of the Company, see “Item 1. Business—Executive Officers.”
The required information with respect to compliance with Section 16(a) of the Exchange Act is incorporated by reference to the sections entitled “Security Ownership of Certain Beneficial Owners and Management” and "Section 16(a) Beneficial Ownership Reporting Compliance" of the Proxy Statement.
The Company has adopted a written Code of Ethics that applies to our directors, officers and employees. The Code of Ethics can be accessed electronically by visiting the Company’s website at www.hf-wa.com.
The Audit and Finance Committee of our Board of Directors retains our independent auditors, reviews and approves the scope and results of the audits with the auditors and management, monitors the adequacy of our system of internal controls and reviews the annual report, auditors’ fees and non-audit services to be provided by the independent auditors. The members of our Audit Committee are Deborah J. Gavin, chair of the committee, Brian S. Charneski, John A. Clees and Gragg E. Miller, all of whom are considered “independent” as defined by the SEC. Our Board of Directors has determined that Mrs. Gavin meets the definition of an audit committee financial expert, as determined by the requirements of the SEC.
ITEM 11. EXECUTIVE COMPENSATION
Information concerning executive and director compensation and certain matters regarding participation in the Company’s Compensation Committee required by this item is incorporated by reference to the headings “Executive Compensation,” “Director Compensation,” “Report of the Compensation Committee,” and "CEO Pay Ratio" of the Proxy Statement.
ITEM 12. SECURITY OWNERSHIP OF CERTAIN BENEFICIAL OWNERS AND MANAGEMENT AND RELATED STOCKHOLDER MATTERS
The following table summarizes the consolidated activity within the Company’s stock-based compensation plans as of December 31, 2017, all of which were approved by shareholders.
Plan Category | Number of securities to be issued upon vesting of restricted stock awards | Number of securities to be issued upon vesting of restricted stock units | Number of securities to be issued upon exercise of outstanding options | Weighted- average exercise price of outstanding options | Number of securities remaining available for future issuance under equity compensation plans | |||||||||||
Equity compensation plans, all of which are approved by security holders | 137,399 | 90,544 | 23,231 | $ | 14.21 | 1,072,809 | ||||||||||
130
Information concerning security ownership of certain beneficial owners and management is incorporated by reference to the section entitled “Security Ownership of Certain Beneficial Owners and Management” of the Proxy Statement.
ITEM 13. CERTAIN RELATIONSHIP AND RELATED TRANSACTIONS, AND DIRECTOR INDEPENDENCE
Information concerning certain relationships and related transactions is incorporated by reference to the sections entitled “Meetings and Committees of the Board of Directors" and "Corporate Governance” of the Proxy Statement.
Our common stock is listed on the NASDAQ Global Select Market. In accordance with NASDAQ requirements, at least a majority of our directors must be independent directors. The Board of Directors has determined that 9 of our 10 directors are independent. Only Brian L. Vance, who serves as President and Chief Executive Officer of Heritage Financial Corporation and Chief Executive Officer of Heritage Bank, is not independent.
ITEM 14. PRINCIPAL ACCOUNTING FEES AND SERVICES
Information concerning principal accounting fees and services is incorporated by reference to the section entitled “Proposal 3 - Ratification of the Appointment of Independent Registered Public Accounting Firm” in the Proxy Statement.
PART IV
ITEM 15. EXHIBITS, FINANCIAL STATEMENT SCHEDULES
(a) The following documents are filed as a part of this report:
(1) Financial Statements: The Consolidated Financial Statements are included in Part II. Item 8. Financial Statements and Supplemental Schedules
(2) Financial Statements Schedules: All schedules are omitted because they are not required or applicable, or the required information is shown in the Consolidated Financial Statements or Notes.
(3) Exhibits: Included in schedule below.
Incorporated by Reference | |||||||||
Exhibit No. | Description of Exhibit | Form | Exhibit | Filing Date/Period End Date | |||||
2.1 | 8-K | 2.1 | 8/5/10 | ||||||
2.2 | 8-K | 2.1 | 11/12/10 | ||||||
2.3 | 8-K | 2.1 | 3/12/13 | ||||||
2.4 | 8-K | 2.1 | 10/25/13 | ||||||
2.5 | 8-K | 2.1 | 7/27/17 | ||||||
3.1 | 8-K | 3.1(B) | 5/18/10 | ||||||
3.2 | 8-K | 3.2 | 10/3/16 | ||||||
10.1 | S-8 | 99.1 | 5/24/02 | ||||||
10.2 | S-8 | 99.1 | 5/24/02 | ||||||
10.3 | S-8 | 99.1 | 5/25/06 | ||||||
10.4 | S-8 | 99.1 | 5/25/06 | ||||||
131
10.5 | S-8 | 99.1 | 5/25/06 | ||||||
10.6 | 10-K | 10.5 | 3/9/17 | ||||||
10.7 | S-8 | - | 5/27/10 | ||||||
10.8 | 8-K | 99.2 | 2/1/17 | ||||||
10.9 | DEF 14A | - | 6/11/14 | ||||||
10.10 | 8-K | 99.6 | 2/1/17 | ||||||
10.11 | 10-Q | 10.8 | 8/8/14 | ||||||
10.12 | 8-K | 99.7 | 2/1/17 | ||||||
10.13 | 10-Q | 10.9 | 8/8/14 | ||||||
10.14 | 8-K | 99.4 | 2/1/17 | ||||||
10.15 | 10-Q | 10.10 | 8/8/14 | ||||||
10.16 | 8-K | 99.3 | 2/1/17 | ||||||
10.17 | 8-K | 99.8 | 2/1/17 | ||||||
10.18 | 8-K | 99.5 | 2/1/17 | ||||||
10.19 | 8-K | 10.1 | 12/22/16 | ||||||
10.20 | 8-K | 10.2 | 12/22/16 | ||||||
10.21 | 8-K | 10.3 | 12/22/16 | ||||||
10.22 | 8-K | 10.5 | 9/7/12 | ||||||
10.23 | 8-K | 10.6 | 9/7/12 | ||||||
10.24 | 8-K | 10.7 | 9/7/12 | ||||||
10.25 | 8-K | 10.1 | 9/7/12 | ||||||
10.26 | 8-K | 10.2 | 9/7/12 | ||||||
10.27 | 8-K | 10.3 | 9/7/12 | ||||||
10.28 | 8-K | 10.5 | 12/22/16 | ||||||
10.29 | 8-K | 10.1 | 1/6/14 | ||||||
132
10.30 | 8-K | 10.2 | 1/6/14 | ||||||
10.31 | S-4 | 1/24/14 | |||||||
10.32 | 8-K | 10.4 | 12/22/16 | ||||||
10.33 | 10-K | 10.16 | 3/11/15 | ||||||
10.34 | 10-Q | 10.17 | 8/6/15 | ||||||
10.35 | 8-K | 10.1 | 12/22/15 | ||||||
11 | Statement regarding computation of earnings per share (2) | ||||||||
14.0 | Code of Ethics and Conduct Policy (3) | ||||||||
21.0 | |||||||||
23.0 | |||||||||
24.0 | |||||||||
31.1 | |||||||||
31.2 | |||||||||
32.1 | |||||||||
101.INS | XBRL Instance Document (1) | ||||||||
101.SCH | XBRL Taxonomy Extension Schema Document (1) | ||||||||
101.CAL | XBRL Taxonomy Extension Calculation Linkbase Document (1) | ||||||||
101.DEF | XBRL Taxonomy Extension Definition Linkbase Document (1) | ||||||||
101.LAB | XBRL Taxonomy Extension Label Linkbase Document (1) | ||||||||
101.PRE | XBRL Taxonomy Extension Presentation Linkbase Document (1) | ||||||||
(1) Filed herewith.
(2) Reference is made to Note (16) Stockholders' Equity in the Notes to Consolidated Financial Statements under Part II. Item 8. herein.
(3) Registrant elects to satisfy Regulation S-K §229.406(c) by posting its Code of Ethics on its website at www.HF-WA.com in the section titled Overview: Governance Documents.
ITEM 16. FORM 10-K SUMMARY
None.
133
SIGNATURES
Pursuant to the requirements of Section 13 or 15(d) of the Securities Exchange Act of 1934, the registrant has duly caused this report to be signed on its behalf by the undersigned, thereunto duly authorized, on February 28, 2018.
HERITAGE FINANCIAL CORPORATION | ||
(Registrant) | ||
/S/ BRIAN L. VANCE | ||
Brian L. Vance | ||
President and Chief Executive Officer | ||
Pursuant to the requirements of the Securities Exchange Act of 1934, this report has been signed below by the following persons on behalf of the registrant and in the capacities indicated on February 28, 2018.
Principal Executive Officer: | |||
/S/ BRIAN L. VANCE | |||
Brian L. Vance | |||
President and Chief Executive Officer | |||
Principal Financial Officer: | |||
/S/ DONALD J. HINSON | |||
Donald J. Hinson | |||
Executive Vice President and Chief Financial Officer | |||
Brian L. Vance, pursuant to a power of attorney that is being filed with the Annual Report on Form 10-K, has signed this report as attorney in fact for the following directors who constitute a majority of the Board. | |||
Brian S. Charneski | |||
John A. Clees | |||
Kimberly T. Ellwanger | |||
Deborah J. Gavin | |||
Jeffrey S. Lyon | |||
Gragg E. Miller | |||
Anthony B. Pickering | |||
Ann Watson | |||
Stephen A. Dennis | |||
By | |||
/S/ BRIAN L. VANCE | |||
Brian L. Vance | |||
Attorney-in-Fact | |||
February 28, 2018 | |||
134