Attached files
Table of Contents
UNITED STATES
SECURITIES AND EXCHANGE COMMISSION
Washington, D.C. 20549
FORM 10-K
| x | ANNUAL REPORT PURSUANT TO SECTION 13 OR 15(d) OF THE SECURITIES EXCHANGE ACT OF 1934 |
For the fiscal year ended December 31, 2010
| ¨ | TRANSITION REPORT PURSUANT TO SECTION 13 OR 15(d) OF THE SECURITIES EXCHANGE ACT OF 1934 |
Commission File No. 0-29480
HERITAGE FINANCIAL CORPORATION
(Exact name of registrant as specified in its charter)
| Washington | 91-1857900 | |
| (State or other jurisdiction of incorporation or organization) |
(IRS Employer Identification No.) | |
| 201 Fifth Avenue SW, Olympia, Washington | 98501 | |
| (Address of principal executive offices) | (Zip Code) | |
(360) 943-1500
(Registrant’s telephone number, including area code)
Securities registered pursuant to Section 12(b) of the Act:
| Title of each class |
Name of each exchange on which registered | |
| Common Stock | NASDAQ Stock Market LLC |
Securities registered pursuant to Section 12(g) of the Act:
None
Indicate by check mark if the registrant is a well-known seasoned issuer, as defined in Rule 405 of the Securities Act. Yes ¨ No x
Indicate by check mark if the registrant is not required to file reports pursuant to Section 13 or Section 15(d) of the Act. Yes ¨ No x
Indicate by check mark whether the registrant (1) has filed all reports required to be filed by Section 13 or 15(d) of the Securities Exchange Act of 1934 during the preceding 12 months (or for such shorter period that the registrant was required to file such reports), and (2) has been subject to such filing requirements for the past 90 days. Yes x No ¨
Indicate by check mark whether the registrant has submitted electronically and posted on its corporate Web site, if any, every Interactive Data File required to be submitted and posted pursuant to Rule 405 of Regulation S-T (§232.405 of this chapter) during the preceding 12 months (or for such shorter period that the registrant was required to submit and post such files). Yes ¨ No ¨
Indicate by check mark if disclosure of delinquent filers pursuant to Item 405 of Regulation S-K (§229.405 of this chapter) is not contained herein, and will not be contained, to the best of the registrant’s knowledge, in definitive proxy or information statements incorporated by reference in Part III of this Form 10-K or any amendment to this Form 10-K. ¨
Indicate by check mark whether the registrant is a large accelerated filer, an accelerated filer, a non-accelerated filer, or a smaller reporting company. See the definitions of “large accelerated filer,” “accelerated filer” and “smaller reporting company” in Rule 12b-2 of the Exchange Act.
Large accelerated filer ¨ Accelerated filer x Non-accelerated filer ¨ Smaller reporting company ¨
Indicate by check mark whether the registrant is a shell company (as defined in Rule 12b-2 of the Exchange Act). Yes ¨ No x
The aggregate market value of the voting and non-voting common equity held by non-affiliates of the registrant was $149,974,370 and was based upon the last sales price as quoted on the NASDAQ Stock Market for June 30, 2010.
The registrant had 15,571,857 shares of common stock outstanding as of February 11, 2011.
DOCUMENTS INCORPORATED BY REFERENCE
Portions of the registrant’s definitive Proxy Statement for the 2011 Annual Meeting of Shareholders will be incorporated by reference into Part III of this Form 10-K.
Table of Contents
HERITAGE FINANCIAL CORPORATION
FORM 10-K
December 31, 2010
| Page | ||||||
| PART I | ||||||
| ITEM 1. |
3 | |||||
| ITEM 1A. |
27 | |||||
| ITEM 1B. |
36 | |||||
| ITEM 2. |
37 | |||||
| ITEM 3. |
37 | |||||
| ITEM 4. |
37 | |||||
| PART II | ||||||
| ITEM 5. |
38 | |||||
| ITEM 6. |
40 | |||||
| ITEM 7. |
MANAGEMENT’S DISCUSSION AND ANALYSIS OF FINANCIAL CONDITION AND RESULTS OF OPERATIONS |
42 | ||||
| ITEM 7A. |
57 | |||||
| ITEM 8. |
57 | |||||
| ITEM 9. |
CHANGES IN AND DISAGREEMENTS WITH ACCOUNTANTS ON ACCOUNTING AND FINANCIAL DISCLOSURE |
57 | ||||
| ITEM 9A. |
58 | |||||
| ITEM 9B. |
60 | |||||
| PART III | ||||||
| ITEM 10. |
61 | |||||
| ITEM 11. |
61 | |||||
| ITEM 12. |
SECURITY OWNERSHIP OF CERTAIN BENEFICIAL OWNERS AND MANAGEMENT AND RELATED STOCKHOLDER MATTERS |
61 | ||||
| ITEM 13. |
CERTAIN RELATIONSHIPS AND RELATED TRANSACTIONS; AND DIRECTOR INDEPENDENCE |
62 | ||||
| ITEM 14. |
62 | |||||
| PART IV | ||||||
| ITEM 15. |
63 | |||||
| 65 | ||||||
2
Table of Contents
| ITEM 1. | BUSINESS |
General
Heritage Financial Corporation (the “Company”) is a bank holding company that was incorporated in the State of Washington in August 1997. We were organized for the purpose of acquiring all of the capital stock of Heritage Savings Bank upon our reorganization from a mutual holding company form of organization to a stock holding company form of organization. Effective September 1, 2004, Heritage Savings Bank switched its charter from a state chartered savings bank to a state chartered commercial bank and changed its legal name from Heritage Savings Bank to Heritage Bank. Effective September 1, 2005, Central Valley Bank (acquired by the Company in March 1999) changed its charter from a nationally chartered commercial bank to a state chartered commercial bank.
In June 2006, the Company completed the acquisition of Western Washington Bancorp and its wholly owned subsidiary, Washington State Bank, N.A. Washington State Bank, N.A. was merged into Heritage Bank on the date of acquisition. Effective July 30, 2010, Heritage Bank entered into a definitive agreement with the Federal Deposit Insurance Corporation (the “FDIC”), pursuant to which Heritage Bank acquired certain assets and assumed certain liabilities of Cowlitz Bank, a Washington state-chartered bank headquartered in Longview, Washington (the “Cowlitz Acquisition”). The Cowlitz Acquisition included nine branches of Cowlitz Bank, including its division Bay Bank, which opened as branches of Heritage Bank on Monday, August 2, 2010. The acquisition also included the Trust Services Division of Cowlitz Bank. Effective November 5, 2010, Heritage Bank entered into a definitive agreement with the FDIC, pursuant to which Heritage Bank acquired certain assets and assumed certain liabilities of Pierce Commercial Bank, a Washington state-chartered bank headquartered in Tacoma, Washington (the “Pierce Commercial Acquisition”). The Pierce Commercial Acquisition included one branch, which opened as a branch of Heritage Bank on Monday, November 8, 2010.
We are primarily engaged in the business of planning, directing, and coordinating the business activities of our wholly owned subsidiaries: Heritage Bank and Central Valley Bank (the “Banks”). The deposits of Heritage Bank and Central Valley Bank are insured by the FDIC. Heritage Bank conducts business from its main office in Olympia, Washington and its twenty-five branch offices located in western Washington and the greater Portland, Oregon area. Central Valley Bank conducts business from its main office in Toppenish, Washington and its five branch offices located in Yakima and Kittitas counties of Washington State.
Our business consists primarily of lending and deposit relationships with small businesses and their owners in our market areas, and attracting deposits from the general public. We also make residential and commercial construction, income property, and consumer loans and originate for sale or investment purposes first mortgage loans on residential properties located in western and central Washington State and the greater Portland, Oregon area.
On November 2008, the Company entered into a Letter Agreement and Securities Purchase Agreement (collectively, the “Purchase Agreement”) with the U.S. Department of the Treasury (“Treasury”) under the Troubled Asset Relief Program Capital Purchase Plan, pursuant to which the Company sold (i) 24,000 shares of the Company’s Fixed Rate Cumulative Perpetual Preferred Stock, Series A (“Series A Preferred Stock”) and (ii) a warrant (the “Warrant”) to purchase 276,074 shares of the Company’s common stock at $13.04 per share for an aggregate purchase price of $24.0 million in cash. On September 22, 2009, the Company completed the sale of 4.3 million shares of common stock in a public offering. The purchase price was $11.50 per share and net proceeds from the sale totaled approximately $46.6 million. Under the terms of the Warrant, because the Company’s September 22, 2009 offering of common stock was a “qualified equity offering” resulting in aggregate gross proceeds of at least $24.0 million, the number of shares of our common stock underlying the Warrant was reduced by 50% to 138,037 shares.
3
Table of Contents
In December 2010, the Company completed the sale of 4.4 million shares of common stock in a public offering. The purchase price was $13.00 per share and net proceeds from the sale totaled approximately $57.6 million.
In December 2010 the Company redeemed the 24,000 shares of its Series A Preferred Stock. The Company paid the Treasury a total of $24.1 million, consisting of $24.0 million of principal and $123,000 of accrued and unpaid dividends. The Warrant is still held by the Treasury and remains outstanding at December 31, 2010.
Market Areas
We offer financial services to meet the needs of the communities we serve through our community-oriented financial institutions. Headquartered in Olympia, Thurston County, Washington, we conduct business through Heritage Bank and Central Valley Bank. Heritage Bank conducts business from its main office in Olympia, Washington and its twenty-five branch offices located in western Washington and the greater Portland, Oregon area. Mortgage loan operations are performed in one office located in Thurston County. Central Valley Bank operates six full service offices, with five in Yakima County and one in Kittitas County.
Lending Activities
General. Our lending activities are conducted through Heritage Bank and Central Valley Bank. We offer residential and commercial construction, multifamily and commercial real estate, and consumer loans and originate for sale or investment purposes first mortgage loans on residential properties. Our focus is on commercial business lending with commercial and industrial loans totaling $392.3 million, or 52.8% of total originated loans, as of December 31, 2010 and $408.6 million, or 52.8% of total originated loans, as of December 31, 2009 and non-owner occupied commercial real estate totaling $221.7 million, or 29.9% of total originated loans, as of December 31, 2010 and $194.6 million, or 25.2% of total originated loans, as of December 31, 2009. We continue to provide one-to-four residential mortgages and real estate construction and land development loans, both single and multifamily residential and commercial. One-to-four residential mortgages totaled $48.3 million, or 6.5% of total originated loans, at December 31, 2010, and $54.4 million, or 7.0% of total originated loans, at December 31, 2009. Real estate construction and land development loans totaled $58.0 million, or 7.8% of total originated loans, at December 31, 2010, and $95.7 million, or 12.4% of total originated loans, at December 31, 2009.
Our lending operations are guided by policies and guidelines that are reviewed and approved annually by our board of directors. These policies and guidelines address the types of loans, underwriting standards, structure and rate considerations, and compliance with laws, regulations and internal lending limits. We conduct post-approval reviews on selected loans and routinely engage external loan specialists to perform reviews of our loan portfolio to check for credit quality, proper documentation and compliance with laws and regulations.
4
Table of Contents
The following table provides information about our loan portfolio by type of loan for the dates indicated. These balances are prior to deduction for the allowance for loan losses.
| At December 31, | ||||||||||||||||||||||||||||||||||||||||
| 2010 | 2009 | 2008 | 2007 | 2006 | ||||||||||||||||||||||||||||||||||||
| Balance | % of Total Originated Loans |
Balance | % of Total Originated Loans |
Balance | % of Total Originated Loans |
Balance | % of Total Originated Loans |
Balance (3) |
% of Total Originated Loans |
|||||||||||||||||||||||||||||||
| (Dollars in thousands) | ||||||||||||||||||||||||||||||||||||||||
| Originated Loans: |
||||||||||||||||||||||||||||||||||||||||
| Commercial business: |
||||||||||||||||||||||||||||||||||||||||
| Commercial and industrial(4)(5) |
$ | 392,301 | 52.8 | % | $ | 408,622 | 52.8 | % | $ | 410,657 | 50.9 | % | $ | 388,483 | 49.8 | % | $ | 367,160 | 49.0 | % | ||||||||||||||||||||
| Non-owner occupied commercial real estate(4) |
221,739 | 29.9 | 194,613 | 25.2 | 190,706 | 23.5 | 196,637 | 25.2 | 199,652 | 26.6 | ||||||||||||||||||||||||||||||
| Total commercial business |
614,040 | 82.7 | 603,235 | 78.0 | 601,363 | 74.4 | 585,120 | 75.0 | 566,812 | 75.6 | ||||||||||||||||||||||||||||||
| One-to-four family |
48,269 | 6.5 | 54,448 | 7.0 | 57,535 | 7.1 | 57,579 | 7.4 | 54,644 | 7.3 | ||||||||||||||||||||||||||||||
| Real estate construction and land development: |
||||||||||||||||||||||||||||||||||||||||
| One-to-four family residential |
29,377 | 4.0 | 46,060 | 6.0 | 71,159 | 8.8 | 82,165 | 10.6 | 85,635 | 11.4 | ||||||||||||||||||||||||||||||
| Multifamily residential and commercial properties |
28,588 | 3.8 | 49,665 | 6.4 | 59,572 | 7.3 | 40,342 | 5.2 | 32,037 | 4.3 | ||||||||||||||||||||||||||||||
| Total Real estate construction and land development(2) |
57,965 | 7.8 | 95,725 | 12.4 | 130,731 | 16.1 | 122,507 | 15.8 | 117,672 | 15.7 | ||||||||||||||||||||||||||||||
| Consumer |
23,832 | 3.2 | 21,261 | 2.8 | 21,255 | 2.6 | 16,641 | 2.1 | 12,976 | 1.7 | ||||||||||||||||||||||||||||||
| Gross originated loans |
744,106 | 100.2 | 774,669 | 100.2 | 810,884 | 100.2 | 781,847 | 100.3 | 752,104 | 100.3 | ||||||||||||||||||||||||||||||
| Less: deferred loan fees |
(1,323 | ) | (0.2 | ) | (1,597 | ) | (0.2 | ) | (1,854 | ) | (0.2 | ) | (2,081 | ) | (0.3 | ) | (2,403 | ) | (0.3 | ) | ||||||||||||||||||||
| Total originated loans |
742,783 | 100.0 | % | 773,072 | 100.0 | % | 809,030 | 100.0 | % | 779,766 | 100.0 | % | 749,701 | 100.0 | % | |||||||||||||||||||||||||
| Purchased covered loans |
128,715 | — | — | — | — | |||||||||||||||||||||||||||||||||||
| Purchased non-covered loans |
131,049 | — | — | — | — | |||||||||||||||||||||||||||||||||||
| Total loans receivable and loans held for sale, net |
$ | 1,002,547 | $ | 773,072 | $ | 809,030 | $ | 779,766 | $ | 749,701 | ||||||||||||||||||||||||||||||
| (1) | Includes loans held for sale of $764,000, $825,000, $304,000, $447,000, and $0 as of December 31, 2010, 2009, 2008, 2007, and 2006, respectively. |
| (2) | Balances are net of undisbursed loan proceeds. |
| (3) | The June 2006 acquisition of Western Washington Bancorp included $41.5 million in total loans. |
| (4) | During the year ended December 31, 2009 certain loan balances previously categorized as commercial business were reclassified as multifamily residential and commercial properties. The amounts reclassified were $33.2 million, $32.9 million, and $31.0 million as of December 31, 2008, 2007, and 2006, respectively. |
| (5) | Commercial and industrial loans include owner-occupied commercial real estate |
The following table presents at December 31, 2010 (i) the aggregate contractual maturities of loans in the named categories of our loan portfolio and (ii) the aggregate amounts of fixed rate and variable or adjustable rate loans in the named categories that mature after one year.
| Maturing | ||||||||||||||||
| Within 1 year |
1-5 years | After 5 years |
Total | |||||||||||||
| (In thousands) | ||||||||||||||||
| Commercial business |
$ | 184,008 | $ | 236,560 | $ | 382,000 | $ | 802,568 | ||||||||
| Real estate construction and land development |
44,602 | 25,378 | 355 | 70,335 | ||||||||||||
| Total |
$ | 228,610 | $ | 261,938 | $ | 382,355 | $ | 872,903 | ||||||||
| Fixed rate loans |
$ | 191,552 | $ | 329,228 | $ | 520,780 | ||||||||||
| Variable or adjustable rate loans |
70,386 | 53,127 | 123,513 | |||||||||||||
| Total |
$ | 261,938 | $ | 382,355 | $ | 644,293 | ||||||||||
5
Table of Contents
Commercial Business Lending
We offer different types of commercial business loans to a variety of businesses. The types of commercial loans offered are business lines of credit, term equipment financing and term owner-occupied real estate loans. We also originate loans that are guaranteed by the Small Business Administration (“SBA”) and Heritage Bank is a “preferred lender” of the SBA. Before extending credit to a business we look closely at the borrower’s management ability, financial history, including cash flow of the borrower and all guarantors, and the liquidation value of the collateral. Emphasis is placed on having a comprehensive understanding of the borrower’s global cash flow and performing necessary financial due diligence.
We originate commercial real estate loans within our primary market areas. Owner-occupied commercial real estate loans are preferred. Our underwriting standards require that commercial real estate loans not exceed 75% of the lower of appraised value at origination or cost, of the underlying collateral. Cash flow coverage to debt servicing requirements is generally a minimum of 1.10 times for multifamily loans and 1.15 times for commercial real estate loans. Cash flow coverage is calculated using an interest rate equal to the note rate plus 2%.
Commercial real estate loans typically involve a greater degree of risk than single-family residential mortgage loans. Payments on loans secured by commercial real estate properties are dependent on successful operation and management of the properties and repayment of these loans are affected by adverse conditions in the real estate market or the economy. We seek to minimize these risks by strictly scrutinizing the financial condition of the borrower, the quality and value of the collateral, and the management of the property securing the loan. We also generally obtain personal guarantees from the owners of the collateral after a thorough review of personal financial statements. In addition, we review our commercial real estate loan portfolio annually for performance of individual loans, and stress loans for potential changes in interest rates, occupancy, and collateral values.
See “Risk Factors—Our loan portfolio is concentrated in loans with a higher risk of loss—Repayment of our commercial and industrial loans as well as owner-occupied commercial real estate loans, is often dependent on the cash flows of the borrower, which may be unpredictable, and the collateral securing these loans may fluctuate in value.” See also “Risk Factors—Our loan portfolio is concentrated in loans with a higher risk of loss—Our non-owner occupied commercial real estate loans, which includes multifamily real estate loans, involve higher principal amounts than other loans and repayment of these loans may be dependent on factors outside our control or the control of our borrowers.”
One-to-Four Family Residential Mortgages
The majority of our one-to four-family residential loans are secured by single-family residences located in our primary market areas. Our underwriting standards require that single-family portfolio loans generally are owner-occupied and do not exceed 80% of the lower of appraised value at origination or cost of the underlying collateral. Terms typically range from 15 to 30 years. We generally sell most single-family loans in the secondary market. Management determines to what extent we will retain or sell these loans and other fixed rate mortgages in order to control the Banks’ interest rate sensitivity position, growth and liquidity. See “Management’s Discussion and Analysis of Financial Condition and Results of Operations—Asset/Liability Management.”
Real estate construction and land development
We originate single-family residential construction loans for the construction of custom homes (where the home buyer is the borrower). We also provide financing to builders for the construction of pre-sold homes and, in selected cases, to builders for the construction of speculative residential property. Because of the higher risks currently involved in the residential construction industry, our lending to builders is limited to those who have
6
Table of Contents
demonstrated a favorable record of performance and who are building in markets that management understands. We further endeavor to limit our construction lending risk through adherence to strict underwriting guidelines and procedures. Speculative construction loans are short term in nature and priced with a variable rate of interest. We require builders to have tangible equity in each construction project, have prompt and thorough documentation of all draw requests and we inspect the project prior to paying any draw requests.
See “Risk Factors—Our loan portfolio is concentrated in loans with a higher risk of loss—Our Real estate construction and land development loans are based upon estimates of costs and value associated with the complete project. These estimates may be inaccurate.”
Origination and Sales of Residential Mortgage Loans
Consistent with our asset/liability management strategy, we sell a significant portion of our residential mortgage loans to the secondary market. Commitments to sell mortgage loans generally are made during the period between the taking of the loan application and the closing of the mortgage loan. Most of these sale commitments are made on a “best efforts” basis whereby we are only obligated to sell the mortgage if the mortgage loan is approved and closed. As a result, management believes that market risk is minimal. In addition, some of our mortgage loan production is brokered to other lenders prior to funding.
When we sell mortgage loans, we typically sell the servicing of the loans (i.e., collection of principal and interest payments). However, we serviced $115,000, $131,000, and $233,000 in mortgage loans for others as of December 31, 2010, 2009, and 2008, respectively. We received fee income for servicing activities on mortgage loans of $0, $1,000, and $1,000 for the years ended December 31, 2010, 2009 and 2008, respectively.
The following table presents summary information concerning our origination and sale of residential mortgage loans and the gains achieved on such activities.
| Years Ended December 31, | ||||||||||||||||||||
| 2010 | 2009 | 2008 | 2007 | 2006 | ||||||||||||||||
| (In thousands) | ||||||||||||||||||||
| Residential mortgage loans: |
||||||||||||||||||||
| Originated |
$ | 18,605 | $ | 16,981 | $ | 16,177 | $ | 4,963 | $ | 8,593 | ||||||||||
| Sold |
16,125 | 16,460 | 16,320 | 4,516 | 8,856 | |||||||||||||||
| Gains on sales of loans, net |
$ | 226 | $ | 288 | $ | 265 | $ | 64 | $ | 133 | ||||||||||
Commitments and Contingent Liabilities
In the ordinary course of business, we enter into various types of transactions that include commitments to extend credit that are not included in our consolidated financial statements. We apply the same credit standards to these commitments as we use in all our lending activities and have included these commitments in our lending risk evaluations. Our exposure to credit loss under commitments to extend credit is represented by the amount of these commitments.
7
Table of Contents
The following table presents outstanding commitments to extend credit, including letters of credit, at the indicated date.
| December 31, 2010 |
||||
| (In thousands) | ||||
| Commercial business: |
||||
| Commercial and industrial |
$ | 147,022 | ||
| Owner-occupied commercial real estate |
2,977 | |||
| Non-owner occupied commercial real estate |
6,712 | |||
| Total commercial business |
156,711 | |||
| One-to-four family residential |
44 | |||
| Real estate construction and land development: |
||||
| One-to-four family residential |
3,542 | |||
| Five or more family residential and commercial properties |
11,595 | |||
| Total real estate construction and land development |
15,137 | |||
| Consumer |
40,640 | |||
| Total outstanding commitments |
$ | 212,532 | ||
Delinquencies and Nonperforming Assets
Delinquency Procedures. We send a borrower a delinquency notice 15 days after the due date when the borrower fails to make a required payment on a loan. If the delinquency is not brought current, additional delinquency notices are mailed at 30 and 45 days for commercial loans. Additional written and oral contacts are made with the borrower between 60 and 90 days after the due date.
If a real estate loan payment is past due for 45 days or more, the collection manager may perform a review of the condition of the property if suspect. We may negotiate and accept a repayment program with the borrower, accept a voluntary deed in lieu of foreclosure or, when considered necessary, begin foreclosure proceedings. If foreclosed on, real property is sold at a public sale and we bid on the property to protect our interest. A decision as to whether and when to begin foreclosure proceedings is based on such factors as the amount of the outstanding loan in relation to the value of the property securing the original indebtedness, the extent of the delinquency, and the borrower’s ability and willingness to cooperate in resolving the delinquency.
Real estate acquired by us is classified as other real estate owned until it is sold. When property is acquired, it is recorded at the estimated fair value (less costs to sell) at the date of acquisition, not to exceed net realizable value, and any resulting write-down is charged to the allowance for loan losses. Upon acquisition, all costs incurred in maintaining the property are expensed. Costs relating to the development and improvement of the property, however, are capitalized to the extent of the property’s net realizable value.
Delinquencies in the commercial business loan portfolio are handled on a case-by-case basis. Generally, notices are sent and personal contact is made with the borrower when the loan is 15 days past due. Loan officers are responsible for collecting loans they originate or which are assigned to them. Depending on the nature of the loan and the type of collateral securing the loan, we may negotiate and accept a modified payment program or take other actions as circumstances warrant.
Classification of Loans. Federal regulations require that our banks periodically evaluate the risks inherent in their respective loan portfolios. In addition, the Division of Banks of the Washington State Department of Financial Institutions (“Division”) and the FDIC have authority to identify problem loans and, if appropriate, require them to be reclassified. There are three classifications for problem loans: Substandard, Doubtful, and Loss. Substandard loans have one or more defined weaknesses and are characterized by the distinct possibility
8
Table of Contents
that the institution will sustain some loss if the deficiencies are not corrected. Doubtful loans have the weaknesses of Substandard loans, with additional characteristics that the weaknesses make collection or liquidation in full on the basis of currently existing facts, conditions, and values questionable. There is a high possibility of loss in loans classified as Doubtful. A loan classified as Loss is considered uncollectible and of such little value that continuance as a loan of the institution is not warranted. If a loan or a portion of the loan is classified as Loss, the institution must charge-off this amount. We also have loans we classify as Watch and Other Assets Especially Mentioned (“OAEM”). Loans classified as Watch are performing assets but have elements of risk that require more monitoring than other performing loans. Loans classified as OAEM are assets that continue to perform but have shown deterioration in credit quality and require close monitoring.
The Banks routinely test their problem loans for potential impairment. A loan is considered impaired when, based on current information and events, it is probable that the Banks will be unable to collect all amounts due according to the original contractual terms of the loan agreement. Problem loans that may be impaired are identified using the Banks’ normal loan review procedures, which include post-approval reviews, monthly reviews by credit administration of criticized loan reports, scheduled internal reviews, underwriting during extensions and renewals and the analysis of information routinely received on a borrower’s financial performance.
Impairment is measured using the present value of expected future cash flows, discounted at the loan’s effective interest rate, unless the loan is collateral dependent, in which case impairment is measured using the fair value of the collateral after deducting appropriate collateral disposition costs. Furthermore, when it is practically expedient, impairment is measured by the fair market price of the loan.
Subsequent to an initial measure of impairment, if there is a significant change in the amount or timing of a loan’s expected future cash flows or a change in the value of collateral or market price of a loan, based on new information received, the impairment is recalculated. However, the net carrying value of a loan never exceeds the recorded investment in the loan.
9
Table of Contents
Nonperforming Assets. Nonperforming assets consist of nonaccrual loans, restructured loans, and other real estate owned. The following table provides information about our originated nonaccrual loans, restructured loans, and other real estate owned for the indicated dates.
| At December 31, | ||||||||||||||||||||
| 2010 | 2009 | 2008 | 2007 | 2006 | ||||||||||||||||
| (Dollars in thousands) | ||||||||||||||||||||
| Nonaccrual originated loans: |
||||||||||||||||||||
| Commercial business |
$ | 10,839 | $ | 9,728 | $ | 1,176 | $ | 33 | $ | 2,801 | ||||||||||
| One-to-four family residential properties |
2 | — | — | — | — | |||||||||||||||
| Real estate construction and land development |
15,642 | 25,108 | 2,221 | 949 | — | |||||||||||||||
| Consumer |
— | — | — | 39 | 6 | |||||||||||||||
| Total nonaccrual originated loans(1)(2) |
26,483 | 34,836 | 3,397 | 1,021 | 2,807 | |||||||||||||||
| Restructured originated loans: |
||||||||||||||||||||
| One-to-four family residential |
394 | 425 | — | — | — | |||||||||||||||
| Total restructured originated loans |
394 | 425 | — | — | — | |||||||||||||||
| Total nonperforming originated loans |
26,877 | 35,261 | 3,397 | 1,021 | 2,807 | |||||||||||||||
| Other real estate owned |
3,030 | 704 | 2,031 | 169 | 225 | |||||||||||||||
| Total nonperforming originated assets |
$ | 29,907 | $ | 35,965 | $ | 5,428 | $ | 1,190 | $ | 3,032 | ||||||||||
| Accruing originated loans past due 90 days or more |
$ | 1,221 | $ | 277 | $ | 664 | $ | 2,084 | $ | — | ||||||||||
| Potential problem originated loans(3) |
$ | 56,088 | $ | 53,086 | $ | 43,061 | $ | 22,023 | $ | 5,509 | ||||||||||
| Allowance for loan losses |
$ | 22,062 | $ | 26,164 | $ | 15,423 | $ | 10,374 | $ | 10,105 | ||||||||||
| Nonperforming originated loans to total originated loans(4) |
3.19 | % | 4.27 | % | 0.42 | % | 0.13 | % | 0.37 | % | ||||||||||
| Allowance for loan losses to total originated loans |
2.97 | % | 3.38 | % | 1.91 | % | 1.33 | % | 1.35 | % | ||||||||||
| Allowance for loan losses to nonperforming originated loans(4) |
93.16 | % | 79.34 | % | 454.02 | % | 1,016.06 | % | 360.05 | % | ||||||||||
| Nonperforming originated assets to total originated assets(4) |
2.41 | % | 3.32 | % | 0.57 | % | 0.13 | % | 0.36 | % | ||||||||||
| (1) | $9.1 million and $17.0 million of nonaccrual loans were considered troubled debt restructures at December 31, 2010 and 2009, respectively. There were no troubled debt restructures at December 31, 2008, 2007 and 2006. |
| (2) | $3.2 million and $2.3 million of nonaccrual loans were guaranteed by government agencies at December 31, 2010 and 2009, respectively. |
| (3) | $5.9 million and $7.2 million of potential problem originated loans were guaranteed by government agencies at December 31, 2010 and 2009, respectively. |
| (4) | Excludes portions guaranteed by government agencies. |
Nonaccrual Loans. Our financial statements are prepared on the accrual basis of accounting, including the recognition of interest income on our loan portfolio, unless a loan is placed on nonaccrual status. Loans are considered to be impaired and are placed on nonaccrual status when there are serious doubts about the collectability of principal or interest. Our policy is to place a loan on nonaccrual status when the loan becomes past due for 90 days or more, is less than fully collateralized, and is not in the process of collection. Amounts received on nonaccrual loans generally are applied first to principal and then to interest only after all principal has been collected.
The decrease of $8.4 million in nonaccrual originated loans at December 31, 2010 compared to December 31, 2009 was primarily attributable to $16.7 million in charge-offs of which $8.1 million related to nonperforming commercial business loans and $8.3 million related to nonperforming construction loans.
10
Table of Contents
At December 31, 2010, our largest originated nonaccrual relationship to one borrower had nonaccrual loans in the amount of $8.3 million. These loans, which were placed on nonaccrual status in 2009, are to a builder/developer of single family homes/lots primarily in Pierce County, Washington. Pierce County has had a significant slowdown in home sales and this slowdown has affected the borrower’s ability to sell lots and repay the loans as originally planned. We believe we are adequately reserved for these loans at this time.
At December 31, 2010, our second largest originated nonaccrual relationship to one borrower had nonaccrual loans in the amount of $5.9 million. The loans, which were categorized as potential problem loans at December 31, 2009, are to a builder/developer of a condominium project in Pierce County, Washington. While the Company has appraisals which justify current carrying values, these loans were placed on nonaccrual status due to the slow rate at which the individual units are selling. While at this time we believe we have adequately reserved for these loans, should property values continue to deteriorate, additional loss provisions may be necessary.
Troubled Debt Restructures. Loans where the terms have been modified in order to grant a concession to a borrower that is experiencing financial difficulty are identified as a Troubled Debt Restructures (“TDRs”). TDRs are considered impaired and are reported as such. At December 31, 2010 we had $9.1 million of TDRs.
Potential Problem Loans. Potential problem loans are those loans that are currently accruing interest and are not considered impaired, but which we are monitoring because the financial information of the borrower causes us concerns as to their ability to comply with their loan repayment terms. Loans that are past due 90 days or more and still accruing interest are both well secured and in the process of collection.
Potential problem loans increased $3.5 million to $56.6 million at December 31, 2010 from $53.1 million at December 31, 2009. The increase in potential problem loans was primarily due to one credit relationship totaling $9.6 million consisting of multifamily and other commercial real estate loans that was downgraded during the year ended December 31, 2010.
Analysis of Allowance for Loan and Lease Losses
Management maintains an allowance for loan and lease losses (“ALLL”) to provide for estimated credit losses inherent in the loan portfolio. The adequacy of the ALLL is monitored through our ongoing quarterly loan quality assessments.
We assess the estimated credit losses inherent in our loan portfolio by considering a number of elements including:
| • | Historical loss experience in a number of homogeneous segments of the loan portfolio; |
| • | The impact of environmental factors, including: |
| • | Levels of and trends in delinquencies and impaired loans; |
| • | Levels and trends in charge-offs and recoveries; |
| • | Effects of changes in risk selection and underwriting standards, and other changes in lending policies, procedures and practices; |
| • | Experience, ability, and depth of lending management and other relevant staff; |
| • | National and local economic trends and conditions; |
| • | External factors such as competition, legal, and regulatory; and |
| • | Effects of changes in credit concentrations. |
We calculate an adequate ALLL for the non-classified and classified performing loans in our loan portfolio by applying historical loss factors for homogeneous segments of the portfolio, adjusted for changes to the above-
11
Table of Contents
noted environmental factors. We may record specific provisions for impaired loans, including loans on nonaccrual status and TDRs, after a careful analysis of each loan’s credit and collateral factors. Our analysis of an adequate ALLL combines the provisions made for our non-classified loans, classified loans, and the specific provisions made for each impaired loan.
While we believe we use the best information available to determine the allowance for loan losses, results of operations could be significantly affected if circumstances differ substantially from the assumptions used in determining the allowance. A further decline in local and national economic conditions, or other factors, could result in a material increase in the allowance for loan losses and may adversely affect the Company’s financial conditions and results of operations. In addition, the determination of the amount of the allowance for loan losses is subject to review by bank regulators, as part of the routine examination process, which may result in the establishment of additional reserves based upon their judgment of information available to them at the time of their examination.
The following table provides information regarding changes in our allowance for loan losses for the indicated periods:
| Years Ended December 31, | ||||||||||||||||||||
| 2010 | 2009 | 2008 | 2007 | 2006 | ||||||||||||||||
| (Dollars in thousands) | ||||||||||||||||||||
| Total originated loans outstanding at end of period(1) |
$ | 742,019 | $ | 772,247 | $ | 808,726 | $ | 779,319 | $ | 749,701 | ||||||||||
| Average total originated loans outstanding during period(1) |
$ | 717,159 | $ | 787,527 | $ | 795,752 | $ | 778,058 | $ | 690,287 | ||||||||||
| Allowance balance at beginning of period |
$ | 26,164 | $ | 15,423 | $ | 10,374 | $ | 10,105 | $ | 8,496 | ||||||||||
| Provision for loan losses |
11,990 | 19,390 | 7,420 | 810 | 720 | |||||||||||||||
| Allowance acquired through acquisition |
— | — | — | — | 749 | |||||||||||||||
| Charge-offs: |
||||||||||||||||||||
| Commercial business |
(8,106 | ) | (2,668 | ) | (144 | ) | (412 | ) | (78 | ) | ||||||||||
| One-to-four family residential |
(169 | ) | (189 | ) | (280 | ) | (67 | ) | (3 | ) | ||||||||||
| Real estate construction and land development |
(8,344 | ) | (5,774 | ) | (1,818 | ) | — | — | ||||||||||||
| Consumer |
(73 | ) | (192 | ) | (165 | ) | (94 | ) | (83 | ) | ||||||||||
| Total charge-offs |
(16,692 | ) | (8,823 | ) | (2,407 | ) | (573 | ) | (164 | ) | ||||||||||
| Recoveries: |
||||||||||||||||||||
| Commercial business |
243 | 1 | 1 | 2 | 255 | |||||||||||||||
| One-to-four family residential |
15 | 1 | — | 5 | 24 | |||||||||||||||
| Real estate construction and land development |
285 | 50 | — | — | — | |||||||||||||||
| Consumer |
57 | 122 | 35 | 25 | 25 | |||||||||||||||
| Total recoveries |
600 | 174 | 36 | 32 | 304 | |||||||||||||||
| Net (charge-offs) recoveries |
(16,092 | ) | (8,649 | ) | (2,371 | ) | (541 | ) | 140 | |||||||||||
| Allowance balance at end of period |
$ | 22,062 | $ | 26,164 | $ | 15,423 | $ | 10,374 | $ | 10,105 | ||||||||||
| Ratio of net (charge-offs) recoveries during period to average total originated loans outstanding |
(2.24 | )% | (1.10 | )% | (0.30 | )% | (0.06 | )% | 0.02 | % | ||||||||||
| (1) | Excludes loans held for sale. |
12
Table of Contents
The following table shows the allocation of the allowance for loan losses for the indicated periods. The allocation is based upon an evaluation of defined loan problems, historical loan loss ratios, and industry wide and other factors that affect loan losses in the categories shown below:
| At December 31, | ||||||||||||||||||||||||||||||||||||||||
| 2010 | 2009 | 2008 | 2007 | 2006 | ||||||||||||||||||||||||||||||||||||
| Amount | % of Total Loans(1) |
Amount | % of Total Loans(1) |
Amount | % of Total Loans(1) |
Amount(2) | % of Total Loans(1) |
Amount | % of Total Loans(1) |
|||||||||||||||||||||||||||||||
| (Dollars in thousands) | ||||||||||||||||||||||||||||||||||||||||
| Commercial business |
$ | 14,329 | 65.0 | % | $ | 12,137 | 46.4 | % | $ | 2,785 | 50.7 | % | $ | 1,999 | 49.5 | % | $ | 7,276 | 48.7 | % | ||||||||||||||||||||
| Real estate construction |
5,449 | 24.7 | 12,892 | 49.3 | 6,587 | 16.1 | 3,839 | 15.8 | 585 | 15.7 | ||||||||||||||||||||||||||||||
| Real estate other |
799 | 3.6 | 550 | 2.1 | 5,797 | 30.6 | 4,231 | 32.6 | 2,106 | 33.9 | ||||||||||||||||||||||||||||||
| Consumer |
554 | 2.5 | 361 | 1.4 | 254 | 2.6 | 305 | 2.1 | 138 | 1.7 | ||||||||||||||||||||||||||||||
| Unallocated |
931 | 4.2 | 224 | 0.8 | — | 0.0 | — | 0.0 | — | 0.0 | ||||||||||||||||||||||||||||||
| Total loans |
$ | 22,062 | 100.0 | % | $ | 26,164 | 100.0 | % | $ | 15,423 | 100.0 | % | $ | 10,374 | 100.0 | % | $ | 10,105 | 100.0 | % | ||||||||||||||||||||
| (1) | Represents the total of all outstanding loans in each category as a percent of total loans outstanding. |
| (2) | The Company historically allocated its allowance for loan losses based on the percentages noted in (1) above, however, in 2008, management reclassified 2007 amounts to be consistent with the 2008 allowance for loan losses allocation method which, is based on qualitative and quantitative factors determined for each loan category. |
Investment Activities
At December 31, 2010, our investment securities portfolio totaled $138.9 million, which consisted of $125.1 million of securities available for sale and $13.8 million of securities held to maturity. This compares with a total portfolio of $104.4 million at December 31, 2009, which was comprised of $90.7 million of securities available for sale and $13.6 million of securities held to maturity. The increase in the investment portfolio was substantially due to the acquisitions of Cowlitz Bank and Pierce Commercial Bank. The composition of the two investment portfolios by type of security, at each respective date, is presented in Note 5 to the Notes to Consolidated Financial Statements.
At June 30, 2008, the Company recorded an other-than-temporary impairment charge of $1.1 million related to its $9.6 million investment in the AMF Ultra Short Mortgage Fund (the “Fund”). The net asset value of the Fund had declined primarily as a result of the uncertainty in spreads in the bond market for private label mortgage-related securities and credit downgrades to a small percentage of the underlying securities. In July 2008, the Company redeemed its 1,080,114 shares in the Fund for $1.6 million in cash and securities with a fair value of $7.9 million. This redemption resulted in a loss of $96,000. The securities received, which were mortgage-backed securities and private residential collateralized mortgage obligations, were classified as “held to maturity” as the Company had the positive intent and ability to hold these securities until they matured. In December 2008, as a result of continued declines in market value and credit downgrades of specific securities acquired in the redemption, the Company recorded an additional impairment charge of $668,000 on private residential collateralized mortgage obligations with a carrying value of $856,000 and a fair value of $188,000. In total during 2008, the Company recorded losses of $1.9 million related to the Fund and the securities received in the redemption of the shares in the Fund.
In the second quarter of 2009, the Company adopted Financial Accounting Standards Board Accounting Standards Codification (“FASB ASC”) 320-10-65, Recognition and Presentation of Other-Than-Temporary Impairments, which provides for the bifurcation of other-than-temporary impairments into (a) the amount of the total other-than-temporary impairment related to a decrease in cash flows expected to be collected from the debt security (the credit loss) and (b) the amount of the total other-than-temporary impairment related to all other factors. As a result of adopting FASB ASC 320-10-65, the Company recorded $830,000 in impairments on private collateralized mortgage obligations not related to credit losses through other comprehensive income
13
Table of Contents
rather than through earnings and $500,000 in impairments related to credit losses through earnings during the year ended December 31, 2009. The Company also reclassified $229,000 from retained earnings to other comprehensive income related to impairment charges on private residential collateralized mortgage obligations at December 31, 2008 and March 31, 2009 that were not due to credit losses. The activity related to the amount of other-than-temporary impairments related to credit losses on held to maturity securities during the year ended December 31, 2010, is presented in Note 5 to the Notes to Consolidated Financial Statements.
Our investment policy is established by the Board of Directors and monitored by the Audit and Finance Committee of the Board of Directors. It is designed primarily to provide and maintain liquidity, generate a favorable return on investments without incurring undue interest rate and credit risk, and complements our Banks’ lending activities. The policy dictates the criteria for classifying securities as either available for sale or held to maturity. The policy permits investment in various types of liquid assets permissible under applicable regulations, which include U.S. Treasury obligations, U.S. Government agency obligations, some certificates of deposit of insured banks, mortgage backed and mortgage related securities, some corporate notes, municipal bonds, and federal funds. Investment in non-investment grade bonds and stripped mortgage backed securities are not permitted under the policy.
The following table provides information regarding our investment securities available for sale at the dates indicated.
| December 31, | ||||||||||||||||||||||||
| 2010 | 2009 | 2008 | ||||||||||||||||||||||
| Amortized Cost |
% of Total Investments |
Amortized Cost |
% of Total Investments |
Amortized Cost |
% of Total Investments |
|||||||||||||||||||
| (Dollars in thousands) | ||||||||||||||||||||||||
| U.S. Treasury and U.S. Government agencies |
$ | 41,124 | 33.2 | % | $ | 22,986 | 25.5 | % | $ | 5,230 | 16.7 | % | ||||||||||||
| Municipal securities |
20,237 | 16.3 | 7,365 | 8.2 | 4,138 | 13.2 | ||||||||||||||||||
| Corporate securities |
10,097 | 8.2 | 10,060 | 11.2 | 4,007 | 12.7 | ||||||||||||||||||
| Mortgage backed securities and collateralized mortgage obligations: |
||||||||||||||||||||||||
| U.S. Government agencies |
52,394 | 42.3 | 49,645 | 55.1 | 18,006 | 57.4 | ||||||||||||||||||
| Total |
$ | 123,852 | 100.0 | % | $ | 90,056 | 100.0 | % | $ | 31,381 | 100.0 | % | ||||||||||||
The following table provides information regarding our investment securities available for sale, by contractual maturity, at December 31, 2010.
| Less Than One Year | One to Five Years | Five to Ten Years | Over Ten Years | |||||||||||||||||||||||||||||
| Fair Value | Weighted Average Yield(1) |
Fair Value | Weighted Average Yield(1) |
Fair Value | Weighted Average Yield(1) |
Fair Value | Weighted Average Yield(1) |
|||||||||||||||||||||||||
| (Dollars in thousands) | ||||||||||||||||||||||||||||||||
| U.S. Treasury and U.S. Government agencies |
$ | 11,053 | 0.92 | % | $ | 30,376 | 1.12 | % | $ | — | — | % | $ | — | — | % | ||||||||||||||||
| Municipal securities |
727 | 2.34 | 4,434 | 3.21 | 12,514 | 4.21 | 2,538 | 5.45 | ||||||||||||||||||||||||
| Corporate securities |
2,052 | 1.02 | 8,224 | 2.00 | — | — | — | — | ||||||||||||||||||||||||
| Mortgage backed securities and collateralized mortgage obligations: |
||||||||||||||||||||||||||||||||
| U.S. Government agencies |
— | — | 745 | 2.51 | 6,924 | 2.95 | 45,588 | 2.66 | ||||||||||||||||||||||||
| Total |
$ | 13,832 | 1.01 | % | $ | 43,779 | 1.51 | % | $ | 19,438 | 3.76 | % | $ | 48,126 | 2.81 | % | ||||||||||||||||
14
Table of Contents
The following table provides information regarding our investment securities held to maturity at the dates indicated.
| December 31, | ||||||||||||||||||||||||
| 2010 | 2009 | 2008 | ||||||||||||||||||||||
| Amortized Cost |
% of Total Investments |
Amortized Cost |
% of Total Investments |
Amortized Cost |
% of Total Investments |
|||||||||||||||||||
| (Dollars in thousands) | ||||||||||||||||||||||||
| U.S. Treasury and U.S. Government agencies |
$ | 1,858 | 13.5 | % | $ | 1,443 | 10.6 | % | $ | 316 | 2.6 | % | ||||||||||||
| Municipal securities |
3,410 | 24.8 | 1,618 | 11.9 | 1,695 | 14.0 | ||||||||||||||||||
| Mortgage backed securities and collateralized mortgage obligations: |
||||||||||||||||||||||||
| U.S. Government agencies |
6,592 | 47.9 | 8,236 | 60.4 | 5,791 | 47.9 | ||||||||||||||||||
| Private residential collateralized mortgage obligations |
1,908 | 13.8 | 2,339 | 17.1 | 4,279 | 35.5 | ||||||||||||||||||
| Total |
$ | 13,768 | 100.0 | % | $ | 13,636 | 100.0 | % | $ | 12,081 | 100.0 | % | ||||||||||||
The following table provides information regarding our investment securities held to maturity, by contractual maturity, at December 31, 2010.
| Less Than One Year | One to Five Years | Five to Ten Years | Over Ten Years | |||||||||||||||||||||||||||||
| Fair Value | Weighted Average Yield(1) |
Fair Value | Weighted Average Yield(1) |
Fair Value | Weighted Average Yield(1) |
Fair Value | Weighted Average Yield(1) |
|||||||||||||||||||||||||
| (Dollars in thousands) | ||||||||||||||||||||||||||||||||
| U.S. Treasury and U.S. Government agencies |
$ | — | — | % | $ | 207 | 5.02 | % | $ | 1,744 | 3.75 | % | $ | — | — | % | ||||||||||||||||
| Municipal securities |
96 | 5.21 | 1,606 | 5.50 | 1,284 | 4.37 | 505 | 5.22 | ||||||||||||||||||||||||
| Mortgage backed securities and collateralized mortgage obligations: |
||||||||||||||||||||||||||||||||
| U.S. Government agencies |
— | — | — | — | 93 | 6.94 | 6,707 | 3.85 | ||||||||||||||||||||||||
| Private residential collateralized mortgage obligations |
— | — | — | — | — | — | 2,048 | 7.36 | ||||||||||||||||||||||||
| Total |
$ | 96 | 5.21 | % | $ | 1,813 | 5.45 | % | $ | 3,121 | 4.12 | % | $ | 9,260 | 5.15 | % | ||||||||||||||||
| (1) | Taxable equivalent weighted average yield. |
The Banks are required to maintain an investment in the stock of the Federal Home Loan Bank (“FHLB”) of Seattle in an amount equal to the greater of $500,000 or 0.50% of residential mortgage loans and pass-through securities or an advance requirement to be confirmed on the date of the advance and 5.0% of the outstanding balance of mortgage loans sold to the FHLB of Seattle. At December 31, 2010 the Banks were required to maintain an investment in the stock of FHLB of Seattle of at least $1.5 million. At December 31, 2010 the Banks had an investment in FHLB stock carried at a cost basis (par value) of $5.6 million.
15
Table of Contents
The Company evaluated its investment in FHLB of Seattle stock for other-than-temporary impairment, consistent with its accounting policy. Based on the Company’s evaluation of the underlying investment, including the long-term nature of the investment, the liquidity position of the FHLB of Seattle, the actions being taken by the FHLB of Seattle to address its regulatory situation and the Company’s intent and ability to hold the investment for a period of time sufficient to recover the par value, the Company did not recognize an other-than-temporary impairment loss on its FHLB of Seattle stock. Even though the Company did not recognize an other-than-temporary impairment loss on its FHLB of Seattle stock during the year ended December 31, 2010, continued deterioration in the FHLB of Seattle’s financial position may result in future impairment losses.
Deposit Activities and Other Sources of Funds
General. Our primary sources of funds are deposits, loan repayments and borrowings. Scheduled loan repayments are a relatively stable source of funds, while deposits and unscheduled loan prepayments, which are influenced significantly by general interest rate levels, interest rates available on other investments, competition, economic conditions, and other factors are not. Customer deposits remain an important source of funding, but these balances have been influenced in the past by adverse market conditions in the industry and may be affected by future developments such as interest rate fluctuations and new competitive pressures. In addition to customer deposits management may utilize the use of brokered deposits on an as-needed basis.
Borrowings may also be used on a short-term basis to compensate for reductions in other sources of funds (such as deposit inflows at less than projected levels). Borrowings may also be used on a longer-term basis to support expanded lending activities and match the maturity of repricing intervals of assets. In addition the Company began to utilize repurchase agreements as a supplement to other funding sources during the year ended December 31, 2009.
During the year ended December 31 2010, non-maturity deposits (total deposits less certificate of deposit accounts) increased $197.1 million, or 36.8%. As a result, the percentage of certificate of deposit accounts to total deposits decreased to 35.5% from 36.2% at December 31, 2009. A significant reason for the change in mix of deposit accounts is attributable to the acquisition of Cowlitz Bank and Pierce Commercial Bank.
Deposit Activities. We offer a variety of deposit accounts designed to attract both short-term and long-term deposits. These accounts include certificates of deposit (“CDs”), regular savings accounts, money market accounts, checking and negotiable order of withdrawal (“NOW”) accounts, and individual retirement accounts (“IRAs”). These accounts generally earn interest at rates established by management based on competitive market factors and management’s desire to increase or decrease certain types or maturities of deposits. The more significant deposit accounts are described below.
Certificates of Deposit. We offer several types of CDs with maturities ranging from three months to five years, which require a minimum deposit of $2,500. Negotiable CDs are offered in amounts of $100,000 or more for terms of 30 days to 12 months.
Regular Savings Accounts. We offer savings accounts that allow for unlimited deposits and withdrawals, provided that a $100 minimum balance is maintained.
Money Market Accounts. Money market accounts pay a variable interest rate that is tiered depending on the balance maintained in the account. Minimum opening balances vary.
Checking and NOW Accounts. Checking and NOW accounts are noninterest and interest bearing, and may be charged service fees based on activity and balances. NOW accounts pay interest, but require a higher minimum balance to avoid service charges.
Individual Retirement Accounts. Individual Retirement Accounts permit annual contributions regulated by law and pay interest at fixed rates. Maturities are available from one to five years.
16
Table of Contents
Sources of Funds
The following table provides the average balances outstanding and the weighted average interest rates for each major category of deposits for the years ended December 31:
| 2010 | 2009 | 2008 | ||||||||||||||||||||||
| Average Balance |
Average Rate Paid |
Average Balance |
Average Rate Paid |
Average Balance |
Average Rate Paid |
|||||||||||||||||||
| (Dollars in thousands) | ||||||||||||||||||||||||
| Interest bearing demand and money market accounts |
$ | 376,245 | 0.58 | % | $ | 310,860 | 0.89 | % | $ | 243,082 | 1.78 | % | ||||||||||||
| Savings |
89,978 | 0.56 | 85,541 | 0.98 | 92,648 | 1.70 | ||||||||||||||||||
| Certificates of deposit |
351,191 | 1.62 | 323,696 | 2.47 | 343,642 | 3.62 | ||||||||||||||||||
| Total interest bearing deposits |
817,414 | 1.02 | 720,097 | 1.61 | 679,372 | 2.70 | ||||||||||||||||||
| Non interest demand deposits |
150,906 | — | 120,107 | — | 108,386 | — | ||||||||||||||||||
| Total deposits |
$ | 968,320 | 0.87 | % | $ | 840,204 | 1.38 | % | $ | 787,758 | 2.32 | % | ||||||||||||
The following table shows the amount and maturity of certificates of deposit of $100,000 or more as of December 31, 2010 (dollars in thousands):
| Remaining maturity: |
||||
| Three months or less |
$ | 78,260 | ||
| Over three months through six months |
34,263 | |||
| Over six months through twelve months |
54,832 | |||
| Over twelve months |
60,626 | |||
| Total |
$ | 227,981 | ||
Borrowings. Deposits are the primary source of funds for our lending and investment activities and our general business purposes. We rely upon advances from the FHLB to supplement our supply of lendable funds and meet deposit withdrawal requirements. The FHLB of Seattle serves as one of our secondary sources of liquidity. Advances from the FHLB of Seattle are typically secured by our first lien single family mortgage loans, multifamily mortgage loans, commercial real estate loans and stock issued by the FHLB, which is owned by us. At December 31, 2010, the Banks maintained an uncommitted credit facility with the FHLB of Seattle for $173.1 million and an uncommitted credit facility with the Federal Reserve Bank of San Francisco for $66.9 million, of which there were no advances or borrowings outstanding. The Banks also maintain advance lines with Key Bank, US Bank and Pacific Coast Bankers Bank to purchase federal funds up to $22.8 million as of December 31, 2010. At December 31, 2010 we had securities sold under agreement to repurchase of $19.0 million which were secured by available for sale investment securities.
The FHLB functions provides credit for member financial institutions. As members, we are required to own capital stock in the FHLB and are authorized to apply for advances on the security of such stock and certain of our mortgage loans and other assets (principally securities which are obligations of, or guaranteed by, the United States) provided certain standards related to creditworthiness have been met. Advances are made pursuant to several different programs. Each credit program has its own interest rate and range of maturities. Depending on the program, limitations on the amount of advances are based either on a fixed percentage of an institution’s net worth or on the FHLB’s assessment of the institution’s creditworthiness. Under its current credit policies, the FHLB of Seattle limits advances to 20% of assets for Heritage Bank and Central Valley Bank.
17
Table of Contents
The following table is a summary of FHLB advances for the years ended December 31:
| 2010 | 2009 | 2008 | ||||||||||
| (Dollars in thousands) | ||||||||||||
| Balance at period end |
$ | — | $ | — | $ | — | ||||||
| Average balance during the period |
1,330 | — | 6,223 | |||||||||
| Maximum amount outstanding at any month end |
17,486 | — | 17,100 | |||||||||
| Average interest rate: |
||||||||||||
| During the period |
1.67 | % | — | 2.91 | % | |||||||
| At period end |
— | — | — | |||||||||
There were no federal funds purchased for the years ended December 31, 2010, 2009 and 2008.
During 2006, the Company entered into a loan agreement with Key Bank in the amount of $3.7 million. The terms of the loan included quarterly payments of $345,000, interest at 6.8% and maturing July 2009. The loan was paid off during the year ended December 31, 2008.
Supervision and Regulation
We are subject to extensive Federal and Washington State legislation, regulation, and supervision. These laws and regulations are primarily intended to protect depositors, the FDIC and shareholders. The laws and regulations affecting banks and bank holding companies have changed significantly over recent years, and it is reasonable to expect that similar changes will continue in the future. Most recently, The Dodd-Frank Wall Street Reform and Consumer Protection Act of 2010 (“Dodd-Frank Act”) was enacted on July 21, 2010, which will significantly change the current bank regulatory structure. See “—Other Regulatory Developments—The Dodd-Frank Wall Street Reform and Consumer Protection Act of 2010” herein for a discussion of this new legislation. Any change in applicable laws, regulations, or regulatory policies may have a material effect on our business, operations, and prospects. We cannot predict the nature or the extent of the effects on our business and earnings that any fiscal or monetary policies or new Federal or State legislation may have in the future.
The following information is qualified in its entirety by reference to the particular statutory and regulatory provisions described.
Heritage Financial. We are subject to regulation as a bank holding company within the meaning of the Bank Holding Company Act of 1956, as amended, and are supervised by the Board of Governors of the Federal Reserve System (“Federal Reserve”). The Federal Reserve has the authority to order bank holding companies to cease and desist from unsound practices and violations of conditions imposed on them. The Federal Reserve is also empowered to assess civil money penalties against companies and individuals who violate the Bank Holding Company Act or orders or regulations thereunder in amounts up to $1.0 million per day. The Federal Reserve may order termination of non-banking activities by non-banking subsidiaries of bank holding companies, or divestiture of ownership and control of a non-banking subsidiary by a bank holding company. Some violations may also result in criminal penalties. The FDIC is authorized to exercise comparable authority under the Federal Deposit Insurance Act and other statutes for state nonmember banks such as Heritage Bank and Central Valley Bank.
The Federal Reserve has a policy that a bank holding company is required to serve as a source of financial and managerial strength to its subsidiary banks and may not conduct its operations in an unsafe or unsound manner. the Dodd-Frank Act and earlier Federal Reserve policy provide that a bank holding company should serve as a source of strength to its subsidiary banks by having the ability to provide financial assistance to its subsidiary banks during periods of financial distress. A bank holding company’s failure to meet its obligation to serve as a source of strength to its subsidiary banks will generally be considered by the Federal Reserve to be an unsafe and unsound banking practice or a violation of the Federal Reserve’s regulations or both. The Dodd-Frank
18
Table of Contents
Act requires new regulations to be projulgated concerning the source of strength. The Federal Deposit Insurance Act requires an undercapitalized bank to develop a capital restoration plan, approved by the FDIC, with a guaranty by each company having control of the bank, of the bank’s compliance with the plan.
We are required to file annual and periodic reports with the Federal Reserve and provide additional information as the Federal Reserve may require. The Federal Reserve may examine us, and any of our subsidiaries, and charge us for the cost of the examination.
We, and any subsidiaries which we may control, are considered “affiliates” within the meaning of the Federal Reserve Act, and transactions between our bank subsidiaries and affiliates are subject to numerous restrictions. With some exceptions, we and our subsidiaries are prohibited from tying the provision of various products or services, such as extensions of credit, to other products or services offered by us, or our affiliates.
Bank regulations require bank holding companies and banks to maintain a minimum “leverage” ratio of core capital to adjusted quarterly average total assets of at least 3%. In addition, banking regulators have adopted risk-based capital guidelines under which risk percentages are assigned to various categories of assets and off-balance sheet items to calculate a risk-adjusted capital ratio. Tier 1 capital generally consists of common stockholders’ equity (which does not include unrealized gains and losses on securities), less goodwill and certain identifiable intangible assets. Tier 2 capital includes Tier 1 capital plus the allowance for loan losses and subordinated debt, both subject to some limitations. Regulatory risk-based capital guidelines require Tier 1 capital of 4% of risk-adjusted assets and minimum total capital ratio (combined Tier 1 and Tier 2) of 8% of risk-adjusted assets. The Dodd-Frank Act requires new capital regulations to be adopted in final form 18 months after the date of enactment of the Dodd-Frank Act (July 21, 2010). To date, no proposed regulations have been issued.
Subsidiaries. Heritage Bank and Central Valley Bank are Washington-chartered commercial banks, the deposits of which are insured by the FDIC. Heritage Bank and Central Valley Bank are subject to regulation by the FDIC and the Division of Banks of the Washington Department of Financial Institutions.
Applicable Federal and State statutes and regulations which govern a bank’s operations relate to minimum capital requirements, required reserves against deposits, investments, loans, legal lending limits, mergers and consolidation, borrowings, issuance of securities, payment of dividends, establishment of branches, and other aspects of its operations, among other things. The Division and the FDIC also have authority to prohibit banks under their supervision from engaging in what they consider to be unsafe and unsound practices.
The Banks are required to file periodic reports with the FDIC and the Division, and are subject to periodic examinations and evaluations by those regulatory authorities. Based upon these evaluations, the regulators may revalue the assets of an institution and require that it establish specific reserves to compensate for the differences between the determined value and the book value of such assets. These examinations must be conducted every 12 months, except that well-capitalized banks may be examined every 18 months. The FDIC and the Division may each accept the results of an examination by the other in lieu of conducting an independent examination.
Dividends paid by our subsidiaries provide substantially all of our cash flow. Applicable Federal and Washington State regulations restrict capital distributions by our Banks, including dividends. Such restrictions are tied to the institution’s capital levels after giving effect to such distributions.
Capital Adequacy. The Federal Reserve and FDIC have issued substantially similar risk-based and leverage capital guidelines applicable to bank holding companies and banks. In addition, these regulatory agencies may from time to time require that a bank holding company or bank maintain capital above the minimum levels, based on its financial condition or actual or anticipated growth.
The Federal Reserve’s risk-based guidelines for bank holding companies establish a two-tier capital framework. Tier 1 capital generally consists of common stockholders’ equity (which does not include unrealized
19
Table of Contents
gains and losses on securities), less goodwill and certain identifiable intangible assets. Tier 2 capital includes Tier 1 capital plus the allowance for loan losses and subordinated debt, both subject to some limitations. The sum of Tier 1 and Tier 2 capital represents qualifying total capital, at least 50% of which must consist of Tier 1 capital.
Risk-based capital ratios are calculated by dividing Tier 1 and total capital by risk-weighted assets. Assets and off-balance sheet exposures are assigned to one of four categories of risk-weights, based primarily on relative credit risk. The minimum Tier 1 risk- based capital ratios under these guidelines at December 31, 2010 were 4% and 8%, respectively. At December 31, 2010, we had Tier 1 risk-based capital and total risk-based capital of 20.2% and 21.5%, respectively.
The Federal Reserve’s leverage capital guidelines establish a minimum leverage ratio determined by dividing Tier 1 capital by adjusted average total assets. The minimum leverage ratio is 3% for bank holding companies that meet certain specified criteria, including having the highest regulatory rating. All other bank holding companies generally are required to maintain a leverage ratio of at least 4%. At December 31, 2010, we had a leverage ratio of 13.9%.
Prompt Corrective Action. Federal statutes establish a supervisory framework based on five capital categories: well capitalized, adequately capitalized, undercapitalized, significantly undercapitalized and critically undercapitalized. An institution’s category depends upon where its capital levels are in relation to relevant capital measures, which include a risk-based capital measure, a leverage ratio capital measure and certain other factors. The federal banking agencies have adopted regulations that implement this statutory framework. Under these regulations, an institution is treated as well capitalized if its ratio of total capital to risk-weighted assets is 10% or more, its ratio of core capital to risk-weighted assets is 6% or more, its ratio of core capital to adjusted total assets (leverage ratio) is 5% or more, and it is not subject to any federal supervisory order or directive to meet a specific capital level. In order to be adequately capitalized, an institution must have a total risk-based capital ratio of not less than 8%, a core capital to risk-weighted assets ratio of not less than 4%, and a leverage ratio of not less than 4%. An institution that is not well capitalized is subject to certain restrictions on brokered deposits, including restrictions on the rates it can offer on its deposits generally. Any institution which is neither well capitalized nor adequately capitalized is considered undercapitalized.
Undercapitalized institutions are subject to certain prompt corrective action requirements, regulatory controls and restrictions which become more extensive as an institution becomes more severely undercapitalized. Failure by either Heritage Bank and Central Valley Bank to comply with applicable capital requirements would, if unremedied, result in progressively more severe restrictions on its activities and lead to enforcement actions, including, but not limited to, the issuance of a capital directive to ensure the maintenance of required capital levels and, ultimately, the appointment of the FDIC as receiver or conservator. Banking regulators will take prompt corrective action with respect to depository institutions that do not meet minimum capital requirements. Additionally, approval of any regulatory application filed for their review may be dependent on compliance with capital requirements.
As of December 31, 2010, the Banks met the requirements to be classified as “well-capitalized.”
Federal law generally bars institutions which are not well capitalized from soliciting or accepting brokered deposits bearing interest rates significantly higher than prevailing market rates.
Deposit Insurance and Other FDIC Programs. The deposits of the Banks are insured up to applicable limits by the Deposit Insurance Fund (“DIF”), which is administered by the FDIC. The FDIC is an independent federal agency that insures the deposits, up to applicable limits, of depository institutions. As insurer of the Banks’ deposits, the FDIC has supervisory and enforcement authority over Heritage Bank and Central Valley Bank and this insurance is backed by the full faith and credit of the United States government. As insurer, the FDIC imposes deposit insurance premiums and is authorized to conduct examinations of and to require reporting by institutions insured by the FDIC. It also may prohibit any institution insured by the FDIC from engaging in
20
Table of Contents
any activity determined by regulation or order to pose a serious risk to the institution and the DIF. The FDIC also has the authority to initiate enforcement actions and may terminate the deposit insurance if it determines that an institution has engaged in unsafe or unsound practices or is in an unsafe or unsound condition.
The FDIC assesses deposit insurance premiums on each FDIC-insured institution quarterly based on annualized rates for one of four risk categories applying these rates to the institution’s deposits. Under rules in effect through March 31, 2011, each institution is assigned to one of four risk categories based on its capital, supervisory ratings and other factors. Well capitalized institutions that are financially sound with only a few minor weaknesses are assigned to Risk Category I. Risk Categories II, III and IV present progressively greater risks to the DIF. A range of initial base assessment rates applies to each Risk Category subject to adjustments based on an institution’s unsecured debt, secured liabilities and brokered deposits, such that the total base assessment rates after adjustments range from 7 to 24 basis points for Risk Category I, 17 to 43 basis points for Risk Category II, 27 to 58 basis points for Risk Category III, and 40 to 77.5 basis points for Risk Category IV. Rates increase uniformly by three basis points effective January 1, 2011.
As required by the Dodd-Frank Act, the FDIC has adopted rules effective April 1, 2011, under which insurance premium assessments are based on an institution’s total assets minus its tangible equity (defined as Tier 1 capital) instead of its deposits. Under these rules, an institution with total assets of less than $10 billion will be assigned to a Risk Category as described above, and a range of initial base assessment rates will apply to each category, subject to adjustment downward based on unsecured debt issued by the institution and, except for an institution in Risk Category I, adjustment upward if the institution’s brokered deposits exceed 10% of its domestic deposits, to produce total base assessment rates. Total base assessment rates range from 2.5 to 9 basis points for Risk Category I, 9 to 24 basis points for Risk Category II, 18 to 33 basis points for Risk Category III, and 30 to 45 basis points for Risk Category IV, all subject to further adjustment upward if the institution holds more than a de minimis amount of unsecured debt issued by another FDIC-insured institution. The FDIC may increase or decrease its rates by 2.0 basis points without further rulemaking.
In addition to the regular quarterly assessments, due to losses and projected losses attributed to failed institutions, the FDIC imposed a special assessment of five basis points on the amount of each depository institution’s assets reduced by the amount of its Tier 1 capital (not to exceed 10 basis points of its assessment base for regular quarterly premiums) as of June 30, 2009, which was collected on September 30, 2009.
As a result of a decline in the reserve ratio (the ratio of the net worth of the DIF to estimated insured deposits) and concerns about expected failure costs and available liquid assets in the DIF, the FDIC adopted a rule requiring each insured institution to prepay on December 30, 2009 the estimated amount of its quarterly assessments for the fourth quarter of 2009 and all quarters through the end of 2012 (in addition to the regular quarterly assessment for the third quarter due on December 30, 2009). The prepaid amount is recorded as an asset with a zero risk weight and the institution will continue to record quarterly expenses for deposit insurance. For purposes of calculating the prepaid amount, assessments are measured at the institution’s assessment rate as of September 30, 2009, with a uniform increase of three basis points effective January 1, 2011, and are based on the institution’s assessment base for the third quarter of 2009, with growth assumed quarterly at annual rate of 5%. If events cause actual assessments during the prepayment period to vary from the prepaid amount, institutions will pay excess assessments in cash, or receive a rebate of prepaid amounts not exhausted after collection of assessments due on June 13, 2013, as applicable. Collection of the prepayment does not preclude the FDIC from changing assessment rates or revising the risk-based assessment system in the future. The rule includes a process for exemption from the prepayment for institutions whose safety and soundness would be affected adversely.
The Dodd-Frank Act establishes 1.35% as the minimum reserve ratio. The FDIC has adopted a plan under which it will meet this ratio by September 30, 2020, the deadline imposed by the Dodd-Frank Act. The Dodd-Frank requires the FDIC to offset the effect on institutions with assets less than $10 billion of the increase in the statutory minimum reserve ratio to 1.35% from the former statutory minimum of 1.15%. The FDIC has not yet announced how it will implement this offset. In addition to the statutory minimum ration, the FDIC must
21
Table of Contents
designate a reserve ratio, known as the designated reserve ratio, or DRR, which may exceed the statutory minimum. The FDIC has established 2.0% as the DRR. In addition, all institutions with deposits insured by the FDIC are required to pay assessments to fund interest payments on bonds issued by the Financing Corporation, an agency of the Federal government established to fund the costs of failed thrifts in the 1980’s. For the quarterly period ended December 31, 2010, the Financing Corporation assessment equaled 1.04 basis points for each $100 in domestic deposits. These assessments, which may be revised based upon the level of DIF deposits, will continue until the bonds mature in the years 2017 through 2019.
Following a systemic risk determination, the FDIC established a Temporary Liquidity Guarantee Program (“TLGP”) in October 2008. There are two parts to the program: the Debt Guarantee Program (“DGP”) and the Transaction Account Guarantee Program (“TAGP”). Eligible entities generally are participants unless they exercised opt out rights in timely fashion. We and our bank subsidiaries did not opt out of these programs.
For the DGP, eligible entities are generally U.S. bank holding companies, savings and loan holding companies, and FDIC-insured institutions. Under the DGP, the FDIC guarantees certain senior unsecured debt of an eligible entity that is issued not later than October 31, 2009. The guarantee is effective through the earlier of the maturity date or June 30, 2012 (for debt issued before April 1, 2009) or December 31, 2012 (for debt issued on or after April 1, 2009). The DGP coverage limit is generally 125% of the eligible entity’s eligible debt outstanding on September 30, 2008 and scheduled to mature on or before June 30, 2009, or for certain institutions, 2% of liabilities as of September 30, 2008. The nonrefundable DGP fee ranges from 50 to 100 basis points (annualized), depending on maturity, for covered debt outstanding during the period until the earlier of maturity or June 30, 2012, with various surcharges of 10 to 50 basis points applicable to debt with a maturity of one year or more issued on or after April 1, 2009. Generally, eligible debt of a participating entity becomes covered when and as issued until the coverage limit is reached, except that under some circumstances, participating entities can issue certain nonguaranteed debt. Various features of the DGP require applications, additional fees, and approvals.
For the TAGP, eligible entities are FDIC-insured institutions. Under the TAGP, the FDIC provides unlimited deposit insurance coverage for noninterest-bearing transaction accounts (typically business checking accounts), NOW accounts bearing interest at 0.5% or less, and certain funds swept into noninterest-bearing savings accounts. Other NOW accounts and money market deposit accounts are not covered. TAGP coverage lasts until December 31, 2009 and, unless the participant has opted out of the extension period, during the extension period of January 1, 2010 through June 30, 2010. While this was extended again through December 31, 2010, on September 27, 2010, the FDIC announced that it will not continue the TAGP beyond December 31, 2010. However, under the Dodd-Frank Act and the FDIC rules, separate temporary coverage for noninterest bearing transaction accounts and Interest on Lawyers’ Trust Accounts, or IOLTA accounts, became effective on December 31, 2010, terminating on December 31, 2012, so that all funds held in such accounts are fully insured, without limit. Further, unlike the TAGP, all U.S. depository institutions insured by the FDIC must participate; there is no opt out provision. The FDIC does not plan to charge a separate assessment for the temporary insurance.
Other Regulatory Developments. Significant federal banking legislation has been enacted in recent years. The following summarizes some of the recent significant federal banking legislation.
The Dodd-Frank Wall Street Reform and Consumer Protection Act of 2010. The Dodd-Frank Act significantly changes the current bank regulatory structure and affects the lending, deposit, investment, trading and operating activities of financial institutions and their holding companies. The Dodd-Frank Act requires various federal agencies to adopt a broad range of new implementing rules and regulations, and to prepare numerous studies and reports for Congress. The federal agencies are given significant discretion in drafting the implementing rules and regulations, and consequently, many of the details and much of the impact of the Dodd-Frank Act may not be known for many months or years.
22
Table of Contents
Certain provisions of the Dodd-Frank Act are expected to have a near term impact on the Company. For example, effective one year after the date of enactment, the Dodd-Frank Act eliminates the federal prohibition on paying interest on demand deposits, thus allowing businesses to have interest-bearing checking accounts. Depending on competitive responses, this significant change to existing law could have an adverse impact on the Company’s interest expense.
The Dodd-Frank Act permanently increases the maximum amount of deposit insurance for banks, savings institutions and credit unions to $250,000 per depositor, retroactive to January 1, 2009.
The Dodd-Frank Act requires publicly traded companies to give stockholders a non-binding vote on executive compensation and so-called “golden parachute” payments and authorizes the Securities and Exchange Commission to promulgate rules that would allow stockholders to nominate their own candidates using a company’s proxy materials. The legislation also directs the federal banking agencies to promulgate rules prohibiting excessive and risky compensation paid to bank and bank holding company executives, regardless of whether the company is publicly traded or not.
The Dodd-Frank Act creates a new Consumer Financial Protection Bureau with broad powers to supervise and enforce consumer protection laws. The Consumer Financial Protection Bureau has broad rule-making authority for a wide range of consumer protection laws that apply to all banks and savings institutions, including the authority to prohibit “unfair, deceptive or abusive” acts and practices. The Consumer Financial Protection Bureau has examination and enforcement authority over all banks and savings institutions with more than $10 billion in assets. Financial institutions such as the Banks with $10 billion or less in assets will continued to be examined for compliance with the consumer laws by their primary bank regulators.
The Dodd-Frank Act includes certain provisions concerning capital regulations which are often referred to as the Collins Amendment. These provisions are intended to subject bank holding companies to the same capital requirements as their bank subsidiaries and to eliminate or significantly reduce the use of hybrid capital instruments, especially trust preferred securities, as regulatory capital. Under the Collins Amendment, trust preferred securities issued by a company with total consolidated assets of less than $15 billion before May 19, 2010 and treated as regulatory capital are grandfathered, but any such securities issued later are not eligible as regulatory capital. The federal banking regulators must develop regulations setting minimum risk-based and leverage capital requirements for holding companies and banks on a consolidated basis that are no less stringent than the generally applicable requirements in effect for depository institutions under the prompt corrective action regulations discussed above. The banking regulators also must seek to make capital standards countercyclical so that the required levels of capital increase in times of economic expansion and decrease in times of economic contraction. The Act requires these new capital regulations to be adopted in final form 18 months after the date of enactment of the Dodd-Frank Act (July 21, 2010). To date, no proposed regulations have been issued.
It is difficult to predict at this time what specific impact the Dodd-Frank Act and the yet to be written implementing rules and regulations will have on community banks. However, it is expected that at a minimum they will increase our operating and compliance costs and could increase our interest expense.
Emergency Economic Stabilization Act. On October 3, 2008, the Emergency Economic Stabilization Act (“EESA”) was enacted. The EESA authorizes the Secretary of the Treasury to purchase from financial institutions and their holding companies up to $700 billion in mortgage loans, mortgage-related securities and certain other financial instruments, including debt and equity securities issued by financial institutions and their holding companies in a troubled asset relief program, or TARP. The purpose of TARP is to restore confidence and stability to the U.S. banking system and to encourage financial institutions to increase their lending to customers and to each other. Under the TARP Capital Purchase Program, or CPP, the Treasury may purchase debt or equity securities from participating institutions. The TARP also allows direct purchases or guarantees of troubled assets of financial institutions. Participants in the CPP are subject to executive compensation limits and are encouraged to expand their lending and mortgage loan modifications. The Company completed its TARP
23
Table of Contents
CPP transaction on November 21, 2008 and received $24 million in funding from the Treasury. In connection with its stock offering completed in September 2009, the Company reduced the number of shares of common stock underlying the Warrant issued to Treasury by 50% to 138,037 shares. In December 2010, the Company redeemed 24,000 shares of its Series A Preferred Stock and paid Treasury a total of $24.1 million, consisting of $24.0 million of principal and $123,000 of accrued and unpaid dividends. The Warrant is still held by the Treasury and remained outstanding at December 31, 2010.
The American Recovery and Reinvestment Act of 2009. On February 17, 2009, President Obama signed ARRA into law. The ARRA is intended to revive the U.S. economy by creating millions of new jobs and stemming home foreclosures. For financial institutions that have received or will receive financial assistance under TARP or related programs, the ARRA significantly rewrites the original executive compensation and corporate governance provisions of Section 111 of the EESA. Among the most important changes instituted by the ARRA are new limits on the ability of TARP recipients to pay incentive compensation to up to 20 of the next most highly-compensated employees in addition to the “senior executive officers,” a restriction on termination of employment payments to senior executive officers and the five next most highly-compensated employees and a requirement that TARP recipients implement “say on pay” shareholder votes.
Sarbanes-Oxley Act. On July 30, 2002, the Sarbanes-Oxley Act of 2002 was signed into law in response to public concerns regarding corporate accountability in connection with various accounting scandals. The stated goals of the Sarbanes-Oxley Act are to increase corporate responsibility, to provide for enhanced penalties for accounting and auditing improprieties at publicly traded companies and to protect investors by improving the accuracy and reliability of corporate disclosures pursuant to the securities laws. The Sarbanes-Oxley Act generally applies to all companies that file or are required to file periodic reports with the Securities and Exchange Commission (“SEC”), under the Securities Exchange Act of 1934.
The Sarbanes-Oxley Act includes very specific additional disclosure requirements and corporate governance rules, requires the SEC and securities exchanges to adopt extensive additional disclosure, corporate governance and other related rules. The Sarbanes-Oxley Act represents significant federal involvement in matters traditionally left to state regulatory systems, such as the regulation of the accounting profession, and to state corporate law, such as the relationship between a board of directors and management and between a board of directors and its committees. Our policies and procedures have been updated to comply with the requirements of the Sarbanes-Oxley Act.
Financial Services Reform Legislation. On November 12, 1999, the Gramm-Leach-Bliley Act (“GLBA”) was enacted into law. The GLBA removes various barriers imposed by the Glass-Steagall Act of 1933, specifically those prohibiting banks and bank holding companies from engaging in the securities and insurance business. The GLBA also expands the bank holding company act framework to permit bank holding companies with subsidiary banks meeting certain capital and management requirements to elect to become a “financial holding company”.
Financial holding companies may engage in a full range of financial activities, including not only banking, insurance, and securities activities, but also merchant banking and additional activities determined to be “financial in nature” or “complementary” to an activity that is financial in nature. The GLBA also provides that the list of permissible financial activities will be expanded as necessary for a financial holding company to keep abreast of competitive and technological changes.
In addition, the GLBA expands the activities in which insured state banks may engage. Under the GLBA, insured state banks are given the ability to engage in financial activities through a subsidiary, as long as the bank and its affiliates meet and comply with certain requirements. First, each bank must be “well capitalized”. Second, the bank must comply with certain capital deduction and financial statement requirements provided under the GLBA. Third, the bank must comply with certain financial and operational safeguards provided under the GLBA. Fourth, the bank must comply with the limits imposed by the GLBA on transactions with affiliates.
24
Table of Contents
Website Access to Company Reports
We post publicly available reports required to be filed with the SEC on our website, www.HF-WA.com, as soon as reasonably practicable after filing such reports with the SEC. The required reports are available free of charge through our website.
Code of Ethics
We have adopted a code of ethics that applies to our principal executive officer, principal financial officer and controller. We have posted the text of our code of ethics at www.HF-WA.com in the section titled Investor Information: Corporate Governance. Any waivers of the code of the ethics will be publicly disclosed to shareholders.
Competition
We compete for loans and deposits with other commercial banks, credit unions, mortgage bankers, and other institutions in the scope and type of services offered, interest rates paid on deposits, pricing of loans, and number and locations of branches, among other things. Many of our competitors have substantially greater resources than we do. Particularly in times of high or rising interest rates, we also face significant competition for investors’ funds from short-term money market securities and other corporate and government securities.
We compete for loans principally through the range and quality of the services we provide, interest rates and loan fees, and the locations of our Banks’ branches. We actively solicit deposit-related clients and compete for deposits by offering depositors a variety of savings accounts, checking accounts, cash management and other services.
Employees
We had 321 full-time equivalent employees at December 31, 2010. We experienced an increase of 99 full-time equivalent employees during 2010, mostly due to the acquisitions of Cowlitz Bank and Pierce Commercial Bank. We believe that employees play a vital role in the success of a service company. Employees are provided with a variety of benefits such as medical, vision, dental and life insurance, a generous retirement plan, and paid vacations and sick leave. None of our employees are covered by a collective bargaining agreement.
Executive Officers
The following table set forth certain information with respect to the executive officers of the Company.
| Name |
Age (1) | Position |
Has Served the Company, Heritage Bank or Central Valley Bank Since |
|||||||
| Brian L. Vance |
56 | President and Chief Executive Officer of Heritage; President and Chief Executive Officer of Heritage Bank; Vice Chairman and Chief Executive Officer of Central Valley Bank | 1996 | |||||||
| Jeffrey J. Deuel |
52 | Executive Vice President, Heritage; Executive Vice President and Chief Operating Officer of Heritage Bank | 2010 | |||||||
| Gregory D. Patjens |
61 | Executive Vice President and Chief Lending Officer of Heritage Bank | 1999 | |||||||
| Donald J. Hinson |
49 | Senior Vice President and Chief Financial Officer of Heritage, Heritage Bank and Central Valley Bank | 2005 | |||||||
| D. Michael Broadhead |
65 | President of Central Valley Bank | 1986 | |||||||
| David A. Spurling |
57 | Senior Vice President and Chief Credit Officer of Heritage Bank | 2001 | |||||||
25
Table of Contents
| (1) | Age is as of December 31, 2010 |
Biographical Information
Brian L. Vance became President and Chief Executive Officer of the Company and Heritage Bank, and Vice Chairman and Chief Executive Officer of Central Valley Bank in 2006. In 2003, Mr. Vance was appointed President and Chief Executive Officer of Heritage Bank and in 1998, Mr. Vance was named President and Chief Operating Officer of Heritage Bank. Mr. Vance joined the Company in 1996 as its Executive Vice President and Chief Credit Officer. Prior to joining Heritage Bank, Mr. Vance was employed for 24 years with West One Bank, a bank with offices in Idaho, Utah, Oregon and Washington. Prior to leaving West One, he was Senior Vice President and Regional Manager of Banking Operations for the south Puget Sound region.
Jeffrey J. Deuel joined Heritage Bank in February 2010 as Executive Vice President. In November 2010, Mr. Deuel was named Executive Vice President and Chief Operating Officer of Heritage Bank and Executive Vice President of the Company. Mr. Deuel came to the Company with 28 years of banking experience and most recently held the position of Executive Vice President Commercial Operations with JPMorgan Chase, formerly Washington Mutual. Prior to joining Washington Mutual Mr. Deuel was based in Philadelphia where he worked for Bank United, First Union Bank, CoreStates Bank, and First Pennsylvania Bank. During his career Mr. Deuel held a variety of leadership positions in commercial banking including lending, front and back office operations, corporate strategies, credit administration, and portfolio management.
Gregory D. Patjens is Executive Vice President and Chief Lending Officer of Heritage Bank. Mr. Patjens joined Heritage Bank in 1999 as Executive Vice President Administration and was promoted in 2001to Executive Vice President and Retail Banking Manager. Mr. Patjens was employed for over 25 years with Key Bank and its predecessor, Puget Sound National Bank, in positions with responsibilities for a variety of administrative and bank operations functions. Prior to leaving Key Bank, Mr. Patjens was Senior Vice President for Key Services, National Client Services.
Donald J. Hinson became the Senior Vice President and Chief Financial Officer of the Company, Heritage Bank and Central Valley Bank in 2007. Mr. Hinson joined the Company in 2005 as Vice President and Controller of Heritage Bank. Prior to that, he served in the banking audit practice of local and national accounting firms of Knight, Vale and Gregory and RSM McGladrey from 1994 to 2005.
D. Michael Broadhead joined Central Valley Bank in 1986 and has been President of Central Valley Bank since 1990. The Company acquired Central Valley Bank in March 1999. Previously, Mr. Broadhead held positions with Farmers Home Administration and First Bank and Trust of Idaho. Prior to leaving First Bank and Trust of Idaho, he held the position of Chief Executive Officer.
David A. Spurling became Senior Vice President and Chief Credit Officer of Heritage Bank in 2007. Mr. Spurling joined Heritage Bank in 2001 as a commercial lender, followed by a role as a commercial team leader. He began his banking career as a middle market lender at Seafirst Bank, followed by positions as a commercial lender at Bank of America in Small Business Banking and as a regional manager for Bank of America’s government-guaranteed lending division.
26
Table of Contents
| ITEM 1A. | RISK FACTORS |
The following are certain risks that management believes are specific to our business. This should not be viewed as an all inclusive list or in any particular order.
Our strategy of pursuing acquisitions and de novo branching exposes us to financial, execution and operational risks that could adversely affect us.
We are pursuing a strategy of supplementing organic growth by acquiring other financial institutions or their businesses that we believe will help us fulfill our strategic objectives and enhance our earnings. There are risks associated with this strategy, however, including the following:
| • | We may be exposed to potential asset quality issues or unknown or contingent liabilities of the banks, businesses, assets and liabilities we acquire. If these issues or liabilities exceed our estimates, our results of operations and financial condition may be materially negatively affected; |
| • | Prices at which acquisitions can be made fluctuate with market conditions. We have experienced times during which acquisitions could not be made in specific markets at prices we considered acceptable and expect that we will experience this condition in the future; |
| • | The acquisition of other entities generally requires integration of systems, procedures and personnel of the acquired entity into our company to make the transaction economically successful. This integration process is complicated and time consuming and can also be disruptive to the customers of the acquired business. If the integration process is not conducted successfully and with minimal effect on the acquired business and its customers, we may not realize the anticipated economic benefits of particular acquisitions within the expected time frame, and we may lose customers or employees of the acquired business. We may also experience greater than anticipated customer losses even if the integration process is successful. These risks are present in our recently completed FDIC-assisted transaction involving our assumption of deposits and the acquisition of assets of Cowlitz Bank; |
| • | To finance an acquisition, we may borrow funds, thereby increasing our leverage and diminishing our liquidity, or raise additional capital, which could dilute the interests of our existing shareholders. |
| • | We have completed two acquisitions during the past year that enhanced our rate of growth. We may not be able to continue to sustain our past rate of growth or to grow at all in the future; |
| • | We expect our net income will increase following our acquisitions, however, we also expect our general and administrative expenses and consequently our efficiency rates will also increase. Ultimately, we would expect our efficiency ratio to improve; however, if we are not successful in our integration process, this may not occur, and our acquisitions or branching activities may not be accretive to earnings in the short or long-term; and |
| • | The purchase and assumption agreement and the loss sharing agreements we have entered into with the FDIC have specific, detailed and cumbersome compliance, servicing, notification and reporting requirements. Our failure to comply with the terms of the agreements or to properly service the loans and real estate owned under the requirements of the loss share agreement may cause individual loans or large pools of loans to lose eligibility for loss share payments from the FDIC. This could result in material losses that are currently not anticipated. |
Our business strategy includes significant growth plans, and our financial condition and results of operations could be negatively affected if we fail to grow or fail to manage our growth effectively.
We intend to pursue a significant growth strategy for our business. We regularly evaluate potential acquisitions and expansion opportunities. If appropriate opportunities present themselves, we expect to engage in selected acquisitions of financial institutions in the future, including FDIC-assisted transactions, branch acquisitions, or other business growth initiatives or undertakings. There can be no assurance that we will successfully identify appropriate opportunities, that we will be able to negotiate or finance such activities or that such activities, if undertaken, will be successful.
27
Table of Contents
Our growth initiatives may require us to recruit experienced personnel to assist in such initiatives. Accordingly, the failure to identify and retain such personnel would place significant limitations on our ability to successfully execute our growth strategy. In addition, to the extent we expand our lending beyond our current market areas, we could incur additional risk related to those new market areas. We may not be able to expand our market presence in our existing market areas or successfully enter new markets.
If we do not successfully execute our acquisition growth plan, it could adversely affect our business, financial condition, results of operations, reputation and growth prospects. In addition, if we were to conclude that the value of an acquired business had decreased and that the related goodwill had been impaired, that conclusion would result in an impairment of goodwill charge to us, which would adversely affect our results of operations. While we believe we have the executive management resources and internal systems in place to successfully manage our future growth, there can be no assurance growth opportunities will be available or that we will successfully manage our growth. See “-If the goodwill we have recorded in connection with acquisitions becomes impaired, our earnings and capital could be reduced” and “-Our strategy of pursuing acquisitions and de novo branching exposes us to financial, execution and operational risks that could adversely affect us” for additional risks related to our acquisition strategy.
Failure to comply with the terms of the loss share agreement with the FDIC may result in significant losses.
In connection with the Cowlitz Bank Acquisition, Heritage Bank entered in to loss sharing agreements with the FDIC that significantly reduces the Bank’s credit loss exposure. The purchase and assumption agreement and the loss sharing agreement for the Cowlitz Bank Acquisition has specific, detailed and cumbersome compliance, servicing, notification and reporting requirements. Our failure to comply with the terms of the agreements or to properly service the loans and REO under the requirements of the loss sharing agreement may cause individual loans or large pools of loans to lose eligibility for loss share payments from the FDIC. This could result in material losses that are currently not anticipated.
We may engage in additional FDIC-assisted transactions, which could present additional risks to our business.
We may have additional opportunities to acquire the assets and liabilities of failed banks in FDIC-assisted transactions. Although these FDIC-assisted transactions typically provide for FDIC assistance to an acquirer to mitigate certain risks, such as sharing exposure to loan losses and providing indemnification against certain liabilities of the failed institution, we are (and would be in future transactions) subject to many of the same risks we would face in acquiring another bank in a negotiated transaction, including risks associated with maintaining customer relationships and failure to realize the anticipated acquisition benefits in the amounts and within the timeframes we expect. In addition, because these acquisitions are structured in a manner that would not allow us the time and access to information normally associated with preparing for and evaluating a negotiated acquisition, we may face additional risks in FDIC-assisted transactions, including additional strain on management resources, management of problem loans, problems related to integration of personnel and operating systems and impact to our capital resources requiring us to raise additional capital. We cannot give assurance that we will be successful in overcoming these risks or any other problems encountered in connection with FDIC-assisted transactions. Our inability to overcome these risks could have a material adverse effect on our business, financial condition and results of operations.
Financial reform legislation recently enacted by Congress will, among other things, tighten capital standards, create a new Consumer Financial Protection Bureau and result in new laws and regulations that are expected to increase our costs of operations.
On July 21, 2010, President Obama signed the Dodd-Frank Wall Street Reform and Consumer Protection Act (the “Dodd-Frank Act”). This new law will significantly change the current bank regulatory structure and affect the lending, deposit, investment, trading and operating activities of financial institutions and their holding companies. The Dodd-Frank Act requires various federal agencies to adopt a broad range of new implementing
28
Table of Contents
rules and regulations, and to prepare numerous studies and reports for Congress. The federal agencies are given significant discretion in drafting the implementing rules and regulations, and consequently, many of the details and much of the impact of the Dodd-Frank Act may not be known for many months or years.
Among the many requirements in the Dodd-Frank Act for new banking regulations is a requirement for new capital regulations to be adopted within 18 months. These regulations must be at least as stringent as, and may call for higher levels of capital than, current regulations. Generally, trust preferred securities will no longer be eligible as Tier 1 capital and outstanding TARP preferred securities will continue to qualify as Tier 1 capital. In addition, the banking regulators are required to seek to make capital requirements for banks and bank holding companies, countercyclical so that capital requirements increase in times of economic expansion and decrease in times of economic contraction.
Certain provisions of the Dodd-Frank Act are expected to have a near term impact on us. For example, effective one year after the date of enactment, the Dodd-Frank Act eliminates the federal prohibitions on paying interest on demand deposits, thus allowing businesses to have interest bearing checking accounts. Depending on competitive responses, this significant change to existing law could have an adverse impact our interest expense.
The Dodd-Frank Act also broadens the base for Federal Deposit Insurance Corporation insurance assessments. Assessments will now be based on the average consolidated total assets less tangible equity capital of a financial institution. The Dodd-Frank Act also permanently increases the maximum amount of deposit insurance for banks, savings institutions and credit unions to $250,000 per depositor and noninterest bearing transaction accounts and IOLTA accounts have unlimited deposit insurance through December 31, 2013.
The Dodd-Frank Act will require publicly traded companies to give stockholders a non-binding vote on executive compensation and so-called “golden parachute” payments and authorizes the Securities and Exchange Commission to promulgate rules that would allow stockholders to nominate their own candidates using a company’s proxy materials. The legislation also directs the federal banking regulators to issue rules prohibiting incentive compensation that encourages inappropriate risks. Specifically, the legislation directs the Federal Reserve Board to promulgate rules prohibiting excessive compensation paid to bank holding company executives, regardless of whether the company is publicly traded or not.
The Dodd-Frank Act creates a new Consumer Financial Protection Bureau with broad powers to supervise and enforce consumer protection laws. The Consumer Financial Protection Bureau has broad rule-making authority for a wide range of consumer protection laws that apply to all banks and savings institutions, including the authority to prohibit “unfair, deceptive or abusive” acts and practices. The Consumer Financial Protection Bureau has examination and enforcement authority over all banks and savings institutions with more than $10 billion in assets. Financial institutions with $10 billion or less in assets, such as banks, will continue to be examined for compliance with the consumer laws by their primary bank regulators.
Many aspects of the Dodd-Frank Act are subject to rulemaking and will take effect over several years, making it difficult to anticipate the overall financial impact on the Company. However, compliance with this new law and its implementing regulations will result in additional operating costs that could have a material adverse effect on our financial condition and results of operations.
Our loan portfolio is concentrated in loans with a higher risk of loss.
Repayment of our commercial business loans, consisting of commercial and industrial loans as well as owner-occupied commercial real estate loans, is often dependent on the cash flows of the borrower, which may be unpredictable, and the collateral securing these loans may fluctuate in value. We offer different types of commercial loans to a variety of businesses with a focus on real estate related industries and businesses in agricultural, healthcare, legal, and other professions. The types of commercial loans offered are business lines of credit, term equipment financing and term real estate loans. We also originate loans that are guaranteed by the
29
Table of Contents
Small Business Administration, or SBA, and are a “preferred lender” of the SBA. Commercial business lending involves risks that are different from those associated with real estate lending. Real estate lending is generally considered to be collateral based lending with loan amounts based on predetermined loan to collateral values and liquidation of the underlying real estate collateral being viewed as the primary source of repayment in the event of borrower default. Our commercial business loans are primarily made based on our assessment of the cash flow of the borrower and secondarily on the underlying collateral provided by the borrower. The borrowers’ cash flow may be unpredictable, and collateral securing these loans may fluctuate in value. Although commercial business loans are often collateralized by equipment, inventory, accounts receivable, or other business assets, the liquidation of collateral in the event of default is often an insufficient source of repayment because accounts receivable may be uncollectible and inventories may be obsolete or of limited use, among other things. Accordingly, the repayment of commercial business loans depends primarily on the cash flow and credit worthiness of the borrower and secondarily on the underlying collateral provided by the borrower. In addition, as part of our commercial business lending activities, we originate agricultural loans. Payments on agricultural loans are typically dependent on the profitable operation or management of the related farm property. The success of the farm may be affected by many factors outside the control of the borrower, including adverse weather conditions that prevent the planting of a crop or limit crop yields, declines in market prices for agricultural products and the impact of government regulations. In addition, many farms are dependent on a limited number of key individuals whose injury or death may significantly affect the successful operation of the farm. If the cash flow from a farming operation is diminished, the borrower’s ability to repay the loan may be impaired.
At December 31, 2010, our originated commercial business loans (consisting of commercial and industrial loans and owner-occupied commercial real estate loans) totaled $392.3 million, or approximately 52.8% of our total originated loan portfolio.
Our non-owner occupied commercial real estate loans, which includes multifamily real estate loans, involve higher principal amounts than other loans and repayment of these loans may be dependent on factors outside our control or the control of our borrowers. We originate commercial and multifamily real estate loans for individuals and businesses for various purposes, which are secured by commercial properties. These loans typically involve higher principal amounts than other types of loans, and repayment is dependent upon income generated, or expected to be generated, by the property securing the loan in amounts sufficient to cover operating expenses and debt service, which may be adversely affected by changes in the economy or local market conditions. For example, if the cash flow from the borrower’s project is reduced as a result of leases not being obtained or renewed, the borrower’s ability to repay the loan may be impaired. Commercial and multifamily real estate loans also expose us to greater credit risk than loans secured by residential real estate because the collateral securing these loans typically cannot be sold as easily as residential real estate. In addition, many of our commercial and multifamily real estate loans are not fully amortizing and contain large balloon payments upon maturity. Such balloon payments may require the borrower to either sell or refinance the underlying property in order to make the payment, which may increase the risk of default or non-payment.
If we foreclose on a commercial and multifamily real estate loan, our holding period for the collateral typically is longer than for one-to-four family residential mortgage loans because there are fewer potential purchasers of the collateral. Additionally, commercial and multifamily real estate loans generally have relatively large balances to single borrowers or related groups of borrowers. Accordingly, if we make any errors in judgment in the collectability of our commercial and multifamily real estate loans, any resulting charge-offs may be larger on a per loan basis than those incurred with our residential or consumer loan portfolios.
As of December 31, 2010, our non-owner occupied commercial real estate loans totaled $221.7 million, or 29.9% of our total originated loan portfolio.
Our real estate construction and land development loans are based upon estimates of costs and value associated with the complete project. These estimates may be inaccurate. Construction lending can involve a higher level of risk than other types of lending because funds are advanced partially based upon the value of the
30
Table of Contents
project, which is uncertain prior to the project’s completion. Because of the uncertainties inherent in estimating construction costs as well as the market value of a completed project and the effects of governmental regulation of real property, our estimates with regards to the total funds required to complete a project and the related loan-to-value ratio may vary from actual results. As a result, construction loans often involve the disbursement of substantial funds with repayment dependent, in part, on the success of the ultimate project and the ability of the borrower to sell or lease the property or refinance the indebtedness. If our estimate of the value of a project at completion proves to be overstated, it may have inadequate security for repayment of the loan and may incur a loss.
As of December 31, 2010, our originated real estate construction and land development loans totaled $58.0 million, or approximately 7.8% of our total originated loan portfolio. Of these loans, $29.4 million, or approximately 4.0%, were one-to-four family residential construction related and $28.6 million, or approximately 3.8% were multifamily residential and commercial construction related. Approximately $15.6 million, or 26.9%, of our total originated construction loans were nonperforming at December 31, 2010.
Our allowance for loan losses may prove to be insufficient to absorb losses in its loan portfolio.
Lending money is a substantial part of our business. Every loan carries a certain risk that it will not be repaid in accordance with its terms or that any underlying collateral will not be sufficient to assure repayment. This risk is affected by, among other things:
| • | cash flow of the borrower and/or the project being financed; |
| • | the changes and uncertainties as to the future value of the collateral, in the case of a collateralized loan; |
| • | the credit history of a particular borrower; |
| • | changes in economic and industry conditions; and |
| • | the duration of the loan. |
We maintain an allowance for loan losses on our non-covered loans, which is a reserve established through a provision for loan losses charged against income, which we believe is appropriate to provide for probable losses in our loan portfolio. The amount of this allowance is determined by our management through a periodic review and consideration of several factors, including, but not limited to:
| • | our general reserve, based on our historical default and loss experience; |
| • | our specific reserve, based on our evaluation of nonperforming loans and their underlying collateral or discounted cash flows; and |
| • | current macroeconomic factors. |
The determination of the appropriate level of the allowance for loan losses inherently involves a high degree of subjectivity and requires us to make significant estimates of current credit risks and future trends, all of which may undergo material changes. Continuing deterioration in economic conditions affecting borrowers, new information regarding existing loans, identification of additional problem loans and other factors, both within and outside of our control, may require an increase in the allowance for loan losses. In addition, bank regulatory agencies periodically review our allowance for loan losses and may require an increase in the provision for possible loan losses or the recognition of further loan charge-offs, based on judgments different than those of management. In addition, if charge-offs in future periods exceed the allowance for loan losses we will need additional provisions to increase the allowance for loan losses. Any increases in the allowance for loan losses will result in a decrease in net income and, possibly, capital, and may have a material adverse effect on our financial condition and results of operations.
31
Table of Contents
If our allowance for loan losses is not adequate, we may be required to make further increases in our provision for loan losses and to charge off additional loans, which could adversely affect our results of operations and our capital.
For the year ended December 31, 2010 we recorded a provision of $12.0 million compared to $19.4 million for the year ended December 31, 2009. We also recorded net loan charge-offs of $16.1 million for the year ended December 31, 2010 compared to $8.6 million for the year ended December 31, 2009. Recently, we have been experiencing decreasing loan delinquencies and increasing loan charge-offs. Generally, our nonperforming loans and assets reflect operating difficulties of individual borrowers resulting from weakness in the local economy. The deterioration in the general economy has been a significant contributing factor to our current level of delinquencies and nonperforming loans. Slower sales and excess inventory in the housing market has been the primary cause of the increase in foreclosures for one-to-four family residential construction loans, which represented 38.1% of our nonperforming originated loans at December 31, 2010. At December 31, 2010 our total nonperforming originated loans were $26.9 million, or 3.19% of total originated loans, compared to $35.3 million or 4.27% of total loans at December 31, 2009. Moreover, if weak economic conditions persist, we expect that we could experience significantly higher delinquencies and loan charge-offs. As a result, we may be required to make further increases in our provision for loan losses in the future, which could adversely affect our financial condition and results of operations, perhaps materially.
The current economic condition in the market areas we serve may continue to adversely impact our earnings and could increase the credit risk associated with our loan portfolio.
Substantially all of our loans are to businesses and individuals in the state of Washington and Oregon, and a continuing decline in the economies of our primary market areas of the Pacific Northwest could have a material adverse effect on our business, financial condition, results of operations and prospects. In particular, the Puget Sound and Portland, Oregon areas have experienced substantial home price declines and increased foreclosures. A series of large Pacific Northwest businesses have implemented substantial employee layoffs and scaled back plans for future growth. Additionally, acquisitions and consolidations have resulted in substantial employee layoffs, along with a significant increase in office space vacancies in downtown Seattle. The Yakima Valley has likewise seen increased unemployment and a continued decline in housing prices.
A further deterioration in economic conditions in the market areas we serve could result in the following consequences, any of which could have a materially adverse impact on our business, financial condition and results of operations:
| • | loan delinquencies, problem assets and foreclosures may increase; |
| • | we may increase our provision for loan losses; |
| • | demand for our products and services may decline; |
| • | collateral for loans made may decline further in value, in turn reducing customers’ borrowing power, reducing the value of assets and collateral associated with existing loans; and |
| • | low cost or noninterest bearing deposits may decrease. |
We cannot accurately predict the effect of the national economic recession on our future results of operations or the market price of our stock.
The national economy and the financial services sector in particular are currently facing challenges of a scope unprecedented in recent history. We cannot accurately predict the severity or duration of the current economic recession, which has adversely impacted the markets we serve. Any further deterioration in the economies of the nation as a whole or in its local markets would have an adverse effect, which could be material, on our business, financial condition, results of operations and prospects, and could also cause the market price of our common stock to decline. While it is impossible to predict how long these recessionary conditions may exist, the economic downturn could continue to present risks for some time for the banking industry and us.
32
Table of Contents
Further economic downturns may adversely affect our investment securities portfolio.
Further deterioration in the credit markets created market volatility and illiquidity, which may result in further significant declines in the market values of a broad range of investment products. We continue to monitor our investment portfolio for deteriorating collateral values and other-than-temporary impairments. Additionally, other than temporary impairments could adversely affect our operating results.
If the goodwill we have recorded in connection with acquisitions becomes impaired, our earnings and capital could be reduced.
Accounting standards require that we account for acquisitions using the purchase method of accounting. Under purchase accounting, if the purchase price of an acquired company exceeds the fair value of its net assets, the excess is carried on the acquirer’s balance sheet as goodwill. In accordance with generally accepted accounting principles, our goodwill is evaluated for impairment on an annual basis or more frequently if events or circumstances indicate that a potential impairment exists. Such evaluation is based on a variety of factors, including the quoted price of our common stock, market prices of common stock of other banking organizations, common stock trading multiples, discounted cash flows, and data from comparable acquisitions. At December 31, 2010, we had goodwill with a carrying amount of $13.0 million.
Declines in our stock price or a prolonged weakness in the operating environment of the financial services industry may result in a future impairment charge. Any such impairment charge could have a material adverse affect on our operating results and capital.
Fluctuating interest rates can adversely affect our profitability.
Our profitability is dependent to a large extent upon net interest income, which is the difference (or “spread”) between the interest earned on loans, securities and other interest-earning assets and the interest paid on deposits, borrowings, and other interest-bearing liabilities. Because of the differences in maturities and repricing characteristics of our interest-earning assets and interest-bearing liabilities, changes in interest rates do not produce equivalent changes in interest income earned on interest-earning assets and interest paid on interest-bearing liabilities. Accordingly, fluctuations in interest rates could adversely affect our interest rate spread, and, in turn, our profitability.
FDIC insurance premiums increased significantly in 2009 and we may pay higher FDIC premiums in the future.
The Dodd-Frank Act established 1.35% as the minimum reserve ratio. The FDIC has adopted a plan under which it will meet this ratio by the statutory deadline of September 30, 2020. The Dodd-Frank requires the FDIC to offset the effect on institutions with assets less than $10 billion of the increase in the minimum reserve ratio to 1.35% from the former minimum of 1.15%. The FDIC has not announced how it will implement this offset. In addition to the statutory minimum ratio, the FDIC must set a designated reserve ratio or DRR, which may exceed the statutory minimum. The FDIC has set 2.0 as the DRR.
As required by the Dodd-Frank Act, the FDIC has adopted final regulations under which insurance premium are based on an institution’s total assets minus its tangible equity instead of its deposits. It is possible that our insurance premiums will increase under these final regulations.
Decreased volumes and lower gains on sales and brokering of mortgage loans sold could adversely impact net income.
We originate and sell mortgage loans as well as broker mortgage loans. Changes in interest rates affect demand for our loan products and the revenue realized on the sale of loans. A decrease in the volume of loans sold/brokered can decrease our revenues and net income.
33
Table of Contents
The tightening of available liquidity could limit our ability to replace deposits and fund loan demand, which could adversely affect our earnings and capital levels.
A tightening of the credit markets and the inability to obtain adequate funding to replace deposits and fund continued loan growth may negatively affect asset growth and, consequently, our earnings capability and capital levels. In addition to any deposit growth, maturity of investment securities and loan payments, we rely from time to time on advances from the Federal Home Loan Bank of Seattle, or FHLB, and certain other wholesale funding sources to fund loans and replace deposits. In the event of a further downturn in the economy, these additional funding sources could be negatively affected which could limit the funds available to us. Our liquidity position could be significantly constrained if we were unable to access funds from the FHLB or other wholesale funding sources.
Our growth or future losses may require us to raise additional capital in the future, but that capital may not be available when it is needed or the cost of that capital may be very high.
We are required by federal and state regulatory authorities to maintain adequate levels of capital to support our operations. At some point we may need to raise additional capital to support continued internal growth and growth through acquisitions.
Our ability to raise additional capital, if needed, will depend on conditions in the capital markets at that time, which are outside our control, and on our financial condition and performance. Accordingly, we cannot make assurances of our ability to raise additional capital if needed, or if the terms will be acceptable to us. If we cannot raise additional capital when needed, our ability to further expand our operations through internal growth and acquisitions could be materially impaired and our financial condition and liquidity could be materially and adversely affected.
Continued deterioration in the financial position of the Federal Home Loan Bank of Seattle may result in future impairment losses of our investment in Federal Home Loan Bank stock.
At December 31, 2010, we owned $5.6 million of stock of the FHLB of Seattle. As a condition of membership at the FHLB, we are required to purchase and hold a certain amount of FHLB stock. Our stock purchase requirement is based, in part, upon the outstanding principal balance of advances from the FHLB and is calculated in accordance with the Capital Plan of the FHLB. Our FHLB stock has a par value of $100, is carried at cost, and is subject to impairment testing. The FHLB has announced that it had a risk-based capital deficiency under the regulations of the Federal Housing Finance Agency, or the FHFA, its primary regulator, and that it would suspend future dividends and the repurchase and redemption of outstanding common stock. As a result, the FHLB has not paid a dividend since the fourth quarter of 2008. The FHLB has communicated that it believes the calculation of risk-based capital under the current rules of the FHFA significantly overstates the market risk of the FHLB’s private-label mortgage-backed securities in the current market environment and that it has enough capital to cover the risks reflected in its balance sheet. As a result, we have not recorded an other-than-temporary impairment on our investment in FHLB stock. However, continued deterioration in the FHLB’s financial position may result in impairment in the value of those securities. In addition, on October 25, 2010, the FHLB received a consent order from the FHFA. The potential impact of the consent order is unknown at this time. We will continue to monitor the financial condition of the FHLB as it relates to, among other things, the recoverability of our investment.
There may be future sales of additional common stock or other dilution of our equity, which may adversely affect the market price of our common stock.
We are not restricted from issuing additional common stock or preferred stock, including any securities that are convertible into or exchangeable for, or that represent the right to receive, common stock or preferred stock or any substantially similar securities. The market price of our common stock could decline as a result of sales of a large number of shares of common stock or preferred stock or similar securities in the market or from the perception that such sales could occur.
34
Table of Contents
Our board of directors is authorized generally to cause us to issue additional common stock, as well as series of preferred stock, without any action on the part of our shareholders except as may be required under the listing requirements of the NASDAQ Stock Market. In addition, the board has the power, without shareholder approval, to set the terms of any such series of preferred stock that may be issued, including voting rights, dividend rights and preferences over the common stock with respect to dividends or upon the liquidation, dissolution or winding-up of our business and other terms. If we issue preferred stock in the future that has a preference over the common stock with respect to the payment of dividends or upon liquidation, dissolution or winding-up, or if we issue preferred stock with voting rights that dilute the voting power of the common stock, the rights of holders of the common stock or the market price of the common stock could be adversely affected.
New or changing tax, accounting, and regulatory rules and interpretations could significantly impact strategic initiatives, results of operations, cash flows, and financial condition.
The financial services industry is extensively regulated. Federal and state banking regulations are designed primarily to protect the deposit insurance funds and consumers, not to benefit a company’s stockholders. These regulations may sometimes impose significant limitations on operations. The significant federal and state banking regulations that affect us are described in this report under the heading “Item 1. Business—Supervision and Regulation.” These regulations, along with the currently existing tax, accounting, securities, insurance, and monetary laws, regulations, rules, standards, policies, and interpretations control the methods by which financial institutions conduct business, implement strategic initiatives and tax compliance, and govern financial reporting and disclosures. These laws, regulations, rules, standards, policies, and interpretations are constantly evolving and may change significantly over time.
Such changes could subject us to additional costs, limit the types of financial services and products we may offer, restrict mergers and acquisitions, investments, access to capital, the location of banking offices, and/or increase the ability of non-banks to offer competing financial services and products, among other things. Further, recent regulatory changes to the rules for overdraft fees for debit transactions and interchange fees could reduce our fee income which would result in a reduction of our noninterest income. Our failure to comply with laws, regulations or policies could result in sanctions by regulatory agencies, civil money penalties and/or reputational damage, could have a material adverse effect on our business, financial condition and results of operations. While we have policies and procedures designed to prevent any such violations, there can be no assurance that such violations will not occur.
Competition with other financial institutions could adversely affect our profitability.
The banking and financial services industry is very competitive. Legal and regulatory developments have made it easier for new and sometimes unregulated competitors to compete with us. Consolidation among financial service providers has resulted in fewer very large national and regional banking and financial institutions holding a large accumulation of assets. These institutions generally have significantly greater resources, a wider geographic presence or greater accessibility. Our competitors sometimes are also able to offer more services, more favorable pricing or greater customer convenience than we do. In addition, our competition has grown from new banks and other financial services providers that target our existing or potential customers. As consolidation continues, we expect additional institutions to try to exploit our market.
Technological developments have allowed competitors including some non-depository institutions, to compete more effectively in local markets and have expanded the range of financial products, services and capital available to our target customers. If we are unable to implement, maintain and use such technologies effectively, we may not be able to offer products or achieve cost-efficiencies necessary to compete in our industry. In addition, some of these competitors have fewer regulatory constraints and lower cost structures.
We rely heavily on the proper functioning of our technology.
We rely heavily on communications and information systems to conduct our business. Any failure, interruption or breach in security of these systems could result in failures or disruptions in our customer
35
Table of Contents
relationship management, general ledger, deposit, loan and other systems. While we have policies and procedures designed to prevent or limit the effect of the failure, interruption or security breach of our information systems, there can be no assurance that any such failures, interruptions or security breaches will not occur or, if they do occur, that they will be adequately addressed. The occurrence of any failures, interruptions or security breaches of our information systems could damage our reputation, result in a loss of customer business, subject us to additional regulatory scrutiny, or expose us to civil litigation and possible financial liability, any of which could have a material adverse effect on our financial condition and results of operations.
We rely on third-party service providers for much of our communications, information, operating and financial control systems technology. If any of our third-party service providers experience financial, operational or technological difficulties, or if there is any other disruption in our relationships with them, we may be required to locate alternative sources of such services, and we cannot assure that we could negotiate terms that are as favorable to us, or could obtain services with similar functionality, as found in our existing systems, without the need to expend substantial resources, if at all. Any of these circumstances could have an adverse effect on our business.
Changes in accounting standards may affect how we record and report our performance.
Our accounting policies and methods are fundamental to how we record and report our financial condition and results of operations. From time to time there are changes in the financial accounting and reporting standards that govern the preparation of our financial statements. These changes can be difficult to predict and can materially impact how we report and record our financial condition and results of operations. In some cases, we could be required to apply a new or revised standard retroactively, resulting in a retrospective adjustment to prior financial statements.
The Warrant we issued to the Treasury may be dilutive to holders of our common stock.
The ownership interest of the existing holders of our common stock will be diluted to the extent the Warrant we issued to the Treasury in conjunction with the sale to the Treasury of the Series A Preferred Stock is exercised. The 138,037 shares of common stock underlying the Warrant represent approximately 0.9% of the shares of our common stock outstanding as of December 31, 2010 (including the shares issuable upon exercise of the Warrant in total shares outstanding). Although the Treasury has agreed not to vote any of the shares of common stock it receives upon exercise of the Warrant, a transferee of any portion of the Warrant or of any shares of common stock acquired upon exercise of the Warrant is not bound by this restriction.
We are dependent on key personnel and the loss of one or more of those key personnel may materially and adversely affect our prospects.
Competition for qualified employees and personnel in the banking industry is intense and there are a limited number of qualified persons with knowledge of, and experience in, the community banking industry where we conduct our business. The process of recruiting personnel with the combination of skills and attributes required to carry out our strategies is often lengthy. Our success depends to a significant degree upon our ability to attract and retain qualified management, loan origination, finance, administrative, marketing and technical personnel and upon the continued contributions of our management and personnel. In particular, our success has been and continues to be highly dependent upon the abilities of key executives, including our President and Chief Executive Officer, Mr. Brian Vance, and certain other employees. In this regard we are currently working with a nationally recognized community bank compensation consultant to prepare severance agreements to replace the severance agreements we previously had in place with certain of our key employees.
| ITEM 1B. | UNRESOLVED STAFF COMMENTS |
There are no unresolved staff comments from the Securities and Exchange Commission.
36
Table of Contents
| ITEM 2. | PROPERTIES |
Our executive offices and the main office of Heritage Bank are located in approximately 22,000 square feet of the headquarters building and adjacent office space which are owned by Heritage Bank and located in downtown Olympia. At December 31, 2010, Heritage Bank had ten offices located in Tacoma and surrounding areas of Pierce County (all but four of which are owned), five offices located in Thurston County (all of which are owned with one office located on leased land), three offices in King County (all of which are leased), one office in Mason County (which is owned), one office in Clark County (which is leased), four offices in Cowlitz County (all of which are owned with the exception of one leased office) and two offices in Multnomah Country (all of which are leased). Central Valley Bank had six offices, five located in Yakima County and one in Kittitas County (all of which are owned with one on leased land).
| ITEM 3. | LEGAL PROCEEDINGS |
We, and our Banks, are not a party to any material pending legal proceedings other than ordinary routine litigation incidental to the business of the Banks.
| ITEM 4. | (REMOVED AND RESERVED) |
37
Table of Contents
| ITEM 5. | MARKET FOR THE REGISTRANT’S COMMON EQUITY, RELATED STOCKHOLDER MATTERS AND ISSUER PURCHASES OF EQUITY SECURITIES |
Our common stock is traded on the NASDAQ Global Select Market under the symbol HFWA. At December 31, 2010, we had approximately 1,193 shareholders of record (not including the number of persons or entities holding stock in nominee or street name through various brokerage firms) and 15,568,471 outstanding shares of common stock. This total does not reflect the number of persons or entities who hold stock in nominee or “street” name through various brokerage firms. The last reported sales price on February 11, 2011 was $14.47 per share. The following table provides sales information per share of our common stock as reported on the NASDAQ Global Select Market for the indicated quarters.
| 2010 Quarter ended: | ||||||||||||||||
| March 31 | June 30 | September 30 | December 31 | |||||||||||||
| High |
$ | 15.36 | $ | 16.46 | $ | 15.70 | $ | 15.49 | ||||||||
| Low |
$ | 13.40 | $ | 13.61 | $ | 12.32 | $ | 13.23 | ||||||||
| 2009 Quarter ended: | ||||||||||||||||
| March 31 | June 30 | September 30 | December 31 | |||||||||||||
| High |
$ | 12.49 | $ | 13.00 | $ | 14.20 | $ | 14.20 | ||||||||
| Low |
$ | 8.55 | $ | 10.53 | $ | 10.51 | $ | 12.25 | ||||||||
Quarterly, the Company reviews the potential payment of cash dividends to common shareholders. The timing and amount of cash dividends paid on our common stock depends on the Company’s earnings, capital requirements, financial condition and other relevant factors. In this regard, in the second quarter of 2009, the Company’s board of directors decided to suspend the quarterly common stock dividend after reviewing these factors and giving consideration to the current economic environment and to preserve our strong capital position.
The most recent fiscal year quarterly cash dividends per common share are listed below:
| Declared |
Cash |
Record Date |
Paid | |||
| January 27, 2009 |
$0.100 | February 5, 2009 | February 20, 2009 |
The primary source for dividends paid to our shareholders is dividends paid to us from Heritage Bank and Central Valley Bank. There are regulatory restrictions on the ability of our subsidiary banks to pay dividends. Under federal regulations, the dollar amount of dividends the banks may pay depends upon their capital position and recent net income. Generally, if a bank satisfies its regulatory capital requirements, it may make dividend payments up to the limits prescribed under state law and FDIC regulations. However, an institution that has converted to a stock form of ownership, as Heritage Bank has done, may not declare or pay a dividend on, or repurchase any of, its common stock if the effect thereof would cause the regulatory capital of the institution to be reduced below the amount required for the liquidation account which was established in connection with the conversion.
As a bank holding company, our ability to pay dividends is subject to the guidelines of the Federal Reserve Board regarding capital adequacy and dividends. The Federal Reserve Board’s policy is that a bank holding company should pay cash dividends only to the extent that its net income for the past year is sufficient to cover both the cash dividends and a rate of earnings retention that is consistent with the holding company’s capital needs, asset quality and overall financial condition, and that it is inappropriate for a bank holding company experiencing serious financial problems to borrow funds to pay dividends. Under Washington law, we are prohibited from paying a dividend if, after making such dividend payment, we would be unable to pay our debts as they become due in the usual course of business, or if our total liabilities, plus the amount that would be
38
Table of Contents
needed, in the event we were to be dissolved at the time of the dividend payment, to satisfy preferential rights on dissolution of holders of preferred stock ranking senior in right of payment to the capital stock on which the applicable distribution is to be made exceed our total assets.
The Company does not currently have a stock repurchase plan in place and no stock was repurchased during the fourth quarter of 2010.
The information regarding the Company’s equity compensation plan is contained under Part III, Item 12 of this report and is incorporated by reference herein.
Stock Performance Graph
The chart shown below depicts total return to stockholders during the period beginning December 31, 2005 and ending December 31, 2010. Total return includes appreciation or depreciation in market value of Heritage common stock as well as actual cash and stock dividends paid to common stockholders. Indices shown below, for comparison purposes only, are the Total Return Index for the NASDAQ Stock Market (U.S. Companies), which is a broad nationally recognized index of stock performance by publicly traded companies and the NASDAQ Bank Index, which is an index that contains securities of NASDAQ-listed companies classified according to the Industry Classification Benchmark as banks. The chart assumes that the value of the investment in Heritage’s common stock and each of the three indices was $100 on December 31, 2005, and that all dividends were reinvested in Heritage common stock.
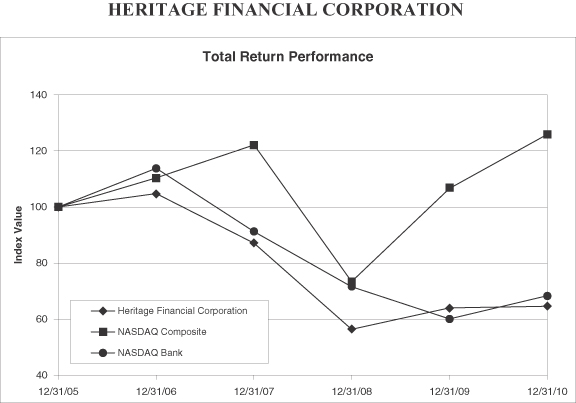
| Period Ended | ||||||||||||||||||||||||
| Index |
12/31/05 | 12/31/06 | 12/31/07 | 12/31/08 | 12/31/09 | 12/31/10 | ||||||||||||||||||
| Heritage Financial Corporation |
$ | 100.00 | $ | 104.75 | $ | 87.06 | $ | 56.37 | $ | 63.95 | $ | 64.60 | ||||||||||||
| NASDAQ Composite |
100.00 | 110.39 | 122.15 | 73.32 | 106.57 | 125.91 | ||||||||||||||||||
| NASDAQ Bank |
100.00 | 113.82 | 91.16 | 71.52 | 59.87 | 68.34 | ||||||||||||||||||
39
Table of Contents
| ITEM 6. | SELECTED FINANCIAL DATA |
The following table sets forth certain information concerning our consolidated financial position and results of operations at and for the dates indicated and have been derived from our audited consolidated financial statements. The information below is qualified in its entirety by the detailed information included elsewhere herein and should be read along with “Item 7. Management’s Discussion and Analysis of Financial Condition and Results of Operations” and “Item 8. Financial Statements and Supplementary Data.”
| For the years ended December 31, | ||||||||||||||||||||
| 2010 | 2009 | 2008 | 2007 | 2006 | ||||||||||||||||
| (Dollars in thousands, except per share amounts) | ||||||||||||||||||||
| Operations Data: |
||||||||||||||||||||
| Interest income |
$ | 59,522 | $ | 53,341 | $ | 56,948 | $ | 62,391 | $ | 55,237 | ||||||||||
| Interest expense |
8,511 | 11,645 | 18,606 | 25,770 | 19,465 | |||||||||||||||
| Net interest income |
51,011 | 41,696 | 38,342 | 36,621 | 35,772 | |||||||||||||||
| Provision for loan losses |
11,990 | 19,390 | 7,420 | 810 | 720 | |||||||||||||||
| Noninterest income |
21,498 | 8,667 | 8,824 | 8,572 | 7,954 | |||||||||||||||
| Noninterest expense |
40,730 | 30,895 | 30,419 | 28,288 | 27,082 | |||||||||||||||
| Federal income tax (benefit) expense |
6,435 | (503 | ) | 2,976 | 5,387 | 5,377 | ||||||||||||||
| Net income |
13,354 | 581 | 6,351 | 10,708 | 10,547 | |||||||||||||||
| Net income (loss) applicable to common shareholders |
11,668 | (739 | ) | 6,208 | 10,708 | 10,547 | ||||||||||||||
| Earnings (loss) per common share(1) |
||||||||||||||||||||
| Basic |
1.05 | (0.10 | ) | 0.93 | 1.62 | 1.64 | ||||||||||||||
| Diluted |
1.04 | (0.10 | ) | 0.93 | 1.60 | 1.59 | ||||||||||||||
| Dividend payout ratio to common shareholders(2) |
— | (100.0 | )% | 59.5 | % | 51.5 | % | 49.1 | % | |||||||||||
| Performance Ratios: |
||||||||||||||||||||
| Net interest spread(3) |
4.56 | % | 4.25 | % | 4.11 | % | 3.86 | % | 4.30 | % | ||||||||||
| Net interest margin(4) |
4.78 | % | 4.57 | % | 4.59 | % | 4.50 | % | 4.83 | % | ||||||||||
| Efficiency ratio(5) |
56.17 | % | 61.34 | % | 64.50 | % | 62.59 | % | 61.94 | % | ||||||||||
| Return on average assets |
1.16 | % | 0.06 | % | 0.71 | % | 1.23 | % | 1.33 | % | ||||||||||
| Return on average common equity |
8.15 | % | (0.72 | )% | 6.98 | % | 12.87 | % | 14.18 | % | ||||||||||
| At December 31, | ||||||||||||||||||||
| 2010 | 2009 | 2008 | 2007 | 2006 | ||||||||||||||||
| Balance Sheet Data: |
||||||||||||||||||||
| Total assets |
$ | 1,367,684 | $ | 1,014,859 | $ | 946,145 | $ | 886,055 | $ | 852,893 | ||||||||||
| Originated loans receivable, net |
719,957 | 746,083 | 793,303 | 768,945 | 739,596 | |||||||||||||||
| Purchased covered loans receivable |
128,715 | — | — | — | — | |||||||||||||||
| Purchased noncovered loans receivable |
131,049 | — | — | — | — | |||||||||||||||
| Loans receivable, net |
979,721 | 746,083 | 793,303 | 768,945 | 739,596 | |||||||||||||||
| Loans held for sale |
764 | 825 | 304 | 447 | — | |||||||||||||||
| Deposits |
1,136,276 | 840,128 | 824,480 | 776,280 | 725,921 | |||||||||||||||
| FDIC indemnification asset |
16,071 | — | — | — | — | |||||||||||||||
| FHLB advances |
— | — | — | 14,990 | 37,167 | |||||||||||||||
| Securities sold under agreement to repurchase |
19,027 | 10,440 | — | — | — | |||||||||||||||
| Stockholders’ equity |
202,279 | 158,498 | 113,147 | 84,967 | 78,639 | |||||||||||||||
| Book value per common share |
12.99 | 12.21 | 13.40 | 12.79 | 11.99 | |||||||||||||||
| Equity to assets ratio |
14.8 | % | 15.6 | % | 12.0 | % | 9.6 | % | 9.2 | % | ||||||||||
| Capital Ratios: |
||||||||||||||||||||
| Total risk-based capital ratio |
21.5 | % | 20.7 | % | 13.7 | % | 10.7 | % | 10.4 | % | ||||||||||
| Tier 1 risk-based capital ratio |
20.2 | % | 19.4 | % | 12.5 | % | 9.5 | % | 9.1 | % | ||||||||||
| Leverage ratio |
13.9 | % | 14.6 | % | 11.0 | % | 8.2 | % | 8.0 | % | ||||||||||
| Asset Quality Ratios: |
||||||||||||||||||||
| Nonperforming originated loans to total originated loans |
3.19 | % | 4.27 | % | 0.42 | % | 0.13 | % | 0.37 | % | ||||||||||
| Allowance for loan losses to total originated loans |
2.97 | % | 3.38 | % | 1.91 | % | 1.33 | % | 1.35 | % | ||||||||||
| Allowance for loan losses to nonperforming originated loans |
93.16 | % | 79.33 | % | 454.02 | % | 1,016.06 | % | 360.05 | % | ||||||||||
| Nonperforming originated assets to total originated assets |
2.41 | % | 3.32 | % | 0.57 | % | 0.13 | % | 0.36 | % | ||||||||||
| Other Data: |
||||||||||||||||||||
| Number of banking offices |
31 | 20 | 20 | 20 | 20 | |||||||||||||||
| Number of full-time equivalent employees |
321 | 222 | 217 | 224 | 233 | |||||||||||||||
40
Table of Contents
| (1) | Effective January 1, 2009, the Company adopted FASB ASC 03-6-1. Earnings per share data for the prior periods have been revised to reflect the retrospective adoption of the FASB ASC. |
| (2) | Dividend payout ratio is declared dividends per common share (excluding stock dividends) divided by basic earnings per common share. |
| (3) | Net interest spread is the difference between the average yield on interest earning assets and the average cost of net interest bearing liabilities. |
| (4) | Net interest margin is net interest income divided by average interest earning assets. |
| (5) | The efficiency ratio is recurring noninterest expense divided by the sum of net interest income and noninterest income. |
41
Table of Contents
| ITEM 7. | MANAGEMENT’S DISCUSSION AND ANALYSIS OF FINANCIAL CONDITION AND RESULTS OF OPERATIONS |
The following discussion is intended to assist in understanding the financial condition and results of operations of the Company. The information contained in this section should be read with the December 31, 2010 audited consolidated financial statements and notes to those financial statements included in this Form 10-K.
This Form 10-K may contain forward-looking statements within the meaning of the Private Securities Litigation Reform Act of 1995. Forward-looking statements often include the words “believes,” “expects,” “anticipates,” “estimates,” “forecasts,” “intends,” “plans,” “targets,” “potentially,” “probably,” “projects,” “outlook” or similar expressions or future or conditional verbs such as “may,” “will,” “should,” “would” and “could.” These forward-looking statements are subject to known and unknown risks, uncertainties and other factors that could cause actual results to differ materially from the results anticipated, including:
| • | our ability to successfully integrate any assets, liabilities, customers, systems, and management personnel we have acquired, including the Cowlitz Bank and Pierce Commercial Bank transactions described in this Form 10-K, or may in the future acquire, into our operations and our ability to realize related revenue synergies and cost savings within expected time frames or at all, and any goodwill charges related thereto and costs or difficulties relating to integration matters, including but not limited to customer and employee retention, which might be greater than expected; |
| • | the credit risks of lending activities, including changes in the level and trend of loan delinquencies and write-offs and changes in our allowance for loan losses and provision for loan losses that may be impacted by deterioration in the housing and commercial real estate markets; |
| • | changes in general economic conditions, either nationally or in our market areas; |
| • | changes in the levels of general interest rates, and the relative differences between short and long term interest rates, deposit interest rates, our net interest margin and funding sources; |
| • | risks related to acquiring assets in or entering markets in which we have not previously operated and may not be familiar;• fluctuations in the demand for loans, the number of unsold homes and other properties and fluctuations in real estate values in our market areas; |
| • | results of examinations of us by the Federal Reserve and of our bank subsidiaries by the FDIC, the Division or other regulatory authorities, including the possibility that any such regulatory authority may, among other things, require us to increase our reserve for loan losses, write-down assets, change our regulatory capital position or affect our ability to borrow funds or maintain or increase deposits, which could adversely affect our liquidity and earnings; |
| • | legislative or regulatory changes that adversely affect our business including changes in regulatory policies and principles, including the recently adopted Dodd-Frank Act and regulations that have been or will be promulgated thereunder and interpretation of regulatory capital or other rules; |
| • | our ability to control operating costs and expenses; |
| • | further increases in premiums for deposit insurance; |
| • | the use of estimates in determining fair value of certain of our assets, which estimates may prove to be incorrect and result in significant declines in valuation; |
| • | difficulties in reducing risk associated with the loans on our balance sheet; |
| • | staffing fluctuations in response to product demand or the implementation of corporate strategies that affect our workforce and potential associated charges; |
| • | computer systems on which we depend could fail or experience a security breach; |
42
Table of Contents
| • | our ability to retain key members of our senior management team; |
| • | costs and effects of litigation, including settlements and judgments; |
| • | our ability to implement our branch expansion strategy; |
| • | our ability to successfully integrate any assets, liabilities, customers, systems, and management personnel we have acquired or may in the future acquire into our operations and our ability to realize related revenue synergies and cost savings within expected time frames and any goodwill charges related thereto; |
| • | changes in consumer spending, borrowing and savings habits; |
| • | the availability of resources to address changes in laws, rules, or regulations or to respond to regulatory actions; |
| • | adverse changes in the securities markets; |
| • | inability of key third-party providers to perform their obligations to us; |
| • | changes in accounting policies and practices, as may be adopted by the financial institution regulatory agencies or the Financial Accounting Standards Board, including additional guidance and interpretation on accounting issues and details of the implementation of new accounting methods; and |
| • | other economic, competitive, governmental, regulatory, and technological factors affecting our operations, pricing, products and services and the other risks described elsewhere in this prospectus supplement, the accompanying prospectus and the incorporated documents. |
Some of these and other factors are discussed in this Form 10-K under the caption “Risk Factors” and elsewhere in this Form 10-K. Such developments could have a material adverse impact on our business, financial position and results of operations.
Any forward-looking statements are based upon management’s beliefs and assumptions at the time they are made. We undertake no obligation to publicly update or revise any forward-looking statements included in this Form 10-K or to update the reasons why actual results could differ from those contained in such statements, whether as a result of new information, future events or otherwise. In light of these risks, uncertainties and assumptions, the forward-looking statements discussed in this Form 10-K, and you should not put undue reliance on any forward-looking statements.
Critical Accounting Policies
The Company’s Consolidated Financial Statements have been prepared in accordance with accounting principles generally accepted in the United States of America. Companies may apply certain critical accounting policies requiring management to make subjective or complex judgments, often as a result of the need to estimate the effect of matters that are inherently uncertain.
The Company considers its most critical accounting estimates to be the allowance for loan losses, estimations of cash flows related to impaired purchased loans, other than temporary impairments in the market value of investments and impairment of goodwill.
Allowance for Loan Losses. The allowance for loan losses is established through a provision for loan losses charged against earnings. The balance of the allowance for loan losses is maintained at the amount management believes will be adequate to absorb known and inherent losses in the loan portfolio at the balance sheet date. The allowance for loan losses is determined by applying estimated loss factors to the credit exposure from outstanding loans.
43
Table of Contents
We assess the estimated credit losses inherent in our non-classified and classified loan portfolio by considering a number of elements including:
| • | Historical loss experience in the portfolio; |
| • | Levels of and trends in delinquencies and impaired loans; |
| • | Levels and trends in charge-offs and recoveries; |
| • | Effects of changes in risk selection and underwriting standards, and other changes in lending policies, procedures and practices; |
| • | Experience, ability, and depth of lending management and other relevant staff; |
| • | National and local economic trends and conditions; |
| • | External factors such as competition, legal, and regulatory; and |
| • | Effects of changes in credit concentrations. |
We calculate an allowance for the non-classified and classified portion of our loan portfolio based on an appropriate percentage loss factor that is calculated based on the above-noted elements and trends. We may record specific provisions for each impaired loan after a careful analysis of that loan’s credit and collateral factors. Our analysis of an allowance combines the provisions made for our non-classified loans, classified loans, and the specific provisions made for each impaired loan.
While we believe we use the best information available to determine the allowance for loan losses, our results of operations could be significantly affected if circumstances differ substantially from the assumptions used in determining the allowance. A further decline in local and national economic conditions, or other factors, could result in a material increase in the allowance for loan losses and may adversely affect the Company’s financial conditions and results of operations. In addition, the determination of the amount of the allowance for loan losses is subject to review by bank regulators, as part of the routine examination process, which may result in the establishment of additional reserves based upon their judgment of information available to them at the time of their examination.
For additional information regarding the allowance for loan losses, its relation to the provision for loans losses, risk related to asset quality and lending activity, see Part I, Item 1, “Business—Analysis of Allowance for Loan and Lease Losses” as well as “—Results of Operations for the Years Ended December 31, 2010 and 2009—Provision for Loan Losses.”
Estimated Cash Flows related to Impaired Purchased Loans. Loans purchased with evidence of credit deterioration since origination for which it is probable that all contractually required payments will not be collected are accounted for under Financial Accounting Standards Board (“FASB”) Accounting Standards Codification (“FASB ASC”) 310-30, Loans and Debt Securities Acquired with Deteriorated Credit Quality, formerly AICPA SOP 03-3 Accounting for Certain Loans or Debt Securities Acquired in a Transfer. In situations where such loans have similar risk characteristics, loans may be aggregated into pools to estimate cash flows. A pool is accounted for as a single asset with a single interest rate, cumulative loss rate and cash flow expectation.
The cash flows expected over the life of the loan or pool are estimated using an internal cash flow model that projects cash flows and calculates the carrying values of the pools, book yields, effective interest income and impairment, if any, based on pool level events. Assumptions as to default rates, loss severity and prepayment speeds are utilized to calculate the expected cash flows.
Expected cash flows at the acquisition date in excess of the fair value of loans are considered to be accretable yield, which is recognized as interest income over the life of the loan or pool using a level yield method if the timing and amount of the future cash flows of the pool is reasonably estimable. Subsequent to the
44
Table of Contents
acquisition date, any increases in cash flow over those expected at purchase date in excess of fair value are recorded as interest income prospectively. Any subsequent decreases in cash flow over those expected at purchase date are recognized by recording an allowance for loan losses. Any disposals of loans, including sales of loans, payments in full or foreclosures result in the removal of the loan from the loan pool at the carrying amount.
Other Than Temporary Impairments in the Market Value of Investments. Unrealized losses on investment securities available for sale and held to maturity securities are evaluated at least quarterly to determine whether declines in value should be considered “other than temporary” and therefore be subject to immediate loss recognition in income. Although these evaluations involve significant judgment, an unrealized loss in the fair value of a debt security is generally deemed to be temporary when the fair value of the security is below the carrying value primarily due to changes in interest rates, there has not been significant deterioration in the financial condition of the issuer, and we have the intent and ability to hold the security for a sufficient time to recover the carrying value. An unrealized loss in the value of an equity security is generally considered temporary when the fair value of the security is below the carrying value primarily due to current market conditions and not deterioration in the financial condition of the issuer and we have the intent and ability to hold the security for a sufficient time to recover the carrying value. Other factors that may be considered in determining whether a decline in the value of either a debt or an equity security is “other than temporary” include ratings by recognized rating agencies; actions of commercial banks or other lenders relative to the continued extension of credit facilities to the issuer of the security; the financial condition, capital strength and near-term prospects of the issuer and recommendations of investment advisors or market analysts. Therefore, continued deterioration of market conditions could result in additional impairment losses recognized within the investment portfolio.
Goodwill. Goodwill represents the excess of the purchase price over the net assets acquired in the purchases of North Pacific Bank and Western Washington Bancorp. The Company’s goodwill is assigned to Heritage Bank and is evaluated for impairment at the Heritage Bank level (reporting unit). Goodwill is not amortized, but is reviewed for impairment annually and between annual tests if an event occurs or circumstances change that might indicate the Company’s recorded value is more than its implied value. Such indicators may include, among others: a significant adverse change in legal factors or in the general business climate; significant decline in the Company’s stock price and market capitalization; unanticipated competition; and an adverse action or assessment by a regulator. Any adverse changes in these factors could have a significant impact on the recoverability of goodwill and could have a material impact on the Company’s financial statements.
When required, the goodwill impairment test involves a two-step process. The first test for goodwill impairment is done by comparing the reporting unit’s aggregate fair value to its carrying value. Absent other indicators of impairment, if the aggregate fair value exceeds the carrying value, goodwill is not considered impaired and no additional analysis is necessary. If the carrying value of the reporting unit were to exceed the aggregate fair value, a second test would be performed to measure the amount of impairment loss, if any. To measure any impairment loss the implied fair value would be determined in the same manner as if the reporting unit were being acquired in a business combination. If the implied fair value of goodwill is less than the recorded goodwill an impairment charge would be recorded for the difference.
Our Strategy
Our primary objective is to be a well-capitalized, profitable community banking organization, with balanced growth while emphasizing lending and deposit relationships with small and medium size businesses along with their owners and the general public. We consider ourselves as an innovative team providing financial services focusing on the success of our customers. Our stated mission is: “Continuously Improve Customer Satisfaction, Employee Empowerment and Shareholder Value.” We will seek to achieve our objective through the following strategies:
45
Table of Contents
Expand geographically as opportunities present themselves. We are committed to continuing the controlled expansion of our franchise through strategic acquisitions designed to increase our market share. We believe that consolidation across the community bank landscape will continue to take place and further believe that, with our capital and liquidity positions, approach to credit management and extensive acquisition experience, we are well positioned to take advantage of acquisitions or other business opportunities in our market areas, including additional FDIC-assisted transactions. In markets where we wish to enter or expand our business, we will also consider opening de novo offices. In the past, we have successfully integrated acquired institutions and opened de novo branches. We plan to acquire or build one to two branches per year in strategic growth locations. We will continue to be disciplined and opportunistic as it pertains to future acquisitions and de novo branching focusing on the Pacific Northwest markets we know and understand.
Focus on Asset Quality. A strong credit culture is a high priority for us. We have a well-developed credit approval structure that has enabled us to maintain a standard of asset quality that we believe is conservative while maintaining our lending objectives. We will continue to focus on loan types and markets that we know well and have a historical record of success. We focus on loan relationships that are well diversified in both size and industry types. With respect to commercial business lending, which is our predominant lending activity, we view ourselves as cash-flow lenders obtaining additional support from realistic collateral values, personal guarantees and secondary sources of repayment. We have a problem loan resolution process that is focused on quick detection and feasible solutions. We seek to maintain strong internal controls and subject our loans to periodic internal loan review as well as a third party loan review process.
Maintain Strong Balance Sheet. In addition to our focus on our underwriting, we believe that the strength of our balance sheet has thus far enabled us to endure the economic downturn afflicting the Pacific Northwest better than many of our competitors. As of December 31, 2010, the ratio of our allowance for loan losses to total originated loans was 2.97% and the ratio of the allowance to nonperforming originated loans was 93.16%. Our liquidity position is also strong, with $169.0 million in cash and cash equivalents as of December 31, 2010. As of December 31, 2010, the regulatory capital ratios of our subsidiary banks were well in excess of the levels required for “well-capitalized” status, and our consolidated total risk-based capital, Tier 1 risk-based capital and leverage ratios were 21.5%, 20.2% and 13.9%, respectively.
Deposit Growth. Our strategic focus is to continuously grow deposits with emphasis on total relationship banking with our business and retail customers. We continue to seek to increase our market share in our communities by providing exceptional customer service, focusing on relationship development with local businesses and strategic branch expansion. Our primary focus is to maintain a high level of non-maturity deposits to internally fund our loan growth with a low reliance on maturity (certificate) deposits. At December 31, 2010, as a percentage of our total deposits, non-maturity deposits were 64.5%. We maintain state of the art technology-based products, such as on-line personal financial management, business cash management, and business remote deposit products that enable us to compete effectively with banks of all sizes. Our retail management team is well seasoned and has strong ties to the communities we serve with a strong focus on relationship building and customer service.
Emphasize business relationships with a focus on commercial lending. We will continue to provide primarily commercial business, commercial real estate and residential construction loans with an emphasis on owner occupied commercial real estate and commercial business lending, and the deposit balances that accompany these relationships. We provide our business customers with an array of competitive deposit and cash management products through a variety of delivery channels with state of the art technologies. Our lending staff is well seasoned with extensive knowledge of our markets and adds value through a focused advisory role that we believe strengthens our customer relationships and loyalty. We currently have and will seek to maintain a diversified portfolio of lending relationships without concentrations in any industry.
Recruit and retain highly competent personnel to execute our strategies. Our compensation and staff development programs are aligned with our strategies to grow our loans and core deposits while maintaining our
46
Table of Contents
focus on asset quality. Our incentive systems are designed to achieve well-balanced and high quality asset growth while maintaining appropriate mechanisms to reduce or eliminate incentive payments when appropriate. Our equity compensation programs and retirement benefits are designed to build and encourage employee ownership at all levels of the company to align employee performance objectives with corporate growth strategies and shareholder value. We have a strong corporate culture, which is supported by our commitment to internal development and promotion from within as well as the retention of management and officers in key roles.
Financial Overview
Heritage Financial Corporation is a bank holding company which primarily engages in the business activities of our wholly owned subsidiaries: Heritage Bank and Central Valley Bank. We provide financial services to our local communities with an ongoing strategic focus in our commercial banking relationships, market expansion and asset quality.
During the period from December 31, 2006 through December 31, 2010 our total assets have grown $514.8 million, or 60.4%, with net loans receivable growing $240.1 million during the period. Our emphasis in growing our commercial business loan portfolio resulted in an increase in commercial business loans of $235.8 million, or 41.6%, since 2006. Overall loan increases have benefited from our emphasis in growing our lending in the Pierce County market and the acquisitions of Cowlitz Bank and Pierce Commercial Bank.
Deposits increased $410.4 million to $1.14 billion at December 31, 2010 from $725.9 million at December 31, 2006. From December 31, 2006 to December 31, 2010, non-maturity deposits (total deposits less certificate of deposit accounts) increased $335.4 million, or 84.3%. As a result, the percentage of certificate of deposit accounts to total deposits decreased to 35.5% at December 31, 2010 from 45.2% at December 31, 2006. A significant amount of the change in the mix of deposit accounts was a result of the Company acquiring Cowlitz Bank and Pierce Commercial Bank.
Equity has increased by $123.6 million since December 31, 2006 due to a combination of earnings and issuances of common stock. During the period from December 31, 2006 through December 31, 2010, our annual net income increased by 26.6% or $2.8 million, mostly due to the gain on bank acquisitions and was partially offset by increases in the allowance for loan losses and losses incurred and from other than temporarily impaired securities.
Our core profitability depends primarily on our net interest income, which is the difference between the income we receive on our loan and investment portfolios, and our cost of funds, which consists of interest paid on deposits and borrowed funds. Like most financial institutions, our interest income and cost of funds are affected significantly by general economic conditions, particularly changes in market interest rates and government policies.
Changes in net interest income result from changes in volume, net interest spread, and net interest margin. Volume refers to the average dollar amounts of interest earning assets and interest bearing liabilities. Net interest spread refers to the difference between the average yield on interest earning assets and the average cost of interest bearing liabilities. Net interest margin refers to net interest income divided by average interest earning assets and is influenced by the level and relative mix of interest earning assets and interest bearing and noninterest bearing liabilities.
47
Table of Contents
The following table provides relevant net interest income information for selected periods. The average daily loan balances presented in the table are net of allowances for loan losses. Nonaccrual loans have been included in the tables as loans carrying a zero yield. Yields on tax-exempt securities and loans have not been stated on a tax-equivalent basis.
| Years Ended December 31, | ||||||||||||||||||||||||||||||||||||
| 2010 | 2009 | 2008 | ||||||||||||||||||||||||||||||||||
| Average Balance |
Interest Earned/ Paid |
Average Yield/ Rate |
Average Balance |
Interest Earned/ Paid |
Average Yield/ Rate |
Average Balance |
Interest Earned/ Paid |
Average Yield/ Rate |
||||||||||||||||||||||||||||
| (Dollars in thousands) | ||||||||||||||||||||||||||||||||||||
| Interest Earning Assets: |
||||||||||||||||||||||||||||||||||||
| Loans |
$ | 810,177 | $ | 56,054 | 6.92 | % | $ | 766,346 | $ | 50,567 | 6.60 | % | $ | 784,514 | $ | 54,919 | 7.00 | % | ||||||||||||||||||
| Taxable securities |
105,815 | 2,661 | 2.52 | 59,365 | 2,295 | 3.87 | 33,970 | 1,649 | 4.86 | |||||||||||||||||||||||||||
| Nontaxable securities |
13,411 | 470 | 3.50 | 5,721 | 244 | 4.26 | 5,528 | 197 | 3.56 | |||||||||||||||||||||||||||
| Interest earning deposits and Federal funds sold |
133,277 | 337 | 0.25 | 76,922 | 235 | 0.31 | 7,402 | 152 | 2.06 | |||||||||||||||||||||||||||
| FHLB stock |
4,204 | — | — | 3,566 | — | — | 3,348 | 31 | 0.92 | |||||||||||||||||||||||||||
| Total interest earning assets |
$ | 1,066,884 | $ | 59,522 | 5.58 | % | $ | 911,920 | $ | 53,341 | 5.85 | % | $ | 834,762 | $ | 56,948 | 6.82 | % | ||||||||||||||||||
| Noninterest earning assets |
86,039 | 66,279 | 58,812 | |||||||||||||||||||||||||||||||||
| Total assets |
$ | 1,152,923 | $ | 978,199 | $ | 893,574 | ||||||||||||||||||||||||||||||
| Interest Bearing Liabilities: |
||||||||||||||||||||||||||||||||||||
| Certificates of deposit |
$ | 351,191 | $ | 5,677 | 1.62 | % | $ | 323,696 | $ | 7,988 | 2.47 | % | $ | 343,642 | $ | 12,423 | 3.62 | % | ||||||||||||||||||
| Savings accounts |
89,978 | 501 | 0.56 | 85,541 | 842 | 0.98 | 92,648 | 1,578 | 1.70 | |||||||||||||||||||||||||||
| Interest bearing demand and money market accounts |
376,245 | 2,200 | 0.58 | 310,860 | 2,769 | 0.89 | 243,082 | 4,320 | 1.78 | |||||||||||||||||||||||||||
| Total interest bearing deposits |
817,414 | 8,378 | 1.02 | 720,097 | 11,599 | 1.61 | 679,372 | 18,321 | 2.70 | |||||||||||||||||||||||||||
| FHLB advances and other borrowings |
2 | 48 | 2.53 | 1 | — | 1.73 | 7,850 | 285 | 3.63 | |||||||||||||||||||||||||||
| Securities sold under agreement to repurchase |
13,750 | 85 | 0.62 | 6,206 | 46 | 0.75 | — | — | — | |||||||||||||||||||||||||||
| Total interest bearing liabilities |
$ | 833,060 | $ | 8,511 | 1.02 | % | $ | 726,304 | $ | 11,645 | 1.60 | % | $ | 687,222 | $ | 18,606 | 2.71 | % | ||||||||||||||||||
| Demand and other noninterest bearing deposits |
150,906 | 120,107 | 108,386 | |||||||||||||||||||||||||||||||||
| Other noninterest bearing liabilities |
2,993 | 5,321 | 6,372 | |||||||||||||||||||||||||||||||||
| Preferred stock |
22,889 | 23,413 | 2,687 | |||||||||||||||||||||||||||||||||
| Stockholders’ equity |
165,964 | 126,467 | 91,594 | |||||||||||||||||||||||||||||||||
| Total liabilities and stockholders’ equity |
$ | 1,152,923 | $ | 978,199 | $ | 893,574 | ||||||||||||||||||||||||||||||
| Net interest income |
$ | 51,011 | $ | 41,697 | $ | 38,342 | ||||||||||||||||||||||||||||||
| Net interest spread |
4.56 | % | 4.25 | % | 4.11 | % | ||||||||||||||||||||||||||||||
| Net interest margin |
4.78 | % | 4.57 | % | 4.59 | % | ||||||||||||||||||||||||||||||
| Average interest earning assets to average interest bearing liabilities |
128.07 | % | 125.56 | % | 121.47 | % | ||||||||||||||||||||||||||||||
48
Table of Contents
The following table provides the amount of change in our net interest income attributable to changes in volume and changes in interest rates. Changes attributable to the combined effect of volume and interest rates have been allocated proportionately for changes due specifically to volume and interest rates.
| Years Ended December 31, | ||||||||||||||||||||||||
| 2010 Compared to 2009 Increase (Decrease) Due to |
2009 Compared to 2008 Increase (Decrease) Due to |
|||||||||||||||||||||||
| Volume | Rate | Total | Volume | Rate | Total | |||||||||||||||||||
| (In thousands) | ||||||||||||||||||||||||
| Interest Earning Assets: |
||||||||||||||||||||||||
| Loans |
$ | 3,033 | $ | 2,454 | $ | 5,487 | $ | (1,199 | ) | $ | (3,153 | ) | $ | (4,352 | ) | |||||||||
| Taxable securities |
1,168 | (802 | ) | 366 | 944 | (297 | ) | 647 | ||||||||||||||||
| Nontaxable securities |
269 | (43 | ) | 226 | 62 | (15 | ) | 47 | ||||||||||||||||
| Interest earning deposits and Federal funds sold |
143 | (41 | ) | 102 | 213 | (130 | ) | 83 | ||||||||||||||||
| FHLB stock |
— | — | — | — | (31 | ) | (31 | ) | ||||||||||||||||
| Interest income |
$ | 4,613 | $ | 1,568 | $ | 6,181 | $ | 20 | $ | (3,626 | ) | $ | (3,606 | ) | ||||||||||
| Interest bearing liabilities: |
||||||||||||||||||||||||
| Certificates of deposit |
$ | 444 | $ | (2,756 | ) | $ | (2,312 | ) | $ | (492 | ) | $ | (3,943 | ) | $ | (4,435 | ) | |||||||
| Savings accounts |
25 | (365 | ) | (340 | ) | (70 | ) | (666 | ) | (736 | ) | |||||||||||||
| Interest bearing demand and money market accounts |
382 | (951 | ) | (569 | ) | 604 | (2,155 | ) | (1,551 | ) | ||||||||||||||
| Total interest bearing deposits |
851 | (4,072 | ) | (3,221 | ) | 42 | (6,764 | ) | (6,722 | ) | ||||||||||||||
| FHLB advances and other borrowings |
48 | — | 48 | (136 | ) | (149 | ) | (285 | ) | |||||||||||||||
| Securities sold under agreement to repurchase |
47 | (8 | ) | 39 | 46 | — | 46 | |||||||||||||||||
| Interest expense |
$ | 946 | $ | (4,080 | ) | $ | (3,134 | ) | $ | (48 | ) | $ | (6,913 | ) | $ | (6,961 | ) | |||||||
Results of Operations for the Years Ended December 31, 2010 and 2009
Recent Developments. On July 30, 2010, Heritage Bank acquired certain assets and assumed certain liabilities of Cowlitz Bank from the FDIC, which had been appointed receiver of the institution, including nine branches located in Washington State and Oregon State. As a results of the Cowlitz Acquisition, Heritage Bank acquired assets with a fair value of approximately $344.8 million, including $145.3 million of loans, $74.1 million of cash and cash equivalents, $70.8 million of a FDIC receivable, $33.7 million of investment securities, $16.1 million of a FDIC indemnification asset, $1.2 million of FHLB stock, $1.7 million of core deposit intangible and $1.2 million of other assets. Heritage Bank assumed liabilities with a fair value of approximately $344.5 million, including $343.9 million of deposits and $422,000 of other liabilities. In connection with this acquisition, Heritage Bank entered into loss-sharing agreements with the FDIC which cover approximately $167.2 million in unpaid principal balance of acquired loans at July 30, 2010.
On November 5, 2010, Heritage Bank acquired certain assets and assumed certain liabilities of Pierce Commercial Bank from the FDIC, which had been appointed receiver of the institution. Pierce Commercial Bank was a full service commercial bank headquartered in Tacoma, Washington. As a results of the Pierce Commercial Acquisition, Heritage Bank acquired assets with a fair value of approximately $210.7 million, including $142.9 million of loans, $30.3 million of cash and cash equivalents, $21.5 million of a FDIC receivable, $13.7 million of investment securities, $1.1 million of FHLB and Federal Reserve stock, and $1.2 million of other assets. Heritage Bank assumed liabilities with a fair value of approximately $203.3 million, including $181.5 million of deposits, $17.5 million in FHLB borrowings and $300,000 of other liabilities. In connection with the Pierce Commercial Acquisition, Heritage Bank did not enter into loss-sharing agreements with the FDIC to cover expected losses on acquired loans or other real estate owned.
Earnings Summary. Including preferred stock dividends, net income applicable to common shareholders of $1.04 per diluted common share was recorded for the year ended December 31, 2010 compared to a net loss of
49
Table of Contents
$0.10 per diluted common share for the year ended December 31, 2009. Net income for the year ended December 31, 2010 was $13.4 million compared to net income of $581,000 for the same period in 2009. The increase was primarily the result of a $11.8 million gain on bank acquisitions, a $7.4 million decrease in the provision for loan losses and a $9.3 million increase in net interest income partially offset by a $9.8 million increase in noninterest expense. The Company’s efficiency ratio improved to 56.2% for the year ended December 31, 2010 from 61.3% for the year ended December 31, 2009.
Net Interest Income. Net interest income increased $9.3 million, or 22.3%, to $51.0 million for the year ended December 31, 2010 compared with the previous year of $41.7 million. The increase in net interest income was due primarily to increased earning assets acquired from the Cowlitz and Pierce Commercial Acquisitions. Net interest income as a percentage of average earning assets (net interest margin) for the year ended December 31, 2010 increased 21 basis points to 4.78% from 4.57% for the previous year. The increase in net interest margin was due primarily to increased loan yields as a result of discount accretion on the acquired loan portfolios balances and offset by low interest earning overnight cash deposits in the Cowlitz and Pierce Commercial Acquisitions. Our net interest spread for the year ended December 31, 2010 increased to 4.56% from 4.25% for the prior year.
Total interest income increased $6.2 million, or 11.6%, to $59.5 million for the year ended December 31, 2010 from $53.3 million for the year ended December 31, 2009 as the yield on interest earning assets decreased to 5.58% for the year ended December 31, 2010 from 5.85% for the year ended December 31, 2009. Total average interest earning assets (including nonaccrual loans) increased by $155.0 million to $1.07 billion for the year ended December 31, 2010 from $911.9 million for the year ended December 31, 2009, mostly due to the Cowlitz and Pierce Commercial Acquisitions. Nonaccrual originated loans decreased by $8.3 million to $26.5 million at December 31, 2010 from $34.8 million at December 31, 2009.
Total interest expense decreased by $3.1 million, or 26.9%, to $8.5 million for the year ended December 31, 2010 from $11.6 million for the year ended December 31, 2009 as the average rate paid on interest bearing liabilities decreased to 1.02% for the year ended December 31, 2010 from 1.60% for the year ended December 31, 2009. Total average interest bearing liabilities increased by $106.8 million to $833.1 million at December 31, 2010 from $726.3 at December 31, 2009, mostly due to the Cowlitz and Pierce Commercial Acquisitions.
Provision for Loan Losses. The provision for loan losses decreased $7.4 million, or 38.2%, to $12.0 million for the year ended December 31, 2010 from $19.4 million for the year ended December 31, 2009. The decreased provision for loan losses was primarily the result of a decrease in nonaccrual originated loans. The Banks had net charge-offs of $16.1 million for the year ended December 31, 2010 compared to net charge-offs of $8.6 million for the year ended December 31, 2009. The ratio of net charge-offs to average total loans outstanding was 2.24% for the year ended December 31, 2010 and 1.10% for the year ended December 31, 2009. The increased amount of charge-offs were due mostly to the resolution of several construction and commercial loans that were nonperforming as of December 31, 2009.
The Banks have established comprehensive methodologies for determining the provisions for loan losses. On a quarterly basis the Banks perform an analysis taking into consideration pertinent factors underlying the quality of the loan portfolio. These factors include changes in the amount and composition of the loan portfolio, historical loss experience for various loan segments, changes in economic conditions, delinquency rates, a detailed analysis of individual loans on nonaccrual status, and other factors to determine the level of the allowance for loan losses. The allowance for loan losses decreased by $4.1 million to $22.1 million at December 31, 2010 from $26.2 million at December 31, 2009. The decreased level of the allowance for loan losses was primarily attributable to decreases in the expected loss allocated to nonperforming originated loans and total originated loans offset by an increase in performing originated loans classified as potential problem loans. As of December 31, 2010, we had identified $26.9 million of impaired originated loans, including $9.1 million of restructured loans. Of those impaired loans, $6.7 million have no allowances for credit losses as their
50
Table of Contents
estimated collateral value is equal to or exceeds their carrying costs. The remaining $20.2 million have related allowances for credit losses totaling $4.6 million.
Based on the comprehensive methodology, management deemed the allowance for loan losses of $22.1 million at December 31, 2010 (2.97% of total originated loans and 93.16% of nonperforming originated loans) adequate to provide for probable losses based on an evaluation of known and inherent risks in the loan portfolio at that date. While the Banks believe they have established their existing allowances for loan losses in accordance with GAAP, there can be no assurance that regulators, in reviewing the Banks’ loan portfolios, will not request the Banks to increase significantly their allowance for loan losses. In addition, because future events affecting borrowers and collateral cannot be predicted with certainty, there can be no assurance that the existing allowance for loan losses is adequate or that increased provisions will not be necessary should the quality of the loans deteriorate. Any material increase in the allowance for loan losses would adversely affect the Company’s financial condition and results of operations. For additional information, see Item 1, Business—Analysis of the Allowance for Loan and Lease Losses.”
Noninterest Income. Total noninterest income increased $12.8 million, or 148.0%, to $21.5 million for the year ended December 31, 2010 compared to $8.7 million for the prior year. The increase was due substantially to an $11.8 million pretax gain on bank acquisitions and a $462,000 increase in service charges on deposits due to deposits acquired through the Cowlitz and Pierce Commercial Acquisitions.
Noninterest Expense. Noninterest expense increased $9.8 million or 31.8% to $40.7 million during the year ended December 31, 2010 compared to $30.9 million for the year ended December 31, 2009. The increase was due to increased salaries and benefits expense in the amount of $5.7 million, increased occupancy and equipment expense of $1.4 million, increased professional services of $1.3 million, and increased data processing of $552,000. These increases were substantially due to the Cowlitz and Pierce Commercial Acquisitions.
The efficiency ratio for the year ended December 31, 2010 was 56.2% compared to 61.3% for the prior year. The efficiency ratio consists of noninterest expense divided by the sum of net interest income before provision for loan losses plus noninterest income.
Federal Income Tax Expense (Benefit). The provision for federal income taxes increased by $6.9 million to a net expense of $6.4 million for the year ended December 31, 2010 from a benefit of $503,000 for the year ended December 31, 2009 primarily as a result of an increase in income before taxes. The Company’s effective tax rate was 32.5% for the year ended December 31, 2010.
Results of Operations for the Years Ended December 31, 2009 and 2008
Earnings Summary. Including preferred stock dividends, a net loss applicable to common shareholders of $0.10 per diluted common share was recorded for the year ended December 31, 2009 compared to net income of $0.93 per diluted common share for the year ended December 31, 2008. Net income for the year ended December 31, 2009 was $581,000 compared to net income of $6.4 million for the same period in 2008. The decrease was primarily the result of a $12.0 million increase in the provision for loan losses partially offset by a $3.4 million increase in net interest income. The Company’s efficiency ratio improved to 61.3% for the year ended December 31, 2009 from 64.5% for the year ended December 31, 2008.
Net Interest Income. Net interest income increased $3.4 million, or 8.8%, to $41.7 million for the year ended December 31, 2009 compared with the previous year of $38.3 million. The increase in net interest income resulted primarily from a decrease in interest expense due to lower cost of funds partially offset by a decrease in interest income. Net interest income as a percentage of average earning assets (net interest margin) for the year ended December 31, 2009 decreased 2 basis points to 4.57% from 4.59% for the previous year. Our net interest spread for the year ended December 31, 2009 increased to 4.25% from 4.11% for the prior year.
Total interest income decreased $3.6 million, or 6.3%, to $53.3 million for the year ended December 31, 2009 from $56.9 million for the year ended December 31, 2008 as the yield on interest earning assets decreased
51
Table of Contents
to 5.85% for the year ended December 31, 2009 from 6.82% for the year ended December 31, 2008. Total average interest earning assets (including nonaccrual loans) increased by $77.1 million to $911.9 million for the year ended December 31, 2009 from $834.8 million for the year ended December 31, 2008. Nonaccrual loans increased by $29.2 million to $32.6 million at December 31, 2009 from $3.4 million at December 31, 2008.
Total interest expense decreased by $7.0 million, or 37.4%, to $11.6 million for the year ended December 31, 2009 from $18.6 million for the year ended December 31, 2008 as the average rate paid on interest bearing liabilities decreased to 1.60% for the year ended December 31, 2009 from 2.71% for the year ended December 31, 2008. Total interest bearing liabilities increased by $39.1 million to $726.3 million at December 31, 2009 from $687.2 at December 31, 2008.
Provision for Loan Losses. The provision for loan losses increased $12.0 million, or 161.2%, to $19.4 million for the year ended December 31, 2009 from $7.4 million for the year ended December 31, 2008. The increased provision for loan losses was primarily the result of an increase in impaired loans, an increase in net charge-offs, an increase in the level of performing loans classified as substandard under the Banks’ loan grading system, and uncertainties in the housing market in certain markets of the Pacific Northwest. The Banks had net charge-offs of $8.6 million for the year ended December 31, 2009 compared to net charge-offs of $2.4 million for the year ended December 31, 2008. The ratio of net charge-offs to average total loans outstanding was 1.10% for the year ended December 31, 2009 and 0.30% for the year ended December 31, 2008.
The Banks have established comprehensive methodologies for determining the provisions for loan losses. On a quarterly basis the Banks perform an analysis taking into consideration pertinent factors underlying the quality of the loan portfolio. These factors include changes in the amount and composition of the loan portfolio, historical loss experience for various loan segments, changes in economic conditions, delinquency rates, a detailed analysis of individual loans on nonaccrual status, and other factors to determine the level of the allowance for loan losses. The allowance for loan losses increased by $10.6 million to $26.2 million at December 31, 2009 from $15.4 million at December 31, 2008. The increased level of the allowance for loan losses was primarily attributable to an increase in impaired loans, an increase in the level of performing loans classified as substandard under the Banks’ grading system and uncertainties in the housing market and economy.
Based on the comprehensive methodology, management deemed the allowance for loan losses of $26.2 million at December 31, 2009 (3.38% of total loans and 79.3% of nonperforming loans) adequate to provide for probable losses based on an evaluation of known and inherent risks in the loan portfolio at that date. While the Banks believe they have established their existing allowance for loan losses in accordance with GAAP, there can be no assurance that regulators, in reviewing the Banks’ loan portfolio, will not request the Banks to increase significantly their allowance for loan losses. In addition, because future events affecting borrowers and collateral cannot be predicted with certainty, there can be no assurance that the existing allowance for loan losses is adequate or that substantial increases will not be necessary should the quality of the loans deteriorate. Any material increase in the allowance for loan losses would adversely affect the Company’s financial condition and results of operations. For additional information, see “Item 1, Analysis of the Allowance for Loan and Lease Losses.”
Noninterest Income. Total noninterest income decreased $157,000, or 1.8%, for the year ended December 31, 2009 compared with the prior year. The decrease was due substantially to a decrease in income from mortgage banking operations in the amount of $56,000 and a decrease in gains on Small Business Administration loan sales in the amount of $36,000 due to decreased market demand and a decrease in rental income in the amount of $141,000 offset by an increase in services charges on deposits due to increased deposits and a lower earnings credit rate in an amount of $96,000.
The decrease in rental income was due primarily to the loss of a tenant formerly occupying office space at the Company’s headquarters. The Company is currently occupying this office space and has no immediate plans to acquire tenants for the space.
52
Table of Contents
Noninterest Expense. Noninterest expense increased $476,000 or 1.6% to $30.9 million during the year ended December 31, 2009 compared to $30.4 million for the year ended December 31, 2008. The increase was due substantially to an assessment from the Washington Public Deposit Protection Commission (“WPDPC”) in the amount of $184,000 due to uncollateralized public deposits of a failed bank, increased FDIC assessment rates and a special assessment resulting in an increase in FDIC assessments in the amount of $1.2 million, and increased marketing expense in the amount of $288,000 resulting primarily from costs associated with a checking account acquisition program, partially offset by a decrease in impairment losses on investment securities of $1.4 million and a decrease in salaries and employee benefits in the amount of $430,000. The decrease in salaries and employee benefits primarily resulted from a decrease of $589,000 in incentive bonuses.
The $1.9 million impairment loss on investment securities recorded during the year ended December 31, 2008 was the result of the redemption of investments in the AMF Ultra Short Mortgage Fund and subsequent other-than-temporary impairment charge on the private label mortgage securities received in the redemption. The $500,000 net impairment loss on investment securities during the year ended December 31, 2009 was also due to the private label mortgage securities received in the redemption.
Effective June 30, 2009, the Company adopted FASB ASC 320-10-65, Recognition and Presentation of Other-Than-Temporary Impairments, which provides for the bifurcation of other-than-temporary impairments into (a) the amount of the total other-than-temporary impairment related to a decrease in cash flows expected to be collected from the debt security (the credit loss) and (b) the amount of the total other-than-temporary impairment related to all other factors. As a result of adopting FASB ASC 320-10-65, the Company recorded $830,000 in other-than-temporary impairments not related to credit losses through other comprehensive income rather than through noninterest expense and as discussed above, recorded $500,000 in other-than-temporary impairments related to credit losses to noninterest expense during the year ended December 31, 2009.
The efficiency ratio for the year ended December 31, 2009 was 61.3% compared to 64.5% for the prior year. The efficiency ratio consists of noninterest expense divided by the sum of net interest income before provision for loan losses plus noninterest income.
Federal Income Tax Expense (Benefit). The provision for federal income taxes decreased by $3.5 million to a net benefit of $503,000 for the year ended December 31, 2009 from an expense of $3.0 million for the year ended December 31, 2008 primarily as a result of lower income before taxes.
Liquidity and Capital Resources
Our primary sources of funds are customer and local government deposits, loan principal and interest payments, loan sales, interest earned on and proceeds from sales and maturities of investment securities, and advances from the FHLB of Seattle. These funds, together with retained earnings, equity and other borrowed funds, are used to make loans, acquire investment securities and other assets, and fund continuing operations. While maturities and scheduled amortization of loans are a predictable source of funds, deposit flows and loan prepayments are greatly influenced by the level of interest rates, economic conditions, and competition.
We must maintain an adequate level of liquidity to ensure the availability of sufficient funds to fund loan originations and deposit withdrawals, satisfy other financial commitments, and fund operations. We generally maintain sufficient cash and short-term investments to meet short-term liquidity needs. At December 31, 2010, cash and cash equivalents totaled $169.0 million, or 12.4% of total assets and investment securities classified as either available for sale or held to maturity with maturities of one year or less amounted to $13.9 million, or 1.02% of total assets. At December 31, 2010, the Banks maintained an uncommitted credit facility with the FHLB of Seattle for $173.1 million and an uncommitted credit facility with the Federal Reserve Bank of San Francisco for $66.9 million, of which there were no borrowings outstanding as of December 31, 2010. The Banks also maintain advance lines with Key Bank, US Bank and Pacific Coast Bankers Bank to purchase federal funds totaling $22.8 million as of December 31, 2010. As of December 31, 2010, there were no overnight federal funds purchased.
53
Table of Contents
During 2010 total assets grew $352.8 million with interest earning deposits and federal funds sold increasing $44.7 million, investment securities increasing $34.6 million and net loans increasing by $233.6 million over the prior year-end. This growth was funded primarily through the Cowlitz and Pierce Commercial Acquisition as well as a common stock offering. Our strategy has been to acquire core deposits (which we define to include all deposits except public funds) from our retail accounts, acquire noninterest bearing demand deposits from our commercial customers, and use available borrowing capacity to fund growth in assets. We anticipate that we will continue to rely on the same sources of funds in the future and use those funds primarily to make loans and purchase investment securities.
Stockholders’ equity at December 31, 2010 was $202.3 million compared with $158.5 million at December 31, 2009. During the year ended December 31, 2010, we paid preferred stock dividends of $1.2 million, realized net income of $13.4 million, recorded $418,000 in unrealized gains on securities available for sale, net of tax, recorded $14,000 of market loss related to other than temporary impairment on securities held to maturity, net of tax, and realized the effects of exercising stock options, stock option compensation and earned ESOP and restricted stock shares totaling $904,000. On December 15 2010, the Company completed the sale of 4.4 million shares of common stock in a public offering. The shares were issued at $13.00 per share and net proceeds from the sale totaled approximately $57.6 million.
On November 21, 2008, the Company completed a sale to the Treasury of 24,000 shares of the Company’s Series A Fixed Rate Cumulative Perpetual Preferred Stock for an aggregate purchase price of $24.0 million in cash, with a related Warrant to purchase 276,074 shares of the Company’s common stock. On December 22, 2010, the Company redeemed the 24,000 shares of its Series A preferred stock. The Company paid the Treasury a total of $24.1 million, consisting of $24.0 million of principal and $123,000 of accrued and unpaid dividends. Under the terms of the Warrants, because of our September 22, 2009 offering of common stock, was a “qualified equity offering” resulting in aggregate gross proceeds of at least $24.0 million, the number of shares of the Company’s common stock underlying the Warrant was reduced by 50% to 138,037 shares. This Warrant is still held by the Treasury and remains outstanding at this time.
The Company, and the Banks, are subject to various regulatory capital requirements. As of December 31, 2010, the Company, and the Banks were classified as “well capitalized” institutions under the criteria established by the Federal Deposit Insurance Act. Our initial public offering in January of 1998 significantly increased our capital to levels well in excess of regulatory requirements and our internal needs. Furthermore, on September 22, 2009, the Company completed the sale of 4.3 million shares of common stock in a public offering. The purchase price was $11.50 per share and net proceeds from the sale totaled approximately $46.6 million. On December 15, 2010, the Company completed the sale of 4.4 million shares of common stock in a public offering. The purchase price was $13.00 per share and net proceeds from the sale totaled approximately $57.6 million.
Quarterly, the Company reviews the potential payment of cash dividends to common shareholders. The timing and amount of cash dividends paid on our common stock depends on the Company’s earnings, capital requirements, financial condition and other relevant factors. In this regard, in the second quarter of 2009, the Company’s Board of Directors decided to suspend the quarterly common stock dividend after reviewing these factors and giving consideration to the current economic environment and to preserve our strong capital position.
Our capital levels are also modestly impacted by our 401(k) Employee Stock Ownership Plan and Trust (“KSOP”). The Employee Stock Ownership Plan (“ESOP”) purchased 2% of the common stock issued in the January 1998 stock offering and borrowed from the Company to fund the purchase of the Company’s common stock. The loan to the ESOP will be repaid principally from the Banks’ contributions to the ESOP. The Banks’ contributions will be sufficient to service the debt over the 15 year loan term at the interest rate of 8.5%. As the debt is repaid, shares are released, and allocated to plan participants based on the proportion of debt service paid during the year. As shares are released, compensation expense is recorded equal to the then current market price of the shares, our capital is increased, and the shares become outstanding for earnings per common share calculations. For the year ended December 31, 2010, the Company has allocated or committed to be released to
54
Table of Contents
the ESOP 9,257 earned shares and has 19,287 unearned, restricted shares remaining to be released. The fair value of unearned, restricted shares held by the ESOP trust was $268,000 at December 31, 2010.
Contractual Obligations
The following table provides the amounts due under specified contractual obligations for the periods indicated as of December 31, 2010:
| Less than 1 year |
1-3 years |
3-5 years |
More than 5 years |
Indeterminate maturity(1) |
Total | |||||||||||||||||||
| (In thousands) | ||||||||||||||||||||||||
| Contractual payments by period: |
||||||||||||||||||||||||
| Deposits |
$ | 298,606 | $ | 91,527 | $ | 12,808 | $ | — | $ | 733,335 | $ | 1,136,276 | ||||||||||||
| Operating leases |
1,238 | 2,049 | 1,782 | 2,653 | — | 7,722 | ||||||||||||||||||
| Purchase obligations(2) |
830 | — | — | — | — | 830 | ||||||||||||||||||
| Total contractual obligations |
$ | 300,674 | $ | 93,576 | $ | 14,590 | $ | 2,653 | $ | 733,335 | $ | 1,144,828 | ||||||||||||
| (1) | Represents interest bearing and noninterest bearing checking, money market and checking accounts. |
| (2) | Represents agreements to purchase goods or services. |
Asset/Liability Management
Our primary financial objective is to achieve long term profitability while controlling our exposure to fluctuations in market interest rates. To accomplish this objective, we have formulated an interest rate risk management policy that attempts to manage the mismatch between asset and liability maturities while maintaining an acceptable interest rate sensitivity position. The principal strategies which we employ to control our interest rate sensitivity are: selling most long term, fixed rate, single-family residential mortgage loan originations; originating commercial loans and residential construction loans at variable interest rates repricing for terms generally one year or less; and offering noninterest bearing demand deposit accounts to businesses and individuals. The longer-term objective is to increase the proportion of noninterest bearing demand deposits, low interest bearing demand deposits, money market accounts, and savings deposits relative to certificates of deposit to reduce our overall cost of funds.
Our asset and liability management strategies have resulted in a positive 0-3 month “gap” of 17.70% and a positive 4-12 month “gap” of 13.68% as of December 31, 2010. These “gaps” measure the difference between the dollar amount of our interest earning assets and interest bearing liabilities that mature or reprice within the designated period (three months and 4-12 months) as a percentage of total interest earning assets, based on certain estimates and assumptions as discussed below. We believe that the implementation of our operating strategies has reduced the potential effects of changes in market interest rates on our results of operations. The positive gap for the 0-3 month period indicates that decreases in market interest rates may adversely affect our results over that period.
55
Table of Contents
The following table provides the estimated maturity or repricing and the resulting interest rate sensitivity gap of our interest earning assets and interest bearing liabilities at December 31, 2010 based upon estimates of expected mortgage prepayment rates and deposit run off rates consistent with national trends. We adjusted mortgage loan maturities for loans held for sale by reflecting these loans in the three-month category, which is consistent with their sale in the secondary mortgage market. The amounts in the table are derived from our internal data. We used certain assumptions in presenting this data so the amounts may not be consistent with other financial information prepared in accordance with generally accepted accounting principles. The amounts in the tables also could be significantly affected by external factors, such as changes in prepayment assumptions, early withdrawal of deposits, and competition.
| Estimated Maturity or Repricing Within | ||||||||||||||||||||||||
| 0-3 months |
4-12 months |
1-5 years |
5-15 years |
More than 15 years |
Total | |||||||||||||||||||
| (Dollars in thousands) | ||||||||||||||||||||||||
| Interest Earnings Assets: |
||||||||||||||||||||||||
| Loans |
$ | 312,894 | $ | 93,219 | $ | 395,517 | $ | 134,637 | $ | 67,603 | $ | 1,003,870 | ||||||||||||
| Investment securities |
5,464 | 22,666 | 66,682 | 34,091 | 10,040 | 138,943 | ||||||||||||||||||
| FHLB stock |
5,594 | — | — | — | — | 5,594 | ||||||||||||||||||
| Interest earning deposits |
131,812 | — | — | — | — | 131,812 | ||||||||||||||||||
| Total interest earning assets |
$ | 455,764 | $ | 115,885 | $ | 462,199 | $ | 168,728 | $ | 77,643 | $ | 1,280,219 | ||||||||||||
| Interest Bearing Liabilities: |
||||||||||||||||||||||||
| Total interest bearing deposits |
$ | 210,093 | $ | 167,379 | $ | 564,221 | $ | — | $ | — | $ | 941,693 | ||||||||||||
| Total securities sold under agreement to repurchase |
19,027 | — | — | — | — | 19,027 | ||||||||||||||||||
| Total interest bearing liabilities |
$ | 229,120 | $ | 167,379 | $ | 564,221 | $ | — | $ | — | $ | 960,720 | ||||||||||||
| Rate sensitivity gap |
$ | 226,644 | $ | (51,494 | ) | $ | (102,022 | ) | $ | 168,728 | $ | 77,643 | $ | 319,499 | ||||||||||
| Cumulative rate sensitivity gap: |
||||||||||||||||||||||||
| Amount |
$ | 226,644 | $ | 175,150 | $ | 73,128 | $ | 241,856 | $ | 319,499 | ||||||||||||||
| As a percentage of total interest earning assets |
17.70 | % | 13.68 | % | 5.71 | % | 18.89 | % | 24.96 | % | ||||||||||||||
Certain shortcomings are inherent in the method of analysis presented in the foregoing table. For example, although certain assets and liabilities may have similar maturities or periods to repricing, they may react in different degrees to changes in market interest rates. Also, the interest rates on some types of assets and liabilities may fluctuate in advance of changes in market interest rates, while interest rates on other types may lag behind changes in market interest rates. Additionally, some assets, such as adjustable rate mortgages, have features, which restrict changes in the interest rates of those assets both on a short-term basis and over the lives of such assets. Further, if a change in market interest rates occurs, prepayment, and early withdrawal levels could deviate significantly from those assumed in calculating the tables. Finally, the ability of many borrowers to service their adjustable rate debt may decrease if market interest rates increase substantially.
Impact of Inflation and Changing Prices
Inflation affects our operations by increasing operating costs and indirectly by affecting the operations and cash flow of our customers. Unlike most industrial companies, virtually all the assets and liabilities of a financial institution are monetary in nature. As a result, changes in interest rates generally have a more significant impact on a financial institution’s performance than the effects of general levels of inflation. Although interest rates do not necessarily move in the same direction or the same extent as the prices of goods and services, increases in inflation generally have resulted in increased interest rates.
56
Table of Contents
| ITEM 7A. | QUANTITATIVE AND QUALITATIVE DISCLOSURES ABOUT MARKET RISK |
We are exposed to interest rate risk through our lending and deposit gathering activities. For a discussion of how this exposure is managed and the nature of changes in our interest rate risk profile during the past year, see Item 7, “Management’s Discussion and Analysis of Financial Condition and Results of Operation—Asset/Liability Management.”
Neither we, nor the Banks, maintain a trading account for any class of financial instrument, nor do we, or they, engage in hedging activities or purchase high risk derivative instruments. Moreover, neither we, nor the Banks, are subject to foreign currency exchange rate risk or commodity price risk.
The table below provides information about our financial instruments that are sensitive to changes in interest rates as of December 31, 2010. The table presents principal cash flows and related weighted average interest rates by expected maturity dates. The expected maturity is the contractual maturity or earlier call date of the instrument. The data in this table may not be consistent with the amounts in the preceding table, which represents amounts by the repricing date or maturity date (whichever occurs sooner) adjusted by estimates such as mortgage prepayments and deposit reduction or early withdrawal rates.
| By Expected Maturity Date | ||||||||||||||||||||||||||||
| Year Ended December 31, | ||||||||||||||||||||||||||||
| 2011 | 2012 | 2013 | 2014- 2015 |
After 2015 |
Total | Fair Value | ||||||||||||||||||||||
| (Dollars in thousands) | ||||||||||||||||||||||||||||
| Investment Securities |
||||||||||||||||||||||||||||
| Amounts maturing: |
||||||||||||||||||||||||||||
| Fixed rate |
$ | 14,320 | $ | 30,459 | $ | 15,320 | $ | 6,878 | $ | 66,218 | $ | 133,195 | ||||||||||||||||
| Weighted average interest rate |
1.16 | % | 1.63 | % | 1.67 | % | 4.33 | % | 3.17 | % | ||||||||||||||||||
| Adjustable rate |
— | — | — | — | 5,748 | 5,748 | ||||||||||||||||||||||
| Weighted average interest rate |
— | — | — | — | 4.76 | % | ||||||||||||||||||||||
| Total |
$ | 14,320 | $ | 30,459 | $ | 15,320 | $ | 6,878 | $ | 71,966 | $ | 138,943 | $ | 139,465 | ||||||||||||||
| Loans(1) |
||||||||||||||||||||||||||||
| Amounts maturing: |
||||||||||||||||||||||||||||
| Fixed rate |
$ | 74,877 | $ | 40,926 | $ | 69,704 | $ | 98,157 | $ | 380,475 | $ | 664,139 | ||||||||||||||||
| Weighted average interest rate |
6.23 | % | 6.38 | % | 6.42 | % | 5.66 | % | 6.10 | % | ||||||||||||||||||
| Adjustable rate |
176,632 | 35,218 | 21,505 | 27,418 | 78,194 | 338,967 | ||||||||||||||||||||||
| Weighted average interest rate |
5.01 | % | 4.98 | % | 4.89 | % | 4.62 | % | 5.41 | % | ||||||||||||||||||
| Total |
$ | 251,509 | $ | 76,144 | $ | 91,209 | $ | 125,575 | $ | 458,669 | $ | 1,003,106 | $ | 1,015,567 | ||||||||||||||
| Certificates of Deposit |
||||||||||||||||||||||||||||
| Amounts maturing: |
||||||||||||||||||||||||||||
| Fixed rate |
$ | 298,606 | $ | 73,905 | $ | 10,811 | $ | 19,619 | $ | — | $ | 402,941 | $ | 404,676 | ||||||||||||||
| Weighted average interest rate |
1.23 | % | 1.66 | % | 2.20 | % | 2.77 | % | — | |||||||||||||||||||
| (1) | Note rates were used in this analysis for all credit-impaired purchased loans rather than the effective accretable yield. Loans held for sale were not included in this table. |
| ITEM 8. | FINANCIAL STATEMENTS AND SUPPLEMENTARY DATA |
For financial statements, see the Index to Consolidated Financial Statements on page F-1.
| ITEM 9. | CHANGES IN AND DISAGREEMENTS WITH ACCOUNTANTS ON ACCOUNTING AND FINANCIAL DISCLOSURE |
None
57
Table of Contents
| ITEM 9A. | CONTROLS AND PROCEDURES |
(i) Disclosure Controls and Procedures.
Our disclosure controls and procedures are designed to ensure that information the Company must disclose in its reports filed or submitted under the Securities Exchange Act of 1934, as amended (the “Exchange Act”), is recorded, processed, summarized, and reported on a timely basis. Our management has evaluated, with the participation and under the supervision of our chief executive officer (“CEO”) and chief financial officer (“CFO”), the effectiveness of our disclosure controls and procedures (as defined in Rules 13a-15(e) and 15d-15(e) of the Exchange Act) as of the end of the period covered by this report. Based on this evaluation, our CEO and CFO have concluded that, as of such date, the Company’s disclosure controls and procedures are effective in ensuring that information relating to the Company, including its consolidated subsidiaries, required to be disclosed in reports that it files under the Exchange Act is (1) recorded, processed, summarized and reported within the time periods specified in the SEC’s rules and forms, and (2) accumulated and communicated to our management, including our CEO and CFO, as appropriate to allow timely decisions regarding required disclosure.
(ii) Internal Control Over Financial Reporting.
(a) Management’s report on internal control over financial reporting.
The Company’s management is responsible for establishing and maintaining adequate internal control over financial reporting. The Company’s internal control system is designed to provide reasonable assurance to our management and the board of directors regarding the preparation and fair presentation of published financial statements. Nonetheless, all internal control systems, no matter how well designed, have inherent limitations. Even systems determined to be effective as of a particular date can provide only reasonable assurance with respect to financial statement preparation and presentation and may not eliminate the need for restatements.
The Company’s management assessed the effectiveness of the Company’s internal control over financial reporting as of December 31, 2010. In making this assessment, management used the criteria set forth by the Committee of Sponsoring Organizations of the Treadway Commission in Internal Control—Integrated Framework. Based on our assessment, we believe that, as of December 31, 2010, the Company’s internal control over financial reporting is effective based on these criteria.
KPMG, an independent registered public accounting firm, has audited the effectiveness of our internal control over financial reporting as of December 31, 2010, which is included in this Item 9A.
58
Table of Contents
(b) Attestation report of the registered public accounting firm.
Report of Independent Registered Public Accounting Firm
The Board of Directors and Stockholders
Heritage Financial Corporation:
We have audited Heritage Financial Corporation and subsidiaries’ (the Company) internal control over financial reporting as of December 31, 2010, based on criteria established in Internal Control—Integrated Framework issued by the Committee of Sponsoring Organizations of the Treadway Commission (COSO). The Company’s management is responsible for maintaining effective internal control over financial reporting and for its assessment of the effectiveness of internal control over financial reporting, included in the accompanying Management’s Report on Internal Control over Financial Reporting. Our responsibility is to express an opinion on the Company’s internal control over financial reporting based on our audit.
We conducted our audit in accordance with the standards of the Public Company Accounting Oversight Board (United States). Those standards require that we plan and perform the audit to obtain reasonable assurance about whether effective internal control over financial reporting was maintained in all material respects. Our audit included obtaining an understanding of internal control over financial reporting, assessing the risk that a material weakness exists, and testing and evaluating the design and operating effectiveness of internal control based on the assessed risk. Our audit also included performing such other procedures as we considered necessary in the circumstances. We believe that our audit provides a reasonable basis for our opinion.
A company’s internal control over financial reporting is a process designed to provide reasonable assurance regarding the reliability of financial reporting and the preparation of financial statements for external purposes in accordance with generally accepted accounting principles. A company’s internal control over financial reporting includes those policies and procedures that (1) pertain to the maintenance of records that, in reasonable detail, accurately and fairly reflect the transactions and dispositions of the assets of the company; (2) provide reasonable assurance that transactions are recorded as necessary to permit preparation of financial statements in accordance with generally accepted accounting principles, and that receipts and expenditures of the company are being made only in accordance with authorizations of management and directors of the company; and (3) provide reasonable assurance regarding prevention or timely detection of unauthorized acquisition, use, or disposition of the company’s assets that could have a material effect on the financial statements.
Because of its inherent limitations, internal control over financial reporting may not prevent or detect misstatements. Also, projections of any evaluation of effectiveness to future periods are subject to the risk that controls may become inadequate because of changes in conditions, or that the degree of compliance with the policies or procedures may deteriorate.
In our opinion, the Company maintained, in all material respects, effective internal control over financial reporting as of December 31, 2010, based on criteria established in Internal Control—Integrated Framework issued by the Committee of Sponsoring Organizations of the Treadway Commission.
We also have audited, in accordance with the standards of the Public Company Accounting Oversight Board (United States), the consolidated statements of financial condition of Heritage Financial Corporation and subsidiaries as of December 31, 2010 and 2009, and the related consolidated statements of operations, stockholders’ equity and comprehensive income (loss), and cash flows for each of the years in the three-year period ended December 31, 2010, and our report dated March 4, 2011 expressed an unqualified opinion on those consolidated financial statements.
/s/ KPMG LLP
Seattle, Washington
March 4, 2011
59
Table of Contents
(c) Changes in internal control over financial reporting.
There were no significant changes in the Company’s internal control over financial reporting during the Company’s most recent fiscal quarter that have materially affected, or are reasonably likely to materially affect, the Company’s internal control over financial reporting.
| ITEM 9B. | OTHER INFORMATION. |
None.
60
Table of Contents
| ITEM 10. | DIRECTORS, EXECUTIVE OFFICERS AND CORPORATE GOVERNANCE |
Information concerning directors of the registrant is incorporated by reference to the section entitled “Election of Directors” of our definitive proxy statement for the annual meeting of shareholders to be held May 4, 2011 (“Proxy Statement”).
For information regarding the executive officers of the Company, see “Item 1. Business—Executive Officers”.
The required information with respect to compliance with Section 16(a) of the Exchange Act is incorporated by reference to the section entitled “Security Ownership of Certain Beneficial Owners and Management” of the Proxy Statement.
The Company has adopted a written Code of Ethics that applies to our directors, officers and employees. The Code of Ethics can be accessed electronically by visiting the Company’s website at www.hf-wa.com.
The Audit Committee of our Board of Directors retains our independent auditors, reviews and approves the scope and results of the audits with the auditors and management, monitors the adequacy of our system of internal controls and reviews the annual report, auditors’ fees and non-audit services to be provided by the independent auditors. The members of our audit committee are Daryl D. Jensen, chair of the committee, Philip S. Weigand, Brian Charneski, John Clees and Gary Christensen, all of whom are considered “independent” as defined by the SEC. Our Board of Directors has determined that Mr. Jensen meets the definition of an audit committee financial expert, as determined by the requirements of the SEC.
| ITEM 11. | EXECUTIVE COMPENSATION |
Information concerning executive and director compensation and certain matters regarding participation in the Company’s compensation committee required by this item is set incorporated by reference to the headings “Executive Compensation”, “Director Compensation,” and “Compensation Committee Report” of the Proxy Statement.
| ITEM 12. | SECURITY OWNERSHIP OF CERTAIN BENEFICIAL OWNERS AND MANAGEMENT AND RELATED STOCKHOLDER MATTERS |
The following table summarizes the consolidated activity within the Company’s stock option plans as of December 31, 2010, all of which were approved by shareholders.
| Plan Category |
Number of securities to be issued upon exercise of outstanding options and awards |
Weighted- average exercise price of outstanding options |
Number of securities remaining available for future issuance under equity compensation plans |
|||||||||
| Equity compensation plans, all of which are approved by security holders |
688,903 | $ | 18.70 | 501,606 | ||||||||
Information concerning security ownership of certain beneficial owners and management is incorporated by reference to the section entitled “Security Ownership of Certain Beneficial Owners and Management” of the Proxy Statement.
61
Table of Contents
| ITEM 13. | CERTAIN RELATIONSHIPS AND RELATED TRANSACTIONS AND DIRECTOR INDEPENDENCE |
Information concerning certain relationships and related transactions is incorporated by reference to the section entitled “Meetings and Committees of the Board of Directors and Corporate Governance Matters” of the Proxy Statement.
Our common stock is listed on the NASDAQ Global Select Market. In accordance with NASDAQ requirements, at least a majority of our directors must be independent directors. The Board of Directors has determined that eight of our ten directors are independent. Directors Charneski, Christensen, Clees, Ellwanger, Fluetsch, Jensen, Lyon and Weigand are all independent. Only Brian L. Vance, who serves as President and Chief Executive Officer of Heritage Financial Corporation and Heritage Bank, and Donald V. Rhodes, the Chairman of Heritage Financial Corporation and its financial institution subsidiaries and the former President and Chief Executive Officer of Heritage Financial Corporation and Heritage Bank, are not independent.
| ITEM 14. | PRINCIPAL ACCOUNTING FEES AND SERVICES |
Information concerning principal accounting fees and services is incorporated by reference to the section entitled “Audit Fees” in the Proxy Statement.
62
Table of Contents
| ITEM 15. | EXHIBITS AND FINANCIAL STATEMENT SCHEDULES— |
(a)(1) The Consolidated Financial Statements are contained as listed on the “Index to Consolidated Financial Statements” on page F-1.
(2) All schedules are omitted because they are not required or applicable, or the required information is shown in the Consolidated Financial Statements or notes.
(3) Exhibits
| Exhibit No. |
||
| 3.1 | Articles of Incorporation(1) | |
| 3.2 | Bylaws of the Company(2) | |
| 4.1 | Form of Certificate for Preferred Stock(3) | |
| 4.2 | Warrant for purchase(3) | |
| 10.1 | 1998 Stock Option and Restricted Stock Award Plan(4) | |
| 10.6 | 1997 Stock Option and Restricted Stock Award Plan(5) | |
| 10.10 | 2002 Incentive Stock Option Plan, Director Nonqualified Stock Option Plan, and Restricted Stock Option Plan(6) | |
| 10.12 | 2006 Incentive Stock Option Plan, Director Nonqualified Stock Option Plan, and Restricted Stock Option Plan(7) | |
| 10.13 | Employment Agreement between the Company and Brian L. Vance, effective October 1, 2006 as amended and restated in February 2007(8) | |
| 10.14 | Employment Agreement between Central Valley Bank and D. Michael Broadhead, effective April 1, 2007(8) | |
| 10.16 | Severance Agreement between Heritage Bank and Gregory D. Patjens, effective April 1, 2007(8) | |
| 10.17 | Severance Agreement between Heritage Bank and Donald J. Hinson, effective August 1, 2007(9) | |
| 10.18 | Letter Agreement between Heritage Financial Corporation and the United States Department of the Treasury dated November 21, 2008 in connection with the Company’s participation in the Troubled Asset Relief Program Capital Purchase Program, and related documents(3) | |
| 10.19 | Letter of Understanding between Heritage Financial Corporation and Donald V. Rhodes dated August 18, 2009(10) | |
| 10.20 | Annual Incentive Compensation Plan(14) | |
| 10.21 | Compensation Modification Agreements between Heritage Financial Corporation and Brian L. Vance, Donald V. Rhodes, Donald J. Hinson, D. Michael Broadhead, Gregory Patjens and Dave Spurling dated September 29, 2009(11) | |
| 10.22 | 2010 Omnibus Equity Plan(13) | |
| 14.0 | Code of Ethics and Conduct Policy(12) | |
| 21.0 | Subsidiaries of the Company | |
| 23.0 | Consent of Independent Registered Public Accounting Firm | |
| 24.0 | Power of Attorney | |
63
Table of Contents
| Exhibit No. |
||
| 31.1 | Certification of Principal Executive Officer pursuant to Section 302 of the Sarbanes-Oxley Act of 2002 | |
| 31.2 | Certification of Principal Financial Officer pursuant to Section 302 of the Sarbanes-Oxley Act of 2002 | |
| 32.1 | Certification of Principal Executive Officer and Principal Financial Officer pursuant to Section 906 of the Sarbanes-Oxley Act of 2002 | |
| 99.1 | Subsequent Year Certification of the Principal Executive Officer pursuant to Section 111(b) of the Emergency Economic Stabilization Act of 2008 | |
| 99.2 | Subsequent Year Certification of the Principal Financial Officer pursuant to Section 111(b) of the Emergency Economic Stabilization Act of 2008 | |
| (1) | Incorporated by reference to the Registration Statement on Form S-1 (Reg. No. 333-35573) declared effective on November 12, 1997; as amended, said Amendment being incorporated by reference to the Amendment to the Articles of Incorporation of Heritage Financial Corporation filed with the Current Report on Form 8-K dated November 25, 2008. |
| (2) | Incorporated by reference to the Current Report on Form 8-K dated November 29, 2007. |
| (3) | Incorporated by reference to the Current Report on Form 8-K dated November 25, 2008. |
| (4) | Incorporated by reference to the Registration Statement on Form S-8 (Reg. No. 333-71415). |
| (5) | Incorporated by reference to the Registration Statement on Form S-8 (Reg. No. 333-57513). |
| (6) | Incorporated by reference to the Registration Statements on Form S-8 (Reg. No. 333-88980; 333-88982; 333-88976). |
| (7) | Incorporated by reference to the Registration Statements on Form S-8 (Reg. No. 333-134473; 333-134474; 333-134475). |
| (8) | Incorporated by reference to the Quarterly Report on Form 10-Q dated May 1, 2007. |
| (9) | Incorporated by reference to the Quarterly Report on Form 10-Q dated November 2, 2007. |
| (10) | Incorporated by reference to the Current Report on Form 8-K dated August 20, 2009. |
| (11) | Incorporated by reference to the Current Report on Form 8-K dated October 2, 2009. |
| (12) | Registrant elects to satisfy Regulation S-K §229.406(c) by posting its Code of Ethics on its website at www.HF-WA.com in the section titled Investor Information: Corporate Governance. |
| (13) | Incorporated by reference to the Registration Statement on Form S-8 (Reg. No. 33-167146). |
| (14) | Incorporated by reference to the Yearly Report on Form 10-K dated March 2, 2010. |
64
Table of Contents
Pursuant to the requirements of Section 13 or 15(d) of the Securities Exchange Act of 1934, the Registrant has duly caused this report to be signed on its behalf by the undersigned, thereunto duly authorized, on the 4th day of March 2011.
| HERITAGE FINANCIAL CORPORATION | ||
| (Registrant) | ||
| By |
/s/ BRIAN L. VANCE | |
| Brian L. Vance | ||
| President and Chief Executive Officer | ||
Pursuant to the requirements of the Securities Exchange Act of 1934, this report has been signed below by the following persons on behalf of the registrant and in the capacities indicated on the 4th day of March 2011.
| Principal Executive Officer: | ||
| /s/ BRIAN L. VANCE Brian L. Vance |
||
| President and Chief Executive Officer | ||
| Principal Financial Officer: | ||
| /s/ DONALD J. HINSON Donald J. Hinson |
||
| Senior Vice President and Chief Financial Officer | ||
Remaining Directors:
*Brian S. Charneski
*Gary B. Christensen
*John A. Clees
*Kimberly T. Ellwanger
*Peter N. Fluetsch
*Daryl D. Jensen
*Jeffrey S. Lyon
*Donald V. Rhodes
*Philip S. Weigand
| *By |
/s/ BRIAN L. VANCE | |
| Brian L. Vance | ||
| Attorney-in-Fact |
65
Table of Contents
HERITAGE FINANCIAL CORPORATION AND SUBSIDIARIES
CONSOLIDATED FINANCIAL STATEMENTS
December 31, 2010, 2009, and 2008
INDEX TO CONSOLIDATED FINANCIAL STATEMENTS
F-1
Table of Contents
Report of Independent Registered Public Accounting Firm
The Board of Directors and Stockholders
Heritage Financial Corporation:
We have audited the accompanying consolidated statements of financial condition of Heritage Financial Corporation and subsidiaries (the Company) as of December 31, 2010 and 2009, and the related consolidated statements of operations, stockholders’ equity and comprehensive income (loss), and cash flows for each of the years in the three-year period ended December 31, 2010. These consolidated financial statements are the responsibility of the Company’s management. Our responsibility is to express an opinion on these consolidated financial statements based on our audits.
We conducted our audits in accordance with the standards of the Public Company Accounting Oversight Board (United States). Those standards require that we plan and perform the audit to obtain reasonable assurance about whether the financial statements are free of material misstatement. An audit includes examining, on a test basis, evidence supporting the amounts and disclosures in the financial statements. An audit also includes assessing the accounting principles used and significant estimates made by management, as well as evaluating the overall financial statement presentation. We believe that our audits provide a reasonable basis for our opinion.
In our opinion, the consolidated financial statements referred to above present fairly, in all material respects, the financial position of Heritage Financial Corporation and subsidiaries as of December 31, 2010 and 2009, and the results of their operations and their cash flows for each of the years in the three-year period ended December 31, 2009, in conformity with U.S. generally accepted accounting principles.
We also have audited, in accordance with the standards of the Public Company Accounting Oversight Board (United States), Heritage Financial Corporation and subsidiaries’ internal control over financial reporting as of December 31, 2010, based on criteria established in Internal Control—Integrated Framework issued by the Committee of Sponsoring Organizations of the Treadway Commission (COSO), and our report dated March 4, 2011 expressed an unqualified opinion on the effectiveness of the Company’s internal control over financial reporting.
/s/ KPMG LLP
Seattle, Washington
March 4, 2011
F-2
Table of Contents
HERITAGE FINANCIAL CORPORATION AND SUBSIDIARIES
CONSOLIDATED STATEMENTS OF FINANCIAL CONDITION
December 31, 2010 and 2009
(Dollars in thousands, except per share amounts)
| 2010 | 2009 | |||||||
| ASSETS | ||||||||
| Cash on hand and in banks |
$ | 37,179 | $ | 20,106 | ||||
| Interest earning deposits |
129,822 | 87,125 | ||||||
| Federal funds sold |
1,990 | — | ||||||
| Investment securities available for sale |
125,175 | 90,736 | ||||||
| Investment securities held to maturity (market value of $14,290 and $13,645) |
13,768 | 13,636 | ||||||
| Loans held for sale |
764 | 825 | ||||||
| Originated loans receivable |
742,019 | 772,247 | ||||||
| Less: Allowance for loan losses |
(22,062 | ) | (26,164 | ) | ||||
| Originated loans receivable, net |
719,957 | 746,083 | ||||||
| Purchased covered loans receivable |
128,715 | — | ||||||
| Purchased non-covered loans receivable |
131,049 | — | ||||||
| Total loans receivable, net |
979,721 | 746,083 | ||||||
| FDIC indemnification asset |
16,071 | — | ||||||
| Other real estate owned |
3,030 | 704 | ||||||
| Premises and equipment, at cost, net |
21,750 | 16,394 | ||||||
| Federal Home Loan Bank stock, at cost |
5,594 | 3,566 | ||||||
| Accrued interest receivable |
4,626 | 4,018 | ||||||
| Prepaid expenses and other assets |
8,974 | 9,175 | ||||||
| Deferred income taxes, net |
4,255 | 9,133 | ||||||
| Intangible assets, net |
1,953 | 346 | ||||||
| Goodwill |
13,012 | 13,012 | ||||||
| Total assets |
$ | 1,367,684 | $ | 1,014,859 | ||||
| LIABILITIES AND STOCKHOLDERS’ EQUITY | ||||||||
| Deposits |
$ | 1,136,276 | $ | 840,128 | ||||
| Securities sold under agreement to repurchase |
19,027 | 10,440 | ||||||
| Accrued expenses and other liabilities |
10,102 | 5,793 | ||||||
| Total liabilities |
1,165,405 | 856,361 | ||||||
| Stockholders’ equity: |
||||||||
| Preferred stock, no par value, 2,500,000 shares authorized; Series A (liquidation preference $1,000 per share); no shares issued and outstanding at December 31, 2010 and 24,000 shares issued and outstanding at December 31, 2009 |
— | 23,487 | ||||||
| Common stock, no par, 50,000,000 shares authorized; 15,568,471 and 11,057,972 shares outstanding at December 31, 2010 and 2009, respectively |
128,436 | 73,534 | ||||||
| Unearned compensation—ESOP and other |
(182 | ) | (270 | ) | ||||
| Retained earnings |
73,648 | 61,980 | ||||||
| Accumulated other comprehensive income (loss), net |
377 | (233 | ) | |||||
| Total stockholders’ equity |
202,279 | 158,498 | ||||||
| Total liabilities and stockholders’ equity |
$ | 1,367,684 | $ | 1,014,859 | ||||
See accompanying notes to consolidated financial statements.
F-3
Table of Contents
HERITAGE FINANCIAL CORPORATION AND SUBSIDIARIES
CONSOLIDATED STATEMENTS OF OPERATIONS
For the years ended December 31, 2010, 2009 and 2008
(Dollars in thousands, except per share amounts)
| 2010 | 2009 | 2008 | ||||||||||
| Interest income: |
||||||||||||
| Interest and fees on loans |
$ | 56,054 | $ | 50,567 | $ | 54,919 | ||||||
| Taxable interest on investment securities |
2,661 | 2,295 | 1,649 | |||||||||
| Nontaxable interest on investment securities |
470 | 244 | 197 | |||||||||
| Interest on federal funds sold and interest earning deposits |
337 | 235 | 152 | |||||||||
| Dividends on Federal Home Loan Bank stock |
— | — | 31 | |||||||||
| Total interest income |
59,522 | 53,341 | 56,948 | |||||||||
| Interest expense: |
||||||||||||
| Deposits |
8,378 | 11,598 | 18,321 | |||||||||
| Other borrowings |
133 | 47 | 285 | |||||||||
| Total interest expense |
8,511 | 11,645 | 18,606 | |||||||||
| Net interest income |
51,011 | 41,696 | 38,342 | |||||||||
| Provision for loan losses |
11,990 | 19,390 | 7,420 | |||||||||
| Net interest income after provision for loan losses |
39,021 | 22,306 | 30,922 | |||||||||
| Noninterest income: |
||||||||||||
| Gain on bank acquisitions |
11,830 | — | — | |||||||||
| Gains on sales of loans, net |
401 | 422 | 435 | |||||||||
| Service charges on deposits |
4,653 | 4,191 | 4,095 | |||||||||
| Merchant Visa income |
3,092 | 3,008 | 3,039 | |||||||||
| Other income |
1,522 | 1,046 | 1,255 | |||||||||
| Total noninterest income |
21,498 | 8,667 | 8,824 | |||||||||
| Noninterest expense: |
||||||||||||
| Impairment loss on investment securities |
318 | 1,330 | 1,927 | |||||||||
| Less: Portion recorded in other comprehensive income |
(20 | ) | (830 | ) | — | |||||||
| Impairment loss on investment securities, net |
298 | 500 | 1,927 | |||||||||
| Salaries and employee benefits |
19,910 | 14,259 | 14,689 | |||||||||
| Occupancy and equipment |
5,326 | 3,928 | 3,855 | |||||||||
| Data processing |
2,233 | 1,681 | 1,575 | |||||||||
| Marketing |
1,171 | 990 | 702 | |||||||||
| Merchant Visa |
2,577 | 2,500 | 2,466 | |||||||||
| Professional services |
2,139 | 823 | 710 | |||||||||
| State and local taxes |
968 | 967 | 930 | |||||||||
| Federal deposit insurance premium |
1,656 | 1,616 | 426 | |||||||||
| Other expense |
4,452 | 3,631 | 3,139 | |||||||||
| Total noninterest expense |
40,730 | 30,895 | 30,419 | |||||||||
| Income before income taxes |
19,789 | 78 | 9,327 | |||||||||
| Income tax expense (benefit) |
6,435 | (503 | ) | 2,976 | ||||||||
| Net income |
$ | 13,354 | $ | 581 | $ | 6,351 | ||||||
| Dividends accrued and discount accreted on preferred shares |
1,686 | 1,320 | 143 | |||||||||
| Net income (loss) applicable to common shareholders |
$ | 11,668 | $ | (739 | ) | $ | 6,208 | |||||
| Basic earnings (loss) per common share |
$ | 1.05 | $ | (0.10 | ) | $ | 0.93 | |||||
| Basic weighted average common shares outstanding |
11,121,346 | 7,831,614 | 6,598,647 | |||||||||
| Diluted earnings (loss) per common share |
$ | 1.04 | $ | (0.10 | ) | $ | 0.93 | |||||
| Diluted weighted average common shares outstanding |
11,173,658 | 7,831,614 | 6,647,420 | |||||||||
See accompanying notes to consolidated financial statements.
F-4
Table of Contents
HERITAGE FINANCIAL CORPORATION AND SUBSIDIARIES
CONSOLIDATED STATEMENTS OF STOCKHOLDERS’ EQUITY AND COMPREHENSIVE INCOME (LOSS)
For the years ended December 31, 2010, 2009 and 2008
(Dollars and shares in thousands)
| Number of preferred stock shares |
Preferred stock |
Number of common shares |
Common stock |
Unearned Compensation- ESOP and restricted stock awards |
Retained earnings |
Accumulated other comprehensive income (loss), net |
Total stock holders’ equity |
|||||||||||||||||||||||||
| Balance at December 31, 2007 |
— | $ | — | 6,643 | $ | 24,985 | $ | (447 | ) | $ | 60,780 | $ | (351 | ) | $ | 84,967 | ||||||||||||||||
| Restricted stock awards granted |
— | — | 25 | — | — | — | — | — | ||||||||||||||||||||||||
| Restricted stock awards canceled |
— | — | (1 | ) | — | — | — | — | — | |||||||||||||||||||||||
| Stock option compensation expense |
— | — | — | 178 | — | — | — | 178 | ||||||||||||||||||||||||
| Earned ESOP and restricted stock shares |
— | — | 9 | 449 | 89 | — | — | 538 | ||||||||||||||||||||||||
| Exercise of stock options (including tax benefits from nonqualified stock options) |
— | — | 24 | 288 | — | — | — | 288 | ||||||||||||||||||||||||
| Warrant issued |
— | — | — | 646 | — | — | — | 646 | ||||||||||||||||||||||||
| Preferred stock, series A, issued |
24 | 23,354 | — | — | — | — | — | 23,354 | ||||||||||||||||||||||||
| Accretion of preferred stock |
— | 13 | — | — | — | (13 | ) | — | — | |||||||||||||||||||||||
| Net income |
— | — | — | — | — | 6,351 | — | 6,351 | ||||||||||||||||||||||||
| Change in fair value of securities available for sale, net of reclassification adjustments |
— | — | — | — | — | — | 703 | 703 | ||||||||||||||||||||||||
| Cash dividends accrued on preferred stock |
— | — | — | — | — | (130 | ) | — | (130 | ) | ||||||||||||||||||||||
| Cash dividends declared ($.56/share cumulative) |
— | — | — | — | — | (3,748 | ) | — | (3,748 | ) | ||||||||||||||||||||||
| Balance at December 31, 2008 |
24 | $ | 23,367 | 6,700 | $ | 26,546 | $ | (358 | ) | $ | 63,240 | $ | 352 | $ | 113,147 | |||||||||||||||||
| Restricted stock awards canceled |
— | — | (1 | ) | — | — | — | — | — | |||||||||||||||||||||||
| Restricted stock awards issued |
— | — | 5 | — | — | — | — | — | ||||||||||||||||||||||||
| Stock option compensation expense |
— | — | — | 143 | — | — | — | 143 | ||||||||||||||||||||||||
| Exercise of stock options (including tax benefits from nonqualified stock options) |
— | — | 4 | 39 | — | — | — | 39 | ||||||||||||||||||||||||
| Share based payment and earned ESOP |
— | — | 9 | 318 | 88 | — | — | 406 | ||||||||||||||||||||||||
| Tax benefit (provision) associated with share based payment and unallocated ESOP |
— | — | — | (84 | ) | — | — | — | (84 | ) | ||||||||||||||||||||||
| Accretion of preferred stock |
— | 120 | — | — | — | (120 | ) | — | — | |||||||||||||||||||||||
| Net income |
— | — | — | — | — | 581 | — | 581 | ||||||||||||||||||||||||
| Change in fair value of securities available for sale, net of reclassification adjustments |
— | — | — | — | — | — | 90 | 90 | ||||||||||||||||||||||||
| Cumulative effect of adoption of FASB ASC 320-10-65 relating to impairment of debt securities, net of tax |
— | — | — | — | — | 149 | (149 | ) | — | |||||||||||||||||||||||
| Other-than-temporary impairment on securities held to maturity, net of tax |
— | — | — | — | — | — | (540 | ) | (540 | ) | ||||||||||||||||||||||
| Accretion of other-than-temporary impairment on securities held to maturity, net of tax |
— | — | — | — | — | — | 14 | 14 | ||||||||||||||||||||||||
| Common stock issuance, net of expenses |
— | — | 4,341 | 46,572 | — | — | — | 46,572 | ||||||||||||||||||||||||
| Cash dividends accrued on preferred stock |
— | — | — | — | — | (1,200 | ) | — | (1,200 | ) | ||||||||||||||||||||||
| Cash dividends declared on common stock |
— | — | — | — | — | (670 | ) | — | (670 | ) | ||||||||||||||||||||||
| Balance at December 31, 2009 |
24 | $ | 23,487 | 11,058 | $ | 73,534 | $ | (270 | ) | $ | 61,980 | $ | (233 | ) | $ | 158,498 | ||||||||||||||||
| Restricted stock awards canceled |
— | — | (1 | ) | — | — | — | — | — | |||||||||||||||||||||||
| Restricted stock awards issued |
— | — | 57 | — | — | — | — | — | ||||||||||||||||||||||||
| Stock option compensation expense |
— | — | — | 204 | — | — | — | 204 | ||||||||||||||||||||||||
| Exercise of stock options (including tax benefits from nonqualified stock options) |
— | — | 17 | 202 | — | — | — | 202 | ||||||||||||||||||||||||
| Share based payment and earned ESOP |
— | — | 9 | 420 | 88 | — | — | 508 | ||||||||||||||||||||||||
| Tax benefit (provision) associated with share based payment and unallocated ESOP |
— | — | — | (10 | ) | — | — | — | (10 | ) | ||||||||||||||||||||||
| Accretion of preferred stock |
— | 513 | — | — | — | (513 | ) | — | — | |||||||||||||||||||||||
| Net income |
— | — | — | — | — | 13,354 | — | 13,354 | ||||||||||||||||||||||||
| Change in fair value of securities available for sale, net of reclassification adjustments |
— | — | — | — | — | — | 418 | 418 | ||||||||||||||||||||||||
| Other-than-temporary impairment on securities held to maturity, net of tax |
— | — | — | — | — | — | (14 | ) | (14 | ) | ||||||||||||||||||||||
| Accretion of other-than-temporary impairment on securities held to maturity, net of tax |
— | — | — | — | — | — | 206 | 206 | ||||||||||||||||||||||||
| Redemption of preferred stock |
(24 | ) | (24,000 | ) | — | — | — | — | — | (24,000 | ) | |||||||||||||||||||||
| Common stock issuance, net of expenses |
— | — | 4,428 | 54,086 | — | — | — | 54,086 | ||||||||||||||||||||||||
| Cash dividends accrued on preferred stock |
— | — | — | — | — | (1,173 | ) | — | (1,173 | ) | ||||||||||||||||||||||
| Cash dividends declared on common stock |
— | — | — | — | — | — | — | — | ||||||||||||||||||||||||
| Balance at December 31, 2010 |
— | $ | — | 15,568 | $ | 128,436 | $ | (182 | ) | $ | 73,648 | $ | 377 | $ | 202,279 | |||||||||||||||||
F-5
Table of Contents
| Comprehensive Income |
2010 | 2009 | 2008 | |||||||||
| Net income |
$ | 13,354 | $ | 581 | $ | 6,351 | ||||||
| Change in fair value of securities available for sale, net of tax of $225, $45, and $378 |
418 | 84 | 703 | |||||||||
| Reclassification adjustment of net gain from sale of available for sale securities included in income, net of tax of $0, $3, $0 |
— | 5 | — | |||||||||
| Cumulative effect of adoption of FASB ASC 320-10-65 relating to impairment of debt securities, net of tax of $0, $(80), $0 |
— | (149 | ) | — | ||||||||
| Other-than-temporary impairment on securities held-to-maturity, net of tax of $(8), $(290), $0 |
(14 | ) | (540 | ) | — | |||||||
| Accretion of other-than-temporary impairment on securities held-to-maturity, net of tax of $111, $8, $0 |
206 | 14 | — | |||||||||
| Comprehensive income (loss) |
$ | 13,964 | $ | (5 | ) | $ | 7,054 | |||||
See accompanying notes to consolidated financial statements.
F-6
Table of Contents
HERITAGE FINANCIAL CORPORATION AND SUBSIDIARIES
CONSOLIDATED STATEMENTS OF CASH FLOWS
For the years ended December 31, 2010, 2009 and 2008
(Dollars in thousands)
| 2010 | 2009 | 2008 | ||||||||||
| Cash flows from operating activities: |
||||||||||||
| Net income |
$ | 13,354 | $ | 581 | $ | 6,351 | ||||||
| Adjustments to reconcile net income to net cash provided by operating activities: |
||||||||||||
| Depreciation and amortization |
2,050 | 1,140 | 1,163 | |||||||||
| Deferred loan fees, net of amortization |
(274 | ) | (257 | ) | (227 | ) | ||||||
| Provision for loan losses |
11,990 | 19,390 | 7,420 | |||||||||
| Net change in accrued interest receivable, prepaid expenses and other assets, accrued expenses and other liabilities |
5,762 | (7,397 | ) | 525 | ||||||||
| Recognition of compensation related to ESOP shares and share based payment |
508 | 406 | 507 | |||||||||
| Stock option compensation expense |
204 | 143 | 178 | |||||||||
| Tax provision realized from stock options exercised, share based payment and dividends on unallocated ESOP shares |
10 | 84 | (68 | ) | ||||||||
| Amortization of intangible assets |
225 | 78 | 78 | |||||||||
| Deferred income tax |
4,549 | (4,373 | ) | (2,540 | ) | |||||||
| Gain on FDIC assisted bank acquisitions |
(11,830 | ) | — | — | ||||||||
| (Gain) loss on sale of investment securities |
44 | (2 | ) | 3 | ||||||||
| Impairment loss on investment of securities |
298 | 500 | 1,927 | |||||||||
| Origination of loans held for sale |
(18,665 | ) | (20,213 | ) | (19,574 | ) | ||||||
| Gain on sale of loans |
(401 | ) | (422 | ) | (435 | ) | ||||||
| Proceeds from sale of loans |
19,127 | 20,114 | 20,152 | |||||||||
| Loss on other real estate owned |
121 | 95 | 23 | |||||||||
| (Gain) loss on sale of premises and equipment |
(2 | ) | (1 | ) | 1 | |||||||
| Net cash provided by operating activities |
27,070 | 9,866 | 15,484 | |||||||||
| Cash flows from investing activities: |
||||||||||||
| Loans originated, net of principal payments |
39,173 | 25,274 | (34,294 | ) | ||||||||
| Maturities of investment securities available for sale |
25,125 | 12,239 | 14,594 | |||||||||
| Maturities of investment securities held to maturity |
2,301 | 2,689 | 1,489 | |||||||||
| Purchase of investment securities available for sale |
(13,740 | ) | (71,961 | ) | (22,587 | ) | ||||||
| Purchase of investment securities held to maturity |
(2,296 | ) | (5,332 | ) | (2,407 | ) | ||||||
| Purchase of premises and equipment |
(6,914 | ) | (1,977 | ) | (2,161 | ) | ||||||
| Proceeds from sales of other real estate owned |
1,948 | 4,045 | 858 | |||||||||
| Proceeds from sale of premises and equipment |
446 | 241 | 10 | |||||||||
| Proceeds from sales of investment securities available for sale |
1,105 | 752 | 3,694 | |||||||||
| Purchase of Federal Home Loan Bank stock |
— | — | 339 | |||||||||
| Net cash acquired in acquisitions |
196,614 | — | — | |||||||||
| Net cash provided by (used) in investing activities |
243,762 | (34,030 | ) | (41,143 | ) | |||||||
| Cash flows from financing activities: |
||||||||||||
| Net (decrease) increase in deposits |
(229,234 | ) | 15,648 | 48,200 | ||||||||
| Net decrease in borrowed funds |
(17,530 | ) | — | (14,990 | ) | |||||||
| Preferred stock cash dividends paid |
(1,173 | ) | (1,200 | ) | (130 | ) | ||||||
| Common stock cash dividends paid |
— | (654 | ) | (3,618 | ) | |||||||
| Net increase in securities sold under agreement to repurchase |
8,587 | 10,440 | — | |||||||||
| Proceeds from issuance of preferred stock and warrants |
— | — | 24,000 | |||||||||
| Repurchase of preferred stock |
(24,000 | ) | — | — | ||||||||
| Proceeds from common stock issuance, net of expenses |
54,086 | 46,572 | — | |||||||||
| Repayments of long-term debt |
— | — | (1,951 | ) | ||||||||
| Proceeds from exercise of stock options |
202 | 39 | 251 | |||||||||
| Tax provision realized from stock options exercised, share based payment and dividends on unallocated ESOP shares |
(10 | ) | (84 | ) | 68 | |||||||
| Net cash (used in) provided by financing activities |
(209,072 | ) | 70,761 | 51,830 | ||||||||
| Net increase in cash and cash equivalents |
61,760 | 46,597 | 26,171 | |||||||||
| Cash and cash equivalents at beginning of year |
107,231 | 60,634 | 34,463 | |||||||||
| Cash and cash equivalents at end of year |
$ | 168,991 | $ | 107,231 | $ | 60,634 | ||||||
F-7
Table of Contents
| 2010 | 2009 | 2008 | ||||||||||
| Supplemental disclosures of cash flow information: |
||||||||||||
| Cash paid for interest |
$ | 8,455 | $ | 12,079 | $ | 19,527 | ||||||
| Cash paid for income taxes |
1,494 | 4,942 | 4,509 | |||||||||
| Loans transferred to other real estate owned |
(3,693 | ) | (2,813 | ) | (2,743 | ) | ||||||
| Securities exchanged in redemption-in-kind transaction |
— | — | 7,857 | |||||||||
| Assets acquired (liabilities assumed) in acquisitions: |
||||||||||||
| Investment securities |
47,397 | — | — | |||||||||
| Loans covered by loss sharing |
142,974 | — | — | |||||||||
| Loans not covered by loss sharing |
145,246 | — | — | |||||||||
| Federal Home Loan Bank stock |
2,264 | — | — | |||||||||
| Accrued interest receivable |
1,133 | — | — | |||||||||
| FDIC indemnification asset |
16,084 | — | — | |||||||||
| Core deposit intangible |
1,832 | — | — | |||||||||
| Other real estate owned |
702 | — | — | |||||||||
| Other assets |
1,219 | — | — | |||||||||
| Deposits |
(525,382 | ) | — | — | ||||||||
| Borrowings |
(17,530 | ) | — | — | ||||||||
| Deferred tax liability |
(4,140 | ) | — | — | ||||||||
| Other liabilities |
$ | (724 | ) | $ | — | $ | — | |||||
See accompanying notes to consolidated financial statements.
F-8
Table of Contents
HERITAGE FINANCIAL CORPORATION AND SUBSIDIARIES
NOTES TO CONSOLIDATED FINANCIAL STATEMENTS
| (1) | Summary of Significant Accounting Policies |
(a) Description of Business
Heritage Financial Corporation (the “Company”) is a bank holding company incorporated in the State of Washington in August 1997. The Company is primarily engaged in the business of planning, directing and coordinating the business activities of its wholly owned subsidiaries: Heritage Bank and Central Valley Bank (the “Banks”). Heritage Bank is a Washington-chartered commercial bank whose deposits are insured by the Federal Deposit Insurance Corporation (“FDIC”) under the Deposit Insurance Fund (“DIF”). Heritage Bank conducts business from its main office in Olympia, Washington and its twenty-five branch offices located in western Washington and the greater Portland, Oregon area. Central Valley Bank conducts business from its main office in Toppenish, Washington and its five branch offices located in Yakima and Kittitas counties of Washington State.
The Company’s business consists primarily of lending and deposit relationships with small businesses and their owners in its market areas and attracting deposits from the general public. The Company also makes residential and commercial construction, income property, and consumer loans and originates for sale or investment purposes first mortgage loans on residential properties located in western and central Washington State and the greater Portland, Oregon area.
Effective July 30, 2010, Heritage Bank entered into a definitive agreement with the Federal Deposit Insurance Corporation (the “FDIC”), pursuant to which Heritage Bank acquired certain assets and assumed certain liabilities of Cowlitz Bank, a Washington state-chartered bank headquartered in Longview, Washington (the “Cowlitz Acquisition”). The Cowlitz Acquisition included nine branches of Cowlitz Bank, including its division Bay Bank, which opened as branches of Heritage Bank as of Monday, August 2, 2010. It also included the Trust Services Division of Cowlitz Bank. Effective November 5, 2010, Heritage Bank entered into a definitive agreement with the Federal Deposit Insurance Corporation, pursuant to which Heritage Bank acquired certain assets and assumed certain liabilities of Pierce Commercial Bank, a Washington state-chartered bank headquartered in Tacoma, Washington (the “Pierce Commercial Acquisition”). The Pierce Commercial Acquisition included one branch, which opened as branches of Heritage Bank as of Monday, November 8, 2010. See Note 2, “Business Combinations”.
(b) Basis of Presentation
The accounting and reporting policies of the Company and its subsidiaries conform to U.S. generally accepted accounting principles. In preparing the consolidated financial statements, management makes estimates and assumptions that affect the reported amounts of assets and liabilities and disclosure of contingent assets and liabilities at the date of financial statements and the reported amounts of income and expense during the reporting periods. Material estimates that are particularly susceptible to significant change related to the determination of the allowance for loan losses, other than temporary impairments in the market value of investments, acquired loans and impairment of goodwill. Actual results could differ from these estimates.
The accompanying consolidated financial statements include the accounts of the Company and its wholly owned subsidiaries. All significant intercompany balances and transactions among the Company and its subsidiaries have been eliminated in consolidation.
Certain prior year amounts have been reclassified to conform to the current year’s presentation.
(c) Cash and Cash Equivalents
For purposes of reporting cash flows, cash and cash equivalents includes cash on hand and in banks, interest bearing deposits, and federal funds sold.
F-9
Table of Contents
The Company is required to maintain an average reserve balance with the Federal Reserve Bank in the form of cash. For the years ended December 31, 2010 and 2009, the Company maintained adequate levels of cash to meet the Federal Reserve Bank requirement.
(d) Investment Securities
The Company identifies investments as held to maturity or available for sale at the time of acquisition. Securities are classified as held to maturity when the Company has the ability and positive intent to hold them to maturity. Securities classified as available for sale are available for future liquidity requirements and may be sold prior to maturity.
Investment securities held to maturity are recorded at cost, adjusted for amortization of premiums or accretion of discounts using the interest method. Securities available for sale are carried at fair value. Unrealized gains and losses on securities available for sale are excluded from earnings and are reported in other comprehensive income. Realized gains and losses on sale are computed on the specific identification method.
A decline in the market value of any available for sale or held to maturity security below cost that is deemed to be other than temporary results in a reduction in carrying amount to fair value, a charge to earnings and an establishment of a new cost basis for the security. Unrealized investment securities losses are evaluated at least quarterly to determine whether such declines in value should be considered “other than temporary” and therefore may be subject to immediate loss recognition in income. Although these evaluations involve significant judgment, an unrealized loss in the fair value of a debt security is generally deemed to be temporary when the fair value of the security is below the carrying value primarily due to changes in interest rates, there has not been significant deterioration in the financial condition of the issuer, and the Company has the intent and ability to hold the security for a sufficient time to recover the carrying value. An unrealized loss in the value of an equity security is generally considered temporary when the fair value of the security is below the carrying value primarily due to current market conditions and not deterioration in the financial condition of the issuer, and the Company has the intent and ability to hold the security for a sufficient time to recover the carrying value. Other factors that may be considered in determining whether a decline in the value of either a debt or an equity security is “other than temporary” include ratings by recognized rating agencies; actions of commercial banks or other lenders relative to the continued extension of credit facilities to the issuer of the security; the financial condition, capital strength and near-term prospects of the issuer and recommendations of investment advisors or market analysts. Therefore continued deterioration of market conditions could result in additional impairment losses recognized within the investment portfolio.
(e) Loans Receivable and Loans Held for Sale
Loans Held for Sale
Mortgage loans held for sale are carried at the lower of amortized cost or market value determined on an aggregate basis. Any loan that management determines will not be held to maturity is classified as held for sale at the time of origination, purchase or securitization, or when such decision is made. Unrealized losses on such loans are included in income.
Originated Loans
Originated loans are generally recorded at their outstanding principal balance adjusted for charge-offs, the allowance for loan losses and deferred fees and costs. Interest on loans is calculated using the simple interest method based on the daily balance of the principal amount outstanding and is credited to income as earned. Loans are considered past due or delinquent when principal or interest payments are past due 30 days or more; delinquent loans may remain on accrual status between 30 days and 89 days past due. The accrual of interest on loans is discontinued at the time the loan is 90 days delinquent unless the credit is well secured and in the process of collection. Loans on which the accrual of interest has been discontinued are designated as nonaccrual loans.
F-10
Table of Contents
Loans are placed on nonaccrual at an earlier date if collection of the contractual principal or interest is doubtful. Substantially all loans that are nonaccrual are also impaired. Income recognition on impaired loans conforms to that used on nonaccrual loans. All interest accrued but not collected on nonaccrual loans is reversed against interest income in the current period. The interest payments received on nonaccrual loans is accounted for on the cost-recovery method whereby the interest payment is applied to the principal balances. Loans may be returned to accrual status when improvements in credit quality eliminate the doubt as to the full collectability of both interest and principal and a period of sustained performance has occurred.
Loans are charged-off if collection of the contractual principal or interest as scheduled in the loan agreement is doubtful. Credit card loans and other consumer loans are typically charged-off no later than 180 days past due.
Purchased Covered and Purchased Non-Covered Loans
Loans acquired in a business acquisition are designated as “purchased” loans. These loans are recorded at their fair value at acquisition date, factoring in credit losses expected to be incurred over the life of the loan. Accordingly, an allowance for loan losses is not carried over or recorded as of the acquisition date.
Loans purchased with evidence of credit deterioration since origination for which it is probable that all contractually required payments will not be collected are accounted for under Financial Accounting Standards Board (“FASB”) Accounting Standards Codification (“FASB ASC”) 310-30, Loans and Debt Securities Acquired with Deteriorated Credit Quality, formerly AICPA SOP 03-3 Accounting for Certain Loans or Debt Securities Acquired in a Transfer. These loans are identified as “impaired” loans. In situations where such loans have similar risk characteristics, loans may be aggregated into pools to estimate cash flows. A pool is accounted for as a single asset with a single interest rate, cumulative loss rate and cash flow expectation.
The cash flows expected over the life of the loan or pool are estimated using an internal cash flow model that projects cash flows and calculates the carrying values of the pools, book yields, effective interest income and impairment, if any, based on pool level events. Assumptions as to default rates, loss severity and prepayment speeds are utilized to calculate the expected cash flows.
Expected cash flows at the acquisition date in excess of the fair value of loans are considered to be accretable yield, which is recognized as interest income over the life of the loan or pool using a level yield method if the timing and amount of the future cash flows of the pool is reasonably estimable. Subsequent to the acquisition date, any increases in cash flow over those expected at purchase date in excess of fair value are recorded as interest income prospectively. Any subsequent decreases in cash flow over those expected at purchase date are recognized by recording an allowance for loan losses. Any disposals of loans, including sales of loans, payments in full or foreclosures result in the removal of the loan from the loan pool at the carrying amount.
Loans accounted for under FASB ASC 310-30 are generally considered accruing and performing loans as the loans accrete interest income over the estimated life of the loan when cash flows are reasonably estimable. Accordingly, acquired impaired loans that are contractually past due are still considered to be accruing and performing loans. If the timing and amount of cash flows is not reasonably estimable, the loans may be classified as nonaccrual loans and interest income may be recognized on a cash basis or as a reduction of the principal amount outstanding.
Loans purchased that are not accounted for under FASB ASC 310-30 are accounted for under FASB ASC 310-20, Receivables—Nonrefundable fees and Other Costs, formerly SFAS91 Nonrefundable fees and Other Costs, which considers the contractual cash flows. These loans are identified as “non-impaired” loans, and are initially recorded at their fair value, which is estimated using an internal cash flow model and assumptions similar to the FASB ASC 310-30 loans. The difference between the estimated fair value and the unpaid principal
F-11
Table of Contents
balance at acquisition date is recognized as interest income over the life of the loan using a straight-line method which approximates the effective interest method. Any unrecognized discount for a loan that is subsequently repaid or fully charged-off will be recognized immediately into income.
Purchased loans subject to loss-sharing agreements with the FDIC are identified as “covered” on the Consolidated Statements of Financial Condition. These loans are evaluated separately from originated and other purchased loans as they have dissimilar risk characteristics based on the loss-sharing attribute. For further information see Note 5—“Indemnification asset”.
(f) Impaired Loans and Troubled Debt Restructures
Impaired Loans
A loan is considered impaired when, based on current information and events, it is probable the Company will be unable to collect the scheduled payments of principal or interest when due according to the contractual terms of the loan agreement. Factors considered by management in determining impairment include payment status, collateral value, and the probability of collecting scheduled principal and interest payments when due. Loans that experience insignificant payment delays and payment shortfalls generally are not classified as impaired. Management determines the significance of payment delays and payment shortfalls on a case-by-case basis, taking into consideration all of the circumstances surrounding the loan and the borrowers, including length of the delay, the reasons for the delay, the borrower’s prior payment record, and the amounts of the shortfall in relation to the principal and interest owed. Impairment is measured on a loan by loan basis by either the present value of expected future cash flows discounted at the loan’s effective interest rate, the loan’s obtainable market price, or the fair value of the collateral (less cost to sell) if the loan is collateral dependent.
Troubled Debt Restructures
A loan is classified as a troubled debt restructuring when we grant a concession to a borrower experiencing financial difficulties. These concessions may include a reduction of the interest rate, principal or accrued interest, extension of the maturity date or other actions intended to minimize potential losses. Loans restructured at a rate equal to or greater than that of a new loan with comparable risk at the time the loan is modified may be excluded from restructured loan disclosures in years subsequent to the restructuring if loans are in compliance with their modified terms. A loan that has been placed on nonaccrual status that is subsequently restructured will usually remain on nonaccrual status until the borrower is able to demonstrate repayment performance in compliance with the restructured terms for a sustained period, typically for six months. A restructured loan may return to accrual status sooner based on other significant events or mitigating circumstances. A loan that has not been placed on nonaccrual status may be restructured and such loan may remain on the accrual status after such restructuring. In these circumstances, the borrower has made payments before and after the restructuring. Generally, this restructuring involves a reduction in the loan interest rate and/or a change to interest-only payments for a period of time. The restructured loan is considered impaired despite the accrual status and a specific valuation allowance is calculated similar to the impaired loans.
(g) Loan Fees
Loan origination fees and certain direct origination costs are deferred and amortized as an adjustment of the yields of the loans over their contractual lives, adjusted for prepayment of the loans, using the effective interest method. In the event loans are sold, the deferred net loan origination fees or costs are recognized as a component of the gains or losses on the sales of loans.
(h) Allowance for Loan Losses
Allowance for Loan Losses on Originated Loans
The allowance for loan losses is a reserve established through a provision for loan losses charged to expense, which represents management’s best estimate of probable losses that have been incurred within the
F-12
Table of Contents
existing portfolio of originated loans. For further information on the policy on purchased loans, see “Allowance for Loan Losses on Purchased Loans.” The allowance, in the judgment of management, is necessary to reserve for estimated loan losses and risks inherent in the loan portfolio. The Company’s allowance for loan loss methodology includes allowance allocations calculated in accordance with FASB ASC Topic 310, “Receivables” and allowance allocations calculated in accordance with FASB ASC Topic 450, “Contingencies.” Accordingly, the methodology is based on historical loss experience by type of credit and internal risk grade, specific homogeneous risk pools and specific loss allocations, with adjustments for current events and conditions. The Company’s process for determining the appropriate level of the allowance for loan losses is designed to account for credit deterioration as it occurs. The provision for loan losses reflects loan quality trends, including the levels of and trends related to nonaccrual loans, past due loans, potential problem loans, criticized loans and net charge-offs or recoveries, among other factors. The provision for loan losses also reflects the totality of actions taken on all loans for a particular period. In other words, the amount of the provision reflects not only the necessary increases in the allowance for loan losses related to newly identified criticized loans, but it also reflects actions taken related to other loans including, among other things, any necessary increases or decreases in required allowances for specific loans or loan pools. Losses are charged against the allowance when management believes the uncollectability of a loan balance is confirmed. Subsequent recoveries, if any, are credited to the allowance.
The level of the allowance reflects management’s continuing evaluation of known and inherent risks in the loan portfolio. Portions of the allowance may be allocated for specific credits; however, the entire allowance is available for any credit that, in management’s judgment, should be charged off.
The Company’s allowance for loan losses consists of three elements: (i) specific valuation allowances determined in accordance with FASB ASC Topic 310 based on probable losses on specific loans; (ii) historical loss factor determined in accordance with FASB ASC Topic 450 based on historical loan loss experience for similar loans with similar characteristics and trends; and (iii) an environmental loss factor to reflect the impact of current conditions, as determined in accordance with FASB ASC Topic 450 based on general economic conditions and other qualitative risk factors both internal and external to the Company. The historical loss factor and environmental loss factor are combined and multiplied against the outstanding principal balance of loans in the pool of similar loans with similar characteristics. The Company’s pools of similar loans are grouped by class of loan.
The allowances established for probable losses on specific loans are based on a regular analysis and evaluation of problem loans. Loans are classified based on an internal credit risk grading process that evaluates, among other things: (i) the obligor’s ability to repay; (ii) the underlying collateral, if any; and (iii) the economic environment and industry in which the borrower operates. This analysis is performed at the loan officer level for all loans. When a loan is performing but has an assigned grade below pass, the loan officer analyzes the loan to determine an appropriate monitoring and collection strategy. When a loan is nonperforming or has been classified as a nonaccrual loan, a member from the special assets department will analyze the loan to determine if it is impaired. If the loan is considered impaired, the special asset department will evaluate the need for a specific valuation allowance on the loan. Specific valuation allowances are determined by analyzing the borrower’s ability to repay amounts owed, collateral deficiencies, the relative risk grade of the loan and economic conditions affecting the borrower’s industry, among other things.
Historical loss factors are calculated based on the historical loss experience and recovery experience of specific classes of loans. The Company calculates historical loss ratios for the classes of loans based on the proportion of actual charge-offs and recovery experienced to the total population of loans in the pool for a rolling four quarter average.
Environmental loss factors are based on general economic conditions and other qualitative risk factors both internal and external to the Company. In general, such valuation allowances are determined by evaluating, among other things: (i) levels of and trend in delinquencies and impaired loans; (ii) levels and trends in charge-offs and recoveries; (iii) effects of changes in risk selection and underwriting standards, and other changes in lending
F-13
Table of Contents
policies, procedures, and practices; (iv) experience, ability, and depth of lending management and other relevant staff; (v) national and local economic trends and conditions; (vi) external factors such as competition, legal, and regulatory and; (vii) effects of changes in credit concentrations. Management evaluates the degree of risk that each one of these components has on the quality of the loan portfolio on a quarterly basis. Each component is determined to be on a scale of risk. The results are then input into a matrix to determine an appropriate environmental loss factor for each class of loan. An additional environmental factor is added after the calculated matrix factor if the specific loan is risk rated greater than watch.
The allowance for loan loss evaluation is inherently subjective, as it requires estimates that are susceptible to significant revision as more information becomes available. While management utilizes its best judgment and information available to recognize losses on loans, future additions to the allowance may be necessary based on declines in local and national economic conditions. In addition, various regulatory agencies, as an integral part of their examination process, periodically review the Bank’s allowance for loan losses. Such agencies may require the Bank to make adjustments to the allowance based on their judgments about information available to them at the time of their examinations. The Company believes the allowance for loan losses is adequate given all the above considerations.
The Banks are also party to financial instruments with off-balance sheet risk in the normal course of business to meet the financing needs of their customers. These financial instruments include commitments to extend credit and standby letters of credit. Those instruments involve, to varying degrees, elements of credit risk in excess of the amount recognized in the consolidated balance sheet. The Company has a policy in which it evaluates the risk on a quarterly basis, and provides for an allowance for credit losses, as necessary. The methodology is similar to the allowance for loan losses, and includes an estimate of the probability of drawdown of the loan commitment. Based on its analysis, the Company has not recorded an allowance for off-balance sheet financial instruments as of December 31, 2010 or December 31, 2009.
Allowance for Loan Losses on Purchased Loans
The purchased loans acquired in the Cowlitz Acquisition and the Pierce Commercial Acquisition are subject to the Company’s internal and external credit review. Under the accounting guidance of FASB ASC 310-30, the allowance for loan losses on impaired purchased loans is measured at each financial reporting period, or measurement date, based on expected cash flows. If and when credit deterioration, or decreases in expected cash flows initially estimated, occurs subsequent to the acquisition date, a provision for loan losses for purchased loans will be charged to earnings as of the measurement date. For the covered loans, a provision for loan losses will be charged to earnings for the full amount without regard to the FDIC loss sharing agreement, and the portion of the loss reimbursable from the FDIC is recorded in noninterest income and increases the FDIC indemnification asset.
The purchased loans not accounted for under FASB ASC 310-30 and the balances funded on purchased loans after acquisition date are also subject to the Company’s credit reviews. An allowance for loan loss is estimated in a similar manner as the originated loan portfolio, and a provision for loan loss is charged to earnings as necessary. Management also reviews historical and environmental factors specific to the acquired portfolio which may be slightly different than the originated loan portfolio.
(i) Indemnification Asset
The FDIC indemnification asset was measured at estimated fair value at acquisition and represents the present value of the estimated losses on covered loans to be reimbursed by the FDIC. Under the terms of the loss sharing agreements with the FDIC, the FDIC will absorb 80% of losses and receive 80% of loss recoveries for the covered loans. The FDIC indemnification asset will be reduced as losses are recognized on covered loans and loss sharing payments are received from the FDIC. Realized losses in excess of acquisition date estimates will immediately increase the FDIC indemnification asset by a credit to noninterest income. Conversely, if realized
F-14
Table of Contents
losses are less than acquisition date estimates, the FDIC indemnification asset will be reduced by a charge to noninterest income on a prospective basis over the shorter of the remaining term of the shared-loss agreements or the remaining life of the loans. Since the FDIC indemnification asset was initially recorded at estimated fair value using a discount rate, a portion of the discount is taken into noninterest income at each reporting date.
(j) Mortgage Banking Operations
The Company sells mortgage loans on a servicing released basis and recognizes a cash gain or loss. A cash gain or loss is recognized to the extent that the sales proceeds of the mortgage loans sold exceed or are less than the net book value at the time of sale. Income from mortgage loans brokered to other lenders is recognized into income on date of loan closing.
Commitments to sell mortgage loans are made primarily during the period between the taking of the loan application and the closing of the mortgage loan. The timing of making these sale commitments is dependent upon the timing of the borrower’s election to lock-in the mortgage interest rate and fees prior to loan closing. Most of these sale commitments are made on a best-efforts basis whereby the Banks are only obligated to sell the mortgage if the mortgage loan is approved and closed by the Banks. As a result, management believes that market risk is minimal.
(k) Other Real Estate and Other Assets Owned
Other real estate acquired by the Company in satisfaction of debt are held for sale and recorded at fair value at time of foreclosure. When property is acquired, it is recorded at the estimated fair value (less the costs to sell) at the date of acquisition, not to exceed net realizable value, and any resulting write-down is charged to the allowance for loan losses. Upon acquisition, all costs incurred in maintaining the property are expensed. Costs relating to the development and improvement of the property, however, are capitalized to the extent of the property’s net realizable value.
(l) Premises and Equipment
Premises and equipment, including leasehold improvements, are stated at cost less accumulated depreciation. Depreciation is computed using the straight-line method over the estimated useful lives of the assets or the lease period, whichever is shorter. The estimated useful lives used to compute depreciation and amortization for buildings and building improvements is 15 to 39 years; and for furniture, fixtures and equipment is three to seven years. The Company reviews buildings, leasehold improvements and equipment for impairment whenever events or changes in the circumstances indicate that the undiscounted cash flows for the property are less than its carrying value. If identified, an impairment loss is recognized through a charge to earnings based on the fair value of the property.
(m) Intangible Assets
The intangible assets represents the Core Deposit Intangible (“CDI”) acquired in business combinations. The fair value of the CDI stemming from any given business combination is based on the present value of the expected cost savings attributable to the core deposit funding, relative to an alternative source of funding. The CDI is amortized over an estimated useful life which approximates the existing deposit relationships acquired. The useful life of the CDI related to the Pierce Commercial Bank, Cowlitz Bank, and Western Washington Bancorp acquisitions is four, nine, and eight years, respectively. The Company evaluates such identifiable intangibles for impairment when an indication of impairment exists. Amortization expense relate to the core deposit intangibles was $225,000 for the year ended December 31, 2010.
F-15
Table of Contents
The estimated aggregated amortization expense related to these intangible assets for future years is as follows (in thousands):
| 2011 |
$ | 437 | ||
| 2012 |
399 | |||
| 2013 |
362 | |||
| 2014 |
273 | |||
| 2015 |
171 | |||
| Thereafter |
311 | |||
| $ | 1,953 | |||
(n) Goodwill
Goodwill represents the excess of the purchase price over the net assets acquired in the purchases of North Pacific Bank and Western Washington Bancorp. The Company’s Goodwill is assigned to Heritage Bank and is evaluated for impairment at the Heritage Bank level (reporting unit). Goodwill is not amortized, but is reviewed for impairment annually and between annual tests if an event occurs or circumstances change that might indicate the Company’s recorded value is more than its implied value. Such indicators may include, among others: a significant adverse change in legal factors or in the general business climate; significant decline in the Company’s stock price and market capitalization; unanticipated competition; and an adverse action or assessment by a regulator. Any adverse changes in these factors could have a significant impact on the recoverability of goodwill and could have a material impact on the Company’s financial statements.
When required, the goodwill impairment test involves a two-step process. The first test for goodwill impairment is done by comparing the reporting unit’s aggregate fair value to its carrying value. Absent other indicators of impairment, if the aggregate fair value exceeds the carrying value, goodwill is not considered impaired and no additional analysis is necessary. If the carrying value of the reporting unit were to exceed the aggregate fair value, a second test would be preformed to measure the amount of impairment loss, if any. To measure any impairment loss the implied fair value would be determined in the same manner as if the reporting unit were being acquired in a business combination. If the implied fair value of goodwill is less than the recorded goodwill an impairment charge would be recorded for the difference.
Based on the results of the first test above, it was determined that no goodwill impairment charges were required for the year ended December 31, 2010. Even though there was no goodwill impairment at December 31, 2010, declines in the value of the Company’s stock price or additional adverse changes in the operating environment of the financial services industry may result in a future impairment charge. For the years ended December 31, 2010 and 2009 no goodwill impairment was recorded.
(o) Income Taxes
The Company and its subsidiaries file a United States consolidated Federal income tax return and an Oregon State income tax return. Deferred tax assets and liabilities are recognized for the future tax consequences attributable to differences between the financial statement carrying amounts of existing assets and liabilities and their respective tax bases. Deferred tax assets and liabilities are measured using enacted tax rates applicable to taxable income in the periods in which those temporary differences are expected to be recovered or settled. The effect on deferred tax assets and liabilities of a change in tax rate is recognized in income in the period that includes the enactment date.
As of December 31, 2010 and December 31, 2009, the Company had an insignificant amount of unrecognized tax benefits, none of which would affect our effective tax rate if recognized. The Company does not anticipate that the amount of unrecognized tax benefits will significantly increase or decrease in the next 12 months. The Company’s policy is to recognize interest and penalties on unrecognized tax benefits in “Federal
F-16
Table of Contents
income taxes” in the Consolidated Statements of Operations. The amount of interest and penalties accrued for the year ended December 31, 2010 was immaterial. The Company and its subsidiaries file a United States consolidated tax return and the tax years subject to examination by the Internal Revenue Service are the years ended December 31, 2010, 2009, 2008 and 2007.
(p) Employee Stock Ownership Plan
The Company sponsors an Employee Stock Ownership Plan (ESOP). The ESOP purchased 2% of the common stock issued in a January 1998 stock offering and borrowed from the Company in order to fund the purchase of the Company’s common stock. The loan to the ESOP will be repaid principally from the Banks’ contributions to the ESOP. The Banks’ contributions will be sufficient to service the debt over the 15-year loan term at the interest rate of 8.5%. As the debt is repaid, shares are released and allocated to plan participants based on the proportion of debt service paid during the year. As shares are released, compensation expense is recorded equal to the then current market price of the shares and the shares become outstanding for earnings per common share calculations. Cash dividends on allocated shares are recorded as a reduction of retained earnings and paid or distributed directly to participants’ accounts. Cash dividends on unallocated shares are recorded as a reduction of debt and accrued interest.
(q) Share Based Payment
The Company maintains a number of stock-based incentive programs, which are discussed in more detail in Note 12.
Total stock-based compensation expense (excluding ESOP expense) for the year ended December 31, 2010 and 2009 were as follows:
| 2010 | 2009 | 2008 | ||||||||||
| (In thousands) | ||||||||||||
| Compensation expense recognized |
$ | 578 | $ | 441 | $ | 521 | ||||||
| Related tax benefit recognized |
145 | 124 | 141 | |||||||||
As of December 31, 2010, the total unrecognized compensation expense related to non-vested stock awards was $878,000 and the related weighted average period over which it is expected to be recognized is approximately 2.4 years.
The fair value of options granted during the years ended December 31, 2010, 2009 and 2008 is estimated on the date of grant using the Black-Scholes option pricing model based on the assumptions noted in the following table. The expected term of share options is derived from historical data and represents the period of time that share options granted are expected to be outstanding. The risk-free interest rate is based on the U.S. Treasury yield curve in effect at the time of grant. Expected volatility is based on historical volatility of Company shares. Expected dividend yield is based on dividends expected to be paid during the expected term of the share options.
| Grant period year ended |
Weighted Average Risk Free Interest Rate |
Expected Term in Years |
Expected Volatility |
Expected Dividend Yield |
Weighted Average Fair Value |
|||||||||||||||
| December 31, 2010 |
2.45 | % | 6.21 | 32 | % | 2.72 | % | $ | 3.84 | |||||||||||
| December 31, 2009 |
2.07 | % | 5.00 | 31 | % | 3.49 | % | $ | 2.33 | |||||||||||
| December 31, 2008 |
2.38 | % | 4.50 | 21 | % | 4.30 | % | $ | 2.38 | |||||||||||
(r) Recently Issued Accounting Pronouncements
FASB ASU No. 2010-28, Intangibles—Goodwill and Other (Topic 350): When to Perform Step 2 of the Goodwill Impairment Test for Reporting Units with Zero or Negative Carrying Amounts (a consensus of the
F-17
Table of Contents
FASB Emerging Issues Task Force) was issued in December 2010. ASU 2010-28 modifies Step 1 of the goodwill impairment test for reporting units with zero or negative carrying amounts. For those reporting units, an entity is required to perform Step 2 of the goodwill impairment test if it is more likely than not that a goodwill impairment exists. In determining whether it is more likely than not that a goodwill impairment exists, an entity should consider whether there are any adverse qualitative factors. The qualitative factors are consistent with the existing guidance and examples in paragraph 350-20-35-30, which requires that goodwill of a reporting unit be tested for impairment between annual tests if an event occurs or circumstances change that would more likely than not reduce the fair value of a reporting unit below its carrying amount. ASU 2010-28 is effective for fiscal years, and interim periods within those years, beginning after December 15, 2010. Early adoption is not permitted. The Company does not expect the adoption of the new guidance to have a material effect on its consolidated financial statements.
FASB ASU No. 2010-29, Business Combinations (Topic 805): Disclosure of Supplementary Pro Forma Information for Business Combinations (a consensus of the FASB Emerging Issues Task Force) was issued in December 2010. ASU201-29 specifies that if a public entity presents comparative financial statements, the entity (acquirer) should disclose revenue and earnings of the combined entity as though the business combination(s) that occurred during the current year had occurred as of the beginning of the comparable prior annual reporting period only. It also expands the supplemental pro forma disclosures under Topic 805 to include a description of the nature and amount of material, nonrecurring pro forma adjustments directly attributable to the business combination included in the reported pro forma revenue and earnings. ASU 2010-29 is effective prospectively for business combinations for which the acquisition date is on or after the beginning of the first annual reporting period beginning on or after December 15, 2010. The new guidance will be effective for the Company’s future acquisitions. Company does not expect the adoption of the new guidance to have a material effect on its consolidated financial statements.
FASB ASU No. 2011-01, Receivables (Topic 310): Deferral of the Effective Date of Disclosures about Troubled Debt Restructurings in Update No. 2010-20, was issued in January 2011. ASU 2011-01 temporarily delays the effective date of the disclosures about troubled debt restructurings in Update 2010-20 for public entities. The delay is intended to allow the Board time to complete its deliberations on what constitutes a troubled debt restructuring. The effective date of the new disclosures about troubled debt restructurings and the guidance for determining what constitutes a troubled debt restructuring will then be coordinated. Currently, that guidance is anticipated to be effective for interim and annual periods ending after June 15, 2011.
FASB ASU No. 2010-06, Fair Value Measurements and Disclosures (Topic 820)—Improving Disclosures About Fair Value Measurements requires expanded disclosures related to fair value measurements including (i) the amounts of significant transfers of assets or liabilities between Levels 1 and 2 of the fair value hierarchy and the reasons for the transfers, (ii) the reasons for transfers of assets or liabilities in or out of Level 3 of the fair value hierarchy, with significant transfers disclosed separately, (iii) the policy for determining when transfers between levels of the fair value hierarchy are recognized and (iv) for recurring fair value measurements of assets and liabilities in Level 3 of the fair value hierarchy, a gross presentation of information about purchases, sales, issuances and settlements. ASU 2010-06 further clarifies that (i) fair value measurement disclosures should be provided for each class of assets and liabilities (rather than major category), which would generally be a subset of assets or liabilities within a line item in the statement of financial position and (ii) company’s should provide disclosures about the valuation techniques and inputs used to measure fair value for both recurring and nonrecurring fair value measurements for each class of assets and liabilities included in Levels 2 and 3 of the fair value hierarchy. The disclosures related to the gross presentation of purchases, sales, issuances and settlements of assets and liabilities included in Level 3 of the fair value hierarchy will be required for the Corporation beginning January 1, 2011. The remaining disclosure requirements and clarifications made by ASU 2010-06 became effective for the Company on January 1, 2010. See Note 17 “Fair Value of Measurements”.
FASB ASU No. 2010-20, Disclosures about the Credit Quality of Financing Receivables and the Allowance for Credit Losses, was issued on July 21, 2010 and requires significant new disclosures about the allowance for credit losses and the credit quality of financing receivables. The requirements are intended to enhance
F-18
Table of Contents
transparency regarding credit losses and the credit quality of loan and lease receivables. Under this statement, allowance for credit losses and fair value are to be disclosed by portfolio segment, while credit quality information, impaired financing receivables and nonaccrual status are to be presented by class of financing receivable. Disclosure of the nature and extent, the financial impact and segment information of troubled debt restructurings will also be required. The disclosures are to be presented at the level of disaggregation that management uses when assessing and monitoring the portfolio’s risk and performance. This ASU is effective for interim and annual reporting periods ending after December 15, 2010. The Company has included these disclosures in the Note 4 “Allowance for Loan Losses”.
FASB ASU No. 2010-18, Effect of a Loan Modification When The Loan Is Part of a Pool That Is Accounted for as a Single Asset, a consensus of the FASB Emerging Issues Task Force (Issue No. 09-I) (Topic 310), was issued April 2010 and is effective for modifications of loans accounted for within pools under FASB ASC Subtopic 310-30, Receivables—Loans and Debt Securities Acquired with Deteriorated Credit Quality, occurring in the first interim or annual period ending after July 15, 2010. As a result of the amendment, modifications of loans that are accounted for within a pool under that Subtopic do not result in the removal of the loans from the pool even if the modifications of the loans would otherwise be considered a troubled debt restructuring. A one-time election to terminate accounting for loans in a pool, which may be made on a pool-by-pool basis, was provided upon adoption of the new guidance. An entity will continue to be required to consider whether the pool of assets in which the loan is included is impaired if expected cash flows for the pool change. The adoption of this Subtopic did not have a significant effect on the Company’s financials.
| (2) | Business Combinations |
Heritage Bank completed two acquisitions during the year ended December 31, 2010. The acquisitions of the net assets constitute business acquisitions as defined by FASB ASC 805, Business Combinations. The Business Combinations topic establishes principles and requirements for how the acquirer of a business recognizes and measures in its financial statements the identifiable assets acquired and the liabilities assumed. Accordingly, the estimated fair values of the acquired assets, including the identifiable intangible assets, and the assumed liabilities in the acquisitions were measured and recorded at the acquisition dates. A description of the methods used to determine the fair values of the significant assets and liabilities of the acquisitions presented below is included in Notes 1 and 16.
The net after tax gain for each of the acquisitions represents the excess of the estimated fair value of the assets acquired over the estimated fair value of the liabilities assumed and is influenced significantly by the FDIC-assisted transaction process. Under the FDIC-assisted transaction process, only certain assets and liabilities are transferred to the acquirer and, depending on the nature and amount of the acquirer’s bid, the FDIC may be required to make a cash payment to the acquirer.
F-19
Table of Contents
A statement of the assets acquired and liabilities assumed from the FDIC was as follows:
| Cowlitz Bank July 30, 2010 |
Pierce Commercial Bank November 5, 2010 |
|||||||
| (in thousands) | ||||||||
| Assets |
||||||||
| Cash and cash equivalents |
$ | 74,073 | $ | 30,262 | ||||
| Investment securities |
33,660 | 13,738 | ||||||
| Loans covered by loss-sharing agreements |
142,974 | — | ||||||
| Loans not covered by loss-sharing agreements |
2,334 | 142,912 | ||||||
| Other Real Estate Owned |
— | 702 | ||||||
| Federal Home Loan Bank stock |
1,187 | 1,077 | ||||||
| FDIC Indemnification Asset |
16,084 | — | ||||||
| FDIC receivable |
70,789 | 21,490 | ||||||
| Core deposit intangible |
1,678 | 154 | ||||||
| Other assets |
1,975 | 377 | ||||||
| Total assets acquired |
$ | 344,754 | $ | 210,712 | ||||
| Liabilities |
||||||||
| Deposits |
$ | 343,894 | $ | 181,488 | ||||
| Federal Home Loan Bank Advances |
— | 17,530 | ||||||
| Deferred tax liability |
153 | 3,987 | ||||||
| Other liabilities |
422 | 302 | ||||||
| Total liabilities assumed |
344,469 | 203,307 | ||||||
| Net assets acquired (after tax gain) |
$ | 285 | $ | 7,405 | ||||
A summary of the net assets received from the FDIC and the estimated fair value adjustments resulting in the bargain purchase gain was as follows:
| Cowlitz Bank July 30, 2010 |
Pierce Commercial Bank November 5, 2010 |
|||||||
| (in thousands) | ||||||||
| Cost basis of net assets (liabilities) on acquisition date |
$ | (63,640 | ) | $ | 18,481 | |||
| FDIC receivable |
70,789 | 21,490 | ||||||
| Fair value adjustments: |
||||||||
| Acquired loans |
(24,211 | ) | (27,699 | ) | ||||
| FDIC indemnification asset |
16,084 | — | ||||||
| Other real estate owned |
— | (107 | ) | |||||
| Core deposit intangible |
1,678 | 154 | ||||||
| Other assets |
— | (74 | ) | |||||
| FHLB advances |
— | (510 | ) | |||||
| Certificates of deposits |
(262 | ) | (343 | ) | ||||
| Deferred tax liability |
(153 | ) | (3,987 | ) | ||||
| Net after-tax gain recognized from the acquisition |
$ | 285 | $ | 7,405 | ||||
F-20
Table of Contents
The operating results of the Company for the year ended December 31, 2010 include the operating results produced by the acquired assets and assumed liabilities from the Cowlitz Acquisition for the period July 30, 2010 to December 31, 2010 and the Pierce Commercial Acquisition for the period November 5, 2010 to December 31, 2010. The Company has considered the requirement of FASB ASC 805 related to the contribution of the acquisitions to the Company’s 2010 results of operations. Based on an aggregation of the non-operating expenses with the Bank’s statement of operations, the Company will present only the significant net interest income for the acquired businesses from acquisition date to December 31, 2010.
| Cowlitz Bank July 30, 2010 to December 31, 2010 |
Pierce Commercial Bank November 5, 2010 to December 31, 2010 |
|||||||
| (in thousands) | ||||||||
| Interest income: loans(1) |
$ | 4,610 | $ | 1,693 | ||||
| Interest expense: deposits |
459 | 134 | ||||||
| Net |
$ | 4,151 | $ | 1,559 | ||||
| (1) | includes the accretion of the credit-impaired purchased loans and the contractual interest income and the amortization of the discount on the non-impaired purchased loans. |
The Company also considered the proforma requirements of FASB ASC 805 deemed it impracticable to provide proforma financials as required under the standard. The Company acquired only certain assets and liabilities of the failed banks, and the acquisitions resulted in a significant amount of fair value adjustments. The Company also has FDIC loss-sharing agreements for Cowlitz Bank. Based on these facts, the Company was unable to independently substantiate the financial information and assumptions made by the acquired management prior the acquisition date without significant estimates of circumstances prior to that point. The Company believes that historical results are not meaningful to the Company’s results of operations.
(a) Cowlitz Bank
On July 30, 2010 Heritage Bank acquired certain assets and assumed certain liabilities of Cowlitz Bank from the FDIC in an FDIC-assisted transaction. As part of the Purchase and Assumption Agreement, Heritage Bank and the FDIC entered into shared-loss agreements (each, a “shared-loss agreement” and collectively, the “shared-loss agreements”), whereby the FDIC will cover a substantial portion of any future losses on loans (and related unfunded loan commitments) and accrued interest on loans for up to 90 days. We refer to the acquired loans subject to the shared-loss agreements as covered loans. Under the terms of the shared-loss agreements, the FDIC will absorb 80% of losses and share in 80% of loss recoveries on covered loans. The shared-loss agreement for commercial and single family residential mortgage loans is in effect for five years and ten years, respectively, from the July 30, 2010 acquisition date and the loss recovery provisions are in effect for eight years and ten years, respectively, from the acquisition date. All of the Cowlitz Bank loans acquired in the transaction are covered loans except unpaid principal balances of approximately $2.3 million in consumer loans for which the FDIC has no reimbursement obligation.
Cowlitz Bank was a full service commercial bank headquartered in Longview, Washington that operated nine branch locations in Washington State and Oregon State. The assets acquired and liabilities assumed have been accounted for under the acquisition method of accounting (formerly the purchase method). The assets and liabilities, both tangible and intangible, were recorded at their estimated fair values as of the July 30, 2010 acquisition date.
Heritage Bank had a cash payment due from the FDIC for $70.8 million as of July 30, 2010 of which all was received prior to September 30, 2010. The cost basis of net liabilities transferred to Heritage Bank in the Cowlitz Acquisition was $63.6 million. The net after tax gain of $285,000 recognized by the Company is considered a bargain purchase transaction under FASB ASC 805 Business Combinations since the total acquisition-date fair
F-21
Table of Contents
value of the identifiable net assets acquired exceeded the fair value of the consideration transferred. The gain was recognized as noninterest income in the Company’s Consolidated Statements of Operations during the year ended December 31, 2010.
(b) Pierce Commercial Bank
On November 5, 2010 Heritage Bank acquired certain assets and assumed certain liabilities of Pierce Commercial Bank from the FDIC in an FDIC-assisted transaction. The Purchase and Assumption Agreement did not contain loss-sharing agreements. However, as part of the bidding process, the Bank’s offer contained a significant discount for the purchase of the loans, which was intended to offset the expected losses in the portfolio.
Pierce Commercial Bank was a full service commercial bank headquartered in Tacoma, Washington. The assets acquired and liabilities assumed have been accounted for under the acquisition method of accounting. The assets and liabilities, both tangible and intangible, were recorded at their estimated fair values as of the November 5, 2010 acquisition date.
Heritage Bank had a cash payment due from the FDIC for $21.5 million as of November 5, 2010 of which all was received prior to December 31, 2010. The cost basis of net assets transferred to Heritage Bank in the Pierce Commercial Acquisition was $18.5 million. The net after tax gain of $7.4 million recognized by the Company was recognized as noninterest income in the Company’s Consolidated Statements of Operations during the year ended December 31, 2010.
| (3) | Loans Receivable |
(a) Loan Origination/Risk Management
The Company originates loans in one of the four segments of the total loan portfolio: commercial business, real estate construction and land development, one-to-four family mortgages, and consumer. Within these segments are classes of loans to which management monitors and assesses credit risk in the loan portfolios. The Company has certain lending policies and procedures in place that are designed to maximize loan income within an acceptable level of risk. Management reviews and approves these policies and procedures on a regular basis. A reporting system supplements the review process by providing management with frequent reports related to loan production, loan quality, concentrations of credit, loan delinquencies, and nonperforming and potential problem loans. The Company also conducts external loan reviews and validates the credit risk assessment on a periodic basis. Results of these reviews are presented to management. The loan review process complements and reinforces the risk identification and assessment decisions made by lenders and credit personnel, as well as the Company’s policies and procedures.
A discussion of the risk characteristics of each portfolio segments is as follows:
Commercial Business
There are three significant classes of loans in the commercial portfolio segment, including commercial and industrial loans, owner-occupied commercial real estate, and non-owner occupied commercial real estate. The owner and non-owner occupied commercial real estate are both considered commercial real estate loans. As each of the classes carries different risk characteristics, management will discuss them separately.
Commercial and industrial. Commercial and industrial loans are primarily made based on the identified cash flows of the borrower and secondarily on the underlying collateral provided by the borrower. The cash flows of borrowers, however, may not be as expected and the collateral securing these loans may fluctuate in value. Most commercial and industrial loans are secured by the assets being financed or other business assets
F-22
Table of Contents
such as accounts receivable or inventory and may incorporate a personal guarantee; however, some short-term loans may be made on an unsecured basis. In the case of loans secured by accounts receivable, the availability of funds for the repayment of these loans may be substantially dependent on the ability of the borrower to collect amounts due from its customers.
Commercial real estate. The Company originates multifamily and commercial real estate loans within its primary market areas. These loans are subject to underwriting standards and processes similar to commercial and industrial loans, in addition to those of real estate loans. These loans are viewed primarily as cash flow loans and secondarily as loans secured by real estate. Commercial real estate involves more risk than other classes in that the lending typically involves higher loan principal amounts, and payments on loans secured by real estate properties are dependent on successful operation and management of the properties. Repayment of these loans may be more adversely affected by conditions in the real estate market or the economy.
One-to-Four Family Residential
The majority of the Company’s one-to four-family residential loans are secured by single-family residences located in its primary market areas. The Company’s underwriting standards require that single-family portfolio loans generally are owner-occupied and do not exceed 80% of the lower of appraised value at origination or cost, of the underlying collateral. Terms typically range from 15 to 30 years. The Company generally sells most single-family loans in the secondary market. Management determines to what extent we will retain or sell these loans and other fixed rate mortgages in order to control the Bank’s interest rate sensitivity position, growth and liquidity.
Real Estate Construction and Land Development
The Company originates construction loans for one-to-four family residential and for five or more residential and commercial properties. The construction loans for the single family generally include construction of custom homes whereby the home buyer is the borrower. The Company also provides financing to builders for the construction of pre-sold homes and, in selected cases, to builders for the construction of speculative residential property. Substantially all construction loans are short-term in nature and priced with a variable rate of interest. Construction lending can involve a higher level of risk than other types of lending because funds are advanced partially based upon the value of the project, which is uncertain prior to the project’s completion. Because of the uncertainties inherent in estimating construction costs as well as the market value of a completed project and the effects of governmental regulation of real property, the Company’s estimates with regards to the total funds required to complete a project and the related loan-to-value ratio may vary from actual results. As a result, construction loans often involve the disbursement of substantial funds with repayment dependent, in part, on the success of the ultimate project and the ability of the borrower to sell or lease the property or refinance the indebtedness. If the Company’s estimate of the value of a project at completion proves to be overstated, it may have inadequate security for repayment of the loan and may incur a loss. Sources of repayment for these types of loans may be pre-committed permanent loans from approved long-term lenders, sales of developed property or an interim loan commitment from the Company until permanent financing is obtained. These loans are closely monitored by on-site inspections and are considered to have higher risks than other real estate loans due to their ultimate repayment being sensitive to interest rate changes, governmental regulation of real property, general economic conditions and the availability of long-term financing.
Consumer
The Company originates consumer loans and lines of credit that are both secured and unsecured. The underwriting process is developed to ensure a qualifying primary and secondary source of repayment. Underwriting standards for home equity loans are heavily influenced by statutory requirements, which include, but are not limited to, a maximum loan-to-value percentage of 80%, collection remedies, the number of such loans a borrower can have at one time and documentation requirements. To monitor and manage consumer loan
F-23
Table of Contents
risk, policies and procedures are developed and modified, as needed. The majority of the consumer loans are relatively small amounts spread across many individual borrowers which minimizes the credit risk. Additionally, trend reports are reviewed by management on a regular basis.
Originated loans receivable at December 31, 2010 and 2009 consisted of the following portfolio segments and classes:
| 2010 | 2009 | |||||||
| (In thousands) | ||||||||
| Commercial business: |
||||||||
| Commercial and industrial |
$ | 232,857 | $ | 211,368 | ||||
| Owner-occupied commercial real estate |
159,444 | 197,254 | ||||||
| Non-owner occupied commercial real estate |
221,739 | 194,613 | ||||||
| Total commercial business |
614,040 | 603,235 | ||||||
| One-to-four family residential |
47,505 | 53,623 | ||||||
| Real estate construction and land development: |
||||||||
| One-to-four family residential |
29,377 | 46,060 | ||||||
| Five or more family residential and commercial properties |
28,588 | 49,665 | ||||||
| Total real estate construction and land development |
57,965 | 95,725 | ||||||
| Consumer |
23,832 | 21,261 | ||||||
| Gross originated loans receivable |
743,342 | 773,884 | ||||||
| Deferred loan fees |
(1,323 | ) | (1,597 | ) | ||||
| Total originated loans receivable |
$ | 742,019 | $ | 772,247 | ||||
The recorded investment of purchased covered and non-covered loans receivable at December 31, 2010 consisted of the following portfolio segments and classes:
| Purchased Covered |
Purchased Non-Covered |
|||||||
| (In thousands) | ||||||||
| Commercial business: |
||||||||
| Commercial and industrial |
$ | 47,048 | $ | 40,794 | ||||
| Owner-occupied commercial real estate |
45,220 | 18,977 | ||||||
| Non-owner occupied commercial real estate |
17,575 | 18,914 | ||||||
| Total commercial business |
109,843 | 78,685 | ||||||
| One-to-four family residential |
10,022 | 20,016 | ||||||
| Real estate construction and land development: |
||||||||
| One-to-four family residential |
5,875 | 1,166 | ||||||
| Five or more family residential and commercial properties |
— | 5,329 | ||||||
| Total real estate construction and land development |
5,875 | 6,495 | ||||||
| Consumer |
2,975 | 25,853 | ||||||
| Total purchased loans receivable |
$ | 128,715 | $ | 131,049 | ||||
The December 31, 2010 recorded investment balance of impaired purchased covered and non-covered loans accounted for under FASB ASC 310-30 was $90.1 million and $80.2 million, respectively. The recorded investment balance of non-impaired purchased covered and non-covered loans was $38.6 million and $50.8 million, respectively.
F-24
Table of Contents
(b) Concentrations of Credit
Most of the Company’s lending activity occurs within the State of Washington, and to a lesser extent the State of Oregon. The primary market areas include Thurston, Pierce, King, Mason, Cowlitz and Clark counties in Washington and Multnomah County in Oregon, as well as other markets. The majority of the Company’s loan portfolio consists of commercial and industrial, non-owner occupied commercial real estate, and owner occupied commercial real estate. As of December 31, 2010 and 2009, there were no concentrations of loans related to any single industry in excess of 10% of total loans.
(c) Credit Quality Indicators
As part of the on-going monitoring of the credit quality of the Company’s loan portfolio, management tracks certain credit quality indicators including trends related to (i) the risk grade loans, (ii) the level of classified loans, (iii) net charge-offs, (iv) nonperforming loans, and (v) the general economic conditions of the United States of America, and specifically the states of Washington and Oregon. The Company utilizes a risk grading matrix to assign a risk grade to each of its loans. Loans are graded on a scale of 0 to 9, and a “W”. A description of the general characteristics of the nine risk grades is as follows:
| • | Grades 0 to 5—These grades are considered “pass grade” with negligible to above average but acceptable risk. These borrowers generally have strong to acceptable capital levels and consistent earnings and debt service capacity. Loans with the higher grades within the “pass” category may include borrowers who are experiencing unusual operating difficulties, but have acceptable payment performance to date. Increased monitoring of financials and/or collateral may be appropriate. Overall, loans with this grade show no immediate loss exposure. |
| • | Grade “W”—This grade includes loans on management’s “watch list” and is intended to be utilized on a temporary basis for pass grade borrowers where a significant risk-modifying action is anticipated in the near term. |
| • | Grade 6—This grade is for “Other Assets Especially Mentioned” (OAEM) in accordance with regulatory guidelines, and is intended to highlight loans with elevated risks. Loans with this grade show signs of deteriorating profits and capital, and the borrower might not be strong enough to sustain a major setback. The borrower is typically higher than normally leveraged, and outside support might be modest and likely illiquid. The loan is at risk of further decline unless active measures are taken to correct the situation. |
| • | Grade 7—This grade includes “Substandard” loans, in accordance with regulatory guidelines, for which the loan has a high risk. The loan also has defined weaknesses which make payment default or principal exposure likely, but not yet certain. The borrower may have shown serious negative trends in financial ratios and performance. Such loans are apt to be dependent upon collateral liquidation, a secondary source of repayment or an event outside of the normal course of business. Loans with this grade can be accrual or nonaccrual status based on the Company’s accrual policy. |
| • | Grade 8—This grade includes “Doubtful” loans in accordance with regulatory guidelines, and the Company has determined these loans to have excessive risk. Such loans are placed on nonaccrual status and may be dependent upon collateral having a value that is difficult to determine or upon some near-term event which lacks certainty. Additionally, these loans generally have a specific valuation allowance. |
| • | Grade 9—This grade includes “Loss” loans in accordance with regulatory guidelines. These loans are determined to have the highest risk of loss. Such loans are charged-off or charged-down when payment is acknowledged to be uncertain or when the timing or value of payments cannot be determined. “Loss” is not intended to imply that the loan or some portion of it will never be paid, nor does it in any way imply that there has been a forgiveness of debt. |
F-25
Table of Contents
Loan grades for all commercial loans are established at the origination of the loan. Non-commercial loans are not graded as a 0 to 9 at origination date as these loans are determined to be “pass graded” loans. These non-commercial loans may subsequently require a 0-9 risk grade if the credit department has evaluated the credit and determined it necessary to classify the loan. Loan grades are reviewed on a quarterly basis, or more frequently if necessary, by the credit department. Typically, an individual loan grade will not be changed from the prior period unless there is a specific indication of credit deterioration or improvement. Credit deterioration is evidenced by delinquency, direct communications with the borrower, or other borrower information that becomes public. Credit improvements are evidences by known facts regarding the borrower or the collateral property.
The loan grades relate to the likelihood of losses in that the higher the grade, the greater the loss potential. Loans with a pass grades are believed to have some inherent losses in the portfolios, but at a lesser extent than the other loan grades. Or, these pass graded loans might have a zero percent loss based on historical experience and current market trends. The OAEM loan grades are transitory in that the Company is waiting on additional information to determine the likelihood and extent of the potential losses. However, the likelihood of loss is greater than Watch grade because there has been measurable credit deterioration. Loans with a substandard grade are generally loans for which the Company has individually analyzed for potential impairment. The Doubtful graded loans and the Loss grades loans are to a point that the Company is almost certain of the losses, and the unpaid principal balances are generally charged-off.
The following table presents the gross recorded balance of the originated loans receivable by credit quality indicator as of December 31, 2010:
| Pass | OAEM | Substandard | Doubtful | Total | ||||||||||||||||
| (in thousands) | ||||||||||||||||||||
| Commercial business: |
||||||||||||||||||||
| Commercial and industrial |
$ | 199,566 | $ | 2,615 | $ | 29,871 | $ | 805 | $ | 232,857 | ||||||||||
| Owner-occupied commercial real estate |
154,910 | 913 | 3,621 | — | 159,444 | |||||||||||||||
| Non-owner occupied commercial real estate |
206,178 | 12,991 | 2,570 | — | 221,739 | |||||||||||||||
| Total commercial business |
560,654 | 16,519 | 36,062 | 805 | 614,040 | |||||||||||||||
| One-to-four family residential |
46,653 | — | 850 | 2 | 47,505 | |||||||||||||||
| Real estate construction and land development: |
||||||||||||||||||||
| One-to-four family residential |
10,287 | 2,317 | 16,773 | — | 29,377 | |||||||||||||||
| Five or more family residential and commercial properties |
19,078 | 793 | 8,717 | — | 28,588 | |||||||||||||||
| Total real estate construction and land development |
29,365 | 3,110 | 25,490 | — | 57,965 | |||||||||||||||
| Consumer |
23,704 | — | 128 | — | 23,832 | |||||||||||||||
| Gross originated loans |
$ | 660,376 | $ | 19,629 | $ | 62,530 | $ | 807 | $ | 743,342 | ||||||||||
The table above includes impaired loan balances. Potential problem loans are those loans that are currently accruing interest and are not considered impaired, but which management is monitoring because the financial information of the borrower causes concern as to their ability to comply with their loan repayment terms. Originated potential problem loans as of December 31, 2010 and 2009 were $56.6 million and $53.1 million, respectively. The balance of originated potential problem loans which are guaranteed by a governmental agency was $5.9 million and $7.2 million as of December 31, 2010 and 2009, respectively. This guarantee reduces the Company’s credit exposure.
F-26
Table of Contents
The following table presents the recorded balance of the non-impaired purchased loans receivable by credit quality indicator as of December 31, 2010.
| Pass | OAEM | Substandard | Doubtful | Total | ||||||||||||||||
| (in thousands) | ||||||||||||||||||||
| Commercial business: |
||||||||||||||||||||
| Commercial and industrial |
$ | 20,065 | $ | 117 | $ | 40 | $ | — | $ | 20,222 | ||||||||||
| Owner-occupied commercial real estate |
34,844 | — | 398 | — | 35,242 | |||||||||||||||
| Non-owner occupied commercial real estate |
11,987 | 575 | — | — | 12,562 | |||||||||||||||
| Total commercial business |
66,896 | 692 | 438 | — | 68,026 | |||||||||||||||
| One-to-four family residential |
3,665 | — | — | — | 3,665 | |||||||||||||||
| Real estate construction and land development: |
||||||||||||||||||||
| One-to-four family residential |
54 | — | — | — | 54 | |||||||||||||||
| Five or more family residential and commercial properties |
152 | — | — | — | 152 | |||||||||||||||
| Total real estate construction and land development |
206 | — | — | — | 206 | |||||||||||||||
| Consumer |
17,345 | 144 | — | — | 17,489 | |||||||||||||||
| Gross non-impaired purchased covered loans |
$ | 88,112 | $ | 836 | $ | 438 | $ | — | $ | 89,386 | ||||||||||
Year-end originated nonaccrual loans, segregated by class of loans, were as follows as of December 31, 2010 and 2009:
| 2010(1) | 2009(1) | |||||||
| (In thousands) | ||||||||
| Commercial business: |
||||||||
| Commercial and industrial |
$ | 8,153 | $ | 7,102 | ||||
| Owner-occupied commercial real estate |
779 | 1,848 | ||||||
| Non-owner occupied commercial real estate |
1,907 | 778 | ||||||
| Total commercial business |
10,839 | 9,278 | ||||||
| One-to-four family residential |
2 | — | ||||||
| Real estate construction and land development: |
||||||||
| One-to-four family residential |
10,226 | 25,108 | ||||||
| Five or more family residential and commercial properties |
5,416 | — | ||||||
| Total real estate construction and land development |
15,642 | 25,108 | ||||||
| Consumer |
— | — | ||||||
| Gross originated loans |
$ | 26,483 | $ | 34,836 | ||||
| (1) | $3.2 million and $2.3 million of nonaccrual originated loans were guaranteed by governmental agencies at December 31, 2010 and 2009, respectively. |
There were no nonaccrual loans recorded in the non-impaired purchased covered and non-covered loans as of December 31, 2010.
F-27
Table of Contents
The Company performs aging analysis of past due loan using the categories of 30-89 days past due and 90 or more days past due. This policy is consistent with regulatory reporting requirements. The balances of originated past due loans, segregated by class of loans, as of December 31, 2010 was as follows:
| 30-89 Days | Greater Than 90 Days |
Total Past Due | Current | Total | > 90 days and still accruing |
|||||||||||||||||||
| (in thousands) | ||||||||||||||||||||||||
| Commercial business: |
||||||||||||||||||||||||
| Commercial and industrial |
$ | 2,585 | $ | 3,561 | $ | 6,146 | $ | 226,711 | $ | 232,857 | $ | 199 | ||||||||||||
| Owner-occupied commercial real estate |
187 | 1,372 | 1,559 | 157,885 | 159,444 | 594 | ||||||||||||||||||
| Non-owner occupied commercial real estate |
3,396 | 1,201 | 4,597 | 217,142 | 221,739 | — | ||||||||||||||||||
| Total commercial business |
6,168 | 6,134 | 12,302 | 601,738 | 614,040 | 793 | ||||||||||||||||||
| One-to-four family residential |
624 | 49 | 673 | 46,832 | 47,505 | 47 | ||||||||||||||||||
| Real estate construction and land development: |
||||||||||||||||||||||||
| One-to-four family residential |
— | 2,844 | 2,844 | 26,533 | 29,377 | — | ||||||||||||||||||
| Five or more family residential and commercial properties |
941 | 5,416 | 6,357 | 22,231 | 28,588 | 381 | ||||||||||||||||||
| Total real estate construction and land development |
941 | 8,260 | 9,201 | 48,764 | 57,965 | 381 | ||||||||||||||||||
| Consumer |
42 | — | 42 | 23,790 | 23,832 | — | ||||||||||||||||||
| Gross originated loans |
$ | 7,775 | $ | 14,443 | $ | 22,218 | $ | 721,124 | $ | 743,342 | $ | 1,221 | ||||||||||||
At December 31, 2009, the Company had $1.8 million and $35.1 million in loans that were 30-89 days past due and 90 or more days past due, respectively. The balance of loans that were past due 90 days or more but still accruing was $277,000 at December 31, 2009.
F-28
Table of Contents
The balances of non-impaired purchased past due loans, segregated by class of loans, as of December 31, 2010 was as follows:
| 30-89 Days | Greater Than 90 Days |
Total Past Due | Current | Total | > 90 days and still accruing |
|||||||||||||||||||
| (in thousands) | ||||||||||||||||||||||||
| Commercial business: |
||||||||||||||||||||||||
| Commercial and industrial |
$ | 774 | $ | — | $ | 774 | $ | 19,448 | $ | 20,222 | $ | — | ||||||||||||
| Owner-occupied commercial real estate |
9,898 | — | 9,898 | 25,344 | 35,242 | — | ||||||||||||||||||
| Non-owner occupied commercial real estate |
— | — | — | 12,562 | 12,562 | — | ||||||||||||||||||
| Total commercial business |
10,672 | — | 10,672 | 57,354 | 68,026 | — | ||||||||||||||||||
| One-to-four family residential |
— | — | — | 3,665 | 3,665 | — | ||||||||||||||||||
| Real estate construction and land development: |
||||||||||||||||||||||||
| One-to-four family residential |
— | — | — | 54 | 54 | — | ||||||||||||||||||
| Five or more family residential and commercial properties |
— | — | — | 152 | 152 | — | ||||||||||||||||||
| Total real estate construction and land development |
— | — | — | 206 | 206 | — | ||||||||||||||||||
| Consumer |
184 | — | 184 | 17,305 | 17,489 | — | ||||||||||||||||||
| Gross non-impaired purchased covered loans |
$ | 10,856 | $ | — | $ | 10,856 | $ | 78,530 | $ | 89,386 | $ | — | ||||||||||||
F-29
Table of Contents
Impaired originated loans at December 31, 2010 are set forth in the following table. For the year ended December 31, 2010, $13,000 was recognized as interest income on a non-owner occupied property subsequent to its classification as impaired.
| Recorded Investment With No Specific Valuation Allowance |
Recorded Investment With Specific Valuation Allowance |
Total Recorded Investment |
Unpaid Contractual Principal Balance |
Related Specific Valuation Allowance |
Average Recorded Investment |
|||||||||||||||||||
| (in thousands) | ||||||||||||||||||||||||
| Commercial business: |
||||||||||||||||||||||||
| Commercial and industrial |
$ | 2,462 | $ | 5,691 | $ | 8,153 | $ | 9,261 | $ | 2,569 | $ | 8,909 | ||||||||||||
| Owner-occupied commercial real estate |
129 | 650 | 779 | 822 | 163 | 771 | ||||||||||||||||||
| Non-owner occupied commercial real estate |
2,301 | — | 2,301 | 3,972 | — | 2,175 | ||||||||||||||||||
| Total commercial business |
4,892 | 6,341 | 11,233 | 14,055 | 2,732 | 11,855 | ||||||||||||||||||
| One-to-four family residential |
— | 2 | 2 | 2 | 2 | 2 | ||||||||||||||||||
| Real estate construction and land development: |
||||||||||||||||||||||||
| One-to-four family residential |
1,804 | 8,423 | 10,227 | 10,183 | 1,664 | 11,228 | ||||||||||||||||||
| Five or more family residential and commercial properties |
— | 5,416 | 5,416 | 6,453 | 201 | 5,697 | ||||||||||||||||||
| Total real estate construction and land development |
1,804 | 13,839 | 15,643 | 16,636 | 1,865 | 16,925 | ||||||||||||||||||
| Consumer |
— | — | — | — | — | — | ||||||||||||||||||
| Gross originated loans |
$ | 6,696 | $ | 20,182 | $ | 26,878 | $ | 30,693 | $ | 4,599 | $ | 28,782 | ||||||||||||
At December 31, 2009, the Company had $34.8 million of impaired originated loans with a specific valuation allowance totaling $7.4 million. The annual average balance of impaired originated loans for the years ended December 31, 2009 and 2008 were $25.9 million and $5.1 million, respectively. There was no interest recognized on impaired loans for the years ended December 31, 2009 and 2008.
The Company had governmental guarantees of $3.2 million and $2.3 million related to the impaired originated loan balances at December 31, 2010 and 2009, respectively.
The Company did not have any non-impaired purchased covered or non-covered loans that were considered impaired at December 31, 2010.
(f) Troubled Debt Restructured Loans
At December 31, 2010, the Company had $9.1 million in originated restructured loans, of which $394,000 were accruing and $8.7 were non-accruing and considered impaired. The majority of originated restructured loans were real estate construction one-to-four family residential loans in the amount of $7.8 million, followed by commercial and industrial loans of $0.9 million and non-owner occupied commercial properties of $0.4 million. At December 31, 2009, the Company had $17.4 million in originated restructured loans, of which $425,000 were accruing and $17.0 were nonaccruing. The balance of originated restructured loans included $12.8 million of real estate construction one-to-four family residential loans, $3.0 million of commercial and industrial loans, and $0.4 million of non-owner occupied commercial properties.
F-30
Table of Contents
(g) Impaired Purchased Loans
As indicated above, the Company purchased impaired loans from its Cowlitz Acquisition and Pierce Commercial Acquisition which are accounted for under FASB ASC 310-30.
The following tables reflect the carrying value at December 31, 2010 and the estimated fair value of the purchased impaired loans at acquisition date:
| Cowlitz Bank | ||||||||
| December 31, 2010 |
July 30, 2010 |
|||||||
| (In thousands) | ||||||||
| Covered purchased loans: |
||||||||
| Commercial business: |
||||||||
| Commercial and industrial |
$ | 38,636 | $ | 52,148 | ||||
| Owner-occupied commercial real estate |
24,575 | 25,065 | ||||||
| Non-owner occupied commercial real estate |
20,771 | 23,054 | ||||||
| Total commercial business |
83,982 | 100,267 | ||||||
| One-to-four family residential |
9,612 | 10,875 | ||||||
| Real estate construction and land development: |
||||||||
| One-to-four family residential |
10,858 | 11,147 | ||||||
| Five or more family residential and commercial properties |
— | 2,481 | ||||||
| Total real estate construction and land development |
10,858 | 13,628 | ||||||
| Consumer |
495 | 1,086 | ||||||
| Gross impaired purchased covered loans |
104,947 | 125,856 | ||||||
| Non-covered purchased loans: |
||||||||
| Consumer |
676 | 791 | ||||||
| Total impaired purchased loans |
105,623 | 126,647 | ||||||
| Less: discount |
14,861 | 23,395 | ||||||
| Net carrying value impaired purchased loans |
$ | 90,762 | $ | 103,252 | ||||
| Pierce Commercial Bank | ||||||||
| December 31, 2010 |
November 5, 2010 |
|||||||
| (In thousands) | ||||||||
| Non-covered purchased loans: |
||||||||
| Commercial business: |
||||||||
| Commercial and industrial |
$ | 36,690 | $ | 42,992 | ||||
| Owner-occupied commercial real estate |
7,315 | 7,365 | ||||||
| Non-owner occupied commercial real estate |
7,600 | 7,992 | ||||||
| Total commercial business |
51,605 | 58,349 | ||||||
| One-to-four family residential |
19,736 | 21,295 | ||||||
| Real estate construction and land development: |
||||||||
| One-to-four family residential |
2,750 | 3,841 | ||||||
| Five or more family residential and commercial properties |
15,816 | 16,807 | ||||||
| Total real estate construction and land development |
18,566 | 20,648 | ||||||
| Consumer |
14,566 | 15,311 | ||||||
| Gross impaired purchased non-covered loans |
104,473 | 115,603 | ||||||
| Less: discount |
24,857 | 26,324 | ||||||
| Net carrying value impaired purchased non-covered loans |
$ | 79,616 | $ | 89,279 | ||||
F-31
Table of Contents
On acquisition date, the amount by which the undiscounted cash flows of the purchased impaired loans exceed the estimate fair value of the loan is the “accretable yield”. The accretable yield is then measured at each financial reporting date and represents the difference between the remaining undiscounted expected cash flows and the current carrying value of the purchased impaired loan.
The following table summarizes the accretable yield on the Cowlitz Bank impaired purchased loans as of July 30, 2010 and the changes therein through December 31, 2010.
| Cowlitz Bank | ||||||||
| (In thousands) | ||||||||
| Estimated fair value of loans acquired |
$ | 103,252 | ||||||
| Less: Undiscounted cash flows expected to be collected: |
||||||||
| Undiscounted contractual cash flows |
$ | 154,144 | ||||||
| Undiscounted cash flows not expected to be collected (nonaccretable difference) |
(25,960 | ) | 128,184 | |||||
| Accretable yield at acquisition |
24,932 | |||||||
| Activity: |
||||||||
| Accretion |
2,746 | |||||||
| Disposals and other |
4,266 | 7,012 | ||||||
| Accretable yield at December 31, 2010 |
$ | 17,920 | ||||||
The following table summarizes the accretable yield on the Pierce Commercial Bank impaired purchased non-covered loans as of November 5, 2010 and the changes therein through December 31, 2010.
| Pierce Commercial Bank | ||||||||
| (In thousands) | ||||||||
| Estimated fair value of loans acquired |
$ | 89,279 | ||||||
| Less: Undiscounted cash flows expected to be collected: |
||||||||
| Undiscounted contractual cash flows |
$ | 134,523 | ||||||
| Undiscounted cash flows not expected to be collected (nonaccretable difference) |
(32,454 | ) | 102,069 | |||||
| Accretable yield at acquisition |
12,790 | |||||||
| Activity: |
||||||||
| Accretion |
871 | |||||||
| Disposals and other |
1,581 | 2,452 | ||||||
| Accretable yield at December 31, 2010 |
$ | 10,338 | ||||||
(h) Related Party Loans
In the ordinary course of business, the Company has granted loans to certain directors, executive officers and their affiliates (collectively referred to as “related parties”). These loans were made on substantially the same terms, including interest rates and collateral, as those prevailing at the time for comparable transactions with other unaffiliated persons and do not involve more than normal risk of collectability. As of December 31, 2010 and 2009, the Company had loans to related parties of $11.3 million and $12.6 million, respectively.
F-32
Table of Contents
Activity in related party loans for the years ending December 31, 2010 and 2009 was as follows (in thousands):
| Balance outstanding at December 31, 2008 |
$ | 14,925 | ||
| Principal additions |
6,821 | |||
| Principal reductions |
(9,131 | ) | ||
| Balance outstanding at December 31, 2009 |
12,615 | |||
| Principal additions |
4,020 | |||
| Principal reductions |
(5,353 | ) | ||
| Balance outstanding at December 31, 2010 |
$ | 11,282 | ||
The Company did not have any borrowings from related parties at December 31, 2010 and 2009.
(i) Mortgage Banking Activities
Details of certain mortgage banking activities at December 31, 2010 and 2009 are as follows:
| 2010 | 2009 | |||||||
| (In thousands) | ||||||||
| Loans held for sale at lower of cost or market |
$ | 764 | $ | 825 | ||||
| Loans serviced for others |
115 | 131 | ||||||
| Total loans sold |
16,125 | 16,460 | ||||||
| Commitments to sell mortgage loans |
861 | 217 | ||||||
| Commitments to fund mortgage loans (at interest rates approximating market rates) |
||||||||
| Fixed rate |
120 | 185 | ||||||
| Variable or adjustable rate |
$ | — | $ | — | ||||
Servicing fee income from mortgage loans serviced for others amounted to $0, $1,000 and $1,000 for the years ended December 31, 2010, 2009 and 2008, respectively.
As of December 31, 2010, the Company had commitments of $156.7 million in commercial business loans, $44,000 in one-to-four family residential loans, $15.1 million in real estate construction loans, and $40.6 million in consumer loans.
| (4) | Allowance for Loan Losses |
The allowance for loan losses is maintained at a level deemed appropriate by management to adequately provide for known and inherent risks in the loan portfolio. A summary of the changes in the allowance for loan losses for the years ended December 31 are as follows:
| 2010 | 2009 | 2008 | ||||||||||
| (In thousands) | ||||||||||||
| Balance at the beginning of year |
$ | 26,164 | $ | 15,423 | $ | 10,374 | ||||||
| Loans charged off |
(16,692 | ) | (8,823 | ) | (2,407 | ) | ||||||
| Recoveries of loans charged off |
600 | 174 | 36 | |||||||||
| Provision charged to operations |
11,990 | 19,390 | 7,420 | |||||||||
| Balance at the end of year |
$ | 22,062 | $ | 26,164 | $ | 15,423 | ||||||
F-33
Table of Contents
The following table details activity in the allowance for loan losses disaggregated on the basis of the Company’s impairment method for the year ended December 31, 2010:
| Commercial and industrial |
Owner- occupied commercial real estate |
Non-owner occupied commercial real estate |
One-to-four family residential |
Real estate construction and land development: one-to-four family residential |
Real estate construction and land development: five or more family residential and commercial real estate |
Consumer | Unallocated | Total | ||||||||||||||||||||||||||||
| (in thousands) | ||||||||||||||||||||||||||||||||||||
| Allowance for loan losses: |
||||||||||||||||||||||||||||||||||||
| Beginning balance |
$ | 8,698 | $ | 1,341 | $ | 2,098 | $ | 550 | $ | 5,846 | $ | 7,046 | $ | 361 | $ | 224 | $ | 26,164 | ||||||||||||||||||
| Charge-offs |
(7,621 | ) | — | (485 | ) | (169 | ) | (3,932 | ) | (4,412 | ) | (73 | ) | — | (16,692 | ) | ||||||||||||||||||||
| Recoveries |
243 | — | — | 15 | 285 | — | 57 | — | 600 | |||||||||||||||||||||||||||
| Provisions |
9,146 | 332 | 577 | 403 | 2,118 | (1,502 | ) | 209 | 707 | 11,990 | ||||||||||||||||||||||||||
| Ending balance |
10,466 | 1,673 | 2,190 | 799 | 4,317 | 1,132 | 554 | 931 | 22,062 | |||||||||||||||||||||||||||
| Period-end amount allocated to:: |
||||||||||||||||||||||||||||||||||||
| Originated loans individually evaluated for impairment |
2,569 | 163 | — | 2 | 1,664 | 201 | — | — | 4,599 | |||||||||||||||||||||||||||
| Originated loans collectively evaluated for impairment |
7,897 | 1,510 | 2,190 | 797 | 2,653 | 931 | 554 | 931 | 17,463 | |||||||||||||||||||||||||||
| Ending balance |
$ | 10,466 | $ | 1,673 | $ | 2,190 | $ | 799 | $ | 4,317 | $ | 1,132 | $ | 554 | $ | 931 | $ | 22,062 | ||||||||||||||||||
F-34
Table of Contents
The purchased loans acquired in the Cowlitz Acquisition and the Pierce Commercial Acquisition are subject to the Company’s internal and external credit review. If and when credit deterioration occurs subsequent to the acquisition dates, a provision for loan losses will be charged to earning for the full amount without regard to the FDIC loss sharing agreement for the covered loan balances. The portion of the estimated loss reimbursable from the FDIC is recorded in noninterest income and increases the FDIC Indemnification Asset. At December 31, 2010, the Company had no provision for loan losses or allowance for loan losses related to the purchased covered and non-covered loans. There were also no purchased loans classified as impaired, meaning no purchased loan was individually evaluated for impairment in the table below.
The following table details the recorded investment balance of the loan receivables disaggregated on the basis of the Company’s impairment method for the year ended December 31, 2010:
| Commercial and industrial |
Owner- occupied commercial real estate |
Non-owner occupied commercial real estate |
One-to-four family residential |
Real estate construction and land development: one-to-four family residential |
Real estate construction and land development: five or more family residential and commercial real estate |
Consumer | Total | |||||||||||||||||||||||||
| (in thousands) | ||||||||||||||||||||||||||||||||
| Originated loans individually evaluated for impairment |
$ | 8,153 | $ | 779 | $ | 2,301 | $ | 2 | $ | 10,227 | $ | 5,416 | $ | — | $ | 26,878 | ||||||||||||||||
| Originated loans collectively evaluated for impairment—originated |
224,704 | 158,665 | 219,438 | 47,503 | 19,150 | 23,172 | 23,832 | 716,464 | ||||||||||||||||||||||||
| Non-impaired purchased covered loans collectively evaluated for impairment |
11,305 | 22,856 | 331 | 1,472 | 54 | — | 2,567 | 38,585 | ||||||||||||||||||||||||
| Non-impaired purchased non-covered loans collectively evaluated for impairment |
8,917 | 12,386 | 12,231 | 2,193 | — | 152 | 14,922 | 50,801 | ||||||||||||||||||||||||
| Impaired purchased covered loans collectively evaluated for impairment |
35,743 | 22,364 | 17,244 | 8,550 | 5,821 | — | 408 | 90,130 | ||||||||||||||||||||||||
| Impaired purchased non-covered loans collectively evaluated for impairment |
$ | 31,877 | $ | 6,591 | $ | 6,683 | $ | 17,823 | $ | 1,166 | $ | 5,177 | $ | 10,931 | $ | 80,248 | ||||||||||||||||
| (5) | FDIC Indemnification Asset |
Changes in the FDIC indemnification asset since the July 30, 2010 Cowlitz Acquisition are as follows:
| (in thousands) | ||||
| Estimated fair value at July 30, 2010 acquisition date |
$ | 16,084 | ||
| Cash payments received from the FDIC |
(63 | ) | ||
| Net accretion |
50 | |||
| Balance at December 31, 2010 |
$ | 16,071 | ||
F-35
Table of Contents
| (6) | Investment Securities |
The amortized cost, gross unrealized gains and losses, and fair values of investment securities at the dates indicated are as follows:
Securities Available for Sale
| Amortized Cost |
Gross Unrealized Gains |
Gross Unrealized Losses |
Fair Value |
|||||||||||||
| (In thousands) | ||||||||||||||||
| December 31, 2010 |
||||||||||||||||
| U.S. Treasury and U.S. Government agencies |
$ | 41,124 | $ | 367 | $ | (62 | ) | $ | 41,429 | |||||||
| Municipal securities |
20,237 | 169 | (193 | ) | 20,213 | |||||||||||
| Corporate securities |
10,097 | 182 | (3 | ) | 10,276 | |||||||||||
| Mortgage backed securities and collateralized mortgage obligations: |
||||||||||||||||
| U.S. Government agencies |
52,394 | 1,034 | (171 | ) | 53,257 | |||||||||||
| Total |
$ | 123,852 | $ | 1,752 | $ | (429 | ) | $ | 125,175 | |||||||
| December 31, 2009 |
||||||||||||||||
| U.S. Treasury and U.S. Government agencies |
$ | 22,986 | $ | 52 | $ | (80 | ) | $ | 22,958 | |||||||
| Municipal securities |
7,365 | 149 | (54 | ) | 7,460 | |||||||||||
| Corporate securities |
10,060 | 127 | (11 | ) | 10,176 | |||||||||||
| Mortgage backed securities and collateralized mortgage obligations: |
||||||||||||||||
| U.S. Government agencies |
49,645 | 695 | (198 | ) | 50,142 | |||||||||||
| Total |
$ | 90,056 | $ | 1,023 | $ | (343 | ) | $ | 90,736 | |||||||
Securities Held to Maturity
| Amortized Cost |
Gross Unrealized Gains |
Gross Unrealized Losses |
Fair Value |
|||||||||||||
| (In thousands) | ||||||||||||||||
| December 31, 2010 |
||||||||||||||||
| U.S. Treasury and U.S. Government agencies |
$ | 1,858 | $ | 93 | $ | — | $ | 1,951 | ||||||||
| Municipal securities |
3,410 | 100 | (19 | ) | 3,491 | |||||||||||
| Mortgage backed securities and collateralized mortgage obligations: |
||||||||||||||||
| U.S. Government agencies |
6,592 | 208 | — | 6,800 | ||||||||||||
| Private residential collateralized mortgage obligations |
1,908 | 250 | (110 | ) | 2,048 | |||||||||||
| Total |
$ | 13,768 | $ | 651 | $ | (129 | ) | $ | 14,290 | |||||||
| December 31, 2009 |
||||||||||||||||
| U.S. Treasury and U.S. Government agencies |
$ | 1,443 | $ | 15 | $ | (14 | ) | $ | 1,444 | |||||||
| Municipal securities |
1,618 | 93 | — | 1,711 | ||||||||||||
| Mortgage backed securities and collateralized mortgage obligations: |
||||||||||||||||
| U.S. government agencies |
8,236 | 172 | (57 | ) | 8,351 | |||||||||||
| Private residential collateralized mortgage obligations |
2,339 | 70 | (270 | ) | 2,139 | |||||||||||
| Total |
$ | 13,636 | $ | 350 | $ | (341 | ) | $ | 13,645 | |||||||
F-36
Table of Contents
Available for sale and held to maturity investments with unrealized losses as of December 31, 2010 are as follows:
| Less than 12 Months | 12 Months or Longer |
Total | ||||||||||||||||||||||
| Fair Value |
Unrealized Losses |
Fair Value |
Unrealized Losses |
Fair Value |
Unrealized Losses |
|||||||||||||||||||
| (In thousands) | ||||||||||||||||||||||||
| U.S. Treasury and U.S. Government agencies |
$ | 10,651 | $ | 62 | $ | $ | $ | 10,651 | $ | 62 | ||||||||||||||
| Municipal securities |
13,575 | 212 | — | — | 13,575 | 212 | ||||||||||||||||||
| Corporate securities |
2,067 | 3 | — | — | 2,067 | 3 | ||||||||||||||||||
| Mortgage backed securities and collateralized mortgage obligations: |
||||||||||||||||||||||||
| U.S. Government agencies |
10,968 | 171 | — | — | 10,968 | 171 | ||||||||||||||||||
| Private residential collateralized mortgage obligations |
681 | 7 | 736 | 103 | 1,417 | 110 | ||||||||||||||||||
| Total temporarily impaired securities |
$ | 37,942 | $ | 455 | $ | 736 | $ | 103 | $ | 38,678 | $ | 558 | ||||||||||||
Available for sale and held to maturity investments with unrealized losses as of December 31, 2009 are as follows:
| Less than 12 Months |
12 Months or Longer |
Total | ||||||||||||||||||||||
| Fair Value |
Unrealized Losses |
Fair Value |
Unrealized Losses |
Fair Value |
Unrealized Losses |
|||||||||||||||||||
| (In thousands) | ||||||||||||||||||||||||
| U.S. Treasury and U.S. Government agencies |
$ | 20,907 | $ | 80 | $ | 1,175 | $ | 14 | $ | 22,082 | $ | 94 | ||||||||||||
| Municipal securities |
2,993 | 54 | — | — | 2,993 | 54 | ||||||||||||||||||
| Corporate securities |
1,982 | 11 | — | — | 1,982 | 11 | ||||||||||||||||||
| Mortgage backed securities and collateralized mortgage obligations: |
||||||||||||||||||||||||
| U.S. Government agencies |
17,247 | 254 | 270 | 1 | 17,517 | 255 | ||||||||||||||||||
| Private residential collateralized mortgage obligations |
55 | 12 | 2,084 | 258 | 2,139 | 270 | ||||||||||||||||||
| Total temporarily impaired securities |
$ | 43,184 | $ | 411 | $ | 3,529 | $ | 273 | $ | 46,713 | $ | 684 | ||||||||||||
The Company has evaluated these securities and has determined that the decline in their value is temporary. The unrealized losses are primarily due to unusually large spreads in the market for mortgage-related products. The fair value of the mortgage backed securities and the collateralized mortgage obligations is expected to recover as the securities approach their maturity date and/or as the pricing spreads narrow on mortgage-related securities. The Company has the ability and intent to hold the investments until recovery of the market value.
The amortized cost and fair value of securities at December 31, 2010, by contractual maturity, are set forth below. Actual maturities may differ from contractual maturities because certain borrowers have the right to call or prepay obligations with or without call or prepayment penalties.
F-37
Table of Contents
Securities Available for Sale
| Amortized Cost |
Fair Value |
|||||||
| (In thousands) | ||||||||
| Due in one year or less |
$ | 13,760 | $ | 13,832 | ||||
| Due after one year through three years |
41,095 | 41,576 | ||||||
| Due after three years through five years |
2,197 | 2,203 | ||||||
| Due after five through ten years |
19,359 | 19,438 | ||||||
| Due after ten years |
47,441 | 48,126 | ||||||
| Totals |
$ | 123,852 | $ | 125,175 | ||||
Securities Held to Maturity
| Amortized Cost |
Fair Value |
|||||||
| (In thousands) | ||||||||
| Due in one year or less |
$ | 95 | $ | 96 | ||||
| Due after one year through three years |
627 | 658 | ||||||
| Due after three years through five years |
1,084 | 1,155 | ||||||
| Due after five years through ten years |
3,032 | 3,121 | ||||||
| Due after ten years |
8,930 | 9,260 | ||||||
| Totals |
$ | 13,768 | $ | 14,290 | ||||
During the year ended December 31, 2010 there were $1.1 million in sales of investment securities available for sale resulting in a loss of $44,000 and no sales of investment securities held to maturity. During the year ended December 31, 2009 there were $752,000 in sales of investment securities available for sale resulting in a gain of $2,000 and no sales of investment securities held to maturity.
Effective June 30, 2009, the Company adopted FASB ASC 320-10-65, Recognition and Presentation of Other-Than-Temporary Impairments, which provides for the bifurcation of other-than-temporary impairments into (a) the amount of the total other-than-temporary impairment related to a decrease in cash flows expected to be collected from the debt security (the credit loss) or (b) the amount of the total other-than-temporary impairment related to all other factors. As a result of adopting FASB ASC 320-10-65, the Company recorded $830,000 in impairments on private residential collateralized mortgage obligations not related to credit losses through other comprehensive income rather than through earnings and $500,000 in impairments related to credit losses through earnings during the year ended December 31, 2009. The Company also reclassified $229,000 from retained earnings to other comprehensive income related to impairment charges on private residential collateralized mortgage obligations at December 31, 2008 and March 31, 2009 that were not due to credit losses.
For the private residential collateralized mortgage obligations we estimated expected future cash flows of the securities by estimating the expected future cash flows of the underlying collateral and applying those collateral cash flows, together with any credit enhancements such as subordination interests owned by third parties, to the security. The expected future cash flows of the underlying collateral are determined using the remaining contractual cash flows adjusted for future expected credit losses (which considers current delinquencies and nonperforming assets, future expected default rates and collateral value by vintage and geographic region) and prepayments. The expected cash flows of the security are then discounted at the interest rate used to recognize interest income on the security to arrive at a present value amount. For the year ended December 31, 2010, twelve private residential collateralized mortgage obligations were determined to be other-than-temporarily impaired resulting in the Company recording $20,000 in impairments on private collateralized mortgage obligations not related to credit losses through other comprehensive income rather than through earnings and $298,000 in impairments related to credit losses through earnings. The average prepayment rate and discount interest rate used in the valuations of the present value were 6.0% and 8.2%, respectively.
F-38
Table of Contents
The following table summarizes activity related to the amount of other-than-temporary impairments related to credit losses on held to maturity securities:
| Gross Other- Than-Temporary Impairments |
Other-Than- Temporary Impairments Included in Other Comprehensive Loss |
Net Other- Than- Temporary Impairments Included in Earnings |
||||||||||
| (In thousands) | ||||||||||||
| December 31, 2008 |
$ | 668 | $ | — | $ | 668 | ||||||
| Impact of change in accounting principle(1) |
— | 229 | (229 | ) | ||||||||
| Additions: |
||||||||||||
| Initial impairments |
1,226 | 831 | 395 | |||||||||
| Subsequent impairments |
105 | — | 105 | |||||||||
| December 31, 2009 |
$ | 1,999 | $ | 1,060 | $ | 939 | ||||||
| Additions: |
||||||||||||
| Initial impairments |
82 | 11 | 71 | |||||||||
| Subsequent impairments |
236 | 9 | 227 | |||||||||
| December 31, 2010 |
$ | 2,317 | $ | 1,080 | $ | 1,237 | ||||||
| (1) | Represents a reclassification of other comprehensive income of other-than-temporary impairments on securities which were previously recorded in earnings at December 13, 2008 and March 31, 2009. |
Details of private residential collateralized mortgage obligation securities received in 2008 from the redemption-in-kind of the AMF Ultra Short Mortgage Fund (“Fund”) as of December 31, 2010 were as follows:
| Ratings | ||||||||||||||||||||||||||||||||||||||||||||||||
| Type and Year |
Par Value |
Amortized Cost |
Fair Value |
Aggregate Unrealized Gain (Loss) |
Year-to-date Change in Unrealized Gain (Loss) |
Year-to-date Impairment Charge |
Life-to-date Impairment Charge(1) |
AAA | AA | A | BBB | Below Investment Grade |
||||||||||||||||||||||||||||||||||||
| (Dollars in thousands) | ||||||||||||||||||||||||||||||||||||||||||||||||
| Alt-A |
||||||||||||||||||||||||||||||||||||||||||||||||
| 2007 |
$ | 412 | $ | 156 | $ | 131 | $ | (25 | ) | $ | (19 | ) | $ | 59 | $ | 176 | — | % | — | % | — | % | — | % | 100 | % | ||||||||||||||||||||||
| 2006 |
537 | 51 | 103 | 52 | 72 | 125 | 428 | — | — | — | — | 100 | ||||||||||||||||||||||||||||||||||||
| 2005 |
125 | 77 | 69 | (8 | ) | (1 | ) | — | 19 | — | — | — | — | 100 | ||||||||||||||||||||||||||||||||||
| 2004 and earlier |
8 | 8 | 7 | (1 | ) | — | — | — | — | 40 | 60 | — | — | |||||||||||||||||||||||||||||||||||
| Total Alt-A |
1,082 | 292 | 310 | 18 | (52 | ) | 184 | 623 | — | 1 | 2 | — | 97 | |||||||||||||||||||||||||||||||||||
| Prime |
||||||||||||||||||||||||||||||||||||||||||||||||
| 2008 |
49 | 47 | 45 | (2 | ) | 8 | — | — | — | — | — | — | 100 | |||||||||||||||||||||||||||||||||||
| 2007 |
391 | 144 | 180 | 36 | 58 | — | 137 | — | — | — | — | 100 | ||||||||||||||||||||||||||||||||||||
| 2006 |
869 | 627 | 713 | 86 | 70 | 35 | 153 | — | — | — | — | 100 | ||||||||||||||||||||||||||||||||||||
| 2005 |
778 | 351 | 369 | 18 | 55 | 36 | 269 | — | — | — | 17 | 83 | ||||||||||||||||||||||||||||||||||||
| 2004 and earlier |
646 | 447 | 431 | (16 | ) | 96 | 43 | 55 | 31 | 15 | 12 | 36 | 6 | |||||||||||||||||||||||||||||||||||
| Total Prime |
2,733 | 1,616 | 1,738 | 122 | 287 | 114 | 614 | 6 | 6 | 3 | 14 | 71 | ||||||||||||||||||||||||||||||||||||
| Totals |
$ | 3,815 | $ | 1,908 | $ | 2,048 | $ | 140 | $ | 339 | $ | 298 | $ | 1,237 | 6 | % | 5 | % | 3 | % | 11 | % | 75 | % | ||||||||||||||||||||||||
| (1) | Life-to-date impairment charge represents impairment charges recognized subsequent to redemption of the Fund. |
At December 31, 2010 and 2009, investment securities available for sale with fair values of $122.6 million and $21.2 million, respectively, were pledged to secure public deposits and for other purposes as required or permitted by law. At December 31, 2010 and 2009, investment securities held to maturity with amortized cost values of $9.6 million and $3.7 million, respectively, were pledged to secure public deposits and for other purposes as required or permitted by law.
There were no securities classified as trading at December 31, 2010 or 2009.
F-39
Table of Contents
| (7) | Premises and Equipment |
A summary of premises and equipment at December 31, 2010 and 2009 follows:
| 2010 | 2009 | |||||||
| (In thousands) | ||||||||
| Land |
$ | 6,707 | $ | 6,175 | ||||
| Buildings and building improvements |
24,129 | 20,163 | ||||||
| Furniture, fixtures and equipment |
14,455 | 12,439 | ||||||
| 45,291 | 38,777 | |||||||
| Less accumulated depreciation |
23,541 | 22,383 | ||||||
| $ | 21,750 | $ | 16,394 | |||||
Total depreciation expense on premises and equipment was $1.4 million, $1.1 million and $1.2 million for the years ended December 31, 2010, 2009 and 2008, respectively.
The Banks lease premises and equipment under operating leases. Rental expense of leased premises and equipment was $1.2 million, $640,000, and $661,000 for the years ended December 31, 2010, 2009 and 2008, respectively, which is included in occupancy and equipment expense.
Minimum net rental commitments under noncancelable leases having an original or remaining term of more than one year for future years ending December 31 are as follows (in thousands):
| 2011 |
$ | 1,238 | ||
| 2012 |
1,121 | |||
| 2013 |
928 | |||
| 2014 |
878 | |||
| 2015 |
904 | |||
| Thereafter |
2,653 | |||
| $ | 7,722 | |||
Certain leases contain renewal options from five to ten years and escalation clauses based on increases in property taxes and other costs.
| (8) | Deposits |
Deposits consisted of the following at December 31:
| 2010 | 2009 | |||||||||||||||
| Amount | Percent | Amount | Percent | |||||||||||||
| (Dollars in thousands) | ||||||||||||||||
| Non interest demand deposits |
$ | 194,583 | 17.1 | % | $ | 133,169 | 15.8 | % | ||||||||
| NOW accounts |
287,247 | 25.3 | 211,509 | 25.2 | ||||||||||||
| Money market accounts |
150,953 | 13.3 | 113,332 | 13.5 | ||||||||||||
| Savings accounts |
100,552 | 8.8 | 78,205 | 9.3 | ||||||||||||
| Total non-maturity deposits |
733,335 | 64.5 | 536,215 | 63.8 | ||||||||||||
| Certificate of deposit accounts |
402,941 | 35.5 | 303,913 | 36.2 | ||||||||||||
| Total deposits |
$ | 1,136,276 | 100.0 | % | $ | 840,128 | 100.0 | % | ||||||||
F-40
Table of Contents
Accrued interest payable on deposits was $322,000, $266,000 and $748,000 at December 31, 2010, 2009 and 2008, respectively and is included in accrued expenses and other liabilities in the consolidated statements of financial condition. Interest expense, by category, is as follows for the years ended December 31:
| 2010 | 2009 | 2008 | ||||||||||
| (In thousands) | ||||||||||||
| NOW accounts |
$ | 1,418 | $ | 1,470 | $ | 1,679 | ||||||
| Money market accounts |
781 | 1,433 | 3,089 | |||||||||
| Savings accounts |
502 | 707 | 1,130 | |||||||||
| Certificate of deposit accounts |
5,677 | 7,988 | 12,423 | |||||||||
| $ | 8,378 | $ | 11,598 | $ | 18,321 | |||||||
Scheduled maturities of certificates of deposit for future years ending December 31 are as follows (in thousands):
| 2011 |
$ | 298,606 | ||
| 2012 |
73,905 | |||
| 2013 |
10,811 | |||
| 2014 |
6,812 | |||
| 2015 |
12,807 | |||
| $ | 402,941 | |||
Certificates of deposit issued in denominations equal to or in excess of $100,000 totaled $228.0 million and $153.4 million at December 31, 2010 and 2009, respectively.
| (9) | FHLB Advances and Stock |
The Federal Home Loan Bank of Seattle (“FHLB”) functions as a bank association providing credit for member financial institutions. Advances are made pursuant to several different programs. Each credit program has its own interest rate and range of maturities. Depending on the program, limitations on the amount of advances are based either on a fixed percentage of an institution’s net worth or on the FHLB’s assessment of the institution’s creditworthiness. At December 31, 2010, the Banks maintained uncommitted credit facilities with the FHLB of Seattle for $173.1 million. There were no FHLB borrowings outstanding as of December 31, 2010.
The Banks are required to maintain an investment in the stock of the FHLB of Seattle in an amount equal to the greater of $500,000 or 0.50% of residential mortgage loans and pass-through securities or an advance requirement to be confirmed on the date of the advance and 5.0% of the outstanding balance of mortgage loans sold to the FHLB of Seattle. At December 31, 2010, the Company was required to maintain an investment in the stock of FHLB of Seattle of at least $1.4 million. The Banks maintained $5.6 million in FHLB stock at December 31, 2010. The stock has no contractual maturity and amounts in excess of the required minimum for FHLB membership may be redeemed at par subject to certain restrictions.
The Company evaluated its investment in FHLB of Seattle stock for other-than-temporary impairment, consistent with its accounting policy. Based on the Company’s evaluation of the underlying investment, including the long-term nature of the investment, the liquidity position of the FHLB of Seattle, the actions being taken by the FHLB of Seattle to address its regulatory situation and the Company’s intent and ability to hold the investment for a period of time sufficient to recover the par value, the Company did not recognize an other-than-temporary impairment loss on its FHLB of Seattle stock. Even though the Company did not recognize an other-than-temporary impairment loss on its FHLB of Seattle stock during 2010, 2009 or 2008, continued deterioration in the FHLB of Seattle’s financial position may result in future impairment losses.
F-41
Table of Contents
A summary of FHLB advances at and for the years ended December 31, is summarized as follows:
| 2010 | 2009 | |||||||
| (Dollars in thousands) | ||||||||
| Balance at period end, due less than 12 months |
$ | — | $ | — | ||||
| Average balance |
1,330 | — | ||||||
| Maximum amount outstanding at any month end |
17,486 | — | ||||||
| Average interest rate: |
||||||||
| During the period |
1.67 | % | — | |||||
| At period end |
— | — | ||||||
Advances from the FHLB are collateralized by a blanket pledge on FHLB stock owned by the Company, deposits at the FHLB and all mortgages or deeds of trust securing such properties. In accordance with the pledge agreement, the Company must maintain unencumbered collateral in an amount equal to varying percentages ranging from 100% to 125% of outstanding advances depending on the type of collateral. At December 31, 2010, the Company was not required to maintain collateral in order to meet the collateral requirements of the FHLB.
| (10) | Federal Funds Purchased |
The Banks maintain advance lines to purchase federal funds totaling $22.8 million. The lines generally mature annually or are reviewed annually. As of December 31, 2010, there were no federal funds purchased.
| (11) | Borrowings |
The Company utilizes repurchase agreements as a supplement to funding sources. Repurchase agreements are secured by available for sale investment securities. At December 31, 2010 and 2009 the Company had securities sold under agreement to repurchase of $19.0 million and $10.4 million, respectively.
The Company also maintains an uncommitted credit facility with the Federal Reserve Bank of San Francisco for $66.9 million, of which there were no borrowings outstanding as of December 31, 2010 and 2009.
| (12) | Federal Income Taxes |
Federal income tax expense (benefit) consisted of the following for the years ended December 31:
| 2010 | 2009 | 2008 | ||||||||||
| (In thousands) | ||||||||||||
| Current |
$ | 1,886 | $ | 3,790 | $ | 5,516 | ||||||
| Deferred |
4,549 | (4,293 | ) | (2,540 | ) | |||||||
| $ | 6,435 | $ | (503 | ) | $ | 2,976 | ||||||
Federal income tax expense differs from that computed by applying the Federal statutory income tax rate of 35% for the years ended December 31:
| 2010 | 2009 | 2008 | ||||||||||
| (In thousands) | ||||||||||||
| Income tax expense at Federal statutory rate |
$ | 6,926 | $ | 27 | $ | 3,264 | ||||||
| Tax exempt interest |
(378 | ) | (311 | ) | (294 | ) | ||||||
| Other, net |
(113 | ) | (219 | ) | 6 | |||||||
| $ | 6,435 | $ | (503 | ) | $ | 2,976 | ||||||
F-42
Table of Contents
The following table presents major components of the deferred Federal income tax asset (liability) resulting from differences between financial reporting and tax bases for the years ended December 31:
| 2010 | 2009 | |||||||
| (In thousands) | ||||||||
| Deferred tax assets: |
||||||||
| Allowance for loan losses |
$ | 7,569 | $ | 9,229 | ||||
| Accrued compensation |
568 | 420 | ||||||
| Capital loss carryforward |
340 | 359 | ||||||
| Other than temporarily impaired securities |
513 | 409 | ||||||
| Unrealized loss on available for sale securities |
— | 125 | ||||||
| Goodwill |
2,593 | — | ||||||
| Other |
699 | 183 | ||||||
| Total deferred tax assets |
12,282 | 10,725 | ||||||
| Deferred tax liabilities: |
||||||||
| Deferred loan fees |
(658 | ) | (708 | ) | ||||
| Premises and equipment |
(344 | ) | (87 | ) | ||||
| FHLB stock |
(1,174 | ) | (797 | ) | ||||
| Unrealized gain on available for sale securities |
(204 | ) | — | |||||
| Indemnification Asset |
(5,647 | ) | — | |||||
| Total deferred tax liabilities |
(8,027 | ) | (1,592 | ) | ||||
| Deferred Federal income tax asset, net |
$ | 4,255 | $ | 9,133 | ||||
The Company has qualified under provisions of the Internal Revenue Code to compute federal income taxes after deductions of additions to the bad debt reserves. At December 31, 2010, the Company had a taxable temporary difference of approximately $2.8 million that arose before 1988 (base-year amount). In accordance with Statement of Financial Accounting Standards No. 109, a deferred tax liability has not been recognized for the temporary difference. Management does not expect this temporary difference to reverse in the foreseeable future.
In assessing the realizability of deferred tax assets, management considers whether it is more likely than not that some portion or all of the deferred tax assets will not be realized. The ultimate realization of deferred tax assets is dependent upon the generation of future taxable income during the periods in which those temporary differences become deductible. Based upon the level of historical taxable income and projections for future taxable income over the periods in which the deferred tax assets are deductible, management expects to realize the benefits of these deductible differences. The Company has a capital loss carryforward in the amount of $1.0 million that will expire in 2013. A tax planning strategy has been developed that will enable the Company to deduct the capital loss carryforward prior to expiration.
(13) Stockholders’ Equity
(a) Preferred Stock and Warrants
On November 21, 2008, the Company completed a sale to the U.S. Department of the Treasury (“Treasury”) of 24,000 shares of the Company’s Fixed Rate Cumulative Perpetual Preferred Stock, Series A, (“preferred shares”), for an aggregate purchase price of $24.0 million in cash, with a related warrant to purchase 276,074 shares of the Company’s common stock. On December 22, 2010, the Company redeemed the 24,000 preferred shares. The Company paid the Treasury a total of $24.1 million, consisting of $24.0 million of principal and $123,000 of accrued and unpaid dividends.
Under the terms of the warrants, because the Company’s September 2009 offering of common stock, described below, was a “qualified equity offering” resulting in aggregate gross proceeds of at least $24.0 million,
F-43
Table of Contents
the number of shares of the Company’s common stock underlying the warrant was reduced by 50% to 138,037 shares. This warrant is still held by the Treasury and remains outstanding at this time
The warrant has a ten-year term with an exercise price of $13.04 per share, an allocated value of $646,000 and a fair value of $588,000. The allocated value is the percent of the fair value of the warrant in relation to the total purchase price of the preferred shares and warrant. The fair value of the warrant was estimated on the date of issue using the Black-Scholes model based on the assumptions noted in the following table. The expected term of the warrant is ten years and represents the period of time that warrant is expected to be outstanding. The risk-free interest rate is based on the U.S. Treasury yield curve in effect at the time of grant. The expected volatility is based on historical volatility of Company shares. The expected dividend yield is based on dividends expected to be paid during the expected term of the warrant.
| Period ended |
Weighted Average Risk Free Interest Rate |
Expected Term in Years |
Expected Volatility |
Expected Dividend Yield |
Weighted Average Fair Value |
|||||||||||||||
| December 31, 2008 |
3.20 | % | 10.00 | 27 | % | 4.29 | % | $ | 2.13 | |||||||||||
(b) Common Stock
On December 15, 2010, the Company completed the sale of 4.4 million shares of common stock in a public offering. The purchase price was $13.00 per share and net proceeds from the sale totaled approximately $54.1 million.
On September 22, 2009, the Company completed the sale of 4.3 million shares of common stock in a public offering. The purchase price was $11.50 per share and net proceeds from the sale totaled approximately $46.6 million.
(c) Earnings Per Common Share
The following table illustrates the reconciliation of weighted average shares used for earnings per common share computations for the years ended December 31:
| 2010 | 2009 | 2008 | ||||||||||
| (Dollars in thousands) | ||||||||||||
| Net income (loss): |
||||||||||||
| Net income |
$ | 13,354 | $ | 581 | $ | 6,351 | ||||||
| Dividends accrued and discount accreted on preferred shares |
(1,686 | ) | (1,320 | ) | (143 | ) | ||||||
| Net income (loss) available to common shareholders |
$ | 11,668 | $ | (739 | ) | $ | 6,208 | |||||
| Dividends and undistributed earnings allocated to participating securities(1) |
— | (7 | ) | (50 | ) | |||||||
| Earnings (loss) allocated to common shareholders |
$ | 11,668 | $ | (746 | ) | $ | 6,158 | |||||
| Basic: |
||||||||||||
| Weighted average common shares outstanding |
11,217,479 | 7,908,412 | 6,684,709 | |||||||||
| Less: restricted stock awards |
(96,133 | ) | (76,798 | ) | (86,062 | ) | ||||||
| Total basic weighted average common shares outstanding |
11,121,346 | 7,831,614 | 6,598,647 | |||||||||
| Diluted: |
||||||||||||
| Basic weighted average common shares outstanding |
11,121,346 | 7,831,614 | 6,598,647 | |||||||||
| Incremental shares from stock options, restricted stock awards and common stock warrant |
52,312 | — | 48,773 | |||||||||
| Weighted average shares common outstanding |
11,173,658 | 7,831,614 | 6,647,420 | |||||||||
F-44
Table of Contents
| (1) | Effective January 1, 2009, the Company adopted FASB ASC 03-6-1, which clarifies that unvested stock-based compensation awards containing nonforfeitable rights to dividend equivalents are considered participating securities and therefore are included in the two-class method calculation of earnings per share. The Company grants restricted stock to certain employees under its stock-based compensation programs. Recipients receive cash dividends during the vesting periods of these awards. Since these dividends are nonforfeitable, the unvested awards are considered participating securities and will have earnings allocated to them. Earnings per share data for the prior periods have been revised to reflect the retrospective adoption of the FASB ASC. |
Potential dilutive shares are excluded from the computation of earnings per share if their effect is anti-dilutive. For the year ended December 31, 2010 and 2008, anti-dilutive shares outstanding related to options and warrants to acquire common stock totaled 567,119 and 458,488, respectively, as the exercise price was in excess of the market value. For the year ended December 31, 2009, the Company recognized a net loss applicable to common shareholders and therefore all shares outstanding related to options and warrants to acquire common stock and all outstanding restricted stock awards were anti-dilutive and have been excluded from the calculation of diluted earnings per share.
(d) Stock Repurchase Program
The Company does not currently have a stock repurchase plan in place and no stock was repurchased during the year ended December 31, 2010.
(e) Restrictions on Dividends
Dividends from the Company depend, in part, upon receipt of dividends from its subsidiary banks because the Company currently has no source of income other than dividends from Heritage Bank and Central Valley Bank.
The FDIC and the Washington State Department of Financial Institutions (“DFI”) have the authority under their supervisory powers to prohibit the payment of dividends by Heritage Bank and Central Valley Bank to the Company. Additionally, current guidance from the Federal Reserve provides, among other things, that dividends per share on the Company’s common stock generally should not exceed earrings per share, measured over the previous four fiscal quarters. Current regulations allow the Company and its subsidiary banks to pay dividends on their common stock if the Company’s or Bank’s regulatory capital would not be reduced below the statutory capital requirements set by the Federal Reserve and the FDIC.
| (14) | Stock Option and Award Plans |
Stock options generally vest ratably over three years and expire five years after they become exercisable or vest ratably over four years and expire ten years from date of grant. Restricted stock awards issued generally have a five-year cliff vesting or four year ratable vesting schedule. The Company issues new shares to satisfy share option exercises and restricted stock awards.
F-45
Table of Contents
The following table summarizes stock option activity for the years ended December 31, 2010, 2009 and 2008.
| Shares | Weighted- Average Exercise Price |
Weighted- Average Remaining Contractual Term |
Aggregate Intrinsic Value (In thousands) |
|||||||||||||
| Outstanding at December 31, 2007 |
518,658 | $ | 20.15 | |||||||||||||
| Granted |
17,550 | 19.99 | ||||||||||||||
| Exercised |
(23,459 | ) | 10.72 | |||||||||||||
| Forfeited or expired |
(1,120 | ) | 20.21 | |||||||||||||
| Outstanding at December 31, 2008 |
511,629 | $ | 20.58 | |||||||||||||
| Granted |
100,735 | 11.35 | ||||||||||||||
| Exercised |
(4,089 | ) | 10.13 | |||||||||||||
| Forfeited or expired |
(69,433 | ) | 17.39 | |||||||||||||
| Outstanding at December 31, 2009 |
538,842 | $ | 19.34 | |||||||||||||
| Granted |
105,082 | 14.79 | ||||||||||||||
| Exercised |
(17,268 | ) | 11.67 | |||||||||||||
| Forfeited or expired |
(76,132 | ) | 19.41 | |||||||||||||
| Outstanding at December 31, 2010 |
550,524 | $ | 18.70 | 3.59 | $ | 256 | ||||||||||
| Exercisable at December 31, 2010 |
373,562 | $ | 21.08 | 1.74 | $ | 86 | ||||||||||
The total intrinsic value of options exercised during the years ended December 31, 2010, 2009 and 2008, was $43,000, $4,000 and $172,000, respectively. The total fair value of options vested during the years ended December 31, 2010, 2009 and 2008, was $24,000, $23,000 and $121,000 respectively.
The following table summarizes restricted stock award activity for the years ended December 31, 2010, 2009 and 2008.
| Shares | Weighted- Average Grant Date Fair Value |
|||||||
| Outstanding at December 31, 2007 |
65,945 | $ | 22.62 | |||||
| Granted |
24,495 | 19.85 | ||||||
| Vested |
(1,245 | ) | 27.71 | |||||
| Forfeited |
(635 | ) | 22.76 | |||||
| Outstanding at December 31, 2008 |
88,560 | $ | 21.87 | |||||
| Granted |
5,000 | 13.55 | ||||||
| Vested |
(26,250 | ) | 20.11 | |||||
| Forfeited |
(1,605 | ) | 23.75 | |||||
| Outstanding at December 31, 2009 |
65,705 | $ | 21.90 | |||||
| Granted |
57,049 | 14.21 | ||||||
| Vested |
(3,800 | ) | 20.24 | |||||
| Forfeited |
(575 | ) | 14.62 | |||||
| Outstanding at December 31, 2010 |
118,379 | $ | 18.29 | |||||
F-46
Table of Contents
| (15) | Regulatory Capital Requirements |
The Company is a bank holding company under the supervision of the Federal Reserve Bank. Bank holding companies are subject to capital adequacy requirements of the Federal Reserve under the Bank Holding Company Act of 1956, as amended, and the regulations of the Federal Reserve. Heritage Bank and Central Valley Bank are federally insured institutions and thereby subject to the capital requirements established by the Federal Deposit Insurance Corporation (“FDIC”). The Federal Reserve requirements generally parallel the FDIC requirements. Failure to meet minimum capital requirements can initiate certain mandatory, and possibly additional discretionary, actions by regulators that, if undertaken, could have a direct material effect on the Company’s consolidated financial statements.
Pursuant to minimum capital requirements of the FDIC, Heritage Bank and Central Valley Bank are required to maintain a leverage ratio (capital to assets ratio) of 3% and risk-based capital ratios of Tier 1 capital and total capital (to total risk-weighted assets) of 4% and 8%, respectively. As of December 31, 2010 and December 31, 2009, Heritage Bank and Central Valley Bank were both classified as “well capitalized” institutions under the criteria established by the Federal Deposit Insurance Act. There are no conditions or events since that notification that management believes have changed the Bank’s classification as a well capitalized institution.
| Minimum Requirements |
Well- Capitalized Requirements |
Actual | ||||||||||||||||||||||
| $ | % | $ | % | $ | % | |||||||||||||||||||
| (Dollars in thousands) | ||||||||||||||||||||||||
| As of December 31, 2010: |
||||||||||||||||||||||||
| The Company consolidated |
||||||||||||||||||||||||
| Tier 1 leverage capital to average assets |
$ | 40,315 | 3 | % | $ | 67,192 | 5 | % | $ | 186,925 | 13.9 | % | ||||||||||||
| Tier 1 capital to risk-weighted assets |
37,020 | 4 | 55,530 | 6 | 186,925 | 20.2 | ||||||||||||||||||
| Total capital to risk-weighted assets |
74,040 | 8 | 92,550 | 10 | 198,635 | 21.5 | ||||||||||||||||||
| Heritage Bank |
||||||||||||||||||||||||
| Tier 1 leverage capital to average assets |
35,487 | 3 | 59,146 | 5 | 146,643 | 12.4 | ||||||||||||||||||
| Tier 1 capital to risk-weighted assets |
32,901 | 4 | 49,351 | 6 | 146,643 | 17.8 | ||||||||||||||||||
| Total capital to risk-weighted assets |
65,802 | 8 | 82,252 | 10 | 157,040 | 19.1 | ||||||||||||||||||
| Central Valley Bank |
||||||||||||||||||||||||
| Tier 1 leverage capital to average assets |
4,841 | 3 | 8,068 | 5 | 15,925 | 9.9 | ||||||||||||||||||
| Tier 1 capital to risk-weighted assets |
4,100 | 4 | 6,150 | 6 | 15,925 | 15.5 | ||||||||||||||||||
| Total capital to risk-weighted assets |
8,200 | 8 | 10,249 | 10 | 17,220 | 16.8 | ||||||||||||||||||
| As of December 31, 2009: |
||||||||||||||||||||||||
| The Company consolidated |
||||||||||||||||||||||||
| Tier 1 leverage capital to average assets |
$ | 30,276 | 3 | % | $ | 50,460 | 5 | % | $ | 145,354 | 14.6 | % | ||||||||||||
| Tier 1 capital to risk-weighted assets |
29,956 | 4 | 44,933 | 6 | 145,354 | 19.4 | ||||||||||||||||||
| Total capital to risk-weighted assets |
59,911 | 8 | 74,889 | 10 | 154,923 | 20.7 | ||||||||||||||||||
| Heritage Bank |
||||||||||||||||||||||||
| Tier 1 leverage capital to average assets |
25,709 | 3 | 42,848 | 5 | 100,751 | 11.8 | ||||||||||||||||||
| Tier 1 capital to risk-weighted assets |
25,851 | 4 | 38,776 | 6 | 100,751 | 15.6 | ||||||||||||||||||
| Total capital to risk-weighted assets |
51,701 | 8 | 64,627 | 10 | 109,024 | 16.9 | ||||||||||||||||||
| Central Valley Bank |
||||||||||||||||||||||||
| Tier 1 leverage capital to average assets |
4,545 | 3 | 7,575 | 5 | 13,762 | 9.1 | ||||||||||||||||||
| Tier 1 capital to risk-weighted assets |
4,075 | 4 | 6,113 | 6 | 13,762 | 13.5 | ||||||||||||||||||
| Total capital to risk-weighted assets |
8,151 | 8 | 10,188 | 10 | 15,048 | 14.8 | ||||||||||||||||||
F-47
Table of Contents
| (16) | Employee Benefit Plans |
Effective October 1, 1999 the Company combined three retirement plans, a money purchase pension plan, a 401k plan, and an employee stock ownership plan (ESOP) at Heritage Bank, and the 401(k) plan at Central Valley Bank into one plan called the Heritage Financial Corporation 401(k) Employee Stock Ownership Plan (“KSOP”). Effective April 1, 2002 the Company added three investment funds to the plan as well as changed the eligibility requirements to the plan. At this same time the Company approved an amendment of the plan to reflect certain provisions of the Economic Growth and Tax Relief Reconciliation Act of 2001 (“EGTRRA”). Effective July 1, 2008, the Company restated the plan to incorporate previously approved plan amendments, restate the Plan to formally comply with EGTRRA and to incorporate certain provisions of the Pension Protection Act of 2006. At this time certain plan eligibility, administration and contribution provisions were changed. In 2010, the Company amended the plan to comply with certain provisions of the Heroes Earnings Assistance and Relief Act of 2008 (“HEART”) and to address required provisions under IRS regulations regarding forfeitures in the ESOP. In 2010, the Company also amended the plan to provide certain service credit for vesting and contribution purposes to employees of Cowlitz and Pierce Commercial Bank at the time of the acquisition of the Bank assets from the FDIC.
The profit sharing portion of the KSOP is a defined contribution retirement plan. The plan provides a contribution to all eligible participants upon completion of one year of service, the attainment of 18 years of age, and employment on the last day of the year. It is the Company’s policy to fund plan costs as accrued. Employee vesting occurs over a period of six years, at which time they become fully vested.
The KSOP also maintains the Company’s salary savings 401(k) plan for its employees. All persons employed as of July 1, 1984 automatically participate in the plan. All employees hired after that date who are at least 18 years of age may participate in the plan the first of the month following thirty days of service. Employees who participate may contribute a portion of their salary, which is matched by the employer at 50% up to certain specified limits. Employee vesting in employer portions occurs over a period of six years for those contributions made after January 1, 2003. Employer contributions for the years ended December 31, 2010, 2009 and 2008 were $352,000, $237,000 and $309,000, respectively.
The third portion of the KSOP is the employee stock ownership plan (ESOP). Heritage Bank established for eligible employees the ESOP and related trust effective July 1, 1994, which became active upon the former mutual holding company’s conversion to a stock-based holding company in January 1995. The plan provides a contribution to all eligible participants upon completion of one year of service, the attainment of 18 years of age, and employment on the last day of the year. The ESOP is funded by employer contributions in cash or common stock. Employee vesting occurs over a period of six years.
In January 1998, the ESOP borrowed $1.3 million from the Company to purchase additional common stock of the Company. The loan will be repaid principally from the subsidiary bank’s contributions to the ESOP over a period of fifteen years. The interest rate on the loan is 8.5% per annum. ESOP compensation expense was $135,000, $113,000 and $145,000 for the years ended December 31, 2010, 2009 and 2008, respectively.
For the year ended December 31, 2010, the Company has allocated or committed to be released to the ESOP 9,257 earned shares and has 19,287 unearned, restricted shares remaining to be released. The fair value of unearned, restricted shares held by the ESOP trust was $268,000 at December 31, 2010.
Employment Agreements
The Company has entered into contracts with certain senior officers that provide benefits under certain conditions following termination without cause, and/or following a change of control of the Company.
F-48
Table of Contents
| (17) | Fair Value of Financial Instruments |
Because broadly traded markets do not exist for most of the Company’s financial instruments, the fair value calculations attempt to incorporate the effect of current market conditions at a specific time. These determinations are subjective in nature, involve uncertainties and matters of significant judgment and do not include tax ramifications; therefore, the results cannot be determined with precision, substantiated by comparison to independent markets and may not be realized in an actual sale or immediate settlement of the instruments. There may be inherent weaknesses in any calculation technique, and changes in the underlying assumptions used, including discount rates and estimates of future cash flows, could significantly affect the results. For all of these reasons, the aggregation of the fair value calculations presented herein do not represent, and should not be construed to represent, the underlying value of the Company.
(a) Cash on Hand and in Banks, Interest Earning Deposits and Federal Funds Sold
The fair value of financial instruments that are short-term or reprice frequently and that have little or no risk are considered to have a fair value equal to carrying value.
(b) Investment Securities Available for Sale and Held to Maturity
The fair value of all investment securities are based upon the assumptions market participants would use in pricing the security. Such assumptions include observable and unobservable inputs such as quoted market prices, dealer quotes and discounted cash flows.
(c) Federal Home Loan Bank stock
FHLB of Seattle stock is not publicly traded, however the recorded value of the stock holdings approximates the fair value, as the FHLB is required to pay par value upon re-acquiring this stock.
(d) Loans Receivable and Loans Held for Sale
Fair value is estimated using the Company’s lending rates that would have been offered at December 31, 2010 and December 31, 2009 for loans, which mirror the attributes of the loans with similar rate structures and average maturities. Commercial loans and construction loans, which are variable rate and short-term are reflected with fair values equal to carrying value. Impaired loans are measured on a loan by loan basis by either the present value of expected future discounted cash flows, the loan’s obtainable market price, or the market value (less selling costs) of the collateral if the loan is collateral dependent.
While these methodologies are permitted under U.S. Generally Accepted Accounting Principles or GAAP for this disclosure, the amounts derived are not intended to reflect an exit price of the asset.
(e) Deposits
For deposits with no contractual maturity, the fair value is equal to the carrying value. The fair value of fixed maturity deposits is based on discounted cash flows using the difference between the deposit rate and the rates currently offered by the Company for deposits of similar remaining maturities.
(f) Securities Sold Under Agreement to Repurchase
Securities sold under agreement to repurchase are short-term in nature, repricing on a daily basis. Fair value financial instruments that are short-term or reprice frequently and that have little or no risk are considered to have a fair value equal to carrying value.
F-49
Table of Contents
(g) Other Financial Instruments
The majority of our commitments to extend credit, standby letters of credit and commitments to sell mortgage loans carry current market interest rates if converted to loans, as such, carrying value is assumed to equal fair value.
The table below presents the carrying value amount of the Company’s financial instruments and their corresponding fair values.
This method of estimating fair value does not incorporate the exit-price concept of fair value prescribed by FASB ASC 820-10 and generally produces a higher fair value.
| December 31, 2010 | December 31, 2009 | |||||||||||||||
| Book Value |
Fair Value | Book Value |
Fair Value | |||||||||||||
| (In thousands) | ||||||||||||||||
| Financial Assets | ||||||||||||||||
| Cash on hand and in banks |
$ | 37,179 | $ | 37,179 | $ | 20,106 | $ | 20,106 | ||||||||
| Interest earning deposits |
129,822 | 129,822 | 87,125 | 87,125 | ||||||||||||
| Federal funds sold |
1,990 | 1,990 | — | — | ||||||||||||
| Investment securities available for sale |
125,175 | 125,175 | 90,736 | 90,736 | ||||||||||||
| Investment securities held to maturity |
13,768 | 14,290 | 13,636 | 13,645 | ||||||||||||
| Federal Home Loan Bank stock |
5,594 | 5,594 | 3,566 | 3,566 | ||||||||||||
| Loans receivable and loans held for sale, net of allowance |
980,485 | 989,968 | 746,908 | 761,756 | ||||||||||||
| Financial Liabilities | ||||||||||||||||
| Deposits: |
||||||||||||||||
| Savings, money market and demand |
733,335 | 733,335 | 536,215 | 536,215 | ||||||||||||
| Time certificates |
402,941 | 404,676 | 303,913 | 304,542 | ||||||||||||
| Total deposits |
$ | 1,136,276 | $ | 1,138,011 | $ | 840,128 | $ | 840,757 | ||||||||
| Securities sold under agreement to repurchase |
$ | 19,027 | $ | 19,027 | $ | 10,440 | $ | 10,440 | ||||||||
We measure the financial assets and financial liabilities at fair value in three levels, based on the markets in which the assets and liabilities are traded and the reliability of the assumptions used to determine fair value. These levels are:
| • | Level 1—Valuations for assets and liabilities traded in active exchange markets, or interest in open-end mutual funds that allow the Company to sell its ownership interest back to the fund at net asset value (“NAV”) on a daily basis. Valuations are obtained from readily available pricing sources for market transactions involving identical assets, liabilities, or funds. |
| • | Level 2—Valuations for assets and liabilities traded in less active dealer, or broker markets, such as quoted prices for similar assets or liabilities or quoted prices in markets that are not active. Level 2 includes U.S. Treasury, U.S. government and agency debt securities, and mortgage-backed securities. Valuations are usually obtained from third party pricing services for comparable assets or liabilities. |
| • | Level 3—Valuations for assets and liabilities that are derived from other valuation methodologies, such as option pricing models, discounted cash flow models and similar techniques, and not based on market exchange, dealer, or broker traded transactions. Level 3 valuations incorporate certain assumptions and projections in determining the fair value assigned to such assets or liabilities. |
F-50
Table of Contents
The following table summarizes the balances of assets and liabilities measured at fair value on a recurring basis at December 31, 2010.
| Total | Level 1 | Level 2 | Level 3 | |||||||||||||
| (In thousands) | ||||||||||||||||
| Investment Securities Available for Sale: |
||||||||||||||||
| U.S. Treasury and U.S. Government agencies |
$ | 41,429 | $ | — | $ | 41,429 | $ | — | ||||||||
| Municipal securities |
20,213 | — | 20,213 | — | ||||||||||||
| Corporate securities |
10,276 | — | 10,276 | — | ||||||||||||
| Mortgage backed securities and collateralized mortgage obligations: |
||||||||||||||||
| U.S Government agencies |
53,257 | — | 53,257 | — | ||||||||||||
| Total |
$ | 125,175 | $ | — | $ | 125,175 | $ | — | ||||||||
The Company may be required, from time to time, to measure certain assets at fair value on a nonrecurring basis. These adjustments to fair value usually result from application of lower-of-cost-or-market accounting or write-downs of individual assets. For assets measured at fair value on a nonrecurring basis during the years ended December 31, 2010 that were still held in the balance sheet at the end of such periods, the following tables provide the level of valuation assumptions used to determine each adjustment and the carrying value of the related assets at the dates indicated.
| Fair Value at December 31, 2010 | Twelve Months Ended December 31, 2010 |
|||||||||||||||||||
| Total | Level 1 | Level 2 | Level 3 | Total Losses | ||||||||||||||||
| (In thousands) | ||||||||||||||||||||
| Loans receivable(1) |
$ | 13,486 | $ | — | $ | — | $ | 13,486 | $ | 6,118 | ||||||||||
| Investment securities held to maturity(2): |
||||||||||||||||||||
| Mortgage back securities and collateralized mortgage obligations: |
||||||||||||||||||||
| Private residential collateralized mortgage obligations |
96 | — | — | 96 | 298 | |||||||||||||||
| Other real estate owned(3) |
3,030 | — | — | 3,030 | 264 | |||||||||||||||
| Total |
$ | 16,612 | $ | — | $ | — | $ | 16,612 | $ | 6,680 | ||||||||||
| (1) | At December 31, 2010, a specific reserve of $4.6 million was recorded on loans receivable identified as impaired. Impairment losses recorded were calculated based on the fair value of the collateral, less the costs to sell. Fair value of the loans’ collateral is determined by an appraisal or independent valuation, which is then adjusted for the cost related to liquidation of the collateral. |
| (2) | Investment securities held to maturity with a carrying amount of $394,000 were written down to their fair value of $76,000 resulting in an impairment charge of $298,000 to noninterest expense for the twelve months ended December 31, 2010. Impairment losses recorded were determined using cash flow models. We estimated expected future cash flows of the securities by estimating the expected future cash flows of the underlying collateral and applying those collateral cash flows, together with any credit enhancements such as subordination interests owned by third parties, to the security. The expected future cash flows of the underlying collateral are determined using the remaining contractual cash flows adjusted for future expected credit losses (which considers current delinquencies and nonperforming assets, future expected default rates and collateral value by vintage and geographic region) and prepayments. The expected cash flows of the security are then discounted at the interest rate used to recognize interest income on the security to arrive at a present value amount. |
F-51
Table of Contents
| (3) | Loans with a carrying amount of $4.4 million were written down to their fair value of $3.0 million when they were transferred to other real estate owned during the twelve months ended December 31, 2010. The resulting losses, to the extent they impacted the provision for loan losses for the twelve months ended December 31, 2010, are included total losses for loans receivable for the twelve months ended December 31, 2010 shown above. |
The following table summarizes the balances of assets and liabilities measured at fair value on a recurring basis at December 31, 2009.
| Total | Level 1 | Level 2 | Level 3 | |||||||||||||
| (In thousands) | ||||||||||||||||
| Investment Securities Available for Sale: |
||||||||||||||||
| U.S. Treasury and U.S. Government agencies |
$ | 22,958 | $ | — | $ | 22,958 | $ | — | ||||||||
| Municipal securities |
7,460 | — | 7,460 | — | ||||||||||||
| Corporate securities |
10,176 | — | 10,176 | — | ||||||||||||
| Mortgage backed securities and collateralized mortgage obligations: |
||||||||||||||||
| U.S Government agencies |
50,142 | — | 50,142 | — | ||||||||||||
| Total |
$ | 90,736 | $ | — | $ | 90,736 | $ | — | ||||||||
The following table summarizes the balances of assets and liabilities measured at fair value on a nonrecurring basis at December 31, 2009, and the total losses resulting from these fair value adjustments for the year ended December 31, 2009.
| Fair Value at December 31, 2009 | Twelve Months Ended December 31, 2009 |
|||||||||||||||||||
| Total | Level 1 | Level 2 | Level 3 | Total Losses | ||||||||||||||||
| (In thousands) | ||||||||||||||||||||
| Loans receivable(1) |
$ | 12,758 | $ | — | $ | — | $ | 12,758 | $ | 15,904 | ||||||||||
| Investment securities held to maturity(2): |
||||||||||||||||||||
| Mortgage back securities and collateralized mortgage obligations: |
||||||||||||||||||||
| Private residential collateralized mortgage obligations |
1,078 | — | — | 1,078 | 500 | |||||||||||||||
| Other real estate owned(3) |
704 | — | — | 704 | 126 | |||||||||||||||
| Total |
$ | 14,540 | $ | — | $ | — | $ | 14,540 | $ | 16,530 | ||||||||||
| (1) | At December 31, 2009, a specific reserve of $7.4 million was recorded on loans receivable identified as impaired. Impairment losses recorded were calculated based on the fair value of the collateral, less the costs to sell. Fair value of the loan’s collateral is determined by an appraisal or independent valuation, which is then adjusted for the cost related to liquidation of the collateral. |
| (2) | Investment securities held to maturity with a carrying amount of $2.4 million were written down to their fair value of $1.1 million resulting in an impairment charge of $500,000 to noninterest expense for the year ended December 31, 2009. |
| (3) | Other real estate owned with a carrying amount of $830,000 were written down to their fair value of $704,000, resulting in impairment charge $126,000 to noninterest expense. Impairment losses recorded were calculated based on the fair value of the collateral, less the costs to sell. The fair value of the collateral is generally based on estimated market prices from independently prepared appraisals or negotiated sales prices with potential buyers. When a current appraised value is not available or management determines the fair value of the collateral is further impaired below the appraised value and there is no observable market |
F-52
Table of Contents
| price, such valuation inputs result in a fair value measurement that is categorized as a Level 3 measurement. The other real estate owned losses shown above are write-downs based on either an accepted purchase offer by an independent third party received after foreclosure or lowered listing prices based on management’s expectation of local market conditions. |
| (18) | Contingencies |
The Company is involved in numerous business transactions, which, in some cases, depend on regulatory determination as to compliance with rules and regulations. Also, the Company has certain litigation and negotiations in progress. All such matters are attributable to activities arising from normal operations. In the opinion of management, after review with legal counsel, the eventual outcome of the aforementioned matters is unlikely to have a materially adverse effect on the Company’s consolidated financial statements or its financial position.
F-53
Table of Contents
| (19) | Heritage Financial Corporation (Parent Company Only) |
Following is the condensed financial statements of the Parent Company.
HERITAGE FINANCIAL CORPORATION
(PARENT COMPANY ONLY)
Condensed Statements of Financial Condition
| December 31, | ||||||||
| 2010 | 2009 | |||||||
| (In thousands) | ||||||||
| ASSETS | ||||||||
| Cash and interest earning deposits |
$ | 23,939 | $ | 29,893 | ||||
| Loans receivable—ESOP |
297 | 423 | ||||||
| Investment in subsidiary banks |
177,924 | 127,662 | ||||||
| Other assets |
483 | 746 | ||||||
| $ | 202,643 | $ | 158,724 | |||||
| LIABILITIES AND STOCKHOLDERS’ EQUITY | ||||||||
| Other liabilities |
364 | 226 | ||||||
| Total stockholders’ equity |
202,279 | 158,498 | ||||||
| $ | 202,643 | $ | 158,724 | |||||
HERITAGE FINANCIAL CORPORATION
(PARENT COMPANY ONLY)
Condensed Statements of Operations
| Years Ended December 31, | ||||||||||||
| 2010 | 2009 | 2008 | ||||||||||
| (In thousands) | ||||||||||||
| Interest income: |
||||||||||||
| Interest earning deposits |
$ | 210 | $ | 163 | $ | 33 | ||||||
| ESOP loan |
31 | 42 | 51 | |||||||||
| Other income: |
||||||||||||
| Dividends from subsidiaries |
— | 750 | 6,350 | |||||||||
| Equity in undistributed income of subsidiaries |
14,661 | 773 | 1,087 | |||||||||
| Total income |
14,902 | 1,728 | 7,521 | |||||||||
| Interest expense |
— | — | 96 | |||||||||
| Other expenses |
2,134 | 1,608 | 1,581 | |||||||||
| Total expense |
2,134 | 1,608 | 1,677 | |||||||||
| Income before Federal income taxes |
12,768 | 120 | 5,844 | |||||||||
| Benefit for Federal income taxes |
(586 | ) | (461 | ) | (507 | ) | ||||||
| Net income |
$ | 13,354 | $ | 581 | $ | 6,351 | ||||||
| Dividend accrued and discount accreted on preferred shares |
1,686 | 1,320 | 143 | |||||||||
| Net income (loss) applicable to common shareholders |
$ | 11,668 | $ | (739 | ) | $ | 6,208 | |||||
F-54
Table of Contents
HERITAGE FINANCIAL CORPORATION
(PARENT COMPANY ONLY)
Condensed Statements of Cash Flows
| Years Ended December 31, | ||||||||||||
| 2010 | 2009 | 2008 | ||||||||||
| (In thousands) | ||||||||||||
| Cash flows from operating activities: |
||||||||||||
| Net income |
$ | 13,354 | $ | 581 | $ | 6,351 | ||||||
| Adjustments to reconcile net income to net cash provided by operating activities: |
||||||||||||
| Equity in undistributed income of subsidiaries |
(14,661 | ) | (1,674 | ) | (7,437 | ) | ||||||
| Dividends from subsidiaries |
— | 750 | 6,350 | |||||||||
| Recognition of compensation related to ESOP shares and share based payment |
508 | 406 | 507 | |||||||||
| Stock option compensation expense |
204 | 143 | 178 | |||||||||
| Net change in other assets and liabilities |
400 | 13 | (1,564 | ) | ||||||||
| Net cash (used) in provided by operating activities |
(195 | ) | 219 | 4,385 | ||||||||
| Cash flows from investing activities: |
||||||||||||
| ESOP loan principal repayments |
126 | 114 | 106 | |||||||||
| Investment in subsidiaries |
(35,000 | ) | (34,000 | ) | (5,000 | ) | ||||||
| Net used in provided by investing activities |
(34,874 | ) | (33,886 | ) | (4,894 | ) | ||||||
| Cash flows from financing activities: |
||||||||||||
| Net decrease in short-term borrowed funds |
— | — | (1,951 | ) | ||||||||
| Proceeds from issuance of preferred stock and warrant |
— | — | 24,000 | |||||||||
| Repurchase of preferred stock |
(24,000 | ) | — | — | ||||||||
| Proceeds from common stock issuance, net of estimated expenses |
54,086 | 46,572 | — | |||||||||
| Preferred cash dividends paid |
(1,173 | ) | (1,184 | ) | — | |||||||
| Common cash dividends paid |
— | (670 | ) | (3,748 | ) | |||||||
| Exercise of stock options |
202 | 39 | 251 | |||||||||
| Net cash provided by in financing activities |
29,115 | 44,757 | 18,552 | |||||||||
| Net (decrease) increase in cash and cash equivalents |
(5,954 | ) | 11,090 | 18,043 | ||||||||
| Cash and cash equivalents at beginning of year |
29,893 | 18,803 | 760 | |||||||||
| Cash and cash equivalents at end of year |
$ | 23,939 | $ | 29,893 | $ | 18,803 | ||||||
F-55
Table of Contents
(20) Selected Quarterly Financial Data (Unaudited)
Results of operations on a quarterly basis were as follows:
| Year Ended December 31, 2010 | ||||||||||||||||
| First Quarter |
Second Quarter |
Third Quarter |
Fourth Quarter |
|||||||||||||
| (Dollars in thousands) | ||||||||||||||||
| Interest income |
$ | 12,848 | $ | 12,716 | $ | 14,940 | $ | 19,016 | ||||||||
| Interest expense |
2,183 | 1,950 | 2,261 | 2,116 | ||||||||||||
| Net interest income |
10,665 | 10,766 | 12,679 | 16,900 | ||||||||||||
| Provision for loan losses |
3,750 | 3,150 | 2,195 | 2,895 | ||||||||||||
| Net interest income after provision for loan losses |
6,915 | 7,616 | 10,484 | 14,005 | ||||||||||||
| Noninterest income |
2,156 | 2,136 | 2,913 | 14,293 | ||||||||||||
| Noninterest expense |
8,075 | 8,474 | 10,331 | 13,849 | ||||||||||||
| (Loss) income before provision for income taxes |
996 | 1,278 | 3,066 | 14,449 | ||||||||||||
| Federal income tax expense |
300 | 423 | 1,024 | 4,689 | ||||||||||||
| Net (loss) income |
$ | 696 | $ | 855 | $ | 2,042 | $ | 9,760 | ||||||||
| Net (loss) income available to common shareholders |
$ | 365 | $ | 523 | $ | 1,710 | $ | 9,069 | ||||||||
| Basic (loss) earnings per common share |
$ | 0.03 | $ | 0.05 | $ | 0.16 | $ | 0.77 | ||||||||
| Diluted (loss) earnings per common share |
0.03 | 0.05 | 0.15 | 0.77 | ||||||||||||
| Cash dividends declared on common stock |
— | — | — | — | ||||||||||||
| Year Ended December 31, 2009 | ||||||||||||||||
| First Quarter |
Second Quarter |
Third Quarter |
Fourth Quarter |
|||||||||||||
| (Dollars in thousands) | ||||||||||||||||
| Interest income |
$ | 13,441 | $ | 13,309 | $ | 13,304 | $ | 13,287 | ||||||||
| Interest expense |
3,363 | 2,974 | 2,775 | 2,533 | ||||||||||||
| Net interest income |
10,078 | 10,335 | 10,529 | 10,754 | ||||||||||||
| Provision for loan losses |
5,250 | 4,540 | 4,650 | 4,950 | ||||||||||||
| Net interest income after provision for loan losses |
4,828 | 5,795 | 5,879 | 5,804 | ||||||||||||
| Noninterest income |
2,037 | 2,272 | 2,105 | 2,253 | ||||||||||||
| Noninterest expense |
7,880 | 8,026 | 7,612 | 7,377 | ||||||||||||
| Income before provision for income taxes |
(1,015 | ) | 41 | 372 | 680 | |||||||||||
| Federal income tax expense |
(421 | ) | (50 | ) | 60 | (92 | ) | |||||||||
| Net income (loss) |
$ | (594 | ) | $ | 91 | $ | 312 | $ | 772 | |||||||
| Net income (loss) available to common shareholders |
$ | (923 | ) | $ | (239 | ) | $ | (18 | ) | $ | 441 | |||||
| Basic earnings (loss) per common share |
$ | (0.14 | ) | $ | (0.04 | ) | $ | (0.00 | ) | $ | 0.04 | |||||
| Diluted earnings (loss) per common share |
(0.14 | ) | (0.04 | ) | (0.00 | ) | 0.04 | |||||||||
| Cash dividends declared on common stock |
0.10 | — | — | — | ||||||||||||
(21) Subsequent Events
Management has reviewed events occurring through the date the financial statements were issued.
F-56
Table of Contents
INDEX TO EXHIBITS
| Exhibit |
||
| 3.1 | Articles of Incorporation(1) | |
| 3.2 | Bylaws of the Company(2) | |
| 4.1 | Form of Certificate for Preferred Stock(3) | |
| 4.2 | Warrant for purchase(3) | |
| 10.1 | 1998 Stock Option and Restricted Stock Award Plan(4) | |
| 10.6 | 1997 Stock Option and Restricted Stock Award Plan(5) | |
| 10.10 | 2002 Incentive Stock Option Plan, Director Nonqualified Stock Option Plan, and Restricted Stock Option Plan(6) | |
| 10.12 | 2006 Incentive Stock Option Plan, Director Nonqualified Stock Option Plan, and Restricted Stock Option Plan(7) | |
| 10.13 | Employment Agreement between the Company and Brian L. Vance, effective October 1, 2006 as amended and restated in February 2007(8) | |
| 10.14 | Employment Agreement between Central Valley Bank and D. Michael Broadhead, effective April 1, 2007(8) | |
| 10.16 | Severance Agreement between Heritage Bank and Gregory D. Patjens, effective April 1, 2007(8) | |
| 10.17 | Severance Agreement between Heritage Bank and Donald J. Hinson, effective August 1, 2007(9) | |
| 10.18 | Letter Agreement between Heritage Financial Corporation and the United States Department of the Treasury dated November 21, 2008 in connection with the Company’s participation in the Troubled Asset Relief Program Capital Purchase Program, and related documents(3) | |
| 10.19 | Letter of Understanding between Heritage Financial Corporation and Donald V. Rhodes dated August 18, 2009(10) | |
| 10.20 | Annual Incentive Compensation Plan(14) | |
| 10.21 | Compensation Modification Agreements between Heritage Financial Corporation and Brian L. Vance, Donald V. Rhodes, Donald J. Hinson, D. Michael Broadhead, Gregory Patjens and Dave Spurling dated September 29, 2009(11) | |
| 10.22 | 2010 Omnibus Equity Plan(13) | |
| 14.0 | Code of Ethics and Conduct Policy(12) | |
| 21.0 | Subsidiaries of the Company | |
| 23.0 | Consent of Independent Registered Public Accounting Firm | |
| 24.0 | Power of Attorney | |
| 31.1 | Certification of Principal Executive Officer pursuant to Section 302 of the Sarbanes-Oxley Act of 2002 | |
| 31.2 | Certification of Principal Financial Officer pursuant to Section 302 of the Sarbanes-Oxley Act of 2002 | |
| 32.1 | Certification of Principal Financial Officer and Principal Financial Officer pursuant to Section 906 of the Sarbanes-Oxley Act of 2002 | |
| 99.1 | Subsequent Year Certification of the Principal Executive Officer pursuant to Section 111(b) of the Emergency Economic Stabilization Act of 2008 | |
| 99.2 | Subsequent Year Certification of the Principal Financial Officer pursuant to Section 111(b) of the Emergency Economic Stabilization Act of 2008 | |
Table of Contents
| (1) | Incorporated by reference to the Registration Statement on Form S-1 (Reg. No. 333-35573) declared effective on November 12, 1997; as amended, said Amendment being incorporated by reference to the Amendment to the Articles of Incorporation of Heritage Financial Corporation filed with the Current Report on Form 8-K dated November 25, 2008. |
| (2) | Incorporated by reference to the Current Report on Form 8-K dated November 29, 2007. |
| (3) | Incorporated by reference to the Current Report on Form 8-K dated November 25, 2008. |
| (4) | Incorporated by reference to the Registration Statement on Form S-8 (Reg. No. 333-71415). |
| (5) | Incorporated by reference to the Registration Statement on Form S-8 (Reg. No. 333-57513). |
| (6) | Incorporated by reference to the Registration Statements on Form S-8 (Reg. No. 333-88980; 333-88982; 333-88976). |
| (7) | Incorporated by reference to the Registration Statements on Form S-8 (Reg. No. 333-134473; 333-134474; 333-134475). |
| (8) | Incorporated by reference to the Quarterly Report on Form 10-Q dated May 1, 2007. |
| (9) | Incorporated by reference to the Quarterly Report on Form 10-Q dated November 2, 2007. |
| (10) | Incorporated by reference to the Current Report on Form 8-K dated August 20, 2009. |
| (11) | Incorporated by reference to the Current Report on Form 8-K dated October 2, 2009. |
| (12) | Registrant elects to satisfy Regulation S-K §229.406(c) by posting its Code of Ethics on its website at www.HF-WA.com in the section titled Investor Information: Corporate Governance. |
| (13) | Incorporated by reference to the Registration Statement on Form S-8 (Reg. No. 33-167146). |
| (14) | Incorporated by reference to the Yearly Report on Form 10-K dated March 2, 2010. |
EXHIBIT INDEX
| Exhibit No. |
Description of Exhibit | |
| 21.0 | Subsidiaries of the Company | |
| 23.0 | Consent of Independent Registered Public Accounting Firm | |
| 24.0 | Power of Attorney | |
| 31.1 | Certification of Principal Executive Officer Pursuant to Section 302 of the Sarbanes-Oxley Act of 2002 | |
| 31.2 | Certification of Principal Financial Officer Pursuant to Section 302 of the Sarbanes-Oxley Act of 2002 | |
| 32.1 | Certification of Principal Executive Officer and Principal Financial Officer pursuant to Section 906 of the Sarbanes-Oxley Act of 2002 | |
| 99.1 | Subsequent Year Certification of the Principal Executive Officer pursuant to Section 111(b) of the Emergency Economic Stabilization Act of 2008 | |
| 99.2 | Subsequent Year Certification of the Principal Financial Officer pursuant to Section 111(b) of the Emergency Economic Stabilization Act of 2008 | |