Attached files
Table of Contents
UNITED STATES
SECURITIES AND EXCHANGE COMMISSION
Washington, D.C. 20549
Form 10-K
(Mark One)
| ☑ ANNUAL REPORT PURSUANT TO SECTION 13 OR 15(d) OF THE SECURITIES EXCHANGE ACT OF 1934 |
| For the fiscal year ended May 31, 2017 |
| or |
| ☐ TRANSITION REPORT PURSUANT TO SECTION 13 OR 15(d) OF THE SECURITIES EXCHANGE ACT OF 1934 |
| For the transition period from to |
Commission File Number 1-8399
WORTHINGTON INDUSTRIES, INC.
(Exact Name of Registrant as Specified in its Charter)
| Ohio |
31-1189815 | |
| (State or Other Jurisdiction of Incorporation or Organization) | (I.R.S. Employer Identification No.) | |
| 200 Old Wilson Bridge Road, Columbus, Ohio |
43085 | |
| (Address of Principal Executive Offices) | (Zip Code) | |
| Registrant’s telephone number, including area code: |
(614) 438-3210 | |
Securities registered pursuant to Section 12(b) of the Act:
| Title of Each Class |
Name of Each Exchange on Which Registered | |
| Common Shares, Without Par Value |
New York Stock Exchange |
Securities registered pursuant to Section 12(g) of the Act: None
| Indicate by check mark if the Registrant is a well-known seasoned issuer, as defined in Rule 405 of the Securities Act. |
Yes ☑ No ☐ |
| Indicate by check mark if the Registrant is not required to file reports pursuant to Section 13 or Section 15(d) of the Act. |
Yes ☐ No ☑ |
Indicate by check mark whether the Registrant (1) has filed all reports required to be filed by Section 13 or 15(d) of the Securities Exchange Act of 1934 during the preceding 12 months (or for such shorter period that the Registrant was required to file such reports), and (2) has been subject to such filing requirements for the past 90 days. Yes ☑ No ☐
Indicate by check mark whether the Registrant has submitted electronically and posted on its corporate Web site, if any, every Interactive Data File required to be submitted and posted pursuant to Rule 405 of Regulation S-T (§232.405 of this chapter) during the preceding 12 months (or for such shorter period that the Registrant was required to submit and post such files). Yes ☑ No ☐
Indicate by check mark if disclosure of delinquent filers pursuant to Item 405 of Regulation S-K (§229.405 of this chapter) is not contained herein, and will not be contained, to the best of Registrant’s knowledge, in definitive proxy or information statements incorporated by reference in Part III of this Form 10-K or any amendment to this Form 10-K. ☐
Indicate by check mark whether the Registrant is a large accelerated filer, an accelerated filer, a non-accelerated filer, smaller reporting company, or an emerging growth company. See the definitions of “large accelerated filer,” “accelerated filer,” “smaller reporting company,” and “emerging growth company” in Rule 12b-2 of the Exchange Act.
Large accelerated filer ☑ Accelerated filer ☐ Non-accelerated filer ☐ Smaller reporting company ☐ Emerging growth company ☐
(Do not check if a smaller reporting company)
If an emerging growth company, indicate by check mark if the Registrant has elected not to use the extended transition period for complying with any new or revised financial accounting standards provided pursuant to Section 13(a) of the Exchange Act. ☐
Indicate by check mark whether the Registrant is a shell company (as defined in Rule 12b-2 of the Act). Yes ☐ No ☑
The aggregate market value of the Common Shares (the only common equity of the Registrant) held by non-affiliates computed by reference to the closing price on the New York Stock Exchange on November 30, 2016, the last business day of the Registrant’s most recently completed second fiscal quarter, was $2,399,439,213. For this purpose, executive officers and directors of the Registrant are considered affiliates.
Indicate the number of shares outstanding of each of the Registrant’s classes of common stock, as of the latest practicable date. On July 19, 2017, the number of Common Shares issued and outstanding was 63,250,653.
DOCUMENT INCORPORATED BY REFERENCE:
Selected portions of the Registrant’s definitive Proxy Statement to be furnished to shareholders of the Registrant in connection with the Annual Meeting of Shareholders to be held on September 27, 2017, are incorporated by reference into Part III of this Annual Report on Form 10-K to the extent provided herein.
Table of Contents
| ii | ||||||
| Item 1. |
1 | |||||
| Item 1A. |
10 | |||||
| Item 1B. |
19 | |||||
| Item 2. |
20 | |||||
| Item 3. |
21 | |||||
| Item 4. |
22 | |||||
| Supplemental Item. |
22 | |||||
| Item 5. |
24 | |||||
| Item 6. |
27 | |||||
| Item 7. |
Management’s Discussion and Analysis of Financial Condition and Results of Operations |
28 | ||||
| Item 7A. |
54 | |||||
| Item 8. |
56 | |||||
| Item 9. |
Changes in and Disagreements with Accountants on Accounting and Financial Disclosure |
106 | ||||
| Item 9A. |
106 | |||||
| Item 9B. |
109 | |||||
|
|
||||||
| Item 10. |
110 | |||||
| Item 11. |
111 | |||||
| Item 12. |
Security Ownership of Certain Beneficial Owners and Management and Related Stockholder Matters |
111 | ||||
| Item 13. |
Certain Relationships and Related Transactions, and Director Independence |
111 | ||||
| Item 14. |
112 | |||||
| Item 15. |
113 | |||||
| 114 | ||||||
| E-1 | ||||||
i
Table of Contents
Selected statements contained in this Annual Report on Form 10-K, including, without limitation, in “PART I – Item 1. – Business” and “PART II – Item 7. – Management’s Discussion and Analysis of Financial Condition and Results of Operations,” constitute “forward-looking statements” as that term is used in the Private Securities Litigation Reform Act of 1995 (the “Act”). Forward-looking statements reflect our current expectations, estimates or projections concerning future results or events. These statements are often identified by the use of forward-looking words or phrases such as “believe,” “expect,” “anticipate,” “may,” “could,” “intend,” “estimate,” “plan,” “foresee,” “likely,” “will,” “should,” or other similar words or phrases. These forward-looking statements include, without limitation, statements relating to:
| • | outlook, strategy or business plans; |
| • | future or expected growth, growth potential, forward momentum, performance, competitive position, sales, volumes, cash flows, earnings, balance sheet strengths, debt, financial condition or other financial measures; |
| • | pricing trends for raw materials and finished goods and the impact of pricing changes; |
| • | demand trends for us or our markets; |
| • | additions to product lines and opportunities to participate in new markets; |
| • | expected benefits from Transformation and innovation efforts and the ability to improve performance and competitive position at our operations; |
| • | anticipated working capital needs, capital expenditures and asset sales; |
| • | anticipated improvements and efficiencies in costs, operations, sales, inventory management, sourcing and the supply chain and the results thereof; |
| • | projected profitability potential; |
| • | the ability to successfully integrate AMTROL and the expected benefits, costs and results from the acquisition of AMTROL; |
| • | the ability to make acquisitions and the projected timing, results, benefits, costs, charges and expenditures related to acquisitions, newly-created joint ventures, headcount reductions and facility dispositions, shutdowns and consolidations; |
| • | projected capacity and the alignment of operations with demand; |
| • | the ability to operate profitably and generate cash in down markets; |
| • | the ability to maintain margins and capture and maintain market share and to develop or take advantage of future opportunities, customer initiatives, new businesses, new products and new markets; |
| • | expectations for Company and customer inventories, jobs and orders; |
| • | expectations for the economy and markets or improvements therein; |
| • | expectations for generating improving and sustainable earnings, earnings potential, margins or shareholder value; |
| • | effects of judicial rulings; and |
| • | other non-historical matters. |
Because they are based on beliefs, estimates and assumptions, forward-looking statements are inherently subject to risks and uncertainties that could cause actual results to differ materially from those projected. Any number of factors could affect actual results, including, without limitation, those that follow:
| • | the effect of national, regional and global economic conditions generally and within major product markets, including a recurrent slowing economy; |
| • | the effect of conditions in national and worldwide financial markets; |
| • | lower oil prices as a factor in demand for products; |
| • | product demand and pricing; |
| • | changes in product mix, product substitution and market acceptance of our products; |
| • | fluctuations in the pricing, quality or availability of raw materials (particularly steel), supplies, transportation, utilities and other items required by operations; |
| • | effects of facility closures and the consolidation of operations; |
ii
Table of Contents
| • | the effect of financial difficulties, consolidation and other changes within the steel, automotive, construction, oil and gas, and other industries in which we participate; |
| • | failure to maintain appropriate levels of inventories; |
| • | financial difficulties (including bankruptcy filings) of original equipment manufacturers, end-users and customers, suppliers, joint venture partners and others with whom we do business; |
| • | the ability to realize targeted expense reductions from headcount reductions, facility closures and other cost reduction efforts; |
| • | the ability to realize cost savings and operational, sales and sourcing improvements and efficiencies, and other expected benefits from Transformation initiatives, on a timely basis; |
| • | the overall success of, and the ability to integrate, newly-acquired businesses and joint ventures, maintain and develop their customers, and achieve synergies and other expected benefits and cost savings therefrom; |
| • | capacity levels and efficiencies, within facilities, within major product markets and within the industries as a whole; |
| • | the effect of disruption in the business of suppliers, customers, facilities and shipping operations due to adverse weather, casualty events, equipment breakdowns, civil unrest, international conflicts, terrorist activities or other causes; |
| • | changes in customer demand, inventories, spending patterns, product choices, and supplier choices; |
| • | risks associated with doing business internationally, including economic, political and social instability, foreign currency exchange rate exposure and the acceptance of our products in global markets; |
| • | the ability to improve and maintain processes and business practices to keep pace with the economic, competitive and technological environment; |
| • | the outcome of adverse claims experience with respect to workers’ compensation, product recalls or product liability, casualty events or other matters; |
| • | deviation of actual results from estimates and/or assumptions used by us in the application of our significant accounting policies; |
| • | level of imports and import prices in our markets; |
| • | the impact of judicial rulings and governmental regulations, both in the United States and abroad, including those adopted by the United States Securities and Exchange Commission and other governmental agencies as contemplated by the Dodd-Frank Wall Street Reform and Consumer Protection Act of 2010; |
| • | the effect of healthcare laws in the United States and potential changes for such laws which may increase our healthcare and other costs and negatively impact our operations and financial results; |
| • | cyber security risks; and |
| • | other risks described from time to time in the filings of Worthington Industries, Inc. with the United States Securities and Exchange Commission, including those described in “PART I – Item 1A. – Risk Factors” of this Annual Report on Form 10-K. |
We note these factors for investors as contemplated by the Act. It is impossible to predict or identify all potential risk factors. Consequently, you should not consider the foregoing list to be a complete set of all potential risks and uncertainties. Any forward-looking statements in this Annual Report on Form 10-K are based on current information as of the date of this Annual Report on Form 10-K, and we assume no obligation to correct or update any such statements in the future, except as required by applicable law.
iii
Table of Contents
General Overview
Worthington Industries, Inc. is a corporation formed under the laws of the State of Ohio (individually, the “Registrant” or “Worthington Industries” or, collectively with the subsidiaries of Worthington Industries, Inc., “we,” “our,” “Worthington” or the “Company”). Founded in 1955, Worthington is primarily a diversified metals manufacturing company, focused on value-added steel processing and manufactured metal products. Our manufactured metal products include: pressure cylinders for liquefied petroleum gas (“LPG”), compressed natural gas (“CNG”), oxygen, refrigerant and other industrial gas storage; hand torches and filled hand torch cylinders; propane-filled camping cylinders; helium-filled balloon kits; steel and fiberglass tanks and processing equipment primarily for the oil and gas industry; cryogenic pressure vessels for liquefied natural gas (“LNG”) and other gas storage applications; engineered cabs and operator stations and cab components; and, through our joint ventures, suspension grid systems for concealed and lay-in panel ceilings; laser welded blanks; light gauge steel framing for commercial and residential construction; and current and past model automotive service stampings.
Worthington is headquartered at 200 Old Wilson Bridge Road, Columbus, Ohio 43085, telephone (614) 438-3210. The common shares of Worthington Industries are traded on the New York Stock Exchange under the symbol WOR.
Worthington Industries maintains an Internet web site at www.worthingtonindustries.com. This uniform resource locator, or URL, is an inactive textual reference only and is not intended to incorporate Worthington Industries’ web site into this Annual Report on Form 10-K. Worthington Industries’ Annual Reports on Form 10-K, Quarterly Reports on Form 10-Q, Current Reports on Form 8-K and amendments to those reports, filed or furnished pursuant to Section 13(a) or 15(d) of the Securities Exchange Act of 1934, as amended (the “Exchange Act”), as well as Worthington Industries’ definitive annual meeting proxy materials filed pursuant to Section 14 of the Exchange Act, are available free of charge, on or through the Worthington Industries web site, as soon as reasonably practicable after such material is electronically filed with, or furnished to, the Securities and Exchange Commission (the “SEC”).
Segments
As of May 31, 2017, we, together with our unconsolidated affiliates, operated 80 manufacturing facilities in 24 states and 11 countries. Thirty of these facilities are operated by wholly-owned and consolidated subsidiaries of the Company. The remaining facilities are operated by our consolidated and unconsolidated joint ventures.
Our operations are managed principally on a products and services basis and are comprised of three primary operating segments which correspond with our reportable business segments: Steel Processing; Pressure Cylinders; and Engineered Cabs. The Steel Processing operating segment consists of the Worthington Steel business unit (“Worthington Steel”) which operates eight manufacturing facilities (seven of which we own); and three consolidated joint ventures: Spartan Steel Coating, LLC (“Spartan”), which operates a cold-rolled, hot-dipped galvanizing line in Monroe, Michigan; TWB Company, L.L.C. (“TWB”), which operates nine laser welded blank facilities and is headquartered in Monroe, Michigan; and Worthington Specialty Processing (“WSP”), which processes wide-sheet steel for the auto industry and operates three facilities in Michigan. The Pressure Cylinders operating segment consists of the Worthington Cylinders business unit (“Worthington Cylinders”) which operates 19 manufacturing facilities; and one consolidated joint venture: Turkey-based Worthington Arıtaş Basınçlı Kaplar Sanayi (“Worthington Aritas,”), a manufacturer of cryogenic pressure vessels for LNG and other gas storage applications with one facility. The Engineered Cabs operating segment consists of the Worthington Industries Engineered Cabs business unit (“Engineered Cabs”), which operates two manufacturing facilities.
Effective June 1, 2017, Worthington Steelpac Systems, LLC (“Packaging Solutions”), which designs and manufactures recyclable steel packaging solutions for the movement of products and operates one manufacturing facility, has been realigned under the Engineered Cabs operating segment, moving from the Steel Processing operating segment. See the Recent Developments section below.
1
Table of Contents
On June 2, 2017, we acquired AMTROL, which operates as part of the Pressure Cylinders operating segment. See the Recent Developments section below.
We hold equity positions in 11 joint ventures, which are further discussed in the Joint Ventures section below. Of these, five are consolidated with their operating results reported within our reportable business segments as follows: Spartan, TWB, and WSP in Steel Processing; Worthington Arıtaş in Pressure Cylinders; and Worthington Energy Innovations, LLC (“WEI”) in Other.
During the fiscal year ended May 31, 2017 (“fiscal 2017”), the Steel Processing, Pressure Cylinders and Engineered Cabs operating segments served approximately 800, 4,100, and 65 customers, respectively, located primarily in the United States. International operations accounted for approximately 7% of our consolidated net sales during fiscal 2017 and were comprised primarily of sales to customers in Europe. No single customer accounted for over 10% of our consolidated net sales in fiscal 2017.
Refer to “Item 8. – Financial Statements and Supplementary Data – Notes to Consolidated Financial Statements – Note N – Segment Data” of this Annual Report on Form 10-K for a full description of our reportable business segments.
Recent Developments
During the first quarter of fiscal 2017, the Company completed the exit of the businesses within its former Construction Services operating segment.
On October 1, 2016, the Company announced certain organizational changes impacting its Pressure Cylinders operating segment, including the consolidation of the Cryogenics business into the Industrial Products business unit.
Effective June 1, 2017, we made certain organizational changes impacting the internal reporting and management structure of Packaging Solutions. As a result of these organizational changes, management responsibilities and internal reporting were realigned, moving Packaging Solutions from the Steel Processing operating segment to the Engineered Cabs operating segment, where we expect to achieve synergies in design engineering and manufacturing development.
On June 2, 2017, we acquired AMTROL, a leading manufacturer of pressure cylinders and water system tanks, which is part of our Pressure Cylinders operating segment. AMTROL is a leader in the design and manufacturing of well water and expansion tanks. AMTROL has manufacturing facilities in Rhode Island, Kentucky and Maryland which also produce refrigerant gas cylinders and ASME code products for industrial and commercial applications. Its Portuguese subsidiary, AMTROL-ALFA, is a leading European producer of LPG, refrigerant, industrial and specialty gas cylinders.
The aggregate merger consideration for AMTROL was approximately $283.0 million and is subject to adjustment based on the Closing Working Capital, Closing Cash, Company Indebtedness and Company Transaction Expenses (as each term is defined in the AMTROL merger agreement) as of the June 2, 2017 closing date. A portion of the merger consideration was used to pay off certain indebtedness and other liabilities of AMTROL.
Steel Processing
Our Steel Processing operating segment consists of the Worthington Steel business unit, our consolidated joint ventures, Spartan, TWB and, beginning with the last quarter of fiscal 2016, WSP. It also included Packaging Solutions through May 31, 2017. For fiscal 2017, fiscal 2016 and fiscal 2015, the percentage of our consolidated net sales generated by the Steel Processing operating segment was approximately 69%, 65% and 63%, respectively.
Worthington Steel is one of the largest independent intermediate processors of flat-rolled steel in the United States. It occupies a niche in the steel industry by focusing on products requiring exact specifications. These products cannot typically be supplied as efficiently by steel mills to the end-users of these products.
2
Table of Contents
As of May 31, 2017, the Steel Processing operating segment, including Spartan, TWB, and WSP, operated 21 manufacturing facilities located in Ohio (5), Michigan (5), Mexico (4), Indiana (1), Tennessee (2), Alabama (1), Kentucky (1), New York (1), and Canada (1).
Our Steel Processing operating segment serves approximately 800 customers, principally in the automotive, aerospace, agricultural, appliance, construction, container, hardware, HVAC, lawn and garden, leisure and recreation, office furniture and office equipment markets. The automotive industry is one of the largest consumers of flat-rolled steel, and thus the largest end market for our Steel Processing operating segment. For fiscal 2017, Steel Processing’s top three customers represented approximately 34% of the operating segment’s total net sales.
Our Steel Processing operating segment buys coils of steel from integrated steel mills and mini-mills and processes them to the precise type, thickness, length, width, shape and surface quality required by customer specifications. Computer-aided processing capabilities include, among others:
| • | cold reducing, which achieves close tolerances of thickness; |
| • | configured blanking, which mechanically stamps steel into specific shapes; |
| • | coil fed laser blanking, which uses lasers to cut coils of steel, aluminum and other metals into specific shapes; |
| • | cutting-to-length, which cuts coils into sheets of exact length; |
| • | dry-lube, the process of coating steel with a dry, soap-based lubricant; |
| • | hot-dipped galvanizing, which coats steel with zinc and zinc alloys through a hot-dip process; |
| • | hydrogen annealing, a thermal process that changes the hardness and certain metallurgical characteristics of steel; |
| • | laser welding, which joins steel or aluminum blanks and coils with different thicknesses, coatings or material strength; |
| • | pickling, a chemical process using an acidic solution to remove surface oxide which develops on hot-rolled steel; |
| • | slitting, which cuts steel coils or steel sheets to specific widths; |
| • | oscillate slitting, a slitting process that spools together several narrow coils welded end-to-end into one larger coil; |
| • | temper rolling, which is the process of light cold-rolling steel; |
| • | tension leveling, a method of applying pressure to achieve precise flatness tolerances; and |
| • | non-metallic coating, including acrylic and paint coating. |
Our Steel Processing operating segment also toll processes steel for steel mills, large end-users, service centers and other processors. Toll processing is different from typical steel processing in that the mill, end-user or other party retains title to the steel and has the responsibility for selling the end product. Toll processing enhances Worthington Steel’s participation in the market for wide sheet steel and large standard orders, which is a market generally served by steel mills rather than by intermediate steel processors.
The steel processing industry is fragmented and highly competitive. There are many competitors, including other independent intermediate processors. Competition is primarily on the basis of price, product quality and the ability to meet delivery requirements. Technical service and support for material testing and customer-specific applications enhance the quality of products (see the Technical Services section below). However, the extent to which technical service capability has improved Worthington Steel’s competitive position has not been quantified. Worthington Steel’s ability to meet tight delivery schedules is, in part, based on the proximity of our facilities to customers, suppliers and one another. The extent to which plant location has impacted Worthington Steel’s competitive position has not been quantified. Processed steel products are priced competitively, primarily based on market factors, including, among other things, market pricing, the cost and availability of raw materials, transportation and shipping costs, and overall economic conditions in the United States and abroad.
3
Table of Contents
As of March 1, 2016, the Company reached an agreement with U.S. Steel, its partner in the WSP joint venture, whereby the Company appoints a majority of the WSP Board of Directors, giving the Company effective control over the operations of WSP. As a result, we began consolidating the results of WSP within the financial results of our Steel Processing operating segment as of March 1, 2016. The ownership percentages in WSP remained unchanged at 51% Worthington and 49% U.S. Steel. WSP operates three facilities in Michigan.
Effective in the first quarter of fiscal 2018, the operations of Packaging Solutions were realigned, moving from the Steel Processing operating segment to the Engineered Cabs operating segment.
Pressure Cylinders
The Pressure Cylinders operating segment consists of the Worthington Cylinders business unit and one consolidated joint venture: Worthington Aritas, a Turkish manufacturer of cryogenic pressure vessels for LNG and other gas storage applications. The percentage of our consolidated net sales generated by the Pressure Cylinders operating segment was approximately 28%, 30% and 30% in fiscal 2017, fiscal 2016 and fiscal 2015, respectively.
Our Pressure Cylinders operating segment manufactures and sells filled and unfilled pressure cylinders, tanks, hand torches, and oil and gas equipment along with various accessories and related products for diversified end-use market applications. The following is a description of these markets:
| • | Industrial Products: This market sector includes high pressure and acetylene cylinders for industrial gases, refrigerant and certain propane gas cylinders, cryogenic equipment and systems and services for handling liquid gases, and other specialty products. Cylinders in this market sector are generally sold to gas producers, cylinder exchangers and industrial distributors. Industrial cylinders hold fuel for uses such as cutting, brazing and soldering, semiconductor production, and beverage delivery. Refrigerant gas cylinders are used to hold refrigerant gases for commercial, residential and automotive air conditioning and refrigeration systems. LPG cylinders hold fuel for barbeque grills, recreational vehicle equipment, residential and light commercial heating systems, industrial forklifts and commercial/residential cooking (the latter, generally outside North America). Cryogenic equipment and systems include LNG systems for marine and mining applications, liquid nitrogen storage freezers and shipping containers for organic specimens in healthcare markets, and tanks, trailers, and regasification plants for liquefied nitrogen, oxygen, argon, hydrogen, and natural gas. Specialty products include a variety of fire suppression and chemical tanks. |
| • | Consumer Products: This market sector includes propane-filled cylinders for torches, camping stoves and other applications, hand held torches and accessories such as solder and brazing rods, and Balloon Time® helium-filled balloon kits. These products are sold primarily to mass merchandisers and distributors. |
| • | Alternative Fuels: This market sector includes composite and steel cylinders used to hold CNG and hydrogen for automobiles, buses, and light-duty trucks, and to hold propane/autogas for automobiles and light- and medium-duty trucks, as well as CNG fuel systems for heavy duty, refuse and other trucks. |
| • | Oil & Gas Equipment: This market sector includes steel and fiberglass storage tanks, separation equipment, controls and other products primarily used in the energy markets, including oil and gas and nuclear. This market sector also includes hoists and other marine products which are used principally in shipyard lift systems. It also leverages its manufacturing competencies to produce pressure vessels, atmospheric tanks, controls and various custom machined components for other industrial and agricultural end markets. |
As noted in the Recent Developments section above, we acquired AMTROL on June 2, 2017, which has been included in the Pressure Cylinders operating segment since that date. AMTROL’s well water and expansion tank businesses will be part of the Consumer Products business unit. Its refrigerant, liquid propane, industrial and specialty gas businesses will be part of the Industrial Products business unit.
While a large percentage of Pressure Cylinders sales are made to major accounts, this operating segment served approximately 4,100 customers during fiscal 2017. No single customer represented greater than 10% of net sales for the Pressure Cylinders operating segment during fiscal 2017. With the AMTROL acquisition, the Pressure Cylinders operating segment serves approximately 4,700 customers.
4
Table of Contents
The Pressure Cylinders operating segment (including the Worthington Aritas consolidated joint venture), operates 20 manufacturing facilities located in Alabama, California, Kansas (2), North Carolina, North Dakota, Ohio (6), Oklahoma, Utah, Wisconsin, Austria, Poland (2), Portugal and Turkey. The AMTROL acquisition added manufacturing facilities in Kentucky, Maryland, Rhode Island and Portugal.
For sales in the United States and Canada, high-pressure and low-pressure cylinders are primarily manufactured in accordance with United States Department of Transportation and Transport Canada specifications. Outside the United States and Canada, cylinders are manufactured according to European norm specifications, as well as various other international standards. Other products are produced to applicable industry standards including, as applicable, those standards issued by the American Petroleum Institute, ASME and UL.
Worthington Cylinders has one principal domestic competitor in the low-pressure LPG cylinder market, and there are a number of foreign competitors in the LPG cylinder market and in the non-refillable refrigerant market. We believe that Worthington Cylinders has the largest market share in its domestic low-pressure cylinder markets. In the other cylinder markets, there are several competitors. Worthington Cylinders is a leading supplier to the European markets for both the high-pressure cylinders and the low-pressure non-refillable cylinders. Worthington Cylinders generally has a strong competitive position for its industrial, energy, retail and specialty products, but competition varies on a product-by-product basis, and geographically for energy products. As with our other operating segments, competition is based upon price, service and quality.
The Pressure Cylinders operating segment uses the trade name “Worthington Cylinders” to conduct business and the registered trademark “Balloon Time®” to market helium-filled balloon kits; the registered trademark “BERNZOMATIC®” to market certain fuel cylinders and hand held torches; the trademark “WORTHINGTON PRO-GRADE” to market certain LPG cylinders, hand torches and camping fuel cylinders; and the registered trademarks “MAP-PRO®” and “Pro-Max®” to market certain hand torch cylinders.
Among the AMTROL trademarks acquired in the AMTROL acquisition are “Therm-X-Trol®” and “Extrol®” which are used to market thermal expansion tanks; “Well X Trol®”, “Champion®”, and “Wel-Flo and Design®” which are used to market well tanks; and “Hydromax®” and “Boilermate®” which are used to market indirect fired water heaters.
Engineered Cabs
The Engineered Cabs operating segment consists of the Worthington Industries Engineered Cabs business unit. For fiscal 2017, fiscal 2016 and fiscal 2015, the percentage of our consolidated net sales generated by the Engineered Cabs operating segment was approximately 3%, 4%, and 6%, respectively.
Engineered Cabs is headquartered in Columbus, Ohio and operates two manufacturing facilities, one in each of South Dakota and Tennessee, which are located near key assembly locations of original equipment manufacturers.
Engineered Cabs is a non-captive designer and manufacturer of high-quality, custom-engineered open and enclosed cabs and operator stations and custom fabrications for heavy mobile equipment used primarily in the agricultural, construction, forestry, military and mining industries. Engineered Cabs’ product design, engineering support and broad manufacturing capabilities enable it to produce custom cabs and structures used in products ranging from small utility equipment to the large earthmovers.
In addition to its engineered cab products, this operating segment has the capability to provide a full suite of complementary products such as machined structural components, complex and painted weldments, and engine doors. Engineered Cabs has the manufacturing capability for steel laser cutting, steel bending and forming, roll-form tube curving and bending, machining, welding – robotic and manual, automated steel product cleaning and E-coating, top coat painting and assembly.
5
Table of Contents
Engineered Cabs produces products for approximately 100 different equipment platforms for approximately 65 customers. For fiscal 2017, Engineered Cabs’ top three customers represented approximately 64% of the operating segment’s total net sales. Its production levels can range from small and medium production volumes through high volume productions.
Engineered Cabs competes with a limited number of non-captive producers of engineered cabs in the United States, although there are numerous other suppliers who can perform various functions supplied by the Company. Some customers can also produce operator cabs in-house. The Company’s competitive strengths include design and engineering capabilities as well as broad manufacturing capabilities, often providing a fully-integrated complete cab at a more effective cost than customers can produce in-house. Competitive drivers are related to quality, delivery and service.
Key supplies for this operating segment include steel sheet and plate, stampings, steel tubing, hardware, controls, wiper systems, glazing materials (glass, polycarbonate), perishables (paint, urethane, caulk), electrical materials, HVAC systems and aesthetic materials (acoustical trim, plastics, foam), which are available from a variety of sources.
As noted above, effective June 1, 2017, the operations of Packaging Solutions were realigned, moving from the Steel Processing operating segment to the Engineered Cabs operating segment. Packaging Solutions operates one facility in Indiana.
Other
The Other category includes the WEI operating segment, which does not meet the quantitative thresholds for separate disclosure, as well as other corporate-related entities. WEI is a 75%-owned consolidated joint venture, which is described in more detail in the Joint Ventures section below.
Segment Financial Data
Financial information for the reportable business segments is provided in “Item 8. – Financial Statements and Supplementary Data – Notes to Consolidated Financial Statements – Note N – Segment Data”.
Financial Information About Geographic Areas
For fiscal 2017, our international operations represented 7% of our consolidated net sales, 4% of our net earnings attributable to controlling interest and 11% of our consolidated net assets. During fiscal 2017, fiscal 2016 and fiscal 2015, we had consolidated operations in Austria, Canada, Mexico, Poland, Portugal, Turkey and the United States. During these same three fiscal years, our unconsolidated joint ventures had operations in China, France, Mexico, the United Kingdom and the United States. Summary information about our foreign operations, including net sales and fixed assets by geographic region, is provided in “Item 8. – Financial Statements and Supplementary Data – Notes to Consolidated Financial Statements – Note A – Summary of Significant Accounting Policies – Risks and Uncertainties” and “Note N – Segment Data” of this Annual Report on Form 10-K.
Suppliers
The primary raw material purchased by Worthington is steel. We purchase steel in large quantities at regular intervals from major primary producers of steel, both domestic and foreign. The amount purchased from any particular supplier varies from year to year depending on a number of factors including market conditions, then current relationships and prices and terms offered. In nearly all market conditions, steel is available from a number of suppliers and generally any supplier relationship or contract can and has been replaced with little or no significant interruption to our business. During fiscal 2017, we purchased approximately 2.4 million tons of steel (70% hot-rolled, 10% cold-rolled and 20% galvanized) on a consolidated basis.
In the Steel Processing operating segment, steel is primarily purchased and processed based on specific customer orders. The Pressure Cylinders and Engineering Cabs operating segments purchase steel to meet production schedules. For certain raw materials, there are more limited suppliers — for example, helium and zinc, which are generally purchased at market prices. Since there are a limited number of suppliers in the helium and zinc markets, if delivery from a major supplier is disrupted due to a force majeure type occurrence, it may be difficult to
6
Table of Contents
obtain an alternative supply. Raw materials are generally purchased in the open market on a negotiated spot-market basis at prevailing market prices. Supply contracts are also entered into, some of which have fixed pricing and some of which are indexed (monthly or quarterly). During fiscal 2017, we purchased steel from the following major suppliers, in alphabetical order: AK Steel Holding Corporation; ArcelorMittal; NLMK USA; North Star BlueScope Steel, LLC; Nucor Corporation; Steel Dynamics, Inc.; and United States Steel Corporation. Major suppliers of aluminum to the Pressure Cylinders operating segment in fiscal 2017 were, in alphabetical order: Arconic Inc.; DK Resources Limited; Meyer Aluminum; Sapa Group and Shanghai Everskill. Major suppliers of zinc to the Steel Processing operating segment in fiscal 2017 were, in alphabetical order: Considar Metal Marketing Inc. (a/k/a HudBay); Glencore Ltd; and Teck Resources Limited. Approximately 36.5 million pounds of zinc were purchased in fiscal 2017. We believe our supplier relationships are good.
Technical Services
We employ a staff of engineers and other technical personnel, and we maintain fully equipped laboratories to support operations. These facilities enable verification, analysis and documentation of the physical, chemical, metallurgical and mechanical properties of raw materials and products. Technical Service personnel also work in conjunction with the sales force to specify components and materials required to fulfill customer needs. Engineers at Engineered Cabs design cabs and cab manufacturing processes according to applicable industry standards. To provide these services, we maintain a continuing program of developmental engineering with respect to product characteristics and product performance under applicable operating conditions. Laboratory facilities also perform metallurgical and chemical testing as dictated by the regulations of the United States Department of Transportation, Transport Canada, and other associated agencies, along with International Organization for Standardization (ISO), ASTM, and other customer and industry specific requirements. An IASI (International Accreditations Service, Incorporated) accredited product material testing laboratory supports some of these efforts.
Seasonality and Backlog
Sales are generally strongest in the fourth quarter of our fiscal year as our operating segments are generally operating at seasonal peaks. Historically, sales have generally been weaker in the third quarter of our fiscal year, primarily due to reduced activity in the building and construction industry as a result of inclement weather, as well as customer plant shutdowns, particularly in the automotive industry, due to holidays. We do not believe backlog is a significant indicator of our business.
Employees
As of May 31, 2017, we had approximately 10,000 employees, including those employed by our unconsolidated joint ventures. Approximately 9% of our consolidated labor force is represented by collective bargaining units. Worthington believes it has good relationships with its employees, including those covered by collective bargaining units.
Joint Ventures
As part of our strategy to selectively develop new products, markets and technological capabilities and to expand our international presence, while mitigating the risks and costs associated with those activities, as of May 31, 2017, we participated in five consolidated and six unconsolidated joint ventures.
Consolidated
The results of the following five consolidated joint ventures have been consolidated with the financial results of the Company since the respective dates on which the Company acquired majority ownership or effective control. The equity owned by the minority members is shown as noncontrolling interests on our consolidated balance sheets and their portions of net earnings are included as net earnings attributable to noncontrolling interests in our consolidated statements of earnings.
| • | Spartan is a 52%-owned consolidated joint venture with AK Steel Corporation, located in Monroe, Michigan. It operates a cold-rolled, hot-dipped galvanizing line for toll processing steel coils into galvanized and galvannealed products intended primarily for the automotive industry. Spartan’s financial results are consolidated within the Steel Processing operating segment. |
7
Table of Contents
| • | TWB is a 55%-owned consolidated joint venture with a subsidiary of Baoshan Iron & Steel Co., Ltd. (“Bao”). It is a leading North American supplier of laser welded blanks, laser welded coils and other laser welded products for use primarily in the automotive industry for products such as inner-door panels, body sides, rails and pillars. TWB operates facilities in Monroe, Michigan; Glasgow, Kentucky; Antioch and Smyrna, Tennessee; Puebla, Ramos Arizpe (Saltillo), Hermosillo and Silao, Mexico; and Cambridge, Ontario, Canada. TWB’s financial results are consolidated within the Steel Processing operating segment. |
| • | WEI is a 75%-owned consolidated joint venture with Thomas E. Kiser (20%) and Stonehenge Structured Finance Partners, LLC (5%) with offices in Fremont and Columbus, Ohio. WEI is an Energy Services Company that develops cost-effective energy solutions for entities in North America and Asia. Once these solutions are implemented, WEI monitors, verifies and guarantees these energy saving solutions. WEI’s financial results are reported within the Other category for segment reporting purposes. |
| • | Worthington Arıtaş is a 75%-owned consolidated joint venture based in Istanbul, Turkey. Worthington Arıtaş manufactures cryogenic tanks for LNG and other gas storage applications. Its financial results are consolidated within the Pressure Cylinders operating segment. |
| • | WSP, a 51%-owned joint venture with a subsidiary of U.S. Steel, operates three steel processing facilities located in Canton, Jackson and Taylor, Michigan, which are managed by Steel Processing and its financial results are consolidated in that operating segment. WSP serves primarily as a toll processor for U.S. Steel and others. WSP’s services include slitting, blanking, cutting-to-length, laser blanking, laser welding, tension leveling and warehousing. |
Unconsolidated
| • | ArtiFlex Manufacturing, LLC (“ArtiFlex”), a 50%-owned joint venture with ITS-H Holdings, LLC, provides an integrated solution for engineering, tooling, stamping, assembly and other services to customers primarily in the automotive industry. ArtiFlex operates six manufacturing facilities: three in Michigan, two in Ohio and one in Kentucky. |
| • | Clarkwestern Dietrich Building Systems LLC (“ClarkDietrich”), a 25%-owned joint venture with CWBS-MISA, Inc., is the industry leader in the manufacture and supply of light gauge steel framing products in the United States. ClarkDietrich manufactures a full line of drywall studs and accessories, structural studs and joists, metal lath and accessories, shaft wall studs and track, and vinyl products used primarily in residential and commercial construction. This joint venture operates 14 manufacturing facilities, one each in Connecticut, Georgia, Hawaii, Illinois, Maryland and Missouri and two each in California, Ohio, Florida and Texas. |
| • | Samuel Steel Pickling Company (“Samuel”), a 31.25%-owned joint venture with Samuel Manu-Tech Pickling, Inc., operates one steel pickling facility in Twinsburg, Ohio, and another in Cleveland, Ohio. Samuel also performs in-line slitting, side trimming, pickle dry, and under winding during the pickling process. |
| • | Serviacero Planos, S. de R.L. de C.V. (“Serviacero Worthington”), a 50%-owned joint venture with Inverzer, S.A. de C.V., operates three facilities in Mexico, one each in Leon, Queretaro and Monterrey. Serviacero Worthington provides steel processing services, such as pickling, slitting, multi-blanking and cutting-to-length, to customers in a variety of industries including automotive, appliance, electronics and heavy equipment. |
| • | Worthington Armstrong Venture (“WAVE”), a 50%-owned joint venture with Armstrong Ventures, Inc., a subsidiary of Armstrong World Industries, Inc., is one of the two largest global manufacturers of ceiling suspension systems for concealed and lay-in panel ceilings used in commercial and residential ceiling markets. It competes with the one other global manufacturer and numerous regional manufacturers. WAVE operates nine facilities in five countries: Santa Fe Springs, California; Alpharetta, Georgia; Aberdeen, Maryland; Benton Harbor, Michigan; North Las Vegas, Nevada; Qingpu, Shanghai, China; Team Valley, United Kingdom; Prouvy, France; and Marval, Pune, India. |
8
Table of Contents
| • | Zhejiang Nisshin Worthington Precision Specialty Steel Co., Ltd, a 10%-owned unconsolidated joint venture with Nisshin Steel Co., Ltd. and Marubeni-Itochu Steel Inc., operates one facility in Pinghu City, Zhejiang, China. The joint venture, which started production in the first quarter of fiscal 2017, is producing cold-rolled strip steel, primarily for the automotive industry. |
See “Item 8. – Financial Statements and Supplementary Data – Notes to Consolidated Financial Statements – Note B – Investments in Unconsolidated Affiliates” of this Annual Report on Form 10-K for additional information about our unconsolidated joint ventures.
Environmental Regulation
Our manufacturing facilities, generally in common with those of similar industries making similar products, are subject to many federal, state, local and foreign laws and regulations relating to the protection of the environment. We examine ways to reduce emissions and waste and to decrease costs related to environmental compliance. The cost of compliance or capital expenditures for environmental control facilities required to meet environmental requirements are not anticipated to be material when compared with overall costs and capital expenditures and, accordingly, are not anticipated to have a material effect on our financial position, results of operations or cash flows, or on the competitive position of Worthington or any particular business segment.
9
Table of Contents
Future results and the market price for Worthington Industries’ common shares are subject to numerous risks, many of which are driven by factors that cannot be controlled or predicted. The following discussion, as well as other sections of this Annual Report on Form 10-K, including “PART II—Item 7. — Management’s Discussion and Analysis of Financial Condition and Results of Operations,” describe certain business risks. Consideration should be given to the risk factors described below as well as those in the Safe Harbor Statement at the beginning of this Annual Report on Form 10-K, in conjunction with reviewing the forward-looking statements and other information contained in this Annual Report on Form 10-K. These risks are not the only risks we face. Our business operations could also be affected by additional factors that are not presently known to us or that we currently consider to be immaterial in our operations.
Risks Related to Our Business
General Economic or Industry Downturns and Weakness
Our industries are cyclical and weakness or downturns in the general economy or certain industries could have an adverse effect on our business. If the domestic or global economies, or certain industry sectors of those economies that are key to our sales, deteriorate, it could result in a corresponding decrease in demand for our products and negatively impact our results of operations and financial condition. Global economic conditions, particularly in Europe, remain fragile, and the actions taken to implement the referendum by United Kingdom voters to exit the European Union (“Brexit”) could heighten these concerns.
The automotive and construction industries account for a significant portion of our net sales, and reduced demand from these industries could adversely affect our business. An overall downturn in the general economy, a disruption in capital and credit markets, high unemployment, reduced consumer confidence or other factors could cause reductions in demand from our end markets in general and, in particular, the automotive and construction end markets. If demand for the products we sell to the automotive, construction or other end markets which we supply were to be reduced, our sales, financial results and cash flows could be negatively affected.
We face intense competition which may cause decreased demand, decreased market share and/or reduced prices for our products and services. Our businesses operate in industries that are highly competitive and have been subject to increasing consolidation of customers. Because of the range of the products and services we sell and the variety of markets we serve, we encounter a wide variety of competitors. Our failure to compete effectively and/or pricing pressures resulting from competition may adversely impact our businesses and financial results.
Financial difficulties and bankruptcy filings by our customers could have an adverse impact on our businesses. In past years, some customers have experienced and some continue to experience challenging financial conditions. The financial difficulties of certain customers and/or their failure to obtain credit or otherwise improve their overall financial condition could result in changes within the markets we serve, including plant closings, decreased production, reduced demand, changes in product mix, unfavorable changes in the prices, terms or conditions we are able to obtain and other changes that may result in decreased purchases from us and otherwise negatively impact our businesses. These conditions also increase the risk that our customers may delay or default on their payment obligations to us. If the general economy or any of our markets decline, the risk of bankruptcy filings by and financial difficulties of our customers may increase. While we have taken and will continue to take steps intended to mitigate the impact of financial difficulties and potential bankruptcy filings by our customers, these matters could have a negative impact on our businesses.
If the price of natural gas and/or oil prices remain low or decline further, the demand for products in our oil and gas equipment business could be adversely affected. Volatility or weakness in oil prices or natural gas prices, or the perception of future price weakness, affects the spending patterns of our customers within the oil and gas equipment business. This has resulted and may continue to result in the drilling of fewer wells and lower production spending on existing wells, lowering demand for our oil and gas equipment products and negatively impacting our results of operations and financial condition. Likewise, lower oil prices has limited, and may continue to limit, the number of vehicles changing from gasoline as a fuel to CNG, propane or alternative fuels which could negatively impact demand for our alternative fuel cylinders and systems.
10
Table of Contents
Volatility in the United States and worldwide capital and credit markets could impact our end markets and result in negative impacts on demand, increased credit and collection risks and other adverse effects on our businesses. The domestic and worldwide capital and credit markets have experienced significant volatility, disruptions and dislocations with respect to price and credit availability. These factors caused diminished availability of credit and other capital in our end markets, and for participants in, and the customers of, those markets. Although domestic credit markets have largely stabilized from the height of the financial crisis, the effects of the financial crisis continue to present additional risks to us, our customers and suppliers. In particular, there is no guarantee that the credit markets or liquidity will not once again be restricted. Additionally, stricter lending standards may make it more difficult and costly for some firms to access the credit markets. Further, uncertainties in Europe regarding the financial sector and sovereign debt and the potential impact on banks in other regions of the world will continue to weigh on global and domestic growth. Although we believe we have adequate access to several sources of contractually committed borrowings and other available credit facilities, these risks could temporarily restrict our ability to borrow money on acceptable terms in the credit markets and potentially could affect our ability to draw on our credit facilities. In addition, restricted access to the credit markets could make it difficult, or in some cases, impossible for customers to borrow money to fund their operations. Lack of, or limited access to, capital would adversely affect our customers’ ability to purchase our products or, in some cases, to pay for our products on a timely basis.
Raw Material Pricing and Availability
Our operating results may be adversely affected by declining steel prices. If steel prices or other raw material prices decrease, competitive conditions may impact how quickly we must reduce our prices to our customers, and we could be forced to use higher-priced raw materials then on hand to complete orders for which the selling prices have decreased. Decreasing steel prices could also require us to write-down the value of our inventory to reflect current market pricing.
Our operating results may be affected by fluctuations in raw material prices, and we may be unable to pass on increases in raw material costs to our customers. Our principal raw material is flat-rolled steel, which we purchase from multiple primary steel producers. The steel industry as a whole has been cyclical, and at times availability and pricing can be volatile due to a number of factors beyond our control. These factors include general economic conditions, domestic and worldwide demand, domestic and worldwide supply, the influence of hedge funds and other investment funds participating in commodity markets, curtailed production from major suppliers due to factors such as the closing or idling of facilities, accidents or equipment breakdowns, repairs or catastrophic events, labor costs or problems, competition, new laws and regulations, import duties, tariffs, energy costs, availability and cost of steel inputs (e.g., ore, scrap, coke and energy), currency exchange rates and other factors described in the immediately following paragraph. This volatility, as well as any increases in raw material costs, could significantly affect our steel costs and adversely impact our financial results. If our suppliers increase the prices of our critical raw materials, we may not have alternative sources of supply. In addition, in an environment of increasing prices for steel and other raw materials, competitive conditions may impact how much of the price increases we can pass on to our customers. To the extent we are unable to pass on future price increases in our raw materials to our customers, our financial results could be adversely affected.
The costs of manufacturing our products and our ability to supply our customers could be negatively impacted if we experience interruptions in deliveries of needed raw materials or supplies. If, for any reason, our supply of flat-rolled steel or other key raw materials, such as aluminum, zinc or helium, or other supplies is curtailed or we are otherwise unable to obtain the quantities we need at competitive prices, our business could suffer and our financial results could be adversely affected. Such interruptions could result from a number of factors, including a shortage of capacity in the supplier base of raw materials, energy or the inputs needed to make steel or other supplies, a failure of suppliers to fulfill their supply or delivery obligations, financial difficulties of suppliers resulting in the closing or idling of supplier facilities, other significant events affecting supplier facilities, significant weather events, those factors listed in the immediately preceding paragraph or other factors beyond our control. Further, the number of suppliers has decreased in recent years due to industry consolidation and the financial difficulties of certain suppliers, and this consolidation may continue.
11
Table of Contents
Inventories
Our businesses could be harmed if we fail to maintain proper inventory levels. We are required to maintain sufficient inventories to accommodate the needs of our customers including, in many cases, short lead times and just-in-time delivery requirements. Although we typically have customer orders in hand prior to placement of our raw material orders for our Steel Processing operating segment, we anticipate and forecast customer demand for each of our operating segments. We purchase raw materials on a regular basis in an effort to maintain our inventory at levels that we believe are sufficient to satisfy the anticipated needs of our customers based upon orders, customer volume expectations, historic buying practices and market conditions. Inventory levels in excess of customer demand may result in the use of higher-priced inventory to fill orders reflecting lower selling prices, if raw material prices have significantly decreased. These events could adversely affect our financial results. Conversely, if we underestimate demand for our products or if our suppliers fail to supply quality products in a timely manner, we may experience inventory shortages. Inventory shortages could result in unfilled orders, negatively impacting our customer relationships and resulting in lost revenues, which could harm our businesses and adversely affect our financial results.
Suppliers and Customers
The loss of significant volume from our key customers could adversely affect us. A significant loss of, or decrease in, business from any of our key customers could have an adverse effect on our sales and financial results if we cannot obtain replacement business. Also, due to consolidation in the industries we serve, including the construction, automotive, and retail industries, our sales may be increasingly sensitive to deterioration in the financial condition of, or other adverse developments with respect to, one or more of our top customers. In addition, certain of our top customers may be able to exert pricing and other influences on us, requiring us to market, deliver and promote our products in a manner that may be more costly to us. We generally do not have long-term contracts with our customers. As a result, although our customers periodically provide indications of their product needs and purchases, they generally purchase our products on an order-by-order basis, and the relationship, as well as particular orders, can be terminated at any time.
Many of our key industries, such as automotive, oil and gas, construction and heavy mobile equipment, are cyclical in nature. Many of our key industries, such as automotive, oil and gas, construction and heavy mobile equipment, are cyclical and can be impacted by both market demand and raw material supply, particularly with respect to steel. The demand for our products is directly related to, and quickly impacted by, customer demand in our industries, which can change as the result of changes in the general United States or worldwide economies and other factors beyond our control. Adverse changes in demand or pricing can have a negative effect on our businesses.
Significant reductions in sales to any of the Detroit Three automakers could have a negative impact on our business. More than half of the net sales of our Steel Processing operating segment and a significant amount of the net sales of certain joint ventures are to automotive-related customers. Although we do sell to the domestic operations of foreign automakers and their suppliers, a significant portion of our automotive sales are to Ford, General Motors, and FCA US (the “Detroit Three automakers”) and their suppliers. A reduction in sales for any of the Detroit Three automakers could negatively impact our business. Since 2011, automobile producers have been taking steps toward complying with new Corporate Average Fuel Economy mileage requirements for new cars and light trucks that they produce. As automobile producers work to produce vehicles in compliance with these standards, they may reduce the amount of steel or begin utilizing alternative materials in cars and trucks to improve fuel economy, thereby reducing demand for steel and resulting in further over-supply of steel in North America. Certain automakers have announced that they will use greater amounts of aluminum and smaller proportions of steel in some new models.
12
Table of Contents
A significant reduction in sales to any of our large heavy mobile equipment customers could have a negative impact on our business. Substantially all of the sales of our Engineered Cabs operating segment are to customers who manufacture heavy mobile equipment. A reduction in sales to any of our major customers in this market could negatively impact our business. A reduction in demand could result from numerous causes including a reduction in overall market demand for heavy mobile equipment, in-sourcing of engineered cabs by our customers, or increased competition.
The closing or relocation of customer facilities could adversely affect us. Our ability to meet delivery requirements and the overall cost of our products as delivered to customer facilities are important competitive factors. If customers close or move their production facilities further away from our manufacturing facilities which can supply them, it could have an adverse effect on our ability to meet competitive conditions, which could result in the loss of sales. Likewise, if customers move their production facilities outside the United States, it could result in the loss of potential sales for us.
Sales conflicts with our customers and/or suppliers may adversely impact us. In some instances, we may compete with one or more of our customers and/or suppliers in pursuing the same business. In addition, in the Engineered Cabs business, our customers often have the option of producing certain cabs in-house instead of having them supplied by us or our competition and to the extent they elect to produce such cabs in-house, it could adversely affect our sales. Such conflicts may strain our relationships with those parties, which could adversely affect our future business with them.
The closing or idling of steel manufacturing facilities could have a negative impact on us. As steel makers have reduced their production capacities by closing or idling production lines, the number of facilities from which we can purchase steel, in particular certain specialty steels, has decreased. Accordingly, if delivery from a supplier is disrupted, particularly with respect to certain types of specialty steel, it may be more difficult to obtain an alternate supply than in the past. These closures and disruptions could also have an adverse effect on our suppliers’ on-time delivery performance, which could have an adverse effect on our ability to meet our own delivery commitments and may have other adverse effects on our businesses.
The loss of key supplier relationships could adversely affect us. Over the years, our various manufacturing operations have developed relationships with certain steel and other suppliers which have been beneficial to us by providing more assured delivery and a more favorable all-in cost, which includes price and shipping costs. If any of those relationships were disrupted, it could have an adverse effect on delivery times and the overall cost and quality of our raw materials, which could have a negative impact on our businesses. In addition, we do not have long-term contracts with any of our suppliers. If, in the future, we are unable to obtain sufficient amounts of steel and other products at competitive prices and on a timely basis from our traditional suppliers, we may be unable to obtain these products from alternative sources at competitive prices to meet our delivery schedules, which could have a material adverse impact on our results of operations.
Competition
Our businesses are highly competitive, and increased competition could negatively impact our financial results. Generally, the markets in which we conduct business are highly competitive. Our competitors include a variety of both domestic and foreign companies in all major markets. Competition for most of our products is primarily on the basis of price, product quality and our ability to meet delivery requirements. Depending on a variety of factors, including raw material, energy, labor and capital costs, government control of currency exchange rates and government subsidies of foreign steel producers or competitors, our businesses may be materially adversely affected by competitive forces. Competition may also increase if suppliers to or customers of our industries begin to more directly compete with our businesses through new facilities, acquisitions or otherwise. As noted above, we can have conflicts with our customers or suppliers who, in some cases, supply the same products and services as we do. Increased competition could cause us to lose market share, increase expenditures, lower our margins or offer additional services at a higher cost to us, which could adversely impact our financial results.
Material Substitution
If steel prices increase compared to certain substitute materials, the demand for our products could be negatively impacted, which could have an adverse effect on our financial results. In certain applications, steel competes with other materials, such as aluminum (particularly in the automobile industry), cement and wood
13
Table of Contents
(particularly in the construction industry), composites, glass and plastic. Prices of all of these materials fluctuate widely, and differences between the prices of these materials and the price of steel may adversely affect demand for our products and/or encourage material substitution, which could adversely affect prices of and demand for steel products. The higher cost of steel relative to certain other materials may make material substitution more attractive for certain uses.
If increased government mileage standards for automobiles result in the substitution of other materials for steel, demand for our products could be negatively impacted, which could have an adverse effect on our financial results. Due to government requirements that manufacturers increase the fuel efficiency of automobiles, the automobile industry is exploring alternative materials to steel to decrease weight. The substitution of lighter weight material for steel in automobiles could adversely affect prices of and demand for our steel products.
Freight and Energy
Increasing freight and energy costs could increase our operating costs, which could have an adverse effect on our financial results. The availability and cost of freight and energy, such as electricity, natural gas and diesel fuel, are important in the manufacture and transport of our products. Our operations consume substantial amounts of energy, and our operating costs generally increase when energy costs rise. Factors that may affect our energy costs include significant increases in fuel, oil or natural gas prices, unavailability of electrical power or other energy sources due to droughts, hurricanes or other natural causes or due to shortages resulting from insufficient supplies to serve customers, or interruptions in energy supplies due to equipment failure or other causes. During periods of increasing energy and freight costs, we may be unable to fully recover our operating cost increases through price increases without reducing demand for our products. Our financial results could be adversely affected if we are unable to pass all of the increases on to our customers or if we are unable to obtain the necessary freight and energy. Also, increasing energy costs could put a strain on the transportation of our materials and products if the increased costs force certain transporters to close.
We depend on third parties for freight services, and increases in costs or the lack of availability of freight services can adversely affect our operations. We rely primarily on third parties for transportation of our products as well as delivery of our raw materials, primarily by truck. If, due to a lack of freight services, raw materials are not delivered to us in a timely manner, we may be unable to manufacture and deliver our products to meet customer demand. Likewise, if due to a lack of freight service, we cannot deliver our products in a timely manner, it could harm our reputation, negatively affect our customer relationships and have a material adverse effect on our results of operations.
Information Systems
We are subject to information system security risks and systems integration issues that could disrupt our internal operations. We are dependent upon information technology and networks in connection with a variety of business activities including the distribution of information internally and to our customers and suppliers. This information technology is subject to potential damage or interruption from a variety of sources, including, without limitation, computer viruses, security breaches, and natural disasters. We could also be adversely affected by system or network disruptions if new or upgraded business management systems are defective, not installed properly or not properly integrated into operations. Various measures have been implemented to manage our risks related to information system and network disruptions and to prevent attempts to gain unauthorized access to our information systems. While we undertake mitigating activities to counter these risks, a system failure could negatively impact our operations and financial results and cyber attacks could threaten the integrity of our trade secrets and sensitive intellectual property.
Business Disruptions
Disruptions to our business or the business of our customers or suppliers could adversely impact our operations and financial results. Business disruptions, including increased costs for, or interruptions in, the supply of energy or raw materials, resulting from shortages of supply or transportation, severe weather events (such as hurricanes, tsunamis, earthquakes, tornados, floods and blizzards), casualty events (such as explosions, fires or material equipment breakdown), acts of terrorism, pandemic disease, labor disruptions, the idling of facilities due to reduced demand (resulting from a downturn in economic activity or otherwise) or other events (such as required
14
Table of Contents
maintenance shutdowns), could cause interruptions to our businesses as well as the operations of our customers and suppliers. While we maintain insurance coverage that can offset some losses relating to certain types of these events, losses from business disruptions could have an adverse effect on our operations and financial results and we could be adversely impacted to the extent any such losses are not covered by insurance or cause some other adverse impact to us.
Foreign Operations
Economic, political and other risks associated with foreign operations could adversely affect our international financial results. Although the substantial majority of our business activity takes place in the United States, we derive a portion of our revenues and earnings from operations in foreign countries, and we are subject to risks associated with doing business internationally. We have wholly-owned facilities in Austria, Poland and Portugal and joint venture facilities in Canada, China, France, India, Mexico, Turkey and the United Kingdom, and are active in exploring other foreign opportunities. The risks of doing business in foreign countries include, among other factors: the potential for adverse changes in the local political climate, in diplomatic relations between foreign countries and the United States or in government policies, laws or regulations; terrorist activity that may cause social disruption; logistical and communications challenges; costs of complying with a variety of laws and regulations; difficulty in staffing and managing geographically diverse operations; deterioration of foreign economic conditions; inflation and fluctuations in interest rates; foreign currency exchange rate fluctuations; foreign exchange restrictions; differing local business practices and cultural considerations; restrictions on imports and exports or sources of supply, including energy and raw materials; changes in duties, quotas, tariffs, taxes or other protectionist measures; and potential issues related to matters covered by the Foreign Corrupt Practices Act, regulations related to import/export controls, the Office of Foreign Assets Control sanctions program, anti-boycott provisions or similar laws. We believe that our business activities outside of the United States involve a higher degree of risk than our domestic activities, and any one or more of these factors could adversely affect our operating results and financial condition. In addition, global and regional economic conditions and the volatility of worldwide capital and credit markets have significantly impacted and may continue to significantly impact our foreign customers and markets. These factors may result in decreased demand in our foreign operations and have had significant negative impacts on our business. Refer to the General Economic or Industry Downturns and Weakness risk factors herein for additional information concerning the impact of the global economic conditions and the volatility of capital and credit markets on our business.
Joint Ventures
A change in the relationship between the members of any of our joint ventures may have an adverse effect on that joint venture. We have been successful in the development and operation of various joint ventures, and our equity in net income from our joint ventures, particularly WAVE, has been important to our financial results. We believe an important element in the success of any joint venture is a solid relationship between the members of that joint venture. If there is a change in ownership, a change of control, a change in management or management philosophy, a change in business strategy or another event with respect to a member of a joint venture that adversely impacts the relationship between the joint venture members, it could adversely impact that joint venture. In addition, joint ventures necessarily involve special risks. Whether or not we hold a majority interest or maintain operational control in a joint venture, our partners may have economic or business interests or goals that are inconsistent with our interests or goals. For example, our partners may exercise veto rights to block actions that we believe to be in our best interests, may take action contrary to our policies or objectives with respect to our investments, or may be unable or unwilling to fulfill their obligations or commitments to the joint venture.
Acquisitions
We may be unable to successfully consummate, manage or integrate our acquisitions or our acquisitions may not meet our expectations. A portion of our growth has occurred through acquisitions. We may from time to time continue to seek attractive opportunities to acquire businesses, enter into joint ventures and make other investments that are complementary to our existing strengths. There are no assurances, however, that any acquisition opportunities will arise or, if they do, that they will be consummated, or that any needed additional financing for such opportunities will be available on satisfactory terms when required. In addition, acquisitions involve risks that the businesses acquired will not perform in accordance with expectations, that business judgments concerning the value, strengths and weaknesses of businesses acquired will prove incorrect, that we may assume unknown liabilities
15
Table of Contents
from the seller, that the acquired businesses may not be integrated successfully and that the acquisitions may strain our management resources or divert management’s attention from other business concerns. International acquisitions may present unique challenges and increase our exposure to the risks associated with foreign operations and countries. Also, failure to successfully integrate any of our acquisitions may cause significant operating inefficiencies and could adversely affect our operations and financial condition.
Capital Expenditures
Our business requires capital investment and maintenance expenditures, and our capital resources may not be adequate to provide for all of our cash requirements. Many of our operations are capital intensive. For the five-year period ended May 31, 2017, our total capital expenditures, including acquisitions and investment activity, were approximately $718.2 million. Additionally, as of May 31, 2017, we were obligated to make aggregate lease payments of $40.5 million under operating lease agreements. Our businesses also require expenditures for maintenance of our facilities. We currently believe that we have adequate resources (including cash and cash equivalents, cash provided by operating activities, availability under existing credit facilities and unused lines of credit) to meet our cash needs for normal operating costs, capital expenditures, debt repayments, dividend payments, future acquisitions and working capital for our existing business. However, given the potential for challenges, uncertainty and volatility in the domestic and global economies and financial markets, there can be no assurance that our capital resources will be adequate to provide for all of our cash requirements.
Litigation
We may be subject to legal proceedings or investigations, the resolution of which could negatively affect our results of operations and liquidity in a particular period. Our results of operations or liquidity in a particular period could be affected by an adverse ruling in any legal proceedings or investigations which may be pending against us or filed against us in the future. We are also subject to a variety of legal and compliance risks, including, without limitation, potential claims relating to product liability, product recall, health and safety, environmental matters, intellectual property rights, taxes and compliance with U.S. and foreign export laws, anti-bribery laws, competition laws and sales and trading practices. While we believe that we have adopted appropriate risk management and compliance programs to address and reduce these risks, the global and diverse nature of our operations means that these risks will continue to exist and additional legal proceedings and contingencies may arise from time to time. An adverse ruling or settlement or an unfavorable change in laws, rules or regulations could have a material adverse effect on our results of operations or liquidity in a particular period.
Claims and Insurance
Adverse claims experience, to the extent not covered by insurance, may have an adverse effect on our financial results. We self-insure a significant portion of our potential liability for workers’ compensation, product liability, cyber liability, product recall, general liability, pollution liability, property liability, automobile liability and employee medical claims. In order to reduce risk, we purchase insurance from highly-rated, licensed insurance carriers that cover most claims in excess of the applicable deductible or retained amounts. We maintain reserves for the estimated cost to resolve open claims as well as an estimate of the cost of claims that have been incurred but not reported. The occurrence of significant claims, our failure to adequately reserve for such claims, a significant cost increase to maintain our insurance or the failure of our insurance providers to perform could have an adverse impact on our financial condition and results of operations.
Accounting and Tax-Related Estimates
We are required to make accounting and tax-related estimates, assumptions and judgments in preparing our consolidated financial statements, and actual results may differ materially from the estimates, assumptions and judgments that we use. In preparing our consolidated financial statements in accordance with accounting principles generally accepted in the United States, we are required to make certain estimates and assumptions that affect the accounting for and recognition of assets, liabilities, revenues and expenses. These estimates and assumptions must be made because certain information that is used in the preparation of our consolidated financial statements is dependent on future events, or cannot be calculated with a high degree of precision from data available to us. In
16
Table of Contents
some cases, these estimates and assumptions are particularly difficult to determine and we must exercise significant judgment. Some of the estimates, assumptions and judgments having the greatest amount of uncertainty, subjectivity and complexity are related to our accounting for bad debts, returns and allowances, inventory, self-insurance reserves, derivatives, stock-based compensation, deferred tax assets and liabilities and asset impairments. Our actual results may differ materially from the estimates, assumptions and judgments that we use, which could have a material adverse effect on our financial condition and results of operations.
Tax Laws and Regulations
Tax increases or changes in tax laws or regulations could adversely affect our financial results. We are subject to tax and related obligations in the jurisdictions in which we operate or do business, including state, local, federal and foreign taxes. The taxing rules of the various jurisdictions in which we operate or do business often are complex and subject to varying interpretations. Tax authorities may challenge tax positions that we take or historically have taken, and may assess taxes where we have not made tax filings or may audit the tax filings we have made and assess additional taxes. Some of these assessments may be substantial, and also may involve the imposition of penalties and interest. In addition, governments could change their existing tax laws, impose new taxes on us or increase the rates at which we are taxed in the future. The payment of substantial additional taxes, penalties or interest resulting from tax assessments, or the imposition of any new taxes, could materially and adversely impact our results of operations and financial condition.
Principal Shareholder
Our principal shareholder may have the ability to exert significant influence in matters requiring a shareholder vote and could delay, deter or prevent a change in control of Worthington Industries. Pursuant to our charter documents, certain matters such as those in which a person would attempt to acquire or take control of the Company, must be approved by the vote of the holders of common shares representing at least 75% of Worthington Industries’ outstanding voting power. Approximately 28% of our outstanding common shares are beneficially owned, directly or indirectly, by John P. McConnell, our Chairman of the Board and Chief Executive Officer. As a result of his beneficial ownership of our common shares, Mr. McConnell may have the ability to exert significant influence in these matters and other proposals upon which our shareholders may vote.
Key Employees
If we lose senior management or other key employees, our business may be adversely affected. Our ability to successfully operate, grow our business and implement our business strategies is largely dependent on the efforts, abilities and services of our senior management and other key employees. The loss of any of these individuals or our inability to attract, train and retain additional personnel could reduce the competitiveness of our business or otherwise impair our operations or prospects. Our future success will also depend, in part, on our ability to attract and retain qualified personnel, including engineers and other skilled technicians, who have experience in the application of our products and are knowledgeable about our business, markets and products. We cannot assure that we will be able to retain our existing senior management personnel or other key employees or attract additional qualified personnel when needed. The loss of any member of our management team could adversely impact our business and operations. We have not entered into any formal employment contracts with or other stand-alone change in control provisions relative to our executive officers. However, we do have certain change in control provisions in our various compensation plans. We may modify our management structure from time to time or reduce our overall workforce, which may create marketing, operational and other business risks.
Credit Ratings
Ratings agencies may downgrade our credit ratings, which may make it more difficult for us to raise capital and could increase our financing costs. Any downgrade in our credit ratings may make raising capital more difficult, may increase the cost and affect the terms of future borrowings, may affect the terms under which we purchase goods and services and may limit our ability to take advantage of potential business opportunities. In addition, the interest rate on our revolving credit facility is tied to our credit ratings, and any downgrade of our credit ratings would likely result in an increase in the cost of borrowings under our revolving credit facility.
17
Table of Contents
Difficult Financial Markets
Should we be required to raise capital in the future, we could face higher borrowing costs, less available capital, more stringent terms and tighter covenants or, in extreme conditions, an inability to raise capital. Although we currently have significant borrowing availability under our existing credit facilities and should be able to access other capital if needed, should those facilities become unavailable due to covenant or other defaults, or should financial results tighten so that we otherwise cannot raise capital outside our existing facilities, or the terms under which we do so change, we may be negatively impacted. Any adverse change in our access to capital or the terms of our borrowings, including increased costs, could have a negative impact on our financial condition.
Environmental, Health and Safety
We may incur additional costs related to environmental and health and safety matters. Our operations and facilities are subject to a variety of federal, state, local and foreign laws and regulations relating to the protection of the environment and human health and safety. Compliance with these laws and regulations and any changes therein may sometimes involve substantial operating costs and capital expenditures, and any failure to maintain or achieve compliance with these laws and regulations or with the permits required for our operations could result in increased costs and capital expenditures and potentially fines and civil or criminal sanctions, third-party claims for property damage or personal injury, cleanup costs or temporary or permanent discontinuance of operations. Over time, we and predecessor operators of our facilities have generated, used, handled and disposed of hazardous and other regulated wastes. Environmental liabilities, including cleanup obligations, could exist at our facilities or at off-site locations where materials from our operations were disposed of or at facilities we have divested, which could result in future expenditures that cannot be currently quantified and which could reduce our profits and cash flow. We may be held strictly liable for any contamination of these sites, and the amount of any such liability could be material. Under the “joint and several” liability principle of certain environmental laws, we may be held liable for all remediation costs at a particular site, even with respect to contamination for which we are not responsible. In addition, changes in environmental and human health and safety laws, rules, regulations or enforcement policies could have a material adverse effect on our business, financial condition or results of operations.
Legislation and Regulations
Certain proposed legislation and regulations may have an adverse impact on the economy in general and in our markets specifically, which may adversely affect our businesses. Our businesses may be negatively impacted by a variety of new or proposed legislation or regulations. For example, legislation and regulations proposing increases in taxation on, or heightened regulation of, greenhouse gas emissions may result in higher prices for steel, higher prices for utilities required to run our facilities, higher fuel costs for us and our suppliers and distributors and other adverse impacts. To the extent that new legislation or regulations increase our costs, we may not be able to fully pass these costs on to our customers without a resulting decline in sales and adverse impact to our profits. Likewise, to the extent new legislation or regulations would have an adverse effect on the economy, our markets or the ability of domestic businesses to compete against foreign operations, we could also be adversely impacted.
Legislation, regulations or other events which could adversely affect the ability or cost to recover natural gas or oil may negatively affect our business. In recent years, increasing amounts of oil and natural gas have been produced through the hydraulic fracking process throughout the United States and North America. This has resulted in decreasing energy costs, particularly for natural gas and similar energy products. This reduction has helped lower energy costs for U.S. businesses. Also, some of our recent acquisitions supply products which are used by companies engaged in hydraulic fracking. If legislation, regulations or other events limit the ability to recover such fuels through hydraulic fracking or increase the cost thereof, it could have a negative impact on our business, the U.S. economy and U.S. businesses in general, which could result in decreased demand for our products or otherwise negatively impact our business.
The provisions of health care laws could adversely affect our businesses. As the effects of the Patient Protection and Affordable Care Act (“Obamacare”) continue to evolve and insurers, governments and employers take action related thereto, the impact on U.S. health care costs are unknown, but these costs have increased. Many project that there will continue to be significant increases in health care costs which could adversely impact the U.S. economy and U.S. businesses. This could result in a decreased demand for our products and the Company’s health care costs could increase which would negatively impact our profits. Congress is considering amending or replacing Obamacare, but it is uncertain if any changes or a replacement will be affected or what the impact of any such changes or replacement will be.
18
Table of Contents
Changes to global data privacy laws and cross-border transfer requirements could adversely affect our business and operations. Our business depends on the transfer of data between our affiliated entities, to and from our business partners, and with third-party service provides, which may be subject to global data privacy laws and cross-border transfer restrictions. While we take steps to comply with these legal requirements, the volatility and changes to the applicability of those laws may impact our ability to effectively transfer data across borders in support of our business operations.
Seasonality
Our operations have been subject to seasonal fluctuations that may impact our cash flows for a particular period. Historically our sales are generally strongest in the fourth quarter of the fiscal year when all of our business segments are normally operating at seasonal peaks, and our sales are generally weaker in the third quarter of the fiscal year, primarily due to reduced activity in the building and construction industry as a result of the colder, more inclement weather, as well as customer plant shutdowns in the automotive industry due to holidays. Our quarterly results may also be affected by the timing of large customer orders. Consequently, our cash flow from operations may fluctuate significantly from quarter to quarter. If, as a result of any such fluctuation, our quarterly cash flows were significantly reduced, we may be unable to service our indebtedness or maintain compliance with certain covenants under our credit facilities. A default under any of the documents governing our indebtedness could prevent us from borrowing additional funds, limit our ability to pay interest or principal and allow our lenders to declare the amounts outstanding to be immediately due and payable and to exercise certain other remedies.
Impairment Charges
Weakness or instability in the general economy, our markets or our results of operations could result in future asset impairments, which would reduce our reported earnings and net worth. We review the carrying value of our long-lived assets, excluding purchased goodwill and intangible assets with indefinite lives, for impairment whenever events or changes in circumstances indicate that the carrying value of an asset or asset group may not be recoverable. Impairment testing involves a comparison of the sum of the undiscounted future cash flows of the asset or asset group to its respective carrying amount. If the sum of the undiscounted future cash flows exceeds the carrying amount, then no impairment exists. If the carrying amount exceeds the sum of the undiscounted future cash flows, then a second step is performed to determine the amount of impairment, if any, to be recognized. For long-lived assets other than goodwill, an impairment loss is recognized to the extent that the carrying amount of the asset or asset group exceeds fair value. Goodwill and intangible assets with indefinite lives are tested for impairment annually, during the fourth quarter, or more frequently if events or changes in circumstances indicate that impairment may be present. The goodwill impairment test consists of comparing the fair value of each reporting unit, determined using discounted cash flows, to each reporting unit’s respective carrying value. If the estimated fair value of the reporting unit exceeds its carrying value, there is no impairment. If the carrying amount of the reporting unit exceeds its estimated fair value, a goodwill impairment is indicated. The amount of the goodwill impairment is determined by comparing the fair value of the net assets of the reporting unit, excluding goodwill, to its estimated fair value, with the difference representing the implied fair value of the goodwill. If the implied fair value of the goodwill is lower than its carrying value, the difference is recorded as an impairment charge in our consolidated statement of earnings. Economic conditions remain fragile in some markets and the possibility remains that the domestic or global economies, or certain industry sectors that are key to our sales, may deteriorate. If certain of our business segments are adversely affected by challenging economic and financial conditions, we may be required to record future impairments, which would negatively impact our results of operations.
Item 1B. – Unresolved Staff Comments
None.
19
Table of Contents
General
Our principal corporate offices are located in an owned office building in Columbus, Ohio, containing approximately 117,700 square feet, which also houses the principal corporate offices of our Pressure Cylinders and Engineered Cabs operating segments. Our Steel Processing corporate offices are located in an office building next to the principal corporate offices that contains approximately 30,000 square feet of leased space. We also own three facilities used for administrative and medical purposes in Columbus, Ohio, containing an aggregate of approximately 166,000 square feet. As of May 31, 2017, we owned or leased a total of approximately 10,500,000 square feet of space for our operations, of which approximately 9,400,000 square feet (10,100,000 square feet with warehouses) was devoted to manufacturing, product distribution and sales offices. Major leases contain renewal options for periods of up to 10 years. For information concerning rental obligations, refer to “Item 7. – Management’s Discussion and Analysis of Financial Condition and Results of Operations –Contractual Cash Obligations and Other Commercial Commitments” as well as “Item 8. – Financial Statements and Supplementary Data – Notes to Consolidated Financial Statements – Note R – Operating Leases” of this Annual Report on Form 10-K. We believe the distribution and office facilities provide adequate space for our operations and are well maintained and suitable.
As of May 31, 2017, excluding our consolidated and unconsolidated joint ventures, we operated 30 manufacturing facilities and 8 warehouses. These facilities are well maintained and in good operating condition, and are believed to be sufficient to meet current needs.
Steel Processing
As of May 31, 2017, our wholly-owned operations within the Steel Processing operating segment operated a total of eight manufacturing facilities, seven of which are owned by the Company and contain approximately 2,300,000 square feet, and one which is leased and contains approximately 100,000 square feet. These facilities are located in Alabama, New York, Indiana, and Ohio (5). This operating segment also owns one warehouse in Ohio, containing approximately 110,000 square feet, and one warehouse in South Carolina, containing approximately 16,000 square feet. As noted above, this operating segment’s corporate offices are located in Columbus, Ohio.
Pressure Cylinders
As of May 31, 2017, our wholly-owned operations within the Pressure Cylinders operating segment operated a total of 19 manufacturing facilities, 17 of which are owned by the Company and contain a total of approximately 3,200,000 square feet, and two of which are leased and contain approximately 300,000 square feet. These facilities are located in Alabama, California, Kansas (2), North Carolina, North Dakota, Ohio (6), Oklahoma, Utah, Wisconsin, Austria, Poland (2) and Portugal. Pressure Cylinders also operated three owned warehouses, one each in Ohio, Austria and Poland, that contain a total of approximately 200,000 square feet, and one leased warehouse in Ohio that contains approximately 200,000 square feet. As noted above, this operating segment’s corporate offices are located in Columbus, Ohio.
The AMTROL acquisition on June 2, 2017 added owned manufacturing facilities in Kentucky, Maryland, Rhode Island and Portugal to the Pressure Cylinders operating segment, as well as one leased manufacturing facility in Portugal and leased warehouses in Rhode Island, Portugal and Kentucky.
Engineered Cabs
Engineered Cabs operates two manufacturing facilities owned by the Company that contain a total of approximately 600,000 square feet, and which are located in South Dakota and Tennessee. This operating segment also has two leased warehouses which are located in South Dakota and Tennessee, containing approximately 45,000 square feet. Engineered Cabs’ corporate offices are located in Columbus, Ohio. The Packaging Solutions business which was recently moved to this segment operates one leased 33,000 square feet facility in Indiana.
20
Table of Contents
Other
The Other category includes a Company-owned manufacturing facility in Wooster, Ohio, that is subject to a lease agreement with our automotive body panels joint venture, ArtiFlex, and contains approximately 900,000 square feet.
Joint Ventures
As outlined below, our consolidated and unconsolidated joint ventures operate a total of 50 manufacturing facilities.
Consolidated
| • | Spartan owns and operates one manufacturing facility in Monroe, Michigan. |
| • | TWB operates nine manufacturing facilities, one owned facility located in Monroe, Michigan, and eight leased facilities located in Kentucky, Tennessee (2), Canada, and Mexico (4). |
| • | WEI leases one manufacturing facility in Fremont, Ohio. |
| • | Worthington Aritas operates one owned manufacturing facility in Bandirma, Turkey. |
| • | WSP owns and operates three steel processing facilities located in Michigan. |
Unconsolidated
| • | ArtiFlex operates six manufacturing facilities, four of which are owned. These facilities are located in Kentucky (1), Michigan (3), and Ohio (2). |
| • | ClarkDietrich operates 14 manufacturing facilities, one each in Connecticut, Georgia, Hawaii, Illinois, Maryland and Missouri and two each in California, Florida, Ohio and Texas. The two facilities in Ohio are owned. The remaining 12 facilities are leased. |
| • | Samuel owns and operates two steel pickling facilities in Ohio. |
| • | Serviacero Worthington owns and operates three steel processing facilities in Mexico. |
| • | WAVE operates nine facilities in five countries, five of which are located in the United States, including one owned facility each in Michigan and Nevada, and one leased facility each in California, Georgia and Maryland. The foreign facilities include one owned facility each in China, France and India, and one leased facility in the United Kingdom. |
| • | Zhejiang Nisshin Worthington Precision Specialty Steel Co., Ltd, operates one steel processing facility in Pinghu City, Zhejiang, China. |
The Company is involved in various judicial and administrative proceedings as both plaintiff and defendant, arising in the ordinary course of business. The Company does not believe that any such proceedings will have a material adverse effect on its business, financial position, results of operation or cash flows.
21
Table of Contents
Item 4. – Mine Safety Disclosures
Not Applicable
Supplemental Item – Executive Officers of the Registrant
The following table lists the names, positions held and ages of the individuals serving as executive officers of the Registrant as of July 24, 2017.
| Name |
Age | Position(s) with the Registrant |
Present Office Held Since |
|||||||
| John P. McConnell |
63 | Chairman of the Board and Chief Executive Officer; a Director | 1996 | |||||||
| Mark A. Russell |
54 | President and Chief Operating Officer | 2012 | |||||||
| B. Andrew Rose |
47 | Executive Vice President and Chief Financial Officer | 2014 | |||||||
| Dale T. Brinkman |
64 | Vice President-Administration, General Counsel and Secretary | 2000 | |||||||
| Terrance M. Dyer |
50 | Vice President-Human Resources | 2012 | |||||||
| Geoffrey G. Gilmore |
45 | President-Worthington Cylinder Corporation | 2016 | |||||||
| John G. Lamprinakos |
59 | President-The Worthington Steel Company | 2016 | |||||||
| Catherine M. Lyttle |
58 | Vice President-Communications and Investor Relations | 2009 | |||||||
| Richard G. Welch |
59 | Corporate Controller | 2000 | |||||||
| Virgil L. Winland |
69 | Senior Vice President-Manufacturing | 2001 | |||||||
John P. McConnell has served as Worthington Industries’ Chief Executive Officer since June 1993, as a director of Worthington Industries continuously since 1990, and as Chairman of the Board of Worthington Industries since September 1996. Mr. McConnell serves as the Chair of the Executive Committee of Worthington Industries’ Board of Directors. He served in various positions with the Company from 1975 to June 1993.
Mark A. Russell has served as President and Chief Operating Officer of Worthington Industries since August 1, 2012. From February 2007 to July 31, 2012, Mr. Russell served as President of The Worthington Steel Company.
B. Andrew ‘Andy’ Rose has served as Executive Vice President of Worthington Industries since July 2014 and as Chief Financial Officer since December 2008. From December 2008 to July 2014, Mr. Rose also served as Vice President of Worthington Industries. From 2007 to 2008, he served as a senior investment professional with MCG Capital Corporation, a publicly-traded company specializing in debt and equity investments in middle market companies; and from 2002 to 2007, he was a founding partner at Peachtree Equity Partners, L.P., a private equity firm backed by Goldman Sachs.
Dale T. Brinkman has served as Worthington Industries’ Vice President-Administration since December 1998 and as Worthington Industries’ General Counsel since September 1982. He has been Secretary of Worthington Industries since September 2000 and served as Assistant Secretary of Worthington Industries from September 1982 to September 2000.
Terrance M. Dyer has served as Vice President-Human Resources of Worthington Industries since June 2012. From October 2009 to June 2012, he served as the Vice President-Human Resources for our WAVE joint venture in Malvern, Pennsylvania. Prior to serving as Vice President-Human Resources for WAVE, Mr. Dyer spent five years in various human resources roles of increasing responsibility at Armstrong World Industries.
22
Table of Contents
Geoffrey G. Gilmore has served as President of Worthington Cylinder Corporation since June 2016. He served as President of The Worthington Steel Company from August 2012 through May 2016. From July 2011 to July 2012, he served as Vice President-Purchasing for Worthington Industries. From April 2010 to July 2011, he served as General Manager of The Worthington Steel Company’s Delta, Ohio facility; and from June 2006 to February 2010, he served as Director of Automotive Sales for The Worthington Steel Company. Mr. Gilmore served in various other positions with the Company from 1998 to June 2006.
John G. Lamprinakos has served as President of The Worthington Steel Company since June 2016. He served as President of Worthington Industries Engineered Cabs from June 2013 through May 2016. From December 2004 to July 2013, Mr. Lamprinakos served as President and Chief Executive Officer of our WAVE joint venture in Malvern, Pennsylvania. Before joining WAVE, Mr. Lamprinakos spent 24 years at Worthington Cylinder Corporation, including as President from 2001 to 2003.
Catherine M. Lyttle has served as Vice President-Communications and Investor Relations of Worthington Industries since April 2009. She served as Vice President of Communications of Worthington Industries from January 1999 to April 2009. Ms. Lyttle served as Vice President of Marketing for the Columbus Chamber of Commerce from 1987 to September 1997 and as Vice President of JMAC Hockey from 1997 to 1999.
Richard G. Welch has served as the Corporate Controller of Worthington Industries since March 2000 and prior thereto, he served as Assistant Controller of Worthington Industries from August 1999 to March 2000. He served as Principal Financial Officer of Worthington Industries on an interim basis from September 2008 to December 2008.
Virgil L. Winland has served as Senior Vice President-Manufacturing of Worthington Industries since January 2001. He served in various other positions with the Company from 1971 to January 2001, including as President of Worthington Cylinder Corporation from June 1998 through January 2001.
Executive officers serve at the pleasure of the directors of the Registrant. There are no family relationships among any of the Registrant’s executive officers or directors. No arrangements or understandings exist pursuant to which any individual has been, or is to be, selected as an executive officer of the Registrant.
23
Table of Contents
Item 5. – Market for Registrant’s Common Equity, Related Stockholder Matters and Issuer Purchases of Equity Securities
Common Shares Information
The common shares of Worthington Industries, Inc. (“Worthington Industries”) trade on the New York Stock Exchange (“NYSE”) under the symbol “WOR” and are listed in most newspapers as “WorthgtnInd.” As of July 19, 2017, Worthington Industries had 5,096 registered shareholders. The following table sets forth (i) the low and high closing prices and the closing price per share for Worthington Industries’ common shares for each quarter of fiscal 2017 and fiscal 2016, and (ii) the cash dividends per share declared on Worthington Industries’ common shares for each quarter of fiscal 2017 and fiscal 2016.
| Market Price | Cash Dividends Declared |
|||||||||||||||
| Low | High | Closing | ||||||||||||||
| Fiscal 2017 Quarter Ended |
||||||||||||||||
| August 31, 2016 |
$ | 36.26 | $ | 45.47 | $ | 42.90 | $ | 0.20 | ||||||||
| November 30, 2016 |
$ | 39.75 | $ | 62.35 | $ | 56.28 | $ | 0.20 | ||||||||
| February 28, 2017 |
$ | 46.12 | $ | 58.85 | $ | 49.05 | $ | 0.20 | ||||||||
| May 31, 2017 |
$ | 41.18 | $ | 51.96 | $ | 41.97 | $ | 0.20 | ||||||||
| Fiscal 2016 Quarter Ended |
||||||||||||||||
| August 31, 2015 |
$ | 23.52 | $ | 30.92 | $ | 25.59 | $ | 0.19 | ||||||||
| November 30, 2015 |
$ | 21.88 | $ | 32.14 | $ | 30.77 | $ | 0.19 | ||||||||
| February 29, 2016 |
$ | 26.41 | $ | 31.12 | $ | 31.11 | $ | 0.19 | ||||||||
| May 31, 2016 |
$ | 32.06 | $ | 38.26 | $ | 37.36 | $ | 0.19 | ||||||||
Dividends are declared at the discretion of Worthington Industries’ Board of Directors (the “Board”). The Board declared quarterly dividends of $0.20 per common share in fiscal 2017 and of $0.19 per common share in fiscal 2016. On June 28, 2017, the Board declared a quarterly dividend of $0.21 per common share for the first quarter of fiscal 2018. This dividend is payable on September 29, 2017, to shareholders of record as of September 15, 2017.
The Board reviews the dividend on a quarterly basis and establishes the dividend rate based upon Worthington Industries’ financial condition, results of operations, capital requirements, current and projected cash flows, business prospects and other factors which the directors may deem relevant. While Worthington Industries has paid a dividend every quarter since becoming a public company in 1968, there is no guarantee this will continue in the future. We currently have no material contractual or regulatory restrictions on the payment of dividends.
Shareholder Return Performance
The following information in this Item 5 of this Annual Report on Form 10-K is not deemed to be “soliciting material” or to be “filed” with the Securities and Exchange Commission or subject to Regulation 14A or Regulation 14C under the Securities Exchange Act of 1934, as amended (the “Exchange Act”), or to the liabilities of Section 18 of the Exchange Act, and will not be deemed to be incorporated by reference into any filing under the Securities Act of 1933, as amended, or the Exchange Act, except to the extent we specifically incorporate such information into such a filing.
24
Table of Contents
The following graph compares the five-year cumulative return on Worthington Industries’ common shares, the S&P Midcap 400 Index and the S&P 1500 Steel Composite Index. The graph assumes that $100 was invested at May 31, 2012, in Worthington Industries’ common shares and each index.
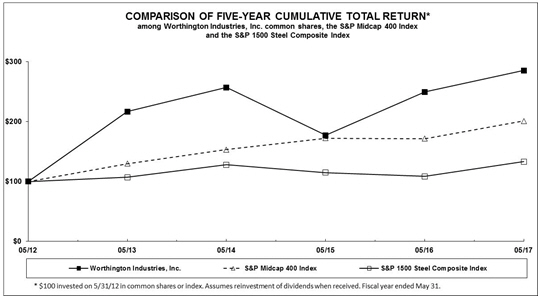
| 05/12 | 05/13 | 05/14 | 05/15 | 05/16 | 05/17 | |||||||||||||||||||
| Worthington Industries, Inc. |
$ | 100.00 | $ | 216.66 | $ | 256.98 | $ | 177.01 | $ | 249.65 | $ | 285.39 | ||||||||||||
| S&P Midcap 400 Index |
$ | 100.00 | $ | 129.95 | $ | 153.40 | $ | 172.23 | $ | 171.51 | $ | 200.94 | ||||||||||||
| S&P 1500 Steel Composite Index |
$ | 100.00 | $ | 107.06 | $ | 127.93 | $ | 115.05 | $ | 108.52 | $ | 133.14 | ||||||||||||
Data and graph provided by Zacks Investment Research, Inc. Copyright© 2017, Standard & Poor’s, a division of The McGraw-Hill Companies, Inc. All rights reserved. Used with permission.
Worthington Industries is a component of the S&P Midcap 400 Index. The S&P 1500 Steel Composite Index, of which Worthington Industries is also a component, is the most specific index relative to the largest line of business of Worthington Industries and its subsidiaries. At May 31, 2017, the S&P 1500 Steel Composite Index included 13 steel related companies from the S&P 500, S&P Midcap 400 and S&P 600 indices: AK Steel Holding Corporation; Carpenter Technology Corporation; Commercial Metals Company; Haynes International, Inc.; Nucor Corporation; Olympic Steel, Inc.; Reliance Steel & Aluminum Co.; Steel Dynamics, Inc.; Stillwater Mining Co.; SunCoke Energy, Inc.; TimkenSteel Corporation; United States Steel Corporation; and Worthington Industries, Inc.
25
Table of Contents
Issuer Purchases of Equity Securities
The following table provides information about purchases made by, or on behalf of, Worthington Industries, Inc. or any “affiliated purchaser” (as defined in Rule 10b – 18(a) (3) under the Exchange Act) of common shares of Worthington Industries, Inc. during each month of the fiscal quarter ended May 31, 2017:
| Period |
Total Number of Common Shares Purchased |
Average Price Paid per Common Share |
Total Number of Common Shares Purchased as Part of Publicly Announced Plans or Programs |
Maximum Number of Common Shares that May Yet Be Purchased Under the Plans or Programs (1) |
||||||||||||
| March 1-31, 2017 (2) |
2,544 | $ | 45.09 | - | 4,046,145 | |||||||||||
| April 1-30, 2017 |
- | - | - | 4,046,145 | ||||||||||||
| May 1-31, 2017 (2) |
2,009 | $ | 42.40 | - | 4,046,145 | |||||||||||
|
|
|
|
|
|
|
|||||||||||
| Total |
4,553 | $ | 43.90 | - | ||||||||||||
|
|
|
|
|
|
|
|||||||||||
| (1) | The number shown represents, as of the end of each period, the maximum number of common shares that could be purchased under the publicly announced repurchase authorization then in effect. On June 26, 2014, Worthington Industries, Inc. announced that on June 25, 2014, the Board had authorized the repurchase of up to 10,000,000 of Worthington Industries’ outstanding common shares. A total of 4,046,145 common shares were available under this repurchase authorization at May 31, 2017. |
The common shares available for repurchase under this authorization may be purchased from time to time, with consideration given to the market price of the common shares, the nature of other investment opportunities, cash flows from operations, general economic conditions and other appropriate factors. Repurchases may be made on the open market or through privately negotiated transactions.
| (2) | Includes an aggregate of 4,553 common shares surrendered by employees in the period from March 1, 2017 through May 31, 2017 to satisfy tax withholding obligations upon the vesting of restricted common shares. These common shares were not counted against the share repurchase authorization in effect throughout fiscal 2017 and discussed in footnote (1) above. |
26
Table of Contents
Item 6. – Selected Financial Data
| Fiscal Years Ended May 31, | ||||||||||||||||||||
| (In thousands, except per share amounts) | 2017 | 2016 | 2015 | 2014 | 2013 | |||||||||||||||
| FINANCIAL RESULTS |
||||||||||||||||||||
| Net sales |
$ | 3,014,108 | $ | 2,819,714 | $ | 3,384,234 | $ | 3,126,426 | $ | 2,612,244 | ||||||||||
| Cost of goods sold |
2,478,203 | 2,367,121 | 2,920,701 | 2,633,907 | 2,215,601 | |||||||||||||||
|
|
|
|
|
|
|
|
|
|
|
|||||||||||
| Gross margin |
535,905 | 452,593 | 463,533 | 492,519 | 396,643 | |||||||||||||||
| Selling, general and administrative expense |
316,373 | 297,402 | 295,920 | 300,396 | 258,324 | |||||||||||||||
| Impairment of goodwill and long-lived assets |
— | 25,962 | 100,129 | 58,246 | 6,488 | |||||||||||||||
| Restructuring and other expense (income) |
6,411 | 7,177 | 6,927 | (1,876 | ) | 2,689 | ||||||||||||||
|
|
|
|
|
|
|
|
|
|
|
|||||||||||
| Operating income |
213,121 | 122,052 | 60,557 | 135,753 | 129,142 | |||||||||||||||
| Miscellaneous income |
3,764 | 11,267 | 795 | 16,963 | 1,452 | |||||||||||||||
| Interest expense |
(29,796 | ) | (31,670 | ) | (35,800 | ) | (26,671 | ) | (23,918 | ) | ||||||||||
| Equity in net income of unconsolidated affiliates |
110,038 | 114,966 | 87,476 | 91,456 | 94,624 | |||||||||||||||
|
|
|
|
|
|
|
|
|
|
|
|||||||||||
| Earnings before income taxes |
297,127 | 216,615 | 113,028 | 217,501 | 201,300 | |||||||||||||||
| Income tax expense |
79,190 | 58,987 | 25,772 | 57,349 | 64,465 | |||||||||||||||
|
|
|
|
|
|
|
|
|
|
|
|||||||||||
| Net earnings |
217,937 | 157,628 | 87,256 | 160,152 | 136,835 | |||||||||||||||
| Net earnings attributable to noncontrolling interests |
13,422 | 13,913 | 10,471 | 8,852 | 393 | |||||||||||||||
|
|
|
|
|
|
|
|
|
|
|
|||||||||||
| Net earnings attributable to controlling interest |
$ | 204,515 | $ | 143,715 | $ | 76,785 | $ | 151,300 | $ | 136,442 | ||||||||||
|
|
|
|
|
|
|
|
|
|
|
|||||||||||
| Earnings per share - diluted: |
||||||||||||||||||||
| Net earnings per share attributable to controlling interest |
$ | 3.15 | $ | 2.22 | $ | 1.12 | $ | 2.11 | $ | 1.91 | ||||||||||
|
|
|
|
|
|
|
|
|
|
|
|||||||||||
| Depreciation and amortization |
$ | 86,793 | $ | 84,699 | $ | 85,089 | $ | 79,730 | $ | 66,469 | ||||||||||
| Capital expenditures (including acquisitions and investments) |
68,386 | 136,837 | 210,346 | 82,855 | 219,813 | |||||||||||||||
| Cash dividends declared |
51,448 | 47,949 | 48,308 | 41,816 | 36,471 | |||||||||||||||
| Per common share |
$ | 0.80 | $ | 0.76 | $ | 0.72 | $ | 0.60 | $ | 0.52 | ||||||||||
| Average common shares outstanding - diluted |
64,874 | 64,755 | 68,483 | 71,664 | 71,314 | |||||||||||||||
| FINANCIAL POSITION |
||||||||||||||||||||
| Total current assets |
$ | 1,190,969 | $ | 915,115 | $ | 991,848 | $ | 1,198,550 | $ | 866,671 | ||||||||||
| Total current liabilities |
520,783 | 430,078 | 524,392 | 589,635 | 448,914 | |||||||||||||||
|
|
|
|
|
|
|
|
|
|
|
|||||||||||
| Working capital |
$ | 670,186 | $ | 485,037 | $ | 467,456 | $ | 608,915 | $ | 417,757 | ||||||||||
|
|
|
|
|
|
|
|
|
|
|
|||||||||||
| Total property, plant and equipment, net |
$ | 570,489 | $ | 582,838 | $ | 513,190 | $ | 498,861 | $ | 459,430 | ||||||||||
| Total assets |
2,325,344 | 2,061,264 | 2,082,305 | 2,293,578 | 1,949,681 | |||||||||||||||
| Total debt |
578,610 | 581,004 | 667,905 | 663,521 | 519,880 | |||||||||||||||
| Total shareholders’ equity - controlling interest |
951,635 | 793,371 | 749,112 | 850,812 | 830,822 | |||||||||||||||
| Per share |
$ | 15.15 | $ | 12.89 | $ | 11.68 | $ | 12.62 | $ | 11.91 | ||||||||||
| Common shares outstanding |
62,802 | 61,534 | 64,141 | 67,408 | 69,752 | |||||||||||||||
Worthington Specialty Processing has been reflected since March 2016 when the Company obtained effective control of this joint venture. The acquisition of the assets of NetBraze, LLC has been reflected since January 2016. The acquisition of the assets of the CryoScience business of Taylor Wharton has been reflected since December 2015. Our aluminum high-pressure cylinder business has been excluded since its disposal in May 2015. The Advanced Component Technologies, Inc. business has been excluded since its disposal in January 2015. The acquisition of the assets of Rome Strip Steel Company, Inc. has been reflected since January 2015. The operations of dHybrid Systems, LLC have been reflected since October 2014. The acquisition of the assets of Midstream Equipment Fabrication LLC has been reflected since August 2014. The acquisition of the assets of James Russell Engineering Works, Inc. has been reflected since July 2014. The operations of the tank manufacturing division of Steffes Corporation have been reflected since their acquisition in March 2014. The operations of Worthington Arıtaş Basınçlı Kaplar Sanayi have been reflected since January 2014 when we acquired our 75% ownership interest. Our small and medium steel high pressure industrial gas and acetylene cylinders business in North America has been excluded from consolidated operating results since its disposition in November 2013. TWB Company, L.L.C. has been reflected since July 2013 when we acquired an additional 10% ownership interest bringing our total to 55%. The acquisition of the assets of Palmer Mfg. & Tank, Inc. has been reflected since April 2013. Our European air brake tank operations in Czech Republic have been excluded since their disposal in October 2012. Westerman, Inc. has been reflected since its acquisition in September 2012.
27
Table of Contents
Item 7. – Management’s Discussion and Analysis of Financial Condition and Results of Operations
Selected statements contained in this “Item 7. – Management’s Discussion and Analysis of Financial Condition and Results of Operations” constitute “forward-looking statements” as that term is used in the Private Securities Litigation Reform Act of 1995. Such forward-looking statements are based, in whole or in part, on management’s beliefs, estimates, assumptions and currently available information. For a more detailed discussion of what constitutes a forward-looking statement and of some of the factors that could cause actual results to differ materially from such forward-looking statements, please refer to the “Safe Harbor Statement” in the beginning of this Annual Report on Form 10-K and “Part I – Item 1A. – Risk Factors” of this Annual Report on Form 10-K.
Introduction
Worthington Industries, Inc. is a corporation formed under the laws of the State of Ohio (individually, the “Registrant” or “Worthington Industries” or, collectively with the subsidiaries of Worthington Industries, Inc., “we,” “our,” “Worthington” or the “Company”). Founded in 1955, Worthington is primarily a diversified metals manufacturing company, focused on value-added steel processing and manufactured metal products. Our manufactured metal products include: pressure cylinders for liquefied petroleum gas (“LPG”), compressed natural gas (“CNG”), oxygen, refrigerant and other industrial gas storage; hand torches and filled hand torch cylinders; propane-filled camping cylinders; helium-filled balloon kits; steel and fiberglass tanks and processing equipment primarily for the oil and gas industry; cryogenic pressure vessels for liquefied natural gas (“LNG”) and other gas storage applications; engineered cabs and operator stations and cab components; and, through joint ventures, suspension grid systems for concealed and lay-in panel ceilings; laser welded blanks; light gauge steel framing for commercial and residential construction; and current and past model automotive service stampings. Our number one goal is to increase shareholder value, which we seek to accomplish by optimizing existing operations, developing and commercializing new products and applications, and pursuing strategic acquisitions and joint ventures.
As of May 31, 2017, excluding our joint ventures, we operated 30 manufacturing facilities worldwide, principally in three operating segments, which correspond with our reportable business segments: Steel Processing, Pressure Cylinders and Engineered Cabs. Our remaining operating segment consists of Worthington Energy Innovations (“WEI”), which does not meet the applicable aggregation criteria or quantitative thresholds for separate disclosure, and therefore is combined and reported in the “Other” category.
We also held equity positions in 11 joint ventures, which operated 50 manufacturing facilities worldwide, as of May 31, 2017. Five of these joint ventures are consolidated with the equity owned by the other joint venture member(s) shown as noncontrolling interests in our consolidated balance sheets, and the other joint venture member(s)’ portion of net earnings and other comprehensive income shown as net earnings or comprehensive income attributable to noncontrolling interests in our consolidated statements of earnings and consolidated statements of comprehensive income, respectively. The remaining six of these joint ventures are accounted for using the equity method.
Overview
The Company’s performance during fiscal 2017 was highlighted by record earnings at Steel Processing, modest improvement at Pressure Cylinders and Engineered Cabs, and a decline in earnings from the Company’s unconsolidated joint ventures. At Steel Processing, favorable pricing spreads, which benefited from significant inventory holding gains in the current year, combined with higher overall volume, increased margins. Pressure Cylinders’ performance was mixed, as earnings growth in the consumer products business was partially offset by weakness in the industrial products and oil & gas equipment businesses. Engineered Cabs’ results also improved as cost reduction efforts led to an increase in gross margin and lower selling, general and administrative expense.
Equity in net income of unconsolidated affiliates (“equity income”) decreased 4% in fiscal 2017 to $110.0 million on lower contributions from WAVE due to accelerated customer purchases in the fourth quarter of fiscal 2016, lower offload business at ArtiFlex and the impact of the consolidation of the Worthington Specialty Processing (“WSP”) joint venture into Steel Processing effective March 1, 2016. We received distributions of $102.0 million from our unconsolidated affiliates during fiscal 2017.
28
Table of Contents
Recent Business Developments
| • | During the first quarter of fiscal 2017, the Company completed the exit of the businesses within its former Construction Services operating segment. |
| • | On October 1, 2016, the Company announced certain organizational changes impacting its Pressure Cylinders operating segment, including the consolidation of the Cryogenics business into the Industrial Products business unit. |
| • | Effective June 1, 2017, we made certain organizational changes impacting the internal reporting and management structure of Packaging Solutions. As a result of these organizational changes, management responsibilities and internal reporting were realigned, moving from the Steel Processing operating segment to the Engineered Cabs operating segment, where we expect to achieve synergies in design engineering and manufacturing development. |
| • | On June 2, 2017, the Company acquired AMTROL, a leading manufacturer of pressure cylinders and water system tanks with operations in the U.S. and Europe. The total purchase price was $283.0 million and is subject to adjustment based on closing working capital. A portion of the purchase price was used to settle certain indebtedness and other liabilities assumed by the Company in the transaction. The acquisition was funded primarily with cash on hand. |
| • | On June 28, 2017, the Board of Directors of Worthington Industries (the “Board”) declared a quarterly dividend of $0.21 per share, an increase of $0.01 per share from the previous quarterly rate. The dividend is payable on September 29, 2017 to shareholders of record on September 15, 2017. |
Market & Industry Overview
We sell our products and services to a diverse customer base and a broad range of end markets. The breakdown of our net sales by end market for fiscal 2017 and fiscal 2016 is illustrated in the following chart:
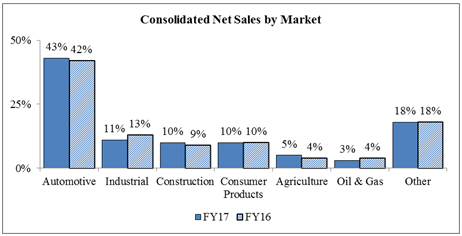
The automotive industry is one of the largest consumers of flat-rolled steel, and thus the largest end market for our Steel Processing operating segment. Approximately 62% of the net sales of our Steel Processing operating segment are to the automotive market. North American vehicle production, primarily by Ford, General Motors and FCA US (the “Detroit Three automakers”), has a considerable impact on the activity within this operating segment. The majority of the net sales of three of our unconsolidated joint ventures are also to the automotive end market.
29
Table of Contents
Approximately 12% of the net sales of our Steel Processing operating segment and 49% of the net sales of our Engineered Cabs operating segment are to the construction market. The construction market is also the predominant end market for two of our unconsolidated joint ventures: WAVE and ClarkDietrich. While the market price of steel significantly impacts these businesses, there are other key indicators that are meaningful in analyzing construction market demand, including U.S. gross domestic product (“GDP”), the Dodge Index of construction contracts and, in the case of ClarkDietrich, trends in the relative price of framing lumber and steel.
Substantially all of the net sales of our Pressure Cylinders operating segment, and approximately 26% and 51% of the net sales of our Steel Processing and Engineered Cabs operating segments, respectively, are to other markets such as consumer products, industrial, lawn and garden, agriculture, oil & gas equipment, heavy truck, mining, forestry and appliance. Given the many different products that make up these net sales and the wide variety of end markets, it is very difficult to detail the key market indicators that drive this portion of our business. However, we believe that the trend in U.S. GDP growth is a good economic indicator for analyzing these operating segments.
We use the following information to monitor our costs and demand in our major end markets:
| 2017 | 2016 | 2015 | 2017 vs. 2016 |
2016 vs. 2015 |
||||||||||||||||
| U.S. GDP (% growth year-over-year)1 |
1.6 | % | 1.9 | % | 2.5 | % | -0.3 | % | -0.6 | % | ||||||||||
| Hot-Rolled Steel ($ per ton)2 |
$ | 601 | $ | 437 | $ | 591 | $ | 164 | $ | (154 | ) | |||||||||
| Detroit Three Auto Build (000’s vehicles)3 |
9,216 | 9,296 | 9,069 | (80 | ) | 227 | ||||||||||||||
| No. America Auto Build (000’s vehicles)3 |
18,329 | 18,181 | 17,145 | 148 | 1,036 | |||||||||||||||
| Zinc ($ per pound)4 |
$ | 1.13 | $ | 0.80 | $ | 0.98 | $ | 0.33 | $ | (0.18 | ) | |||||||||
| Natural Gas ($ per mcf)5 |
$ | 3.01 | $ | 2.31 | $ | 3.60 | $ | 0.70 | $ | (1.29 | ) | |||||||||
| On-Highway Diesel Fuel Prices ($ per gallon)6 |
$ | 2.58 | $ | 2.40 | $ | 3.38 | $ | 0.18 | $ | (0.98 | ) | |||||||||
| Crude Oil - WTI ($ per barrel)6 |
$ | 48.80 | $ | 42.67 | $ | 73.16 | $ | 6.13 | $ | (30.49 | ) | |||||||||
1 2016/2015 figures based on revised actuals 2 CRU Hot-Rolled Index; period average 3 IHS Global 4 LME Zinc; period average 5 NYMEX Henry Hub Natural Gas; period average 6 Energy Information Administration; period average
U.S. GDP growth rate trends are generally indicative of the strength in demand and, in many cases, pricing for our products. A year-over-year increase in U.S. GDP growth rates is indicative of a stronger economy, which generally increases demand and pricing for our products. Conversely, decreasing U.S. GDP growth rates generally indicate a weaker economy. Changes in U.S. GDP growth rates can also signal changes in conversion costs related to production and in selling, general and administrative (“SG&A”) expense.
The market price of hot-rolled steel is one of the most significant factors impacting our selling prices and operating results. When steel prices fall, we typically have higher-priced material flowing through cost of goods sold, while selling prices compress to what the market will bear, negatively impacting our results. On the other hand, in a rising price environment, our results are generally favorably impacted, as lower-priced material purchased in previous periods flows through cost of goods sold, while our selling prices increase at a faster pace to cover current replacement costs.
30
Table of Contents
The following table presents the average quarterly market price per ton of hot-rolled steel during fiscal 2017, fiscal 2016 and fiscal 2015:
| Fiscal Year | ||||||||||||
| (Dollars per ton 1) | 2017 | 2016 | 2015 | |||||||||
| 1st Quarter |
$ | 617 | $ | 461 | $ | 673 | ||||||
| 2nd Quarter |
$ | 544 | $ | 419 | $ | 651 | ||||||
| 3rd Quarter |
$ | 608 | $ | 381 | $ | 578 | ||||||
| 4th Quarter |
$ | 636 | $ | 486 | $ | 464 | ||||||
| Annual Avg. |
$ | 601 | $ | 437 | $ | 591 | ||||||
1 CRU Hot-Rolled Index
No single customer contributed more than 10% of our consolidated net sales during fiscal 2017. While our automotive business is largely driven by the production schedules of the Detroit Three automakers, our customer base is much broader and includes other domestic manufacturers and many of their suppliers. During fiscal 2017, vehicle production for the Detroit Three automakers was down 1%, while North American vehicle production as a whole increased 1%.
Certain other commodities, such as zinc, natural gas and diesel fuel, represent a significant portion of our cost of goods sold, both directly through our plant operations and indirectly through transportation and freight expense.
31
Table of Contents
Results of Operations
Fiscal 2017 Compared to Fiscal 2016
Consolidated Operations
The following table presents consolidated operating results for the periods indicated:
| Fiscal Year Ended May 31, | ||||||||||||||||||||
| (Dollars in millions) | 2017 | % of Net sales |
2016 | % of Net sales |
Increase/ (Decrease) |
|||||||||||||||
| Net sales |
$ | 3,014.1 | 100.0 | % | $ | 2,819.7 | 100.0 | % | $ | 194.4 | ||||||||||
| Cost of goods sold |
2,478.2 | 82.2 | % | 2,367.1 | 83.9 | % | 111.1 | |||||||||||||
|
|
|
|
|
|
|
|||||||||||||||
| Gross margin |
535.9 | 17.8 | % | 452.6 | 16.1 | % | 83.3 | |||||||||||||
| Selling, general and administrative expense |
316.4 | 10.5 | % | 297.4 | 10.5 | % | 19.0 | |||||||||||||
| Impairment of long-lived assets |
— | 0.0 | % | 26.0 | 0.9 | % | (26.0 | ) | ||||||||||||
| Restructuring and other expense |
6.4 | 0.2 | % | 7.2 | 0.3 | % | (0.8 | ) | ||||||||||||
|
|
|
|
|
|
|
|||||||||||||||
| Operating income |
213.1 | 7.1 | % | 122.0 | 4.3 | % | 91.1 | |||||||||||||
| Miscellaneous income |
3.8 | 0.1 | % | 11.3 | 0.4 | % | (7.5 | ) | ||||||||||||
| Interest expense |
(29.8 | ) | -1.0 | % | (31.7 | ) | -1.1 | % | (1.9 | ) | ||||||||||
| Equity in net income of unconsolidated affiliates |
110.0 | 3.6 | % | 115.0 | 4.1 | % | (5.0 | ) | ||||||||||||
| Income tax expense |
(79.2 | ) | -2.6 | % | (59.0 | ) | -2.1 | % | 20.2 | |||||||||||
|
|
|
|
|
|
|
|||||||||||||||
| Net earnings |
217.9 | 7.2 | % | 157.6 | 5.6 | % | 60.3 | |||||||||||||
| Net earnings attributable to noncontrolling interests |
13.4 | 0.4 | % | 13.9 | 0.5 | % | (0.5 | ) | ||||||||||||
|
|
|
|
|
|
|
|||||||||||||||
| Net earnings attributable to controlling interest |
$ | 204.5 | 6.8 | % | $ | 143.7 | 5.1 | % | $ | 60.8 | ||||||||||
|
|
|
|
|
|
|
|||||||||||||||
| Equity income by unconsolidated affiliate |
||||||||||||||||||||
| WAVE |
$ | 78.3 | $ | 82.7 | $ | (4.4 | ) | |||||||||||||
| ClarkDietrich |
17.3 | 14.6 | 2.7 | |||||||||||||||||
| Serviacero |
7.2 | 6.3 | 0.9 | |||||||||||||||||
| ArtiFlex |
7.0 | 10.3 | (3.3 | ) | ||||||||||||||||
| WSP |
— | 1.7 | (1.7 | ) | ||||||||||||||||
| Other |
0.2 | (0.6 | ) | 0.8 | ||||||||||||||||
|
|
|
|
|
|
|
|||||||||||||||
| Total |
$ | 110.0 | $ | 115.0 | $ | (5.0 | ) | |||||||||||||
|
|
|
|
|
|
|
|||||||||||||||
Fiscal 2017 net earnings attributable to controlling interest increased $60.8 million over fiscal 2016. Net sales and operating highlights were as follows:
| • | Net sales increased $194.4 million over fiscal 2016. The increase was driven by higher average direct selling prices in Steel Processing, which favorably impacted net sales by $156.9 million, partially offset by lower volume in Engineered Cabs and certain Pressure Cylinders businesses. Net sales were also favorably impacted by the consolidation of the WSP joint venture, which contributed net sales of $49.6 million. For additional information regarding the consolidation of WSP, refer to “Item 8. – Financial Statements and Supplementary Data – Notes to Consolidated Financial Statements – Note O – Acquisitions” of this Annual Report on Form 10-K. |
| • | Gross margin increased $83.3 million over fiscal 2016. The increase was driven primarily by higher gross margin at Steel Processing, up $68.9 million on an improved pricing spread and contributions from the consolidation of WSP. The remaining improvement in gross margin was driven by increases in Pressure Cylinders, where strength in consumer products was partially offset by weakness in industrial products and oil & gas equipment. |
| • | SG&A expense increased $19.0 million over fiscal 2016. The consolidation of WSP and the impact of prior year acquisitions in Pressure Cylinders accounted for $8.1 million of the increase. The remaining increase in SG&A expense was driven primarily by higher profit sharing and bonus expense and an increase in accrued legal costs, which were up a combined $14.2 million. Overall, SG&A expense as a percent of sales was flat as compared to the prior year. |
32
Table of Contents
| • | Impairment charges of $26.0 million in fiscal 2016 consisted of $23.0 million related to the impairment of certain long-lived assets in our oil & gas equipment business and $3.0 million related to the September 30, 2015 closure of the Engineered Cabs facility in Florence, South Carolina. For additional information regarding these impairment charges, refer to “Item 8. – Financial Statements and Supplementary Data – Notes to Consolidated Financial Statements – Note C – Goodwill and Other Long-Lived Assets” of this Annual Report on Form 10-K. |
| • | Restructuring and other expense totaled $6.4 million in fiscal 2017. A total of $3.4 million related to activities within Pressure Cylinders, including $2.0 million of costs incurred in connection with a plant consolidation at our cryogenics joint venture in Turkey. The remaining activity related to ongoing costs associated with previously completed plant closures in Steel Processing and Engineered Cabs. For additional information, refer to “Item 8. – Financial Statements and Supplementary Data – Notes to Consolidated Financial Statements – Note D – Restructuring and Other Expense” of this Annual Report on Form 10-K. |
| • | Miscellaneous income decreased $7.5 million from fiscal 2016. The decrease was primarily the result of a $6.9 million pre-tax gain related to the consolidation of WSP in the prior year. The gain represents the difference between the fair value of the Company’s previously-held ownership interest in WSP and its carrying value at the acquisition date. For additional information, refer to “Item 8. – Financial Statements and Supplementary Data – Notes to Consolidated Financial Statements – Note O – Acquisitions” of this Annual Report on Form 10-K. |
| • | Interest expense decreased $1.9 million from fiscal 2016. The decrease was driven primarily by lower average short-term borrowings. For additional information, refer to “Item 8. – Financial Statements and Supplementary Data – Notes to Consolidated Financial Statements – Note G – Debt and Receivables Securitization” of this Annual Report on Form 10-K. |
| • | Equity income decreased $5.0 million from fiscal 2016 to $110.0 million. The decrease was driven by lower contributions from WAVE due to accelerated customer purchases in the fourth quarter of fiscal 2016, lower offload business at ArtiFlex and the impact of the consolidation of WSP. The impact of these items was partially offset by higher contributions from ClarkDietrich, up $2.7 million despite a $4.5 million favorable impact related to legal settlements in the prior year. We received distributions of $102.0 million from our unconsolidated affiliates during fiscal 2017. For additional financial information regarding our unconsolidated affiliates, refer to “Item 8. – Financial Statements and Supplementary Data – Notes to Consolidated Financial Statements – Note B – Investments in Unconsolidated Affiliates” of this Annual Report on Form 10-K. |
| • | Income tax expense increased $20.2 million over fiscal 2016 due to higher earnings, partially offset by a $13.1 million increase in tax benefits associated with share-based payment awards. Fiscal 2017 income tax expense reflects an effective tax rate attributable to controlling interest of 27.9% vs. 29.1% in fiscal 2016. The 27.9% rate is lower than the federal statutory rate of 35% primarily as a result of tax benefits associated with share-based payment awards, benefits from the qualified production activities deduction, lower rates on foreign income, offset partially by state and local income taxes. For additional information, refer to “Item 8. – Financial Statements and Supplementary Data – Notes to Consolidated Financial Statements – Note L – Income Taxes” of this Annual Report on Form 10-K. |
33
Table of Contents
Segment Operations
Steel Processing
The following table presents a summary of operating results for our Steel Processing operating segment for the periods indicated:
| Fiscal Year Ended May 31, | ||||||||||||||||||||
| (Dollars in millions) | 2017 | % of Net sales |
2016 | % of Net sales |
Increase/ (Decrease) |
|||||||||||||||
| Net sales |
$ | 2,074.8 | 100.0 | % | $ | 1,843.7 | 100.0 | % | $ | 231.1 | ||||||||||
| Cost of goods sold |
1,757.0 | 84.7 | % | 1,594.8 | 86.5 | % | 162.2 | |||||||||||||
|
|
|
|
|
|
|
|||||||||||||||
| Gross margin |
317.8 | 15.3 | % | 248.9 | 13.5 | % | 68.9 | |||||||||||||
| Selling, general and administrative expense |
145.5 | 7.0 | % | 132.8 | 7.2 | % | 12.7 | |||||||||||||
| Restructuring and other expense |
1.8 | 0.1 | % | 4.1 | 0.2 | % | (2.3 | ) | ||||||||||||
|
|
|
|
|
|
|
|||||||||||||||
| Operating income |
$ | 170.5 | 8.2 | % | $ | 112.0 | 6.1 | % | $ | 58.5 | ||||||||||
|
|
|
|
|
|
|
|||||||||||||||
| Material cost |
$ | 1,364.5 | $ | 1,245.1 | $ | 119.4 | ||||||||||||||
| Tons shipped (in thousands) |
4,070 | 3,523 | 547 | |||||||||||||||||
Net sales and operating highlights were as follows:
| • | Net sales increased $231.1 million over fiscal 2016 driven primarily by higher average direct selling prices, which increased net sales by $156.9 million. The remaining increase was due to higher overall volume, including $49.6 million related to the consolidation of the WSP joint venture. The mix of direct versus toll tons processed was 52% to 48% compared to 58% to 42% in fiscal 2016. The change in mix was driven primarily by the consolidation of WSP. |
| • | Operating income increased $58.5 million over fiscal 2016 on higher gross margin, partially offset by higher SG&A expense. Favorable pricing spreads, which benefited from significant inventory holding gains in the current year compared to inventory holding losses in the prior year, and higher direct volume increased gross margin by $71.6 million and $10.8 million, respectively. This was partially offset by higher manufacturing expenses driven by higher profit sharing and bonus expense, an increase in healthcare costs and production/start-up costs associated with new production lines at our TWB joint venture. SG&A expense increased $12.7 million on higher allocated corporate costs, the consolidation of WSP, and higher profit sharing and bonus expense. Restructuring and other expense in fiscal 2017 consisted primarily of costs related to the closure of our stainless steel business, Precision Specialty Metals (“PSM”). |
34
Table of Contents
Pressure Cylinders
The following table presents a summary of operating results for our Pressure Cylinders operating segment for the periods indicated:
| Fiscal Year Ended May 31, | ||||||||||||||||||||
| (Dollars in millions) | 2017 | % of Net sales |
2016 | % of Net sales |
Increase/ (Decrease) |
|||||||||||||||
| Net sales |
$ | 829.8 | 100.0 | % | $ | 844.9 | 100.0 | % | $ | (15.1 | ) | |||||||||
| Cost of goods sold |
625.5 | 75.4 | % | 649.3 | 76.8 | % | (23.8 | ) | ||||||||||||
|
|
|
|
|
|
|
|||||||||||||||
| Gross margin |
204.3 | 24.6 | % | 195.6 | 23.2 | % | 8.7 | |||||||||||||
| Selling, general and administrative expense |
146.8 | 17.7 | % | 143.8 | 17.0 | % | 3.0 | |||||||||||||
| Impairment of long-lived assets |
- | 0.0 | % | 23.0 | 2.7 | % | (23.0 | ) | ||||||||||||
| Restructuring and other expense |
3.4 | 0.4 | % | 0.4 | 0.0 | % | 3.0 | |||||||||||||
|
|
|
|
|
|
|
|||||||||||||||
| Operating income |
$ | 54.1 | 6.5 | % | $ | 28.4 | 3.4 | % | $ | 25.7 | ||||||||||
|
|
|
|
|
|
|
|||||||||||||||
| Material cost |
$ | 338.4 | $ | 359.8 | $ | (21.4 | ) | |||||||||||||
| Net sales by principal class of products: |
||||||||||||||||||||
| Consumer products |
$ | 315.0 | $ | 293.2 | $ | 21.8 | ||||||||||||||
| Industrial products |
341.2 | 362.7 | (21.5 | ) | ||||||||||||||||
| Alternative fuels |
111.3 | 98.7 | 12.6 | |||||||||||||||||
| Oil & gas equipment |
62.3 | 90.3 | (28.0 | ) | ||||||||||||||||
|
|
|
|
|
|
|
|||||||||||||||
| Total Pressure Cylinders |
$ | 829.8 | $ | 844.9 | $ | (15.1 | ) | |||||||||||||
|
|
|
|
|
|
|
|||||||||||||||
| Units shipped by principal class of products: |
||||||||||||||||||||
| Consumer products |
60,665,420 | 61,631,907 | (966,487 | ) | ||||||||||||||||
| Industrial products |
10,155,628 | 10,484,892 | (329,264 | ) | ||||||||||||||||
| Alternative fuels |
512,257 | 422,630 | 89,627 | |||||||||||||||||
| Oil & gas equipment |
2,308 | 3,668 | (1,360 | ) | ||||||||||||||||
|
|
|
|
|
|
|
|||||||||||||||
| Total Pressure Cylinders |
71,335,613 | 72,543,097 | (1,207,484 | ) | ||||||||||||||||
|
|
|
|
|
|
|
|||||||||||||||
Net sales and operating highlights were as follows:
| • | Net sales decreased $15.1 million from fiscal 2016. The decrease was driven by lower volumes in the oil & gas equipment and industrial products businesses, partially offset by improvements in consumer products and alternative fuels. Softness in the oil & gas equipment market led to a 31%, or $28.0 million, decline in net sales. However, this market began to show signs of improvement in the fourth quarter of fiscal 2017. Net sales in the industrial products business were down $21.5 million on lower volume due to weaker demand for our refillable propane cylinder products, as well as softness for high pressure industrial cylinders in Europe. |
| • | Operating income increased $25.7 million over fiscal 2016 on lower impairment and restructuring charges, which declined a combined $20.0 million. The remaining increase was driven by improvements in the consumer products business, up on the combined impact of higher pricing spreads and an improved product mix, partially offset by declines in the industrial products and oil & gas equipment businesses. |
35
Table of Contents
Engineered Cabs
The following table presents a summary of operating results for our Engineered Cabs operating segment for the periods indicated:
| Fiscal Year Ended May 31, | ||||||||||||||||||||
| (In millions) | 2017 | % of Net sales |
2016 | % of Net sales |
Increase/ (Decrease) |
|||||||||||||||
| Net sales |
$ | 101.4 | 100.0 | % | $ | 121.9 | 100.0 | % | $ | (20.5 | ) | |||||||||
| Cost of goods sold |
92.5 | 91.2 | % | 116.2 | 95.3 | % | (23.7 | ) | ||||||||||||
|
|
|
|
|
|
|
|||||||||||||||
| Gross margin |
8.9 | 8.8 | % | 5.7 | 4.7 | % | 3.2 | |||||||||||||
| Selling, general and administrative expense |
15.4 | 15.2 | % | 18.4 | 15.1 | % | (3.0 | ) | ||||||||||||
| Impairment of long-lived assets |
- | 0.0 | % | 3.0 | 2.5 | % | (3.0 | ) | ||||||||||||
| Restructuring and other expense |
1.2 | 1.2 | % | 3.6 | 3.0 | % | (2.4 | ) | ||||||||||||
|
|
|
|
|
|
|
|||||||||||||||
| Operating loss |
$ | (7.7 | ) | -7.6 | % | $ | (19.3 | ) | -15.8 | % | $ | 11.6 | ||||||||
|
|
|
|
|
|
|
|||||||||||||||
| Material cost |
$ | 46.1 | $ | 57.3 | $ | (11.2 | ) | |||||||||||||
Net sales and operating highlights were as follows:
| • | Net sales decreased $20.5 million from fiscal 2016 on lower volumes due to declines in market demand. |
| • | Operating loss improved $11.6 million to $7.7 million on lower impairment and restructuring charges and the impact of cost reduction efforts, which led to margin improvements and a 16% decline in SG&A expense. |
36
Table of Contents
Other
The Other category includes the WEI operating segment, which does not meet the quantitative thresholds for separate disclosure. Certain income and expense items not allocated to our operating segments are also included in the Other category, including costs associated with our captive insurance company. The Other category also includes the results of our former Construction Services operating segment, on a historical basis, through May 31, 2016. The following table presents a summary of operating results for the Other category for the periods indicated:
| Fiscal Year Ended May 31, | ||||||||||||||||||||
| (Dollars in millions) | 2017 | % of Net sales |
2016 | % of Net sales |
Increase/ (Decrease) |
|||||||||||||||
| Net sales |
$ | 8.0 | 100.0 | % | $ | 9.2 | 100.0 | % | $ | (1.2 | ) | |||||||||
| Cost of goods sold |
3.2 | 40.0 | % | 6.9 | 75.0 | % | (3.7 | ) | ||||||||||||
|
|
|
|
|
|
|
|||||||||||||||
| Gross margin |
4.8 | 60.0 | % | 2.3 | 25.0 | % | 2.5 | |||||||||||||
| Selling, general and administrative expense |
8.6 | 107.5 | % | 2.2 | 23.9 | % | 6.4 | |||||||||||||
| Restructuring and other income |
- | 0.0 | % | (0.9 | ) | -9.8 | % | (0.9 | ) | |||||||||||
|
|
|
|
|
|
|
|||||||||||||||
| Operating income (loss) |
$ | (3.8 | ) | -47.5 | % | $ | 1.0 | 10.9 | % | $ | (4.8 | ) | ||||||||
|
|
|
|
|
|
|
|||||||||||||||
Net sales and operating highlights were as follows:
| • | Net sales decreased $1.2 million from fiscal 2016. The decrease was driven by the exit of the Construction Services business, partially offset by improvement at WEI. |
| • | Operating loss of $3.8 million in the current year was driven primarily by higher SG&A expense, up $6.4 million due primarily to higher profit sharing and bonus expense and an increase in accrued legal costs. Gross margin increased $2.5 million on higher contributions from WEI and a lower loss in the Construction Services business, which ceased operations during the first quarter of fiscal 2017. |
37
Table of Contents
Fiscal 2016 Compared to Fiscal 2015
Consolidated Operations
The following table presents consolidated operating results for the periods indicated:
| Fiscal Year Ended May 31, | ||||||||||||||||||||
| (Dollars in millions) | 2016 | % of Net sales |
2015 | % of Net sales |
Increase/ (Decrease) |
|||||||||||||||
| Net sales |
$ | 2,819.7 | 100.0 | % | $ | 3,384.2 | 100.0 | % | $ | (564.5 | ) | |||||||||
| Cost of goods sold |
2,367.1 | 83.9 | % | 2,920.7 | 86.3 | % | (553.6 | ) | ||||||||||||
|
|
|
|
|
|
|
|||||||||||||||
| Gross margin |
452.6 | 16.1 | % | 463.5 | 13.7 | % | (10.9 | ) | ||||||||||||
| Selling, general and administrative expense |
297.4 | 10.5 | % | 295.9 | 8.7 | % | 1.5 | |||||||||||||
| Impairment of goodwill and long-lived assets |
26.0 | 0.9 | % | 100.1 | 3.0 | % | (74.1 | ) | ||||||||||||
| Restructuring and other expense |
7.2 | 0.3 | % | 6.9 | 0.2 | % | 0.3 | |||||||||||||
|
|
|
|
|
|
|
|||||||||||||||
| Operating income |
122.0 | 4.3 | % | 60.6 | 1.8 | % | 61.4 | |||||||||||||
| Miscellaneous income |
11.3 | 0.4 | % | 0.8 | 0.0 | % | 10.5 | |||||||||||||
| Interest expense |
(31.7 | ) | -1.1 | % | (35.8 | ) | -1.1 | % | (4.1 | ) | ||||||||||
| Equity in net income of unconsolidated affiliates |
115.0 | 4.1 | % | 87.5 | 2.6 | % | 27.5 | |||||||||||||
| Income tax expense |
(59.0 | ) | -2.1 | % | (25.8 | ) | -0.8 | % | 33.2 | |||||||||||
|
|
|
|
|
|
|
|||||||||||||||
| Net earnings |
157.6 | 5.6 | % | 87.3 | 2.6 | % | 70.3 | |||||||||||||
| Net earnings attributable to noncontrolling interests |
13.9 | 0.5 | % | 10.5 | 0.3 | % | 3.4 | |||||||||||||
|
|
|
|
|
|
|
|||||||||||||||
| Net earnings attributable to controlling interest |
$ | 143.7 | 5.1 | % | $ | 76.8 | 2.3 | % | $ | 66.9 | ||||||||||
|
|
|
|
|
|
|
|||||||||||||||
| Equity income by unconsolidated affiliate |
||||||||||||||||||||
| WAVE |
$ | 82.7 | $ | 70.6 | $ | 12.1 | ||||||||||||||
| ClarkDietrich |
14.6 | 2.9 | 11.7 | |||||||||||||||||
| Serviacero |
6.3 | 3.3 | 3.0 | |||||||||||||||||
| ArtiFlex |
10.3 | 7.2 | 3.1 | |||||||||||||||||
| WSP |
1.7 | 2.9 | (1.2 | ) | ||||||||||||||||
| Other |
(0.6 | ) | 0.6 | (1.2 | ) | |||||||||||||||
|
|
|
|
|
|
|
|||||||||||||||
| Total |
$ | 115.0 | $ | 87.5 | $ | 27.5 | ||||||||||||||
|
|
|
|
|
|
|
|||||||||||||||
Fiscal 2016 net earnings attributable to controlling interest increased $66.9 million over fiscal 2015. Net sales and operating highlights were as follows:
| • | Net sales decreased $564.5 million from fiscal 2015. The decrease was driven by lower average selling prices in Steel Processing due to the lower market price of steel and by lower volume in Pressure Cylinders and Engineered Cabs, partially offset by the impact of acquisitions. |
| • | Gross margin decreased $10.9 million from fiscal 2015 on lower volume, partially offset by an improved pricing spread in Steel Processing and lower manufacturing expenses across many of our businesses. |
| • | SG&A expense increased $1.5 million over fiscal 2015 driven by higher profit sharing and bonus expense and the impact of acquisitions. |
| • | Impairment charges of $26.0 million in fiscal 2016 consisted of $23.0 million related to the impairment of certain long-lived assets in the oil & gas equipment business within Pressure Cylinders and $3.0 million related to the closure of the Engineered Cabs facility in Florence, South Carolina. Impairment charges in the prior year related primarily to the impairment of goodwill and other long-lived assets in Engineered Cabs. For additional information regarding these impairment charges, refer to “Item 8. – Financial Statements and Supplementary Data – Notes to Consolidated Financial Statements – Note C – Goodwill and Other Long-Lived Assets” of this Annual Report on Form 10-K. |
38
Table of Contents
| • | Restructuring and other expense of $7.2 million in fiscal 2016 was driven primarily by costs associated with the closure of the PSM facility in Steel Processing and the Florence, South Carolina facility in Engineered Cabs, partially offset by a net gain of $6.9 million related to asset disposals. For additional information, refer to “Item 8. – Financial Statements and Supplementary Data – Notes to Consolidated Financial Statements – Note D – Restructuring and Other Expense” of this Annual Report on Form 10-K. |
| • | Miscellaneous income increased $10.5 million over fiscal 2015. The increase was primarily the result of a $6.9 million pre-tax gain related to the consolidation of WSP. The gain represents the difference between the fair value of the Company’s previously-held ownership in WSP and its carrying value at the acquisition date. For additional information, refer to “Item 8. – Financial Statements and Supplementary Data – Notes to Consolidated Financial Statements – Note O – Acquisitions” of this Annual Report on Form 10-K. |
| • | Interest expense of $31.7 million was $4.1 million lower than the prior fiscal year. The decrease was driven by lower average debt levels as a result of a decrease in working capital requirements due to the lower average market price of steel. For additional information, refer to “Item 8. – Financial Statements and Supplementary Data – Notes to Consolidated Financial Statements – Note G – Debt and Receivables Securitization” of this Annual Report on Form 10-K. |
| • | Equity income increased $27.5 million over fiscal 2015 to $115.0 million on higher contributions from WAVE and ClarkDietrich, up $12.1 million and $11.7 million, respectively, over the prior year. The equity portion of income from ClarkDietrich includes a $4.5 million net legal settlement gain related to successful disparagement litigation against several competitors in an industry trade association. We received distributions of $86.5 million from our unconsolidated affiliates during fiscal 2016. For additional financial information regarding our unconsolidated affiliates, refer to “Item 8. – Financial Statements and Supplementary Data – Notes to Consolidated Financial Statements – Note B – Investments in Unconsolidated Affiliates” of this Annual Report on Form 10-K. |
| • | Income tax expense increased $33.2 million over fiscal 2015 due to higher earnings and an approximately $5.3 million benefit related to foreign tax credits recorded in fiscal 2015, partially offset by a $3.2 million tax benefit representing excess tax benefits from share-based payment awards recorded in income tax expense resulting from the adoption of new accounting guidance as described in “Item 8. – Financial Statements and Supplementary Data – Notes to Consolidated Financial Statements – Note A – Summary of Significant Accounting Policies – Recently Adopted Accounting Standards” of this Annual Report on Form 10-K. |
Fiscal 2016 income tax expense reflected an effective tax rate attributable to controlling interest of 29.1% vs. 25.1% in fiscal 2015. The 29.1% rate is lower than the federal statutory rate of 35% primarily as a result of lower tax rates on foreign income, benefits from the qualified production activities deduction, and the adoption of the new accounting guidance described above with respect to share-based payment awards, offset partially by state and local income taxes. For additional information, refer to “Item 8. – Financial Statements and Supplementary Data – Notes to Consolidated Financial Statements – Note L – Income Taxes” of this Annual Report on Form 10-K.
39
Table of Contents
Segment Operations
Steel Processing
The following table presents a summary of operating results for our Steel Processing operating segment for the periods indicated:
| Fiscal Year Ended May 31, | ||||||||||||||||||||
| (Dollars in millions) | 2016 | % of Net sales |
2015 | % of Net sales |
Increase/ (Decrease) |
|||||||||||||||
| Net sales |
$ | 1,843.7 | 100.0 | % | $ | 2,145.7 | 100.0 | % | $ | (302.0 | ) | |||||||||
| Cost of goods sold |
1,594.8 | 86.5 | % | 1,910.5 | 89.0 | % | (315.7 | ) | ||||||||||||
|
|
|
|
|
|
|
|||||||||||||||
| Gross margin |
248.9 | 13.5 | % | 235.2 | 11.0 | % | 13.7 | |||||||||||||
| Selling, general and administrative expense |
132.8 | 7.2 | % | 123.4 | 5.8 | % | 9.4 | |||||||||||||
| Impairment of long-lived assets |
- | 0.0 | % | 3.1 | 0.1 | % | (3.1 | ) | ||||||||||||
| Restructuring and other expense |
4.1 | 0.2 | % | - | 0.0 | % | 4.1 | |||||||||||||
|
|
|
|
|
|
|
|||||||||||||||
| Operating income |
$ | 112.0 | 6.1 | % | $ | 108.7 | 5.1 | % | $ | 3.3 | ||||||||||
|
|
|
|
|
|
|
|||||||||||||||
| Material cost |
$ | 1,245.1 | $ | 1,567.3 | $ | (322.2 | ) | |||||||||||||
| Tons shipped (in thousands) |
3,523 | 3,510 | 13 | |||||||||||||||||
Net sales and operating highlights were as follows:
| • | Net sales decreased $302.0 million from fiscal 2015 as lower average steel prices led to lower average selling prices, reducing net sales by approximately $260.5 million. The remaining decrease in net sales was due to the closure of the Company’s stainless steel business, PSM, partially offset by contributions from recent acquisitions. The mix of direct versus toll tons processed was 58% to 42% compared to 59% to 41% in fiscal 2015. |
| • | Operating income increased $3.3 million over fiscal 2015. The increase was driven by an improved pricing spread and lower inventory holding losses. Higher SG&A expense, driven by the impact of acquisitions and higher profit sharing and bonus expense, combined with fiscal 2016 restructuring activities partially offset the overall increase in operating income. Restructuring and other expense in fiscal 2016 consisted primarily of costs related to the closure of PSM ($7.0 million), which were partially offset by a net gain related to the disposal of the remaining fixed assets of our legacy Baltimore steel processing facility ($3.0 million). The $3.1 million impairment charge in fiscal 2015 related to the closure of the PSM facility. |
40
Table of Contents
Pressure Cylinders
The following table presents a summary of operating results for our Pressure Cylinders operating segment for the periods indicated:
| Fiscal Year Ended May 31, | ||||||||||||||||||||
| (Dollars in millions) | 2016 | % of Net sales |
2015 | % of Net sales |
Increase/ (Decrease) |
|||||||||||||||
| Net sales |
$ | 844.9 | 100.0 | % | $ | 1,001.4 | 100.0 | % | $ | (156.5 | ) | |||||||||
| Cost of goods sold |
649.3 | 76.8 | % | 783.8 | 78.3 | % | (134.5 | ) | ||||||||||||
|
|
|
|
|
|
|
|||||||||||||||
| Gross margin |
195.6 | 23.2 | % | 217.6 | 21.7 | % | (22.0 | ) | ||||||||||||
| Selling, general and administrative expense |
143.8 | 17.0 | % | 141.1 | 14.1 | % | 2.7 | |||||||||||||
| Impairment of long-lived assets |
23.0 | 2.7 | % | 11.9 | 1.2 | % | 11.1 | |||||||||||||
| Restructuring and other expense |
0.4 | 0.0 | % | 6.4 | 0.6 | % | (6.0 | ) | ||||||||||||
|
|
|
|
|
|
|
|||||||||||||||
| Operating income |
$ | 28.4 | 3.4 | % | $ | 58.2 | 5.8 | % | $ | (29.8 | ) | |||||||||
|
|
|
|
|
|
|
|||||||||||||||
| Material cost |
$ | 359.8 | $ | 474.3 | $ | (114.5 | ) | |||||||||||||
| Net sales by principal class of products: |
||||||||||||||||||||
| Consumer products |
$ | 293.2 | $ | 296.6 | $ | (3.4 | ) | |||||||||||||
| Industrial products* |
362.7 | 353.0 | 9.7 | |||||||||||||||||
| Mississippi* |
- | 26.8 | (26.8 | ) | ||||||||||||||||
| Alternative fuels |
98.7 | 94.5 | 4.2 | |||||||||||||||||
| Oil & gas equipment |
90.3 | 230.5 | (140.2 | ) | ||||||||||||||||
|
|
|
|
|
|
|
|||||||||||||||
| Total Pressure Cylinders |
$ | 844.9 | $ | 1,001.4 | $ | (156.5 | ) | |||||||||||||
|
|
|
|
|
|
|
|||||||||||||||
| Units shipped by principal class of products: |
||||||||||||||||||||
| Consumer products |
61,631,907 | 65,506,424 | (3,874,517 | ) | ||||||||||||||||
| Industrial products* |
10,484,892 | 10,171,453 | 313,439 | |||||||||||||||||
| Mississippi* |
- | 5,278,597 | (5,278,597 | ) | ||||||||||||||||
| Alternative fuels |
422,630 | 431,954 | (9,324 | ) | ||||||||||||||||
| Oil & gas equipment |
3,668 | 10,246 | (6,578 | ) | ||||||||||||||||
|
|
|
|
|
|
|
|||||||||||||||
| Total Pressure Cylinders |
72,543,097 | 81,398,674 | (8,855,577 | ) | ||||||||||||||||
|
|
|
|
|
|
|
|||||||||||||||
| * | Mississippi, an industrial gas facility, was sold in May 2015. It has been identified separately so as not to distort the industrial products comparisons as the products previously produced at the Mississippi facility have been discontinued. |
Net sales and operating highlights were as follows:
| • | Net sales decreased $156.5 million from fiscal 2015 on lower volume, particularly in the oil & gas equipment business where volumes decreased 64%. Volumes in fiscal 2016 were also negatively impacted by the May 2015 disposition of our high-pressure cylinders business in Mississippi, which generated sales of $26.8 million in fiscal 2015. |
| • | Operating income decreased $29.8 million from fiscal 2015 as declines in the oil & gas equipment business more than offset improvements in the industrial products and consumer products businesses resulting from lower commodity input prices and lower overall manufacturing costs. Impairment charges in fiscal 2016 related to the partial write-off of certain long-lived assets in the oil & gas equipment business. |
41
Table of Contents
Engineered Cabs
The following table presents a summary of operating results for our Engineered Cabs operating segment for the periods indicated:
| Fiscal Year Ended May 31, | ||||||||||||||||||||
| (In millions) | 2016 | % of Net sales |
2015 | % of Net sales |
Increase/ (Decrease) |
|||||||||||||||
| Net sales |
$ | 121.9 | 100.0 | % | $ | 193.0 | 100.0 | % | $ | (71.1 | ) | |||||||||
| Cost of goods sold |
116.2 | 95.3 | % | 180.5 | 93.5 | % | (64.3 | ) | ||||||||||||
|
|
|
|
|
|
|
|||||||||||||||
| Gross margin |
5.7 | 4.7 | % | 12.5 | 6.5 | % | (6.8 | ) | ||||||||||||
| Selling, general and administrative expense |
18.4 | 15.1 | % | 26.1 | 13.5 | % | (7.7 | ) | ||||||||||||
| Impairment of long-lived assets |
3.0 | 2.5 | % | 83.9 | 43.5 | % | (80.9 | ) | ||||||||||||
| Restructuring and other expense (income) |
3.6 | 3.0 | % | (0.3 | ) | -0.2 | % | 3.9 | ||||||||||||
|
|
|
|
|
|
|
|||||||||||||||
| Operating loss |
$ | (19.3 | ) | -15.8 | % | $ | (97.2 | ) | -50.4 | % | $ | 77.9 | ||||||||
|
|
|
|
|
|
|
|||||||||||||||
| Material cost |
$ | 57.3 | $ | 89.3 | $ | (32.0 | ) | |||||||||||||
Net sales and operating highlights were as follows:
| • | Net sales decreased $71.1 million from fiscal 2015 due to declines in market demand in most lines of business combined with the impact of the January 2015 sale of the assets of Advanced Component Technologies, Inc. and the September 2015 closure of Florence, South Carolina facility. |
| • | Operating loss decreased $77.9 million from fiscal 2015 due primarily to lower impairment and restructuring charges. Excluding the impact of impairment and restructuring charges, the operating loss was $0.9 million lower than fiscal 2015 as a result of lower SG&A expense, partially offset by a decrease in gross margin. Fiscal 2016 impairment charges consisted of $3.0 million related to the closure of the Florence, South Carolina facility. Impairment charges in fiscal 2015 consisted of $44.9 million for the full write off of goodwill and $39.0 million for other long-lived assets. For additional information regarding these impairment charges, refer to “Item 8. – Financial Statements and Supplementary Data – Notes to Consolidated Financial Statements – Note C – Goodwill and Other Long-Lived Assets” of this Annual Report on Form 10-K. |
42
Table of Contents
Other
The Other category includes the WEI operating segment, which does not meet the quantitative thresholds for separate disclosure. Certain income and expense items not allocated to our operating segments are also included in the Other category, including costs associated with our captive insurance company. The Other category also includes the results of our former Construction Services operating segment, on a historical basis, through May 31, 2016. The following table presents a summary of operating results for the Other category for the periods indicated:
| Fiscal Year Ended May 31, | ||||||||||||||||||||
| (Dollars in millions) | 2016 | % of Net sales |
2015 | % of Net sales |
Increase/ (Decrease) |
|||||||||||||||
| Net sales |
$ | 9.2 | 100.0 | % | $ | 44.1 | 100.0 | % | $ | (34.9 | ) | |||||||||
| Cost of goods sold |
6.9 | 75.0 | % | 45.9 | 104.1 | % | (39.0 | ) | ||||||||||||
|
|
|
|
|
|
|
|||||||||||||||
| Gross margin (loss) |
2.3 | 25.0 | % | (1.8 | ) | -4.1 | % | 4.1 | ||||||||||||
| Selling, general and administrative expense |
2.2 | 23.9 | % | 5.3 | 12.0 | % | (3.1 | ) | ||||||||||||
| Restructuring and other expense (income) |
(0.9 | ) | -9.8 | % | 1.9 | 4.3 | % | (2.8 | ) | |||||||||||
|
|
|
|
|
|
|
|||||||||||||||
| Operating income (loss) |
$ | 1.0 | 10.9 | % | $ | (9.0 | ) | -20.4 | % | $ | 10.0 | |||||||||
|
|
|
|
|
|
|
|||||||||||||||
Net sales and operating highlights were as follows:
| • | Net sales decreased $34.9 million from fiscal 2015. The decrease was driven by a decline in both the Construction Services, which the Company has exited, and the WEI businesses. |
| • | Operating income of $1.0 million represents a $10.0 million improvement over the $9.0 million operating loss recognized in fiscal 2015. The improvement resulted from lower losses within Construction Services, which the Company has exited, and a net gain within restructuring and other income related to the sale of real estate in our legacy metal framing business. |
Liquidity and Capital Resources
During fiscal 2017, we generated $335.7 million of cash from operating activities, invested $68.4 million in property, plant and equipment, and paid $50.7 million of dividends on our common shares. The following table summarizes our consolidated cash flows for each period shown:
| Fiscal Year Ended May 31, |
||||||||
| (in millions) | 2017 | 2016 | ||||||
| Net cash provided by operating activities |
$ | 335.7 | $ | 413.3 | ||||
| Net cash used by investing activities |
(63.0 | ) | (127.0 | ) | ||||
| Net cash used by financing activities |
(78.8 | ) | (233.2 | ) | ||||
|
|
|
|
|
|||||
| Increase in cash and cash equivalents |
193.9 | 53.1 | ||||||
| Cash and cash equivalents at beginning of period |
84.2 | 31.1 | ||||||
|
|
|
|
|
|||||
| Cash and cash equivalents at end of period |
$ | 278.1 | $ | 84.2 | ||||
|
|
|
|
|
|||||
We believe we have access to adequate resources to meet our needs for normal operating costs, capital expenditures, debt repayments, dividend payments and working capital for our existing businesses. These resources include cash and cash equivalents, cash provided by operating activities and unused lines of credit. We also believe we have adequate access to the financial markets to allow us to be in a position to sell long-term debt or equity securities. We routinely monitor current operational requirements, financial market conditions, and credit relationships and we may choose to seek additional capital by issuing new debt and/or equity securities to strengthen our liquidity or capital structure. However, should we seek such additional capital, there can be no assurance that we
43
Table of Contents
would be able to obtain such additional capital on terms acceptable to us, if at all, and such additional equity or debt financing could dilute the interests of our existing shareholders and/or increase our interest costs. On July 19, 2017, we filed a universal automatic shelf registration statement on Form S-3ASR with the Securities and Exchange Commission. The registration statement permits us to offer debt securities, common shares or any combination of these securities, from time to time, in one or more public offerings.
Operating Activities
Our business is cyclical and cash flows from operating activities may fluctuate during the year and from year to year due to economic and industry conditions. We rely on cash and short-term borrowings to meet cyclical increases in working capital needs. These needs generally rise during periods of increased economic activity or increasing raw material prices, requiring higher levels of inventory and accounts receivable. During economic slowdowns or periods of decreasing raw material costs, working capital needs generally decrease as a result of the reduction of inventories and accounts receivable.
Net cash provided by operating activities was $335.7 million during fiscal 2017 compared to $413.3 million in fiscal 2016. The $77.6 million decrease in net cash provided by operating activities was driven primarily by an increase in working capital levels as a result of higher average steel prices, partially offset by higher net earnings. Net cash provided by operating activities in fiscal 2016 benefited from declining working capital levels as a result of declining steel prices and lower overall volumes.
Investing Activities
Net cash used by investing activities was $63.0 million during fiscal 2017 compared to $127.0 million in fiscal 2016, a decrease of $64.0 million. The decrease was driven primarily by the absence of acquisitions in fiscal 2017 and lower capital expenditures, which decreased $28.6 million. During fiscal 2016, we spent a combined $34.2 million, net of cash acquired, for the net assets of the CryoScience business of Taylor Wharton and the net assets of NetBraze, LLC.
Capital expenditures reflect cash used for investment in property, plant and equipment and are presented below by reportable business segment (this information excludes cash flows related to acquisition and divestiture activity):
| Fiscal Year Ended May 31, |
||||||||
| (in millions) | 2017 | 2016 | ||||||
| Steel Processing |
$ | 40.8 | $ | 42.1 | ||||
| Pressure Cylinders |
24.8 | 29.9 | ||||||
| Engineered Cabs |
0.8 | 6.9 | ||||||
| Other |
2.0 | 18.1 | ||||||
|
|
|
|
|
|||||
| Total Capital Expenditures |
$ | 68.4 | $ | 97.0 | ||||
|
|
|
|
|
|||||
Capital expenditures were $68.4 million in fiscal 2017. Significant capital expenditures in fiscal 2017 included $11.2 million to expand capacity at TWB, our consolidated laser welding joint venture, $9.4 million to expand galvanizing capacity at our steel processing facility in Delta, Ohio, and $6.8 million to expand capacity and capabilities at our alternative fuels cylinder facility in Pomona, California.
Investment activities are largely discretionary and future investment activities could be reduced significantly, or eliminated, as economic conditions warrant. We assess acquisition opportunities as they arise, and any such opportunities may require additional financing. There can be no assurance, however, that any such opportunities will arise, that any such acquisitions will be consummated, or that any needed additional financing will be available on satisfactory terms when required. On June 2, 2017, we acquired AMTROL, a leading manufacturer of pressure cylinders and water system tanks, for $283.0 million. The purchase price was funded primarily with available cash.
44
Table of Contents
Financing Activities
Net cash used by financing activities was $78.8 million in fiscal 2017 compared to $233.2 million in fiscal 2016. The decrease from fiscal 2016 was driven primarily by the absence of share repurchases and lower repayments of short-term borrowings.
Long-term debt – Our senior unsecured long-term debt is rated “investment grade” by both Moody’s Investors Service, Inc. and Standard & Poor’s Ratings Group. We typically use the net proceeds from long-term debt for acquisitions, refinancing of outstanding debt, capital expenditures and general corporate purposes. As of May 31, 2017, we were in compliance with our long-term financial debt covenants. Our long-term debt agreements do not include ratings triggers or material adverse change provisions.
On September 26, 2014, our consolidated joint venture in Turkey, Worthington Aritas, executed a five-year term loan denominated in Euros. As of May 31, 2017, we had borrowed $28.7 million against the facility. The facility bears interest at a variable rate based on EURIBOR. The applicable variable rate was 1.5% at May 31, 2017. On October 15, 2014, we entered into an interest rate swap to fix the interest rate on 60% of the borrowings outstanding under this facility at 2.015% starting on December 26, 2014 through September 26, 2019. Borrowings against the facility were used for the construction of a cryogenics manufacturing facility in Turkey.
Short-term borrowings – Our short-term debt agreements do not include ratings triggers or material adverse change provisions. We were in compliance with our short-term financial debt covenants at May 31, 2017.
Short-term borrowings at May 31, 2017 totaled $123,000 and consisted of amounts outstanding under various credit facilities maintained by our consolidated joint venture, Worthington Aritas.
We maintain a $500.0 million multi-year revolving credit facility (the “Credit Facility”) with a group of lenders that matures in April 2020. Borrowings under the Credit Facility typically have maturities of less than one year and given that our intention has been to repay them within a year, they have been classified as short-term borrowings within current liabilities on our consolidated balance sheets. However, we can also extend the term of amounts borrowed by renewing these borrowings for the term of the Credit Facility. We have the option to borrow at rates equal to an applicable margin over the LIBOR, Prime or Fed Funds rates. The applicable margin is determined by our credit rating. There were no borrowings outstanding under the Credit Facility at May 31, 2017. As discussed in “Item 8. – Financial Statements and Supplementary Data – Notes to Consolidated Financial Statements – Note F – Guarantees,” we provided $15.3 million in letters of credit for third-party beneficiaries as of May 31, 2017. While not drawn against at May 31, 2017, $13.6 million of these letters of credit were issued against availability under the Credit Facility, leaving $486.4 million available at May 31, 2017.
We maintain a $100.0 million revolving trade accounts receivable securitization facility (the “AR Facility”) which matures in January 2018. Pursuant to the terms of the AR Facility, certain of our subsidiaries sell their accounts receivable without recourse, on a revolving basis, to Worthington Receivables Corporation (“WRC”), a wholly-owned, consolidated, bankruptcy-remote subsidiary. In turn, WRC may sell without recourse, on a revolving basis, up to $100.0 million of undivided ownership interests in this pool of accounts receivable to a third-party bank. We retain an undivided interest in this pool and are subject to risk of loss based on the collectability of the receivables from this retained interest. Because the amount eligible to be sold excludes receivables more than 90 days past due, receivables offset by an allowance for doubtful accounts due to bankruptcy or other cause, concentrations over certain limits with specific customers and certain reserve amounts, we believe additional risk of loss is minimal. As of May 31, 2017, no undivided ownership interests in this pool of accounts receivable had been sold.
Common shares – We declared dividends at a quarterly rate of $0.20 per common share for each quarter of fiscal 2017 compared to $0.19 per common share for each quarter of fiscal 2016. Dividends paid on our common shares totaled $50.7 million and $47.2 million during fiscal 2017 and fiscal 2016, respectively. On June 28, 2017, the Board declared a quarterly dividend of $0.21 per common share. The dividend is payable on September 29, 2017 to shareholders of record on September 15, 2017.
45
Table of Contents
On June 25, 2014, the Board authorized the repurchase of up to 10,000,000 of our outstanding common shares. A total of 5,953,855 common shares have been repurchased under this authorization, leaving 4,046,145 common shares available for repurchase.
No common shares were repurchased under this authorization during fiscal 2017 due to the anticipated investment opportunity in AMTROL as described in Recent Business Developments. During fiscal 2016, we repurchased 3,500,000 common shares having an aggregate cost of $99,847,000 under this authorization. During fiscal 2015, we repurchased 4,176,187 common shares having an aggregate cost of $127,360,000, including 2,453,855 under this authorization.
The common shares available for repurchase under this authorization may be purchased from time to time, with consideration given to the market price of the common shares, the nature of other investment opportunities, cash flows from operations, general economic conditions and other relevant factors. Repurchases may be made on the open market or through privately negotiated transactions.
Dividend Policy
We currently have no material contractual or regulatory restrictions on the payment of dividends. Dividends are declared at the discretion of the Board. The Board reviews the dividend quarterly and establishes the dividend rate based upon our financial condition, results of operations, capital requirements, current and projected cash flows, business prospects and other relevant factors. While we have paid a dividend every quarter since becoming a public company in 1968, there is no guarantee that payments will continue in the future.
Contractual Cash Obligations and Other Commercial Commitments
The following table summarizes our contractual cash obligations as of May 31, 2017. Certain of these contractual obligations are reflected in our consolidated balance sheet, while others are disclosed as future obligations in accordance with U.S. GAAP.
| Payments Due by Period | ||||||||||||||||||||
| (in millions) | Total | Less Than 1 Year |
1–3 Years |
4–5 Years |
After 5 Years |
|||||||||||||||
| Short-term borrowings |
$ | 0.1 | $ | 0.1 | $ | - | $ | - | $ | - | ||||||||||
| Long-term debt |
581.1 | 6.7 | 174.1 | - | 400.3 | |||||||||||||||
| Interest expense on long-term debt |
179.6 | 28.5 | 55.4 | 36.6 | 59.1 | |||||||||||||||
| Operating leases |
40.5 | 10.0 | 15.8 | 7.9 | 6.8 | |||||||||||||||
| Royalty obligations |
12.0 | 2.0 | 4.0 | 4.0 | 2.0 | |||||||||||||||
|
|
|
|
|
|
|
|
|
|
|
|||||||||||
| Total contractual cash obligations |
$ | 813.3 | $ | 47.3 | $ | 249.3 | $ | 48.5 | $ | 468.2 | ||||||||||
|
|
|
|
|
|
|
|
|
|
|
|||||||||||
Interest expense on long-term debt is computed by using the rates of interest on the debt, including impacts of the related interest rate hedge. Royalty obligations relate to a trademark license agreement executed in connection with the acquisition of Coleman Cylinders in fiscal 2012. Due to the uncertainty regarding the timing of future cash outflows associated with the unfunded portion of our pension benefit obligations and our unrecognized tax benefits, we are unable to make a reliable estimate of the periods of cash settlement and have not included these amounts in the contractual cash obligations table above. For additional information, refer to “Item 8. – Financial Statements and Supplementary Data – Notes to Consolidated Financial Statements – Note K – Employee Pension Plans” and “Note L – Income Taxes” of this Annual Report on Form 10-K.
46
Table of Contents
The following table summarizes our other commercial commitments as of May 31, 2017. These commercial commitments are not reflected in our consolidated balance sheet.
| Commitment Expiration by Period | ||||||||||||||||||||
| (in millions) | Total | Less Than 1 Year |
1-3 Years |
4-5 Years |
After 5 Years |
|||||||||||||||
| Guarantees |
$ | 9.3 | $ | 9.3 | $ | - | $ | - | $ | - | ||||||||||
| Standby letters of credit |
15.3 | 15.3 | - | - | - | |||||||||||||||
|
|
|
|
|
|
|
|
|
|
|
|||||||||||
| Total commercial commitments |
$ | 24.6 | $ | 24.6 | $ | - | $ | - | $ | - | ||||||||||
|
|
|
|
|
|
|
|
|
|
|
|||||||||||
Off-Balance Sheet Arrangements
We do not have guarantees or other off-balance sheet financing arrangements that we believe are reasonably likely to have a material current or future effect on our consolidated financial condition, changes in financial condition, revenue or expenses, results of operations, liquidity, capital expenditures or capital resources. However, as of May 31, 2017, we were party to an operating lease for an aircraft in which we have guaranteed a residual value at the termination of the lease. The maximum obligation under the terms of this guarantee was approximately $9.3 million at May 31, 2017. Based on current facts and circumstances, we have estimated the likelihood of payment pursuant to this guarantee is not probable and, therefore, no amounts have been recognized in our consolidated financial statements.
Recently Adopted Accounting Standards
In April 2015, amended accounting guidance was issued that requires debt issuance costs related to a recognized debt liability to be presented in the balance sheet as a direct deduction from the carrying amount of the corresponding debt liability itself. The amended guidance does not apply to line-of-credit arrangements. Accordingly, issuance costs related to line-of-credit arrangements will continue to be presented as an asset and amortized ratably over the term of the arrangement. The Company adopted this guidance on a retrospective basis effective June 1, 2016. As a result, debt issuance costs of $2.1 million and $2.5 million have been presented as a component of the carrying amount of long-term debt reported in our consolidated balance sheets as of May 31, 2017 and May 31, 2016, respectively.
In September 2015, amended accounting guidance was issued regarding adjustments to provisional amounts recorded in conjunction with a business combination. The amended guidance requires the acquirer to recognize adjustments to provisional amounts identified during the measurement period in the reporting period in which such adjustments are identified, rather than retrospectively adjusting previously reported amounts. The Company adopted this amended guidance on a prospective basis effective June 1, 2016.
In March 2016, amended accounting guidance was issued that simplifies the accounting for share-based payments. The amended guidance impacts several aspects of the accounting for share-based payment transactions, including the income tax consequences, forfeitures, statutory withholding requirements, and classification in the statement of cash flows. The amended guidance is effective for fiscal years beginning after December 15, 2016, including interim periods within those fiscal years. Early adoption is permitted. The Company elected to early adopt this amended accounting guidance during the fourth quarter of fiscal 2016. The impact resulting from the adoption of this amended guidance is summarized below.
47
Table of Contents
| • | Income Tax Accounting – The amended accounting guidance requires all excess tax benefits and tax deficiencies to be recognized as an income tax benefit or expense on a prospective basis in the period of adoption. The adoption of this provision of the amended accounting guidance resulted in the recognition of excess tax benefits of $16.2 million and $3.2 million in income tax expense, rather than in paid-in capital, during fiscal 2017 and fiscal 2016, respectively. As the adoption was on a prospective basis, fiscal 2015 has not been restated. |
| • | Forfeitures – The Company has elected to continue to estimate the number of awards expected to vest, as permitted by the amended accounting guidance, rather than electing to account for forfeitures as they occur. |
| • | Statement of Cash Flows Presentation – The amended accounting guidance requires excess tax benefits to be classified as an operating activity in the statement of cash flows. Previously, excess tax benefits were presented as a cash inflow from financing activities and cash outflow from operating activities. The Company has elected to present these changes on a prospective basis and therefore fiscal 2015 has not been adjusted to conform with the current presentation. |
Recently Issued Accounting Standards
In May 2014, amended accounting guidance was issued that replaces most existing revenue recognition guidance under U.S. GAAP. The amended guidance requires an entity to recognize the amount of revenue to which it expects to be entitled for the transfer of promised goods or services to customers. Subsequently, additional guidance was issued on several areas including guidance intended to improve the operability and understandability of the implementation of principal versus agent considerations and clarifications on the identification of performance obligations and implementation of guidance related to licensing. The amended guidance is effective for annual reporting periods beginning after December 15, 2017, including interim periods within that reporting period. The amended guidance permits the use of either the retrospective or cumulative effect transition method. We are in the process of evaluating the effect this guidance will have on the presentation of our consolidated financial statements and related disclosures. While we have not yet identified any material changes in the timing of revenue recognition, our evaluation is ongoing and not complete. We plan to adopt the amended guidance in the first quarter of fiscal 2019.
In July 2015, amended accounting guidance was issued regarding the measurement of inventory. The amended guidance requires that inventory accounted for under the first-in, first-out (FIFO) or average cost methods be measured at the lower of cost and net realizable value, where net realizable value represents the estimated selling price of inventory in the ordinary course of business, less reasonably predictable costs of completion, disposal, and transportation. The amended guidance has no impact on inventory accounted for under the last-in, first-out (LIFO) or retail inventory methods. The amended guidance is effective prospectively for fiscal years beginning after December 15, 2016, including interim periods within those fiscal years. Early adoption is permitted as of the beginning of an interim or annual reporting period. We do not expect the adoption of this amended accounting guidance to have a material impact on our consolidated financial position or results of operations.
In February 2016, amended accounting guidance was issued that replaces most existing lease accounting guidance under U.S. GAAP. Among other changes, the amended guidance requires that lease assets and liabilities be recognized on the balance sheet by lessees for those leases classified as operating leases under previous guidance. The amended guidance is effective for fiscal years beginning after December 15, 2018, including interim periods within those fiscal years. Early adoption is permitted, and the change is to be applied using a modified retrospective approach as of the beginning of the earliest period presented. We are in the process of evaluating the effect this guidance will have on our consolidated financial position, results of operations and cash flows, and we have not determined the effect of the amended guidance on our ongoing financial reporting.
48
Table of Contents
In March 2016, amended accounting guidance was issued regarding derivatives instruments designated as hedging instruments. The amended guidance clarifies that a change in the counterparty to such a hedging instrument does not, in and of itself, require dedesignation of that hedging relationship provided that all other hedge accounting criteria continue to be met. The amended guidance is effective for fiscal years beginning after December 15, 2016, including interim periods within those fiscal years. Early adoption is permitted, and the change may be applied either prospectively or retrospectively. We do not expect the adoption of this amended accounting guidance to have a material impact on our consolidated financial position or results of operations.
In June 2016, amended accounting guidance was issued related to the measurement of credit losses on financial instruments. The amended guidance changes the impairment model for most financial assets to require measurement and recognition of expected credit losses for financial assets held. The amended guidance is effective for fiscal years beginning after December 15, 2019, including interim periods within those fiscal years. We are in the process of evaluating the effect this guidance will have on our consolidated financial position and results of operations, and we have not determined the effect of the amended guidance on our ongoing financial reporting.
In August 2016, amended accounting guidance was issued to clarify the proper cash flow presentation of certain specific types of cash payments and cash receipts. The amended guidance is effective for fiscal years beginning after December 15, 2017, including interim periods within those fiscal years. Early adoption is permitted. We are in the process of evaluating the effect this guidance will have on our consolidated financial position, results of operations and cash flows, and we have not determined the effect of the amended guidance on our ongoing financial reporting.
In October 2016, amended accounting guidance was issued that requires the income tax consequences of an intra-entity transfer on an asset other than inventory to be recognized when the transfer occurs. The amended guidance is effective for fiscal years beginning after December 15, 2017, including interim periods within those fiscal years. Early adoption is permitted. We are in the process of evaluating the effect this guidance will have on our consolidated financial position, results of operations and cash flows, and have not determined the effect of the guidance on our ongoing financial reporting.
In November 2016, amended accounting guidance was issued that requires amounts generally described as restricted cash and restricted cash equivalents to be included with cash and cash equivalents when reconciling the beginning-of-period and end-of-period total amounts shown on the statement of cash flows. The amended guidance is effective for fiscal years beginning after December 15, 2017, including interim periods within those fiscal years. Early adoption is permitted. We do not expect the adoption of this amended guidance to have a material impact on our consolidated cash flows.
In January 2017, amended accounting guidance was issued to clarify the definition of a business to provide additional guidance to assist in evaluating whether transactions should be accounted for as an acquisition (or disposal) of either an asset or business. The amended guidance is effective for fiscal years beginning after December 15, 2017, including interim periods within those fiscal years. Early adoption is permitted. We do not expect the adoption of this amended guidance to have a material impact on our consolidated financial position or results of operations.
In January 2017, amended accounting guidance was issued to simplify the goodwill impairment calculation, by removing Step 2 of the goodwill impairment test. Goodwill impairment will now be the amount by which a reporting unit’s carrying value exceeds its fair value, not to exceed the carrying amount of the goodwill. The amended guidance is effective for fiscal years beginning after December 15, 2019, including interim periods within those fiscal years. Early adoption is permitted. We are in the process of evaluating the effect this guidance will have on our consolidated financial position and results of operations, and have not determined the effect on our ongoing financial reporting.
In March 2017, amended accounting guidance was issued that requires an employer to report the service cost component of pension and postretirement benefits in the same line item as other current employee compensation costs. Additionally, other components of net benefit cost are to be presented in the income statement separately from the service cost component and outside of income from operations. The amended guidance is effective for fiscal years beginning after December 15, 2017, including interim periods within those fiscal years. We are in the process of evaluating the effect this guidance will have on our consolidated financial position and results of operations, and have not determined the effect on our ongoing financial reporting.
49
Table of Contents
In May 2017, amended accounting guidance was issued to provide guidance about which changes to the terms or conditions of a share-based payment award require application of modification accounting. The amended guidance is effective for fiscal years beginning after December 15, 2017, including interim periods within those fiscal years. Early adoption is permitted. We do not expect the adoption of this amended guidance to have a material impact on our consolidated financial position or results of operations.
Environmental
We do not believe that compliance with environmental laws has or will have a material effect on our capital expenditures, future results of operations or financial position or competitive position.
Inflation
The effects of inflation on our operations were not significant during the periods presented in the consolidated financial statements.
Critical Accounting Policies
The discussion and analysis of our consolidated financial condition and results of operations are based upon our consolidated financial statements, which have been prepared in accordance with U.S. GAAP. The preparation of these consolidated financial statements requires us to make estimates and assumptions that affect the reported amounts of assets and liabilities and the disclosure of contingent assets and liabilities at the date of the consolidated financial statements and the reported amounts of revenues and expenses during the reporting periods. We continually evaluate our estimates, including those related to our valuation of receivables, inventories, intangible assets, accrued liabilities, income and other tax accruals and contingencies and litigation. We base our estimates on historical experience and various other assumptions that we believe to be reasonable under the circumstances. These results form the basis for making judgments about the carrying values of assets and liabilities that are not readily apparent from other sources. Critical accounting policies are defined as those that reflect our significant judgments and uncertainties that could potentially result in materially different results under different assumptions and conditions. Although actual results historically have not deviated significantly from those determined using our estimates, as discussed below, our consolidated financial position or results of operations could be materially different if we were to report under different conditions or to use different assumptions in the application of such policies. We believe the following accounting policies are the most critical to us, as these are the primary areas where financial information is subject to our estimates, assumptions and judgment in the preparation of our consolidated financial statements.
Revenue Recognition: We recognize revenue upon transfer of title and risk of loss, or in the case of toll processing revenue, upon delivery of the goods, provided evidence of an arrangement exists, pricing is fixed and determinable and the ability to collect is probable. In circumstances where the collection of payment is not probable at the time of shipment, we defer recognition of revenue until payment is collected. We provide for returns and allowances based on historical experience and current customer activities.
Receivables: In order to ensure that our receivables are properly valued, we utilize two contra-receivable accounts: returns and allowances and allowance for doubtful accounts. Returns and allowances are used to record estimates of returns or other allowances resulting from quality, delivery, discounts or other issues affecting the value of receivables. This account is estimated based on historical trends and current market conditions, with the offset to net sales.
The allowance for doubtful accounts is used to record the estimated risk of loss related to the customers’ inability to pay. This allowance is maintained at a level that we consider appropriate based on factors that affect collectability, such as the financial health of our customers, historical trends of charge-offs and recoveries and current economic and market conditions. As we monitor our receivables, we identify customers that may have payment problems, and we adjust the allowance accordingly, with the offset to SG&A expense. Account balances are charged off against the allowance when recovery is considered remote.
50
Table of Contents
We review our receivables on an ongoing basis to ensure that they are properly valued and collectible. Based on this review, we believe our related reserves are appropriate. The allowance for doubtful accounts decreased approximately $1.1 million during fiscal 2017 to $3.4 million.
While we believe our allowance for doubtful accounts is adequate, changes in economic conditions, the financial health of customers and bankruptcy settlements could impact our future earnings. If the economic environment and market conditions deteriorate, particularly in the automotive and construction end markets where our exposure is greatest, additional bad debt reserves may be required.
Inventory Valuation: Inventories are valued at the lower of cost or market. Cost is determined using the first-in, first-out method for all inventories. This assessment requires the use of significant estimates to determine replacement cost, cost to complete, normal profit margin and the ultimate selling price of the inventory. Due to a decline in steel prices in fiscal 2015, the replacement cost of our inventory was lower than what was reflected in our records at May 31, 2015. Accordingly, we recorded a lower of cost or market adjustment of $1.7 million at May 31, 2015 to reflect this lower value. The entire amount related to our Steel Processing operating segment and was recorded in cost of goods sold. We believe our inventories were valued appropriately as of May 31, 2017 and May 31, 2016.
Impairment of Definite-Lived Long-Lived Assets: We review the carrying value of our long-lived assets, including intangible assets with finite useful lives, for impairment whenever events or changes in circumstances indicate that the carrying value of an asset or asset group may not be recoverable. Impairment testing involves a comparison of the sum of the undiscounted future cash flows of the asset or asset group to its respective carrying amount. If the sum of the undiscounted future cash flows exceeds the carrying amount, then no impairment exists. If the carrying amount exceeds the sum of the undiscounted future cash flows, then a second step is performed to determine the amount of impairment, if any, to be recognized. An impairment loss is recognized to the extent that the carrying amount of the asset or asset group exceeds its fair value.
Fiscal 2017: During the fourth quarter of fiscal 2017, events and circumstances related to the long-lived assets of the Company’s cryogenics joint venture in Turkey indicated the potential for impairment. The Company’s current estimate of the undiscounted future cash flows indicated that the carrying amount of $40.0 million was expected to be recovered. However, the estimated undiscounted future cash flows for this asset group did not exceed book value by a significant amount (approximately 12% at May 31, 2017). Therefore, it is reasonably possible that any change in the estimate of undiscounted cash flows may result in the need to write down these assets to fair value.
Fiscal 2016: Due to the decline in oil prices and resulting reduced demand for products, management determined that an impairment indicator was present for the long-lived assets in the oil & gas equipment business within Pressure Cylinders. The Company had tested the five asset groups in its oil & gas equipment business for impairment during the fourth quarter of fiscal 2015 and again in the first quarter of fiscal 2016. In each of these tests, the Company’s estimate of the undiscounted future cash flows for each asset group indicated that the carrying amounts were expected to be recovered as of those measurement dates.
During the second quarter of fiscal 2016, the continued decline of oil prices further reduced the demand for oil & gas equipment products, causing a significant decrease in the long-term cash flow projections of that business. Based on these revised cash flow projections, the Company determined that long-lived assets of two of the facilities with a combined carrying amount of $59.9 million were impaired and wrote them down to their estimated fair value of $36.9 million, resulting in an impairment charge of $23.0 million. Fair value was based on expected future cash flows using Level 3 inputs under Accounting Standard Codification (“ASC”) 820. The cash flows are those expected to be generated by market participants, discounted at an appropriate rate for the risks inherent in those cash flow projections, or 13%. Because of deteriorating market conditions (i.e., rising interest rates and declining marketplace demand), it is possible that our estimate of discounted cash flows may change resulting in the need to adjust our determination of fair value.
During the first quarter of fiscal 2016, management finalized its plan to close the Engineered Cabs facility in Florence, South Carolina and transfer the majority of the business to the Engineered Cabs facility in Greeneville, Tennessee. Under the plan, certain machinery and equipment was transferred to the Greeneville facility to support
51
Table of Contents
higher volume requirements. Management reevaluated the recoverability of the remaining assets and determined that long-lived assets with a carrying value of $4.1 million were impaired. As a result, these long-lived assets were written down to their estimated fair value of $1.1 million resulting in an impairment charge of $3.0 million during the first quarter of fiscal 2016. The Company ceased production at the Florence facility on September 30, 2015.
Impairment of Indefinite-Lived Long-Lived Assets: Goodwill and intangible assets with indefinite lives are not amortized, but instead are tested for impairment annually, during the fourth quarter, or more frequently if events or changes in circumstances indicate that impairment may be present. Application of goodwill impairment testing involves judgment, including but not limited to, the identification of reporting units and estimation of the fair value of each reporting unit. A reporting unit is defined as an operating segment or one level below an operating segment. With the exception of Pressure Cylinders, we test goodwill at the operating segment level as we have determined that the characteristics of the reporting units within each operating segment are similar and allow for their aggregation in accordance with the applicable accounting guidance. For our Pressure Cylinders operating segment, the oil & gas equipment business has been treated as a separate reporting unit since the second quarter of fiscal 2016.
The goodwill impairment test consists of comparing the fair value of each reporting unit, determined using discounted cash flows, to each reporting unit’s respective carrying value. If the estimated fair value of a reporting unit exceeds its carrying value, there is no impairment. If the carrying amount of the reporting unit exceeds its estimated fair value, goodwill impairment is indicated. The amount of the impairment is determined by comparing the fair value of the net assets of the reporting unit, excluding goodwill, to its estimated fair value, with the difference representing the implied fair value of the goodwill. If the implied fair value of the goodwill is lower than its carrying value, the difference is recorded as an impairment charge in our consolidated statement of earnings. The impairment test for indefinite-lived intangible assets consists of a comparison of the fair value of the intangible asset to its carrying value. If the carrying value of the intangible asset exceeds its fair value, the difference is recorded as an impairment charge in our consolidated statement of earnings.
As a result of the fiscal 2016 impairment of the oil & gas equipment assets noted above, the Company also performed an impairment review of the goodwill of the Pressure Cylinders reporting unit during the second quarter of fiscal 2016. The Company first assessed the reporting unit structure and determined that it was no longer appropriate to aggregate the oil & gas equipment component with the rest of Pressure Cylinders for purposes of goodwill impairment testing. This determination was driven by changes in the economic characteristics of the oil & gas equipment business as a result of sustained low oil prices, which indicated that the risk profile and prospects for growth and profitability were no longer similar to the other components of Pressure Cylinders. In accordance with the applicable accounting guidance, the Company allocated a portion of Pressure Cylinders goodwill totaling $26.0 million to the oil & gas equipment reporting unit using a relative fair value approach. A subsequent comparison of the fair values of the oil & gas equipment and the Pressure Cylinders reporting units, determined using discounted cash flows, to their respective carrying values indicated that a step 2 calculation to quantify a potential impairment was not required. The key assumptions that drive the fair value calculations are projected cash flows and the discount rate. Prior to the allocation of goodwill, the Company tested the goodwill of the old Pressure Cylinders reporting unit for impairment and determined that fair value exceeded carrying value by a significant amount.
During the third quarter of fiscal 2015, the Company concluded that an interim impairment test of the goodwill of its Engineered Cabs reporting unit was necessary. This conclusion was based on certain indicators of impairment, including the decision to close the Company’s unprofitable Engineered Cabs facility in Florence, South Carolina, and significant downward revisions to forecasted cash flows as a result of continued weakness in the mining and agricultural end markets and higher than expected manufacturing costs.
Prior to conducting the goodwill impairment test, the Company first evaluated the other long-lived assets of the Engineered Cabs reporting unit for recoverability. Recoverability was tested using future cash flow projections based on management’s long-range estimates of market conditions. The sum of the undiscounted future cash flows for the customer relationship intangible asset and the property, plant and equipment of the Florence facility were less than their respective carrying values. As a result, these assets were written down to their respective fair values, resulting in impairment charges of $22.4 million for the customer relationship intangible asset and $14.3 million for the property, plant and equipment of the Florence asset group during the third quarter of fiscal 2015.
52
Table of Contents
In addition to the above, the Company also determined that sufficient indicators of potential impairment existed to require an interim goodwill analysis of the Engineered Cabs reporting unit. A comparison of the fair value of the Engineered Cabs operating segment, determined using discounted cash flows, to its carrying value indicated potential goodwill impairment. After a subsequent review of the fair value of the net assets of Engineered Cabs, it was determined that the implied fair value of goodwill was $0 and, as a result, the entire $44.9 million goodwill balance was written off during the third quarter of fiscal 2015.
We performed our annual impairment evaluation of goodwill and other indefinite-lived intangible assets during the fourth quarter of fiscal 2017 and concluded that the fair value of each reporting unit exceeded its carrying value; therefore, no additional impairment charges were recognized.
Accounting for Derivatives and Other Contracts at Fair Value: We use derivatives in the normal course of business to manage our exposure to fluctuations in commodity prices, foreign currency exchange rates and interest rates. Fair values for these contracts are based upon valuation methodologies deemed appropriate in the circumstances; however, the use of different assumptions could affect the estimated fair values.
Stock-Based Compensation: All share-based awards, including those to employees and non-employee directors, are recorded as expense in the consolidated statements of earnings based on the fair value of the award at the date of grant.
Income Taxes: In accordance with the authoritative accounting guidance, we account for income taxes using the asset and liability method. The asset and liability method requires the recognition of deferred tax assets and liabilities for expected future tax consequences of temporary differences that currently exist between the tax basis and financial reporting basis of our assets and liabilities. In assessing the realizability of deferred tax assets, we consider whether it is more likely than not that some, or a portion, of the deferred tax assets will not be realized. We provide a valuation allowance for deferred income tax assets when it is more likely than not that a portion of such deferred income tax assets will not be realized.
In accordance with accounting literature related to uncertainty in income taxes, tax benefits from uncertain tax positions that are recognized in the financial statements are measured based on the largest benefit that has a greater than fifty percent likelihood of being realized upon ultimate settlement.
We have reserves for taxes and associated interest and penalties that may become payable in future years as a result of audits by taxing authorities. It is our policy to record these in income tax expense. While we believe the positions taken on previously filed tax returns are appropriate, we have established the tax and interest reserves in recognition that various taxing authorities may challenge our positions. The tax reserves are analyzed periodically, and adjustments are made as events occur to warrant adjustment to the reserves, such as lapsing of applicable statutes of limitations, conclusion of tax audits, additional exposure based on current calculations, identification of new issues, and release of administrative guidance or court decisions affecting a particular tax issue.
Self-Insurance Reserves: We are largely self-insured with respect to workers’ compensation, general and automobile liability, property damage, employee medical claims and other potential losses. In order to reduce risk and better manage our overall loss exposure, we purchase stop-loss insurance that covers individual claims in excess of the deductible amounts. We maintain reserves for the estimated cost to settle open claims, which includes estimates of legal costs expected to be incurred, as well as an estimate of the cost of claims that have been incurred but not reported. These estimates are based on actuarial valuations that take into consideration the historical average claim volume, the average cost for settled claims, current trends in claim costs, changes in our business and workforce, general economic factors and other assumptions believed to be reasonable under the circumstances. The estimated reserves for these liabilities could be affected if future occurrences and claims differ from assumptions used and historical trends. Facility consolidations, a focus on safety initiatives and an emphasis on property loss prevention and product quality have resulted in an improvement in our loss history and the related assumptions used to analyze many of the current self-insurance reserves. We will continue to review these reserves on a quarterly basis, or more frequently if factors dictate a more frequent review is warranted.
The critical accounting policies discussed herein are not intended to be a comprehensive list of all of our accounting policies. In many cases, the accounting treatment of a particular transaction is specifically dictated by U.S. GAAP, with a lesser need for our judgment in their application. There are also areas in which our judgment in selecting an available alternative would not produce a materially different result.
53
Table of Contents
Item 7A. – Quantitative and Qualitative Disclosures About Market Risk
In the normal course of business, we are exposed to various market risks. We continually monitor these risks and regularly develop appropriate strategies to manage them. Accordingly, from time to time, we may enter into certain financial and commodity-based derivative instruments. These instruments are used solely to mitigate market exposure and are not used for trading or speculative purposes. Refer to “Item 8. – Financial Statements and Supplementary Data – Notes to Consolidated Financial Statements – Note P – Derivative Instruments and Hedging Activities” of this Annual Report on Form 10-K for additional information.
Interest Rate Risk
We are exposed to changes in interest rates primarily as a result of our borrowing and investing activities to maintain liquidity and fund operations. The nature and amount of our long-term and short-term debt can be expected to fluctuate as a result of business requirements, market conditions and other factors. We manage exposures to interest rates using a mix of fixed and variable rate debt. We use interest rate swap instruments to manage our exposure to interest rate movements.
We entered into an interest rate swap in October 2014 to hedge changes in cash flows attributable to changes in EURIBOR associated with a five-year, euro denominated term loan entered into by our consolidated joint venture in Turkey. Under the terms of the swap, we receive interest at a variable rate equal to the three-month EURIBOR plus 1.5% and pay interest at a fixed rate of 2.015%. The interest rate swap has a notional amount equal to 60% of the borrowings outstanding under the facility. Borrowings outstanding under the facility totaled $28.7 million at May 31, 2017.
We entered into an interest rate swap in March 2014, in anticipation of the issuance of $250.0 million principal amount of our 2026 Notes. Refer to “Item 8. – Financial Statements and Supplementary Data – Notes to Consolidated Financial Statements – Note G – Debt and Receivables Securitization” of this Annual Report on Form 10-K for additional information regarding the 2026 Notes. The interest rate swap had a notional amount of $150.0 million to hedge the risk of changes in the semi-annual interest payments attributable to changes in the benchmark interest rate during the several days leading up to the issuance of the 12-year fixed-rate debt. Upon pricing of the 2026 Notes, the derivative was settled and resulted in a loss of approximately $3.1 million, a significant portion of which was reflected within accumulated other comprehensive income in our consolidated statement of equity and will be recognized in earnings, as an increase to interest expense, over the life of the related 2026 Notes.
We entered into a U.S. Treasury Rate-based treasury lock in April 2010, in anticipation of the issuance of $150.0 million principal amount of our 2020 Notes. Refer to “Item 8. – Financial Statements and Supplementary Data – Notes to Consolidated Financial Statements – Note G – Debt and Receivables Securitization” of this Annual Report on Form 10-K for additional information regarding the 2020 Notes. The treasury lock had a notional amount of $150.0 million to hedge the risk of changes in the semi-annual interest payments attributable to changes in the benchmark interest rate during the several days leading up to the issuance of the 10-year fixed-rate debt. Upon pricing of the 2020 Notes, the derivative was settled and resulted in a loss of approximately $1.4 million, which has been reflected within accumulated other comprehensive income in our consolidated statements of equity. That balance is being recognized in earnings, as an increase to interest expense, over the life of the related 2020 Notes.
Foreign Currency Risk
The translation of foreign currencies into United States dollars subjects us to exposure related to fluctuating exchange rates. Derivative instruments are not used to manage this risk; however, we do make use of forward contracts to manage exposure to certain intercompany loans with our foreign affiliates as well as exposure to transactions denominated in a currency other than the related foreign affiliate’s local currency. Such contracts limit exposure to both favorable and unfavorable currency fluctuations. At May 31, 2017, the difference between the contract and book value of these instruments was not material to our consolidated financial position, results of operations or cash flows. A 10% change in the exchange rate to the U.S. dollar forward rate is not expected to materially impact our consolidated financial position, results of operations or cash flows. A sensitivity analysis of changes in the U.S. dollar on these foreign currency-denominated contracts indicates that if the U.S. dollar
54
Table of Contents
uniformly weakened by 10% against all of these currency exposures, the fair value of these instruments would not be materially impacted. Any resulting changes in fair value would be offset by changes in the underlying hedged balance sheet position. A sensitivity analysis of changes in the currency exchange rates of our foreign locations indicates that a 10% increase in those rates would not have materially impacted our net results. The sensitivity analysis assumes a uniform shift in all foreign currency exchange rates. The assumption that exchange rates change in uniformity may overstate the impact of changing exchange rates on assets and liabilities denominated in a foreign currency.
Commodity Price Risk
We are exposed to market risk for price fluctuations on purchases of steel, natural gas, zinc and other raw materials as well as our utility requirements. We attempt to negotiate the best prices for commodities and to competitively price products and services to reflect the fluctuations in market prices. Derivative financial instruments have been used to manage a portion of our exposure to fluctuations in the cost of certain commodities, including steel, natural gas, zinc and other raw materials. These contracts covered periods commensurate with known or expected exposures throughout fiscal 2017. The derivative instruments were executed with highly rated financial institutions. No credit loss is anticipated. No derivatives are held for trading purposes.
A sensitivity analysis of changes in the price of hedged commodities indicates that a 10% decline in the market prices of steel, zinc, natural gas or any combination of these would not have a material impact to the value of our hedges or our reported results.
The fair values of our outstanding derivative positions as of May 31, 2017 and 2016 are summarized below. Fair values of these derivatives do not consider the offsetting impact of the underlying hedged item.
| Fair Value At May 31, |
||||||||
| (in millions) | 2017 | 2016 | ||||||
| Interest rate contracts |
$ | (0.3 | ) | $ | (0.5 | ) | ||
| Foreign currency contracts |
0.1 | - | ||||||
| Commodity contracts |
7.4 | 20.3 | ||||||
|
|
|
|
|
|||||
| $ | 7.2 | $ | 19.8 | |||||
|
|
|
|
|
|||||
Safe Harbor
Quantitative and qualitative disclosures about market risk include forward-looking statements with respect to management’s opinion about risks associated with the use of derivative instruments. These statements are based on certain assumptions with respect to market prices and industry supply of, and demand for, steel products and certain raw materials. To the extent these assumptions prove to be inaccurate, future outcomes with respect to hedging programs may differ materially from those discussed in the forward-looking statements.
55
Table of Contents
Item 8. – Financial Statements and Supplementary Data
Report of Independent Registered Public Accounting Firm
The Board of Directors and Shareholders
Worthington Industries, Inc.:
We have audited the accompanying consolidated balance sheets of Worthington Industries, Inc. and subsidiaries (the Company) as of May 31, 2017 and 2016, and the related consolidated statements of earnings, comprehensive income, equity, and cash flows for each of the years in the three-year period ended May 31, 2017. In connection with our audits of the consolidated financial statements, we also have audited the financial statement schedule of valuation and qualifying accounts. These consolidated financial statements and financial statement schedule are the responsibility of the Company’s management. Our responsibility is to express an opinion on these consolidated financial statements and financial statement schedule based on our audits.
We conducted our audits in accordance with the standards of the Public Company Accounting Oversight Board (United States). Those standards require that we plan and perform the audit to obtain reasonable assurance about whether the financial statements are free of material misstatement. An audit includes examining, on a test basis, evidence supporting the amounts and disclosures in the financial statements. An audit also includes assessing the accounting principles used and significant estimates made by management, as well as evaluating the overall financial statement presentation. We believe that our audits provide a reasonable basis for our opinion.
In our opinion, the consolidated financial statements referred to above present fairly, in all material respects, the financial position of Worthington Industries, Inc. and subsidiaries as of May 31, 2017 and 2016, and the results of their operations and their cash flows for each of the years in the three-year period ended May 31, 2017, in conformity with U.S. generally accepted accounting principles. Also in our opinion, the related financial statement schedule, when considered in relation to the basic consolidated financial statements taken as a whole, presents fairly, in all material respects, the information set forth therein.
We also have audited, in accordance with the standards of the Public Company Accounting Oversight Board (United States), Worthington Industries, Inc.’s internal control over financial reporting as of May 31, 2017, based on criteria established in Internal Control – Integrated Framework (2013) issued by the Committee of Sponsoring Organizations of the Treadway Commission (COSO), and our report dated July 24, 2017 expressed an unqualified opinion on the effectiveness of the Company’s internal control over financial reporting.
| /s/ KPMG LLP |
Columbus, Ohio
July 24, 2017
56
Table of Contents
WORTHINGTON INDUSTRIES, INC.
CONSOLIDATED BALANCE SHEETS
(In thousands)
| May 31, | ||||||||
| 2017 | 2016 | |||||||
| ASSETS |
||||||||
| Current assets: |
||||||||
| Cash and cash equivalents |
$ | 278,081 | $ | 84,188 | ||||
| Receivables, less allowances of $3,444 and $4,579 at May 31, 2017 and May 31, 2016, respectively |
486,730 | 439,688 | ||||||
| Inventories: |
||||||||
| Raw materials |
185,001 | 162,427 | ||||||
| Work in process |
95,630 | 86,892 | ||||||
| Finished products |
73,303 | 70,016 | ||||||
|
|
|
|
|
|||||
| Total inventories |
353,934 | 319,335 | ||||||
| Income taxes receivable |
7,164 | 10,535 | ||||||
| Assets held for sale |
9,654 | 10,079 | ||||||
| Prepaid expenses and other current assets |
55,406 | 51,290 | ||||||
|
|
|
|
|
|||||
| Total current assets |
1,190,969 | 915,115 | ||||||
| Investments in unconsolidated affiliates |
208,591 | 191,826 | ||||||
| Goodwill |
247,673 | 246,067 | ||||||
| Other intangible assets, net of accumulated amortization of $63,134 and $49,532 at May 31, 2017 and May 31, 2016, respectively |
82,781 | 96,164 | ||||||
| Other assets |
24,841 | 29,254 | ||||||
| Property, plant and equipment: |
||||||||
| Land |
22,077 | 18,537 | ||||||
| Buildings and improvements |
297,951 | 256,973 | ||||||
| Machinery and equipment |
961,542 | 945,951 | ||||||
| Construction in progress |
27,616 | 48,156 | ||||||
|
|
|
|
|
|||||
| Total property, plant and equipment |
1,309,186 | 1,269,617 | ||||||
| Less: accumulated depreciation |
738,697 | 686,779 | ||||||
|
|
|
|
|
|||||
| Total property, plant and equipment, net |
570,489 | 582,838 | ||||||
|
|
|
|
|
|||||
| Total assets |
$ | 2,325,344 | $ | 2,061,264 | ||||
|
|
|
|
|
|||||
See notes to consolidated financial statements.
57
Table of Contents
WORTHINGTON INDUSTRIES, INC.
CONSOLIDATED BALANCE SHEETS
(Dollars in thousands)
| May 31, | ||||||||
| 2017 | 2016 | |||||||
| LIABILITIES AND EQUITY |
||||||||
| Current liabilities: |
||||||||
| Accounts payable |
$ | 368,071 | $ | 290,432 | ||||
| Short-term borrowings |
123 | 2,651 | ||||||
| Accrued compensation, contributions to employee benefit plans and related taxes |
86,201 | 75,105 | ||||||
| Dividends payable |
13,698 | 13,471 | ||||||
| Other accrued items |
41,551 | 45,056 | ||||||
| Income taxes payable |
4,448 | 2,501 | ||||||
| Current maturities of long-term debt |
6,691 | 862 | ||||||
|
|
|
|
|
|||||
| Total current liabilities |
520,783 | 430,078 | ||||||
| Other liabilities |
61,498 | 63,487 | ||||||
| Distributions in excess of investment in unconsolidated affiliate |
63,038 | 52,983 | ||||||
| Long-term debt |
571,796 | 577,491 | ||||||
| Deferred income taxes, net |
34,300 | 17,379 | ||||||
|
|
|
|
|
|||||
| Total liabilities |
1,251,415 | 1,141,418 | ||||||
|
|
|
|
|
|||||
| Shareholders’ equity – controlling interest: |
||||||||
| Preferred shares, without par value; authorized – 1,000,000 shares; issued and outstanding – none |
|
- |
|
- | ||||
| Common shares, without par value; authorized – 150,000,000 shares; issued and outstanding, 2017 – 62,802,456 shares, 2016 – 61,533,668 shares |
- | - | ||||||
| Additional paid-in capital |
303,391 | 298,984 | ||||||
| Accumulated other comprehensive loss, net of taxes of $5,310 and $4,768 at May 31, 2017 and May 31, 2016, respectively |
(27,775 | ) | (28,565 | ) | ||||
| Retained earnings |
676,019 | 522,952 | ||||||
|
|
|
|
|
|||||
| Total shareholders’ equity – controlling interest |
951,635 | 793,371 | ||||||
| Noncontrolling interests |
122,294 | 126,475 | ||||||
|
|
|
|
|
|||||
| Total equity |
1,073,929 | 919,846 | ||||||
|
|
|
|
|
|||||
| Total liabilities and equity |
$ | 2,325,344 | $ | 2,061,264 | ||||
|
|
|
|
|
|||||
See notes to consolidated financial statements.
58
Table of Contents
WORTHINGTON INDUSTRIES, INC.
CONSOLIDATED STATEMENTS OF EARNINGS
(In thousands, except per share amounts)
| Fiscal Years Ended May 31, | ||||||||||||
| 2017 | 2016 | 2015 | ||||||||||
| Net sales |
$ | 3,014,108 | $ | 2,819,714 | $ | 3,384,234 | ||||||
| Cost of goods sold |
2,478,203 | 2,367,121 | 2,920,701 | |||||||||
|
|
|
|
|
|
|
|||||||
| Gross margin |
535,905 | 452,593 | 463,533 | |||||||||
| Selling, general and administrative expense |
316,373 | 297,402 | 295,920 | |||||||||
| Impairment of goodwill and long-lived assets |
— | 25,962 | 100,129 | |||||||||
| Restructuring and other expense |
6,411 | 7,177 | 6,927 | |||||||||
|
|
|
|
|
|
|
|||||||
| Operating income |
213,121 | 122,052 | 60,557 | |||||||||
| Other income (expense): |
||||||||||||
| Miscellaneous income, net |
3,764 | 11,267 | 795 | |||||||||
| Interest expense |
(29,796 | ) | (31,670 | ) | (35,800 | ) | ||||||
| Equity in net income of unconsolidated affiliates |
110,038 | 114,966 | 87,476 | |||||||||
|
|
|
|
|
|
|
|||||||
| Earnings before income taxes |
297,127 | 216,615 | 113,028 | |||||||||
| Income tax expense |
79,190 | 58,987 | 25,772 | |||||||||
|
|
|
|
|
|
|
|||||||
| Net earnings |
217,937 | 157,628 | 87,256 | |||||||||
| Net earnings attributable to noncontrolling interests |
13,422 | 13,913 | 10,471 | |||||||||
|
|
|
|
|
|
|
|||||||
| Net earnings attributable to controlling interest |
$ | 204,515 | $ | 143,715 | $ | 76,785 | ||||||
|
|
|
|
|
|
|
|||||||
| Basic |
||||||||||||
| Average common shares outstanding |
62,443 | 62,469 | 66,309 | |||||||||
|
|
|
|
|
|
|
|||||||
| Earnings per share attributable to controlling interest |
$ | 3.28 | $ | 2.30 | $ | 1.16 | ||||||
|
|
|
|
|
|
|
|||||||
| Diluted |
||||||||||||
| Average common shares outstanding |
64,874 | 64,755 | 68,483 | |||||||||
|
|
|
|
|
|
|
|||||||
| Earnings per share attributable to controlling interest |
$ | 3.15 | $ | 2.22 | $ | 1.12 | ||||||
|
|
|
|
|
|
|
|||||||
See notes to consolidated financial statements.
59
Table of Contents
WORTHINGTON INDUSTRIES, INC.
CONSOLIDATED STATEMENTS OF COMPREHENSIVE INCOME
(In thousands)
| Fiscal Years Ended May 31, | ||||||||||||
| 2017 | 2016 | 2015 | ||||||||||
| Net earnings |
$ | 217,937 | $ | 157,628 | $ | 87,256 | ||||||
| Other comprehensive income (loss): |
||||||||||||
| Foreign currency translation |
1,342 | 4,716 | (34,229 | ) | ||||||||
| Pension liability adjustment, net of tax |
2,242 | (2,058 | ) | (3,738 | ) | |||||||
| Cash flow hedges, net of tax |
(2,822 | ) | 22,208 | (11,653 | ) | |||||||
|
|
|
|
|
|
|
|||||||
| Other comprehensive income (loss) |
762 | 24,866 | (49,620 | ) | ||||||||
|
|
|
|
|
|
|
|||||||
| Comprehensive income |
218,699 | 182,494 | 37,636 | |||||||||
| Comprehensive income attributable to noncontrolling interests |
13,394 | 16,640 | 7,974 | |||||||||
|
|
|
|
|
|
|
|||||||
| Comprehensive income attributable to controlling interest |
$ | 205,305 | $ | 165,854 | $ | 29,662 | ||||||
|
|
|
|
|
|
|
|||||||
See notes to consolidated financial statements.
60
Table of Contents
WORTHINGTON INDUSTRIES, INC.
CONSOLIDATED STATEMENTS OF EQUITY
(Dollars in thousands, except per share amounts)
| Controlling Interest | ||||||||||||||||||||||||||||||||
| Common Shares | Additional Paid-in Capital |
Accumulated Other Comprehensive Loss, Net of Tax |
Retained Earnings |
Total | Noncontrolling Interests |
Total | ||||||||||||||||||||||||||
| (in thousands) | Shares | Amount | ||||||||||||||||||||||||||||||
| Balance at May 31, 2014 |
67,408,484 | $ | - | $ | 262,610 | $ | (3,581 | ) | $ | 591,783 | $ | 850,812 | $ | 94,070 | $ | 944,882 | ||||||||||||||||
| Net earnings |
- | - | - | - | 76,785 | 76,785 | 10,471 | 87,256 | ||||||||||||||||||||||||
| Other comprehensive loss |
- | - | - | (47,123 | ) | - | (47,123 | ) | (2,497 | ) | (49,620 | ) | ||||||||||||||||||||
| Acquisition of dHybrid Systems, LLC |
- | - | - | - | - | - | 4,082 | 4,082 | ||||||||||||||||||||||||
| Common shares issued, net of withholding tax |
909,181 | - | 2,910 | - | - | 2,910 | - | 2,910 | ||||||||||||||||||||||||
| Theoretical common shares in NQ plans |
- | - | 14,560 | - | - | 14,560 | - | 14,560 | ||||||||||||||||||||||||
| Stock-based compensation |
- | - | 26,837 | - | - | 26,837 | - | 26,837 | ||||||||||||||||||||||||
| Purchases and retirement of common shares |
(4,176,187 | ) | - | (17,839 | ) | - | (109,521 | ) | (127,360 | ) | - | (127,360 | ) | |||||||||||||||||||
| Dividends to noncontrolling interests |
- | - | - | - | - | - | (15,189 | ) | (15,189 | ) | ||||||||||||||||||||||
| Cash dividends declared ($0.72 per share) |
- | - | - | - | (48,309 | ) | (48,309 | ) | - | (48,309 | ) | |||||||||||||||||||||
|
|
|
|
|
|
|
|
|
|
|
|
|
|
|
|
|
|||||||||||||||||
| Balance at May 31, 2015 |
64,141,478 | $ | - | $ | 289,078 | $ | (50,704 | ) | $ | 510,738 | $ | 749,112 | $ | 90,937 | $ | 840,049 | ||||||||||||||||
|
|
|
|
|
|
|
|
|
|
|
|
|
|
|
|
|
|||||||||||||||||
| Net earnings |
- | - | - | - | 143,715 | 143,715 | 13,913 | 157,628 | ||||||||||||||||||||||||
| Other comprehensive income |
- | - | - | 22,139 | - | 22,139 | 2,727 | 24,866 | ||||||||||||||||||||||||
| Acquisition of Worthington Specialty Processing |
- | - | - | - | - | - | 28,004 | 28,004 | ||||||||||||||||||||||||
| Common shares issued, net of withholding tax |
892,190 | - | 8,707 | - | - | 8,707 | - | 8,707 | ||||||||||||||||||||||||
| Theoretical common shares in NQ plans |
- | - | 960 | - | - | 960 | - | 960 | ||||||||||||||||||||||||
| Stock-based compensation |
- | - | 16,534 | - | - | 16,534 | - | 16,534 | ||||||||||||||||||||||||
| Purchases and retirement of common shares |
(3,500,000 | ) | - | (16,295 | ) | - | (83,552 | ) | (99,847 | ) | - | (99,847 | ) | |||||||||||||||||||
| Dividends to noncontrolling interests |
- | - | - | - | - | - | (9,106 | ) | (9,106 | ) | ||||||||||||||||||||||
| Cash dividends declared ($0.76 per share) |
- | - | - | - | (47,949 | ) | (47,949 | ) | - | (47,949 | ) | |||||||||||||||||||||
|
|
|
|
|
|
|
|
|
|
|
|
|
|
|
|
|
|||||||||||||||||
| Balance at May 31, 2016 |
61,533,668 | $ | - | $ | 298,984 | $ | (28,565 | ) | $ | 522,952 | $ | 793,371 | $ | 126,475 | $ | 919,846 | ||||||||||||||||
|
|
|
|
|
|
|
|
|
|
|
|
|
|
|
|
|
|||||||||||||||||
| Net earnings |
- | - | - | - | 204,515 | 204,515 | 13,422 | 217,937 | ||||||||||||||||||||||||
| Other comprehensive income (loss) |
- | - | - | 790 | - | 790 | (28 | ) | 762 | |||||||||||||||||||||||
| Common shares issued, net of withholding tax |
1,268,788 | - | (9,075 | ) | - | - | (9,075 | ) | - | (9,075 | ) | |||||||||||||||||||||
| Theoretical common shares in NQ plans |
- | - | 1,259 | - | - | 1,259 | - | 1,259 | ||||||||||||||||||||||||
| Stock-based compensation |
- | - | 13,158 | - | - | 13,158 | - | 13,158 | ||||||||||||||||||||||||
| Purchase of noncontrolling interest in dHybrid |
- | - | (935 | ) | - | - | (935 | ) | (1,953 | ) | (2,888 | ) | ||||||||||||||||||||
| Dividends to noncontrolling interests |
- | - | - | - | - | - | (15,622 | ) | (15,622 | ) | ||||||||||||||||||||||
| Cash dividends declared ($0.80 per share) |
- | - | - | - | (51,448 | ) | (51,448 | ) | - | (51,448 | ) | |||||||||||||||||||||
|
|
|
|
|
|
|
|
|
|
|
|
|
|
|
|
|
|||||||||||||||||
| Balance at May 31, 2017 |
62,802,456 | $ | - | $ | 303,391 | $ | (27,775 | ) | $ | 676,019 | $ | 951,635 | $ | 122,294 | $ | 1,073,929 | ||||||||||||||||
|
|
|
|
|
|
|
|
|
|
|
|
|
|
|
|
|
|||||||||||||||||
See notes to consolidated financial statements.
61
Table of Contents
WORTHINGTON INDUSTRIES, INC.
CONSOLIDATED STATEMENTS OF CASH FLOWS
(In thousands)
| Fiscal Years Ended May 31, | ||||||||||||
| 2017 | 2016 | 2015 | ||||||||||
| Operating activities: |
||||||||||||
| Net earnings |
$ | 217,937 | $ | 157,628 | $ | 87,256 | ||||||
| Adjustments to reconcile net earnings to net cash provided by operating activities: |
||||||||||||
| Depreciation and amortization |
86,793 | 84,699 | 85,089 | |||||||||
| Impairment of goodwill and long-lived assets |
- | 25,962 | 100,129 | |||||||||
| Provision for (benefit from) deferred income taxes |
18,443 | 7,354 | (39,960 | ) | ||||||||
| Bad debt expense |
269 | 346 | 259 | |||||||||
| Equity in net income of unconsolidated affiliates, net of distributions |
(8,023 | ) | (29,473 | ) | (12,299 | ) | ||||||
| Net (gain) loss on assets |
7,951 | (12,996 | ) | 3,277 | ||||||||
| Stock-based compensation |
14,349 | 15,836 | 17,916 | |||||||||
| Excess tax benefits – stock-based compensation |
- | - | (7,178 | ) | ||||||||
| Gain on previously held equity interest in WSP |
- | (6,877 | ) | - | ||||||||
| Changes in assets and liabilities, net of impact of acquisitions: |
||||||||||||
| Receivables |
(39,927 | ) | 66,117 | 32,011 | ||||||||
| Inventories |
(34,599 | ) | 66,351 | 54,108 | ||||||||
| Prepaid expenses and other current assets |
985 | 18,327 | (15,295 | ) | ||||||||
| Other assets |
1,905 | (4,530 | ) | 1,617 | ||||||||
| Accounts payable and accrued expenses |
67,492 | 20,180 | (83,190 | ) | ||||||||
| Other liabilities |
2,097 | 4,460 | (9,365 | ) | ||||||||
|
|
|
|
|
|
|
|||||||
| Net cash provided by operating activities |
335,672 | 413,384 | 214,375 | |||||||||
|
|
|
|
|
|
|
|||||||
| Investing activities: |
||||||||||||
| Investment in property, plant and equipment |
(68,386 | ) | (97,036 | ) | (96,255 | ) | ||||||
| Investment in notes receivable |
- | - | (7,300 | ) | ||||||||
| Acquisitions, net of cash acquired |
- | (34,206 | ) | (105,291 | ) | |||||||
| Investments in unconsolidated affiliates |
- | (5,595 | ) | (8,230 | ) | |||||||
| Proceeds from sale of assets and insurance |
5,422 | 9,797 | 14,007 | |||||||||
|
|
|
|
|
|
|
|||||||
| Net cash used by investing activities |
(62,964 | ) | (127,040 | ) | (203,069 | ) | ||||||
|
|
|
|
|
|
|
|||||||
| Financing activities: |
||||||||||||
| Net proceeds from (repayments of) short-term borrowings, net issuance costs |
(2,528 | ) | (85,843 | ) | 79,047 | |||||||
| Proceeds from long-term debt, net of issuance costs |
- | 921 | 30,572 | |||||||||
| Principal payments on long-term debt |
(874 | ) | (862 | ) | (102,852 | ) | ||||||
| Proceeds from issuance of common shares, net of tax withholdings |
(9,075 | ) | 8,707 | 2,910 | ||||||||
| Excess tax benefits–stock-based compensation |
- | - | 7,178 | |||||||||
| Payments to noncontrolling interests |
(15,622 | ) | (9,106 | ) | (13,379 | ) | ||||||
| Repurchase of common shares |
- | (99,847 | ) | (127,360 | ) | |||||||
| Dividends paid |
(50,716 | ) | (47,193 | ) | (46,434 | ) | ||||||
|
|
|
|
|
|
|
|||||||
| Net cash used by financing activities |
(78,815 | ) | (233,223 | ) | (170,318 | ) | ||||||
|
|
|
|
|
|
|
|||||||
| Increase (decrease) in cash and cash equivalents |
193,893 | 53,121 | (159,012 | ) | ||||||||
| Cash and cash equivalents at beginning of year |
84,188 | 31,067 | 190,079 | |||||||||
|
|
|
|
|
|
|
|||||||
| Cash and cash equivalents at end of year |
$ | 278,081 | $ | 84,188 | $ | 31,067 | ||||||
|
|
|
|
|
|
|
|||||||
See notes to consolidated financial statements.
62
Table of Contents
WORTHINGTON INDUSTRIES, INC.
NOTES TO CONSOLIDATED FINANCIAL STATEMENTS
Fiscal Years Ended May 31, 2017, 2016 and 2015
Note A – Summary of Significant Accounting Policies
Consolidation: The consolidated financial statements include the accounts of Worthington Industries, Inc. and consolidated subsidiaries (collectively, “we,” “our,” “Worthington,” or the “Company”). Investments in unconsolidated affiliates are accounted for using the equity method. Significant intercompany accounts and transactions are eliminated.
The Company owns controlling interests in the following five joint ventures: Spartan Steel Coating, LLC (“Spartan”) (52%), TWB Company, L.L.C. (“TWB”) (55%), Worthington Arıtaş Basınçlı Kaplar Sanayi (“Worthington Aritas”) (75%), Worthington Energy Innovations, LLC (“WEI”) (75%), and Worthington Specialty Processing (“WSP”) (51%). These joint ventures are consolidated with the equity owned by the other joint venture members shown as noncontrolling interests in our consolidated balance sheets, and their portions of net earnings and other comprehensive income (loss) (“OCI”) shown as net earnings or comprehensive income attributable to noncontrolling interests in our consolidated statements of earnings and comprehensive income, respectively. On January 1, 2017, the Company acquired the minority membership interest in dHybrid Systems, LLC (“dHybrid”) from the noncontrolling member in a non-cash transaction. The difference between the fair value of the noncontrolling interest and its carrying value was recorded as a reduction to additional paid-in capital in the amount of $935,000 (net of tax of $539,000).
Use of Estimates: The preparation of consolidated financial statements in conformity with accounting principles generally accepted in the United States (“U.S. GAAP”) requires management to make estimates and assumptions that affect the amounts reported in the consolidated financial statements and accompanying notes. Actual results could differ from those estimates.
Cash and Cash Equivalents: We consider all highly liquid investments purchased with an original maturity of three months or less to be cash equivalents.
Inventories: Inventories are valued at the lower of cost or market. Cost is determined using the first-in, first-out method for all inventories. This assessment requires the use of significant estimates to determine replacement cost, cost to complete, normal profit margin and the ultimate selling price of the inventory. Due to a decline in steel prices in the fiscal year ended May 31, 2015 (“fiscal 2015”), the replacement cost of our inventory was lower than what was reflected in our records at May 31, 2015. Accordingly, we recorded a lower of cost or market adjustment of $1,716,000 at May 31, 2015 to reflect this lower value. The entire amount related to our Steel Processing operating segment and was recorded in cost of goods sold. We believe our inventories were valued appropriately as of May 31, 2017 and 2016.
Derivative Financial Instruments: We utilize derivative financial instruments to manage exposure to certain risks related to our ongoing operations. The primary risks managed through the use of derivative instruments include interest rate risk, currency exchange risk and commodity price risk. All derivative instruments are accounted for using mark-to-market accounting. The accounting for changes in the fair value of a derivative instrument depends on whether it has been designated and qualifies as part of a hedging relationship and, if so, the reason for holding it. Gains and losses on fair value hedges are recognized in current period earnings in the same line as the underlying hedged item. The effective portion of gains and losses on cash flow hedges is deferred as a component of accumulated other comprehensive income or loss (“AOCI”) and recognized in earnings at the time the hedged item affects earnings, in the same financial statement caption as the underlying hedged item. Ineffectiveness of the hedges during the fiscal year ended May 31, 2017 (“fiscal 2017”), the fiscal year ended May 31, 2016 (“fiscal 2016”) and fiscal 2015 was immaterial. Classification in the consolidated statements of earnings of gains and losses related to derivative instruments that do not qualify for hedge accounting is determined based on the underlying intent of the instruments. Cash flows related to derivative instruments are generally classified as operating activities in our consolidated statements of cash flows.
63
Table of Contents
In order for hedging relationships to qualify for hedge accounting under current accounting guidance, we formally document each hedging relationship and its risk management objective. This documentation includes the hedge strategy, the hedging instrument, the hedged item, the nature of the risk being hedged, how hedge effectiveness will be assessed prospectively and retrospectively as well as a description of the method used to measure hedge ineffectiveness.
Derivative instruments are executed only with highly-rated counterparties. No credit loss is anticipated on existing instruments, and no material credit losses have been experienced to date. We monitor our positions, as well as the credit ratings of counterparties to those positions.
We discontinue hedge accounting when it is determined that the derivative instrument is no longer effective in offsetting the hedged risk, expires or is sold, is terminated or is no longer designated as a hedging instrument because it is unlikely that a forecasted transaction will occur or we determine that designation of the hedging instrument is no longer appropriate. In all situations in which hedge accounting is discontinued and the derivative instrument is retained, we continue to carry the derivative instrument at its fair value on the consolidated balance sheet and recognize any subsequent changes in its fair value in net earnings immediately. When it is probable that a forecasted transaction will not occur, we discontinue hedge accounting and immediately recognize the gains and losses that were accumulated in AOCI.
Refer to “Note P – Derivative Instruments and Hedging Activities” for additional information regarding the consolidated balance sheet location and the risk classification of our derivative instruments.
Risks and Uncertainties: As of May 31, 2017, excluding our joint ventures, we operated 30 manufacturing facilities worldwide, principally in three operating segments, which correspond with our reportable business segments: Steel Processing, Pressure Cylinders, and Engineered Cabs. Our remaining operating segment consists of WEI, which does not meet the applicable aggregation criteria or quantitative thresholds for separate disclosure, and therefore is combined and reported in the “Other” Category. We also held equity positions in 11 joint ventures, which operated 50 manufacturing facilities worldwide, as of May 31, 2017. Our largest end market is the automotive industry, which comprised 43%, 42%, and 38% of consolidated net sales in fiscal 2017, fiscal 2016, and fiscal 2015, respectively. Our international operations represented 7%, 6%, and 4% of consolidated net sales and 4%, 8%, and (4)% of net earnings attributable to controlling interest in fiscal 2017, fiscal 2016, and fiscal 2015, respectively, and 11% and 12% of consolidated net assets as of May 31, 2017 and May 31, 2016, respectively. As of May 31, 2017, approximately 9% of our consolidated labor force was represented by collective bargaining agreements. The concentration of credit risks from financial instruments related to the markets we serve is not expected to have a material adverse effect on our consolidated financial position, cash flows or future results of operations.
In fiscal 2017, our largest customer accounted for approximately 9% of our consolidated net sales, and our ten largest customers accounted for approximately 34% of our consolidated net sales. A significant loss of, or decrease in, business from any of these customers could have an adverse effect on our consolidated net sales and financial results if we cannot obtain replacement business. Also, due to consolidation within the industries we serve, including the construction, automotive and retail industries, our sales may be increasingly sensitive to deterioration in the financial condition of, or other adverse developments with respect to, one or more of our largest customers.
Our principal raw material is flat-rolled steel, which we purchase from multiple primary steel producers. The steel industry as a whole has been cyclical, and at times availability and pricing can be volatile due to a number of factors beyond our control. This volatility can significantly affect our steel costs. In an environment of increasing prices for steel and other raw materials, in general, competitive conditions may impact how much of the price increases we can pass on to our customers. To the extent we are unable to pass on future price increases in our raw materials to our customers, our financial results could be adversely affected. Also, if steel prices decrease, in general, competitive conditions may impact how quickly we must reduce our prices to our customers, and we could be forced to use higher-priced raw materials to complete orders for which the selling prices have decreased. Declining steel prices could also require us to write-down the value of our inventories to reflect current market pricing. Further, the number of suppliers has decreased in recent years due to industry consolidation and the financial difficulties of certain suppliers, and consolidation may continue. Accordingly, if delivery from a major steel supplier is disrupted, it may be more difficult to obtain an alternative supply than in the past.
64
Table of Contents
Receivables: We review our receivables on an ongoing basis to ensure that they are properly valued and collectible. This is accomplished through two contra-receivable accounts: returns and allowances and allowance for doubtful accounts. Returns and allowances are used to record estimates of returns or other allowances resulting from quality, delivery, discounts or other issues affecting the value of receivables. This account is estimated based on historical trends and current market conditions, with the offset to net sales. The returns and allowances account increased approximately $685,000 during fiscal 2017 to $6,738,000.
The allowance for doubtful accounts is used to record the estimated risk of loss related to the customers’ inability to pay. This allowance is maintained at a level that we consider appropriate based on factors that affect collectability, such as the financial health of our customers, historical trends of charge-offs and recoveries and current economic and market conditions. As we monitor our receivables, we identify customers that may have payment problems, and we adjust the allowance accordingly, with the offset to selling, general and administrative (“SG&A”) expense. Account balances are charged off against the allowance when recovery is considered remote. The allowance for doubtful accounts decreased approximately $1,135,000 during fiscal 2017 to $3,444,000.
While we believe our allowance for doubtful accounts is adequate, changes in economic conditions, the financial health of customers and bankruptcy settlements could impact our future earnings. If the economic environment and market conditions deteriorate, particularly in the automotive and construction end markets where our exposure is greatest, additional reserves may be required.
Property and Depreciation: Property, plant and equipment are carried at cost and depreciated using the straight-line method. Buildings and improvements are depreciated over 10 to 40 years and machinery and equipment over 3 to 20 years. Depreciation expense was $73,268,000, $68,886,000 and $64,666,000 during fiscal 2017, fiscal 2016 and fiscal 2015, respectively. Accelerated depreciation methods are used for income tax purposes.
Goodwill and Other Long-Lived Assets: We use the purchase method of accounting for all business combinations and recognize amortizable and indefinite-lived intangible assets separately from goodwill. The acquired assets and assumed liabilities in an acquisition are measured and recognized based on their estimated fair values at the date of acquisition, with goodwill representing the excess of the purchase price over the fair value of the identifiable net assets. A bargain purchase may occur, wherein the fair value of identifiable net assets exceeds the purchase price, and a gain is then recognized in the amount of that excess. Goodwill and intangible assets with indefinite lives are not amortized, but instead are tested for impairment annually, during the fourth quarter, or more frequently if events or changes in circumstances indicate that impairment may be present. Application of goodwill impairment testing involves judgment, including but not limited to, the identification of reporting units and estimation of the fair value of each reporting unit. A reporting unit is defined as an operating segment or one level below an operating segment. With the exception of Pressure Cylinders, we test goodwill at the operating segment level as we have determined that the characteristics of the reporting units within each operating segment are similar and allow for their aggregation in accordance with the applicable accounting guidance. For our Pressure Cylinders operating segment, the oil & gas equipment business has been treated as a separate reporting unit since the second quarter of fiscal 2016.
The goodwill impairment test consists of comparing the fair value of each reporting unit, determined using discounted cash flows, to each reporting unit’s respective carrying value. If the estimated fair value of a reporting unit exceeds its carrying value, there is no impairment. If the carrying amount of the reporting unit exceeds its estimated fair value, goodwill impairment is indicated. The amount of the goodwill impairment is determined by comparing the fair value of the net assets of the reporting unit, excluding goodwill, to its estimated fair value, with the difference representing the implied fair value of the goodwill. If the implied fair value of the goodwill is lower than its carrying value, the difference is recorded as an impairment charge in our consolidated statements of earnings. The impairment test for indefinite-lived intangible assets consists of a comparison of the fair value of the intangible asset to its carrying value. If the carrying value of the indefinite-lived intangible asset exceeds its fair value, the difference is recorded as an impairment charge in our consolidated statements of earnings.
We review the carrying value of our long-lived assets, including intangible assets with finite useful lives, for impairment whenever events or changes in circumstances indicate that the carrying value of an asset or asset group may not be recoverable. Impairment testing involves a comparison of the sum of the undiscounted future cash
65
Table of Contents
flows of the asset or asset group to its respective carrying amount. If the sum of the undiscounted future cash flows exceeds the carrying amount, then no impairment exists. If the carrying amount exceeds the sum of the undiscounted future cash flows, then a second step is performed to determine the amount of impairment, if any, to be recognized. The impairment loss recognized is equal to the amount that the carrying value of the asset or asset group exceeds its fair value.
Our impairment testing for both goodwill and other long-lived assets, including intangible assets with finite useful lives, is largely based on cash flow models that require significant judgment and require assumptions about future volume trends, revenue and expense growth rates; and, in addition, external factors such as changes in economic trends and cost of capital. Significant changes in any of these assumptions could impact the outcomes of the tests performed. See “Note C – Goodwill and Other Long-Lived Assets” for additional details regarding these assets and related impairment testing.
Leases: Certain lease agreements contain fluctuating or escalating payments and rent holiday periods. The related rent expense is recorded on a straight-line basis over the lease term. Leasehold improvements made by the lessee, whether funded by the lessee or by landlord allowances or incentives, are recorded as leasehold improvement assets and will be amortized over the shorter of the economic life or the lease term. These incentives are recorded as deferred rent and amortized as reductions in rent expense over the lease term.
Stock-Based Compensation: At May 31, 2017, we had stock-based compensation plans for our employees as well as our non-employee directors as described more fully in “Note J – Stock-Based Compensation.” All share-based awards, including grants of stock options and restricted common shares, are recorded as expense in the consolidated statements of earnings based on their grant-date fair values.
Revenue Recognition: We recognize revenue upon transfer of title and risk of loss, or in the case of toll processing revenue, upon delivery of the goods, provided evidence of an arrangement exists, pricing is fixed and determinable and the ability to collect is probable. We provide, through charges to net sales, for returns and allowances based on experience and current customer activities. We also provide, through charges to net sales, for customer rebates and sales discounts based on specific agreements and recent and anticipated levels of customer activity. In circumstances where the collection of payment is not probable at the time of shipment, we defer recognition of revenue until payment is collected.
Advertising Expense: Advertising costs are expensed as incurred and included in SG&A expense. Advertising expense was $14,822,000, $13,970,000, and $11,153,000 for fiscal 2017, fiscal 2016 and fiscal 2015, respectively.
Shipping and Handling Fees and Costs: Shipping and handling fees billed to customers are included in net sales. Shipping and handling costs incurred are included in cost of goods sold.
Environmental Costs: Environmental costs are capitalized if the costs extend the life of the property, increase its capacity, and/or mitigate or prevent contamination from future operations. Costs related to environmental contamination treatment and cleanup are charged to expense as incurred.
Statements of Cash Flows: Supplemental cash flow information was as follows for the fiscal years ended May 31:
| (in thousands) | 2017 | 2016 | 2015 | |||||||||
| Interest paid, net of amount capitalized |
$ | 29,826 | $ | 30,431 | $ | 36,190 | ||||||
| Income taxes paid, net of refunds |
$ | 55,652 | $ | 50,750 | $ | 67,825 | ||||||
We use the “cumulative earnings” approach for determining cash flow presentation of distributions from our unconsolidated joint ventures. Distributions received are included in our consolidated statements of cash flows as operating activities, unless the cumulative distributions exceed our portion of the cumulative equity in the net earnings of the joint venture, in which case the excess distributions are deemed to be returns of the investment and are classified as investing activities in our consolidated statements of cash flows.
66
Table of Contents
Income Taxes: We account for income taxes using the asset and liability method. The asset and liability method requires the recognition of deferred tax assets and liabilities for expected future tax consequences of temporary differences that currently exist between the tax basis and the financial reporting basis of our assets and liabilities. In assessing the realizability of deferred tax assets, we consider whether it is more likely than not that all, or a portion, of the deferred tax assets will not be realized. We provide a valuation allowance for deferred income tax assets when it is more likely than not that a portion of such deferred income tax assets will not be realized.
Tax benefits from uncertain tax positions that are recognized in the consolidated financial statements are measured based on the largest benefit that has a greater than fifty percent likelihood of being realized upon ultimate settlement.
We have reserves for income taxes and associated interest and penalties that may become payable in future years as a result of audits by taxing authorities. It is our policy to record these in income tax expense. While we believe the positions taken on previously filed tax returns are appropriate, we have established the tax and interest reserves in recognition that various taxing authorities may challenge our positions. The tax reserves are analyzed periodically, and adjustments are made as events occur to warrant adjustment to the reserves, such as lapsing of applicable statutes of limitations, conclusion of tax audits, additional exposure based on current calculations, identification of new issues and release of administrative guidance or court decisions affecting a particular tax issue.
Self-Insurance Reserves: We are largely self-insured with respect to workers’ compensation, general and automobile liability, property damage, employee medical claims and other potential losses. In order to reduce risk and better manage our overall loss exposure, we purchase stop-loss insurance that covers individual claims in excess of the deductible amounts. We maintain reserves for the estimated cost to settle open claims, which includes estimates of legal costs expected to be incurred, as well as an estimate of the cost of claims that have been incurred but not reported. These estimates are based on actuarial valuations that take into consideration the historical average claim volume, the average cost for settled claims, current trends in claim costs, changes in our business and workforce, general economic factors and other assumptions believed to be reasonable under the circumstances. The estimated reserves for these liabilities could be affected if future occurrences and claims differ from the assumptions used and historical trends.
Recently Adopted Accounting Standards:
In April 2015, amended accounting guidance was issued that requires debt issuance costs related to a recognized debt liability to be presented in the balance sheet as a direct deduction from the carrying amount of the corresponding debt liability itself. The amended guidance does not apply to line-of-credit arrangements. Accordingly, issuance costs related to line-of-credit arrangements will continue to be presented as an asset and amortized ratably over the term of the arrangement. The Company adopted this guidance on a retrospective basis effective June 1, 2016. As a result, debt issuance costs of $2,146,000 and $2,491,000 have been presented as a component of the carrying amount of long-term debt reported in our consolidated balance sheets as of May 31, 2017 and May 31, 2016, respectively. For additional information, refer to “Note G – Debt and Receivables Securitization.”
In September 2015, amended accounting guidance was issued regarding adjustments to provisional amounts recorded in conjunction with a business combination. The amended guidance requires the acquirer to recognize adjustments to provisional amounts identified during the measurement period in the reporting period in which such adjustments are identified, rather than retrospectively adjusting previously reported amounts. The Company adopted this amended guidance on a prospective basis effective June 1, 2016.
In March 2016, amended accounting guidance was issued that simplifies the accounting for share-based payments. The amended guidance impacts several aspects of the accounting for share-based payment transactions, including the income tax consequences, forfeitures, statutory withholding requirements, and classification in the statement of cash flows. The amended guidance is effective for fiscal years beginning after December 15, 2016, including interim periods within those fiscal years. Early adoption is permitted. The Company elected to early adopt this amended accounting guidance during the fourth quarter of fiscal 2016. The impact resulting from the adoption of this amended guidance is summarized below.
67
Table of Contents
| • | Income Tax Accounting – The amended accounting guidance requires all excess tax benefits and tax deficiencies to be recognized as an income tax benefit or expense on a prospective basis in the period of adoption. The adoption of this provision of the amended accounting guidance resulted in the recognition of excess tax benefits of $16,243,000 and $3,178,000 in income tax expense, rather than in paid-in capital, during fiscal 2017 and fiscal 2016, respectively. As the adoption was on a prospective basis, fiscal 2015 has not been restated. |
| • | Forfeitures – The Company has elected to continue to estimate the number of awards expected to vest, as permitted by the amended accounting guidance, rather than electing to account for forfeitures as they occur. |
| • | Statement of Cash Flows Presentation – The amended accounting guidance requires excess tax benefits to be classified as an operating activity in the statement of cash flows. Previously, excess tax benefits were presented as a cash inflow from financing activities and cash outflow from operating activities. The Company has elected to present these changes on a prospective basis and therefore fiscal 2015 has not been adjusted to conform with the current presentation. |
Recently Issued Accounting Standards:
In May 2014, amended accounting guidance was issued that replaces most existing revenue recognition guidance under U.S. GAAP. The amended guidance requires an entity to recognize the amount of revenue to which it expects to be entitled for the transfer of promised goods or services to customers. Subsequently, additional guidance was issued on several areas including guidance intended to improve the operability and understandability of the implementation of principal versus agent considerations and clarifications on the identification of performance obligations and implementation of guidance related to licensing. The amended guidance is effective for annual reporting periods beginning after December 15, 2017, including interim periods within that reporting period. The amended guidance permits the use of either the retrospective or cumulative effect transition method. We are in the process of evaluating the effect this guidance will have on the presentation of our consolidated financial statements and related disclosures. While we have not yet identified any material changes in the timing of revenue recognition, our evaluation is ongoing and not complete. We plan to adopt the amended guidance in the first quarter of fiscal 2019.
In July 2015, amended accounting guidance was issued regarding the measurement of inventory. The amended guidance requires that inventory accounted for under the first-in, first-out (FIFO) or average cost methods be measured at the lower of cost and net realizable value, where net realizable value represents the estimated selling price of inventory in the ordinary course of business, less reasonably predictable costs of completion, disposal, and transportation. The amended guidance has no impact on inventory accounted for under the last-in, first-out (LIFO) or retail inventory methods. The amended guidance is effective prospectively for fiscal years beginning after December 15, 2016, including interim periods within those fiscal years. Early adoption is permitted as of the beginning of an interim or annual reporting period. We do not expect the adoption of this amended accounting guidance to have a material impact on our consolidated financial position or results of operations.
In February 2016, amended accounting guidance was issued that replaces most existing lease accounting guidance under U.S. GAAP. Among other changes, the amended guidance requires that lease assets and liabilities be recognized on the balance sheet by lessees for those leases classified as operating leases under previous guidance. The amended guidance is effective for fiscal years beginning after December 15, 2018, including interim periods within those fiscal years. Early adoption is permitted, and the change is to be applied using a modified retrospective approach as of the beginning of the earliest period presented. We are in the process of evaluating the effect this guidance will have on our consolidated financial position and results of operations, and we have not determined the effect of the amended guidance on our ongoing financial reporting.
68
Table of Contents
In March 2016, amended accounting guidance was issued regarding derivatives instruments designated as hedging instruments. The amended guidance clarifies that a change in the counterparty to such a hedging instrument does not, in and of itself, require dedesignation of that hedging relationship provided that all other hedge accounting criteria continue to be met. The amended guidance is effective for fiscal years beginning after December 15, 2016, including interim periods within those fiscal years. Early adoption is permitted, and the change may be applied either prospectively or retrospectively. We do not expect the adoption of this amended accounting guidance to have a material impact on our consolidated financial position or results of operations.
In June 2016, amended accounting guidance was issued related to the measurement of credit losses on financial instruments. The amended guidance changes the impairment model for most financial assets to require measurement and recognition of expected credit losses for financial assets held. The amended guidance is effective for fiscal years beginning after December 15, 2019, including interim periods within those fiscal years. We are in the process of evaluating the effect this guidance will have on our consolidated financial position and results of operations, and we have not determined the effect of the amended guidance on our ongoing financial reporting.
In August 2016, amended accounting guidance was issued to clarify the proper cash flow presentation of certain specific types of cash payments and cash receipts. The amended guidance is effective for fiscal years beginning after December 15, 2017, including interim periods within those fiscal years. Early adoption is permitted. We are in the process of evaluating the effect this guidance will have on our consolidated financial position, results of operations and cash flows, and we have not determined the effect of the amended guidance on our ongoing financial reporting.
In October 2016, amended accounting guidance was issued that requires the income tax consequences of an intra-entity transfer on an asset other than inventory to be recognized when the transfer occurs. The amended guidance is effective for fiscal years beginning after December 15, 2017, including interim periods within those fiscal years. Early adoption is permitted. We are in the process of evaluating the effect this guidance will have on our consolidated financial position, results of operations and cash flows, and have not determined the effect of the guidance on our ongoing reporting.
In November 2016, amended accounting guidance was issued that requires amounts generally described as restricted cash and restricted cash equivalents to be included with cash and cash equivalents when reconciling the beginning-of-period and end-of-period total amounts shown on the statement of cash flows. The amended guidance is effective for fiscal years beginning after December 15, 2017, including interim periods within those fiscal years. Early adoption is permitted. We do not expect the adoption of this amended guidance to have a material impact on our consolidated cash flows.
In January 2017, amended accounting guidance was issued to clarify the definition of a business to provide additional guidance to assist in evaluating whether transactions should be accounted for as an acquisition (or disposal) of either an asset or business. The amended guidance is effective for fiscal years beginning after December 15, 2017, including interim periods within those fiscal years. Early adoption is permitted. We do not expect the adoption of this amended guidance to have a material impact on our consolidated financial position or results of operations.
In January 2017, amended accounting guidance was issued to simplify the goodwill impairment calculation, by removing Step 2 of the goodwill impairment test. Goodwill impairment will now be the amount by which a reporting unit’s carrying value exceeds its fair value, not to exceed the carrying amount of the goodwill. The amended guidance is effective for fiscal years beginning after December 15, 2019, including interim periods within those fiscal years. Early adoption is permitted. We are in the process of evaluating the effect this guidance will have on our consolidated financial position and results of operations, and have not determined the effect on our ongoing financial reporting.
In March 2017, amended accounting guidance was issued that requires an employer to report the service cost component of pension and postretirement benefits in the same line item as other current employee compensation costs. Additionally, other components of net benefit cost are to be presented in the income statement separately from the service cost component and outside of income from operations. The amended guidance is effective for fiscal years beginning after December 15, 2017, including interim periods within those fiscal years. We are in the process of evaluating the effect this guidance will have on our consolidated financial position and results of operations, and have not determined the effect on our ongoing financial reporting.
69
Table of Contents
In May 2017, amended accounting guidance was issued to provide guidance about which changes to the terms or conditions of a share-based payment award require application of modification accounting. The amended guidance is effective for fiscal years beginning after December 15, 2017, including interim periods within those fiscal years. Early adoption is permitted. We do not expect the adoption of this amended guidance to have a material impact on our consolidated financial position or results of operations.
Note B – Investments in Unconsolidated Affiliates
Our investments in affiliated companies that we do not control, either through majority ownership or otherwise, are accounted for using the equity method. These include ArtiFlex Manufacturing, LLC (“ArtiFlex”) (50%), Clarkwestern Dietrich Building Systems LLC (“ClarkDietrich”) (25%), Samuel Steel Pickling Company (31.25%), Serviacero Planos, S. de R. L. de C.V. (“Serviacero”) (50%), Worthington Armstrong Venture (“WAVE”) (50%), and Zhejiang Nisshin Worthington Precision Specialty Steel Co., Ltd. (10%).
We received distributions from unconsolidated affiliates totaling $102,015,000, $86,513,000, and $78,297,000 in fiscal 2017, fiscal 2016 and fiscal 2015, respectively. We have received cumulative distributions from WAVE in excess of our investment balance, which resulted in an amount recorded within other liabilities on our consolidated balance sheets of $63,038,000 and $52,983,000 at May 31, 2017 and 2016, respectively. In accordance with the applicable accounting guidance, we reclassified the negative balance to the liability section of our consolidated balance sheet. We will continue to record our equity in the net income of WAVE as a debit to the investment account, and if it becomes positive, it will again be shown as an asset on our consolidated balance sheet. If it becomes probable that any excess distribution may not be returned (upon joint venture liquidation or otherwise), we will recognize any balance classified as a liability as income immediately.
We use the “cumulative earnings” approach for determining cash flow presentation of distributions from our unconsolidated joint ventures. Distributions received are included in our consolidated statements of cash flows as operating activities, unless the cumulative distributions exceed our portion of the cumulative equity in the net earnings of the joint venture, in which case the excess distributions are deemed to be returns of the investment and are classified as investing activities in our consolidated statements of cash flows.
The following table presents combined information regarding the financial position of our unconsolidated affiliates accounted for using the equity method as of May 31, 2017 and 2016:
| (in thousands) | 2017 | 2016 | ||||||
| Cash |
$ | 55,541 | $ | 112,122 | ||||
| Other current assets |
559,021 | 446,796 | ||||||
| Noncurrent assets |
361,106 | 352,370 | ||||||
|
|
|
|
|
|||||
| Total assets |
$ | 975,668 | $ | 911,288 | ||||
|
|
|
|
|
|||||
| Current liabilities |
$ | 156,947 | $ | 112,491 | ||||
| Short-term borrowings |
8,172 | 11,398 | ||||||
| Current maturities of long-term debt |
5,827 | 3,297 | ||||||
| Long-term debt |
268,711 | 266,942 | ||||||
| Other noncurrent liabilities |
21,380 | 21,034 | ||||||
| Equity |
514,631 | 496,126 | ||||||
|
|
|
|
|
|||||
| Total liabilities and equity |
$ | 975,668 | $ | 911,288 | ||||
|
|
|
|
|
|||||
70
Table of Contents
The following table presents summarized financial information for our four largest unconsolidated affiliates as of, and for the fiscal years ended May 31. All other unconsolidated affiliates are combined and presented in the Other category, including WSP through March 1, 2016. On March 1, 2016, the Company obtained effective control over the operations of WSP and, as a result, began consolidating its financial results within Steel Processing. For additional information, refer to “Note O – Acquisitions.”
| (in thousands) | 2017 | 2016 | 2015 | |||||||||
| Net sales |
||||||||||||
| WAVE |
$ | 400,987 | $ | 393,718 | $ | 382,451 | ||||||
| ClarkDietrich |
711,735 | 615,609 | 576,171 | |||||||||
| Serviacero |
275,315 | 260,337 | 277,385 | |||||||||
| ArtiFlex |
208,922 | 219,510 | 183,029 | |||||||||
| Other |
17,784 | 74,214 | 91,144 | |||||||||
|
|
|
|
|
|
|
|||||||
| Total net sales |
$ | 1,614,743 | $ | 1,563,388 | $ | 1,510,180 | ||||||
|
|
|
|
|
|
|
|||||||
| Gross margin |
||||||||||||
| WAVE |
$ | 207,035 | $ | 207,143 | $ | 181,102 | ||||||
| ClarkDietrich |
128,098 | 95,427 | 65,530 | |||||||||
| Serviacero |
37,080 | 15,328 | 17,028 | |||||||||
| ArtiFlex |
22,829 | 30,181 | 24,145 | |||||||||
| Other |
(4,313 | ) | 13,142 | 14,201 | ||||||||
|
|
|
|
|
|
|
|||||||
| Total gross margin |
$ | 390,729 | $ | 361,221 | $ | 302,006 | ||||||
|
|
|
|
|
|
|
|||||||
| Operating income (loss) |
||||||||||||
| WAVE |
$ | 167,157 | $ | 172,721 | $ | 147,603 | ||||||
| ClarkDietrich |
68,696 | 33,897 | 10,436 | |||||||||
| Serviacero |
29,975 | 11,110 | 14,036 | |||||||||
| ArtiFlex |
15,519 | 22,612 | 16,476 | |||||||||
| Other |
(8,407 | ) | 6,910 | 4,980 | ||||||||
|
|
|
|
|
|
|
|||||||
| Total operating income |
$ | 272,940 | $ | 247,250 | $ | 193,531 | ||||||
|
|
|
|
|
|
|
|||||||
| Depreciation and amortization |
||||||||||||
| WAVE |
$ | 4,871 | $ | 4,120 | $ | 4,150 | ||||||
| ClarkDietrich |
12,718 | 14,289 | 16,638 | |||||||||
| Serviacero |
3,862 | 3,508 | 3,462 | |||||||||
| ArtiFlex |
5,850 | 6,105 | 7,258 | |||||||||
| Other |
698 | 3,081 | 4,154 | |||||||||
|
|
|
|
|
|
|
|||||||
| Total depreciation and amortization |
$ | 27,999 | $ | 31,103 | $ | 35,662 | ||||||
|
|
|
|
|
|
|
|||||||
| Interest expense (income) |
||||||||||||
| WAVE |
$ | 7,183 | $ | 6,635 | $ | 6,412 | ||||||
| ClarkDietrich |
20 | 80 | 138 | |||||||||
| Serviacero |
89 | 114 | 201 | |||||||||
| ArtiFlex |
1,429 | 1,650 | 1,973 | |||||||||
| Other |
— | (10 | ) | (29 | ) | |||||||
|
|
|
|
|
|
|
|||||||
| Total interest expense |
$ | 8,721 | $ | 8,469 | $ | 8,695 | ||||||
|
|
|
|
|
|
|
|||||||
| Income tax expense (benefit) |
||||||||||||
| WAVE |
$ | 5,626 | $ | 2,449 | $ | 2,539 | ||||||
| ClarkDietrich |
— | — | — | |||||||||
| Serviacero |
11,740 | 6,249 | 7,844 | |||||||||
| ArtiFlex |
(2 | ) | 289 | 105 | ||||||||
| Other |
(2 | ) | 53 | — | ||||||||
|
|
|
|
|
|
|
|||||||
| Total income tax expense |
$ | 17,362 | $ | 9,040 | $ | 10,488 | ||||||
|
|
|
|
|
|
|
|||||||
| Net earnings (loss) |
||||||||||||
| WAVE |
$ | 154,866 | $ | 164,132 | $ | 138,670 | ||||||
| ClarkDietrich |
69,122 | 58,539 | 11,799 | |||||||||
| Serviacero |
18,140 | 6,246 | 8,429 | |||||||||
| ArtiFlex |
14,092 | 20,673 | 14,398 | |||||||||
| Other |
(5,472 | ) | 8,516 | 4,806 | ||||||||
|
|
|
|
|
|
|
|||||||
| Total net earnings |
$ | 250,748 | $ | 258,106 | $ | 178,102 | ||||||
|
|
|
|
|
|
|
|||||||
71
Table of Contents
At May 31, 2017, $28,803,000 of our consolidated retained earnings represented undistributed earnings of our unconsolidated affiliates, net of tax.
Note C – Goodwill and Other Long-Lived Assets
Goodwill
The following table summarizes the changes in the carrying amount of goodwill during fiscal 2017 and fiscal 2016 by reportable business segment:
| Steel Processing |
Pressure Cylinders |
Engineered Cabs |
Other | Total | ||||||||||||||||
| (in thousands) | ||||||||||||||||||||
| Balance at May 31, 2015 |
||||||||||||||||||||
| Goodwill |
$ | 6,587 | $ | 226,761 | $ | 44,933 | $ | 127,245 | $ | 405,526 | ||||||||||
| Accumulated impairment losses |
- | - | (44,933 | ) | (121,594 | ) | (166,527 | ) | ||||||||||||
|
|
|
|
|
|
|
|
|
|
|
|||||||||||
| 6,587 | 226,761 | - | 5,651 | 238,999 | ||||||||||||||||
|
|
|
|
|
|
|
|
|
|
|
|||||||||||
| Acquisitions and purchase accounting adjustments |
458 | 6,713 | - | - | 7,171 | |||||||||||||||
| Translation adjustments |
- | (103 | ) | - | - | (103 | ) | |||||||||||||
|
|
|
|
|
|
|
|
|
|
|
|||||||||||
| 458 | 6,610 | - | - | 7,068 | ||||||||||||||||
|
|
|
|
|
|
|
|
|
|
|
|||||||||||
| Balance at May 31, 2016 |
||||||||||||||||||||
| Goodwill |
7,045 | 233,371 | 44,933 | 127,245 | 412,594 | |||||||||||||||
| Accumulated impairment losses |
- | - | (44,933 | ) | (121,594 | ) | (166,527 | ) | ||||||||||||
|
|
|
|
|
|
|
|
|
|
|
|||||||||||
| 7,045 | 233,371 | - | 5,651 | 246,067 | ||||||||||||||||
|
|
|
|
|
|
|
|
|
|
|
|||||||||||
| Acquisitions and purchase accounting adjustments |
854 | - | - | - | 854 | |||||||||||||||
| Translation adjustments |
- | 752 | - | - | 752 | |||||||||||||||
|
|
|
|
|
|
|
|
|
|
|
|||||||||||
| 854 | 752 | - | - | 1,606 | ||||||||||||||||
|
|
|
|
|
|
|
|
|
|
|
|||||||||||
| Balance at May 31, 2017 |
||||||||||||||||||||
| Goodwill |
7,899 | 234,123 | 44,933 | 127,245 | 414,200 | |||||||||||||||
| Accumulated impairment losses |
- | - | (44,933 | ) | (121,594 | ) | (166,527 | ) | ||||||||||||
|
|
|
|
|
|
|
|
|
|
|
|||||||||||
| $ | 7,899 | $ | 234,123 | $ | - | $ | 5,651 | $ | 247,673 | |||||||||||
|
|
|
|
|
|
|
|
|
|
|
|||||||||||
For additional information regarding the Company’s acquisitions, refer to “Note O – Acquisitions.”
72
Table of Contents
Other Intangible Assets
Intangible assets with definite lives are amortized on a straight-line basis over their estimated useful lives, which range from one to 20 years. The following table summarizes other intangible assets by class as of May 31, 2017 and 2016:
| 2017 | 2016 | |||||||||||||||
| (in thousands) | Cost | Accumulated Amortization |
Cost | Accumulated Amortization |
||||||||||||
| Indefinite-lived intangible assets: |
||||||||||||||||
| Trademarks |
$ | 14,501 | $ | - | $ | 14,501 | $ | - | ||||||||
|
|
|
|
|
|
|
|
|
|||||||||
| Total indefinite-lived intangibles |
14,501 | - | 14,501 | - | ||||||||||||
| Definite-lived intangible assets: |
||||||||||||||||
| Customer relationships |
$ | 96,262 | $ | 45,822 | $ | 96,072 | $ | 35,561 | ||||||||
| Non-compete agreements |
9,443 | 7,751 | 9,422 | 6,237 | ||||||||||||
| Technology / know-how |
21,755 | 5,607 | 21,689 | 3,865 | ||||||||||||
| Other |
3,954 | 3,954 | 4,012 | 3,869 | ||||||||||||
|
|
|
|
|
|
|
|
|
|||||||||
| Total definite-lived intangibles |
131,414 | 63,134 | 131,195 | 49,532 | ||||||||||||
|
|
|
|
|
|
|
|
|
|||||||||
| Total intangible assets |
$ | 145,915 | $ | 63,134 | $ | 145,696 | $ | 49,532 | ||||||||
|
|
|
|
|
|
|
|
|
|||||||||
Amortization expense totaled $13,525,000, $15,813,000, and $20,422,000 in fiscal 2017, fiscal 2016 and fiscal 2015, respectively.
Amortization expense for each of the next five fiscal years is estimated to be:
| (in thousands) | ||||
| 2018 |
$ | 13,181 | ||
| 2019 |
$ | 10,759 | ||
| 2020 |
$ | 8,373 | ||
| 2021 |
$ | 7,802 | ||
| 2022 |
$ | 5,468 | ||
Impairment of Long-Lived Asset
Fiscal 2017: During the fourth quarter of fiscal 2017, events and circumstances related to the long-lived assets of the Company’s cryogenics joint venture in Turkey indicated the potential for impairment. The Company’s current estimate of the undiscounted future cash flows indicated that the carrying amount of $39,990,000 was expected to be recovered. However, the estimated undiscounted future cash flows for this asset group did not exceed book value by a significant amount (approximately 12% at May 31, 2017). Therefore, it is reasonably possible that any change in the estimate of undiscounted cash flows may result in the need to write down these assets to fair value.
Fiscal 2016: Due to the decline in oil prices and resulting reduced demand for products, management determined that an impairment indicator was present for the long-lived assets in the oil & gas equipment business within Pressure Cylinders. The Company had tested the five asset groups in its oil & gas equipment business for impairment during the fourth quarter of fiscal 2015 and again in the first quarter of fiscal 2016. In each of these tests, the Company’s estimate of the undiscounted future cash flows for each asset group indicated that the carrying amounts were expected to be recovered as of those measurement dates.
73
Table of Contents
During the second quarter of fiscal 2016, the continued decline of oil prices further reduced the demand for oil & gas equipment products, causing a significant decrease in the long-term cash flow projections of that business. Based on these revised cash flow projections, the Company determined that long-lived assets of two of the facilities with a combined carrying amount of $59,895,000 were impaired and wrote them down to their estimated fair value of $36,933,000, resulting in an impairment charge of $22,962,000. Fair value was based on expected future cash flows using Level 3 inputs under Accounting Standard Codification (“ASC”) 820. The cash flows are those expected to be generated by market participants, discounted at an appropriate rate for the risks inherent in those cash flow projections, or 13%. Because of deteriorating market conditions (i.e., rising interest rates and declining marketplace demand), it is possible that our estimate of discounted cash flows may change resulting in the need to adjust our determination of fair value.
As a result of the impairment of the oil & gas equipment assets noted above, the Company also performed an impairment review of the goodwill of the Pressure Cylinders reporting unit during the second quarter of fiscal 2016. The Company first assessed the reporting unit structure and determined that it was no longer appropriate to aggregate the oil & gas equipment component with the rest of Pressure Cylinders for purposes of goodwill impairment testing. This determination was driven by changes in the economic characteristics of the oil & gas equipment business as a result of sustained low oil prices, which indicated that the risk profile and prospects for growth and profitability were no longer similar to the other components of Pressure Cylinders. In accordance with the applicable accounting guidance, the Company allocated a portion of Pressure Cylinders goodwill totaling $25,982,000 to the Oil & Gas Equipment reporting unit using a relative fair value approach. A subsequent comparison of the fair values of the Oil & Gas Equipment and the Pressure Cylinders reporting units, determined using discounted cash flows, to their respective carrying values indicated that a step 2 calculation to quantify a potential impairment was not required. The key assumptions that drive the fair value calculations are projected cash flows and the discount rate. Prior to the allocation of goodwill, the Company tested the goodwill of the old Pressure Cylinders reporting unit for impairment and determined that fair value exceeded carrying value by a significant amount.
During the first quarter of fiscal 2016, management finalized its plan to close the Engineered Cabs facility in Florence, South Carolina and transfer the majority of the business to the Engineered Cabs facility in Greeneville, Tennessee. Under the plan, certain machinery and equipment was transferred to the Greeneville facility to support higher volume requirements. Management reevaluated the recoverability of the remaining assets and determined that long-lived assets with a carrying value of $4,059,000 were impaired. As a result, these long-lived assets were written down to their estimated fair value of $1,059,000 resulting in an impairment charge of $3,000,000 during the first quarter of fiscal 2016. The Company ceased production at the Florence facility on September 30, 2015.
Fiscal 2015: During the fourth quarter of fiscal 2015, we determined that indicators of impairment were present with regard to intangible assets related to our compressed natural gas (“CNG”) fuel systems joint venture, dHybrid. Recoverability of the identified asset group was tested using future cash flow projections based on management’s long-range estimates of market conditions. The sum of these undiscounted future cash flows was less than the net book value of the asset group. In accordance with the applicable accounting guidance, the intangible assets were written down to their fair value, resulting in an impairment charge of $2,344,000.
During the third quarter of fiscal 2015, the Company concluded that an interim impairment test of the goodwill of its Engineered Cabs reporting unit was necessary. This conclusion was based on certain indicators of impairment, including the decision to close the Company’s Engineered Cabs’ facility in Florence, South Carolina and significant downward revisions to forecasted cash flows as a result of continued weakness in the mining and agricultural end markets and higher than expected manufacturing costs.
Prior to conducting the goodwill impairment test, the Company first evaluated the other long-lived assets of the Engineered Cabs reporting unit for recoverability. Recoverability was tested using future cash flow projections based on management’s long-range estimates of market conditions. The sums of the undiscounted future cash flows for the customer relationship intangible asset and the property, plant and equipment of the Florence, South Carolina facility were less than their respective carrying values. As a result, these assets were written down to their respective fair values, resulting in impairment charges of $22,356,000 for the customer relationship intangible asset and $14,311,000 for the property, plant and equipment of the Florence asset group during the third quarter of fiscal 2015. As noted above, an additional impairment charge related to the Florence asset group was later recognized during the first quarter of fiscal 2016.
74
Table of Contents
As noted above, the Company determined that indicators of potential impairment existed to require an interim goodwill analysis of the Engineered Cabs reporting unit. A comparison of the fair value of the Engineered Cabs reporting unit, determined using discounted cash flows, to its carrying value indicated that a step 2 calculation to quantify the potential impairment was required. After a subsequent review of the fair value of the net assets of Engineered Cabs, it was determined that the implied fair value of goodwill was $0 and, accordingly, the entire $44,933,000 goodwill balance was written-off during the third quarter of fiscal 2015. The key assumptions used in the fair value calculations were projected cash flows and the discount rate.
During the second quarter of fiscal 2015, management committed to a plan to sell the assets of the Advanced Component Technologies, Inc. (“ACT”) business within Engineered Cabs. In accordance with the applicable accounting guidance, the net assets were recorded at the lower of net book value or fair value less costs to sell, resulting in an impairment charge of $2,389,000. During the third quarter of fiscal 2015, the Company completed the sale of these assets and recognized a gain of $332,000.
Also during the second quarter of fiscal 2015, we determined that indicators of impairment were present at the Company’s aluminum high-pressure cylinder business in New Albany, Mississippi, and at the Company’s military construction business due to current and projected operating losses. Recoverability of the identified asset groups was tested using future cash flow projections based on management’s long-range estimates of market conditions. The sum of the undiscounted future cash flows was less than the net book value of the asset groups. In accordance with the applicable accounting guidance, the net assets were written down to their fair values, resulting in impairment charges of $3,221,000 and $1,179,000, respectively.
During the fourth quarter of fiscal 2014, the Company committed to a plan to sell its 60% ownership interest in Worthington Nitin Cylinders, a consolidated joint venture in India, and Precision Specialty Metals (“PSM”), a stainless steel business. Accordingly, at May 31, 2014, the net assets of these businesses were recorded as assets held for sale at the lower of their fair values or net book values, less selling costs. During the first half of fiscal 2015, changes in facts and circumstances related to these businesses indicated that the Company needed to reassess the fair value of these assets. As a result, additional impairment charges of $6,346,000 and $3,050,000, respectively, were recorded. The Company completed the sale of Worthington Nitin Cylinders during the second quarter of fiscal 2016.
Note D – Restructuring and Other Expense
We consider restructuring activities to be programs whereby we fundamentally change our operations such as closing and consolidating manufacturing facilities or moving manufacturing of a product to another location. Restructuring activities may also involve substantial realignment of the management structure of a business unit in response to changing market conditions.
A progression of the liabilities associated with our restructuring activities, combined with a reconciliation to the restructuring and other expense financial statement caption in our consolidated statement of earnings for fiscal 2017, is summarized below:
| (in thousands) | Beginning Balance |
Expense | Payments | Adjustments | Ending Balance |
|||||||||||||||
| Early retirement and severance |
$ | 1,831 | $ | 1,854 | $ | (3,505 | ) | $ | 73 | $ | 253 | |||||||||
| Facility exit and other costs |
653 | 3,752 | (3,916 | ) | 47 | 536 | ||||||||||||||
|
|
|
|
|
|
|
|
|
|
|
|||||||||||
| $ | 2,484 | 5,606 | $ | (7,421 | ) | $ | 120 | $ | 789 | |||||||||||
|
|
|
|
|
|
|
|
|
|||||||||||||
| Net loss on sale of assets |
805 | |||||||||||||||||||
|
|
|
|||||||||||||||||||
| Restructuring and other expense |
$ | 6,411 | ||||||||||||||||||
|
|
|
|||||||||||||||||||
75
Table of Contents
During fiscal 2017, the following actions were taken related to the Company’s restructuring activities:
| • | The Company announced certain organizational changes impacting its Pressure Cylinders operating segment, including the consolidation of the Cryogenics business unit into the Industrial Products business unit. In connection with this matter, the Company recognized severance expense of $1,356,000 related to permanent headcount reductions. |
| • | In connection with the closure of the Company’s stainless steel business, Precision Specialty Metals, Inc. (“PSM”), the Company recognized $1,999,000 of facility exit costs and a credit to severance expense of $106,000. |
| • | In connection with the closure of the Engineered Cabs facility in Florence, South Carolina, the Company recognized facility exit costs of $504,000. The Company also recognized a net gain of $104,000 related to the disposal of assets. |
| • | In connection with the consolidation of the Company’s existing cryogenics facility in Istanbul, Turkey, to its Greenfield facility in Bandirma, Turkey, the Company recognized facility exit costs of $1,299,000 and severance expense of $699,000. The consolidation is substantially complete. |
| • | The Company sold the remaining real estate of the legacy Advanced Component Technologies, Inc. (“ACT”) business within Engineered Cabs for cash proceeds of $700,000, resulting in a loss of $822,000. |
| • | In connection with other non-significant restructuring activities, the Company recognized a credit to severance expense of $95,000 and a credit to facility exit costs of $50,000. The Company also recognized a net loss on disposal of assets of $87,000. |
The total liability as of May 31, 2017 is expected to be paid in the next twelve months.
Note E – Contingent Liabilities and Commitments
Legal Proceedings
We are defendants in certain legal actions. In the opinion of management, the outcome of these actions, which is not clearly determinable at the present time, would not significantly affect our consolidated financial position or future results of operations. We also believe that environmental issues will not have a material effect on our capital expenditures, consolidated financial position or future results of operations.
Insurance Recoveries
On August 19, 2013, a fire occurred at our Pressure Cylinders facility in Kienberg, Austria, in the building that houses the massing process in the production of acetylene cylinders. The other portions of the Austrian facility were not damaged; however, the massing process building sustained extensive damage and was rendered inoperable. Additionally, we incurred incremental business interruption costs. The Company had business interruption and property damage insurance and, as a result, the fire did not have a material adverse impact on the Company’s consolidated financial results.
During fiscal 2015, the Company received proceeds of $1,248,000 representing advance payments for the replacement value of damaged equipment. These proceeds were in excess of the $243,000 remaining book value of the assets, resulting in a gain of $1,005,000 within miscellaneous income.
76
Table of Contents
Total proceeds received related to insurance claims since the date of loss have been as follows:
| (in thousands) | ||||
| Property and equipment |
$ | 6,892 | ||
| Business interruption |
5,521 | |||
| Other expenses |
1,001 | |||
|
|
|
|||
| Total insurance proceeds |
$ | 13,414 | ||
|
|
|
|||
Proceeds for business interruption related to the loss of profits since the date of the fire and have been recorded as a reduction of manufacturing expense, and totaled $2,653,000 during fiscal 2015. Proceeds for other expenses represent reimbursement for incremental expenses related to the fire and were recorded as an offset to manufacturing expense, and totaled $256,000 during fiscal 2015. This claim was settled during the third quarter of fiscal 2015.
Note F – Guarantees
We do not have guarantees that we believe are reasonably likely to have a material current or future effect on our consolidated financial condition, changes in financial condition, revenues or expenses, results of operations, liquidity, capital expenditures or capital resources. However, as of May 31, 2017, we were party to an operating lease for an aircraft in which we have guaranteed a residual value at the termination of the lease. The maximum obligation under the terms of this guarantee was approximately $9,277,000 at May 31, 2017. Based on current facts and circumstances, we have estimated the likelihood of payment pursuant to this guarantee is not probable and, therefore, no amounts have been recognized in our consolidated financial statements.
We also had in place $15,294,000 of outstanding stand-by letters of credit issued to third-party service providers at May 31, 2017. The fair value of these guarantee instruments, based on premiums paid, was not material and no amounts were drawn against them at May 31, 2017.
Note G – Debt and Receivables Securitization
The following table summarizes our long-term debt and short-term borrowings outstanding at May 31, 2017 and 2016:
| (in thousands) | 2017 | 2016 | ||||||
| Short-term borrowings |
$ | 123 | $ | 2,651 | ||||
| 4.55% senior notes due April 15, 2026 |
250,000 | 250,000 | ||||||
| 4.60% senior notes due August 10, 2024 |
150,000 | 150,000 | ||||||
| 6.50% senior notes due April 15, 2020 |
150,000 | 150,000 | ||||||
| Term loans |
30,400 | 31,020 | ||||||
| Other |
668 | 320 | ||||||
|
|
|
|
|
|||||
| Total debt |
581,191 | 583,991 | ||||||
| Unamortized discount and debt issuance costs |
(2,581 | ) | (2,987 | ) | ||||
|
|
|
|
|
|||||
| Total debt, net |
578,610 | 581,004 | ||||||
| Less: current maturities and short-term borrowings |
6,814 | 3,513 | ||||||
|
|
|
|
|
|||||
| Total long term debt |
$ | 571,796 | $ | 577,491 | ||||
|
|
|
|
|
|||||
77
Table of Contents
Maturities on long-term debt and short-term borrowings in the next five fiscal years, and the remaining years thereafter, are as follows:
| (in thousands) | ||||
| 2018 |
$ | 6,814 | ||
| 2019 |
6,636 | |||
| 2020 |
167,421 | |||
| 2021 |
- | |||
| 2022 |
- | |||
| Thereafter |
400,320 | |||
|
|
|
|||
| Total |
$ | 581,191 | ||
|
|
|
|||
Long-Term Debt
On September 26, 2014, our consolidated joint venture in Turkey, Worthington Aritas, executed a five-year term loan denominated in Euros. As of May 31, 2017, we had borrowed $28,687,000 against the facility. The facility bears interest at a variable rate based on EURIBOR. The applicable variable rate was 1.5% at May 31, 2017. On October 15, 2014, we entered into an interest rate swap to fix the interest rate on 60% of the borrowings outstanding under this facility at 2.015% starting on December 26, 2014 through September 26, 2019. Borrowings against the facility were used for the construction of a cryogenics manufacturing facility in Turkey.
On April 15, 2014, we issued $250,000,000 aggregate principal amount of unsecured senior notes due on April 15, 2026 (the “2026 Notes”). The 2026 Notes bear interest at a rate of 4.55%. The 2026 Notes were sold to the public at 99.789% of the principal amount thereof, to yield 4.573% to maturity. We used a portion of the net proceeds from the offering to repay borrowings then outstanding under our revolving credit facilities. Approximately $3,081,000, $2,256,000 and $528,000 were allocated to the settlement of a derivative contract entered into in anticipation of the issuance of the 2026 Notes, debt issuance costs, and the debt discount, respectively. The debt issuance costs and debt discount were recorded on the consolidated balance sheets within long-term debt as a contra-liability, and the loss on the derivative contract recorded within AOCI. Each will continue to be recognized, through interest expense, in our consolidated statements of earnings over the term of the 2026 Notes. The unamortized portion of the debt issuance costs and debt discount was $1,677,000 and $388,000, respectively, at May 31, 2017.
On August 10, 2012, we issued $150,000,000 aggregate principal amount of unsecured senior notes due August 10, 2024 (the “2024 Notes”). The 2024 Notes bear interest at a rate of 4.60%. The net proceeds from this issuance were used to repay a portion of the then outstanding borrowings under our revolving credit facilities. Approximately $80,000 of the aggregate proceeds were allocated to debt issuance costs. The unamortized portion of the debt issuance costs was $48,000 at May 31, 2017.
On April 27, 2012, we executed a $5,880,000 seven-year term loan that matures on May 1, 2019 and requires monthly payments of $76,350. The loan bears interest at a rate of 2.49% and is secured by an aircraft that was purchased with its proceeds. Borrowings outstanding totaled $1,713,000 as of May 31, 2017.
On April 13, 2010, we issued $150,000,000 aggregate principal amount of unsecured senior notes due on April 15, 2020 (the “2020 Notes”). The 2020 Notes bear interest at a rate of 6.50%. The 2020 Notes were sold to the public at 99.890% of the principal amount thereof, to yield 6.515% to maturity. We used the net proceeds from the offering to repay a portion of the then outstanding borrowings under our revolving credit facilities. Approximately $165,000, $1,535,000 and $1,358,000 were allocated to the debt discount, debt issuance costs, and the settlement of a derivative contract entered into in anticipation of the issuance of the 2020 Notes. The debt discount and debt issuance costs were recorded on the consolidated balance sheets within long-term debt as a contra-liability, and the loss on the derivative contract within AOCI. Each will continue to be recognized, through interest expense, in our consolidated statements of earnings over the remaining term of the 2020 Notes. The unamortized portion of the debt issuance costs and debt discount was $421,000 and $47,000, respectively, at May 31, 2017.
78
Table of Contents
Other Financing Arrangements
We maintain a $100,000,000 revolving trade accounts receivable securitization facility (the “AR Facility”) that matures in January 2018. Pursuant to the terms of the AR Facility, certain of our subsidiaries sell their accounts receivable without recourse, on a revolving basis, to Worthington Receivables Corporation (“WRC”), a wholly-owned, consolidated, bankruptcy-remote subsidiary. In turn, WRC may sell without recourse, on a revolving basis, up to $100,000,000 of undivided ownership interests in this pool of accounts receivable to a third-party bank. We retain an undivided interest in this pool and are subject to risk of loss based on the collectability of the receivables from this retained interest. Because the amount eligible to be sold excludes receivables more than 90 days past due, receivables offset by an allowance for doubtful accounts due to bankruptcy or other cause, concentrations over certain limits with specific customers and certain reserve amounts, we believe additional risk of loss is minimal. As of May 31, 2017, no undivided ownership interests in this pool of accounts receivable had been sold. Facility fees of $354,000, $540,000, and $723,000 were recognized within interest expense during fiscal 2017, fiscal 2016 and fiscal 2015, respectively.
We also maintain a $500,000,000 multi-year revolving credit facility (the “Credit Facility”) with a group of lenders that matures in April 2020. Borrowings under the Credit Facility typically have maturities of less than one year. However, we can extend the term of amounts borrowed by renewing these borrowings for the term of the Credit Facility. We have the option to borrow at rates equal to an applicable margin over the LIBOR, Prime rate or Fed Funds rate. The applicable margin is determined by our credit rating. There were no borrowings outstanding under the Credit Facility at May 31, 2017. As discussed in “Note F – Guarantees,” we provided $15,294,000 in letters of credit for third-party beneficiaries as of May 31, 2017. While not drawn against at May 31, 2017, $13,600,000 of these letters of credit were issued against availability under the Credit Facility, leaving $486,400,000 available at May 31, 2017.
Note H – Comprehensive Income (Loss)
Other Comprehensive Income (Loss): The following table summarizes the tax effects of each component of other comprehensive income (loss) for the fiscal years ended May 31:
| 2017 | 2016 | 2015 | ||||||||||||||||||||||||||||||||||
| (in thousands) | Before- Tax |
Tax | Net-of- Tax |
Before- Tax |
Tax | Net-of- Tax |
Before- Tax |
Tax | Net-of- Tax |
|||||||||||||||||||||||||||
| Foreign currency translation |
$ | 1,342 | $ | - | $ | 1,342 | $ | 4,716 | $ | - | $ | 4,716 | $ | (34,229 | ) | $ | - | $ | (34,229 | ) | ||||||||||||||||
| Pension liability adjustment |
3,400 | (1,158 | ) | 2,242 | (3,233 | ) | 1,175 | (2,058 | ) | (5,652 | ) | 1,914 | (3,738 | ) | ||||||||||||||||||||||
| Cash flow hedges |
(4,522 | ) | 1,700 | (2,822 | ) | 35,524 | (13,316 | ) | 22,208 | (18,605 | ) | 6,952 | (11,653 | ) | ||||||||||||||||||||||
|
|
|
|
|
|
|
|
|
|
|
|
|
|
|
|
|
|
|
|||||||||||||||||||
| Other comprehensive income (loss) |
$ | 220 | $ | 542 | $ | 762 | $ | 37,007 | $ | (12,141 | ) | $ | 24,866 | $ | (58,486 | ) | $ | 8,866 | $ | (49,620 | ) | |||||||||||||||
|
|
|
|
|
|
|
|
|
|
|
|
|
|
|
|
|
|
|
|||||||||||||||||||
79
Table of Contents
Accumulated Other Comprehensive Loss: The components of the changes in accumulated other comprehensive loss for the fiscal years ended May 31, 2017 and May 31, 2016 were as follows:
| Foreign Currency Translation |
Pension Liability Adjustment |
Cash Flow Hedges |
Accumulated Other Comprehensive Loss |
|||||||||||||
| (in thousands) | ||||||||||||||||
| Balance at May 31, 2015 |
$ | (20,717 | ) | $ | (15,003 | ) | $ | (14,984 | ) | $ | (50,704 | ) | ||||
| Other comprehensive income (loss) before reclassifications |
1,989 | (3,667 | ) | 7,283 | 5,605 | |||||||||||
| Reclassification adjustments to income (a) |
- | 434 | 28,241 | 28,675 | ||||||||||||
| Income taxes |
- | 1,175 | (13,316 | ) | (12,141 | ) | ||||||||||
|
|
|
|
|
|
|
|
|
|||||||||
| Balance at May 31, 2016 |
$ | (18,728 | ) | $ | (17,061 | ) | $ | 7,224 | $ | (28,565 | ) | |||||
|
|
|
|
|
|
|
|
|
|||||||||
| Other comprehensive income before reclassifications |
1,370 | 2,841 | 7,669 | 11,880 | ||||||||||||
| Reclassification adjustments to income (a) |
- | 559 | (12,191 | ) | (11,632 | ) | ||||||||||
| Income taxes |
- | (1,158 | ) | 1,700 | 542 | |||||||||||
|
|
|
|
|
|
|
|
|
|||||||||
| Balance at May 31, 2017 |
$ | (17,358 | ) | $ | (14,819 | ) | $ | 4,402 | $ | (27,775 | ) | |||||
|
|
|
|
|
|
|
|
|
|||||||||
| (a) | The statement of earnings classification of amounts reclassified to income for cash flow hedges is disclosed in “Note P – Derivative Instruments and Hedging Activities.” |
The estimated net amount of the gains in AOCI at May 31, 2017 expected to be reclassified into net earnings within the succeeding twelve months is $6,166,000 (net of tax of $3,770,000). This amount was computed using the fair value of the cash flow hedges at May 31, 2017, and will change before actual reclassification from other comprehensive income to net earnings during fiscal 2018.
Note I – Equity
Preferred Shares: The Worthington Industries, Inc. Amended Articles of Incorporation authorize two classes of preferred shares and their relative voting rights. The Board of Directors of Worthington Industries, Inc. is empowered to determine the issue prices, dividend rates, amounts payable upon liquidation and other terms of the preferred shares when issued. No preferred shares are issued or outstanding.
Common Shares: On June 25, 2014, the Board of Directors of Worthington Industries, Inc. authorized the repurchase of up to 10,000,000 of our outstanding common shares. An aggregate of 5,953,855 common shares have been repurchased under this authorization, leaving 4,046,145 common shares available for repurchase at May 31, 2017.
No common shares were repurchased under this authorization during fiscal 2017. During fiscal 2016, we repurchased 3,500,000 common shares having an aggregate cost of $99,847,000 under this authorization. During fiscal 2015, we repurchased 4,176,187 common shares having an aggregate cost of $127,360,000, including 2,453,855 common shares under this authorization.
Common shares available for repurchase under this authorization may be purchased from time to time, with consideration given to the market price of the common shares, the nature of other investment opportunities, cash flows from operations, general economic conditions and other relevant considerations. Repurchases may be made on the open market or through privately negotiated transactions.
On October 1, 2014, the Company amended its non-qualified deferred compensation plans for employees to require that any portion of a participant’s current account credited to the theoretical common share option, which reflects the fair value of the Company’s common shares with dividends reinvested, and any new contributions credited to the theoretical common share option remain credited to the theoretical common share option until distributed. For amounts credited to the theoretical common share option, payouts are required to be made in the form of whole common shares of the Company and cash in lieu of fractional common shares. As a result, we account for the deferred compensation obligation credited to the theoretical common share option within equity. The amounts credited to equity totaled $1,259,000 and $960,000 during fiscal 2017 and fiscal 2016, respectively. Prior to October 1, 2014, participant accounts credited to the theoretical common share option were settled in cash and classified as a liability in the Company’s consolidated balance sheets.
Note J – Stock-Based Compensation
Under our employee and non-employee director stock-based compensation plans (the “Plans”), we may grant incentive or non-qualified stock options, restricted common shares and performance shares to employees and non-qualified stock options and restricted common shares to non-employee directors. We classify share-based compensation expense within SG&A expense to correspond with the same financial statement caption as the majority of the cash compensation paid to employees. A total of 3,797,139 of our common shares were authorized and available for issuance in connection with the stock-based compensation plans in place at May 31, 2017.
80
Table of Contents
We recognized pre-tax stock-based compensation expense of $14,349,000 ($9,112,000 after-tax), $15,836,000 ($10,056,000 after-tax), and $17,916,000 ($11,500,000 after-tax) under the Plans during fiscal 2017, fiscal 2016 and fiscal 2015, respectively. At May 31, 2017, the total unrecognized compensation cost related to non-vested awards was $18,012,000, which will be expensed over the next three fiscal years.
Non-Qualified Stock Options
Stock options may be granted to purchase common shares at not less than 100% of the fair market value of the underlying common shares on the date of the grant. All outstanding stock options are non-qualified stock options. The exercise price of all stock options granted has been set at 100% of the fair market value of the underlying common shares on the date of grant. Generally, stock options granted to employees vest and become exercisable at the rate of (i) 20% per year for options issued before June 30, 2011, and (ii) 33% per year for options issued on or after June 30, 2011, in each case beginning one year from the date of grant, and expire ten years after the date of grant. Non-qualified stock options granted to non-employee directors vest and become exercisable on the earlier of (a) the first anniversary of the date of grant or (b) the date on which the next annual meeting of shareholders is held following the date of grant for any stock option granted as of the date of an annual meeting of shareholders of Worthington. Stock options can be exercised through net-settlement, at the election of the option holder.
U.S. GAAP requires that all share-based awards be recorded as expense in the statement of earnings based on their grant-date fair value. We calculate the fair value of our non-qualified stock options using the Black-Scholes option pricing model and certain assumptions. The computation of fair values for all stock options incorporates the following assumptions: expected volatility (based on the historical volatility of our common shares); risk-free interest rate (based on the United States Treasury strip rate for the expected term of the stock options); expected term (based on historical exercise experience); and dividend yield (based on annualized current dividends and an average quoted price of our common shares over the preceding annual period).
The table below sets forth the non-qualified stock options granted during each of the last three fiscal years. For each grant, the exercise price was equal to the closing market price of the underlying common shares at each respective grant date. The fair values of these stock options were based on the Black-Scholes option pricing model, calculated at the respective grant dates. The calculated pre-tax stock-based compensation expense for these stock options, which is after an estimate of forfeitures, will be recognized on a straight-line basis over the respective vesting periods of the stock options.
| 2017 | 2016 | 2015 | ||||||||||
| (in thousands, except per share amounts) | ||||||||||||
| Granted |
111 | 154 | 97 | |||||||||
| Weighted average exercise price, per share |
$ | 42.30 | $ | 30.92 | $ | 42.95 | ||||||
| Weighted average grant date fair value, per share |
$ | 11.60 | $ | 9.55 | $ | 17.96 | ||||||
| Pre-tax stock-based compensation, net of forfeitures |
$ | 1,146 | $ | 1,305 | $ | 1,553 | ||||||
The weighted average fair value of stock options granted in fiscal 2017, fiscal 2016 and fiscal 2015 was based on the following weighted average assumptions:
| 2017 | 2016 | 2015 | ||||||||||
| Assumptions used: |
||||||||||||
| Dividend yield |
2.59 | % | 2.33 | % | 1.88 | % | ||||||
| Expected volatility |
36.86 | % | 38.40 | % | 50.92 | % | ||||||
| Risk-free interest rate |
1.15 | % | 1.98 | % | 1.88 | % | ||||||
| Expected life (years) |
6.0 | 6.0 | 6.0 | |||||||||
81
Table of Contents
The following tables summarize our stock option activity for the years ended May 31:
| 2017 | 2016 | 2015 | ||||||||||||||||||||||
| (in thousands, except per share amounts) | Stock Options |
Weighted Average Exercise Price |
Stock Options |
Weighted Average Exercise Price |
Stock Options |
Weighted Average Exercise Price |
||||||||||||||||||
| Outstanding, beginning of year |
3,306 | $ | 19.01 | 4,044 | $ | 18.25 | 4,752 | $ | 17.58 | |||||||||||||||
| Granted |
111 | 42.30 | 154 | 30.92 | 97 | 42.95 | ||||||||||||||||||
| Exercised |
(1,076 | ) | 16.90 | (874 | ) | 17.22 | (758 | ) | 17.24 | |||||||||||||||
| Forfeited |
(34 | ) | 29.95 | (18 | ) | 32.25 | (47 | ) | 17.00 | |||||||||||||||
|
|
|
|
|
|
|
|||||||||||||||||||
| Outstanding, end of year |
2,307 | 20.99 | 3,306 | 19.01 | 4,044 | 18.25 | ||||||||||||||||||
|
|
|
|
|
|
|
|||||||||||||||||||
| Exercisable at end of year |
2,067 | 19.17 | 3,059 | 17.85 | 3,276 | 17.63 | ||||||||||||||||||
|
|
|
|
|
|
|
|||||||||||||||||||
| Number of Stock Options (in thousands) |
Weighted Average Remaining Contractual Life (in years) |
Aggregate Intrinsic Value (in thousands) |
||||||||||
| May 31, 2017 |
||||||||||||
| Outstanding |
2,307 | 3.95 | $ | 48,509 | ||||||||
| Exercisable |
2,067 | 3.47 | $ | 47,488 | ||||||||
| May 31, 2016 |
||||||||||||
| Outstanding |
3,306 | 4.33 | $ | 61,178 | ||||||||
| Exercisable |
3,059 | 4.01 | $ | 60,082 | ||||||||
| May 31, 2015 |
||||||||||||
| Outstanding |
4,044 | 4.82 | $ | 38,277 | ||||||||
| Exercisable |
3,276 | 4.42 | $ | 31,625 | ||||||||
The total intrinsic value of stock options exercised during fiscal 2017 was $18,989,000. The total amount of cash received from the exercise of stock options during fiscal 2017 was $11,676,000, and the related excess tax benefit realized from share-based payment awards was $16,243,000.
The following table summarizes information about non-vested stock option awards for the year ended May 31, 2017:
| Number of Stock Options (in thousands) |
Weighted Average Grant Date Fair Value per Share |
|||||||
| Non-vested, beginning of year |
247 | $ | 10.91 | |||||
| Granted |
111 | 10.32 | ||||||
| Vested |
(84 | ) | 11.57 | |||||
| Forfeited |
(34 | ) | 13.84 | |||||
|
|
|
|||||||
| Non-vested, end of year |
240 | $ | 9.99 | |||||
|
|
|
|||||||
82
Table of Contents
Service-Based Restricted Common Shares
We have awarded restricted common shares to certain employees and non-employee directors that contain service-based vesting conditions. Service-based restricted common shares granted to employees cliff vest three years from the date of grant. Service-based restricted common shares granted to non-employee directors vest under the same parameters as the non-employee stock options discussed above. All service-based restricted common shares are valued at the closing market price of our common shares on the date of the grant.
The table below sets forth the service-based restricted common shares we granted during each of fiscal 2017, fiscal 2016 and fiscal 2015. The calculated pre-tax stock-based compensation expense for these restricted common shares will be recognized on a straight-line basis over their respective vesting periods.
| (in thousands, except per share amounts) | 2017 | 2016 | 2015 | |||||||||
| Granted |
525 | 217 | 240 | |||||||||
| Weighted average grant date fair value, per share |
$ | 42.28 | $ | 29.49 | $ | 40.05 | ||||||
| Pre-tax stock-based compensation, net of forfeitures |
$ | 19,841 | $ | 5,800 | $ | 8,660 | ||||||
The following tables summarize the activity for our service-based restricted common shares for the years ended May 31:
| 2017 | 2016 | 2015 | ||||||||||||||||||||||
| (in thousands, except per share amounts) | Restricted Common Shares |
Weighted Average Grant Date Fair Value |
Restricted Common Shares |
Weighted Average Grant Date Fair Value |
Restricted Common Shares |
Weighted Average Grant Date Fair Value |
||||||||||||||||||
| Outstanding, beginning of year |
698 | $ | 33.69 | 635 | $ | 33.65 | 573 | $ | 28.36 | |||||||||||||||
| Granted |
525 | 42.28 | 217 | 29.49 | 240 | 40.05 | ||||||||||||||||||
| Vested |
(310 | ) | 31.81 | (120 | ) | 24.14 | (142 | ) | 23.32 | |||||||||||||||
| Forfeited |
(48 | ) | 38.82 | (34 | ) | 34.53 | (36 | ) | 32.62 | |||||||||||||||
|
|
|
|
|
|
|
|||||||||||||||||||
| Outstanding, end of year |
865 | 39.49 | 698 | 33.69 | 635 | 33.65 | ||||||||||||||||||
|
|
|
|
|
|
|
|||||||||||||||||||
| Weighted average remaining contractual life of outstanding restricted common shares (in years) |
1.57 | 1.04 | 1.41 | |||||||||||||||||||||
| Aggregate intrinsic value of outstanding restricted common shares |
$ | 36,298 | $ | 26,059 | $ | 17,269 | ||||||||||||||||||
| Aggregate intrinsic value of restricted common shares vested during the year |
$ | 12,840 | $ | 3,527 | $ | 5,400 | ||||||||||||||||||
83
Table of Contents
Market-Based Restricted Common Shares
During fiscal 2015, we granted an aggregate of 50,000 market-based restricted common shares to two key employees under one of our stock-based compensation plans. Vesting of these restricted common share awards is contingent upon the price of our common shares reaching $60.00 per share and remaining at or above that price for 30 consecutive days during the five-year period following the date of grant and the completion of a five-year service vesting period. The grant-date fair value of these restricted common shares, as determined by a Monte Carlo simulation model, was $32.06 per share. The following assumptions were used to determine the grant-date fair value and the derived service period for these market-based restricted common shares:
| Dividend yield |
1.60 | % | ||
| Expected volatility |
44.00 | % | ||
| Risk-free interest rate |
1.70 | % |
The calculated pre-tax stock-based compensation expense was determined to be $1,603,000 and will continue to be recognized on a straight-line basis over the remaining vesting period. At May 31, 2017, 25,000 of these market-based restricted common shares were outstanding.
Performance Shares
We have awarded performance shares to certain key employees that are contingent (i.e., vest) upon achieving corporate targets for cumulative corporate economic value added, earnings per share growth and, in the case of business unit executives, business unit operating income targets for the three-year periods ended or ending May 31, 2017, 2018 and 2019. These performance share awards will be paid, to the extent earned, in common shares of the Company in the fiscal quarter following the end of the applicable three-year performance period. The fair value of our performance shares is determined by the closing market prices of the underlying common shares at their respective grant dates and the pre-tax stock-based compensation expense is based on our periodic assessment of the probability of the targets being achieved and our estimate of the number of common shares that will ultimately be issued.
The table below sets forth the performance shares we granted (at target levels) during fiscal 2017, fiscal 2016 and fiscal 2015:
| (in thousands, except per share amounts) | 2017 | 2016 | 2015 | |||||||||
| Granted |
67 | 87 | 61 | |||||||||
| Weighted average grant date fair value, per share |
$ | 44.91 | $ | 30.12 | $ | 42.71 | ||||||
| Pre-tax stock-based compensation |
$ | 2,995 | $ | 2,623 | $ | 2,611 | ||||||
Note K – Employee Pension Plans
We provide retirement benefits to employees mainly through defined contribution retirement plans. Eligible participants make pre-tax contributions based on elected percentages of eligible compensation, subject to annual addition and other limitations imposed by the Internal Revenue Code and the various plans’ provisions. Company contributions consist of company matching contributions, annual or monthly employer contributions and discretionary contributions, based on individual plan provisions.
We also have one defined benefit plan, The Gerstenslager Company Bargaining Unit Employees’ Pension Plan (the “Gerstenslager Plan” or “defined benefit plan”). The Gerstenslager Plan is a non-contributory pension plan, which covers certain employees based on age and length of service. Our contributions have complied with ERISA’s minimum funding requirements. Effective May 9, 2011, in connection with the formation of the ArtiFlex joint venture, the Gerstenslager Plan was frozen, which qualified as a curtailment under the applicable accounting guidance. We did not recognize a gain or loss in connection with the curtailment of the Gerstenslager Plan.
84
Table of Contents
The following table summarizes the components of net periodic pension cost for the defined benefit plan and the defined contribution plans for the years ended May 31:
| (in thousands) | 2017 | 2016 | 2015 | |||||||||
| Defined benefit plan: |
||||||||||||
| Interest cost |
$ | 1,527 | $ | 1,621 | $ | 1,541 | ||||||
| Actuarial (return) loss on plan assets |
(2,224 | ) | 1,154 | (1,846 | ) | |||||||
| Net amortization and deferral |
1,025 | (2,664 | ) | 51 | ||||||||
|
|
|
|
|
|
|
|||||||
| Net periodic pension cost (benefit) on defined benefit plan |
328 | 111 | (254 | ) | ||||||||
| Defined contribution plans |
14,542 | 13,300 | 13,270 | |||||||||
|
|
|
|
|
|
|
|||||||
| Total retirement plan cost |
$ | 14,870 | $ | 13,411 | $ | 13,016 | ||||||
|
|
|
|
|
|
|
|||||||
The following actuarial assumptions were used for our defined benefit plan:
| 2017 | 2016 | 2015 | ||||||||||
| To determine benefit obligation: |
||||||||||||
| Discount rate |
3.94 | % | 3.75 | % | 4.07 | % | ||||||
| To determine net periodic pension cost: |
||||||||||||
| Discount rate |
3.75 | % | 4.07 | % | 4.38 | % | ||||||
| Expected long-term rate of return |
7.00 | % | 7.00 | % | 7.00 | % | ||||||
| Rate of compensation increase |
n/a | n/a | n/a | |||||||||
To calculate the discount rate we used the expected cash flows of the benefit payments and the Citigroup Pension Index. The Gerstenslager Plan’s expected long-term rate of return in fiscal 2017, fiscal 2016 and fiscal 2015 was based on the actual historical returns adjusted for a change in the frequency of lump-sum settlements upon retirement. In determining our benefit obligation, we use the actuarial present value of the vested benefits to which each eligible employee is currently entitled, based on the employee’s expected date of separation or retirement.
The following tables provide a reconciliation of the changes in the projected benefit obligation and fair value of plan assets and the funded status of the Gerstenslager Plan as of, and for the fiscal years ended May 31:
| (in thousands) | 2017 | 2016 | ||||||
| Change in benefit obligation |
||||||||
| Benefit obligation, beginning of year |
$ | 41,168 | $ | 40,227 | ||||
| Interest cost |
1,527 | 1,621 | ||||||
| Actuarial (gain) loss |
(2,459 | ) | 759 | |||||
| Benefits paid |
(1,062 | ) | (1,439 | ) | ||||
|
|
|
|
|
|||||
| Benefit obligation, end of year |
$ | 39,174 | $ | 41,168 | ||||
|
|
|
|
|
|||||
| Change in plan assets |
||||||||
| Fair value, beginning of year |
$ | 25,566 | $ | 28,159 | ||||
| Actual return (loss) on plan assets |
2,224 | (1,154 | ) | |||||
| Company contributions |
294 | - | ||||||
| Benefits paid |
(1,062 | ) | (1,439 | ) | ||||
|
|
|
|
|
|||||
| Fair value, end of year |
$ | 27,022 | $ | 25,566 | ||||
|
|
|
|
|
|||||
| Funded status |
$ | (12,152 | ) | $ | (15,602 | ) | ||
|
|
|
|
|
|||||
| Amounts recognized in the consolidated balance sheets consist of: |
||||||||
| Other liabilities |
$ | (12,152 | ) | $ | (15,602 | ) | ||
| Accumulated other comprehensive loss |
17,839 | 21,324 | ||||||
| Amounts recognized in accumulated other comprehensive loss consist of: |
||||||||
| Net loss |
17,839 | 21,324 | ||||||
|
|
|
|
|
|||||
| Total |
$ | 17,839 | $ | 21,324 | ||||
|
|
|
|
|
|||||
85
Table of Contents
The following table shows other changes in plan assets and benefit obligations recognized in OCI during the fiscal years ended May 31:
| (in thousands) | 2017 | 2016 | ||||||
| Net actuarial gain (loss) |
$ | 2,926 | $ | (3,858 | ) | |||
| Amortization of net loss |
559 | 434 | ||||||
|
|
|
|
|
|||||
| Total recognized in other comprehensive income (loss) |
$ | 3,485 | $ | (3,424 | ) | |||
|
|
|
|
|
|||||
| Total recognized in net periodic benefit cost and other comprehensive income (loss) |
$ | 3,157 | $ | (3,535 | ) | |||
|
|
|
|
|
|||||
The estimated net loss for the defined benefit plan that will be amortized from AOCI into net periodic pension cost during fiscal 2018 is $473,000.
Pension plan assets are required to be disclosed at fair value in the consolidated financial statements. Fair value is defined in “Note Q – Fair Value Measurements.” The pension plan assets’ fair value measurement level within the fair value hierarchy is based on the lowest level of any input that is significant to the fair value measurement. Valuation techniques used need to maximize the use of observable inputs and minimize the use of unobservable inputs.
The following table sets forth, by level within the fair value hierarchy, a summary of the defined benefit plan’s assets measured at fair value on a recurring basis at May 31, 2017:
| (in thousands) | Fair Value | Quoted Prices in Active Markets (Level 1) |
Significant Other Observable Inputs (Level 2) |
Significant Unobservable Inputs (Level 3) |
||||||||||||
| Investment: |
||||||||||||||||
| Money Market Funds |
$ | 294 | $ | 294 | $ | - | $ | - | ||||||||
| Bond Funds |
14,613 | 14,613 | - | - | ||||||||||||
| Equity Funds |
12,115 | 12,115 | - | - | ||||||||||||
|
|
|
|
|
|
|
|
|
|||||||||
| Totals |
$ | 27,022 | $ | 27,022 | $ | - | $ | - | ||||||||
|
|
|
|
|
|
|
|
|
|||||||||
86
Table of Contents
The following table sets forth, by level within the fair value hierarchy, a summary of the defined benefit plan’s assets measured at fair value on a recurring basis at May 31, 2016:
| (in thousands) | Fair Value | Quoted Prices in Active Markets (Level 1) |
Significant Other Observable Inputs (Level 2) |
Significant Unobservable Inputs (Level 3) |
||||||||||||
| Investment: |
||||||||||||||||
| Money Market Funds |
$ | 340 | $ | 340 | $ | - | $ | - | ||||||||
| Bond Funds |
12,435 | 12,435 | - | - | ||||||||||||
| Equity Funds |
12,791 | 12,791 | - | - | ||||||||||||
|
|
|
|
|
|
|
|
|
|||||||||
| Totals |
$ | 25,566 | $ | 25,566 | $ | - | $ | - | ||||||||
|
|
|
|
|
|
|
|
|
|||||||||
Fair values of the money market, bond and equity funds held by the defined benefit plan were determined by quoted market prices.
Plan assets for the defined benefit plan consisted principally of the following as of the respective measurement dates:
| May 31, 2017 |
May 31, 2016 |
|||||||
| Asset category: |
||||||||
| Equity securities |
45 | % | 50 | % | ||||
| Debt securities |
54 | % | 49 | % | ||||
| Other |
1 | % | 1 | % | ||||
|
|
|
|
|
|||||
| Total |
100 | % | 100 | % | ||||
|
|
|
|
|
|||||
Equity securities include no employer stock. The investment policy and strategy for the defined benefit plan is: (i) long-term in nature with liquidity requirements that are anticipated to be minimal due to the projected normal retirement date of the average employee and the current average age of participants; (ii) to earn nominal returns, net of investment fees, equal to or in excess of the actuarial assumptions of the plan; and (iii) to include a strategic asset allocation of 60%-80% equities, including international, and 20%-40% fixed income investments. No employer contributions are expected to be made to the defined benefit plan during fiscal 2018.
The following estimated future benefits, which reflect expected future service, as appropriate, are expected to be paid during the fiscal years noted:
| (in thousands) | ||||
| 2018 |
$ | 1,076 | ||
| 2019 |
$ | 1,145 | ||
| 2020 |
$ | 1,187 | ||
| 2021 |
$ | 1,268 | ||
| 2022 |
$ | 1,398 | ||
| 2023-2027 |
$ | 8,751 | ||
Commercial law requires us to pay severance and service benefits to employees at our Austrian Pressure Cylinders location. Severance benefits must be paid to all employees hired before December 31, 2002. Employees hired after that date are covered under a governmental plan that requires us to pay benefits as a percentage of compensation (included in payroll tax withholdings). Service benefits are based on a percentage of compensation and years of service. The accrued liability for these unfunded plans was $6,149,000 and $5,939,000 at May 31, 2017 and 2016, respectively, and was included in other liabilities on the consolidated balance sheets. Net periodic pension cost for these plans was $554,000, $617,000, and $718,000, for fiscal 2017, fiscal 2016 and fiscal 2015, respectively. The assumed salary rate increase was 2.75%, 2.75%, and 3.0% for fiscal 2017, fiscal 2016 and fiscal 2015, respectively. The discount rate at May 31, 2017, 2016 and 2015 was 1.60%, 1.75%, and 1.60%, respectively. Each discount rate was based on a published corporate bond rate with a term approximating the estimated benefit payment cash flows and is consistent with European and Austrian regulations.
87
Table of Contents
Note L – Income Taxes
Earnings before income taxes for the fiscal years ended May 31 include the following components:
| (in thousands) | 2017 | 2016 | 2015 | |||||||||
| United States based operations |
$ | 266,222 | $ | 180,467 | $ | 104,732 | ||||||
| Non – United States based operations |
30,905 | 36,148 | 8,296 | |||||||||
|
|
|
|
|
|
|
|||||||
| Earnings before income taxes |
297,127 | 216,615 | 113,028 | |||||||||
| Less: Net earnings attributable to noncontrolling interests* |
13,422 | 13,913 | 10,471 | |||||||||
|
|
|
|
|
|
|
|||||||
| Earnings before income taxes attributable to controlling interest |
$ | 283,705 | $ | 202,702 | $ | 102,557 | ||||||
|
|
|
|
|
|
|
|||||||
| * | Net earnings attributable to noncontrolling interests are not taxable to Worthington. |
Significant components of income tax expense (benefit) for the fiscal years ended May 31 were as follows:
| (in thousands) | 2017 | 2016 | 2015 | |||||||||
| Current |
||||||||||||
| Federal |
$ | 50,200 | $ | 42,837 | $ | 57,511 | ||||||
| State and local |
2,954 | 2,157 | 2,731 | |||||||||
| Foreign |
7,593 | 6,639 | 5,490 | |||||||||
|
|
|
|
|
|
|
|||||||
| 60,747 | 51,633 | 65,732 | ||||||||||
|
|
|
|
|
|
|
|||||||
| Deferred |
||||||||||||
| Federal |
18,177 | 7,584 | (37,839 | ) | ||||||||
| State and local |
476 | 934 | (754 | ) | ||||||||
| Foreign |
(210 | ) | (1,164 | ) | (1,367 | ) | ||||||
|
|
|
|
|
|
|
|||||||
| 18,443 | 7,354 | (39,960 | ) | |||||||||
|
|
|
|
|
|
|
|||||||
| $ | 79,190 | $ | 58,987 | $ | 25,772 | |||||||
|
|
|
|
|
|
|
|||||||
Due to the adoption of amended accounting guidance related to the accounting for share-based payments in fiscal 2016, as described in “Note A – Summary of Significant Accounting Policies – Recently Adopted Accounting Standards,” no tax benefits related to stock-based compensation were credited to additional paid-in capital in fiscal 2017 or fiscal 2016. The tax benefit related to stock-based compensation that was credited to additional paid-in capital was $6,179,000 for fiscal 2015. The tax benefit related to the purchase of noncontrolling interest in dHybrid credited to additional paid-in capital was $539,000 for fiscal 2017. Tax benefits (expense) related to defined benefit pension liability that were credited to (deducted from) OCI were $(1,158,000), $1,175,000, and $1,914,000 for fiscal 2017, fiscal 2016 and fiscal 2015, respectively. Tax benefits (expenses) related to cash flow hedges that were credited to (deducted from) OCI were $1,700,000, $(13,316,000), and $6,952,000 for fiscal 2017, fiscal 2016 and fiscal 2015, respectively.
88
Table of Contents
A reconciliation of the 35% federal statutory tax rate to total tax provision follows:
| 2017 | 2016 | 2015 | ||||||||||
| Federal statutory rate |
35.0 | % | 35.0 | % | 35.0 | % | ||||||
| State and local income taxes, net of federal tax benefit |
1.8 | 2.6 | 3.0 | |||||||||
| Change in state and local valuation allowances |
(0.3 | ) | (1.1 | ) | (1.1 | ) | ||||||
| Non-U.S. income taxes at other than 35% |
(2.1 | ) | (3.5 | ) | (0.7 | ) | ||||||
| Change in Non-U.S. valuation allowances |
0.7 | 0.5 | 1.2 | |||||||||
| Qualified production activities deduction |
(1.9 | ) | (2.2 | ) | (5.9 | ) | ||||||
| Research & development credits |
(0.1 | ) | (0.2 | ) | (0.2 | ) | ||||||
| Benefit related to foreign tax credits |
(0.5 | ) | - | (5.3 | ) | |||||||
| Excess benefit related to share-based payment awards |
(5.7 | ) | (1.6 | ) | - | |||||||
| Other |
1.0 | (0.4 | ) | (0.9 | ) | |||||||
|
|
|
|
|
|
|
|||||||
| Effective tax rate attributable to controlling interest |
27.9 | % | 29.1 | % | 25.1 | % | ||||||
|
|
|
|
|
|
|
|||||||
The above effective tax rate attributable to controlling interest excludes any impact from the inclusion of net earnings attributable to noncontrolling interests in our consolidated statements of earnings. The effective tax rates upon inclusion of net earnings attributable to noncontrolling interests were 26.7%, 27.2% and 22.8% for fiscal 2017, fiscal 2016 and fiscal 2015, respectively. Net earnings attributable to noncontrolling interests are primarily a result of our WSP, Spartan, Worthington Aritas, and TWB consolidated joint ventures. The earnings attributable to the noncontrolling interests in WSP, Spartan and TWB’s U.S. operations do not generate tax expense to Worthington since the investors in WSP, Spartan and TWB’s U.S. operations are taxed directly based on the earnings attributable to them. The tax expense of Worthington Aritas (a foreign corporation), and TWB’s wholly-owned foreign corporations, is reported in our consolidated tax expense.
Under applicable accounting guidance, a tax benefit may be recognized from an uncertain tax position only if it is more likely than not that the tax position will be sustained on examination by the taxing authorities, including resolution of any related appeals or litigation processes, based on the technical merits of the position. Any tax benefits recognized in our financial statements from such a position were measured based on the largest benefit that has a greater than fifty percent likelihood of being realized upon ultimate settlement.
The total amount of unrecognized tax benefits were $2,975,000, $2,827,000, and $3,530,000 as of May 31, 2017, 2016 and 2015, respectively. The total amount of unrecognized tax benefits that, if recognized, would affect the effective tax rate attributable to controlling interest was $2,225,000 as of May 31, 2017. Unrecognized tax benefits are the differences between a tax position taken, or expected to be taken in a tax return, and the benefit recognized for accounting purposes. Accrued amounts of interest and penalties related to unrecognized tax benefits are recognized as part of income tax expense within our consolidated statements of earnings. As of May 31, 2017, 2016 and 2015, we had accrued liabilities of $307,000, $538,000 and $947,000, respectively, for interest and penalties related to unrecognized tax benefits.
A tabular reconciliation of unrecognized tax benefits follows:
| (In thousands) | ||||
| Balance at May 31, 2016 |
$ | 2,827 | ||
| Decreases – tax positions taken in prior years |
(206 | ) | ||
| Increases – current tax positions |
617 | |||
| Settlements |
(227 | ) | ||
| Lapse of statutes of limitations |
(36 | ) | ||
|
|
|
|||
| Balance at May 31, 2017 |
$ | 2,975 | ||
89
Table of Contents
Approximately $673,000 of the liability for unrecognized tax benefits is expected to be settled in the next twelve months due to the expiration of statutes of limitations in various tax jurisdictions and as a result of expected settlements with various tax jurisdictions. While it is expected that the amount of unrecognized tax benefits will change in the next twelve months, any change is not expected to have a material impact on our consolidated financial position, results of operations or cash flows.
The following is a summary of the tax years open to examination by major tax jurisdiction:
U.S. Federal –2014 and forward
U.S. State and Local – 2013 and forward
Austria – 2013 and forward
Canada – 2013 and forward
Mexico – 2011 and forward
Earnings before income taxes attributable to foreign sources for fiscal 2017, fiscal 2016 and fiscal 2015 were as noted above. As of May 31, 2017, and based on the tax laws in effect at that time, it remains our intention to continue to indefinitely reinvest our undistributed foreign earnings, except for the foreign earnings of our TWB joint venture. Accordingly, no deferred tax liability has been recorded for our foreign earnings, except those that pertain to TWB. Excluding TWB, the undistributed earnings of our foreign subsidiaries at May 31, 2017 were approximately $241,000,000. If such earnings were not permanently reinvested, a deferred tax liability of approximately $12,000,000 would have been required.
90
Table of Contents
The components of our deferred tax assets and liabilities as of May 31 were as follows:
| (in thousands) | 2017 | 2016 | ||||||
| Deferred tax assets |
||||||||
| Accounts receivable |
$ | 2,157 | $ | 2,786 | ||||
| Inventories |
6,624 | 6,418 | ||||||
| Accrued expenses |
30,065 | 34,035 | ||||||
| Net operating loss carry forwards |
13,256 | 12,756 | ||||||
| Tax credit carry forwards |
3,206 | 3,127 | ||||||
| Stock-based compensation |
17,668 | 22,452 | ||||||
| Other |
205 | 210 | ||||||
|
|
|
|
|
|||||
| Total deferred tax assets |
73,181 | 81,784 | ||||||
| Valuation allowance for deferred tax assets |
(12,987 | ) | (11,796 | ) | ||||
|
|
|
|
|
|||||
| Net deferred tax assets |
60,194 | 69,988 | ||||||
|
|
|
|
|
|||||
| Deferred tax liabilities |
||||||||
| Property, plant and equipment |
(42,599 | ) | (35,521 | ) | ||||
| Investment in affiliated companies, principally due to undistributed earnings |
(46,001 | ) | (42,967 | ) | ||||
| Derivative contracts |
(1,745 | ) | (6,395 | ) | ||||
| Other |
(4,149 | ) | (2,484 | ) | ||||
|
|
|
|
|
|||||
| Total deferred tax liabilities |
(94,494 | ) | (87,367 | ) | ||||
|
|
|
|
|
|||||
| Net deferred tax liability |
$ | (34,300 | ) | $ | (17,379 | ) | ||
|
|
|
|
|
|||||
During fiscal 2016, the Company adopted amended accounting guidance that requires all deferred tax assets and liabilities to be classified as noncurrent on the balance sheet. The above net deferred tax liability amounts are classified in the consolidated balance sheets as noncurrent liabilities as of May 31, 2017 and May 31, 2016. At May 31, 2017, we had tax benefits for state net operating loss carry forwards of $8,470,000 that expire from fiscal 2018 to the fiscal year ending May 31, 2037, tax benefits for foreign net operating loss carry forwards of $4,786,000 that expire from fiscal 2018 to the fiscal year ending May 31, 2036, and a tax benefit for foreign income tax credit carry forwards of $3,206,000, that expires in the fiscal year ending May 31, 2025.
The valuation allowance for deferred tax assets of $12,987,000 at May 31, 2017 is associated primarily with the net operating loss carry forwards. The valuation allowance includes $8,548,000 for state and $4,439,000 for foreign deferred tax assets. The majority of the state valuation allowance relates to our facility in Decatur, Alabama. The foreign valuation allowance relates to the Company’s operations in Turkey. Based on our history of profitability, the scheduled reversal of deferred tax liabilities, and taxable income projections, we have determined that it is more likely than not that the remaining deferred tax assets are otherwise realizable.
91
Table of Contents
Note M – Earnings Per Share
The following table sets forth the computation of basic and diluted earnings per share for the fiscal years ended May 31:
| (in thousands, except per share amounts) | 2017 | 2016 | 2015 | |||||||||
| Numerator (basic & diluted): |
||||||||||||
| Net earnings attributable to controlling interest – income available to common shareholders |
$ | 204,515 | $ | 143,715 | $ | 76,785 | ||||||
| Denominator: |
||||||||||||
| Denominator for basic earnings per share attributable to controlling interest – weighted average common shares |
62,443 | 62,469 | 66,309 | |||||||||
| Effect of dilutive securities |
2,431 | 2,286 | 2,174 | |||||||||
|
|
|
|
|
|
|
|||||||
| Denominator for diluted earnings per share attributable to controlling interest – adjusted weighted average common shares |
64,874 | 64,755 | 68,483 | |||||||||
|
|
|
|
|
|
|
|||||||
| Basic earnings per share attributable to controlling interest |
$ | 3.28 | $ | 2.30 | $ | 1.16 | ||||||
| Diluted earnings per share attributable to controlling interest |
3.15 | 2.22 | 1.12 | |||||||||
Stock options covering 100,048, 326,585, and 97,798 common shares for fiscal 2017, fiscal 2016 and fiscal 2015, respectively, have been excluded from the computation of diluted earnings per share because the effect of their inclusion would have been anti-dilutive for those periods.
Note N – Segment Data
Our operations are managed principally on a products and services basis and include three reportable business segments: Steel Processing, Pressure Cylinders and Engineered Cabs, each of which is comprised of a similar group of products and services. Factors used to identify reportable business segments include the nature of the products and services provided by each business, the management reporting structure, similarity of economic characteristics and certain quantitative measures, as prescribed by authoritative guidance. A discussion of each of our reportable business segments is outlined below.
Steel Processing: The Steel Processing reportable segment consists of the Worthington Steel business unit and Worthington Steelpac Systems, LLC (“Packaging Solutions”), which designs and manufactures reusable custom steel platforms, racks and pallets for supporting, protecting and handling products throughout the shipping process. Worthington Steel also includes three consolidated joint ventures: Spartan, TWB and WSP. Spartan operates a cold-rolled, hot-dipped galvanizing line and TWB operates a laser welded blanking business. WSP serves primarily as a toll processor for U.S. Steel and others. Its services include slitting, blanking, cutting-to-length, laser blanking, laser welding, tension leveling and warehousing. Worthington Steel is an intermediate processor of flat-rolled steel. This operating segment’s processing capabilities include cold reducing, configured blanking, coil fed laser blanking, cutting-to-length, dry-lube, hot-dipped galvanizing, hydrogen annealing, laser welding, pickling, slitting, oscillate slitting, temper rolling, tension leveling, and non-metallic coating, including acrylic and paint coating. Worthington Steel sells to customers principally in the aerospace, agricultural, appliance, automotive, construction, container, hardware, HVAC, lawn and garden, leisure and recreation, office furniture and office equipment markets. Worthington Steel also toll processes steel for steel mills, large end-users, service centers and other processors. Toll processing is different from typical steel processing in that the mill, end-user or other party retains title to the steel and has the responsibility for selling the end product. The percentage of our consolidated net sales generated by Steel Processing was approximately 69%, 65% and 63%, in fiscal 2017, fiscal 2016 and fiscal 2015, respectively
Pressure Cylinders: The Pressure Cylinders reportable segment consists of the Worthington Cylinders business unit and the Company’s consolidated joint venture in Turkey, Worthington Aritas. Worthington Aritas is a manufacturer of cryogenic pressure vessels for LNG and other gas storage applications. The percentage of our consolidated net sales generated by Pressure Cylinders was approximately 28%, 30% and 30% in fiscal 2017, fiscal 2016 and fiscal 2015, respectively.
92
Table of Contents
Pressure Cylinders manufactures and sells filled and unfilled pressure cylinders, tanks, hand torches, and oil and gas equipment along with various accessories and related products for diversified end-use market applications. The following is a description of these markets:
| • | Industrial Products: This market sector includes high pressure and acetylene cylinders for industrial gases, refrigerant and certain propane gas cylinders, hand torch cylinders and joining products such as solder and brazing rods, cryogenic equipment, and systems and services for handling liquid gasses, and other specialty products. Cylinders in this market sector are generally sold to gas producers, cylinder exchangers and industrial distributors. Industrial cylinders hold fuel for uses such as cutting, brazing and soldering, semiconductor production, and beverage delivery. Refrigerant gas cylinders are used to hold refrigerant gases for commercial, residential and automotive air conditioning and refrigeration systems. LPG cylinders hold fuel for barbeque grills, recreational vehicle equipment, residential and light commercial heating systems, industrial forklifts and commercial/residential cooking (the latter, generally outside North America). Cryogenic equipment and systems include LNG systems for marine and mining applications, liquid nitrogen storage freezers and shipping containers for organic specimens in healthcare markets, and tanks, trailers, and regasification plants for liquefied nitrogen, oxygen, argon, hydrogen, and natural gas. Specialty products include a variety of fire suppression and chemical tanks. |
| • | Consumer Products: This market sector includes propane-filled cylinders for torches, camping stoves and other applications, hand held torches and accessories, and Balloon Time® helium-filled balloon kits. These products are sold primarily to mass merchandisers and distributors. |
| • | Alternative Fuels: This market sector includes composite and steel cylinders used to hold CNG and hydrogen for automobiles, buses, and light-duty trucks, and to hold propane/autogas for automobiles and light- and medium-duty trucks, as well as CNG fuel systems for heavy duty, refuse and other trucks. |
| • | Oil & Gas Equipment: This market sector includes steel and fiberglass storage tanks, separation equipment, controls and other products primarily used in the energy markets, including oil and gas and nuclear. This market sector also includes hoists and other marine products which are used principally in shipyard lift systems. This market sector also leverages its manufacturing competencies to produce pressure vessels, atmospheric tanks, controls and various custom machined components for other industrial and agricultural end markets. |
Engineered Cabs: The Engineered Cabs reportable segment consists of the Worthington Industries Engineered Cabs business unit, a non-captive designer and manufacturer of high-quality, custom-engineered open and enclosed cabs and operator stations and custom fabrications for heavy mobile equipment used primarily in the agricultural, construction, forestry, military and mining industries. Engineered Cabs’ product design, engineering support and broad manufacturing capabilities enable it to produce cabs and structures used in products ranging from small utility equipment to large earthmovers.
Other: The Other category includes the Worthington Energy Innovations operating segment, as it does not meet the quantitative thresholds for separate disclosure. Certain income and expense items not allocated to our operating segments are also included in Other, including costs associated with our captive insurance company. The Other category also includes the results of our former Construction Services operating segment, on a historical basis, through May 31, 2016.
Worthington Energy Innovations: WEI is a 75%-owned consolidated joint venture with Tom E. Kiser (20%) and Stonehenge Structured Finance Partners, LLC (5%) (together referred to as “WEI Partners”), with offices in Fremont and Columbus, Ohio. WEI is an Energy Services Company that develops cost-effective energy solutions for entities in North America and Asia. Once these solutions are implemented, WEI monitors, verifies and guarantees these energy saving solutions.
93
Table of Contents
The accounting policies of the reportable business segments and other operating segments are described in “Note A – Summary of Significant Accounting Policies.” We evaluate operating segment performance based on operating income (loss). Inter-segment sales are not material.
The following table presents summarized financial information for our reportable business segments as of, and for the fiscal years ended, May 31:
| (in thousands) | 2017 | 2016 | 2015 | |||||||||
| Net sales |
||||||||||||
| Steel Processing |
$ | 2,074,869 | $ | 1,843,661 | $ | 2,145,744 | ||||||
| Pressure Cylinders |
829,846 | 844,898 | 1,001,402 | |||||||||
| Engineered Cabs |
101,388 | 121,946 | 192,953 | |||||||||
| Other |
8,005 | 9,209 | 44,135 | |||||||||
|
|
|
|
|
|
|
|||||||
| Total net sales |
$ | 3,014,108 | $ | 2,819,714 | $ | 3,384,234 | ||||||
|
|
|
|
|
|
|
|||||||
| Operating income (loss) |
||||||||||||
| Steel Processing |
$ | 170,481 | $ | 112,001 | $ | 108,707 | ||||||
| Pressure Cylinders |
54,098 | 28,375 | 58,113 | |||||||||
| Engineered Cabs |
(7,685 | ) | (19,331 | ) | (97,260 | ) | ||||||
| Other |
(3,773 | ) | 1,007 | (9,003 | ) | |||||||
|
|
|
|
|
|
|
|||||||
| Total operating income |
$ | 213,121 | $ | 122,052 | $ | 60,557 | ||||||
|
|
|
|
|
|
|
|||||||
| Depreciation and amortization |
||||||||||||
| Steel Processing |
$ | 42,861 | $ | 38,523 | $ | 34,526 | ||||||
| Pressure Cylinders |
31,052 | 32,403 | 34,953 | |||||||||
| Engineered Cabs |
5,197 | 6,205 | 10,184 | |||||||||
| Other |
7,683 | 7,568 | 5,426 | |||||||||
|
|
|
|
|
|
|
|||||||
| Total depreciation and amortization |
$ | 86,793 | $ | 84,699 | $ | 85,089 | ||||||
|
|
|
|
|
|
|
|||||||
| Impairment of goodwill and long-lived assets |
||||||||||||
| Steel Processing |
$ | - | $ | - | $ | 3,050 | ||||||
| Pressure Cylinders |
- | 22,962 | 11,911 | |||||||||
| Engineered Cabs |
- | 3,000 | 83,989 | |||||||||
| Other |
- | - | 1,179 | |||||||||
|
|
|
|
|
|
|
|||||||
| Total impairment of goodwill and long-lived assets |
$ | - | $ | 25,962 | $ | 100,129 | ||||||
|
|
|
|
|
|
|
|||||||
| Restructuring and other expense (income) |
||||||||||||
| Steel Processing |
$ | 1,828 | $ | 4,110 | $ | 72 | ||||||
| Pressure Cylinders |
3,411 | 392 | 6,408 | |||||||||
| Engineered Cabs |
1,219 | 3,570 | (332 | ) | ||||||||
| Other |
(47 | ) | (895 | ) | 779 | |||||||
|
|
|
|
|
|
|
|||||||
| Total restructuring and other expense |
$ | 6,411 | $ | 7,177 | $ | 6,927 | ||||||
|
|
|
|
|
|
|
|||||||
| Total assets |
||||||||||||
| Steel Processing |
$ | 882,863 | $ | 819,853 | $ | 829,116 | ||||||
| Pressure Cylinders |
766,611 | 787,786 | 804,799 | |||||||||
| Engineered Cabs |
62,141 | 75,124 | 94,506 | |||||||||
| Other |
613,729 | 378,501 | 353,884 | |||||||||
|
|
|
|
|
|
|
|||||||
| Total assets |
$ | 2,325,344 | $ | 2,061,264 | $ | 2,082,305 | ||||||
|
|
|
|
|
|
|
|||||||
| Capital expenditures |
||||||||||||
| Steel Processing |
$ | 40,775 | $ | 42,063 | $ | 34,546 | ||||||
| Pressure Cylinders |
24,798 | 29,916 | 35,872 | |||||||||
| Engineered Cabs |
755 | 6,945 | 8,951 | |||||||||
| Other |
2,058 | 18,112 | 16,886 | |||||||||
|
|
|
|
|
|
|
|||||||
| Total capital expenditures |
$ | 68,386 | $ | 97,036 | $ | 96,255 | ||||||
|
|
|
|
|
|
|
|||||||
94
Table of Contents
The following table presents net sales by geographic region for the fiscal years ended May 31:
| (in thousands) | 2017 | 2016 | 2015 | |||||||||
| North America |
$ | 2,805,182 | $ | 2,662,196 | $ | 3,239,123 | ||||||
| International |
208,926 | 157,518 | 145,111 | |||||||||
|
|
|
|
|
|
|
|||||||
| Total |
$ | 3,014,108 | $ | 2,819,714 | $ | 3,384,234 | ||||||
|
|
|
|
|
|
|
|||||||
The following table presents property, plant and equipment, net, by geographic region as of May 31:
| (in thousands) | 2017 | 2016 | ||||||
| North America |
$ | 501,776 | $ | 515,263 | ||||
| International |
68,713 | 67,575 | ||||||
|
|
|
|
|
|||||
| Total |
$ | 570,489 | $ | 582,838 | ||||
|
|
|
|
|
|||||
Note O – Acquisitions
Worthington Specialty Processing
Effective March 1, 2016, the Company reached an agreement with U.S. Steel, its partner in the WSP joint venture, whereby the Company appoints a majority of the WSP Board of Directors, giving the Company effective control over the operations of WSP. The ownership percentages in WSP remained unchanged at 51% Worthington and 49% U.S. Steel. This transaction was accounted for as a step acquisition, which required that the Company re-measure its previously held 51% ownership interest in WSP to fair value and record the difference between fair value and carrying value as a gain in our consolidated statement of earnings. The re-measurement to fair value resulted in a non-cash, pre-tax gain of $6,877,000, which is included in miscellaneous income, net in our consolidated statement of earnings for fiscal 2016. The fair value of the Company’s previously held interest in WSP was estimated to be $32,375,000 and was derived using an income approach. The acquired assets became part of our Steel Processing operating segment upon closing.
The assets acquired and liabilities assumed were recognized at their acquisition-date fair values. In connection with the acquisition of WSP, we identified and valued the following identifiable intangible assets:
| (in thousands) | Amount | Useful Life (Years) |
||||||
| Category |
||||||||
| Customer relationships |
$ | 3,300 | 6 | |||||
| Trade name |
1,900 | Indefinite | ||||||
|
|
|
|||||||
| Total acquired identifiable intangible assets |
$ | 5,200 | ||||||
|
|
|
|||||||
The total fair value of the business includes the fair values of other assets that were not identifiable, not separately recognizable under accounting rules (e.g., assembled workforce) or of immaterial value. The fair value of the business also includes a going-concern element that represents our ability to earn a higher rate of return on this group of assets than would be expected on the separate assets as determined during the valuation process. This additional investment value resulted in goodwill, which is expected to be deductible for income tax purposes.
95
Table of Contents
The following table summarizes the fair value assigned to the assets acquired and liabilities assumed at the acquisition date:
| (in thousands) | ||||
| Cash |
$ | 6,902 | ||
| Accounts receivable |
10,233 | |||
| Inventories |
3,349 | |||
| Prepaid expense and other |
809 | |||
| Intangible assets |
5,200 | |||
| Other assets |
2,608 | |||
| Property, plant and equipment |
38,657 | |||
|
|
|
|||
| Total identifiable assets |
67,758 | |||
| Accounts payable |
(6,963 | ) | ||
| Accrued liabilities |
(1,728 | ) | ||
|
|
|
|||
| Net identifiable assets |
59,067 | |||
| Goodwill |
1,312 | |||
|
|
|
|||
| Net assets |
60,379 | |||
| Noncontrolling interest |
(28,004 | ) | ||
|
|
|
|||
| Total basis allocated |
$ | 32,375 | ||
|
|
|
|||
NetBraze
On January 15, 2016, the Company acquired the net assets of NetBraze, LLC, a manufacturer of brazing alloys, silver brazing filler metals, solders and fluxes. The total purchase price was $3,390,000, including contingent consideration with an estimated fair value of $540,000. This basis was allocated among the net assets acquired at their acquisition-date fair values, with $1,565,000 to working capital and $1,825,000 to fixed assets. The acquired assets became part of our Pressure Cylinders operating segment upon closing.
The CryoScience business of Taylor Wharton
On December 7, 2015, the Company acquired the net assets of the CryoScience business of Taylor Wharton (“Taylor Wharton CryoScience”), including a manufacturing facility in Theodore, Alabama. The Company also purchased certain intellectual property and manufacturing assets of Taylor Wharton focused on the cryogenic industrial and LNG markets. The total purchase price was $30,584,000 after adjusting for an estimated working capital deficit of $772,000. The acquired assets became part of our Pressure Cylinders operating segment upon closing.
The assets acquired and liabilities assumed were recognized at their acquisition-date fair values, with goodwill representing the excess of the purchase price over the fair value of the net identifiable assets acquired. In connection with the acquisition, we identified and valued the following identifiable intangible assets:
| (in thousands) | Amount | Useful
Life (Years) |
||||||
| Category |
||||||||
| Technology |
$ | 2,800 | 20 | |||||
| Customer relationships |
2,200 | 15 | ||||||
| Other |
260 | 1 | ||||||
|
|
|
|||||||
| Total acquired identifiable intangible assets |
$ | 5,260 | ||||||
|
|
|
|||||||
The purchase price includes the fair values of other assets that were not identifiable, not separately recognizable under accounting rules (e.g., assembled workforce), or of immaterial value. The purchase price also includes a going-concern element that represents our ability to earn a higher rate of return on this group of assets than would be expected on the separate assets as determined during the valuation process. This additional investment value resulted in goodwill, which is expected to be deductible for income tax purposes.
96
Table of Contents
The following table summarizes the consideration transferred and the fair value assigned to the assets acquired and liabilities assumed at the acquisition date:
| (in thousands) | ||||
| Accounts receivable |
$ | 2,367 | ||
| Inventories |
5,762 | |||
| Prepaid expenses |
208 | |||
| Intangible assets |
5,260 | |||
| Property, plant and equipment |
13,400 | |||
|
|
|
|||
| Total identifiable assets |
26,997 | |||
| Accounts payable |
(2,808 | ) | ||
| Other accrued items |
(318 | ) | ||
|
|
|
|||
| Net assets |
23,871 | |||
| Goodwill |
6,713 | |||
|
|
|
|||
| Purchase price |
30,584 | |||
| Plus: estimated working capital deficit |
772 | |||
|
|
|
|||
| Cash paid at closing |
$ | 31,356 | ||
|
|
|
|||
Operating results of these acquired businesses have been included in our consolidated statements of earnings from the respective acquisition date, forward. Proforma operating results and operating results for the acquired businesses since the respective acquisition dates have not been separately disclosed because the effects were not material, individually or in the aggregate.
Note P – Derivative Instruments and Hedging Activities
We utilize derivative financial instruments to manage exposure to certain risks related to our ongoing operations. The primary risks managed through the use of derivative instruments include interest rate risk, foreign currency exchange risk and commodity price risk. While certain of our derivative instruments are designated as hedging instruments, we also enter into derivative instruments that are designed to hedge a risk, but are not designated as hedging instruments and therefore do not qualify for hedge accounting. These derivative instruments are adjusted to current fair value through earnings at the end of each period.
Interest Rate Risk Management – We are exposed to the impact of interest rate changes. Our objective is to manage the impact of interest rate changes on cash flows and the market value of our borrowings. We utilize a mix of debt maturities along with both fixed-rate and variable-rate debt to manage changes in interest rates. In addition, we enter into interest rate swaps to further manage our exposure to interest rate variations related to our borrowings and to lower our overall borrowing costs.
Foreign Currency Exchange Risk Management – We conduct business in several major international currencies and are therefore subject to risks associated with changing foreign currency exchange rates. We enter into various contracts that change in value as foreign currency exchange rates change to manage this exposure. Such contracts limit exposure to both favorable and unfavorable currency exchange rate fluctuations. The translation of foreign currencies into United States dollars also subjects us to exposure related to fluctuating currency exchange rates; however, derivative instruments are not used to manage this risk.
Commodity Price Risk Management – We are exposed to changes in the price of certain commodities, including steel, natural gas, zinc and other raw materials, and our utility requirements. Our objective is to reduce earnings and cash flow volatility associated with forecasted purchases and sales of these commodities to allow management to focus its attention on business operations. Accordingly, we enter into derivative contracts to manage the associated price risk.
97
Table of Contents
We are exposed to counterparty credit risk on all of our derivative instruments. Accordingly, we have established and maintain strict counterparty credit guidelines. We have credit support agreements in place with certain counterparties to limit our credit exposure. These agreements require either party to post cash collateral if its cumulative market position exceeds a predefined liability threshold. Amounts posted to the margin accounts accrue interest at market rates and are required to be refunded in the period in which the cumulative market position falls below the required threshold. We do not have significant exposure to any one counterparty and management believes the risk of loss is remote and, in any event, would not be material.
Refer to “Note Q – Fair Value Measurements” for additional information regarding the accounting treatment for our derivative instruments, as well as how fair value is determined.
The following table summarizes the fair value of our derivative instruments and the respective line in which they were recorded in the consolidated balance sheet at May 31, 2017:
| Asset Derivatives | Liability Derivatives | |||||||||||||||
| (in thousands) |
Balance Sheet Location |
Fair Value |
Balance Sheet Location |
Fair Value |
||||||||||||
| Derivatives designated as hedging instruments: |
|
|||||||||||||||
| Commodity contracts |
Receivables | $ | 7,148 | Accounts payable | $ | 111 | ||||||||||
| Other assets | 6 | Other liabilities | 159 | |||||||||||||
|
|
|
|
|
|||||||||||||
| 7,154 | 270 | |||||||||||||||
| Interest rate contracts |
Receivables | - | Accounts payable | 141 | ||||||||||||
| Other assets | - | Other liabilities | 160 | |||||||||||||
|
|
|
|
|
|||||||||||||
| - | 301 | |||||||||||||||
|
|
|
|
|
|||||||||||||
| Totals |
$ | 7,154 | $ | 571 | ||||||||||||
|
|
|
|
|
|||||||||||||
| Derivatives not designated as hedging instruments: |
|
|||||||||||||||
| Commodity contracts |
Receivables | $ | 1,110 | Accounts payable | $ | 570 | ||||||||||
| Other assets | - | Other liabilities | 1 | |||||||||||||
|
|
|
|
|
|||||||||||||
| 1,110 | 571 | |||||||||||||||
| Foreign exchange contracts |
Receivables | 62 | Accounts payable | - | ||||||||||||
|
|
|
|
|
|||||||||||||
| Totals |
$ | 1,172 | $ | 571 | ||||||||||||
|
|
|
|
|
|||||||||||||
| Total Derivative Instruments |
$ | 8,326 | $ | 1,142 | ||||||||||||
|
|
|
|
|
|||||||||||||
The amounts in the table above reflect the fair value of the Company’s derivative contracts on a net basis. Had these amounts been recognized on a gross basis, the impact would have been a $100,000 increase in receivables with a corresponding increase in accounts payable.
98
Table of Contents
The following table summarizes the fair value of our derivative instruments and the respective line in which they were recorded in the consolidated balance sheet at May 31, 2016:
| Asset Derivatives | Liability Derivatives | |||||||||||||||
| (in thousands) | Balance Sheet Location |
Fair Value |
Balance Sheet Location |
Fair Value |
||||||||||||
| Derivatives designated as hedging instruments: |
|
|||||||||||||||
| Commodity contracts |
Receivables | $ | 13,224 | Accounts payable | $ | 696 | ||||||||||
| Other assets | 3,589 | Other liabilities | 80 | |||||||||||||
|
|
|
|
|
|||||||||||||
| 16,813 | 776 | |||||||||||||||
| Interest rate contracts |
Receivables | - | Accounts payable | 155 | ||||||||||||
| Other assets | - | Other liabilities | 306 | |||||||||||||
|
|
|
|
|
|||||||||||||
| - | 461 | |||||||||||||||
|
|
|
|
|
|||||||||||||
| Totals |
$ | 16,813 | $ | 1,237 | ||||||||||||
|
|
|
|
|
|||||||||||||
| Derivatives not designated as hedging instruments: |
|
|||||||||||||||
| Commodity contracts |
Receivables | $ | 4,660 | Accounts payable | $ | 761 | ||||||||||
| Other assets | 317 | Other liabilities | - | |||||||||||||
|
|
|
|
|
|||||||||||||
| 4,977 | 761 | |||||||||||||||
| Foreign exchange contracts |
Receivables | - | Accounts payable | 15 | ||||||||||||
|
|
|
|
|
|||||||||||||
| Totals |
$ | 4,977 | $ | 776 | ||||||||||||
|
|
|
|
|
|||||||||||||
| Total Derivative Instruments |
$ | 21,790 | $ | 2,013 | ||||||||||||
|
|
|
|
|
|||||||||||||
The amounts in the table above reflect the fair value of the Company’s derivative contracts on a net basis. Had these amounts been recognized on a gross basis, the impact would have been a $300,000 decrease in receivables with a corresponding decrease in accounts payable.
Cash Flow Hedges
We enter into derivative instruments to hedge our exposure to changes in cash flows attributable to interest rate and commodity price fluctuations associated with certain forecasted transactions. These derivative instruments are designated and qualify as cash flow hedges. Accordingly, the effective portion of the gain or loss on the derivative instrument is reported as a component of OCI and reclassified into earnings in the same line associated with the forecasted transaction and in the same period during which the hedged transaction affects earnings. The ineffective portion of the gain or loss on the derivative instrument is recognized in earnings immediately.
The following table summarizes our cash flow hedges outstanding at May 31, 2017:
| (in thousands) | Notional Amount |
Maturity Date |
||||||
| Commodity contracts |
$ | 35,529 | June 2017 – June 2019 | |||||
| Interest rate contracts |
17,203 | September 2019 | ||||||
99
Table of Contents
The following table summarizes the gain (loss) recognized in OCI and the gain (loss) reclassified from AOCI into earnings for derivative instruments designated as cash flow hedges during fiscal 2017 and fiscal 2016:
| (in thousands) | Gain (Loss) Recognized in OCI (Effective Portion) |
Location of Gain (Loss) Reclassified from Accumulated OCI (Effective Portion) |
Gain (Loss) Reclassified from Accumulated OCI (Effective Portion) |
Location of Gain (Ineffective Portion) Excluded from Effectiveness Testing |
Gain (Ineffective Portion) Excluded from Effectiveness Testing |
|||||||||||||
| For the fiscal year ended |
||||||||||||||||||
| May 31, 2017: |
||||||||||||||||||
| Interest rate contracts |
$ | 26 | Interest expense | $ | (211 | ) | Interest expense | $ | - | |||||||||
| Commodity contracts |
7,643 | Cost of goods sold | 12,402 | Cost of goods sold | - | |||||||||||||
|
|
|
|
|
|
|
|||||||||||||
| Totals |
$ | 7,669 | $ | 12,191 | $ | - | ||||||||||||
|
|
|
|
|
|
|
|||||||||||||
| For the fiscal year ended |
||||||||||||||||||
| May 31, 2016: |
||||||||||||||||||
| Interest rate contracts |
$ | (266 | ) | Interest expense | $ | (510 | ) | Interest expense | $ | - | ||||||||
| Commodity contracts |
7,549 | Cost of goods sold | (27,727 | ) | Cost of goods sold | - | ||||||||||||
| Foreign currency contracts |
- | Miscellaneous income, net | (4 | ) | Miscellaneous income, net | - | ||||||||||||
|
|
|
|
|
|
|
|||||||||||||
| Totals |
$ | 7,283 | $ | (28,241 | ) | $ | - | |||||||||||
|
|
|
|
|
|
|
|||||||||||||
The estimated net amount of the gains in AOCI at May 31, 2017 expected to be reclassified into net earnings within the succeeding twelve months is $6,166,000 (net of tax of $3,770,000). This amount was computed using the fair value of the cash flow hedges at May 31, 2017, and will change before actual reclassification from other comprehensive income to net earnings during fiscal 2018.
Economic (Non-designated) Hedges
We enter into foreign currency contracts to manage our foreign exchange exposure related to inter-company and financing transactions that do not meet the requirements for hedge accounting treatment. We also enter into certain commodity contracts that do not qualify for hedge accounting treatment. Accordingly, these derivative instruments are adjusted to current market value at the end of each period through earnings.
The following table summarizes our economic (non-designated) derivative instruments outstanding at May 31, 2017:
| (in thousands) | Notional Amount |
Maturity Date(s) | ||||||
| Commodity contracts |
$ | 25,331 | June 2017 – December 2018 | |||||
| Foreign currency contracts |
4,676 | June 2017 | ||||||
100
Table of Contents
The following table summarizes the gain (loss) recognized in earnings for economic (non-designated) derivative financial instruments during fiscal 2017 and fiscal 2016:
| Gain (Loss)
Recognized in Earnings |
||||||||||||
| Fiscal Year Ended | ||||||||||||
| Location of Gain (Loss) Recognized in Earnings |
May 31, | |||||||||||
| (in thousands) | 2017 | 2016 | ||||||||||
| Commodity contracts |
Cost of goods sold | $ | 3,749 | $ | (1,351 | ) | ||||||
| Foreign exchange contracts |
Miscellaneous income, net | (553 | ) | 148 | ||||||||
|
|
|
|
|
|||||||||
| Total |
$ | 3,196 | $ | (1,203 | ) | |||||||
|
|
|
|
|
|||||||||
Note Q – Fair Value Measurements
Fair value is defined as the price that would be received to sell an asset or paid to transfer a liability in an orderly transaction between market participants at the measurement date. Fair value is an exit price concept that assumes an orderly transaction between willing market participants and is required to be based on assumptions that market participants would use in pricing an asset or a liability. Current accounting guidance establishes a three-tier fair value hierarchy as a basis for considering such assumptions and for classifying the inputs used in the valuation methodologies. This hierarchy requires entities to maximize the use of observable inputs and minimize the use of unobservable inputs. The three levels of inputs used to measure fair values are as follows:
| Level 1 |
– | Observable prices in active markets for identical assets and liabilities. | ||
| Level 2 |
– | Inputs other than quoted prices included within Level 1 that are observable for the assets and liabilities, either directly or indirectly. | ||
| Level 3 |
– | Unobservable inputs that are supported by little or no market activity and that are significant to the fair value of the assets and liabilities. | ||
Recurring Fair Value Measurements
At May 31, 2017, our financial assets and liabilities measured at fair value on a recurring basis were as follows:
| (in thousands) | Quoted
Prices in Active Markets (Level 1) |
Significant Other Observable Inputs (Level 2) |
Significant Unobservable Inputs (Level 3) |
Totals | ||||||||||||
| Assets |
||||||||||||||||
| Derivative contracts (1) |
$ | - | $ | 8,326 | $ | - | $ | 8,326 | ||||||||
|
|
|
|
|
|
|
|
|
|||||||||
| Total assets |
$ | - | $ | 8,326 | $ | - | $ | 8,326 | ||||||||
|
|
|
|
|
|
|
|
|
|||||||||
| Liabilities |
||||||||||||||||
| Derivative contracts (1) |
$ | - | $ | 1,142 | $ | - | $ | 1,142 | ||||||||
| Contingent consideration obligation (2) |
- | - | 585 | 585 | ||||||||||||
|
|
|
|
|
|
|
|
|
|||||||||
| Total liabilities |
$ | - | $ | 1,142 | $ | 585 | $ | 1,727 | ||||||||
|
|
|
|
|
|
|
|
|
|||||||||
101
Table of Contents
At May 31, 2016, our financial assets and liabilities measured at fair value on a recurring basis were as follows:
| (in thousands) | Quoted
Prices in Active Markets (Level 1) |
Significant Other Observable Inputs (Level 2) |
Significant Unobservable Inputs (Level 3) |
Totals | ||||||||||||
| Assets |
||||||||||||||||
| Derivative contracts (1) |
$ | - | $ | 21,790 | $ | - | $ | 21,790 | ||||||||
|
|
|
|
|
|
|
|
|
|||||||||
| Total assets |
$ | - | $ | 21,790 | $ | - | $ | 21,790 | ||||||||
|
|
|
|
|
|
|
|
|
|||||||||
| Liabilities |
||||||||||||||||
| Derivative contracts (1) |
$ | - | $ | 2,013 | $ | - | $ | 2,013 | ||||||||
| Contingent consideration obligations (2) |
- | - | 4,519 | 4,519 | ||||||||||||
|
|
|
|
|
|
|
|
|
|||||||||
| Total liabilities |
$ | - | $ | 2,013 | $ | 4,519 | $ | 6,532 | ||||||||
|
|
|
|
|
|
|
|
|
|||||||||
| (1) | The fair value of our derivative contracts is based on the present value of the expected future cash flows considering the risks involved, including non-performance risk, and using discount rates appropriate for the respective maturities. Market observable, Level 2 inputs are used to determine the present value of the expected future cash flows. Refer to “Note P – Derivative Instruments and Hedging Activities” for additional information regarding our use of derivative instruments. |
| (2) | The fair value of the contingent consideration obligations is determined using a probability weighted cash flow approach based on management’s projections of future cash flows of the acquired businesses. The fair value measurements are based on significant inputs not observable in the market and thus represent Level 3 measurements. |
The non-derivative financial instruments included in the carrying amounts of cash and cash equivalents, receivables, income taxes receivable, other assets, deferred income taxes, accounts payable, short-term borrowings, accrued compensation, contributions to employee benefit plans and related taxes, other accrued expenses, income taxes payable and other liabilities approximate fair value due to their short-term nature. The fair value of long-term debt, including current maturities, based upon models utilizing primarily market observable (Level 2) inputs and credit risk, was $618,059,000 and $609,245,000 at May 31, 2017 and 2016, respectively. The carrying amount of long-term debt, including current maturities, was $578,487,000 and $578,353,000 at May 31, 2017 and 2016, respectively.
102
Table of Contents
Note R – Operating Leases
We lease certain property and equipment from third parties under non-cancelable operating lease agreements. Rent expense under operating leases was $13,519,000, $14,683,000 and $17,219,000 in fiscal 2017, fiscal 2016 and fiscal 2015, respectively. Future minimum lease payments for non-cancelable operating leases having an initial or remaining term in excess of one year at May 31, 2017, were as follows:
| (in thousands) | ||||
| 2018 |
$ | 9,951 | ||
| 2019 |
9,259 | |||
| 2020 |
6,605 | |||
| 2021 |
4,820 | |||
| 2022 |
3,041 | |||
| Thereafter |
6,784 | |||
|
|
|
|||
| Total |
$ | 40,460 | ||
|
|
|
|||
Note S – Related Party Transactions
We purchase from, and sell to, affiliated companies certain raw materials and services at prevailing market prices. Net sales to affiliated companies for fiscal 2017, fiscal 2016 and fiscal 2015 totaled $56,588,000, $32,496,000, and $32,277,000, respectively. Purchases from affiliated companies for fiscal 2017, fiscal 2016 and fiscal 2015 totaled $7,145,000, $15,737,000, and $8,021,000, respectively. Accounts receivable from affiliated companies were $4,616,000 and $5,152,000 at May 31, 2017 and 2016, respectively. Accounts payable to affiliated companies were $76,000 and $107,000 at May 31, 2017 and 2016, respectively.
Note T – Quarterly Results of Operations (Unaudited)
The following table summarizes the unaudited quarterly consolidated results of operations for fiscal 2017 and fiscal 2016:
| (in thousands, except per share) | Three Months Ended | |||||||||||||||
| Fiscal 2017 | August 31 | November 30 | February 28 | May 31 | ||||||||||||
| Net sales |
$ | 737,549 | $ | 727,780 | $ | 703,436 | $ | 845,343 | ||||||||
| Gross margin |
147,282 | 122,803 | 110,990 | 154,830 | ||||||||||||
| Net earnings |
68,536 | 49,867 | 38,951 | 60,583 | ||||||||||||
| Net earnings attributable to controlling interest |
65,567 | 46,565 | 35,889 | 56,494 | ||||||||||||
| Earnings per share – basic |
$ | 1.06 | $ | 0.75 | $ | 0.57 | $ | 0.90 | ||||||||
| Earnings per share – diluted |
$ | 1.02 | $ | 0.72 | $ | 0.55 | $ | 0.87 | ||||||||
| Fiscal 2016 | August 31 | November 30 | February 29 | May 31 | ||||||||||||
| Net sales |
$ | 758,147 | $ | 699,816 | $ | 647,080 | $ | 714,671 | ||||||||
| Gross margin |
113,016 | 109,179 | 95,923 | 134,475 | ||||||||||||
| Impairment of long-lived assets (1) |
3,000 | 22,962 | - | - | ||||||||||||
| Net earnings (2) |
34,995 | 25,752 | 34,143 | 62,738 | ||||||||||||
| Net earnings attributable to controlling interest (2) |
31,968 | 23,376 | 29,847 | 58,523 | ||||||||||||
| Earnings per share – basic (2) |
$ | 0.50 | $ | 0.37 | $ | 0.48 | $ | 0.95 | ||||||||
| Earnings per share – diluted (2) |
$ | 0.48 | $ | 0.36 | $ | 0.47 | $ | 0.92 | ||||||||
| (1) | For additional information regarding the Company’s impairment activity, refer to “Note C – Goodwill and Other Long-Lived Assets.” |
| (2) | Amounts are presented on a revised basis due to the adoption of amended accounting guidance related to the accounting for share-based payments in the fourth quarter of fiscal 2016. As a result of the adoption of this amended accounting guidance, net earnings and net earnings attributable to controlling interest for the three month periods ended August 31, 2015, November 30, 2015 and February 29, 2016 increased $558,000, $136,000 and $271,000, respectively, from the previously reported results. |
103
Table of Contents
The sum of the quarterly earnings per share data presented in the table may not equal the annual results due to rounding and the impact of dilutive securities on the annual versus the quarterly earnings per share calculations.
Note U – Subsequent Events
Effective June 1, 2017, we made certain organizational changes impacting the internal reporting and management structure of Packaging Solutions. As a result of these organizational changes, management responsibilities and internal reporting were realigned, moving from the Steel Processing operating segment to the Engineered Cabs operating segment, where we expect to achieve synergies in design engineering and manufacturing development.
On June 2, 2017, the Company acquired AMTROL, a leading manufacturer of pressure cylinders and water system tanks with operations in the U.S. and Europe. The total purchase price was $283,000,000 and is subject to adjustment based on closing working capital. A portion of the purchase price was used to settle certain indebtedness and other liabilities assumed by the Company in the transaction. The acquisition was funded primarily with cash on hand.
104
Table of Contents
WORTHINGTON INDUSTRIES, INC. AND SUBSIDIARIES
SCHEDULE II – VALUATION AND QUALIFYING ACCOUNTS
| COL. A. | COL. B. | COL. C. | COL. D. | COL. E. | ||||||||||||||||||||||||||||||||||||||||
| Description | Additions | |||||||||||||||||||||||||||||||||||||||||||
| Balance at Beginning of Period |
Charged to Costs and Expenses |
Charged to Other Accounts – Describe (A) |
Deductions – Describe (B) |
Balance at End of Period |
||||||||||||||||||||||||||||||||||||||||
| Year Ended May 31, 2017:
Deducted from asset accounts: Allowance for possible losses on trade accounts receivable |
$ | 4,579,000 | $ | 269,000 | $ | - | $ | 1,404,000 | $ | 3,444,000 | ||||||||||||||||||||||||||||||||||
|
|
|
|
|
|
|
|
|
|
|
|||||||||||||||||||||||||||||||||||
| Year Ended May 31, 2016:
Deducted from asset accounts: Allowance for possible losses on trade accounts receivable |
$ | 3,085,000 | $ | 1,556,000 | $ | 394,000 | $ | 456,000 | $ | 4,579,000 | ||||||||||||||||||||||||||||||||||
|
|
|
|
|
|
|
|
|
|
|
|||||||||||||||||||||||||||||||||||
| Year Ended May 31, 2015:
Deducted from asset accounts: Allowance for possible losses on trade accounts receivable |
$ | 3,043,000 | $ | 259,000 | $ | - | $ | 217,000 | $ | 3,085,000 | ||||||||||||||||||||||||||||||||||
|
|
|
|
|
|
|
|
|
|
|
|||||||||||||||||||||||||||||||||||
Note A – Miscellaneous amounts.
Note B – Uncollectable accounts charged to the allowance.
See accompanying Report of Independent Registered Public Accounting Firm.
105
Table of Contents
Item 9. – Changes in and Disagreements With Accountants on Accounting and Financial Disclosure
Not applicable.
Item 9A. – Controls and Procedures
Evaluation of Disclosure Controls and Procedures
We maintain disclosure controls and procedures [as defined in Rules 13a-15(e) and 15d-15(e) under the Securities Exchange Act of 1934, as amended (the “Exchange Act”)] that are designed to provide reasonable assurance that information required to be disclosed in the reports that we file or submit under the Exchange Act is recorded, processed, summarized and reported within the time periods specified in the Securities and Exchange Commission’s rules and forms, and that such information is accumulated and communicated to our management, including our principal executive officer and our principal financial officer, as appropriate to allow timely decisions regarding required disclosure.
Management, with the participation of our principal executive officer and our principal financial officer, performed an evaluation of the effectiveness of our disclosure controls and procedures as of the end of the fiscal year covered by this Annual Report on Form 10-K (the fiscal year ended May 31, 2017). Based on that evaluation, our principal executive officer and our principal financial officer have concluded that such disclosure controls and procedures were effective at a reasonable assurance level as of the end of the fiscal year covered by this Annual Report on Form 10-K.
Changes in Internal Control Over Financial Reporting
There were no changes in our internal control over financial reporting that occurred in the last fiscal quarter (the fiscal quarter ended May 31, 2017) that have materially affected, or are reasonably likely to materially affect, our internal control over financial reporting.
Annual Report of Management on Internal Control Over Financial Reporting
Management is responsible for establishing and maintaining adequate internal control over financial reporting to provide reasonable assurance regarding the reliability of our financial reporting and the preparation of financial statements for external purposes in accordance with accounting principles generally accepted in the United States. Internal control over financial reporting includes those policies and procedures that (i) pertain to the maintenance of records that, in reasonable detail, accurately and fairly reflect the transactions and dispositions of the assets of Worthington Industries, Inc. and our consolidated subsidiaries; (ii) provide reasonable assurance that transactions are recorded as necessary to permit preparation of financial statements in accordance with accounting principles generally accepted in the United States, and that receipts and expenditures of Worthington Industries, Inc. and our consolidated subsidiaries are being made only in accordance with authorizations of management and directors of Worthington Industries, Inc. and our consolidated subsidiaries, as appropriate; and (iii) provide reasonable assurance regarding prevention or timely detection of unauthorized acquisition, use or disposition of the assets of Worthington Industries, Inc. and our consolidated subsidiaries that could have a material effect on the financial statements.
Management, with the participation of our principal executive officer and our principal financial officer, evaluated the effectiveness of our internal control over financial reporting as of May 31, 2017, the end of our fiscal year. Management based its assessment on criteria established in Internal Control—Integrated Framework (2013) issued by the Committee of Sponsoring Organizations of the Treadway Commission. Management’s assessment included evaluation of such elements as the design and operating effectiveness of key controls over financial reporting, process documentation, accounting policies and our overall control environment. This assessment is supported by testing and monitoring performed under the direction of management.
Because of its inherent limitations, internal control over financial reporting may not prevent or detect misstatements. Also, projections of any evaluation of effectiveness to future periods are subject to the risk that controls may become inadequate because of changes in conditions, or that the degree of compliance with the policies or procedures may deteriorate. Accordingly, even an effective system of internal control over financial reporting will provide only reasonable assurance with respect to financial statement preparation.
106
Table of Contents
Based on the assessment of our internal control over financial reporting, management has concluded that our internal control over financial reporting was effective at a reasonable assurance level as of May 31, 2017. The results of management’s assessment were reviewed with the Audit Committee of the Board of Directors of Worthington Industries, Inc.
Additionally, our independent registered public accounting firm, KPMG LLP, independently assessed the effectiveness of our internal control over financial reporting and issued the accompanying Report of Independent Registered Public Accounting Firm.
107
Table of Contents
Report of Independent Registered Public Accounting Firm
The Board of Directors and Shareholders
Worthington Industries, Inc.:
We have audited Worthington Industries, Inc.’s (the Company) internal control over financial reporting as of May 31, 2017, based on criteria established in Internal Control – Integrated Framework (2013) issued by the Committee of Sponsoring Organizations of the Treadway Commission (COSO). Worthington Industries, Inc.’s management is responsible for maintaining effective internal control over financial reporting and for its assessment of the effectiveness of internal control over financial reporting, included in the accompanying Annual Report of Management on Internal Control Over Financial Reporting. Our responsibility is to express an opinion on the Company’s internal control over financial reporting based on our audit.
We conducted our audit in accordance with the standards of the Public Company Accounting Oversight Board (United States). Those standards require that we plan and perform the audit to obtain reasonable assurance about whether effective internal control over financial reporting was maintained in all material respects. Our audit included obtaining an understanding of internal control over financial reporting, assessing the risk that a material weakness exists, and testing and evaluating the design and operating effectiveness of internal control based on the assessed risk. Our audit also included performing such other procedures as we considered necessary in the circumstances. We believe that our audit provides a reasonable basis for our opinion.
A company’s internal control over financial reporting is a process designed to provide reasonable assurance regarding the reliability of financial reporting and the preparation of financial statements for external purposes in accordance with generally accepted accounting principles. A company’s internal control over financial reporting includes those policies and procedures that (1) pertain to the maintenance of records that, in reasonable detail, accurately and fairly reflect the transactions and dispositions of the assets of the company; (2) provide reasonable assurance that transactions are recorded as necessary to permit preparation of financial statements in accordance with generally accepted accounting principles, and that receipts and expenditures of the company are being made only in accordance with authorizations of management and directors of the company; and (3) provide reasonable assurance regarding prevention or timely detection of unauthorized acquisition, use, or disposition of the company’s assets that could have a material effect on the financial statements.
Because of its inherent limitations, internal control over financial reporting may not prevent or detect misstatements. Also, projections of any evaluation of effectiveness to future periods are subject to the risk that controls may become inadequate because of changes in conditions, or that the degree of compliance with the policies or procedures may deteriorate.
In our opinion, Worthington Industries, Inc. maintained, in all material respects, effective internal control over financial reporting as of May 31, 2017, based on criteria established in Internal Control – Integrated Framework (2013) issued by the Committee of Sponsoring Organizations of the Treadway Commission (COSO).
We also have audited, in accordance with the standards of the Public Company Accounting Oversight Board (United States), the consolidated balance sheets of Worthington Industries, Inc. and subsidiaries as of May 31, 2017 and 2016, and the related consolidated statements of earnings, comprehensive income, equity, and cash flows for each of the years in the three-year period ended May 31, 2017, and our report dated July 24, 2017, expressed an unqualified opinion on those consolidated financial statements.
| /s/ KPMG LLP |
Columbus, Ohio
July 24, 2017
108
Table of Contents
There is nothing to be reported under this Item 9B.
109
Table of Contents
Item 10. – Directors, Executive Officers and Corporate Governance
Directors, Executive Officers and Persons Nominated or Chosen to Become Directors or Executive Officers
The information required by Item 401 of SEC Regulation S-K concerning the directors of Worthington Industries, Inc. (“Worthington Industries” or the “Registrant”) and the nominees for re-election as directors of Worthington Industries at the Annual Meeting of Shareholders to be held on September 27, 2017 (the “2017 Annual Meeting”) is incorporated herein by reference from the disclosure to be included under the caption “PROPOSAL 1: ELECTION OF DIRECTORS” in Worthington Industries’ definitive Proxy Statement relating to the 2017 Annual Meeting (“Worthington Industries’ Definitive 2017 Proxy Statement”), which will be filed pursuant to SEC Regulation 14A not later than 120 days after the end of Worthington Industries’ fiscal 2017 (the fiscal year ended May 31, 2017).
The information required by Item 401 of SEC Regulation S-K concerning the executive officers of Worthington Industries is incorporated herein by reference from the disclosure included under the caption “Supplemental Item – Executive Officers of the Registrant” in Part I of this Annual Report on Form 10-K.
Compliance with Section 16(a) of the Exchange Act
The information required by Item 405 of SEC Regulation S-K is incorporated herein by reference from the disclosure to be included under the caption “SECURITY OWNERSHIP OF CERTAIN BENEFICIAL OWNERS AND MANAGEMENT – Section 16(a) Beneficial Ownership Reporting Compliance” in Worthington Industries’ Definitive 2017 Proxy Statement.
Procedures by which Shareholders may Recommend Nominees to Worthington Industries’ Board of Directors
Information concerning the procedures by which shareholders of Worthington Industries may recommend nominees to Worthington Industries’ Board of Directors is incorporated herein by reference from the disclosure to be included under the captions “PROPOSAL 1: ELECTION OF DIRECTORS – Committees of the Board – Nominating and Governance Committee” and “CORPORATE GOVERNANCE – Nominating Procedures” in Worthington Industries’ Definitive 2017 Proxy Statement. These procedures have not materially changed from those described in Worthington Industries’ definitive Proxy Statement for the 2016 Annual Meeting of Shareholders held on September 29, 2016.
Audit Committee Matters
The information required by Items 407(d)(4) and 407(d)(5) of SEC Regulation S-K is incorporated herein by reference from the disclosure to be included under the caption “PROPOSAL 1: ELECTION OF DIRECTORS –Committees of the Board – Audit Committee” in Worthington Industries’ Definitive 2017 Proxy Statement.
Code of Conduct; Committee Charters; Corporate Governance Guidelines; Charter of Lead Independent Director
Worthington Industries’ Board of Directors has adopted Charters for each of the Audit Committee, the Compensation Committee, the Executive Committee and the Nominating and Governance Committee as well as Corporate Governance Guidelines as contemplated by the applicable sections of the New York Stock Exchange Listed Company Manual. Worthington Industries’ Board of Directors has also adopted a Charter of the Lead Independent Director of Worthington Industries’ Board of Directors.
In accordance with the requirements of Section 303A.10 of the New York Stock Exchange Listed Company Manual, the Board of Directors of Worthington Industries has adopted a Code of Conduct covering the directors, officers and employees of Worthington Industries and its subsidiaries, including Worthington Industries’ Chairman of the Board and Chief Executive Officer (the principal executive officer), Worthington Industries’
110
Table of Contents
Executive Vice President and Chief Financial Officer (the principal financial officer) and Worthington Industries’ Controller (the principal accounting officer). The Registrant will disclose the following events, if they occur, in a current report on Form 8-K to be filed with the SEC within the required four business days following their occurrence: (A) the date and nature of any amendment to a provision of Worthington Industries’ Code of Conduct that (i) applies to Worthington Industries’ principal executive officer, principal financial officer, principal accounting officer or controller, or persons performing similar functions, (ii) relates to any element of the “code of ethics” definition enumerated in Item 406(b) of SEC Regulation S-K, and (iii) is not a technical, administrative or other non-substantive amendment; and (B) a description of any waiver (including the nature of the waiver, the name of the person to whom the waiver was granted and the date of the waiver), including an implicit waiver, from a provision of the Code of Conduct granted to Worthington Industries’ principal executive officer, principal financial officer, principal accounting officer or controller, or persons performing similar functions, that relates to one or more of the elements of the “code of ethics” definition set forth in Item 406(b) of SEC Regulation S-K. In addition, Worthington Industries will disclose any waivers from the provisions of the Code of Conduct granted to a director or an executive officer of Worthington Industries in a current report on Form 8-K to be filed with the SEC within the required four business days following their occurrence.
The text of each of the Charter of the Audit Committee, the Charter of the Compensation Committee, the Charter of the Executive Committee, the Charter of the Nominating and Governance Committee, the Charter of the Lead Independent Director, the Corporate Governance Guidelines and the Code of Conduct is posted on the “Corporate Governance” page of the “Investor Center” section of Worthington Industries’ web site located at www.worthingtonindustries.com. In addition, a copy of the Code of Conduct was filed as Exhibit 14 to Worthington Industries’ Annual Report on Form 10-K for the fiscal year ended May 31, 2012.
Item 11. – Executive Compensation
The information required by Item 402 of SEC Regulation S-K is incorporated herein by reference from the disclosure to be included under the captions “SECURITY OWNERSHIP OF CERTAIN BENEFICIAL OWNERS AND MANAGEMENT,” “EXECUTIVE COMPENSATION” and “COMPENSATION OF DIRECTORS” in Worthington Industries’ Definitive 2017 Proxy Statement.
The information required by Item 407(e)(4) of SEC Regulation S-K is incorporated herein by reference from the disclosure to be included under the caption “CORPORATE GOVERNANCE – Compensation Committee Interlocks and Insider Participation” in Worthington Industries’ Definitive 2017 Proxy Statement.
The information required by Item 407(e)(5) of SEC Regulation S-K is incorporated herein by reference from the disclosure to be included under the caption “EXECUTIVE COMPENSATION – Compensation Committee Report” in Worthington Industries’ Definitive 2017 Proxy Statement.
Item 12. – Security Ownership of Certain Beneficial Owners and Management and Related Stockholder Matters
Ownership of Common Shares of Worthington Industries
The information required by Item 403 of SEC Regulation S-K is incorporated herein by reference from the disclosure to be included under the caption “SECURITY OWNERSHIP OF CERTAIN BENEFICIAL OWNERS AND MANAGEMENT” in Worthington Industries’ Definitive 2017 Proxy Statement.
Equity Compensation Plan Information
The information required by Item 201(d) of SEC Regulation S-K is incorporated herein by reference from the disclosure to be included under the caption “EQUITY COMPENSATION PLAN INFORMATION” in Worthington Industries’ Definitive 2017 Proxy Statement.
Item 13. – Certain Relationships and Related Transactions, and Director Independence
Certain Relationships and Related Person Transactions
The information required by Item 404 of SEC Regulation S-K is incorporated herein by reference from the disclosure in respect of John P. McConnell to be included under the caption “SECURITY OWNERSHIP OF CERTAIN BENEFICIAL OWNERS AND MANAGEMENT” and from the disclosure to be included under the caption “TRANSACTIONS WITH CERTAIN RELATED PERSONS” in Worthington Industries’ Definitive 2017 Proxy Statement.
111
Table of Contents
Director Independence
The information required by Item 407(a) of SEC Regulation S-K is incorporated herein by reference from the disclosure to be included under the captions “CORPORATE GOVERNANCE – Director Independence” and “TRANSACTIONS WITH CERTAIN RELATED PERSONS” in Worthington Industries’ Definitive 2017 Proxy Statement.
Item 14. – Principal Accountant Fees and Services
The information required by this Item 14 is incorporated herein by reference from the disclosure to be included under the captions “AUDIT COMMITTEE MATTERS – Independent Registered Public Accounting Firm Fees” and “AUDIT COMMITTEE MATTERS – Pre-Approval of Services Performed by the Independent Registered Public Accounting Firm” in Worthington Industries’ Definitive 2017 Proxy Statement.
112
Table of Contents
Item 15. – Exhibits and Financial Statement Schedules
| (a) | The following documents are filed as a part of this Annual Report on Form 10-K: |
| (1) | Consolidated Financial Statements: |
The consolidated financial statements (and report thereon) listed below are filed as a part of this Annual Report on Form 10-K:
Report of Independent Registered Public Accounting Firm (KPMG LLP)
Consolidated Balance Sheets as of May 31, 2017 and 2016
Consolidated Statements of Earnings for the fiscal years ended May 31, 2017, 2016 and 2015
Consolidated Statements of Comprehensive Income for the fiscal years ended May 31, 2017, 2016 and 2015
Consolidated Statements of Equity for the fiscal years ended May 31, 2017, 2016 and 2015
Consolidated Statements of Cash Flows for the fiscal years ended May 31, 2017, 2016 and 2015
Notes to Consolidated Financial Statements – fiscal years ended May 31, 2017, 2016 and 2015
| (2) | Financial Statement Schedule: |
Schedule II – Valuation and Qualifying Accounts
All other financial statement schedules for which provision is made in the applicable accounting regulations of the SEC are omitted because they are not required or the required information has been presented in the aforementioned consolidated financial statements or notes thereto.
| (3) | Listing of Exhibits: |
The exhibits listed on the “Index to Exhibits” beginning on page E-1 of this Annual Report on Form 10-K are included with this Annual Report on Form 10-K or incorporated in this Annual Report on Form 10-K by reference as noted in the “Index to Exhibits.” The “Index to Exhibits” specifically identifies each management contract or compensatory plan or arrangement required to be included as an exhibit to this Annual Report on Form 10-K or incorporated in this Annual Report on Form 10-K by reference.
| (b) | Exhibits: The exhibits listed on the “Index to Exhibits” beginning on page E-1 of this Annual Report on Form 10-K are included with this Annual Report on Form 10-K or incorporated in this Annual Report on Form 10-K by reference as noted in the “Index to Exhibits.” |
| (c) | Financial Statement Schedule: The financial statement schedule listed in Item 15(a)(2) above is filed with this Annual Report on Form 10-K. |
113
Table of Contents
Pursuant to the requirements of Section 13 or 15(d) of the Securities Exchange Act of 1934, the Registrant has duly caused this report to be signed on its behalf by the undersigned, thereunto duly authorized.
| WORTHINGTON INDUSTRIES, INC. | ||||||
| Date: July 24, 2017 |
By: | /s/ John P. McConnell | ||||
| John P. McConnell, | ||||||
| Chairman of the Board and Chief Executive Officer | ||||||
Pursuant to the requirements of the Securities Exchange Act of 1934, this report has been signed below by the following persons on behalf of the Registrant and in the capacities and on the date indicated.
| SIGNATURE |
DATE |
TITLE | ||
| /s/ John P. McConnell John P. McConnell |
July 24, 2017 | Director, Chairman of the Board and Chief Executive Officer (Principal Executive Officer) | ||
| /s/ B. Andrew Rose B. Andrew Rose |
July 24, 2017 | Executive Vice President and Chief Financial Officer (Principal Financial Officer) | ||
| /s/ Richard G. Welch |
July 24, 2017 | Controller | ||
| Richard G. Welch |
(Principal Accounting Officer) | |||
| * |
* |
Director | ||
| Kerrii B. Anderson |
||||
| * |
* |
Director | ||
| John B. Blystone |
||||
| * |
* |
Director | ||
| Mark C. Davis |
||||
| * |
* |
Director | ||
| Michael J. Endres |
||||
| * |
* |
Director | ||
| Ozey K. Horton, Jr. |
||||
| * |
* |
Director | ||
| Peter Karmanos, Jr. |
||||
| * |
* |
Director | ||
| Carl A. Nelson, Jr. |
||||
| * |
* |
Director | ||
| Sidney A. Ribeau |
||||
| * |
* | Director | ||
| Mary Schiavo |
||||
*The undersigned, by signing his name hereto, does hereby sign this report on behalf of each of the above-identified directors of the Registrant pursuant to powers of attorney executed by such directors, which powers of attorney are filed with this report within Exhibit 24.
| *By: |
/s/ John P. McConnell |
Date: July 24, 2017 | ||||
| John P. McConnell |
||||||
| Attorney-In-Fact |
114
Table of Contents
| Exhibit
|
Description
|
Location
| ||||
| 2.1 | Agreement and Plan of Merger, dated as of June 2, 2017, by and among Worthington Steel of Michigan, Inc., Worthington Rhode Island Corporation, New AMTROL Holdings, Inc. and Aqua Stockholder Representative, LLC, as Stockholder Representative‡ |
Incorporated herein by reference to Exhibit 2.1 to the Current Report on Form 8-K of Worthington Industries, Inc., an Ohio corporation (the “Registrant”), dated June 6, 2017 and filed with the SEC on the same date (SEC File No. 1-8399) | ||||
| 3.1 | Amended Articles of Incorporation of Worthington Industries, Inc., as filed with the Ohio Secretary of State on October 13, 1998 |
Incorporated herein by reference to Exhibit 3(a) to the Registrant’s Quarterly Report on Form 10-Q for the quarterly period ended August 31, 1998 (SEC File No. 0-4016) | ||||
| 3.2 | Code of Regulations of Worthington Industries, Inc. (reflecting all amendments through the date of this Annual Report on Form 10-K) [This document represents the Code of Regulations of Worthington Industries, Inc. in compiled form incorporating all amendments.] |
Incorporated herein by reference to Exhibit 3(b) to the Registrant’s Quarterly Report on Form 10-Q for the quarterly period ended August 31, 2000 (SEC File No. 1-8399) | ||||
| ‡ | The Disclosure Schedules and Exhibits referenced in the Agreement and plan of Merger have been omitted pursuant to Item 601(b)(2) of SEC Regulation S-K. Worthington Industries, Inc. hereby undertakes to furnish a copy of any of the omitted Disclosure Schedules and Exhibits to the Securities and Exchange Commission upon request. |
E-1
Table of Contents
| 4.1 | Amended and Restated Credit Agreement, dated as of April 23, 2015, among Worthington Industries, Inc., as a Borrower; Worthington Industries International S.à.r.l., as a Borrower; PNC Bank, National Association, as a Lender, the Swingline Lender, an Issuing Bank and Administrative Agent; JPMorgan Chase Bank, N.A., as a Lender, an Issuing Bank and Syndication Agent; Bank of America, N.A.; U.S. Bank National Association; Wells Fargo Bank, National Association; Branch Banking and Trust Company; Fifth Third Bank; The Huntington National Bank; The Northern Trust Company; and Credit Suisse AG, Cayman Islands Branch, as Lenders (collectively with PNC Bank, National Association and JPMorgan Chase Bank, N.A., the “Lenders”); and Citizens Bank of Pennsylvania, as a Departing Lender; with Bank of America, N.A., U.S. Bank National Association and Wells Fargo Bank, National Association serving as Co-Documentation Agents; and J.P. Morgan Securities LLC and PNC Capital Markets LLC serving as Joint Bookrunners and Joint Lead Arrangers |
Incorporated herein by reference to Exhibit 4.1 to the Registrant’s Current Report on Form 8-K dated April 28, 2015 and filed with the SEC on the same date (SEC File No. 1-8399) | ||||
| 4.2 | Indenture, dated as of April 13, 2010, between Worthington Industries, Inc. and U.S. Bank National Association, as Trustee |
Incorporated herein by reference to Exhibit 4.1 to the Registrant’s Current Report on Form 8-K dated April 13, 2010 and filed with the SEC on the same date (SEC File No. 1-8399) | ||||
| 4.3 | First Supplemental Indenture, dated as of April 13, 2010, between Worthington Industries, Inc. and U.S. Bank National Association, as Trustee |
Incorporated herein by reference to Exhibit 4.2 to the Registrant’s Current Report on Form 8-K dated April 13, 2010 and filed with the SEC on the same date (SEC File No. 1-8399) | ||||
| 4.4 | Form of 6.50% Global Note due April 15, 2020 (included as Exhibit A in Exhibit 4.3 to this Annual Report on Form 10-K) |
Incorporated herein by reference to Exhibit 4.2 to the Registrant’s Current Report on Form 8-K dated April 13, 2010 and filed with the SEC on the same date (SEC File No. 1-8399) | ||||
| 4.5 | Second Supplemental Indenture, dated as of April 15, 2014, between Worthington Industries, Inc. and U.S. Bank National Association, as Trustee |
Incorporated herein by reference to Exhibit 4.2 to the Registrant’s Current Report on Form 8-K dated April 15, 2014 and filed with the SEC on the same date (SEC File No. 1-8399) | ||||
| 4.6 | Form of 4.55% Global Note due April 15, 2026 (included as Exhibit A in Exhibit 4.5 to this Annual Report on Form 10-K) |
Incorporated herein by reference to Exhibit 4.2 to the Registrant’s Current Report on Form 8-K dated April 15, 2014 and filed with the SEC on the same date (SEC File No. 1-8399) | ||||
E-2
Table of Contents
| 4.7 | Note Agreement, dated as of August 10, 2012, between Worthington Industries, Inc. and The Prudential Insurance Company of America, Pruco Life Insurance Company of New Jersey, Pruco Life Insurance Company, Prudential Arizona Reinsurance Universal Company, Prudential Annuities Life Assurance Corporation, The Prudential Life Insurance Company, Ltd. and The Gibraltar Life Insurance Co., Ltd. |
Incorporated herein by reference to Exhibit 4.1 to the Registrant’s Current Report on Form 8-K dated August 15, 2012 and filed with the SEC on the same date (SEC File No. 1-8399) | ||||
| 4.8 | Form of 4.60% Senior Note due August 10, 2024 (included as Exhibit A in Exhibit 4.7 to this Annual Report on Form 10-K) |
Incorporated herein by reference to Exhibit 4.1 to the Registrant’s Current Report on Form 8-K dated August 15, 2012 and filed with the SEC on the same date (SEC File No. 1-8399) | ||||
| 4.9 | Amendment No. 1 to Note Agreement, dated June 10, 2015, among Worthington Industries, Inc., on the one hand, and The Prudential Insurance Company of America, Pruco Life Insurance Company of New Jersey, Pruco Life Insurance Company, Prudential Arizona Reinsurance Universal Company, Prudential Annuities Life Assurance Corporation, The Prudential Life Insurance Company, Ltd. and The Gibraltar Life Insurance Co., Ltd., on the other hand |
Incorporated herein by reference to Exhibit 4.9 to the Registrant’s Annual Report on Form 10-K for the fiscal year ended May 31, 2015 (SEC File No. 1-8399) | ||||
| 4.10 | Agreement to furnish instruments and agreements defining rights of holders of long-term debt to the Securities and Exchange Commission upon request |
Filed herewith | ||||
| 10.1 | Worthington Industries, Inc. Non-Qualified Deferred Compensation Plan effective March 1, 2000* |
Incorporated herein by reference to Exhibit 10.1 to the Registrant’s Annual Report on Form 10-K for the fiscal year ended May 31, 2005 (SEC File No. 1-8399) | ||||
| 10.2 | Amendment to the Worthington Industries, Inc. Non-Qualified Deferred Compensation Plan (Amendment effective as of September 1, 2011)* |
Incorporated herein by reference to Exhibit 10.8 to the Registrant’s Quarterly Report on Form 10-Q for the quarterly period ended August 31, 2011 (SEC File No. 1-8399) | ||||
| 10.3 | Second Amendment to the Worthington Industries, Inc. Non-Qualified Deferred Compensation Plan (Second Amendment effective as of October 1, 2014)* |
Incorporated herein by reference to Exhibit 10.3 to the Registrant’s Annual Report on Form 10-K for the fiscal year ended May 31, 2014 (SEC File No. 1-8399) | ||||
| 10.4 | Worthington Industries, Inc. Amended and Restated 2005 Non-Qualified Deferred Compensation Plan (Restatement effective December 2008)* |
Incorporated herein by reference to Exhibit 10.10 to the Registrant’s Quarterly Report on Form 10-Q for the quarterly period ended November 30, 2008 (SEC File No. 1-8399) | ||||
| * | Indicates management contract or compensatory plan or arrangement. |
E-3
Table of Contents
| 10.5 | First Amendment to the Worthington Industries, Inc. Amended and Restated 2005 Non-Qualified Deferred Compensation Plan (First Amendment effective as of September 1, 2011)* |
Incorporated herein by reference to Exhibit 10.9 to the Registrant’s Quarterly Report on Form 10-Q for the quarterly period ended August 31, 2011 (SEC File No. 1-8399) | ||||
| 10.6 | Second Amendment to the Worthington Industries, Inc. Amended and Restated 2005 Non-Qualified Deferred Compensation Plan (Second Amendment effective as of October 1, 2014)* |
Incorporated herein by reference to Exhibit 10.6 to the Registrant’s Annual Report on Form 10-K for the fiscal year ended May 31, 2014 (SEC File No. 1-8399) | ||||
| 10.7 | Worthington Industries, Inc. Deferred Compensation Plan for Directors, as Amended and Restated, effective June 1, 2000* |
Incorporated herein by reference to Exhibit 10(d) to the Registrant’s Annual Report on Form 10-K for the fiscal year ended May 31, 2000 (SEC File No. 1-8399) | ||||
| 10.8 | Amendment to the Worthington Industries, Inc. Deferred Compensation Plan for Directors, as Amended and Restated, effective June 1, 2000 (Amendment effective as of September 1, 2011)* |
Incorporated herein by reference to Exhibit 10.10 to the Registrant’s Quarterly Report on Form 10-Q for the quarterly period ended August 31, 2011 (SEC File No. 1-8399) | ||||
| 10.9 | Second Amendment to the Worthington Industries, Inc. Deferred Compensation Plan for Directors, as Amended and Restated (Second Amendment effective as of October 1, 2014)* |
Incorporated herein by reference to Exhibit 10.9 to the Registrant’s Annual Report on Form 10-K for the fiscal year ended May 31, 2014 (SEC File No. 1-8399) | ||||
| 10.10 | Worthington Industries, Inc. Amended and Restated 2005 Deferred Compensation Plan for Directors (Restatement effective as of December 2008)* |
Incorporated herein by reference to Exhibit 10.5 to the Registrant’s Quarterly Report on Form 10-Q for the quarterly period ended November 30, 2008 (SEC File No. 1-8399) | ||||
| 10.11 | First Amendment to the Worthington Industries, Inc. Amended and Restated 2005 Deferred Compensation Plan for Directors (First Amendment effective as of September 1, 2011)* |
Incorporated herein by reference to Exhibit 10.11 to the Registrant’s Quarterly Report on Form 10-Q for the quarterly period ended August 31, 2011 (SEC File No. 1-8399) | ||||
| 10.12 | Second Amendment to the Worthington Industries, Inc. Amended and Restated 2005 Deferred Compensation Plan for Directors (Second Amendment effective as of October 1, 2014)* |
Incorporated herein by reference to Exhibit 10.12 to the Registrant’s Annual Report on Form 10-K for the fiscal year ended May 31, 2014 (SEC File No. 1-8399) | ||||
| 10.13 | Worthington Industries, Inc. Amended and Restated 1997 Long-Term Incentive Plan (amendment and restatement effective as of November 1, 2008)* |
Incorporated herein by reference to Exhibit 10.8 to the Registrant’s Quarterly Report on Form 10-Q for the quarterly period ended November 30, 2008 (SEC File No. 1-8399) | ||||
| 10.14 | First Amendment to the Worthington Industries, Inc. Amended and Restated 1997 Long-Term Incentive Plan (First Amendment effective as of June 26, 2013; performance goals approved by shareholders on September 26, 2013)* |
Incorporated herein by reference to Exhibit 10.2 to the Registrant’s Current Report on Form 8-K dated October 1, 2013 and filed with the SEC on the same date (SEC File No. 1-8399) | ||||
| * | Indicates management contract or compensatory plan or arrangement. |
E-4
Table of Contents
| 10.15 | Second Amendment to the Worthington Industries, Inc. Amended and Restated 1997 Long-Term Incentive Plan (Second Amendment effective as of September 26, 2013)* |
Incorporated herein by reference to Exhibit 10.3 to the Registrant’s Current Report on Form 8-K dated October 1, 2013 and filed with the SEC on the same date (SEC File No. 1-8399) | ||||
| 10.16 | Third Amendment to the Worthington Industries, Inc. Amended and Restated 1997 Long-Term Incentive Plan (Third Amendment effective as of June 28, 2017)* |
Filed herewith | ||||
| 10.17 | Worthington Industries, Inc. Amended and Restated 1997 Long-Term Incentive Plan (reflects the First Amendment, the Second Amendment and the Third Amendment thereto)* |
Filed herewith | ||||
| 10.18 | Form of Notice of Grant of Stock Options and Option Agreement for non-qualified stock options under the Worthington Industries, Inc. 1997 Long-Term Incentive Plan (now known as the Worthington Industries, Inc. Amended and Restated 1997 Long-Term Incentive Plan)* |
Incorporated herein by reference to Exhibit 10.7 to the Registrant’s Annual Report on Form 10-K for the fiscal year ended May 31, 2010 (SEC File No. 1-8399) | ||||
| 10.19 | Form of Restricted Stock Award Agreement under the Worthington Industries, Inc. Amended and Restated 1997 Long-Term Incentive Plan entered into by Worthington Industries, Inc. prior to June 2013 in order to evidence the grant of restricted stock to employees of Worthington Industries, Inc.* |
Incorporated herein by reference to Exhibit 10.3 to the Registrant’s Quarterly Report on Form 10-Q for the quarterly period ended November 30, 2008 (SEC File No. 1-8399) | ||||
| 10.20 | Form of Letter Evidencing Performance Awards Granted and to be Granted under the Worthington Industries, Inc. Amended and Restated 1997 Long-Term Incentive Plan with targets for three-fiscal-year periods ending on or after May 31, 2015* |
Incorporated herein by reference to Exhibit 10.1 to the Registrant’s Current Report on Form 8-K dated July 2, 2013 and filed with the SEC on the same date (SEC File No. 1-8399) | ||||
| 10.21 | Form of Restricted Stock Award Agreement for awards granted after June 1, 2014 entered into by Worthington Industries, Inc. in order to evidence grants of restricted common shares on and after June 30, 2014 and prior to June 28, 2017, in each case which will vest on the third anniversary of the grant date, subject to the terms thereof and of the Worthington Industries, Inc. Amended and Restated 1997 Long-Term Incentive Plan* |
Incorporated herein by reference to Exhibit 10.1 to the Registrant’s Current Report on Form 8-K dated July 1, 2014 and filed with the SEC on the same date (SEC File No. 1-8399) | ||||
| * | Indicates management contract or compensatory plan or arrangement. |
E-5
Table of Contents
| 10.22 | Form of Restricted Stock Award Agreement for awards granted after June 28, 2017 entered into by Worthington Industries, Inc. in order to evidence the grant, after June 28, 2017, of restricted common shares, in each case which will vest on the fourth anniversary of the grant date, subject to the terms thereof and of the Worthington Industries, Inc. Amended and Restated 1997 Long-Term Incentive Plan* |
Filed herewith | ||||
| 10.23 | Form of Restricted Stock Award Agreement entered into by Worthington Industries, Inc. with Geoffrey G. Gilmore, in order to evidence the grant, effective June 24, 2014, of 25,000 performance-based restricted common shares pursuant to the Worthington Industries, Inc. Amended and Restated 1997 Long-Term Incentive Plan* |
Incorporated herein by reference to Exhibit 10.2 to the Registrant’s Current Report on Form 8-K dated July 1, 2014 and filed with the SEC on the same date (SEC File No. 1-8399) | ||||
| 10.24 | Form of Restricted Stock Award Agreement for awards granted after June 28, 2017 to be entered into by Worthington Industries, Inc. in order to evidence the grant, after June 28, 2017, of restricted common shares, in each case which will vest on the third anniversary of the grant date, subject to the terms thereto and of the Worthington Industries, Inc. Amended and Restated 1997 Long-Term Incentive Plan* |
Filed herewith | ||||
| 10.25 | Worthington Industries, Inc. Amended and Restated 2003 Stock Option Plan (amendment and restatement effective November 1, 2008)* |
Incorporated herein by reference to Exhibit 10.6 to the Registrant’s Quarterly Report on Form 10-Q for the quarterly period ended November 30, 2008 (SEC File No. 1-8399) | ||||
| 10.26 | First Amendment to the Worthington Industries, Inc. Amended and Restated 2003 Stock Option Plan (First Amendment effective September 26, 2013)* |
Incorporated herein by reference to Exhibit 10.6 to the Registrant’s Current Report on Form 8-K dated October 1, 2013 and filed with the SEC on the same date (SEC File No. 1-8399) | ||||
| 10.27 | Second Amendment to the Worthington Industries, Inc. Amended and Restated 2003 Stock Option Plan (Second Amendment effective June 28, 2017)* |
Filed herewith | ||||
| 10.28 | Form of Notice of Grant of Stock Options and Option Agreement for non-qualified stock options granted under the Worthington Industries, Inc. 2003 Stock Option Plan (now known as the Worthington Industries, Inc. Amended and Restated 2003 Stock Option Plan)* |
Incorporated herein by reference to Exhibit 10.14 to the Registrant’s Annual Report on Form 10-K for the fiscal year ended May 31, 2010 (SEC File No. 1-8399) | ||||
| * | Indicates management contract or compensatory plan or arrangement. |
E-6
Table of Contents
| 10.29 | Worthington Industries, Inc. Amended and Restated 2006 Equity Incentive Plan for Non-Employee Directors reflecting the First Amendment and the Second Amendment thereto* |
Incorporated herein by reference to Exhibit 10.1 to the Registrant’s Current Report on Form 8-K dated October 3, 2016 and filed with the SEC on the same day (SEC File No. 1-8399) | ||||
| 10.30 | Form of Nonqualified Stock Option Award Agreement under the Worthington Industries, Inc. 2006 Equity Incentive Plan for Non-Employee Directors (now known as the Worthington Industries, Inc. Amended and Restated 2006 Equity Incentive Plan for Non-Employee Directors) entered into by Worthington Industries, Inc. in order to evidence the grant of nonqualified stock options to non-employee directors of Worthington Industries, Inc. on September 27, 2006 and September 26, 2007* |
Incorporated herein by reference to Exhibit 10.2 to the Registrant’s Current Report on Form 8-K dated October 2, 2006 and filed with the SEC on the same date (SEC File No. 1-8399) | ||||
| 10.31 | Form of Notice of Grant of Stock Options and Option Agreement under the Worthington Industries, Inc. 2006 Equity Incentive Plan for Non-Employee Directors (now known as the Worthington Industries, Inc. Amended and Restated 2006 Equity Incentive Plan for Non-Employee Directors) to evidence the grant of non-qualified stock options to non-employee directors of Worthington Industries, Inc. on and after September 24, 2008* |
Incorporated herein by reference to Exhibit 10.17 to the Registrant’s Annual Report on Form 10-K for the fiscal year ended May 31, 2010 (SEC File No. 1-8399) | ||||
| 10.32 | Form of Restricted Stock Award Agreement under the Worthington Industries, Inc. 2006 Equity Incentive Plan for Non-Employee Directors (now known as the Worthington Industries, Inc. Amended and Restated 2006 Equity Incentive Plan for Non-Employee Directors) entered into by Worthington Industries, Inc. in order to evidence the grant of restricted stock to non-employee directors of Worthington Industries, Inc. on September 24, 2008 and to be entered into by Worthington Industries, Inc. in order to evidence future grants of restricted stock to non-employee directors of Worthington Industries, Inc. * |
Incorporated herein by reference to Exhibit 10.3 to the Registrant’s Quarterly Report on Form 10-Q for the quarterly period ended August 31, 2008 (SEC File No. 1-8399) | ||||
| 10.33 | Worthington Industries, Inc. 2010 Stock Option Plan* |
Incorporated herein by reference to Exhibit 10.1 to the Registrant’s Current Report on Form 8-K dated October 5, 2010 and filed with the SEC on the same date (SEC File No. 1-8399) | ||||
| * | Indicates management contract or compensatory plan or arrangement. |
E-7
Table of Contents
| 10.34 | First Amendment to the Worthington Industries, Inc. 2010 Stock Option Plan (First Amendment effective September 26, 2013)* |
Incorporated herein by reference to Exhibit 10.7 to the Registrant’s Current Report on Form 8-K dated October 1, 2013 and filed with the SEC on the same date (SEC File No. 1-8399) | ||||
| 10.35 | Second Amendment to the Worthington Industries, Inc. 2010 Stock Option Plan (Second Amendment effective as of June 28, 2017)* |
Filed herewith | ||||
| 10.36 | Form of Non-Qualified Stock Option Award Agreement entered into by Worthington Industries, Inc. in order to evidence the grant of non-qualified stock options to executive officers of Worthington Industries, Inc. effective as of June 30, 2011 pursuant to the Worthington Industries, Inc. 2010 Stock Option Plan and to be entered into by Worthington Industries, Inc. in order to evidence future grants of non-qualified stock options to executive officers pursuant to the Worthington Industries, Inc. 2010 Stock Option Plan* |
Incorporated herein by reference to Exhibit 10.1 to the Registrant’s Current Report on Form 8-K dated July 6, 2011 and filed with the SEC on the same date (SEC File No. 1-8399) | ||||
| 10.37 | Worthington Industries, Inc. Annual Incentive Plan for Executives* |
Incorporated herein by reference to Exhibit 10.1 to the Registrant’s Current Report on Form 8-K dated September 30, 2008 and filed with the SEC on the same date (SEC File No. 1-8399) | ||||
| 10.38 | First Amendment to the Worthington Industries, Inc. Annual Incentive Plan for Executives (approved by shareholders on September 26, 2013)* |
Incorporated herein by reference to Exhibit 10.5 to the Registrant’s Current Report on Form 8-K dated October 1, 2013 and filed with the SEC on the same date (SEC File No. 1-8399) | ||||
| 10.39 | Form of Letter Evidencing Cash Performance Bonus Awards Granted and to be Granted under the Worthington Industries, Inc. Annual Incentive Plan for Executives (sometimes also referred to as the Worthington Industries, Inc. Annual Short Term Incentive Plan)* |
Incorporated herein by reference to Exhibit 10.42 to the Registrant’s Annual Report on Form 10-K for the fiscal year ended May 31, 2014 (SEC File No. 1-8399) | ||||
| 10.40 | Receivables Purchase Agreement, dated as of November 30, 2000, among Worthington Receivables Corporation, as Seller, Worthington Industries, Inc., as Servicer, members of various purchaser groups from time to time party to the Receivables Purchase Agreement and PNC Bank, National Association, as Administrator |
Incorporated herein by reference to Exhibit 10(h)(i) to the Registrant’s Annual Report on Form 10-K for the fiscal year ended May 31, 2001 (SEC File No. 1-8399) | ||||
| * | Indicates management contract or compensatory plan or arrangement. |
E-8
Table of Contents
| 10.41 | Amendment No. 1 to Receivables Purchase Agreement, dated as of May 18, 2001, among Worthington Receivables Corporation, as Seller, Worthington Industries, Inc., as Servicer, members of various purchaser groups from time to time party to the Receivables Purchase Agreement and PNC Bank, National Association, as Administrator |
Incorporated herein by reference to Exhibit 10(h)(ii) to the Registrant’s Annual Report on Form 10-K for the fiscal year ended May 31, 2001 (SEC File No. 1-8399) | ||||
| 10.42 | Amendment No. 2 to Receivables Purchase Agreement, dated as of May 31, 2004, among Worthington Receivables Corporation, as Seller, Worthington Industries, Inc., as Servicer, members of various purchaser groups from time to time party to the Receivables Purchase Agreement and PNC Bank, National Association, as Administrator |
Incorporated herein by reference to Exhibit 10(g)(x) to the Registrant’s Annual Report on Form 10-K for the fiscal year ended May 31, 2004 (File No. 1-8399) | ||||
| 10.43 | Amendment No. 3 to Receivables Purchase Agreement, dated as of January 27, 2005, among Worthington Receivables Corporation, as Seller, Worthington Industries, Inc., as Servicer, the members of the various purchaser groups from time to time party to the Receivables Purchase Agreement and PNC Bank, National Association, as Administrator |
Incorporated herein by reference to Exhibit 10.15 to the Registrant’s Annual Report on Form 10-K for the fiscal year ended May 31, 2005 (SEC File No. 1-8399) | ||||
| 10.44 | Amendment No. 4 to Receivables Purchase Agreement, dated as of January 25, 2008, among Worthington Receivables Corporation, as Seller, Worthington Industries, Inc., as Servicer, the members of the various purchaser groups from time to time party to the Receivables Purchase Agreement and PNC Bank, National Association, as Administrator |
Incorporated herein by reference to Exhibit 10.20 to the Registrant’s Annual Report on Form 10-K for the fiscal year ended May 31, 2008 (SEC File No. 1-8399) | ||||
| 10.45 | Amendment No. 5 to Receivables Purchase Agreement, dated as of January 22, 2009, among Worthington Receivables Corporation, as Seller, Worthington Industries, Inc., as Servicer, the members of the various purchaser groups from time to time party to the Receivables Purchase Agreement and PNC Bank, National Association, as Administrator |
Incorporated herein by reference to Exhibit 10.1 to the Registrant’s Quarterly Report on Form 10-Q for the quarterly period ended February 28, 2009 (SEC File No. 1-8399) | ||||
| 10.46 | Amendment No. 6 to Receivables Purchase Agreement, dated as of April 30, 2009, among Worthington Receivables Corporation, as Seller, Worthington Industries, Inc., as Servicer, the members of the various purchaser groups from time to time party to the Receivables Purchase Agreement and PNC Bank, National Association, as Administrator |
Incorporated herein by reference to Exhibit 10.30 to the Registrant’s Annual Report on Form 10-K for the fiscal year ended May 31, 2009 (SEC File No. 1-8399) | ||||
E-9
Table of Contents
| 10.47 | Amendment No. 7 to Receivables Purchase Agreement, dated as of January 21, 2010, among Worthington Receivables Corporation, as Seller, Worthington Industries, Inc., as Servicer, the members of the various purchaser groups from time to time party to the Receivables Purchase Agreement and PNC Bank, National Association, as Administrator |
Incorporated herein by reference to Exhibit 10.1 to the Registrant’s Quarterly Report on Form 10-Q for the quarterly period ended February 28, 2010 (SEC File No. 1-8399) | ||||
| 10.48 | Amendment No. 8 to Receivables Purchase Agreement, dated as of April 16, 2010, among Worthington Receivables Corporation, as Seller, Worthington Industries, Inc., as Servicer, the members of the various purchaser groups from time to time party to the Receivables Purchase Agreement and PNC Bank, National Association, as Administrator |
Incorporated herein by reference to Exhibit 10.30 to the Registrant’s Annual Report on Form 10-K for the fiscal year ended May 31, 2010 (SEC File No. 1-8399) | ||||
| 10.49 | Amendment No. 9 to Receivables Purchase Agreement, dated as of January 20, 2011, among Worthington Receivables Corporation, as Seller, Worthington Industries, Inc., as Servicer, the members of the various purchaser groups from time to time party to the Receivables Purchase Agreement and PNC Bank, National Association, as Administrator |
Incorporated herein by reference to Exhibit 10.1 to the Registrant’s Quarterly Report on Form 10-Q for the quarterly period ended February 28, 2011 (SEC File No. 1-8399) | ||||
| 10.50 | Amendment No. 10 to Receivables Purchase Agreement, dated as of February 28, 2011, among Worthington Receivables Corporation, as Seller, Worthington Industries, Inc., as Servicer, the members of the various purchaser groups from time to time party to the Receivables Purchase Agreement and PNC Bank, National Association, as Administrator |
Incorporated herein by reference to Exhibit 10.2 to the Registrant’s Quarterly Report on Form 10-Q for the quarterly period ended February 28, 2011 (SEC File No. 1-8399) | ||||
| 10.51 | Amendment No. 11 to Receivables Purchase Agreement, dated as of May 6, 2011, among Worthington Receivables Corporation, as Seller, Worthington Industries, Inc., as Servicer, the members of the various purchaser groups from time to time party to the Receivables Purchase Agreement and PNC Bank, National Association, as Administrator |
Incorporated herein by reference to Exhibit 10.36 to the Registrant’s Annual Report on Form 10-K for the fiscal year ended May 31, 2011 (SEC File No. 1-8399) | ||||
| 10.52 | Amendment No. 12 to Receivables Purchase Agreement, dated as of January 19, 2012, among Worthington Receivables Corporation, as Seller, Worthington Industries, Inc., as Servicer, the members of the various purchaser groups from time to time party to the Receivables Purchase Agreement and PNC Bank, National Association, as Administrator |
Incorporated herein by reference to Exhibit 10.1 to the Registrant’s Quarterly Report on Form 10-Q for the quarterly period ended February 29, 2012 (SEC File No. 1-8399) | ||||
E-10
Table of Contents
| 10.53 | Amendment No. 13 to Receivables Purchase Agreement, dated as of January 18, 2013, among Worthington Receivables Corporation, as Seller, Worthington Industries, Inc., as Servicer, the members of the various purchaser groups from time to time party to the Receivables Purchase Agreement and PNC Bank, National Association, as Administrator |
Incorporated herein by reference to Exhibit 10.1 to the Registrant’s Quarterly Report on Form 10-Q for the quarterly period ended February 28, 2013 (SEC File No. 1-8399) | ||||
| 10.54 | Amendment No. 14 to Receivables Purchase Agreement, dated as of July 15, 2013, among Worthington Receivables Corporation, as Seller, Worthington Industries, Inc., as Servicer, the members of the various purchaser groups from time to time party to the Receivables Purchase Agreement and PNC Bank, National Association, as Administrator |
Incorporated herein by reference to Exhibit 10.48 to the Registrant’s Annual Report on Form 10-K for the fiscal year ended May 31, 2013 (SEC File No. 1-8399) | ||||
| 10.55 | Amendment No. 15 to Receivables Purchase Agreement, dated as of October 11, 2013, among Worthington Receivables Corporation, as Seller, Worthington Industries, Inc., as Servicer, the members of the various purchaser groups from time to time party to the Receivables Purchase Agreement and PNC Bank, National Association, as Administrator |
Incorporated herein by reference to Exhibit 10.57 to the Registrant’s Annual Report on Form 10-K for the fiscal year ended May 31, 2015 (SEC File No. 1-8399) | ||||
| 10.56 | Amendment No. 16 to Receivables Purchase Agreement, dated as of May 23, 2014, among Worthington Receivables Corporation, as Seller, Worthington Industries, Inc., as Servicer, the members of the various purchaser groups from time to time party to the Receivables Purchase Agreement and PNC Bank, National Association, as Administrator |
Incorporated herein by reference to Exhibit 10.58 to the Registrant’s Annual Report on Form 10-K for the fiscal year ended May 31, 2015 (SEC File No. 1-8399) | ||||
| 10.57 | Amendment No. 17 to Receivables Purchase Agreement, dated as of January 16, 2015, among Worthington Receivables Corporation, as Seller, Worthington Industries, Inc., as Servicer, the members of the various purchaser groups from time to time party to the Receivables Purchase Agreement and PNC Bank, National Association, as Administrator |
Incorporated herein by reference to Exhibit 10.1 to the Registrant’s Quarterly Report on Form 10-Q for the quarterly period ended February 28, 2015 (SEC File No. 1-8399) | ||||
| 10.58 | Purchase and Sale Agreement, dated as of November 30, 2000, between the various originators listed therein and Worthington Receivables Corporation |
Incorporated herein by reference to Exhibit 10(h)(iii) to the Registrant’s Annual Report on Form 10-K for the fiscal year ended May 31, 2001 (SEC File No. 1-8399) | ||||
| 10.59 | Amendment No. 1, dated as of May 18, 2001, to Purchase and Sale Agreement, dated as of November 30, 2000, between the various originators listed therein and Worthington Receivables Corporation |
Incorporated herein by reference to Exhibit 10(h)(iv) to the Registrant’s Annual Report on Form 10-K for the fiscal year ended May 31, 2001 (File No. 1-8399) | ||||
E-11
Table of Contents
| 10.60 | Amendment No. 2, dated as of August 25, 2006, to Purchase and Sale Agreement, dated as of November 30, 2000, between the various originators listed therein and Worthington Receivables Corporation |
Incorporated herein by reference to Exhibit 10.5 to the Registrant’s Quarterly Report on Form 10-Q for the quarterly period ended August 31, 2006 (SEC File No. 1-8399) | ||||
| 10.61 | Amendment No. 3, dated as of October 1, 2008, to Purchase and Sale Agreement, dated as of November 30, 2000, among the various originators listed therein, Worthington Taylor, Inc. and Worthington Receivables Corporation |
Incorporated herein by reference to Exhibit 10.3 to the Registrant’s Quarterly Report on Form 10-Q for the quarterly period ended February 28, 2011 (SEC File No. 1-8399) | ||||
| 10.62 | Amendment No. 4, dated as of February 28, 2011, to Purchase and Sale Agreement, dated as of November 30, 2000, among the various originators listed therein, Dietrich Industries, Inc. and Worthington Receivables Corporation |
Incorporated herein by reference to Exhibit 10.4 to the Registrant’s Quarterly Report on Form 10-Q for the quarterly period ended February 28, 2011 (SEC File No. 1-8399) | ||||
| 10.63 | Amendment No. 5, dated as of May 6, 2011, to Purchase and Sale Agreement, dated as of November 30, 2000, among the various originators listed therein, The Gerstenslager Company and Worthington Receivables Corporation |
Incorporated herein by reference to Exhibit 10.42 to the Registrant’s Annual Report on Form 10-K for the fiscal year ended May 31, 2011 (SEC File No. 1-8399) | ||||
| 10.64 | Amendment No. 6, dated as of January 19, 2012, to Purchase and Sale Agreement, dated as of November 30, 2000, among the various originators listed therein and Worthington Receivables Corporation |
Incorporated herein by reference to Exhibit 10.2 to the Registrant’s Quarterly Report on Form 10-Q for the quarterly period ended February 29, 2012 (SEC File No. 1-8399) | ||||
| 10.65 | Amendment No. 7, dated as of January 16, 2015, to Purchase and Sale Agreement, dated as of November 30, 2000, among the various originators listed therein, Advanced Component Technologies, Inc., Worthington Cylinders Mississippi, LLC, Worthington Steel of Kentucky, L.L.C., The Worthington Steel Company (North Carolina), and Worthington Receivables Corporation |
Incorporated herein by reference to Exhibit 10.2 to the Registrant’s Quarterly Report on Form 10-Q for the quarterly period ended February 28, 2015 (SEC File No. 1-8399) | ||||
| 10.66 | Amendment No. 8, dated as of February 18, 2015, to Purchase and Sale Agreement, dated as of November 30, 2000, among the various originators listed therein and Worthington Receivables Corporation |
Incorporated herein by reference to Exhibit 10.3 to the Registrant’s Quarterly Report on Form 10-Q for the quarterly period ended February 28, 2015 (SEC File No. 1-8399) | ||||
| 10.67 | Summary of Annual Base Salaries Approved for Named Executive Officers of Worthington Industries, Inc.* |
Filed herewith | ||||
| * | Indicates management contract or compensatory plan or arrangement. |
E-12
Table of Contents
| 10.68 | Summary of Annual Cash Performance Bonus Awards, Long-Term Performance Awards, Stock Options and Restricted Shares granted in Fiscal 2012 for Named Executive Officers* |
Incorporated herein by reference to Exhibit 10.47 to the Registrant’s Annual Report on Form 10-K for the fiscal year ended May 31, 2011 (SEC File No. 1-8399) | ||||
| 10.69 | Summary of Annual Cash Incentive Bonus Awards, Long-Term Performance Awards, Stock Options and Restricted Common Shares granted in Fiscal 2013 for Named Executive Officers* |
Incorporated herein by reference to Exhibit 10.56 to the Registrant’s Annual Report on Form 10-K for the fiscal year ended May 31, 2012 (SEC File No. 1-8399) | ||||
| 10.70 | Summary of Annual Cash Incentive Bonus Awards, Long-Term Performance Awards, Stock Options and Restricted Common Shares granted in Fiscal 2014 for Named Executive Officers* |
Incorporated herein by reference to Exhibit 10.62 to the Registrant’s Annual Report on Form 10-K for the fiscal year ended May 31, 2013 (SEC File No. 1-8399) | ||||
| 10.71 | Summary of Annual Cash Incentive Bonus Awards, Long-Term Performance Awards, Stock Options and Restricted Common Shares granted in Fiscal 2015 for Named Executive Officers* |
Incorporated herein by reference to Exhibit 10.71 to the Registrant’s Annual Report on Form 10-K for the fiscal year ended May 31, 2014 (SEC File No. 1-8399) | ||||
| 10.72 | Summary of Annual Cash Incentive Bonus Awards, Long-Term Performance Awards, Stock Options and Restricted Common Shares granted in Fiscal 2016 for Named Executive Officers* |
Incorporated herein by reference to Exhibit 10.74 to the Registrant’s Annual Report on Form 10-K for the fiscal year ended May 31, 2015 (SEC File No. 1-8399) | ||||
| 10.73 | Summary of Annual Cash Incentive Bonus Awards, Long-Term Performance Awards, Stock Options and Restricted Common Shares granted in Fiscal 2017 for Named Executive Officers* |
Incorporated herein by reference to Exhibit 10.71 to the Registrant’s Annual Report on Form 10-K for the fiscal year ended May 31, 2016 (SEC File No. 1-8399) | ||||
| 10.74 | Summary of Annual Cash Incentive Bonus Awards, Long-Term Performance Awards, Stock Options and Restricted Common Shares granted in Fiscal 2018 for Named Executive Officers* |
Filed herewith | ||||
| 10.75 | Form of Indemnification Agreement entered into between Worthington Industries, Inc. and each executive officer of Worthington Industries, Inc.* |
Incorporated herein by reference to Exhibit 10.33 to the Registrant’s Annual Report on Form 10-K for the fiscal year ended May 31, 2008 (SEC File No. 1-8399) | ||||
| 10.76 | Form of Indemnification Agreement entered into between Worthington Industries, Inc. and each non-employee director of Worthington Industries, Inc.* |
Incorporated herein by reference to Exhibit 10.32 to the Registrant’s Annual Report on Form 10-K for the fiscal year ended May 31, 2008 (SEC File No. 1-8399) | ||||
| 12 | Computation of Ratio of Earnings to Fixed Charges |
Filed herewith | ||||
| 14 | Worthington Industries, Inc. Code of Conduct |
Incorporated herein by reference to Exhibit 14 to the Registrant’s Annual Report on Form 10-K for the fiscal year ended May 31, 2012 (SEC File No. 1-8399) | ||||
| * | Indicates management contract or compensatory plan or arrangement. |
E-13
Table of Contents
| 21 | Subsidiaries of Worthington Industries, Inc. |
Filed herewith | ||||
| 23.1 | Consent of Independent Registered Public Accounting Firm (KPMG LLP) |
Filed herewith | ||||
| 23.2 | Consent of Independent Auditor (KPMG LLP) with respect to consolidated financial statements of Worthington Armstrong Venture |
Filed herewith | ||||
| 24 | Powers of Attorney of Directors and Certain Executive Officers of Worthington Industries, Inc. |
Filed herewith | ||||
| 31.1 | Rule 13a - 14(a) / 15d - 14(a) Certifications (Principal Executive Officer) |
Filed herewith | ||||
| 31.2 | Rule 13a - 14(a) / 15d - 14(a) Certifications (Principal Financial Officer) |
Filed herewith | ||||
| 32.1 | Certifications of Principal Executive Officer Pursuant to 18 U.S.C. Section 1350, as Adopted Pursuant to Section 906 of the Sarbanes-Oxley Act of 2002 |
Furnished herewith | ||||
| 32.2 | Certifications of Principal Financial Officer Pursuant to 18 U.S.C. Section 1350, as Adopted Pursuant to Section 906 of the Sarbanes-Oxley Act of 2002 |
Furnished herewith | ||||
| 99.1 | Worthington Armstrong Venture Consolidated Financial Statements as of December 31, 2016 and 2015 and for the years ended December 31, 2016, 2015 and 2014 |
Incorporated herein by reference to Exhibit 99.1 to the Registrant’s Current Report on Form 8-K dated July 19, 2017 and filed with the SEC on the same date (SEC File No. 1-8399) | ||||
| 101.INS | XBRL Instance Document |
Submitted electronically herewith # | ||
| 101.SCH | XBRL Taxonomy Extension Schema Document | Submitted electronically herewith # | ||
| 101.CAL | XBRL Taxonomy Extension Calculation Linkbase Document | Submitted electronically herewith # | ||
| 101.DEF | XBRL Taxonomy Definition Linkbase Document | Submitted electronically herewith # | ||
| 101.LAB | XBRL Taxonomy Extension Label Linkbase Document | Submitted electronically herewith # | ||
| 101.PRE | XBRL Taxonomy Extension Presentation Linkbase Document | Submitted electronically herewith # | ||
# Attached as Exhibit 101 to this Annual Report on Form 10-K for the fiscal year ended May 31, 2017 of Worthington Industries, Inc. are the following documents formatted in XBRL (eXtensible Business Reporting Language):
| (i) | Consolidated Balance Sheets at May 31, 2017 and 2016; |
E-14
Table of Contents
| (ii) | Consolidated Statements of Earnings for the fiscal years ended May 31, 2017, 2016 and 2015; |
| (iii) | Consolidated Statements of Comprehensive Income for the fiscal years ended May 31, 2017, 2016 and 2015; |
| (iv) | Consolidated Statements of Equity for the fiscal years ended May 31, 2017, 2016 and 2015; |
| (v) | Consolidated Statements of Cash Flows for the fiscal years ended May 31, 2017, 2016 and 2015; and |
| (vi) | Notes to Consolidated Financial Statements – fiscal years ended May 31, 2017, 2016 and 2015. |
E-15