Attached files
Table of Contents

UNITED STATES
SECURITIES AND EXCHANGE COMMISSION
Washington, D.C. 20549
FORM 10-Q
x QUARTERLY REPORT PURSUANT TO SECTION 13 OR 15(d) OF THE SECURITIES EXCHANGE ACT OF 1934
For the quarterly period ended February 28, 2011
OR
| ¨ | TRANSITION REPORT PURSUANT TO SECTION 13 OR 15(d) OF THE SECURITIES EXCHANGE ACT OF 1934 |
For the transition period from to
Commission File Number 001-08399
WORTHINGTON INDUSTRIES, INC.
(Exact name of registrant as specified in its charter)
| Ohio |
31-1189815 | |
| (State or other jurisdiction of incorporation or organization) | (I.R.S. Employer Identification No.) | |
| 200 Old Wilson Bridge Road, Columbus, Ohio |
43085 | |
| (Address of principal executive offices) | (Zip Code) | |
| (614) 438-3210 | ||
| (Registrant’s telephone number, including area code) | ||
| Not applicable | ||
| (Former name, former address and former fiscal year, if changed since last report) | ||
Indicate by check mark whether the registrant (1) has filed all reports required to be filed by Section 13 or 15(d) of the Securities Exchange Act of 1934 during the preceding 12 months (or for such shorter period that the registrant was required to file such reports), and (2) has been subject to such filing requirements for the past 90 days.
YES x NO ¨
Indicate by check mark whether the registrant has submitted electronically and posted on its corporate Web site, if any, every Interactive Data File required to be submitted and posted pursuant to Rule 405 of Regulation S-T (§232.405 of this chapter) during the preceding 12 months (or for such shorter period that the registrant was required to submit and post such files).
YES x NO ¨
Indicate by check mark whether the registrant is a large accelerated filer, an accelerated filer, a non-accelerated filer, or a smaller reporting company. See the definitions of “large accelerated filer,” “accelerated filer” and “smaller reporting company” in Rule 12b-2 of the Exchange Act.
| Large accelerated filer |
x |
Accelerated filer |
¨ | |||
| Non-accelerated filer |
¨ (Do not check if a smaller reporting company) |
Smaller reporting company |
¨ |
Indicate by check mark whether the registrant is a shell company (as defined in Rule 12b-2 of the Exchange Act).
YES ¨ NO x
APPLICABLE ONLY TO CORPORATE ISSUERS:
Indicate the number of shares outstanding of each of the Issuer’s classes of common stock, as of the latest practicable date. On March 31, 2011, the number of Common Shares issued and outstanding was 74,268,614.
Table of Contents
| ii | ||||||
| Item 1. |
||||||
| Consolidated Balance Sheets – |
1 | |||||
| Consolidated Statements of Earnings – |
2 | |||||
| Consolidated Statements of Cash Flows – |
3 | |||||
| 4 | ||||||
| Item 2. |
Management’s Discussion and Analysis of Financial Condition and Results of Operations |
18 | ||||
| Item 3. |
33 | |||||
| Item 4. |
33 | |||||
| Item 1. |
34 | |||||
| Item 1A. |
34 | |||||
| Item 2. |
34 | |||||
| Item 3. |
35 | |||||
| Item 4. |
35 | |||||
| Item 5. |
35 | |||||
| Item 6. |
35 | |||||
| 37 | ||||||
| 38 | ||||||
i
Table of Contents
Selected statements contained in this Quarterly Report on Form 10-Q, including, without limitation, in “PART I – Item 2. –Management’s Discussion and Analysis of Financial Condition and Results of Operations,” constitute “forward-looking statements” as that term is used in the Private Securities Litigation Reform Act of 1995 (the “Act”). Forward-looking statements reflect our current expectations, estimates or projections concerning future results or events. These statements are often identified by the use of forward-looking words or phrases such as “believe,” “expect,” “anticipate,” “may,” “could,” “intend,” “estimate,” “plan,” “foresee,” “likely,” “will,” “should” or other similar words or phrases. These forward-looking statements include, without limitation, statements relating to:
| — | business plans or future or expected growth, performance, sales, volumes, cash flows, earnings, balance sheet strengths, debt, financial condition or other financial measures; |
| — | projected profitability potential, capacity, and working capital needs; |
| — | demand trends for us or our markets; |
| — | pricing trends for raw materials and finished goods and the impact of pricing changes; |
| — | anticipated capital expenditures and asset sales; |
| — | anticipated improvements and efficiencies in costs, operations, sales, inventory management, sourcing and the supply chain and the results thereof; |
| — | the ability to make acquisitions and projected timing, results, benefits, costs, charges and expenditures related to acquisitions, newly-created joint ventures, headcount reductions and facility dispositions, shutdowns and consolidations; |
| — | the alignment of operations with demand; |
| — | the ability to operate profitably and generate cash in down markets; |
| — | the ability to capture and maintain margins and market share and to develop or take advantage of future opportunities, new products and new markets; |
| — | expectations for Company and customer inventories, jobs and orders; |
| — | expectations for the economy and markets or improvements therein; |
| — | expected benefits from transformation plans, cost reduction efforts and other new initiatives; |
| — | expectations for increasing volatility or improving and sustaining earnings, earnings potential, margins or shareholder value; |
| — | effects of judicial rulings; and |
| — | other non-historical matters. |
Because they are based on beliefs, estimates and assumptions, forward-looking statements are inherently subject to risks and uncertainties that could cause actual results to differ materially from those projected. Any number of factors could affect actual results, including, without limitation, those that follow:
| — | the effect of national, regional and worldwide economic conditions generally and within major product markets, including a prolonged or substantial economic downturn; |
| — | the effect of conditions in national and worldwide financial markets; |
| — | product demand and pricing; |
| — | changes in product mix, product substitution and market acceptance of our products; |
| — | fluctuations in pricing, quality or availability of raw materials (particularly steel), supplies, transportation, utilities and other items required by operations; |
| — | effects of facility closures and the consolidation of operations; |
| — | the effect of financial difficulties, consolidation and other changes within the steel, automotive, construction and other industries in which we participate; |
| — | failure to maintain appropriate levels of inventories; |
| — | financial difficulties (including bankruptcy filings) of original equipment manufacturers, end-users and customers, suppliers, joint venture partners and others with whom we do business; |
| — | the ability to realize targeted expense reductions from headcount reductions, facility closures and other cost reduction efforts; |
| — | the ability to realize other cost savings and operational, sales and sourcing improvements and efficiencies, and other expected benefits from transformation initiatives, on a timely basis; |
| — | the overall success of, and the ability to integrate, newly-acquired businesses and achieve synergies and other expected benefits therefrom; |
| — | the overall success of newly-created joint ventures, including the demand for their products, and the ability to achieve the anticipated benefits therefrom; |
| — | capacity levels and efficiencies, within facilities and within the industry as a whole; |
ii
Table of Contents
| — | the effect of disruption in the business of suppliers, customers, facilities and shipping operations due to adverse weather, casualty events, equipment breakdowns, acts of war or terrorist activities or other causes; |
| — | changes in customer demand, inventories, spending patterns, product choices, and supplier choices; |
| — | risks associated with doing business internationally, including economic, political and social instability, foreign currency exposure and the acceptance of our products in new markets; |
| — | the ability to improve and maintain processes and business practices to keep pace with the economic, competitive and technological environment; |
| — | adverse claims experience with respect to worker’s compensation, product recalls or product liability, casualty events or other matters; |
| — | deviation of actual results from estimates and/or assumptions used by us in the application of our significant accounting policies; |
| — | level of imports and import prices in our markets; |
| — | the impact of judicial rulings and governmental regulations, including those adopted by the United States Securities and Exchange Commission and other governmental agencies as contemplated by the Dodd-Frank Wall Street Reform and Consumer Protection Act of 2010, both in the United States and abroad; and |
| — | other risks described from time to time in our filings with the Securities and Exchange Commission, including those described in “PART I – Item 1A. — Risk Factors” of our Annual Report on Form 10-K for the fiscal year ended May 31, 2010. |
We note these factors for investors as contemplated by the Act. It is impossible to predict or identify all potential risk factors. Consequently, you should not consider the foregoing list to be a complete set of all potential risks and uncertainties. Any forward-looking statements in this Quarterly Report on Form 10-Q are based on current information as of the date of this Quarterly Report on Form 10-Q, and we assume no obligation to correct or update any such statements in the future, except as required by applicable law.
iii
Table of Contents
Item 1. – Financial Statements
CONSOLIDATED BALANCE SHEETS
(in thousands)
| February 28, 2011 |
May 31, 2010 |
|||||||
| (unaudited) | ||||||||
| Assets |
||||||||
| Current assets: |
||||||||
| Cash and cash equivalents |
$ | 49,726 | $ | 59,016 | ||||
| Receivables, less allowances of $6,182 and $5,752 at February 28, 2011 and May 31, 2010, respectively |
345,209 | 301,455 | ||||||
| Inventories: |
||||||||
| Raw materials |
177,201 | 177,819 | ||||||
| Work in process |
104,762 | 106,261 | ||||||
| Finished products |
90,608 | 80,251 | ||||||
| Total inventories |
372,571 | 364,331 | ||||||
| Income taxes receivable |
9,713 | 1,443 | ||||||
| Assets held for sale |
- | 2,637 | ||||||
| Deferred income taxes |
23,927 | 21,964 | ||||||
| Prepaid expenses and other current assets |
35,397 | 31,439 | ||||||
| Total current assets |
836,543 | 782,285 | ||||||
| Investments in unconsolidated affiliates |
125,069 | 113,001 | ||||||
| Goodwill |
93,943 | 79,543 | ||||||
| Other intangible assets, net of accumulated amortization of $19,469 and $17,768 at February 28, 2011 and May 31, 2010, respectively |
25,269 | 23,964 | ||||||
| Other assets |
16,591 | 15,391 | ||||||
| Property, plant and equipment, net |
495,628 | 506,163 | ||||||
| Total assets |
$ | 1,593,043 | $ | 1,520,347 | ||||
| Liabilities and equity |
||||||||
| Current liabilities: |
||||||||
| Accounts payable |
$ | 265,803 | $ | 258,730 | ||||
| Short-term borrowings |
80,778 | - | ||||||
| Accrued compensation, contributions to employee benefit plans and related taxes |
52,023 | 62,413 | ||||||
| Dividends payable |
7,424 | 7,932 | ||||||
| Other accrued items |
44,175 | 41,635 | ||||||
| Income taxes payable |
- | 9,092 | ||||||
| Total current liabilities |
450,203 | 379,802 | ||||||
| Other liabilities |
69,851 | 68,380 | ||||||
| Long-term debt |
250,250 | 250,238 | ||||||
| Deferred income taxes |
77,463 | 71,893 | ||||||
| Total liabilities |
847,767 | 770,313 | ||||||
| Shareholders’ equity - controlling interest |
695,250 | 711,413 | ||||||
| Noncontrolling interest |
50,026 | 38,621 | ||||||
| Total equity |
745,276 | 750,034 | ||||||
| Total liabilities and equity |
$ | 1,593,043 | $ | 1,520,347 | ||||
See notes to consolidated financial statements.
1
Table of Contents
CONSOLIDATED STATEMENTS OF EARNINGS
(Unaudited)
(In thousands, except per share data)
| Three Months
Ended February 28, |
Nine Months
Ended February 28, |
|||||||||||||||
| 2011 | 2010 | 2011 | 2010 | |||||||||||||
| Net sales |
$ | 569,439 | $ | 451,113 | $ | 1,766,931 | $ | 1,316,621 | ||||||||
| Cost of goods sold |
481,185 | 393,399 | 1,529,944 | 1,142,474 | ||||||||||||
| Gross margin |
88,254 | 57,714 | 236,987 | 174,147 | ||||||||||||
| Selling, general and administrative expense |
59,769 | 57,519 | 173,518 | 155,642 | ||||||||||||
| Impairment of long-lived assets |
- | 32,706 | - | 35,409 | ||||||||||||
| Restructuring and other expense |
464 | 2,775 | 1,452 | 3,740 | ||||||||||||
| Operating income (loss) |
28,021 | (35,286 | ) | 62,017 | (20,644 | ) | ||||||||||
| Other income (expense): |
||||||||||||||||
| Miscellaneous income (expense) |
(219 | ) | (134 | ) | (356 | ) | 1,236 | |||||||||
| Interest expense |
(4,533 | ) | (1,889 | ) | (14,079 | ) | (6,448 | ) | ||||||||
| Equity in net income of unconsolidated affiliates |
16,958 | 14,560 | 51,470 | 45,842 | ||||||||||||
| Earnings (loss) before income taxes |
40,227 | (22,749 | ) | 99,052 | 19,986 | |||||||||||
| Income tax expense (benefit) |
11,893 | (6,650 | ) | 29,582 | 3,872 | |||||||||||
| Net earnings (loss) |
28,334 | (16,099 | ) | 69,470 | 16,114 | |||||||||||
| Net earnings attributable to noncontrolling interest |
2,008 | 1,641 | 6,321 | 3,930 | ||||||||||||
| Net earnings (loss) attributable to controlling interest |
$ | 26,326 | $ | (17,740 | ) | $ | 63,149 | $ | 12,184 | |||||||
| Basic |
||||||||||||||||
| Average common shares outstanding |
74,171 | 79,146 | 75,306 | 79,102 | ||||||||||||
| Earnings (loss) per share attributable to controlling interest |
$ | 0.35 | $ | (0.22 | ) | $ | 0.84 | $ | 0.15 | |||||||
| Diluted |
||||||||||||||||
| Average common shares outstanding |
75,001 | 79,146 | 75,687 | 79,116 | ||||||||||||
| Earnings (loss) per share attributable to controlling interest |
$ | 0.35 | $ | (0.22 | ) | $ | 0.83 | $ | 0.15 | |||||||
| Common shares outstanding at end of period |
74,195 | 79,175 | 74,195 | 79,175 | ||||||||||||
| Cash dividends declared per share |
$ | 0.10 | $ | 0.10 | $ | 0.30 | $ | 0.30 | ||||||||
See notes to consolidated financial statements.
2
Table of Contents
CONSOLIDATED STATEMENTS OF CASH FLOWS
(Unaudited, in thousands)
| Three Months
Ended February 28, |
Nine Months
Ended February 28, |
|||||||||||||||
| 2011 | 2010 | 2011 | 2010 | |||||||||||||
| Operating activities |
||||||||||||||||
| Net earnings (loss) |
$ | 28,334 | $ | (16,099 | ) | $ | 69,470 | $ | 16,114 | |||||||
| Adjustments to reconcile net earnings (loss) to net cash provided (used) by operating activities: |
||||||||||||||||
| Depreciation and amortization |
15,789 | 16,103 | 47,259 | 48,431 | ||||||||||||
| Impairment of long-lived assets |
- | 32,706 | - | 35,409 | ||||||||||||
| Restructuring and other expense, non-cash |
- | 147 | 225 | 3,247 | ||||||||||||
| Provision for deferred income taxes |
7,778 | (4,870 | ) | 3,314 | (6,173 | ) | ||||||||||
| Bad debt expense (income) |
215 | 967 | 996 | (1,986 | ) | |||||||||||
| Equity in net income of unconsolidated affiliates, net of distributions |
(2,997 | ) | (2,090 | ) | (6,813 | ) | (6,248 | ) | ||||||||
| Net gain on sale of assets |
(1,191 | ) | (115 | ) | (1,521 | ) | (4,407 | ) | ||||||||
| Stock-based compensation |
1,603 | 1,254 | 4,635 | 3,404 | ||||||||||||
| Gain on acquisition |
- | - | - | (891 | ) | |||||||||||
| Changes in assets and liabilities: |
||||||||||||||||
| Receivables |
(24,591 | ) | (17,081 | ) | (39,713 | ) | (11,807 | ) | ||||||||
| Inventories |
(21,601 | ) | (31,438 | ) | 4,729 | (22,040 | ) | |||||||||
| Prepaid expenses and other current assets |
(5,435 | ) | (2,536 | ) | (4,740 | ) | 17,399 | |||||||||
| Other assets |
(2,020 | ) | 112 | (1,212 | ) | 296 | ||||||||||
| Accounts payable and accrued expenses |
68,840 | 8,053 | (25,302 | ) | 47,109 | |||||||||||
| Other liabilities |
354 | 767 | 4,012 | 2,124 | ||||||||||||
| Net cash provided (used) by operating activities |
65,078 | (14,120 | ) | 55,339 | 119,981 | |||||||||||
| Investing activities |
||||||||||||||||
| Investment in property, plant and equipment, net |
(5,101 | ) | (5,638 | ) | (15,911 | ) | (26,592 | ) | ||||||||
| Acquisitions, net of cash acquired |
(19,515 | ) | (30,100 | ) | (31,690 | ) | (64,164 | ) | ||||||||
| Investments in unconsolidated affiliates, net |
- | (568 | ) | - | (304 | ) | ||||||||||
| Proceeds from sale of assets |
183 | 185 | 6,690 | 14,663 | ||||||||||||
| Net cash used by investing activities |
(24,433 | ) | (36,121 | ) | (40,911 | ) | (76,397 | ) | ||||||||
| Financing activities |
||||||||||||||||
| Net proceeds from (repayments of) short-term borrowings |
(42,957 | ) | 63,779 | 80,778 | 119,020 | |||||||||||
| Principal payments on long-term debt |
- | (19,459 | ) | - | (138,010 | ) | ||||||||||
| Proceeds from issuance of common shares |
1,077 | 720 | 2,415 | 2,060 | ||||||||||||
| Payments to noncontrolling interest |
(2,496 | ) | (1,619 | ) | (9,072 | ) | (4,539 | ) | ||||||||
| Repurchase of common shares |
- | - | (75,092 | ) | - | |||||||||||
| Dividends paid |
(7,413 | ) | (7,928 | ) | (22,747 | ) | (23,741 | ) | ||||||||
| Net cash provided (used) by financing activities |
(51,789 | ) | 35,493 | (23,718 | ) | (45,210 | ) | |||||||||
| Decrease in cash and cash equivalents |
(11,144 | ) | (14,748 | ) | (9,290 | ) | (1,626 | ) | ||||||||
| Cash and cash equivalents at beginning of period |
60,870 | 69,441 | 59,016 | 56,319 | ||||||||||||
| Cash and cash equivalents at end of period |
$ | 49,726 | $ | 54,693 | $ | 49,726 | $ | 54,693 | ||||||||
See notes to consolidated financial statements.
3
Table of Contents
NOTES TO CONSOLIDATED FINANCIAL STATEMENTS
Three and Nine Months Ended February 28, 2011 and 2010
(Unaudited)
NOTE A – Basis of Presentation
The accompanying unaudited consolidated financial statements include the accounts of Worthington Industries, Inc. and consolidated subsidiaries (collectively, “we”, “our”, “Worthington” or the “Company”). Investments in unconsolidated affiliates are accounted for using the equity method of accounting. Significant intercompany accounts and transactions have been eliminated.
Spartan Steel Coating, LLC, in which we own a 52% controlling interest, and Worthington Nitin Cylinders Limited, in which we own a 60% controlling interest, are fully consolidated with the equity owned by each other joint venture member shown as noncontrolling interest on the consolidated balance sheets, and each other joint venture member’s portion of net earnings included as net earnings attributable to noncontrolling interest in the consolidated statements of earnings. Refer to “NOTE K - Acquisitions” for additional information regarding our acquisition of Nitin Cylinders Limited.
In June 2009, amended accounting guidance was issued regarding the consolidation of variable-interest entities (“VIEs”). Specifically, this guidance made significant changes to the model for determining the primary beneficiary, if any, of a VIE, and also addresses how often this assessment should be performed. We adopted this amended accounting guidance on June 1, 2010. There was no impact to our consolidated results of operations or financial position upon adoption.
These unaudited consolidated financial statements have been prepared in accordance with accounting principles generally accepted in the United States of America (“GAAP”) for interim financial information and with the instructions to Form 10-Q and Article 10 of Regulation S-X of the Securities and Exchange Commission (“SEC”). Accordingly, they do not include all of the information and notes required by GAAP for complete financial statements. In the opinion of management, all adjustments, which are of a normal and recurring nature, except those which have been disclosed elsewhere in this Quarterly Report on Form 10-Q, necessary for a fair statement of the results of operations of these interim periods, have been included. Operating results for the three and nine months ended February 28, 2011 are not necessarily indicative of the results that may be expected for the fiscal year ending May 31, 2011 (“fiscal 2011”). For further information, refer to the consolidated financial statements and notes thereto included in our Annual Report on Form 10-K for the fiscal year ended May 31, 2010 (the “2010 Form 10-K”).
In the third quarter of fiscal 2011, we changed the presentation of our consolidated statements of cash flows to begin with net earnings instead of net earnings attributable to controlling interest. Prior year amounts have been reclassified to conform to the fiscal 2011 presentation.
The preparation of financial statements in conformity with GAAP requires management to make estimates and assumptions that affect the amounts reported in the financial statements and accompanying notes. Actual results could differ from those estimates.
Recently Issued Accounting Standards
In October 2009, amended accounting guidance was issued for revenue arrangements with multiple deliverables. This amended guidance sets forth requirements that must be met for an entity to recognize revenue from a sale of a delivered item that is part of a multiple-element arrangement when other items have not been delivered. Additionally, the amended guidance will require more disclosure about an entity’s multiple-element arrangements. This amended guidance is effective for fiscal years beginning on or after June 15, 2010, and interim periods within those fiscal years. We do not expect the adoption of this amended accounting guidance, effective for us on June 1, 2011, to have a material impact on our financial position or results of operations.
4
Table of Contents
NOTE B – Segment Operations
Summarized financial information for our reportable segments is shown in the following table:
| Three Months
Ended February 28, |
Nine Months
Ended February 28, |
|||||||||||||||
| (in thousands) | 2011 | 2010 | 2011 | 2010 | ||||||||||||
| Net sales |
||||||||||||||||
| Steel Processing |
$ | 301,752 | $ | 232,219 | $ | 973,763 | $ | 639,362 | ||||||||
| Pressure Cylinders |
135,921 | 116,538 | 408,213 | 322,771 | ||||||||||||
| Metal Framing |
81,382 | 67,517 | 242,970 | 243,529 | ||||||||||||
| Other |
50,384 | 34,839 | 141,985 | 110,959 | ||||||||||||
| Consolidated net sales |
$ | 569,439 | $ | 451,113 | $ | 1,766,931 | $ | 1,316,621 | ||||||||
| Operating income (loss) |
||||||||||||||||
| Steel Processing |
$ | 14,213 | $ | 7,465 | $ | 39,260 | $ | 23,008 | ||||||||
| Pressure Cylinders |
10,849 | 4,095 | 29,926 | 14,072 | ||||||||||||
| Metal Framing |
2,723 | (9,087 | ) | (7,890 | ) | (10,565 | ) | |||||||||
| Other |
236 | (37,759 | ) | 721 | (47,159 | ) | ||||||||||
| Consolidated operating income (loss) |
$ | 28,021 | $ | (35,286 | ) | $ | 62,017 | $ | (20,644 | ) | ||||||
| Pre-tax impairment of long-lived assets and restructuring and other expense (income) |
||||||||||||||||
| Steel Processing |
$ | 70 | $ | 286 | $ | (303 | ) | $ | 461 | |||||||
| Pressure Cylinders |
- | 12 | - | 307 | ||||||||||||
| Metal Framing |
411 | 2,014 | 1,387 | 2,995 | ||||||||||||
| Other |
(17 | ) | 33,169 | 368 | 35,386 | |||||||||||
| Consolidated pre-tax impairment of long-lived assets and restructuring and other expense |
$ | 464 | $ | 35,481 | $ | 1,452 | $ | 39,149 | ||||||||
| (in thousands) | February 28, 2011 |
May 31, 2010 |
||||||
| Total assets |
||||||||
| Steel Processing |
$ | 629,676 | $ | 674,953 | ||||
| Pressure Cylinders |
458,165 | 393,639 | ||||||
| Metal Framing |
181,287 | 203,072 | ||||||
| Other |
323,915 | 248,683 | ||||||
| Consolidated total assets |
$ | 1,593,043 | $ | 1,520,347 | ||||
During the third quarter of fiscal 2011, we made certain organizational changes impacting the internal reporting and management structure of our previously reported Mid-Rise Construction, Military Construction and Commercial Stairs operating segments. As a result of these organizational changes, management responsibilities and internal reporting for these businesses were re-aligned and combined into a single operating segment referred to as the Worthington Global Group (the “Global Group”). The purpose of the Global Group is to develop and implement new organic growth platforms by applying our core competencies in markets that have high growth opportunities. The Global Group will be reported in the “Other” category for segment reporting purposes, as it does not meet the applicable aggregation criteria or materiality thresholds for separate disclosure. Accordingly, these organizational changes did not impact the composition of our reportable segments.
5
Table of Contents
NOTE C – Comprehensive Income
The following table summarizes the allocation of total comprehensive income between controlling and noncontrolling interests for the three and nine months ended February 28, 2011:
| Three Months Ended February 28, 2011 | Nine Months Ended February 28, 2011 | |||||||||||||||||||||||
| (in thousands) | Controlling Interest |
Noncontrolling Interest |
Total | Controlling Interest |
Noncontrolling Interest |
Total | ||||||||||||||||||
| Net earnings |
$ | 26,326 | $ | 2,008 | $ | 28,334 | $ | 63,149 | $ | 6,321 | $ | 69,470 | ||||||||||||
| Other comprehensive income (loss): |
||||||||||||||||||||||||
| Foreign currency translation |
4,314 | - | 4,314 | 9,766 | - | 9,766 | ||||||||||||||||||
| Cash flow hedges |
3,007 | - | 3,007 | 1,230 | - | 1,230 | ||||||||||||||||||
| Pension liability adjustment |
(40 | ) | - | (40 | ) | (28 | ) | - | (28 | ) | ||||||||||||||
| Total comprehensive income |
$ | 33,607 | $ | 2,008 | $ | 35,615 | $ | 74,117 | $ | 6,321 | $ | 80,438 | ||||||||||||
The following table summarizes the allocation of total comprehensive income between controlling and noncontrolling interests for the three and nine months ended February 28, 2010:
| Three Months Ended February 28, 2010 | Nine Months Ended February 28, 2010 | |||||||||||||||||||||||
| (in thousands) | Controlling Interest |
Noncontrolling Interest |
Total | Controlling Interest |
Noncontrolling Interest |
Total | ||||||||||||||||||
| Net earnings (loss) |
$ | (17,740 | ) | $ | 1,641 | $ | (16,099 | ) | $ | 12,184 | $ | 3,930 | $ | 16,114 | ||||||||||
| Other comprehensive income (loss): |
||||||||||||||||||||||||
| Foreign currency translation |
(10,269 | ) | - | (10,269 | ) | (4,465 | ) | - | (4,465 | ) | ||||||||||||||
| Cash flow hedges |
1,230 | - | 1,230 | (438 | ) | - | (438 | ) | ||||||||||||||||
| Pension liability adjustment |
265 | - | 265 | 2,277 | - | 2,277 | ||||||||||||||||||
| Total comprehensive income (loss) |
$ | (26,514 | ) | $ | 1,641 | $ | (24,873 | ) | $ | 9,558 | $ | 3,930 | $ | 13,488 | ||||||||||
NOTE D – Changes in Equity
The following table provides a summary of the changes in total equity, shareholders’ equity attributable to controlling interest, and equity attributable to noncontrolling interest during the nine months ended February 28, 2011:
| Controlling Interest | ||||||||||||||||||||||||
| (in thousands) | Additional Paid-in Capital |
Cumulative Other Comprehensive Income (Loss), Net of Tax |
Retained Earnings |
Total | Non- controlling Interest |
Total | ||||||||||||||||||
| Balance at May 31, 2010 |
$ | 189,918 | $ | (10,631 | ) | $ | 532,126 | $ | 711,413 | $ | 38,621 | $ | 750,034 | |||||||||||
| Comprehensive income* |
- | 10,968 | 63,149 | 74,117 | 6,321 | 80,438 | ||||||||||||||||||
| Acquisition of Nitin Cylinders Limited |
- | - | - | - | 14,156 | 14,156 | ||||||||||||||||||
| Common shares issued |
2,415 | - | - | 2,415 | - | 2,415 | ||||||||||||||||||
| Stock-based compensation |
4,635 | - | - | 4,635 | - | 4,635 | ||||||||||||||||||
| Purchases and retirement of common shares |
(12,662 | ) | - | (62,430 | ) | (75,092 | ) | - | (75,092 | ) | ||||||||||||||
| Dividends paid to noncontrolling interest |
- | - | - | - | (9,072 | ) | (9,072 | ) | ||||||||||||||||
| Cash dividends declared |
- | - | (22,238 | ) | (22,238 | ) | - | (22,238 | ) | |||||||||||||||
| Balance at February 28, 2011 |
$ | 184,306 | $ | 337 | $ | 510,607 | $ | 695,250 | $ | 50,026 | $ | 745,276 | ||||||||||||
| * | The allocation of the components of comprehensive income attributable to controlling and noncontrolling interests is disclosed in “Note C – Comprehensive Income.” |
6
Table of Contents
NOTE E – Stock-Based Compensation
Non-Qualified Stock Options
During the nine months ended February 28, 2011, we granted non-qualified stock options covering a total of 2,409,675 common shares under our stock-based compensation plans. The weighted average option price of $12.17 per share was equal to the weighted average market price of the underlying common shares at the respective grant date. The weighted average fair value of these stock options, based on the Black-Scholes option-pricing model, calculated at the respective grant date, was $4.88 per share. The calculated pre-tax stock-based compensation expense for these stock options, after an estimate for forfeitures, was $9,609,000, which will be recognized on a straight-line basis over the five-year vesting period. The following weighted average assumptions were used to value these stock options:
| Dividend yield |
2.8 | % | ||
| Expected term (years) |
6.0 | |||
| Expected volatility |
53.8 | % | ||
| Risk-free interest rate |
2.1 | % |
The expected volatility is based on the historical volatility of our common shares. The risk-free interest rate is based on the United States Treasury strip rate for the expected term of the stock options. The expected term was developed using historical exercise experience.
Restricted Common Shares
During the nine months ended February 28, 2011, we granted restricted common shares covering a total of 24,650 common shares under our stock-based compensation plans. The fair value per share of $15.03 was equal to the market price of the underlying common shares at the grant date. The calculated pre-tax stock-based compensation expense for these restricted common shares of $371,000 will be recognized on a straight-line basis over their respective vesting periods.
NOTE F – Employee Pension Plans
The following table summarizes the components of net periodic pension cost for our defined benefit plans for the three and nine months ended February 28, 2011 and 2010:
| Three Months
Ended February 28, |
Nine Months
Ended February 28, |
|||||||||||||||
| (in thousands) | 2011 | 2010 | 2011 | 2010 | ||||||||||||
| Defined benefit plans: |
||||||||||||||||
| Service cost |
$ | 238 | $ | 208 | $ | 711 | $ | 625 | ||||||||
| Interest cost |
358 | 354 | 1,070 | 1,065 | ||||||||||||
| Expected return on plan assets |
(333 | ) | (222 | ) | (999 | ) | (665 | ) | ||||||||
| Net amortization and deferral |
64 | 63 | 192 | 190 | ||||||||||||
| Net pension cost of defined benefit plans |
$ | 327 | $ | 403 | $ | 974 | $ | 1,215 | ||||||||
We anticipate total contributions to our pension plans of approximately $1,307,000 in fiscal 2011, of which approximately $1,025,000 had been made as of February 28, 2011.
NOTE G – Income Taxes
Income tax expense for the first nine months of fiscal 2011 and fiscal 2010 reflect estimated annual effective income tax rates of 32.3% and 34.9%, respectively. These rates are prior to the impact of discrete tax adjustments, and are applicable only to net earnings attributable to controlling interest, as reflected in our consolidated statements of earnings. Income tax expense associated with net earnings attributable to noncontrolling interest, and reflected in our consolidated statements of earnings, is not material as a result of the pass-through tax status of our joint ventures. Management is required to estimate the annual effective income tax rate based upon its forecast of annual pre-tax income for domestic and foreign operations. To the extent that actual pre-tax results for the year differ from the forecast estimates applied at the end of the most recent interim period, the actual income tax rate recognized in fiscal 2011 could be materially different from the forecasted rate as of the end of the third quarter of fiscal 2011.
7
Table of Contents
Income tax expense for the first nine months of fiscal 2011 and the first nine months of fiscal 2010 was calculated using the estimated annual effective income tax rates for fiscal 2011 and fiscal 2010, respectively. The change in those estimated annual effective income tax rates is primarily due to the change in the mix of income among the jurisdictions in which we do business and the favorable impact of certain permanent tax expense adjustments.
NOTE H – Investments in Unconsolidated Affiliates
Our investments in affiliated companies that are not controlled, either through majority ownership or otherwise, are accounted for using the equity method. At February 28, 2011, these equity investments and the percentage interests owned consisted of: DMFCWBS, LLC (50%), LEFCO Worthington, LLC (49%), Samuel Steel Pickling Company (31%), Serviacero Planos, S.A. de C.V. (50%), TWB Company, L.L.C. (45%), Worthington Armstrong Venture (“WAVE”) (50%), Worthington Modern Steel Framing Manufacturing Co., Ltd. (“WMSFMCo.”) (40%) and Worthington Specialty Processing (“WSP”) (51%). WSP is considered to be jointly controlled and not consolidated due to the substantive participating rights of the minority partner.
On November 19, 2010, we joined with Hubei Modern Urban Construction and Development Group Co., Ltd. to create WMSFMCo. We will contribute approximately $6,000,000 of cash in exchange for our 40% ownership interest. The purpose of WMSFMCo. is to design, manufacture, assemble and distribute steel framing materials and accessories for construction projects in five Central Chinese provinces and to provide project management and building design and construction supply services thereto. WMSFMCo. is accounted for using the equity method as our ownership interest does not constitute a controlling financial interest.
We received distributions from unconsolidated affiliates totaling $44,657,000 during the nine months ended February 28, 2011. We have received cumulative distributions from WAVE in excess of our investment balance, which resulted in an amount within other liabilities on the consolidated balance sheet of $15,205,000 at February 28, 2011. During the nine months ended February 28, 2011, there were no distributions from unconsolidated joint ventures classified as cash flows from investing activities. During the nine months ended February 28, 2010, the distribution received from WAVE in excess of our cumulative equity in the earnings of that joint venture was $375,000. This cash flow was included in investing activities in the consolidated statements of cash flows due to the nature of the distribution as a return of investment, rather than a return on investment.
8
Table of Contents
Combined financial information for our unconsolidated affiliates is summarized in the following table:
| (in thousands) | February 28, 2011 |
May 31, 2010 |
||||||
| Cash |
$ | 84,827 | $ | 75,762 | ||||
| Other current assets |
215,617 | 199,288 | ||||||
| Noncurrent assets |
170,119 | 170,787 | ||||||
| Total assets |
$ | 470,563 | $ | 445,837 | ||||
| Current liabilities |
$ | 93,448 | $ | 85,514 | ||||
| Long-term debt |
150,201 | 150,212 | ||||||
| Other noncurrent liabilities |
7,830 | 10,244 | ||||||
| Equity |
219,084 | 199,867 | ||||||
| Total liabilities and equity |
$ | 470,563 | $ | 445,837 | ||||
| Three Months
Ended February 28, |
Nine Months
Ended February 28, |
|||||||||||||||
| (in thousands) | 2011 | 2010 | 2011 | 2010 | ||||||||||||
| Net sales |
$ | 201,678 | $ | 169,569 | $ | 625,483 | $ | 505,065 | ||||||||
| Gross margin |
50,797 | 41,222 | 155,995 | 131,756 | ||||||||||||
| Depreciation and amortization |
2,840 | 2,556 | 8,402 | 7,968 | ||||||||||||
| Interest expense |
364 | 356 | 1,147 | 1,088 | ||||||||||||
| Income tax expense |
1,504 | 1,264 | 7,025 | 2,225 | ||||||||||||
| Net earnings |
31,442 | 29,727 | 102,089 | 89,636 | ||||||||||||
NOTE I – Goodwill and Other Long-Lived Assets
We review the carrying value of our long-lived assets, including intangible assets with finite useful lives, for impairment whenever events or changes in circumstances indicate that the carrying value of an asset or asset group may not be recoverable. Impairment testing involves a comparison of the sum of the undiscounted future cash flows of the asset or asset group to its respective carrying amount. If the sum of the undiscounted future cash flows exceeds the carrying amount, then no impairment exists. If the carrying amount exceeds the sum of the undiscounted future cash flows, then a second step is performed to determine the amount of impairment, if any, which would be recorded as an impairment charge in our consolidated statements of earnings. During the third quarter of fiscal 2011, certain indicators of impairment were present with regard to the long-lived assets of our Metal Framing and Steel Packaging operating segments as well as our Spartan joint venture; however, we determined the carrying amount of these asset groups to be recoverable and, therefore, no impairment charges were recorded. There were no other impairment indicators present as of February 28, 2011. During the nine months ended February 28, 2010, certain indicators of impairment were present related to long-lived assets within our Steel Packaging and former Construction Services operating segments resulting in impairment charges of $10,758,000 in our consolidated statements of earnings.
Purchased goodwill and intangible assets with indefinite lives are not amortized, but instead are tested for impairment annually, during the fourth quarter, or more frequently if events or changes in circumstances indicate that impairment may be present. Application of goodwill impairment testing involves judgment, including but not limited to, the identification of reporting units and estimating the fair value of each reporting unit. A reporting unit is defined as an operating segment or one level below an operating segment. We test goodwill at the operating segment level as we have determined that the characteristics of the reporting units within each operating segment are similar and allow for their aggregation in accordance with the applicable accounting guidance.
The goodwill impairment test consists of comparing the fair value of each operating segment, determined using discounted cash flows, to each operating segment’s respective carrying value. If the estimated fair value of an operating segment exceeds its carrying value, there is no impairment. If the carrying amount of the operating segment exceeds its estimated fair value, a goodwill impairment is indicated. The amount of the impairment is determined by comparing the fair value of the net assets of the operating segment,
9
Table of Contents
excluding goodwill, to its estimated fair value, with the difference representing the implied fair value of the goodwill. If the implied fair value of the goodwill is lower than its carrying value, the difference is recorded as an impairment charge in our consolidated statements of earnings. No impairment indicators were present with regard to our goodwill or our indefinite lived intangible assets during the nine months ended February 28, 2011. During the nine months ended February 28, 2010, goodwill impairment indicators existed in our former Construction Services operating segment, resulting in an impairment charge of $24,651,000 in our consolidated statements of earnings.
NOTE J – Restructuring
In fiscal 2008, we initiated a Transformation Plan (the “Plan”) with the overall goal to improve our sustainable earnings potential, asset utilization and operational performance. The Plan focuses on cost reduction, margin expansion and organizational capability improvements, and, in the process, seeks to drive excellence in three core competencies: sales, operations and supply chain management. The Plan is comprehensive in scope and includes aggressive diagnostic and implementation phases in the Steel Processing and Metal Framing operating segments.
During the nine months ended February 28, 2011, the following actions were taken:
| — | Execution of the Plan continued throughout several facilities in the Steel Processing and Metal Framing operating segments resulting in $1,696,000 of expense, which was recorded within restructuring and other expense in our consolidated statements of earnings. |
| — | Impairment and other charges of $829,000 were recognized. These charges included impairment and severance related to the announced closure of the Phoenix, Arizona and the Renton, Washington facilities within Metal Framing, whose operations had previously been suspended, as well as the consolidation of the Metal Framing processing operations from the Hammond, Indiana location into the Warren, Ohio location. These charges were recorded within restructuring and other expense in our consolidated statements of earnings. |
| — | Assets classified as held for sale were disposed of resulting in a net gain of $1,073,000. This gain was recorded within restructuring and other expense in the consolidated statements of earnings. |
A progression of the liabilities created as part of the Plan, combined with a reconciliation to the restructuring and other expense line item in our consolidated statements of earnings for the nine months ended February 28, 2011 is summarized as follows:
| (in thousands) | 5/31/2010 Liability |
Expense | Payments | Adjustments | 2/28/2011 Liability |
|||||||||||||||
| Early retirement and severance |
$ | 893 | $ | 303 | $ | (907 | ) | $ | 6 | $ | 295 | |||||||||
| Other costs |
560 | 1,997 | (2,383 | ) | (172 | ) | 2 | |||||||||||||
| $ | 1,453 | 2,300 | $ | (3,290 | ) | $ | (166 | ) | $ | 297 | ||||||||||
| Non-cash charges |
225 | |||||||||||||||||||
| Net gain on dispositions |
(1,073 | ) | ||||||||||||||||||
| Total |
$ | 1,452 | ||||||||||||||||||
NOTE K – Acquisitions
Nitin Cylinders Limited
On December 28, 2010, we acquired 60% of the net assets of Visakhapatnam, India-based Nitin Cylinders Limited for approximately $21,236,000 in cash to expand our presence in the alternative fuels cylinder market. Upon execution of the purchase agreement, the name of the company was changed to Worthington Nitin Cylinders Limited (“WNCL”), which operates as a consolidated joint venture due to our controlling financial interest. WNCL is a manufacturer of high pressure, seamless steel cylinders for compressed natural gas storage in motor vehicles as well as cylinders for compressed industrial gases.
10
Table of Contents
The assets acquired and liabilities assumed were recognized at their acquisition-date fair values, with goodwill representing the excess of the purchase price over the fair value of the net identifiable assets acquired. In connection with the acquisition of WNCL, we identified and valued the following intangible assets:
| (in thousands) | Average
Life (Years) |
|||||||
| Category |
Amount | |||||||
| Trade name |
$ | 850 | Indefinite | |||||
| Customer relationships |
160 | 15-20 | ||||||
| Other |
230 | 1-10 | ||||||
| Total acquired intangible assets |
$ | 1,240 | ||||||
Cash flows used to determine the purchase price included strategic and synergistic benefits (investment value) specific to us, which resulted in a purchase price in excess of the fair value of identifiable net assets. Since the fair values assigned to the acquired assets could only assume strategies and synergies of market participants, that additional investment value specific to us was included in goodwill. The purchase price included fair values of other assets that were not identifiable, not separately recognizable under accounting rules (e.g., assembled workforce) or of immaterial value. Goodwill of $7,174,000 was recorded in connection with this acquisition, which is not expected to be deductible for income tax purposes.
The following table summarizes the consideration paid for WNCL and the fair value assigned to the assets acquired and liabilities assumed at the acquisition date, as well as the acquisition-date fair value of the noncontrolling interest:
| (in thousands) | ||||
| Cash and cash equivalents |
$ | 1,721 | ||
| Accounts receivable |
2,499 | |||
| Inventories |
9,916 | |||
| Other current assets |
652 | |||
| Intangible assets |
1,240 | |||
| Property, plant and equipment |
14,450 | |||
| Total identifiable assets |
30,478 | |||
| Accounts payable |
(1,227 | ) | ||
| Accrued liabilities |
(41 | ) | ||
| Deferred income taxes |
(992 | ) | ||
| Net identifiable assets |
28,218 | |||
| Goodwill |
7,174 | |||
| Net assets |
35,392 | |||
| Noncontrolling interest |
(14,156 | ) | ||
| Total consideration paid |
$ | 21,236 | ||
Operating results of WNCL have been included in the consolidated statements of earnings from the acquisition date forward. Had the acquisition occurred at the beginning of fiscal 2010, consolidated results of operations would not have differed materially from reported results.
Hy-Mark Cylinders, Inc.
On June 21, 2010, the Pressure Cylinders operating segment acquired the assets of Hy-Mark Cylinders, Inc. (“Hy-Mark”) for cash of $12,175,000. Hy-Mark is a manufacturer of extruded aluminum cylinders for medical oxygen, scuba, beverage service, industrial, specialty, and professional racing applications.
The assets acquired from Hy-Mark were measured and recognized based on their estimated fair values at the date of acquisition, with goodwill representing the excess of the purchase price over the fair value of the net identifiable assets acquired. Intangible assets, consisting mostly of customer lists, will be amortized on a straight-line basis over their estimated useful life of nine years.
Cash flows used to determine the purchase price included strategic and synergistic benefits (investment value) specific to us, which resulted in a purchase price in excess of the fair value of identifiable net assets. Since the fair values assigned to the acquired assets could only assume strategies and synergies of market participants, that additional investment value specific to us was included in goodwill. The purchase price included fair values of other assets that were not identifiable, not separately recognizable under accounting rules (e.g., assembled workforce) or of immaterial value. Goodwill of $4,362,000 was recorded in connection with this acquisition, which is expected to be deductible for income tax purposes.
11
Table of Contents
The following table summarizes the consideration paid for Hy-Mark and the fair value assigned to the assets acquired and liabilities assumed at the acquisition date:
| (in thousands) | ||||
| Inventories |
$ | 3,053 | ||
| Intangible assets |
2,660 | |||
| Property, plant and equipment |
2,100 | |||
| Identifiable net assets |
7,813 | |||
| Goodwill |
4,362 | |||
| Total consideration paid |
$ | 12,175 | ||
Operating results of Hy-Mark have been included in the consolidated statements of earnings from the acquisition date forward. Had the acquisition occurred at the beginning of fiscal 2010, consolidated results of operations would not have differed materially from reported results.
NOTE L – Fair Value
Fair value is defined as the price that would be received to sell an asset or paid to transfer a liability in an orderly transaction between market participants at the measurement date. Fair value is an exit price concept that assumes an orderly transaction between willing market participants and is required to be based on assumptions that market participants would use in pricing an asset or liability. Current accounting guidance establishes a three-tier fair value hierarchy as a basis for considering such assumptions and for classifying the inputs used in the valuation methodologies. This hierarchy requires entities to maximize the use of observable inputs and minimize the use of unobservable inputs. The three levels of inputs used to measure fair values are as follows:
| Level 1 |
– |
Observable prices in active markets for identical assets and liabilities. | ||
| Level 2 |
– |
Observable inputs other than quoted prices in active markets for identical assets and liabilities. | ||
| Level 3 |
– |
Unobservable inputs that are supported by little or no market activity and that are significant to the fair value of the assets and liabilities. |
At February 28, 2011, our financial assets and liabilities measured at fair value on a recurring basis were as follows:
| (in thousands) | Level 1 | Level 2 | Level 3 | Totals | ||||||||||||
| Assets |
||||||||||||||||
| Commodity contracts |
$ | - | $ | 1,907 | $ | - | $ | 1,907 | ||||||||
| Total assets |
$ | - | $ | 1,907 | $ | - | $ | 1,907 | ||||||||
| Liabilities |
||||||||||||||||
| Interest rate contracts |
$ | - | $ | 10,155 | $ | - | $ | 10,155 | ||||||||
| Commodity contracts |
- | 504 | - | 504 | ||||||||||||
| Foreign currency contracts |
- | 67 | - | 67 | ||||||||||||
| Total liabilities |
$ | - | $ | 10,726 | $ | - | $ | 10,726 | ||||||||
The fair value of our foreign currency contracts, commodity contracts and interest rate contracts is based on the present value of the expected future cash flows considering the risks involved, including non-performance risk, and using discount rates appropriate for the respective maturities. Market observable, Level 2 inputs are used to determine the present value of the expected future cash flows. Refer to “NOTE N - Derivative Instruments and Hedging Activities” for additional information regarding our use of derivative instruments.
The carrying amount of our cash and cash equivalents, receivables, income taxes receivable, other assets, deferred income taxes, accounts payable, short-term borrowings, accrued compensation, contributions to employee benefit plans and related taxes, other accrued expenses, income taxes payable and other liabilities approximate their fair value due to their short-term nature. The fair value of our long-term debt, including current maturities, based upon models that incorporate non-performance risk and use market observable inputs, was $264,965,000 and $250,319,000 at February 28, 2011 and May 31, 2010, respectively, compared to carrying values of $250,250,000 and $250,238,000, respectively.
12
Table of Contents
NOTE M – Debt and Receivables Securitization
We had a $435,000,000 multi-year revolving credit facility (the “Facility”) with a group of lenders prior to the expiration of a $35,000,000 commitment of one lender in September 2010. The remaining $400,000,000 Facility matures in May 2013. No borrowings were outstanding under the Facility at February 28, 2011. Additionally, as discussed in “Note O – Guarantees”, we provided $14,650,000 in stand-by letters of credit for third-party beneficiaries as of February 28, 2011. While not drawn against as of February 28, 2011, these letters of credit are issued against availability under the Facility, leaving $385,350,000 available at February 28, 2011.
We also maintain a $100,000,000 revolving trade accounts receivable securitization facility (the “AR Facility”), which expires in January 2012. The AR Facility has been available throughout fiscal 2011 to date, and was available throughout fiscal 2010. Pursuant to the terms of the AR Facility, certain of our subsidiaries sell their accounts receivable without recourse, on a revolving basis, to Worthington Receivables Corporation (“WRC”), a wholly-owned, consolidated, bankruptcy-remote subsidiary. In turn, WRC may sell without recourse, on a revolving basis, up to $100,000,000 of undivided ownership interests in this pool of accounts receivable to a multi-sell, asset-backed commercial paper conduit (the “Conduit”). Purchases by the Conduit are financed with the sale of A1/P1 commercial paper. We retain an undivided interest in this pool and are subject to risk of loss based on the collectability of the receivables from this retained interest. Because the amount eligible to be sold excludes receivables more than 90 days past due, receivables offset by an allowance for doubtful accounts due to bankruptcy or other cause, concentrations over certain limits with specific customers and certain reserve amounts, we believe additional risk of loss is minimal. The book value of the retained portion of the pool of accounts receivable approximates fair value due to its short-term nature. As of February 28, 2011, the pool of eligible accounts receivable exceeded the $100,000,000 limit and $80,000,000 of undivided ownership interests in this pool of accounts receivable had been sold.
In June 2009, amended accounting guidance was issued with respect to the accounting for and disclosure of transfers of financial assets. This amended guidance impacts new transfers of many types of financial assets, including but not limited to factoring arrangements and sales of trade receivables, mortgages and installment loans. We adopted this amended accounting guidance on June 1, 2010. Upon adoption, it was determined that asset transfers to the AR facility no longer qualified for sales treatment. Accordingly, the $80,000,000 in net proceeds received during fiscal 2011 are classified as net proceeds from short-term borrowings in the consolidated statements of cash flows. Asset transfers prior to June 1, 2010, qualified for sales treatment and were therefore recorded as a reduction in the accounts receivable balance. As of May 31, 2010, February 28, 2010 and May 31, 2009, $45,000,000, $90,000,000 and $60,000,000, respectively, in proceeds from the AR Facility were recorded as a reduction in the accounts receivable balance.
NOTE N – Derivative Instruments and Hedging Activities
We utilize derivative financial instruments to manage exposure to certain risks related to our ongoing operations. The primary risks managed through the use of derivative instruments include interest rate risk, currency exchange risk and commodity price risk. We do not use derivative instruments for trading or speculative purposes. While certain of our derivative instruments are designated as hedging instruments, we also enter into derivative instruments that are designed to hedge a risk, but are not designated as hedging instruments and therefore do not qualify for hedge accounting. These derivative instruments are adjusted to current fair value through earnings at the end of each period.
Interest Rate Risk Management – We are exposed to the impact of interest rate changes. Our objective is to manage the impact of interest rate changes on cash flows and the market value of our borrowings. We utilize a mix of debt maturities along with both fixed-rate and variable-rate debt to manage changes in interest rates. In addition, we enter into interest rate swaps to further manage our exposure to interest rate variations related to our borrowings and to lower our overall borrowing costs.
Currency Exchange Risk Management – We conduct business in several major international currencies and are therefore subject to risks associated with changing foreign exchange rates. We enter into various contracts that change in value as foreign exchange rates change to manage this exposure. Such contracts limit exposure to both favorable and unfavorable currency fluctuations. The translation of foreign currencies into United States dollars also subjects us to exposure related to fluctuating exchange rates; however, derivative instruments are not used to manage this risk.
13
Table of Contents
Commodity Price Risk Management – We are exposed to changes in the price of certain commodities, including steel, natural gas, zinc and other raw materials and utility requirements. Our objective is to reduce earnings and cash flow volatility associated with forecasted purchases of these commodities to allow management to focus its attention on business operations. Accordingly, we enter into derivative contracts to manage the price risk associated with these forecasted purchases.
We are exposed to counterparty credit risk on all of our derivative instruments. Accordingly, we have established and maintain strict counterparty credit guidelines and enter into derivative instruments only with major financial institutions. We do not have significant exposure to any one counterparty and management believes the risk of loss is remote and, in any event, would not be material.
Refer to “NOTE L – Fair Value” for additional information regarding the accounting treatment for our derivative instruments, as well as how fair value is determined.
The following table summarizes the fair value of our derivative instruments and the respective line item in which they were recorded in the consolidated balance sheet at February 28, 2011:
| (in thousands) | Location | Value | Location | Value | ||||||||||||
| Derivatives designated as hedging instruments: |
||||||||||||||||
| Interest rate contracts |
Receivables |
$ | - | Accounts payable |
$ | 2,023 | ||||||||||
| Other assets |
- | Other liabilities |
8,132 | |||||||||||||
| - | 10,155 | |||||||||||||||
| Commodity contracts |
Receivables |
1,862 | Accounts payable |
- | ||||||||||||
| 1,862 | - | |||||||||||||||
| Totals |
$ | 1,862 | $ | 10,155 | ||||||||||||
| Derivatives not designated as hedging instruments: |
||||||||||||||||
| Foreign currency contracts |
Receivables |
$ | - | Accounts payable |
$ | 67 | ||||||||||
| - | 67 | |||||||||||||||
| Commodity contracts |
Other assets |
45 | Other accrued items | 504 | ||||||||||||
| 45 | 504 | |||||||||||||||
| Totals |
$ | 45 | $ | 571 | ||||||||||||
| Total derivatives |
$ | 1,907 | $ | 10,726 | ||||||||||||
Cash Flow Hedges
We enter into derivative instruments to hedge our exposure to changes in cash flows attributable to interest rate and commodity price fluctuations associated with certain forecasted transactions. These derivative instruments are designated and qualify as cash flow hedges. Accordingly, the effective portion of the gain or loss on the derivative instrument is reported as a component of other comprehensive income (“OCI”) and reclassified into earnings in the same line item associated with the forecasted transaction and in the same period during which the hedged transaction affects earnings. The ineffective portion of the gain or loss on the derivative instrument is recognized in earnings immediately.
The following table summarizes our cash flow hedges outstanding at February 28, 2011:
| (Dollars in thousands) | Notional Amount |
Maturity Date | ||||||
| Commodity contracts |
$ | 8,600 | November 2011 | |||||
| Interest rate contracts |
100,000 | December 2014 | ||||||
14
Table of Contents
The following table summarizes the gain (loss) recognized in OCI and the gain (loss) reclassified from accumulated OCI into earnings for derivative instruments designated as cash flow hedges during the three months ended February 28, 2011 and 2010:
| (in thousands) | Gain (Loss) Recognized in OCI (Effective Portion) |
Location of Gain (Loss) Reclassified from Accumulated OCI (Effective Portion) |
Gain (Loss) Reclassified from Accumulated OCI (Effective Portion) |
Location of Gain (Loss) (Ineffective Portion) and Excluded from Effectiveness Testing |
Gain (Loss) (Ineffective Portion) and Excluded from Effectiveness Testing |
|||||||||||||||
| For the three months ended February 28, 2011: |
||||||||||||||||||||
| Interest rate contracts |
$ | 1,227 | Interest expense | $ | (1,022 | ) | Interest expense | $ | - | |||||||||||
| Commodity contracts |
2,135 | Cost of goods sold | (215 | ) | Cost of goods sold | - | ||||||||||||||
| Totals |
$ | 3,362 | $ | (1,237 | ) | $ | - | |||||||||||||
| For the three months ended February 28, 2010: |
||||||||||||||||||||
| Interest rate contracts |
$ | 181 | Interest expense | $ | (971 | ) | Interest expense | $ | - | |||||||||||
| Commodity contracts |
674 | Cost of goods sold | - | Cost of goods sold | 95 | |||||||||||||||
| Totals |
$ | 855 | $ | (971 | ) | $ | 95 | |||||||||||||
The following table summarizes the gain (loss) recognized in OCI and the gain (loss) reclassified from accumulated OCI into earnings for derivative instruments designated as cash flow hedges during the nine months ended February 28, 2011 and 2010:
| (in thousands) | Gain (Loss) Recognized in OCI (Effective Portion) |
Location of Gain (Loss) Reclassified from Accumulated OCI (Effective Portion) |
Gain (Loss) Reclassified from Accumulated OCI (Effective Portion) |
Location of Gain (Loss) (Ineffective Portion) and Excluded from Effectiveness Testing |
Gain (Loss) (Ineffective Portion) and Excluded from Effectiveness Testing |
|||||||||||||||
| For the nine months ended February 28, 2011: |
||||||||||||||||||||
| Interest rate contracts |
$ | (3,481 | ) | Interest expense | $ | (2,986 | ) | Interest expense | $ | - | ||||||||||
| Commodity contracts |
1,374 | Cost of goods sold | (86 | ) | Cost of goods sold | - | ||||||||||||||
| Totals |
$ | (2,107 | ) | $ | (3,072 | ) | $ | - | ||||||||||||
| For the nine months ended February 28, 2010: |
||||||||||||||||||||
| Interest rate contracts |
$ | (4,027 | ) | Interest expense | $ | (2,597 | ) | Interest expense | $ | - | ||||||||||
| Commodity contracts |
674 | Cost of goods sold | - | Cost of goods sold | 95 | |||||||||||||||
| Totals |
$ | (3,353 | ) | $ | (2,597 | ) | $ | 95 | ||||||||||||
The estimated net amount of the losses in accumulated other comprehensive income at February 28, 2011 expected to be reclassified into net earnings within the succeeding twelve months is $1,339,000 (net of tax of $820,000). This amount was computed using the fair value of the cash flow hedges at February 28, 2011, and will change before actual reclassification from other comprehensive income to net earnings during the fiscal years ending May 31, 2011 and 2012.
Economic (Non-designated) Hedges
We enter into foreign currency contracts to manage our foreign exchange exposure related to inter-company and financing transactions that do not meet the requirements for hedge accounting treatment. We also enter into certain commodity contracts that do not qualify for hedge accounting treatment. Accordingly, these derivative instruments are adjusted to current market value at the end of each period through earnings.
15
Table of Contents
The following table summarizes our economic (non-designated) derivative instruments outstanding at February 28, 2011:
| (Dollars in thousands) | Notional Amount |
Maturity Date(s) | ||||
| Commodity contracts |
$ | 9,600 | March 2011 - August 2012 | |||
| Foreign currency contracts |
48,300 | May 2011 | ||||
The following table summarizes the gain (loss) recognized in earnings for economic (non-designated) derivative financial instruments during the three months ended February 28, 2011 and 2010:
| Location of Gain (Loss) | Gain (Loss) Recognized in Earnings for the Three Months Ended February 28, |
|||||||||||
| (in thousands) | Recognized in Earnings | 2011 | 2010 | |||||||||
| Commodity contracts |
Cost of goods sold | $ | 619 | $ | 24 | |||||||
| Foreign currency contracts |
Miscellaneous expense | (2,912 | ) | 4,524 | ||||||||
| Total |
$ | (2,293 | ) | $ | 4,548 | |||||||
The following table summarizes the gain (loss) recognized in earnings for economic (non-designated) derivative financial instruments during the nine months ended February 28, 2011 and 2010:
| Location of Gain (Loss) | Gain (Loss) Recognized in Earnings for the Nine Months Ended February 28, |
|||||||||||
| (in thousands) | Recognized in Earnings | 2011 | 2010 | |||||||||
| Commodity contracts |
Cost of goods sold | $ | (795 | ) | $ | 24 | ||||||
| Foreign currency contracts |
Miscellaneous expense | (5,247 | ) | 1,478 | ||||||||
| Total |
$ | (6,042 | ) | $ | 1,502 | |||||||
The gain (loss) on these derivatives significantly offset the gain (loss) on the hedged items.
NOTE O – Guarantees
We do not have guarantees that we believe are reasonably likely to have a material effect on our current or future financial condition, changes in financial condition, revenue or expenses, results of operations, liquidity, capital expenditures or capital resources. However, as of February 28, 2011, we were party to an operating lease for an aircraft in which we have guaranteed a residual value at the termination of the lease. The maximum obligation under the terms of this guarantee was approximately $14,667,000 at February 28, 2011. Based on current facts and circumstances, we have estimated the likelihood of payment pursuant to this guarantee, and determined that the fair value of the obligation based on those likely outcomes is not material.
We also had in place $14,650,000 of outstanding stand-by letters of credit as of February 28, 2011. These letters of credit were issued to third-party service providers and had no amounts drawn against them at February 28, 2011. The fair value of these guarantee instruments, based on premiums paid, was not material at February 28, 2011.
NOTE P – Warranties
We have established reserves for anticipated sales returns and allowances, including limited warranties on certain products. The liability for sales returns and allowances is primarily based on historical experience and current information. The liability amounts related to warranties were immaterial at February 28, 2011 and May 31, 2010, respectively.
16
Table of Contents
NOTE Q – Contingent Liabilities
We are involved in an ongoing dispute with a former customer (the “Plaintiff”). The dispute relates primarily to our early termination of a three-year supply contract (the “Contract”) on March 1, 2007 as a result of certain actions taken by the Plaintiff that we believed breached the Contract, and the resulting price increases charged to the Plaintiff during 2007 and 2008 after such early termination. During the third quarter of fiscal 2010, this dispute was litigated and a jury awarded contract damages relating to the price increases and other items to the Plaintiff of approximately $13,002,000.
During the second quarter of fiscal 2011, the trial judge ruled on various post-trial motions that had been filed by the parties, and awarded the Plaintiff pre-judgment interest of $1,828,000 and attorneys’ fees and costs of $970,000. This additional award exceeded the amount anticipated by us by approximately $1,400,000.
As a result of the post-trial rulings, an additional pre-tax charge to selling, general and administrative expense of $1,400,000 was recorded within the Pressure Cylinders operating segment, increasing our reserves related to this matter to $14,402,000. We believe we have numerous grounds to appeal the verdict in this matter, and are pursuing such an appeal.
We are defendants in certain other legal actions. In the opinion of management, the outcome of these actions, which is not clearly determinable at the present time, would not significantly affect our consolidated financial position or future results of operations. We also believe that environmental issues will not have a material effect on our capital expenditures, consolidated financial position or future results of operations.
NOTE R – Subsequent Events
On March 1, 2011, we executed an agreement with Marubeni-Itochu Steel America Inc. (“MISA”) to combine certain assets of our Metal Framing operating segment and ClarkWestern Building Systems in a newly-formed joint venture. In connection with this exchange transaction, we received a 25% interest in the new joint venture, to be known as ClarkDietrich Building Systems LLC, as well as the assets of three MISA Metals, Inc. steel processing locations. As we will not have a controlling financial interest in the new joint venture, we will account for our ownership interest using the equity method. The steel processing assets will be reported under our Steel Processing operating segment.
Our contribution to the new joint venture will consist of all of our metal framing business and related working capital including six of the 13 facilities. We will retain and operate the remaining seven facilities only to support the transition of the business into the new joint venture. Following this brief transition period, we will dispose of these assets. As disclosed in “NOTE I – Goodwill and Other Long-Lived Assets,” during the third quarter of fiscal 2011, we tested the long-lived assets of our metal framing business for impairment. As the carrying value of the combined asset group was determined to be recoverable based on the test, we concluded that there was no impairment to be recognized at February 28, 2011.
On March 1, 2011, as the agreement was signed and the assets were contributed to the new joint venture, we initiated an impairment evaluation of the metal framing assets retained in accordance with the applicable accounting guidance. Although this evaluation is not finalized, we expect to record an impairment charge related to these assets in the fourth quarter of fiscal 2011. Furthermore, preliminary valuations indicate that the fair value of the assets received exceeds the carrying value of the metal framing assets contributed to the joint venture, resulting in a gain on the exchange transaction. This gain will also be recognized in the fourth quarter of fiscal 2011.
We also expect to incur approximately $12,400,000 of restructuring charges, consisting primarily of employee severance, lease expenses and post-closure facility costs, as a result of the closure of the seven retained metal framing facilities. These restructuring charges are expected to be recognized primarily in the fourth quarter of fiscal 2011.
On March 18, 2011, we joined with Gestamp Renewables to create Gestamp Worthington Wind Steel, LLC. We will contribute $9,500,000 in cash in exchange for our 50% ownership interest, which will be accounted for under the equity method as it does not constitute a controlling financial interest. The joint venture will focus on producing towers for wind turbines being constructed in the North American market.
17
Table of Contents
Item 2. – Management’s Discussion and Analysis of Financial Condition and Results of Operations
Selected statements contained in this “Item 2. – Management’s Discussion and Analysis of Financial Condition and Results of Operations” constitute “forward-looking statements” as that term is used in the Private Securities Litigation Reform Act of 1995. Such forward-looking statements are based, in whole or in part, on management’s beliefs, estimates, assumptions and currently available information. For a more detailed discussion of what constitutes a forward-looking statement and of some of the factors that could cause actual results to differ materially from such forward-looking statements, please refer to the “Safe Harbor Statement” in the beginning of this Quarterly Report on Form 10-Q and “Part I – Item 1A. – Risk Factors” of our Annual Report on Form 10-K for the fiscal year ended May 31, 2010.
Introduction
The following discussion and analysis of market and industry trends, business strategy, and the results of operations and financial position of Worthington Industries, Inc., together with its subsidiaries (collectively, “we,” “our,” “Worthington,” or our “Company”), should be read in conjunction with our consolidated financial statements included in “Item 1. – Financial Statements” of this Quarterly Report on Form 10-Q. Our Annual Report on Form 10-K for the fiscal year ended May 31, 2010 (“fiscal 2010”) includes additional information about us, our operations and our financial position and should be read in conjunction with this Quarterly Report on Form 10-Q.
We are primarily a diversified metal processing company, focused on value-added steel processing and manufactured metal products. As of February 28, 2011, excluding our joint ventures, we operated 41 manufacturing facilities worldwide, principally in three reportable business segments: Steel Processing, Pressure Cylinders, and Metal Framing. Other operating segments, which are immaterial for purposes of separate disclosure, include Automotive Body Panels, Steel Packaging, and the Worthington Global Group (the “Global Group”). We also held equity positions in ten joint ventures, which operated 26 manufacturing facilities worldwide, as of February 28, 2011.
Refer to the “Recent Company Developments” section below for further information regarding the formation of the Global Group operating segment during the third quarter of fiscal 2011.
Overview
During the three months ended February 28, 2011 (“the third quarter of fiscal 2011”), the Company continued to benefit from the strengthening of the automotive market as well as improving overall general economic conditions both domestically and internationally. Although the construction market remains depressed compared to historical norms, there has been a break from further erosion and some signs of stability. Recent acquisitions by both the Steel Processing and Pressure Cylinders operating segments have produced solid results and proven complementary to our business. The Transformation Plan efforts have enhanced efficiencies at our facilities and positioned us to respond more quickly to current and future opportunities and challenges.
The Company also benefited from inventory holding gains as our selling prices increased to cover the 55% increase in the market price of steel during the current quarter, while steel purchased at a lower cost in prior periods flowed through cost of goods sold, improving the spread between average selling prices and the cost of steel. The prior year quarter also benefited from inventory holding gains as the market price of steel increased 14% during that quarter.
Recent Company Developments
We have closed on several strategic initiatives since the beginning of the third quarter of fiscal 2011. These include the following:
| — | The Company created the Global Group operating segment charged with developing and implementing new organic growth platforms, by applying our core competencies in markets that have high growth opportunities. The first set of initiatives includes expansion of high density mid-rise residential construction in emerging international markets and development of new business in sectors such as renewable energy. The Global Group, which includes our former Mid-Rise Construction, Military Construction and Commercial Stairs operating segments, is included in the “Other” category for segment reporting purposes. |
18
Table of Contents
| — | On December 28, 2010, we acquired 60% of the net assets of Nitin Cylinders Limited, which is now Worthington Nitin Cylinders Limited (“WNCL”). WNCL is a manufacturer of high pressure, seamless steel cylinders for compressed natural gas storage in motor vehicles and cylinders for compressed industrial gases. The results of this joint venture are consolidated in the Pressure Cylinders operating segment. For the third quarter of fiscal 2011, the joint venture contributed $2.0 million in consolidated net sales. See “Item 1. – Financial Statements – Notes to Consolidated Financial Statements – Note K – Acquisitions” of this Quarterly Report on Form 10-Q for more information. |
| — | On January 4, 2011, we announced the creation of a joint venture with Hubei Modern Urban Construction & Development Group Co., Ltd. (“HMUCG”) of China to manufacture light gauge steel framing products and to design, engineer, and supply light gauge steel-framed mid-rise residential buildings in five Central Chinese provinces. This 40%-owned joint venture will be unconsolidated and known as Worthington Modern Steel Framing Manufacturing Co., Ltd. |
| — | On February 15, 2011, the Global Group signed a memorandum of understanding with Gestamp Renewables group to create a 50-50 joint venture which will focus on producing towers for wind turbines being constructed in North America. The joint venture agreement was signed on March 18, 2011. This unconsolidated joint venture, to be known as Gestamp Worthington Wind Steel, LLC, has identified Cheyenne, Wyoming as the site of the initial production facility. |
| — | On February 22, 2011, we announced an agreement in principle with Marubeni-Itochu Steel America Inc. (“MISA”) to combine certain assets of our Metal Framing operating segment and ClarkWestern Building Systems in a newly-formed joint venture. The transaction closed effective March 1, 2011. In the asset exchange, structured as a cashless transaction with the exception of working capital adjustments and other transition payments, we received a 25% interest in the new joint venture, ClarkDietrich Building Systems LLC, as well as the assets of three MISA Metals Inc. steel processing locations. The joint venture will be unconsolidated and the steel processing assets and locations will be reported under our Steel Processing operating segment. |
Market & Industry Overview
The automotive industry is one of the largest consumers of flat-rolled steel, and thus the largest end market for our Steel Processing operating segment. Roughly half of the sales of our Steel Processing operating segment, and substantially all of the sales of our Automotive Body Panels operating segment, are to the automotive market. North American vehicle production, primarily by Chrysler, Ford and General Motors (the “Detroit Three automakers”), has a considerable impact on the sales volume of the customers within these two segments. Our sales volume in the Steel Processing and Automotive Body Panels operating segments are also impacted by the market price of steel and, to a lesser extent, the market prices of other commodities used in their operations, such as zinc, natural gas and diesel fuel. The majority of the sales from five of our unconsolidated joint ventures are also made to the automotive end market, but those sales are not included in our consolidated results. Adding our ownership percentage of the sales from each of our unconsolidated joint ventures to our reported sales would not materially change the breakdown in the chart below.
On a cautionary note, it is anticipated that the damage and disruptions caused by the earthquake and resulting tsunami, which struck Japan on March 11, 2011, may negatively impact many of the markets we serve. It is too early to determine how deep or how long the impact will be on each of these markets. We are monitoring the situation and are prepared to act as outcomes become clearer.
19
Table of Contents
Our sales breakdown by end user market is illustrated by the following chart:
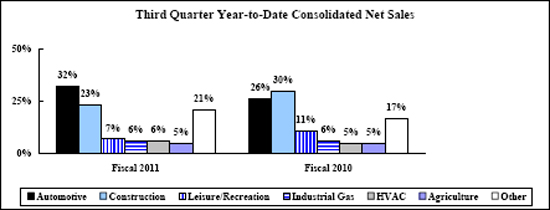
Substantially all of the sales of our Metal Framing and Global Group operating segments, as well as approximately 12% of the sales of our Steel Processing operating segment, are to the construction market, both residential and non-residential. We estimate that approximately 12% of our construction market sales are to the residential market. While the market price of steel significantly impacts this business, there are other key indicators that are meaningful in analyzing construction market demand including U.S. gross domestic product (“GDP”), the Dodge Index of construction contracts, and trends in the relative price of framing lumber and steel. Construction/remodel is also the predominant end market for our joint venture, Worthington Armstrong Venture (“WAVE”), whose sales are not included in our consolidated operating income.
The sales of our Pressure Cylinders and Steel Packaging operating segments, and approximately 38% of the sales of our Steel Processing operating segment, are to other markets such as leisure and recreation, industrial gas, HVAC, agriculture, appliance, lawn and garden, and consumer specialty products. Given the many different products that make up these sales and the wide variety of end markets, it is very difficult to detail the key market indicators that drive this portion of our business. However, we believe that the trend in U.S. GDP growth is a good economic indicator for analyzing these operating segments.
We use the following information to monitor our costs and major end markets:
| Three Months Ended |
Nine Months Ended |
|||||||||||||||||||||||
| February 28, | February 28, | |||||||||||||||||||||||
| 2011 | 2010 | Inc / (Dec) | 2011 | 2010 | Inc / (Dec) | |||||||||||||||||||
| U.S. GDP (% growth year-over-year) 1 |
1.1 | % | 1.7 | % | (0.6 | %) | 1.8 | % | (0.7 | %) | 2.5 | % | ||||||||||||
| Hot-Rolled Steel ($ per ton) 2 |
$ | 699 | $ | 549 | $ | 150 | $ | 622 | $ | 509 | $ | 113 | ||||||||||||
| Detroit Three Auto Build (000’s vehicles) 3 |
1,657 | 1,475 | 182 | 5,214 | 4,095 | 1,119 | ||||||||||||||||||
| No. America Auto Build (000’s vehicles) 3 |
2,943 | 2,643 | 300 | 9,229 | 7,563 | 1,666 | ||||||||||||||||||
| Dodge Index |
90 | 90 | — | 87 | 89 | (2 | ) | |||||||||||||||||
| Framing Lumber ($ per 1,000 board ft) 4 |
$ | 294 | $ | 277 | $ | 17 | $ | 269 | $ | 250 | $ | 19 | ||||||||||||
| Zinc ($ per pound) 5 |
$ | 1.08 | $ | 1.05 | $ | 0.03 | $ | 0.99 | $ | 0.91 | $ | 0.08 | ||||||||||||
| Natural Gas ($ per mcf) 6 |
$ | 4.27 | $ | 5.41 | ($ | 1.14 | ) | $ | 4.21 | $ | 4.41 | ($ | 0.20 | ) | ||||||||||
| On-Highway Diesel Fuel Prices ($ per gallon) 7 |
$ | 3.36 | $ | 2.79 | $ | 0.57 | $ | 3.12 | $ | 2.69 | $ | 0.43 | ||||||||||||
| 1 | 2010 figures based on revised actuals 2 CRU Index; period average 3 CSM Autobase 4 Random Lengths; period average |
| 5 | LME Zinc; period average 6 NYMEX Henry Hub Natural Gas; period average 7 Energy Information Administration; period average |
U.S. GDP growth rate trends are generally indicative of the strength in demand and, in many cases, pricing for our products. A year-over-year increase in U.S. GDP growth rates is indicative of a stronger economy, which generally increases demand and pricing for our products. The third quarter of fiscal 2011 is the fifth quarter in a row of positive year-over-year change in U.S. GDP. Conversely, decreasing U.S. GDP growth rates generally indicate the opposite effect, which we experienced in the first half of fiscal 2010. Changes in U.S. GDP growth rates can also signal changes in conversion costs related to production and in selling, general and administrative (“SG&A”) expenses.
20
Table of Contents
The market price of hot-rolled steel is one of the most significant factors impacting our selling prices and operating results. In a rising price environment, our results are generally favorably impacted as lower-priced material, purchased in previous periods, flows through cost of goods sold, while our selling prices increase at a faster pace to cover current replacement costs. On the other hand, when steel prices fall, we typically have higher-priced material flowing through cost of goods sold, while selling prices compress to what the market will bear, negatively impacting our results. This creates what we refer to as inventory holding gains or losses.
No single customer contributed more than 10% of our consolidated net sales during the third quarter of fiscal 2011. While our automotive business is largely driven by the production schedules of the Detroit Three automakers, our customer base is much broader and includes new domestic manufacturers and many of their suppliers. Automotive production from the Detroit Three automakers strengthened in calendar 2010 and continues to do so in calendar 2011. Vehicle production for the Detroit Three automakers for the first nine months of fiscal 2011 was up 27% over the same nine months in the prior fiscal year. Additionally, North American vehicle production for the first nine months of fiscal 2011 was up 22% against the prior nine months ended February 28.
The Dodge Index represents the value of total construction contracts, including residential and non-residential building construction. This overall index serves as a broad indicator of the construction markets in which we participate, as it tracks actual construction starts. This index continues to remain at historical lows due to the recession and global financial crisis which began more than two years ago. The relative price of framing lumber, an alternative construction material against which we compete, can also affect our Metal Framing operating segment, as certain applications may permit the use of this alternative building material.
The market prices of certain other commodities such as zinc, natural gas and diesel fuel represent a significant portion of our cost of goods sold, both directly through our plant operations and indirectly through transportation and freight expense.
Results of Operations
Third Quarter – Fiscal 2011 Compared to Fiscal 2010
Consolidated Operations
The following table presents consolidated operating results for the periods indicated:
| Three Months Ended February 28, | ||||||||||||||||||||
| (Dollars in millions) | 2011 | % of Net sales |
2010 | % of Net sales |
Increase/ (Decrease) |
|||||||||||||||
| Net sales |
$ | 569.4 | 100.0 | % | $ | 451.1 | 100.0 | % | $ | 118.3 | ||||||||||
| Cost of goods sold |
481.1 | 84.5 | % | 393.4 | 87.2 | % | 87.7 | |||||||||||||
| Gross margin |
88.3 | 15.5 | % | 57.7 | 12.8 | % | 30.6 | |||||||||||||
| Selling, general and administrative expense |
59.8 | 10.5 | % | 57.5 | 12.8 | % | 2.3 | |||||||||||||
| Impairment of long-lived assets |
– | 0.0 | % | 32.7 | 7.2 | % | (32.7 | ) | ||||||||||||
| Restructuring and other expense |
0.5 | 0.1 | % | 2.8 | 0.6 | % | (2.3 | ) | ||||||||||||
| Operating income (loss) |
28.0 | 4.9 | % | (35.3 | ) | -7.8 | % | 63.3 | ||||||||||||
| Miscellaneous expense |
(0.3 | ) | -0.1 | % | (0.2 | ) | -0.1 | % | 0.1 | |||||||||||
| Interest expense |
(4.5 | ) | -0.8 | % | (1.9 | ) | -0.4 | % | 2.6 | |||||||||||
| Equity in net income of unconsolidated affiliates |
17.0 | 3.0 | % | 14.6 | 3.2 | % | 2.4 | |||||||||||||
| Income tax (expense) benefit |
(11.9 | ) | -2.1 | % | 6.7 | 1.5 | % | 18.6 | ||||||||||||
| Net earnings (loss) |
28.3 | 5.0 | % | (16.1 | ) | -3.6 | % | 44.4 | ||||||||||||
| Net earnings attributable to noncontrolling interest |
(2.0 | ) | -0.4 | % | (1.6 | ) | -0.4 | % | (0.4 | ) | ||||||||||
| Net earnings (loss) attributable to controlling interest |
$ | 26.3 | 4.6 | % | $ | (17.7 | ) | -3.9 | % | $ | 44.0 | |||||||||
Net earnings (loss) represent the results for our consolidated operations, including 100% of our consolidated joint ventures, Spartan Steel Coating, LLC (“Spartan”), of which we own 52%, and WNCL, of which we own 60%. The noncontrolling interest, or 48% of Spartan and 40% of WNCL, is subtracted to arrive at net earnings (loss) attributable to controlling interest (i.e., Worthington). For the third quarter of fiscal 2011, net earnings attributable to controlling interest were $26.3 million, an increase of $44.0 million from the net loss recognized in the comparable prior year period.
21
Table of Contents
| — | Net sales increased $118.3 million, or 26%, from the prior year to $569.4 million. Higher volumes in all operating segments increased net sales by $79.1 million, most notably in our Steel Processing and Pressure Cylinders operating segments. Average selling prices increased over the prior year due to the higher cost of steel and resulted in increased net sales of $39.2 million. |
| — | Gross margin of $88.3 million represented an improvement of $30.6 million from the prior year. The improvement was primarily due to the aforementioned improved volumes and an increased spread between average selling prices and the cost of steel, especially in Steel Processing. Both the current quarter and prior year quarter benefited from inventory holding gains that were comparable in amount. The impact of these factors on gross margin was partially offset by higher volume related manufacturing expenses in the current quarter. |
| — | SG&A expense increased $2.3 million from the prior year quarter, primarily due to higher profit sharing and bonus expenses in the current quarter as a result of increased earnings partially offset by lower litigation and bad debt expenses. The prior year quarter included $4.9 million in litigation related legal expenses. |
| — | Impairment of long-lived assets of $32.7 million in the prior year related to the former Construction Services operating segment. See “Item 1. – Financial Statements – Notes to Consolidated Financial Statements – Note I – Goodwill and Other Long-lived Assets” of this Quarterly Report on Form 10-Q for more information. |
| — | Interest expense of $4.5 million increased $2.6 million over the prior year mainly due to higher debt levels and higher interest rates due to the April 2010 issuance of $150.0 million aggregate principal amount of 6.5% notes due 2020 to lock in long-term financing. |
| — | Equity in net income of unconsolidated affiliates increased $2.4 million from the third quarter of fiscal 2010, to $17.0 million, as all of our unconsolidated joint ventures were profitable for the quarter. The majority of the equity in net income of unconsolidated affiliates is from WAVE. Our portion of WAVE’s net income increased 22% or $2.5 million from last year’s third quarter, to $14.1 million. Our portion of TWB Company, L.L.C. (“TWB”) earnings decreased 38% or $0.7 million from the prior year period, while all other joint ventures posted modest increases in earnings. See “Item 1. – Financial Statements – Notes to Consolidated Financial Statements – NOTE H – Investments in Unconsolidated Affiliates” of this Quarterly Report on Form 10-Q for more financial information on our unconsolidated affiliates. |
| — | Income tax expense of $11.9 million in the third quarter of fiscal 2011 compared to an income tax benefit of $6.7 million in the prior year third quarter. This was due to the favorable change in pre-tax earnings as well as the impact of discrete tax adjustments. The current quarter expense reflects an estimated annual effective tax rate of 32.3% compared to 34.9% in the prior year third quarter. These rates are prior to the impact of discrete tax adjustments, and are applicable only to net earnings attributable to controlling interest, as reflected in our consolidated statements of earnings. The discrete adjustments were immaterial during the current quarter, but were $11.2 million during the comparable prior year quarter, primarily due to the tax impact of the previously mentioned impairment charges. See “Item 1. – Financial Statements – Notes to Consolidated Financial Statements – NOTE G – Income Taxes” of this Quarterly Report on Form 10-Q for more information on our tax rates. |
22
Table of Contents
Segment Operations
Steel Processing
The following table presents a summary of operating results for our Steel Processing operating segment for the periods indicated:
| Three Months Ended February 28, | ||||||||||||||||||||
| (Dollars in millions) | 2011 | % of Net sales |
2010 | % of Net sales |
Increase/ (Decrease) |
|||||||||||||||
| Net sales |
$ | 301.8 | 100.0 | % | $ | 232.2 | 100.0 | % | $ | 69.6 | ||||||||||
| Cost of goods sold |
260.8 | 86.4 | % | 203.4 | 87.6 | % | 57.4 | |||||||||||||
| Gross margin |
41.0 | 13.6 | % | 28.8 | 12.4 | % | 12.2 | |||||||||||||
| Selling, general and administrative expense |
26.7 | 8.9 | % | 21.0 | 9.1 | % | 5.7 | |||||||||||||
| Restructuring and other expense |
0.1 | 0.0 | % | 0.3 | 0.1 | % | (0.2 | ) | ||||||||||||
| Operating income |
$ | 14.2 | 4.7 | % | $ | 7.5 | 3.2 | % | $ | 6.7 | ||||||||||
| Material cost |
$ | 210.7 | $ | 164.6 | $ | 46.1 | ||||||||||||||
| Tons shipped (in thousands) |
590 | 512 | 78 | |||||||||||||||||
Net sales and operating income highlights were as follows:
| — | Net sales increased $69.6 million from the prior year to $301.8 million. Stronger economic conditions, especially in the automotive market which represents higher value-added processing, and the impact of the acquisition of the Gibraltar steel processing assets in February 2010 resulted in a 15% increase in volume, which accounted for $47.9 million of the total increase in net sales compared to the same period in the prior year. Higher base material prices in the current quarter led to increased pricing for our products, favorably impacting net sales by $21.7 million versus the comparable prior year period. |
| — | Operating income for the quarter improved $6.7 million to $14.2 million. Increased volumes and a higher spread between average selling prices and material costs were more than enough to offset higher SG&A expenses. SG&A expenses increased $5.7 million during the third quarter of fiscal 2011 due to higher profit sharing and bonus expenses and the impact of acquisitions. |
23
Table of Contents
Pressure Cylinders
The following table presents a summary of operating results for our Pressure Cylinders operating segment for the periods indicated:
| Three Months Ended February 28, | ||||||||||||||||||||
| (Dollars in millions) | 2011 | % of Net sales |
2010 | % of Net sales |
Increase/ (Decrease) |
|||||||||||||||
| Net sales |
$ | 135.9 | 100.0 | % | $ | 116.5 | 100.0 | % | $ | 19.4 | ||||||||||
| Cost of goods sold |
108.9 | 80.1 | % | 93.9 | 80.6 | % | 15.0 | |||||||||||||
| Gross margin |
27.0 | 19.8 | % | 22.6 | 19.4 | % | 4.4 | |||||||||||||
| Selling, general and administrative expense |
16.1 | 11.9 | % | 18.5 | 15.9 | % | (2.4 | ) | ||||||||||||
| Operating income |
$ | 10.9 | 8.0 | % | $ | 4.1 | 3.5 | % | $ | 6.8 | ||||||||||
| Material cost |
$ | 61.1 | $ | 50.7 | $ | 10.4 | ||||||||||||||
| Units shipped (in thousands) |
14,617 | 14,000 | 617 | |||||||||||||||||
Net sales and operating income highlights were as follows:
| — | Net sales increased $19.4 million, or 17%, from the prior year third quarter, to $135.9 million. The continued recovery of European industrial gas and automotive markets and stable conditions in the North American markets led to a 4% increase in volume, accounting for $12.1 million of the overall increase in net sales. Higher average pricing for our products, driven by increased raw material cost and a favorable shift in product mix, contributed $7.3 million to the increase in net sales. |
| — | Operating income increased $6.8 million from last year’s fiscal third quarter to $10.9 million, aided by improved North American operations, and the return to profitability of our European operations. SG&A expense decreased as litigation costs incurred in the prior year did not recur. See “Item 1. – Financial Statements – Notes to Consolidated Financial Statements – NOTE Q – Contingent Liabilities” of this Quarterly Report on Form 10-Q for further information regarding this litigation. |
Metal Framing
The following table presents a summary of operating results for our Metal Framing operating segment for the periods indicated:
| Three Months Ended February 28, | ||||||||||||||||||||
| (Dollars in millions) | 2011 | % of Net sales |
2010 | % of Net sales |
Increase/ (Decrease) |
|||||||||||||||
| Net sales |
$ | 81.4 | 100.0 | % | $ | 67.5 | 100.0 | % | $ | 13.9 | ||||||||||
| Cost of goods sold |
67.9 | 83.4 | % | 65.1 | 96.4 | % | 2.8 | |||||||||||||
| Gross margin |
13.5 | 16.6 | % | 2.4 | 3.6 | % | 11.1 | |||||||||||||
| Selling, general and administrative expense |
10.4 | 12.8 | % | 9.5 | 14.0 | % | 0.9 | |||||||||||||
| Restructuring and other expense |
0.4 | 0.5 | % | 2.0 | 3.0 | % | (1.6 | ) | ||||||||||||
| Operating income (loss) |
$ | 2.7 | 3.3 | % | $ | (9.1 | ) | -13.4 | % | $ | 11.8 | |||||||||
| Material cost |
$ | 48.0 | $ | 43.5 | $ | 4.5 | ||||||||||||||
| Tons shipped (in thousands) |
59 | 58 | 1 | |||||||||||||||||
Net sales and operating income (loss) highlights were as follows:
| — | Net sales increased $13.9 million from the prior year to $81.4 million. Higher base material prices led to increased pricing for our products, favorably impacting net sales by $12.5 million. A 2% increase in volume improved net sales by $1.4 million. |
24
Table of Contents
| — | Operating income of $2.7 million improved $11.8 million compared to the operating loss of $9.1 million recognized during the third quarter of fiscal 2010. Gross margin increased $11.1 million, as a result of a higher spread between average selling prices and the cost of steel, slightly higher volumes, and lower manufacturing expenses. SG&A expenses increased due to higher profit sharing and bonus expenses. |
Other
The “Other” category includes the Automotive Body Panels, Steel Packaging and the Global Group operating segments, which do not meet the materiality tests for purposes of separate disclosure, along with income and expense items not allocated to the operating segments. The following table presents a summary of operating results for the “Other” operating segments for the periods indicated:
| Three Months Ended February 28, | ||||||||||||||||||||
| (Dollars in millions) | 2011 | % of Net sales |
2010 | % of Net sales |
Increase/ (Decrease) |
|||||||||||||||
| Net sales |
$ | 50.4 | 100.0 | % | $ | 34.8 | 100.0 | % | $ | 15.6 | ||||||||||
| Cost of goods sold |
43.5 | 86.5 | % | 30.9 | 88.9 | % | 12.6 | |||||||||||||
| Gross margin |
6.9 | 13.7 | % | 3.9 | 11.4 | % | 3.0 | |||||||||||||
| Selling, general and administrative expense |
6.7 | 13.4 | % | 8.5 | 24.4 | % | (1.8 | ) | ||||||||||||
| Impairment of long-lived assets |
- | -0.1 | % | 32.7 | 93.9 | % | (32.7 | ) | ||||||||||||
| Restructuring and other expense |
- | -0.1 | % | 0.5 | 1.2 | % | (0.5 | ) | ||||||||||||
| Operating income (loss) |
$ | 0.2 | 0.4 | % | $ | (37.8 | ) | -108.3 | % | $ | 38.0 | |||||||||
Net sales and operating income (loss) highlights were as follows:
| — | Net sales increased $15.6 million from the third quarter of fiscal 2010, to $50.4 million, due to higher volumes in all operating segments represented in the “Other” category. |
| — | Operating income of $0.2 million was significantly higher than the $37.8 million operating loss recognized during the third quarter of fiscal 2010. The favorable change in gross margin was aided by volume improvements in all the operating segments. In addition, the third quarter of fiscal 2010 included a $32.7 million impairment charge associated with long-lived assets in the former Construction Services segment. SG&A decreased in part due to a $1.3 million charge to bad debt expense in the prior year quarter, also related to the former Construction Services segment. |
25
Table of Contents
Nine Months Year-to-Date—Fiscal 2011 Compared to Fiscal 2010
Consolidated Operations
The following table presents consolidated operating results for the periods indicated:
| Nine Months Ended February 28, | ||||||||||||||||||||
| (Dollars in millions) | 2011 | % of Net sales |
2010 | % of Net sales |
Increase/ (Decrease) |
|||||||||||||||
| Net sales |
$ | 1,766.9 | 100.0 | % | $ | 1,316.6 | 100.0 | % | $ | 450.3 | ||||||||||
| Cost of goods sold |
1,529.9 | 86.6 | % | 1,142.5 | 86.9 | % | 387.4 | |||||||||||||
| Gross margin |
237.0 | 13.4 | % | 174.1 | 13.1 | % | 62.9 | |||||||||||||
| Selling, general and administrative expense |
173.5 | 9.8 | % | 155.6 | 11.8 | % | 17.9 | |||||||||||||
| Impairment of long-lived assets |
- | 0.0 | % | 35.4 | 2.7 | % | (35.4 | ) | ||||||||||||
| Restructuring and other expense |
1.5 | 0.1 | % | 3.7 | 0.3 | % | (2.2 | ) | ||||||||||||
| Operating income (loss) |
62.0 | 3.5 | % | (20.6 | ) | -1.6 | % | 82.6 | ||||||||||||
| Miscellaneous income (expense) |
(0.4 | ) | 0.0 | % | 1.2 | 0.1 | % | (1.6 | ) | |||||||||||
| Interest expense |
(14.1 | ) | -0.8 | % | (6.4 | ) | -0.5 | % | 7.7 | |||||||||||
| Equity in net income of unconsolidated affiliates |
51.5 | 2.9 | % | 45.8 | 3.5 | % | 5.7 | |||||||||||||
| Income tax expense |
(29.6 | ) | -1.7 | % | (3.9 | ) | -0.3 | % | 25.7 | |||||||||||
| Net earnings |
69.4 | 3.9 | % | 16.1 | 1.2 | % | 53.3 | |||||||||||||
| Net earnings attributable to noncontrolling interest |
(6.3 | ) | -0.4 | % | (3.9 | ) | -0.3 | % | (2.4 | ) | ||||||||||
| Net earnings attributable to controlling interest |
$ | 63.1 | 3.6 | % | $ | 12.2 | 0.9 | % | $ | 50.9 | ||||||||||
Net earnings represent the results for our consolidated operations, including 100% of our consolidated joint ventures, Spartan, of which we own 52%, and WNCL, of which we own 60%. The noncontrolling interest, or 48% of Spartan and 40% of WNCL, is subtracted to arrive at net earnings attributable to controlling interest (i.e., Worthington). For the first nine months of fiscal 2011, net earnings attributable to controlling interest were $63.1 million, an increase of $50.9 million from the prior year nine-month period.
| — | Net sales increased $450.3 million, or 34%, from the prior year to $1,766.9 million. Higher volumes increased net sales by $268.2 million, most notably in our Steel Processing and Pressure Cylinders operating segments. Average selling prices increased over the prior year due to the higher cost of steel, resulting in increased net sales of $182.1 million. |
| — | Gross margin improved $62.9 million from the prior year. The improvement was primarily due to increased volumes in Steel Processing and Pressure Cylinders, as well as an increase in the spread between average selling prices and the cost of steel. |
| — | SG&A expense increased $17.9 million from the prior year, primarily due to acquisitions and higher profit sharing and bonuses due to higher earnings. |
| — | Impairment of long-lived assets of $35.4 million in the first nine months of the prior year related to the Steel Packaging and former Construction Services segments. See “Item 1. – Financial Statements – Notes to Consolidated Financial Statements – NOTE I – Goodwill and Other Long-Lived Assets” of this Quarterly Report on Form 10-Q for more information. |
| — | Restructuring charges totaled $1.5 million in the current year period, compared to $3.7 million in the prior year. These charges for both the current and prior year periods related to the Transformation Plan, which has progressed through the remaining facilities in Steel Processing and Metal Framing. |
| — | Interest expense increased $7.7 million over the prior year due to higher debt levels driven by acquisitions, share repurchases and increased working capital needs, as well as higher interest rates due to the issuance in April 2010 of $150.0 million aggregate principal amount of 6.50% notes due 2020. |
| — | Equity in net income of unconsolidated affiliates increased $5.7 million from the first nine months of fiscal 2010, to $51.5 million. The vast majority of the equity in net income of unconsolidated affiliates is from WAVE. Our portion of WAVE’s net income increased 7% from the comparable prior year period, to $41.7 million. The remaining increase in equity |
26
Table of Contents
| earnings came primarily from our portion of TWB’s earnings which increased by $1.3 million from the comparable prior year period due to continued improvement in the automotive industry. See “Item 1. – Financial Statements – Notes to Consolidated Financial Statements – NOTE H – Investments in Unconsolidated Affiliates” of this Quarterly Report on Form 10-Q for more financial information on our unconsolidated affiliates. |
| — | Income tax expense of $29.6 million increased from $3.9 million in fiscal 2010 primarily due to higher earnings in fiscal 2011. The current year expense of $29.6 million was calculated using an estimated annual effective income tax rate of 32.3%, versus 34.9% in the prior year. These rates are prior to the impact of discrete tax adjustments, and are applicable only to net earnings attributable to controlling interest, as reflected in our consolidated statements of earnings. The discrete adjustments were immaterial during the current year-to-date period, but were $11.8 million during the comparable prior year period, primarily due to the tax impact of the previously mentioned impairment charges. See “Item 1. – Financial Statements – Notes to Consolidated Financial Statements – NOTE G – Income Taxes” of this Quarterly Report on Form 10-Q for more information on our tax rates. |
Segment Operations
Steel Processing
The following table presents a summary of operating results for our Steel Processing operating segment for the periods indicated:
| Nine Months Ended February 28, | ||||||||||||||||||||
| (Dollars in millions) | 2011 | % of Net sales |
2010 | % of Net sales |
Increase/ (Decrease) |
|||||||||||||||
| Net sales |
$ | 973.8 | 100.0 | % | $ | 639.4 | 100.0 | % | $ | 334.4 | ||||||||||
| Cost of goods sold |
858.1 | 88.1 | % | 559.2 | 87.5 | % | 298.9 | |||||||||||||
| Gross margin |
115.7 | 11.9 | % | 80.2 | 12.5 | % | 35.5 | |||||||||||||
| Selling, general and administrative expense |
76.7 | 7.9 | % | 56.7 | 8.9 | % | 20.0 | |||||||||||||
| Restructuring and other expense (income) |
(0.3 | ) | 0.0 | % | 0.5 | 0.1 | % | (0.8 | ) | |||||||||||
| Operating income |
$ | 39.3 | 4.0 | % | $ | 23.0 | 3.6 | % | $ | 16.3 | ||||||||||
| Material cost |
$ | 704.7 | $ | 446.9 | $ | 257.8 | ||||||||||||||
| Tons shipped (in thousands) |
1,815 | 1,410 | 405 | |||||||||||||||||
Net sales and operating income highlights were as follows:
| — | Net sales increased $334.4 million from the prior year to $973.8 million. Stronger economic conditions, especially in the automotive end market, resulted in a 33% and 24% increase in direct and toll volume, respectively. This translated into a $212.2 million increase to net sales versus the comparable period in the prior year. Higher base material prices versus the year ago period led to increased pricing for our products, favorably impacting net sales by $122.2 million. |
| — | Operating income for the nine-month period improved to $39.3 million from the $23.0 million reported last year. Higher volumes, including the impact of the acquisition of the Gibraltar steel processing assets, improved operating income by $54.2 million, but this was partially offset by higher manufacturing and profit sharing and bonus expenses. |
27
Table of Contents
Pressure Cylinders
The following table presents a summary of operating results for our Pressure Cylinders operating segment for the periods indicated:
| Nine Months Ended February 28, | ||||||||||||||||||||
| (Dollars in millions) | 2011 | % of Net sales |
2010 | % of Net sales |
Increase/ (Decrease) |
|||||||||||||||
| Net sales |
$ | 408.2 | 100.0 | % | $ | 322.8 | 100.0 | % | $ | 85.4 | ||||||||||
| Cost of goods sold |
328.9 | 80.6 | % | 262.8 | 81.5 | % | 66.1 | |||||||||||||
| Gross margin |
79.3 | 19.4 | % | 60.0 | 18.5 | % | 19.3 | |||||||||||||
| Selling, general and administrative expense |
49.4 | 12.1 | % | 45.7 | 14.1 | % | 3.7 | |||||||||||||
| Restructuring and other expense |
- | 0.0 | % | 0.3 | 0.1 | % | (0.3 | ) | ||||||||||||
| Operating income |
$ | 29.9 | 7.3 | % | $ | 14.0 | 4.3 | % | $ | 15.9 | ||||||||||
| Material cost |
$ | 187.4 | $ | 142.4 | $ | 45.0 | ||||||||||||||
| Units shipped (in thousands) |
42,570 | 40,420 | 2,150 | |||||||||||||||||
Net sales and operating income highlights were as follows:
| — | Net sales increased $85.4 million, or 26%, from the first nine months of fiscal 2010, to $408.2 million. Higher volumes increased net sales by $67.3 million due to continued recovery in the European industrial gas and automotive markets, stable market conditions in the North American operations and the full-year impact of the Structural Composites Industries, LLC (“SCI”) and Hy-Mark Cylinders, Inc. (“Hy-Mark”) acquisitions. Higher overall pricing for our products increased net sales by $18.1 million versus the comparable period in the prior year. |
| — | Operating income increased $15.9 million from the first nine months of fiscal 2010 to $29.9 million, aided by solid North American operations, and the improvement and return to profitability of our European operations. SG&A expense increased mainly due to acquisitions completed in fiscal 2011 as well as an increase in the portion of allocated corporate expenses. |
Metal Framing
The following table presents a summary of operating results for our Metal Framing operating segment for the periods indicated:
| Nine Months Ended February 28, | ||||||||||||||||||||
| (Dollars in millions) | 2011 | % of Net sales |
2010 | % of Net sales |
Increase/ (Decrease) |
|||||||||||||||
| Net sales |
$ | 243.0 | 100.0 | % | $ | 243.5 | 100.0 | % | $ | (0.5 | ) | |||||||||
| Cost of goods sold |
219.5 | 90.3 | % | 218.6 | 89.8 | % | 0.9 | |||||||||||||
| Gross margin |
23.5 | 9.7 | % | 24.9 | 10.2 | % | (1.4 | ) | ||||||||||||
| Selling, general and administrative expense |
30.0 | 12.3 | % | 32.5 | 13.3 | % | (2.5 | ) | ||||||||||||
| Restructuring and other expense |
1.4 | 0.6 | % | 3.0 | 1.2 | % | (1.6 | ) | ||||||||||||
| Operating loss |
$ | (7.9 | ) | -3.3 | % | $ | (10.6 | ) | -4.4 | % | $ | 2.7 | ||||||||
| Material cost |
$ | 159.9 | $ | 146.3 | $ | 13.6 | ||||||||||||||
| Tons shipped (in thousands) |
184 | 211 | (27 | ) | ||||||||||||||||
Net sales and operating loss highlights were as follows:
| — | Net sales decreased $0.5 million from the prior year to $243.0 million, as a 13% decline in volume reduced net sales by $36.1 million. Higher base material prices led to increased pricing for our products, favorably impacting net sales by $35.6 million. |
28
Table of Contents
| — | The operating loss decreased $2.7 million from the first nine months of fiscal 2010 to $7.9 million. Gross margin decreased by $1.4 million, as a result of lower volumes. SG&A expense decreased $2.5 million as a result of lower headcount. |
Other
The “Other” category includes the Automotive Body Panels, Steel Packaging, and the Global Group operating segments, which do not meet the materiality threshold for purposes of separate disclosure, along with income and expense items not allocated to the operating segments. The following table presents a summary of operating results for the “Other” operating segments for the periods indicated:
| Nine Months Ended February 28, | Increase/ (Decrease) |
|||||||||||||||||||
| (Dollars in millions) | 2011 | % of Net sales |
2010 | % of Net sales |
||||||||||||||||
| Net sales |
$ | 142.0 | 100.0 | % | $ | 111.0 | 100.0 | % | $ | 31.0 | ||||||||||
| Cost of goods sold |
123.5 | 87.0 | % | 102.0 | 91.9 | % | 21.5 | |||||||||||||
| Gross margin |
18.5 | 13.0 | % | 9.0 | 8.1 | % | 9.5 | |||||||||||||
| Selling, general and administrative expense |
17.4 | 12.3 | % | 20.8 | 18.8 | % | (3.4 | ) | ||||||||||||
| Impairment of long-lived assets |
- | 0.0 | % | 35.4 | 31.9 | % | (35.4 | ) | ||||||||||||
| Restructuring and other expense |
0.4 | 0.3 | % | 0.0 | -0.1 | % | 0.4 | |||||||||||||
| Operating income (loss) |
$ | 0.7 | 0.5 | % | $ | (47.2 | ) | -42.6 | % | $ | 47.9 | |||||||||
Net sales and operating income (loss) highlights were as follows:
| — | Net sales increased $31.0 million from the first nine months of fiscal 2010, to $142.0 million, as volumes improved across all operating segments. Construction-related business units within the Global Group operating segment, however, continue to be negatively affected by the weakness in the commercial construction market. |
| — | Operating income of $0.7 million was $47.9 million higher than last year’s operating loss of $47.2 million. The favorable change in gross margin was aided by improvements in most of the operating segments. In addition, the nine months ended February 28, 2010 included $35.4 million in impairment charges related to our Steel Packaging and former Construction Services operating segments. |
29
Table of Contents
Liquidity and Capital Resources
During the nine months ended February 28, 2011, we generated $55.3 million in cash from operating activities, received $6.7 million of proceeds from the sale of assets, invested $15.9 million in property, plant and equipment and paid $31.7 million, net of cash acquired, for the assets of Hy-Mark and the 60% ownership interest in WNCL. Additionally, we repurchased 5.3 million of our common shares for $75.1 million and paid $22.7 million in dividends on our common shares, which excludes the $9.1 million of dividend payments made to noncontrolling interests. These activities were funded with $80.0 million of short-term borrowings under our revolving trade accounts receivable securitization facility (the “AR Facility”) and the cash generated from operating activities. The following table summarizes our consolidated cash flows for the nine months ended February 28, 2011 and 2010:
| Nine Months Ended February 28, |
||||||||
| (in millions) | 2011 | 2010 | ||||||
| Net cash provided by operating activities |
$ | 55.3 | $ | 120.0 | ||||
| Net cash used by investing activities |
(40.9 | ) | (76.4 | ) | ||||
| Net cash used by financing activities |
(23.7 | ) | (45.2 | ) | ||||
| Decrease in cash and cash equivalents |
(9.3 | ) | (1.6 | ) | ||||
| Cash and cash equivalents at beginning of period |
59.0 | 56.3 | ||||||
| Cash and cash equivalents at end of period |
$ | 49.7 | $ | 54.7 | ||||
We believe we have access to adequate resources to meet our needs for normal operating costs, mandatory capital expenditures and debt redemptions, dividend payments and working capital for our existing businesses. These resources include cash and cash equivalents, cash provided by operating activities and unused lines of credit. We also believe that we have adequate access to the financial markets to allow us to be in a position to sell long-term debt or equity securities. However, given the current uncertainty and volatility in the financial markets, our ability to access capital and the terms under which we can do so may change.
Operating Activities
Our business is cyclical and cash flows from operating activities may fluctuate during the year and from year to year due to economic conditions. We rely on cash and short-term borrowings to meet cyclical increases in working capital needs. These needs generally rise during periods of increased economic activity or increasing raw material prices due to higher levels of inventory and accounts receivable. During economic slowdowns, or periods of decreasing raw material costs, working capital needs generally decrease as a result of the reduction of inventories and accounts receivable.
Net cash provided by operating activities decreased $64.7 million to $55.3 million during the nine months ended February 28, 2011, compared to $120.0 million during the comparable prior year period. The decrease was largely driven by changes in working capital. During the nine months ended February 28, 2011, accounts payable decreased $25.3 million compared to a $47.1 million increase during the comparable prior year period, driven largely by changes in buying patterns as well as the timing of payments for raw material purchases. An increase in accounts receivable, resulting primarily from the change in classification of proceeds from the AR Facility as short-term borrowings effective June 1, 2010, also contributed to the decrease in operating cash flow. Proceeds received from the AR Facility prior to June 1, 2010, were recorded as a reduction in accounts receivable. During the nine months ended February 28, 2011, proceeds received from the AR Facility were $80.0 million compared to $45.0 million, $90.0 million and $60.0 million as of May 31, 2010, February 28, 2010, and May 31, 2009, respectively. The overall decrease in operating cash flow was offset by lower inventories, which decreased $4.7 million compared to a $22.0 million increase during the comparable prior year period. The decrease in inventories was driven primarily by changes in buying patterns and excludes the impact of acquisitions. Also offsetting the decrease in operating cash flow were higher net earnings, which were $69.4 million during the nine months ended February 28, 2011, compared to $16.1 million during the comparable prior year period, which included $38.7 million of non-cash impairment and restructuring charges.
Investing Activities
Net cash used by investing activities decreased $35.5 million to $40.9 million during the nine months ended February 28, 2011, compared to $76.4 million during the comparable prior year period. The decrease was primarily the result of lower acquisition
30
Table of Contents
activity during the nine months ended February 28, 2011, versus the comparable prior year period. The aggregate purchase price paid for the assets of Piper Metal Forming, U.S. Respiratory, Inc. and Pacific Cylinders, Inc. (collectively, “Piper”), the membership interests of SCI and the steel processing assets of Gibraltar during the first nine months of fiscal 2010 exceeded the price paid for the assets of Hy-Mark and the 60% ownership interest in WNCL in fiscal 2011 by $32.5 million. Additionally, lower levels of capital spending accounted for $10.7 million of the decrease in cash used by investing activities. The impact of these items was offset by lower proceeds from the sale of assets, which were $6.7 million during the nine months ended February 28, 2011, versus $14.7 million during the comparable prior year period.
Investment activities are largely discretionary, and future investment activities could be reduced significantly as economic conditions warrant. We assess acquisition opportunities as they arise, and such opportunities may require additional financing. There can be no assurance, however, that any such opportunities will arise, that any such acquisitions will be consummated, or that any needed additional financing will be available on satisfactory terms when required.
Financing Activities
Net cash used by financing activities was $23.7 million during the nine months ended February 28, 2011, compared to $45.2 million during the comparable prior year period. Cash used by financing activities in the prior year was driven by $138.0 million of principal payments on long-term debt funded largely by $119.0 million of borrowings against our revolving credit facility. During the nine months ended February 28, 2011, $75.1 million of cash was used for the repurchase of our common shares (see “Common shares” caption below). Additionally, as previously noted, the $80.0 million in proceeds from the AR Facility received year-to-date during fiscal 2011 have been classified as proceeds from short-term borrowings in our consolidated statements of cash flows reducing the net cash used by financing activities during the nine months ended February 28, 2011. In contrast, the $45.0 million, $90.0 million and $60.0 million in proceeds from the AR Facility as of May 31, 2010, February 28, 2010, and May 31, 2009, respectively, were recorded as a reduction in the accounts receivable balance.
As of February 28, 2011, we were in compliance with our short-term and long-term debt covenants. These debt agreements do not include ratings triggers or material adverse change provisions. Our credit ratings at February 28, 2011 were unchanged from those reported as of May 31, 2010. Refer to “Part I – Item 1. – Financial Statements – NOTE M – Debt and Receivables Securitization” for additional information regarding our short-term and long-term debt agreements.
Common shares – The Board of Directors of Worthington Industries, Inc. (“Worthington Industries”) declared quarterly dividends of $0.10 per common share during each of the first three quarters of fiscal 2011. Dividends paid on our common shares totaled $22.7 million and $23.7 million during the nine months ended February 28, 2011 and 2010, respectively.
On September 26, 2007, Worthington Industries announced that the Board of Directors had authorized the repurchase of up to 10,000,000 of Worthington Industries’ outstanding common shares. As of May 31, 2010, 8,449,500 common shares were available for repurchase under this authorization. Since that time, we repurchased 5,254,698 shares for a total of $75.1 million. This effectively reduced our outstanding common share base by over 6.5%. As of February 28, 2011, a total of 3,194,802 common shares remained available under this repurchase authorization. The common shares available for repurchase under this authorization may be purchased from time to time, with consideration given to the market price of the common shares, the nature of other investment opportunities, cash flows from operations, general economic conditions and other relevant considerations. Repurchases may be made on the open market or through privately negotiated transactions.
Dividend Policy
We currently have no material contractual or regulatory restrictions on the payment of dividends. Dividends are declared at the discretion of the Board of Directors of Worthington Industries. The Board of Directors reviews the dividend quarterly and establishes the dividend rate based upon our financial condition, results of operations, capital requirements, current and projected cash flows, business prospects and other relevant factors. While we have paid a dividend every quarter since becoming a public company in 1968, there is no guarantee that payments will continue in the future.
31
Table of Contents
Contractual Cash Obligations and Other Commercial Commitments
Our contractual cash obligations and other commercial commitments have not changed significantly from those disclosed in “Part II – Item 7. – Management’s Discussion and Analysis of Financial Condition and Results of Operations – Contractual Cash Obligations and Other Commercial Commitments” of our 2010 Form 10-K, other than the changes in borrowings, as described in “Part I – Item 1. – Financial Statements – NOTE M – Debt and Receivables Securitization” of this Quarterly Report on Form 10-Q. Refer to that note for additional information.
Off-Balance Sheet Arrangements
We do not have guarantees or other off-balance sheet financing arrangements that we believe are reasonably likely to have a material current or future effect on our financial condition, changes in financial condition, results of operations, liquidity, capital expenditures or capital resources. However, as of February 28, 2011, we were party to an operating lease for an aircraft in which we have guaranteed a residual value at the termination of the lease. The maximum obligation under the terms of this guarantee was approximately $14.7 million at February 28, 2011. Based on current facts and circumstances, we have estimated the likelihood of payment pursuant to this guarantee, and determined that the fair value of the obligation based on those likely outcomes is not material.
Recently Issued Accounting Standards
In October 2009, amended accounting guidance was issued for revenue arrangements with multiple deliverables. This amended guidance sets forth requirements that must be met for an entity to recognize revenue from a sale of a delivered item that is part of a multiple-element arrangement when other items have not been delivered. Additionally, the amended guidance will require more disclosure about an entity’s multiple-element arrangements. This amended guidance is effective for fiscal years beginning on or after June 15, 2010, and interim periods within those fiscal years. We do not expect the adoption of this amended accounting guidance, effective for us on June 1, 2011, to have a material impact on our financial position or results of operations.
In June 2009, amended accounting guidance was issued regarding the consolidation of variable-interest entities (“VIEs”). Specifically, this guidance made significant changes to the model for determining the primary beneficiary, if any, of a VIE, and also addresses how often this assessment should be performed. We adopted this amended accounting guidance on June 1, 2011. There was no impact to our consolidated results of operations or financial position upon adoption.
Critical Accounting Policies
The discussion and analysis of our financial condition and results of operations is based upon our consolidated financial statements, which have been prepared in accordance with accounting principles generally accepted in the United States. The preparation of these consolidated financial statements requires us to make estimates and assumptions that affect the reported amounts of assets and liabilities and the disclosure of contingent assets and liabilities at the date of the consolidated financial statements and the reported amounts of revenues and expenses during the reporting periods. We continually evaluate our estimates, including those related to our valuation of receivables, intangible assets, accrued liabilities, income and other tax accruals, and contingencies and litigation. We base our estimates on historical experience and various other assumptions that we believe to be reasonable under the circumstances. These results form the basis for making judgments about the carrying values of assets and liabilities that are not readily obtained from other sources. Critical accounting policies are defined as those that require our significant judgments and involve uncertainties that could potentially result in materially different results under different assumptions and conditions. Although actual results historically have not deviated significantly from those determined using our estimates, our financial position or results of operations could be materially different if we were to report under different conditions or to use different assumptions in the application of such policies. Our critical accounting policies have not significantly changed from those discussed in “Part II – Item 7. – Management’s Discussion and Analysis of Financial Condition and Results of Operations – Critical Accounting Policies” of our 2010 Form 10-K.
We review our receivables on an ongoing basis to ensure they are properly valued. Based on this review, we believe our reserve for doubtful accounts is adequate. However, if the economic environment and market conditions deteriorate, particularly in the automotive and construction markets where our exposure is greatest, additional reserves may be required. We recognize revenue upon transfer of title and risk of loss provided evidence of an arrangement exists, pricing is fixed and determinable, and the ability to collect is probable.
We review the carrying value of our long-lived assets, including intangible assets with finite useful lives, for impairment whenever events or changes in circumstances indicate that the carrying value of an asset or asset group may not be recoverable.
32
Table of Contents
Impairment testing involves a comparison of the sum of the undiscounted future cash flows of the asset or asset group to its respective carrying amount. If the sum of the undiscounted future cash flows exceeds the carrying amount, then no impairment exists. If the carrying amount exceeds the sum of the undiscounted future cash flows, then a second step is performed to determine the amount of impairment, which would be recorded as an impairment charge in our consolidated statements of earnings. During the third quarter of fiscal 2011, certain indicators of impairment were present with regard to the long-lived assets of our Metal Framing and Steel Packaging operating segments and our Spartan joint venture; however, we determined the carrying amount of these long-lived assets was recoverable and, therefore, no impairment charges were recorded. There were no other impairment indicators present as of February 28, 2011. During the nine months ended February 28, 2010, certain indicators of impairment were present related to long-lived assets within our Steel Packaging and former Construction Services operating segments resulting in impairment charges of $10.8 million in our consolidated statements of earnings.
Purchased goodwill and intangible assets with indefinite lives are not amortized, but instead are tested for impairment annually, during the fourth quarter, or more frequently if events or changes in circumstances indicate that impairment may be present. Application of goodwill impairment testing involves judgment, including but not limited to, the identification of reporting units and estimating the fair value of each reporting unit. A reporting unit is defined as an operating segment or one level below an operating segment. We test goodwill at the operating segment level as we have determined that the characteristics of the reporting units within each operating segment are similar and allow for their aggregation in accordance with the applicable accounting guidance.
The goodwill impairment test consists of comparing the fair value of each operating segment, determined using discounted cash flows, to each operating segment’s respective carrying value. If the estimated fair value of an operating segment exceeds its carrying value, there is no impairment. If the carrying amount of the operating segment exceeds its estimated fair value, a goodwill impairment is indicated. The amount of the impairment is determined by comparing the fair value of the net assets of the operating segment, excluding goodwill, to its estimated fair value, with the difference representing the implied fair value of the goodwill. If the implied fair value of the goodwill is lower than its carrying value, the difference is recorded as an impairment charge in the consolidated statements of earnings. No impairment indicators were present with regard to our goodwill or intangible assets with indefinite useful lives during the nine months ended February 28, 2011. During the nine months ended February 28, 2010, goodwill impairment indicators existed in our former Construction Services operating segment resulting in an impairment charge of $24.7 million in our consolidated statements of earnings.
Item 3. – Quantitative and Qualitative Disclosures About Market Risk
Market risks have not changed significantly from those disclosed in “Part II – Item 7A. – Quantitative and Qualitative Disclosures About Market Risk” of our 2010 Form 10-K.
Item 4. – Controls and Procedures
Evaluation of Disclosure Controls and Procedures
We maintain disclosure controls and procedures [as defined in Rules 13a-15(e) and 15d-15(e) under the Securities Exchange Act of 1934, as amended (the “Exchange Act”)] that are designed to provide reasonable assurance that information required to be disclosed in the reports that we file or submit under the Exchange Act is recorded, processed, summarized and reported within the time periods specified in the Securities and Exchange Commission’s rules and forms, and that such information is accumulated and communicated to our management, including our principal executive officer and our principal financial officer, as appropriate to allow timely decisions regarding required disclosure.
Management, with the participation of our principal executive officer and our principal financial officer, performed an evaluation of the effectiveness of our disclosure controls and procedures as of the end of the period covered by this Quarterly Report on Form 10-Q (the fiscal quarter ended February 28, 2011). Based on that evaluation, our principal executive officer and our principal financial officer have concluded that such disclosure controls and procedures were effective at a reasonable assurance level as of the end of the period covered by this Quarterly Report on Form 10-Q.
33
Table of Contents
Changes in Internal Control Over Financial Reporting
There were no changes that occurred during the period covered by this Quarterly Report on Form 10-Q (the fiscal quarter ended February 28, 2011) in our internal control over financial reporting (as defined in Rules 13a-15(f) and 15d-15(f) under the Exchange Act) that have materially affected, or are reasonably likely to materially affect, our internal control over financial reporting.
Various legal actions, which generally have arisen in the ordinary course of business, are pending against us. None of this pending litigation, individually or collectively, is expected to have a material adverse effect on our financial position, results of operations or cash flows. Notwithstanding the statement above, see “Item I. – Financial Statements – Notes to Consolidated Financial Statements – Note Q – Contingent Liabilities” in Part I of this Quarterly Report on Form 10-Q for additional information regarding certain litigation which remained pending during the third quarter of fiscal 2011.
There are certain risks and uncertainties in our business that could cause our actual results to differ materially from those anticipated. In “PART I – Item 1A. – Risk Factors” of the 2010 Form 10-K, as filed with the Securities and Exchange Commission on July 30, 2010, and available at www.sec.gov or at www.worthingtonindustries.com, we included a detailed discussion of our risk factors. Our risk factors have not changed significantly from those disclosed in our 2010 Form 10-K. These risk factors should be read carefully in connection with evaluating our business and in connection with the forward-looking statements and other information contained in this Quarterly Report on Form 10-Q. Any of the risks described in our 2010 Form 10-K could materially affect our business, financial condition or future results and the actual outcome of matters as to which forward-looking statements are made. The risk factors described in our 2010 Form 10-K are not the only risks facing us. Additional risks and uncertainties not currently known to us, or that we currently deem to be immaterial, also may materially adversely affect our business, financial condition and/or future results.
Item 2. – Unregistered Sales of Equity Securities and Use of Proceeds
The following table provides information about purchases made by, or on behalf of, Worthington Industries, Inc. or any “affiliated purchaser” (as defined in Rule 10b-18(a) (3) under the Securities Exchange Act of 1934, as amended) of common shares of Worthington Industries, Inc. during each month of the fiscal quarter ended February 28, 2011:
| Period |
Total Number of Common Shares Purchased |
Average Price Paid per Common Share |
Total Number of Common Shares Purchased as Part of Publicly Announced Plans or Programs |
Maximum Number
of Common Shares that May Yet Be Purchased Under the Plans or Programs (1) |
||||||||||||
| December 1-31, 2010 |
- | - | - | 3,194,802 | ||||||||||||
| January 1-31, 2011 |
- | - | - | 3,194,802 | ||||||||||||
| February 1-28, 2011 |
- | - | - | 3,194,802 | ||||||||||||
| Total |
- | - | - | |||||||||||||
| (1) | On September 26, 2007, Worthington Industries, Inc. announced that the Board of Directors had authorized the repurchase of up to 10,000,000 of Worthington Industries, Inc.’s outstanding common shares. A total of 3,194,802 common shares remained available under this repurchase authorization at February 28, 2011. The common shares available for purchase under this authorization may be purchased from time to time, with consideration given to the market price of the common shares, the nature of other investment opportunities, cash flows from operations and general economic conditions. Repurchases may be made on the open market or through privately negotiated transactions. |
34
Table of Contents
Item 3. – Defaults Upon Senior Securities
Not applicable
Not applicable
| 10.1 |
Amendment No. 9 to Receivables Purchase Agreement, dated as of January 20, 2011, among Worthington Receivables Corporation, as Seller, Worthington Industries, Inc., as Servicer, the members of the various purchaser groups from time to time party thereto and PNC Bank, National Association, as Administrator * | |
| 10.2 |
Amendment No. 10 to Receivables Purchase Agreement, dated as of February 28, 2011, among Worthington Receivables Corporation, as Seller, Worthington Industries, Inc., as Servicer, the members of the various purchaser groups from time to time party thereto and PNC Bank, National Association, as Administrator * | |
| 10.3 |
Amendment No. 3, dated as of October 1, 2008, to Purchase and Sale Agreement, dated as of November 30, 2000, among the various originators listed therein, Worthington Taylor, Inc. and Worthington Receivables Corporation * | |
| 10.4 |
Amendment No. 4, dated as of February 28, 2011, to Purchase and Sale Agreement, dated as of November 30, 2000, among the various originators listed therein, Dietrich Industries, Inc. and Worthington Receivables Corporation * | |
| 31.1 |
Rule 13a - 14(a) / 15d - 14(a) Certifications (Principal Executive Officer) * | |
| 31.2 |
Rule 13a - 14(a) / 15d - 14(a) Certifications (Principal Financial Officer) * | |
| 32.1 |
Section 1350 Certifications of Principal Executive Officer ** | |
| 32.2 |
Section 1350 Certifications of Principal Financial Officer ** | |
| 101.INS |
XBRL Instance Document # | |
| 101.SCH |
XBRL Taxonomy Extension Schema Document # | |
| 101.CAL |
XBRL Taxonomy Extension Calculation Linkbase Document # | |
| 101.LAB |
XBRL Taxonomy Extension Label Linkbase Document # | |
| 101.PRE |
XBRL Taxonomy Extension Presentation Linkbase Document # | |
| * | Filed herewith. |
| ** | Furnished herewith. |
| # | Attached as Exhibit 101 to this Quarterly Report on Form 10-Q of Worthington Industries, Inc. are the following documents formatted in XBRL (eXtensible Business Reporting Language): |
| (i) | Consolidated Balance Sheets at February 28, 2011 and May 31, 2010, |
| (ii) | Consolidated Statements of Earnings for the three and nine months ended February 28, 2011 and 2010, |
35
Table of Contents
| (iii) | Consolidated Statements of Cash Flows for the three and nine months ended February 28, 2011 and 2010 and |
| (iv) | Notes to Consolidated Financial Statements for the three and nine months ended February 28, 2011 and 2010. |
In accordance with Rule 406T of Regulation S-T, the XBRL related documents in Exhibit 101 to this Quarterly Report on Form 10-Q are deemed not filed or part of a registration statement or prospectus for purposes of Sections 11 or 12 of the Securities Act of 1933, as amended; are deemed not filed for purposes of Section 18 of the Securities Exchange Act of 1934, as amended; and otherwise are not subject to liability under these Sections.
36
Table of Contents
Pursuant to the requirements of the Securities Exchange Act of 1934, the Registrant has duly caused this report to be signed on its behalf by the undersigned thereunto duly authorized.
| WORTHINGTON INDUSTRIES, INC. | ||||||
| Date: April 11, 2011 |
By: |
/s/ B. Andrew Rose | ||||
| B. Andrew Rose, | ||||||
| Vice President and Chief Financial Officer | ||||||
| (On behalf of the Registrant and as Principal | ||||||
| Financial Officer) | ||||||
37
Table of Contents
| Exhibit No. |
Description |
Location | ||
| 10.1 | Amendment No. 9 to Receivables Purchase Agreement, dated as of January 20, 2011, among Worthington Receivables Corporation, as Seller, Worthington Industries, Inc., as Servicer, the members of the various purchaser groups from time to time party thereto and PNC Bank, National Association, as Administrator |
Filed herewith | ||
| 10.2 | Amendment No. 10 to Receivables Purchase Agreement, dated as of February 28, 2011, among Worthington Receivables Corporation, as Seller, Worthington Industries, Inc., as Servicer, the members of the various purchaser groups from time to time party thereto and PNC Bank, National Association, as Administrator |
Filed herewith | ||
| 10.3 | Amendment No. 3, dated as of October 1, 2008, to Purchase and Sale Agreement, dated as of November 30, 2000, among the various originators listed therein, Worthington Taylor, Inc. and Worthington Receivables Corporation |
Filed herewith | ||
| 10.4 | Amendment No. 4, dated as of February 28, 2011, to Purchase and Sale Agreement, dated as of November 30, 2000, among the various originators listed therein, Dietrich Industries, Inc. and Worthington Receivables Corporation |
Filed herewith | ||
| 31.1 | Rule 13a - 14(a) / 15d - 14(a) Certifications (Principal Executive Officer) |
Filed herewith | ||
| 31.2 | Rule 13a - 14(a) / 15d - 14(a) Certifications (Principal Financial Officer) |
Filed herewith | ||
| 32.1 | Section 1350 Certifications of Principal Executive Officer |
Furnished herewith | ||
| 32.2 | Section 1350 Certifications of Principal Financial Officer |
Furnished herewith | ||
| 101.INS | XBRL Instance Document |
Submitted electronically herewith# | ||
| 101.SCH | XBRL Taxonomy Extension Schema Document |
Submitted electronically herewith# | ||
| 101.CAL | XBRL Taxonomy Extension Calculation Linkbase Document |
Submitted electronically herewith# | ||
| 101.LAB | XBRL Taxonomy Extension Label Linkbase Document |
Submitted electronically herewith# | ||
| 101.PRE | XBRL Taxonomy Extension Presentation Linkbase Document |
Submitted electronically herewith# | ||
| # | Attached as Exhibit 101 to this Quarterly Report on Form 10-Q of Worthington Industries, Inc. are the following documents formatted in XBRL (eXtensible Business Reporting Language): |
| (i) | Consolidated Balance Sheets at February 28, 2011 and May 31, 2010, |
| (ii) | Consolidated Statements of Earnings for the three and nine months ended February 28, 2011 and 2010, |
| (iii) | Consolidated Statements of Cash Flows for the three and nine months ended February 28, 2011 and 2010, and |
38
Table of Contents
| (iv) | Notes to Consolidated Financial Statements for the three and nine months ended February 28, 2011 and 2010. |
In accordance with Rule 406T of Regulation S-T, the XBRL related documents in Exhibit 101 to this Quarterly Report on Form 10-Q are deemed not filed or part of a registration statement or prospectus for purposes of Sections 11 or 12 of the Securities Act of 1933, as amended; are deemed not filed for purposes of Section 18 of the Securities Exchange Act of 1934, as amended; and otherwise are not subject to liability under these Sections.
39