Attached files
Table of Contents

UNITED STATES
SECURITIES AND EXCHANGE COMMISSION
Washington, D.C. 20549
FORM 10-Q
| x | QUARTERLY REPORT PURSUANT TO SECTION 13 OR 15(d) OF THE SECURITIES EXCHANGE ACT OF 1934 |
For the quarterly period ended August 31, 2009
OR
| ¨ | TRANSITION REPORT PURSUANT TO SECTION 13 OR 15(d) OF THE SECURITIES EXCHANGE ACT OF 1934 |
For the transition period from to
Commission File Number 001-08399
WORTHINGTON INDUSTRIES, INC.
(Exact name of registrant as specified in its charter)
| Ohio |
31-1189815 | |||
| (State or other jurisdiction of incorporation or organization) | (I.R.S. Employer Identification No.) | |||
| 200 Old Wilson Bridge Road, Columbus, Ohio |
43085 | |||
| (Address of principal executive offices) | (Zip Code) | |||
(614) 438-3210
(Registrant’s telephone number, including area code)
Not applicable
(Former name, former address and former fiscal year, if changed since last report)
Indicate by check mark whether the registrant (1) has filed all reports required to be filed by Section 13 or 15(d) of the Securities Exchange Act of 1934 during the preceding 12 months (or for such shorter period that the registrant was required to file such reports), and (2) has been subject to such filing requirements for the past 90 days.
YES x NO ¨
Indicate by check mark whether the registrant has submitted electronically and posted on its corporate Web site, if any, every Interactive Data File required to be submitted and posted pursuant to Rule 405 of Regulation S-T (§232.405 of this chapter) during the preceding 12 months (or for such shorter period that the registrant was required to submit and post such files).
YES ¨ NO ¨
Indicate by check mark whether the registrant is a large accelerated filer, an accelerated filer, a non-accelerated filer, or a smaller reporting company. See the definitions of “large accelerated filer,” “accelerated filer” and “smaller reporting company” in Rule 12b-2 of the Exchange Act.
| Large accelerated filer |
x |
Accelerated filer |
¨ | |||
| Non-accelerated filer |
¨ (Do not check if a smaller reporting company) |
Smaller reporting company |
¨ |
Indicate by check mark whether the registrant is a shell company (as defined in Rule 12b-2 of the Exchange Act).
YES ¨ NO x
APPLICABLE ONLY TO CORPORATE ISSUERS:
Indicate the number of shares outstanding of each of the Issuer’s classes of common stock, as of the latest practicable date. On September 30, 2009, the number of Common Shares issued and outstanding was 79,129,192.
Table of Contents
| ii | ||||
| Part I. Financial Information |
||||
| Item 1. |
Financial Statements (Unaudited) |
|||
| Consolidated Balance Sheets – |
1 | |||
| Consolidated Statements of Earnings – |
2 | |||
| Consolidated Statements of Cash Flows – |
3 | |||
| 4 | ||||
| Item 2. |
Management’s Discussion and Analysis of Financial Condition and Results of Operations |
17 | ||
| Item 3. |
28 | |||
| Item 4. |
28 | |||
| Part II. Other Information |
||||
| Item 1. |
29 | |||
| Item 1A. |
29 | |||
| Item 2. |
29 | |||
| Item 3. |
29 | |||
| Item 4. |
30 | |||
| Item 5. |
30 | |||
| Item 6. |
30 | |||
| 31 | ||||
| 32 | ||||
i
Table of Contents
Selected statements contained in this Quarterly Report on Form 10-Q, including, without limitation, in “PART I – Item 2. –Management’s Discussion and Analysis of Financial Condition and Results of Operations,” constitute “forward-looking statements” as that term is used in the Private Securities Litigation Reform Act of 1995 (the “Act”). These forward-looking statements include, without limitation, statements relating to:
| — | business plans or future or expected growth, performance, sales, volumes, cash flows, earnings, financial condition or other financial measures; |
| — | projected working capital needs; |
| — | demand trends for the Company or its markets; |
| — | pricing trends for raw materials and finished goods and the impact of pricing changes; |
| — | anticipated capital expenditures and asset sales; |
| — | anticipated improvements and efficiencies in operations, sales, sourcing and the supply chain; |
| — | projected timing, results, benefits, costs, charges and expenditures related to acquisitions, headcount reductions and facility dispositions, shutdowns and consolidations; |
| — | the alignment of operations with demand; |
| — | the ability to develop or take advantage of future opportunities, new products and markets; |
| — | expectations for Company and customer inventories, jobs and orders; |
| — | expectations for the economy and markets or improvements therein; |
| — | expected benefits from transformation plans, cost reduction efforts and other new initiatives; |
| — | expectations for improving earnings, margins or shareholder value; |
| — | effects of judicial rulings; and |
| — | other non-historical matters. |
Because they are based on beliefs, estimates and assumptions, forward-looking statements are inherently subject to risks and uncertainties that could cause actual results to differ materially from those projected. Any number of factors could affect actual results, including, without limitation, those that follow:
| — | the effect of national, regional and worldwide economic conditions generally and within major product markets, including a prolonged or substantial economic downturn; |
| — | the effect of conditions in national and worldwide financial markets; |
| — | product demand and pricing; |
| — | changes in product mix, product substitution and market acceptance of the Company’s products; |
| — | fluctuations in pricing, quality or availability of raw materials (particularly steel), supplies, transportation, utilities and other items required by operations; |
| — | effects of facility closures and the consolidation of operations; |
| — | the effect of financial difficulties, consolidation and other changes within the steel, automotive, construction and other industries in which the Company participates; |
| — | failure to maintain appropriate levels of inventories; |
| — | financial difficulties (including bankruptcy filings) of original equipment manufacturers, end-users and customers, suppliers, joint venture partners and others with whom the Company does business; |
| — | the ability to realize targeted expense reductions from head count reductions, facility closures and other cost reduction efforts; |
| — | the ability to realize other cost savings and operational, sales and sourcing improvements and efficiencies, and other expected benefits from transformation initiatives on a timely basis; |
| — | the overall success of, and the ability to integrate, newly acquired businesses and achieve synergies therefrom; |
| — | capacity levels and efficiencies, within facilities and within the industry as a whole; |
| — | the effect of disruption in business of suppliers, customers, facilities and shipping operations due to adverse weather, casualty events, equipment breakdowns, acts of war or terrorist activities or other causes; |
| — | changes in customer demand, inventories, spending patterns, product choices, and supplier choices; |
| — | risks associated with doing business internationally, including economic, political and social instability, and foreign currency exposure; |
| — | the ability to improve and maintain processes and business practices to keep pace with the economic, competitive and technological environment; |
| — | adverse claims experience with respect to workers compensation, product recalls or liability, casualty events or other matters; |
ii
Table of Contents
| — | deviation of actual results from estimates and/or assumptions used by the Company in the application of its significant accounting policies; |
| — | level of imports and import prices in the Company’s markets; |
| — | the impact of judicial rulings and governmental regulations, both in the United States and abroad; and |
| — | other risks described from time to time in the Company’s filings with the Securities and Exchange Commission, including those described in “PART I – Item 1A. — Risk Factors” of the Company’s Annual Report on Form 10-K for the fiscal year ended May 31, 2009. |
We note these factors for investors as contemplated by the Act. It is impossible to predict or identify all potential risk factors. Consequently, you should not consider the foregoing list to be a complete set of all potential risks and uncertainties. Any forward-looking statements in this Quarterly Report on Form 10-Q are based on current information as of the date of this Form 10-Q, and we assume no obligation to correct or update any such statements in the future, except as required by applicable law.
iii
Table of Contents
PART I. FINANCIAL INFORMATION
Item 1. – Financial Statements
CONSOLIDATED BALANCE SHEETS
(Unaudited, in thousands)
| August 31, 2009 |
May 31, 2009 | |||||
| Assets |
||||||
| Current assets: |
||||||
| Cash and cash equivalents |
$ | 102,401 | $ | 56,319 | ||
| Receivables, less allowances of $10,834 and $12,470 at August 31, 2009 and May 31, 2009 |
178,508 | 182,881 | ||||
| Inventories: |
||||||
| Raw materials |
107,180 | 141,082 | ||||
| Work in process |
53,857 | 57,612 | ||||
| Finished products |
71,900 | 71,878 | ||||
| Total inventories |
232,937 | 270,572 | ||||
| Income taxes receivable |
20,503 | 29,749 | ||||
| Assets held for sale |
1,842 | 707 | ||||
| Deferred income taxes |
25,664 | 24,868 | ||||
| Prepaid expenses and other current assets |
33,320 | 33,839 | ||||
| Total current assets |
595,175 | 598,935 | ||||
| Investments in unconsolidated affiliates |
101,091 | 100,395 | ||||
| Goodwill |
101,741 | 101,343 | ||||
| Other intangible assets, net of accumulated amortization of $16,267 and $15,328 at August 31, 2009 and May 31, 2009 |
22,703 | 23,642 | ||||
| Other assets |
18,050 | 18,009 | ||||
| Property, plant and equipment, net |
515,330 | 521,505 | ||||
| Total assets |
$ | 1,354,090 | $ | 1,363,829 | ||
| Liabilities and equity |
||||||
| Current liabilities: |
||||||
| Accounts payable |
$ | 154,019 | $ | 136,215 | ||
| Notes payable |
95,440 | 980 | ||||
| Accrued compensation, contributions to employee benefit plans and related taxes |
29,848 | 34,503 | ||||
| Dividends payable |
7,932 | 7,916 | ||||
| Other accrued items |
47,181 | 49,488 | ||||
| Income taxes payable |
4,391 | 4,965 | ||||
| Current maturities of long-term debt |
19,465 | 138,013 | ||||
| Total current liabilities |
358,276 | 372,080 | ||||
| Other liabilities |
65,459 | 65,400 | ||||
| Long-term debt |
100,400 | 100,400 | ||||
| Deferred income taxes |
84,665 | 82,986 | ||||
| Total liabilities |
608,800 | 620,866 | ||||
| Shareholders’ equity - controlling interest |
709,540 | 706,069 | ||||
| Noncontrolling interest |
35,750 | 36,894 | ||||
| Total equity |
745,290 | 742,963 | ||||
| Total liabilities and equity |
$ | 1,354,090 | $ | 1,363,829 | ||
See notes to consolidated financial statements.
1
Table of Contents
CONSOLIDATED STATEMENTS OF EARNINGS
(Unaudited)
(In thousands, except per share)
| Three Months Ended August 31, |
||||||||
| 2009 | 2008 | |||||||
| Net sales |
$ | 417,527 | $ | 913,222 | ||||
| Cost of goods sold |
368,327 | 761,320 | ||||||
| Gross margin |
49,200 | 151,902 | ||||||
| Selling, general and administrative expense |
50,025 | 63,402 | ||||||
| Restructuring charges |
3,626 | 8,752 | ||||||
| Operating income (loss) |
(4,451 | ) | 79,748 | |||||
| Other income (expense): |
||||||||
| Miscellaneous income |
1,695 | 162 | ||||||
| Interest expense |
(2,511 | ) | (5,569 | ) | ||||
| Equity in net income of unconsolidated affiliates |
16,144 | 25,010 | ||||||
| Earnings before income taxes |
10,877 | 99,351 | ||||||
| Income tax expense |
3,282 | 30,073 | ||||||
| Net earnings |
7,595 | 69,278 | ||||||
| Net earnings attributable to noncontrolling interest |
920 | 654 | ||||||
| Net earnings attributable to controlling interest |
$ | 6,675 | $ | 68,624 | ||||
| Average common shares outstanding - basic |
79,065 | 79,017 | ||||||
| Earnings per share attributable to controlling interest - basic |
$ | 0.08 | $ | 0.87 | ||||
| Average common shares outstanding - diluted |
79,081 | 79,498 | ||||||
| Earnings per share attributable to controlling interest - diluted |
$ | 0.08 | $ | 0.86 | ||||
| Common shares outstanding at end of period |
79,074 | 78,785 | ||||||
| Cash dividends declared per common share |
$ | 0.10 | $ | 0.17 | ||||
See notes to consolidated financial statements.
2
Table of Contents
CONSOLIDATED STATEMENTS OF CASH FLOWS
(Unaudited, in thousands)
| Three Months Ended August 31, |
||||||||
| 2009 | 2008 | |||||||
| Operating activities |
||||||||
| Net earnings attributable to controlling interest |
$ | 6,675 | $ | 68,624 | ||||
| Adjustments to reconcile net earnings attributable to controlling interest to net cash provided by operating activities: |
||||||||
| Depreciation and amortization |
15,896 | 16,368 | ||||||
| Restructuring charges, non-cash |
2,823 | - | ||||||
| Provision for deferred income taxes |
2,393 | 744 | ||||||
| Equity in net income of unconsolidated affiliates, net of distributions |
(520 | ) | (10,510 | ) | ||||
| Net earnings attributable to noncontrolling interest |
920 | 654 | ||||||
| Net loss (gain) on sale of assets |
149 | (142 | ) | |||||
| Stock-based compensation |
974 | 1,284 | ||||||
| Excess tax benefits - stock-based compensation |
- | (355 | ) | |||||
| Gain on acquisition of Piper |
(1,123 | ) | - | |||||
| Changes in assets and liabilities: |
||||||||
| Receivables |
7,259 | 15,276 | ||||||
| Inventories |
41,777 | (69,650 | ) | |||||
| Prepaid expenses and other current assets |
967 | (1,967 | ) | |||||
| Other assets |
119 | (1,830 | ) | |||||
| Accounts payable and accrued expenses |
17,312 | 5,805 | ||||||
| Other liabilities |
606 | (1,958 | ) | |||||
| Net cash provided by operating activities |
96,227 | 22,343 | ||||||
| Investing activities |
||||||||
| Investment in property, plant and equipment, net |
(7,749 | ) | (14,784 | ) | ||||
| Acquisitions, net of cash acquired |
(9,713 | ) | (40,225 | ) | ||||
| Distributions from (investments in) unconsolidated affiliates, net |
264 | (288 | ) | |||||
| Proceeds from sale of assets |
19 | 3,450 | ||||||
| Net cash used by investing activities |
(17,179 | ) | (51,847 | ) | ||||
| Financing activities |
||||||||
| Net proceeds from short-term borrowings |
94,460 | 56,203 | ||||||
| Principal payments on long-term debt |
(118,548 | ) | (248 | ) | ||||
| Proceeds from issuance of common shares |
1,092 | 1,762 | ||||||
| Excess tax benefits - stock-based compensation |
- | 355 | ||||||
| Payments to noncontrolling interest |
(2,064 | ) | (1,680 | ) | ||||
| Repurchase of common shares |
- | (12,402 | ) | |||||
| Dividends paid |
(7,906 | ) | (13,483 | ) | ||||
| Net cash provided (used) by financing activities |
(32,966 | ) | 30,507 | |||||
| Increase in cash and cash equivalents |
46,082 | 1,003 | ||||||
| Cash and cash equivalents at beginning of period |
56,319 | 73,772 | ||||||
| Cash and cash equivalents at end of period |
$ | 102,401 | $ | 74,775 | ||||
See notes to consolidated financial statements.
3
Table of Contents
NOTES TO CONSOLIDATED FINANCIAL STATEMENTS
Three Month Periods Ended August 31, 2009 and August 31, 2008
(Unaudited)
NOTE A – Basis of Presentation
The accompanying unaudited consolidated financial statements include the accounts of Worthington Industries, Inc. and consolidated subsidiaries (collectively, “we”, “our”, “Worthington” or the “Company”). Investments in unconsolidated affiliates are accounted for using the equity method. Significant intercompany accounts and transactions are eliminated.
Spartan Steel Coating, LLC, in which the Company owns a 52% controlling interest, is fully consolidated with the equity owned by the other joint venture member shown as noncontrolling interest on the consolidated balance sheets, and its portion of net earnings included as net earnings attributable to noncontrolling interest in the consolidated statements of earnings. Effective June 1, 2009, we adopted Statement of Financial Accounting Standards (“SFAS”) No. 160, Noncontrolling Interests In Consolidated Financial Statements—an amendment of ARB No. 51 (“SFAS No. 160”). SFAS No. 160 changed the accounting and reporting for minority interests, which have been recharacterized as noncontrolling interests, as discussed above. Prior period financial statements and disclosures for existing minority interests have been restated in accordance with SFAS No. 160. All other requirements of SFAS No. 160 will be applied prospectively. Refer to “NOTE C – Comprehensive Income” and “NOTE D – Changes in Equity” for additional information and revised disclosures required by the adoption of SFAS No. 160.
These unaudited consolidated financial statements have been prepared in accordance with accounting principles generally accepted in the United States of America (the “United States”) for interim financial information and with the instructions to Form 10-Q and Article 10 of Regulation S-X of the Securities and Exchange Commission (“SEC”). Accordingly, they do not include all of the information and notes required by accounting principles generally accepted in the United States for complete financial statements. In the opinion of management, all adjustments, which are of a normal and recurring nature, except those which have been disclosed elsewhere in this Quarterly Report on Form 10-Q, necessary for a fair statement of the results of operations of these interim periods, have been included. Operating results for the three months ended August 31, 2009 are not necessarily indicative of the results that may be expected for the fiscal year ending May 31, 2010 (“fiscal 2010”). Certain prior year amounts have been reclassified to conform to the fiscal 2010 presentation. For further information, refer to the consolidated financial statements and notes thereto included in the Annual Report on Form 10-K for the fiscal year ended May 31, 2009 (“fiscal 2009”) of Worthington Industries, Inc. (the “2009 Form 10-K”).
The preparation of financial statements in conformity with accounting principles generally accepted in the United States requires management to make estimates and assumptions that affect the amounts reported in the financial statements and accompanying notes. Actual results could differ from those estimates.
Recently Issued Accounting Standards: In December 2008, the Financial Accounting Standards Board (“FASB”) issued FSP No. FAS 132(R)-1, Employers’ Disclosures about Postretirement Benefit Plan Assets—an amendment of FASB Statement No. 132(R) (“FSP FAS 132(R)-1”). FSP FAS 132(R)-1 expands the disclosure requirements under FASB Statement No. 132(R), Employers’ Disclosures about Pensions and Other Postretirement Benefits to include disclosure on investment policies and strategies, major categories of plan assets, fair value measurements for each major category of plan assets segregated by fair value hierarchy level as defined in SFAS No. 157, Fair Value Measurements (“SFAS No. 157”), the effect of fair value measurements using Level 3 inputs (as defined in SFAS No. 157) on changes in plan assets for the period, and significant concentrations of risk within plan assets. FSP FAS 132(R)-1 is effective for financial statements issued for fiscal years ending after December 15, 2009. The adoption of this standard will require expanded disclosure in the notes to the Company’s consolidated financial statements but will not impact amounts within our consolidated financial statements.
In June 2009, the FASB issued SFAS No. 166, Accounting for Transfers of Financial Assets—an amendment of FASB Statement No. 140 (“SFAS No. 166”). SFAS No. 166 amends the guidance on transfers of financial assets and impacts new transfers of many types of financial assets (e.g., factoring arrangements and sales of trade receivables, mortgages and installment loans). SFAS No. 166 is effective for fiscal years beginning after November 15, 2009, and in interim periods within those fiscal years. We are currently evaluating the impact of this statement.
4
Table of Contents
In June 2009, the FASB issued SFAS No. 167, Amendments to FASB Interpretation No. 46(R) (“SFAS No. 167”). SFAS No. 167 amends the consolidation guidance for variable-interest entities (“VIE”) under FIN 46(R). SFAS No. 167 makes significant changes to the model for determining who should consolidate a VIE, and also addresses how often this assessment should be performed. SFAS No. 167 is effective as of the beginning of the first annual reporting period that begins after November 15, 2009, and interim periods within that annual period. We are currently evaluating the impact of this statement.
In June 2009, the FASB issued SFAS No. 168, The FASB Accounting Standards CodificationTM and the Hierarchy of Generally Accepted Accounting Principles—a replacement of FASB Statement No. 162 (“SFAS No. 168”). On the effective date of this Statement, the Codification will supersede all then-existing non-SEC accounting and reporting standards. All other non-grandfathered, non-SEC accounting literature not included in the Codification will become non-authoritative. This Statement is effective for financial statements issued for interim and annual periods ending after September 15, 2009. We do not expect this pronouncement to have a material impact on our consolidated financial statements, though it will change the manner in which accounting literature is referenced and described in the notes to the Company’s consolidated financial statements.
5
Table of Contents
NOTE B – Segment Operations
Summarized financial information for our reportable segments is shown in the following table:
| Three Months Ended August 31, |
||||||||
| (in thousands) | 2009 | 2008 | ||||||
| Net sales |
||||||||
| Steel Processing |
$ | 181,586 | $ | 459,914 | ||||
| Metal Framing |
95,437 | 232,932 | ||||||
| Pressure Cylinders |
101,312 | 148,399 | ||||||
| Other |
39,192 | 71,977 | ||||||
| Consolidated |
$ | 417,527 | $ | 913,222 | ||||
| Operating income (loss) |
||||||||
| Steel Processing |
$ | 808 | $ | 44,397 | ||||
| Metal Framing |
(4,289 | ) | 20,959 | |||||
| Pressure Cylinders |
5,891 | 18,654 | ||||||
| Other |
(6,861 | ) | (4,262 | ) | ||||
| Consolidated |
$ | (4,451 | ) | $ | 79,748 | |||
| Pre-tax restructuring charges |
||||||||
| Steel Processing |
$ | 479 | $ | 12 | ||||
| Metal Framing |
3,576 | 1,280 | ||||||
| Pressure Cylinders |
288 | 7 | ||||||
| Other |
(717 | ) | 7,453 | |||||
| Consolidated |
$ | 3,626 | $ | 8,752 | ||||
| (in thousands) | August 31, 2009 |
May 31, 2009 |
||||||
| Total assets |
||||||||
| Steel Processing |
$ | 464,692 | $ | 469,701 | ||||
| Metal Framing |
208,346 | 226,285 | ||||||
| Pressure Cylinders |
367,353 | 355,717 | ||||||
| Other |
313,699 | 312,126 | ||||||
| Consolidated |
$ | 1,354,090 | $ | 1,363,829 | ||||
6
Table of Contents
NOTE C – Comprehensive Income
The following table summarizes the allocation of total comprehensive income between controlling and noncontrolling interests for the quarter ended August 31, 2009:
| (in thousands) | Controlling Interest |
Noncontrolling Interest |
Total | ||||||||
| Net earnings |
$ | 6,675 | $ | 920 | $ | 7,595 | |||||
| Other comprehensive income (loss): |
|||||||||||
| Foreign currency translation |
981 | - | 981 | ||||||||
| Cash flow hedges |
(192 | ) | - | (192 | ) | ||||||
| Pension liability adjustment |
2,012 | - | 2,012 | ||||||||
| Total comprehensive income |
$ | 9,476 | $ | 920 | $ | 10,396 | |||||
The following table summarizes the allocation of total comprehensive income between controlling and noncontrolling interests for the quarter ended August 31, 2008:
| (in thousands) | Controlling Interest |
Noncontrolling Interest |
Total | |||||||||
| Net earnings |
$ | 68,624 | $ | 654 | $ | 69,278 | ||||||
| Other comprehensive loss: |
||||||||||||
| Foreign currency translation |
(7,080 | ) | - | (7,080 | ) | |||||||
| Cash flow hedges |
(1,343 | ) | (413 | ) | (1,756 | ) | ||||||
| Total comprehensive income |
$ | 60,201 | $ | 241 | $ | 60,442 | ||||||
NOTE D – Changes in Equity
The following table provides a summary of the changes in the carrying amounts of total equity, shareholders’ equity attributable to controlling interest, and equity attributable to noncontrolling interest for the quarter ended August 31, 2009:
| Controlling Interest | ||||||||||||||||||||||
| (in thousands) | Additional Paid-in Capital |
Cumulative Other Comprehensive Income, Net of Tax |
Retained Earnings |
Total | Noncontrolling Interest |
Total | ||||||||||||||||
| Balance at May 31, 2009 |
$ | 183,051 | $ | 4,457 | $ | 518,561 | $ | 706,069 | $ | 36,894 | $ | 742,963 | ||||||||||
| Comprehensive income* |
- | 2,801 | 6,675 | 9,476 | 920 | 10,396 | ||||||||||||||||
| Common shares issued |
936 | - | - | 936 | - | 936 | ||||||||||||||||
| Stock-based compensation |
974 | - | - | 974 | - | 974 | ||||||||||||||||
| Dividends paid to noncontrolling interest |
- | - | - | - | (2,064 | ) | (2,064 | ) | ||||||||||||||
| Cash dividends declared |
- | - | (7,915 | ) | (7,915 | ) | - | (7,915 | ) | |||||||||||||
| Balance at August 31, 2009 |
$ | 184,961 | $ | 7,258 | $ | 517,321 | $ | 709,540 | $ | 35,750 | $ | 745,290 | ||||||||||
| * | The allocation of the components of comprehensive income attributable to controlling and noncontrolling interests is disclosed in “NOTE C – Comprehensive Income.” |
7
Table of Contents
NOTE E – Stock-Based Compensation
During the three months ended August 31, 2009, we granted non-qualified stock options covering 692,250 common shares under our stock-based compensation plans. The option price of $13.25 per share was equal to the market price of the underlying common shares at the grant date. The fair value of these stock options, based on the Black-Scholes option-pricing model, calculated at the grant date, was $4.85 per share. The calculated pre-tax stock-based compensation expense for these stock options, after an estimate for forfeitures, is $2,720,000, which will be recognized on a straight-line basis over the vesting period of the stock options. The following assumptions were used to value the stock options:
| Dividend yield |
3.1 | % | |
| Expected term (years) |
6.0 | ||
| Expected volatility |
47.9 | % | |
| Risk-free interest rate |
2.9 | % |
The expected volatility is based on the historical volatility of the common shares of the Company, and the risk-free interest rate is based on the United States Treasury strip rate for the expected term of the stock options. The expected term was developed using the historical exercise experience.
NOTE F – Employee Pension Plans
The following table summarizes the components of net periodic pension cost for our defined benefit plans for the periods indicated:
| (in thousands) | Three Months Ended August 31, |
|||||||
| 2009 | 2008 | |||||||
| Defined benefit plans: |
||||||||
| Service cost |
$ | 207 | $ | 231 | ||||
| Interest cost |
354 | 340 | ||||||
| Expected return on plan assets |
(222 | ) | (306 | ) | ||||
| Net amortization and deferral |
63 | 55 | ||||||
| Net pension cost of defined benefit plans |
$ | 402 | $ | 320 | ||||
We anticipate total contributions of approximately $1,429,000 in fiscal 2010, of which approximately $305,000 had been made as of August 31, 2009.
NOTE G – Income Taxes
Income tax expense for the first three months of fiscal 2010 and fiscal 2009 reflect estimated annual effective income tax rates of 33.6% and 30.5%, respectively. These rates are prior to the impact of discrete tax adjustments, and are applicable only to net earnings attributable to controlling interest, as reflected in our consolidated statements of earnings. Income tax expense associated with net earnings attributable to noncontrolling interest, and reflected in our consolidated statements of earnings, is not material as a result of the joint venture’s tax status. Management is required to estimate the annual effective tax rate based upon its forecast of annual pre-tax income for domestic and foreign operations. To the extent that actual pre-tax results for the year differ from the forecast estimates applied at the end of the most recent interim period, the actual tax rate recognized in fiscal 2010 could be materially different from the forecasted rate as of the end of the first quarter of fiscal 2010.
Income tax expense for the first three months of fiscal 2010 and the first three months of fiscal 2009 were calculated using the estimated annual effective income tax rates for fiscal 2010 and fiscal 2009, respectively. The change in those estimated annual effective tax rates is primarily due to the change in the mix of income among the jurisdictions in which we do business.
8
Table of Contents
NOTE H – Investments in Unconsolidated Affiliates
Our investments in affiliated companies that are not controlled, either through majority ownership or otherwise, are accounted for using the equity method. At August 31, 2009, these equity investments, and the percentage interest owned, consisted of: Worthington Armstrong Venture (“WAVE”) (50%), TWB Company, L.L.C. (45%), Worthington Specialty Processing (“WSP”) (51%), Serviacero Planos, S.A. de C.V. (50%), LEFCO Worthington, LLC (49%), and DMFCWBS, LLC (“Clark JV”) (50%). WSP is considered to be jointly controlled and not consolidated due to substantive participating rights of the minority partner.
On August 12, 2009, we joined with ClarkWestern Building Systems, Inc., to create the Clark JV. We contributed certain intangible assets and committed to pay a portion of certain costs and expenses in return for 50% of the units and voting power of the joint venture. The purpose of the joint venture is to develop, test, and obtain approvals for metal framing stud designs, as well as to develop, own and license intellectual property related to such designs. The Clark JV will not manufacture, offer for sale, or sell any products, but will license its designs to its members. The joint venture is accounted for using the equity method of accounting, as both parties have equal voting rights and control.
We received distributions from unconsolidated affiliates totaling $16,000,000 during the three months ended August 31, 2009, all from our WAVE joint venture. We have received cumulative distributions from WAVE in excess of our investment balance, which resulted in an amount within other liabilities on the consolidated balance sheet of $18,465,000 at August 31, 2009. During the three months ended August 31, 2009, the distribution received from WAVE in excess of the Company’s cumulative equity in the earnings of that joint venture was $375,000. That cash flow was included in investing activities in the consolidated statement of cash flows due to the nature of the distribution as a return of investment, rather than a return on investment. In the quarter ended August 31, 2008, there were no distributions from unconsolidated joint ventures classified as cash flows from investing activities.
Combined financial information for the unconsolidated affiliates is summarized in the following table:
| (in thousands) | August 31, 2009 |
May 31, 2009 | ||||
| Cash |
$ | 81,141 | $ | 72,103 | ||
| Other current assets |
169,151 | 165,615 | ||||
| Noncurrent assets |
171,219 | 167,779 | ||||
| Total assets |
$ | 421,511 | $ | 405,497 | ||
| Current liabilities |
$ | 73,363 | $ | 57,995 | ||
| Long-term debt |
150,965 | 150,596 | ||||
| Other noncurrent liabilities |
25,837 | 24,373 | ||||
| Equity |
171,346 | 172,533 | ||||
| Total liabilities and equity |
$ | 421,511 | $ | 405,497 | ||
| Three Months Ended August 31, | ||||||
| (in thousands) | 2009 | 2008 | ||||
| Net sales |
$ | 161,060 | $ | 217,308 | ||
| Gross margin |
45,593 | 69,885 | ||||
| Depreciation and amortization |
2,830 | 3,944 | ||||
| Interest expense |
380 | 915 | ||||
| Income tax expense |
1,872 | 4,295 | ||||
| Net earnings |
29,436 | 49,482 | ||||
9
Table of Contents
NOTE I – Goodwill and Other Long-Lived Assets
We review the carrying value of our long-lived assets, including intangible assets with finite useful lives, whenever events or changes in circumstances indicate that the carrying value of an asset or a group of assets may not be recoverable. When a potential impairment is indicated, accounting standards require a charge to be recognized in the consolidated financial statements if the carrying amount of an asset or group of assets exceeds the fair value of that asset or group of assets. The loss recognized would be the difference between the fair value and the carrying amount of the asset or group of assets.
Due to continued deterioration in business and market conditions impacting our Metal Framing and Construction Services business segments during the first quarter of fiscal 2010, we determined that certain indicators of potential impairment were present for long-lived assets, as defined by SFAS No. 144, Accounting for the Impairment or Disposal of Long-Lived Assets. Therefore, long-lived assets, including intangible assets with finite useful lives, were subsequently tested for impairment during the three months ended August 31, 2009. Recoverability of the identified asset groups was tested using future cash flow projections based on management’s long range estimates of market conditions. The sum of the undiscounted future cash flows related to each asset group was more than the net book value for each of the asset groups; therefore, there was no impairment loss at August 31, 2009.
We test our goodwill balances for impairment annually, during the fourth quarter, and more frequently if events or changes in circumstances indicate that goodwill may be impaired. We test goodwill at the business segment level as we have determined that the characteristics of the reporting units within each business segment are similar and allow for their aggregation to the business segment level for testing purposes. The test consists of determining the fair value of the business segments, using discounted cash flows, and comparing the result to the carrying values of the business segments. If the estimated fair value of a business segment exceeds its carrying value, there is no impairment. If the carrying amount of the business segment exceeds its estimated fair value, an impairment of the goodwill is indicated. The amount of the impairment would be determined by establishing the fair value of all assets and liabilities of the business segment, excluding the goodwill, and comparing the total to the estimated fair value of the business segment. The difference would represent the fair value of the goodwill; and, if it is lower than the book value of the goodwill, the difference would be recorded as a loss in the consolidated statements of earnings.
During the quarter ended August 31, 2009, we tested the value of the goodwill balances in the Construction Services business segment, as weakness in the construction market continued. For the test, we have assumed the revenue growth rate would range from 5% to 10%, after a significant decrease in revenue for fiscal 2010. In the near term, we expect a higher rate due to pent-up demand and growth in the market share of our Construction Services business segment. Growth is then estimated to slow to 5% in the latter years of the forecast. The revenue growth rates for fiscal periods subsequent to fiscal 2010 used in our analysis as of May 31, 2009 were 5% to 7.5%, and were changed to reflect the expected recovery from more depressed levels of business. We set the discount rate at 12%, consistent with that used in the fiscal 2009 annual testing. Based on this test, there was no indication of impairment for the associated goodwill balances. We also performed the same test using a 14% discount rate, which indicated no impairment as well.
We will continue to test goodwill and other long-lived assets for impairment in each reporting period in which indicators, or potential indicators, of impairment are present. We will also perform the required annual test of impairment for the goodwill balances related to the Pressure Cylinders and Construction Services business segments during the fourth quarter ending May 31, 2010.
NOTE J – Restructuring
In the first quarter of fiscal 2008, we announced the initiation of a Transformation Plan (the “Plan”) with the overall goal to increase the Company’s sustainable earnings potential, asset utilization and operational performance. The Plan is being implemented over a three-year period and focuses on cost reduction, margin expansion and organizational capability improvements, and in the process drives excellence in three core competencies: sales, operations and supply chain management. The Plan is comprehensive in scope and includes aggressive diagnostic and implementation phases in the Steel Processing and Metal Framing business segments.
To assist in the development and implementation of the Plan, a consulting firm was retained. The services provided by this firm included assistance through diagnostic tools, performance improvement technologies, project
10
Table of Contents
management techniques, benchmarking information and insights that directly relate to the Plan. Accordingly, the firm’s fees were included in restructuring charges. To date, the following actions have been taken:
| — | On September 25, 2007, we announced the closure or downsizing of five locations in our Metal Framing segment. These actions were completed as of May 31, 2008. |
| — | During the first quarter of fiscal 2009, the Metal Framing corporate offices were moved from Pittsburgh and Blairsville, Pennsylvania to Columbus, Ohio. |
| — | Headcount was reduced through a combination of voluntary retirement and severance packages. |
| — | On October 23, 2008, we announced the closure of two facilities, one Steel Processing (Louisville, Kentucky) and one Metal Framing (Renton, Washington), and headcount reductions of 282. The Louisville facility was closed on February 28, 2009, and the Renton facility closed on December 31, 2008. |
| — | On December 5, 2008, we announced the closure and suspension of operations at three Metal Framing facilities and headcount reductions in Steel Processing of 186 and in Metal Framing of 125. The Lunenburg, Massachusetts facility closed on February 28, 2009, and operations suspended in Miami, Florida and Phoenix, Arizona on February 28, 2009. |
| — | In August 2009, the Lunenburg, Massachusetts facility met the held for sale classification criteria under applicable accounting guidance. After an immaterial adjustment to fair value, that facility ($1,235,000) has been included as assets held for sale in the consolidated balance sheet as of August 31, 2009. |
| — | The decision was made during the first quarter of fiscal 2010 to close the Joliet, Illinois Metal Framing facility. A majority of the roll forming operation located there will be moved to the Hammond, Indiana facility. Approximately $1,717,000 was recognized in impairment related to this closure during the three months ended August 31, 2009. |
In connection with the Plan, a total of $64,778,000 has been recorded to date as restructuring charges in the consolidated statements of earnings: $18,111,000 and $43,041,000 were incurred in fiscal 2008 and fiscal 2009, respectively, and $3,626,000 was incurred during the first three months of fiscal 2010. Restructuring charges for the first three months of fiscal 2010 are summarized as follows:
| (in thousands) | 5/31/2009 Liability |
Expense | Payments | Adjustments | 8/31/2009 Liability | ||||||||||||
| Early retirement and severance |
$ | 3,201 | $ | 353 | $ | (1,395 | ) | $ | (52 | ) | $ | 2,107 | |||||
| Other costs |
999 | 450 | (981 | ) | - | 468 | |||||||||||
| $ | 4,200 | 803 | $ | (2,376 | ) | $ | (52 | ) | $ | 2,575 | |||||||
| Non-cash charges |
2,823 | ||||||||||||||||
| Total |
$ | 3,626 | |||||||||||||||
An estimated $2,400,000 of additional restructuring charges is expected to be incurred under the Plan during the remainder of fiscal 2010. These expected remaining costs will not include a significant amount of external professional fees, as responsibility for executing the Plan has been successfully transitioned to our internal transformation teams.
NOTE K – Acquisitions
Effective June 1, 2009, we adopted SFAS No. 141 (revised 2007), Business Combinations (“SFAS No. 141(R)”), the provisions of which are aimed at improving the relevance, representational faithfulness and comparability of the information that a reporting entity provides in its financial reports about a business combination and its effects. For the Company, SFAS No. 141(R) applies prospectively to business combinations after May 31, 2009. As a result of adopting the provisions of SFAS 141(R), transaction costs associated with the acquisition of the assets related to the business of Piper Metal Forming Corporation, U.S. Respiratory, Inc. and Pacific Cylinders, Inc. (collectively, “Piper”) were expensed, and a gain on the transaction was recorded, as discussed below.
Effective June 1, 2009, we also adopted FSP No. FAS 141(R)-1, Accounting for Assets Acquired and Liabilities Assumed in a Business Combination That Arise from Contingencies (“FSP No. 141(R)-1”). FSP No. 141(R)-1 requires that assets acquired and liabilities assumed in a business combination that arise from contingencies be recognized at fair value if fair value can be reasonably estimated. The adoption of this pronouncement did not have a material impact on the Company’s consolidated financial statements.
11
Table of Contents
On June 1, 2009, Worthington purchased substantially all of the assets of Piper for cash of $9,713,000. Piper is a leading manufacturer of aluminum high pressure cylinders and impact extruded steel and aluminum parts, serving the medical, automotive, defense, oil services and other commercial markets, with one manufacturing location in New Albany, Mississippi. It operates as part of Worthington’s Pressure Cylinders business segment. Piper’s aluminum products increase our line of industrial gas product offerings and present an opportunity to increase our participation in the growing medical market.
The purchase price was allocated to the acquired assets and assumed liabilities based on their estimated fair values at the date of acquisition, with the gain on the acquisition of $1,123,000 representing the excess of the fair value allocated to the net assets over the purchase price. The Company was able to realize a gain on this transaction as a result of current market conditions and the seller’s desire to exit the business. The gain on this transaction is recorded within other income on the consolidated statements of earnings. While the Company does not anticipate any changes to the initial accounting for this transaction, final review of the purchased net assets and related fair value determinations remains in process and could result in future adjustments within the measurement period, as defined within applicable accounting guidance.
The allocation was as follows:
| (in thousands) | ||||
| Accounts receivable |
$ | 4,043 | ||
| Inventory |
4,142 | |||
| Other current assets |
296 | |||
| Property, plant and equipment, net |
4,300 | |||
| Total assets |
12,781 | |||
| Accounts payable |
(1,670 | ) | ||
| Accrued liabilities |
(275 | ) | ||
| Identifiable net assets |
10,836 | |||
| Gain on acquisition |
(1,123 | ) | ||
| Total purchase price |
$ | 9,713 | ||
Operating results of Piper have been included in the consolidated statements of earnings from the acquisition date forward, which was the first day of fiscal 2010. Pro forma results including the acquired business since the beginning of fiscal 2009 would not be materially different than the prior period results reported.
NOTE L – Fair Value
Effective June 1, 2008, we adopted SFAS No. 157. SFAS No. 157 establishes a framework for measuring fair value and expands disclosures about fair value measurements. SFAS No. 157 was effective for our financial assets and liabilities after May 31, 2008, and was effective for our non-financial assets and liabilities after May 31, 2009. The adoption of SFAS No. 157 did not have a material impact on amounts within our consolidated financial statements.
SFAS No. 157 clarifies that fair value is an exit price, representing the amount that would be received to sell an asset, or paid to transfer a liability, in an orderly transaction between market participants. Fair value should be determined based on assumptions that market participants would use in pricing an asset or liability. SFAS No. 157 uses a three-tier hierarchy that classifies assets and liabilities based on the inputs used in the valuation methodologies. In accordance with SFAS No. 157, we measured our derivative contracts at fair value. We classified these as level 2 assets and liabilities for purposes of SFAS No. 157 as they are based upon models utilizing market observable inputs and credit risk. Derivative instruments are executed only with highly rated financial institutions. No credit loss is anticipated on existing instruments, and no such material losses have been experienced to date. The Company continues to monitor its positions, as well as the credit ratings of counterparties to those positions.
12
Table of Contents
At August 31, 2009, our financial assets and liabilities measured at fair value on a recurring basis were as follows:
| (in thousands) | Quoted Prices in Active Markets (Level 1) |
Significant Other Observable Inputs (Level 2) |
Significant Unobservable Inputs (Level 3) |
Totals | ||||||||
| Assets | ||||||||||||
| Foreign currency derivative contracts |
$ | - | $ | 78 | $ | - | $ | 78 | ||||
| Liabilities | ||||||||||||
| Foreign currency derivative contracts |
$ | - | $ | 340 | $ | - | $ | 340 | ||||
| Interest rate derivative contracts |
- | 7,850 | - | 7,850 | ||||||||
| Total liabilities |
$ | - | $ | 8,190 | $ | - | $ | 8,190 | ||||
Refer to “NOTE N – Derivative Instruments and Hedging Activities” for additional information regarding the location within the consolidated balance sheets and the risk classification of the Company’s derivative instruments.
The fair values of the Company’s assets measured on a non-recurring basis during the first quarter ended August 31, 2009 are categorized as follows:
| (in thousands) | Quoted Prices in Active Markets (Level 1) |
Significant Other Observable Inputs (Level 2) |
Significant Unobservable Inputs (Level 3) |
Totals | ||||||||
| Assets |
||||||||||||
| Long-lived assets held for sale |
$ | - | $ | 1,235 | $ | - | $ | 1,235 | ||||
| Long-lived assets held and used |
- | 3,848 | - | 3,848 | ||||||||
| Total assets |
$ | - | $ | 5,083 | $ | - | $ | 5,083 | ||||
Assets of the Lunenburg, Massachusetts Metal Framing facility were written down to their fair value of $1,235,000, resulting in an impairment charge of $311,000; which was included in net earnings for the three months ended August 31, 2009. See “NOTE J – Restructuring” for additional details.
Certain assets of the Joliet, Illinois Metal Framing facility were written down to their fair value of $3,848,000, resulting in an impairment charge of $1,717,000, which was included in net earnings for the three months ended August 31, 2009. See “NOTE J – Restructuring” for additional details.
Effective August 31, 2009, we adopted FSP No. FAS 107-1 and APB 28-1, Interim Disclosures about Fair Value of Financial Instruments (“FSP No. 107-1 and APB 28-1”). FSP No. 107-1 and APB 28-1 amends SFAS No. 107, Disclosures about Fair Value of Financial Instruments, to require disclosures about fair value of financial instruments in interim as well as in annual financial statements. FSP No. 107-1 and APB 28-1 also amends APB Opinion No. 28, “Interim Financial Reporting,” to require those disclosures in all interim financial statements. FSP No. 107-1 and APB 28-1 was effective for all reporting periods ending after June 15, 2009.
The non-derivative financial instruments included in the carrying amounts of cash and cash equivalents, receivables, income tax receivables, other assets, accounts and notes payable, accrued expenses and income taxes payable approximate fair values. The fair value of long-term debt, including current maturities, based upon quoted market prices, was $120,176,000 and $242,136,000 at August 31, 2009 and at May 31, 2009, respectively. See “NOTE M – Debt and Receivables Securitization” for a description of the repurchase transaction that caused a substantial decrease in the outstanding amounts of both the carrying and fair values of our 6.7% senior notes.
13
Table of Contents
NOTE M – Debt and Receivables Securitization
On June 12, 2009, we redeemed $118,545,000 of the then $138,000,000 outstanding 6.7% senior notes due December 1, 2009 (the “Notes”), leaving $19,455,000 of the Notes outstanding at August 31, 2009. The consideration paid for the Notes was $1,025 per $1,000 principal amount of the Notes, plus accrued and unpaid interest. The repurchase was funded by a combination of cash on hand and borrowings under existing credit facilities, in an effort to reduce interest expense.
We have a $435,000,000 multi-year revolving credit facility (the “Facility”) with a group of lenders. The Facility matures in May 2013, except for a $35,000,000 commitment by one lender, which expires in September 2010. The outstanding balance under the Facility at August 31, 2009 was $95,440,000, leaving $339,560,000 available. Additionally, at August 31, 2009, we had $100,000,000 floating rate senior notes outstanding, which are due on December 17, 2014 (the “2014 Notes”) and bear interest at a variable rate equal to six-month LIBOR plus 80 basis points. However, we entered into an interest rate swap agreement whereby we receive interest on the $100,000,000 notional amount at the six-month LIBOR rate and we pay interest on the same notional amount at a fixed rate of 4.46%, effectively fixing the interest rate at 5.26%. See NOTE N – Derivative Instruments and Hedging Activities” for additional information regarding the Company’s derivative instruments.
We maintain a $100,000,000 revolving trade accounts receivable securitization facility, which expires in January 2011 (the “AR Facility”). The AR Facility has been available throughout fiscal 2010 to date, and was available throughout fiscal 2009. Transactions under the AR Facility have been accounted for as a sale under the provisions of SFAS No. 140, Accounting for Transfers and Servicing of Financial Assets and Extinguishments of Liabilities. Pursuant to the terms of the AR Facility, certain of our subsidiaries sell their accounts receivable without recourse, on a revolving basis, to Worthington Receivables Corporation (“WRC”), a wholly-owned, consolidated, bankruptcy-remote subsidiary. In turn, WRC may sell without recourse, on a revolving basis, up to $100,000,000 of undivided ownership interests in this pool of accounts receivable to a multi-sell, asset-backed commercial paper conduit (the “Conduit”). Purchases by the Conduit are financed with the sale of A1/P1 commercial paper. We retain an undivided interest in this pool and are subject to risk of loss based on the collectability of the receivables from this retained interest. Because the amount eligible to be sold excludes receivables more than 90 days past due, receivables offset by an allowance for doubtful accounts due to bankruptcy or other cause, receivables from foreign customers, concentrations over certain limits with specific customers and certain reserve amounts, we believe additional risk of loss is minimal. The book value of the retained portion of the pool of accounts receivable approximates fair value. Accounts receivable sold under the AR Facility are excluded from accounts receivable in the consolidated financial statements. As of August 31, 2009, the pool of eligible accounts receivable was $76,200,000, and $55,000,000 of undivided ownership interests in this pool of accounts receivable had been sold.
NOTE N – Derivative Instruments and Hedging Activities
Interest Rate Risk – We entered into an interest rate swap in October 2004, which was amended December 17, 2004. The swap had a notional amount of $100,000,000 to hedge changes in cash flows attributable to changes in the LIBOR rate associated with the December 17, 2004 issuance of the 2014 Notes (see “NOTE M – Debt and Receivables Securitization”). We pay a fixed rate of 4.46% and receive a variable rate based on six-month LIBOR. The interest rate derivative is classified as a cash flow hedge per SFAS No. 133, Accounting for Derivative Instruments and Hedging Activities (“SFAS No. 133”). The effective portion of the change in the fair value of the derivative is recorded in other comprehensive income and is reclassified to interest expense in the period in which earnings are impacted by the hedged items or in the period that the transaction no longer qualifies as a cash flow hedge.
Foreign Currency Risk – The translation of foreign currencies into United States Dollars subjects the Company to exposure related to fluctuating exchange rates. Derivative instruments are not used to manage this risk; however, the Company does make use of forward contracts to manage exposure to certain inter-company loans with our foreign affiliates. Such contracts limit exposure to both favorable and unfavorable currency fluctuations. At August 31, 2009, the difference between the contract and book value was not material to the Company’s consolidated financial position, results of operations or cash flows. The changes in the fair value of the derivative instruments are recorded either in the consolidated balance sheets under foreign currency translation or in net earnings in the same period in which foreign currency translation or net earnings are impacted by the hedged items.
14
Table of Contents
Commodity Price Risk – The Company attempts to negotiate the best prices for commodities and to competitively price products and services to reflect the fluctuations in market prices. To further manage its exposure to fluctuations in the cost of steel, natural gas, zinc and other raw materials and utility requirements, the Company has used derivative instruments to cover periods commensurate with known or expected exposures. However, no such instruments were in place at August 31, 2009. No derivative instruments are held for trading purposes. When in place, the effective portion of the changes in the fair value of cash flow derivatives are recorded in other comprehensive income and reclassified to cost of goods sold in the period in which earnings are impacted by the hedged items or in the period that the transaction no longer qualifies as a cash flow hedge. If the derivative instruments do not qualify for hedge accounting under SFAS No. 133, changes in their fair value are recorded in cost of goods sold.
Refer to “NOTE L – Fair Value” for additional information regarding the accounting treatment and Company policy for derivative instruments, as well as how fair value is determined for the Company’s derivative instruments. The fair value of derivative instruments at August 31, 2009 is summarized in the following table:
| Asset Derivatives |
Liability Derivatives | |||||||||
| (in thousands) | Balance Sheet |
Fair Value |
Balance Sheet |
Fair Value | ||||||
| Derivatives designated as hedging instruments under SFAS 133: |
||||||||||
| Interest rate contracts |
Receivables |
$ | - | Accounts payable |
$ | 1,676 | ||||
| Other assets |
- | Other liabilities |
6,174 | |||||||
| Totals |
- | 7,850 | ||||||||
| Derivatives not designated as hedging instruments under SFAS 133: |
||||||||||
| Foreign exchange contracts |
Receivables |
78 | Accounts payable |
- | ||||||
| Other assets |
- | Other accrued items |
340 | |||||||
| Total Derivatives |
$ | 78 | $ | 8,190 | ||||||
The effect of derivative instruments on the consolidated statement of earnings is summarized in the following tables:
Derivatives designated as cash flow hedging instruments under SFAS 133:
| (in thousands) | Loss Recognized in OCI (Effective Portion) |
Location of Loss |
Loss Reclassified from Accumulated OCI (Effective Portion) |
Location of Loss and Excluded |
Loss (Ineffective Portion) and Excluded from Effectiveness Testing | |||||||||
| For the three months ended August 31, 2009: |
||||||||||||||
| Interest rate contracts |
$ | 1,092 | Interest expense |
$ | (795 | ) | Interest expense |
$ | - | |||||
The estimated net amount of the existing gains or losses in other comprehensive income at August 31, 2009 expected to be reclassified into net earnings within the succeeding twelve months was $1,113,000 (net of tax of $563,000). This amount was computed using the fair value of the cash flow hedges at August 31, 2009, and will change before actual reclassification from other comprehensive income to net earnings during the fiscal years ending May 31, 2010 and 2011.
15
Table of Contents
Derivatives not designated as hedging instruments under SFAS 133:
| (in thousands) | Location of Loss Recognized in Earnings |
Loss Recognized in Earnings for the Three Months Ended August 31, 2009 |
||||
| Foreign exchange contracts |
Miscellaneous expense | $ | (670 | ) | ||
The loss on these derivatives significantly offsets the gain on the hedged items.
NOTE O – Guarantees and Warranties
The Company does not have guarantees that it believes are reasonably likely to have a material current or future effect on our financial condition, changes in financial condition, revenue or expenses, results of operations, liquidity, capital expenditures or capital resources. However, as of August 31, 2009, the Company was party to operating leases for aircraft in which the Company has guaranteed residual values at the termination of the leases. The maximum obligation under these terms was approximately $17,938,000 at August 31, 2009. Based on current facts and circumstances, the Company has estimated the likelihood of payment pursuant to these guarantees, and determined that the fair value of the obligations based on those likely outcomes is not material.
The Company also had in place $9,010,000 of outstanding stand-by letters of credit as of August 31, 2009. These letters of credit were issued to third-party service providers and had no amounts drawn against them at August 31, 2009. Fair value of these guarantee instruments, based on premiums paid, was not material at August 31, 2009.
We have established reserves for anticipated sales returns and allowances, including limited warranties on certain products. The liability for sales returns and allowances is primarily based on historical experience and current information. The liability amounts related to warranties were immaterial at August 31, 2009 and 2008.
NOTE P – Subsequent Events
Effective August 31, 2009, we adopted SFAS No. 165, Subsequent Events (“SFAS No. 165”). SFAS No. 165 established general standards of accounting for and disclosure of events that occur after the balance sheet date, but before financial statements are issued. SFAS No. 165 requires disclosure of the date through which subsequent events are evaluated and whether the date corresponds with the time at which the financial statements were available for issue (as defined) or were issued. Accordingly, subsequent events have been evaluated through October 13, 2009, the date of issuance of our consolidated financial statements.
On September 3, 2009, the Company acquired Structural Composites Industries, LLC (“SCI”) for cash of $24,351,000. SCI is a leading manufacturer of U.S. Department of Transportation-approved lightweight, aluminum-lined, composite-wrapped high pressure cylinders used in commercial, military, marine and aerospace applications. Product lines include cylinders for alternative fuel vehicles using natural gas or hydrogen, self-contained breathing apparatuses, aviation oxygen and escape slides, military applications, home oxygen therapy, and advanced and cryogenic structures. The purchase price allocation and related initial accounting for this transaction are not yet complete.
16
Table of Contents
Item 2. – Management’s Discussion and Analysis of Financial Condition and Results of Operations
Selected statements contained in this “Item 2. – Management’s Discussion and Analysis of Financial Condition and Results of Operations” constitute “forward-looking statements” as that term is used in the Private Securities Litigation Reform Act of 1995. Such forward-looking statements are based, in whole or in part, on management’s beliefs, estimates, assumptions and currently available information. For a more detailed discussion of what constitutes a forward-looking statement and of some of the factors that could cause actual results to differ materially from such forward-looking statements, please refer to the “Safe Harbor Statement” in the beginning of this Quarterly Report on Form 10-Q and “Part I - Item 1A. - Risk Factors” of our Annual Report on Form 10-K for the fiscal year ended May 31, 2009.
Introduction
The following discussion and analysis of market and industry trends, business strategy, and the results of operations and financial position of Worthington Industries, Inc., together with its subsidiaries (collectively, “we,” “our,” “Worthington,” or our “Company”), should be read in conjunction with our consolidated financial statements included in “Item 1. – Financial Statements” of this Quarterly Report on Form 10-Q. Our Annual Report on Form 10-K for the fiscal year ended May 31, 2009 (“fiscal 2009”) includes additional information about our Company, our operations and our financial position and should be read in conjunction with this Quarterly Report on Form 10-Q.
We are primarily a diversified metal processing company focused on value-added steel processing and manufactured metal products. As of August 31, 2009, excluding our joint ventures, we operated 41 manufacturing facilities worldwide, principally in three reportable business segments: Steel Processing, Metal Framing and Pressure Cylinders. Other business segments, which are immaterial for purposes of separate disclosure, include Automotive Body Panels, Construction Services and Steel Packaging. We also held equity positions in seven joint ventures, which operated 21 manufacturing facilities worldwide.
Overview
For the first quarter of fiscal 2009, we reported the highest net earnings in our Company’s history. Since that time, the global economy has fallen into a deep and extended recession. While there has been some stabilization, the economy has yet to recover. Demand throughout most sectors of the economy remains low. Construction and automotive, our two largest markets, continue to struggle. Normal seasonal shutdowns were greatly extended by many customers, while others put off placing orders as they worked to reduce their own inventory levels in light of the decreased demand for their products. As a result, comparisons of the results for our first quarter ended August 31, 2009 to the first quarter of fiscal 2009 show significant decreases in volumes and earnings. However, the results for the first quarter of fiscal 2010 are improved from those reported for the fourth quarter of fiscal 2009.
In the first quarter of fiscal 2008, we announced the initiation of a Transformation Plan (the “Transformation”) with the overall goal to increase the Company’s sustainable earnings potential, asset utilization and operational performance. We have largely completed our planned efforts under the Transformation within the Steel Processing business segment, and are continuing with similar efforts within our Metal Framing business segment. As we conclude on the execution of the Transformation within Steel Processing and work toward completion of the Metal Framing objectives, we expect restructuring expenses to continue to diminish throughout the year ended May 31, 2010 (“fiscal 2010”). While the Transformation draws closer to its expected completion in the year ended May 31, 2011, we believe its lasting impacts have improved our ability to respond to challenges and opportunities being presented currently, and those that will arise in the future.
Market & Industry Overview
For the three months ended August 31, 2009, our sales breakdown by end user market is illustrated by the following chart. Substantially all of the sales of our Metal Framing and Construction Services segments, as well as approximately 25% of the sales of our Steel Processing segment, are to the construction market, both residential and non-residential. We estimate that approximately 8% of our construction market sales are to the residential market. While the market price of steel significantly impacts this business, there are other key indicators that are meaningful in analyzing construction market demand including U.S. gross domestic product (“GDP”), the Dodge Index of construction contracts, and trends in the relative price of framing lumber and steel. Construction is also the predominant end market for our WAVE joint venture, whose sales are not consolidated in our results. Adding our
17
Table of Contents
ownership percentage of the sales from each of our unconsolidated joint ventures to our reported sales would not materially change the breakdown in the chart.
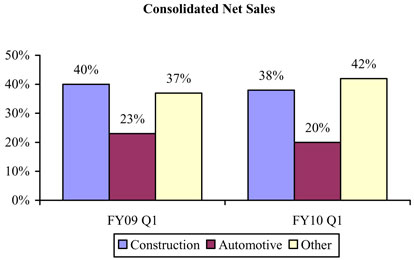
The automotive industry is the largest consumer of flat-rolled steel and thus the largest end market for our Steel Processing segment. Approximately 37% of the sales of our Steel Processing segment, and substantially all of the sales of our Automotive Body Panels segment, are to the automotive market. North American vehicle production, primarily by Chrysler, Ford and General Motors (the “Detroit Three automakers”), has a considerable impact on the customers within these two segments. These segments are also impacted by the market price of steel and, to a lesser extent, the market prices of other commodities used in their operations, such as zinc, natural gas and diesel fuel. The majority of the sales from two of our unconsolidated joint ventures are also made to the automotive end market, though those sales are not consolidated in our results. Adding our ownership percentage of the sales from each of our unconsolidated joint ventures to our reported sales would not materially change the breakdown in the previous chart.
The sales of our Pressure Cylinders and Steel Packaging segments, and approximately 40% of the sales of our Steel Processing segment, are to other markets such as agriculture, appliance, leisure and recreation, distribution and transportation, HVAC, lawn and garden, and consumer specialty products. Given the many different product lines that make up these sales and the wide variety of end markets, it is very difficult to detail the key market indicators that drive this portion of our business. However, we believe that the trend in U.S. GDP growth is a good economic indicator for analyzing these segments.
We use the following information to monitor our costs and major end markets:
| Three Months Ended, | ||||||||
| August 31, | Inc / (Dec) | |||||||
| 2009 | 2008 | |||||||
| U.S. GDP (% growth year-over-year) |
(3.5%) | 0.5% | (4.0%) | |||||
| Hot-Rolled Steel ($ per ton) 1 |
$ | 439 | $ | 1,067 | ($628) | |||
| Detroit Three Auto Build (000’s vehicles) 2 |
989 | 1,750 | (761) | |||||
| No. America Auto Build (000’s vehicles) 2 |
2,063 | 3,114 | (1,051) | |||||
| Dodge Index |
87 | 117 | (30) | |||||
| Framing Lumber ($ per 1,000 board ft) 3 |
$ | 230 | $ | 272 | ($42) | |||
| Zinc ($ per pound) 4 |
$ | 0.75 | $ | 0.83 | ($0.08) | |||
| Natural Gas ($ per mcf) 5 |
$ | 3.57 | $ | 10.77 | ($7.20) | |||
| Retail Diesel Prices, All Types ($ per gallon) 6 |
$ | 2.31 | $ | 4.43 | ($2.12) | |||
| 1 | CRU Index; period average 2 CSM Autobase 3 Random Lengths; period average 4 LME Zinc; period average |
| 5 | NYMEX Henry Hub Natural Gas; period average 6 Energy Information Administration; period average |
18
Table of Contents
U.S. GDP growth rate trends are generally indicative of the strength in demand and, in many cases, pricing for our products. Historically, we have seen that decreasing U.S. GDP growth rates year-over-year can have a negative effect on our results, as a weaker economy generally reduces demand and pricing for our products. Conversely, the opposite is also generally true. Changes in U.S. GDP growth rates can also signal changes in conversion costs related to production and in selling, general and administrative (“SG&A”) expenses.
In recent quarters, the market price of hot-rolled steel has been one of the most significant factors impacting selling prices and has materially impacted earnings. In a rising price environment, such as the first quarter of fiscal 2009, our results are generally favorably impacted as lower-priced material, purchased in previous periods, flows through cost of goods sold, while our selling prices increase at a faster pace to cover current replacement costs. On the other hand, when steel prices fall, we typically have higher-priced material flowing through cost of goods sold while selling prices compress to what the market will bear, negatively impacting our results.
No single customer contributed more than 5% of our consolidated net sales for the quarter. While our automotive business is largely driven by the production schedules of the Detroit Three automakers, our customer base is much broader and includes many of their suppliers as well. Automotive production from the Detroit Three automakers has been low when compared to recent history. However, in the latter half of our fiscal 2010 first quarter production rebounded slightly from recent quarters, aided by the “Cash for Clunkers” federal incentive program, which ended in August. The first half of the fiscal 2010 first quarter was negatively impacted by the extended shutdowns at General Motors and Chrysler, due to their restructuring efforts. We continue to pursue customer diversification beyond the Detroit Three automakers and their suppliers; and, in recent quarters, we have increased our business in other markets such as energy, infrastructure and agriculture.
The Dodge Index represents the value of total construction contracts, including residential and non-residential building construction. This overall index serves as a broad indicator of the construction markets in which we participate, as it tracks actual construction starts. The relative price of framing lumber, an alternative construction material against which we compete, can also affect our Metal Framing segment, as certain applications may permit the use of this alternative building material.
The market prices of certain other commodities such as zinc, natural gas and diesel fuel represent a significant portion of our cost of goods sold, both directly through our plant operations and indirectly through transportation and freight expense. These costs have remained relatively flat compared to last year, but have begun to slowly rise as the economy begins to stabilize.
Recent Developments
The following has taken place during fiscal 2010:
| — | On June 1, 2009, we purchased, for $9.7 million, substantially all of the assets related to the business of Piper Metal Forming Corporation, U.S. Respiratory, Inc. and Pacific Cylinders, Inc. (collectively, “Piper”). These assets and expenses have been included in our Pressure Cylinders business segment and contributed $6.1 million in net sales for the first quarter of fiscal 2010. |
| — | On July 13, 2009, the Serviacero Worthington joint venture opened its greenfield steel processing facility near Monterrey, Mexico. The 65,000 square foot facility, with rail access, currently operates a slitting and packaging line. |
| — | On August 12, 2009, our Metal Framing business segment announced the formation of a joint venture with ClarkWestern Building Systems to co-develop a new ProSTUDTM drywall framing product. The components of the product will be lightweight and feature a number of technological advances to enhance stiffness. We expect that production of this new product will begin in the fourth quarter of calendar 2009. |
| — | On September 3, 2009, we purchased Structural Composites Industries, LLC (SCI), for $24.4 million. SCI is a leading manufacturer of DOT-approved lightweight, aluminum-lined, composite-wrapped high pressure cylinders used in commercial, military, marine and aerospace applications. This operation will be included in our Pressure Cylinders business segment. |
19
Table of Contents
| — | On September 30, 2009, we announced the consolidation, within our Metal Framing business segment, of our Joliet, Illinois roll forming operations into our Hammond, Indiana facility. |
Results of Operations
First Quarter – Fiscal 2010 Compared to Fiscal 2009
Consolidated Operations
The following table presents consolidated operating results for the periods indicated:
| Three Months Ended August 31, | ||||||||||||||||
| (Dollars in millions) | 2009 | % of Net sales |
2008 | % of Net sales |
Increase/ (Decrease) |
|||||||||||
| Net sales |
$ | 417.5 | 100.0% | $ | 913.2 | 100.0% | $ | (495.7 | ) | |||||||
| Cost of goods sold |
368.3 | 88.2% | 761.3 | 83.4% | (393.0 | ) | ||||||||||
| Gross margin |
49.2 | 11.8% | 151.9 | 16.6% | (102.7 | ) | ||||||||||
| Selling, general and administrative expense |
50.0 | 12.0% | 63.4 | 6.9% | (13.4 | ) | ||||||||||
| Restructuring charges |
3.6 | 0.9% | 8.8 | 1.0% | (5.2 | ) | ||||||||||
| Operating income (loss) |
(4.4 | ) | -1.1% | 79.7 | 8.7% | (84.1 | ) | |||||||||
| Miscellaneous income |
1.7 | 0.4% | 0.3 | 0.0% | 1.4 | |||||||||||
| Interest expense |
(2.5 | ) | -0.6% | (5.6 | ) | -0.6% | (3.1 | ) | ||||||||
| Equity in net income of unconsolidated affiliates |
16.1 | 3.9% | 25.0 | 2.7% | (8.9 | ) | ||||||||||
| Income tax expense |
(3.3 | ) | -0.8% | (30.1 | ) | -3.3% | (26.8 | ) | ||||||||
| Net earnings |
7.6 | 1.8% | 69.3 | 7.6% | (61.7 | ) | ||||||||||
| Net earnings attributable to noncontrolling interest |
(0.9 | ) | -0.2% | (0.7 | ) | -0.1% | (0.2 | ) | ||||||||
| Net earnings attributable to controlling interest |
$ | 6.7 | 1.6% | $ | 68.6 | 7.5% | $ | (61.9 | ) | |||||||
Net earnings represent the results for our consolidated operations, including 100% of our consolidated joint venture, Spartan, of which we own 52%. The noncontrolling interest, or 48% of Spartan, is subtracted to arrive at net earnings attributable to controlling interest (i.e. Worthington). For the first quarter of fiscal 2010, net earnings attributable to controlling interest were $6.7 million, a decrease of $61.9 million from the record prior year first quarter.
| — | Net sales decreased $495.7 million from the prior year to $417.5 million. Lower volumes in all business segments, decreased sales by $363.6 million, most notably in our Metal Framing and Steel Processing segments as demand declined dramatically in the construction and automotive sectors. Average selling prices decreased over the prior year due to the lower cost of steel, resulting in decreased sales of $132.1 million. |
| — | Gross margin decreased $102.7 million from the prior year, primarily as a result of the lower volumes experienced in all of our business segments, along with compressed market spreads. |
| — | SG&A expense decreased $13.4 million from the prior year, primarily due to reduced compensation expense, as headcount has declined and profit sharing was down significantly due to lower earnings. |
| — | Restructuring charges totaled $3.6 million compared to $8.8 million in the prior year. All of these charges related to the Transformation and include charges related to facility closures, layoffs and other associated expenses. |
| — | Interest expense decreased $3.1 million over the prior year due to lower average short-term borrowings, the repurchase of long-term notes completed in June 2009 and lower market interest rates. |
| — | Equity in net income of unconsolidated affiliates declined $8.9 million from the first quarter of fiscal 2009, to $16.1 million. The vast majority of the equity in net income of unconsolidated affiliates is from WAVE, where our portion of their earnings declined 27% from last year’s first quarter, to $15.6 million. See “Item 1. – Financial Statements – Notes to Consolidated Financial Statements – NOTE H – Investments in |
20
Table of Contents
| Unconsolidated Affiliates” of this Quarterly Report on Form 10-Q for more financial information on our unconsolidated affiliates. |
| — | Income tax expense decreased $26.8 million due to lower quarterly earnings. The current quarter expense of $3.3 million was calculated using an estimated annual effective tax rate of 33.6%, versus 30.5% in the prior year quarter. The change in the estimated annual effective tax rate is primarily due to the change in the mix of income among the jurisdictions in which we do business. See “Item 1. – Financial Statements – Notes to Consolidated Financial Statements – NOTE G – Income Taxes” of this Quarterly Report on Form 10-Q for more information on our tax rates. |
Segment Operations
Steel Processing
The following table presents a summary of operating results for our Steel Processing business segment for the periods indicated:
| Three Months Ended August 31, | ||||||||||||||
| (Dollars in millions) | 2009 | % of Net sales |
2008 | % of Net sales |
Increase/ (Decrease) |
|||||||||
| Net sales |
$ | 181.6 | 100.0% | $ | 459.9 | 100.0% | $ | (278.3 | ) | |||||
| Cost of goods sold |
164.4 | 90.5% | 388.7 | 84.5% | (224.3 | ) | ||||||||
| Gross margin |
17.2 | 9.5% | 71.2 | 15.5% | (54.0 | ) | ||||||||
| Selling, general and administrative expense |
15.9 | 8.8% | 26.8 | 5.8% | (10.9 | ) | ||||||||
| Restructuring charges |
0.5 | 0.3% | - | 0.0% | 0.5 | |||||||||
| Operating income |
$ | 0.8 | 0.4% | $ | 44.4 | 9.7% | $ | (43.6 | ) | |||||
| Material cost |
$ | 130.1 | $ | 330.9 | $ | (200.8 | ) | |||||||
| Tons shipped (in thousands) |
401 | 751 | (350 | ) | ||||||||||
Net sales and operating income highlights were as follows:
| — | Net sales decreased $278.3 million from the prior year to $181.6 million. Unfavorable economic conditions continued to weaken demand in many customer groups, causing a 47% reduction in volume from the prior year and a resulting $192.0 million decrease in net sales. With the cost of steel declining from record highs in the year ago quarter, our average selling prices also declined and negatively impacted net sales by $86.3 million. |
| — | Operating income for the quarter decreased from the $44.4 million reported last year, to $0.8 million. Of the decrease, $31.8 million was due to lower volumes and $24.7 million was due to a smaller spread between average selling prices and material costs. Partially offsetting this decrease was a $10.9 million reduction in SG&A expense, which resulted from lower compensation expense due to reduced headcount and lower profit sharing and bonuses, as well as to savings across several categories driven by the Transformation. |
21
Table of Contents
Metal Framing
The following table presents a summary of operating results for our Metal Framing business segment for the periods indicated:
| Three Months Ended August 31, | |||||||||||||||
| (Dollars in millions) | 2009 | % of Net sales |
2008 | % of Net sales |
Increase/ (Decrease) |
||||||||||
| Net sales |
$ | 95.4 | 100.0% | $ | 232.9 | 100.0% | $ | (137.5 | ) | ||||||
| Cost of goods sold |
84.4 | 88.5% | 193.4 | 83.0% | (109.0 | ) | |||||||||
| Gross margin |
11.0 | 11.5% | 39.5 | 17.0% | (28.5 | ) | |||||||||
| Selling, general and administrative expense |
11.7 | 12.3% | 17.2 | 7.4% | (5.5 | ) | |||||||||
| Restructuring charges |
3.6 | 3.8% | 1.3 | 0.6% | 2.3 | ||||||||||
| Operating income (loss) |
$ | (4.3 | ) | -4.5% | $ | 21.0 | 9.0% | $ | (25.3 | ) | |||||
| Material cost |
$ | 58.5 | $ | 152.8 | $ | (94.3 | ) | ||||||||
| Tons shipped (in thousands) |
83 | 153 | (70 | ) | |||||||||||
Net sales and operating income (loss) highlights were as follows:
| — | Net sales decreased $137.5 million from the prior year to $95.4 million, as a 46% decline in volume and lower average selling prices reduced net sales by $103.2 million and $34.3 million, respectively. |
| — | The operating loss of $4.3 million was a significant change from the operating income of $21.0 million reported last year. Of the decline, $24.8 million was caused by lower sales volumes and $9.2 million related to a smaller spread between average selling prices and material costs. These negative impacts were partially offset by lower manufacturing and SG&A expenses. Manufacturing expenses declined as a result of savings related to previously announced plant closures, headcount reductions and lower variable expenses related to volume. SG&A expense declined mainly due to lower compensation expense caused by headcount reductions. |
Pressure Cylinders
The following table presents a summary of operating results for our Pressure Cylinders business segment for the periods indicated:
| Three Months Ended August 31, | ||||||||||||||
| (Dollars in millions) | 2009 | % of Net sales |
2008 | % of Net sales |
Increase/ (Decrease) |
|||||||||
| Net sales |
$ | 101.3 | 100.0% | $ | 148.4 | 100.0% | $ | (47.1 | ) | |||||
| Cost of goods sold |
82.1 | 81.0% | 117.1 | 78.9% | (35.0 | ) | ||||||||
| Gross margin |
19.2 | 19.0% | 31.3 | 21.1% | (12.1 | ) | ||||||||
| Selling, general and administrative expense |
13.0 | 12.8% | 12.6 | 8.5% | 0.4 | |||||||||
| Restructuring charges |
0.3 | 0.3% | - | 0.0% | 0.3 | |||||||||
| Operating income |
$ | 5.9 | 5.8% | $ | 18.7 | 12.6% | $ | (12.8 | ) | |||||
| Material cost |
$ | 45.8 | $ | 70.0 | $ | (24.2 | ) | |||||||
| Units shipped (in thousands) |
13,920 | 12,147 | 1,773 | |||||||||||
Net sales and operating income highlights were as follows:
| — | Net sales decreased $47.1 million from the prior year first quarter, to $101.3 million. While unit volume increased 15% due to the addition of high-volume, low-price products acquired from the Piper acquisition, revenue declined as a result of significantly lower industrial and refrigerant gas cylinder volumes, stemming from the steep declines in these global markets. |
| — | Operating income decreased $12.8 million from last year to $5.9 million, primarily due to the cylinder volume declines discussed above. SG&A expense increased due to the June 2009 acquisition of Piper. |
22
Table of Contents
Other
The “Other” category includes our Automotive Body Panels, Construction Services and Steel Packaging business segments, which are immaterial for purposes of separate disclosure. Also included are income and expense items not allocated to the above reportable business segments. The following table presents a summary of operating results for the “Other” business segments for the periods indicated:
| Three Months Ended August 31, | ||||||||||||||||
| (Dollars in millions) | 2009 | % of Net sales |
2008 | % of Net sales |
Increase/ (Decrease) |
|||||||||||
| Net sales |
$ | 39.2 | 100.0% | $ | 72.0 | 100.0% | $ | (32.8 | ) | |||||||
| Cost of goods sold |
37.5 | 95.7% | 62.0 | 86.1% | (24.5 | ) | ||||||||||
| Gross margin |
1.7 | 4.3% | 10.0 | 13.9% | (8.3 | ) | ||||||||||
| Selling, general and administrative expense |
9.3 | 23.7% | 6.8 | 9.4% | 2.5 | |||||||||||
| Restructuring charges |
(0.7 | ) | -1.8% | 7.5 | 10.4% | (8.2 | ) | |||||||||
| Operating loss |
$ | (6.9 | ) | -17.6% | $ | (4.3 | ) | -6.0% | $ | (2.6 | ) | |||||
Net sales and operating loss highlights were as follows:
| — | Net sales fell $32.8 million from the first quarter of fiscal 2009, to $39.2 million for the first quarter of fiscal 2010. While all three business segments reported lower net sales, the majority of the decrease was attributable to weaker volumes in our Construction Services and Automotive Body Panels segments. Both of these segments have been negatively affected by the economic downturn. |
| — | The operating loss increased by $2.6 million over last year’s operating loss of $4.3 million, to $6.9 million. The unfavorable change in gross margin was primarily due to the lower volumes mentioned previously and increased expenses in the Construction Services business segment. This was almost entirely offset by lower Transformation-related restructuring charges, as the outside consulting fees associated with this effort have ceased. SG&A expenses are higher than the first quarter of fiscal year 2009 due to an increased accrual for professional fees. |
Liquidity and Capital Resources
During the three month period ended August 31, 2009, we generated cash from operating activities of $96.2 million. We reduced current maturities of long-term debt by $118.5 million, funded partially with increased short-term borrowings of $94.5 million, for a net borrowing decrease of $24.0 million. This was achieved while we also paid $7.9 million in dividends, made $7.7 million of capital expenditures, completed a $9.7 million acquisition and increased our cash position by $46.1 million. The following table is a summary of our consolidated cash flows:
| Three Months Ended August 31, |
||||||||
| (in millions) | 2009 | 2008 | ||||||
| Net cash provided by operating activities |
$ | 96.2 | $ | 22.3 | ||||
| Net cash used by investing activities |
(17.2 | ) | (51.8 | ) | ||||
| Net cash provided (used) by financing activities |
(32.9 | ) | 30.5 | |||||
| Increase in cash and cash equivalents |
46.1 | 1.0 | ||||||
| Cash and cash equivalents at beginning of period |
56.3 | 73.8 | ||||||
| Cash and cash equivalents at end of period |
$ | 102.4 | $ | 74.8 | ||||
23
Table of Contents
We believe we have access to adequate resources to meet our needs for normal operating costs, mandatory capital expenditures, mandatory debt redemptions, dividend payments and working capital for our existing businesses. These resources include cash and cash equivalents, cash provided by operating activities and unused lines of credit. Given the current uncertainty in the financial markets, our ability to access capital and the terms under which we can do so may change. Should the Company be required to raise capital in this environment, potential outcomes might include higher borrowing costs, less available capital, more stringent terms and tighter covenants, or in extreme conditions, an inability to raise capital.
Operating Activities
Our business is cyclical and cash flows from operating activities may fluctuate during the year and from year-to-year due to economic conditions. We rely on cash and short-term financing to meet cyclical increases in working capital needs. Cash requirements generally rise during periods of increased economic activity or increasing raw material prices due to higher levels of inventory and accounts receivable. During economic slowdowns, or periods of decreasing raw material costs, cash requirements generally decrease as a result of the reduction of inventories and accounts receivable. With lower cash requirements, we are typically able to reduce, or eliminate, short-term debt.
During the first three months of fiscal 2010, net cash provided by operating activities increased $73.9 million from the same period of fiscal 2009, largely as a result of significant cash generated by a decrease in inventories. This decrease in inventory levels was due mainly to the significantly lower sales volumes experienced over the several most recent fiscal quarters, the related Company effort to consciously reduce inventory levels and a current period increase in volumes, relative to those recent quarterly periods, that depleted on-hand inventories. Net operating cash inflow was also aided somewhat by an increase in accounts payable balances compared to those reported in the same period last year.
We review our receivables on an ongoing basis to ensure they are properly valued. Based on this review, we believe our reserve for doubtful accounts is sized appropriately. However, if the economic environment and market conditions do not improve, particularly in the automotive and construction markets where our exposure is greatest, additional reserves may be required.
As noted above, while an economic slowdown adversely affects sales, it generally decreases working capital needs. We will continue to adjust operating activities and cash needs based on economic conditions and their impact on our markets and businesses.
Investing Activities
Net cash used by investing activities decreased $34.6 million during the first three months of fiscal 2010, compared to the same period of fiscal 2009. In fiscal 2010, we have had lower acquisition and investment outlays, as well as a decrease in capital spending. The price paid for the acquisition of Piper in the current year was significantly less than the price of the acquisition of the Sharon Companies in the prior year; and, capital spending was reduced, largely based on the status of projects underway and an effort by management to reduce spending in this area.
Investment activities are largely discretionary, and future investment activities could be reduced significantly as economic conditions warrant. We assess acquisition opportunities as they arise, and such opportunities may require additional financing. There can be no assurance, however, that any such opportunities will arise, that any such acquisitions will be consummated, or that any needed additional financing will be available on satisfactory terms when required.
Financing Activities
The net cash used by financing activities was $32.9 million during the first three months of fiscal 2010, compared to $30.5 million of net cash provided by financing activities in the same period of fiscal 2009. This change was primarily due to a net decrease in overall borrowings of $24.1 million in the first quarter of fiscal 2010, versus a net increase in borrowings of $56.0 million in the prior year. That impact was partially offset by lower common share repurchases and dividend payments in the current quarter.
Our credit ratings at August 31, 2009 were unchanged from those reported as of May 31, 2009.
24
Table of Contents
Long-term debt – As of August 31, 2009, we were in compliance with our long-term debt covenants. Our long-term debt agreements do not include ratings triggers or material adverse change provisions.
On June 12, 2009, we redeemed $118.5 million of the then $138.0 million outstanding 6.7% notes due December 1, 2009 (“Notes”). The consideration paid for the Notes was $1,025 per $1,000 principal amount of Notes, plus accrued and unpaid interest. The repurchase was funded by a combination of cash on hand and borrowings under existing credit facilities in an effort to reduce interest expense.
Short-term debt – We maintain a $435.0 million five-year revolving credit facility, which expires in May 2013, except for a $35.0 million commitment by one lender, which expires in September 2010. We were in compliance with our short-term debt covenants at August 31, 2009. Our short-term debt agreements do not include ratings triggers or material adverse change provisions. Current borrowings under this revolving credit facility have maturities of less than one year and given that we intend to repay them within the next year, they have been classified as notes payable. However, we can also extend the term of amounts borrowed by renewing these borrowings for the term of the facility. We have the option to borrow at rates equal to an applicable margin over the LIBOR, Prime or Fed Funds rates. The applicable margin is determined by our credit rating. At August 31, 2009, borrowings under the revolving credit facility bore interest at rates based on LIBOR. We had $339.6 million available to us under this facility at August 31, 2009, compared to $434.0 million available to us at May 31, 2009.
Our most restrictive debt covenants require us to maintain an interest coverage ratio (adjusted EBITDA divided by interest expense, on a trailing 12-month basis) of at least 3.25 times and a consolidated indebtedness to capitalization ratio of not more than 55%. These covenants are tested at the end of each fiscal quarter. At August 31, 2009, the interest coverage ratio was 5.70 times and the consolidated indebtedness to capitalization ratio was 29%.
We also have a $100.0 million revolving trade accounts receivable securitization facility, of which $55.0 million was utilized at August 31, 2009, and $60.0 million was utilized at May 31, 2009. See the description that follows under “Off-Balance Sheet Arrangements.” The securitization facility is backed by a committed liquidity facility that expires during January 2011.
We provided $9.0 million in letters of credit for third-party beneficiaries as of August 31, 2009. The letters of credit secure potential obligations to certain bond and insurance providers. These letters can be drawn at any time at the option of the beneficiaries.
Common shares – Worthington Industries’ Board of Directors declared quarterly dividends of $0.17 per common share in fiscal 2009, until reducing the dividend declared in the fourth quarter of fiscal 2009 to $0.10 per common share, which remained unchanged for the first quarter of fiscal 2010. Dividends paid on our common shares totaled $7.9 million and $13.5 million in the first three months of fiscal 2010 and fiscal 2009, respectively. We currently have no material contractual or regulatory restrictions on the payment of dividends.
At its meeting on September 27, 2006, the Board of Directors of Worthington Industries reconfirmed its authorization to repurchase up to 10,000,000 of Worthington’s outstanding common shares, which had initially been announced on June 13, 2005. This repurchase authorization was completed during December 2007. On September 26, 2007, Worthington announced that the Board of Directors had authorized the repurchase of up to an additional 10,000,000 of Worthington’s outstanding common shares. A total of 8,449,500 common shares remained available under this repurchase authorization as of August 31, 2009. The common shares available for repurchase under this authorization may be purchased from time to time, with consideration given to the market price of the common shares, the nature of other investment opportunities, cash flows from operations, general economic conditions and other relevant considerations. Repurchases may be made on the open market or through privately negotiated transactions. No common share repurchases were made during the first three months of fiscal 2010. During the first three months of fiscal 2009, we spent $12.4 million on common share repurchases.
Dividend Policy
Dividends are declared at the discretion of our Board of Directors. Quarterly, the Board of Directors establishes the dividend rate based upon our financial condition, results of operations, capital requirements, current and projected cash flows, business prospects and other relevant factors. While we have paid a dividend every quarter since becoming a public company in 1968, there is no guarantee that payments will continue in the future.
25
Table of Contents
Contractual Cash Obligations and Other Commercial Commitments
Our contractual cash obligations and other commercial commitments have not changed significantly from those disclosed in “Part II - Item 7. – Management’s Discussion and Analysis of Financial Condition and Results of Operations – Contractual Cash Obligations and Other Commercial Commitments” of our 2009 Form 10-K, other than the changes in borrowings, as described in “Part I – Item 1. – Financial Statements - NOTE M – Debt and Receivables Securitization” of this Quarterly Report on Form 10-Q. Refer to that note for additional information.
Off-Balance Sheet Arrangements
We maintain a $100.0 million revolving trade accounts receivable securitization facility, which expires in January 2011 (the “AR Facility”). The AR Facility has been available throughout fiscal 2010 to date, and was available throughout fiscal 2009. Transactions under the AR Facility have been accounted for as a sale under the provisions of Statement of Financial Accounting Standards (“SFAS”) No. 140, Accounting for Transfers and Servicing of Financial Assets and Extinguishments of Liabilities. Pursuant to the terms of the AR Facility, certain of our subsidiaries sell their accounts receivable without recourse, on a revolving basis, to Worthington Receivables Corporation (“WRC”), a wholly-owned, consolidated, bankruptcy-remote subsidiary. In turn, WRC may sell without recourse, on a revolving basis, up to $100.0 million of undivided ownership interests in this pool of accounts receivable to a multi-sell, asset-backed commercial paper conduit (the “Conduit”). Purchases by the Conduit are financed with the sale of A1/P1 commercial paper. We retain an undivided interest in this pool and are subject to risk of loss based on the collectability of the receivables from this retained interest. Because the amount eligible to be sold excludes receivables more than 90 days past due, receivables offset by an allowance for doubtful accounts due to bankruptcy or other cause, receivables from foreign customers, concentrations over certain limits with specific customers and certain reserve amounts, we believe additional risk of loss is minimal. The book value of the retained portion of the pool of accounts receivable approximates fair value. Accounts receivable sold under the AR Facility are excluded from accounts receivable in the consolidated financial statements. As of August 31, 2009, the pool of eligible accounts receivable was $76.2 million, and $55.0 million of undivided ownership interests in this pool of accounts receivable had been sold.
We do not have guarantees or other off-balance sheet financing arrangements that we believe are reasonably likely to have a material current or future effect on our financial condition, changes in financial condition, revenue or expenses, results of operations, liquidity, capital expenditures or capital resources. However, as of August 31, 2009, the Company was party to operating leases for aircraft in which the Company has guaranteed residual values at the termination of the leases. The maximum obligation under these terms was approximately $17.9 million at August 31, 2009. Based on current facts and circumstances, the Company has estimated the likelihood of payment pursuant to this guarantee, and determined that the fair value of the obligation based on those likely outcomes is not material.
Recently Issued Accounting Standards
In December 2008, the Financial Accounting Standards Board (“FASB”) issued FSP No. FAS 132(R)-1, Employers’ Disclosures about Postretirement Benefit Plan Assets—an amendment of FASB Statement No. 132(R) (“FSP FAS 132(R)-1”). FSP FAS 132(R)-1 expands the disclosure requirements under FASB Statement No. 132(R), Employers’ Disclosures about Pensions and Other Postretirement Benefits to include disclosure on investment policies and strategies, major categories of plan assets, fair value measurements for each major category of plan assets segregated by fair value hierarchy level as defined in SFAS 157, the effect of fair value measurements using Level 3 inputs on changes in plan assets for the period, and significant concentrations of risk within plan assets. FSP FAS 132(R)-1 is effective for financial statements issued for fiscal years ending after December 15, 2009. The adoption of this standard will require expanded disclosure in the notes to the Company’s consolidated financial statements but will not impact amounts within our consolidated financial statements.
In June 2009, the FASB issued SFAS No. 166, Accounting for Transfers of Financial Assets—an amendment of FASB Statement No. 140 (“SFAS No. 166”). SFAS No. 166 amends the guidance on transfers of financial assets and impacts new transfers of many types of financial assets (e.g., factoring arrangements and sales of trade receivables, mortgages and installment loans). SFAS No. 166 is effective for fiscal years beginning after November 15, 2009, and in interim periods within those fiscal years. We are currently evaluating the impact of this statement.
26
Table of Contents
In June 2009, the FASB issued SFAS No. 167, Amendments to FASB Interpretation No. 46(R) (“SFAS No. 167”). SFAS No. 167 amends the consolidation guidance for variable-interest entities (“VIE”) under FIN 46(R). SFAS No. 167 makes significant changes to the model for determining who should consolidate a VIE, and also addresses how often this assessment should be performed. SFAS No. 167 is effective as of the beginning of the first annual reporting period that begins after November 15, 2009, and interim periods within that annual period. We are currently evaluating the impact of this statement.
In June 2009, the FASB issued SFAS No. 168, The FASB Accounting Standards CodificationTM and the Hierarchy of Generally Accepted Accounting Principles—a replacement of FASB Statement No. 162 (“SFAS No. 168”). On the effective date of this Statement, the Codification will supersede all then-existing non-SEC accounting and reporting standards. All other non-grandfathered, non-SEC accounting literature not included in the Codification will become non-authoritative. This Statement is effective for financial statements issued for interim and annual periods ending after September 15, 2009. We do not expect this pronouncement to have a material impact on our consolidated financial statements, though it will change the manner in which accounting literature is referenced and described in the notes to the Company’s consolidated financial statements.
Critical Accounting Policies
The discussion and analysis of our financial condition and results of operations is based upon our consolidated financial statements, which have been prepared in accordance with accounting principles generally accepted in the United States. The preparation of these consolidated financial statements requires us to make estimates and assumptions that affect the reported amounts of assets and liabilities and the disclosure of contingent assets and liabilities at the date of the consolidated financial statements and the reported amounts of revenues and expenses during the reporting periods. We continually evaluate our estimates, including those related to our valuation of receivables, intangible assets, accrued liabilities, income and other tax accruals, and contingencies and litigation. We base our estimates on historical experience and various other assumptions that we believe to be reasonable under the circumstances. These results form the basis for making judgments about the carrying values of assets and liabilities that are not readily obtained from other sources. Critical accounting policies are defined as those that require our significant judgments and involve uncertainties that could potentially result in materially different results under different assumptions and conditions. Although actual results historically have not deviated significantly from those determined using our estimates, our financial position or results of operations could be materially different if we were to report under different conditions or to use different assumptions in the application of such policies. Our critical accounting policies have not significantly changed from those discussed in “Part II - Item 7. – Management’s Discussion and Analysis of Financial Condition and Results of Operations – Critical Accounting Policies” of our 2009 Form 10-K.
We review our receivables on an ongoing basis to ensure they are properly valued. Based on this review, we believe our reserve for doubtful accounts is sized appropriately. However, if the economic environment and market conditions do not improve, particularly in the automotive and construction markets where our exposure is greatest, additional reserves may be required.
We recognize revenue upon transfer of title and risk of loss provided evidence of an arrangement exists, pricing is fixed and determinable, and the ability to collect is probable. As of August 31, 2009, and May 31, 2009, we had deferred $9.3 million of revenue related to pricing disputes.
We review the carrying value of our long-lived assets, including intangible assets with finite useful lives, whenever events or changes in circumstances indicate that the carrying value of an asset or a group of assets may not be recoverable. When a potential impairment is indicated, accounting standards require a charge to be recognized in the consolidated financial statements if the carrying amount of an asset or group of assets exceeds the fair value of that asset or group of assets. The loss recognized would be the difference between the fair value and the carrying amount of the asset or group of assets.
Due to continued deterioration in business and market conditions impacting our Metal Framing and Construction Services business segments during the first quarter of fiscal 2010, we determined that certain indicators of potential impairment were present for long-lived assets, as defined by SFAS No. 144, Accounting for the Impairment or Disposal of Long-Lived Assets. Therefore, long-lived assets, including intangible assets with finite useful lives, were subsequently tested for impairment during the three months ended August 31, 2009. Recoverability of the identified asset groups was tested using future cash flow projections based on management’s long range estimates of market conditions. The sum of the undiscounted future cash flows related to each asset
27
Table of Contents
group was more than the net book value for each of the asset groups; therefore, there was no impairment loss at August 31, 2009.
We test our goodwill balances for impairment annually, during the fourth quarter, and more frequently if events or changes in circumstances indicate that goodwill may be impaired. We test goodwill at the business segment level as we have determined that the characteristics of the reporting units within each business segment are similar and allow for their aggregation to the business segment level for testing purposes. The test consists of determining the fair value of the business segments, using discounted cash flows, and comparing the result to the carrying values of the business segments. If the estimated fair value of a business segment exceeds its carrying value, there is no impairment. If the carrying amount of the business segment exceeds its estimated fair value, an impairment of the goodwill is indicated. The amount of the impairment would be determined by establishing the fair value of all assets and liabilities of the business segment, excluding the goodwill, and comparing the total to the estimated fair value of the business segment. The difference would represent the fair value of the goodwill; and, if it is lower than the book value of the goodwill, the difference would be recorded as a loss in the consolidated statements of earnings.
During the quarter ended August 31, 2009, we tested the value of the goodwill balances in the Construction Services business segment, as weakness in the construction market continued. For the test, we have assumed the revenue growth rate would range from 5% to 10%, after a significant decrease in revenue for fiscal 2010. In the near term, we expect a higher rate due to pent-up demand and growth in the market share of our Construction Services business segment. Growth is then estimated to slow to 5% in the latter years of the forecast. The revenue growth rates for fiscal periods subsequent to fiscal 2010 used in our analysis as of May 31, 2009 were 5% to 7.5%, and were changed to reflect the expected recovery from more depressed levels of business. We set the discount rate at 12%, consistent with that used in the fiscal 2009 annual testing. Based on this test, there was no indication of impairment for the associated goodwill balances. We also performed the same test using a 14% discount rate, which indicated no impairment as well.
We will continue to test goodwill and other long-lived assets for impairment in each reporting period in which indicators, or potential indicators, of impairment are present. We will also perform the required annual test of impairment for the goodwill balances related to the Pressure Cylinders and Construction Services business segments during the fourth quarter ending May 31, 2010.
Item 3. – Quantitative and Qualitative Disclosures About Market Risk
Market risks have not changed significantly from those disclosed in “Part II - Item 7A. – Quantitative and Qualitative Disclosures About Market Risk” of our 2009 Form 10-K.
Item 4. – Controls and Procedures
Evaluation of Disclosure Controls and Procedures
We maintain disclosure controls and procedures [as defined in Rules 13a-15(e) and 15d-15(e) under the Securities Exchange Act of 1934, as amended (the “Exchange Act”)] that are designed to provide reasonable assurance that information required to be disclosed in the reports that we file or submit under the Exchange Act is recorded, processed, summarized and reported within the time periods specified in the Securities and Exchange Commission’s rules and forms, and that such information is accumulated and communicated to our management, including our principal executive officer and our principal financial officer, as appropriate, to allow timely decisions regarding required disclosure.
Management, with the participation of our principal executive officer and our principal financial officer, performed an evaluation of the effectiveness of our disclosure controls and procedures as of the end of the period covered by this Quarterly Report on Form 10-Q (the fiscal quarter ended August 31, 2009). Based on that evaluation, our principal executive officer and our principal financial officer have concluded that such disclosure controls and procedures were effective at a reasonable assurance level as of the end of the period covered by this Quarterly Report on Form 10-Q.
Changes in Internal Control Over Financial Reporting
There were no changes that occurred during the period covered by this Quarterly Report on Form 10-Q (the fiscal quarter ended August 31, 2009) in our internal control over financial reporting (as defined in Rules 13a-15(f) and 15d-15(f) under the Exchange Act) that have materially affected, or are reasonably likely to materially affect, our internal control over financial reporting.
28
Table of Contents
PART II. OTHER INFORMATION
Various legal actions, which generally have arisen in the ordinary course of business, are pending against the Company. None of this pending litigation, individually or collectively, is expected to have a material adverse effect on our financial position, results of operations or cash flows.
There are certain risks and uncertainties in our business that could cause our actual results to differ materially from those anticipated. In “PART I – Item 1A. – Risk Factors” of the Annual Report on Form 10-K of Worthington Industries, Inc. for the fiscal year ended May 31, 2009 (the “2009 Form 10-K”), as filed with the Securities and Exchange Commission on July 30, 2009, and available at www.sec.gov or at www.worthingtonindustries.com, we included a detailed discussion of our risk factors. Our risk factors have not changed significantly from those disclosed in our 2009 Form 10-K. These risk factors should be read carefully in connection with evaluating our business and in connection with the forward-looking statements and other information contained in this Quarterly Report on Form 10-Q. Any of the risks described in our 2009 Form 10-K could materially affect our business, financial condition or future results and the actual outcome of matters as to which forward-looking statements are made. The risk factors described in our 2009 Form 10-K are not the only risks facing the Company. Additional risks and uncertainties not currently known to us, or that we currently deem to be immaterial, also may materially adversely affect our business, financial condition and/or future results.
Item 2. – Unregistered Sales of Equity Securities and Use of Proceeds
The following table provides information about purchases made by, or on behalf of, Worthington Industries, Inc. or any “affiliated purchaser” (as defined in Rule 10b – 18(a) (3) under the Securities Exchange Act of 1934, as amended) of common shares of Worthington Industries, Inc. during each month of the fiscal quarter ended August 31, 2009:
| Period |
Total Number of Common Shares Purchased |
Average Price Paid per Common Share |
Total Number of Common Shares Purchased as Part of Publicly Announced Plans or Programs |
Maximum Number of Common Shares that May Yet Be Purchased Under the Plans or Programs (1) | ||||
| June 1-30, 2009 |
- | - | - | 8,449,500 | ||||
| July 1-31, 2009 |
- | - | - | 8,449,500 | ||||
| August 1-31, 2009 |
- | - | - | 8,449,500 | ||||
| Total |
- | - | - | |||||
| (1) | On September 26, 2007, Worthington Industries, Inc. announced that the Board of Directors had authorized the repurchase of up to 10,000,000 of Worthington Industries, Inc.’s outstanding common shares. A total of 8,449,500 common shares remained available under this repurchase authorization as of August 31, 2009. The common shares available for purchase under this authorization may be purchased from time to time, with consideration given to the market price of the common shares, the nature of other investment opportunities, cash flows from operations and general economic conditions. Repurchases may be made on the open market or through privately negotiated transactions. |
Item 3. – Defaults Upon Senior Securities
Not applicable
29
Table of Contents
Item 4. – Submission of Matters to a Vote of Security Holders
The 2009 Annual Meeting of Shareholders of Worthington Industries, Inc. (the “Annual Meeting”) was held on September 30, 2009. In connection with the Annual Meeting, proxies were solicited on behalf of the Board of Directors of Worthington Industries, Inc. At the close of business on August 10, 2009, the record date for the Annual Meeting, 79,093,744 common shares of Worthington Industries, Inc. were outstanding and entitled to vote. At the Annual Meeting, 71,161,320 common shares, or 90% of the outstanding common shares entitled to vote, were represented by proxy or in person. Following are the voting results on the proposals considered and voted upon at the Annual Meeting:
| 1. | All of the nominees of the Board of Directors of Worthington Industries, Inc. for election to the class of directors whose terms will expire at the 2012 Annual Meeting of Shareholders were elected by the following votes: |
| Votes For | Votes Withheld | Abstentions/ Broker Non-votes | ||||
| John B. Blystone |
70,104,455 | 1,056,867 | N/A | |||
| John R. Kasich |
70,430,057 | 731,265 | N/A | |||
| Sidney A. Ribeau |
50,712,509 | 20,448,812 | N/A |
Continuing directors whose terms will expire at the 2010 Annual Meeting of Shareholders are John P. McConnell and Mary Schiavo. Continuing directors whose terms will expire at the 2011 Annual Meeting of Shareholders are Michael J. Endres, Peter Karmanos, Jr. and Carl A. Nelson, Jr.
| 2. | The appointment of KPMG LLP as the independent registered public accounting firm of Worthington Industries, Inc. for the fiscal year ending May 31, 2010, was ratified by the following vote: 69,837,039 votes for; 1,251,858 votes against; 72,423 abstentions; and no broker non-votes. |
Not applicable
| 10.1 | Summary of Annual Cash Performance Bonus Awards, Long-Term Performance Awards and Stock Options granted for Fiscal 2010 for Named Executive Officers | |
| 31.1 | Rule 13a - 14(a) / 15d - 14(a) Certifications (Principal Executive Officer) | |
| 31.2 | Rule 13a - 14(a) / 15d - 14(a) Certifications (Principal Financial Officer) | |
| 32.1 | Section 1350 Certifications of Principal Executive Officer | |
| 32.2 | Section 1350 Certifications of Principal Financial Officer | |
30
Table of Contents
Pursuant to the requirements of the Securities Exchange Act of 1934, the Registrant has duly caused this report to be signed on its behalf by the undersigned thereunto duly authorized.
| WORTHINGTON INDUSTRIES, INC. | ||||||
| Date: October 13, 2009 |
By: |
/s/ B. Andrew Rose | ||||
| B. Andrew Rose, | ||||||
| Vice President and Chief Financial Officer | ||||||
| (On behalf of the Registrant and as Principal | ||||||
| Financial Officer) | ||||||
31
Table of Contents
| Exhibit No. |
Description |
Location | ||
| 10.1 | Summary of Annual Cash Performance Bonus Awards, Long-Term Performance Awards and Stock Options granted for Fiscal 2010 for Named Executive Officers* | Incorporated herein by reference to Exhibit 10.36 to the Registrant’s Annual Report on Form 10-K for the fiscal year ended May 31, 2009 (SEC File No. 1-8399) | ||
| 31.1 | Rule 13a - 14(a) / 15d - 14(a) Certifications (Principal Executive Officer) | Filed herewith | ||
| 31.2 | Rule 13a - 14(a) / 15d - 14(a) Certifications (Principal Financial Officer) | Filed herewith | ||
| 32.1 | Section 1350 Certifications of Principal Executive Officer | Filed herewith | ||
| 32.2 | Section 1350 Certifications of Principal Financial Officer | Filed herewith | ||
| * | Indicates management contract or compensatory plan or arrangement |
32