Attached files
| file | filename |
|---|---|
| 8-K - FORM 8-K - CONDOR HOSPITALITY TRUST, INC. | d383913d8k.htm |
Exhibit 99.1

Condor Hospitality Trust, Inc.
Investor Presentation | June 2017
NASDAQ: CDOR
Safe Harbor Statement
All
statements made today, other than statements of historical fact, are or may be deemed to be “forward-looking statements” within the meaning of the safe harbor provisions of the U.S. Private Securities Litigation Reform Act of 1995.
Forward-looking statements can be identified by words such as “anticipate,” “intend,” “plan,” “goal,” “seek,” “believe,” “project,” “estimate,” “expect,”
“strategy,” “future,” “likely,” “may,” “should,” “will” and similar references to future periods. Forward-looking statements are neither historical facts nor assurances of future
performance. Instead, they are based only on our current beliefs, expectations, and assumptions regarding the future of our business, future plans and strategies, projections, anticipated events and trends, the economy, and other future conditions.
Because forward-looking statements relate to the future, they are subject to inherent uncertainties, risks, and changes in circumstances that are difficult to predict and many of which are outside of our control. Our actual results and financial
condition may differ materially from those indicated in the forward-looking statements. Therefore, you should not rely on any of these forward-looking statements. Important factors that could cause our actual results and financial condition to
differ materially from those indicated in any forward-looking statements are discussed under the heading “Risk Factors” in our publicly available reports filed with the Securities and Exchange Commission.
Investor Inquiries
Jonathan J. Gantt
Chief Financial Officer & Senior Vice President T: 301.861.3305 E: jgantt@trustcondor.com
Cover Images
Atlanta Aloft Downtown | Atlanta, Georgia

Year-to-Date 2017 Update
Condor Hospitality Trust Presents A Unique Investment Opportunity
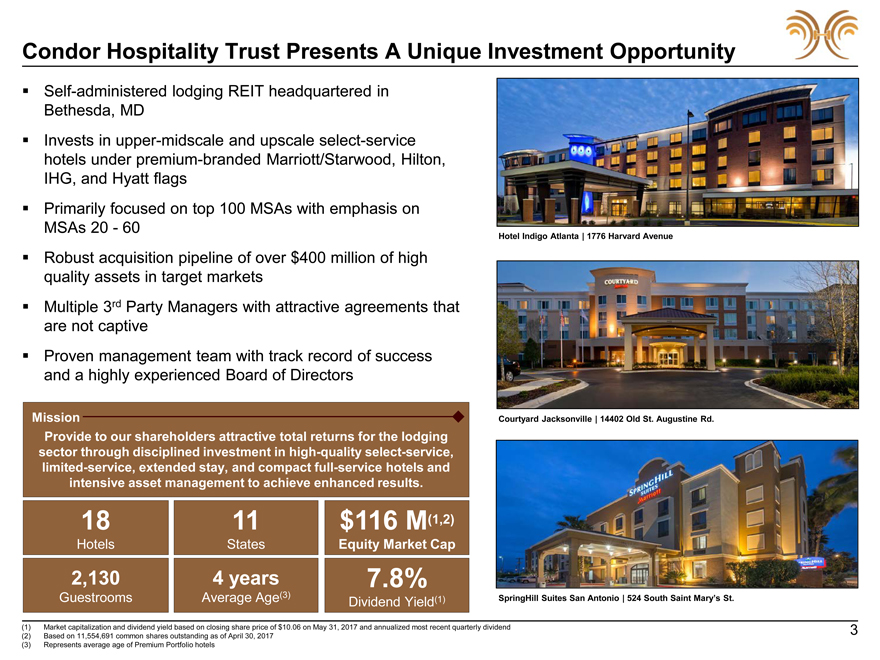
Self-administered lodging REIT headquartered in Bethesda, MD
Invests in upper-midscale and
upscale select-service hotels under premium-branded Marriott/Starwood, Hilton, IHG, and Hyatt flags Primarily focused on top 100 MSAs with emphasis on MSAs 20—60
Hotel Indigo Atlanta | 1776 Harvard Avenue
Robust acquisition pipeline of over
$400 million of high quality assets in target markets Multiple 3rd Party Managers with attractive agreements that are not captive Proven management team with track record of success and a highly experienced Board of Directors
Mission Courtyard Jacksonville | 14402 Old St. Augustine Rd.
Provide to our shareholders
attractive total returns for the lodging sector through disciplined investment in high-quality select-service, limited-service, extended stay, and compact full-service hotels and intensive asset management to achieve enhanced results.
18 11 $116 M(1,2)
Hotels States Equity Market Cap
2,130 4 years 7.8%
Guestrooms Average Age(3) Dividend Yield(1) SpringHill Suites San Antonio |
524 South Saint Mary’s St.
(1) Market capitalization and dividend yield based on closing share price of $10.06 on May 31, 2017 and annualized most recent
quarterly dividend 3 (2) Based on 11,554,691 common shares outstanding as of April 30, 2017 (3) Represents average age of Premium Portfolio hotels
Continued Execution of Stated Strategy
What We Committed
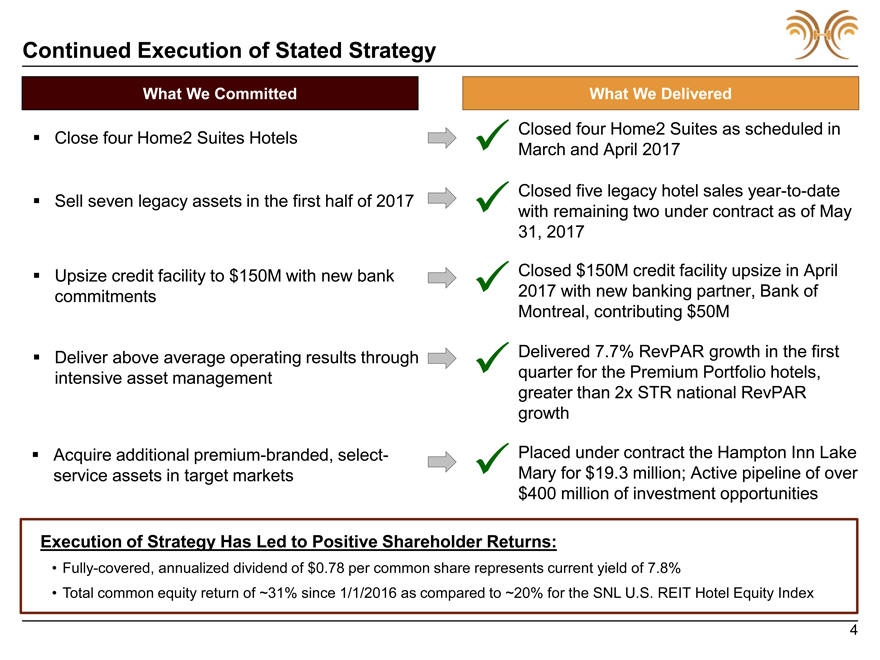
Close four Home2 Suites Hotels
Sell seven legacy assets in the first half of 2017
Upsize credit facility to $150M with new
bank commitments
Deliver above average operating results through intensive asset management
Acquire additional premium-branded, select-service assets in target markets
What We Delivered
Closed four Home2 Suites as scheduled in March and April 2017 Closed five legacy hotel sales
year-to-date with remaining two under contract as of May 31, 2017 Closed $150M credit facility upsize in April 2017 with new banking partner, Bank of Montreal,
contributing $50M
Delivered 7.7% RevPAR growth in the first quarter for the Premium Portfolio hotels, greater than 2x STR national RevPAR growth Placed under
contract the Hampton Inn Lake Mary for $19.3 million; Active pipeline of over $400 million of investment opportunities
Execution of Strategy Has Led to
Positive Shareholder Returns:
Fully-covered, annualized dividend of $0.78 per common share represents current yield of 7.8%
Total common equity return of ~31% since 1/1/2016 as compared to ~20% for the SNL U.S. REIT Hotel Equity Index 4
Relentless Execution Has Dramatically Transformed Condor
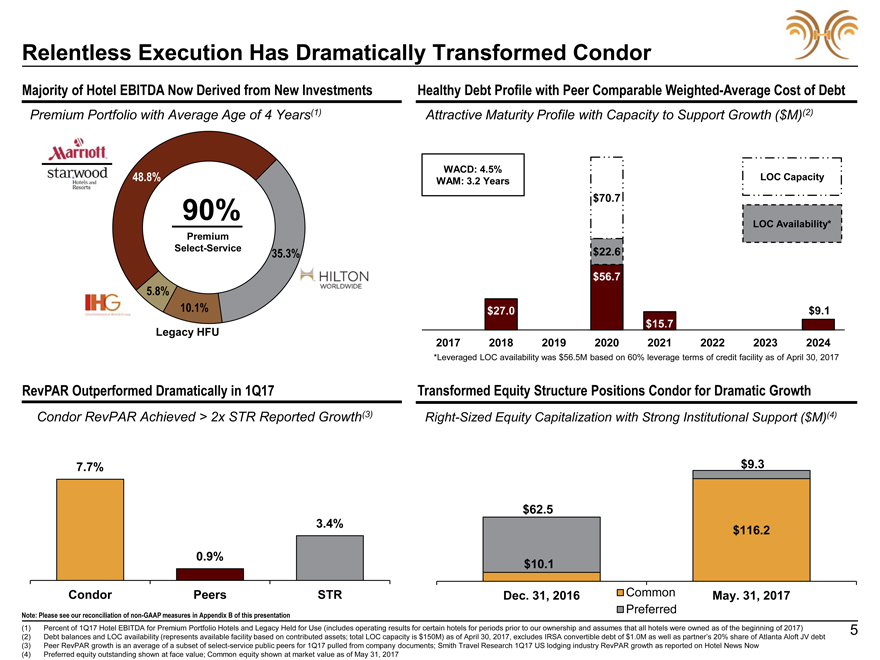
Majority of Hotel EBITDA Now Derived from New Investments
Premium Portfolio with Average Age
of 4 Years(1)
48.8%
90%
Premium
Select-Service 35.3%
5.8%
10.1%
Legacy HFU
Healthy Debt Profile with Peer Comparable Weighted-Average Cost of
Debt
Attractive Maturity Profile with Capacity to Support Growth ($M)(2)
WACD: 4.5%
WAM: 3.2 Years LOC Capacity $70.7
LOC Availability*
$22.6 $56.7
$27.0 $9.1 $15.7 2017 2018 2019 2020 2021 2022 2023 2024
*Leveraged LOC availability was
$56.5M based on 60% leverage terms of credit facility as of April 30, 2017
RevPAR Outperformed Dramatically in 1Q17
Condor RevPAR Achieved > 2x STR Reported Growth(3)
7.7%
3.4% 0.9% Condor Peers STR
Transformed Equity Structure Positions Condor for Dramatic Growth
Right-Sized Equity Capitalization with Strong Institutional Support ($M)(4)
$9.3
$62.5 $116.2
$10.1
Dec. 31, 2016 Common May. 31, 2017
Preferred
Note: Please see our reconciliation of
non-GAAP measures in Appendix B of this presentation
(1) Percent of 1Q17
Hotel EBITDA for Premium Portfolio Hotels and Legacy Held for Use (includes operating results for certain hotels for periods prior to our ownership and assumes that all hotels were owned as of the beginning of 2017)
(2) Debt balances and LOC availability (represents available facility based on contributed assets; total LOC capacity is $150M) as of April 30, 2017,
excludes IRSA convertible debt of $1.0M as well as partner’s 20% share of Atlanta Aloft JV debt
(3) Peer RevPAR growth is an average of
a subset of select-service public peers for 1Q17 pulled from company documents; Smith Travel Research 1Q17 US lodging industry RevPAR growth as reported on Hotel News Now
(4) Preferred equity outstanding shown at face value; Common equity shown at market value as of May 31, 2017
5
Condor’s Current Stock Price Represents a Steep Discount to Sector
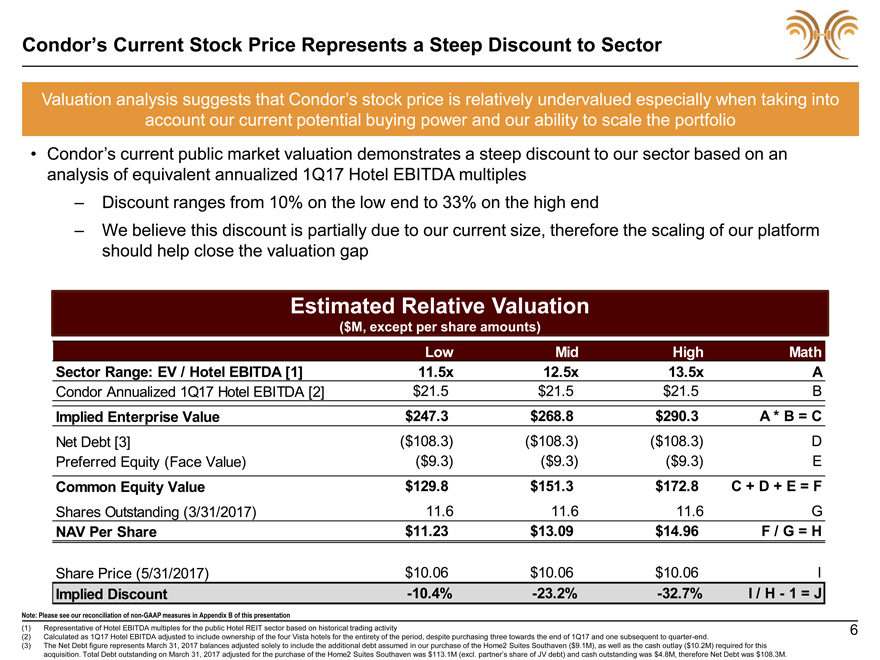
Valuation analysis suggests that Condor’s stock price is relatively undervalued especially when taking into account our current potential buying power and our ability to scale
the portfolio
Condor’s current public market valuation demonstrates a steep discount to our sector based on an analysis of equivalent annualized 1Q17 Hotel
EBITDA multiples
Discount ranges from 10% on the low end to 33% on the high end
We believe this discount is partially due to our current size, therefore the scaling of our platform should help close the valuation gap
Estimated Relative Valuation
($M, except per share
amounts)
Low MidHighMath
Sector Range: EV / Hotel EBITDA [1] 11.5x 12.5x13.5xA
Condor Annualized 1Q17 Hotel EBITDA [2] $21.5 $21.5$21.5B
Implied Enterprise Value $247.3 $268.8$290.3A * B = C
Net Debt
[3] ($108.3) ($108.3)($108.3)D
Preferred Equity (Face Value) ($9.3) ($9.3)($9.3)E
Common Equity Value $129.8 $151.3$172.8C + D + E = F
Shares Outstanding
(3/31/2017) 11.6 11.611.6G
NAV Per Share $11.23 $13.09$14.96F / G = H
Share Price (5/31/2017) $10.06 $10.06$10.06I
Implied
Discount -10.4% -23.2%-32.7%I / H—1 = J
Note: Please see our reconciliation of non-GAAP
measures in Appendix B of this presentation
(1) Representative of Hotel EBITDA multiples for the public Hotel REIT sector based on historical trading activity
(2) Calculated as 1Q17 Hotel EBITDA adjusted to include ownership of the four Vista hotels for the entirety of the period, despite purchasing three towards the end
of 1Q17 and one subsequent to quarter-end.
(3) The Net Debt figure represents March 31, 2017 balances adjusted solely
to include the additional debt assumed in our purchase of the Home2 Suites Southaven ($9.1M), as well as the cash outlay ($10.2M) required for this acquisition. Total Debt outstanding on March 31, 2017 adjusted for the purchase of the Home2
Suites Southaven was $113.1M (excl. partner’s share of JV debt) and cash outstanding was $4.8M, therefore Net Debt was $108.3M.
6

Condor Portfolio, Management, and Performance
Compelling Investment Opportunity
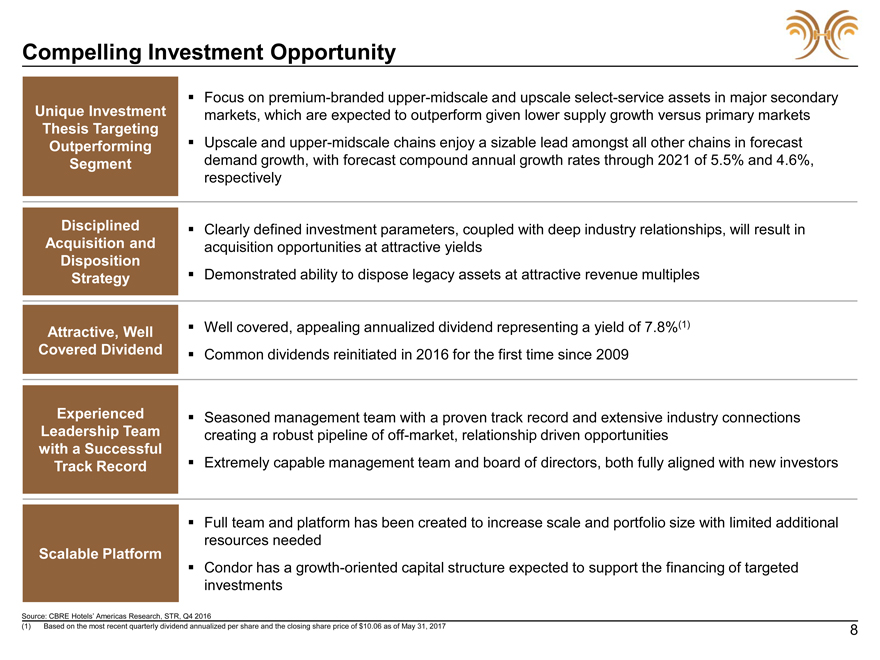
Focus on premium-branded upper-midscale and upscale select-service assets in major secondary
Unique Investment markets, which are expected to outperform given lower supply growth versus primary markets
Thesis Targeting
Outperforming Upscale and
upper-midscale chains enjoy a sizable lead amongst all other chains in forecast
Segment demand growth, with forecast compound annual growth
rates through 2021 of 5.5% and 4.6%,
respectively
Disciplined Clearly defined investment parameters, coupled with deep industry relationships, will result in
Acquisition and acquisition opportunities at attractive yields
Disposition
Strategy
Demonstrated ability to dispose legacy assets at attractive revenue multiples
Attractive, Well Well covered, appealing annualized dividend
representing a yield of 7.8%(1)
Covered Dividend Common dividends reinitiated in 2016 for the first time since 2009
Experienced Seasoned management team with a proven track record and extensive industry connections
Leadership Team creating a robust pipeline of off-market, relationship driven opportunities
with a Successful
Track Record Extremely
capable management team and board of directors, both fully aligned with new investors
Full team and platform has been created to increase scale and portfolio size
with limited additional
resources needed
Scalable
Platform
Condor has a growth-oriented capital structure expected to support the financing of targeted
investments
Source: CBRE Hotels’ Americas Research, STR, Q4 2016
(1) Based on the most recent quarterly dividend annualized per share and the closing share price of $10.06 as of May 31, 2017 8
Dramatically Repositioned Portfolio Comprised of High-Quality Assets
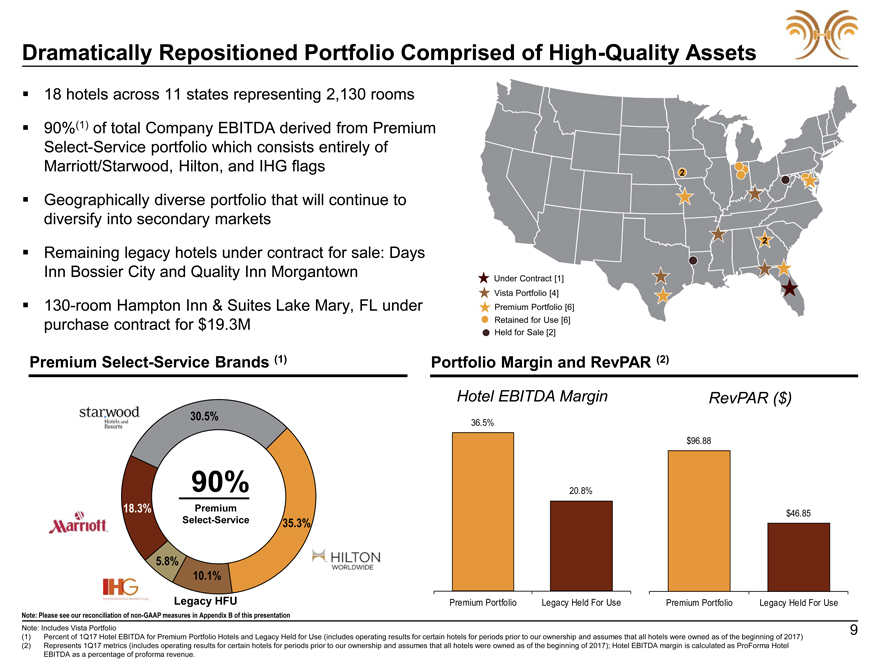
18 hotels across 11 states representing 2,130 rooms
90%(1) of total Company EBITDA derived
from Premium
Select-Service portfolio which consists entirely of
Marriott/Starwood, Hilton, and IHG flags 2
Geographically diverse
portfolio that will continue to
diversify into secondary markets
2
Remaining legacy hotels under contract for sale: Days
Inn Bossier City and Quality Inn Morgantown Under Contract [1]
Vista
Portfolio [4]
130-room Hampton Inn & Suites Lake Mary, FL under Premium Portfolio [6]
purchase contract for $19.3M Retained for Use [6]
Held for Sale [2]
Premium Select-Service Brands (1) Portfolio Margin and RevPAR (2)
Hotel EBITDA MarginRevPAR ($)
30.5%36.5%
$96.88
90%20.8%
18.3% Premium$46.85
Select-Service35.3%
5.8%
10.1%
Legacy HFUPremium PortfolioLegacy Held For UsePremium PortfolioLegacy Held For Use
Note: Please see our reconciliation of non-GAAP measures in Appendix B of this presentation
Note: Includes Vista Portfolio 9
(1) Percent of
1Q17 Hotel EBITDA for Premium Portfolio Hotels and Legacy Held for Use (includes operating results for certain hotels for periods prior to our ownership and assumes that all hotels were owned as of the beginning of 2017)
(2) Represents 1Q17 metrics (includes operating results for certain hotels for periods prior to our ownership and assumes that all hotels were owned as of
the beginning of 2017); Hotel EBITDA margin is calculated as ProForma Hotel
EBITDA as a percentage of proforma revenue.
Unique Investment Thesis Will Drive Outperformance
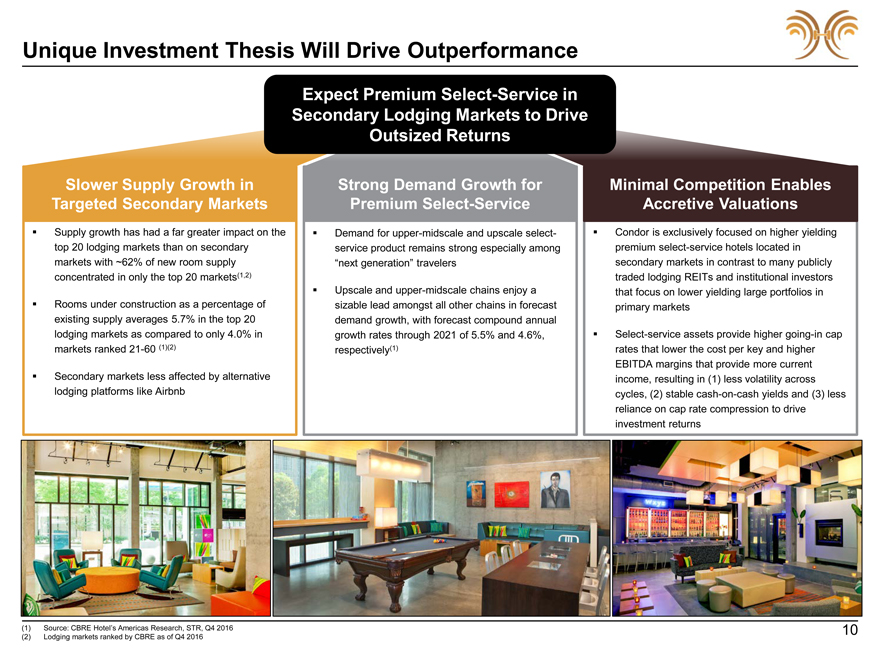
Expect Premium Select-Service in
Secondary Lodging Markets to Drive
Outsized Returns
Slower Supply Growth in Strong Demand Growth
forMinimal Competition Enables
Targeted Secondary Markets Premium Select-ServiceAccretive Valuations
Supply growth has had a far greater impact on the Demand for upper-midscale and upscale select- Condor is exclusively focused on higher yielding
top 20 lodging markets than on secondary service product remains strong especially amongpremium select-service hotels located in
markets with ~62% of new room supply “next generation” travelerssecondary markets in contrast to many publicly
concentrated in only the top 20 markets(1,2) traded lodging REITs and institutional investors
Upscale and upper-midscale chains enjoy athat focus on lower yielding large portfolios in
Rooms under construction as a percentage of sizable lead amongst all other chains in forecastprimary markets
existing supply averages 5.7% in the top 20 demand growth, with forecast compound annual
lodging markets as compared to only 4.0% in growth rates through 2021 of 5.5% and 4.6%, Select-service assets provide higher
going-in cap
markets ranked 21-60
(1)(2) respectively(1)rates that lower the cost per key and higher
EBITDA margins that provide more current
Secondary markets less affected by alternative income, resulting in (1) less volatility across
lodging platforms like Airbnb cycles, (2) stable cash-on-cash yields and
(3) less
reliance on cap rate compression to drive
investment returns
Source: CBRE Hotel’s Americas Research, STR, Q4 2016
Lodging markets
ranked by CBRE as of Q4 2016
10
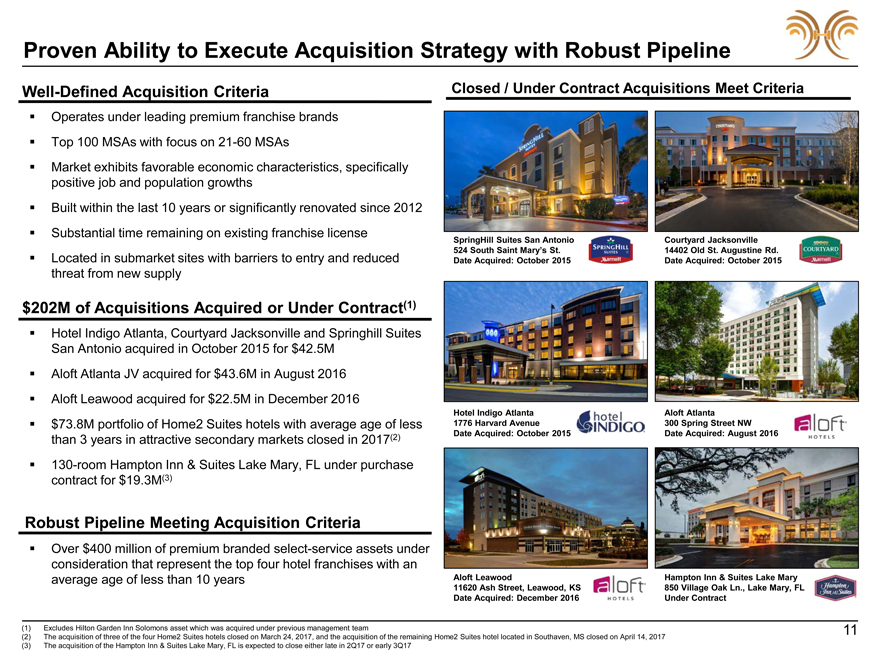
Proven Ability to Execute Acquisition Strategy with Robust Pipeline
Well-Defined Acquisition Criteria Closed / Under Contract Acquisitions Meet Criteria
Operates
under leading premium franchise brands Top 100 MSAs with focus on 21-60 MSAs
Market exhibits favorable economic
characteristics, specifically positive job and population growths Built within the last 10 years or significantly renovated since 2012 Substantial time remaining on existing franchise license Located in submarket sites with barriers to entry and
reduced threat from new supply
$202M of Acquisitions Acquired or Under Contract(1)
Hotel Indigo Atlanta, Courtyard Jacksonville and Springhill Suites San Antonio acquired in October 2015 for $42.5M
Aloft Atlanta JV acquired for $43.6M in August 2016 Aloft Leawood acquired for $22.5M in December 2016
$73.8M portfolio of Home2 Suites hotels with average age of less than 3 years in attractive secondary markets closed in 2017(2) 130-room
Hampton Inn & Suites Lake Mary, FL under purchase contract for $19.3M(3)
Robust Pipeline Meeting Acquisition Criteria
Over $400 million of premium branded select-service assets under consideration that represent the top four hotel franchises with an average age of less than 10 years
SpringHill Suites San Antonio Courtyard Jacksonville
524 South Saint Mary’s St. 14402 Old St. Augustine Rd.
Date Acquired: October 2015 Date Acquired: October 2015
Hotel Indigo
Atlanta Aloft Atlanta
1776 Harvard Avenue 300 Spring Street NW
Date Acquired: October 2015 Date Acquired: August 2016
Aloft
Leawood Hampton Inn & Suites Lake Mary
11620 Ash Street, Leawood, KS 850 Village Oak Ln., Lake Mary, FL
Date Acquired: December 2016 Under Contract
(1)
Excludes Hilton Garden Inn Solomons asset which was acquired under previous management team
(2) The acquisition of three of the four Home2 Suites hotels closed on
March 24, 2017, and the acquisition of the remaining Home2 Suites hotel located in Southaven, MS closed on April 14, 2017 (3) The acquisition of the Hampton Inn & Suites Lake Mary, FL is expected to close either late in 2Q17 or
early 3Q17
11
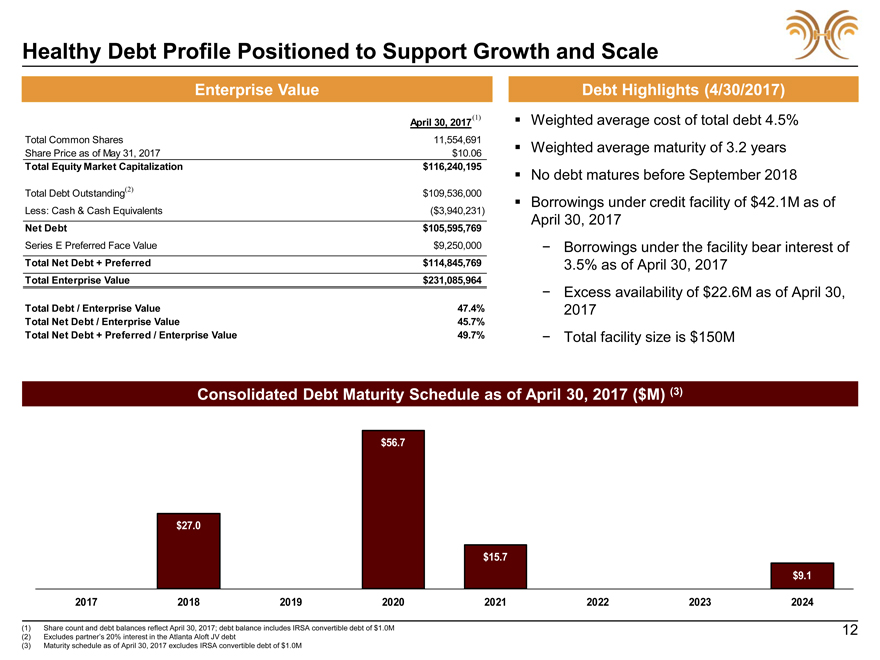
Healthy Debt Profile Positioned to Support Growth and Scale
Enterprise Value Debt Highlights (4/30/2017)
April 30, 2017(1)
Weighted average cost of total debt 4.5%
Total Common Shares 11,554,691 Weighted average maturity of 3.2 years
Share Price as of May 31, 2017 $10.06
Total Equity Market
Capitalization $116,240,195 No debt matures before September 2018
Total Debt Outstanding(2) $109,536,000 Borrowings
under credit facility of $42.1M as of
Less: Cash & Cash Equivalents ($3,940,231)April 30, 2017
Net Debt $105,595,769
Series E Preferred Face
Value $9,250,000-Borrowings under the facility bear interest of
Total Net Debt + Preferred $114,845,7693.5% as of
April 30, 2017
Total Enterprise Value $231,085,964
-Excess availability of $22.6M as of April 30,
Total Debt / Enterprise
Value 47.4%2017
Total Net Debt / Enterprise Value 45.7%
Total Net Debt + Preferred / Enterprise Value 49.7%-Total facility size is $150M
Consolidated Debt Maturity Schedule as of April 30, 2017 ($M) (3)
$56.7
$27.0
$15.7
$9.1
2017 2018 201920202021202220232024
Share count and
debt balances reflect April 30, 2017; debt balance includes IRSA convertible debt of $1.0M
Excludes partner’s 20% interest in the Atlanta Aloft JV debt
Maturity schedule as of April 30, 2017 excludes IRSA convertible debt of $1.0M
12
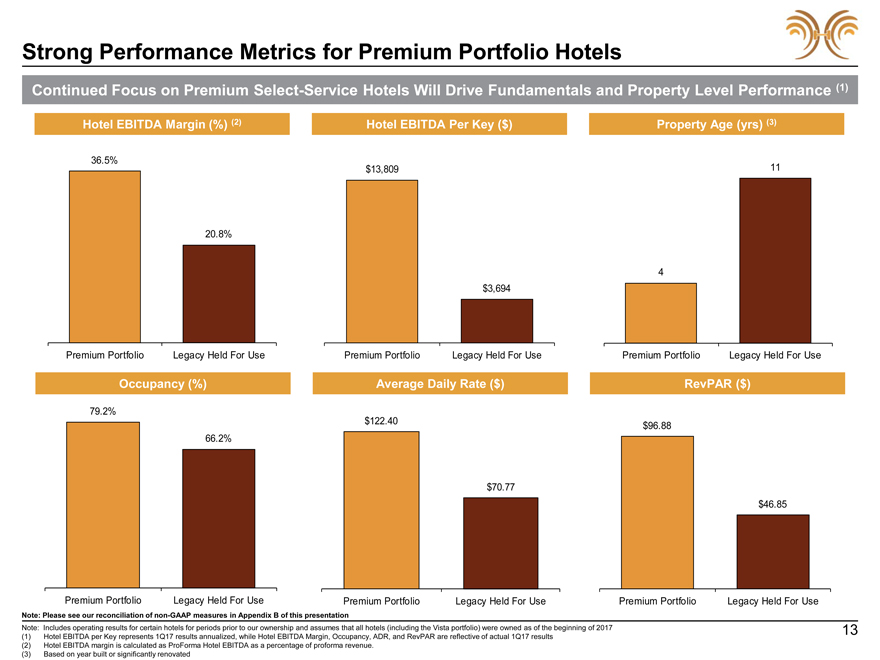
Strong Performance Metrics for Premium Portfolio Hotels
Continued Focus on Premium Select-Service Hotels Will Drive Fundamentals and Property Level Performance (1)
Hotel EBITDA Margin (%) (2) Hotel EBITDA Per Key ($) Property Age (yrs) (3)
36.5% $13,80911
20.8%
4
$3,694
Premium Portfolio Legacy Held For Use Premium PortfolioLegacy Held For UsePremium PortfolioLegacy Held For Use
Occupancy (%) Average Daily Rate ($) RevPAR ($)
79.2%
$122.40$96.88
66.2%
$70.77
$46.85
Premium Portfolio Legacy Held For Use Premium PortfolioLegacy
Held For UsePremium PortfolioLegacy Held For Use
Note: Please see our reconciliation of non-GAAP measures in Appendix B of
this presentation
Note: Includes operating results for certain hotels for periods prior to our ownership and assumes that all hotels (including the Vista
portfolio) were owned as of the beginning of 2017 (1) Hotel EBITDA per Key represents 1Q17 results annualized, while Hotel EBITDA Margin, Occupancy, ADR, and RevPAR are reflective of actual 1Q17 results (2) Hotel EBITDA margin is calculated as
ProForma Hotel EBITDA as a percentage of proforma revenue.
(3) Based on year built or significantly renovated
13
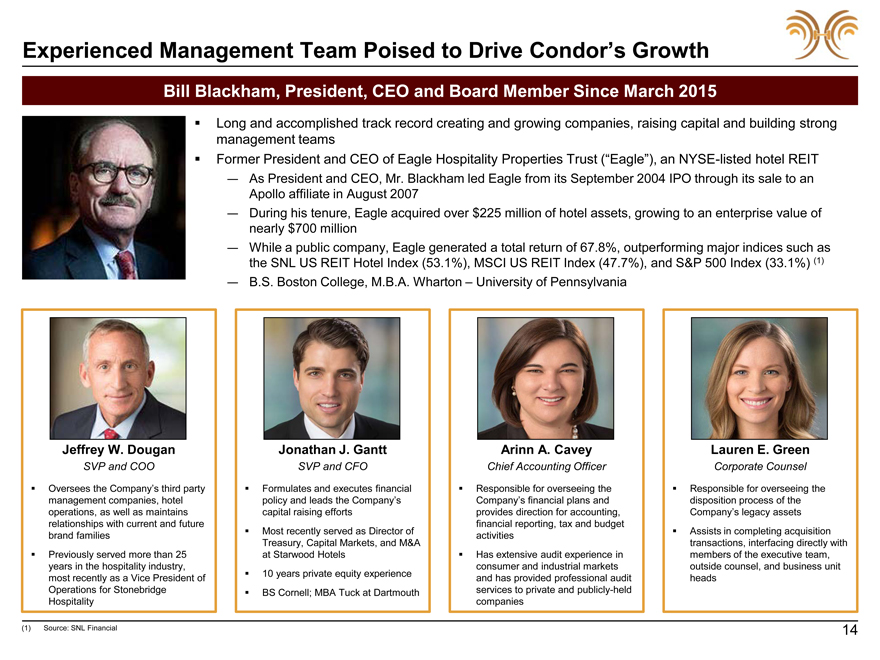
Experienced Management Team Poised to Drive Condor’s Growth
Bill Blackham, President, CEO and Board Member Since March 2015
Long and accomplished track
record creating and growing companies, raising capital and building strong
management teams
Former President and CEO of Eagle Hospitality Properties Trust (“Eagle”), an NYSE-listed hotel REIT
—As President and CEO, Mr. Blackham led Eagle from its September 2004 IPO through its sale to an
Apollo affiliate in August 2007
—During his tenure, Eagle acquired over $225 million
of hotel assets, growing to an enterprise value of
nearly $700 million
—While a public company, Eagle generated a total return of 67.8%, outperforming major indices such as
the SNL US REIT Hotel Index (53.1%), MSCI US REIT Index (47.7%), and S&P 500 Index (33.1%) (1)
—B.S. Boston College, M.B.A. Wharton – University of Pennsylvania
Jeffrey W.
Dougan Jonathan J. GanttArinn A. CaveyLauren E. Green
SVP and COO SVP and CFOChief Accounting OfficerCorporate
Counsel
Oversees the Company’s third party Formulates and executes financial Responsible for overseeing the Responsible for overseeing the
management companies, hotel policy and leads the Company’sCompany’s financial plans anddisposition process of the
operations, as well as maintains capital raising effortsprovides direction for accounting,Company’s legacy assets
relationships with current and future financial reporting, tax and budget
brand families Most recently served as Director ofactivities Assists in completing acquisition
Treasury, Capital Markets, and M&Atransactions, interfacing directly with
Previously
served more than 25 at Starwood Hotels Has extensive audit experience inmembers of the executive team,
years in the hospitality
industry, consumer and industrial marketsoutside counsel, and business unit
most recently as a Vice President of 10
years private equity experienceand has provided professional auditheads
Operations for Stonebridge BS Cornell; MBA Tuck at
Dartmouthservices to private and publicly-held
Hospitality companies
(1) Source: SNL Financial
14
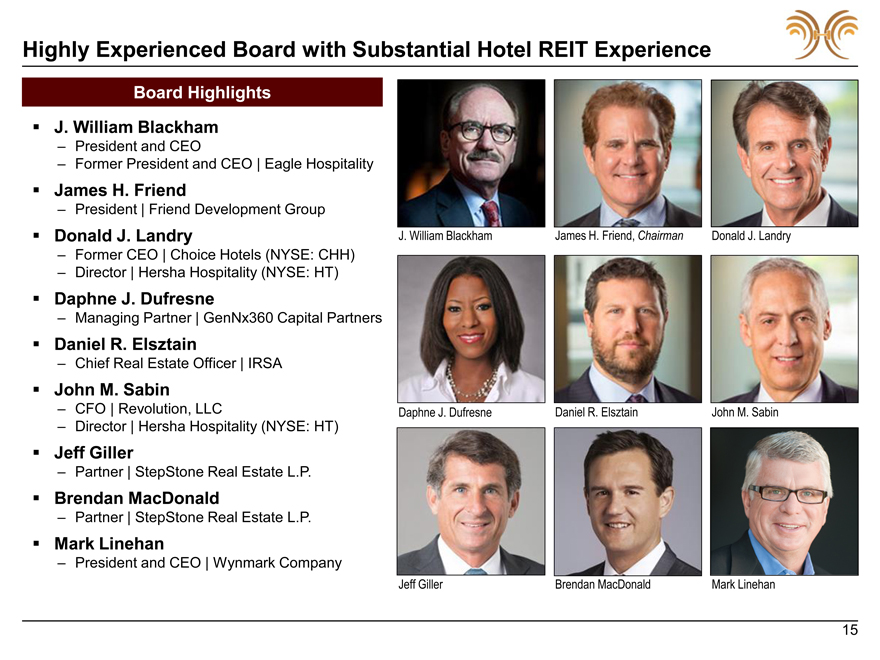
Highly Experienced Board with Substantial Hotel REIT Experience
Board Highlights
J. William Blackham
President and CEO
Former President and CEO | Eagle Hospitality
James H. Friend
President | Friend Development Group
Donald J. Landry J. William BlackhamJames H. Friend, ChairmanDonald J. Landry
Former CEO |
Choice Hotels (NYSE: CHH)
Director | Hersha Hospitality (NYSE: HT)
Daphne J.
Dufresne
Managing Partner | GenNx360 Capital Partners
Daniel R. Elsztain
Chief Real Estate Officer | IRSA
John M. Sabin
CFO | Revolution, LLCDaphne J. DufresneDaniel R. ElsztainJohn M. Sabin
Director | Hersha
Hospitality (NYSE: HT)
Jeff Giller
Partner | StepStone Real Estate L.P.
Brendan MacDonald
Partner | StepStone Real Estate L.P.
Mark Linehan
President and CEO | Wynmark Company
Jeff GillerBrendan MacDonaldMark Linehan
15
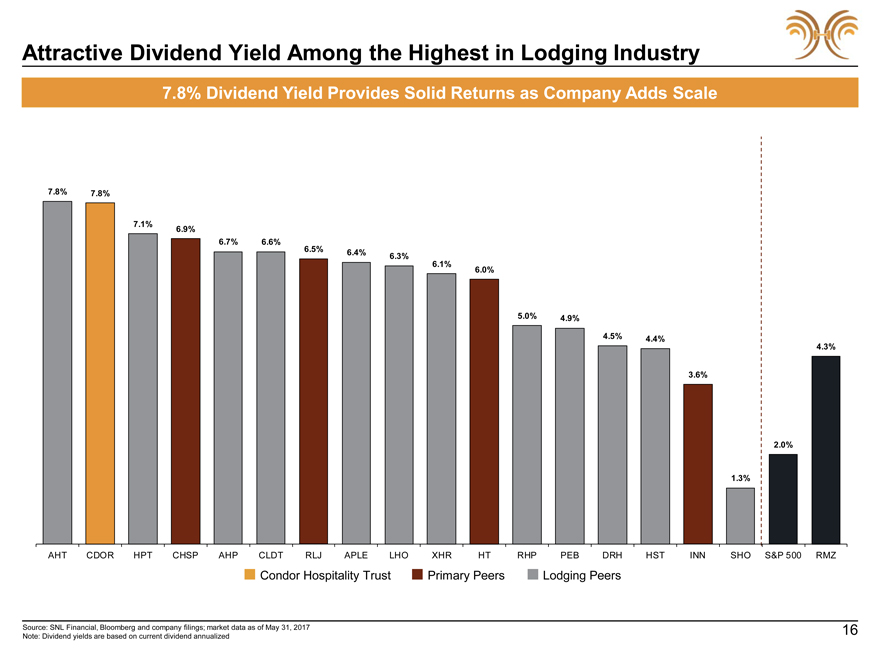
Attractive Dividend Yield Among the Highest in Lodging Industry
7.8% Dividend Yield Provides Solid Returns as Company Adds Scale
7.8% 7.8%
7.1% 6.9%
6.7%6.6%
6.5%6.4%
6.3%
6.1%6.0%
5.0%4.9%
4.5%4.4%
4.3%
3.6%
2.0%
1.3%
AHT CDOR HPT CHSP AHPCLDTRLJAPLELHOXHRHTRHPPEBDRHHSTINNSHOS&P 500RMZ
Condor Hospitality TrustPrimary PeersLodging Peers
Source: SNL Financial,
Bloomberg and company filings; market data as of May 31, 2017 16
Note: Dividend yields are based on current dividend
annualized

Appendix A | Acquisition Case Studies
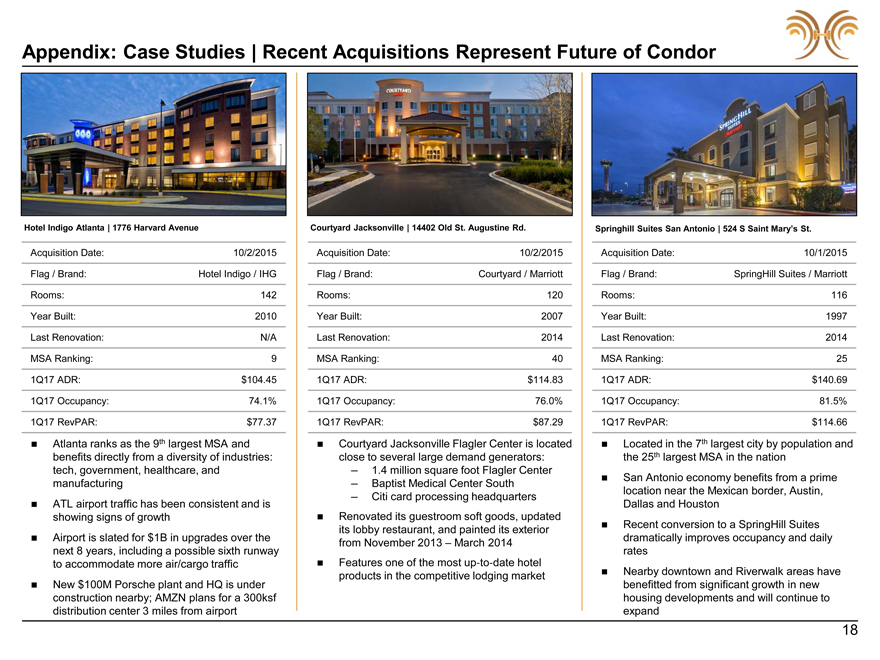
Appendix: Case Studies | Recent Acquisitions Represent Future of Condor
Hotel Indigo Atlanta | 1776 Harvard Avenue
Acquisition Date: 10/2/2015 Flag / Brand: Hotel
Indigo / IHG Rooms: 142 Year Built: 2010 Last Renovation: N/A MSA Ranking: 9 1Q17 ADR: $104.45 1Q17 Occupancy: 74.1% 1Q17 RevPAR: $77.37
Atlanta ranks as the 9th
largest MSA and benefits directly from a diversity of industries: tech, government, healthcare, and manufacturing ATL airport traffic has been consistent and is showing signs of growth Airport is slated for $1B in upgrades
over the next 8 years, including a possible sixth runway to accommodate more air/cargo traffic New $100M Porsche plant and HQ is under construction nearby; AMZN plans for a 300ksf distribution center 3 miles from airport
Courtyard Jacksonville | 14402 Old St. Augustine Rd.
Acquisition Date: 10/2/2015 Flag / Brand:
Courtyard / Marriott Rooms: 120 Year Built: 2007 Last Renovation: 2014 MSA Ranking: 40 1Q17 ADR: $114.83 1Q17 Occupancy: 76.0% 1Q17 RevPAR: $87.29
Courtyard
Jacksonville Flagler Center is located close to several large demand generators:
1.4 million square foot Flagler Center
Baptist Medical Center South
Citi card processing headquarters Renovated its guestroom soft
goods, updated its lobby restaurant, and painted its exterior from November 2013 – March 2014 Features one of the most up-to-date hotel products in the competitive
lodging market
Springhill Suites San Antonio | 524 S Saint Mary’s St.
Acquisition Date: 10/1/2015 Flag / Brand: SpringHill Suites / Marriott Rooms: 116 Year Built: 1997 Last Renovation: 2014 MSA Ranking: 25 1Q17 ADR: $140.69 1Q17
Occupancy: 81.5% 1Q17 RevPAR: $114.66
Located in the 7th largest city by population and the 25th largest MSA in the nation San Antonio economy benefits from a
prime location near the Mexican border, Austin, Dallas and Houston Recent conversion to a SpringHill Suites dramatically improves occupancy and daily rates Nearby downtown and Riverwalk areas have benefitted from significant growth in new housing
developments and will continue to expand
18
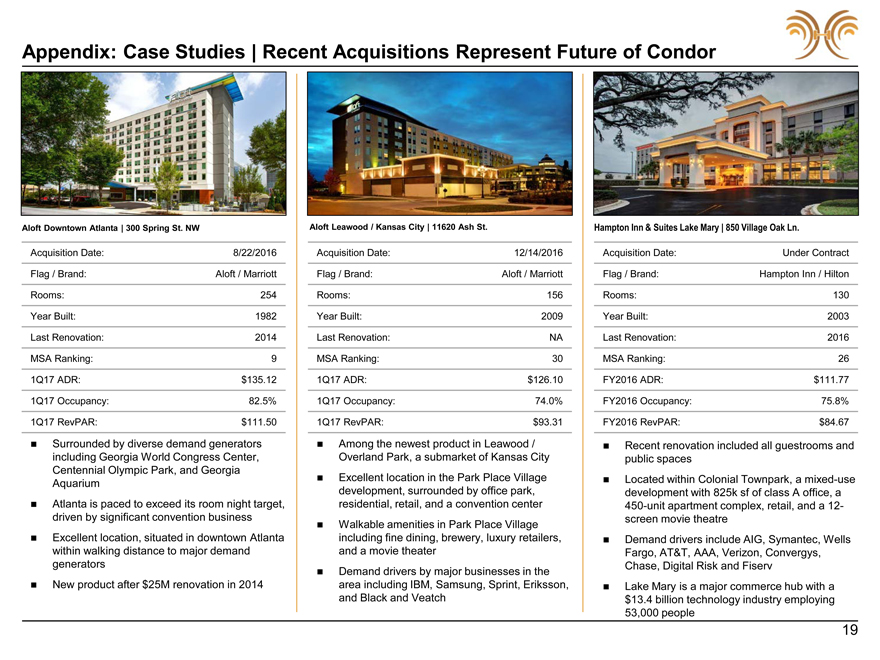
Appendix: Case Studies | Recent Acquisitions Represent Future of Condor
Aloft Downtown Atlanta | 300 Spring St. NW
Acquisition
Date: 8/22/2016
Flag / Brand: Aloft / Marriott
Rooms: 254
Year Built: 1982
Last Renovation: 2014
MSA Ranking: 9
1Q17 ADR: $135.12
1Q17
Occupancy: 82.5%
1Q17 RevPAR: $111.50
Surrounded by diverse demand generators
including Georgia World Congress Center,
Centennial Olympic Park, and Georgia
Aquarium
Atlanta is paced to exceed its room night target,
driven by significant
convention business
Excellent location, situated in downtown Atlanta
within
walking distance to major demand
generators
New
product after $25M renovation in 2014
Aloft Leawood / Kansas City | 11620 Ash St.
Acquisition Date: 12/14/2016 Flag / Brand: Aloft / Marriott Rooms: 156 Year Built: 2009 Last Renovation: NA MSA Ranking: 30 1Q17 ADR: $126.10 1Q17 Occupancy: 74.0% 1Q17 RevPAR:
$93.31
Among the newest product in Leawood / Overland Park, a submarket of Kansas City Excellent location in the Park Place Village development, surrounded by
office park, residential, retail, and a convention center Walkable amenities in Park Place Village including fine dining, brewery, luxury retailers, and a movie theater Demand drivers by major businesses in the area including IBM, Samsung, Sprint,
Eriksson, and Black and Veatch
Hampton Inn & Suites Lake Mary | 850 Village Oak Ln.
Acquisition Date: Under Contract Flag / Brand: Hampton Inn / Hilton Rooms: 130 Year Built: 2003 Last Renovation: 2016 MSA Ranking: 26 FY2016 ADR: $111.77 FY2016 Occupancy: 75.8%
FY2016 RevPAR: $84.67
Recent renovation included all guestrooms and public spaces Located within Colonial Townpark, a
mixed-use development with 825k sf of class A office, a 450-unit apartment complex, retail, and a 12-screen movie theatre Demand
drivers include AIG, Symantec, Wells Fargo, AT&T, AAA, Verizon, Convergys, Chase, Digital Risk and Fiserv Lake Mary is a major commerce hub with a $13.4 billion technology industry employing 53,000 people
19
Appendix: Case Studies | Recent Acquisitions Represent Future of Condor
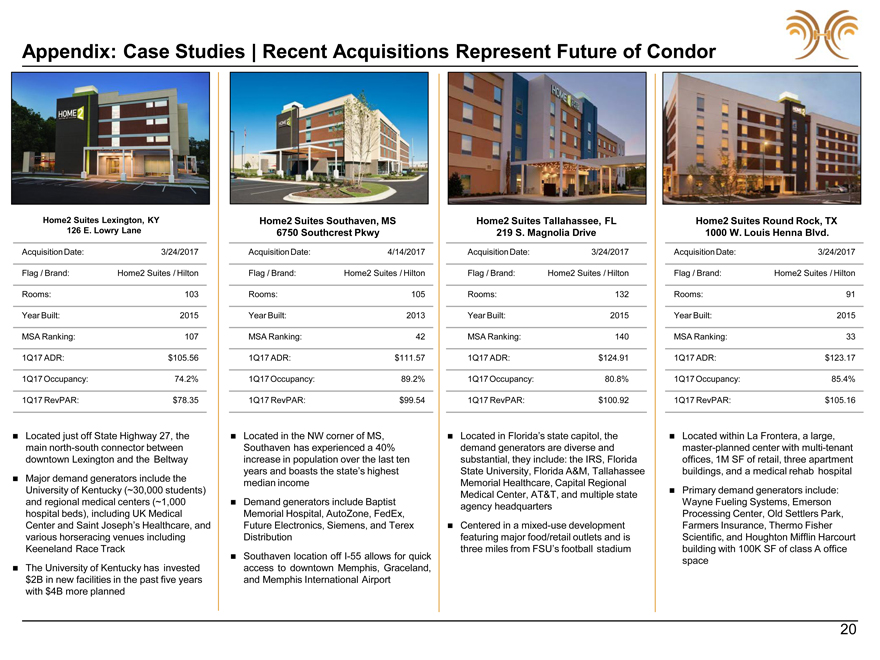
Home2 Suites Lexington, KY Home2 Suites Southaven, MSHome2 Suites Tallahassee, FLHome2 Suites Round Rock, TX
126 E. Lowry Lane 6750 Southcrest Pkwy219 S. Magnolia Drive1000 W. Louis Henna Blvd.
AcquisitionDate: 3/24/2017 AcquisitionDate:4/14/2017AcquisitionDate:3/24/2017AcquisitionDate:3/24/2017
Flag / Brand: Home2 Suites / Hilton Flag / Brand:Home2 Suites / HiltonFlag / Brand:Home2 Suites / HiltonFlag / Brand:Home2 Suites / Hilton
Rooms: 103 Rooms:105Rooms:132Rooms:91
Year
Built: 2015 Year Built:2013Year Built:2015Year Built:2015
MSA Ranking: 107 MSA Ranking:42MSA Ranking:140MSA
Ranking:33
1Q17 ADR: $105.56 1Q17 ADR:$111.571Q17 ADR:$124.911Q17 ADR:$123.17
1Q17Occupancy: 74.2% 1Q17Occupancy:89.2%1Q17Occupancy:80.8%1Q17Occupancy:85.4%
1Q17 RevPAR: $78.35 1Q17 RevPAR:$99.541Q17 RevPAR:$100.921Q17 RevPAR:$105.16
Located just off State Highway 27, the Located in the NW corner of MS, Located in Florida’s state capitol, the Located within La Frontera, a large,
main north-south connector between Southaven has experienced a 40%demand generators are diverse andmaster-planned center with multi-tenant
downtown Lexington and the Beltway increase in population over the last tensubstantial, they include: the IRS, Floridaoffices, 1M SF of
retail, three apartment
years and boasts the state’s highestState University, Florida A&M, Tallahasseebuildings, and a medical rehab hospital
Major demand generators include the median incomeMemorial Healthcare, Capital Regional
University of Kentucky (~30,000 students) Medical Center, AT&T, and multiple state Primary demand generators include:
and regional medical centers (~1,000 Demand generators include Baptistagency headquartersWayne Fueling Systems, Emerson
hospital beds), including UK Medical Memorial Hospital, AutoZone, FedEx,Processing Center, Old Settlers Park,
Center and Saint Joseph’s Healthcare, and Future Electronics, Siemens, and Terex Centered in a mixed-use
developmentFarmers Insurance, Thermo Fisher
various horseracing venues including Distributionfeaturing major food/retail outlets and
isScientific, and Houghton Mifflin Harcourt
Keeneland Race Track three miles from FSU’s football stadiumbuilding with 100K SF of class
A office
Southaven location off I-55 allows for quickspace
The University of Kentucky has invested access to downtown Memphis, Graceland,
$2B in new facilities in the past five years and Memphis International Airport
with $4B more planned
20
Appendix B | Non-GAAP Reconciliation
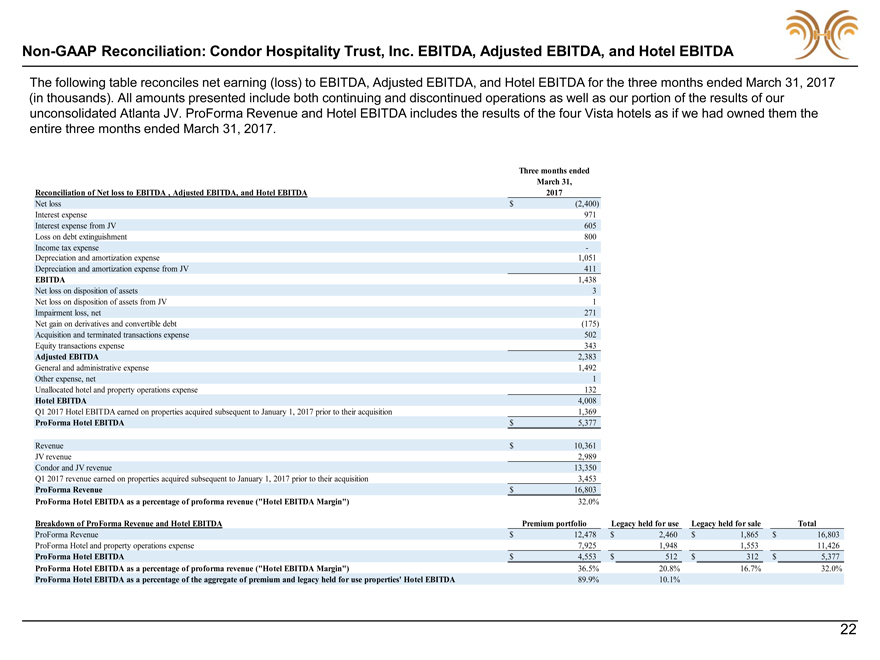
Non-GAAP Reconciliation: Condor Hospitality Trust, Inc. EBITDA,
Adjusted EBITDA, and Hotel EBITDA
The following table reconciles net earning (loss) to EBITDA, Adjusted EBITDA, and Hotel EBITDA for the three months ended
March 31, 2017 (in thousands). All amounts presented include both continuing and discontinued operations as well as our portion of the results of our unconsolidated Atlanta JV. ProForma Revenue and Hotel EBITDA includes the results of the four
Vista hotels as if we had owned them the entire three months ended March 31, 2017.
Three months ended
March 31,
Reconciliation of Net loss to EBITDA , Adjusted EBITDA,
and Hotel EBITDA 2017
Net loss $(2,400)
Interest expense 971
Interest expense from JV
605
Loss on debt extinguishment 800
Income tax
expense -
Depreciation and amortization expense 1,051
Depreciation and amortization expense from JV 411
EBITDA 1,438
Net loss on disposition of
assets 3
Net loss on disposition of assets from JV 1
Impairment loss, net 271
Net gain on derivatives and convertible
debt (175)
Acquisition and terminated transactions expense 502
Equity transactions expense 343
Adjusted
EBITDA 2,383
General and administrative expense 1,492
Other expense, net 1
Unallocated hotel and property operations
expense 132
Hotel EBITDA 4,008
Q1 2017 Hotel EBITDA earned on properties acquired subsequent to January 1, 2017 prior to their acquisition 1,369
ProForma Hotel EBITDA $5,377
Revenue $10,361
JV revenue 2,989
Condor and JV
revenue 13,350
Q1 2017 revenue earned on properties acquired subsequent to January 1, 2017 prior to their
acquisition 3,453
ProForma Revenue $16,803
ProForma Hotel EBITDA as a percentage of proforma revenue (“Hotel EBITDA Margin”) 32.0%
Breakdown of ProForma Revenue and Hotel EBITDA Premium portfolio Legacy held for useLegacy held for saleTotal
ProForma Revenue $12,478$2,460$1,865$16,803
ProForma Hotel and property
operations expense 7,9251,9481,55311,426
ProForma Hotel EBITDA $4,553$512$312$5,377
ProForma Hotel EBITDA as a percentage of proforma revenue (“Hotel EBITDA Margin”) 36.5%20.8%16.7%32.0%
ProForma Hotel EBITDA as a percentage of the aggregate of premium and legacy held for use properties’ Hotel EBITDA 89.9%10.1%
22
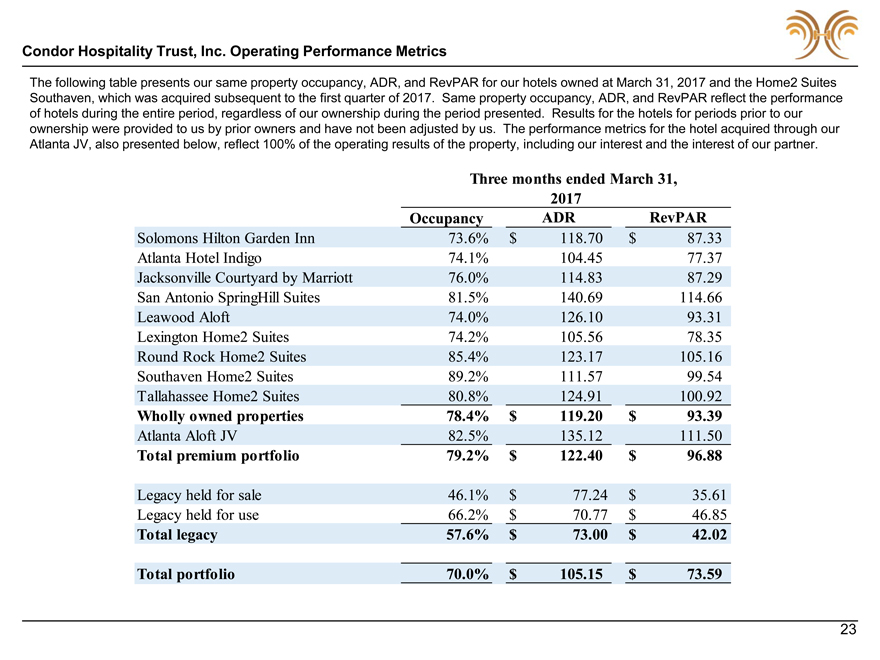
Condor Hospitality Trust, Inc. Operating Performance Metrics
The following table presents our same property occupancy, ADR, and RevPAR for our hotels owned at March 31, 2017 and the Home2 Suites Southaven, which was acquired subsequent
to the first quarter of 2017. Same property occupancy, ADR, and RevPAR reflect the performance of hotels during the entire period, regardless of our ownership during the period presented. Results for the hotels for periods prior to our ownership
were provided to us by prior owners and have not been adjusted by us. The performance metrics for the hotel acquired through our Atlanta JV, also presented below, reflect 100% of the operating results of the property, including our interest and the
interest of our partner.
Three months ended March 31,
2017
Occupancy ADRRevPAR
Solomons Hilton Garden
Inn 73.6% $118.70$87.33
Atlanta Hotel Indigo 74.1% 104.4577.37
Jacksonville Courtyard by Marriott 76.0% 114.8387.29
San Antonio
SpringHill Suites 81.5% 140.69114.66
Leawood Aloft 74.0% 126.1093.31
Lexington Home2 Suites 74.2% 105.5678.35
Round Rock Home2
Suites 85.4% 123.17105.16
Southaven Home2 Suites 89.2% 111.5799.54
Tallahassee Home2 Suites 80.8% 124.91100.92
Wholly owned
properties 78.4% $119.20$93.39
Atlanta Aloft JV 82.5% 135.12111.50
Total premium portfolio 79.2% $122.40$96.88
Legacy held for
sale 46.1% $77.24$35.61
Legacy held for use 66.2% $70.77$46.85
Total legacy 57.6% $73.00$42.02
Total
portfolio 70.0% $105.15$73.59
23