Attached files
| file | filename |
|---|---|
| 8-K - 8-K - Benefit Street Partners Realty Trust, Inc. | v468437_8k.htm |
Exhibit 99.1

Financing the Growth of Commercial Real Estate Note: This program does not own the properties pictured. The properties serve as the underlying collateral for mezzanine loan s h eld by BSP Realty Trust. First Quarter 2017 Investor Presentation

2 IMPORTANT INFORMATION Risk Factors Investing in and owning our common stock involves a high degree of risk . See the section entitled “Risk Factors” in our Form 10 - K filed March 29 , 2017 for a discussion of these risks . Forward - Looking Statements Certain statements included in this presentation are forward - looking statements . Those statements include statements regarding the intent, belief or current expectations of Benefit Street Partners Realty Trust, Inc . (“BSP Realty Trust”, “we”, “our” or the “Company”) and members of our management team, as well as the assumptions on which such statements are based, and generally are identified by the use of words such as "may," "will," "seeks," "anticipates," "believes," "estimates," "expects," "plans," "intends," "should" or similar expressions . Actual results may differ materially from those contemplated by such forward - looking statements . Further, forward - looking statements speak only as of the date they are made, and we undertake no obligation to update or revise forward - looking statements to reflect changed assumptions, the occurrence of unanticipated events or changes to future operating results over time, unless required by law . Additional Important Information The summary information provided in this presentation does not purport to be complete and no obligation to update or otherwise revise such information is being assumed . Nothing shall be relied upon as a promise or representation as to the future performance of BSP Realty Trust . This summary is not an offer to sell securities and is not soliciting an offer to buy securities in any jurisdiction where the offer or sale is not permitted . This summary is not advice, a recommendation or an offer to enter into any transaction with BSP Realty Trust or any of their affiliated funds . There is no guarantee that any of the goals, targets or objectives described in this summary will be achieved . The information contained herein is not intended to provide, and should not be relied upon for, accounting, legal, ERISA or tax advice or investment recommendations . Investors should also seek advice from their own independent tax, accounting, financial, ERISA, investment and legal advisors to properly assess the merits and risks associated with their investment in light of their own financial condition and other circumstances . The information contained herein will be superseded by, and is qualified in its entirety by reference to, BSP Realty Trust's Annual Report and Form 10 - K, which will contain information about the investment objective, terms and conditions of an investment in BSP Realty Trust . Investors should consider the investment objectives, risks, and charges and expenses of BSP Realty Trust carefully before investing . BSP Realty Trust's Annual Report and Form 10 - K contain this and other information about the company . You may obtain a copy of the most recent Annual or Semi - Annual Report by calling ( 844 ) 785 - 4393 and/or visiting www . bsprealtytrust . com . Past performance is not indicative of future results . There is no guarantee that any of the estimates, targets or projections illustrated in this summary will be achieved . Any references herein to any of BSP Realty Trust's past or present investments, portfolio characteristics, or performance, have been provided for illustrative purposes only . It should not be assumed that these investments were or will be profitable or that any future investments will be profitable or will equal the performance of these investments . There can be no guarantee that the investment objective of BSP Realty Trust will be achieved . Any investment entails a risk of loss . An investor could lose all or substantially all of his or her investment . Please refer to BSP Realty Trust's Annual Report on Form 10 - K for a more complete list of risk factors . AUM refers to the assets under management for funds and separately managed accounts managed by Providence Equity Partners L . L . C . , Providence Equity Capital Markets L . L . C . (“PECM”), Benefit Street Partners L . L . C . (“Benefit Street”) and Merganser Capital Management, LLC (collectively, “Providence” . For private debt funds and other drawdown funds and separately managed accounts, AUM generally represents the sum of the total investments at fair value plus available capital (undrawn commitments plus distributions subject to recall) . For hedge funds, non - drawdown funds and separately managed accounts, AUM represents the NAV (net asset value) of each fund or separately managed account . For CLOs, AUM represents the total amount of the debt tranches and subordinated notes (equity) at closing . For long - only liquid accounts, AUM represents the gross asset value of the investments managed by Providence . AUM amounts are as of 2 / 28 / 2017 . Certain amounts are preliminary and remain subject to change .

3 Richard J. Byrne Chief Executive Officer and President of BSP Realty Trust Jerome S. Baglien Chief Financial Officer of BSP Realty Trust TODAY’S SPEAKERS Richard Byrne is president of Benefit Street Partners and is based in BSP’s New York office . Mr . Byrne is also Chairman and Chief Executive Officer of Business Development Corporation of America . Prior to joining BSP in 2013 , Mr . Byrne was chief executive officer of Deutsche Bank Securities Inc . He was also the global head of capital markets at Deutsche Bank as well as a member of the global banking executive committee and the global markets executive committee . Before joining Deutsche Bank, Mr . Byrne was global co - head of the leveraged finance group and global head of credit research at Merrill Lynch . He was also a perennially top - ranked credit analyst . Mr . Byrne earned a Masters of Business Administration from the Kellogg School of Management at Northwestern University and a Bachelor of Arts from Binghamton University . Jerry Baglien is chief financial officer of commercial real estate with Benefit Street Partners in BSP’s New York office . Prior to joining BSP in 2016 , Mr . Baglien was director of fund finance for GTIS Partners LP, where he oversaw all finance and operations for GTIS funds . Previously, he was an accounting manager at iStar Inc . with oversight of loans and special investments . Mr . Baglien received a Master of Business Administration from Kellstadt Graduate School of Business at DePaul University and a Bachelor of Science in Accounting from the University of Oregon .
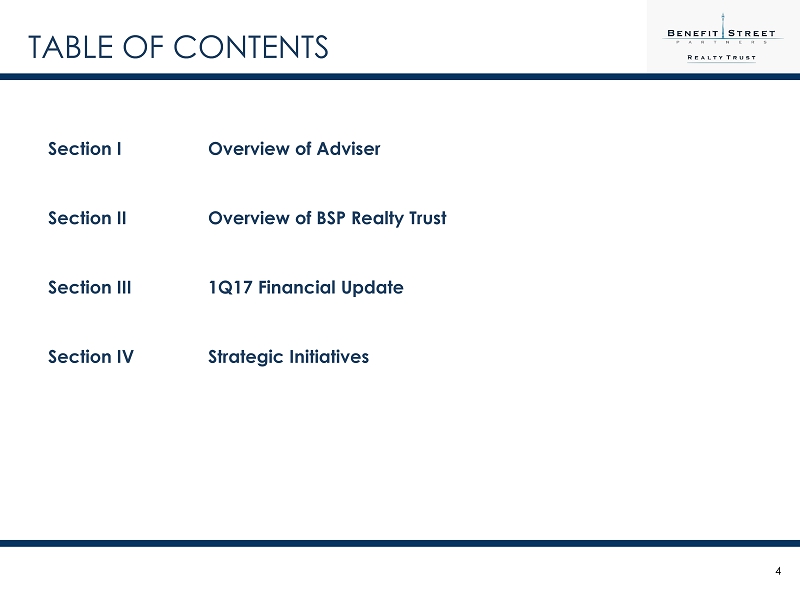
4 TABLE OF CONTENTS Section I Overview of Adviser Section II Overview of BSP Realty Trust Section III 1Q17 Financial Update Section IV Strategic Initiatives
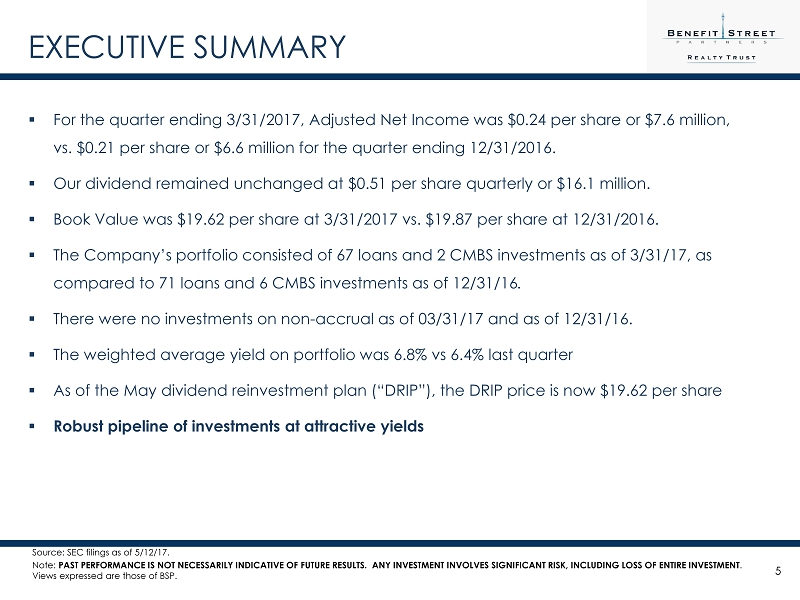
5 EXECUTIVE SUMMARY ▪ For the quarter ending 3/31/2017 , Adjusted Net Income was $ 0.24 per share or $7.6 million, vs. $ 0.21 per share or $ 6.6 million for the quarter ending 12/31/2016 . ▪ Our dividend remained unchanged at $0.51 per share quarterly or $16.1 million. ▪ Book Value was $19.62 per share at 3/31/2017 vs. $19.87 per share at 12/31/2016. ▪ The Company’s portfolio consisted of 67 loans and 2 CMBS investments as of 3/31/17, as compared to 71 loans and 6 CMBS investments as of 12/31/16 . ▪ There were no investments on non - accrual as of 03/31/17 and as of 12/31/16. ▪ The weighted average yield on portfolio was 6.8% vs 6.4% last quarter ▪ As of the May dividend reinvestment plan (“DRIP”), the DRIP price is now $19.62 per share ▪ Robust pipeline of investments at attractive yields Source: SEC filings as of 5/12/17. Note: PAST PERFORMANCE IS NOT NECESSARILY INDICATIVE OF FUTURE RESULTS. ANY INVESTMENT INVOLVES SIGNIFICANT RISK, INCLUDING LOSS O F E NTIRE INVESTMENT . Views expressed are those of BSP.
6 Section I – Overview of Adviser — Benefit Street Partners L.L.C. (“BSP” or the “Adviser”)
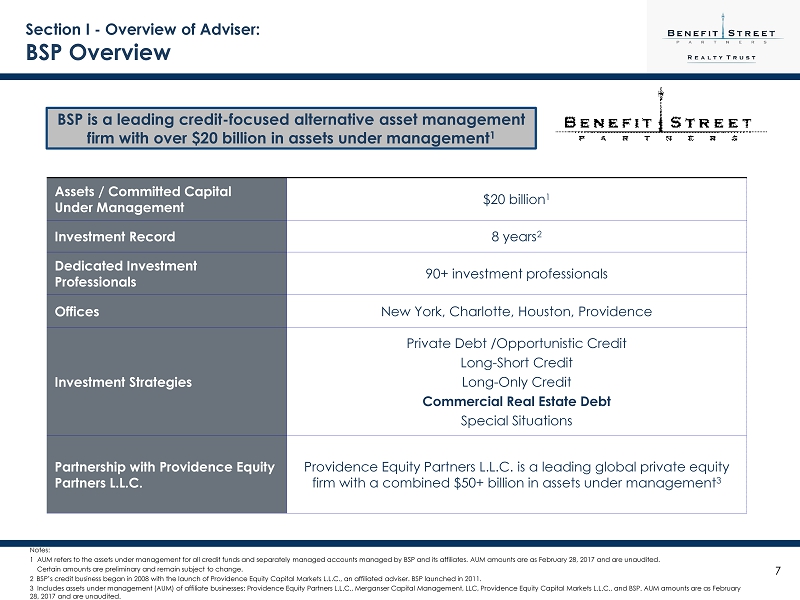
7 Section I - Overview of Adviser: BSP Overview Assets / Committed Capital Under Management $20 billion 1 Investment Record 8 years 2 Dedicated Investment Professionals 90+ investment professionals Offices New York, Charlotte, Houston, Providence Investment Strategies Private Debt /Opportunistic Credit Long - Short Credit Long - Only Credit Commercial Real Estate Debt Special Situations Partnership with Providence Equity Partners L.L.C. Providence Equity Partners L.L.C. is a leading global private equity firm with a combined $50+ billion in assets under management 3 BSP is a leading credit - focused alternative asset management firm with over $20 billion in assets under management 1 Notes: 1 AUM refers to the assets under management for all credit funds and separately managed accounts managed by BSP and its affi lia tes. AUM amounts are as February 28, 2017 and are unaudited. Certain amounts are preliminary and remain subject to change. 2 BSP’s credit business began in 2008 with the launch of Providence Equity Capital Markets L.L.C., an affiliated adviser. BSP l aun ched in 2011. 3 Includes assets under management (AUM) of affiliate businesses: Providence Equity Partners L.L.C., Merganser Capital Management, LLC, Pro vidence Equity Capital Markets L.L.C., and BSP. AUM amounts are as February 28, 2017 and are unaudited.

8 Section I - Overview of Adviser: BSP Platform Established , high - quality institutional infrastructure to support all credit activities Extensive networks and expertise across numerous sectors; Direct origination and research capabilities Seek to achieve downside protection through lien protection, capital structure priority, covenants, default penalties, call protection and change of control rights BSP senior management team has worked together for 30 years BSP Realty Trust Officers: Richard Byrne , Chief Executive Officer and President Jerry Baglien , Chief Financial Officer and Treasurer Micah Goodman, Corporate Secretary BSP Senior CRE Team: Scott Waynebern , Head of Commercial Real Estate Michael Comparato , Head of CRE Origination Investment Team: ▪ 90+ investment professionals with extensive credit experience 1 Significant experience in debt financing through multiple business cycles and across the capital structure including: high yield , leveraged loans, private debt, liquid credit, structured credit and real estate Highly Experienced Team Deep Credit Markets Expertise Broad Industry Expertise Rigorous Risk Management Robust Infrastructure Note: PAST PERFORMANCE IS NOT NECESSARILY INDICATIVE OF FUTURE RESULTS. ANY INVESTMENT INVOLVES SIGNIFICANT RISKS, INCLUDING LOSS OF THE ENTIRE INVESTMENT. Views expressed are those of BSP1 As of May 2017.

9 Section I - Overview of Adviser: BSP Commercial Real Estate Overview ▪ BSP’s extensive network of brokers and borrowers helps drive proprietary deal flow and can generate numerous high return opportunities. ▪ BSP team has originated $2.5+ billion of commercial mortgages since inception. ▪ Leverage relationships and experience to structure “one stop shop” solutions for borrowers. Proprietary Middle Market Sourcing Attractive Industry Dynamics ▪ Supply: $1.4 trillion maturity wall 1 driven by 2006/2007 prior peak originations. ▪ Demand : Destruction of existing lending capacity at banks (increasing impact of regulations ). ▪ Market leading CRE business led by multi - cycle veterans in origination, credit, capital markets and legal. ▪ 43 - person team including dedicated asset management team. ▪ The senior BSP Commercial Real Estate team has significant asset management experience , collectively overseeing over $60 billion of loans/equity under management and restructurings throughout their careers . Experienced Real Estate Team Note: Views expressed are those of BSP. 1 Source : Trepp commercial mortgage loans from 2016 to 2019.
10 Section II – Overview of BSP Realty Trust
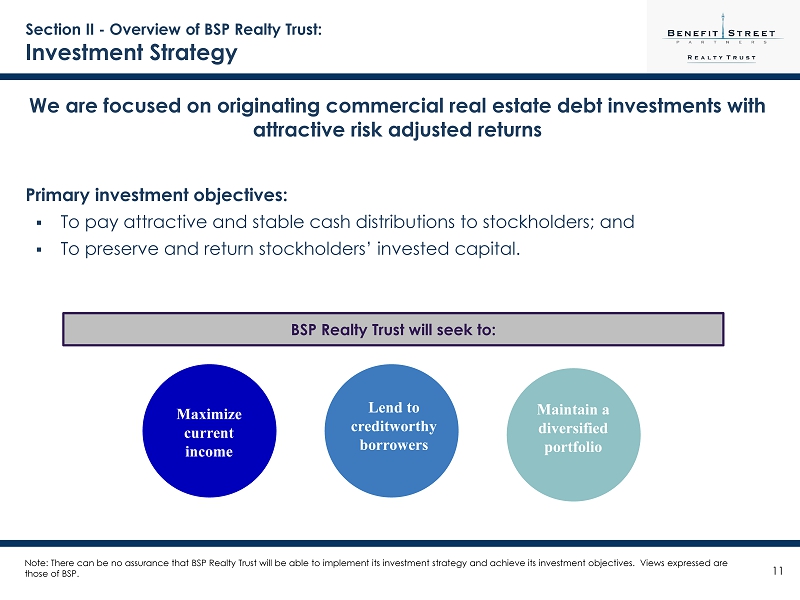
11 We are focused on originating commercial real estate debt investments with attractive risk adjusted returns Primary investment objectives: ▪ To pay attractive and stable cash distributions to stockholders; and ▪ To preserve and return stockholders’ invested capital . Note: There can be no assurance that BSP Realty Trust will be able to implement its investment strategy and achieve its investment objectives. Views expressed are those of BSP . Section II - Overview of BSP Realty Trust : Investment Strategy BSP Realty Trust will seek to: Maximize current income Lend to creditworthy borrowers Maintain a diversified portfolio
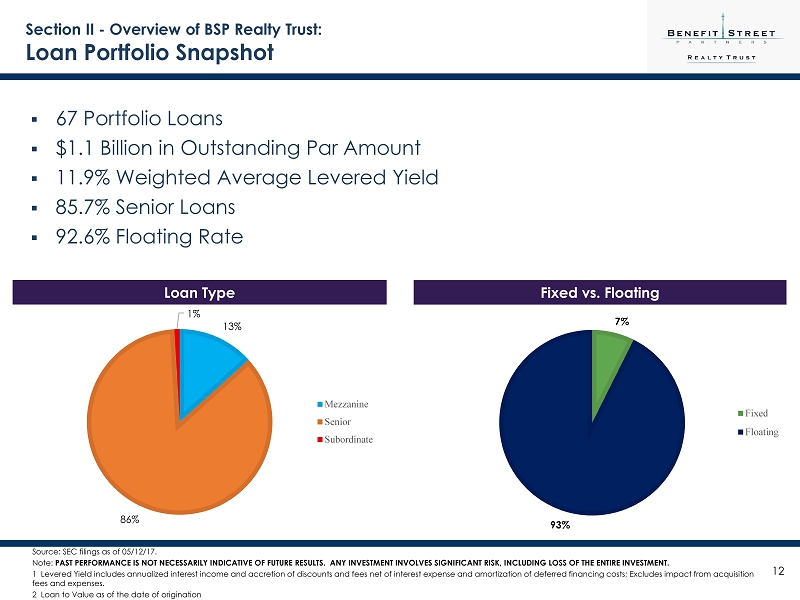
12 Section II - Overview of BSP Realty Trust : Loan Portfolio Snapshot ▪ 67 Portfolio Loans ▪ $1.1 Billion in Outstanding Par Amount ▪ 11.9% Weighted Average Levered Yield ▪ 85.7% Senior Loans ▪ 92.6% Floating Rate Loan Type Fixed vs. Floating Source: SEC filings as of 05/12/17. Note: PAST PERFORMANCE IS NOT NECESSARILY INDICATIVE OF FUTURE RESULTS. ANY INVESTMENT INVOLVES SIGNIFICANT RISK, INCLUDING LOSS O F T HE ENTIRE INVESTMENT. 1 Levered Yield includes annualized interest income and accretion of discounts and fees net of interest expense and amortization of deferred financing costs; Excludes impact from acquisition fees and expenses. 2 Loan to Value as of the date of origination 7% 93% Fixed Floating 13% 86% 1% Mezzanine Senior Subordinate

13 Section II - Overview of BSP Realty Trust : Portfolio Diversification Loan Portfolio by Collateral Type Loan Portfolio by Region Source: SEC filings as of 5/12/2017 12% 5% 4% 27% 34% 18% Hospitality Industrial Mixed Use Multifamily Office Retail 1% 19% 16% 7% 13% 15% 7% 12% 10% New England Mideast Great Lakes Plains Southeast Southwest Rocky Mountain Far West Various

14 Section II - Overview of BSP Realty Trust: Portfolio Composition The BSPRT portfolio concentration in Senior Loans has increased, while Mezzanine Loans portfolio has declined. Portfolio Composition by Loan Type Source: SEC filings as of 05/12/17. Loan Q1 2016 Q2 2016 Q3 2016 Q4 2016 Q1 2017 Senior 80% 81% 80% 84% 86% Mezzanine 19% 18% 19% 15% 13% Subordinate 1% 1% 1% 1% 1%
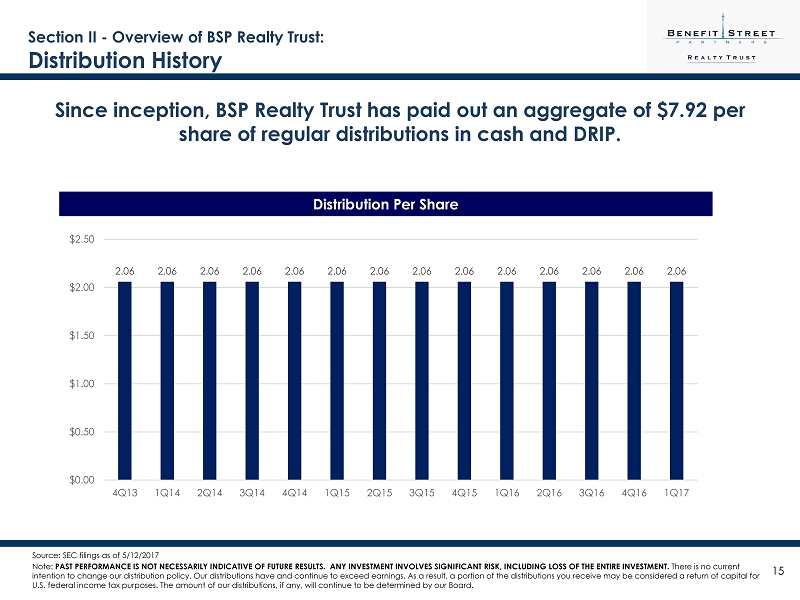
15 Since inception, BSP Realty Trust has paid out an aggregate of $7.92 per share of regular distributions in cash and DRIP. Section II - Overview of BSP Realty Trust : Distribution History 2.06 2.06 2.06 2.06 2.06 2.06 2.06 2.06 2.06 2.06 2.06 2.06 2.06 2.06 $0.00 $0.50 $1.00 $1.50 $2.00 $2.50 4Q13 1Q14 2Q14 3Q14 4Q14 1Q15 2Q15 3Q15 4Q15 1Q16 2Q16 3Q16 4Q16 1Q17 Distribution Per Share Source: SEC filings as of 5/12/2017 Note: PAST PERFORMANCE IS NOT NECESSARILY INDICATIVE OF FUTURE RESULTS. ANY INVESTMENT INVOLVES SIGNIFICANT RISK, INCLUDING LOSS O F T HE ENTIRE INVESTMENT. There is no current intention to change our distribution policy. Our distributions have and continue to exceed earnings. As a result, a portion o f t he distributions you receive may be considered a return of capital for U.S. federal income tax purposes. The amount of our distributions, if any, will continue to be determined by our Board.
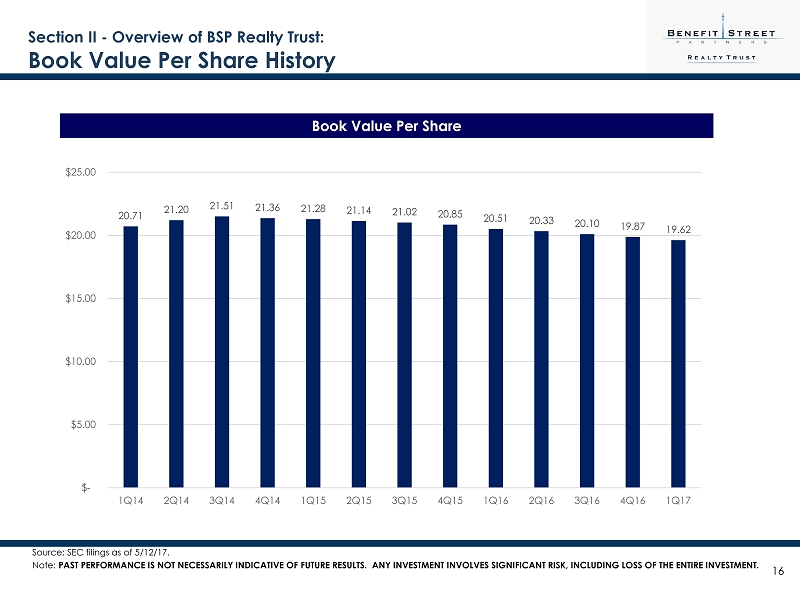
16 Section II - Overview of BSP Realty Trust : Book Value Per Share History Book Value Per Share Source: SEC filings as of 5/12/17. Note: PAST PERFORMANCE IS NOT NECESSARILY INDICATIVE OF FUTURE RESULTS. ANY INVESTMENT INVOLVES SIGNIFICANT RISK, INCLUDING LOSS O F T HE ENTIRE INVESTMENT. 20.71 21.20 21.51 21.36 21.28 21.14 21.02 20.85 20.51 20.33 20.10 19.87 19.62 $- $5.00 $10.00 $15.00 $20.00 $25.00 1Q14 2Q14 3Q14 4Q14 1Q15 2Q15 3Q15 4Q15 1Q16 2Q16 3Q16 4Q16 1Q17

17 Section II - Overview of BSP Realty Trust : Financing Sources JP Morgan • $300mm Line • Libor + 225 to 250 • Avg. Spread of 230 • June 2017 Maturity • $257mm drawn Goldman Sachs • $250mm Line • Libor + 235 to 285 • Avg. Spread of 260 • December 2019 Maturity • $0.0mm drawn RFT FL1 – 2015 • $428mm Line • LIBOR + 1.75% to 5.25% • Avg. Spread of 2.32% • June 2017 Maturity • $370mm drawn ▪ $710 million of debt outstanding and $ 268 million of undrawn debt capacity ▪ 3.6% weighted average cost of debt CLO Warehouse Lines JP Morgan • $300mm Line • LIBOR + 2.25% to 2.50% • Avg. Spread of 2.30% • June 2017 Maturity • $ 251mm drawn Goldman Sachs • $250mm Line • LIBOR + 2.35% to 2.85% • December 2019 Maturity • $89.1mm drawn Source: SEC filings as of 5/12/17.
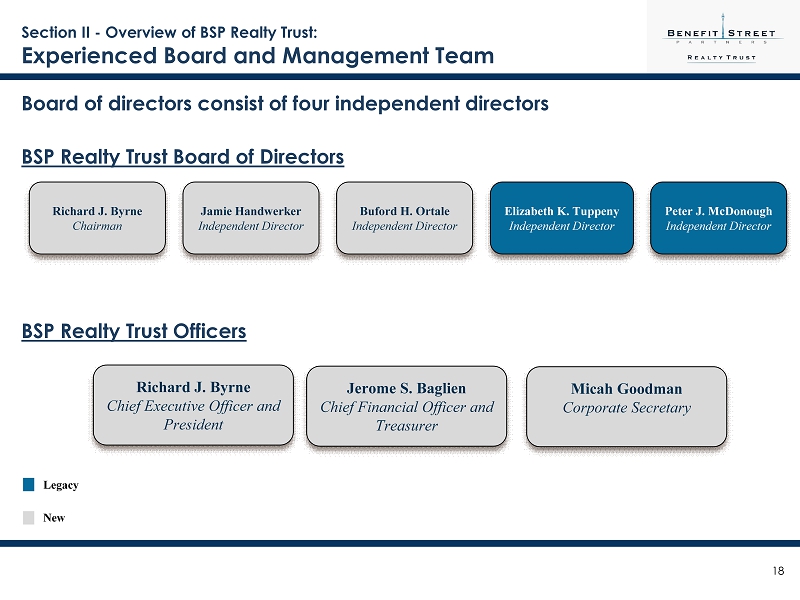
18 Richard J. Byrne Chief Executive Officer and President Jerome S. Baglien Chief Financial Officer and Treasurer Elizabeth K. Tuppeny Independent Director Peter J. McDonough Independent Director Richard J. Byrne Chairman BSP Realty Trust Board of Directors BSP Realty Trust Officers Legacy New Jamie Handwerker Independent Director Buford H. Ortale Independent Director Board of directors consist of four independent directors Micah Goodman Corporate Secretary Section II - Overview of BSP Realty Trust : Experienced Board and Management Team

19 Section III – 1Q17 Financial Update

20 Section III – 1Q17 Financial Update: Financial Highlights ($’s in thousands, where applicable) Source: SEC filings as of 5/12/17 . Note: PAST PERFORMANCE IS NOT NECESSARILY INDICATIVE OF FUTURE RESULTS. ANY INVESTMENT INVOLVES SIGNIFICANT RISK, INCLUDING LOSS O F T HE ENTIRE INVESTMENT. (1) Adjusted to remove impact of unrealized losses on loans held - for - sale. (2) Debt to Equity is calculated as total debt, excluding interest payable, distributions payable, due to affiliates and accounts paya ble and accrued expenses over Book Value at the end of the period. Quarter End Quarter End 3/31/17 12/31/16 Book Value 621,307$ 633,650$ Book Value, per share 19.62$ 19.87$ Net Income 6,049$ 6,337$ Net Income, per share 0.19$ 0.20$ Adjusted Net Income (1) 7,646$ 6,584 Adjusted Net Income, per share (1) 0.24$ 0.21$ Distributions Paid 16,100$ 16,247$ Distributions, per share 0.51$ 0.52$ Dividend Coverage - % 37.6% 39.0% Total Assets 1,255,278$ 1,248,125$ % of loans originated by BSP 8.0% N/A Debt 622,210$ 602,753$ Debt/Equity Ratio (2) 1.00x 0.95x
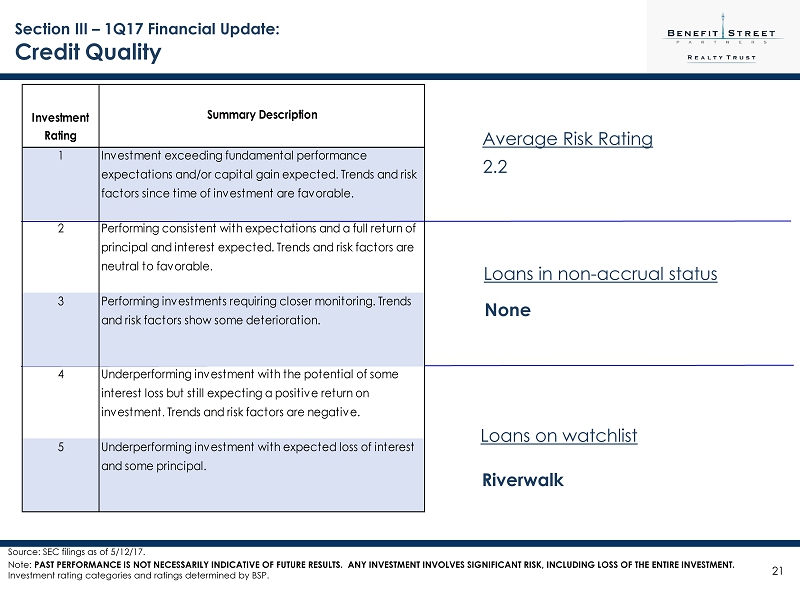
21 21 Section III – 1Q17 Financial Update: Credit Quality Loans in non - accrual status Loans on watchlist None Riverwalk Average Risk Rating 2.2 Investment Rating Summary Description 1 Investment exceeding fundamental performance expectations and/or capital gain expected. Trends and risk factors since time of investment are favorable. 2 Performing consistent with expectations and a full return of principal and interest expected. Trends and risk factors are neutral to favorable. 3 Performing investments requiring closer monitoring. Trends and risk factors show some deterioration. 4 Underperforming investment with the potential of some interest loss but still expecting a positive return on investment. Trends and risk factors are negative. 5 Underperforming investment with expected loss of interest and some principal. Source: SEC filings as of 5/12/17. Note: PAST PERFORMANCE IS NOT NECESSARILY INDICATIVE OF FUTURE RESULTS. ANY INVESTMENT INVOLVES SIGNIFICANT RISK, INCLUDING LOSS O F T HE ENTIRE INVESTMENT . Investment rating categories and ratings determined by BSP.

22 Section IV – Strategic Initiatives

23 Note: There can be no assurance that BSP Realty Trust will be able to implement its investment strategy and achieve its investment objectives. Views expressed are those of BSP . Deploy Capital ▪ Leverage breadth of BSP’s commercial real estate platform to originate n ew loans with attractive risk - adjusted returns ▪ New BSP originations began 1Q 2017 and we have a strong pipeline of investment opportunities Enhance Balance Sheet ▪ Entered into new debt facility with Goldman Sachs ▪ Active discussions with existing and new debt financing counterparties ▪ Evaluating opportunity to execute additional Collateralized Loan Obligation (CLO) Seek to narrow the gap between net income and distributions . Position BSP Realty Trust for a liquidity event . 1 2 Section IV – Strategic Initiatives: Strategic Initiatives

24 Notes: As of May 30, 2017. PAST PERFORMANCE IS NOT NECESSARILY INDICATIVE OF FUTURE RESULTS. ANY INVESTMENT INVOLVES SIGNIFICANT RISK, INCLUDING LOSS O F T HE ENTIRE INVESTMENT. Views expressed are those of BSP . There can be no assurance that signed applications will close and fund. 1 Loan to Value as of the date of origination 2 Levered Yield includes annualized interest income and accretion of discounts and fees net of interest expense; Excludes impact from acquisition fees and expenses. 1Q2017 Number of Loans Closed 5 % Senior Loans 100% % Floating Rate Loans 100% Total Loan Commitments $93.4 Average Loan Commitment Size $18.7 Weighted Average Loan to Value 1 65% Weighted Average Levered Yield 2 15.8% Geographies FL, HI, MN, NV, OH, OR, PA, TN, TX, UT Property Types Multifamily, Retail, Office, Hospitality, Mixed Use Section IV – Strategic Initiatives: 1Q 2017 Origination Update ($’s in millions, where applicable) 4/1 - 5/30 8 100% 100% $158.9 $19.9 65% 16.5% FL, UT, NV, LA, TX, HI Multifamily, Retail, Office, Hospitality, Mixed Use Strong pipeline: Nine loans for $265M as of 5/30/2017. Mixed Use Strong pipeline: Nine loans for $265M as of 5/30/2017.

25 Section IV – Strategic Initiatives: YTD 2017 Origination Update $14mm $37mm $43mm $36mm $90mm $250mm $mm $25mm $50mm $75mm $100mm $125mm $150mm $175mm $200mm $225mm $250mm $275mm 1/1/2017 2/1/2017 3/1/2017 4/1/2017 5/1/2017 6/1/2017 BSPRT Origination Volume Closed Projected to Close

26 Section IV – Strategic Initiatives: Financing Sources JP Morgan • $300mm Line • Libor + 225 to 250 • Avg. Spread of 230 • June 2017 Maturity • $257mm drawn Goldman Sachs • $250mm Line • Libor + 235 to 285 • Avg. Spread of 260 • December 2019 Maturity • $0.0mm drawn RFT FL1 – 2015 • $428mm Line • LIBOR + 1.75% to 5.25% • Avg. Spread of 2.32% • June 2017 Maturity • $370 mm drawn ▪ $622 million of debt outstanding and $ 210 million of undrawn debt capacity ▪ 3.6% weighted average cost of debt CLO Warehouse Lines JP Morgan • $300mm Line • LIBOR + 2.25% to 2.50% • Avg. Spread of 2.30% • June 2017 Maturity • $ 251mm drawn Goldman Sachs • $250mm Line • LIBOR + 2.35% to 2.85% • December 2019 Maturity • $89.1mm drawn Source: SEC filings as of 5/12/17.
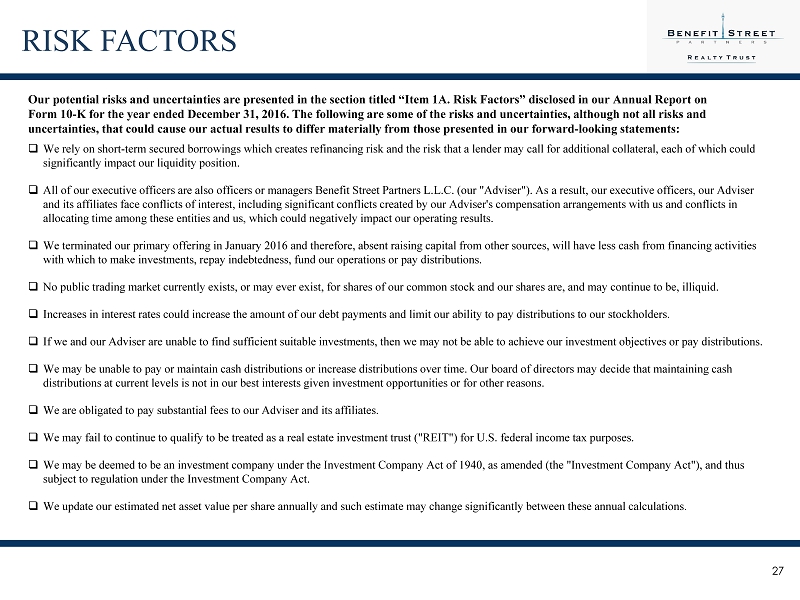
27 RISK FACTORS Our potential risks and uncertainties are presented in the section titled “Item 1A. Risk Factors” disclosed in our Annual Rep ort on Form 10 - K for the year ended December 31, 2016. The following are some of the risks and uncertainties, although not all risks and uncertainties, that could cause our actual results to differ materially from those presented in our forward - looking statements: □ We rely on short - term secured borrowings which creates refinancing risk and the risk that a lender may call for additional colla teral, each of which could significantly impact our liquidity position. □ All of our executive officers are also officers or managers Benefit Street Partners L.L.C. (our " Adviser "). As a result, our executive officers, our Adviser and its affiliates face conflicts of interest, including significant conflicts created by our Adviser's compensation arrangements with us and conflicts in allocating time among these entities and us, which could negatively impact our operating results. □ We terminated our primary offering in January 2016 and therefore, absent raising capital from other sources, will have less c ash from financing activities with which to make investments, repay indebtedness, fund our operations or pay distributions. □ No public trading market currently exists, or may ever exist, for shares of our common stock and our shares are, and may cont inu e to be, illiquid. □ Increases in interest rates could increase the amount of our debt payments and limit our ability to pay distributions to our sto ckholders. □ If we and our Adviser are unable to find sufficient suitable investments, then we may not be able to achieve our investment objectives or pay distr ibu tions. □ We may be unable to pay or maintain cash distributions or increase distributions over time. Our board of directors may decide th at maintaining cash distributions at current levels is not in our best interests given investment opportunities or for other reasons. □ We are obligated to pay substantial fees to our Adviser and its affiliates. □ We may fail to continue to qualify to be treated as a real estate investment trust ("REIT") for U.S. federal income tax purpo ses . □ We may be deemed to be an investment company under the Investment Company Act of 1940, as amended (the "Investment Company Ac t") , and thus subject to regulation under the Investment Company Act. □ We update our estimated net asset value per share annually and such estimate may change significantly between these annual ca lcu lations.

Financing the Growth of Commercial Real Estate www.bsprealtytrust.com ▪ Investor and Financial Advisors can call (844) 785 - 4393 for account information, balances and the status of submitted paperwork ▪ Financial Advisors may view client accounts, statements and tax forms at www.dstvision.com ▪ Shareholders may access their accounts at www.bsprealtytrust.com