Attached files
| file | filename |
|---|---|
| EX-32.2 - EXHIBIT 32.2 - Benefit Street Partners Realty Trust, Inc. | rft-2016q2xexhibit312.htm |
| EX-32 - EXHIBIT 32 CEO AND CFO - Benefit Street Partners Realty Trust, Inc. | rft-2016q2xexhibit32.htm |
| EX-31.1 - EXHIBIT 31.1 - Q2 2016 - Benefit Street Partners Realty Trust, Inc. | rft-2016q2xexhibit311.htm |
| EX-10..2 - EXHIBIT 10..2 - Benefit Street Partners Realty Trust, Inc. | rft2016q2petermcdonoughindem.htm |
| EX-10.3 - EXHIBIT 10.3 RESTRICTED STOCK AGREE - Benefit Street Partners Realty Trust, Inc. | rftstockagreement.htm |
UNITED STATES
SECURITIES AND EXCHANGE COMMISSION
Washington, D.C. 20549
FORM 10-Q
(Mark One) | |
x | QUARTERLY REPORT PURSUANT TO SECTION 13 OR 15(D) OF THE SECURITIES EXCHANGE ACT OF 1934 |
For the quarterly period ended June 30, 2016
OR
¨ | TRANSITION REPORT PURSUANT TO SECTION 13 OR 15(D) OF THE SECURITIES EXCHANGE ACT OF 1934 |
Commission file number: 000-55188
REALTY FINANCE TRUST, INC.
(Exact name of registrant as specified in its charter)
Maryland | 46-1406086 | |
(State or Other Jurisdiction of Incorporation or Organization) | (I.R.S. Employer Identification No.) | |
405 Park Avenue, 14th Floor New York, New York | 10022 | |
(Address of Principal Executive Office) | (Zip Code) | |
(212) 415-6500
(Registrant’s Telephone Number, Including Area Code)
Not applicable
(Former Name, Former Address and Former Fiscal Year, if Changed Since Last Report)
Indicate by check mark whether the registrant: (1) has filed all reports required to be filed by Section 13 or 15(d) of the Securities Exchange Act of 1934 during the preceding 12 months (or for such shorter period that the registrant was required to file such reports), and (2) has been subject to such filing requirements for the past 90 days. Yes x No o
Indicate by check mark whether the registrant has submitted electronically and posted on its corporate Web site, if any, every Interactive Data File required to be submitted and posted pursuant to Rule 405 of Regulation S-T (§232.405 of this chapter) during the preceding 12 months (or for such shorter period that the registrant was required to submit and post such files).Yes x No o
Indicate by check mark whether the registrant is a large accelerated filer, an accelerated filer, a non-accelerated filer or a smaller reporting company. See the definitions of "large accelerated filer," "accelerated filer" and "smaller reporting company" in Rule 12b-2 of the Exchange Act. (check one):
(Do not check if a smaller reporting company)
Large accelerated filer o | Accelerated filer o |
Non-accelerated filer o | Smaller reporting company x |
Indicate by check mark whether the registrant is a shell company (as defined in Rule 12b-2 of the Exchange Act). Yes o No x
The number of shares of the registrant's common stock, $0.01 par value, outstanding as of July 31, 2016 was 31,441,977.
TABLE OF CONTENTS
Page | |
PART I | |
1 | |
PART II | |
i
PART I
Item 1. Consolidated Financial Statements.
REALTY FINANCE TRUST, INC.
CONSOLIDATED BALANCE SHEETS
(In thousands, except for share and per share data)
June 30, 2016 | December 31, 2015 | ||||||
ASSETS | (Unaudited) | ||||||
Cash and cash equivalents | $ | 63,653 | $ | 14,807 | |||
Restricted cash | 6,498 | 5,366 | |||||
Commercial mortgage loans, held for investment, net of allowance of $1,722 and $888 (1) | 1,126,995 | 1,124,201 | |||||
Real estate securities, available for sale, at fair value | 125,987 | 130,754 | |||||
Receivable for loan repayment | 1,596 | 1,307 | |||||
Accrued interest receivable (2) | 5,248 | 5,360 | |||||
Prepaid expenses and other assets | 1,125 | 689 | |||||
Total assets | $ | 1,331,102 | $ | 1,282,484 | |||
LIABILITIES AND STOCKHOLDERS' EQUITY | |||||||
Collateralized loan obligations | $ | 287,412 | $ | 287,229 | |||
Repurchase agreements - commercial mortgage loans | 262,056 | 206,239 | |||||
Repurchase agreements - real estate securities | 119,280 | 117,211 | |||||
Interest payable (3) | 808 | 792 | |||||
Distributions payable | 5,392 | 5,552 | |||||
Accounts payable and accrued expenses | 14,520 | 6,805 | |||||
Due to affiliates | 4,049 | 4,327 | |||||
Total liabilities | 693,517 | 628,155 | |||||
Commitment and Contingencies (See Note 8) | |||||||
Preferred stock, $0.01 par value, 50,000,000 authorized, none issued and outstanding as of June 30, 2016 and December 31, 2015 | — | — | |||||
Convertible stock ("promote shares"); $0.01 par value, 1,000 shares authorized, issued and outstanding as of June 30, 2016 and December 31, 2015 | 1 | 1 | |||||
Common stock, $0.01 par value, 949,999,000 shares authorized, 31,361,543 and 31,385,280 shares issued and outstanding as of June 30, 2016 and December 31, 2015, respectively | 314 | 314 | |||||
Additional paid-in capital | 691,632 | 691,590 | |||||
Accumulated other comprehensive loss | (4,827 | ) | (2,254 | ) | |||
Accumulated deficit | (49,535 | ) | (35,322 | ) | |||
Total stockholders' equity | 637,585 | 654,329 | |||||
Total liabilities and stockholders' equity | $ | 1,331,102 | $ | 1,282,484 | |||
(1) | Includes $425,992 and $425,733 of loans net of allowance of $713 and $422 pledged as collateral on collateralized loan obligations ("CLO"), a variable interest entity ("VIE") as of June 30, 2016 and December 31, 2015, respectively. |
(2) | Includes $1,010 and $1,048 of interest receivable for loans pledged as collateral on CLO, a VIE as of June 30, 2016 and December 31, 2015, respectively. |
(3) | Includes $500 and $513 of interest payable for loans pledged as collateral on CLO, a VIE as of June 30, 2016 and December 31, 2015, respectively. |
The accompanying notes are an integral part of these unaudited consolidated financial statements.
1
REALTY FINANCE TRUST, INC.
CONSOLIDATED STATEMENTS OF OPERATIONS
(In thousands, except for share and per share data)
(Unaudited)
Three Months Ended June 30, | Six Months Ended June 30, | ||||||||||||||
2016 | 2015 | 2016 | 2015 | ||||||||||||
Interest Income: | |||||||||||||||
Interest income | $ | 20,222 | $ | 12,484 | $ | 40,513 | $ | 22,089 | |||||||
Less: Interest expense | 5,393 | 2,523 | 10,161 | 4,456 | |||||||||||
Net interest income | 14,829 | 9,961 | 30,352 | 17,633 | |||||||||||
Expenses: | |||||||||||||||
Asset management and subordinated performance fee | 3,015 | 974 | 6,025 | 1,336 | |||||||||||
Acquisition fees | 223 | 3,149 | 380 | 4,181 | |||||||||||
Administrative services expenses | 539 | — | 1,355 | — | |||||||||||
Professional fees | 811 | 1,040 | 2,072 | 2,419 | |||||||||||
Other expenses | 712 | 415 | 1,406 | 538 | |||||||||||
Loan loss provision | 669 | 80 | 834 | 224 | |||||||||||
Total expenses | 5,969 | 5,658 | 12,072 | 8,698 | |||||||||||
Net income | $ | 8,860 | $ | 4,303 | $ | 18,280 | $ | 8,935 | |||||||
Basic net income per share | $ | 0.28 | $ | 0.20 | $ | 0.58 | $ | 0.45 | |||||||
Diluted net income per share | $ | 0.28 | $ | 0.20 | $ | 0.58 | $ | 0.45 | |||||||
Basic weighted average shares outstanding | 31,802,261 | 22,036,590 | 31,676,513 | 19,671,251 | |||||||||||
Diluted weighted average shares outstanding | 31,807,927 | 22,040,657 | 31,682,402 | 19,675,540 | |||||||||||
The accompanying notes are an integral part of these unaudited consolidated financial statements.
2
REALTY FINANCE TRUST, INC.
CONSOLIDATED STATEMENTS OF COMPREHENSIVE INCOME
(In thousands)
(Unaudited)
Three Months Ended June 30, | Six Months Ended June 30, | ||||||||||||||
2016 | 2015 | 2016 | 2015 | ||||||||||||
Net income | $ | 8,860 | $ | 4,303 | $ | 18,280 | $ | 8,935 | |||||||
Unrealized (loss)/gain on available-for-sale securities | 2,391 | 143 | (2,573 | ) | 2 | ||||||||||
Comprehensive income attributable to Realty Finance Trust, Inc. | $ | 11,251 | $ | 4,446 | $ | 15,707 | $ | 8,937 | |||||||
The accompanying notes are an integral part of these unaudited consolidated financial statements.
3
REALTY FINANCE TRUST, INC.
CONSOLIDATED STATEMENT OF CHANGES IN STOCKHOLDERS' EQUITY
(In thousands, except for share data)
(Unaudited)
Convertible Stock | Common Stock | ||||||||||||||||||||||||||||
Number of Shares | Amount | Number of Shares | Par Value | Additional Paid-In Capital | Accumulated Other Comprehensive Loss | Accumulated Deficit | Total Stockholders' Equity | ||||||||||||||||||||||
Balance, December 31, 2015 | 1,000 | 1 | 31,385,280 | 314 | 691,590 | (2,254 | ) | (35,322 | ) | 654,329 | |||||||||||||||||||
Common stock repurchases | — | — | (536,240 | ) | (5 | ) | (12,921 | ) | — | — | (12,926 | ) | |||||||||||||||||
Common stock issued through distribution reinvestment plan | — | — | 512,503 | 5 | 12,945 | — | — | 12,950 | |||||||||||||||||||||
Share-based compensation | — | — | — | — | 18 | — | — | 18 | |||||||||||||||||||||
Net income | — | — | — | — | — | 18,280 | 18,280 | ||||||||||||||||||||||
Distributions declared | — | — | — | — | — | — | (32,493 | ) | (32,493 | ) | |||||||||||||||||||
Other comprehensive loss | — | — | — | — | — | (2,573 | ) | — | (2,573 | ) | |||||||||||||||||||
Balance, June 30, 2016 | 1,000 | $ | 1 | 31,361,543 | $ | 314 | $ | 691,632 | $ | (4,827 | ) | $ | (49,535 | ) | $ | 637,585 | |||||||||||||
The accompanying notes are an integral part of these unaudited consolidated financial statements.
4
REALTY FINANCE TRUST, INC.
CONSOLIDATED STATEMENTS OF CASH FLOWS
(In thousands)
(Unaudited)
Six Months Ended June 30, | |||||||
2016 | 2015 | ||||||
Cash flows from operating activities: | |||||||
Net income | $ | 18,280 | $ | 8,935 | |||
Adjustments to reconcile net income to net cash provided by operating activities: | |||||||
Premium amortization and (discount accretion), net | (1,143 | ) | (508 | ) | |||
Accretion of deferred commitment fees | (765 | ) | (301 | ) | |||
Amortization of deferred financing costs | 1,333 | 1,184 | |||||
Share-based compensation | 18 | 12 | |||||
Loan loss provision | 834 | 224 | |||||
Changes in assets and liabilities: | |||||||
Accrued interest receivable | 877 | (574 | ) | ||||
Prepaid expenses and other assets | (20 | ) | 40 | ||||
Accounts payable and accrued expenses | 52 | 1,192 | |||||
Due to affiliates | (278 | ) | (78 | ) | |||
Interest payable | 16 | 184 | |||||
Net cash provided by operating activities | $ | 19,204 | $ | 10,310 | |||
Cash flows from investing activities: | |||||||
Origination and purchase of commercial mortgage loans | $ | (25,194 | ) | $ | (378,803 | ) | |
Purchase of real estate securities | — | (43,287 | ) | ||||
Principal repayments received on commercial mortgage loans | 22,401 | 35,366 | |||||
Principal repayments received on real estate securities | 2,213 | 287 | |||||
Net cash used in investing activities | $ | (580 | ) | $ | (386,437 | ) | |
Cash flows from financing activities: | |||||||
Proceeds from issuances of common stock | $ | — | $ | 214,419 | |||
Common stock repurchases | (6,013 | ) | (1,278 | ) | |||
Payments of offering costs and fees related to common stock issuances | — | (24,703 | ) | ||||
Borrowings on repurchase agreements - commercial mortgage loans | 104,626 | 186,592 | |||||
Repayments of repurchase agreements - commercial mortgage loans | (48,809 | ) | (13,857 | ) | |||
Borrowings on repurchase agreements - real estate securities | 715,666 | 263,280 | |||||
Repayments of repurchase agreements - real estate securities | (713,597 | ) | (232,039 | ) | |||
Increase in restricted cash related to financing activities | (1,132 | ) | (344 | ) | |||
Payments of deferred financing costs | (816 | ) | (125 | ) | |||
Distributions paid | (19,703 | ) | (10,759 | ) | |||
Net cash provided by financing activities | $ | 30,222 | $ | 381,186 | |||
Net change in cash | $ | 48,846 | $ | 5,059 | |||
Cash, beginning of period | 14,807 | 386 | |||||
Cash, end of period | $ | 63,653 | $ | 5,445 | |||
Supplemental disclosures of cash flow information: | |||||||
Interest paid | 8,811 | 5,456 | |||||
Supplemental disclosures of non-cash flow information: | |||||||
Distributions payable | $ | 5,392 | $ | 4,022 | |||
Common stock issued through distribution reinvestment plan | 12,950 | 7,974 | |||||
Receivable for common stock issued | — | 1,756 | |||||
The accompanying notes are an integral part of these unaudited consolidated financial statements.
5
REALTY FINANCE TRUST, INC.
NOTES TO CONSOLIDATED FINANCIAL STATEMENTS
June 30, 2016
(Unaudited)
Note 1 - Organization and Business Operations
Realty Finance Trust, Inc. (the "Company") was incorporated in Maryland on November 15, 2012 and conducts its operations to qualify as a real estate investment trust ("REIT") for U.S. federal income tax purposes beginning with the taxable year ended December 31, 2013. Substantially all of the Company's business is conducted through Realty Finance Operating Partnership, L.P. (the “OP”), a Delaware limited partnership. Realty Finance Advisors, LLC is the Company's advisor (the "Advisor"). The Company is the sole general partner and directly or indirectly hold all of the units of limited partner interests in the OP. Additionally, the Advisor contributed $1,000 to the Company in exchange for 1,000 convertible shares of Realty Finance Trust, Inc. The convertible shares will automatically convert to shares of the Company's common stock upon the first occurrence of any of the following triggering events, (each a "Triggering Event"): (i) the Company has paid total distributions on the then-outstanding shares of the Company's common stock in an amount equal to or in excess of the sum of the invested capital (as defined in the Company's charter) plus an aggregate 6.0% cumulative, pre-tax, non-compounded, annual return on such invested capital, (ii) a listing of the Company's shares of common stock on a national securities exchange or (iii) the termination of the Company's advisory agreement under certain circumstances. The Company did not incur any of the aforementioned trigger events to date.
Prior to January 2016 the Company was offering for sale a maximum of 80.0 million shares of common stock, $0.01 par value per share, on a reasonable best efforts basis (the "Offering"), pursuant to a registration statement on Form S-11 filed with the U.S. Securities and Exchange Commission under the Securities Act of 1933, as amended. The registration statement also covered the offer and sale of up to approximately 16.8 million shares of common stock pursuant to a distribution reinvestment plan (the "DRIP") under which common stockholders may elect to have their distributions reinvested in additional shares of the Company’s common stock. Effective January 2016, the Company terminated the Offering, deregistered 4,069 unsold shares from the Offering and reallocated 49.7 million unsold shares from the Offering to the DRIP offering.
The Company is in business to originate, acquire and manage a diversified portfolio of commercial real estate debt secured by properties located both within and outside of the United States. The Company also invests in commercial real estate securities. Commercial real estate debt may include first mortgage loans, subordinated mortgage loans, mezzanine loans and participations in such loans. Real estate securities may include commercial mortgage-backed securities ("CMBS"), senior unsecured debt of publicly traded REITs, debt or equity securities of other publicly traded real estate companies and collateralized debt obligations ("CDOs").
The Company has no employees. The Company has retained the Advisor to manage the Company's affairs on a day-to-day basis. The Advisor is controlled by AR Global Investments, LLC ("AR Global"), the parent of American Realty Capital VIII, LLC (the "Sponsor"), as a result of which they are related parties and each of them has received or will receive compensation and fees for services related to the investment and management of the Company's assets, the operations of the Company and the liquidation of the Company.
On May 6, 2016, the Company announced that the Company's Board, with the unanimous agreement of all directors, had recently formed a special committee, consisting exclusively of independent directors, to explore a potential strategic transaction with a related party. The Board granted the special committee the exclusive authority to consider, review, evaluate and, if appropriate, negotiate a strategic transaction on behalf of the Company. In addition, the Board granted the special committee the authority, when considering such strategic transaction, to solicit expressions of interest or other proposals for, and to consider, any alternative transactions. These transactions may include a possible sale or merger with one or more related or unrelated entities, listing the shares on a national exchange, changing the advisor or the sale of assets.
There are no assurances that the consideration of any strategic alternative will result in a transaction. The Company does not intend to comment on or disclose developments regarding the process unless the Company deems further disclosure is appropriate or required.
6
REALTY FINANCE TRUST, INC.
NOTES TO CONSOLIDATED FINANCIAL STATEMENTS
June 30, 2016
(Unaudited)
Note 2 - Summary of Significant Accounting Policies
Basis of Accounting
The accompanying consolidated financial statements and related footnotes are unaudited and have been prepared on the accrual basis of accounting in conformity with accounting principles generally accepted in the United States of America (“GAAP”) for interim financial statements and pursuant to the requirements for reporting on Form 10-Q and Regulation S-X, as appropriate. Accordingly, the consolidated financial statements may not include all of the information and notes required by GAAP for annual consolidated financial statements. GAAP requires management to make estimates and assumptions that affect the reported amount of assets and liabilities as of the date of the financial statements and the reported amounts of income and expenses during the reported periods. Changes in the economic environment, financial markets and any other parameters used in determining these estimates could cause actual results to differ materially. In the opinion of management, the interim data includes all adjustments, of a normal and recurring nature, necessary for a fair statement of the results for the periods presented. The current period’s results of operations will not necessarily be indicative of results that ultimately may be achieved for the entire year or any subsequent interim periods.
These financial statements should be read in conjunction with the audited consolidated financial statements and notes thereto as of, and for the year ended December 31, 2015, which are included in the Company's Annual Report on Form 10-K filed with the Securities and Exchange Commission ("SEC") on March 11, 2016. There have been no significant changes to the Company's significant accounting policies during the three and six months ended June 30, 2016, as described below.
Principles of Consolidation
The Company consolidates all entities that the Company controls through either majority ownership or voting rights. In addition, the Company consolidates all variable interest entities ("VIE") of which the Company is considered the primary beneficiary. VIEs are defined as entities in which equity investors (i) do not have the characteristics of a controlling financial interest and/or (ii) do not have sufficient equity at risk for the entity to finance its activities without additional subordinated financial support from other parties. The entity that consolidates a VIE is known as its primary beneficiary and is generally the entity with (i) the power to direct the activities that most significantly affect the VIE’s economic performance and (ii) the right to receive benefits from the VIE or the obligation to absorb losses of the VIE that could be significant to the VIE.
The accompanying consolidated financial statements include the accounts of the Company, its wholly owned subsidiary, Realty Finance Operating Partnership, L.P. (the "OP") and its subsidiaries. All intercompany accounts and transactions have been eliminated in consolidation. In determining whether the Company has a controlling financial interest in a joint venture and the requirement to consolidate the accounts of that entity, management considers factors such as ownership interest, authority to make decisions and contractual and substantive participating rights of the other partners or members as well as whether the entity is a variable interest entity ("VIE") for which the Company is the primary beneficiary. The Company has determined the OP is a VIE of which the Company is the primary beneficiary. Substantially all of the Company's assets and liabilities are held by the OP.
The accompanying consolidated financial statements include the accounts of a collateralized loan obligation ("CLO") issued and securitized by a wholly owned subsidiary of the Company. The Company has determined the CLO is a VIE of which the Company's subsidiary is the primary beneficiary. The Company has disclosed the assets and liabilities of the CLO on the face of the balance sheet in accordance with ASC 810 - Consolidation.
Allowance for Loan Losses
The allowance for loan losses reflects management's estimate of loan losses inherent in the loan portfolio as of the balance sheet date. The reserve is increased through the loan loss provision on the Company's consolidated statement of operations and is decreased by charge-offs when losses are confirmed through the receipt of assets, such as cash in a pre-foreclosure sale or upon ownership control of the underlying collateral in full satisfaction of the loan upon foreclosure or when significant collection efforts have ceased. The Company uses a uniform process for determining its allowance for loan losses. The allowance for loan losses includes a general, formula-based component and an asset-specific component.
General reserves are recorded when (i) available information as of each balance sheet date indicates that it is probable a loss has occurred in the portfolio and (ii) the amount of the loss can be reasonably estimated. The Company currently estimates loss rates based on historical realized losses experienced in the industry and takes into account current collateral and economic conditions affecting the probability and severity of losses when establishing the allowance for loan losses. The Company performs a comprehensive analysis of its loan portfolio and assigns risk ratings to loans that incorporate management's current judgments about their credit quality based on all known and relevant internal and external factors that may affect collectability. The Company considers, among other things, payment status, lien position, borrower financial resources and investment in
7
REALTY FINANCE TRUST, INC.
NOTES TO CONSOLIDATED FINANCIAL STATEMENTS
June 30, 2016
(Unaudited)
collateral, collateral type, project economics and geographic location as well as national and regional economic factors. This methodology results in loans being segmented by risk classification into risk rating categories that are associated with estimated probabilities of default and principal loss. Ratings range from "1" to "5" with "1" representing the lowest risk of loss and "5" representing the highest risk of loss.
The asset-specific reserve component relates to reserves for losses on individual impaired loans. The Company considers a loan to be impaired when, based upon current information and events, it believes that it is probable that the Company will be unable to collect all amounts due under the contractual terms of the loan agreement. This assessment is made on an individual loan basis each quarter based on such factors as payment status, lien position, borrower financial resources and investment in collateral, collateral type, project economics and geographical location as well as national and regional economic factors. A reserve is established for an impaired loan when the present value of payments expected to be received, observable market prices or the estimated fair value of the collateral (for loans that are dependent on the collateral for repayment) is lower than the carrying value of that loan.
For collateral dependent impaired loans, impairment is measured using the estimated fair value of collateral less the estimated cost to sell. Valuations are performed or obtained at the time a loan is determined to be impaired and designated non-performing, and they are updated if circumstances indicate that a significant change in value has occurred. The Advisor generally will use the income approach through internally developed valuation models to estimate the fair value of the collateral for such loans. In more limited cases, the Advisor will obtain external "as is" appraisals for loan collateral, generally when third party participations exist.
A loan is also considered impaired if its terms are modified in a troubled debt restructuring ("TDR"). A TDR occurs when a concession is granted and the debtor is experiencing financial difficulties. Impairments on TDR loans are generally measured based on the present value of expected future cash flows discounted at the effective interest rate of the original loans.
The Company designates non-performing loans at such time as (i) loan payments become 90-days past due; (ii) the loan has a maturity default; or (iii) in the opinion of the Company, it is probable the Company will be unable to collect all amounts due according to the contractual terms of the loan. Income recognition will be suspended when a loan is designated non-performing and resumed only when the suspended loan becomes contractually current and performance is demonstrated to have resumed. A loan will be written off when it is no longer realizable and legally discharged.
Per Share Data
The Company calculates basic earnings per share by dividing net income attributable to the Company for the period by the weighted-average number of shares of common stock outstanding for that period. Diluted earnings per share reflects the potential dilution that could occur from shares issuable in connection with the restricted stock plan and if convertible shares were exercised, except when doing so would be anti-dilutive.
Reportable Segments
The Company conducts its business through the following segments:
• | The real estate debt business which is focused on originating, acquiring and asset managing commercial real estate debt investments, including first mortgage loans, subordinate mortgages, mezzanine loans and participations in such loans. |
• | The real estate securities business which is focused on investing in and asset managing commercial real estate securities primarily consisting of CMBS and may include unsecured REIT debt, CDO notes and other securities. |
See Note 12 - Segment Reporting for further information regarding the Company's segments.
Recently Issued Accounting Pronouncements
In February 2015, the FASB amended the accounting for consolidation of certain legal entities. The amendments modify the evaluation of whether certain legal entities are VIEs or voting interest entities, eliminate the presumption that a general partner should consolidate a limited partnership and affect the consolidation analysis of reporting entities that are involved with VIEs (particularly those that have fee arrangements and related party relationships). The revised guidance is effective for fiscal years, and for interim periods within those fiscal years, beginning after December 15, 2015. Early adoption was permitted, including adoption in an interim period. The Company elected to adopt this guidance effective January 1, 2016. The Company has evaluated the impact of the adoption of the new guidance on its consolidated financial statements and has determined the Company’s OP is considered a VIE. However, the Company meets the disclosure exemption criteria as the Company is the primary beneficiary of the VIE and the Company's partnership interest is considered a majority voting interest in a business and
8
REALTY FINANCE TRUST, INC.
NOTES TO CONSOLIDATED FINANCIAL STATEMENTS
June 30, 2016
(Unaudited)
the assets of the OP can be used for purposes other than settling its obligation, such as paying distributions. As such, the new guidance did not have a material impact on the Company's consolidated financial statements.
In March 2016, the FASB issued an update that changes the accounting for certain aspects of share-based compensation. Among other things, the revised guidance allows companies to make an entity-wide accounting policy election to either estimate the number of awards that are expected to vest or account for forfeitures when they occur. The revised guidance is effective for reporting periods beginning after December 15, 2016. Early adoption is permitted. The Company has adopted the provisions of this guidance beginning January 1, 2016, electing to account for forfeitures when they occur, and determined that there is no impact to the Company’s consolidated financial position, results of operations and cash flows.
In March 2016, the FASB issued guidance which requires an entity to determine whether the nature of its promise to provide goods or services to a customer is performed in a principal or agent capacity and to recognize revenue in a gross or net manner based on its principal/agent designation. This guidance is effective for public business entities for fiscal years, and for interim periods within those fiscal years, beginning after December 15, 2017. Early adoption is permitted. The Company is currently evaluating the impact of this new guidance.
In June 2016, the FASB issued guidance that changes how entities measure credit losses for financial assets carried at amortized cost. The update eliminates the requirement that a credit loss must be probable before it can be recognized and instead requires an entity to recognize the current estimate of all expected credit losses. Additionally, the update requires credit losses on available-for-sale debt securities to be carried as an allowance rather than as a direct write-down of the asset. The amendments become effective for reporting periods beginning after December 15, 2019. The amendments may be adopted early for reporting periods beginning after December 15, 2018. The company is currently evaluating the impact of this new guidance.
Note 3 - Commercial Mortgage Loans
The following table is a summary of the Company's commercial mortgage loan carrying values by class (in thousands):
June 30, 2016 | December 31, 2015 | ||||||
Senior loans | $ | 913,619 | $ | 894,075 | |||
Mezzanine loans | 205,098 | 221,014 | |||||
Subordinated loans | 10,000 | 10,000 | |||||
Total gross carrying value of loans | 1,128,717 | 1,125,089 | |||||
Less: Allowance for loan losses | 1,722 | 888 | |||||
Total commercial mortgage loans, net | $ | 1,126,995 | $ | 1,124,201 | |||
The following table presents the activity in the Company's allowance for loan losses (in thousands):
Six Months Ended June 30, 2016 | Six Months Ended June 30, 2015 | ||||||
Beginning of period | $ | 888 | $ | 570 | |||
Provision for loan losses | 834 | 224 | |||||
Charge-offs | — | — | |||||
Recoveries | — | — | |||||
Ending allowance for loan losses | $ | 1,722 | $ | 794 | |||
As of June 30, 2016 and December 31, 2015, the Company's commercial mortgage loan portfolio comprised 75 and 77 loans, respectively.
9
REALTY FINANCE TRUST, INC.
NOTES TO CONSOLIDATED FINANCIAL STATEMENTS
June 30, 2016
(Unaudited)
June 30, 2016 | December 31, 2015 | |||||||||||||
Loan Type | Par Value | Percentage | Par Value | Percentage | ||||||||||
Office | $ | 313,296 | 27.6 | % | $ | 307,876 | 27.2 | % | ||||||
Multifamily | 308,278 | 27.1 | % | 305,129 | 26.9 | % | ||||||||
Hospitality | 173,281 | 15.2 | % | 171,752 | 15.1 | % | ||||||||
Retail | 160,912 | 14.2 | % | 158,784 | 14.0 | % | ||||||||
Mixed Use | 128,496 | 11.3 | % | 138,798 | 12.2 | % | ||||||||
Industrial | 52,688 | 4.6 | % | 52,107 | 4.6 | % | ||||||||
$ | 1,136,951 | 100.0 | % | $ | 1,134,446 | 100.0 | % | |||||||
Credit Characteristics
As part of the Company's process for monitoring the credit quality of its loans, it performs a quarterly loan portfolio assessment and assigns risk ratings to each of its loans. The loans are scored on a scale of 1 to 5 as follows:
Investment Rating | Summary Description | |
1 | Investment exceeding fundamental performance expectations and/or capital gain expected. Trends and risk factors since time of investment are favorable. | |
2 | Performing consistent with expectations and a full return of principal and interest expected. Trends and risk factors are neutral to favorable. | |
3 | Performing investments requiring closer monitoring. Trends and risk factors show some deterioration. | |
4 | Underperforming investment with some loss of interest expected but still expecting a positive return on investment. Trends and risk factors are negative. | |
5 | Underperforming investment with expected loss of interest and some principal. | |
All commercial mortgage loans are assigned an initial risk rating of 2.0. As of June 30, 2016 and December 31, 2015, the weighted average risk rating of loans was 2.0 and 2.0, respectively. As of June 30, 2016 and December 31, 2015, the Company did not have any loans that were past due on their payments, in non-accrual status or impaired.
For the six months ended June 30, 2016 and June 30, 2015, the activity in the Company's loan portfolio was as follows (in thousands):
Six Months Ended June 30, 2016 | Six Months Ended June 30, 2015 | ||||||
Balance at Beginning of Year | $ | 1,124,201 | $ | 456,884 | |||
Acquisitions and originations | 25,194 | 378,803 | |||||
Dispositions | — | — | |||||
Principal repayments | (22,690 | ) | (43,877 | ) | |||
Discount accretion and premium amortization* | 1,124 | 506 | |||||
Provision for loan losses | (834 | ) | (224 | ) | |||
Balance at End of Period | $ | 1,126,995 | $ | 792,092 | |||
________________________
* Includes amortization of capitalized acquisition fees and expenses.
Note 4 - Real Estate Securities
The following is a summary of the Company's real estate securities, CMBS (in thousands):
Weighted Average | ||||||||||||||||
Number of Investments | Interest Rate | Maturity | Par Value | Fair Value | ||||||||||||
June 30, 2016 | 16 | 4.80 | % | January 2019 | $ | 130,970 | $ | 125,987 | ||||||||
December 31, 2015 | 16 | 4.71 | % | February 2019 | 133,183 | 130,754 | ||||||||||
10
REALTY FINANCE TRUST, INC.
NOTES TO CONSOLIDATED FINANCIAL STATEMENTS
June 30, 2016
(Unaudited)
The Company classified its CMBS as available-for-sale as of June 30, 2016 and December 31, 2015. These investments are reported at fair value in the balance sheet with changes in fair value recorded in accumulated other comprehensive income or loss. The following table shows the amortized cost, unrealized gains/losses and fair value of the Company's CMBS investments as of June 30, 2016 and December 31, 2015 (in thousands):
Amortized Cost | Unrealized Gains | Unrealized Losses | Fair Value | |||||||||||||
June 30, 2016 | $ | 130,814 | $ | 39 | $ | (4,866 | ) | $ | 125,987 | |||||||
December 31, 2015 | 133,008 | — | (2,254 | ) | 130,754 | |||||||||||
As of June 30, 2016, the Company held 16 CMBS positions for an aggregate carrying value of $130.8 million, with an unrealized loss of $4.9 million, of which 11 positions had a total unrealized loss of $0.3 million for a period greater than 12 months.
Note 5 - Debt
Repurchase Agreements - Commercial Mortgage Loans
The Company entered into repurchase facilities with JPMorgan Chase Bank, National Association (the "JPM Repo Facility") and Barclays Bank PLC (the "Barclays Repo Facility"). The JPM Repo Facility provides up to $150.0 million in advances. The Barclays Repo Facility provides up to $150.0 million in advances. Both, the JPM Repo Facility and Barclays Repo Facility are subject to various adjustments. The Company expects to use advances from the JPM Repo Facility and the Barclays Repo Facility to finance the acquisition or origination of eligible loans, including first mortgage loans, subordinated mortgage loans, mezzanine loans and participation interests therein. The initial maturity date of the JPM Repo Facility was June 18, 2016, with a one year extension at the Company’s option, which may be exercised upon the satisfaction of certain conditions. The Company has exercised the extension option with the JPM Repo Facility lender, extending the maturity date to June 17, 2017. The Company entered into an amendment of the Barclays Repo Facility, dated as of May 12, 2016 (the “Barclays Amendment”), pursuant to which the maturity date of the Barclays Repo Facility was extended to September 6, 2016, and the pricing rate for each purchased asset was increased by 0.50% per annum. There are two six months extensions remaining under the Barclays Repo Facility, which may be granted by the lender in its sole discretion upon the satisfaction of certain conditions. Although the Company is in discussions with the lender with respect to an extension, as of the filing date of this quarterly report the lender has not granted an extension. In the event the extension is not granted by the maturity date and the Company is unable to obtain alternative financing, the Company would be required to sell a portion of the Company's assets to provide cash to supplement cash-on-hand and liquid securities in order to repay the amounts then outstanding on the facility. As of June 30, 2016, the Company is in compliance with all debt covenants.
As of June 30, 2016 and December 31, 2015, the Company had $140.1 million and $84.3 million outstanding under the JPM Repo Facility. Advances under the JPM Repo Facility accrue interest at per annum rates equal to the sum of (i) the applicable LIBOR index rate plus (ii) a margin between 2.25% to 4.5%, depending on the attributes of the purchased assets. As of June 30, 2016 and December 31, 2015, the weighted average interest rate on advances was 2.7% and 3.1%, respectively. The Company incurred $1.7 million and $1.6 million in interest expense on the JPM Repo Facility for the six months ended June 30, 2016 and 2015, respectively.
As of June 30, 2016 and December 31, 2015, the Company had $121.9 million and $121.9 million outstanding under the Barclays Repo Facility. After giving effect to the Barclays Amendment, advances under the Barclays Repo Facility accrue interest at per annum rates equal to the sum of (i) the applicable LIBOR index rate plus (ii) a margin between 2.5% to 3.0%, depending on the attributes of the purchased assets. As of June 30, 2016 and December 31, 2015, the weighted average interest rate on advances was 3.0% and 2.4%, respectively. The Company incurred $1.7 million and $1.4 million of interest expense on the Barclays Repo Facility for the six months ended June 30, 2016 and 2015, respectively.
The JPM Repo Facility and the Barclays Repo Facility generally provide that in the event of a decrease in the value of the Company's collateral, the lenders can demand additional collateral. Should the value of the Company’s collateral decrease, whether as a result of deteriorating credit quality, an increase in credit market spreads or otherwise, resulting margin calls may cause an adverse change in the Company’s liquidity position.
11
REALTY FINANCE TRUST, INC.
NOTES TO CONSOLIDATED FINANCIAL STATEMENTS
June 30, 2016
(Unaudited)
Repurchase Agreements - Real Estate Securities
The Company has entered into various Master Repurchase Agreements (the "MRAs") that allow the Company to sell real estate securities while providing a fixed repurchase price for the same real estate securities in the future. The repurchase contracts on each security under an MRA generally mature in 30 to 90 days and terms are adjusted for current market rates as necessary. Below is a summary of the Company's MRAs as of June 30, 2016 and December 31, 2015 (in thousands):
Weighted Average | |||||||||||||||||
Counterparty | Amount Outstanding | Accrued Interest | Collateral Pledged (*) | Interest Rate | Days to Maturity | ||||||||||||
As of June 30, 2016 | |||||||||||||||||
J.P. Morgan Securities LLC | $ | 89,882 | $ | 40 | $ | 139,130 | 2.27 | % | 22 | ||||||||
Citigroup Global Markets, Inc. | 26,023 | 82 | 35,184 | 2.33 | % | 43 | |||||||||||
Wells Fargo Securities, LLC | 3,375 | 3 | 4,450 | 1.80 | % | 13 | |||||||||||
Total/Weighted Average | $ | 119,280 | $ | 125 | $ | 178,764 | 2.27 | % | 26 | ||||||||
As of December 31, 2015 | |||||||||||||||||
J.P. Morgan Securities LLC | $ | 86,898 | $ | 108 | $ | 130,618 | 2.03 | % | 8 | ||||||||
Citigroup Global Markets, Inc. | 26,619 | 71 | 35,528 | 2.00 | % | 45 | |||||||||||
Wells Fargo Securities, LLC | 3,694 | 3 | 4,925 | 1.67 | % | 13 | |||||||||||
Total/Weighted Average | $ | 117,211 | $ | 182 | $ | 171,071 | 2.01 | % | 17 | ||||||||
* Includes $54,082 and $56,044 Tranche C of RFT issued CLO held by the Company, which eliminates within the Real estate securities, at fair value line of the consolidated balance sheets as of June 30, 2016 and December 31, 2015, respectively.
Collateralized Loan Obligation
On October 19, 2015, RFT 2015-FL1 Issuer, Ltd. (the “Issuer”) and RFT 2015-FL1 Co-Issuer, LLC (the “Co-Issuer”), both wholly owned indirect subsidiaries of the Company, entered into an indenture with the RFT OP, as advancing agent, U.S. Bank National Association as note administrator and U.S. Bank National Association as trustee, which governs the issuance of approximately $350.2 million principal balance secured floating rate notes (the “Notes”). In addition, concurrently with the issuance of the Notes, the Issuer also issued 78,188,494 Preferred Shares, par value of $0.001 per share and with an aggregate liquidation preference and notional amount equal to $1,000 per share (the “Preferred Shares”), which were not offered as part of closing the indenture. For U.S. federal income tax purposes, the Issuer and Co-Issuer are disregarded entities.
The Notes are collateralized by interests in a pool of 28 mortgage assets having a total principal balance of $428.4 million (the “Mortgage Assets”) originated by a subsidiary of the Company. The sale of the Mortgage Assets to the Issuer is governed by a Mortgage Asset Purchase Agreement dated as of October 19, 2015, between the Company and the Issuer. In connection with the securitization, the Issuer and Co-Issuer offered and sold the following classes of Notes to third parties: Class A, Class B, Class C. A wholly owned subsidiary of the Company retained approximately $56.0 million of the total $76.0 million of Class C and all of the preferred equity in the Issuer. The retained Class C and its related interest income and the preferred equity are eliminated in the Company's consolidated financial statements. The Company, as the holder of preferred equity in the Issuer, will absorb the first losses of the CLO, which may have a negative impact to the Company's result of operations. The issuance of the CLO also results in an increase in interest expense within the consolidated statement of operations due to increased interest expense. The following table represents the terms of the CLO issued.
12
REALTY FINANCE TRUST, INC.
NOTES TO CONSOLIDATED FINANCIAL STATEMENTS
June 30, 2016
(Unaudited)
Facility ($000s) | Par Value Issued | Par Value Outstanding (*) | Interest Rate | Maturity Date | ||||||||
As of June 30, 2016 | ||||||||||||
Tranche A | $ | 231,345 | $ | 231,345 | 1M LIBOR + 175 | 8/1/2030 | ||||||
Tranche B | 42,841 | 42,841 | 1M LIBOR + 388 | 8/1/2030 | ||||||||
Tranche C | 76,044 | 20,000 | 1M LIBOR + 525 | 8/1/2030 | ||||||||
$ | 350,230 | $ | 294,186 | |||||||||
As of December 31, 2015 | ||||||||||||
Tranche A | $ | 231,345 | $ | 231,345 | 1M LIBOR + 175 | 8/1/2030 | ||||||
Tranche B | 42,841 | 42,841 | 1M LIBOR + 388 | 8/1/2030 | ||||||||
Tranche C | 76,044 | 20,000 | 1M LIBOR + 525 | 8/1/2030 | ||||||||
$ | 350,230 | $ | 294,186 | |||||||||
________________________
* Excludes $54,082 and $56,044 of Tranche C of RFT issued CLO held by the Company, which eliminates within the Real estate securities, at fair value line of the consolidated balance sheets as of June 30, 2016 and December 31, 2015, respectively.
The below represents the total assets and liabilities of the Company's only CLO. The CLO is considered a VIE and is consolidated into the Company's consolidated financial statements as of June 30, 2016 and December 31, 2015 as the Company is the primary beneficiary of the VIE. The Company is the primary beneficiary of the CLO because (i) the Company has the power to direct the activities that most significantly affect the VIE’s economic performance and (ii) the right to receive benefits from the VIE or the obligation to absorb losses of the VIE that could be significant to the VIE.
Assets ($000s) | June 30, 2016 | December 31, 2015 | ||||||
Cash | $ | 5 | $ | 5 | ||||
Commercial mortgage loans, held for investment, net of allowance of $713 and $422 (1) | 425,992 | 425,733 | ||||||
Accrued interest receivable | 1,010 | 1,048 | ||||||
Total Assets | $ | 427,007 | $ | 426,786 | ||||
Liabilities | ||||||||
Notes payable (2)(3) | $ | 343,195 | $ | 342,998 | ||||
Accrued interest payable | 500 | 513 | ||||||
Total Liabilities | $ | 343,695 | $ | 343,511 | ||||
________________________
(1) The balance is presented net of allowance for loan loss of $713 and $422 as of June 30, 2016 and December 31, 2015, respectively. The commercial mortgage loans balance as of December 31, 2015 of $426,155 as disclosed in Note 5 to the consolidated financial statements included in the 2015 Form 10-K was not net of allowance for loan loss of $422.
(2) Includes $55,783 and $55,769 of Tranche C of RFT issued CLO held by the Company, which eliminates within the Collateral loan obligations line of the consolidated balance sheets as of June 30, 2016 and December 31, 2015, respectively.
(3) The balance is presented net of deferred financing cost and discount of $7,035 and $7,232 as of June 30, 2016 and December 31, 2015, respectively. The notes payable balance as of December 31, 2015 of $348,269 as disclosed in Note 5 to the consolidated financial statements included in the 2015 Form 10-K was not net of deferred financing cost of $5,271.
13
REALTY FINANCE TRUST, INC.
NOTES TO CONSOLIDATED FINANCIAL STATEMENTS
June 30, 2016
(Unaudited)
Note 6 - Net Income Per Share
The following table is a summary of the basic and diluted net income per share computation for the three and six months ended June 30, 2016 and 2015, respectively:
Three Months Ended June 30, | Six Months Ended June 30, | ||||||||||||||
2016 | 2015 | 2016 | 2015 | ||||||||||||
Net income (in thousands) | $ | 8,860 | $ | 4,303 | $ | 18,280 | $ | 8,935 | |||||||
Basic weighted average shares outstanding | 31,802,261 | 22,036,590 | 31,676,513 | 19,671,251 | |||||||||||
Unvested restricted shares | 5,666 | 4,067 | 5,889 | 4,289 | |||||||||||
Diluted weighted average shares outstanding | 31,807,927 | 22,040,657 | 31,682,402 | 19,675,540 | |||||||||||
Basic net income per share | $ | 0.28 | $ | 0.20 | $ | 0.58 | $ | 0.45 | |||||||
Diluted net income per share | $ | 0.28 | $ | 0.20 | $ | 0.58 | $ | 0.45 | |||||||
Note 7 - Common Stock
As of June 30, 2016 and December 31, 2015, the Company had 31,361,543 and 31,385,280 shares of common stock outstanding, respectively, including shares issued pursuant to the DRIP and unvested restricted shares. As of June 30, 2016 and December 31, 2015, the Company had received total proceeds of $755.5 million and $755.5 million, respectively, excluding shares issued pursuant to the DRIP and share-based compensation.
On December 30, 2014, the Company filed with the Maryland State Department of Assessments and Taxation articles supplementary to its charter that reclassified 1,000 authorized but unissued shares of the Company’s common stock as shares of convertible stock and set the terms of such convertible shares. The Company then issued 1,000 convertible shares to the Advisor for $1.00 per share. The convertible shares will automatically convert to shares of common stock upon the first occurrence of any of following triggering events (the "Triggering Event"): (i) the Company has paid total distributions on the then-outstanding shares of common stock in an amount equal to or in excess of the sum of the invested capital (as defined in the Company’s charter) plus an aggregate 6.0% cumulative, pre-tax, non-compounded, annual return on such invested capital, (ii) a listing of the Company’s shares of common stock on a national securities exchange or (iii) the termination of the Company’s advisory agreement under certain circumstances. In general, but with certain exceptions as outlined in the articles supplementary, each convertible share will convert into a number of common shares equal to 1/1000 of the quotient of (a) the conversion product (the product of 0.15 times the amount, if any, by which (i) the sum of the enterprise value as of the date of the Triggering Event plus total distributions paid to the Company’s stockholders through the date of the Triggering Event exceeds (ii) the sum of the Company's stockholders’ invested capital plus a 6.0% return as of the date of the Triggering Event) divided by (b) the quotient of the enterprise value divided by the number of shares of the Company’s common stock outstanding (on an as-converted basis) on the date of the Triggering Event. The conversion product will be reduced by the amounts payable pursuant to the annual subordinated performance fee as realized appreciation in the Company’s assets during the time that the Advisor or one of its affiliates acts as the Company’s advisor. As of June 30, 2016, the Triggering Event had not occurred.
Distributions
In order to maintain its election to qualify as a REIT, the Company must currently distribute, at a minimum, an amount equal to 90% of its taxable income, without regard to the deduction for distributions paid and excluding net capital gains. The Company must distribute 100% of its taxable income (including net capital gains) to avoid paying corporate federal income taxes.
In May 2013, the Company's board of directors authorized, and the Company declared, a distribution payable on a monthly basis to stockholders of record on each day at a rate equal to $0.00565068493 per day, which is equivalent to $2.0625 per annum, per share of common stock. In March 2016, the Company's board of directors ratified the existing distribution amount a change to the daily distribution amount equivalent to $2.0625 per annum and for calendar year 2016, affirmed a change to the daily distribution amount to $0.0056352459 per day per share of common stock, effective January 1, 2016, to accurately reflect that 2016 is a leap year. The Company's distributions are payable by the fifth day following each month end to stockholders of record at the close of business each day during the prior month. Distribution payments are dependent on the availability of funds. The Board may reduce the amount of distributions paid or suspend distribution payments at any time, and therefore, distributions payments are not assured. The Company distributed $32.6 million during the six months ended June 30, 2016,
14
REALTY FINANCE TRUST, INC.
NOTES TO CONSOLIDATED FINANCIAL STATEMENTS
June 30, 2016
(Unaudited)
comprised of $19.7 million in cash and $13.0 million in shares of common stock issued under the DRIP. The Company distributed $47.1 million during the year ended December 31, 2015, comprised of $26.9 million in cash and $20.2 million in shares of common stock issued under the DRIP.
Share Repurchase Program
The Company did not sell any equity securities that were not registered under the Securities Act during the six months ended June 30, 2016.
The Company's Board unanimously approved an amended and restated share repurchase program (the “SRP”), which became effective on February 28, 2016. The SRP enables stockholders to sell their shares to the Company. Subject to certain conditions, stockholders that purchased shares of the Company's common stock or received their shares from us (directly or indirectly) through one or more non-cash transactions and have held their shares for a period of at least one year may request that the Company repurchase their shares of common stock so long as the repurchase otherwise complies with the provisions of Maryland law. Repurchase requests made following the death or qualifying disability of a stockholder will not be subject to any minimum holding period.
The repurchase price per share for requests other than for death or disability will be equal to the most-recent estimated net asset value per share of the Company's common stock calculated by the Company's Advisor and approved by the Company's board of directors in accordance with the Company's valuation guidelines, or estimated per-share NAV, multiplied by a percentage equal to (i) 92.5%, if the person seeking repurchase has held his or her shares for a period greater than one year and less than two years; (ii) 95%, if the person seeking repurchase has held his or her shares for a period greater than two years and less than three years; (iii) 97.5%, if the person seeking repurchase has held his or her shares for a period greater than three years and less than four years; or (iv) 100%, if the person seeking repurchase has held his or her shares for a period greater than four years. In the case of requests for death or disability, the repurchase price per share will be equal to the estimated per-share NAV at the time of repurchase.
Repurchases pursuant to the SRP, when requested, generally will be made semiannually (each six-month period ending June 30 or December 31, a “fiscal semester”). Repurchases for any fiscal semester will be limited to a maximum of 2.5% of the weighted average number of shares of common stock outstanding during the previous fiscal year, with a maximum for any fiscal year of 5.0% of the weighted average number of shares of common stock outstanding during the previous fiscal year. Funding for repurchases pursuant to the SRP for any given fiscal semester will be limited to proceeds received during that same fiscal semester through the issuance of common stock pursuant to any DRIP in effect from time to time, provided that the Board has the power, in its sole discretion, to determine the amount of shares repurchased during any fiscal semester as well as the amount of funds to be used for that purpose. Any repurchase requests received during such fiscal semester will be paid at a price based on the Company's estimated per share NAV applicable on the last day of such fiscal semester, as described above. Due to these limitations, the Company cannot guarantee that the Company will be able to accommodate all repurchase requests made during any fiscal semester or fiscal year. However, a stockholder may withdraw its request at any time or ask that the Company honors the request when funds are available. Pending repurchase requests will be honored on a pro rata basis. The Company will generally pay repurchase proceeds, less any applicable tax or other withholding required by law, by the 31st day following the end of the fiscal semester during which the repurchase request was made.
Calculations of the Company's estimated per-share NAV will occur periodically, at the discretion of the Board, provided that such calculations will be made at least annually. Following its calculation, the Company's estimated per-share NAV will be disclosed in a periodic report. The most recent calculation of the Company's estimated per-share NAV approved by the Board occurred on November 4, 2015 based on the Company's net asset value as of September 30, 2015 and was equal to $25.27.
When a stockholder requests redemption and the redemption is approved, the Company will reclassify such obligation from equity to a liability based on the settlement value of the obligation. Shares repurchased under the SRP will have the status of authorized but unissued shares.
The following table reflects the number of shares repurchased under the SRP cumulatively through June 30, 2016:
15
REALTY FINANCE TRUST, INC.
NOTES TO CONSOLIDATED FINANCIAL STATEMENTS
June 30, 2016
(Unaudited)
Number of Requests | Number of Shares Repurchased(1) | Average Price per Share | ||||||||
Cumulative as of December 31, 2015 | 301 | 381,474 | $ | 23.72 | ||||||
January 1 - March 31, 2016 | — | — | — | |||||||
April 1 - June 30, 2016 | 668 | 536,240 | 24.08 | |||||||
Cumulative as of June 30, 2016 | 969 | 917,714 | $ | 23.93 | ||||||
________________________
1 As permitted under the SRP, in July 2016, our board of directors authorized, with respect to redemption requests received during the semi-annual period from January 1, 2016 to June 30, 2016, the repurchase of shares validly submitted for repurchase in an amount limited to the proceeds reinvested through our DRIP. As a result, redemption requests in the amount of 208,470 shares were not fulfilled.
Note 8 - Commitments and Contingencies
Unfunded Commitments Under Commercial Mortgage Loans
As of June 30, 2016 and December 31, 2015, the Company had the below unfunded commitments to the Company's borrowers.
Funding Expiration | June 30, 2016 | December 31, 2015 | ||||||
2016 | $ | 238 | $ | 890 | ||||
2017 | 11,949 | 16,072 | ||||||
2018 | 89,229 | 104,428 | ||||||
2019 | 11,719 | 16,939 | ||||||
2020 | — | — | ||||||
2021 | — | — | ||||||
Total | $ | 113,135 | $ | 138,329 | ||||
Litigation and Regulatory Matters
In the ordinary course of business, the Company may become subject to litigation, claims and regulatory matters. The Company has no knowledge of material legal or regulatory proceedings pending or known to be contemplated against the Company at this time.
Note 9 - Related Party Transactions and Arrangements
As of June 30, 2016 and December 31, 2015, entities wholly-owned by the Sponsor owned 52,771 and 8,888 shares of the Company’s outstanding common stock, respectively.
Realty Capital Securities, LLC (the "Former Dealer Manager") served as the dealer manager of the Company's Offering through December 31, 2015. American National Stock Transfer, LLC, a subsidiary of the parent company of the Former Dealer Manager ("ANST"), provided the Company with transfer agency services through February 2016. RCS Capital Corporation, the parent company of the Company's Former Dealer Manager and certain of its affiliates that provided the Company with services, filed for Chapter 11 bankruptcy protection in January 2016, prior to which it was also under common control with AR Global, the parent of the Company's Sponsor. In May 2016, RCAP and its affiliated debtors emerged from bankruptcy under the new name, Aretec Group, Inc.
Fees Paid in Connection with the Offering
The Former Dealer Manager received fees and compensation in connection with the sale of the Company’s common stock in the Offering. The Former Dealer Manager received a selling commission of up to 7% of the per share purchase price of the Company's offering proceeds before reallowance of commissions earned by soliciting dealers. In addition, the Former Dealer Manager received up to 3% of the gross proceeds from the sale of shares, before reallowance to soliciting dealers, as a dealer manager fee. The Former Dealer Manager was permitted to reallow its dealer manager fee to such soliciting dealers. A
16
REALTY FINANCE TRUST, INC.
NOTES TO CONSOLIDATED FINANCIAL STATEMENTS
June 30, 2016
(Unaudited)
soliciting dealer was permitted to elect to receive a fee equal to 7.5% of the gross proceeds from the sale of shares (not including selling commissions and dealer manager fees) by such soliciting dealer, with 2.5% thereof paid at the time of such sale and 1% thereof paid on each anniversary of the closing of such sale up to and including the fifth anniversary of the closing of such sale. If this option was elected, the dealer manager fee was reduced to 2.5% of gross proceeds (not including selling commissions and Former Dealer Manager fees).
The predecessor to AR Global is a party to a services agreement with RCS Advisory Services, LLC, ("RCS Advisory") a subsidiary of the parent company of the Former Dealer Manager, pursuant to which RCS Advisory and its affiliates provided the Company and certain other companies sponsored by AR Global with services (including, without limitation, transaction management, compliance, due diligence, event coordination and marketing services, among others) on a time and expenses incurred basis or at a flat rate based on services performed. The predecessor to AR Global instructed RCS Advisory to stop providing such services in November 2015 and no services have since been provided by RCS Advisory.
The Company was also party to a transfer agency agreement with American National Stock Transfer, LLC, a subsidiary of the parent company of the Former Dealer Manager (“ANST”), pursuant to which ANST provided the Company with transfer agency services (including broker and stockholder servicing, transaction processing, year-end IRS reporting and other services), and supervisory services overseeing the transfer agency services performed by a third-party transfer agent. AR Global received written notice from ANST on February 10, 2016 that it would wind down operations by the end of the month and would withdraw as the transfer agent effective February 29, 2016. Subsequently, effective February 26, 2016, the Company entered into a definitive agreement with DST Systems, Inc., a third-party and its previous provider of sub-transfer agency services, to provide the Company directly with transfer agency services (including broker and stockholder servicing, transaction processing, year-end IRS reporting and other services).
The table below shows the compensation and reimbursement to the Advisor, its affiliates, entities under common control with the Advisor and the Former Dealer Manager incurred for services relating to the Offering during the three and six months ended months ended June 30, 2016 and 2015, respectively, and the associated payable as of June 30, 2016 and December 31, 2015, respectively (in thousands):
Three Months Ended June 30, | Six Months Ended June 30, | Payable as of | ||||||||||||||||||||||
2016 | 2015 | 2016 | 2015 | June 30, 2016 | December 31, 2015 | |||||||||||||||||||
Total commissions and fees incurred from the Former Dealer Manager | $ | — | $ | 11,521 | $ | — | $ | 20,768 | $ | — | $ | — | ||||||||||||
Total compensation and reimbursement for services provided by the Advisor, its affiliates, entities under common control with the Advisor and the Former Dealer Manager | $ | — | $ | 1,886 | $ | — | $ | 3,848 | $ | 480 | $ | 480 | ||||||||||||
The payables as of June 30, 2016 and December 31, 2015 in the table above are included in "Due to affiliates" on the Company's consolidated balance sheets. The fees incurred are recorded within additional paid in capital line in the consolidated balance sheets.
The Company is responsible for organizational and offering costs from the Offering, excluding commissions and Former Dealer Manager fees, up to a maximum of 2.0% of gross proceeds from its Offering of common stock, measured at the end of the Offering. Organizational and offering costs in excess of the 2.0% cap as of the end of the Offering are the Advisor's responsibility. As of June 30, 2016 and December 31, 2015, organizational and offering costs exceeded 2.0% of cap of gross proceeds received from the Offering by $0.8 million and $0.8 million, respectively which has been recorded in Additional Paid-In Capital of the Company's financial statements as the Advisor has not reimbursed the Company for these costs.
Fees Paid in Connection with the Operations of the Company
The Advisor receives an acquisition fee of 1.0% of the principal amount funded by the Company to originate or acquire commercial mortgage loans and 1.0% of the anticipated net equity funded by the Company to acquire real estate securities. The Company reimburses the Advisor for expenses incurred by the Advisor on behalf of the Company related to selecting,
17
REALTY FINANCE TRUST, INC.
NOTES TO CONSOLIDATED FINANCIAL STATEMENTS
June 30, 2016
(Unaudited)
evaluating, originating and acquiring investments in an amount up to 0.5% of the principal amount funded by the Company to originate or acquire commercial mortgage loans and up to 0.5% of the anticipated net equity funded by the Company to acquire real estate securities investments. In no event will the total of all acquisition fees and acquisition expenses exceed 4.5% of the principal amount funded with respect to the Company's total portfolio including subsequent fundings to investments in the Company's portfolio. During the three and six months ended June 30, 2016, acquisition fees of $0.2 million and $0.4 million and for three and six months ended June 30, 2015 $3.1 million and $4.2 million, respectively, have been recognized in Acquisition fees within the consolidated statement of operations. In addition, for the three and six months ended 2015 the Company capitalized $1.0 million and $1.7 million, of acquisition expenses in Commercial mortgage loans line within the Company's consolidated balance sheets, which will be amortized over the life of each investment using the effective interest method. The Company did not capitalize any acquisitions expenses for the three and six months ended June 30, 2016.
The Company pays the Advisor, or its affiliates, a monthly asset management fee equal to one-twelfth of 0.75% of the cost of the Company's assets. Commencing November 10, 2015 (the "NAV pricing date"), the asset management fee is based on the lower of the cost of the Company's assets and the fair value of the Company's assets (fair value will consist of the market value of each portfolio investment as determined by the Advisor in accordance with the Company's valuation guidelines). During the three and six months ended June 30, 2016 , the Company incurred $2.4 million and $4.7 million, in asset management fees, respectively. During the three and six months ended 2015, the Company incurred $0.5 million and $0.5 million in asset management fees, respectively. These asset management fees are recorded in Asset management and subordinated performance fee within the statement of operations. Prior to June 17, 2015, the amount of the asset management fee was reduced to the extent that funds from operations as defined by the National Association of Real Estate Investment Trusts ("FFO"), as adjusted, during the six month period ending on the last day of the calendar quarter immediately preceding the date such asset management fee was payable, was less than distributions declared during the same period. For purposes of this determination, FFO, as adjusted, is FFO adjusted to (i) include acquisition fees and acquisition expenses; (ii) include non-cash restricted stock grant amortization, if any; and (iii) impairments and loan loss reserves on investments, if any (including commercial mortgage loans and other debt investments). FFO, as adjusted, is not the same as FFO.
The Company will pay the Advisor, an annual subordinated performance fee calculated on the basis of total return to stockholders, payable monthly in arrears, such that for any year in which total return on stockholders’ capital exceeds 6.0% per annum, the Advisor will be entitled to 15.0% of the excess total return; provided that in no event will the annual subordinated performance fee payable to the Advisor exceed 10.0% of the aggregate total return for such year. This fee will be payable only upon the sale of assets, distributions or other events which result in the Company's return on stockholders’ capital exceeding 6.0% per annum. During the three and six months ended June 30, 2016, the Company incurred an annual subordinated performance fee of $0.6 million and $1.3 million, respectively. During the three and six months ended 2015, the Company incurred an annual subordinated performance fee of $0.4 million and $0.8 million, respectively. These subordinated performance fees are recorded in Asset management and subordinated performance fee within the statement of operations.
Effective June 1, 2013, the Company entered into an agreement with the Former Dealer Manager to provide strategic advisory services and investment banking services required in the ordinary course of the Company's business, such as performing financial analysis, evaluating publicly traded comparable companies and assisting in developing a portfolio composition strategy, a capitalization structure to optimize future liquidity options and structuring operations. The Company prepaid the cost of an one-time $0.9 million associated with this agreement and amortizes the cost over the estimated life of the Offering into Other expenses on the Company's consolidated statements of operations. For period ending December 31, 2015, the Company had approximately $6,000 of unamortized cost. There was no remaining unamortized cost as of June 30, 2016 and these services are no longer being provided.
The Company will reimburse the Advisor for expenses incurred related to administrative services such as accounting, legal and other services in accordance with the advisory agreement. For the three and six months ended June 30, 2016, the Company incurred and reimbursed $0.5 million and $1.4 million to the Advisor. The Company did not reimburse the Advisor any administrative fees for the three and six months ended June 30, 2015.
18
REALTY FINANCE TRUST, INC.
NOTES TO CONSOLIDATED FINANCIAL STATEMENTS
June 30, 2016
(Unaudited)
The table below depicts related party fees and reimbursements in connection with the operations of the Company for the three and six months ended June 30, 2016 and 2015 and the associated payable as of June 30, 2016 and December 31, 2015 (in thousands):
Three Months Ended June 30, | Six Months Ended June 30, | Payable as of | |||||||||||||||||||||||
2016 | 2015 | 2016 | 2015 | June 30, 2016 | December 31, 2015 | ||||||||||||||||||||
Acquisition fees and expenses (1) | $ | 223 | $ | 4,423 | $ | 380 | $ | 6,204 | $ | — | $ | 55 | |||||||||||||
Administrative services expenses (2) | 539 | — | — | 1,355 | — | (42 | ) | — | |||||||||||||||||
Advisory and investment banking fee | — | 14 | 6 | 28 | — | — | |||||||||||||||||||
Asset management and subordinated performance fee | 3,015 | 974 | 6,025 | 1,336 | 3,576 | 3,792 | |||||||||||||||||||
Other related party expenses | 24 | — | 50 | — | 35 | — | |||||||||||||||||||
Total related party fees and reimbursements | $ | 3,801 | $ | 5,411 | $ | 7,816 | $ | 7,568 | $ | 3,569 | $ | 3,847 | |||||||||||||
________________________
1 Includes amortization of capitalized acquisition fees and expenses.
2 The ($42) represents a refund owed to the Company by the Advisor due to overpayment of administrative services expense.
The payables as of June 30, 2016 and December 31, 2015 in the table above are included in "Due to affiliates" on the Company's consolidated balance sheets.
In order to improve operating cash flows and the ability to pay distributions from operating cash flows, the Advisor may elect to waive certain fees. Because the Advisor may waive certain fees, cash flows from operations that would have been paid to the Advisor may be available to pay distributions to stockholders. The fees that may be forgiven are not deferrals and accordingly, will not be paid to the Advisor. The Advisor has also permanently waived a portion of the acquisition fees and expenses earned on the acquisition of the Company's CMBS in the amount of $0.4 million and $0.5 million for the three and six months ended June 30, 2015, respectively. The Company did not purchase any CMBS positions during the three and six months ended June 30, 2016 as such did not incur any acquisition fees and expenses for CMBS purchases.
Subject to the limitations outlined below, the Company will reimburse the Advisor's cost of providing administrative services and personnel costs in connection with other services during the operational stage, in addition to paying an asset management fee; however, the Company will not reimburse the Advisor for personnel costs in connection with services for which the Advisor receives acquisition fees or disposition fees. For the three and six months ended June 30, 2016, the Company incurred $0.5 million and $1.4 million of administrative costs in connection with the operations of the Company, which is included in "Administrative services expenses" in the consolidated statements of operations . The Company did not incur such expenses for the six months ended June 30, 2015.
The Advisor must pay any expenses in which the Company's operating expenses as defined by North American Securities Administrators Association at the end of the four preceding fiscal quarters exceeds the greater of (i) 2.0% of average invested assets or (ii) 25.0% of net income for such expense year. For the preceding four fiscal quarters, the Company did not exceed the greater of the two aforementioned criteria as of June 30, 2016.
Fees Paid in Connection with the Liquidation of Assets, or Listing of the Company's Common Stock or Termination of the Advisory Agreement
The Company will pay a disposition fee of 1.0% of the contract sales price of each commercial mortgage loan or other investment sold, including CMBS or CDOs issued by a subsidiary of the Company as part of a securitization transaction. The Company will not be obligated to pay a disposition fee upon the maturity, prepayment, workout, modification or extension of commercial real estate debt unless there is a corresponding fee paid by the borrower, in which case the disposition fee will be the lesser of (i) 1.0% of the principal amount of the debt prior to such transaction; or (ii) the amount of the fee paid by the borrower in connection with such transaction. If the Company takes ownership of a property as a result of a workout or foreclosure of a loan, it will pay a disposition fee upon the sale of such property.
19
REALTY FINANCE TRUST, INC.
NOTES TO CONSOLIDATED FINANCIAL STATEMENTS
June 30, 2016
(Unaudited)
On December 30, 2014, the Company issued 1,000 convertible shares to the Advisor for $1.00 per share. The convertible shares issued to the Advisor will automatically convert to shares of the Company’s common stock upon the first to occur of any of the Triggering Events described in Note 7.
During the three and six months ended June 30, 2016 and 2015, no fees were paid in connection with the liquidation of assets, listing of the Company's common stock or termination of the advisory agreement.
The Company has also established a restricted share plan for the benefit of employees, directors, employees of the Advisor and its affiliates.
Note 10 - Fair Value of Financial Instruments
GAAP establishes a hierarchy of valuation techniques based on the observability of inputs used in measuring financial instruments at fair values. GAAP establishes market-based or observable inputs as the preferred source of values, followed by valuation models using management assumptions in the absence of market inputs. The three levels of the hierarchy are described below:
• | Level I - Inputs are unadjusted, quoted prices in active markets for identical assets or liabilities at the measurement date. |
• | Level II - Inputs (other than quoted prices included in Level I) are either directly or indirectly observable for the asset or liability through correlation with market data at the measurement date and for the duration of the instrument’s anticipated life. |
• | Level III - Inputs reflect management’s best estimate of what market participants would use in pricing the asset or liability at the measurement date. Consideration is given to the risk inherent in the valuation technique and the risk inherent in the inputs to the model. |
The determination of where an asset or liability falls in the above hierarchy requires significant judgment and factors specific to the asset or liability. In instances where the determination of the fair value measurement is based on inputs from different levels of the fair value hierarchy, the level in the fair value hierarchy within which the entire fair value measurement falls is based on the lowest level input that is significant to the fair value measurement in its entirety. The Company evaluates its hierarchy disclosures each quarter and depending on various factors, it is possible that an asset or liability may be classified differently from quarter to quarter.
The Company has implemented valuation control processes to validate the fair value of the Company's financial instruments measured at fair value including those derived from pricing models. These control processes are designed to assure that the values used for financial reporting are based on observable inputs wherever possible. In the event that observable inputs are not available, the control processes are designed to assure that the valuation approach utilized is appropriate and consistently applied and the assumptions are reasonable.
CMBS are valued utilizing both observable and unobservable market inputs. These factors include projected future cash flows, ratings, subordination levels, vintage, remaining lives, credit issues, recent trades of similar real estate securities and the spreads used in the prior valuation. The Company obtains current market spread information where available and uses this information in evaluating and validating the market price of all real CMBS. Depending upon the significance of the fair value inputs used in determining these fair values, these real estate securities are classified in either Level II or Level III of the fair value hierarchy. As of June 30, 2016 and December 31, 2015, the Company received broker quotes on each CMBS investment used in determining the fair value and have been classified as Level II due to the observable nature of many of the market inputs.
20
REALTY FINANCE TRUST, INC.
NOTES TO CONSOLIDATED FINANCIAL STATEMENTS
June 30, 2016
(Unaudited)
The following table presents the Company's financial instrument carried at fair value on a recurring basis in the consolidated balance sheet by its level in the fair value hierarchy as of June 30, 2016 and December 31, 2015 (in thousands):
Total | Level I | Level II | Level III | ||||||||||||
June 30, 2016 | |||||||||||||||
Real estate securities | $ | 125,987 | $ | — | $ | 125,987 | $ | — | |||||||
December 31, 2015 | |||||||||||||||
Real estate securities | 130,754 | — | 130,754 | — | |||||||||||
A review of the fair value hierarchy classification is conducted on a quarterly basis. Changes in the type of inputs may result in a reclassification for certain assets. The Company's policy with respect to transfers between levels of the fair value hierarchy is to recognize transfers into and out of each level as of the beginning of the reporting period. There were no transfers between levels within fair value hierarchy during the three and six months ended June 30, 2016 and 2015. There are no financial instruments carried at fair value on a non-recurring basis as of June 30, 2016 and December 31, 2015.
The fair value of cash and cash equivalents and restricted cash are measured using observable quoted market prices, or Level I inputs and their carrying value approximates their fair value. The fair value of borrowings under repurchase agreements approximate their carrying value on the consolidated balance sheets due to their short-term nature, and are measured using Level II inputs.
The fair values of the Company's commercial mortgage loans and collateralized loan obligations, which are not reported at fair value on the consolidated balance sheets are reported below as of June 30, 2016 and December 31, 2015 (in thousands):
Level | Carrying Amount | Fair Value | |||||||||
June 30, 2016 | |||||||||||
Commercial mortgage loans | Asset | III | $ | 1,128,717 | $ | 1,141,859 | |||||
Collateralized loan obligation | Liability | II | 287,412 | 289,480 | |||||||
December 31, 2015 | |||||||||||
Commercial mortgage loans | Asset | III | 1,125,089 | 1,138,841 | |||||||
Collateralized loan obligation | Liability | II | 287,229 | 289,733 | |||||||
The fair value of the commercial mortgage loans is estimated using a discounted cash flow analysis, based on the Advisor's experience with similar types of investments. The Company received broker quotes for each tranche of CLO to determine the fair value of the debt.
Note 11 - Offsetting Assets and Liabilities
The Company's consolidated balance sheets used a gross presentation of repurchase agreements and collateral pledged. The table below provides a gross presentation, the effects of offsetting and a net presentation of the Company's repurchase agreements within the scope of ASC 210-20, Balance Sheet—Offsetting, as of June 30, 2016 and December 31, 2015, respectively (in thousands):
Gross Amounts Not Offset on the Balance Sheet | ||||||||||||||||||||||||
Repurchase Agreements | Gross Amounts of Recognized Liabilities | Gross Amounts Offset on the Balance Sheet | Net Amount of Liabilities Presented on the Balance Sheet | Financial Instruments as Collateral Pledged | Cash Collateral Pledged | Net Amount | ||||||||||||||||||
June 30, 2016 | ||||||||||||||||||||||||
Commercial mortgage loans | $ | 262,056 | $ | — | $ | 262,056 | $ | 408,858 | $ | 5,000 | $ | — | ||||||||||||
Real estate securities (*) | 119,280 | — | 119,280 | 178,764 | 1,498 | — | ||||||||||||||||||
December 31, 2015 | ||||||||||||||||||||||||
Commercial mortgage loans | 206,239 | — | 206,239 | 355,802 | 5,000 | — | ||||||||||||||||||
Real estate securities (*) | 117,211 | — | 117,211 | 171,071 | 366 | — | ||||||||||||||||||
21
REALTY FINANCE TRUST, INC.
NOTES TO CONSOLIDATED FINANCIAL STATEMENTS
June 30, 2016
(Unaudited)
* Includes $56,044 and $56,044 Tranche C of RFT issued CLO held by the Company, which eliminates within the Repurchase agreement-real estate securities line of the consolidated balance sheets as of June 30, 2016 and December 31, 2015, respectively.
Note 12 - Segment Reporting
The Company conducts its business through the following segments:
• | The real estate debt business focuses on originating, acquiring and asset managing commercial real estate debt investments, including first mortgage loans, subordinate mortgages, mezzanine loans and participations in such loans. |
• | The real estate securities business focuses on investing in and asset managing commercial real estate securities primarily consisting of CMBS and may include unsecured REIT debt, CDO notes and other securities. |
The following table represents the Company's operations by segment for the three months ended June 30, 2016 and 2015 (in thousands):
Three Months Ended June 30, 2016 | Total | Real Estate Debt | Real Estate Securities | |||||||||
Interest income | $ | 20,222 | $ | 18,615 | $ | 1,607 | ||||||
Interest expense | 5,393 | 4,710 | 683 | |||||||||
Net income | 8,860 | 8,451 | 409 | |||||||||
Three Months Ended June 30, 2015 | ||||||||||||
Interest income | 12,484 | 11,822 | 662 | |||||||||
Interest expense | 2,523 | 2,344 | 179 | |||||||||
Net income | 4,303 | 4,202 | 101 | |||||||||
The following table represents the Company's operations by segment for the six months ended June 30, 2016 and 2015 (in thousands):
Six Months Ended June 30, 2016 | Total | Real Estate Debt | Real Estate Securities | |||||||||
Interest income | $ | 40,513 | $ | 37,291 | $ | 3,222 | ||||||
Interest expense | 10,161 | 8,801 | 1,360 | |||||||||
Net income | 18,280 | 17,510 | 770 | |||||||||
Six Months Ended June 30, 2015 | ||||||||||||
Interest income | 22,089 | 21,018 | 1,071 | |||||||||
Interest expense | 4,456 | 4,148 | 308 | |||||||||
Net income | 8,935 | 8,748 | 187 | |||||||||
The following table represents the Company's total assets by segment as of June 30, 2016 and December 31, 2015 (in thousands):
22
REALTY FINANCE TRUST, INC.
NOTES TO CONSOLIDATED FINANCIAL STATEMENTS
June 30, 2016
(Unaudited)
As of June 30, 2016 | Total | Real Estate Debt | Real Estate Securities | |||||||||
Total Assets | $ | 1,331,102 | $ | 1,203,061 | $ | 128,041 | ||||||
As of December 31, 2015 | ||||||||||||
Total Assets | 1,282,484 | 1,150,858 | 131,626 | |||||||||
For the purposes of the table above, any expenses not associated with a specific segment have been allocated to the business segments using a percentage derived by using the sum of commercial mortgage loans, net and real estate securities, at fair value as the denominator and commercial mortgage loans, net and real estate securities, at fair value as the numerators.
Note 13 - Subsequent Events
The Company has evaluated subsequent events through the filing of this Quarterly Report on Form 10-Q and determined that there have not been any events that have occurred that would require adjustments to disclosures in the consolidated financial statements except for the following transactions:
Repurchase Agreements
The Company entered into the JPM Amendment as of July 15, 2016, pursuant to which the maturity date of the JPM Repo Facility was extended to June 17, 2017. For additional information refer to “Item 2. Management’s Discussion and Analysis of Financial Condition and Results of Operations--Liquidity and Capital Resources.”
Indemnification Agreement
On August 10, 2016, the Company entered into an indemnification agreement (the “Indemnification Agreement”) with Peter J. McDonough (the “Indemnitee”) in connection with Mr. McDonough’s appointment as an independent director of the Company’s board of directors. The Indemnification Agreement provides that the Company will indemnify the Indemnitee, to the fullest extent permitted by Maryland law and the Company's charter and subject to the limitations set forth in the Indemnification Agreement, from and against all judgments, penalties, fines and amounts paid in settlement and expenses reasonably incurred by the Indemnitee that may result or arise in connection with the Indemnitee serving in his capacity as a present or former director, officer, employee or agent of the Company or as a director, trustee, officer, partner, manager, managing member, fiduciary, employee or agent of any other foreign or domestic corporation, partnership, limited liability company, joint venture, trust, employee benefit plan or other enterprise that such person is or was serving in such capacity at our request. The Indemnification Agreement further provides that, subject to the limitations set forth in the Indemnification Agreement, the Company will, without requiring a preliminary determination of the Indemnitee’s ultimate entitlement of indemnification under the Indemnification Agreement, advance all reasonable expenses to the Indemnitee incurred by or on behalf of the Indemnitee in connection with any proceeding the Indemnitee is or is threatened to be made a party to.
The Indemnification Agreement provides that the Indemnitee is entitled to indemnification unless it is established that (a) the act or omission of the Indemnitee was material to the matter giving rise to the proceeding and (i) was committed in bad faith or (ii) was the result of active and deliberate dishonesty, (b) the Indemnitee actually received an improper personal benefit in money, property or services or (c) in the case of any criminal proceeding, the Indemnitee had reasonable cause to believe that his conduct was unlawful. The Indemnification Agreement further limits the Indemnitee’s entitlement to indemnification in cases where (a) the proceeding was won by or in the right of the Company and the Indemnitee was adjudged to be liable to the Company, (b) the Indemnitee was adjudged to be liable on the basis that personal benefit was improperly received in any proceeding charging improper personal benefit to the Indemnitee or (c) the proceeding was brought by the Indemnitee, except in certain circumstances.
The Indemnification Agreement also provides that, except for a proceeding brought by the Indemnitee, the Company has the right to defend the Indemnitee in any proceeding which may give rise to indemnification under the Indemnification Agreement. The Indemnification Agreement grants the Indemnitee the right to separate counsel in certain proceedings involving separate defenses, counterclaims or other conflicts of interest and in proceedings in which the Company fail to assume the defense of the Indemnitee in a timely manner. The Indemnification Agreement further provides that the Company will use its
reasonable best efforts to acquire directors and officers liability insurance covering the Indemnitee or any claim made against the Indemnitee by reason of his service to the Company.
The description of the Indemnification Agreement in this Quarterly Report on Form 10-Q is a summary and is qualified in its entirety by the terms of the Indemnification Agreement attached as Exhibit 10.2 to this Quarterly Report on Form 10-Q and incorporated herein by reference.
Distributions Paid
On July 1, 2016, the Company paid a distribution of $5.4 million to stockholders of record during the month of June 2016. The Company paid $3.4 million of the distribution in cash, while $2.0 million was used to purchase 80,434 shares through the DRIP.
23
Item 2. Management's Discussion and Analysis of Financial Condition and Results of Operations
The following discussion should be read in conjunction with the accompanying consolidated financial statements of Realty Finance Trust, Inc. The notes thereto and other financial information included elsewhere in this Quarterly Report on Form 10-Q as well as our Annual Report on Form 10-K for the fiscal year ended December 31, 2015 filed with the U.S. Securities and Exchange Commission (the "SEC") on March 11, 2016.
As used herein, the terms "we," "our" and "us" refer to Realty Finance Trust, Inc., a Maryland corporation, and, as required by context, to Realty Finance Operating Partnership, L.P., a Delaware limited partnership, which we refer to as the "OP," and to its subsidiaries. We are externally managed by Realty Finance Advisors, LLC (our "Advisor"), a Delaware limited liability company.
The forward-looking statements contained in this Quarterly Report on Form 10-Q may include, but are not limited to, statements as to:
• | our business and investment strategy; |
• | our ability to make investments in a timely manner or on acceptable terms; |
• | current credit market conditions and our ability to obtain long-term financing for our investments in a timely manner and on terms that are consistent with what we project when we invest; |
• | the effect of general market, real estate market, economic and political conditions, including the recent economic slowdown and dislocation in the global credit markets; |
• | our ability to make scheduled payments on our debt obligations; |
• | our ability to generate sufficient cash flows to make distributions to our stockholders; |
• | our ability to generate sufficient debt and equity capital to fund additional investments; |
• | our ability to refinance our existing financing arrangements; |
• | the degree and nature of our competition; |
• | the availability of qualified personnel; |
• | our ability to maintain our qualification as a real estate investment trust ("REIT"); and |
• | other factors set forth under the caption "Risk Factors" in our Annual Report on Form 10-K for the year ended December 31, 2015. |
In addition, words such as "anticipate," "believe," "expect" and "intend" indicate a forward-looking statement, although not all forward-looking statements include these words. The forward-looking statements contained in this Quarterly Report on Form 10-Q involve risks and uncertainties. Our actual results could differ materially from those implied or expressed in the forward-looking statements for any reason.
Our investors should not place undue reliance on these forward-looking statements. The forward-looking statements made in this Quarterly Report on Form 10-Q relate only to events as of the date on which the statements are made. We undertake no obligation to update any forward-looking statement to reflect events or circumstances occurring after the date of this Quarterly Report on Form 10-Q.
Overview
We were incorporated in Maryland on November 15, 2012 and conduct our operations to qualify as a REIT for U.S. federal income tax purposes beginning with the taxable year ended December 31, 2013. On May 14, 2013, we commenced business operations after raising in excess of $2.0 million of equity, the amount require for us to release equity proceeds from escrow. We are in business to originate, acquire and manage a diversified portfolio of commercial real estate debt secured by properties located both within and outside of the United States. We also invest in commercial real estate securities. Commercial real estate debt investments may include first mortgage loans, subordinated mortgage loans, mezzanine loans and participations in such loans. Commercial real estate securities may include CMBS, senior unsecured debt of publicly traded REITs, debt or equity securities of other publicly traded real estate companies and CDOs. We have no direct employees. We have retained the Advisor to manage our affairs on a day-to-day basis. The Advisor is under common control with the parent of the Sponsor, and will receive compensation and fees for services related to the investment and management of our assets. The Advisor receives fees during the offering, acquisition, operational and liquidation stages.
Prior to January 2016, we were offering for sale a maximum of $2.0 billion of common stock, $0.01 par value per share, on a reasonable best efforts basis, pursuant to a registration statement on Form S-11 filed with the SEC under the Securities Act of 1933, as amended (the "Securities Act"). The registration statement also covered the offer and sale of up to approximately $400.0 million in shares of common stock pursuant to a DRIP under which common stockholders may elect to have their
24
distributions reinvested in additional shares of common stock. Effective January 2016, we terminated the Offering, deregistered 4,069 unsold shares from the Offering and reallocated 49.7 million unsold shares from the Offering to the DRIP offering.
Prior to the NAV Pricing Date (as described below), we offered shares of our common stock in the Offering through Realty Capital Securities, LLC (the "Former Dealer Manager") at a per share price of up to $25.00 per share (including the maximum allowed to be charged for commissions and fees, subject to certain discounts as described in our prospectus). Prior to the NAV pricing date, we offered shares of our common stock pursuant to a the DRIP at a per share price of $23.75.
On November 4, 2015, our board of directors unanimously determined an estimated NAV per share of our common stock of $25.27 as of September 30, 2015. The estimated NAV per share is based upon the estimated value of our assets less our liabilities as of September 30, 2015. The conflicts committee of the board of directors approved the engagement of Duff & Phelps, LLC, an independent third-party real estate advisory firm, who performed appraisals of our assets in accordance with our valuation guidelines. Our Advisor calculated the estimated NAV per share, and the conflicts committee of our board of directors, which is comprised solely of our independent directors, approved and recommended to our board of directors the estimated NAV per share calculated by our Advisor. The valuation was performed in accordance with the provisions of Practice Guideline 2013-01, Valuations of Publicly Registered Non-Listed REITs, issued by the Investment Program Association in April 2013.
As of close of business on November 10, 2015 (the “NAV pricing date”), pursuant to the net asset value (“NAV”) calculation described herein, we began offering shares of our common stock in the Offering at a price of up to $28.08 per share, inclusive of applicable commissions and Former Dealer Manager fees, and through the DRIP at a price equal to $25.27 per share, the NAV per share. As noted above, we have terminated the Offering. The per share price for our DRIP offering will be equal to our per share NAV, divided by the number of shares of our common stock outstanding as of such date.
We have no employees. Our Advisor has been retained by us to manage our affairs on a day-to-day basis. The Advisor is under common control with AR Global, the parent of our Sponsor, as a result of which they are related parties, and each, including the Former Dealer Manager, have received or will receive compensation, fees and expense reimbursements for services related to the Offering, the investment and management of our assets, our operations and our liquidation.
On May 6, 2016, we announced that our Board, with the unanimous agreement of all directors, had recently formed a special committee, consisting exclusively of independent directors, to explore a potential strategic transaction with a related party. The Board granted the special committee the exclusive authority to consider, review, evaluate and, if appropriate, negotiate a strategic transaction on behalf of us. In addition, the Board granted the special committee the authority, when considering such strategic transaction, to solicit expressions of interest or other proposals for, and to consider, any alternative transactions. These transactions may include a possible sale or merger with one or more related or unrelated entities, listing the shares on a national exchange, changing the advisor or the sale of assets.
There are no assurances that the consideration of any strategic alternative will result in a transaction. We do not intend to comment on or disclose developments regarding the process unless we deem further disclosure is appropriate or required.
Significant Accounting Policies and Use of Estimates
A summary of our significant accounting policies is set forth in Note 2 - Summary of Significant Accounting Policies to our consolidated financial statements included in this Quarterly Report on Form 10-Q. A full disclosure of our significant accounting polices is disclosed in our Annual Report on Form 10-K for the year ended December 31, 2015.
Portfolio
As of June 30, 2016 and December 31, 2015, our portfolio consisted of 75 and 77 loans (the "Loans") and 16 and 16 investments in CMBS, respectively. The Loans had a total carrying value, net of reserve, of $1,127.0 million and $1,124.2 million, and our CMBS investments had a fair value of $126.0 million and $130.8 million as of June 30, 2016 and December 31, 2015, respectively. For our loans, we currently estimate loss rates based on historical realized losses experienced in the industry and take into account current collateral and economic conditions affecting the probability or severity of losses when establishing the allowance for loan losses. We recorded a general allowance for loan losses as of June 30, 2016 and December 31, 2015 in the amount of $1.7 million and $0.9 million, respectively. There were no impaired or specifically reserved loans in the portfolio as of June 30, 2016 and December 31, 2015.
As of June 30, 2016 and December 31, 2015, our Loans had a weighted average coupon of 6.1% and 6.1%, and a weighted average life of 2.3 and 2.7 years, respectively. Our CMBS investments had a weighted average coupon of 4.8% and 4.7% and a remaining life of 2.6 and 3.2 years as of June 30, 2016 and December 31, 2015, respectively. The following charts summarize our portfolio as a percentage of par value, including CMBS, by the collateral type, geographical region and coupon rate type as of June 30, 2016 and December 31, 2015:
25
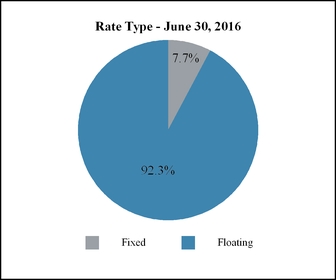
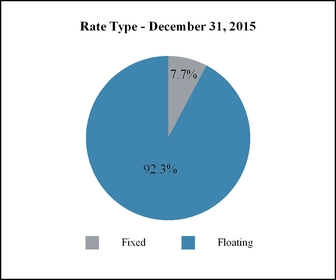
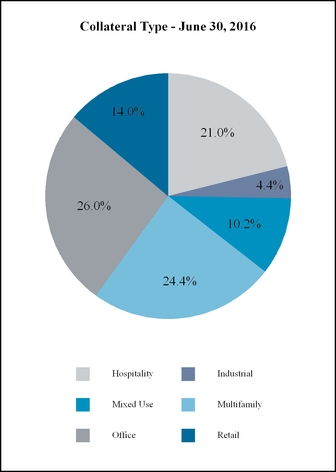
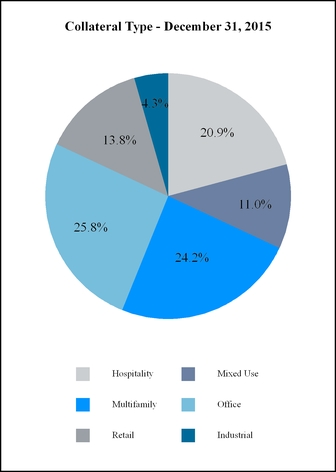
26
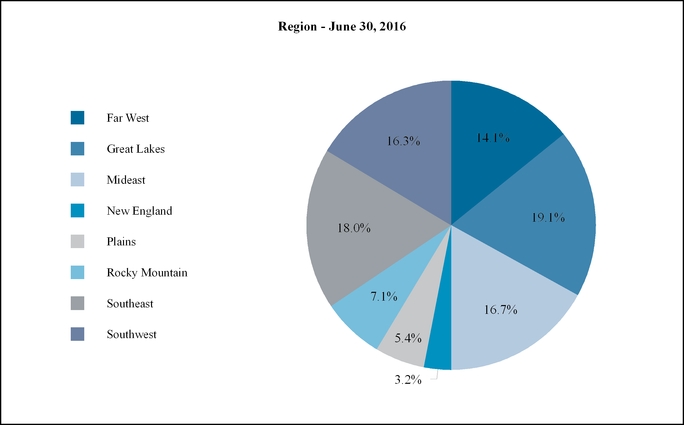
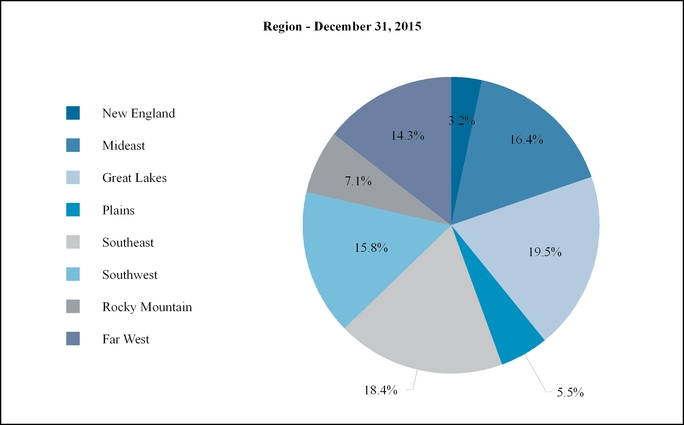
27
An investments region classification is defined according to the map below based on the location of investments' secured property.
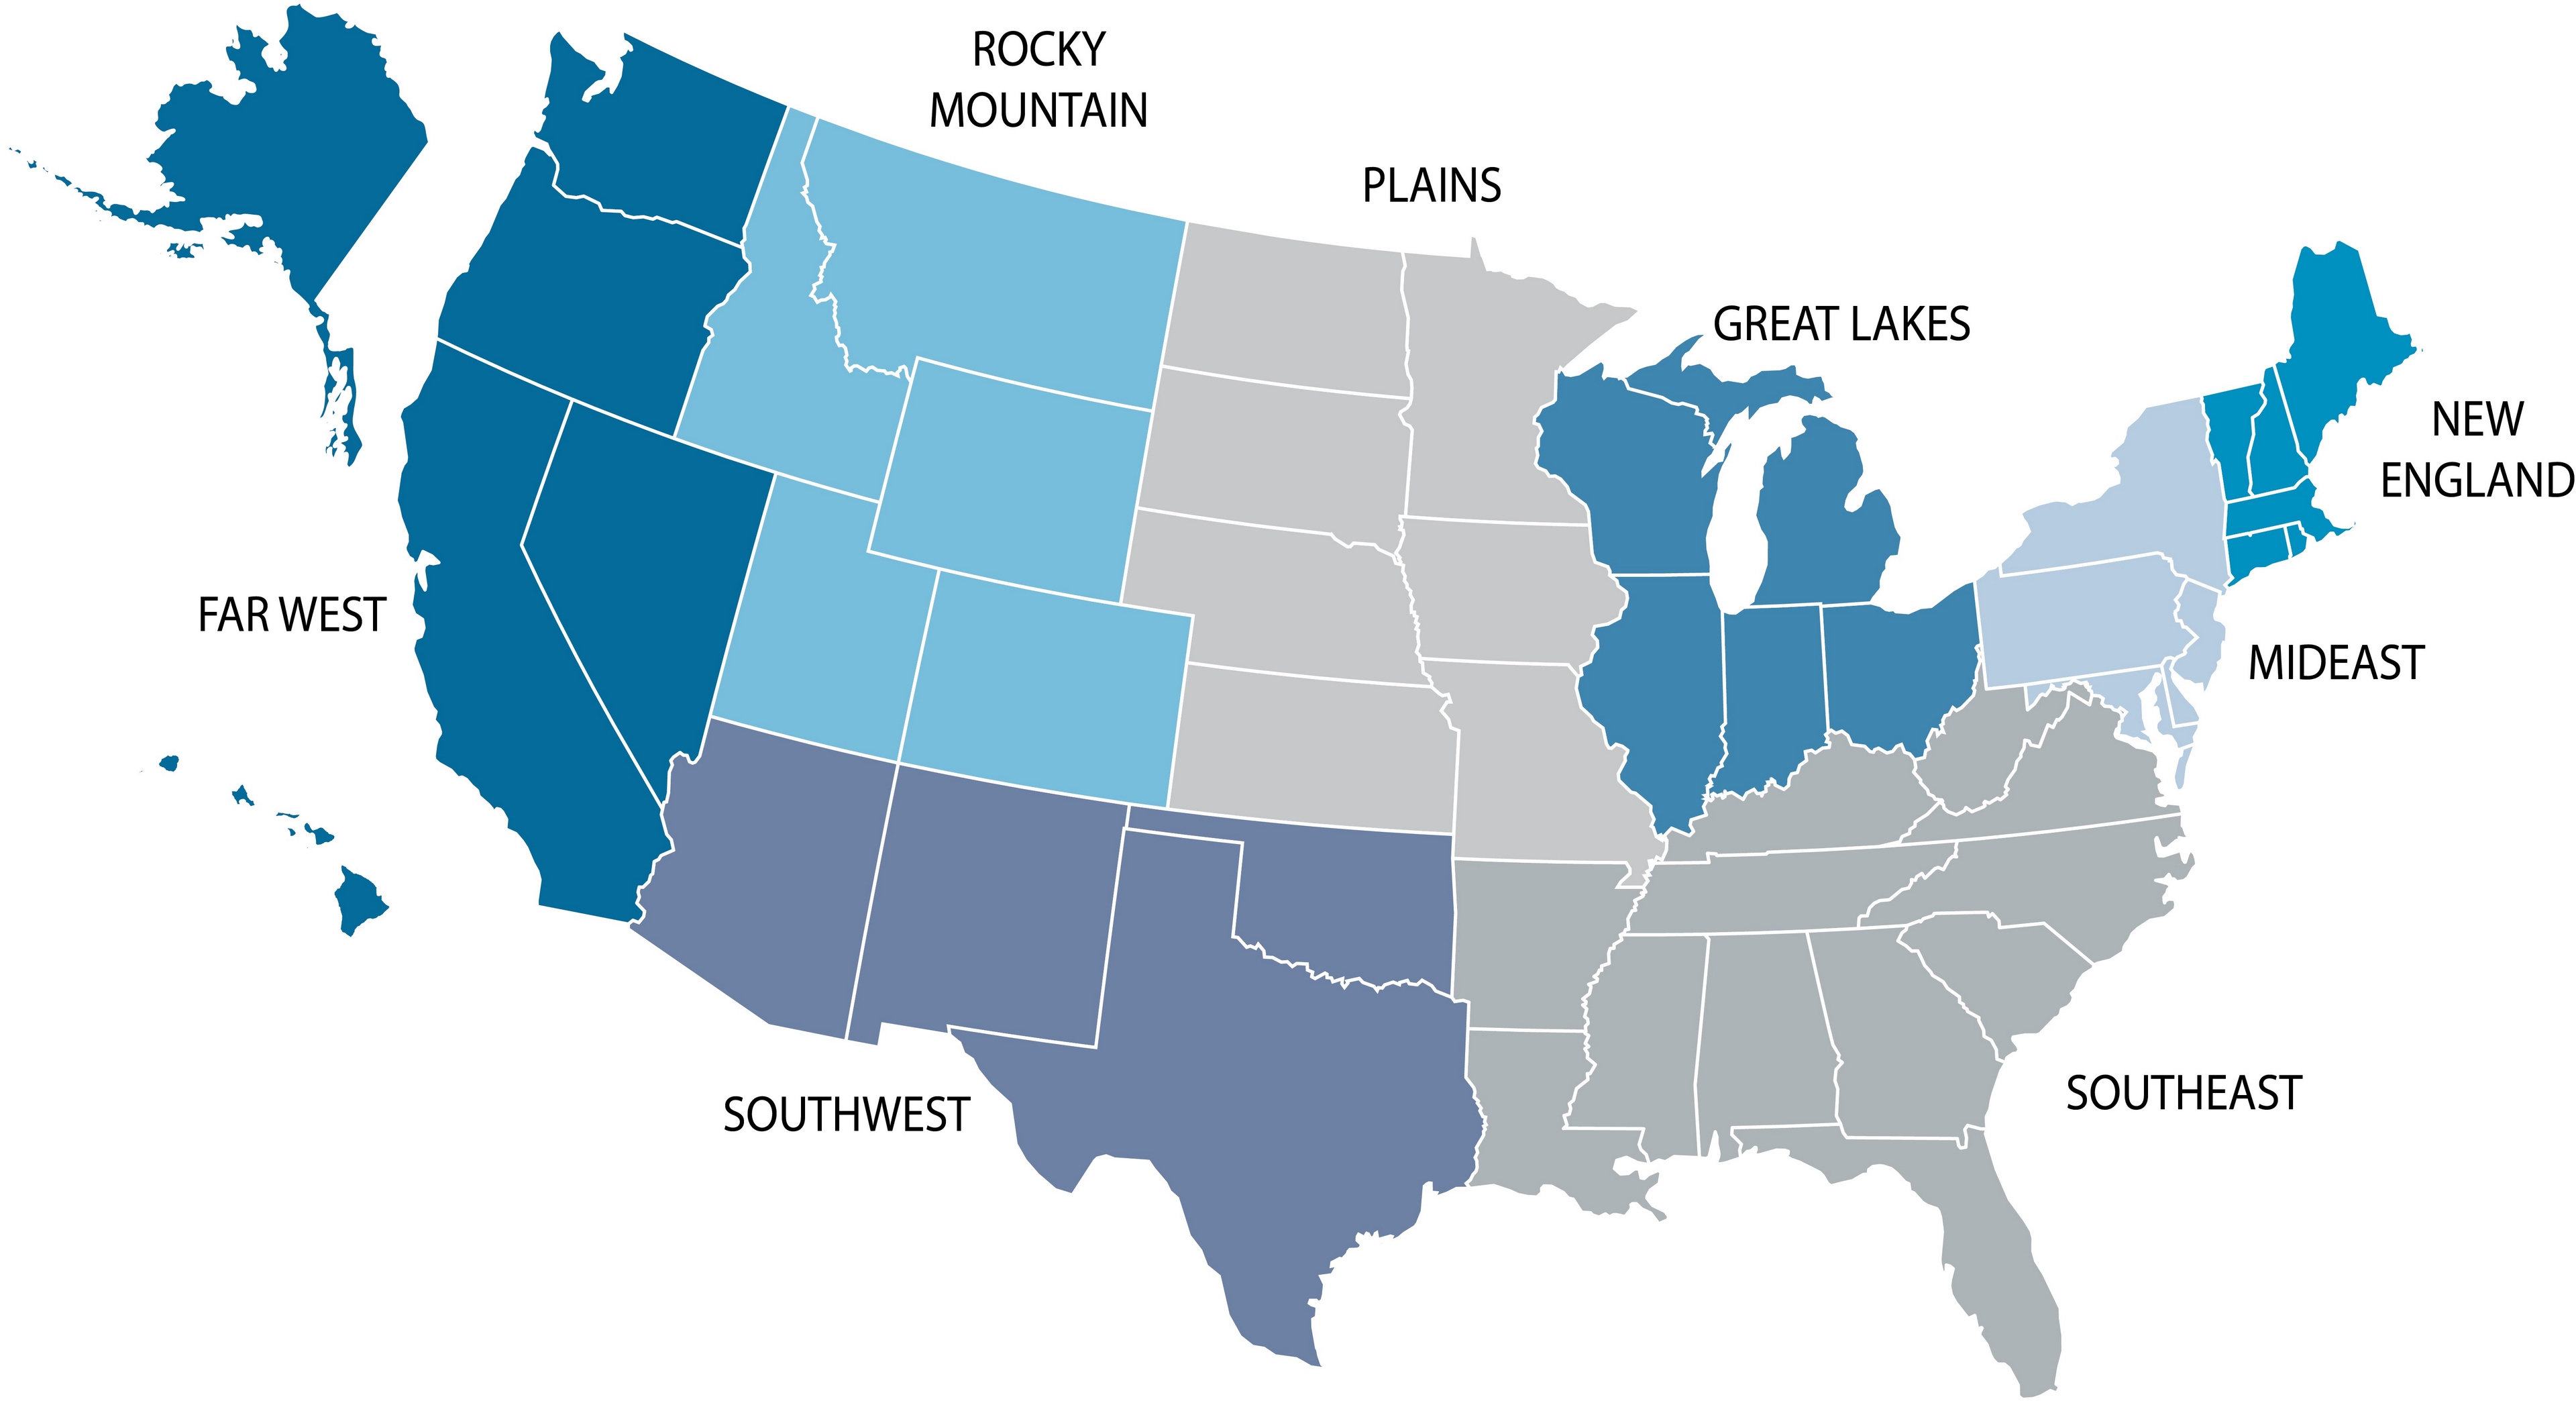
The following charts show the par value by maturity year for the investments in our portfolio as of June 30, 2016 and December 31, 2015.
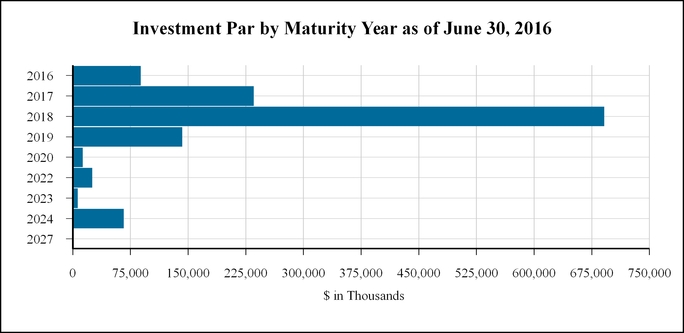
28
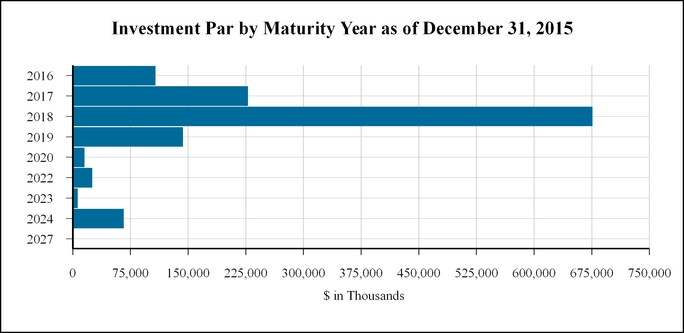
The following table shows selected data from our commercial mortgage loans portfolio as of June 30, 2016 (in thousands):
Loan Type | Property Type | Par Value | Interest Rate (1) | Effective Yield | Loan to Value (2) |
Senior 1 | Retail | $7,460 | 1M LIBOR + 4.75% | 5.4% | 78.0% |
Senior 2 | Office | 8,500 | 1M LIBOR + 4.65% | 5.4% | 70.8% |
Senior 3 | Mixed Use | 11,000 | 1M LIBOR + 9.00% | 9.4% | 70.0% |
Senior 4 | Office | 35,800 | 1M LIBOR + 5.25% | 6.0% | 75.0% |
Senior 5 | Office | 12,519 | 1M LIBOR + 4.75% | 5.3% | 74.4% |
Senior 6 | Retail | 14,600 | 1M LIBOR + 4.25% | 4.9% | 65.0% |
Senior 7 | Retail | 11,636 | 1M LIBOR + 5.00% | 5.7% | 70.0% |
Senior 8 | Office | 19,250 | 1M LIBOR + 4.55% | 5.1% | 70.0% |
Senior 9 | Multifamily | 17,072 | 1M LIBOR + 4.75% | 5.5% | 75.0% |
Senior 10 | Multifamily | 14,314 | 1M LIBOR + 4.50% | 5.2% | 76.0% |
Senior 11 | Office | 12,000 | 1M LIBOR + 4.75% | 5.3% | 54.1% |
Senior 12 | Multifamily | 21,810 | 1M LIBOR + 4.25% | 4.8% | 69.6% |
Senior 13 | Multifamily | 8,668 | 1M LIBOR + 4.75% | 5.5% | 76.0% |
Senior 14 | Retail | 9,850 | 1M LIBOR + 5.25% | 5.9% | 80.0% |
Senior 15 | Industrial | 19,033 | 1M LIBOR + 4.25% | 4.9% | 68.0% |
Senior 16 | Hospitality | 10,350 | 1M LIBOR + 5.50% | 6.2% | 69.9% |
Senior 17 | Office | 31,401 | 1M LIBOR + 4.65% | 5.4% | 80.0% |
Senior 18 | Retail | 4,725 | 1M LIBOR + 5.50% | 6.3% | 72.0% |
Senior 19 | Retail | 20,244 | 1M LIBOR + 4.75% | 5.6% | 55.0% |
Senior 20 | Multifamily | 41,434 | 1M LIBOR + 4.00% | 4.6% | 77.0% |
Senior 21 | Retail | 7,500 | 1M LIBOR + 5.00% | 5.8% | 59.0% |
Senior 22 | Office | 13,214 | 1M LIBOR + 5.00% | 5.7% | 75.0% |
Senior 23 | Hospitality | 11,482 | 1M LIBOR + 5.75% | 6.4% | 60.0% |
Senior 24 | Hospitality | 13,895 | 1M LIBOR + 5.30% | 6.0% | 73.5% |
Senior 25 | Mixed Use | 22,473 | 1M LIBOR + 5.50% | 6.1% | 55.3% |
Senior 26 | Multifamily | 18,181 | 1M LIBOR + 4.20% | 4.8% | 76.4% |
Senior 27 | Mixed Use | 10,583 | 1M LIBOR + 5.10% | 5.8% | 75.0% |
Senior 28 | Multifamily | 40,537 | 1M LIBOR + 4.25% | 5.0% | 77.0% |
Senior 29 | Retail | 9,450 | 1M LIBOR + 4.90% | 5.5% | 69.2% |
29
Loan Type | Property Type | Par Value | Interest Rate (1) | Effective Yield | Loan to Value (2) |
Senior 30 | Industrial | 33,655 | 1M LIBOR + 4.00% | 4.5% | 65.0% |
Senior 31 | Mixed Use | 45,174 | 1M LIBOR + 5.50% | 6.2% | 72.6% |
Senior 32 | Multifamily | 8,850 | 1M LIBOR + 4.70% | 5.4% | 68.8% |
Senior 33 | Office | 25,981 | 1M LIBOR + 4.60% | 5.3% | 65.0% |
Senior 34 | Mixed Use | 8,016 | 1M LIBOR + 4.75% | 5.4% | 78.3% |
Senior 35 | Hospitality | 16,800 | 1M LIBOR + 4.90% | 5.5% | 74.0% |
Senior 36 | Office | 35,000 | 1M LIBOR + 5.00% | 5.5% | 79.0% |
Senior 37 | Office | 6,282 | 1M LIBOR + 4.90% | 5.4% | 80.0% |
Senior 38 | Retail | 11,800 | 1M LIBOR + 4.75% | 5.4% | 79.4% |
Senior 39 | Retail | 13,500 | 1M LIBOR + 5.00% | 5.7% | 78.0% |
Senior 40 | Retail | 11,684 | 1M LIBOR + 4.50% | 5.1% | 74.8% |
Senior 41 | Multifamily | 18,075 | 1M LIBOR + 4.50% | 5.1% | 75.0% |
Senior 42 | Mixed Use | 31,250 | 1M LIBOR + 4.50% | 5.2% | 75.0% |
Senior 43 | Multifamily | 24,669 | 1M LIBOR + 4.25% | 5.0% | 79.7% |
Senior 44 | Office | 9,802 | 1M LIBOR + 5.50% | 6.3% | 75.0% |
Senior 45 | Multifamily | 28,597 | 1M LIBOR + 3.85% | 4.2% | 76.8% |
Senior 46 | Multifamily | 10,785 | 1M LIBOR + 3.95% | 4.3% | 77.5% |
Senior 47 | Multifamily | 12,174 | 1M LIBOR + 3.95% | 4.3% | 78.2% |
Senior 48 | Multifamily | 5,864 | 1M LIBOR + 4.05% | 4.5% | 80.0% |
Senior 49 | Office | 28,422 | 1M LIBOR + 4.25% | 4.8% | 73.3% |
Senior 50 | Multifamily | 14,086 | 1M LIBOR + 5.00% | 5.7% | 76.7% |
Senior 51 | Retail | 26,500 | 1M LIBOR + 4.75% | 5.2% | 67.4% |
Senior 52 | Multifamily | 10,680 | 1M LIBOR + 4.75% | 5.3% | 75.0% |
Mezzanine 1 | Office | 5,000 | 11.00% | 10.8% | 63.6% |
Mezzanine 2 | Hospitality | 3,000 | 11.00% | 10.8% | 81.8% |
Mezzanine 3 | Hospitality | 11,000 | 1M LIBOR + 7.05% | 7.5% | 70.0% |
Mezzanine 4 | Office | 19,027 | 1M LIBOR + 7.25% | 7.2% | 76.0% |
Mezzanine 5 | Office | 7,000 | 12.00% | 11.9% | 78.3% |
Mezzanine 6 | Hospitality | 12,000 | 1M LIBOR + 9.00% | 9.2% | 74.2% |
Mezzanine 7 | Retail | 1,963 | 13.00% | 12.9% | 85.0% |
Mezzanine 8 | Office | 5,098 | 3M LIBOR + 10.00% | 10.7% | 79.5% |
Mezzanine 9 | Hospitality | 44,575 | 1M LIBOR + 10.00% | 10.4% | 75.0% |
Mezzanine 10 | Multifamily | 5,000 | 9.00% | 8.7% | 73.9% |
Mezzanine 11 | Multifamily | 3,480 | 9.50% | 9.4% | 84.5% |
Mezzanine 12 | Office | 10,000 | 1M LIBOR + 8.00% | 8.4% | 80.0% |
Mezzanine 13 | Multifamily | 4,000 | 12.00% | 11.8% | 74.5% |
Mezzanine 14 | Office | 10,000 | 10.00% | 10.9% | 79.0% |
Mezzanine 15 | Office | 10,000 | 1M LIBOR + 10.75% | 15.5% | 80.0% |
Mezzanine 16 | Hospitality | 7,140 | 10.00% | 11.5% | 73.9% |
Mezzanine 17 | Hospitality | $3,900 | 10.00% | 11.5% | 73.9% |
Mezzanine 18 | Hospitality | $12,510 | 10.00% | 11.5% | 73.9% |
Mezzanine 19 | Hospitality | $8,050 | 10.00% | 11.5% | 73.9% |
Mezzanine 20 | Office | $9,000 | 10.50% | 10.4% | 85.0% |
Mezzanine 21 | Hospitality | $6,230 | 5.46% | 13.3% | 76.7% |
Mezzanine 22 | Hospitality | $12,350 | 1M LIBOR + 10.00% | 10.4% | 74.0% |
Subordinate 1 | Retail | $10,000 | 11.00% | 11.0% | 50.1% |
$1,136,951 | 6.3% | 73.03% | |||
________________________
(1) Our floating rate loan agreements contain the contractual obligation for the borrower to maintain an interest rate cap to protect against rising interest rates. In a simple interest rate cap, the borrower pays a premium for a notional principal amount based on a capped interest rate (the "cap rate"). When the floating rate exceeds the cap rate, the borrower receives a payment from the cap counterparty equal to the difference between the floating rate and the cap rate on the same notional principal amount for a specified period of time. When interest rates rise, the value of an interest rate cap will increase, thereby reducing the borrower's exposure to rising interest rates.
30
(2) Loan to value percentage is from metrics at origination.
Results of Operations
Comparison of the Three Months Ended June 30, 2016 to the Three Months Ended June 30, 2015
We conduct our business through the following segments:
• | The real estate debt business focuses on originating, acquiring and asset managing commercial real estate debt investments, including first mortgage loans, subordinate mortgages, mezzanine loans and participations in such loans. |
• | The real estate securities business focuses on investing in and asset managing commercial real estate securities primarily consisting of CMBS and may include unsecured REIT debt, CDO notes and other securities. |
Net Interest Income
Net interest income is generated on our interest-earning assets less related interest-bearing liabilities and is recorded as part of our real estate debt and real estate securities segments.
The following table presents the average balance of interest-earning assets less related interest-bearing liabilities, associated interest income and expense and corresponding yield earned and incurred for the three months ended June 30, 2016 and 2015 (dollars in thousands):
________________________
Three Months Ended June 30, | ||||||||||||||||||||||
2016 | 2015 | |||||||||||||||||||||
Average Carrying Value(1) | Interest Income / Expense(2) | WA Yield / Financing Cost(3)(4) | Average Carrying Value(1) | Interest Income / Expense(2) | WA Yield / Financing Cost(3)(4) | |||||||||||||||||
Interest-earning assets: | ||||||||||||||||||||||
Real estate debt | $ | 1,136,418 | $ | 18,615 | 6.6 | % | $ | 676,329 | $ | 11,822 | 7.0 | % | ||||||||||
Real estate securities | 131,040 | 1,607 | 4.9 | % | 76,043 | 662 | 3.5 | % | ||||||||||||||
Total | 1,267,458 | 20,222 | 6.4 | % | 752,372 | 12,484 | 6.6 | % | ||||||||||||||
Interest-bearing liabilities: | ||||||||||||||||||||||
Repurchase Agreements - Loans | 238,439 | 2,585 | 4.3 | % | 252,606 | 2,344 | 3.7 | % | ||||||||||||||
Repurchase Agreements - Securities | 122,539 | 683 | 2.2 | % | 47,622 | 179 | 1.5 | % | ||||||||||||||
Collateralized loan obligations | 288,128 | 2,125 | 3.0 | % | — | — | — | % | ||||||||||||||
Total | 649,106 | 5,393 | 3.3 | % | 300,228 | 2,523 | 3.4 | % | ||||||||||||||
Net interest income/spread | 14,829 | 3.1 | % | $ | 9,961 | 3.2 | % | |||||||||||||||
Average leverage %(5) | 51.2 | % | 39.9 | % | ||||||||||||||||||
Weighted average levered yield(6) | 8.0 | % | 7.9 | % | ||||||||||||||||||
(1) Based on amortized cost for real estate debt and real estate securities and principal amount for repurchase agreements. Amounts are calculated based on daily averages for three months ended June 30, 2016 and 2015, respectively.
(2) Includes the effect of amortization of premium or accretion of discount and deferred fees.
(3) Calculated as interest income or expense divided by average carrying value.
(4) Annualized.
(5) Calculated by dividing total average interest-bearing liabilities by total average interest-earning assets.
(6) Calculated by taking the sum of (i) the net interest spread multiplied by the average leverage and (ii) the interest-earning assets.
Interest Income
The primary driver for increased interest income during the three months ended June 30, 2016 compared to the same period in 2015 was the increase in the size of our portfolio resulting from the investment of the capital raised in the Offering into real estate debt. As of June 30, 2016, our Loans had a total carrying value of $1,128.7 million and our CMBS investments had a fair value of $126.0 million, while as of June 30, 2015, the Loans had a total carrying value of $792.9 million and our CMBS investments had a fair value of $93.2 million. This increase was partially offset by a decrease in yield on our investments by 20 basis points quarter over quarter, primarily due to a shift in the composition of the portfolio predominately to lower yielding senior loans over the course of 2015.
31
Interest Expense
Interest expense for the three months ended June 30, 2016 was $2.9 million higher than for the three months ended June 30, 2015, primarily due to an increase in average borrowings outstanding of approximately $350 million period over period. The increase was partially offset by a 10 basis points decrease in rates on interest-bearing liabilities primarily due to borrowing more on our lower interest repurchase agreements for senior loans compared to higher cost borrowings.
Expenses from Operations
Expenses from operations for the three months ended June 30, 2016 and 2015 were made up of the following (in thousands):
Three Months Ended June 30, | ||||||||
2016 | 2015 | |||||||
Asset management and subordinated performance fee | $ | 3,015 | $ | 974 | ||||
Acquisition fees | 223 | 3,149 | ||||||
Professional fees | 811 | 1,040 | ||||||
Administrative services expenses | 539 | — | ||||||
Other expenses | 712 | 415 | ||||||
Loan loss provision | 669 | 80 | ||||||
Total expenses from operations | $ | 5,969 | $ | 5,658 | ||||
For the three months ended June 30, 2016, expenses from operations were primarily related to asset management and subordinated performance fees. During the three months ended June 30, 2016 and June 30, 2015, we incurred $3.0 million and $1.0 million of asset management and subordinated performance fees, respectively, an increase of $2.0 million, primarily due to increase in the size of our real estate asset portfolio. Additionally, we have incurred approximately $0.5 million of administrative service expenses related to general and administrative expense reimbursement to the Advisor for three months ended June 30, 2016, we did not have these expenses for the three months ended June 30, 2015, as the Advisor did not seek reimbursement for such expenses for the prior year's period. For the three months ended June 30, 2015, our expenses from operations were primarily related to acquisition fees and professional fees of $4.2 million.
Comparison of the Six Months Ended June 30, 2016 to the Six Months Ended June 30, 2015
We conduct our business through the following segments:
• | The real estate debt business focuses on originating, acquiring and asset managing commercial real estate debt investments, including first mortgage loans, subordinate mortgages, mezzanine loans and participations in such loans. |
• | The real estate securities business focuses on investing in and asset managing commercial real estate securities primarily consisting of CMBS and may include unsecured REIT debt, CDO notes and other securities. |
Net Interest Income
Net interest income is generated on our interest-earning assets less related interest-bearing liabilities and is recorded as part of our real estate debt and real estate securities segments.
The following table presents the average balance of interest-earning assets less related interest-bearing liabilities, associated interest income and expense and corresponding yield earned and incurred for the six months ended June 30, 2016 and 2015 (dollars in thousands):
32
Six Months Ended June 30, | ||||||||||||||||||||||
2016 | 2015 | |||||||||||||||||||||
Average Carrying Value(1) | Interest Income/Expense(2) | WA Yield/Financing Cost (3)(4) | Average Carrying Value(1) | Interest Income/Expense(2) | WA Yield/Financing Cost (3)(4) | |||||||||||||||||
Interest-earning assets: | ||||||||||||||||||||||
Real estate debt | $ | 1,127,898 | $ | 37,291 | 6.6 | % | $ | 603,370 | $ | 21,018 | 7.0 | % | ||||||||||
Real estate securities | 131,592 | 3,222 | 4.9 | % | 67,511 | 1,071 | 3.2 | % | ||||||||||||||
Total | 1,259,490 | 40,513 | 6.4 | % | 670,881 | 22,089 | 6.6 | % | ||||||||||||||
Interest-bearing liabilities: | ||||||||||||||||||||||
Repurchase Agreements - Loans | 245,693 | 4,568 | 3.7 | % | 218,460 | 4,148 | 3.8 | % | ||||||||||||||
Repurchase Agreements - Securities | 121,565 | 1,360 | 2.2 | % | 40,504 | 308 | 1.5 | % | ||||||||||||||
Collateralized loan obligations | 288,149 | 4,233 | 2.9 | % | — | — | — | % | ||||||||||||||
Total | 655,407 | 10,161 | 3.1 | % | 258,964 | 4,456 | 3.4 | % | ||||||||||||||
Net interest income/spread | 30,352 | 3.3 | % | $ | 17,633 | 3.2 | % | |||||||||||||||
Average leverage %(5) | 52.0 | % | 38.6 | % | ||||||||||||||||||
Weighted average levered yield(6) | 8.1 | % | 7.8 | % | ||||||||||||||||||
(1) Based on amortized cost for real estate debt and real estate securities and principal amount for repurchase agreements. Amounts are calculated based on daily averages for six months ended June 30, 2016 and 2015, respectively.
(2) Includes the effect of amortization of premium or accretion of discount and deferred fees.
(3) Calculated as interest income or expense divided by average carrying value.
(4) Annualized.
(5) Calculated by dividing total average interest-bearing liabilities by total average interest-earning assets.
(6) Calculated by taking the sum of (i) the net interest spread multiplied by the average leverage and (ii) the interest-earning assets.
Interest Income
The primary driver for increased interest income during the six months ended June 30, 2016 compared to the same period in 2015 was the increase in the size of our portfolio resulting from the investment of the capital raised in the Offering into real estate debt. As of June 30, 2016, our Loans had a total carrying value of $1,128.7 million and our CMBS investments had a fair value of $126.0 million, while as of June 30, 2015, the Loans had a total carrying value of $792.9 million and our CMBS investments had a fair value of $93.2 million. This increase was partially offset by a decrease in yield on our investments by 20 basis points in the first half of 2016 compared to first half of 2015, primarily due to a shift in the composition of the portfolio predominately to lower yielding senior loans over the course of 2015.
Interest Expense
Interest expense for the six months ended June 30, 2016 was $5.7 million higher than for the six months ended June 30, 2015, primarily due to an increase in average borrowings outstanding of approximately $400 million period over period. The increase was partially offset by a 30 basis points decrease in rates on interest-bearing liabilities primarily due to borrowing more on our lower interest repurchase agreements for senior loans compared to higher cost borrowings.
33
Expenses from Operations
Expenses from operations for the three months ended June 30, 2016 and 2015 were made up of the following (in thousands):
Six Months Ended June 30, | ||||||||
2016 | 2015 | |||||||
Asset management and subordinated performance fee | $ | 6,025 | $ | 1,336 | ||||
Acquisition fees | 380 | 4,181 | ||||||
Professional fees | 2,072 | 2,419 | ||||||
Administrative services expenses | 1,355 | — | ||||||
Other expenses | 1,406 | 538 | ||||||
Loan loss provision | 834 | 224 | ||||||
Total expenses from operations | $ | 12,072 | $ | 8,698 | ||||
For the six months ended June 30, 2016, expenses from operations were primarily related to asset management and subordinated performance fees. During the six months ended June 30, 2016 and June 30, 2015, we incurred $6 million and $1.3 million of asset management and subordinated performance fees, respectively, an increase of $4.7 million due to increase in portfolio size of approximately $600 million during first half of 2016 compared to first half of 2015. Additionally, there was no waiver of asset management fee during the first half of 2016. Additionally, we have incurred approximately $1.4 million of administrative service expenses related to general and administrative expense reimbursement to the Advisor for the six months ended June 30, 2016, we did not have these expenses for the six months ended June 30, 2015 as the Advisor did not seek reimbursement for such expenses for the prior year's period. For the six months ended June 30, 2015, our expenses from operations were primarily related to acquisition fees and professional fees of $6.6 million.
Liquidity and Capital Resources
Our principal demands for cash will be acquisition costs, including the purchase price of any investments we originate or acquire, the payment of our operating and administrative expenses, continuing debt service obligations and distributions to our stockholders. Prior to January 2016, we generally funded our investments from the net proceeds of the Offering. We can acquire our assets with cash or debt, but we also may acquire assets free and clear of indebtedness by paying the entire purchase price for the asset in cash or in OP units. We currently believe that we have sufficient liquidity and capital resources available for the acquisition of additional investments, repayments on borrowings and the payment of cash dividends, although given the termination of our Offering we expect our new investments to decrease significantly in 2016 unless we are able to raise additional equity capital.
Loan Repo Facilities
We entered into the JPM Repo Facility with JPMorgan Chase Bank, National Association (the "JPM Facility"). The JPM Repo Facility provides up to $150.0 million in advances, subject to adjustment, which we expect to use to finance the acquisition or origination of eligible loans, including first mortgage loans, junior mortgage loans, mezzanine loans and participation interests therein. Advances under the JPM Repo Facility accrue interest at per annum rates equal to the sum of (i) the applicable LIBOR index rate plus (ii) a margin of between 2.25% to 4.50%, depending on the attributes of the purchased assets. The initial maturity date of the JPM Repo Facility was June 18, 2016, with a one-year extension at our option, which may be exercised upon the satisfaction of certain conditions. The Company has exercised the extension option with the JPM Repo Facility lender, extending the maturity date to June 17, 2017. As of June 30, 2016 and December 31, 2015, there was $140.1 million and $84.3 million of principal outstanding on the JPM Repo Facility, respectively.
We entered into the Barclays Repo Facility with Barclays Bank PLC ("Barclays Repo Facility"). The Barclays Repo Facility provides up to $150.0 million in advances, subject to adjustment, which we expect to use to finance the acquisition or origination of eligible loans, including first mortgage loans and senior notes and participation interests therein. We entered into an amendment of the Barclays Repo Facility, dated as of May 12, 2016 (the “Barclays Amendment”), after giving effect to the Barclays Amendment, advances under the Barclays Repo Facility accrue interest at per annum rates equal to the sum of (i) the applicable LIBOR index rate plus (ii) a margin of between 2.50% to 3.00%, depending on the attributes of the purchased assets. Pursuant to the Barclays Amendment, the maturity date of the Barclays Repo Facility was extended to September 6, 2016. There are two six-month extensions remaining under the Barclays Repo Facility, which may be granted by lender in its sole discretion upon the satisfaction of certain conditions. As of June 30, 2016 and December 31, 2015, we had $121.9 million and $121.9 million outstanding under the Barclays Repo Facility, respectively. Although we are in discussions with the lender with respect to an extension, as of the filing date of this quarterly report the lender has not granted an extension. In the event the extension is not granted by the maturity date and we are unable to obtain alternative financing, we would be required to sell a
34
portion of our assets to provide cash to supplement our cash-on-hand and liquid securities in order to repay the amounts then outstanding on the facility. As of June 30, 2016, the Company is in compliance with all debt covenants.
The JPM Repo Facility and the Barclays Repo Facility generally provide that in the event of a decrease in the value of our collateral, the lenders can demand additional collateral. Should the value of our collateral decrease, whether as a result of deteriorating credit quality, an increase in credit market spreads or otherwise, resulting margin calls may cause an adverse change in our liquidity position.
CMBS Master Repurchase Agreements ("MRAs")
We entered into various MRAs that allow us to sell real estate securities while providing a fixed repurchase price for the same real estate securities in the future. The repurchase contracts on each security under an MRA generally mature in 30 to 90 days and terms are adjusted for current market rates as necessary. As of June 30, 2016 and December 31, 2015, we entered into six MRAs, of which three were in use, described below (in thousands):
Amount | Weighted Average | ||||||||||||||||
Counterparty | Outstanding | Accrued Interest | Collateral Pledged | Interest Rate | Days to Maturity | ||||||||||||
As of June 30, 2016 | |||||||||||||||||
J.P. Morgan Securities LLC (*) | $ | 89,882 | $ | 40 | $ | 139,130 | 2.27 | % | 22 | ||||||||
Citigroup Global Markets, Inc. | 26,023 | 82 | 35,184 | 2.33 | % | 43 | |||||||||||
Wells Fargo Securities, LLC | 3,375 | 3 | 4,450 | 1.80 | % | 13 | |||||||||||
Total/Weighted Average | $ | 119,280 | $ | 125 | $ | 178,764 | 2.27 | % | 26 | ||||||||
As of December 31, 2015 | |||||||||||||||||
J.P. Morgan Securities LLC (*) | $ | 86,898 | $ | 108 | $ | 130,618 | 2.03 | % | 8 | ||||||||
Citigroup Global Markets, Inc. | 26,619 | 71 | 35,528 | 2.00 | % | 45 | |||||||||||
Wells Fargo Securities, LLC | 3,694 | 3 | 4,925 | 1.67 | % | 13 | |||||||||||
Total/Weighted Average | $ | 117,211 | $ | 182 | $ | 171,071 | 2.01 | % | 17 | ||||||||
(*) Collateral includes $54,082 and $56,044 of Tranche C of RFT issued CLO to JPM. The investment in Tranche C of the CLO eliminates on the consolidated balance sheets as of June 30, 2016 and December 31, 2015, respectively.
We expect to use additional debt financing as a source of capital. Under our charter, the maximum amount of our total indebtedness shall not exceed 300% of our total ‘‘net assets’’ (as defined by the NASAA REIT Guidelines) as of the date of any borrowing, which is generally expected to be 75% of the cost of our investments; however, we may exceed that limit if approved by a majority of our independent directors and disclosed to stockholders in our next quarterly report following such borrowing along with justification for exceeding such limit. This charter limitation, however, does not apply to individual real estate assets or investments. At the date of acquisition of each asset, we anticipate that the cost of investment for such asset will be substantially similar to its fair market value, which will enable us to satisfy our requirements under the North American Securities Administrators ("NASAA") Statement of Policy regarding REITs (the "REIT Guidelines"). However, subsequent events, including changes in the fair market value of our assets, could result in our exceeding these limits. We anticipate that adequate cash will be generated from operations to fund our operating and administrative expenses, continuing debt service obligations and the payment of distributions.
In addition to our current mix of financing sources, we may also access additional forms of financings, including credit facilities, securitizations and public and private, secured and unsecured debt issuances by us or our subsidiaries.
Distributions
On May 13, 2013, our board of directors authorized, and we declared, a distribution payable on a monthly basis to stockholders of record on each day at a rate equal to $0.00565068493 per day, which is equivalent to $2.0625 per annum, per share of common stock. In March 2016, our board of directors ratified the existing distribution amount equivalent to $2.0625 per annum, and, for calendar year 2016, affirmed a change to the daily distribution amount to$0.0056352459 per day per share of common stock, effective January 1, 2016, to accurately reflect that 2016 is a leap year. The distribution will be payable by the fifth day following the end of each month to stockholders of record at the close of business each day during the prior month.
The below table shows the distributions paid on shares outstanding during the six months ended June 30, 2016 and six months ended June 30, 2015 (in thousands):
35
Six Months Ended June 30, 2016 Payment Date | Amount Paid in Cash | Amount Issued under DRIP | ||||||||
January 4, 2016 | $ | 3,225 | $ | 2,324 | ||||||
February 2, 2016 | 3,337 | 2,159 | ||||||||
March 2, 2016 | 3,057 | 2,099 | ||||||||
April 1, 2016 | 3,342 | 2,188 | ||||||||
May 2, 2016 | 3,296 | 2,068 | ||||||||
June 1, 2016 | 3,446 | 2,112 | ||||||||
Total | $ | 19,703 | $ | 12,950 | ||||||
Six Months Ended June 30, 2015 Payment Date | Amount Paid in Cash | Amount Issued under DRIP | ||||||||
January 2, 2015 | $ | 1,512 | $ | 1,109 | ||||||
February 2, 2015 | 1,618 | 1,182 | ||||||||
March 2, 2015 | 1,568 | 1,153 | ||||||||
April 1, 2015 | 1,873 | 1,395 | ||||||||
May 1, 2015 | 1,972 | 1,478 | ||||||||
June 1, 2015 | 2,216 | 1,657 | ||||||||
Total | $ | 10,759 | $ | 7,974 | ||||||
The following table shows the sources for the payment of distributions to common stockholders for the periods presented(in thousands):
Three Months Ended June 30, | Six Months Ended June 30, | |||||||||||||||||||||||||||
2016 | 2015 | 2016 | 2015 | |||||||||||||||||||||||||
Distributions: | ||||||||||||||||||||||||||||
Cash distributions paid | $ | 10,084 | $ | 6,062 | $ | 19,703 | $ | 10,759 | ||||||||||||||||||||
Distributions reinvested | 6,368 | 4,529 | 12,950 | 7,974 | ||||||||||||||||||||||||
Total distributions | $ | 16,452 | $ | 10,591 | $ | 32,653 | $ | 18,733 | ||||||||||||||||||||
Source of distribution coverage: | ||||||||||||||||||||||||||||
Cash flows provided by operations | $ | 9,116 | 55.4 | % | $ | 5,052 | 47.7 | % | $ | 19,204 | 58.8 | % | $ | 10,310 | 55.0 | % | ||||||||||||
Proceeds from issuance of common stock | — | — | % | 1,010 | 9.5 | % | — | — | % | 449 | 2.4 | % | ||||||||||||||||
Available cash on hand | 968 | 5.9 | % | — | — | % | 499 | 1.5 | % | — | — | % | ||||||||||||||||
Common stock issued under DRIP | 6,368 | 38.7 | % | 4,529 | 42.8 | % | 12,950 | 39.7 | % | 7,974 | 42.6 | % | ||||||||||||||||
Total sources of distributions | $ | 16,452 | 100.0 | % | $ | 10,591 | 100.0 | % | $ | 32,653 | 100.0 | % | $ | 18,733 | 100.0 | % | ||||||||||||
Cash flows provided by operations (GAAP) | $ | 9,116 | $ | 5,052 | $ | 19,204 | $ | 10,310 | ||||||||||||||||||||
Net income (GAAP) | $ | 8,860 | $ | 4,303 | $ | 18,280 | $ | 8,935 | ||||||||||||||||||||
36
The following table compares cumulative distributions paid to cumulative net income (in accordance with GAAP) for the period from November 15, 2012 (date of inception) through June 30, 2016 (in thousands):
For the Period from November 15, 2012 (date of inception) to June 30, 2016 | ||||
Distributions paid: | ||||
Common stockholders in cash | $ | 54,530 | ||
Common stockholders pursuant to DRIP / offering proceeds | 38,327 | |||
Total distributions paid | $ | 92,857 | ||
Reconciliation of net income: | ||||
Net interest income | $ | 91,490 | ||
Gain on sale | 112 | |||
Acquisition fees | (12,682 | ) | ||
Other operating expenses | (30,206 | ) | ||
Net income | $ | 48,714 | ||
Cash flows provided by operations | $ | 48,098 | ||
Cash Flows
Cash Flows for the Six Months Ended June 30, 2016
Net cash provided by operating activities for the six months ended June 30, 2016 was $19.2 million. Cash inflows were primarily driven by net income of $18.3 million.
Net cash used in investing activities for the six months ended June 30, 2016 was $0.6 million. Cash outflows were driven by additional funding of $25.2 million on existing loans, partially offset by principal repayments of $24.6 million.
Net cash provided by financing activities for the six months ended June 30, 2016 was $30.2 million. Cash inflows were primarily driven by $55.8 million from net borrowings on the JPM Repo Facility and $2.1 million from net borrowings on our CMBS MRAs which were partially offset by the payment of $19.7 million in cash distributions paid to stockholders and $6 million of stock redemptions.
Cash Flows for the Six Months Ended June 30, 2015
Net cash provided by operating activities for the six months ended June 30, 2015 was $10.3 million. Cash inflows were primarily driven by an increase in net interest income to $17.6 million, but were partially offset by cash outflows mainly for acquisition fees of $4.2 million.
Net cash used in investing activities for the six months ended June 30, 2015 was $386.4 million. Cash outflows were primarily driven by originations and acquisitions with $378.8 million and $43.3 million representing our investment in 24 new loans and four new CMBS position, respectively.
Net cash provided by financing activities for the six months ended June 30, 2015 was $381.2 million. Cash inflows were primarily driven by the $214.4 million from the issuance of common stock, $172.7 million from net borrowings on the JPM Repo Facility and the Barclays Repo Facility and $31.2 million from net borrowings on our CMBS MRAs which were partially offset by the payment of $24.7 million of offering costs.
Related Party Arrangements
Realty Finance Advisors, LLC
Subject to certain restrictions and limitations, our Advisor is responsible for managing our affairs on a day-to-day basis and for identifying, originating, acquiring and asset managing investments on our behalf. For such services, to the extent permitted by law and regulations, our Advisor receives fees and reimbursements from us. Below is a description of the fees and reimbursements incurred to our Advisor.
Organization and Offering Expenses
Our Advisor is entitled to receive reimbursement for organization and offering expenses, which may include reimbursements to our Advisor for other organization and offering expenses it incurs for due diligence fees included in detailed and itemized invoices. We are obligated to reimburse our Advisor for organization and offering costs to the extent the organization and offering expenses do not exceed 2.0% of gross proceeds from the Offering. We shall not reimburse our Advisor for any organization and offering costs that our independent directors determine are not fair and commercially reasonable to us.
Operating Costs
We will reimburse our Advisor’s costs of providing administrative services. We will not reimburse the Advisor for personnel costs in connection with services for which the Advisor receives acquisition fees or disposition fees. The Advisor must pay any expenses in which our operating expenses as defined by North American Securities Administrators Association at the end of the four preceding fiscal quarters exceeds the greater of (i) 2.0% of average invested assets or (ii) 25.0% of net income other than any additions to reserves for depreciation, bad debt or other similar non-cash reserves and excluding any gain from the sale of assets for that period, unless a majority of our independent directors determine the excess expenses were justified based on unusual and nonrecurring factors.
Asset Management Fee
Our Advisor, or its affiliates, receives an annual asset management fee equal to 0.75% of the cost of our assets. Commencing on the NAV pricing date, the asset management fee is based on the lower of 0.75% of the cost of our assets and 0.75% of the fair value of our assets (fair value will consist of the market value of each portfolio investment as determined in accordance with our valuation guidelines). This fee will be paid monthly in arrears, based on assets held by us during the measurement period adjusted for the appropriate closing dates for individual investments. Prior to June 17, 2015, the amount of the asset management fee was reduced to the extent that FFO, as adjusted, during the six month period ending on the last day of the calendar quarter immediately preceding the date such asset management fee was payable, was less than distributions declared during the same period. For purposes of this determination, FFO, as adjusted, is FFO adjusted to (i) include acquisition fees and acquisition expenses; (ii) include non-cash restricted stock grant amortization, if any; and (iii) include impairments and loan loss reserves on investments, if any (including commercial mortgage loans and other debt investments). FFO, as adjusted, is not the same as FFO.
Acquisition Fee
Our Advisor, or its affiliates, receives an acquisition fee equal to 1.0% of the contract purchase price paid for our commercial real estate debt or other commercial real estate investments and 1.0% of the anticipated net equity funded by the us to acquire real estate securities.
Acquisition Expense
Our Advisor, or its affiliates, may receive reimbursements for acquisition expenses incurred including personnel costs related to selecting, evaluating, originating and acquiring investments on our behalf and we may incur third party acquisition expenses. We reimburse the Advisor, or its affiliates, up to 0.5% of the principal amount funded by us to originate or acquire commercial mortgage loans and up to 0.5% of the anticipated net equity funded by us to acquire real estate securities investments. In no event will the total of all acquisition fees and acquisition expenses exceed 4.5% of the principal amount funded with respect to our total portfolio including subsequent fundings to investments in our portfolio.
Asset Disposition Fee
For substantial assistance in connection with the sale of investments, as determined by our board of directors, we will pay our Advisor, or its affiliates, a disposition fee of 1.0% of the contract sales price of each commercial mortgage loan or other investment sold, including real estate securities or collateralized debt obligations issued by our subsidiary as part of a securitization transaction. We will not be obligated to pay a disposition fee upon the maturity, prepayment, workout, modification or extension of commercial real estate debt unless there is a corresponding fee paid by the borrower, in which case the disposition fee will be the lesser of (i) 1.0% of the principal amount of the debt prior to such transaction; or (ii) the amount of the fee paid by the borrower in connection with such transaction. If we take ownership of a property as a result of a workout or foreclosure of a loan, we will pay a disposition fee upon the sale of such property.
37
Annual Subordinated Performance Fee
We pay the Advisor an annual subordinated performance fee calculated on the basis of our total return to stockholders, payable monthly in arrears, such that for any year in which our total return on stockholders’ capital exceeds 6.0% per annum, the Advisor will be entitled to 15.0% of the excess total return; provided that in no event will the annual subordinated performance fee payable to the Advisor exceed 10.0% of the aggregate total return for such year. This fee will be payable only upon the sale of assets, distributions or other events which result in our return on stockholders’ capital exceeding 6.0% per annum.
Convertible Stock
We have issued 1,000 convertible shares to the Advisor, which will automatically convert to shares of our common stock upon the occurrence of the first to occur of the Triggering Events. In general, but with certain exceptions as outlined in the articles supplementary, each convertible share will convert into a number of common shares equal to 1/1000 of the quotient of (a) the conversion product (the product of 0.15 times the amount, if any, by which (i) the sum of the enterprise value as of the date of the Triggering Event plus total distributions paid to the our stockholders through the date of the Triggering Event exceeds (ii) the sum of our stockholders’ invested capital plus a 6.0% return as of the date of the Triggering Event) divided by (b) the quotient of the enterprise value divided by the number of shares of our common stock outstanding (on an as-converted basis) on the date of the Triggering Event. The conversion product will be reduced by the amounts payable pursuant to the annual subordinated performance fee as realized appreciation in our assets during the time that the Advisor or one of its affiliates acts as our advisor.
Realty Capital Securities, LLC and its Affiliates
Selling Commissions and Former Dealer Manager Fees
Prior to the termination of the Former Dealer Manager, we paid our Former Dealer Manager selling commissions of up to 7.0% of the per share purchase price of shares in our Offering, all of which were reallowed to soliciting dealers. In addition, we paid our Former Dealer Manager a fee of 3.0% of the per share purchase price of shares in our Offering, a portion of which could be reallowed to soliciting dealers. Alternatively, a soliciting dealer could have elected to receive a selling commission equal to 7.5% of the gross proceeds from the sale of shares made by such soliciting dealer, with 2.5% thereof paid at the time of such sale and 1.0% thereof paid on each anniversary of such sale up to and including the fifth anniversary of the closing of such sale.
No selling commissions or Former Dealer Manager fees are paid for sales under our DRIP.
Additional Fees Incurred to the Sponsor and its Affiliates
The predecessor to AR Global is a party to a services agreement with RCS Advisory Services, LLC, ("RCS Advisory") a subsidiary of the parent company of the Former Dealer Manager, pursuant to which RCS Advisory and its affiliates provided us and certain other companies sponsored by AR Global with services (including, without limitation, transaction management, compliance, due diligence, event coordination and marketing services, financial research, strategic advisory services, investment banking services, critical thinking and analytical resources, among others) on a time and expenses incurred basis or at a flat rate based on services performed. The predecessor to AR Global instructed RCS Advisory to stop providing such services in November 2015 and no services have since been provided by RCS Advisory.
We were also party to a transfer agency agreement with American National Stock Transfer, LLC, a subsidiary of the parent company of the Former Dealer Manager (“ANST”), pursuant to which ANST provided us with transfer agency services (including broker and stockholder servicing, transaction processing, year-end IRS reporting and other services), and supervisory services overseeing the transfer agency services performed by a third-party transfer agent. AR Global received written notice from ANST on February 10, 2016 that it would wind down operations by the end of the month and would withdraw as the transfer agent effective February 29, 2016. On February 26, 2016, we entered into a definitive agreement with DST Systems, Inc., a third-party and its previous provider of sub-transfer agency services, to provide us directly with transfer agency services (including broker and stockholder servicing, transaction processing, yearend IRS reporting and other services). See Note 9 - Related Party Transactions and Arrangements to our consolidated financial statements included in this Annual Report on Form 10-K and Item 13. Certain Relationships and Related Transactions, and Director Independence for a discussion of the various related party transactions, agreements and fees.
38
Total Costs Incurred Due to Related Party Arrangements
The table below shows the costs incurred due to related party arrangements during the three and six months ended June 30, 2016 and 2015 and the associated payable as of June 30, 2016 and December 31, 2015 (in thousands). See Note 9 - Related Party Transactions and Arrangements for further detail.
Three Months Ended June 30, | Six Months Ended June 30, | Payable as of | ||||||||||||||||||||||
2016 | 2015 | 2016 | 2015 | June 30, 2016 | December 31, 2015 | |||||||||||||||||||
Total commissions and fees incurred from the Former Dealer Manager in connection with the offering | $ | — | $ | 11,521 | $ | — | $ | 20,768 | $ | — | $ | — | ||||||||||||
Total compensation and reimbursement for services provided by the Advisor, its affiliates, entities under common control with the Advisor and the Former Dealer Manager | — | 1,886 | — | 3,848 | 480 | 480 | ||||||||||||||||||
Acquisition fees and expenses(1) | 223 | 4,423 | 380 | 6,204 | — | 55 | ||||||||||||||||||
Administrative services expenses(2) | 539 | — | 1,355 | — | (42 | ) | ||||||||||||||||||
Advisory and investment banking fee | — | 14 | 6 | 28 | — | — | ||||||||||||||||||
Asset management and subordinated performance fee | 3,015 | 974 | 6,025 | 1,336 | 3,576 | 3,792 | ||||||||||||||||||
Other related party expenses | 24 | — | 50 | — | 35 | — | ||||||||||||||||||
Total | $ | 3,801 | $ | 18,818 | $ | 7,816 | $ | 32,184 | $ | 4,049 | $ | 4,327 | ||||||||||||
________________________
1 Includes amortization of capitalized acquisition fees and expenses.
2 The ($42) represents a refund owed to the Company by the Advisor due to overpayment of administrative services expense.
The payables as of June 30, 2016 and December 31, 2015 in the table above are included in Due to affiliates on our consolidated balance sheets.
Off Balance Sheet Arrangements
We have no off balance sheet arrangements as of June 30, 2016 and through the date of the filing of this Form 10-Q.
Non-GAAP Financial Measures
Funds from Operations and Modified Funds from Operations
Due to certain unique operating characteristics of real estate companies, as discussed below, the National Association of Real Estate Investment Trusts ("NAREIT") and the Investment Program Association ("IPA") industry trade groups, have each promulgated measures respectively known as funds from operations ("FFO") and modified funds from operations ("MFFO"), which we believe to be appropriate supplemental measures to reflect the operating performance of a REIT. The use of FFO and MFFO is recommended by the REIT industry as supplemental performance measures. FFO and MFFO are not equivalents to our net income or loss as determined under generally accepted accounting principles ("GAAP").
We define FFO, a non-GAAP measure, consistent with the standards established by the White Paper on FFO approved by the Board of Governors of NAREIT, as revised in February 2004 (the "White Paper"). The White Paper defines FFO as net income or loss computed in accordance with GAAP, excluding gains or losses from sales of depreciable property, property and asset impairment write-downs, depreciation and amortization, and after adjustments for unconsolidated partnerships and joint ventures. Adjustments for unconsolidated partnerships and joint ventures are calculated to reflect FFO. Our business plan is to operate as a mortgage REIT with our portfolio consisting of commercial mortgage loan investments and investments in real estate securities. We will typically have no FFO adjustments to our net income or loss computed in accordance with GAAP as a result of operating as a mortgage REIT. Although we have the ability to acquire real property, we have not acquired any at this time and as such have not had any FFO adjustments to our net income or loss computed in accordance with GAAP.
Publicly registered, non-listed REITs typically operate differently from exchange traded REITs because they generally have a limited life followed by a liquidity event or other targeted exit strategy. Non-listed REITs typically have a significant amount of acquisition activity and are substantially more dynamic during their initial years of investment and operation as compared to later years when the proceeds from their continuous public offering have been fully invested and when we are seeking to implement a liquidity event or other exit strategy. However, it is likely that we will make investments past the acquisition stage, albeit at a substantially lower level.
39
The origination and acquisition of debt investments is a key operating feature of our business plan that results in the generation of income and cash flows in order to make distributions to stockholders. Acquisition fees paid to our Advisor and acquisition expenses reimbursed to our Advisor in connection with the origination and acquisition of debt investments are evaluated in accordance with GAAP to determine if they should be expensed in the period incurred or capitalized and amortized over the life of the investment. Acquisition fees and acquisition expenses that are deemed to be expensed in the period incurred are included in the computation of net income or loss from operations. The amortization of acquisition fees and acquisition expenses that are able to be capitalized are included in the computation of net income or loss from operations. All such acquisition fees and acquisition expenses are paid in cash when incurred that would otherwise be available to distribute to our stockholders. When proceeds from the Offering have not been sufficient to fund the payment of acquisition fees and the reimbursement of acquisition expenses to our Advisor, such fees and expenses have been paid from other sources, including financings, operating cash flow, net proceeds from the sale of investments or from other cash flows. We believe that acquisition fees and acquisition expenses incurred by us negatively impact our operating performance during the period in which such investments are originated or acquired by reducing cash flows and therefore the potential distributions to stockholders. However, we only add back acquisition fees and acquisition expenses reflected in net income or loss from operations in the current period.
We define MFFO, a non-GAAP measure, consistent with the IPA's Guideline 2010 - 01, Supplemental Performance Measure for Publicly Registered, Non-Listed REITs: Modified Funds from Operations (the "Practice Guideline") issued by the IPA in November 2010. We define MFFO as FFO further adjusted for the following items, as applicable: acquisition fees; accretion of discounts and amortization of premiums and other loan expenses on debt investments; fair value adjustments on real estate related investments such as commercial real estate securities or derivative investments included in net income; impairments of real estate related investments, gains or losses included in net income from the extinguishment or sale of debt, hedges, foreign exchange, derivatives or securities holdings where trading of such holdings is not a fundamental attribute of the business plan, unrealized gains or losses from fair value adjustments on real estate securities, including commercial mortgage backed securities and other securities, interest rate swaps and other derivatives not deemed to be hedges and foreign exchanges holdings; unrealized gains or losses resulting from consolidation from, or deconsolidation to, equity accounting, and after adjustments for consolidated and unconsolidated partnerships and joint ventures, with such adjustments calculated to reflect MFFO on the same basis. The accretion of discounts and amortization of premiums and other loan expenses on debt investments, gains and losses on hedges, foreign exchange, derivatives or securities holdings, unrealized gains and losses resulting from consolidations, as well as other listed cash flow adjustments are adjustments made to net income in calculating the cash flows provided by operating activities and, in some cases, reflect gains or losses which are unrealized and may not ultimately be realized. While we will be responsible for managing interest rate, hedge and foreign exchange risk, we expect to retain an outside consultant to review all our hedging agreements. Inasmuch as interest rate hedges are not a fundamental part of our operations, we believe it is appropriate to exclude such gains and losses in calculating MFFO, as such gains and losses are not reflective of our core operations.
Our MFFO calculation excludes impairments of real estate related investments, including loans. We assess the credit quality of our investments and adequacy of loan loss reserves on a quarterly basis, or more frequently as necessary. For loans classified as held-for-investment, we establish and maintain a general allowance for loan losses inherent in our portfolio at the reporting date and, where appropriate, a specific allowance for loan losses for loans we have determined to be impaired at the reporting date. An individual loan is considered impaired when it is deemed probable that we will not be able to collect all amounts due according to the contractual terms of the loan. Real estate related securities are evaluated for other-than-temporary impairment when the fair value of a security falls below its net amortized cost. Significant judgment is required in this analysis. We consider the estimated net recoverable value of the loan or security as well as other factors, including but not limited to the fair value of any collateral, the amount and the status of any senior debt, the prospects for the borrower and the competitive situation of the region where the borrower does business. Fair value is typically estimated based upon discounting the expected future cash flows of the underlying collateral taking into consideration the discount rate, capitalization rate, occupancy, creditworthiness of major tenants and many other factors. This requires significant judgment and because it is based upon projections of future economic events, which are inherently subjective, the amounts ultimately realized may differ materially from the carrying value as of the balance sheet date. If upon completion of the assessment, the estimated fair value of the underlying collateral is less than the net carrying value of the loan, a specific allowance for loan losses is recorded. In the case of real estate securities, all or a portion of a deemed impairment may be recorded. Due to our limited life, any allowance for loan losses or impairment of real estate securities recorded may be difficult to recover.
MFFO is a metric used by management to evaluate our performance against other non-listed REITs which have limited lives with short and defined acquisition periods and targeted exit strategies shortly thereafter and is not intended to be used as a liquidity measure. Although management uses the MFFO metric to evaluate future operating performance, this metric excludes certain key operating items and other adjustments that may affect our overall operating performance. MFFO is not equivalent to net income or loss as determined under GAAP. We believe that our use of MFFO and the adjustments used to calculate it allow us to present our performance in a manner that reflects certain characteristics that are unique to non-listed REITs, such as their
40
limited life, limited and defined acquisition period and targeted exit strategy, and hence that the use of such measures is useful to investors.
We believe that FFO provides useful context for understanding MFFO, and we believe that MFFO is a useful non-GAAP measure for non-listed REITs. It is helpful to management and stockholders in assessing our future operating performance once our organization and offering and acquisition and development stages are complete, because it eliminates from net income non-cash fair value adjustments on our real estate securities and acquisition fees and acquisition expenses that are incurred as part of our investment activities. However, MFFO may not be a useful measure of our operating performance or as a comparable measure to other typical non-listed REITs if we do not continue to operate in a similar manner to other non-listed REITs, including if we were to extend our acquisition and development stage or if we determined not to pursue an exit strategy.
However, MFFO does have certain limitations. For instance, the effect of any amortization or accretion on investments originated or acquired at a premium or discount, respectively, is not reported in MFFO. In addition, realized gains or losses from acquisitions and dispositions and other adjustments listed above are not reported in MFFO, even though such realized gains or losses and other adjustments could affect our operating performance and cash available for distribution. Stockholders should note that any cash gains generated from the sale of investments would generally be used to fund new investments. Any mark-to-market or fair value adjustments may be based on many factors, including current operational or individual property issues or general market or overall industry conditions.
Neither FFO nor MFFO is equivalent to net income or loss or cash flow provided by operating activities determined in accordance with GAAP and should not be construed to be more relevant or accurate than the GAAP methodology in evaluating our operating performance. Neither FFO nor MFFO is necessarily indicative of cash flow available to fund our cash needs including our ability to make distributions to our stockholders. FFO and MFFO do not represent amounts available for management’s discretionary use because of needed capital replacement or expansion, debt service obligations or other commitments or uncertainties. Furthermore, neither FFO nor MFFO should be considered as an alternative to net income or loss as an indicator of our operating performance.
Neither the SEC, NAREIT nor any other regulatory body has passed judgment on the acceptability of the adjustments that we use to calculate FFO or MFFO. In the future, the SEC, NAREIT or another regulatory body may decide to standardize the allowable adjustments across the non-listed REIT industry and we would have to adjust our calculation and characterization of FFO or MFFO.
The table below reflects the items deducted or added to net income or loss in our calculation of FFO and MFFO for the three and six months ended June 30, 2016 and 2015 (in thousands):
Three Months Ended June 30, | Six Months Ended June 30, | |||||||||||||||
2016 | 2015 | 2016 | 2015 | |||||||||||||
Funds From Operations: | ||||||||||||||||
Net income | $ | 8,860 | $ | 4,303 | $ | 18,280 | $ | 8,935 | ||||||||
Funds from operations | $ | 8,860 | $ | 4,303 | $ | 18,280 | $ | 8,935 | ||||||||
Modified Funds From Operations: | ||||||||||||||||
Funds from operations | $ | 8,860 | $ | 4,303 | $ | 18,280 | $ | 8,935 | ||||||||
Amortization of premiums, discounts and fees on investments, net | (568 | ) | (319 | ) | (1,143 | ) | (508 | ) | ||||||||
Acquisition fees | 223 | 3,149 | 380 | 4,181 | ||||||||||||
Loan loss provision | 669 | 80 | 834 | 224 | ||||||||||||
Modified funds from operations | $ | 9,184 | $ | 7,213 | $ | 18,351 | $ | 12,832 | ||||||||
Item 3. Quantitative and Qualitative Disclosures about Market Risk.
Our market risk arises primarily from interest rate risk relating to interest rate fluctuations. Many factors, including governmental monetary and tax policies, domestic and international economic and political considerations and other factors that are beyond our control contribute to interest rate risk. To meet our short and long-term liquidity requirements, we may borrow funds at fixed and variable rates. Our interest rate risk management objectives are to limit the impact of interest rate changes in earnings and cash flows and to lower our overall borrowing costs. To achieve these objectives, from time to time, we may enter into interest rate hedge contracts such as swaps, collars and treasury lock agreements in order to mitigate our interest rate risk with respect to various debt instruments. While hedging activities may insulate us against adverse changes in interest rates, they may also limit our ability to participate in benefits of lower interest rates with respect to our portfolio of investments with fixed interest rates. During the periods covered by this report, we did not engage in interest rate hedging activities. We do not hold or issue these derivative contracts for trading or speculative purposes. We do not have any foreign denominated investments, and thus, we are not exposed to foreign currency fluctuations.
As of June 30, 2016 and December 31, 2015, our portfolio included 75 and 77 variable rate investments, respectively, based on LIBOR for various terms. Borrowings under our repurchase agreements are also based on LIBOR. The following table quantifies the potential changes in interest income net of interest expense should interest rates increase by 50 or 100 basis
41
points or decrease by 25 basis points, assuming that our current balance sheet was to remain constant and no actions were taken to alter our existing interest rate sensitivity:
Estimated Percentage Change in Interest Income Net of Interest Expense | ||||||
Change in Interest Rates | June 30, 2016 | December 31, 2015 | ||||
(-) 25 Basis Points | (2.22 | )% | (2.38 | )% | ||
Base Interest Rate | — | % | — | % | ||
(+) 50 Basis Points | 4.44 | % | 4.81 | % | ||
(+) 100 Basis Points | 8.87 | % | 9.61 | % | ||
Item 4. Controls and Procedures.
Disclosure Controls and Procedures
In accordance with Rules 13a-15(b) and 15d-15(b) of the Securities Exchange Act of 1934, as amended (the "Exchange Act"), management, with the participation of our Chief Executive Officer and Chief Financial Officer, has evaluated the effectiveness of our disclosure controls and procedures (as defined in Rule 13a-15(e) and Rule 15d-15(e) of the Exchange Act) as of the end of the period covered by this Quarterly Report on Form 10-Q. Based on such evaluation, our Chief Executive Officer and Chief Financial Officer have concluded, as of the end of such period, that our disclosure controls and procedures are effective in recording, processing, summarizing and reporting, on a timely basis, information required to be disclosed by us in our reports that we file or submit under the Exchange Act.
Changes in Internal Controls Over Financial Reporting
During the three months ended June 30, 2016, there were no changes in our internal controls over financial reporting (as defined in Rule 13a-15(f) and 15(d)-15(f) of the Exchange Act) that have materially affected, or are reasonably likely to materially affect, our internal control over financial reporting.
42
PART II
Item 1. Legal Proceedings.
Neither we nor any of our subsidiaries are a party to any material, pending legal proceedings.
Item 1A. Risk Factors.
Our potential risks and uncertainties are presented in the section entitled "Risk Factors" contained in the Annual Report on Form 10-K for the year ended December 31, 2015. There have been no material changes from these risk factors.
Item 2. Unregistered Sales of Equity Securities and Use of Proceeds.
We did not sell any equity securities that were not registered under the Securities Act during the three months ended June 30, 2016.
Our Board unanimously approved an amended and restated share repurchase program (the “SRP”), which became effective on February 28, 2016. The SRP enables stockholders to sell their shares to us. Subject to certain conditions, stockholders that purchased shares of our common stock or received their shares from us (directly or indirectly) through one or more non-cash transactions and have held their shares for a period of at least one year may request that we repurchase their shares of common stock so long as the repurchase otherwise complies with the provisions of Maryland law. Repurchase requests made following the death or qualifying disability of a stockholder will not be subject to any minimum holding period.
The repurchase price per share for requests other than for death or disability will be equal to the most-recent estimated net asset value per share of our common stock calculated by our Advisor and approved by our board of directors in accordance with our valuation guidelines, or estimated per-share NAV, multiplied by a percentage equal to (i) 92.5%, if the person seeking repurchase has held his or her shares for a period greater than one year and less than two years; (ii) 95%, if the person seeking repurchase has held his or her shares for a period greater than two years and less than three years; (iii) 97.5%, if the person seeking repurchase has held his or her shares for a period greater than three years and less than four years; or (iv) 100%, if the person seeking repurchase has held his or her shares for a period greater than four years. In the case of requests for death or disability, the repurchase price per share will be equal to the estimated per-share NAV at the time of repurchase.
Repurchases pursuant to the SRP, when requested, generally will be made semiannually (each six-month period ending June 30 or December 31, a “fiscal semester”). Repurchases for any fiscal semester will be limited to a maximum of 2.5% of the weighted average number of shares of common stock outstanding during the previous fiscal year, with a maximum for any fiscal year of 5.0% of the weighted average number of shares of common stock outstanding during the previous fiscal year. Funding for repurchases pursuant to the SRP for any given fiscal semester will be limited to proceeds received during that same fiscal semester through the issuance of common stock pursuant to any DRIP in effect from time to time, provided that the Board has the power, in its sole discretion, to determine the amount of shares repurchased during any fiscal semester as well as the amount of funds to be used for that purpose. Any repurchase requests received during such fiscal semester will be paid at a price based on our estimated per share NAV applicable on the last day of such fiscal semester, as described above. Due to these limitations, we cannot guarantee that we will be able to accommodate all repurchase requests made during any fiscal semester or fiscal year. However, a stockholder may withdraw its request at any time or ask that we honor the request when funds are available. Pending repurchase requests will be honored on a pro rata basis. We will generally pay repurchase proceeds, less any applicable tax or other withholding required by law, by the 31st day following the end of the fiscal semester during which the repurchase request was made.
Calculations of our estimated per-share NAV will occur periodically, at the discretion of the Board, provided that such calculations will be made at least annually. Following its calculation, our estimated per-share NAV will be disclosed in a periodic report. The most recent calculation of our estimated per-share NAV approved by the Board occurred on November 4, 2015 based on our net asset value as of September 30, 2015 and was equal to $25.27.
When a stockholder requests redemption and the redemption is approved, we will reclassify such obligation from equity to a liability based on the settlement value of the obligation. Shares repurchased under the SRP will have the status of authorized but unissued shares.
43
The following table reflects the number of shares repurchased under the SRP cumulatively through June 30, 2016:
Number of Requests | Number of Shares Repurchased (1) | Average Price per Share | ||||||||
Cumulative as of December 31, 2015 | 301 | 381,474 | $ | 23.72 | ||||||
January 1 - March 31, 2016 | — | — | — | |||||||
April 1 - June 30, 2016 | 668 | 536,240 | 24.08 | |||||||
Cumulative as of June 30, 2016 | 969 | 917,714 | $ | 23.93 | ||||||
________________________
1 As permitted under the SRP, in July 2016, our board of directors authorized, with respect to redemption requests received during the semi-annual period from January 1, 2016 to June 30, 2016, the repurchase of shares validly submitted for repurchase in an amount limited to the proceeds reinvested through our DRIP. As a result, redemption requests in the amount of 208,470 shares were not fulfilled.
Item 3. Defaults upon Senior Securities.
Not applicable.
Item 4. Mine Safety Disclosures.
Not applicable.
Item 5. Other Information.
On August 10, 2016, we entered into an indemnification agreement (the “Indemnification Agreement”) with Peter J. McDonough (the “Indemnitee”) in connection with Mr. McDonough’s appointment as an independent director of the Company’s board of directors. The Indemnification Agreement provides that we will indemnify the Indemnitee, to the fullest extent permitted by Maryland law and our charter and subject to the limitations set forth in the Indemnification Agreement, from and against all judgments, penalties, fines and amounts paid in settlement and expenses reasonably incurred by the Indemnitee that may result or arise in connection with the Indemnitee serving in his capacity as a present or former director, officer, employee or agent of us or as a director, trustee, officer, partner, manager, managing member, fiduciary, employee or agent of any other foreign or domestic corporation, partnership, limited liability company, joint venture, trust, employee benefit plan or other enterprise that such person is or was serving in such capacity at our request. The Indemnification Agreement further provides that, subject to the limitations set forth in the Indemnification Agreement, we will, without requiring a preliminary determination of the Indemnitee’s ultimate entitlement of indemnification under the Indemnification Agreement, advance all reasonable expenses to the Indemnitee incurred by or on behalf of the Indemnitee in connection with any proceeding the Indemnitee is or is threatened to be made a party to.
The Indemnification Agreement provides that the Indemnitee is entitled to indemnification unless it is established that (a) the act or omission of the Indemnitee was material to the matter giving rise to the proceeding and (i) was committed in bad faith or (ii) was the result of active and deliberate dishonesty, (b) the Indemnitee actually received an improper personal benefit in money, property or services or (c) in the case of any criminal proceeding, the Indemnitee had reasonable cause to believe that his conduct was unlawful. The Indemnification Agreement further limits the Indemnitee’s entitlement to indemnification in cases where (a) the proceeding was won by or in the right of us and the Indemnitee was adjudged to be liable to us, (b) the Indemnitee was adjudged to be liable on the basis that personal benefit was improperly received in any proceeding charging improper personal benefit to the Indemnitee or (c) the proceeding was brought by the Indemnitee, except in certain circumstances.
The Indemnification Agreement also provides that, except for a proceeding brought by the Indemnitee, we have the right to defend the Indemnitee in any proceeding which may give rise to indemnification under the Indemnification Agreement. The Indemnification Agreement grants the Indemnitee the right to separate counsel in certain proceedings involving separate defenses, counterclaims or other conflicts of interest and in proceedings in which we fail to assume the defense of the Indemnitee in a timely manner. The Indemnification Agreement further provides that we will use our reasonable best efforts to acquire directors and officers liability insurance covering the Indemnitee or any claim made against the Indemnitee by reason of his service to us.
The description of the Indemnification Agreement in this Quarterly Report on Form 10-Q is a summary and is qualified in its entirety by the terms of the Indemnification Agreement attached as Exhibit 10.2 to this Quarterly Report on Form 10-Q and incorporated herein by reference.
44
Item 6. Exhibits.
EXHIBITS INDEX
The following exhibits are included in this Quarterly Report on Form 10-Q for the quarter ended June 30, 2016 (and are numbered in accordance with Item 601 of Regulation S-K).
Exhibit No. | Description | |
10.2* | Indemnification Agreement, dated as of August 10, 2016, between the Company and Peter J. McDonough. | |
10.3* | Form of Restricted Stock Award Agreement. | |
31.1* | Certification of the Principal Executive Officer of the Company pursuant to Securities Exchange Act Rule 13a - 14(a) or 15(d) - 14(a), as adopted pursuant to Section 302 of the Sarbanes-Oxley Act of 2002. | |
31.2* | Certification of the Principal Financial Officer of the Company pursuant to Securities Exchange Act Rule 13a - 14(a) or 15(d) - 14(a), as adopted pursuant to Section 302 of the Sarbanes-Oxley Act of 2002. | |
32* | Written statements of the Principal Executive Officer and Principal Financial Officer of the Company pursuant to 18 U.S.C. Section 1350, as adopted pursuant to Section 906 of the Sarbanes-Oxley Act of 2002. | |
101* | XBRL (eXtensible Business Reporting Language). The following materials from Realty Finance Trust, Inc.’s Quarterly Report on Form 10-Q for the three months ended June 30, 2016, formatted in XBRL: (i) the consolidated Balance Sheets, (ii) the consolidated Statements of Operations, (iii) the consolidated Statements of Comprehensive Income, (iv) the consolidated Statement of Changes in Stockholders' Equity, (v) the consolidated Statements of Cash Flows and (vi) the Notes to the consolidated Financial Statements. | |
* Filed herewith.
45
REALTY FINANCE TRUST, INC.
SIGNATURES
Pursuant to the requirements of Section 13 or 15(d) of the Securities Exchange Act of 1934, the registrant has duly caused this report to be signed on its behalf by the undersigned, thereunto duly authorized.
REALTY FINANCE TRUST, INC. | |
Dated: August 12, 2016 | By: /s/ Peter M. Budko Name: Peter M. Budko Title: Chief Executive Officer and Interim President (Principal Executive Officer) |
Dated: August 12, 2016 | By: /s/ Nicholas Radesca Name: Nicholas Radesca Title: Chief Financial Officer, Secretary and Treasurer (Principal Financial Officer and Principal Accounting Officer) |
46