Attached files
| file | filename |
|---|---|
| EX-32 - EXHIBIT 32 - Benefit Street Partners Realty Trust, Inc. | bsprt2018q1-exhibit32.htm |
| EX-31.2 - EXHIBIT 31.2 - Benefit Street Partners Realty Trust, Inc. | bsprt2018q1-exhibit312.htm |
| EX-31.1 - EXHIBIT 31.1 - Benefit Street Partners Realty Trust, Inc. | bsprt2018q1-exhibit311.htm |
UNITED STATES
SECURITIES AND EXCHANGE COMMISSION
Washington, D.C. 20549
FORM 10-Q
(Mark One) | |
x | QUARTERLY REPORT PURSUANT TO SECTION 13 OR 15(D) OF THE SECURITIES EXCHANGE ACT OF 1934 |
For the quarterly period ended March 31, 2018
OR
¨ | TRANSITION REPORT PURSUANT TO SECTION 13 OR 15(D) OF THE SECURITIES EXCHANGE ACT OF 1934 |
Commission file number: 000-55188
BENEFIT STREET PARTNERS REALTY TRUST, INC.
(Exact name of registrant as specified in its charter)
Maryland | 46-1406086 | |
(State or Other Jurisdiction of Incorporation or Organization) | (I.R.S. Employer Identification No.) | |
9 West 57th Street, Suite #4920 New York, New York | 10019 | |
(Address of Principal Executive Office) | (Zip Code) | |
(212) 588-6770
(Registrant’s Telephone Number, Including Area Code)
(Former Name, Former Address and Former Fiscal Year, if Changed Since Last Report)
Indicate by check mark whether the registrant: (1) has filed all reports required to be filed by Section 13 or 15(d) of the Securities Exchange Act of 1934 during the preceding 12 months (or for such shorter period that the registrant was required to file such reports), and (2) has been subject to such filing requirements for the past 90 days. Yes x No o
Indicate by check mark whether the registrant has submitted electronically and posted on its corporate Web site, if any, every Interactive Data File required to be submitted and posted pursuant to Rule 405 of Regulation S-T (§232.405 of this chapter) during the preceding 12 months (or for such shorter period that the registrant was required to submit and post such files).Yes x No o
Indicate by check mark whether the registrant is a large accelerated filer, an accelerated filer, a non-accelerated filer, a smaller reporting company or an emerging growth company. See the definitions of "large accelerated filer," "accelerated filer," "smaller reporting company," and "emerging growth company" in Rule 12b-2 of the Exchange Act. (check one):
Large accelerated filer o | Accelerated filer o |
Non-accelerated filer (Do not check if a smaller reporting company) x | Smaller reporting company o |
Emerging growth filer o | |
If an emerging growth company, indicate by check mark if the registrant has elected not to use the extended transition period for complying with any new or revised financial accounting standards provided pursuant to Section 13(a) of the Exchange Act. o | |
Indicate by check mark whether the registrant is a shell company (as defined in Rule 12b-2 of the Exchange Act). Yes o No x
The number of shares of the registrant's common stock, $0.01 par value, outstanding as of April 30, 2018 was 31,709,387.
TABLE OF CONTENTS
Page | |
PART I | |
PART II | |
i
PART I
Item 1. Consolidated Financial Statements.
BENEFIT STREET PARTNERS REALTY TRUST, INC.
CONSOLIDATED BALANCE SHEETS
(Dollars in thousands, except for share and per share data)
March 31, 2018 | December 31, 2017 | ||||||
ASSETS | (Unaudited) | ||||||
Cash and cash equivalents | $ | 57,670 | $ | 83,711 | |||
Restricted cash | 10,151 | 7,997 | |||||
Commercial mortgage loans, held for investment, net of allowance of $1,548 and $1,466 | 1,627,851 | 1,402,046 | |||||
Commercial mortgage loans, held-for-sale, measured at fair value | 69,465 | 28,531 | |||||
Derivative instruments, at fair value | 821 | 132 | |||||
Receivable for loan repayment (1) | 48,454 | 49,085 | |||||
Accrued interest receivable | 8,925 | 8,152 | |||||
Prepaid expenses and other assets | 4,378 | 4,007 | |||||
Total assets | $ | 1,827,715 | $ | 1,583,661 | |||
LIABILITIES AND STOCKHOLDERS' EQUITY | |||||||
Collateralized loan obligations | $ | 690,765 | $ | 826,150 | |||
Repurchase agreements - commercial mortgage loans | 501,310 | 65,690 | |||||
Other financing - commercial mortgage loans | 20,573 | 25,698 | |||||
Repurchase agreements - real estate securities | — | 39,035 | |||||
Derivative instruments, at fair value | 515 | 357 | |||||
Interest payable | 2,251 | 1,544 | |||||
Distributions payable | 3,866 | 3,917 | |||||
Accounts payable and accrued expenses | 5,291 | 4,510 | |||||
Due to affiliates | 2,970 | 6,421 | |||||
Total liabilities | $ | 1,227,541 | $ | 973,322 | |||
Commitment and Contingencies (See Note 8) | |||||||
Preferred stock, $0.01 par value, 50,000,000 authorized, none issued and outstanding as of March 31, 2018 and December 31, 2017 | — | — | |||||
Common stock, $0.01 par value, 949,999,000 shares authorized, 31,600,114 and 31,834,072 shares issued and outstanding as of March 31, 2018 and December 31, 2017, respectively | 318 | 320 | |||||
Additional paid-in capital | 699,888 | 704,101 | |||||
Accumulated other comprehensive income (loss) | — | — | |||||
Accumulated deficit | (100,032 | ) | (94,082 | ) | |||
Total stockholders' equity | 600,174 | 610,339 | |||||
Total liabilities and stockholders' equity | $ | 1,827,715 | $ | 1,583,661 | |||
(1) Includes $20.2 million and $48.7 million of cash held by servicer related to CLO loan payoffs as of March 31, 2018 and December 31, 2017, respectively.
The accompanying notes are an integral part of these unaudited consolidated financial statements.
1
BENEFIT STREET PARTNERS REALTY TRUST, INC.
CONSOLIDATED STATEMENTS OF OPERATIONS
(Dollars in thousands, except for share and per share data)
(Unaudited)
Three Months Ended March 31, | |||||||
2018 | 2017 | ||||||
Interest income: | |||||||
Interest income | $ | 29,408 | $ | 18,879 | |||
Less: Interest expense | 18,674 | 5,428 | |||||
Net interest income | 10,734 | 13,451 | |||||
Expenses: | |||||||
Asset management and subordinated performance fee | 2,241 | 2,312 | |||||
Acquisition fees and acquisition expenses | 65 | 624 | |||||
Administrative services expenses | 3,196 | 855 | |||||
Professional fees | 2,226 | 767 | |||||
Other expenses | 1,325 | 606 | |||||
Total expenses | 9,053 | 5,164 | |||||
Other (income)/loss: | |||||||
Loan loss (recovery)/provision | 82 | 612 | |||||
Realized (gain)/loss on commercial mortgage loans held-for-sale | 28 | 247 | |||||
Realized (gain)/loss on commercial mortgage loans held-for-sale, measured at fair value | (2,304 | ) | — | ||||
Realized (gain)/loss on sale of real estate securities | — | 29 | |||||
Unrealized (gain)/loss on commercial mortgage loans held-for-sale | — | 1,350 | |||||
Unrealized (gain)/loss on commercial mortgage loans held-for-sale, measured at fair value | (635 | ) | — | ||||
Unrealized (gain)/loss on derivatives | 197 | — | |||||
Realized (gain)/loss on derivatives | (1,246 | ) | — | ||||
Total other (income)/loss | $ | (3,878 | ) | $ | 2,238 | ||
Income/(loss) before taxes | 5,559 | 6,049 | |||||
Provision for income tax | 263 | — | |||||
Net income | $ | 5,296 | $ | 6,049 | |||
Basic net income per share | $ | 0.17 | $ | 0.19 | |||
Diluted net income per share | $ | 0.17 | $ | 0.19 | |||
Basic weighted average shares outstanding | 31,670,518 | 31,740,256 | |||||
Diluted weighted average shares outstanding | 31,684,832 | 31,750,045 | |||||
The accompanying notes are an integral part of these unaudited consolidated financial statements.
2
BENEFIT STREET PARTNERS REALTY TRUST, INC.
CONSOLIDATED STATEMENTS OF COMPREHENSIVE INCOME
(Dollars in thousands)
(Unaudited)
Three Months Ended March 31, | |||||||
2018 | 2017 | ||||||
Net income | $ | 5,296 | $ | 6,049 | |||
Unrealized gain (loss) on available-for-sale securities | — | 1,388 | |||||
Comprehensive income attributable to Benefit Street Partners Realty Trust, Inc. | $ | 5,296 | $ | 7,437 | |||
The accompanying notes are an integral part of these unaudited consolidated financial statements.
3
BENEFIT STREET PARTNERS REALTY TRUST, INC.
CONSOLIDATED STATEMENT OF CHANGES IN STOCKHOLDERS' EQUITY
(Dollars in thousands, except for share data)
(Unaudited)
Common Stock | |||||||||||||||||||||||
Number of Shares | Par Value | Additional Paid-In Capital | Accumulated Other Comprehensive Income | Accumulated Deficit | Total Stockholders' Equity | ||||||||||||||||||
Balance, December 31, 2017 | 31,834,072 | $ | 320 | $ | 704,101 | $ | — | $ | (94,082 | ) | $ | 610,339 | |||||||||||
Common stock repurchases | (421,809 | ) | (4 | ) | (7,826 | ) | — | — | (7,830 | ) | |||||||||||||
Common stock issued through distribution reinvestment plan | 187,851 | 2 | 3,571 | — | — | 3,573 | |||||||||||||||||
Share-based compensation | — | — | 42 | — | — | 42 | |||||||||||||||||
Net income | — | — | — | — | 5,296 | 5,296 | |||||||||||||||||
Distributions declared | — | — | — | — | (11,246 | ) | (11,246 | ) | |||||||||||||||
Other comprehensive income | — | — | — | — | — | — | |||||||||||||||||
Balance, March 31, 2018 | 31,600,114 | $ | 318 | $ | 699,888 | $ | — | $ | (100,032 | ) | $ | 600,174 | |||||||||||
The accompanying notes are an integral part of these unaudited consolidated financial statements.
4
BENEFIT STREET PARTNERS REALTY TRUST, INC.
CONSOLIDATED STATEMENTS OF CASH FLOWS
(Dollars in thousands)
(Unaudited)
Three Months Ended March 31, | |||||||
2018 | 2017 | ||||||
Cash flows from operating activities: | |||||||
Net income | $ | 5,296 | $ | 6,049 | |||
Adjustments to reconcile net income to net cash provided by operating activities: | |||||||
Premium amortization and (discount accretion), net | (1,006 | ) | (634 | ) | |||
Accretion of deferred commitment fees | (346 | ) | (538 | ) | |||
Amortization of deferred financing costs | 7,966 | 694 | |||||
Share-based compensation | 42 | 15 | |||||
Change in unrealized losses on commercial mortgage loans held-for-sale | — | 1,597 | |||||
Change in unrealized losses on commercial mortgage loans held-for-sale, measured at fair value | (635 | ) | — | ||||
Change in unrealized losses on derivative instruments | 197 | — | |||||
Change in unrealized losses on real estate securities | — | 29 | |||||
Loan loss (recovery)/provision | 82 | 612 | |||||
Origination of commercial mortgage loans, held-for-sale | (123,522 | ) | — | ||||
Proceeds from sale of commercial mortgage loans, held-for-sale | 83,050 | 11,790 | |||||
Changes in assets and liabilities: | |||||||
Accrued interest receivable | (427 | ) | 688 | ||||
Prepaid expenses and other assets | (1,617 | ) | (41 | ) | |||
Accounts payable and accrued expenses | 781 | 291 | |||||
Due to affiliates | (3,451 | ) | (323 | ) | |||
Interest payable | 707 | 100 | |||||
Net cash (used in)/provided by operating activities | $ | (32,883 | ) | $ | 20,329 | ||
Cash flows from investing activities: | |||||||
Origination and purchase of commercial mortgage loans, held for investment | $ | (374,657 | ) | $ | (93,884 | ) | |
Receivable for loan repayment | 631 | — | |||||
Proceeds from sale of real estate securities | — | 24,681 | |||||
Purchase of derivative instruments | (520 | ) | — | ||||
Principal repayments received on commercial mortgage loans, held for investment | 149,711 | 80,079 | |||||
Net cash (used in)/provided by investing activities | $ | (224,835 | ) | $ | 10,876 | ||
Cash flows from financing activities: | |||||||
Common stock repurchases | $ | (7,830 | ) | $ | (9,459 | ) | |
Repayments of collateralized loan obligations | (141,950 | ) | (49,456 | ) | |||
Borrowings on repurchase agreements - commercial mortgage loans | $ | 681,559 | 89,085 | ||||
Repayments of repurchase agreements - commercial mortgage loans | (245,940 | ) | (5,801 | ) | |||
Borrowings on repurchase agreements - real estate securities | 39,146 | 196,503 | |||||
Repayments of repurchase agreements - real estate securities | (78,181 | ) | (210,968 | ) | |||
Repayments on other financing - commercial mortgage loans | (5,273 | ) | — | ||||
Payments of deferred financing costs | — | (334 | ) | ||||
Distributions paid | (7,700 | ) | (10,365 | ) | |||
Net cash (used in)/provided by financing activities | $ | 233,831 | $ | (795 | ) | ||
Net change in cash, cash equivalents and restricted cash | $ | (23,887 | ) | $ | 30,410 | ||
Cash, cash equivalents and restricted cash beginning of period | 91,708 | 123,069 | |||||
Cash, cash equivalents and restricted cash, end of period | $ | 67,821 | $ | 153,479 | |||
5
BENEFIT STREET PARTNERS REALTY TRUST, INC.
CONSOLIDATED STATEMENTS OF CASH FLOWS (Continued)
(Dollars in thousands)
(Unaudited)
Three Months Ended March 31, | |||||||
2018 | 2017 | ||||||
Supplemental disclosures of cash flow information: | |||||||
Interest paid | $ | 10,001 | $ | 4,634 | |||
Supplemental disclosures of non-cash flow information: | |||||||
Distributions payable | $ | 3,866 | $ | 5,562 | |||
Common stock issued through distribution reinvestment plan | 3,573 | 5,734 | |||||
Loans transferred to commercial real estate loans, held-for-sale, transferred at fair value | — | 45,513 | |||||
Reconciliation of cash, cash equivalents and restricted cash at end of period: | |||||||
Cash and cash equivalents | 57,670 | 148,372 | |||||
Restricted cash | 10,151 | 5,107 | |||||
Cash, cash equivalents and restricted cash, end of period | $ | 67,821 | $ | 153,479 | |||
The accompanying notes are an integral part of these unaudited consolidated financial statements.
6
BENEFIT STREET PARTNERS REALTY TRUST, INC.
NOTES TO CONSOLIDATED FINANCIAL STATEMENTS
March 31, 2018
(Unaudited)
Note 1 - Organization and Business Operations
Benefit Street Partners Realty Trust, Inc. (the "Company"), formerly known as Realty Finance Trust, Inc., is a real estate finance company that primarily originates, acquires and manages a diversified portfolio of commercial real estate debt investments secured by properties located within and outside the United States. The Company was incorporated in Maryland on November 15, 2012 and commenced operations on May 14, 2013.
The Company made a tax election to be treated as a real estate investment trust (a "REIT") for U.S. federal income tax purposes commencing with its taxable year ended December 31, 2013. The Company believes that it has qualified as a REIT and intends to continue to meet the requirements for qualification and taxation as a REIT. The Company, through a subsidiary which is treated as a taxable REIT subsidiary (a "TRS") is indirectly subject to U.S federal, state and local income taxes. The majority of the Company's business is conducted through Benefit Street Partners Realty Operating Partnership, L.P. (the “OP”), a Delaware limited partnership. The Company is the sole general partner and directly or indirectly holds all of the units of limited partner interests in the OP.
The Company has no direct employees. Benefit Street Partners L.L.C. serves as the Company's advisor (the "Advisor") pursuant to an Advisory Agreement executed on September 29, 2016 (the “Advisory Agreement”), as amended and restated by the Amended and Restated Advisory Agreement executed on January 19, 2018 (the "Amended and Restated Advisory Agreement"). The Advisor, an investment adviser registered with the U.S. Securities and Exchange Commission (“SEC”), is a credit-focused alternative asset management firm. Established in 2008, the Advisor's credit platform manages funds for institutions and high-net-worth investors across various credit funds and complementary strategies including high yield, levered loans, private / opportunistic debt, liquid credit, structured credit and commercial real estate debt. These strategies complement each other as they all leverage the sourcing, analytical, compliance, and operational capabilities that encompass the platform. The Advisor manages the Company's affairs on a day-to-day basis. The Advisor receives compensation and fees for services related to the investment and management of the Company's assets and the operations of the Company. Prior to September 29, 2016, Realty Finance Advisor, LLC ("Former Advisor") was the Company's advisor.
The Company invests in commercial real estate debt investments, which may include first mortgage loans, subordinated mortgage loans, mezzanine loans and participations in such loans. The Company also originates conduit loans which the Company intends to sell through its TRS into commercial mortgage-backed securities ("CMBS") at a profit.
The Company may also invest in commercial real estate securities. Real estate securities may include CMBS, senior unsecured debt of publicly traded REITs, debt or equity securities of other publicly traded real estate companies and collateralized debt obligations ("CDOs").
Note 2 - Summary of Significant Accounting Policies
The accompanying consolidated financial statements and related footnotes are unaudited and have been prepared on the accrual basis of accounting in conformity with accounting principles generally accepted in the United States of America (“GAAP”) for interim financial statements and pursuant to the requirements for reporting on Form 10-Q and Regulation S-X, as appropriate. Accordingly, the consolidated financial statements may not include all of the information and notes required by GAAP for annual consolidated financial statements. GAAP requires management to make estimates and assumptions that affect the reported amount of assets and liabilities as of the date of the financial statements and the reported amounts of income and expenses during the reported periods. Changes in the economic environment, financial markets and any other parameters used in determining these estimates could cause actual results to differ materially. In the opinion of management, the interim data includes all adjustments, of a normal and recurring nature, necessary for a fair statement of the results for the periods presented. The current period’s results of operations will not necessarily be indicative of results that ultimately may be achieved for the entire year or any subsequent interim periods.
Certain prior-period amounts have been reclassified to conform with current presentation. In the opinion of management, all normal recurring adjustments considered necessary for a fair statement of the results of the periods presented have been included. The current period’s results of operations will not necessarily be indicative of results in any subsequent reporting period.
These financial statements should be read in conjunction with the audited consolidated financial statements and notes thereto as of, and for the year ended December 31, 2017, which are included in the Company's Annual Report on Form 10-K filed with the SEC on March 16, 2018. There have been no significant changes to the Company's significant accounting policies during the three months ended March 31, 2018.
7
BENEFIT STREET PARTNERS REALTY TRUST, INC.
NOTES TO CONSOLIDATED FINANCIAL STATEMENTS
March 31, 2018
(Unaudited)
Principles of Consolidation
The accompanying consolidated financial statements include the accounts of the Company, the OP and its subsidiaries. All intercompany accounts and transactions have been eliminated in consolidation. In determining whether the Company has a controlling financial interest in a joint venture and the requirement to consolidate the accounts of that entity, management considers factors such as ownership interest, authority to make decisions and contractual and substantive participating rights of the other partners or members, as well as whether the entity is a variable interest entity ("VIE") for which the Company is the primary beneficiary.
The Company has determined the OP is a VIE of which the Company is the primary beneficiary. Substantially all of the Company's assets and liabilities are held by the OP.
The Company consolidates all entities that it controls through either majority ownership or voting rights. In addition, the Company consolidates all VIEs of which the Company is considered the primary beneficiary. VIEs are entities in which equity investors (i) do not have the characteristics of a controlling financial interest and/or (ii) do not have sufficient equity at risk for the entity to finance its activities without additional subordinated financial support from other parties. The entity that consolidates a VIE is its primary beneficiary and is generally the entity with (i) the power to direct the activities that most significantly affect the VIE’s economic performance and (ii) the right to receive benefits from the VIE or the obligation to absorb losses of the VIE that could be significant to the VIE.
The accompanying consolidated financial statements include the accounts of collateralized loan obligations ("CLOs") issued and securitized by wholly owned subsidiaries of the Company. The Company has determined the CLOs are VIEs of which the Company's subsidiary is the primary beneficiary. The assets and liabilities of the CLOs are consolidated in the accompanying consolidated balance sheet in accordance with ASC 810, Consolidation.
Acquisition Fees and Acquisition Expenses
Acquisition fees and acquisition expenses paid to the Company's Advisor in connection with the origination and acquisition of commercial mortgage loan investments and acquisition of real estate securities are evaluated based on the nature of the expense to determine if they should be expensed in the period incurred or capitalized and amortized over the life of the investment. The Company capitalizes certain direct costs relating to the loan origination activities and the cost is amortized over the life of the loan.
The Company has historically incurred both acquisition fees and acquisition expenses payable to the Advisor. Pursuant to the Advisory Agreement, the Advisor is entitled to an acquisition fee of 1.0% of the principal amount funded by the Company to originate or acquire commercial mortgage loans (or anticipated net equity funded by the Company in the case of acquisition of real estate securities) until the aggregate purchase price for all investments acquired reaches $600 million and, separately, reimbursement for insourced acquisition expenses of 0.5%. In September 2017, the Company's aggregate purchase price for all investments acquired reached $600 million, and concurrently terminated the 1.0% acquisition fee payments to the Advisor for all investments subsequent to the limit being reached. The Company continues to reimburse the Advisor for the acquisition expenses pursuant to the Advisory Agreement.
Commercial Mortgage Loans
Held-for-Investment - Commercial mortgage loans that are held for investment purposes and are anticipated to be held until maturity, are carried at cost, net of unamortized acquisition expenses, discounts or premiums. Commercial mortgage loans, held for investment purposes, that are deemed to be impaired are carried at amortized cost less a specific allowance for loan losses. Interest income is recorded on the accrual basis and related discounts, premiums and acquisition expenses on investments are amortized over the life of the investment using the effective interest method. Amortization is reflected as an adjustment to interest income in the Company’s consolidated statements of operations. Guaranteed loan exit fees payable by the borrower upon maturity are accreted over the life of the investment using the effective interest method. The accretion of guaranteed loan exit fees is recognized in interest income in the Company's consolidated statements of operation.
Held-for-Sale - Commercial mortgage loans that are intended to be sold in the foreseeable future are reported as held-for-sale and are transferred at fair value and recorded at the lower of cost or fair value with changes recorded through the statements of operations. Unamortized loan origination costs for commercial mortgage loans held-for-sale that are carried at the lower of cost or fair value are capitalized as part of the carrying value of the loans and recognized upon the sale of such loans. Amortization of origination costs ceases upon transfer of commercial mortgage loans to held-for-sale. During the quarter ended March 31, 2018, the Company originated a $3.7 million of commercial mortgage loan held-for-sale and sold it during the quarter for net proceeds of approximately $3.7 million.
8
BENEFIT STREET PARTNERS REALTY TRUST, INC.
NOTES TO CONSOLIDATED FINANCIAL STATEMENTS
March 31, 2018
(Unaudited)
Held-for-Sale, Accounted for Under the Fair Value Option - The fair value option provides an option to elect fair value as an alternative measurement for selected financial assets, financial liabilities, and written loan commitments. The Company has elected to measure commercial mortgage loans held-for-sale in the Company's TRS under the fair value option. These commercial mortgage loans are included in the Commercial mortgage loans, held-for-sale, measured at fair value in the consolidated balance sheet. Interest income received on commercial mortgage loans held-for-sale is recorded on the accrual basis of accounting and is included in interest income in the consolidated statements of operations.
As of March 31, 2018 the fair value amount and the contractual principal outstanding of commercial mortgage loans accounted for under the fair value option was $69.5 million and $69.0 million, respectively. As of December 31, 2017, the fair value amount and the contractual principal outstanding of commercial mortgage loans accounted for under the fair value option was $28.5 million. None of the Company's commercial mortgage loans accounted for under the fair value option are in default or are greater than ninety days past due. For the three months ended March 31, 2018 and March 31, 2017, the Company realized gain of $2.3 million and $0.0 million, respectively, relating to the sale of commercial mortgage loans that are accounted for under the fair value option.
Allowance for Loan Losses
The allowance for loan losses reflects management's estimate of loan losses inherent in the loan portfolio as of the balance sheet date. The reserve is increased or decreased through the loan loss provision or recovery on the Company's consolidated statements of operations and is decreased by charge-offs when losses are confirmed through the receipt of assets, such as cash in a pre-foreclosure sale or upon ownership control of the underlying collateral in full satisfaction of the loan upon foreclosure or when significant collection efforts have ceased. The Company uses a uniform process for determining its allowance for loan losses. The allowance for loan losses includes a general, formula-based component and an asset-specific component.
General reserves are recorded when (i) available information as of each balance sheet date indicates that it is probable a loss has occurred in the portfolio and (ii) the amount of the loss can be reasonably estimated. The Company estimates loss rates based on historical realized losses experienced in the industry, given the fact the Company has not experienced any losses, and takes into account current collateral and economic conditions affecting the probability and severity of losses when establishing the allowance for loan losses. The Company performs a comprehensive analysis of its loan portfolio and assigns risk ratings to loans that incorporate management's current judgments about their credit quality based on all known and relevant internal and external factors that may affect collectability. The Company considers, among other things, payment status, lien position, borrower financial resources and investment in collateral, collateral type, project economics and geographic location as well as national and regional economic factors. This methodology results in loans being segmented by risk classification into risk rating categories that are associated with estimated probabilities of default and principal loss. Ratings range from "1" to "5" with "1" representing the lowest risk of loss and "5" representing the highest risk of loss.
The asset-specific reserve component relates to reserves for losses on individual impaired loans. The Company considers a loan to be impaired when, based upon current information and events, it believes that it is probable that the Company will be unable to collect all amounts due under the contractual terms of the loan agreement. This assessment is made on an individual loan basis each quarter based on such factors as payment status, lien position, borrower financial resources and investment in collateral, collateral type, project economics and geographical location as well as national and regional economic factors. A reserve is established for an impaired loan when the present value of payments expected to be received, observable market prices or the estimated fair value of the collateral (for loans that are dependent on the collateral for repayment) is lower than the carrying value of that loan.
For collateral dependent impaired loans, impairment is measured using the estimated fair value of collateral less the estimated cost to sell. Valuations are performed or obtained at the time a loan is determined to be impaired and designated non-performing, and are updated if circumstances indicate that a significant change in value has occurred. The Advisor generally will use the income approach through internally developed valuation models to estimate the fair value of the collateral for such loans. In more limited cases, the Advisor will obtain external "as is" appraisals for loan collateral, generally when third party participations exist.
A loan is also considered impaired if its terms are modified in a troubled debt restructuring ("TDR"). A TDR occurs when a concession is granted and the debtor is experiencing financial difficulties. Impairments on TDR loans are generally measured based on the present value of expected future cash flows discounted at the effective interest rate of the original loans.
The Company designates non-performing loans at such time as (i) loan payments become 90-days past due; (ii) the loan has a maturity default; or (iii) in the opinion of the Company, it is probable the Company will be unable to collect all amounts due according to the contractual terms of the loan. Income recognition will be suspended when a loan is designated non-
9
BENEFIT STREET PARTNERS REALTY TRUST, INC.
NOTES TO CONSOLIDATED FINANCIAL STATEMENTS
March 31, 2018
(Unaudited)
performing and resumed only when the suspended loan becomes contractually current and performance is demonstrated to have resumed. A loan will be written off when it is no longer realizable and legally discharged.
Income Taxes
The Company has conducted its operations to qualify as a REIT for U.S. federal income tax purposes commencing with its taxable year ended December 31, 2013. As a REIT, if the Company meets certain organizational and operational requirements and distributes at least 90% of its "REIT taxable income" (determined before the deduction of dividends paid and excluding net capital gains) to its stockholders in a taxable year, it will not be subject to U.S. federal income tax on the REIT taxable income that it distributes. The Company did not have any undistributed REIT taxable income for the period ended March 31, 2018 and therefore, has not provided for REIT U.S. federal income tax expense. However, even if the Company qualifies for taxation as a REIT, the Company and its subsidiaries may be subject to a variety of taxes, including payroll taxes and certain state and local income, property, excise and franchise taxes. The Company could also be subject to U.S. federal income tax in certain circumstances.
The Company owns a subsidiary that has elected to be treated as a taxable REIT subsidiary (a "TRS") for U.S. federal, state and local income taxes, where applicable, as a C corporation. TRSs can participate in certain activities from which REITs are generally precluded, as long as these activities meet specific criteria and are conducted within the parameters of certain limitations established by the Code. For U.S. federal income tax purposes, the Company’s TRS is not consolidated with the Company, but instead taxed as a separate C corporation.
For financial reporting purposes, a provision for current and deferred taxes is established for the portion of earnings recognized by the Company with respect to its interest in its TRS. The Company's TRS recognized pre-tax income of approximately $1.7 million and U.S. federal, state and local income tax expense of $0.3 million for the three months ended March 31, 2018, which has been included on the accompanying consolidated statements of operations.
The Company’s tax returns are subject to audit by taxing authorities. Generally, as of March 31, 2018, the tax years 2014, 2015, 2016 and 2017 remain open to examination by the major taxing jurisdictions in which the Company is subject to taxes. The Company does not expect tax expense to have an impact on either short or long-term liquidity or capital needs. Under GAAP, a tax benefit related to an income tax position may be recognized when it is more likely than not that the position will be sustained upon examination by the tax authorities based on the technical merits of the position. A position that meets this standard is measured at the largest amount of benefit that will more likely than not be realized upon settlement.
The Company has assessed its tax positions for all open tax years beginning with its taxable year ended December 31, 2014 and concluded that there were no uncertainties to be recognized. The Company’s accounting policy with respect to interest and penalties related to tax uncertainties is to classify these amounts as provision for income taxes.
Enacted on December 22, 2017, the recently passed Tax Cuts and Jobs Act ("TCJA") made many significant changes to the U.S. federal income tax laws applicable to businesses and their owners, including REITs and their stockholders, and may lessen the relative competitive advantage of operating as a REIT rather than as a C corporation. Pursuant to this legislation, as of January 1, 2018, the U.S. federal income tax rate applicable to corporations is reduced to 21%, and the corporate alternative minimum tax is repealed.
In addition, through taxable years ending in 2025, the highest marginal income tax rate applicable to individuals, estates and trusts is reduced to 37% and those taxpayers may deduct up to 20% of certain pass-through income, including ordinary REIT dividends that are not "capital gain dividends" or "qualified dividend income," subject to certain limitations. For taxpayers qualifying for the full deduction, the effective maximum tax rate on ordinary REIT dividends would be 29.6% (excluding the 3.8% net investment income tax).
The reduced corporate tax rate applies to the Company's TRS and any other TRS it forms. Changes in tax rates and tax laws are accounted for in the period of enactment. The amounts recorded in the consolidated statement of operations are provisional. Due to the timing of the enacted legislation, as well as the technical corrections, amendments or administrative guidance that could clarify the treatment of certain provisions, the Company will continue to evaluate its conclusions and update its estimates as necessary.
Commencing in taxable years beginning after December 31, 2017, Section 163(j) of the Code, as amended by TCJA, limits the deductibility of net interest expense paid or accrued on debt properly allocable to a trade or business to 30% of “adjusted taxable income,” ("ATI") subject to certain exceptions. The Company does not expect to be subject to this limitation because it does not expect to have interest expense in excess of the sum of its interest income and 30% of its ATI. However, the
10
BENEFIT STREET PARTNERS REALTY TRUST, INC.
NOTES TO CONSOLIDATED FINANCIAL STATEMENTS
March 31, 2018
(Unaudited)
limitation could cause the Company’s TRS or any other TRS it forms to have greater taxable income and thus potentially greater corporate tax liability.
Derivatives and Hedging Activities
In the normal course of business, the Company is exposed to the effect of interest rate changes and may undertake a strategy to limit these risks through the use of derivatives. The Company uses derivatives primarily to economically hedge against interest rates, CMBS spreads and macro market risk in order to minimize volatility. The Company may use a variety of derivative instruments that are considered conventional, such as interest rate swaps, Treasury note futures and credit derivatives on various indices including CMBX and CDX.
The Company recognizes all derivatives on the consolidated balance sheets at fair value. The Company does not designate derivatives as hedges to qualify for hedge accounting for financial reporting purposes and therefore any net payments under, or fluctuations in the fair value of these derivatives have been recognized currently in unrealized gain/(loss) on derivative instruments in the accompanying consolidated statements of operations. The Company records derivative asset and liability positions on a gross basis with any collateral posted with or received from counterparties recorded separately on the Company’s consolidated balance sheets within the Restricted cash line of the consolidated balance sheets. Certain derivatives that the Company has entered into are subject to master netting agreements with its counterparties, allowing for netting of the same transaction, in the same currency, on the same date.
Per Share Data
The Company calculates basic earnings per share by dividing net income attributable to the Company for the period by the weighted-average number of shares of common stock outstanding for that period. Diluted earnings per share reflects the potential dilution that could occur from shares outstanding if potential shares of common stock with a dilutive effect have been issued in connection with the restricted stock plan, except when doing so would be anti-dilutive.
Reportable Segments
The Company has determined that it has three reportable segments based on how the chief operating decision maker reviews and manages the business. The three reporting segments are as follows:
• | The real estate debt business which is focused on originating, acquiring and asset managing commercial real estate debt investments, including first mortgage loans, subordinate mortgages, mezzanine loans and participations in such loans. |
• | The real estate securities business which is focused on investing in and asset managing commercial real estate securities primarily consisting of CMBS and may include unsecured REIT debt, CDO notes and other securities. |
• | The real estate conduit operated business through the Company's TRS, which is focused on originating and subsequently selling fixed-rate commercial real estate loans into the CMBS securitization market at a profit. |
See Note 13 - Segment Reporting for further information regarding the Company's segments.
Recently Adopted Accounting Pronouncements
In May 2014, the FASB issued ASU 2014-09, “Revenue from Contracts with Customers (Topic 606),” or ASU 2014-09. ASU 2014-09 broadly amends the accounting guidance for revenue recognition. ASU 2014-09 is effective for the first interim or annual period beginning after December 15, 2017, and is to be applied retrospectively. The Company adopted this guidance on January 1, 2018 and it did not have a material impact on our consolidated financial statements.
In August 2016, the FASB issued guidance on how certain transactions should be classified and presented in the statement of cash flows as either operating, investing or financing activities. Among other things, the update provides specific guidance on where to classify debt prepayment and extinguishment costs, payments for contingent consideration made after a business combination and distributions received from equity method investments. The Company adopted this guidance on January 1, 2018. The adoption of this guidance did not have a material impact on the Company's consolidated financial statements.
In November 2016, the FASB issued guidance on the classification of restricted cash in the statement of cash flows. The amendment requires restricted cash to be included in the beginning-of-period and end-of-period total cash amounts. Therefore, transfers between cash and restricted cash will no longer be shown on the statement of cash flows. As a result, entities will no longer present transfers between cash and cash equivalents and restricted cash in the statement of cash flows. The Company
11
BENEFIT STREET PARTNERS REALTY TRUST, INC.
NOTES TO CONSOLIDATED FINANCIAL STATEMENTS
March 31, 2018
(Unaudited)
adopted this guidance on January 1, 2018 and applied the guidance retrospectively to our prior period consolidated statement of cash flows.
Accounting Pronouncements not yet Adopted
In June 2016, the FASB issued guidance that changes how entities measure credit losses for financial assets carried at amortized cost. The update eliminates the requirement that a credit loss must be probable before it can be recognized and instead requires an entity to recognize the current estimate of all expected credit losses. Additionally, the update requires credit losses on available-for-sale debt securities to be carried as an allowance rather than as a direct write-down of the asset. The amendments become effective for reporting periods beginning after December 15, 2019. The amendments may be adopted early for reporting periods beginning after December 15, 2018. The Company is currently evaluating the impact of this new guidance.
In February 2018, the FASB issued guidance that allows an entity to elect to reclassify the stranded tax effects related to the Tax Cuts and Jobs Act of 2017 from accumulated other comprehensive income into retained earnings. The amendments become effective for reporting periods beginning after December 15, 2018, and early adoption is permitted. The Company is currently evaluating the impact of this new guidance.
Note 3 - Commercial Mortgage Loans
The following table is a summary of the Company's commercial mortgage loans, held-for-investment, carrying values by class (dollars in thousands):
March 31, 2018 | December 31, 2017 | ||||||
Senior loans | $ | 1,593,867 | $ | 1,368,425 | |||
Mezzanine loans | 35,532 | 35,087 | |||||
Subordinated loans | — | — | |||||
Total gross carrying value of loans | 1,629,399 | 1,403,512 | |||||
Less: Allowance for loan losses | 1,548 | 1,466 | |||||
Total commercial mortgage loans, held for investment, net | $ | 1,627,851 | $ | 1,402,046 | |||
The following table presents the activity in the Company's allowance for loan losses (dollars in thousands):
Three Months Ended March 31, 2018 | |||||||
2018 | 2017 | ||||||
Beginning of period | $ | 1,466 | $ | 2,181 | |||
Loan loss (recovery)/provision | 82 | 612 | |||||
Charge-offs | — | — | |||||
Recoveries | — | — | |||||
Ending allowance for loan losses | $ | 1,548 | $ | 2,793 | |||
As of March 31, 2018 and December 31, 2017, the Company's total commercial mortgage loan portfolio, excluding commercial mortgage loans accounted for under the fair value option, comprised of 82 and 69 loans, respectively.
12
BENEFIT STREET PARTNERS REALTY TRUST, INC.
NOTES TO CONSOLIDATED FINANCIAL STATEMENTS
March 31, 2018
(Unaudited)
The following table represents the composition by loan type of the Company's commercial mortgage loans portfolio, excluding commercial mortgage loans, held-for-sale, measured at fair value (dollars in thousands).
March 31, 2018 | December 31, 2017 | |||||||||||||
Loan Type | Par Value | Percentage | Par Value | Percentage | ||||||||||
Multifamily | $ | 645,571 | 39.4 | % | $ | 505,189 | 35.9 | % | ||||||
Office | 441,664 | 27.0 | % | 455,698 | 32.4 | % | ||||||||
Retail | 210,247 | 12.9 | % | 209,598 | 14.9 | % | ||||||||
Hospitality | 284,975 | 17.4 | % | 184,025 | 13.1 | % | ||||||||
Industrial | 53,208 | 3.3 | % | 53,208 | 3.7 | % | ||||||||
Mixed Use | — | — | % | — | — | % | ||||||||
Total (1) | $ | 1,635,665 | 100.0 | % | $ | 1,407,718 | 100.0 | % | ||||||
________________________
(1) Excludes $69.0 million and $28.5 million in commercial mortgage loans held-for-sale, measured at fair value in the Company's TRS segment as of March 31, 2018 and December 31, 2017, respectively.
As of March 31, 2018 and December 31, 2017, the Company's total commercial mortgage loans, held-for-sale, measured at fair value comprised of 9 and 3 loans, respectively.
The following table represents the composition by loan type of the Company's commercial mortgage loans, held-for-sale, measured at fair value (dollars in thousands).
March 31, 2018 | December 31, 2017 | |||||||||||||
Loan Type | Par Value | Percentage | Par Value | Percentage | ||||||||||
Multifamily | $ | 14,395 | 20.9 | % | $ | 28,531 | 100.0 | % | ||||||
Industrial | 9,600 | 13.9 | % | — | — | % | ||||||||
Retail | 33,955 | 49.2 | % | — | — | % | ||||||||
Hospitality | 4,526 | 6.6 | % | — | — | % | ||||||||
Office | 6,500 | 9.4 | % | — | — | % | ||||||||
Total | $ | 68,976 | 100.0 | % | $ | 28,531 | 100.0 | % | ||||||
Credit Characteristics
As part of the Company's process for monitoring the credit quality of its commercial mortgage loans, excluding those held-for-sale, measured at fair value, it performs a quarterly loan portfolio assessment and assigns risk ratings to each of its loans. The loans are scored on a scale of 1 to 5 as follows:
Investment Rating | Summary Description | |
1 | Investment exceeding fundamental performance expectations and/or capital gain expected. Trends and risk factors since time of investment are favorable. | |
2 | Performing consistent with expectations and a full return of principal and interest expected. Trends and risk factors are neutral to favorable. | |
3 | Performing investments requiring closer monitoring. Trends and risk factors show some deterioration. | |
4 | Underperforming investment with the potential of some interest loss but still expecting a positive return on investment. Trends and risk factors are negative. | |
5 | Underperforming investment with expected loss of interest and some principal. | |
All commercial mortgage loans, excluding loans classified as commercial mortgage loans, held-for-sale, measured at fair value within the consolidated balance sheet, are assigned an initial risk rating of 2.0. As of March 31, 2018 and December 31, 2017, the weighted average risk rating of loans was 2.2 and 2.2, respectively. As of March 31, 2018 and December 31, 2017, the Company did not have any loans that were past due on their payments, in non-accrual status or impaired.
13
BENEFIT STREET PARTNERS REALTY TRUST, INC.
NOTES TO CONSOLIDATED FINANCIAL STATEMENTS
March 31, 2018
(Unaudited)
For the three months ended March 31, 2018 and March 31, 2017, the activity in the Company's commercial mortgage loans, held-for-investment portfolio was as follows (dollars in thousands):
Three Months Ended March 31, | |||||||
2018 | 2017 | ||||||
Balance at Beginning of Year | $ | 1,402,046 | $ | 1,046,556 | |||
Acquisitions and originations | 377,658 | 93,140 | |||||
Principal repayments | (149,711 | ) | (86,079 | ) | |||
Discount accretion and premium amortization | 1,006 | 628 | |||||
Loans transferred to commercial real estate loans, held-for-sale | — | (45,513 | ) | ||||
Net fees capitalized into carrying value of loans | (3,066 | ) | 744 | ||||
Loan loss recovery/(provision) | (82 | ) | (612 | ) | |||
Balance at End of Period | $ | 1,627,851 | $ | 1,008,864 | |||
Note 4 - Real Estate Securities
As of March 31, 2018 and December 31, 2017 the Company held no CMBS positions. For the three months ended March 31, 2017, the Company recognized a loss of less than $0.03 million recorded within the realized (gain) loss on sale of real estate securities line in the consolidated statements of operations.
The following table provides information on the amounts of gains (losses) on the Company's real estate securities, CMBS, available-for-sale (dollars in thousands):
Three Months Ended March 31, | ||||||||
2018 | 2017 | |||||||
Unrealized gains (losses) available-for-sale securities | $ | — | $ | 1,037 | ||||
Reclassification of net (gains) losses on available-for-sale securities included in net income (loss) | — | 351 | ||||||
Unrealized gains (losses) available-for-sale securities, net of reclassification adjustment | $ | — | $ | 1,388 | ||||
The amounts reclassified for net (gain) loss on available-for-sale securities are included in the realized (gain) loss on sale of real estate securities in the Company's consolidated statements of operations.
Note 5 - Debt
Repurchase Agreements - Commercial Mortgage Loans
The Company entered into repurchase facilities with JPMorgan Chase Bank, National Association (the "JPM Repo Facility"), Goldman Sachs Bank USA (the "GS Repo Facility"), U.S Bank National Association (the "USB Repo Facility"), and Credit Suisse AG (the "CS Repo Facility" and together with JPM Repo Facility, GS Repo Facility, USB Repo Facility, the "Repo Facilities").
Advances under the JPM Repo Facility currently accrue interest at per annum rates generally equal to the sum of (i) the applicable LIBOR index rate plus (ii) a margin of 2.40%. Borrowings under the GS Repo Facility accrue interest at per annum rates generally equal to the sum of (i) a spread over LIBOR of between 2.35% to 2.85%, depending on the attributes of the purchased asset, and (ii) 0.50%. Borrowings under the USB Repo Facility accrue interest at per annum rates generally equal to the sum of (i) the applicable LIBOR index rate plus (ii) a margin between 2.25% to 3.00%, depending on the attributes of the purchased assets. Borrowings under the CS Repo Facility accrue interest at per annum rates generally equal to the sum of (i) the applicable LIBOR index rate plus (ii) a margin of 2.50% depending on the attributes of the purchased assets.
The Company entered into a repurchase facility with Barclays Bank PLC (the "Barclays Facility") on September 19, 2017. Borrowings under the Barclays Facility accrue interest, at the Company's option, at per annum rates equal to (i) a spread over the Base Rate of 1.75% or (ii) a spread over the Eurodollar Rate of 2.75%, and provides for quarterly interest-only payments, with all principal and interest outstanding being due on the maturity date.
14
BENEFIT STREET PARTNERS REALTY TRUST, INC.
NOTES TO CONSOLIDATED FINANCIAL STATEMENTS
March 31, 2018
(Unaudited)
The details of the Company's Repo Facilities and the Barclays Facility at March 31, 2018 and December 31, 2017 are as follows (dollars in thousands):
As of March 31, 2018 | Ending Weighted Average Interest Rate | Term Maturity | |||||||||||||||
Repurchase Facility | Committed Financing | Amount Outstanding | Interest Expense (1) | ||||||||||||||
JPM Repo Facility (2) | $ | 520,000 | $ | 406,996 | $ | 3,154 | 4.12 | % | 1/30/2020 | ||||||||
GS Repo Facility (3) | 250,000 | 13,500 | 185 | 4.13 | % | 12/27/2018 | |||||||||||
USB Repo Facility (4) | 100,000 | — | 73 | n/a | 6/15/2020 | ||||||||||||
CS Repo Facility (5) | 250,000 | 80,814 | 662 | 4.10 | % | 8/30/2018 | |||||||||||
Barclays Facility (6) | 75,000 | — | 138 | n/a | 9/19/2019 | ||||||||||||
Total | $ | 1,195,000 | $ | 501,310 | $ | 4,212 | |||||||||||
__________________________
(1) Includes amortization of deferred financing costs.
(2) On January 30, 2018 the committed financing amount was upsized from $300 million to $520 million and maturity date amended to January 30, 2020. Includes a one-year extension at the Company's option.
(3) Includes a one-year extension at the Company’s option, which may be exercised upon the satisfaction of certain conditions.
(4) Includes two one-year extensions at the option of an indirect wholly-owned subsidiary of the Company, which may be exercised upon the satisfaction of certain conditions.
(5) Prior to the end of each calendar quarter, the Company may request an extension of the termination date for an additional 364 days from the end of such calendar quarter subject to the satisfaction of certain conditions and approvals.
(6) Includes a one-year extension at the Company's option.
As of December 31, 2017 | Ending Weighted Average Interest Rate (1) | Term Maturity | |||||||||||||||
Repurchase Facility | Committed Financing | Amount Outstanding | Interest Expense (1) (2) | ||||||||||||||
JPM Repo Facility (3) | $ | 300,000 | $ | 42,042 | $ | 2,547 | 3.29 | % | 6/12/2019 | ||||||||
GS Repo Facility (4) | 250,000 | 13,500 | 277 | 3.38 | % | 12/27/2018 | |||||||||||
USB Repo Facility (5) | 100,000 | — | — | N/A | 6/15/2020 | ||||||||||||
CS Repo Facility (6) | 250,000 | 10,148 | — | N/A | 8/30/2018 | ||||||||||||
Barclays Facility (7) | 75,000 | — | — | N/A | 9/19/2019 | ||||||||||||
Total | $ | 975,000 | $ | 65,690 | $ | 2,824 | |||||||||||
_______________________
(1) For the period ended March 31, 2017.
(2) Includes amortization of deferred financing costs.
(3) Includes a one-year extension at the Company's option.
(4) Includes a one-year extension at the Company’s option, which may be exercised upon the satisfaction of certain conditions.
(5) Includes two one-year extensions at the option of an indirect wholly-owned subsidiary of the Company, which may be exercised upon the satisfaction of certain conditions.
(6) Prior to the end of each calendar quarter, the Company may request an extension of the termination date for an additional 364 days from the end of such calendar quarter subject to the satisfaction of certain conditions and approvals.
(7) Includes a one-year extension a tthe Company's option.
We expect to use the advances from the Repo Facilities and the Barclays Facility to finance the acquisition or origination of eligible loans, including first mortgage loans, subordinated mortgage loans, mezzanine loans and participation interests therein.
The Repo Facilities generally provide that in the event of a decrease in the value of the Company's collateral, the lenders can demand additional collateral. Should the value of the Company’s collateral decrease as a result of deteriorating credit quality, resulting margin calls may cause an adverse change in the Company’s liquidity position. As of March 31, 2018 and December 31, 2017, the Company is in compliance with all debt covenants.
15
BENEFIT STREET PARTNERS REALTY TRUST, INC.
NOTES TO CONSOLIDATED FINANCIAL STATEMENTS
March 31, 2018
(Unaudited)
Other financing - Commercial Mortgage Loans
The Company entered into a financing arrangement with Pacific Western Bank for term financing (“PWB Financing”) on May 17, 2017. The PWB Financing provided the Company with $36.2 million and is collateralized by a portfolio asset of $54.2 million. The PWB Financing currently accrues interest at per annum rates equal to the sum of (i) the applicable LIBOR index rate plus (ii) a margin of 4.0%. The PWB Financing initially matures on June 9, 2019, with two one-year extension options at the Company’s option. As of March 31, 2018 and December 31, 2017, the Company had $20.9 million and $26.2 million, respectively, of outstanding principal under the PWB Financing. The Company incurred $0.5 million of interest expense on the PWB Financing for the three months ended March 31, 2018, including amortization of deferred financing costs.
Repurchase Agreements - Real Estate Securities
The Company has entered into various Master Repurchase Agreements (the "MRAs") that allow the Company to sell real estate securities while providing a fixed repurchase price for the same real estate securities in the future. The repurchase contracts on each security under an MRA generally mature in 30-90 days and terms are adjusted for current market rates as necessary.
Below is a summary of the Company's MRAs as of March 31, 2018 and December 31, 2017 (dollars in thousands):
Weighted Average | |||||||||||||||||
Counterparty | Amount Outstanding | Accrued Interest | Collateral Pledged (*) | Interest Rate | Days to Maturity | ||||||||||||
As of March 31, 2018 | |||||||||||||||||
JP Morgan Securities LLC | $ | — | $ | — | $ | — | N/A | N/A | |||||||||
Total | $ | — | $ | — | $ | — | N/A | N/A | |||||||||
As of December 31, 2017 | |||||||||||||||||
JP Morgan Securities LLC | $ | 39,035 | $ | 11 | $ | 56,044 | 3.32 | % | 26 | ||||||||
Total | $ | 39,035 | $ | 11 | $ | 56,044 | 3.32 | % | 26 | ||||||||
________________________
* Includes $56.0 million Tranche C of RFT 2015-FL1 CLO held by the Company, which eliminates within the Real estate securities, at fair value line of the consolidated balance sheets as of December 31, 2017.
On February 15, 2018, the Company repaid the outstanding amount of $39.0 million.
Collateralized Loan Obligation
On February 15, 2018, the Company called all of the outstanding notes issued by RFT 2015-FL1. The outstanding principal of the notes on the date of the call was $145 million. The Company recognized all the remaining unamortized deferred financing costs of $6.4 million recorded within the Interest expense line of the consolidated statements of operations, which was a non-cash charge.
As of March 31, 2018 and December 31, 2017 the notes issued by BSPRT 2017-FL1 Issuer, a wholly owned indirect subsidiary of the Company, are collateralized by interests in a pool of 25 mortgage assets having a total principal balance of $418.1 million (the “2017-FL1 Mortgage Assets”) originated by a subsidiary of the Company. The sale of the 2017-FL1 Mortgage Assets to BSPRT 2017-FL1 Issuer is governed by a Mortgage Asset Purchase Agreement dated as of June 29, 2017, between the Company and BSPRT 2017-FL1 Issuer.
As of March 31, 2018 and December 31, 2017 the notes issued by BSPRT 2017-FL2 Issuer, a wholly owned indirect subsidiary of the Company, are collateralized by interests in a pool of 20 mortgage assets having a total principal balance of $440.7 million (the “2017-FL2 Mortgage Assets”) originated by a subsidiary of the Company. The sale of the 2017-FL2 Mortgage Assets to BSPRT 2017-FL2 Issuer is governed by a Mortgage Asset Purchase Agreement dated as of November 29, 2017, between the Company and BSPRT 2017-FL2 Issuer.
16
BENEFIT STREET PARTNERS REALTY TRUST, INC.
NOTES TO CONSOLIDATED FINANCIAL STATEMENTS
March 31, 2018
(Unaudited)
The Company, through its wholly-owned subsidiaries, holds the preferred equity tranches of BSPRT 2017-FL1 and BSPRT 2017-FL2 which is valued at approximately $127.0 million. The following table represents the terms of the notes issued by BSPRT 2017-FL1 Issuer and BSPRT 2017-FL2 Issuer, respectively (dollars in thousands):
________________________
CLO Facility | As of March 31, 2018 | Par Value Issued | Par Value Outstanding (1) | Interest Rate | Maturity Date | |||||||||
2017-FL1 Issuer | Tranche A | 223,600 | 223,600 | 1M LIBOR + 135 | 7/1/2027 | |||||||||
2017-FL1 Issuer | Tranche B | 48,000 | 48,000 | 1M LIBOR + 240 | 7/1/2027 | |||||||||
2017-FL1 Issuer | Tranche C | 67,900 | 67,900 | 1M LIBOR + 425 | 7/1/2027 | |||||||||
2017-FL2 Issuer | Tranche A | 237,970 | 237,970 | 1M LIBOR + 82 | 10/15/2034 | |||||||||
2017-FL2 Issuer | Tranche A-S | 36,357 | 36,357 | 1M LIBOR + 110 | 10/15/2034 | |||||||||
2017-FL2 Issuer | Tranche B | 26,441 | 26,441 | 1M LIBOR + 140 | 10/15/2034 | |||||||||
2017-FL2 Issuer | Tranche C | 25,339 | 25,339 | 1M LIBOR + 215 | 10/15/2034 | |||||||||
2017-FL2 Issuer | Tranche D | 35,255 | 35,255 | 1M LIBOR + 345 | 10/15/2034 | |||||||||
$ | 700,862 | $ | 700,862 | |||||||||||
CLO Facility | As of December 31, 2017 | Par Value Issued | Par Value Outstanding (1) (2) | Interest Rate | Maturity Date | |||||||||
2015-FL1 Issuer | Tranche A | $ | 231,345 | $ | 79,109 | 1M LIBOR + 175 | 8/1/2030 | |||||||
2015-FL1 Issuer | Tranche B | 42,841 | 42,841 | 1M LIBOR + 388 | 8/1/2030 | |||||||||
2015-FL1 Issuer | Tranche C | 76,044 | 20,000 | 1M LIBOR + 525 | 8/1/2030 | |||||||||
2017-FL1 Issuer | Tranche A | 223,600 | 223,600 | 1M LIBOR + 135 | 7/1/2027 | |||||||||
2017-FL1 Issuer | Tranche B | 48,000 | 48,000 | 1M LIBOR + 240 | 7/1/2027 | |||||||||
2017-FL1 Issuer | Tranche C | 67,900 | 67,900 | 1M LIBOR + 425 | 7/1/2027 | |||||||||
2017-FL2 Issuer | Tranche A | 237,970 | 237,970 | 1M LIBOR + 82 | 10/15/2034 | |||||||||
2017-FL2 Issuer | Tranche A-S | 36,357 | 36,357 | 1M LIBOR + 110 | 10/15/2034 | |||||||||
2017-FL2 Issuer | Tranche B | 26,441 | 26,441 | 1M LIBOR + 140 | 10/15/2034 | |||||||||
2017-FL2 Issuer | Tranche C | 25,339 | 25,339 | 1M LIBOR + 215 | 10/15/2034 | |||||||||
2017-FL2 Issuer | Tranche D | 35,255 | 35,255 | 1M LIBOR + 345 | 10/15/2034 | |||||||||
$ | 1,051,092 | $ | 842,812 | |||||||||||
(1) Excludes $16.0 million of Tranche E notes and $14.9 million of Tranche F notes issued by BSPRT 2017-FL2 Issuer, held by the Company, which are eliminated within the collateralized loan obligation line of the consolidated balance sheets as of March 31, 2018 and December 31, 2017.
(2) Excludes $56.0 million of Tranche C notes issued by RFT 2015-FL1 Issuer, held by the Company, which eliminates within the collateralized loan obligation line of the consolidated balance sheets as of December 31, 2017.
17
BENEFIT STREET PARTNERS REALTY TRUST, INC.
NOTES TO CONSOLIDATED FINANCIAL STATEMENTS
March 31, 2018
(Unaudited)
The below table reflects the total assets and liabilities of the Company's two CLOs. The CLOs are considered VIEs and are consolidated into the Company's consolidated financial statements as of March 31, 2018 and December 31, 2017 as the Company is the primary beneficiary of the VIE. The Company is the primary beneficiary of the CLOs because (i) the Company has the power to direct the activities that most significantly affect the VIE’s economic performance and (ii) the right to receive benefits from the VIEs or the obligation to absorb losses of the VIEs that could be significant to the VIE.
Assets (dollars in thousands) | March 31, 2018 | December 31, 2017 | ||||||
Cash (1) | $ | 20,332 | $ | 49,017 | ||||
Commercial mortgage loans, held for investment, net of allowance (2) | 836,106 | 1,033,427 | ||||||
Accrued interest receivable | 2,518 | 4,212 | ||||||
Total Assets | $ | 858,956 | $ | 1,086,656 | ||||
Liabilities | ||||||||
Notes payable (3)(4) | $ | 721,676 | $ | 912,800 | ||||
Interest payable | 1,133 | 1,462 | ||||||
Total Liabilities | $ | 722,809 | $ | 914,262 | ||||
________________________
(1) Includes $20.2 million and $48.7 million of cash held by the servicer related to CLO loan payoffs as of March 31, 2018 and December 31, 2017.
(2) The balance is presented net of allowance for loan loss of $0.9 million and $1.3 million as of March 31, 2018 and December 31, 2017, respectively.
(3) Includes $16.0 million of Tranche E notes and $14.9 million of Tranche F notes issued by 2017-FL2 Issuer held by the Company as of March 31, 2018 and December 31, 2017. The notes held by the Company are eliminated within the Collateral loan obligations line of the consolidated balance sheets. Includes $55.8 million of Tranche C of Company issued CLO held by the Company as of December 31, 2017.
(4) The balance is presented net of deferred financing cost and discount of $10.1 million and $16.9 million as of March 31, 2018 and December 31, 2017, respectively.
Note 6 - Net Income Per Share
The following table is a summary of the basic and diluted net income per share computation for the three months ended March 31, 2018 and 2017 (dollars in thousands, except share amounts):
Three Months Ended March 31, | |||||||
2018 | 2017 | ||||||
Net income (in thousands) | $ | 5,296 | $ | 6,049 | |||
Basic weighted average shares outstanding | 31,670,518 | 31,740,256 | |||||
Unvested restricted shares | 14,314 | 9,789 | |||||
Diluted weighted average shares outstanding | 31,684,832 | 31,750,045 | |||||
Basic net income per share | $ | 0.17 | $ | 0.19 | |||
Diluted net income per share | $ | 0.17 | $ | 0.19 | |||
Note 7 - Common Stock
As of March 31, 2018 and December 31, 2017, the Company had 31,600,114 and 31,834,072 shares of common stock outstanding, respectively, including shares issued pursuant to the Dividend Reinvestment Plan ("DRIP") and unvested restricted shares.
Distributions
In order to maintain its election to qualify as a REIT, the Company must currently distribute, at a minimum, an amount equal to 90% of its taxable income, without regard to the deduction for distributions paid and excluding net capital gains. The Company must distribute 100% of its taxable income (including net capital gains) to avoid paying corporate U.S. federal income taxes.
18
BENEFIT STREET PARTNERS REALTY TRUST, INC.
NOTES TO CONSOLIDATED FINANCIAL STATEMENTS
March 31, 2018
(Unaudited)
In March 2016, the Company's board of directors ratified the existing distribution amount equivalent to $2.0625 per annum for calendar year 2016. On November 10, 2016 the Company’s board of directors changed the DRIP offer price to $20.05, which is equal to the estimated per-share NAV as of September 30, 2016 approved by the board of directors. In August 2017, the Company’s board of directors authorized and declared a distribution calculated daily at a rate of $0.00394521 per day, which is equivalent to $1.44 per annum, per share of common stock. The price change was applied to the reinvestment of distributions commencing with the October 2016 distributions. On May 10, 2017, the Company’s board of directors changed the methodology used to determine the DRIP offer price to be the lesser of (i) the Company’s most recent estimated per-share NAV, as approved by the Company’s board of directors from time to time, and (ii) the Company’s most recent book value per share, computed in accordance with GAAP. The DRIP offer price for January 2018, February 2018, March 2018 and April 2018 was $19.02 per share, which is the Company's estimated per share NAV as of September 30, 2017. Starting in June 2018, the DRIP offer price will be $18.99, which is the GAAP book value as of March 31, 2018.
The Company's distributions are payable by the fifth day following each month end to stockholders of record at the close of business each day during the prior month. Distribution payments are dependent on the availability of funds. The Company's board of directors may reduce the amount of distributions paid or suspend distribution payments at any time, and therefore, distributions payments are not assured. The Company distributed $11.2 million during the three months ended March 31, 2018, comprised of $7.7 million in cash and $3.6 million in shares of common stock issued under the DRIP. The Company distributed $16.0 million during the three months ended March 31, 2017, comprised of $10.4 million in cash and $5.7 million in shares of common stock issued under the DRIP.
Share Repurchase Program
The Company's board of directors unanimously approved an amended and restated share repurchase program (the “SRP”), which became effective on February 28, 2016. The SRP enables stockholders to sell their shares to the Company. Subject to certain conditions, stockholders that purchased shares of the Company's common stock or received their shares from us (directly or indirectly) through one or more non-cash transactions and have held their shares for a period of at least one year, may request that the Company repurchase their shares of common stock so long as the repurchase otherwise complies with the provisions of Maryland law. Repurchase requests made following the death or qualifying disability of a stockholder will not be subject to any minimum holding period.
On August 10, 2017, the Company's board of directors amended the SRP to provide that the repurchase price per share for requests will be equal to the lesser of (i) the Company’s most recent estimated per-share NAV, as approved by the Company’s board of directors from time to time, and (ii) the Company’s most recent book value per share, computed in accordance with GAAP, multiplied by a percentage equal to (i) 92.5%, if the person seeking repurchase has held his or her shares for a period greater than one year and less than two years; (ii) 95%, if the person seeking repurchase has held his or her shares for a period greater than two years and less than three years; (iii) 97.5%, if the person seeking repurchase has held his or her shares for a period greater than three years and less than four years; or (iv) 100%, if the person seeking repurchase has held his or her shares for a period greater than four years or in the case of requests for death or qualifying disability.
Repurchase requests related to death or a qualifying disability must satisfy certain conditions, each of which are assessed by and at the sole discretion of the Company, including the following conditions. In the case of death, the shareholder must be a natural person (or a revocable grantor trust) and the Company must receive a written notice from the estate of the shareholder, the recipient of the shares through bequest or inheritance, or the trustee in the case of a revocable grantor trust. In the case of a “qualifying disability”, the shareholder must be a natural person (or a revocable grantor trust) and the Company must receive a written notice from the shareholder, or the trustee in the case of a revocable grantor trust, that the condition was not pre-existing on the date the shares were acquired. In order for a disability to be considered a “qualifying disability”, the shareholder must receive and provide evidence (the shareholder application and the notice of final determination) of disability based upon a physical or mental condition or impairment made by a government agency responsible for reviewing and determining disability retirement benefits (e.g. the Social Security Administration).
Repurchases pursuant to the SRP, when requested, generally will be made semiannually (each six-month period ending June 30 or December 31, a “fiscal semester”). Repurchases for any fiscal semester will be limited to a maximum of 2.5% of the weighted average number of shares of common stock outstanding during the previous fiscal year, with a maximum for any fiscal year of 5.0% of the weighted average number of shares of common stock outstanding during the previous fiscal year. Funding for repurchases pursuant to the SRP for any given fiscal semester will be limited to proceeds received during that same fiscal semester through the issuance of common stock pursuant to any DRIP in effect from time to time, provided that the Company's board of directors has the power, in its sole discretion, to determine the amount of shares repurchased during any fiscal semester as well as the amount of funds to be used for that purpose. Any repurchase requests received during such fiscal
19
BENEFIT STREET PARTNERS REALTY TRUST, INC.
NOTES TO CONSOLIDATED FINANCIAL STATEMENTS
March 31, 2018
(Unaudited)
semester will be paid at the price, computed as described above on the last day of such fiscal semester. Due to these limitations, the Company cannot guarantee that the Company will be able to accommodate all repurchase requests made during any fiscal semester or fiscal year. However, a stockholder may withdraw its request at any time or ask that the Company honors the request when funds are available. Pending repurchase requests will be honored on a pro rata basis. The Company will generally pay repurchase proceeds, less any applicable tax or other withholding required by law, by the 31st day following the end of the fiscal semester during which the repurchase request was made.
When a stockholder requests redemption and the redemption is approved, the Company will reclassify such obligation from equity to a liability based on the settlement value of the obligation. Shares repurchased under the SRP will have the status of authorized but unissued shares.
The following table reflects the number of shares repurchased under the SRP cumulatively through March 31, 2018:
Number of Requests | Number of Shares Repurchased | Average Price per Share | ||||||||
Cumulative as of December 31, 2017 | 2,125 | 1,991,391 | $ | 21.36 | ||||||
January 1 - March 31, 2018(1) | 889 | 421,809 | 18.56 | |||||||
Cumulative as of March 31, 2018 | 3,014 | 2,413,200 | $ | 20.88 | ||||||
________________________
(1) Reflects shares repurchased in January 2018 pursuant to repurchase requests submitted for the fiscal semester ended December 31, 2017. As permitted under the SRP, the Board authorized repurchases up to the amount of proceeds reinvested through our DRIP. As a result, redemption requests in the amount of 185,689 shares were not fulfilled.
We currently expect to repurchase shares under the SRP for the fiscal semester ended June 30, 2018 in July 2018. Since the Company’s most recent estimated per-share NAV is $19.02 and the Company’s GAAP book value per share as of March 31, 2018 is $18.99, we expect the SRP repurchase price for the fiscal semester ended June 30, 2018 will be $18.99 and we expect to continue to limit repurchases to the amounts reinvested pursuant to our DRIP plan.
Note 8 - Commitments and Contingencies
Unfunded Commitments for Commercial Mortgage Loans
As of March 31, 2018 and December 31, 2017, the Company had the below unfunded commitments to the Company's borrowers (dollars in thousands):
Funding Expiration | March 31, 2018 | December 31, 2017 | ||||||
2018 | 33,339 | 36,475 | ||||||
2019 | 17,737 | 26,465 | ||||||
2020 | 41,987 | 20,598 | ||||||
2021 | 98,914 | — | ||||||
Total | $ | 191,977 | $ | 83,538 | ||||
Litigation and Regulatory Matters
In the ordinary course of business, the Company may become subject to litigation, claims and regulatory matters. The Company has no knowledge of material legal or regulatory proceedings pending or known to be contemplated against the Company at this time.
Note 9 - Related Party Transactions and Arrangements
Advisory Agreement Fees and Reimbursements
Pursuant to the Advisory Agreement, the Company makes or was required to make the following payments and reimbursements to the Advisor:
•The Company reimburses the Advisor’s costs of providing services pursuant to the Advisory Agreement, except the salaries and benefits paid by the Advisor to the Company’s executive officers.
20
BENEFIT STREET PARTNERS REALTY TRUST, INC.
NOTES TO CONSOLIDATED FINANCIAL STATEMENTS
March 31, 2018
(Unaudited)
•The Company pays the Advisor, or its affiliates, a monthly asset management fee equal to one-twelfth of 1.5% of stockholder’s equity as calculated pursuant to the Advisory Agreement.
•The Company will pay the Advisor an annual subordinated performance fee calculated on the basis of total return to stockholders, payable monthly in arrears, such that for any year in which total return on stockholders’ capital exceeds 6.0% per annum, our Advisor will be entitled to 15.0% of the excess total return; provided that in no event will the annual subordinated performance fee payable to our Advisor exceed 10.0% of the aggregate total return for such year.
•Until September 2017, the Company paid its Advisor an acquisition fee of 1.0% of the principal amount funded by us to originate or acquire commercial mortgage loans and 1.0% of the anticipated net equity funded by the Company to acquire real estate securities.
•The Company reimburses the Advisor for insourced expenses incurred by the Advisor on the Company‘s behalf related to selecting, evaluating, originating and acquiring investments in an amount up to 0.5% of the principal amount funded by the Company to originate or acquire commercial mortgage loans and up to 0.5% of the anticipated net equity funded by the Company to acquire real estate securities investments.
Until September 29, 2016, the Former Advisor served as the Company's advisor and the Company paid the Former Advisor certain fees and expense reimbursements pursuant to its advisory agreement with the Former Advisor. The types of fees and reimbursements paid to the Former Advisor were similar to those paid to the Advisor prior to September 2017. In addition, prior to January 2016, the Company paid dealer-manager fees and selling commissions to an affiliate ("Former Dealer Manager") of the Former Advisor.
The table below shows the compensation and reimbursement to the Former Advisor, its affiliates, entities under common control with the Former Advisor and the Former Dealer Manager incurred for services relating to the Company's public offering during the three months ended March 31, 2018 and 2017, and the associated payable as of March 31, 2018 and December 31, 2017 (dollars in thousands):
Three Months Ended March 31, | ||||||||
2018 | 2017 | |||||||
Total commissions and fees incurred from the Former Dealer Manager | $ | — | $ | — | ||||
Total compensation and reimbursement for services provided by the Former Advisor, its affiliates, entities under common control with the Former Advisor and the Former Dealer Manager | $ | — | $ | — | ||||
Payable as of | ||||||||
March 31, 2018 | December 31, 2017 | |||||||
Total commissions and fees incurred from the Former Dealer Manager | $ | — | $ | — | ||||
Total compensation and reimbursement for services provided by the Former Advisor, its affiliates, entities under common control with the Former Advisor and the Former Dealer Manager | $ | 480 | $ | 480 | ||||
The payables as of March 31, 2018 and December 31, 2017 in the table above are included in Due to affiliates on the Company's consolidated balance sheets.
21
BENEFIT STREET PARTNERS REALTY TRUST, INC.
NOTES TO CONSOLIDATED FINANCIAL STATEMENTS
March 31, 2018
(Unaudited)
The table below shows the costs incurred due to arrangements with our Advisor and its affiliates during the three months ended March 31, 2018 and March 31, 2017, and the associated payable as of March 31, 2018 and December 31, 2017 (dollars in thousands):
Three Months Ended March 31, | Payable as of | |||||||||||||||
2018 | 2017 | March 31, 2018 | December 31, 2017 | |||||||||||||
Acquisition fees and acquisition expenses (1) | $ | 65 | $ | 624 | $ | — | $ | — | ||||||||
Administrative services expenses | 3,196 | 855 | 1,596 | 3,480 | ||||||||||||
Asset management and subordinated performance fee | 2,241 | 2,312 | 741 | 2,315 | ||||||||||||
Other related party expenses (2) | 199 | 48 | 153 | 146 | ||||||||||||
Total related party fees and reimbursements | $ | 5,701 | $ | 3,839 | $ | 2,490 | $ | 5,941 | ||||||||
________________________
(1) Total acquisition fees and expenses paid during the three months ended March 31, 2018 and March 31, 2017 were $1.9 million and $1.4 million respectively, of which $1.9 million and $0.8 million were capitalized within the commercial mortgage loans, held for investment line of the Company's consolidated balance sheet.
(2) Included in other expenses in the Company's consolidated statement of operations.
The payables as of March 31, 2018 and December 31, 2017 in the table above are included in Due to affiliates on the Company's consolidated balance sheets.
Share Ownership
On February 14, 2018 (the “Commitment Date”) the Company entered into stock purchase agreements (collectively, the “Purchase Agreements”), by and between the Company and certain institutional investors (the “Institutional Investors”), certain officers of the Company, and certain owners, employees and associates of the Advisor and its affiliates (collectively, the “Manager Investors,” and together with the Institutional Investors, the “Investors”), pursuant to which the Investors committed to purchase an aggregate amount of up to approximately $97.0 million of common stock (including Manager Investor commitments of approximately $32.1 million) of the Company in one or more closings. The purchase price will be $16.87 per share. The timing of any closing, and the amount of shares to be sold at such Closing, will be determined by the Company in its sole discretion, subject to certain limitations. As described in the Purchase Agreements, the Company may enter into additional Purchase Agreements with other investors within 12 months of the Commitment Date. As of May 14, 2018 the Company has not sold any shares pursuant to the Purchase Agreements.
Other Transactions
On February 22, 2018, the Company purchased commercial mortgage loans, held-for-sale from an entity that is an affiliate of our Advisor, for an aggregate purchase price of $27.8 million. The purchase of the commercial mortgage loans and the $27.8 million purchase price were approved by the Company’s board of directors.
In December 2017, the Company purchased a commercial mortgage loan from an entity that is an affiliate of our Advisor, for an aggregate purchase price of $17.1 million and is included in Commercial mortgage loans, held-for-investment in the consolidated balance sheet. The purchase of the commercial mortgage loan and the $17.1 million purchase price were approved by the Company’s board of directors and the Nominating and Corporate Governance Committee, which consists solely of independent directors.
Note 10 - Fair Value of Financial Instruments
GAAP establishes a hierarchy of valuation techniques based on the observability of inputs used in measuring financial instruments at fair values. GAAP establishes market-based or observable inputs as the preferred source of values, followed by valuation models using management assumptions in the absence of market inputs. The three levels of the hierarchy are described below:
• | Level I - Inputs are unadjusted, quoted prices in active markets for identical assets or liabilities at the measurement date. |
• | Level II - Inputs (other than quoted prices included in Level I) are either directly or indirectly observable for the asset or liability through correlation with market data at the measurement date and for the duration of the instrument’s anticipated life. |
22
BENEFIT STREET PARTNERS REALTY TRUST, INC.
NOTES TO CONSOLIDATED FINANCIAL STATEMENTS
March 31, 2018
(Unaudited)
• | Level III - Unobservable inputs that reflect the entity's own assumptions about the assumptions that market participants would use in the pricing of the asset or liability and are consequently not based on market activity, but rather through particular valuation techniques. |
The determination of where an asset or liability falls in the above hierarchy requires significant judgment and factors specific to the asset or liability. In instances where the determination of the fair value measurement is based on inputs from different levels of the fair value hierarchy, the level in the fair value hierarchy within which the entire fair value measurement falls is based on the lowest level input that is significant to the fair value measurement in its entirety. The Company evaluates its hierarchy disclosures each quarter and depending on various factors, it is possible that an asset or liability may be classified differently from quarter to quarter.
The Company has implemented valuation control processes to validate the fair value of the Company's financial instruments measured at fair value including those derived from pricing models. These control processes are designed to assure that the values used for financial reporting are based on observable inputs wherever possible. In the event that observable inputs are not available, the control processes are designed to assure that the valuation approach utilized is appropriate and consistently applied and the assumptions are reasonable.
Financial Instruments Measured at Fair Value on a Recurring Basis
CMBS are valued utilizing both observable and unobservable market inputs. These factors include projected future cash flows, ratings, subordination levels, vintage, remaining lives, credit issues, recent trades of similar real estate securities and the spreads used in the prior valuation. Depending upon the significance of the fair value inputs used in determining these fair values, these real estate securities are classified in either Level II or Level III of the fair value hierarchy. As of March 31, 2018 and December 31, 2017 the Company had no CMBS.
Commercial mortgage loans held-for-sale, measured at fair value in the Company's TRS are initially recorded at transaction proceeds, which are considered to be the best initial estimate of fair value. The Company engaged the services of a third party independent valuation firm to determine fair value of investments held by the Company. Fair value is determined using a discounted cash flow model that primarily considers changes in interest rates and credit spreads, weighted average life and current performance of the underlying collateral. The Company classified the commercial mortgage loans held-for-sale, measured at fair value as Level III.
The fair value for Treasury note futures is derived using market prices. Treasury note futures trade on the Chicago Mercantile Exchange (“CME”). The instruments are a variety of recently issued 10-year U.S. Treasury notes. The future contracts are liquid and are centrally cleared through the CME. Treasury note futures are generally categorized in Level I of the fair value hierarchy.
The fair value for credit default swap contracts is derived using a pricing model that is widely accepted by marketplace participants. Credit default swaps are traded in the OTC market. The pricing model takes into account multiple inputs including specific contract terms, interest rate yield curves, interest rates, credit curves, recovery rates, and current credit spreads obtained from swap counterparties and other market participants. Most inputs into the model are not subjective as they are observable in the marketplace or set per the contract. Valuation is primarily determined by the difference between the contract spread and the current market spread. The contract spread (or rate) is generally fixed and the market spread is determined by the credit risk of the underlying debt or reference entity. If the underlying indices are liquid and the OTC market for the current spread is active, credit default swaps and interest rate swaps are categorized in Level II of the fair value hierarchy. If the underlying indices are illiquid and the OTC market for the current spread is not active, credit default swaps are categorized in Level III of the fair value hierarchy. The credit default swaps and interest rate swaps are generally categorized in Level II of the fair value hierarchy.
A review of the fair value hierarchy classification is conducted on a quarterly basis. Changes in the type of inputs may result in a reclassification for certain assets. The Company's policy with respect to transfers between levels of the fair value hierarchy is to recognize transfers into and out of each level as of the beginning of the reporting period. There were no transfers between levels within fair value hierarchy during the quarter ended March 31, 2018 and December 31, 2017.
23
BENEFIT STREET PARTNERS REALTY TRUST, INC.
NOTES TO CONSOLIDATED FINANCIAL STATEMENTS
March 31, 2018
(Unaudited)
The following table presents information about the Company’s financial instruments carried at fair value on a recurring basis in the consolidated balance sheets by its level in the fair value hierarchy as of March 31, 2018 and December 31, 2017 (dollars in thousands):
:
Total | Level I | Level II | Level III | |||||||||||||
March 31, 2018 | ||||||||||||||||
Assets, at fair value | ||||||||||||||||
Commercial mortgage loans, held-for-sale (1) | $ | 69,465 | $ | — | $ | — | $ | 69,465 | ||||||||
Credit default swaps | 520 | — | 520 | — | ||||||||||||
Interest rate swaps | 301 | — | 301 | — | ||||||||||||
Total assets, at fair value | $ | 70,286 | $ | — | $ | 821 | — | $ | 69,465 | |||||||
Liabilities, at fair value | ||||||||||||||||
Credit default swaps | $ | 42 | $ | — | $ | 42 | $ | — | ||||||||
Interest rate swaps | 287 | — | 287 | — | ||||||||||||
Treasury note futures | 186 | 186 | — | — | ||||||||||||
Total liabilities, at fair value | $ | 515 | $ | 186 | $ | 329 | $ | — | ||||||||
December 31, 2017 | ||||||||||||||||
Assets, at fair value | ||||||||||||||||
Real estate securities | $ | — | $ | — | $ | — | $ | — | ||||||||
Commercial mortgage loans, held-for-sale (1) | 28,531 | — | — | 28,531 | ||||||||||||
Treasury note futures | 132 | 132 | — | — | ||||||||||||
Total assets, at fair value | $ | 28,663 | $ | 132 | $ | — | $ | 28,531 | ||||||||
Liabilities, at fair value | ||||||||||||||||
Credit default swaps | $ | 357 | $ | — | $ | 357 | $ | — | ||||||||
Total liabilities, at fair value | $ | 357 | $ | — | $ | 357 | $ | — | ||||||||
________________________
(1) Loans held in the Company's TRS, reported within Commercial mortgage loans, held-for-sale, measured at fair value on the consolidated balance sheets.
Both observable and unobservable inputs may be used to determine the fair value of positions that the Company has classified within the Level III category. As a result, the unrealized gains and losses for assets and liabilities within the Level III category may include changes in fair value that were attributable to both observable and unobservable inputs. The following table summarizes the valuation method and significant unobservable inputs used for the Company’s financial instruments that are categorized within Level III of the fair value hierarchy as of March 31, 2018 and December 31, 2017 (dollars in thousands).
Asset Category | Fair Value | Valuation Methodologies | Unobservable Inputs (1) | Weighted Average (2) | Range | |
March 31, 2018 | Commercial mortgage loans, held-for-sale, measured at fair value | $69,465 | Discounted Cash Flow | Yield | 5.15% | 4.8% - 6.2% |
December 31, 2017 | Commercial mortgage loans, held-for-sale, measured at fair value | $28,531 | Discounted Cash Flow | Yield | 4.93% | 4.8% - 5.3% |
(1) In determining certain of these inputs, the Company evaluates a variety of factors including economic conditions, industry and market developments, market valuations of comparable companies and company specific developments including exit strategies and realization opportunities. The Company has determined that market participants would take these inputs into account when valuing the investments.
(2) Inputs were weighted based on the fair value of the investments included in the range.
24
BENEFIT STREET PARTNERS REALTY TRUST, INC.
NOTES TO CONSOLIDATED FINANCIAL STATEMENTS
March 31, 2018
(Unaudited)
The following table presents additional information about the Company’s financial instruments which are measured at fair value on a recurring basis as of March 31, 2018 and December 31, 2017 for which the Company has used Level III inputs to determine fair value (dollars in thousands):
March 31, 2018 | ||||||||
Commercial Mortgage Loans, held-for-sale, measured at fair value | Real Estate Securities | |||||||
Beginning balance, January 1, 2018 | $ | 28,531 | $ | — | ||||
Transfers into Level III | — | — | ||||||
Realized gain on sale of commercial mortgage loan held-for-sale | 2,304 | — | ||||||
Unrealized gains (losses) | 635 | |||||||
Purchases | 119,695 | — | ||||||
Sales / paydowns | (81,700 | ) | — | |||||
Transfers out of Level III | — | — | ||||||
Ending balance, March 31, 2018 | $ | 69,465 | $ | — | ||||
December 31, 2017 | ||||||||
Commercial Mortgage Loans, held-for-sale, measured at fair value | Real Estate Securities | |||||||
Beginning balance, January 1, 2017 | $ | — | $ | 49,049 | ||||
Transfers into Level III | — | — | ||||||
Realized gain on sale of real estate securities | — | 172 | ||||||
Realized gain on sale of commercial mortgage loan held-for-sale | 4,523 | — | ||||||
Impairment losses on real estate securities | — | |||||||
Net accretion | — | 167 | ||||||
Unrealized gains (losses) included in OCI (1) | — | 500 | ||||||
Purchases | 156,101 | — | ||||||
Sales | (132,093 | ) | (34,888 | ) | ||||
Cash repayments/receipts | — | (15,000 | ) | |||||
Transfers out of Level III | — | — | ||||||
Ending balance, December 31, 2017 | $ | 28,531 | $ | — | ||||
________________________
(1) - Unrealized gains included in Other comprehensive income ("OCI") are attributable to assets held at December 31, 2017.
25
BENEFIT STREET PARTNERS REALTY TRUST, INC.
NOTES TO CONSOLIDATED FINANCIAL STATEMENTS
March 31, 2018
(Unaudited)
Financial Instruments Not Measured at Fair Value
The fair values of the Company's commercial mortgage loans, held-for-investment and collateralized loan obligations, which are not reported at fair value on the consolidated balance sheets are reported below as of March 31, 2018 and December 31, 2017 (dollars in thousands):
Level | Carrying Amount | Fair Value | |||||||||
March 31, 2018 | |||||||||||
Commercial mortgage loans, held-for-investment (1) | Asset | III | $ | 1,629,399 | $ | 1,621,843 | |||||
Collateralized loan obligation | Liability | II | 690,765 | 702,674 | |||||||
December 31, 2017 | |||||||||||
Commercial mortgage loans, held-for-investment (1) | Asset | III | 1,403,512 | 1,396,406 | |||||||
Collateralized loan obligation | Liability | II | 826,150 | 842,812 | |||||||
________________________
1 The carrying value is gross of $1.5 million and $1.5 million of allowance for loan losses as of March 31, 2018 and December 31, 2017, respectively.
The fair value of the commercial mortgage loans, held-for-investment is estimated using a discounted cash flow analysis, based on the Advisor's experience with similar types of investments. The Company estimates the fair value of the collateralized loan obligations using external broker quotes.
26
BENEFIT STREET PARTNERS REALTY TRUST, INC.
NOTES TO CONSOLIDATED FINANCIAL STATEMENTS
March 31, 2018
(Unaudited)
Note 11 - Derivative Instruments
The Company uses derivative instruments primarily to economically manage the fair value variability of fixed rate assets caused by interest rate fluctuations and overall portfolio market risk.
As of March 31, 2018, the net premiums paid on derivative instrument assets were $0.5 million.
The following derivative instruments were outstanding as of March 31, 2018 and December 31, 2017 (dollars in thousands):
Fair Value | |||||||||||||||
Contract type | Notional | Assets (1) | Liabilities (1) | Net | |||||||||||
As of March 31, 2018 | |||||||||||||||
Credit default swaps | $ | 40,000 | $ | 520 | $ | 42 | $ | 478 | |||||||
Interest rate swaps | 22,000 | 301 | 287 | $ | 14 | ||||||||||
Treasury note futures | 30,099 | — | 186 | $ | (186 | ) | |||||||||
Total | $ | 92,099 | $ | 821 | $ | 515 | $ | 306 | |||||||
As of December 31, 2017 | |||||||||||||||
Credit default swaps | $ | 30,000 | $ | 32 | $ | 357 | $ | (325 | ) | ||||||
Treasury note futures | 43,906 | 100 | — | $ | 100 | ||||||||||
Total | $ | 73,906 | $ | 132 | $ | 357 | $ | (225 | ) | ||||||
_______________________
(1) Shown as derivative instruments, at fair value, in the accompanying consolidated balance sheets.
The following table indicates the net realized and unrealized losses on derivatives, by primary underlying risk exposure, as included in loss on derivative instruments in the consolidated statements of operations for the three months ended March 31, 2018. The Company did not have any net realized and unrealized gain or loss on derivatives during the three months ended March 31, 2017 (dollars in thousands).
Three Months Ended March 31, 2018 | ||||||||||||
Unrealized Gain/(Loss) | Realized Gain/(Loss) | Total | ||||||||||
Contract type | ||||||||||||
Credit default swaps | $ | 376 | $ | (11 | ) | $ | 365 | |||||
Interest rate swaps | (287 | ) | 244 | $ | (43 | ) | ||||||
Treasury note futures | (286 | ) | 1,013 | 727 | ||||||||
Total | $ | (197 | ) | $ | 1,246 | $ | 1,049 | |||||
27
BENEFIT STREET PARTNERS REALTY TRUST, INC.
NOTES TO CONSOLIDATED FINANCIAL STATEMENTS
March 31, 2018
(Unaudited)
Note 12 - Offsetting Assets and Liabilities
The Company's consolidated balance sheets used a gross presentation of repurchase agreements and collateral pledged. The table below provides a gross presentation, the effects of offsetting and a net presentation of the Company's repurchase agreements within the scope of ASC 210-20, Balance Sheet—Offsetting, as of March 31, 2018 and December 31, 2017 (dollars in thousands):
Gross Amounts Not Offset on the Balance Sheet | ||||||||||||||||||||||||
Assets | Gross Amounts of Recognized Assets | Gross Amounts Offset on the Balance Sheet | Net Amount of Assets Presented on the Balance Sheet | Financial Instruments | Cash Collateral Pledged | Net Amount | ||||||||||||||||||
March 31, 2018 | ||||||||||||||||||||||||
Derivative instruments, at fair value | $ | 821 | $ | — | $ | 821 | $ | — | $ | — | $ | — | ||||||||||||
December 31, 2017 | ||||||||||||||||||||||||
Derivative instruments, at fair value | $ | 132 | $ | — | $ | 132 | $ | — | $ | — | $ | — | ||||||||||||
Gross Amounts Not Offset on the Balance Sheet | ||||||||||||||||||||||||
Liabilities | Gross Amounts of Recognized Liabilities | Gross Amounts Offset on the Balance Sheet | Net Amount of Liabilities Presented on the Balance Sheet | Financial Instruments | Cash Collateral Pledged (2) | Net Amount | ||||||||||||||||||
March 31, 2018 | ||||||||||||||||||||||||
Repurchase agreements, commercial mortgage loans | $ | 501,310 | $ | — | $ | 501,310 | $ | 777,354 | $ | 5,567 | $ | — | ||||||||||||
Derivative instruments, at fair value | 515 | — | 515 | — | 4,584 | — | ||||||||||||||||||
December 31, 2017 | ||||||||||||||||||||||||
Repurchase agreements, commercial mortgage loans | $ | 65,690 | $ | — | $ | 65,690 | $ | 163,235 | $ | 5,005 | $ | — | ||||||||||||
Repurchase agreements, real estate securities (1) | 39,035 | — | 39,035 | 56,044 | — | — | ||||||||||||||||||
Derivative instruments, at fair value | 357 | — | 357 | — | 2,961 | — | ||||||||||||||||||
________________________
(1) Includes $56.0 million of Tranche C of Company issued CLO held by the Company, which eliminates within the real estate securities, at fair value line of the consolidated balance sheets as of December 31, 2017.
(2) These cash collateral amounts are recorded within the Restricted cash balance on the consolidated balance sheets.
Note 13 - Segment Reporting
We conduct our business through the following reporting segments:
• | The real estate debt business focuses on originating, acquiring and asset managing commercial real estate debt investments, including first mortgage loans, subordinate mortgages, mezzanine loans and participations in such loans. |
• | The real estate securities business focuses on investing in and asset managing commercial real estate securities primarily consisting of CMBS and may include unsecured REIT debt, CDO notes and other securities. |
28
BENEFIT STREET PARTNERS REALTY TRUST, INC.
NOTES TO CONSOLIDATED FINANCIAL STATEMENTS
March 31, 2018
(Unaudited)
• | The real estate conduit business operated through the Company's TRS, which is focused on generating risk-adjusted returns by originating and subsequently selling fixed-rate commercial real estate loans into the CMBS securitization market at a profit. |
The following table represents the Company's operations by segment for the three months ended March 31, 2018 and 2017 (dollars in thousands):
Three Months Ended March 31, 2018 | Total | Real Estate Debt | Real Estate Securities | TRS | ||||||||||||
Interest income | $ | 29,408 | $ | 28,515 | $ | — | $ | 893 | ||||||||
Interest expense | 18,674 | 17,761 | 161 | 752 | ||||||||||||
Net income (loss) | 5,296 | 3,981 | (161 | ) | 1,476 | |||||||||||
Total assets | 1,827,715 | 1,719,757 | — | 107,958 | ||||||||||||
Three Months Ended March 31, 2017 | ||||||||||||||||
Interest income | 18,879 | 18,208 | 671 | — | ||||||||||||
Interest expense | 5,428 | 4,993 | 435 | — | ||||||||||||
Net income | 6,049 | 5,949 | 100 | — | ||||||||||||
Total assets | 1,255,278 | 1,229,244 | 26,034 | — | ||||||||||||
For the purposes of the table above, any expenses not associated with a specific segment have been allocated to the business segments using a percentage derived by using the sum of commercial mortgage loans, net and real estate securities, at fair value as the denominator and commercial mortgage loans, net and real estate securities, at fair value as the numerators.
Note 14 - Subsequent Events
The Company has evaluated subsequent events through the filing of this Quarterly Report on Form 10-Q and determined that there have not been any events that have occurred that would require adjustments to disclosures in the consolidated financial statements except for the following transactions:
Distributions Paid
On April 2, 2018, the Company paid a distribution of $3.9 million to stockholders of record as of March 31, 2018. Approximately $2.7 million of the distribution was paid in cash, while $1.2 million was used to purchase 63,068 shares for those stockholders that chose to reinvest distributions through the DRIP.
29
Item 2. Management's Discussion and Analysis of Financial Condition and Results of Operations
The following discussion and analysis should be read in conjunction with the accompanying financial statements of Benefit Street Partners Realty Trust, Inc., the notes thereto, and other financial information included elsewhere in this Quarterly Report on Form 10-Q, as well as our Annual Report on Form 10-K for the fiscal year ended December 31, 2017 filed with the U.S. Securities and Exchange Commission (the "SEC") on March 16, 2018.
As used herein, the terms "we," "our" and "us" refer to Benefit Street Partners Realty Trust, Inc., a Maryland corporation, and, as required by context, to Benefit Street Partners Realty Operating Partnership, L.P., a Delaware limited partnership, which we refer to as the "OP," and to its subsidiaries. We are externally managed by Benefit Street Partners L.L.C. (our "Advisor").
The forward-looking statements contained in this Quarterly Report on Form 10-Q may include, but are not limited to, statements as to:
• | our business and investment strategy; |
• | our ability to make investments in a timely manner or on acceptable terms; |
• | current credit market conditions and our ability to obtain long-term financing for our investments in a timely manner and on terms that are consistent with what we project when we invest; |
• | the effect of general market, real estate market, economic and political conditions, including the recent economic slowdown and dislocation in the global credit markets; |
• | our ability to make scheduled payments on our debt obligations; |
• | our ability to generate sufficient cash flows to make distributions to our stockholders; |
• | our ability to generate sufficient debt and equity capital to fund additional investments |
• | our ability to refinance our existing financing arrangements; |
• | the degree and nature of our competition; |
• | the availability of qualified personnel; |
• | we may be deemed to be an investment company under the Investment Company Act of 1940, as amended (the "Investment Company Act"), and thus subject to regulation under the Investment Company Act; and |
• | our ability to maintain our qualification as a real estate investment trust ("REIT"); and |
• | other factors set forth under the caption "Risk Factors" in our Annual Report on Form 10-K for the year ended December 31, 2017. |
In addition, words such as "anticipate," "believe," "expect" and "intend" indicate a forward-looking statement, although not all forward-looking statements include these words. The forward-looking statements contained in this Quarterly Report on Form 10-Q involve risks and uncertainties. Our actual results could differ materially from those implied or expressed in the forward-looking statements for any reason.
Our investors should not place undue reliance on these forward-looking statements. The forward-looking statements made in this Quarterly Report on Form 10-Q relate only to events as of the date on which the statements are made. We undertake no obligation to update any forward-looking statement to reflect events or circumstances occurring after the date of this Quarterly Report on Form 10-Q.
Overview
We were incorporated in Maryland on November 15, 2012 and have conducted our operations to qualify as a REIT for U.S. federal income tax purposes beginning with our taxable year ended December 31, 2013. The Company, through a subsidiary which is treated as a TRS, is indirectly subject to U.S. federal, state and local income taxes. On May 14, 2013, we commenced business operations after raising in excess of $2.0 million of equity, the amount required for us to release equity proceeds from escrow. We primarily originate, acquire and manage a diversified portfolio of commercial real estate debt investments secured by properties located within and outside of the United States. Commercial real estate debt investments may include first mortgage loans, subordinated mortgage loans, mezzanine loans and participations in such loans. Substantially all of our business is conducted through the OP, a Delaware limited partnership. We are the sole general partner and directly or indirectly hold all of the units of limited partner interests in the OP.
The Company has no direct employees. On September 29, 2016 we terminated our advisory agreement with our Former Advisor and entered into, and executed, an advisory agreement with Benefit Street Partners L.L.C., which was subsequently amended on January 19, 2018. The appointment of the Advisor and the execution of the Advisory Agreement were recommended by a special committee of our board of directors consisting exclusively of our independent directors. The special committee, with the assistance of its independent financial advisor and independent legal counsel, conducted a competitive process to select a new advisor before selecting the Advisor. Our Advisor manages our affairs on a day-to-day basis. The Advisor receives compensation and fees for services related to the investment and management of our assets and our operations.
30
The Advisor, an SEC-registered investment adviser, is a credit-focused alternative asset management firm. The Advisor manages funds for institutions and high-net-worth investors across various credit funds and complementary strategies including high yield, levered loans, private / opportunistic debt, liquid credit, structured credit and commercial real estate debt. These strategies complement each other as they all leverage the sourcing, analytical, compliance, and operational capabilities that encompass the Advisor’s robust platform.
The Company invests in commercial real estate debt investments, which may include first mortgage loans, subordinated mortgage loans, mezzanine loans and participations in such loans. The Company also originates conduit loans which the Company intends to sell through its TRS into CMBS securitization transactions at a profit.
The Company may also invest in commercial real estate securities. Real estate securities may include CMBS, senior unsecured debt of publicly traded REITs, debt or equity securities of other publicly traded real estate companies and CDOs.
On November 9, 2017, our board of directors unanimously approved and established an estimated (“NAV”) per share of $19.02. Refer to "Item 5. Market for Registrant's Common Equity, Related Stockholder Matters and Issuer Purchases of Equity Securities" in our Annual Report on Form 10-K for the fiscal year ended December 31, 2017 for additional information regarding our estimated NAV per share.
Significant Accounting Policies and Use of Estimates
A summary of our significant accounting policies is set forth in Note 2 - Summary of Significant Accounting Policies to our consolidated financial statements included in this Quarterly Report on Form 10-Q. A full disclosure of our significant accounting polices is disclosed in our Annual Report on Form 10-K for the year ended December 31, 2017.
Portfolio
As of March 31, 2018 and December 31, 2017, our portfolio consisted of 82 and 69 commercial mortgage loans, excluding commercial mortgage loans accounted for under the fair value option, respectively. The commercial mortgage loans held for investment had a total carrying value, net of allowance for loan losses, of $1,627.9 million and $1,402.0 million, respectively. As of March 31, 2018 and December 31, 2017, the Company's total commercial mortgage loans, held for sale, measured at fair value comprised of 9 and 3 loans, respectively. We had no CMBS investments as of March 31, 2018 and December 31, 2017. For our commercial mortgage loans, excluding commercial mortgage loans accounted for under the fair value option, we currently estimate loss rates based on historical realized losses experienced in the industry and take into account current collateral and economic conditions affecting the probability or severity of losses when establishing the allowance for loan losses. We recorded a general allowance for loan losses as of March 31, 2018 and December 31, 2017 in the amount of $1.5 million and $1.5 million, respectively. There were no impaired or specifically reserved loans in the portfolio as of March 31, 2018 and December 31, 2017.
As of March 31, 2018 and December 31, 2017, our commercial mortgage loans, excluding commercial mortgage loans accounted for under the fair value option had a weighted average coupon of 6.6% and 6.7%, and a weighted average life of 1.5 and 1.3 years, respectively. We had no CMBS as of March 31, 2018 and December 31, 2017.
31
The following charts summarize our portfolio as a percentage of par value, excluding commercial mortgage loans, held-for- sale, at fair value, by the collateral type, geographical region and coupon rate type as of March 31, 2018 and December 31, 2017:
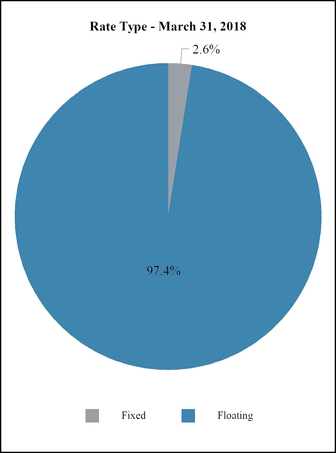
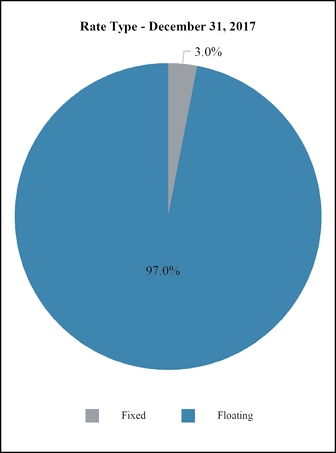
32
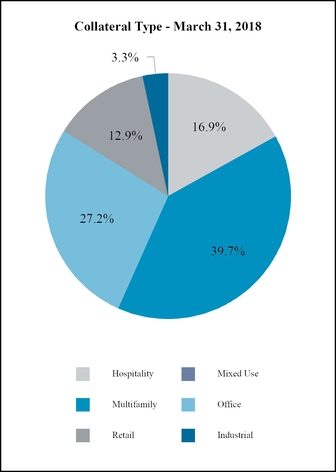
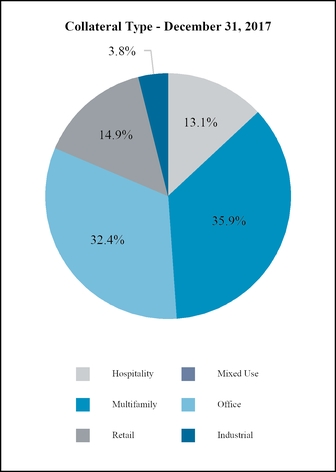
33
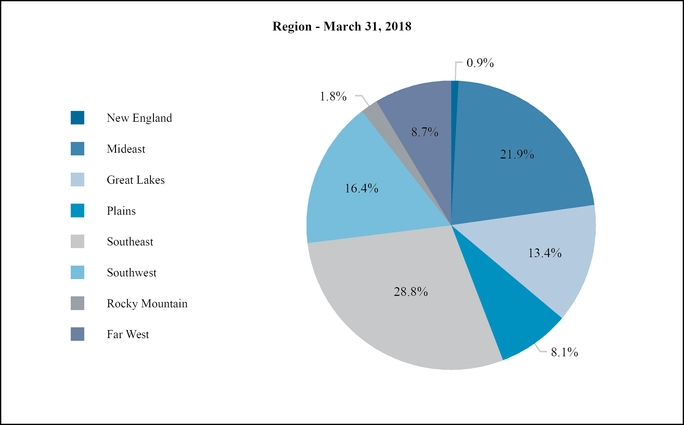
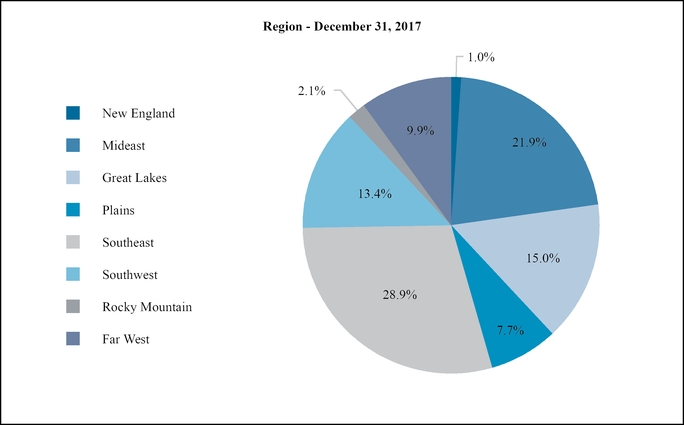
34
An investments region classification is defined according to the below map based on the location of investments' secured property.
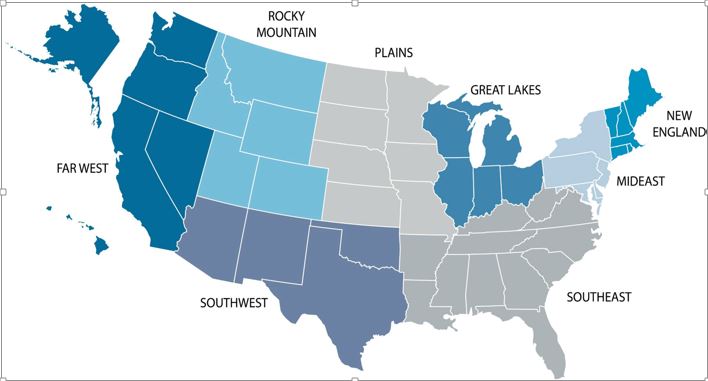
The following charts show the par value by contractual maturity year for the investments in our portfolio as of March 31, 2018 and December 31, 2017.
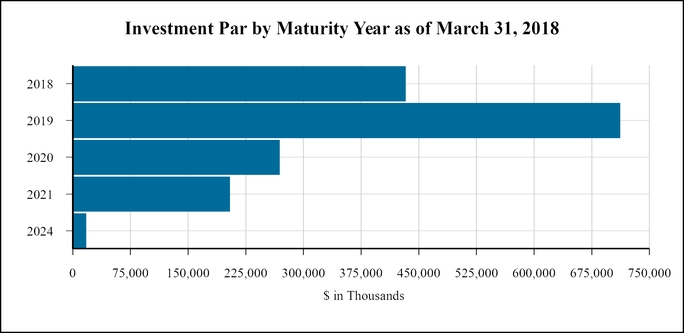
35
The following table shows selected data from our commercial mortgage loans portfolio as of March 31, 2018 (dollars in thousands):
Loan Type | Property Type | Par Value | Interest Rate (1) | Effective Yield | Loan to Value (2) |
Senior Debt 1 | Office | $31,250 | 1M LIBOR + 4.50% | 6.3% | 71.1% |
Senior Debt 2 | Retail | 9,450 | 1M LIBOR + 4.90% | 6.7% | 69.2% |
Senior Debt 3 | Office | 41,885 | 1M LIBOR + 5.25% | 7.0% | 72.1% |
Senior Debt 4 | Retail | 11,684 | 1M LIBOR + 4.50% | 6.3% | 74.8% |
Senior Debt 5 | Retail | 11,040 | 1M LIBOR + 5.25% | 7.0% | 72.0% |
Senior Debt 6 | Hospitality | 16,800 | 1M LIBOR + 4.90% | 6.7% | 74.0% |
Senior Debt 7 | Multifamily | 26,636 | 1M LIBOR + 4.25% | 6.0% | 79.7% |
Senior Debt 8 | Retail | 14,600 | 1M LIBOR + 4.25% | 6.0% | 65.0% |
Senior Debt 9 | Retail | 27,249 | 1M LIBOR + 4.75% | 6.5% | 67.4% |
Senior Debt 10 | Office | 10,430 | 1M LIBOR + 4.65% | 6.4% | 70.8% |
Senior Debt 11 | Industrial | 19,553 | 1M LIBOR + 4.25% | 6.0% | 68.0% |
Senior Debt 12 | Multifamily | 18,941 | 1M LIBOR + 4.20% | 6.0% | 76.4% |
Senior Debt 13 | Hospitality | 15,375 | 1M LIBOR + 5.30% | 7.1% | 73.5% |
Senior Debt 14 | Office | 45,235 | 1M LIBOR + 5.50% | 7.3% | 72.6% |
Senior Debt 15 | Retail | 7,500 | 1M LIBOR + 5.00% | 6.8% | 59.0% |
Senior Debt 16 | Retail | 4,725 | 1M LIBOR + 5.50% | 7.3% | 72.0% |
Senior Debt 17 | Multifamily | 44,595 | 1M LIBOR + 4.25% | 6.0% | 77.0% |
Senior Debt 18 | Office | 14,250 | 1M LIBOR + 4.75% | 6.5% | 74.4% |
Senior Debt 19 | Multifamily | 5,538 | 1M LIBOR + 3.85% | 5.6% | 76.8% |
Senior Debt 20 | Multifamily | 5,519 | 1M LIBOR + 3.95% | 5.7% | 77.5% |
Senior Debt 21 | Multifamily | 13,120 | 1M LIBOR + 3.95% | 5.7% | 78.2% |
Senior Debt 22 | Multifamily | 5,894 | 1M LIBOR + 4.05% | 5.8% | 80.0% |
Senior Debt 23 | Industrial | 33,655 | 1M LIBOR + 4.00% | 5.8% | 65.0% |
Senior Debt 24 | Office | 12,000 | 1M LIBOR + 4.75% | 6.5% | 54.1% |
Senior Debt 25 | Office | 35,000 | 1M LIBOR + 5.00% | 6.8% | 79.0% |
Senior Debt 26 | Office | 29,163 | 1M LIBOR + 4.25% | 6.0% | 73.3% |
Senior Debt 27 | Office | 20,530 | 1M LIBOR + 5.35% | 7.1% | 48.2% |
Senior Debt 28 | Multifamily | 14,000 | 1M LIBOR + 5.00% | 6.8% | 56.3% |
36
Loan Type | Property Type | Par Value | Interest Rate (1) | Effective Yield | Loan to Value (2) |
Senior Debt 29 | Retail | 13,700 | 1M LIBOR + 4.75% | 6.5% | 62.6% |
Senior Debt 30 | Retail | 28,900 | 1M LIBOR + 4.73% | 6.5% | 73.1% |
Senior Debt 31 | Retail | 12,700 | 1M LIBOR + 5.00% | 6.8% | 73.3% |
Senior Debt 32 | Multifamily | 29,258 | 1M LIBOR + 6.75% | 8.5% | 72.8% |
Senior Debt 33 | Retail | 15,750 | 1M LIBOR + 5.25% | 7.0% | 70.5% |
Senior Debt 34 | Retail | 25,000 | 1M LIBOR + 4.40% | 6.2% | 71.4% |
Senior Debt 35 | Multifamily | 15,556 | 1M LIBOR + 7.10% | 8.9% | 76.4% |
Senior Debt 36 | Hospitality | 12,600 | 1M LIBOR + 5.50% | 7.3% | 61.6% |
Senior Debt 37 | Hospitality | 11,750 | 1M LIBOR + 5.50% | 7.3% | 71.2% |
Senior Debt 38 | Retail | 20,450 | 1M LIBOR + 5.00% | 6.8% | 60.9% |
Senior Debt 39 | Multifamily | 26,000 | 1M LIBOR + 5.25% | 7.0% | 69.7% |
Senior Debt 40 | Hospitality | 14,900 | 1M LIBOR + 6.25% | 8.0% | 69.0% |
Senior Debt 41 | Office | 11,580 | 1M LIBOR + 4.45% | 6.2% | 64.2% |
Senior Debt 42 | Office | 9,750 | 1M LIBOR + 5.50% | 7.3% | 74.0% |
Senior Debt 43 | Multifamily | 39,700 | 1M LIBOR + 5.50% | 7.3% | 76.0% |
Senior Debt 44 | Multifamily | 25,500 | 1M LIBOR + 4.85% | 6.6% | 83.1% |
Senior Debt 45 | Retail | 7,500 | 1M LIBOR + 5.25% | 7.0% | 70.5% |
Senior Debt 46 | Office | 62,040 | 1M LIBOR + 4.50% | 6.3% | 69.2% |
Senior Debt 47 | Multifamily | 42,934 | 1M LIBOR + 4.50% | 6.3% | 73.8% |
Senior Debt 48 | Hospitality | 8,875 | 1M LIBOR + 6.20% | 8.0% | 67.7% |
Senior Debt 49 | Office | 25,120 | 1M LIBOR + 4.15% | 5.9% | 69.5% |
Senior Debt 50 | Multifamily | 34,875 | 1M LIBOR + 3.75% | 5.5% | 71.2% |
Senior Debt 51 | Office | 12,400 | 1M LIBOR + 4.00% | 5.8% | 69.7% |
Senior Debt 52 | Multifamily | 81,000 | 1M LIBOR + 4.75% | 6.5% | 69.4% |
Senior Debt 53 | Hospitality | 10,600 | 1M LIBOR + 5.00% | 6.8% | 61.6% |
Senior Debt 54 | Office | 20,231 | 1M LIBOR + 4.25% | 6.0% | 68.6% |
Senior Debt 55 | Hospitality | 7,700 | 1M LIBOR + 5.75% | 7.5% | 77.0% |
Senior Debt 56 | Multifamily | 15,843 | 1M LIBOR + 3.62% | 5.4% | 69.5% |
Senior Debt 57 | Multifamily | 13,740 | 1M LIBOR + 4.75% | 6.5% | 63.9% |
Senior Debt 58 | Hospitality | 57,075 | 1M LIBOR + 4.75% | 6.5% | 51.8% |
Senior Debt 59 | Multifamily | 13,481 | 1M LIBOR + 4.50% | 6.3% | 68.4% |
Senior Debt 60 | Multifamily | 26,111 | 1M LIBOR + 4.50% | 6.3% | 22.4% |
Senior Debt 61 | Hospitality | 10,250 | 1M LIBOR + 5.25% | 7.0% | 60.7% |
Senior Debt 62 | Hospitality | 12,850 | 1M LIBOR + 4.41% | 6.2% | 48.1% |
Senior Debt 63 | Multifamily | 16,100 | 1M LIBOR + 3.60% | 5.4% | 80.5% |
Senior Debt 64 | Multifamily | 11,841 | 1M LIBOR + 3.30% | 5.1% | 70.9% |
Senior Debt 65 | Multifamily | 27,300 | 1M LIBOR + 3.50% | 5.3% | 75.0% |
Senior Debt 66 | Office | 24,350 | 1M LIBOR + 4.65% | 6.4% | 56.4% |
Senior Debt 67 | Hospitality | 21,000 | 1M LIBOR + 4.00% | 5.8% | 54.8% |
Senior Debt 68 | Office | 19,450 | 1M LIBOR + 3.70% | 5.5% | 58.9% |
Senior Debt 69 | Multifamily | 16,925 | 1M LIBOR + 4.25% | 6.0% | 75.0% |
Senior Debt 70 | Multifamily | 14,250 | 1M LIBOR + 3.65% | 5.4% | 77.0% |
Senior Debt 71 | Multifamily | 42,000 | 1M LIBOR + 3.70% | 5.5% | 63.7% |
Senior Debt 72 | Hospitality | 13,500 | 1M LIBOR + 4.75% | 6.5% | 59.9% |
Senior Debt 73 | Hospitality | 10,000 | 1M LIBOR + 4.95% | 6.7% | 52.6% |
Senior Debt 74 | Hospitality | $24,000 | 1M LIBOR + 4.00% | 5.8% | 68.0% |
Senior Debt 75 | Hospitality | $19,700 | 1M LIBOR + 4.40% | 6.2% | 72.7% |
Senior Debt 76 | Hospitality | $18,000 | 5.75% | 5.8% | 52.9% |
Mezzanine 1 | Multifamily | $4,000 | 12.00% | 12.0% | 74.5% |
Mezzanine 2 | Office | $7,000 | 12.00% | 12.0% | 78.3% |
Mezzanine 3 | Multifamily | $3,480 | 9.50% | 9.5% | 84.3% |
Mezzanine 4 | Office | $10,000 | 10.00% | 10.0% | 78.7% |
Mezzanine 5 | Multifamily | $3,000 | 1M LIBOR + 13.00% | 14.8% | 77.7% |
37
Loan Type | Property Type | Par Value | Interest Rate (1) | Effective Yield | Loan to Value (2) |
Mezzanine 6 | Multifamily | $8,433 | 1M LIBOR + 13.00% | 14.8% | 76.4% |
$1,635,665 | 6.6% | 68.4% | |||
________________________
(1) Our floating rate loan agreements contain the contractual obligation for the borrower to maintain an interest rate cap to protect against rising interest rates. In a simple interest rate cap, the borrower pays a premium for a notional principal amount based on a capped interest rate (the "cap rate"). When the floating rate exceeds the cap rate, the borrower receives a payment from the cap counterparty equal to the difference between the floating rate and the cap rate on the same notional principal amount for a specified period of time. When interest rates rise, the value of an interest rate cap will increase, thereby reducing the borrower's exposure to rising interest rates.
(2) Loan to value percentage is from metrics at origination.
The following table shows selected data from our commercial mortgage loans, held-for-sale, measured at fair value (dollars in thousands):
Loan Type | Property Type | Par Value | Interest Rate | Effective Yield | Loan to Value (1) |
TRS Senior 1 | Industrial | $9,600 | 5.11% | 5.1% | 49.7% |
TRS Senior 2 | Retail | 5,830 | 4.90% | 4.9% | 50.0% |
TRS Senior 3 | Multifamily | 5,937 | 5.01% | 5.0% | 71.7% |
TRS Senior 4 | Multifamily | 3,958 | 5.01% | 5.0% | 71.7% |
TRS Senior 5 | Multifamily | 4,500 | 5.53% | 5.5% | 66.0% |
TRS Senior 6 | Retail | 13,375 | 5.19% | 5.2% | 54.1% |
TRS Senior 7 | Retail | 14,750 | 5.25% | 5.3% | 65.6% |
TRS Senior 8 | Office | 6,500 | 5.30% | 5.3% | 59.1% |
TRS Senior 9 | Hospitality | 4,526 | 5.63% | 5.6% | 64.7% |
68,976 | n/m | 60.1% | |||
________________________
(1) Loan to value percentage is from metrics at origination.
n/m - not meaningful.
Results of Operations
Comparison of the Three Months Ended March 31, 2018 to the Three Months Ended March 31, 2017
We conduct our business through the following segments:
• | The real estate debt business focuses on originating, acquiring and asset managing commercial real estate debt investments, including first mortgage loans, subordinate mortgages, mezzanine loans and participations in such loans. |
• | The real estate securities business focuses on investing in and asset managing commercial real estate securities primarily consisting of CMBS and may include unsecured REIT debt, CDO notes and other securities. |
• | The real estate conduit business operated through the Company's TRS, which is focused on generating risk-adjusted returns by originating and subsequently selling fixed-rate commercial real estate loans into the CMBS securitization market at a profit. |
Net Interest Income
Net interest income is generated on our interest-earning assets less related interest-bearing liabilities and is recorded as part of our real estate debt and real estate securities segments.
38
The following table presents the average balance of interest-earning assets less related interest-bearing liabilities, associated interest income and expense and corresponding yield earned and incurred for the three months ended March 31, 2018 and 2017 (dollars in thousands):
________________________
Three Months Ended March 31, | ||||||||||||||||||||||
2018 | 2017 | |||||||||||||||||||||
Average Carrying Value(1) | Interest Income / Expense(2) | WA Yield / Financing Cost(3)(4) | Average Carrying Value(1) | Interest Income / Expense(2) | WA Yield / Financing Cost(3)(4) | |||||||||||||||||
Interest-earning assets: | ||||||||||||||||||||||
Real estate debt | $ | 1,535,788 | $ | 28,515 | 7.4 | % | $ | 1,064,405 | $ | 18,208 | 6.8 | % | ||||||||||
Real estate conduit | 78,833 | 893 | 4.5 | % | — | — | — | % | ||||||||||||||
Real estate securities | — | — | n/a | 43,745 | 671 | 6.1 | % | |||||||||||||||
Total | $ | 1,614,621 | $ | 29,408 | 7.3 | % | $ | 1,108,150 | $ | 18,879 | 6.8 | % | ||||||||||
Interest-bearing liabilities: | ||||||||||||||||||||||
Repurchase agreements - commercial mortgage loans | $ | 313,509 | $ | 4,212 | 5.4 | % | $ | 280,468 | $ | 2,824 | 4.0 | % | ||||||||||
Other financing - commercial mortgage loans | 21,242 | 489 | 9.2 | % | — | — | — | % | ||||||||||||||
Repurchase agreements - real estate securities | 19,542 | 161 | 3.3 | % | 63,611 | 435 | 2.7 | % | ||||||||||||||
Collateralized loan obligations | 740,796 | 13,722 | 7.4 | % | 258,653 | 2,169 | 3.4 | % | ||||||||||||||
Derivative instruments | — | 90 | n/a | — | — | n/a | ||||||||||||||||
Total | $ | 1,095,089 | $ | 18,674 | 6.8 | % | $ | 602,732 | $ | 5,428 | 3.6 | % | ||||||||||
Net interest income/spread | $ | 10,734 | 0.5 | % | $ | 13,451 | 3.2 | % | ||||||||||||||
Average leverage %(5) | 67.8 | % | 54.4 | % | ||||||||||||||||||
Weighted average levered yield(6) | 7.6 | % | 8.5 | % | ||||||||||||||||||
(1) Based on amortized cost for real estate debt and real estate securities and principal amount for repurchase agreements. Amounts are calculated based on daily averages for three months ended March 31, 2018 and 2017, respectively.
(2) Includes the effect of amortization of premium or accretion of discount and deferred fees.
(3) Calculated as interest income or expense divided by average carrying value.
(4) Annualized.
(5) Calculated by dividing total average interest-bearing liabilities by total average interest-earning assets.
(6) Calculated by taking the sum of (i) the net interest spread multiplied by the average leverage and (ii) the weighted average yield interest-earning assets.
Interest Income
Interest income earned during the three months ended March 31, 2018 was $10.5 million higher compared to the three months ended March 31, 2017. The increase in interest income was due to an increase in the 1 Month LIBOR, the benchmark index for our loans and an increase of $506.5 million in the average carrying value of our interest-earning assets. As of March 31, 2018, our loans had a total carrying value of $1,698.9 million and no CMBS investments, while as of March 31, 2017, our loans had a total carrying value of $1,065.0 million and our CMBS investments had a fair value of $25.7 million.
Interest income earned during the three months ended March 31, 2018 at the TRS was $0.9 million compared to $0.0 million for the three months ended March 31, 2017. The $0.9 million increase in interest income was due to the formation of the TRS in September 2017.
Interest Expense
Interest expense for the three months ended March 31, 2018 was $13.2 million higher compared to the three months ended March 31, 2017. The increase in interest expense was due to an increase in the 1 Month LIBOR, the benchmark index for our financing lines, a $6.4 million non-cash charge of all the remaining unamortized deferred financing costs related to RFT 2015-FL1, and an increase of $492.4 million in the average carrying value of our interest-bearing liabilities, of which approximately $202.3 million is an increase due to the issuance of two CLOs issued in 2017.
39
Interest expense at the TRS for the three months ended March 31, 2018 at the TRS was $0.8 million compared to $0.0 million for the three months ended March 31, 2017. The $0.8 million increase in interest expense was due to the formation of the TRS in September 2017.
Realized Gain/Loss on Commercial Mortgage Loans Held-for-Sale
Realized loss on commercial mortgage loans held-for-sale for the three months ended March 31, 2018 was $28.0 thousand compared to $0.2 million for the three months ended March 31, 2017. The $0.2 million decrease in realized loss was due to the loss from the sale of one commercial mortgage loan held-for-sale during the three months ended March 31, 2018 versus the sale of two commercial mortgage loans held-for-sale during the three months ended March 31, 2017.
Realized gain on commercial mortgage loans held-for-sale, measured at fair value at the TRS for the three months ended March 31, 2018 was $2.3 million compared to $0.0 million for the three months ended March 31, 2017. The $2.3 million increase in realized gain was due to the sale of fixed-rate commercial real estate loans into the CMBS securitization market during the three months ended March 31, 2018.
Expenses from Operations
Expenses from operations for the three months ended March 31, 2018 and 2017 were made up of the following (dollars in thousands):
Three Months Ended March 31, | ||||||||
2018 | 2017 | |||||||
Asset management and subordinated performance fee | $ | 2,241 | $ | 2,312 | ||||
Acquisition fees and acquisition expenses | 65 | 624 | ||||||
Administrative services expenses | 3,196 | 855 | ||||||
Professional fees | 2,226 | 767 | ||||||
Other expenses | 1,325 | 606 | ||||||
Total expenses | $ | 9,053 | $ | 5,164 | ||||
For the three months ended March 31, 2018, expenses were primarily related to asset management and subordinated performance fees, professional fees and administrative services expenses. During the three months ended March 31, 2018 and March 31, 2017, we incurred $2.2 million and $2.3 million of asset management and subordinated performance fees, respectively, a decrease of $0.1 million. The entire $2.2 million and $2.3 million in the asset management and subordinated performance fee line for the three months ended March 31, 2018 and three months ended March 31, 2017 is composed of asset management fees, as there was no subordinated performance fee due to applicable conditions not having been satisfied.
During the three months ended March 31, 2018 and March 31, 2017, we incurred $3.2 million and $0.9 million of administrative services expenses, respectively, an increase of approximately $2.3 million, primarily due to increased insourced expenses related to selecting, evaluating, originating and acquiring investments. Additionally, during the three months ended March 31, 2018 and March 31, 2017 we incurred $2.2 million and $0.8 million of professional fees, respectively, an increase of approximately $1.4 million, primarily due to nominal loan origination activity during the three months ended March 31, 2017 and professional fees incurred related to the Company's TRS segment.
Liquidity and Capital Resources
Our principal demands for cash will be funding our loan investments, payment of fees and reimbursements to the Advisor, the payment of our operating and administrative expenses, continuing debt service obligations, and distributions to our stockholders. We currently believe that we have sufficient liquidity and capital resources available for all anticipated uses, including the origination of loan investments, required debt service and the payment of cash dividends.
We expect to use additional debt financing as a source of capital. Our board of directors currently intends to operate at a leverage level of between one to three times book value of equity. However, our board of directors may change this target without shareholder approval. We anticipate that adequate cash will be generated from operations to fund our operating and administrative expenses, continuing debt service obligations and the payment of distributions.
In addition to our current mix of financing sources, we may also access additional forms of financings, including credit facilities, securitizations, public and private, secured and unsecured debt issuances by us or our subsidiaries, or through capital recycling initiatives whereby we sell certain assets in our portfolio and reinvest the proceeds in assets with more attractive risk-adjusted returns.
40
Repurchase Agreements, Commercial Mortgage Loans
As of March 31, 2018, we have repurchase facilities with JPMorgan Chase Bank, National Association (the "JPM Repo Facility"), Goldman Sachs Bank USA (the "GS Repo Facility"), U.S. Bank National Association (the "USB Repo Facility"), Barclays Bank PLC (the "Barclays Facility") and Credit Suisse AG (the "CS Repo Facility" and together with JPM Repo Facility, GS Repo Facility, USB Repo Facility, Barclays Facility, the "Repo Facilities").
The JPM Repo Facility has a maturity date of January 30, 2020 plus a one-year extension at the Company's option and provides up to $520.0 million in advances. The GS Repo Facility has a maturity date of December 27, 2018, with a one-year extension at the Company’s option, which may be exercised upon the satisfaction of certain conditions, and provides up to $250.0 million in advances. The USB Repo Facility matures on July 15, 2020, with two one-year extensions at the option of the Company, which may be exercised upon the satisfaction of certain conditions, and provides up to $100.0 million in advances. The CS Repo Facility matures on August 30, 2018 and provides up to $250.0 million in advances. Prior to the end of each calendar quarter, the Company may request an extension of the termination date for an additional 364 days from the end of such calendar quarter subject to the satisfaction of certain conditions and approvals.
We expect to use advances from these Repo Facilities to finance the acquisition or origination of eligible loans, including first mortgage loans, subordinated mortgage loans, mezzanine loans and participation interests therein.
As of March 31, 2018 and December 31, 2017, there was $407.0 million and $42.0 million outstanding under the JPM Repo Facility, respectively. As of March 31, 2018 and December 31, 2017, we had $13.5 million and $13.5 million outstanding under the GS Repo Facility, respectively. As of March 31, 2018 and December 31, 2017, we had $80.8 million and $10.1 million outstanding under the CS Repo Facility, respectively. The Company had no advances under the USB Repo Facility as of March 31, 2018 and December 31, 2017.
The Company entered into the Barclays Facility on September 19, 2017. The Barclays Facility provides for a senior secured $75 million revolving line of credit and bears interest at per annum rates equal to one of two base rates plus an applicable margin. The Barclays Facility has a maturity of September 19, 2019, subject to an extension term of one year, and provides for quarterly interest-only payments, with all principal and interest outstanding being due on the maturity date. The Barclays Facility may be prepaid from time to time and at any time, in whole or in part, without premium or penalty. The Company expects to use advances on the Barclays Facility to finance the origination of eligible loans, including first lien mortgage loans, junior mortgage loans, mezzanine loans, and participation interests therein. As of March 31, 2018 and December 31, 2017, the Company had no advances under the Barclays Facility.
The Repo Facilities generally provide that in the event of a decrease in the value of the Company's collateral, the lenders can demand additional collateral. Should the value of the Company’s collateral decrease as a result of deteriorating credit quality, resulting margin calls may cause an adverse change in the Company’s liquidity position.
Other financing - Commercial Mortgage Loans
We entered into a financing arrangement with Pacific Western Bank for term financing (“PWB Financing”) on May 17, 2017. The PWB Financing provided the Company with $36.2 million and is collateralized by a portfolio asset of $54.2 million. The PWB Financing initially matures on June 9, 2019, with two one-year extension option at the Company’s option. As of March 31, 2018 and December 31, 2017, we had $20.9 million and $26.2 million outstanding under the PWB Financing, respectively.
Repurchase Agreements - Real Estate Securities
We entered into various Master Repurchase Agreements ("MRAs") that allow us to sell real estate securities while providing a fixed repurchase price for the same real estate securities in the future. The repurchase contracts on each security under an MRA generally mature in 30 to 90 days and terms are adjusted for current market rates as necessary.
41
Below is a summary of the Company's MRAs as of March 31, 2018 and December 31, 2017 (dollars in thousands):
Amount | Weighted Average | ||||||||||||||||
Counterparty | Outstanding | Accrued Interest | Collateral Pledged (*) | Interest Rate | Days to Maturity | ||||||||||||
As of March 31, 2018 | |||||||||||||||||
J.P. Morgan Securities LLC | $ | — | $ | — | $ | — | N/A | N/A | |||||||||
Total/Weighted Average | $ | — | $ | — | $ | — | N/A | N/A | |||||||||
As of December 31, 2017 | |||||||||||||||||
J.P. Morgan Securities LLC (1) | $ | 39,035 | $ | 11 | $ | 56,044 | 3.32 | % | 26 | ||||||||
Total/Weighted Average | $ | 39,035 | $ | 11 | $ | 56,044 | 2.50 | % | 26 | ||||||||
(1) Collateral includes $56.0 million Tranche C of Company issued CLO held by the Company, which eliminates within the Real estate securities, at fair value line of the consolidated balance sheets as of December 31, 2017, respectively.
On February 15, 2018, we repaid the outstanding amount of $39.0 million.
Distributions
In order to maintain its election to qualify as a REIT, the Company must currently distribute, at a minimum, an amount equal to 90% of its taxable income, without regard to the deduction for distributions paid and excluding net capital gains. The Company must distribute 100% of its taxable income (including net capital gains) to avoid paying corporate U.S. federal income taxes.
In March 2016, our board of directors authorized and declared ongoing monthly distributions at a rate equivalent to $2.0625 per annum, per share. In August 2017, our board of directors authorized and declared ongoing monthly distributions at a rate equivalent to $1.44 per annum, per share.
The Company's distributions are payable by the fifth day following each month end to stockholders of record at the close of business each day during the prior month. Distribution payments are dependent on the availability of funds. The Company's board of directors may reduce the amount of distributions paid or suspend distribution payments at any time, and therefore, distributions payments are not assured.
The below table shows the distributions paid on shares outstanding during the three months ended March 31, 2018 and 2017 (dollars in thousands):
Three Months Ended March 31, 2018 | ||||||||||
Payment Date | Amount Paid in Cash | Amount Issued under DRIP | ||||||||
January 2, 2018 | $ | 2,649 | $ | 1,242 | ||||||
February 1, 2018 | 2,665 | 1,233 | ||||||||
March 1, 2018 | 2,386 | 1,098 | ||||||||
Total | $ | 7,700 | $ | 3,573 | ||||||
Three Months Ended March 31, 2017 | ||||||||||
Payment Date | Amount Paid in Cash | Amount Issued under DRIP | ||||||||
January 3, 2017 | $ | 3,575 | $ | 2,007 | ||||||
February 1, 2017 | 3,560 | 1,957 | ||||||||
March 1, 2017 | 3,230 | 1,770 | ||||||||
Total | $ | 10,365 | $ | 5,734 | ||||||
42
The following table shows the sources for the payment of distributions to common stockholders for the periods presented (dollars in thousands):
Three Months Ended March 31, | ||||||||||||||
2018 | 2017 | |||||||||||||
Distributions: | ||||||||||||||
Cash distributions paid | $ | 7,700 | $ | 10,365 | ||||||||||
Distributions reinvested | 3,573 | 5,734 | ||||||||||||
Total distributions | $ | 11,273 | $ | 16,099 | ||||||||||
Source of distribution coverage: | ||||||||||||||
Net cash (used in)/provided by operating activities | $ | (32,883 | ) | (291.7 | )% | $ | 20,329 | 72.9 | % | |||||
Available cash on hand | 40,583 | 360.0 | % | 1,826 | 6.5 | % | ||||||||
Common stock issued under DRIP | 3,573 | 31.7 | % | 5,734 | 20.6 | % | ||||||||
Total sources of distributions | $ | 11,273 | 100.0 | % | $ | 27,889 | 100.0 | % | ||||||
Cash flows (used in)/provided by operations (GAAP) | $ | (32,883 | ) | $ | 20,329 | |||||||||
Net income (GAAP) | $ | 5,296 | $ | 6,049 | ||||||||||
The following table compares cumulative distributions paid to cumulative net income (in accordance with GAAP) for the period from November 15, 2012 (date of inception) through March 31, 2018 (dollars in thousands):
For the Period from November 15, 2012 (date of inception) to March 31, 2018 | ||||
Distributions paid: | ||||
Common stockholders in cash | $ | 121,606 | ||
Common stockholders pursuant to DRIP / offering proceeds | 74,048 | |||
Total distributions paid | $ | 195,654 | ||
Reconciliation of net income: | ||||
Net interest income | $ | 185,312 | ||
Realized gain (loss) on sale of real estate securities | (1,734 | ) | ||
Realized gain (loss) on sale of commercial mortgage loan | 204 | |||
Acquisition fees and expenses | (17,370 | ) | ||
Other operating expenses | (74,378 | ) | ||
Net income | 92,034 | |||
Cash flows provided by operations | $ | 39,389 | ||
Cash Flows
Cash Flows for the Three Months Ended March 31, 2018
Net cash used in operating activities for the three months ended March 31, 2018 was $32.9 million. Cash outflows were primarily driven by cash outflows of $123.5 million from origination of commercial mortgage loans, held for sale, measured at fair value, partially offset by $83.1 million of proceeds from the sale of commercial mortgage loans, held for sale.
Net cash used in investing activities for the three months ended March 31, 2018 was $224.8 million. Cash outflows of $374.7 million was due to new originations and purchases of commercial mortgage loans, held for investment. This was partially offset by $149.7 million of proceeds from principal repayments received on commercial mortgage loans, held for investment.
Net cash provided by financing activities for the three months ended March 31, 2018 was $233.8 million. Cash inflows were primarily driven by $435.6 million from net borrowings on the Repo Facilities repurchase agreements offset by cash outflows of $142.0 million on repayments on collateralized loan obligations and net payments of $39.0 million on our CMBS MRAs.
43
Cash Flows for the Three Months Ended March 31, 2017
Net cash provided by operating activities for the three months ended March 31, 2017 was $20.3 million. Cash inflows were primarily driven by net income of $6.0 million and $11.8 million of proceeds from sale of commercial mortgage loans, held for sale.
Net cash provided by investing activities for the three months ended March 31, 2017 was $10.9 million. Cash inflows were primarily driven by proceeds from the sale of real estate securities of $24.7 million and principal repayments of $80.1 million, offset by additional funding of $93.9 million on existing loans.
Net cash used in financing activities for the three months ended March 31, 2017 was $0.8 million. Cash outflows were primarily driven by $83.3 million from net borrowings on the Repo Facilities offset by $14.5 million from net payment on our CMBS MRAS, the payment of $10.4 million in cash distributions paid to stockholders, $9.5 million of stock repurchase and repayments on collateralized loan obligations of $49.5 million.
Election as a REIT
We elected to be taxed as a REIT under Sections 856 through 860 of the Internal Revenue Code commencing with the taxable year ended December 31, 2013. As a REIT, if we meet certain organizational and operational requirements and distribute at least 90% of our "REIT taxable income" (determined before the deduction of dividends paid and excluding net capital gains) to our stockholders in a year, we will not be subject to U.S. federal income tax to the extent of the income that we distribute. Even if we qualify for taxation as a REIT, we may be subject to certain state and local taxes on our income and property, and U.S. federal income and excise taxes on our undistributed income.
Contractual Obligations and Commitments
Our contractual obligations, excluding expected interest payments, as of March 31, 2018 are summarized as follows (dollars in thousands):
Less than 1 year | 1 to 3 years | 3 to 5 years | More than 5 years | Total | ||||||||||||||||
Unfunded loan commitments (1) | $ | 33,339 | $ | 59,724 | $ | 98,914 | $ | — | $ | 191,977 | ||||||||||
JPM Repo Facility | — | 406,996 | — | — | 406,996 | |||||||||||||||
GS Repo Facility | 13,500 | — | — | — | 13,500 | |||||||||||||||
CS Repo Facility | 80,814 | — | — | — | 80,814 | |||||||||||||||
CLOs (2) | — | — | — | 700,862 | 700,862 | |||||||||||||||
PWB Financing | — | 20,910 | — | — | 20,910 | |||||||||||||||
Total | $ | 127,653 | $ | 487,630 | $ | 98,914 | $ | 700,862 | $ | 1,415,059 | ||||||||||
________________________
(1) The allocation of our unfunded loan commitments is based on the earlier of the commitment expiration date or the loan maturity date.
(2) Excludes $16.0 million of Tranche E notes and $14.9 million of Tranche F notes issued by 2017-FL2 Issuer, held by the Company, which are eliminated within the collateralized loan obligation line of the consolidated balance sheets as of March 31, 2018 and December 31, 2017.
In addition, we have contractual obligations under our agreements with the Advisor as described below.
Related Party Arrangements
Benefit Street Partners L.L.C.
Amended Advisory Agreement
On January 19, 2018, we entered into an amendment to the Advisory Agreement. The amended Advisory Agreement amends and restates the Advisory Agreement, dated as of September 29, 2016, by and among the Company, the Operating Partnership and the Advisor.
The Nominating and Corporate Governance Committee (the “Committee”) of our Board, which consists solely of the Company’s independent directors, negotiated, approved and recommended that the Board approve, the amended Advisory Agreement. The Committee engaged independent legal counsel to assist the Committee in negotiating the amended Advisory Agreement.
44
The Advisor will continue to provide the daily management for the Company and the Operating Partnership, including an investment program consistent with the investment objectives and policies of the Company as determined and adopted from time to time by the Board. The Advisor shall continue to be entitled to an asset management fee equal to one and one-half percent (1.5%) of Equity (as defined in the amended Advisory Agreement). The Advisor shall continue to be entitled to an annual subordinated performance fee equal to fifteen percent (15%) of the Total Return (as defined in the amended Advisory Agreement) over a six percent (6%) per annum hurdle, subject to certain limitations. The Advisor shall not be entitled to acquisition or disposition fees. The Company or the Operating Partnership shall continue to pay directly or reimburse the Advisor for all the expenses paid or actually incurred by the Advisor in connection with the services it provides to the Company and the Operating Partnership pursuant to the amended Advisory Agreement, subject to certain limitations.
The initial term of the amended Advisory Agreement is three-years and shall be automatically renewed for additional one-year periods, unless either party elects not to renew. The Company may terminate the amended Advisory Agreement for a Cause Event (as defined in the amended Advisory Agreement) without payment of a termination fee. Following the expiration of a term, and upon 180 days’ prior written notice, the Company may, without cause, elect not to renew the amended Advisory Agreement upon the determination by two-thirds of the Company’s independent directors that (i) there has been unsatisfactory performance by the Advisor or (ii) that the asset management fee and annual subordinated performance fee payable to the Advisor are not fair, subject to certain conditions. In such case, the Company shall be obligated to pay a termination fee.
Pursuant to the amended Advisory Agreement, the Advisor and/or its affiliates are required to acquire equity securities of the Company equal to a purchase price of not less than $10 million, subject to certain conditions, for which, the Advisor and its affiliates on February 14, 2018, have committed to purchase $32.1 million of common stock. During the term of the amended Advisory Agreement, the Advisor shall not, directly or indirectly, manage or advise another REIT that is engaged in the business of the Company in any geographical region in which the Company has a significant investment, or provide any services related to fixed-rate conduit lending to any other person, subject to certain conditions.
Investment in Common Stock
On February 14, 2018 (the “Commitment Date”), the Company entered into stock purchase agreements (collectively, the “Purchase Agreements”), by and between the Company and certain officers of the Company, and certain owners, employees and associates of the Advisor and its affiliates (collectively, the “Manager Investors”), pursuant to which the Manager Investors committed to purchase an aggregate amount of up to approximately $10.0 million of shares of common stock of the Company in one or more closings (each, a “Closing,” and collectively, the “Closings”). The timing of any Closing, and the amount of shares of common stock to be sold at such Closing, will be determined by the Company in its sole discretion, subject to certain limitations. As described in the Purchase Agreements, the Company may enter into additional Purchase Agreements with other investors within 12 months of the Commitment Date.
The Purchase Agreements provide that the purchase price for the shares of common stock shall be equal to 90% of GAAP book value per share of the common stock as of March 31, 2018 (“Book Value”). However, in consideration of them being the first investors to commit to purchase shares in the offering, the Company agreed to sell the shares to the Manager Investors at 88% of Book Value. The Company further agreed that if subsequent investors in the offering are permitted to acquire common stock for less than 90% of Book Value, the effective purchase price of the Manager Investors will be subject to downward adjustment. The Purchase Agreements also provide that the Company will enter into a liquidity event, such as a listing of the common stock, within three years of the Commitment Date, subject to certain restrictions. The Purchase Agreements contain customary representations, warranties and covenants and indemnification provisions.
The Manager Investors have agreed with the Advisor not to sell or otherwise transfer the shares of common stock, without the consent of the Advisor, prior to 180 days after a listing of the Company’s common stock on a national securities exchange. In addition, the Manager Investors will not be eligible to participate in the Company’s amended and restated share repurchase program for at least three years.
The board of directors and the Nominating and Corporate Governance Committee of the board of directors each unanimously approved the Company’s entry into the Purchase Agreements and the terms therein including the offering price.
Advisory Agreement Fees and Reimbursements
Pursuant to the Advisory Agreement, we are or were required to make the following payments and reimbursements to the Advisor:
• | We reimburse our Advisor’s costs of providing services pursuant to the Advisory Agreement, except the salaries and benefits paid by the Advisor to our executive officers. |
• | We pay our Advisor, or its affiliates, a monthly asset management fee equal to one-twelfth of 1.5% of stockholder’s equity as calculated pursuant to the Advisory Agreement. |
45
• | We will pay our Advisor an annual subordinated performance fee calculated on the basis of total return to stockholders, payable monthly in arrears, such that for any year in which total return on stockholders’ capital exceeds 6.0% per annum, our Advisor will be entitled to 15.0% of the excess total return; provided that in no event will the annual subordinated performance fee payable to our Advisor exceed 10.0% of the aggregate total return for such year. |
• | Until September 2017, we paid our Advisor an acquisition fee of 1.0% of the principal amount funded by us to originate or acquire commercial mortgage loans and 1.0% of the anticipated net equity funded by us to acquire real estate securities. |
• | We reimburse our Advisor for insourced expenses incurred by our Advisor on our behalf related to selecting, evaluating, originating and acquiring investments in an amount up to 0.5% of the principal amount funded by us to originate or acquire commercial mortgage loans and up to 0.5% of the anticipated net equity funded by us to acquire real estate securities investments. |
Until September 29, 2016, the Former Advisor served as the Company's advisor and the Company paid the Former Advisor certain fees and expense reimbursements pursuant to its advisory agreement with the Former Advisor. The types of fees and reimbursements paid to the Former Advisor were similar to those paid to the Advisor prior to September 2017. In addition, prior to January 2016 we paid dealer-manager fees and selling commissions to an affiliate of the Former Advisor, prior to February 2016 we paid transfer agent fees to an affiliate of the Former Advisor, and prior to November 2015 we paid various financial services fees to an affiliate of the Former Advisor.
Loan Acquisition
In December 2017, the Company purchased a commercial mortgage loan from an entity that is an affiliate of our Advisor, for an aggregate purchase price of $17.1 million and is included in Commercial mortgage loans, held-for-investment in the consolidated balance sheet. The purchase of the commercial mortgage loan and the $17.1 million purchase price were approved by the Company’s board of directors and the Nominating and Corporate Governance Committee, which consists solely of independent directors.
On February 22, 2018, the Company purchased commercial mortgage loans from an entity that is an affiliate of our Advisor, for an aggregate purchase price of $27.8 million. The purchase of the commercial mortgage loans and the $27.8 million purchase price were approved by the Company’s board of directors.
The table below shows the costs incurred due to arrangements with our Advisor and its affiliates during the three months ended months ended March 31, 2018 and 2017 and the associated payable as of March 31, 2018 and December 31, 2017 (dollars in thousands).
See Note 9 - Related Party Transactions and Arrangements for further detail.
Three Months Ended March 31, | Payable as of | |||||||||||||||
2018 | 2017 | March 31, 2018 | December 31, 2017 | |||||||||||||
Total compensation and reimbursement for services provided by the Former Advisor, its affiliates, entities under common control with the Former Advisor and the Former Dealer Manager | $ | — | $ | — | $ | 480 | $ | 480 | ||||||||
Acquisition fees and expenses(1) | 65 | 624 | — | — | ||||||||||||
Administrative services expenses | 3,196 | 855 | 1,596 | 3,480 | ||||||||||||
Advisory and investment banking fee | — | — | — | — | ||||||||||||
Asset management and subordinated performance fee | 2,241 | 2,312 | 741 | 2,315 | ||||||||||||
Other related party expenses | 199 | 48 | 153 | 146 | ||||||||||||
Total | $ | 5,701 | $ | 3,839 | $ | 2,970 | $ | 6,421 | ||||||||
________________________
(1) Total acquisition fees and expenses paid during the three months ended March 31, 2018 and March 31, 2017 were $1.9 million and $1.4 million respectively, of which $1.9 million and $0.8 million were capitalized within the commercial mortgage loans, held for investment line of the Company's consolidated balance sheet.
The payables as of March 31, 2018 and December 31, 2017 in the table above are included in Due to affiliates on our consolidated balance sheets.
Off Balance Sheet Arrangements
We have no off balance sheet arrangements as of March 31, 2018 and through the date of the filing of this Form 10-Q.
46
Non-GAAP Financial Measures
Funds from Operations and Modified Funds from Operations
Due to certain unique operating characteristics of real estate companies, as discussed below, the National Association of Real Estate Investment Trusts ("NAREIT") and the Investment Program Association ("IPA") industry trade groups, have each promulgated measures respectively known as funds from operations ("FFO") and modified funds from operations ("MFFO"), which we believe to be appropriate supplemental measures to reflect the operating performance of a REIT. The use of FFO and MFFO is recommended by the REIT industry as supplemental performance measures. FFO and MFFO are not equivalents to our net income or loss as determined under generally accepted accounting principles ("GAAP").
We define FFO, a non-GAAP measure, consistent with the standards established by the White Paper on FFO approved by the Board of Governors of NAREIT, as revised in February 2004 (the "White Paper"). The White Paper defines FFO as net income or loss computed in accordance with GAAP, excluding gains or losses from sales of depreciable property, property and asset impairment write-downs, depreciation and amortization, and after adjustments for unconsolidated partnerships and joint ventures. Adjustments for unconsolidated partnerships and joint ventures are calculated to reflect FFO. Our business plan is to operate as a mortgage REIT with our portfolio consisting of commercial mortgage loan investments and investments in real estate securities. We will typically have no FFO adjustments to our net income or loss computed in accordance with GAAP as a result of operating as a mortgage REIT. Although we have the ability to acquire real property, we have not acquired any at this time and as such have not had any FFO adjustments to our net income or loss computed in accordance with GAAP.
Publicly registered, non-listed REITs typically operate differently from exchange traded REITs because they generally have a limited life followed by a liquidity event or other targeted exit strategy. Non-listed REITs typically have a significant amount of acquisition activity and are substantially more dynamic during their initial years of investment and operation as compared to later years when the proceeds from their continuous public offering have been fully invested and when the Company is seeking to implement a liquidity event or other exit strategy. However, it is likely that we will make investments past the acquisition stage, albeit at a substantially lower level.
The origination and acquisition of debt investments is a key operating feature of our business plan that results in the generation of income and cash flows in order to make distributions to stockholders. Acquisition fees paid to our Advisor and acquisition expenses reimbursed to our Advisor in connection with the origination and acquisition of debt investments are evaluated in accordance with GAAP to determine if they should be expensed in the period incurred or capitalized and amortized over the life of the investment. Acquisition fees and acquisition expenses that are deemed to be expensed in the period incurred are included in the computation of net income or loss from operations. The amortization of acquisition fees and acquisition expenses that are able to be capitalized are included in the computation of net income or loss from operations. All such acquisition fees and acquisition expenses are paid in cash when incurred that would otherwise be available to distribute to our stockholders. When proceeds from the Offering have not been sufficient to fund the payment of acquisition fees and the reimbursement of acquisition expenses to our Advisor, such fees and expenses have been paid from other sources, including financings, operating cash flow, net proceeds from the sale of investments or from other cash flows. We believe that acquisition fees and acquisition expenses incurred by us negatively impact our operating performance during the period in which such investments are originated or acquired by reducing cash flows and therefore the potential distributions to stockholders. However, it is likely that we will make investments past the acquisition stage, albeit at a substantially lower level.
We define MFFO, a non-GAAP measure, consistent with the IPA's Guideline 2010 - 01, Supplemental Performance Measure for Publicly Registered, Non-Listed REITs: Modified Funds from Operations (the "Practice Guideline") issued by the IPA in November 2010. We define MFFO as FFO further adjusted for the following items, as applicable: acquisition fees; accretion of discounts and amortization of premiums and other loan expenses on debt investments; fair value adjustments on real estate related investments such as commercial real estate securities or derivative investments included in net income; impairments of real estate related investments, gains or losses included in net income from the extinguishment or sale of debt, hedges, foreign exchange, derivatives or securities holdings where trading of such holdings is not a fundamental attribute of the business plan, unrealized gains or losses from fair value adjustments on real estate securities, including commercial mortgage backed securities and other securities, interest rate swaps and other derivatives not deemed to be hedges and foreign exchanges holdings; unrealized gains or losses resulting from consolidation from, or deconsolidation to, equity accounting, and after adjustments for consolidated and unconsolidated partnerships and joint ventures, with such adjustments calculated to reflect MFFO on the same basis. The accretion of discounts and amortization of premiums and other loan expenses on debt investments, gains and losses on hedges, foreign exchange, derivatives or securities holdings, unrealized gains and losses resulting from consolidations, as well as other listed cash flow adjustments are adjustments made to net income in calculating the cash flows provided by operating activities and, in some cases, reflect gains or losses which are unrealized and may not ultimately be realized. While we will be responsible for managing interest rate, hedge and foreign exchange risk, we expect to retain an outside consultant to review all our hedging agreements. Inasmuch as interest rate hedges are not a fundamental part of our operations, we believe it is appropriate to exclude such gains and losses in calculating MFFO, as such gains and losses are not reflective of our core operations.
47
Our MFFO calculation excludes impairments of real estate related investments, including loans. We assess the credit quality of our investments and adequacy of loan loss reserves on a quarterly basis, or more frequently as necessary. For loans classified as held-for-investment, we establish and maintain a general allowance for loan losses inherent in our portfolio at the reporting date and, where appropriate, a specific allowance for loan losses for loans we have determined to be impaired at the reporting date. An individual loan is considered impaired when it is deemed probable that we will not be able to collect all amounts due according to the contractual terms of the loan. Real estate related securities are evaluated for other-than-temporary impairment when the fair value of a security falls below its net amortized cost. Significant judgment is required in this analysis. We consider the estimated net recoverable value of the loan or security as well as other factors, including but not limited to the fair value of any collateral, the amount and the status of any senior debt, the prospects for the borrower and the competitive situation of the region where the borrower does business. Fair value is typically estimated based upon discounting the expected future cash flows of the underlying collateral taking into consideration the discount rate, capitalization rate, occupancy, creditworthiness of major tenants and many other factors. This requires significant judgment and because it is based upon projections of future economic events, which are inherently subjective, the amounts ultimately realized may differ materially from the carrying value as of the balance sheet date. If upon completion of the assessment, the estimated fair value of the underlying collateral is less than the net carrying value of the loan, a specific allowance for loan losses is recorded. In the case of real estate securities, all or a portion of a deemed impairment may be recorded. Due to our limited life, any allowance for loan losses or impairment of real estate securities recorded may be difficult to recover.
MFFO is a metric used by management to evaluate our performance against other non-listed REITs which have limited lives with short and defined acquisition periods and targeted exit strategies shortly thereafter and is not intended to be used as a liquidity measure. Although management uses the MFFO metric to evaluate future operating performance, this metric excludes certain key operating items and other adjustments that may affect our overall operating performance. MFFO is not equivalent to net income or loss as determined under GAAP. We believe that our use of MFFO and the adjustments used to calculate it allow us to present our performance in a manner that reflects certain characteristics that are unique to non-listed REITs, such as their limited life, limited and defined acquisition period and targeted exit strategy, and hence that the use of such measures is useful to investors.
We believe that FFO provides useful context for understanding MFFO, and we believe that MFFO is a useful non-GAAP measure for non-listed REITs. It is helpful to management and stockholders in assessing our future operating performance once our organization and offering and acquisition and development stages are complete, because it eliminates from net income non-cash fair value adjustments on our real estate securities and acquisition fees and acquisition expenses that are incurred as part of our investment activities. However, MFFO may not be a useful measure of our operating performance or as a comparable measure to other typical non-listed REITs if we do not continue to operate in a similar manner to other non-listed REITs, including if we were to extend our acquisition and development stage or if we determined not to pursue an exit strategy.
However, MFFO does have certain limitations. For instance, the effect of any amortization or accretion on investments originated or acquired at a premium or discount, respectively, is not reported in MFFO. In addition, realized gains or losses from acquisitions and dispositions and other adjustments listed above are not reported in MFFO, even though such realized gains or losses and other adjustments could affect our operating performance and cash available for distribution. Stockholders should note that any cash gains generated from the sale of investments would generally be used to fund new investments. Any mark-to-market or fair value adjustments may be based on many factors, including current operational or individual property issues or general market or overall industry conditions.
Neither FFO nor MFFO is equivalent to net income or loss or cash flow provided by operating activities determined in accordance with GAAP and should not be construed to be more relevant or accurate than the GAAP methodology in evaluating our operating performance. Neither FFO nor MFFO is necessarily indicative of cash flow available to fund our cash needs including our ability to make distributions to our stockholders. FFO and MFFO do not represent amounts available for management’s discretionary use because of needed capital replacement or expansion, debt service obligations or other commitments or uncertainties. Furthermore, neither FFO nor MFFO should be considered as an alternative to net income or loss as an indicator of our operating performance.
Neither the SEC, NAREIT nor any other regulatory body has passed judgment on the acceptability of the adjustments that we use to calculate FFO or MFFO. In the future, the SEC, NAREIT or another regulatory body may decide to standardize the allowable adjustments across the non-listed REIT industry and we would have to adjust our calculation and characterization of FFO or MFFO.
48
The table below reflects the items deducted or added to net income or loss in our calculation of FFO and MFFO for the three months ended March 31, 2018 and 2017 (dollars in thousands):
Three Months Ended March 31, | ||||||||
2018 | 2017 | |||||||
Funds From Operations: | ||||||||
Net income (GAAP) | $ | 5,296 | $ | 6,049 | ||||
Funds from operations | $ | 5,296 | $ | 6,049 | ||||
Modified Funds From Operations: | ||||||||
Funds from operations | $ | 5,296 | $ | 6,049 | ||||
Accretion of premiums, discounts and fees on investments, net | (1,006 | ) | (634 | ) | ||||
Acquisition fees | 65 | 624 | ||||||
Unrealized (gain) loss on financial instruments | (438 | ) | — | |||||
Loan loss (recovery)/provision | 82 | 612 | ||||||
Modified funds from operations(1) | $ | 3,999 | $ | 6,651 | ||||
__________________________
(1) Modified funds from operations of $4.0 million includes a non-cash charge of $6.4m related to the call RFT 2015-FL1 CLO on February 15, 2018. Excluding this non-cash charge, modified funds from operations would have been $10.4 million.
49
Item 3. Quantitative and Qualitative Disclosures about Market Risk.
Credit Risk
Our investments are subject to a high degree of credit risk. Credit risk is the exposure to loss from loan defaults. Default rates are subject to a wide variety of factors, including, but not limited to, borrower financial condition, property performance, property management, supply/demand factors, construction trends, consumer behavior, regional economics, interest rates, the strength of the U.S. economy, and other factors beyond our control. All loans are subject to a certain probability of default. We manage credit risk through the underwriting process, acquiring our investments at the appropriate discount to face value, if any, and establishing loss assumptions. We also carefully monitor the performance of the loans, as well as external factors that may affect their value.
Interest Rate Risk
Our market risk arises primarily from interest rate risk relating to interest rate fluctuations. Many factors including governmental monetary and tax policies, domestic and international economic and political considerations and other factors that are beyond our control contribute to interest rate risk. To meet our short and long-term liquidity requirements, we may borrow funds at fixed and variable rates. Our interest rate risk management objectives are to limit the impact of interest rate changes in earnings and cash flows and to lower our overall borrowing costs. To achieve these objectives, from time to time, we may enter into interest rate hedge contracts such as swaps, collars and treasury lock agreements in order to mitigate our interest rate risk with respect to various debt instruments. While hedging activities may insulate us against adverse changes in interest rates, they may also limit our ability to participate in benefits of lower interest rates with respect to our portfolio of investments with fixed interest rates. During the periods covered by this report, we did not engage in interest rate hedging activities. We do not hold or issue derivative contracts for trading or speculative purposes. We do not have any foreign denominated investments, and thus, we are not exposed to foreign currency fluctuations.
As of March 31, 2018 and December 31, 2017, our portfolio included 77 and 64 variable rate investments, respectively, based on LIBOR for various terms. Borrowings under our repurchase agreements are also based on LIBOR. The following table quantifies the potential changes in interest income net of interest expense should interest rates increase by 50 or 100 basis points or decrease by 25 basis points, assuming that our current balance sheet was to remain constant and no actions were taken to alter our existing interest rate sensitivity:
Estimated Percentage Change in Interest Income Net of Interest Expense | ||||||
Change in Interest Rates | March 31, 2018 | December 31, 2017 | ||||
(-) 25 Basis Points | (1.51 | )% | (1.61 | )% | ||
Base Interest Rate | — | % | — | % | ||
(+) 50 Basis Points | 3.02 | % | 3.23 | % | ||
(+) 100 Basis Points | 6.04 | % | 6.45 | % | ||
Item 4. Controls and Procedures.
Disclosure Controls and Procedures
In accordance with Rules 13a-15(b) and 15d-15(b) of the Securities Exchange Act of 1934, as amended (the "Exchange Act"), management, with the participation of our Chief Executive Officer and Chief Financial Officer, has evaluated the effectiveness of our disclosure controls and procedures (as defined in Rules 13a-15(e) and 15d-15(e) of the Exchange Act) as of the end of the period covered in this Quarterly Report on Form 10-Q. Based on such evaluation, our Chief Executive Officer and Chief Financial Officer have concluded, as of the end of such period, that our disclosure controls and procedures are effective in recording, processing, summarizing and reporting, on a timely basis, information required to be disclosed by us in our reports that we file or submit under the Exchange Act.
Changes in Internal Control Over Financial Reporting
During the quarter ended March 31, 2018, there were no changes in our internal control over financial reporting that have materially affected, or are reasonably likely to materially affect, our internal control over financial reporting.
50
PART II
Item 1. Legal Proceedings.
The Company has no knowledge of material pending legal proceedings, other than ordinary routine litigation incidental to the business, or material pending or threatened regulatory proceedings, against the Company at this time.
Item 1A. Risk Factors.
Our potential risks and uncertainties are presented in the section entitled "Risk Factors" contained in the Annual Report on Form 10-K for the year ended December 31, 2016. There have been no material changes from these risk factors.
Item 2. Unregistered Sales of Equity Securities and Use of Proceeds.
Unregistered Sales of Equity Securities
Refer to Note 9 - Related Party Transactions and Arrangements to our consolidated financial statements included in this Quarterly Report on Form 10-Q for a discussion of the stock purchase agreements we entered into with certain institutional investors, certain officers of the Company, and certain owners, employees and associates of the Advisor and its affiliates in February 2018 pursuant to which such persons committed to buy shares of our common stock. As of May 14, 2018, the Company has not sold any shares pursuant to these purchase agreements.
Issuer Purchases of Equity Securities
Share repurchase activity under the SRP during the three months ended March 31, 2018 was as follows:
Number of Shares Repurchased | Average Price per Share | Total Number of Shares Purchased as Part of Publicly Announced Plans or Programs | Maximum Number (or Approximate Dollar Value) of Shares That May Yet Be Purchased Under the Plans or Programs | |||||||||
January 1 - January 31, 2018 | 421,809 | $ | 18.56 | 421,809 | (1) | |||||||
February 1 - February 28, 2018 | — | N/A | — | (1) | ||||||||
March 1 - March 31, 2018 | — | N/A | — | (1) | ||||||||
Total | 421,809 | (1) | ||||||||||
(1) The Company's board of directors unanimously approved an amended and restated share repurchase program (the “SRP”), which became effective on February 28, 2016. Repurchases pursuant to the SRP, when requested, generally will be made semiannually (each six-month period ending June 30 or December 31, a “fiscal semester”). Repurchases for any fiscal semester will be limited to a maximum of 2.5% of the weighted average number of shares of common stock outstanding during the previous fiscal year, with a maximum for any fiscal year of 5.0% of the weighted average number of shares of common stock outstanding during the previous fiscal year. Funding for repurchases pursuant to the SRP for any given fiscal semester will be limited to proceeds received during that same fiscal semester through the issuance of common stock pursuant to any DRIP in effect from time to time, provided that the Company's board of directors has the power, in its sole discretion, to determine the amount of shares repurchased during any fiscal semester as well as the amount of funds to be used for that purpose. See Note 7 - Common Stock to our consolidated financial statements included in this Quarterly Report on Form 10-Q for further discussion of our SRP.
Item 3. Defaults upon Senior Securities.
Not applicable.
Item 4. Mine Safety Disclosures.
Not applicable.
Item 5. Other Information.
Not applicable.
51
Item 6. Exhibits.
EXHIBITS INDEX
The following exhibits are included in this Quarterly Report on Form 10-Q for the quarter ended March 31, 2018 (and are numbered in accordance with Item 601 of Regulation S-K).
Exhibit No. | Description | |
10.1 | ||
10.2 | ||
10.3 | ||
31.1* | ||
31.2* | ||
32* | ||
101* | ||
* Filed herewith.
52
BENEFIT STREET PARTNERS REALTY TRUST, INC.
SIGNATURES
Pursuant to the requirements of Section 13 or 15(d) of the Securities Exchange Act of 1934, the registrant has duly caused this report to be signed on its behalf by the undersigned, thereunto duly authorized.
BENEFIT STREET PARTNERS REALTY TRUST, INC. | |
Dated: May 14, 2018 | By: /s/ Richard J. Byrne Name: Richard J. Byrne Title: Chief Executive Officer and President (Principal Executive Officer) |
Dated: May 14, 2018 | By: /s/ Jerome S. Baglien Name: Jerome S. Baglien Title: Chief Financial Officer and Treasurer (Principal Financial Officer and Principal Accounting Officer) |
53