Attached files
| file | filename |
|---|---|
| EX-32 - EXHIBIT 32 - Benefit Street Partners Realty Trust, Inc. | bsprt-exhibit32_q320.htm |
| EX-31.2 - EXHIBIT 31.2 - Benefit Street Partners Realty Trust, Inc. | bsprt-exhibit312_q320.htm |
| EX-31.1 - EXHIBIT 31.1 - Benefit Street Partners Realty Trust, Inc. | bsprt-exhibit311_q320.htm |
UNITED STATES
SECURITIES AND EXCHANGE COMMISSION
Washington, D.C. 20549
FORM 10-Q
(Mark One) | |
x | QUARTERLY REPORT PURSUANT TO SECTION 13 OR 15(D) OF THE SECURITIES EXCHANGE ACT OF 1934 |
For the quarterly period ended September 30, 2020
OR
¨ | TRANSITION REPORT PURSUANT TO SECTION 13 OR 15(D) OF THE SECURITIES EXCHANGE ACT OF 1934 |
Commission file number: 000-55188
BENEFIT STREET PARTNERS REALTY TRUST, INC.
(Exact name of registrant as specified in its charter)
Maryland | 46-1406086 | |
(State or Other Jurisdiction of Incorporation or Organization) | (I.R.S. Employer Identification No.) | |
9 West 57th Street, Suite #4920 New York, New York | 10019 | |
(Address of Principal Executive Office) | (Zip Code) | |
(212) 588-6770
(Registrant’s Telephone Number, Including Area Code)
(Former Name, Former Address and Former Fiscal Year, if Changed Since Last Report)
Securities registered pursuant to Section 12(b) of the Act:
Title of each class | Trading Symbol(s) | Name of each exchange on which registered |
None | ||
Indicate by check mark whether the registrant: (1) has filed all reports required to be filed by Section 13 or 15(d) of the Securities Exchange Act of 1934 during the preceding 12 months (or for such shorter period that the registrant was required to file such reports), and (2) has been subject to such filing requirements for the past 90 days. Yes x No o
Indicate by check mark whether the registrant has submitted electronically every Interactive Data File required to be submitted pursuant to Rule 405 of Regulation S-T (§232.405 of this chapter) during the preceding 12 months (or for such shorter period that the registrant was required to submit such files).Yes x No o
Indicate by check mark whether the registrant is a large accelerated filer, an accelerated filer, a non-accelerated filer, a smaller reporting company or an emerging growth company. See the definitions of "large accelerated filer," "accelerated filer," "smaller reporting company," and "emerging growth company" in Rule 12b-2 of the Exchange Act:
Large accelerated filer o | Accelerated filer o |
Non-accelerated filer x | Smaller reporting company o |
Emerging growth filer o | |
If an emerging growth company, indicate by check mark if the registrant has elected not to use the extended transition period for complying with any new or revised financial accounting standards provided pursuant to Section 13(a) of the Exchange Act. o | |
Indicate by check mark whether the registrant is a shell company (as defined in Rule 12b-2 of the Exchange Act). Yes o No x
The number of shares of the registrant's common stock, $0.01 par value, outstanding as of October 31, 2020 was 44,494,494.
BENEFIT STREET PARTNERS REALTY TRUST, INC.
TABLE OF CONTENTS
Page | ||
i
PART I
Item 1. Consolidated Financial Statements and Notes (unaudited)
1
BENEFIT STREET PARTNERS REALTY TRUST, INC.
CONSOLIDATED BALANCE SHEETS
(In thousands, except share and per share data)
September 30, 2020 | December 31, 2019 | ||||||
ASSETS | (Unaudited) | ||||||
Cash and cash equivalents | $ | 96,066 | $ | 87,246 | |||
Restricted cash | 8,438 | 21,876 | |||||
Commercial mortgage loans, held for investment, net of allowance of $22,777 and $921 as of September 30, 2020 and December 31, 2019, respectively | 2,598,921 | 2,762,042 | |||||
Commercial mortgage loans, held-for-sale, measured at fair value | 99 | 112,562 | |||||
Real estate securities, available for sale, measured at fair value, amortized cost of $179,413 and $387,294 as of September 30, 2020 and December 31, 2019, respectively | 169,803 | 386,316 | |||||
Derivative instruments, measured at fair value | — | 1,119 | |||||
Other real estate investments, measured at fair value | 2,518 | 2,557 | |||||
Receivable for loan repayment (1) | 135,160 | 89,317 | |||||
Accrued interest receivable | 14,738 | 16,308 | |||||
Prepaid expenses and other assets | 7,628 | 5,322 | |||||
Intangible lease asset, net of amortization | 13,753 | 14,377 | |||||
Operating right of use asset, net of amortization | 5,750 | 5,979 | |||||
Real estate owned, net of depreciation | 36,683 | 35,333 | |||||
Real estate owned, held-for-sale | 21,411 | — | |||||
Receivable for unsettled trades | — | 266 | |||||
Total assets | $ | 3,110,968 | $ | 3,540,620 | |||
LIABILITIES AND STOCKHOLDERS' EQUITY | |||||||
Collateralized loan obligations | $ | 1,657,559 | $ | 1,803,185 | |||
Repurchase agreements - commercial mortgage loans | 184,243 | 252,543 | |||||
Repurchase agreements - real estate securities | 177,545 | 394,359 | |||||
Mortgage note payable | 40,623 | 29,167 | |||||
Other financing and loan participation - commercial mortgage loans | 23,001 | — | |||||
Derivative instruments, measured at fair value | — | 1,581 | |||||
Interest payable | 2,783 | 4,958 | |||||
Distributions payable | 15,645 | 6,912 | |||||
Accounts payable and accrued expenses | 8,218 | 10,925 | |||||
Due to affiliates | 8,438 | 4,789 | |||||
Operating lease liabilities | 6,257 | 6,136 | |||||
Deferred rent revenue | — | 150 | |||||
Total liabilities | $ | 2,124,312 | $ | 2,514,705 | |||
Commitment and contingencies (See Note 10) | |||||||
Redeemable convertible preferred stock Series A, $0.01 par value, 60,000 authorized and 40,515 and 40,500 issued and outstanding as of September 30, 2020 and December 31, 2019, respectively | $ | 202,280 | $ | 202,144 | |||
Redeemable convertible preferred stock Series C, $0.01 par value, 20,000 authorized and 1,400 issued and outstanding as of September 30, 2020 and December 31, 2019, respectively | 6,961 | 6,966 | |||||
Equity: | |||||||
Preferred stock, $0.01 par value, 50,000,000 authorized, none issued and outstanding as of September 30, 2020 and December 31, 2019 | — | — | |||||
Common stock, $0.01 par value, 949,999,000 shares authorized, 44,353,727 and 43,916,815 shares issued and outstanding as of September 30, 2020 and December 31, 2019, respectively | 445 | 441 | |||||
Additional paid-in capital | 910,040 | 903,310 | |||||
Accumulated other comprehensive income (loss) | (9,610 | ) | (978 | ) | |||
Accumulated deficit | (123,460 | ) | (85,968 | ) | |||
Total stockholders' equity | $ | 777,415 | $ | 816,805 | |||
Total liabilities, redeemable convertible preferred stock and stockholders' equity | $ | 3,110,968 | $ | 3,540,620 | |||
(1) Includes $134.0 million and $89.3 million of cash held by servicer related to loan payoffs pledged to the CLOs as of September 30, 2020 and December 31, 2019, respectively.
The accompanying notes are an integral part of these unaudited consolidated financial statements.
2
BENEFIT STREET PARTNERS REALTY TRUST, INC.
CONSOLIDATED STATEMENTS OF OPERATIONS
(In thousands, except share and per share data)
(Unaudited)
Three Months Ended September 30, | Nine Months Ended September 30, | ||||||||||||||
2020 | 2019 | 2020 | 2019 | ||||||||||||
Income: | |||||||||||||||
Interest income | $ | 44,414 | $ | 50,445 | $ | 135,509 | $ | 145,181 | |||||||
Less: Interest expense | 15,113 | 22,160 | 54,740 | 68,395 | |||||||||||
Net interest income | 29,301 | 28,285 | 80,769 | 76,786 | |||||||||||
Revenue from real estate owned | 1,017 | 1,064 | 3,474 | 1,064 | |||||||||||
Total Income | $ | 30,318 | $ | 29,349 | $ | 84,243 | $ | 77,850 | |||||||
Expenses: | |||||||||||||||
Asset management and subordinated performance fee | 3,749 | 4,468 | 11,399 | 11,917 | |||||||||||
Acquisition expenses | 166 | 180 | 483 | 698 | |||||||||||
Administrative services expenses | 3,128 | 4,564 | 10,180 | 12,083 | |||||||||||
Professional fees | 2,470 | 3,427 | 8,476 | 8,090 | |||||||||||
Real estate owned operating expenses | 509 | 1,366 | 3,250 | 1,366 | |||||||||||
Depreciation and amortization | 591 | — | 1,765 | — | |||||||||||
Other expenses | 571 | 1,100 | 3,213 | 2,832 | |||||||||||
Total expenses | $ | 11,184 | $ | 15,105 | $ | 38,766 | $ | 36,986 | |||||||
Other (income)/loss: | |||||||||||||||
Increase/(decrease) in provision for credit losses | (3,710 | ) | (245 | ) | 14,929 | 2,823 | |||||||||
Impairment losses on real estate owned assets | — | — | 398 | — | |||||||||||
Realized (gain)/loss on extinguishment of debt | — | — | (438 | ) | — | ||||||||||
Realized (gain)/loss on sale of real estate securities | 4,390 | — | 10,137 | — | |||||||||||
Realized (gain)/loss on sale of commercial mortgage loan held-for-sale | — | — | (252 | ) | 25 | ||||||||||
Realized (gain)/loss on sale of real estate owned, held-for-sale | (1,424 | ) | — | (1,424 | ) | — | |||||||||
Realized (gain)/loss on sale of commercial mortgage loan, held-for-sale, measured at fair value | (1,940 | ) | (14,157 | ) | (11,106 | ) | (32,575 | ) | |||||||
Unrealized (gain)/loss on commercial mortgage loans, held-for-sale, measured at fair value | (263 | ) | (161 | ) | 76 | (393 | ) | ||||||||
Unrealized (gain)/loss on other real estate investments, measured at fair value | (6 | ) | — | 37 | — | ||||||||||
Unrealized (gain)/loss on derivatives | (4,310 | ) | (4,388 | ) | 625 | (1,318 | ) | ||||||||
Realized (gain)/loss on derivatives | 4,722 | 5,188 | 13,050 | 8,272 | |||||||||||
Total other (income)/loss | $ | (2,541 | ) | $ | (13,763 | ) | $ | 26,032 | $ | (23,166 | ) | ||||
Income/(loss) before taxes | 21,675 | 28,007 | 19,445 | 64,030 | |||||||||||
Provision/(benefit) for income tax | 178 | 2,094 | (2,466 | ) | 3,701 | ||||||||||
Net income/(loss) | $ | 21,497 | $ | 25,913 | $ | 21,911 | $ | 60,329 | |||||||
Net income/(loss) applicable to common stock | $ | 16,739 | $ | 20,460 | $ | 10,466 | $ | 48,409 | |||||||
Basic earnings per share | $ | 0.38 | $ | 0.48 | $ | 0.24 | $ | 1.17 | |||||||
Diluted earnings per share | $ | 0.38 | $ | 0.48 | $ | 0.24 | $ | 1.17 | |||||||
Basic weighted average shares outstanding | 44,405,196 | 42,795,038 | 44,348,282 | 41,287,548 | |||||||||||
Diluted weighted average shares outstanding | 44,421,084 | 42,807,773 | 44,361,739 | 41,300,384 | |||||||||||
The accompanying notes are an integral part of these unaudited consolidated financial statements.
3
BENEFIT STREET PARTNERS REALTY TRUST, INC.
CONSOLIDATED STATEMENTS OF COMPREHENSIVE INCOME
(In thousands)
(Unaudited)
Three Months Ended September 30, | Nine Months Ended September 30, | ||||||||||||||
2020 | 2019 | 2020 | 2019 | ||||||||||||
Net income/(loss) | $ | 21,497 | $ | 25,913 | $ | 21,911 | $ | 60,329 | |||||||
Unrealized gain/(loss) on available-for-sale securities | 18,656 | (372 | ) | (8,632 | ) | (292 | ) | ||||||||
Comprehensive income/(loss) attributable to Benefit Street Partners Realty Trust, Inc. | $ | 40,153 | $ | 25,541 | $ | 13,279 | $ | 60,037 | |||||||
The accompanying notes are an integral part of these unaudited consolidated financial statements.
4
BENEFIT STREET PARTNERS REALTY TRUST, INC.
CONSOLIDATED STATEMENTS OF CHANGES IN STOCKHOLDERS' EQUITY
(In thousands, except share data)
(Unaudited)
Common Stock | ||||||||||||||||||||||
Number of Shares | Par Value | Additional Paid-In Capital | Accumulated Other Comprehensive Income/(Loss) | Accumulated Deficit | Total Stockholders' Equity | |||||||||||||||||
Balance, December 31, 2019 | 43,916,815 | $ | 441 | $ | 903,310 | $ | (978 | ) | $ | (85,968 | ) | $ | 816,805 | |||||||||
Issuance of common stock | 650,034 | 7 | 10,855 | — | — | 10,862 | ||||||||||||||||
Common stock repurchases | (361,829 | ) | (4 | ) | (6,711 | ) | — | — | (6,715 | ) | ||||||||||||
Common stock issued through distribution reinvestment plan | 191,326 | 1 | 3,548 | — | — | 3,549 | ||||||||||||||||
Share-based compensation | — | — | 39 | — | — | 39 | ||||||||||||||||
Offering costs | — | — | (136 | ) | — | — | (136 | ) | ||||||||||||||
Net income/(loss) | — | — | — | — | (7,400 | ) | (7,400 | ) | ||||||||||||||
Distributions declared | — | — | — | — | (20,371 | ) | (20,371 | ) | ||||||||||||||
Cumulative-effect adjustment upon adoption of ASU 2016-13 (Note 2) | — | — | — | — | (7,761 | ) | (7,761 | ) | ||||||||||||||
Other comprehensive income/(loss) | — | — | — | (67,607 | ) | — | (67,607 | ) | ||||||||||||||
Balance, March 31, 2020 | 44,396,346 | $ | 445 | $ | 910,905 | $ | (68,585 | ) | $ | (121,500 | ) | $ | 721,265 | |||||||||
Issuance of common stock | — | $ | — | $ | 25 | $ | — | $ | — | $ | 25 | |||||||||||
Common stock repurchases | (11,306 | ) | — | (192 | ) | — | — | (192 | ) | |||||||||||||
Common stock issued through distribution reinvestment plan | 6 | — | (57 | ) | — | — | (57 | ) | ||||||||||||||
Share-based compensation | 10,770 | — | 57 | — | — | 57 | ||||||||||||||||
Offering costs | — | (32 | ) | (32 | ) | |||||||||||||||||
Net income/(loss) | — | — | — | — | 7,814 | 7,814 | ||||||||||||||||
Distributions declared | — | — | — | — | (15,603 | ) | (15,603 | ) | ||||||||||||||
Other comprehensive income/(loss) | — | — | — | 40,319 | — | 40,319 | ||||||||||||||||
Balance, June 30, 2020 | 44,395,816 | $ | 445 | $ | 910,706 | $ | (28,266 | ) | $ | (129,289 | ) | $ | 753,596 | |||||||||
Issuance of common stock | — | $ | — | $ | — | $ | — | $ | — | $ | — | |||||||||||
Common stock repurchases | (206,332 | ) | (2 | ) | (3,350 | ) | — | — | (3,352 | ) | ||||||||||||
Common stock issued through distribution reinvestment plan | 164,243 | 2 | 2,667 | — | — | 2,669 | ||||||||||||||||
Share-based compensation | — | — | 40 | — | — | 40 | ||||||||||||||||
Offering costs | — | — | (23 | ) | — | — | (23 | ) | ||||||||||||||
Net income/(loss) | — | — | — | — | 21,497 | 21,497 | ||||||||||||||||
Distributions declared | — | — | — | — | (15,668 | ) | (15,668 | ) | ||||||||||||||
Other comprehensive income/(loss) | — | — | — | 18,656 | — | 18,656 | ||||||||||||||||
Balance, September 30, 2020 | 44,353,727 | $ | 445 | $ | 910,040 | $ | (9,610 | ) | $ | (123,460 | ) | $ | 777,415 | |||||||||
Balance, December 31, 2018 | 39,303,710 | $ | 395 | $ | 827,558 | $ | (459 | ) | $ | (94,266 | ) | $ | 733,228 | |||||||||
Issuance of common stock | 1,161,580 | 11 | 19,398 | — | — | 19,409 | ||||||||||||||||
Common stock repurchases | (387,530 | ) | (4 | ) | (7,203 | ) | — | — | (7,207 | ) | ||||||||||||
Common stock issued through distribution reinvestment plan | 180,906 | 2 | 3,390 | — | — | 3,392 | ||||||||||||||||
Share-based compensation | — | — | 39 | — | — | 39 | ||||||||||||||||
Offering costs | — | — | (382 | ) | — | — | (382 | ) | ||||||||||||||
Net income | — | — | — | — | 19,890 | 19,890 | ||||||||||||||||
Distributions declared | — | — | — | — | (17,449 | ) | (17,449 | ) | ||||||||||||||
Other comprehensive income/(loss) | — | — | — | 145 | — | 145 | ||||||||||||||||
Balance, March 31, 2019 | 40,258,666 | $ | 404 | $ | 842,800 | $ | (314 | ) | $ | (91,825 | ) | $ | 751,065 | |||||||||
5
Issuance of common stock | 1,267,833 | $ | 13 | $ | 21,175 | $ | — | $ | — | $ | 21,188 | |||||||||||
Common stock repurchases | — | — | — | — | — | — | ||||||||||||||||
Common stock issued through distribution reinvestment plan | 187,146 | 2 | 3,490 | — | — | 3,492 | ||||||||||||||||
Share-based compensation | 6,400 | — | 39 | — | — | 39 | ||||||||||||||||
Offering Cost | — | — | (529 | ) | — | — | (529 | ) | ||||||||||||||
Net income | — | — | — | — | 14,526 | 14,526 | ||||||||||||||||
Distributions declared | — | — | — | — | (18,298 | ) | (18,298 | ) | ||||||||||||||
Other comprehensive income/(loss) | — | — | — | (65 | ) | — | (65 | ) | ||||||||||||||
Balance, June 30, 2019 | 41,720,045 | $ | 419 | $ | 866,975 | $ | (379 | ) | $ | (95,597 | ) | $ | 771,418 | |||||||||
Issuance of common stock | 1,466,430 | $ | 14 | $ | 24,471 | $ | — | $ | — | $ | 24,485 | |||||||||||
Common stock repurchases | (354,323 | ) | (3 | ) | (6,603 | ) | — | — | (6,606 | ) | ||||||||||||
Common stock issued through distribution reinvestment plan | 188,912 | 2 | 3,513 | — | — | 3,515 | ||||||||||||||||
Share-based compensation | — | — | 39 | — | — | 39 | ||||||||||||||||
Offering Cost | — | — | (187 | ) | — | — | (187 | ) | ||||||||||||||
Net income | — | — | — | — | 25,913 | 25,913 | ||||||||||||||||
Distributions declared | — | — | — | — | (19,685 | ) | (19,685 | ) | ||||||||||||||
Other comprehensive income/(loss) | — | — | — | (372 | ) | — | (372 | ) | ||||||||||||||
Balance, September 30, 2019 | 43,021,064 | $ | 432 | $ | 888,208 | $ | (751 | ) | $ | (89,369 | ) | $ | 798,520 | |||||||||
The accompanying notes are an integral part of these unaudited consolidated financial statements.
6
BENEFIT STREET PARTNERS REALTY TRUST, INC.
CONSOLIDATED STATEMENTS OF CASH FLOWS
(In thousands)
(Unaudited)
Nine Months Ended September 30, | |||||||
2020 | 2019 | ||||||
Cash flows from operating activities: | |||||||
Net income/(loss) | $ | 21,911 | $ | 60,329 | |||
Adjustments to reconcile net income/(loss) to net cash (used in)/provided by operating activities: | |||||||
Premium amortization and (discount accretion), net | $ | (4,535 | ) | $ | (4,756 | ) | |
Accretion of deferred commitment fees | (4,710 | ) | (2,220 | ) | |||
Amortization of deferred financing costs | 8,297 | 8,406 | |||||
Share-based compensation | 136 | 117 | |||||
Realized (gain)/loss on sale of real estate securities | 10,137 | — | |||||
Realized (gain)/loss on sale of real estate owned, held-for-sale | (1,424 | ) | — | ||||
Unrealized (gain)/loss on commercial mortgage loans held-for-sale | 76 | (393 | ) | ||||
Unrealized (gain)/loss on derivative instruments | 625 | (1,318 | ) | ||||
Unrealized losses on other real estate investments | 37 | — | |||||
Depreciation and amortization | 1,765 | — | |||||
Recognition of deferred rent revenue | (150 | ) | — | ||||
Increase/(decrease) in provision for credit losses | 14,929 | 2,823 | |||||
Impairment losses on real estate owned assets | 398 | — | |||||
Origination of commercial mortgage loans, held-for-sale | (122,043 | ) | (749,422 | ) | |||
Proceeds from sale of commercial mortgage loans, held-for-sale | 270,479 | 647,089 | |||||
Changes in assets and liabilities: | |||||||
Accrued interest receivable | 6,280 | 768 | |||||
Prepaid expenses and other assets | (5,173 | ) | (3,467 | ) | |||
Accounts payable and accrued expenses | (3,114 | ) | 4,517 | ||||
Due to affiliates | 3,649 | 1,595 | |||||
Interest payable | (2,175 | ) | 111 | ||||
Net cash (used in)/provided by operating activities | $ | 195,395 | $ | (35,821 | ) | ||
Cash flows from investing activities: | |||||||
Origination and purchase of commercial mortgage loans, held for investment | $ | (851,524 | ) | $ | (892,413 | ) | |
Principal repayments received on commercial mortgage loans, held for investment | 880,067 | 482,396 | |||||
Purchase of other real estate investments | — | (2,511 | ) | ||||
Purchase of real estate owned and capital expenditures | (2,869 | ) | — | ||||
Proceeds from sale of real estate owned, held-for-sale | 15,424 | — | |||||
Purchase of real estate securities | (148,580 | ) | (206,710 | ) | |||
Principal repayments received on real estate securities | — | 541 | |||||
Proceeds from sale of real estate securities | 346,200 | — | |||||
Purchase of derivative instruments | (829 | ) | (3,224 | ) | |||
Net cash (used in)/provided by investing activities | $ | 237,889 | $ | (621,921 | ) | ||
Cash flows from financing activities: | |||||||
Proceeds from issuances of common stock | $ | 10,887 | $ | 63,986 | |||
Proceeds from issuances of redeemable convertible preferred stock | 70 | 46,245 | |||||
Common stock repurchases | (10,259 | ) | (13,814 | ) | |||
Borrowings under collateralized loan obligation | — | 639,899 | |||||
Repayments of collateralized loan obligation | (150,766 | ) | (333,740 | ) | |||
7
BENEFIT STREET PARTNERS REALTY TRUST, INC.
CONSOLIDATED STATEMENTS OF CASH FLOWS
(In thousands)
(Unaudited)
Borrowings on repurchase agreements - commercial mortgage loans | 195,182 | 866,582 | |||||
Repayments of repurchase agreements - commercial mortgage loans | (263,482 | ) | (904,085 | ) | |||
Borrowings on repurchase agreements - real estate securities | 857,163 | 1,112,709 | |||||
Repayments of repurchase agreements - real estate securities | (1,073,977 | ) | (912,940 | ) | |||
Borrowing on other financing and loan participation - commercial mortgage loans | 23,001 | — | |||||
Repayments on other financing and loan participation - commercial mortgage loans | — | (10,000 | ) | ||||
Borrowing on mortgage note payable | 11,456 | — | |||||
Payments of deferred financing costs | (511 | ) | (4,395 | ) | |||
Distributions paid | (36,666 | ) | (44,393 | ) | |||
Net cash (used in)/provided by financing activities: | $ | (437,902 | ) | $ | 506,054 | ||
Net change in cash, cash equivalents and restricted cash | (4,618 | ) | (151,688 | ) | |||
Cash, cash equivalents and restricted cash, beginning of period | 109,122 | 204,419 | |||||
Cash, cash equivalents and restricted cash, end of period | $ | 104,504 | $ | 52,731 | |||
Supplemental disclosures of cash flow information: | |||||||
Taxes paid | $ | 4,400 | $ | — | |||
Interest paid | 48,618 | 59,878 | |||||
Cash paid for amounts included in the measurement of operating lease liabilities | — | 33 | |||||
Supplemental disclosures of non - cash flow information: | |||||||
Distribution payable | $ | 15,645 | $ | 6,456 | |||
Common stock issued through distribution reinvestment plan | 6,161 | 10,393 | |||||
Commercial mortgage loans transferred from held for sale to held for investment | 23,625 | 4,472 | |||||
Real estate owned received in foreclosure | 35,411 | 8,110 | |||||
Recognition of right-of-use asset and related lease liability | — | 6,109 | |||||
Reconciliation of cash, cash equivalents and restricted cash at end of period: | |||||||
Cash and cash equivalents | $ | 96,066 | $ | 34,104 | |||
Restricted cash | 8,438 | 18,627 | |||||
Cash, cash equivalents and restricted cash, end of period | $ | 104,504 | $ | 52,731 | |||
The accompanying notes are an integral part of these unaudited consolidated financial statements.
8
BENEFIT STREET PARTNERS REALTY TRUST, INC.
NOTES TO CONSOLIDATED FINANCIAL STATEMENTS
September 30, 2020
(Unaudited)
Note 1 - Organization and Business Operations
Benefit Street Partners Realty Trust, Inc. (the "Company") is a real estate finance company that primarily originates, acquires and manages a diversified portfolio of commercial real estate debt investments secured by properties located within and outside the United States. The Company was incorporated in Maryland on November 15, 2012 and commenced operations on May 14, 2013.
The Company made a tax election to be treated as a real estate investment trust (a "REIT") for U.S. federal income tax purposes commencing with its taxable year ended December 31, 2013. The Company believes that it has qualified as a REIT and intends to continue to meet the requirements for qualification and taxation as a REIT. In addition, the Company, through a subsidiary which is treated as a taxable REIT subsidiary (a "TRS") is indirectly subject to U.S federal, state and local income taxes. The majority of the Company's business is conducted through Benefit Street Partners Realty Operating Partnership, L.P. (the “OP”), a Delaware limited partnership. The Company is the sole general partner and directly or indirectly holds all of the units of limited partner interests in the OP.
The Company has no direct employees. Benefit Street Partners L.L.C. serves as the Company's advisor (the "Advisor") pursuant to an Amended and Restated Advisory Agreement, dated January 19, 2018 (the "Advisory Agreement"). The Advisor is a wholly owned subsidiary of Franklin Resources, Inc. which, together with its various subsidiaries, operates as Franklin Templeton. The Advisor, an investment adviser registered with the U.S. Securities and Exchange Commission (“SEC”), is a credit-focused alternative asset management firm. Established in 2008, the Advisor's credit platform manages funds for institutions and high-net-worth investors across various credit funds and complementary strategies including high yield, levered loans, private / opportunistic debt, liquid credit, structured credit and commercial real estate debt. These strategies complement each other as they all leverage the sourcing, analytical, compliance, and operational capabilities that encompass the platform. The Advisor manages the Company's affairs on a day-to-day basis. The Advisor receives compensation and fees for services related to the investment and management of the Company's assets and the operations of the Company.
The Company invests in commercial real estate debt investments, which may include first mortgage loans, subordinated mortgage loans, mezzanine loans and participations in such loans. The Company also originates conduit loans which the Company intends to sell through its TRS into commercial mortgage-backed securities ("CMBS") at a profit. The Company also invests in commercial real estate securities. Real estate securities may include CMBS, senior unsecured debt of publicly traded REITs, debt or equity securities of other publicly traded real estate companies and collateralized debt obligations ("CDOs"). The Company also owns real estate, which represents real estate acquired by the Company through foreclosure, deed in lieu of foreclosure, or purchase.
Note 2 - Summary of Significant Accounting Policies
Basis of Accounting
The Company's unaudited consolidated financial statements and related footnotes have been prepared on the accrual basis of accounting in conformity with accounting principles generally accepted in the United States of America ("GAAP") for interim financial statements and pursuant to the requirements for reporting on Form 10-Q and Regulation S-X, as appropriate. Accordingly, the consolidated financial statements may not include all of the information and notes required by GAAP for annual consolidated financial statements.
These financial statements should be read in conjunction with the audited consolidated financial statements and notes thereto as of, and for the year ended December 31, 2019, which are included in the Company's Annual Report on Form 10-K/A filed with the SEC on March 19, 2020.
Use of Estimates
GAAP requires management to make estimates and assumptions that affect the reported amount of assets and liabilities as of the date of the financial statements and the reported amounts of income and expenses during the reported periods. Changes in the economic environment, financial markets and any other parameters used in determining these estimates could cause actual results to differ materially. In the opinion of management, the interim data includes all adjustments, of a normal and recurring nature, necessary for a fair statement of the results for the periods presented. The current period’s results of operations will not necessarily be indicative of results that ultimately may be achieved for the entire year or any subsequent interim periods.
9
BENEFIT STREET PARTNERS REALTY TRUST, INC.
NOTES TO CONSOLIDATED FINANCIAL STATEMENTS
September 30, 2020
(Unaudited)
In response to the global coronavirus (COVID-19) pandemic, numerous countries, including the U.S., have declared national emergencies with respect to COVID-19 and certain jurisdictions, including those where our corporate headquarters and/or properties that secure our investments, or properties that the Company owns, are located, have at times imposed “stay-at-home” guidelines or orders or other restrictions to help prevent its spread. The disruptive economic effects of the COVID-19 pandemic and government responses thereto have significantly impacted our estimates involving credit losses and fair values during the three and nine months ended September 30, 2020, including introducing a significant degree of uncertainty underlying those estimates.
Principles of Consolidation
The accompanying consolidated financial statements include the accounts of the Company, the OP and its subsidiaries. All intercompany accounts and transactions have been eliminated in consolidation. In determining whether the Company has a controlling financial interest in a joint venture and the requirement to consolidate the accounts of that entity, management considers factors such as ownership interest, authority to make decisions and contractual and substantive participating rights of the other partners or members, as well as whether the entity is a variable interest entity ("VIE") for which the Company is the primary beneficiary.
The Company has determined the OP is a VIE of which the Company is the primary beneficiary. Substantially all of the Company's assets and liabilities are held by the OP.
The Company consolidates all entities that it controls through either majority ownership or voting rights. In addition, the Company consolidates all VIEs of which the Company is considered the primary beneficiary. VIEs are entities in which equity investors (i) do not have the characteristics of a controlling financial interest and/or (ii) do not have sufficient equity at risk for the entity to finance its activities without additional subordinated financial support from other parties. The entity that consolidates a VIE is its primary beneficiary and is generally the entity with (i) the power to direct the activities that most significantly affect the VIE’s economic performance and (ii) the right to receive benefits from the VIE or the obligation to absorb losses of the VIE that could be significant to the VIE.
The accompanying consolidated financial statements include the accounts of collateralized loan obligations ("CLOs") issued and securitized by wholly owned subsidiaries of the Company. The Company has determined the CLOs are VIEs of which the Company's subsidiary is the primary beneficiary. The assets and liabilities of the CLOs are consolidated in the accompanying consolidated balance sheets in accordance with Financial Accounting Standards Board (“FASB”) Accounting Standards Codification (“ASC”) 810, Consolidation.
Acquisition Expenses
The Company capitalizes certain direct costs relating to loan origination activities and the cost is amortized over the life of the loan.
Cash and Cash Equivalents
Cash consists of amounts deposited with high quality financial institutions. These deposits are guaranteed by the Federal Deposit Insurance Company up to an insurance limit. Cash equivalents include short-term, liquid investments in money market funds with original maturities of 90 days or less when purchased.
Restricted Cash
Restricted cash primarily consists of cash pledged as margin on repurchase agreements and derivative transactions. The duration of this restricted cash generally matches the duration of the related repurchase agreements or derivative transaction.
Commercial Mortgage Loans
Held for Investment - Commercial mortgage loans that are held for investment purposes and are anticipated to be held until maturity, are carried at cost, net of unamortized acquisition expenses, discounts or premiums and unfunded commitments. Commercial mortgage loans, held for investment purposes, that are deemed to be impaired are carried at amortized cost less a specific allowance for credit losses. Interest income is recorded on the accrual basis and related discounts, premiums and acquisition expenses on investments are amortized over the life of the investment using the effective interest method. Amortization is reflected as an adjustment to interest income in the Company’s consolidated statements of operations. Guaranteed loan commitment fees payable by the borrower upon maturity are accreted over the life of the investment using the effective interest method. The accretion of guaranteed loan commitment fees is recognized in interest income in the Company's consolidated statements of operations.
10
BENEFIT STREET PARTNERS REALTY TRUST, INC.
NOTES TO CONSOLIDATED FINANCIAL STATEMENTS
September 30, 2020
(Unaudited)
Held-for-Sale - Commercial mortgage loans that are intended to be sold in the foreseeable future are reported as held-for-sale and are transferred at fair value and recorded at the lower of cost or fair value with changes recorded through the statements of operations. Unamortized loan origination costs for commercial mortgage loans held-for-sale that are carried at the lower of cost or fair value are capitalized as part of the carrying value of the loans and recognized upon the sale of such loans. Amortization of origination costs ceases upon transfer of commercial mortgage loans to held-for-sale.
Held-for-Sale, Accounted for Under the Fair Value Option - The fair value option provides an option to elect fair value as an alternative measurement for selected financial assets, financial liabilities, and written loan commitments. The Company has elected to measure commercial mortgage loans held-for-sale in the Company's TRS under the fair value option. These commercial mortgage loans are included in the Commercial mortgage loans, held-for-sale, measured at fair value in the consolidated balance sheets. Interest income received on commercial mortgage loans held-for-sale, measured at fair value is recorded on the accrual basis of accounting and is included in interest income in the consolidated statements of operations. Acquisition expenses on originating these investments are expensed when incurred.
Real estate owned
Real estate owned (“REO”) assets represent real estate acquired by the Company through foreclosure, deed in lieu of foreclosure, or purchase. REO assets are carried at their estimated fair value at acquisition and are presented net of accumulated depreciation and impairment charges. The Company allocates the purchase price of acquired real estate assets based on the fair value of the acquired land, building, furniture, fixtures and equipment.
Real estate owned assets are depreciated using the straight-line method over estimated useful lives of up to 40 years for buildings and improvements and up to 15 years for furniture, fixtures and equipment. Renovations and/or replacements that improve or extend the life of the real estate owned assets are capitalized and depreciated over their estimated useful lives.
Real estate owned assets that are probable to be sold within one year are reported as held-for sale. Real estate owned assets classified as held-for-sale shall be measured at the lower of its carrying amount or fair value less cost to sell. Real estate owned assets shall not be depreciated or amortized while it is classified as held-for-sale. Interest and other expenses attributable to the liabilities of a disposal group classified as held-for-sale shall continue to be accrued. Upon the disposition of a real estate owned asset, the Company calculates realized gains and losses as net proceeds received less the carrying value of the real estate owned asset. Net proceeds received are net of direct selling costs associated with the disposition of the real estate owned asset.
Leases
Operating right of use assets "ROU" represent the Company’s right to use an underlying asset during the lease term and lease liabilities represent the Company’s obligation to make lease payments arising from the lease. ROU assets and lease liabilities are recognized at commencement date based on the present value of fixed lease payments over the lease term. Leases will be classified as either a finance or operating lease, with such classification affecting the pattern and classification of expense recognition in the consolidated statements of operations. For leases greater than 12 months, the Company determines, at the inception of the contract, if the arrangement meets the classification criteria for an operating or finance lease. For leases that have extension options, which can be exercised at the Company's discretion, management uses judgment to determine if it is reasonably certain that such extension options will be elected. If the extension options are reasonably certain to occur, the Company includes the extended term's lease payments in the calculation of the respective lease liability. Lease expense for lease payments is recognized on a straight-line basis over the lease term. The incremental borrowing rate used to discount the lease liability is determined at commencement of the lease, or upon modification of the lease, as the interest rate a lessee would have to pay to borrow on a fully collateralized basis over a similar term an amount equal to the lease payments in a similar economic environment. The Company's incremental borrowing rate considers information at both the corporate and property level and analysis of current market conditions for obtaining new financings. All leases as of September 30, 2020 were operating leases.
Separately, on October 15, 2019, the Company acquired certain real estate assets which had an existing in-place lease asset. This in-place lease asset is recorded as an Intangible lease asset on the consolidated balance sheets and amortized using the straight-line method over the contractual life of the lease.
Credit Losses
In June 2016, the FASB issued Accounting Standards Update ("ASU") No. 2016-13, Financial Instruments-Credit Losses, which amends the credit impairment model for financial instruments. The Company adopted ASU 2016-13 on January 1, 2020.
11
BENEFIT STREET PARTNERS REALTY TRUST, INC.
NOTES TO CONSOLIDATED FINANCIAL STATEMENTS
September 30, 2020
(Unaudited)
Following our adoption of ASU 2016-13, our previous incurred loss model was replaced with a lifetime current expected credit loss (“CECL”) model for financial instruments carried at amortized cost and off-balance sheet credit exposures, such as loans, loan commitments, held-to-maturity (“HTM”) debt securities, financial guarantees, net investments in leases, reinsurance and trade receivables, which will generally result in earlier recognition of allowance for losses. For available for sale (“AFS”) debt securities, unrealized credit losses are recognized as allowances rather than reductions in amortized cost basis and elimination of the other than temporary impairment concept will result in more frequent estimation of credit losses. The accounting model for purchased credit impaired loans and debt securities has been simplified, including elimination of some of the asymmetrical treatment between credit losses and credit recoveries, to be consistent with the CECL model for originated and purchased non-credit impaired assets. The adopted model for ASC 326 as it applies to HTM and AFS securities, encompassing the beneficial interest model for securities that are not of high credit quality, has been clarified to include the effective interest method as a basis for the projection of cash collections method in connection with the newly adopted impairment models for HTM and AFS debt securities under ASC 326 when securities are not of high credit quality. Upon adoption of ASU 2016-13 on January 1, 2020, the Company recorded an additional allowance for credit losses for our outstanding loans and unfunded loan commitments of $7.8 million, or $0.18 per share, which was 0.27% of the aggregate commitment amount of the Company’s loan portfolio at December 31, 2019.
Pre-adoption | Transition Adjustment | Post-adjustment | ||||
Assets | ||||||
Commercial mortgage loans, held for investment, net of allowance | 2,762,042 | (7,211 | ) | 2,754,831 | ||
Liabilities | ||||||
Accounts payable and accrued expenses (1) | 10,925 | (550 | ) | 10,375 | ||
Equity | ||||||
Accumulated deficit | (85,968 | ) | (7,761 | ) | (93,729 | ) |
(1) Includes allowance associated with unfunded loan commitment.
The following discussion highlights changes to the Company’s accounting policies as a result of this adoption.
Allowance for credit losses
The allowance for credit losses for the Company’s financial instruments carried at amortized cost and off-balance sheet credit exposures, such as loans held for investment and unfunded loan commitments represents a lifetime estimate of expected credit losses. Factors considered by the Company when determining the allowance for credit losses reserve include loan-specific characteristics such as loan-to-value (“LTV”) ratio, vintage year, loan term, property type, occupancy and geographic location, financial performance of the borrower, expected payments of principal and interest, as well as internal or external information relating to past events, current conditions and reasonable and supportable forecasts.
The allowance for credit losses is measured on a collective (pool) basis when similar risk characteristics exist for multiple financial instruments. If similar risk characteristics do not exist, the Company measures the allowance for credit losses on an individual instrument basis. The determination of whether a particular financial instrument should be included in a pool can change over time. If a financial asset’s risk characteristics change, the Company evaluates whether it is appropriate to continue to keep the financial instrument in its existing pool or evaluate it individually.
In measuring the allowance for credit losses for financial instruments including our unfunded loan commitments that share similar risk characteristics, the Company primarily applies a probability of default (“PD”)/loss given default (“LGD”) model for instruments that are collectively assessed, whereby the allowance for credit losses is calculated as the product of PD, LGD and exposure at default (“EAD”). The Company’s model principally utilizes historical loss rates derived from a commercial mortgage backed securities database with historical losses from 1998 to 2020 provided by a reputable third party, forecasting the loss parameters using a scenario-based statistical approach over a reasonable and supportable forecast period of twelve months, followed by an immediate reversion to average historical losses. For financial instruments assessed on an individual basis, including when it is probable that the Company will be unable to collect the full payment of principal and interest on the instrument, the Company applies a discounted cash flow (“DCF”) methodology.
12
BENEFIT STREET PARTNERS REALTY TRUST, INC.
NOTES TO CONSOLIDATED FINANCIAL STATEMENTS
September 30, 2020
(Unaudited)
For financial instruments where the borrower is experiencing financial difficulty based on the Company’s assessment at the reporting date and the repayment is expected to be provided substantially through the operation or sale of the collateral, the Company may elect to use as a practical expedient the fair value of the collateral at the reporting date when determining the allowance for credit losses.
In developing the allowance for credit losses for its loans held for investment, the Company performs a comprehensive analysis of its loan portfolio and assigns risk ratings to loans that incorporate management's current judgments about their credit quality based on all known and relevant internal and external factors that may affect collectability, using similar factors as those in developing the allowance for credit losses. This methodology results in loans being segmented by risk classification into risk rating categories that are associated with estimated probabilities of default and principal loss. Risk rating categories range from "1" to "5" with "1" representing the lowest risk of loss and "5" representing the highest risk of loss with the ratings updated quarterly. At the time of origination or purchase, loans held for investment are ranked as a “2” and will move accordingly going forward based on the ratings which are defined as follows:
1. | Very Low Risk- Investment exceeding fundamental performance expectations and/or capital gain expected. Trends and risk factors since time of investment are favorable. |
2. | Low Risk- Performing consistent with expectations and a full return of principal and interest expected. Trends and risk factors are neutral to favorable. |
3. | Average Risk- Performing investments requiring closer monitoring. Trends and risk factors show some deterioration. |
4. | High Risk/Delinquent/Potential for Loss- Underperforming investment with the potential of some interest loss but still expecting a positive return on investment. Trends and risk factors are negative. |
5. | Impaired/Defaulted/Loss Likely- Underperforming investment with expected loss of interest and some principal. |
The Company also considers qualitative and environmental factors, including, but not limited to, economic and business conditions, nature and volume of the loan portfolio, lending terms, volume and severity of past due loans, concentration of credit and changes in the level of such concentrations in its determination of the allowance for credit losses.
Changes in the allowance for credit losses for the Company’s financial instruments are recorded in Increase/(decrease) in provision for credit losses on the consolidated statements of operations with a corresponding offset to the financial instrument’s amortized cost recorded on the consolidated balance sheets, or as a component of Accounts payable and accrued expenses for unfunded loan commitments.
The Company has elected to not measure an allowance for credit losses for accrued interest receivable as it is reversed against interest income when a loan or preferred equity investment is placed on nonaccrual status. Loans are charged off against the Increase/(decrease) in provision for credit losses when all or a portion of the principal amount is determined to be uncollectible.
Past due and nonaccrual status
Loans are placed on nonaccrual status and considered non-performing when full payment of principal and interest is unpaid for 90 days or more or where reasonable doubt exists as to timely collection, unless the loan is both well secured and in the process of collection. Interest received on nonaccrual status loans are accounted for under the cost-recovery method, until qualifying for return to accrual. Upon restructuring the nonaccrual loan, the Company may return a loan to accrual status when repayment of principal and interest is reasonably assured.
Troubled Debt Restructuring (“TDR”)
The Company classifies an individual financial instrument as a TDR when it has a reasonable expectation that the financial instrument’s contractual terms will be modified in a manner that grants concession to the borrower who is experiencing financial difficulty. Concessions could include term extensions, payment deferrals, interest rate reductions, principal forgiveness, forbearance, or other actions designed to maximize the Company’s collection on the financial instrument. The Company determines the allowance for credit losses for financial instruments that are TDRs individually.
13
BENEFIT STREET PARTNERS REALTY TRUST, INC.
NOTES TO CONSOLIDATED FINANCIAL STATEMENTS
September 30, 2020
(Unaudited)
Real Estate Securities
On the acquisition date, all of the Company’s commercial real estate securities were classified as available for sale and carried at fair value, and subsequently any unrealized gains or losses are recognized as a component of accumulated other comprehensive income or loss. The Company may elect the fair value option for its real estate securities, and as a result, any unrealized gains or losses on such real estate securities will be recorded in the Company’s consolidated statements of operations. No such election has been made to date. Related discounts, premiums and acquisition expenses on investments are amortized over the life of the investment using the effective interest method. Amortization is reflected as an adjustment to interest income in the Company’s consolidated statements of operations. The Company uses the specific identification method in determining the cost relief for real estate securities sold. Realized gains and losses from the sale of real estate securities are included in the Company’s consolidated statements of operations.
AFS real estate securities which have experienced a decline in the fair value below their amortized cost basis (i.e., impairment) are evaluated each reporting period to determine whether the decline in fair value is due to credit-related factors. Any impairment that is not credit-related is recognized in other comprehensive income, while credit-related impairment is recognized as an allowance on the consolidated balance sheets with a corresponding adjustment on the consolidated statements of operations. If the Company intends to sell an impaired real estate security or more likely than not will be required to sell such a security before recovering its amortized cost basis, the entire impairment amount is recognized in the consolidated statements of operations with a corresponding adjustment to the security’s amortized cost basis.
The Company analyzes the AFS security portfolio on a periodic basis for credit losses at the individual security level using the same criteria described above for those amortized cost financial assets subject to an allowance for credit losses including but not limited to; performance of the underlying assets in the security, borrower financial resources and investment in collateral, collateral type, credit ratings, project economics and geographic location as well as national and regional economic factors.
The non-credit loss component of the unrealized loss within the Company’s AFS portfolio is recognized as an adjustment to the individual security’s asset balance with an offsetting entry to other comprehensive income in the consolidated balance sheets.
Repurchase Agreements
Commercial mortgage loans and real estate securities sold under repurchase agreements have been treated as collateralized financing transactions because the Company maintains effective control over the transferred securities. Commercial mortgage loans and real estate securities financed through a repurchase agreement remain on the Company’s consolidated balance sheets as an asset and cash received from the purchaser is recorded as a liability. Interest paid in accordance with repurchase agreements is recorded in interest expense on the Company's consolidated statements of operations.
Deferred Financing Costs
The deferred financing costs related to the Company's various Master Repurchase Agreements as well as certain prepaid subscription costs are included in Prepaid expenses and other assets on the consolidated balance sheets. Deferred financing cost on the Company's collateralized debt obligations ("CLO") are netted against the Company's CLO payable in the Collateralized debt obligations on the consolidated balance sheets. Deferred financing costs are amortized over the terms of the respective financing agreement using the effective interest method and included in interest expense on the Company's consolidated statements of operations. Unamortized deferred financing costs are generally expensed when the associated debt is refinanced or repaid before maturity.
Share Repurchase Program
The Company has a Share Repurchase Program (the "SRP") that enables stockholders to sell their shares to the Company, subject to certain conditions. Refer to Note 9 - Stock Transactions for a description of the SRP. When a stockholder requests a redemption and the redemption is approved by the board of directors, the Company will reclassify such obligation from equity to a liability based on the settlement value of the obligation. Shares repurchased under the SRP will have the status of authorized but unissued shares.
14
BENEFIT STREET PARTNERS REALTY TRUST, INC.
NOTES TO CONSOLIDATED FINANCIAL STATEMENTS
September 30, 2020
(Unaudited)
Offering and Related Costs
Since 2018, the Company has from time to time offered, and may in the future offer, shares of the Company’s common stock or one or more series of its preferred stock (“Preferred Stock”), including its Series A convertible preferred stock (“Series A Preferred Stock”) and Series C convertible preferred stock (the “Series C Preferred Stock,”) in private placements exempt from the registration requirements of the Securities Act of 1933, as amended. In connection with these offerings, the Company incurs various offering costs. These offering costs include but are not limited to legal, accounting, printing, mailing and filing fees, and diligence expenses of broker-dealers. Offering costs for the common stock are recorded in the Company’s stockholders’ equity, while the offering costs for the Preferred Stock are included within Redeemable convertible preferred stock Series A and Redeemable convertible preferred stock series C, respectively, on the Company’s consolidated balance sheets.
Distribution Reinvestment Plan
Pursuant to the DRIP, stockholders may elect to reinvest distributions by purchasing shares of common stock in lieu of receiving cash. No dealer manager fees or selling commissions are paid with respect to shares purchased pursuant to the DRIP. The board of directors may designate that certain cash or other distributions be excluded from the DRIP. The Company has the right to amend any aspect of the DRIP or terminate the DRIP with ten days’ notice to participants. Shares issued under the DRIP are recorded to equity in the consolidated balance sheets in the period distributions are declared.
Income Taxes
The Company has conducted its operations to qualify as a REIT for U.S. federal income tax purposes beginning with its taxable year ended December 31, 2013. As a REIT, if the Company meets certain organizational and operational requirements and distributes at least 90% of its "REIT taxable income" (determined before the deduction of dividends paid and excluding net capital gains) to its stockholders in a year, it will not be subject to U.S. federal income tax to the extent of the income that it distributes. However, even if the Company qualifies for taxation as a REIT, it may be subject to certain state and local taxes on income in addition to U.S. federal income and excise taxes on its undistributed income. The Company, through its TRS, is indirectly subject to U.S. federal, state and local income taxes. The Company’s TRS is not consolidated for U.S. federal income tax purposes, but is instead taxed as a C corporation. For financial reporting purposes, the TRS is consolidated and a provision for current and deferred taxes is established for the portion of earnings recognized by the Company with respect to its interest in its TRS. Total income tax provision/(benefit) for the three months ended September 30, 2020 and September 30, 2019 was $0.2 million and $2.1 million, respectively. Total income tax provision/(benefit) for the nine months ended September 30, 2020 and September 30, 2019 was $(2.5) million and $3.7 million, respectively.
The Company uses a more-likely-than-not threshold for recognition and derecognition of tax positions taken or to be taken in a tax return. The Company has assessed its tax positions for all open tax years beginning with December 31, 2016 and concluded that there were no uncertainties to be recognized. The Company’s accounting policy with respect to interest and penalties related to tax uncertainties is to classify these amounts as provision for income taxes.
The Company utilizes the TRS to reduce the impact of the prohibited transaction tax and to avoid penalty for the holding of assets not qualifying as real estate assets for purposes of the REIT asset tests. Any income associated with a TRS is fully taxable because the TRS is subject to federal and state income taxes as a domestic C corporation based upon its net income.
Derivatives and Hedging Activities
In the normal course of business, the Company is exposed to the effect of interest rate changes and may undertake a strategy to limit these risks through the use of derivatives. The Company uses derivatives primarily to economically hedge against interest rates, CMBS spreads and macro market risk in order to minimize volatility. The Company may use a variety of derivative instruments that are considered conventional, including but not limited to: Treasury note futures and credit derivatives on various indices including CMBX and CDX.
The Company recognizes all derivatives on the consolidated balance sheets at fair value. The Company does not designate derivatives as hedges to qualify for hedge accounting for financial reporting purposes and therefore any net payments under, or fluctuations in the fair value of these derivatives have been recognized currently in unrealized gain/(loss) on derivative instruments in the accompanying consolidated statements of operations. The Company records derivative asset and liability positions on a gross basis with any collateral posted with or received from counterparties recorded separately within Restricted cash on the Company’s consolidated balance sheets. Certain derivatives that the Company has entered into are subject to master netting agreements with its counterparties, allowing for netting of the same transaction, in the same currency, on the same date.
15
BENEFIT STREET PARTNERS REALTY TRUST, INC.
NOTES TO CONSOLIDATED FINANCIAL STATEMENTS
September 30, 2020
(Unaudited)
Per Share Data
The Company’s Preferred Stock is considered a participating security and the Company calculates basic earnings per share using the two-class method. The Company’s dilutive earnings per share calculation is computed using the more dilutive result of the treasury stock method, assuming the participating security is a potential common share, or the two-class method, assuming the participating security is not converted. The Company calculates basic earnings per share by dividing net income applicable to common stock for the period by the weighted-average number of shares of common stock outstanding for that period. Diluted earnings per share reflects the potential dilution that could occur from shares outstanding if potential shares of common stock with a dilutive effect have been issued in connection with the restricted stock plan or upon conversion of the outstanding shares of the Company’s Preferred Stock, except when doing so would be anti-dilutive.
Reportable Segments
The Company has determined that it has four reportable segments based on how the chief operating decision maker reviews and manages the business. The four reporting segments are as follows:
• | The real estate debt business which is focused on originating, acquiring and asset managing commercial real estate debt investments, including first mortgage loans, subordinate mortgages, mezzanine loans and participations in such loans. |
• | The real estate securities business which is focused on investing in and asset managing commercial real estate securities primarily consisting of CMBS and may include unsecured REIT debt, CDO notes and other securities. |
• | The commercial conduit business in the Company's TRS, which is focused on originating and subsequently selling fixed-rate commercial real estate loans into the CMBS securitization market. |
• | The real estate owned business represents real estate acquired by the Company through foreclosure, deed in lieu of foreclosure, or purchase. |
See Note 15 - Segment Reporting for further information regarding the Company's segments.
Redeemable Convertible Preferred Stock
The Company’s outstanding Preferred Stock is classified outside of permanent equity in the consolidated balance sheets. Subject to certain conditions, the outstanding Preferred Stock is redeemable at the option of the holders of the Preferred Stock, outside of the control of the Company. As set forth in the Articles Supplementary relating to each of the Series A Preferred Stock and the Series C Preferred Stock (collectively, the “Articles Supplementary”) to the Company’s Articles of Amendment and Restatement, the Preferred Stock is redeemable for shares of the Company's common stock, $0.01 par value per share (the "Common Stock") at the option of the holder upon a change of control (as defined in the Articles Supplementary) or after the sixth anniversary of the date of issuance. A change in control of the Company occurs if any person acquires more than 50% of the total economic interests or voting power of all securities of the Company, other than in a liquidity event.
Shares of Preferred Stock rank senior to shares of Common Stock with respect to rights to receive dividends and to participate in distributions or payments upon any voluntary or involuntary liquidation, dissolution or winding up of the Company. Dividends payable on each share of outstanding Preferred Stock will be equal to the greater of (i) an amount equal to $16.67 per share and (ii) the monthly dividend that would have been paid had such share of Preferred Stock been converted to a share of Common Stock, subject to proration in the event that such share of Preferred Stock was not outstanding for the full month.
16
BENEFIT STREET PARTNERS REALTY TRUST, INC.
NOTES TO CONSOLIDATED FINANCIAL STATEMENTS
September 30, 2020
(Unaudited)
Immediately prior to a “Liquidity Event,” each outstanding share of Series A Preferred Stock shall convert into 299.2 shares of Common Stock, subject to anti-dilution adjustments (the “Conversion Rate”). Each outstanding share of Series C Preferred Stock will convert into shares of Common Stock at the same Conversion Rate on the one-year anniversary of a Liquidity Event, subject to the Company’s right to accelerate the conversion to a date no earlier than six months after the Liquidity Event, upon at least ten days prior notice to the holders of the Series C Preferred Stock. A “Liquidity Event” is defined as (i) the listing of the Common Stock on a national securities exchange or quotation on an electronic inter-dealer quotation system; (ii) a merger or business combination involving the Company pursuant to which outstanding shares Common Stock are exchanged for securities of another company which are listed on a national securities exchange or quoted on an electronic inter-dealer quotation system; or (iii) any other transaction or series of transaction that results in all shares of Common Stock being transferred or exchange for cash or securities which are listed on a national securities exchange or quoted on an electronic inter-dealer quotation system. If there has not been a Liquidity Event within six years from the initial issuance of the outstanding Preferred Stock, each holder of Preferred Stock shall have the right to convert all, but not less than all, of the Preferred Stock held by such holder into Common Stock at the Conversion Rate. Each holder also has the option to convert its shares of outstanding Preferred Stock into Common Stock upon a change in control (as defined in the respective Articles Supplementary for the Series A Preferred Stock and Series C Preferred Stock) of the Company. In addition, neither the Company nor a holder of shares of outstanding Preferred Stock may redeem shares of the Preferred Stock until six years from the initial issuance of the Preferred Stock, except in cases of a change in control (as defined in the respective Articles Supplementary).
Holders of the outstanding Preferred Stock are entitled to vote on each matter submitted to a vote of the stockholders of the Company upon which the holders of Common Stock are entitled to vote, upon which the holders of the Preferred Stock and holders of the Common Stock shall vote together as a single class. The number of votes applicable to a share of outstanding Preferred Stock will be equal to the number of shares of Common Stock a share of Preferred Stock could have been converted into as of the record date set for purposes of such stockholder vote (rounded down to the nearest whole number of shares of Common Stock). In addition, the affirmative vote of the holders of two-thirds of the outstanding shares of Preferred Stock is required to approve the issuance of any equity securities senior to the Preferred Stock and to take certain actions materially adverse to the holders of the Preferred Stock.
Accounting Pronouncements Not Yet Adopted
On March 12, 2020, the FASB issued ASU No. 2020-04, Reference Rate Reform (Topic 848): Facilitation of the Effects of Reference Rate Reform on Financial Reporting, which provides temporary optional expedients and exceptions to the US GAAP guidance on contract modifications and hedge accounting to ease the financial reporting burdens of the expected market transition from LIBOR and other interbank offered rates to alternative reference rates. The guidance is effective upon issuance and generally can be applied through December 31, 2022. The Company has not adopted any of the optional expedients or exceptions through September 30, 2020, but will continue to evaluate the possible adoption of any such expedients or exceptions during the effective period as circumstances evolve.
17
BENEFIT STREET PARTNERS REALTY TRUST, INC.
NOTES TO CONSOLIDATED FINANCIAL STATEMENTS
September 30, 2020
(Unaudited)
Note 3 - Commercial Mortgage Loans
The following table is a summary of the Company's commercial mortgage loans, held for investment, carrying values by class (dollars in thousands):
________________________
September 30, 2020 | December 31, 2019 | ||||||
Senior loans | $ | 2,607,234 | $ | 2,721,325 | |||
Mezzanine loans | 14,464 | 41,638 | |||||
Total gross carrying value of loans | 2,621,698 | 2,762,963 | |||||
Less: Allowance for credit losses (1) | 22,777 | 921 | |||||
Total commercial mortgage loans, held for investment, net | $ | 2,598,921 | $ | 2,762,042 | |||
(1) As of September 30, 2020 and December 31, 2019, there have been no specific reserves for loans in non-performing status.
As of September 30, 2020 and December 31, 2019, the Company's total commercial mortgage loan portfolio, excluding commercial mortgage loans accounted for under the fair value option, was comprised of 124 and 122 loans, respectively.
Allowance for Credit Losses
The following table presents the activity in the Company's allowance for credit losses, excluding the unfunded loan commitments, as of September 30, 2020 (dollars in thousands):
Three Months Ended September 30, 2020 | ||||||||||||||||||||||||||||||||||||
MultiFamily | Retail | Office | Industrial | Mixed Use | Hospitality | Self Storage | Manufactured Housing | Total | ||||||||||||||||||||||||||||
Beginning Balance | $ | 10,742 | $ | 780 | $ | 4,350 | $ | 599 | $ | 2,250 | $ | 7,243 | $ | 220 | $ | 60 | $ | 26,244 | ||||||||||||||||||
Current Period: | ||||||||||||||||||||||||||||||||||||
Increase/(decrease) in provision for credit losses | (3,937 | ) | (327 | ) | (2,336 | ) | 170 | (1,003 | ) | 4,024 | (92 | ) | 34 | (3,467 | ) | |||||||||||||||||||||
Ending Balance | $ | 6,805 | $ | 453 | $ | 2,014 | $ | 769 | $ | 1,247 | $ | 11,267 | $ | 128 | $ | 94 | $ | 22,777 | ||||||||||||||||||
Nine Months Ended September 30, 2020 | ||||||||||||||||||||||||||||||||||||
MultiFamily | Retail | Office | Industrial | Mixed Use | Hospitality | Self Storage | Manufactured Housing | Total | ||||||||||||||||||||||||||||
Beginning Balance | $ | 322 | $ | 202 | $ | 249 | $ | 23 | $ | 4 | $ | 103 | $ | — | $ | 18 | $ | 921 | ||||||||||||||||||
Cumulative-effect adjustment upon adoption of ASU 2016-13 | 3,220 | 386 | 1,966 | 434 | 9 | 739 | 399 | 58 | 7,211 | |||||||||||||||||||||||||||
Current Period: | ||||||||||||||||||||||||||||||||||||
Increase/(decrease) in provision for credit losses | 3,263 | (135 | ) | (201 | ) | 312 | 1,234 | 10,852 | (271 | ) | 18 | 15,072 | ||||||||||||||||||||||||
Write offs | — | — | — | — | — | (427 | ) | — | — | (427 | ) | |||||||||||||||||||||||||
Ending Balance | $ | 6,805 | $ | 453 | $ | 2,014 | $ | 769 | $ | 1,247 | $ | 11,267 | $ | 128 | $ | 94 | $ | 22,777 | ||||||||||||||||||
The Company recorded a decrease in its provision for credit losses during the three months ended September 30, 2020 of $3.5 million and an increase in its provision for credit losses during the nine months ended September 30, 2020 of $15.1 million. This is primarily driven by an update of the macro economic assumptions used in the Company’s current quarter CECL evaluation.
18
BENEFIT STREET PARTNERS REALTY TRUST, INC.
NOTES TO CONSOLIDATED FINANCIAL STATEMENTS
September 30, 2020
(Unaudited)
The following table presents the activity in the Company's allowance for credit losses, for the unfunded loan commitments, as of September 30, 2020 (dollars in thousands):
Three Months Ended September 30, 2020 | ||||||||||||||||||||||||||||||||||||
MultiFamily | Retail | Office | Industrial | Mixed Use | Hospitality | Self Storage | Manufactured Housing | Total | ||||||||||||||||||||||||||||
Beginning Balance | $ | 225 | $ | — | $ | 149 | $ | 40 | $ | — | $ | 235 | $ | — | $ | 1 | $ | 650 | ||||||||||||||||||
Current Period: | ||||||||||||||||||||||||||||||||||||
Increase/(decrease) in provision for credit losses | (111 | ) | — | (73 | ) | 144 | — | (203 | ) | — | — | (243 | ) | |||||||||||||||||||||||
Ending Balance | $ | 114 | $ | — | $ | 76 | $ | 184 | $ | — | $ | 32 | $ | — | $ | 1 | $ | 407 | ||||||||||||||||||
Nine Months Ended September 30, 2020 | ||||||||||||||||||||||||||||||||||||
MultiFamily | Retail | Office | Industrial | Mixed Use | Hospitality | Self Storage | Manufactured Housing | Total | ||||||||||||||||||||||||||||
Beginning Balance | $ | — | $ | — | $ | — | $ | — | $ | — | $ | — | $ | — | $ | — | $ | — | ||||||||||||||||||
Cumulative-effect adjustment upon adoption of ASU 2016-13 | 239 | 40 | 150 | 30 | 1 | 57 | 28 | 5 | 550 | |||||||||||||||||||||||||||
Current Period: | ||||||||||||||||||||||||||||||||||||
Increase/(decrease) in provision for credit losses | (125 | ) | (40 | ) | (74 | ) | 154 | (1 | ) | (25 | ) | (28 | ) | (4 | ) | (143 | ) | |||||||||||||||||||
Ending Balance | $ | 114 | $ | — | $ | 76 | $ | 184 | $ | — | $ | 32 | $ | — | $ | 1 | $ | 407 | ||||||||||||||||||
The following table represents the composition by loan type of the Company's commercial mortgage loans, held for investment portfolio (dollars in thousands):
September 30, 2020 | December 31, 2019 | |||||||||||||
Loan Type | Par Value | Percentage | Par Value | Percentage | ||||||||||
Multifamily | $ | 1,310,072 | 49.8 | % | $ | 1,491,971 | 53.9 | % | ||||||
Hospitality | 403,729 | 15.4 | % | 446,562 | 16.1 | % | ||||||||
Office | 361,658 | 13.8 | % | 414,772 | 15.0 | % | ||||||||
Industrial | 221,460 | 8.4 | % | 118,743 | 4.3 | % | ||||||||
Self Storage | 92,492 | 3.5 | % | 67,767 | 2.4 | % | ||||||||
Retail | 91,045 | 3.5 | % | 111,620 | 4.0 | % | ||||||||
Mixed Use | 69,579 | 2.6 | % | 58,808 | 2.1 | % | ||||||||
Manufactured Housing | 62,685 | 2.4 | % | 44,656 | 1.6 | % | ||||||||
Land | 16,400 | 0.6 | % | 16,400 | 0.6 | % | ||||||||
Total | $ | 2,629,120 | 100.0 | % | $ | 2,771,299 | 100.0 | % | ||||||
19
BENEFIT STREET PARTNERS REALTY TRUST, INC.
NOTES TO CONSOLIDATED FINANCIAL STATEMENTS
September 30, 2020
(Unaudited)
As of September 30, 2020 and December 31, 2019, the Company's total commercial mortgage loans, held-for-sale, measured at fair value were comprised of 1 and 7 loans, respectively. As of September 30, 2020 and December 31, 2019, the contractual principal outstanding of commercial mortgage loans, held-for-sale, measured at fair value was $0.1 million and $112.5 million, respectively. As of September 30, 2020 and December 31, 2019, none of the Company's commercial mortgage loans, held-for-sale, measured at fair value were in default or greater than ninety days past due.
The following table represents the composition by loan type of the Company's commercial mortgage loans, held-for-sale, measured at fair value (dollars in thousands):
September 30, 2020 | December 31, 2019 | |||||||||||||
Loan Type | Par Value | Percentage | Par Value | Percentage | ||||||||||
Multifamily | $ | 100 | 100.0 | % | $ | 78,250 | 69.6 | % | ||||||
Retail | — | — | % | 2,613 | 2.3 | % | ||||||||
Office | — | — | % | — | — | % | ||||||||
Manufactured Housing | — | — | % | — | — | % | ||||||||
Hospitality | — | — | % | 8,000 | 7.1 | % | ||||||||
Industrial | — | — | % | 23,625 | 21.0 | % | ||||||||
Total | $ | 100 | 100.0 | % | $ | 112,488 | 100.0 | % | ||||||
Loan Credit Quality and Vintage
The following tables present the amortized cost of our commercial mortgage loans, held for investment as of September 30, 2020, by loan type, the Company’s internal risk rating and year of origination. The risk ratings are updated as of September 30, 2020.
September 30, 2020 | ||||||||||||||||||||||||||||||||
2020 | 2019 | 2018 | 2017 | 2016 | 2015 | Prior | Total | |||||||||||||||||||||||||
Multifamily: | ||||||||||||||||||||||||||||||||
Risk Rating: | ||||||||||||||||||||||||||||||||
1-2 internal grade | $ | 475,769 | $ | 433,442 | $ | 321,477 | $ | 34,875 | $ | — | $ | — | $ | 3,488 | $ | 1,269,051 | ||||||||||||||||
3-4 internal grade | — | — | — | 37,812 | — | — | — | 37,812 | ||||||||||||||||||||||||
Total Multifamily Loans | $ | 475,769 | $ | 433,442 | $ | 321,477 | $ | 72,687 | $ | — | $ | — | $ | 3,488 | $ | 1,306,863 | ||||||||||||||||
Retail: | ||||||||||||||||||||||||||||||||
Risk Rating: | ||||||||||||||||||||||||||||||||
1-2 internal grade | $ | — | $ | 36,158 | $ | 16,391 | $ | — | $ | — | $ | — | $ | — | $ | 52,549 | ||||||||||||||||
3-4 internal grade | — | 12,868 | 41,896 | — | — | — | — | 54,764 | ||||||||||||||||||||||||
Total Retail Loans | $ | — | $ | 49,026 | $ | 58,287 | $ | — | $ | — | $ | — | $ | — | $ | 107,313 | ||||||||||||||||
Office: | ||||||||||||||||||||||||||||||||
Risk Rating: | ||||||||||||||||||||||||||||||||
1-2 internal grade | $ | 92,497 | $ | 154,508 | $ | 61,221 | $ | 41,479 | $ | — | $ | — | $ | — | $ | 349,705 | ||||||||||||||||
3-4 internal grade | — | — | — | 10,454 | — | — | — | 10,454 | ||||||||||||||||||||||||
Total Office Loans | $ | 92,497 | $ | 154,508 | $ | 61,221 | $ | 51,933 | $ | — | $ | — | $ | — | $ | 360,159 | ||||||||||||||||
Industrial: | ||||||||||||||||||||||||||||||||
Risk Rating: | ||||||||||||||||||||||||||||||||
1-2 internal grade | $ | 74,256 | $ | 112,416 | $ | — | $ | — | $ | — | $ | 33,655 | $ | — | $ | 220,327 | ||||||||||||||||
3-4 internal grade | — | — | — | — | — | — | — | — | ||||||||||||||||||||||||
Total Industrial Loans | $ | 74,256 | $ | 112,416 | $ | — | $ | — | $ | — | $ | 33,655 | $ | — | $ | 220,327 | ||||||||||||||||
20
BENEFIT STREET PARTNERS REALTY TRUST, INC.
NOTES TO CONSOLIDATED FINANCIAL STATEMENTS
September 30, 2020
(Unaudited)
Mixed Use: | ||||||||||||||||||||||||||||||||
Risk Rating: | ||||||||||||||||||||||||||||||||
1-2 internal grade | $ | — | $ | — | $ | 56,697 | $ | 12,882 | $ | — | $ | — | $ | — | $ | 69,579 | ||||||||||||||||
3-4 internal grade | — | — | — | — | — | — | — | — | ||||||||||||||||||||||||
Total Mixed Use Loans | $ | — | $ | — | $ | 56,697 | $ | 12,882 | $ | — | $ | — | $ | — | $ | 69,579 | ||||||||||||||||
Hospitality: | ||||||||||||||||||||||||||||||||
Risk Rating: | ||||||||||||||||||||||||||||||||
1-2 internal grade | $ | 26,868 | $ | 10,542 | $ | — | $ | — | $ | — | $ | — | $ | — | $ | 37,410 | ||||||||||||||||
3-4 internal grade | — | 159,545 | 114,999 | 90,763 | — | — | — | 365,307 | ||||||||||||||||||||||||
Total Hospitality Loans | $ | 26,868 | $ | 170,087 | $ | 114,999 | $ | 90,763 | $ | — | $ | — | $ | — | $ | 402,717 | ||||||||||||||||
Self Storage: | ||||||||||||||||||||||||||||||||
Risk Rating: | ||||||||||||||||||||||||||||||||
1-2 internal grade | $ | 29,747 | $ | — | $ | 62,557 | $ | — | $ | — | $ | — | $ | — | $ | 92,304 | ||||||||||||||||
3-4 internal grade | — | — | — | — | — | — | — | — | ||||||||||||||||||||||||
Total Self Storage Loans | $ | 29,747 | $ | — | $ | 62,557 | $ | — | $ | — | $ | — | $ | — | $ | 92,304 | ||||||||||||||||
Manufactured Housing: | ||||||||||||||||||||||||||||||||
Risk Rating: | ||||||||||||||||||||||||||||||||
1-2 internal grade | $ | 17,410 | $ | 45,026 | $ | — | $ | — | $ | — | $ | — | $ | — | $ | 62,436 | ||||||||||||||||
3-4 internal grade | — | — | — | — | — | — | — | — | ||||||||||||||||||||||||
Total Manufactured Housing Loans | $ | 17,410 | $ | 45,026 | $ | — | $ | — | $ | — | $ | — | $ | — | $ | 62,436 | ||||||||||||||||
Total | $ | 716,547 | $ | 964,505 | $ | 675,238 | $ | 228,265 | $ | — | $ | 33,655 | $ | 3,488 | $ | 2,621,698 | ||||||||||||||||
Past Due Status
The following table presents an aging summary of the loans amortized cost basis at September 30, 2020 (dollars in thousands):
________________________
Multifamily | Retail | Office | Industrial | Mixed Use | Hospitality | Self Storage | Manufactured Housing | Total | ||||||||||||||||||||||||||||
Status: | ||||||||||||||||||||||||||||||||||||
Current | $ | 1,306,863 | $ | 94,836 | $ | 360,159 | $ | 220,327 | $ | 69,579 | $ | 345,642 | $ | 92,304 | $ | 62,436 | $ | 2,552,146 | ||||||||||||||||||
1-29 days past due | — | — | — | — | — | — | — | — | — | |||||||||||||||||||||||||||
30-59 days past due | — | — | — | — | — | — | — | — | — | |||||||||||||||||||||||||||
60-89 days past due | — | — | — | — | — | — | — | — | — | |||||||||||||||||||||||||||
90-119 days past due | — | — | — | — | — | — | — | — | — | |||||||||||||||||||||||||||
120+ days past due (1) | — | 12,477 | — | — | — | 57,075 | — | — | 69,552 | |||||||||||||||||||||||||||
Total | $ | 1,306,863 | $ | 107,313 | $ | 360,159 | $ | 220,327 | $ | 69,579 | $ | 402,717 | $ | 92,304 | $ | 62,436 | $ | 2,621,698 | ||||||||||||||||||
(1) For the three and nine months ended September 30, 2020, interest income recognized on these two loans was $0.0 million and $0.4 million, respectively.
As of September 30, 2020, the Company had two loans on non-accrual status with a total cost basis of $69.6 million. As of December 31, 2019, the Company had one loan on non-accrual status with a cost basis of $57.1 million.
21
BENEFIT STREET PARTNERS REALTY TRUST, INC.
NOTES TO CONSOLIDATED FINANCIAL STATEMENTS
September 30, 2020
(Unaudited)
Credit Characteristics
As part of the Company's process for monitoring the credit quality of its commercial mortgage loans, excluding those held-for-sale, measured at fair value, it performs a quarterly loan portfolio assessment and assigns risk ratings to each of its loans. The loans are scored on a scale of 1 to 5 as follows:
Investment Rating | Summary Description | |
1 | Investment exceeding fundamental performance expectations and/or capital gain expected. Trends and risk factors since time of investment are favorable. | |
2 | Performing consistent with expectations and a full return of principal and interest expected. Trends and risk factors are neutral to favorable. | |
3 | Performing investments requiring closer monitoring. Trends and risk factors show some deterioration. | |
4 | Underperforming investment with the potential of some interest loss but still expecting a positive return on investment. Trends and risk factors are negative. | |
5 | Underperforming investment with expected loss of interest and some principal. | |
All commercial mortgage loans, excluding loans classified as commercial mortgage loans, held-for-sale, measured at fair value within the consolidated balance sheets, are assigned an initial risk rating of 2.0. As of September 30, 2020 and December 31, 2019, the weighted average risk rating of the loans was 2.2 and 2.1, respectively.
The following table represents the allocation by risk rating for the Company's commercial mortgage loans, held for investment (dollars in thousands):
September 30, 2020 | December 31, 2019 | |||||||||||||||
Risk Rating | Number of Loans | Par Value | Risk Rating | Number of Loans | Par Value | |||||||||||
1 | — | $ | — | 1 | — | $ | — | |||||||||
2 | 98 | 2,159,809 | 2 | 113 | 2,452,330 | |||||||||||
3 | 22 | 385,787 | 3 | 8 | 298,994 | |||||||||||
4 | 4 | 83,524 | 4 | 1 | 19,975 | |||||||||||
5 | — | — | 5 | — | — | |||||||||||
124 | $ | 2,629,120 | 122 | $ | 2,771,299 | |||||||||||
For the nine months ended September 30, 2020 and year ended December 31, 2019, the activity in the Company's commercial mortgage loans, held for investment portfolio was as follows (dollars in thousands):
Nine Months Ended September 30, | Year Ended December 31, | ||||||
2020 | 2019 | ||||||
Balance at Beginning of Year | $ | 2,762,042 | $ | 2,206,830 | |||
Cumulative-effect adjustment upon adoption of ASU 2016-13 | (7,211 | ) | — | ||||
Acquisitions and originations | 855,686 | 1,326,983 | |||||
Principal repayments | (926,337 | ) | (771,774 | ) | |||
Discount accretion/premium amortization | 4,661 | 6,264 | |||||
Loans transferred from/(to) commercial real estate loans, held-for-sale | (36,049 | ) | 10,100 | ||||
Net fees capitalized into carrying value of loans | (4,162 | ) | (5,339 | ) | |||
Increase/(decrease) in provision for credit losses | (15,072 | ) | (3,007 | ) | |||
Charge-off from allowance for credit losses | 427 | 6,922 | |||||
Transfer to real estate owned | (35,064 | ) | — | ||||
Transfer on deed in lieu of foreclosure to real estate owned | — | (14,937 | ) | ||||
Balance at End of Period | $ | 2,598,921 | $ | 2,762,042 | |||
22
BENEFIT STREET PARTNERS REALTY TRUST, INC.
NOTES TO CONSOLIDATED FINANCIAL STATEMENTS
September 30, 2020
(Unaudited)
During the nine months ended September 30, 2020, the Company wrote off a commercial mortgage loan, held for investment, with a carrying value of $14.4 million in exchange for the possession of a REO investment at a fair value of $14.0 million at the time of the transfer. This $14.0 million REO investment is comprised of $11.6 million of real property (land, building and improvements) and $2.4 million of personal property (furniture, fixture, and equipment). The transfer occurred when the Company took possession of the property by completing a foreclosure transaction in March 2020, resulting in a $0.4 million impairment loss at the time of transfer. The Company sold this REO asset during the nine months ended September 30, 2020 for a $1.4 million gain, presented net of direct selling costs associated with the disposition of the asset, included within Realized gain/loss on sale of real estate owned, held-for-sale in the Company's consolidated statements of operations. The results of operations of the REO have been included in the Company’s consolidated statements of operations and comprehensive income since the acquisition date and the gain on sale has been included in the Company’s consolidated statements of operations for the quarter ended September 30, 2020.
During the nine months ended September 30, 2020, the Company reached an agreement with a borrower to take possession of certain collateral. At the time of transfer, the carrying value of the commercial mortgage loan, held for investment was $21.1 million, which was exchanged for possession of the REO asset at a purchase price of $21.4 million. This $21.4 million REO investment is comprised of $18.9 million of real property (land, building and improvements) and $2.5 million of personal property (furniture, fixture, and equipment). The Company accounted for the REO acquired during the nine months ended September 30, 2020 as an asset acquisition. No gain or loss was recognized at the time of transfer.
23
BENEFIT STREET PARTNERS REALTY TRUST, INC.
NOTES TO CONSOLIDATED FINANCIAL STATEMENTS
September 30, 2020
(Unaudited)
Note 4 - Real Estate Securities
The following is a summary of the Company's real estate securities, CMBS (dollars in thousands):
September 30, 2020 | ||||||||
Type | Interest Rate | Maturity | Par Value | Fair Value | ||||
CMBS 1 | 3.0% | 5/15/2022 | $13,250 | $12,556 | ||||
CMBS 2 | 2.2% | 6/26/2025 | 10,800 | 10,153 | ||||
CMBS 3 | 2.5% | 2/15/2036 | 40,000 | 37,931 | ||||
CMBS 4 | 1.9% | 6/15/2037 | 8,000 | 7,861 | ||||
CMBS 5 | 2.1% | 9/15/2037 | 24,000 | 23,100 | ||||
CMBS 6 | 2.3% | 6/15/2034 | 12,000 | 11,578 | ||||
CMBS 7 | 1.5% | 12/15/2036 | 20,000 | 18,826 | ||||
CMBS 8 | 1.8% | 12/15/2036 | 25,000 | 23,191 | ||||
CMBS 9 | 2.3% | 3/15/2035 | 25,665 | 24,607 | ||||
December 31, 2019 | ||||||||
Type | Interest Rate | Maturity | Par Value | Fair Value | ||||
CMBS 1 | 4.7% | 5/15/2022 | $13,250 | $13,274 | ||||
CMBS 2 | 3.8% | 6/26/2025 | 12,131 | 12,151 | ||||
CMBS 3 | 4.1% | 2/15/2036 | 40,000 | 40,186 | ||||
CMBS 4 | 3.7% | 5/15/2036 | 18,500 | 18,535 | ||||
CMBS 5 | 3.1% | 5/15/2036 | 15,000 | 15,019 | ||||
CMBS 6 | 3.2% | 5/15/2037 | 13,500 | 13,525 | ||||
CMBS 7 | 3.4% | 5/15/2037 | 15,000 | 15,028 | ||||
CMBS 8 | 3.2% | 6/15/2037 | 7,000 | 7,013 | ||||
CMBS 9 | 3.6% | 2/15/2036 | 9,600 | 9,641 | ||||
CMBS 10 | 3.5% | 8/15/2036 | 10,000 | 10,027 | ||||
CMBS 11 | 3.6% | 6/15/2037 | 8,000 | 8,015 | ||||
CMBS 12 | 3.3% | 7/15/2038 | 13,000 | 13,022 | ||||
CMBS 13 | 3.3% | 9/15/2037 | 32,000 | 32,074 | ||||
CMBS 14 | 3.7% | 9/15/2037 | 24,000 | 24,084 | ||||
CMBS 15 | 3.3% | 10/19/2038 | 50,000 | 50,094 | ||||
CMBS 16 | 3.7% | 10/19/2038 | 26,000 | 26,029 | ||||
CMBS 17 | 3.2% | 6/15/2034 | 15,000 | 15,022 | ||||
CMBS 18 | 3.5% | 6/15/2034 | 6,500 | 6,509 | ||||
CMBS 19 | 3.9% | 6/15/2034 | 12,000 | 12,022 | ||||
CMBS 20 | 3.1% | 12/15/2036 | 20,000 | 20,021 | ||||
CMBS 21 | 3.4% | 12/15/2036 | 25,000 | 25,025 | ||||
The Company classified its CMBS investments as available for sale as of September 30, 2020 and December 31, 2019. These investments are reported at fair value in the consolidated balance sheets with changes in fair value recorded in accumulated other comprehensive income/(loss). The weighted average contractual maturity for CLO investments included within the CMBS portfolio as of September 30, 2020 and December 31, 2019 was 14 and 17 years. The weighted average contractual maturity for single asset single borrower "SASB" investments as of September 30, 2020 and December 31, 2019 was 14 and 5 years.
24
BENEFIT STREET PARTNERS REALTY TRUST, INC.
NOTES TO CONSOLIDATED FINANCIAL STATEMENTS
September 30, 2020
(Unaudited)
The following table shows the amortized cost, allowance for expected credit losses, unrealized gain/(loss) and fair value of the Company's CMBS investments by investment type (dollars in thousands):
Amortized Cost | Credit Loss Allowance | Unrealized Gain | Unrealized Loss | Fair Value | ||||||||||||||||
September 30, 2020 | ||||||||||||||||||||
CLOs | $ | 123,464 | $ | — | $ | — | $ | (5,830 | ) | $ | 117,634 | |||||||||
SASB | 55,949 | — | — | (3,780 | ) | 52,169 | ||||||||||||||
Total | $ | 179,413 | $ | — | $ | — | $ | (9,610 | ) | $ | 169,803 | |||||||||
December 31, 2019 | ||||||||||||||||||||
CLOs | $ | 330,000 | $ | — | $ | 1 | $ | (881 | ) | $ | 329,120 | |||||||||
SASB | 57,294 | — | — | (98 | ) | 57,196 | ||||||||||||||
Total | $ | 387,294 | $ | — | $ | 1 | $ | (979 | ) | $ | 386,316 | |||||||||
As of September 30, 2020 the Company held 9 CMBS positions with an amortized cost basis of $179.4 million and an unrealized loss of $9.6 million, of which 4 positions had an unrealized loss for a period greater than twelve months. As of December 31, 2019, the Company held 21 CMBS positions with an amortized cost basis of $387.3 million and an unrealized loss of $1.0 million, of which 2 positions had an unrealized loss for a period greater than twelve months.
The following table provides information on the unrealized losses and fair value on the Company's real estate securities, CMBS, available for sale that were in an unrealized loss position, and for which an allowance for credit losses has not been recorded as of September 30, 2020 and December 31, 2019 (amounts in thousands):
Fair Value | Unrealized Loss | ||||||||||||||
Securities with an unrealized loss less than 12 months | Securities with an unrealized loss greater than 12 months | Securities with an unrealized loss less than 12 months | Securities with an unrealized loss greater than 12 months | ||||||||||||
September 30, 2020 | |||||||||||||||
CLOs | $ | 74,119 | $ | 43,515 | $ | (3,901 | ) | $ | (1,929 | ) | |||||
SASB | 42,017 | 10,152 | (3,089 | ) | (691 | ) | |||||||||
Total | $ | 116,136 | $ | 53,667 | $ | (6,990 | ) | $ | (2,620 | ) | |||||
December 31, 2019 | |||||||||||||||
CLOs | $ | 315,845 | $ | 13,275 | $ | (863 | ) | $ | (17 | ) | |||||
SASB | 45,045 | 12,151 | (67 | ) | (31 | ) | |||||||||
Total | $ | 360,890 | $ | 25,426 | $ | (930 | ) | $ | (48 | ) | |||||
As of September 30, 2020 and December 31, 2019, there were 4 securities and 2 securities, respectively with unrealized losses for a period greater than twelve months reflected in the table above. After evaluating the securities, the Company concluded that the unrealized losses reflected above were noncredit-related and would be recovered from the securities’ estimated future cash flows. The Company considered a number of factors in reaching this conclusion, including that the Company did not intend to sell the securities, it was not considered more likely than not that we would be forced to sell the securities prior to recovering our amortized cost, the portfolio is made up of investment grade securities of recent originations and higher tranches, and that there were no material credit events that would have caused us to otherwise conclude that the Company would not recover our cost. The allowance for credit losses is calculated using a discounted cash flow approach and is measured as the difference between the original cash flows expected to be collected to the revised cash flows expected to be collected discounted using the effective interest rate, limited by the amount that the fair value is less than the amortized cost basis. Significant judgment is used in projecting cash flows. As a result, actual income and/or credit losses could be materially different from what is currently projected and/or reported.
25
BENEFIT STREET PARTNERS REALTY TRUST, INC.
NOTES TO CONSOLIDATED FINANCIAL STATEMENTS
September 30, 2020
(Unaudited)
The following table provides information on the amounts of gain/(loss) on the Company's real estate securities, CMBS, available for sale (dollars in thousands):
Three Months Ended September 30, | Nine Months Ended September 30, | ||||||||||||||
2020 | 2019 | 2020 | 2019 | ||||||||||||
Unrealized gain/(loss) available for sale securities | $ | 4,199 | $ | (372 | ) | $ | (9,380 | ) | $ | (292 | ) | ||||
Reclassification of net (gain)/loss on available for sale securities included in net income/(loss) | 14,457 | — | 748 | — | |||||||||||
Unrealized gain/(loss) available for sale securities, net of reclassification adjustment | $ | 18,656 | $ | (372 | ) | $ | (8,632 | ) | $ | (292 | ) | ||||
The amounts reclassified for net (gain)/loss on available for sale securities are included in the realized (gain)/loss on sale of real estate securities in the Company's consolidated statements of operations. The Company's unrealized gain/(loss) on available-for-sale securities is net of tax. Due to the Company's designation as a REIT, there was no tax impact on unrealized gain/(loss) on available for sale securities.
The deterioration in fair value of real estate securities for both collateralized loan obligations and other securities as of September 30, 2020 can be attributed mainly to the market down-turn and volatility as a result of high unemployment and credit uncertainties related to the outbreak of COVID-19. Management currently does not have the intention to sell any of the real estate securities as of September 30, 2020.
26
BENEFIT STREET PARTNERS REALTY TRUST, INC.
NOTES TO CONSOLIDATED FINANCIAL STATEMENTS
September 30, 2020
(Unaudited)
Note 5 - Real Estate Owned
The following table summarizes the Company's real estate owned assets as of September 30, 2020 (dollars in thousands):
________________________
September 30, 2020 | ||||||||||||||||||||||||
Acquisition Date | Property Type | Primary Location(s) | Land | Building and Improvements | Furniture, Fixtures and Equipment | Accumulated Depreciation | Real Estate Owned, net | |||||||||||||||||
August 2019 (1)(2) | Hotel | Chicago, IL | $ | — | $ | 10,234 | $ | — | $ | (260 | ) | $ | 9,974 | |||||||||||
October 2019 (1) | Office | Jeffersonville, IN | 1,887 | 21,989 | 3,565 | (732 | ) | 26,709 | ||||||||||||||||
September 2020 (3) | Hotel | Minneapolis, MN | 1,731 | 17,157 | 2,523 | — | 21,411 | |||||||||||||||||
$ | 3,618 | $ | 49,380 | $ | 6,088 | $ | (992 | ) | $ | 58,094 | ||||||||||||||
(1) Refer to Note 2 for the useful life of the above assets.
(2) Represents assets acquired by the Company by completing a deed-in-lieu of foreclosure transaction.
(3)Asset is designated as held-for-sale within the Company's consolidated balance sheets.
The following table summarizes the Company's real estate owned assets as of December 31, 2019 (dollars in thousands):
________________________
December 31, 2019 | ||||||||||||||||||||||||
Acquisition Date | Property Type | Primary Location(s) | Land | Building and Improvements | Furniture, Fixtures and Equipment | Accumulated Depreciation | Real Estate Owned, net | |||||||||||||||||
August 2019 (1)(2) | Hotel | Chicago, IL | $ | — | $ | 8,110 | $ | — | $ | (86 | ) | $ | 8,024 | |||||||||||
October 2019 (1) | Office | Jeffersonville, IN | 1,887 | 25,554 | — | (133 | ) | 27,309 | ||||||||||||||||
$ | 1,887 | $ | 33,664 | $ | — | $ | (219 | ) | $ | 35,333 | ||||||||||||||
(1) Refer to Note 2 for the useful life of the above assets.
(2) Represents assets acquired by the Company by completing a deed-in-lieu of foreclosure transaction.
Depreciation expense for the three and nine months ended September 30, 2020 totaled $0.3 million and $0.8 million, respectively. Depreciation expense for the three and nine months ended September 30, 2019 totaled $0.03 million.
Long-Lived Asset Classified as Held-for-Sale
As of September 30, 2020, the Company has designated one property included within the real estate owned business segment as held-for-sale. The property is located in Minneapolis, MN and is currently being marketed and sale is probable to occur within one year.
27
BENEFIT STREET PARTNERS REALTY TRUST, INC.
NOTES TO CONSOLIDATED FINANCIAL STATEMENTS
September 30, 2020
(Unaudited)
Note 6 - Leases
Operating Right of Use Asset
The following table summarizes the Company's operating right of use asset recognized in the consolidated balance sheets as of September 30, 2020 (dollars in thousands):
September 30, 2020 | ||||||||||||||||
Acquisition Date | Property Type | Primary Location(s) | Operating Right of Use Asset, Gross | Accumulated Amortization | Operating Right of Use Asset, net of Amortization | |||||||||||
August 2019 | Hotel | Chicago, IL | $ | 6,109 | $ | (359 | ) | $ | 5,750 | |||||||
$ | 6,109 | $ | (359 | ) | $ | 5,750 | ||||||||||
The following table summarizes the Company's operating right of use asset recognized in the consolidated balance sheets as of December 31, 2019 (dollars in thousands):
December 31, 2019 | ||||||||||||||||
Acquisition Date | Property Type | Primary Location(s) | Operating Right of Use Asset, Gross | Accumulated Amortization | Operating Right of Use Asset, net of Amortization | |||||||||||
August 2019 | Hotel | Chicago, IL | $ | 6,109 | $ | (130 | ) | $ | 5,979 | |||||||
$ | 6,109 | $ | (130 | ) | $ | 5,979 | ||||||||||
Operating Lease Liabilities
On August 19, 2019, in conjunction with the deed-in-lieu of foreclosure transaction, the Company assumed a non-cancelable ground lease for the land on which the property is located and classified the lease as an operating lease. The ground lease requires monthly rental payments with annual increases of 3%. The initial term of the lease expires in 2067 and can be renewed for a sixty-year period. Rent expense for this operating lease for the three and nine months ended September 30, 2020 totaled $0.2 million and $0.6 million, respectively. Rent expense for this operating lease for the three and nine months ended September 30, 2019 totaled $0.1 million and $0.1 million, respectively.
The following table summarizes the Company's schedule of minimum future lease payments as of September 30, 2020 (dollars in thousands):
Minimum Future Lease Payments | September 30, 2020 | |||
2020 (October - December) | $ | 101 | ||
2021 | 410 | |||
2022 | 422 | |||
2023 | 435 | |||
2024 | 448 | |||
2025 and beyond | 39,438 | |||
Total undiscounted lease payments | $ | 41,254 | ||
Less: Amount representing interest | (34,997 | ) | ||
Present value of lease liability | $ | 6,257 | ||
28
BENEFIT STREET PARTNERS REALTY TRUST, INC.
NOTES TO CONSOLIDATED FINANCIAL STATEMENTS
September 30, 2020
(Unaudited)
The following table summarizes the Company's schedule of minimum future lease payments as of December 31, 2019 (dollars in thousands):
Minimum Future Lease Payments | December 31, 2019 | |||
2020 | $ | 398 | ||
2021 | 410 | |||
2022 | 422 | |||
2023 | 435 | |||
2024 | 448 | |||
2025 and beyond | 39,438 | |||
Total undiscounted lease payments | $ | 41,551 | ||
Less: Amount representing interest | (35,415 | ) | ||
Present value of lease liability | $ | 6,136 | ||
The discount rate used to calculate the lease liability as of September 30, 2020 and December 31, 2019 is 9%. The remaining lease term is 47.20 years as of September 30, 2020 and 47.95 as of December 31, 2019.
Intangible Lease Asset
The following table summarizes the Company's intangible lease asset recognized in the consolidated balance sheets as of September 30, 2020 (dollars in thousands):
September 30, 2020 | ||||||||||||||||
Acquisition Date | Property Type | Primary Location(s) | Intangible Lease Asset, Gross | Accumulated Amortization | Intangible Lease Asset, Net of Amortization | |||||||||||
October 2019 | Office | Jeffersonville, IN | $ | 14,509 | $ | (756 | ) | $ | 13,753 | |||||||
$ | 14,509 | $ | (756 | ) | $ | 13,753 | ||||||||||
The following table summarizes the Company's intangible lease asset recognized in the consolidated balance sheets as of December 31, 2019 (dollars in thousands):
December 31, 2019 | ||||||||||||||||
Acquisition Date | Property Type | Primary Location(s) | Intangible Lease Asset, Gross | Accumulated Amortization | Intangible Lease Asset, Net of Amortization | |||||||||||
October 2019 | Office | Jeffersonville, IN | $ | 14,509 | $ | (131 | ) | $ | 14,377 | |||||||
$ | 14,509 | $ | (131 | ) | $ | 14,377 | ||||||||||
Rental Income
On October 15, 2019, the Company purchased an office building that was subject to an existing triple net lease. The minimum rental amount due under the lease is subject to annual increases of 1.5%. The initial term of the lease expires in 2037 and contains renewal options for four consecutive five-year terms. The remaining lease term is 16.60 years. Rental income for this operating lease for the three and nine months ended September 30, 2020 totaled $0.7 million and $2.1 million, respectively. There had been no rental income for this operating lease for the three and nine months ended September 30, 2019.
29
BENEFIT STREET PARTNERS REALTY TRUST, INC.
NOTES TO CONSOLIDATED FINANCIAL STATEMENTS
September 30, 2020
(Unaudited)
The following table summarizes the Company's schedule of future minimum rents to be received under the lease (dollars in thousands):
Minimum Rents | September 30, 2020 | |||
2020 (October - December) | $ | 636 | ||
2021 | 2,568 | |||
2022 | 2,607 | |||
2023 | 2,646 | |||
2024 | 2,686 | |||
2025 and beyond | 36,894 | |||
Total minimum rent | $ | 48,037 | ||
Amortization Expense
Intangible lease assets are amortized using the straight-line method over the contractual life of the lease, of a period up to 20 years. The weighted average life of intangible assets as of September 30, 2020 is approximately 16.60 years. Amortization expense for the three and nine months ended September 30, 2020 totaled $0.2 million and $0.6 million, respectively. There had been no amortization expense for the three and nine months ended September 30, 2019.
The following table summarizes the Company's expected amortization for intangible assets over the next five years, assuming no further acquisitions or dispositions (dollars in thousands):
Amortization Expense | September 30, 2020 | |||
2020 (October - December) | $ | (206 | ) | |
2021 | (825 | ) | ||
2022 | (825 | ) | ||
2023 | (825 | ) | ||
2024 | (825 | ) | ||
30
BENEFIT STREET PARTNERS REALTY TRUST, INC.
NOTES TO CONSOLIDATED FINANCIAL STATEMENTS
September 30, 2020
(Unaudited)
Note 7 - Debt
Repurchase Agreements - Commercial Mortgage Loans
The Company has entered into repurchase facilities with JPMorgan Chase Bank, National Association (the "JPM Repo Facility"), U.S Bank National Association (the "USB Repo Facility"), Barclays Bank PLC (the "Barclays Revolver Facility" and the "Barclays Repo Facility"), Wells Fargo Bank, National Association (the "WF Repo Facility"), and Credit Suisse AG (the "CS Repo Facility," and together with the JPM Repo Facility, the USB Repo Facility, the WF Repo Facility, the Barclays Revolver Facility and the Barclays Repo Facility, the "Repo Facilities").
The Repo Facilities are financing sources through which the Company may pledge one or more mortgage loans to the financing entity in exchange for funds typically at an advance rate of between 65% to 80% of the principal amount of the mortgage loan being pledged.
The details of the Company's Repo Facilities at September 30, 2020 and December 31, 2019 are as follows (dollars in thousands):
________________________
As of September 30, 2020 | |||||||||||||||||
Repurchase Facility | Committed Financing | Amount Outstanding | Interest Expense (1) | Ending Weighted Average Interest Rate | Maturity | ||||||||||||
JPM Repo Facility (2) | $ | 300,000 | $ | 129,697 | $ | 3,722 | 2.52 | % | 1/30/2021 | ||||||||
USB Repo Facility (3) | 100,000 | — | 374 | N/A | 6/15/2021 | ||||||||||||
CS Repo Facility (4) | 200,000 | 34,546 | 2,602 | 3.19 | % | 8/19/2021 | |||||||||||
WF Repo Facility (5) | 175,000 | — | 801 | N/A | 11/21/2020 | ||||||||||||
Barclays Revolver Facility (6) | 100,000 | 20,000 | 257 | 5.00 | % | 9/20/2021 | |||||||||||
Barclays Repo Facility (7) | 300,000 | — | 847 | N/A | 3/15/2022 | ||||||||||||
Total | $ | 1,175,000 | $ | 184,243 | $ | 8,603 | |||||||||||
(1) For the nine months ended September 30, 2020. Includes amortization of deferred financing costs.
(2) On September 3, 2019, the committed financing amount was downsized from $520.0 million to $300.0 million and on October 6, 2020 the Company amended the maturity to October 6, 2022.
(3) On June 9, 2020, the Company exercised the extension option upon the satisfaction of certain conditions, and extended the term maturity to June 15, 2021.
(4) On August 28, 2020, the Company exercised the extension option upon the satisfaction of certain conditions, and extended the term maturity to August 19, 2021.
(5) Includes three one-year extensions at the Company’s option, which may be exercised upon the satisfaction of certain conditions.
(6) On September 13, 2019, the Company exercised the extension option, and extended the term maturity to September 20, 2021. There is one more one-year extension option available at the Company's discretion.
(7) Includes two one-year extensions at the Company's option.
31
BENEFIT STREET PARTNERS REALTY TRUST, INC.
NOTES TO CONSOLIDATED FINANCIAL STATEMENTS
September 30, 2020
(Unaudited)
As of December 31, 2019 | |||||||||||||||||
Repurchase Facility | Committed Financing | Amount Outstanding | Interest Expense (1) | Ending Weighted Average Interest Rate | Maturity | ||||||||||||
JPM Repo Facility (2) | $ | 300,000 | $ | 107,526 | $ | 6,862 | 4.51 | % | 1/30/2021 | ||||||||
USB Repo Facility (3) | 100,000 | — | 622 | N/A | 6/15/2020 | ||||||||||||
CS Repo Facility (4) | 300,000 | 87,375 | 5,563 | 4.84 | % | 3/27/2020 | |||||||||||
WF Repo Facility (5) | 175,000 | 24,942 | 1,333 | 3.65 | % | 11/21/2020 | |||||||||||
Barclays Revolver Facility (6) | 100,000 | — | 976 | N/A | 9/20/2021 | ||||||||||||
Barclays Repo Facility (7) | 300,000 | 32,700 | 1,260 | 3.80 | % | 3/15/2022 | |||||||||||
Total | $ | 1,275,000 | $ | 252,543 | $ | 16,616 | |||||||||||
(1) For the twelve months ended December 31, 2019. Includes amortization of deferred financing costs.
(2) On September 3, 2019, the committed financing amount was downsized from $520.0 million to $300.0 million and the maturity date was amended to January 30, 2021.
(3) Includes two one-year extensions at the option of an indirect wholly-owned subsidiary of the Company, which may be exercised upon the satisfaction of certain conditions.
(4) On March 26, 2019, the Company exercised the extension option upon the satisfaction of certain conditions, and extended the term maturity to March 27, 2020.
(5) Includes three one-year extensions at the Company’s option, which may be exercised upon the satisfaction of certain conditions.
(6) On September 13, 2019, the Company exercised the extension option, and extended the term maturity to September 20, 2021. There is one more one-year extension option available at the Company's discretion.
(7) Includes two one-year extensions at the Company's option.
The Company expects to use the advances from the Repo Facilities to finance the acquisition or origination of eligible loans, including first mortgage loans, subordinated mortgage loans, mezzanine loans and participation interests therein.
The Repo Facilities generally provide that in the event of a decrease in the value of the Company's collateral, the lenders can demand additional collateral. As of September 30, 2020 and December 31, 2019, the Company is in compliance with all debt covenants.
Other financing and loan participation - Commercial Mortgage Loans
On March 23, 2020, the Company transferred $15.2 million of its interest in a term loan to Sterling National Bank ("SNB") via a participation agreement. The Company incurred $0.1 million and $0.3 million of interest expense on SNB for the three and nine months ended September 30, 2020. As of September 30, 2020 there was an outstanding balance of $23.0 million.
Mortgage Note Payable
On October 15, 2019, the Company obtained a commercial mortgage loan for $29.2 million related to the real estate owned portfolio. As of September 30, 2020 the loan accrued interest at an annual rate of 3.85%. The Company incurred $0.3 million and $0.9 million of interest expense for the three and nine months ended September 30, 2020. Additionally, on January 6, 2020, the Company obtained a commercial mortgage loan for $11.0 million related to the real estate owned portfolio. As of September 30, 2020 the loan accrued interest at an annual rate of 9.00%. The Company incurred $0.3 million and $0.7 million of interest expense for the three and nine months ended September 30, 2020.
Unsecured Debt
On March 26, 2020, the Company and certain of its subsidiaries entered into a material amendment to an existing lending agreement with Security Benefit Life Insurance Company ("SBL"), secured by a pledge of equity interests in certain of the Company’s subsidiaries, for a total commitment of $100.0 million with a maturity of February 10, 2023 and a rate of one-month LIBOR + 4.5%. The amendment revised the terms of the existing SBL lending agreement, entered into in February 2020, to permit the Company to borrow under the agreement. The Company incurred $0.1 million and $0.2 million of interest expense on the lending agreement with SBL for the three and nine months ended September 30, 2020. As of September 30, 2020, there was no outstanding balance under the lending agreement.
32
BENEFIT STREET PARTNERS REALTY TRUST, INC.
NOTES TO CONSOLIDATED FINANCIAL STATEMENTS
September 30, 2020
(Unaudited)
Repurchase Agreements - Real Estate Securities
The Company has entered into various Master Repurchase Agreements (the "MRAs") that allow the Company to sell real estate securities while providing a fixed repurchase price for the same real estate securities in the future. The repurchase contracts on each security under an MRA generally mature in 30-90 days and terms are adjusted for current market rates as necessary.
Below is a summary of the Company's MRAs as of September 30, 2020 and December 31, 2019 (dollars in thousands):
________________________
Weighted Average | ||||||||||||||||
Counterparty | Amount Outstanding | Accrued Interest | Collateral Pledged (1) | Interest Rate | Days to Maturity | |||||||||||
As of September 30, 2020 | ||||||||||||||||
JP Morgan Securities LLC | $ | 17,733 | $ | 1,511 | $ | 23,128 | 2.02 | % | 59 | |||||||
Wells Fargo Securities, LLC | — | 1,057 | — | N/A | N/A | |||||||||||
Goldman Sachs International | 35,275 | 278 | 50,359 | 2.66 | % | 15 | ||||||||||
Barclays Capital Inc. | 70,877 | 1,730 | 96,068 | 2.41 | % | 34 | ||||||||||
Credit Suisse AG | — | 905 | — | N/A | N/A | |||||||||||
Citigroup Global Markets, Inc. | 53,660 | 2,216 | 71,134 | 1.95 | % | 30 | ||||||||||
Total/Weighted Average | $ | 177,545 | $ | 7,697 | $ | 240,689 | 2.29 | % | 31 | |||||||
As of December 31, 2019 | ||||||||||||||||
JP Morgan Securities LLC | $ | 83,353 | $ | 124 | $ | 93,500 | 2.53 | % | 20 | |||||||
Wells Fargo Securities, LLC | 178,304 | 1,199 | 209,873 | 2.94 | % | 11 | ||||||||||
Barclays Capital Inc. | 40,720 | 221 | 47,475 | 2.81 | % | 23 | ||||||||||
Citigroup Global Markets, Inc. | 91,982 | 413 | 103,453 | 2.69 | % | 19 | ||||||||||
Total/Weighted Average | $ | 394,359 | $ | 1,957 | $ | 454,301 | 2.79 | % | 16 | |||||||
(1) Includes $70.9 million and $68.5 million of CLO notes, held by the Company, which are eliminated within the real estate securities, at fair value line in the consolidated balance sheets as of September 30, 2020 and December 31, 2019, respectively.
Collateralized Loan Obligations
On January 15, 2020, the Company called all of the outstanding notes issued by BSPRT 2017-FL2 Issuer, Ltd., a wholly owned indirect subsidiary of the Company. The outstanding principal of the notes on the date of the call was $21.0 million. The Company recognized all the remaining unamortized deferred financing costs of $4.5 million recorded within the Interest expense line of the consolidated statements of operations, which was a non-cash charge.
As of September 30, 2020 and December 31, 2019 the notes issued by BSPRT 2018-FL3 Issuer, Ltd. and BSPRT 2018-FL3 Co-Issuer, LLC, wholly owned indirect subsidiaries of the Company, are collateralized by interests in a pool of 34 and 41 mortgage assets having a principal balance of $501.2 million and $523.2 million, respectively (the "2018-FL3 Mortgage Assets"). The sale of the 2018-FL3 Mortgage Assets to BSPRT 2018-FL3 Issuer, Ltd. is governed by a Mortgage Asset Purchase Agreement dated as of April 5, 2018, between the Company and BSPRT 2018-FL3 Issuer, Ltd.
As of September 30, 2020 and December 31, 2019 the notes issued by BSPRT 2018-FL4 Issuer, Ltd. and BSPRT 2018-FL4 Co-Issuer, LLC, each wholly owned indirect subsidiaries of the Company, are collateralized by interests in a pool of 58 and 49 mortgage assets having a principal balance of $821.5 million and $867.9 million, respectively (the "2018-FL4 Mortgage Assets"). The sale of the 2018-FL4 Mortgage Assets to BSPRT 2018-FL4 Issuer is governed by a Mortgage Asset Purchase Agreement dated as of October12, 2018, between the Company and BSPRT 2018-FL4 Issuer.
As of September 30, 2020 and December 31, 2019, the notes issued by BSPRT 2019-FL5 Issuer, Ltd. and BSPRT 2019-FL5 Co-Issuer, LLC, each wholly owned indirect subsidiaries of the Company, are collateralized by interests in a pool of 52 and 48 mortgage assets having a principal balance of $744.3 million and $809.4 million respectively (the "2019-FL5 Mortgage Assets"). The sale of the 2019-FL5 Mortgage Assets to BSPRT 2019-FL5 Issuer is governed by a Mortgage Asset Purchase Agreement dated as of May 30, 2019, between the Company and BSPRT 2019-FL5 Issuer.
33
BENEFIT STREET PARTNERS REALTY TRUST, INC.
NOTES TO CONSOLIDATED FINANCIAL STATEMENTS
September 30, 2020
(Unaudited)
The Company, through its wholly-owned subsidiaries, holds the preferred equity tranches of the above CLOs of approximately $256.9 million and $305.4 million as of September 30, 2020 and December 31, 2019, respectively. The following table represents the terms of the notes issued by 2018-FL3 Issuer, 2018-FL4 Issuer and 2019-FL5 Issuer (the "CLOs), respectively, as of September 30, 2020 (dollars in thousands):
________________________
CLO Facility | Tranche | Par Value Issued | Par Value Outstanding (1) | Interest Rate | Maturity Date | |||||||||
2018-FL3 Issuer | Tranche A | $ | 286,700 | $ | 193,930 | 1M LIBOR + 105 | 10/15/2034 | |||||||
2018-FL3 Issuer | Tranche A-S | 77,775 | 77,775 | 1M LIBOR + 135 | 10/15/2034 | |||||||||
2018-FL3 Issuer | Tranche B | 41,175 | 41,175 | 1M LIBOR + 165 | 10/15/2034 | |||||||||
2018-FL3 Issuer | Tranche C | 39,650 | 39,650 | 1M LIBOR + 255 | 10/15/2034 | |||||||||
2018-FL3 Issuer | Tranche D | 42,700 | 42,700 | 1M LIBOR + 345 | 10/15/2034 | |||||||||
2018-FL4 Issuer | Tranche A | 416,827 | 416,827 | 1M LIBOR + 105 | 9/15/2035 | |||||||||
2018-FL4 Issuer | Tranche A-S | 73,813 | 73,813 | 1M LIBOR + 130 | 9/15/2035 | |||||||||
2018-FL4 Issuer | Tranche B | 56,446 | 56,446 | 1M LIBOR + 160 | 9/15/2035 | |||||||||
2018-FL4 Issuer | Tranche C | 68,385 | 68,385 | 1M LIBOR + 210 | 9/15/2035 | |||||||||
2018-FL4 Issuer | Tranche D | 57,531 | 57,531 | 1M LIBOR + 275 | 9/15/2035 | |||||||||
2019-FL5 Issuer | Tranche A | 407,025 | 407,025 | 1M LIBOR + 115 | 5/15/2029 | |||||||||
2019-FL5 Issuer | Tranche A-S | 76,950 | 76,950 | 1M LIBOR + 148 | 5/15/2029 | |||||||||
2019-FL5 Issuer | Tranche B | 50,000 | 50,000 | 1M LIBOR + 140 | 5/15/2029 | |||||||||
2019-FL5 Issuer | Tranche C | 61,374 | 61,372 | 1M LIBOR + 200 | 5/15/2029 | |||||||||
2019-FL5 Issuer | Tranche D | 48,600 | 5,000 | 1M LIBOR + 240 | 5/15/2029 | |||||||||
2019-FL5 Issuer | Tranche E | 20,250 | 3,000 | 1M LIBOR + 285 | 5/15/2029 | |||||||||
$ | 1,825,201 | $ | 1,671,579 | |||||||||||
(1) Excludes $267.1 million of CLO notes, held by the Company, which are eliminated within the collateralized loan obligation line of the consolidated balance sheets as of September 30, 2020.
34
BENEFIT STREET PARTNERS REALTY TRUST, INC.
NOTES TO CONSOLIDATED FINANCIAL STATEMENTS
September 30, 2020
(Unaudited)
The following table represents the terms of the notes issued by 2017-FL2 Issuer, 2018-FL3 Issuer, 2018-FL4 Issuer and 2019-FL5 Issuer, as of December 31, 2019 (dollars in thousands):
________________________
CLO Facility | Tranche | Par Value Issued | Par Value Outstanding (1) | Interest Rate | Maturity Date | |||||||||
2017-FL2 Issuer | Tranche A | $ | 237,970 | $ | — | 1M LIBOR + 82 | 10/15/2034 | |||||||
2017-FL2 Issuer | Tranche A-S | 36,357 | — | 1M LIBOR + 110 | 10/15/2034 | |||||||||
2017-FL2 Issuer | Tranche B | 26,441 | — | 1M LIBOR + 140 | 10/15/2034 | |||||||||
2017-FL2 Issuer | Tranche C | 25,339 | — | 1M LIBOR + 215 | 10/15/2034 | |||||||||
2017-FL2 Issuer | Tranche D | 35,255 | 21,444 | 1M LIBOR + 345 | 10/15/2034 | |||||||||
2018-FL3 Issuer | Tranche A | 286,700 | 286,700 | 1M LIBOR + 105 | 10/15/2034 | |||||||||
2018-FL3 Issuer | Tranche A-S | 77,775 | 77,775 | 1M LIBOR + 135 | 10/15/2034 | |||||||||
2018-FL3 Issuer | Tranche B | 41,175 | 41,175 | 1M LIBOR + 165 | 10/15/2034 | |||||||||
2018-FL3 Issuer | Tranche C | 39,650 | 39,650 | 1M LIBOR + 255 | 10/15/2034 | |||||||||
2018-FL3 Issuer | Tranche D | 42,700 | 42,700 | 1M LIBOR + 345 | 10/15/2034 | |||||||||
2018-FL4 Issuer | Tranche A | 416,827 | 416,827 | 1M LIBOR + 105 | 9/15/2035 | |||||||||
2018-FL4 Issuer | Tranche A-S | 73,813 | 73,813 | 1M LIBOR + 130 | 9/15/2035 | |||||||||
2018-FL4 Issuer | Tranche B | 56,446 | 56,446 | 1M LIBOR + 160 | 9/15/2035 | |||||||||
2018-FL4 Issuer | Tranche C | 68,385 | 68,385 | 1M LIBOR + 210 | 9/15/2035 | |||||||||
2018-FL4 Issuer | Tranche D | 57,531 | 57,531 | 1M LIBOR + 275 | 9/15/2035 | |||||||||
2019-FL5 Issuer | Tranche A | 407,025 | 407,025 | 1M LIBOR + 115 | 5/15/2029 | |||||||||
2019-FL5 Issuer | Tranche A-S | 76,950 | 76,950 | 1M LIBOR + 148 | 5/15/2029 | |||||||||
2019-FL5 Issuer | Tranche B | 50,000 | 50,000 | 1M LIBOR + 140 | 5/15/2029 | |||||||||
2019-FL5 Issuer | Tranche C | 61,374 | 61,374 | 1M LIBOR + 200 | 5/15/2029 | |||||||||
2019-FL5 Issuer | Tranche D | 48,600 | 24,300 | 1M LIBOR + 240 | 5/15/2029 | |||||||||
2019-FL5 Issuer | Tranche E | 20,250 | 20,250 | 1M LIBOR + 285 | 5/15/2029 | |||||||||
$ | 2,186,563 | $ | 1,822,345 | |||||||||||
(1) Excludes $261.4 million of CLO notes, held by the Company, which are eliminated within the collateralized loan obligation line of the consolidated balance sheets as of December 31, 2019.
35
BENEFIT STREET PARTNERS REALTY TRUST, INC.
NOTES TO CONSOLIDATED FINANCIAL STATEMENTS
September 30, 2020
(Unaudited)
The below table reflects the total assets and liabilities of the Company's outstanding CLOs. The CLOs are considered VIEs and are consolidated into the Company's consolidated financial statements as of September 30, 2020 and December 31, 2019 as the Company is the primary beneficiary of the VIE. The Company is the primary beneficiary of the CLOs because (i) the Company has the power to direct the activities that most significantly affect the VIE’s economic performance and (ii) the right to receive benefits from the VIEs or the obligation to absorb losses of the VIEs that could be significant to the VIE.
________________________
Assets (dollars in thousands) | September 30, 2020 | December 31, 2019 | ||||||
Cash (1) | $ | 134,423 | $ | 89,946 | ||||
Commercial mortgage loans, held for investment, net (2) | 2,029,427 | 2,294,663 | ||||||
Accrued interest receivable | 4,723 | 6,254 | ||||||
Total Assets | $ | 2,168,573 | $ | 2,390,863 | ||||
Liabilities | ||||||||
Notes payable (3)(4) | $ | 1,924,677 | $ | 2,064,601 | ||||
Accrued interest payable | 1,190 | 2,576 | ||||||
Total Liabilities | $ | 1,925,867 | $ | 2,067,177 | ||||
(1) Includes $134.0 million and $89.3 million of cash held by the servicer related to CLO loan payoffs as of September 30, 2020 and December 31, 2019, respectively.
(2) The balance is presented net of allowance for credit losses of $16.7 million and $0.8 million as of September 30, 2020 and December 31, 2019, respectively.
(3) Includes $267.1 million and $261.4 million of CLO notes, held by the Company, which are eliminated within the collateralized loan obligation line of the consolidated balance sheets as of September 30, 2020 and December 31, 2019, respectively.
(4) The balance is presented net of deferred financing cost and discount of $14.0 million and $19.2 million as of September 30, 2020 and December 31, 2019, respectively.
36
BENEFIT STREET PARTNERS REALTY TRUST, INC.
NOTES TO CONSOLIDATED FINANCIAL STATEMENTS
September 30, 2020
(Unaudited)
Note 8 - Earnings Per Share
The Company uses the two-class method in calculating basic and diluted earnings per share. Net income/(loss) is allocated between our common stock and other participating securities based on their participation rights. Diluted net income per share has been computed using the weighted average number of shares of common stock outstanding and other dilutive securities. The following table presents a reconciliation of the numerators and denominators of the basic and diluted earnings per share computations and the calculation of basic and diluted earnings per share for the three and nine months ended September 30, 2020 and September 30, 2019 (in thousands, except share and per share data):
Three Months Ended September 30, | Nine Months Ended September 30, | ||||||||||||||
Numerator | 2020 | 2019 | 2020 | 2019 | |||||||||||
Net income | $ | 21,497 | $ | 25,913 | $ | 21,911 | $ | 60,329 | |||||||
Less: Preferred stock dividends | 3,475 | 4,147 | 11,445 | 10,957 | |||||||||||
Less: Undistributed earnings allocated to preferred stock | 1,283 | 1,306 | — | 963 | |||||||||||
Net income/(loss) attributable to common stockholders (for basic and diluted earnings per share) | 16,739 | 20,460 | 10,466 | 48,409 | |||||||||||
Denominator | |||||||||||||||
Weighted-average common shares outstanding for basic earnings per share | 44,405,196 | 42,795,038 | 44,348,282 | 41,287,548 | |||||||||||
Effect of dilutive shares: | |||||||||||||||
Unvested restricted shares | 15,888 | 12,735 | 13,457 | 12,836 | |||||||||||
Weighted-average common shares outstanding for diluted earnings per share | 44,421,084 | 42,807,773 | 44,361,739 | 41,300,384 | |||||||||||
Basic earnings per share | $ | 0.38 | $ | 0.48 | $ | 0.24 | $ | 1.17 | |||||||
Diluted earnings per share | $ | 0.38 | $ | 0.48 | $ | 0.24 | $ | 1.17 | |||||||
37
BENEFIT STREET PARTNERS REALTY TRUST, INC.
NOTES TO CONSOLIDATED FINANCIAL STATEMENTS
September 30, 2020
(Unaudited)
Note 9 - Stock Transactions
As of September 30, 2020 and December 31, 2019, the Company had 44,353,727 and 43,916,815 shares of common stock outstanding, respectively, including shares issued pursuant to the Company's distribution reinvestment plan (the "DRIP"), share repurchases and unvested restricted shares.
As of September 30, 2020 and December 31, 2019, the Company had 40,515 and 40,500 shares of Series A Preferred Stock outstanding, respectively and 1,400 shares of Series C Preferred Stock outstanding.
The following tables present the activity in the Company's Series A Preferred Stock for the nine months ended September 30, 2020 and September 30, 2019, respectively (dollars in thousands, except share amounts):
Shares | Amount | ||||||
Balance, December 31, 2019 | 40,500 | $ | 202,144 | ||||
Issuance of Preferred Stock | 14 | 70 | |||||
Dividends paid in Preferred Stock | 1 | 4 | |||||
Offering Costs | — | (9 | ) | ||||
Amortization of offering costs | — | 71 | |||||
Ending Balance, September 30, 2020 | 40,515 | $ | 202,280 | ||||
Shares | Amount | ||||||
Balance, December 31, 2018 | 29,249 | $ | 145,786 | ||||
Issuance of Preferred Stock | 9,249 | 46,245 | |||||
Dividends paid in Preferred Stock | 3 | 18 | |||||
Amortization of offering costs | — | 76 | |||||
Ending Balance, September 30, 2019 | 38,501 | $ | 192,125 | ||||
The following tables present the activity in the Company's Series C Preferred Stock for the period ended September 30, 2020. For the period ended September 30, 2019, the Company's Series C Preferred Stock did not have any activity (dollars in thousands, except share amounts):
Shares | Amount | ||||||
Balance, December 31, 2019 | 1,400 | $ | 6,966 | ||||
Issuance of Preferred Stock, net of offering cost | — | — | |||||
Dividends paid in Preferred Stock | — | — | |||||
Offering Costs | (11 | ) | |||||
Amortization of offering costs | — | 6 | |||||
Ending Balance, September 30, 2020 | 1,400 | $ | 6,961 | ||||
Distributions
In order to maintain its election to qualify as a REIT, the Company must currently distribute, at a minimum, an amount equal to 90% of its taxable income, without regard to the deduction for distributions paid and excluding net capital gains. The Company must distribute 100% of its taxable income (including net capital gains) to avoid paying corporate U.S. federal income taxes. Distribution payments are dependent on the availability of funds. The Company's board of directors may reduce the amount of distributions paid or suspend distribution payments at any time, and therefore, distributions payments are not assured.
In April 2020, the Company’s board of directors unanimously approved a transition in the timing of the dividend payments to holders of the Company’s common stock from a monthly payment with daily accruals to a quarterly payment and accrual basis. Similarly, the Company began paying accrued and unpaid dividends on Preferred Stock on a quarterly basis.
38
BENEFIT STREET PARTNERS REALTY TRUST, INC.
NOTES TO CONSOLIDATED FINANCIAL STATEMENTS
September 30, 2020
(Unaudited)
In September 2020 the Company’s board of directors declared the following third quarter 2020 dividends: (i) a quarterly cash dividend of $0.275 per common share (equivalent to $1.10 per annum) which was paid in October 2020 to holders of record on September 30, 2020, and (ii) a quarterly cash dividend per share of Preferred Stock equivalent to the amount of distributions that would have been paid upon a conversion of such share of Preferred Stock into common stock, which was paid in October 2020 to holders of record on September 30, 2020.
The Company distributed $33.3 million of common stock dividends during the nine months ended September 30, 2020, comprised of $27.1 million in cash and $6.2 million in shares of common stock issued under the DRIP. The DRIP was temporarily suspended for the March 2020 dividend, but was reactivated for the second quarter 2020 dividend. The Company distributed $44.1 million of common stock dividends during the nine months ended September 30, 2019, comprised of $33.7 million in cash and $10.4 million in shares of common stock issued under the DRIP.
As of September 30, 2020 and December 31, 2019, the Company had declared but unpaid common stock distributions of $12.2 million and $5.4 million, respectively. Additionally, as of September 30, 2020 and December 31, 2019, the Company had declared but unpaid Series A Preferred Stock distributions of $3.3 million and $1.5 million, respectively and $0.1 million and $0.1 million of Series C Preferred stock, respectively. These amounts are included in Distributions payable on the Company’s consolidated balance sheets.
Share Repurchase Program
The Company's board of directors unanimously approved an amended and restated share repurchase program (the “SRP”), which became effective on February 28, 2016. The SRP enables stockholders to sell their shares to the Company. Subject to certain conditions, stockholders that purchased shares of the Company's common stock or received their shares from us (directly or indirectly) through one or more non-cash transactions and have held their shares for a period of at least one year may request that the Company repurchase their shares of common stock so long as the repurchase otherwise complies with the provisions of Maryland law. Repurchase requests made following the death or qualifying disability of a stockholder will not be subject to any minimum holding period.
The repurchase price per share for SRP repurchases is equal to the lesser of (i) the Company’s most recent estimated per-share net asset value ("NAV"), as approved by the Company’s board of directors from time to time, and (ii) the Company’s book value per share, computed in accordance with GAAP, multiplied by a percentage equal to (i) 92.5%, if the person seeking repurchase has held his or her shares for a period greater than one year and less than two years; (ii) 95%, if the person seeking repurchase has held his or her shares for a period greater than two years and less than three years; (iii) 97.5%, if the person seeking repurchase has held his or her shares for a period greater than three years and less than four years; or (iv) 100%, if the person seeking repurchase has held his or her shares for a period greater than four years or in the case of requests for death or disability. The Company’s estimated per-share NAV as of September 30, 2020, as determined by the board of directors, is $17.88. The Company’s GAAP book value per share as of September 30, 2020 is $17.53.
Repurchase requests related to death or a qualifying disability must satisfy certain conditions, each of which are assessed by and at the sole discretion of the Company, including the following conditions. In the case of death, the shareholder must be a natural person (or a revocable grantor trust) and the Company must receive a written notice from the estate of the shareholder, the recipient of the shares through bequest or inheritance, or the trustee in the case of a revocable grantor trust. In the case of a “qualifying disability”, the shareholder must be a natural person (or a revocable grantor trust) and the Company must receive a written notice from the shareholder, or the trustee in the case of a revocable grantor trust, that the condition was not pre-existing on the date the shares were acquired. In order for a disability to be considered a “qualifying disability”, the shareholder must receive and provide evidence (the shareholder application and the notice of final determination) of disability based upon a physical or mental condition or impairment made by a government agency responsible for reviewing and determining disability retirement benefits (e.g. the Social Security Administration).
39
BENEFIT STREET PARTNERS REALTY TRUST, INC.
NOTES TO CONSOLIDATED FINANCIAL STATEMENTS
September 30, 2020
(Unaudited)
Repurchases pursuant to the SRP, when requested, generally will be made semiannually (each six-month period ending June 30 or December 31, a “fiscal semester”). Repurchases for any fiscal semester will be limited to a maximum of 2.5% of the weighted average number of shares of common stock outstanding during the previous fiscal year, with a maximum for any fiscal year of 5.0% of the weighted average number of shares of common stock outstanding during the previous fiscal year. Funding for repurchases pursuant to the SRP for any given fiscal semester will be limited to proceeds received during that same fiscal semester through the issuance of common stock pursuant to any DRIP in effect from time to time, provided that the Company's board of directors has the power, in its sole discretion, to determine the amount of shares repurchased during any fiscal semester as well as the amount of funds to be used for that purpose. Any repurchase requests received during such fiscal semester will be paid at the price, computed as described above on the last day of such fiscal semester. Due to these limitations, the Company cannot guarantee that the Company will be able to accommodate all repurchase requests made during any fiscal semester or fiscal year. However, a stockholder may withdraw its request at any time or ask that the Company honors the request when funds are available. Pending repurchase requests will be honored on a pro rata basis. The Company will generally pay repurchase proceeds, less any applicable tax or other withholding required by law, by the 31st day following the end of the fiscal semester during which the repurchase request was made.
The following table reflects the number of shares repurchased under the SRP cumulatively through September 30, 2020:
________________________
Number of Requests | Number of Shares Repurchased | Average Price per Share | |||||||
Cumulative as of December 31, 2019 | 5,878 | 3,542,267 | $ | 20.23 | |||||
January 1 - January 31, 2020 (1) | 1,170 | 373,135 | 18.56 | ||||||
February 1 - February 28, 2020 | — | — | N/A | ||||||
March 1 - March 31, 2020 | — | — | N/A | ||||||
April 1 - April 30, 2020 (1) | — | — | N/A | ||||||
May 1 - May 31, 2020 | — | — | N/A | ||||||
June 1 - June 30, 2020 | — | — | N/A | ||||||
July 1 - July 31, 2020 (2) | 1,046 | 206,332 | 16.25 | ||||||
August 1 - August 31, 2020 | — | — | N/A | ||||||
September 1 - September 30, 2020 (2) | — | — | N/A | ||||||
Cumulative as of September 30, 2020 | 8,094 | 4,121,734 | $ | 19.88 | |||||
(1) Reflects shares repurchased pursuant to repurchase requests submitted for the second semester of 2019, including 11,306 shares which for administrative reasons were processed in April 2020. Pursuant to the terms of the SRP, the Company is only authorized to repurchase up to the amount of proceeds reinvested through our DRIP during the applicable semester. As a result, redemption requests in the amount of 1,986,803 shares were not fulfilled for the second semester of 2019.
(2) Reflects shares repurchased pursuant to repurchase requests submitted for the first semester of 2020, including 771 shares which for administrative reasons were processed in September 2020. Pursuant to the terms of the SRP, the Company is only authorized to repurchase up to the amount of proceeds reinvested through our DRIP during the applicable semester. As a result, redemption requests in the amount of 1,677,268 shares were not fulfilled for the first semester of 2020.
40
BENEFIT STREET PARTNERS REALTY TRUST, INC.
NOTES TO CONSOLIDATED FINANCIAL STATEMENTS
September 30, 2020
(Unaudited)
Note 10 - Commitments and Contingencies
Unfunded Commitments Under Commercial Mortgage Loans
As of September 30, 2020 and December 31, 2019, the Company had the below unfunded commitments to the Company's borrowers (dollars in thousands):
Funding Expiration | September 30, 2020 | December 31, 2019 | |||||
2020 | $ | 7,731 | $ | 90,519 | |||
2021 | 71,963 | 100,861 | |||||
2022 | 105,632 | 56,863 | |||||
2023 | 67,790 | 8,637 | |||||
2024 and beyond | 5,450 | 5,450 | |||||
$ | 258,566 | $ | 262,330 | ||||
The borrowers are required to meet or maintain certain metrics in order to qualify for the unfunded commitment amounts.
Litigation and Regulatory Matters
The Company is not presently involved in any material litigation arising outside the ordinary course of business. However, the Company is involved in routine litigation arising in the ordinary course of business, none of which the Company believes, individually or in the aggregate, will have a material impact on the Company’s financial condition, operating results or cash flows.
Note 11 - Related Party Transactions and Arrangements
Advisory Agreement Fees and Reimbursements
Pursuant to the Advisory Agreement, the Company is required to make the following payments and reimbursements to the Advisor:
• | The Company reimburses the Advisor’s costs of providing services pursuant to the Advisory Agreement, except the salaries and benefits paid by the Advisor to the Company’s executive officers. |
• | The Company pays the Advisor, or its affiliates, a monthly asset management fee equal to one-twelfth of 1.5% of stockholder’s equity as calculated pursuant to the Advisory Agreement. |
• | The Company will pay the Advisor an annual subordinated performance fee calculated on the basis of total return to stockholders, payable monthly in arrears, such that for any year in which total return on stockholders’ capital exceeds 6.0% per annum, our Advisor will be entitled to 15.0% of the excess total return; provided that in no event will the annual subordinated performance fee payable to our Advisor exceed 10.0% of the aggregate total return for such year. |
• | The Company reimburses the Advisor for insourced expenses incurred by the Advisor on the Company‘s behalf related to selecting, evaluating, originating and acquiring investments in an amount up to 0.5% of the principal amount funded by the Company to originate or acquire commercial mortgage loans and up to 0.5% of the anticipated net equity funded by the Company to acquire real estate securities investments. |
41
BENEFIT STREET PARTNERS REALTY TRUST, INC.
NOTES TO CONSOLIDATED FINANCIAL STATEMENTS
September 30, 2020
(Unaudited)
The table below shows the costs incurred due to arrangements with our Advisor and its affiliates during the three and nine months ended September 30, 2020 and September 30, 2019 and the associated payable as of September 30, 2020 and December 31, 2019 (dollars in thousands):
________________________
Three Months Ended September 30, | Nine Months Ended September 30, | Payable as of | |||||||||||||||||||||
2020 | 2019 | 2020 | 2019 | September 30, 2020 | December 31, 2019 | ||||||||||||||||||
Acquisition expenses (1) | $ | 166 | $ | 180 | $ | 483 | $ | 698 | $ | 68 | $ | 225 | |||||||||||
Administrative services expenses | 3,128 | 4,564 | 10,180 | 12,083 | 3,128 | 1,238 | |||||||||||||||||
Asset management and subordinated performance fee | 3,749 | 4,468 | 11,399 | 11,917 | 5,242 | 3,326 | |||||||||||||||||
Other related party expenses (2) | 14 | 590 | 685 | 1,225 | — | — | |||||||||||||||||
Total related party fees and reimbursements | $ | 7,057 | $ | 9,802 | $ | 22,747 | $ | 25,923 | $ | 8,438 | $ | 4,789 | |||||||||||
(1) Total acquisition expenses paid during the three and nine months ended September 30, 2020 were $2.2 million and $5.0 million respectively, of which $2.0 million and $4.5 million were capitalized within the commercial mortgage loans, held for investment and real estate securities, available for sale, at fair value lines of the consolidated balance sheets. For three and nine months ended September 30, 2019 total acquisition expenses paid were $1.6 million and $5.4 million respectively, of which $1.4 million and $4.7 million were capitalized within the commercial mortgage loans, held for investment and real estate securities, available for sale, at fair value lines of the consolidated balance sheets.
(2) These are reimbursable costs incurred related to the increase in loan origination activities. These amounts are included in Other expenses in the Company's consolidated statements of operations.
The payables as of September 30, 2020 and December 31, 2019 in the table above are included in Due to affiliates on the Company's consolidated balance sheets.
Other Transactions
On February 22, 2018, the Company purchased commercial mortgage loans, held-for-sale from an entity that is an affiliate of our Advisor, for an aggregate purchase price of $27.8 million. The purchase of the commercial mortgage loans and the $27.8 million purchase price were approved by the Company’s board of directors. On April 18, 2018, the Company sold $23.3 million of these commercial mortgage loans into a CMBS securitization. The remaining $4.5 million of these commercial mortgage loans, recorded as held for investment, were fully paid down during the nine months ended September 30, 2020.
On March 26, 2020, the Company and certain of its subsidiaries entered into a material amendment to an existing lending agreement with SBL, an entity that also holds 14,950 of the Company’s outstanding shares of Series A Preferred Stock, secured by a pledge of equity interests in certain of the Company’s subsidiaries, for a total commitment of $100.0 million with a maturity of February 10, 2023 and a rate of one-month LIBOR + 4.5%. The amendment revised the terms of the existing SBL lending agreement, entered into in February 2020, to permit the Company to borrow under the agreement. The Company incurred $0.1 million and $0.2 million of interest expense on the lending agreement with SBL for the three and nine months ended September 30, 2020, respectively. As of September 30, 2020 there was no outstanding balance under the lending agreement.
42
BENEFIT STREET PARTNERS REALTY TRUST, INC.
NOTES TO CONSOLIDATED FINANCIAL STATEMENTS
September 30, 2020
(Unaudited)
Note 12 - Fair Value of Financial Instruments
GAAP establishes a hierarchy of valuation techniques based on the observability of inputs used in measuring financial instruments at fair values. GAAP establishes market-based or observable inputs as the preferred source of values, followed by valuation models using management assumptions in the absence of market inputs. The three levels of the hierarchy are described below:
• | Level I - Inputs are unadjusted, quoted prices in active markets for identical assets or liabilities at the measurement date. |
• | Level II - Inputs (other than quoted prices included in Level I) are either directly or indirectly observable for the asset or liability through correlation with market data at the measurement date and for the duration of the instrument’s anticipated life. |
• | Level III - Unobservable inputs that reflect the entity's own assumptions about the assumptions that market participants would use in the pricing of the asset or liability and are consequently not based on market activity, but rather through particular valuation techniques. |
The determination of where an asset or liability falls in the above hierarchy requires significant judgment and factors specific to the asset or liability. In instances where the determination of the fair value measurement is based on inputs from different levels of the fair value hierarchy, the level in the fair value hierarchy within which the entire fair value measurement falls is based on the lowest level input that is significant to the fair value measurement in its entirety. The Company evaluates its hierarchy disclosures each quarter and depending on various factors, it is possible that an asset or liability may be classified differently from quarter to quarter.
The Company has implemented valuation control processes to validate the fair value of the Company's financial instruments measured at fair value including those derived from pricing models. These control processes are designed to assure that the values used for financial reporting are based on observable inputs wherever possible. In the event that observable inputs are not available, the control processes are designed to assure that the valuation approach utilized is appropriate and consistently applied and the assumptions are reasonable.
Financial Instruments Measured at Fair Value on a Recurring Basis
CMBS, recorded in real estate securities, held-for-sale, measured at fair value on the consolidated balance sheets are valued utilizing both observable and unobservable market inputs. These factors include projected future cash flows, ratings, subordination levels, vintage, remaining lives, credit issues, and recent trades of similar real estate securities. Depending upon the significance of the fair value inputs used in determining these fair values, these real estate securities are classified in either Level II or Level III of the fair value hierarchy. As of September 30, 2020 and December 31, 2019, the Company obtained third party pricing for determining the fair value of each CMBS investment, resulting in a Level II classification.
Commercial mortgage loans held-for-sale, measured at fair value in the Company's TRS are initially recorded at transaction proceeds, which are considered to be the best initial estimate of fair value. The Company engaged the services of a third party independent valuation firm to determine fair value of certain investments held by the Company. Fair value is determined using a discounted cash flow model that primarily considers changes in interest rates and credit spreads, weighted average life and current performance of the underlying collateral. The Company classified the commercial mortgage loans held-for-sale, measured at fair value as Level III.
Other real estate investments, measured at fair value on the consolidated balance sheets are valued using unobservable inputs. The Company engaged the services of a third party independent valuation firm to determine fair value of certain investments, including preferred equity investments, held by the Company. Fair value is determined using a discounted cash flow model that primarily considers changes in interest rates and credit spreads, weighted average life and current performance of the underlying collateral. The Company classified the other real estate investments, measured at fair value as Level III.
The fair value for Treasury note futures is derived using market prices. Treasury note futures trade on the Chicago Mercantile Exchange (“CME”). The instruments are a variety of recently issued 10-year U.S. Treasury notes. The future contracts are liquid and are centrally cleared through the CME. Treasury note futures are generally categorized in Level I of the fair value hierarchy.
43
BENEFIT STREET PARTNERS REALTY TRUST, INC.
NOTES TO CONSOLIDATED FINANCIAL STATEMENTS
September 30, 2020
(Unaudited)
The fair value for credit default swaps and interest rate swaps contracts are derived using pricing models that are widely accepted by marketplace participants. Credit default swaps and interest rate swaps are traded in the OTC market. The pricing models take into account multiple inputs including specific contract terms, interest rate yield curves, interest rates, credit curves, recovery rates, and/or current credit spreads obtained from swap counterparties and other market participants. Most inputs into the models are not subjective as they are observable in the marketplace or set per the contract. Valuation is primarily determined by the difference between the contract spread and the current market spread. The contract spread (or rate) is generally fixed and the market spread is determined by the credit risk of the underlying debt or reference entity. If the underlying indices are liquid and the OTC market for the current spread is active, credit default swaps and interest rate swaps are categorized in Level II of the fair value hierarchy. If the underlying indices are illiquid and the OTC market for the current spread is not active, credit default swaps are categorized in Level III of the fair value hierarchy. The credit default swaps and interest rate swaps are generally categorized in Level II of the fair value hierarchy.
A review of the fair value hierarchy classification is conducted on a quarterly basis. Changes in the type of inputs may result in a reclassification for certain assets or liabilities. The Company's policy with respect to transfers between levels of the fair value hierarchy is to recognize transfers into and out of each level as of the beginning of the reporting period. There were no material transfers between levels within the fair value hierarchy for the period ended September 30, 2020 and December 31, 2019.
The following table presents the Company's financial instruments carried at fair value on a recurring basis in the consolidated balance sheets by its level in the fair value hierarchy as of September 30, 2020 and December 31, 2019 (dollars in thousands):
Total | Level I | Level II | Level III | ||||||||||||
September 30, 2020 | |||||||||||||||
Real estate securities, available-for-sale, measured at fair value | $ | 169,803 | $ | — | $ | 169,803 | $ | — | |||||||
Commercial mortgage loans, held-for-sale, measured at fair value | 99 | — | — | 99 | |||||||||||
Other real estate investments, measured at fair value | 2,518 | — | — | 2,518 | |||||||||||
Credit default swaps | — | — | — | — | |||||||||||
Total assets, at fair value | $ | 172,420 | $ | — | $ | 169,803 | $ | 2,617 | |||||||
Liabilities, at fair value | |||||||||||||||
Credit default swaps | $ | — | $ | — | $ | — | $ | — | |||||||
Total liabilities, at fair value | $ | — | $ | — | $ | — | $ | — | |||||||
December 31, 2019 | |||||||||||||||
Real estate securities, available-for-sale, measured at fair value | $ | 386,316 | $ | — | $ | 386,316 | $ | — | |||||||
Commercial mortgage loans, held-for-sale, measured at fair value | 112,562 | — | — | 112,562 | |||||||||||
Other real estate investments, measured at fair value | 2,557 | — | — | 2,557 | |||||||||||
Credit default swaps | 59 | — | 59 | — | |||||||||||
Interest rate swaps | 325 | — | 325 | — | |||||||||||
Treasury Note Futures | 735 | 735 | — | — | |||||||||||
Total assets, at fair value | $ | 502,554 | $ | 735 | $ | 386,700 | $ | 115,119 | |||||||
Liabilities, at fair value | |||||||||||||||
Credit Default Swaps | $ | 1,581 | $ | — | $ | 1,581 | $ | — | |||||||
Total liabilities, at fair value | $ | 1,581 | $ | — | $ | 1,581 | $ | — | |||||||
44
BENEFIT STREET PARTNERS REALTY TRUST, INC.
NOTES TO CONSOLIDATED FINANCIAL STATEMENTS
September 30, 2020
(Unaudited)
Both observable and unobservable inputs may be used to determine the fair value of positions that the Company has classified within the Level III category. As a result, the unrealized gains and losses for assets and liabilities within the Level III category may include changes in fair value that were attributable to both observable and unobservable inputs. The following table summarizes the valuation method and significant unobservable inputs used for the Company’s financial instruments that are categorized within Level III of the fair value hierarchy as of September 30, 2020 and December 31, 2019 (dollars in thousands):
________________________
Asset Category | Fair Value | Valuation Methodologies | Unobservable Inputs (1) | Weighted Average (2) | Range | ||||||
September 30, 2020 | |||||||||||
Commercial mortgage loans, held-for-sale, measured at fair value | $ | 99 | Discounted Cash Flow | Yield | 16.6% | 15.6% - 17.6% | |||||
Other real estate investments, measured at fair value | 2,518 | Discounted Cash Flow | Yield | 13.2% | 12.2% - 14.2% | ||||||
December 31, 2019 | |||||||||||
Commercial mortgage loans, held-for-sale, measured at fair value | $ | 112,562 | Discounted Cash Flow | Yield | 4.9% | 4.7% - 5.2% | |||||
Other real estate investments, measured at fair value | 2,557 | Discounted Cash Flow | Yield | 12.4% | 11.4% - 13.4% | ||||||
(1) In determining certain of these inputs, the Company evaluates a variety of factors including economic conditions, industry and market developments, market valuations of comparable companies and company specific developments including exit strategies and realization opportunities. The Company has determined that market participants would take these inputs into account when valuing the investments.
(2) Inputs were weighted based on the fair value of the investments included in the range.
Increases or decreases in any of the above unobservable inputs in isolation would result in a lower or higher fair value measurement for such assets.
45
BENEFIT STREET PARTNERS REALTY TRUST, INC.
NOTES TO CONSOLIDATED FINANCIAL STATEMENTS
September 30, 2020
(Unaudited)
The following table presents additional information about the Company’s financial instruments which are measured at fair value on a recurring basis as of September 30, 2020 and December 31, 2019 for which the Company has used Level III inputs to determine fair value (dollars in thousands):
September 30, 2020 | ||||||||
Commercial Mortgage Loans, held-for-sale, measured at fair value | Other Real Estate Investments, measured at fair value | |||||||
Beginning balance, January 1, 2020 | $ | 112,562 | $ | 2,557 | ||||
Transfers into Level III | — | — | ||||||
Total realized and unrealized gain/(loss) included in earnings: | ||||||||
Realized gain/(loss) on sale of commercial mortgage loan, held-for-sale | 11,106 | — | ||||||
Unrealized gain/(loss) on commercial mortgage loans, held-for-sale and other real estate investments | (76 | ) | (37 | ) | ||||
Net accretion | — | (2 | ) | |||||
Purchases (1) | 122,043 | — | ||||||
Sales / paydowns (1) | (221,911 | ) | — | |||||
Cash repayments/receipts | — | — | ||||||
Transfers out of Level III | (23,625 | ) | — | |||||
Ending Balance, September 30, 2020 | $ | 99 | $ | 2,518 | ||||
December 31, 2019 | ||||||||
Commercial Mortgage Loans, held-for-sale, measured at fair value | Other Real Estate Investments, measured at fair value | |||||||
Beginning balance, January 1, 2019 | $ | 76,863 | $ | — | ||||
Transfers into Level III | — | — | ||||||
Total realized and unrealized gain/(loss) included in earnings: | ||||||||
Realized gain/(loss) on sale of commercial mortgage loan, held-for-sale | 37,832 | — | ||||||
Unrealized gain/(loss) on commercial mortgage loans, held-for-sale and other real estate investments | 312 | 47 | ||||||
Net accretion | — | — | ||||||
Purchases | 1,015,677 | 2,510 | ||||||
Sales / paydowns | (1,008,050 | ) | — | |||||
Cash repayments/receipts | — | — | ||||||
Transfers out of Level III | (10,072 | ) | — | |||||
Ending Balance, December 31, 2019 | $ | 112,562 | $ | 2,557 | ||||
________________________
(1) Excluded from Purchases and Sales/paydowns are $679.1 million and $682.0 million, respectively, of loans that collateralize a CMBS investment required to be consolidated in connection with the Company's retention of the B tranche during the three months ended September 30, 2020. Upon disposition of the B tranche during the three months ended September 30, 2020, the Company recognized a gain of $2.8 million that is recorded in Realized gain/loss on sale of real estate securities on the consolidated statements of operations.
46
BENEFIT STREET PARTNERS REALTY TRUST, INC.
NOTES TO CONSOLIDATED FINANCIAL STATEMENTS
September 30, 2020
(Unaudited)
The fair value of cash and cash equivalents and restricted cash are measured using observable quoted market prices, or Level I inputs and their carrying value approximates their fair value. The fair value of borrowings under repurchase agreements approximate their carrying value on the consolidated balance sheets due to their short-term nature, and are measured using Level II inputs.
Financial Instruments Not Measured at Fair Value
The fair values of the Company's commercial mortgage loans, held-for-investment and collateralized loan obligations, which are not reported at fair value on the consolidated balance sheets are reported below as of September 30, 2020 and December 31, 2019 (dollars in thousands):
________________________
Level | Carrying Amount (1) | Fair Value | |||||||||
September 30, 2020 | |||||||||||
Commercial mortgage loans, held for investment | Asset | III | $ | 2,621,698 | $ | 2,614,562 | |||||
Collateralized loan obligations | Liability | III | 1,657,559 | 1,686,125 | |||||||
Mortgage note payable | Liability | III | 40,623 | 40,623 | |||||||
December 31, 2019 | |||||||||||
Commercial mortgage loans, held for investment | Asset | III | $ | 2,762,963 | $ | 2,784,650 | |||||
Collateralized loan obligations | Liability | III | 1,803,185 | 1,822,386 | |||||||
Mortgage note payable | Liability | III | 29,167 | 29,167 | |||||||
(1) The carrying value is gross of $22.8 million and $0.9 million of allowance for credit losses as of September 30, 2020 and December 31, 2019, respectively.
The fair value of the commercial mortgage loans, held for investment is estimated using a discounted cash flow analysis, based on the Advisor's experience with similar types of investments. The Company estimates the fair value of the collateralized loan obligations using external broker quotes. The fair value of the other financing and loan participation-commercial mortgage loans is generally estimated using a discounted cash flow analysis.
47
BENEFIT STREET PARTNERS REALTY TRUST, INC.
NOTES TO CONSOLIDATED FINANCIAL STATEMENTS
September 30, 2020
(Unaudited)
Note 13 - Derivative Instruments
The Company uses derivative instruments primarily to manage the fair value variability of fixed rate assets caused by interest rate fluctuations and overall portfolio market risk.
As of September 30, 2020, the net premiums received on derivative instrument assets were $0.7 million.
The following derivative instruments were outstanding as of September 30, 2020 and December 31, 2019 (dollars in thousands):
Fair Value | ||||||||||||
Contract type | Notional | Assets | Liabilities | |||||||||
September 30, 2020 | ||||||||||||
Credit default swaps | $ | — | $ | — | $ | — | ||||||
Interest rate swaps | 17,577 | — | — | |||||||||
Treasury note futures | — | — | — | |||||||||
Total | $ | 17,577 | $ | — | $ | — | ||||||
December 31, 2019 | ||||||||||||
Credit default swaps | $ | 94,300 | $ | 59 | $ | 1,581 | ||||||
Interest rate swaps | 42,546 | 325 | — | |||||||||
Treasury note futures | 74,000 | 735 | — | |||||||||
Total | $ | 210,846 | $ | 1,119 | $ | 1,581 | ||||||
The following table indicates the net realized and unrealized losses on derivatives, by primary underlying risk exposure, as included in loss on derivative instruments in the consolidated statements of operations for the three and nine months ended September 30, 2020 and September 30, 2019:
Three Months Ended September 30, 2020 | Nine Months Ended September 30, 2020 | |||||||||||||||
Contract type | Unrealized (Gain)/Loss | Realized (Gain)/Loss | Unrealized (Gain)/Loss | Realized (Gain)/Loss | ||||||||||||
Credit default swaps | $ | 101 | $ | 206 | $ | (433 | ) | $ | 269 | |||||||
Interest rate swaps | (4,411 | ) | 4,516 | 323 | 7,462 | |||||||||||
Treasury note futures | — | — | 735 | 5,284 | ||||||||||||
Options | — | — | — | 35 | ||||||||||||
Total | $ | (4,310 | ) | $ | 4,722 | $ | 625 | $ | 13,050 | |||||||
Three Months Ended September 30, 2019 | Nine Months Ended September 30, 2019 | |||||||||||||||
Contract type | Unrealized (Gain)/Loss | Realized (Gain)/Loss | Unrealized (Gain)/Loss | Realized (Gain)/Loss | ||||||||||||
Credit default swaps | $ | (172 | ) | $ | 159 | $ | 132 | $ | 1,537 | |||||||
Interest rate swaps | (1,608 | ) | 1,248 | (543 | ) | 1,477 | ||||||||||
Treasury note futures | (2,608 | ) | 3,669 | (907 | ) | 4,909 | ||||||||||
Options | — | 112 | — | 349 | ||||||||||||
Total | $ | (4,388 | ) | $ | 5,188 | $ | (1,318 | ) | $ | 8,272 | ||||||
48
BENEFIT STREET PARTNERS REALTY TRUST, INC.
NOTES TO CONSOLIDATED FINANCIAL STATEMENTS
September 30, 2020
(Unaudited)
Note 14 - Offsetting Assets and Liabilities
The Company's consolidated balance sheets used a gross presentation of repurchase agreements and collateral pledged. The table below provides a gross presentation, the effects of offsetting and a net presentation of the Company's derivative instruments and repurchase agreements within the scope of ASC 210-20, Balance Sheet—Offsetting, as of September 30, 2020 and December 31, 2019 (dollars in thousands):
Gross Amounts Not Offset on the Balance Sheet | ||||||||||||||||||||||||
Assets | Gross Amounts of Recognized Assets | Gross Amounts Offset on the Balance Sheet | Net Amount of Assets Presented on the Balance Sheet | Financial Instruments | Cash Collateral (1) | Net Amount | ||||||||||||||||||
September 30, 2020 | ||||||||||||||||||||||||
Derivative instruments, at fair value | $ | — | $ | — | $ | — | $ | — | $ | — | $ | — | ||||||||||||
December 31, 2019 | ||||||||||||||||||||||||
Derivative instruments, at fair value | $ | 1,119 | $ | — | $ | 1,119 | $ | — | $ | 10,895 | $ | — | ||||||||||||
Gross Amounts Not Offset on the Balance Sheet | ||||||||||||||||||||||||
Liabilities | Gross Amounts of Recognized Liabilities | Gross Amounts Offset on the Balance Sheet | Net Amount of Liabilities Presented on the Balance Sheet | Financial Instruments | Cash Collateral (1) | Net Amount | ||||||||||||||||||
September 30, 2020 | ||||||||||||||||||||||||
Repurchase agreements - commercial mortgage loans | $ | 184,243 | $ | — | $ | 184,243 | $ | 406,690 | $ | 5,199 | $ | — | ||||||||||||
Repurchase agreements - real estate securities | 177,545 | — | 177,545 | 240,689 | 148 | — | ||||||||||||||||||
Derivative instruments, at fair value | — | — | — | — | 724 | — | ||||||||||||||||||
December 31, 2019 | ||||||||||||||||||||||||
Repurchase agreements - commercial mortgage loans | $ | 252,543 | $ | — | $ | 252,543 | $ | 394,229 | $ | 5,011 | $ | — | ||||||||||||
Repurchase agreements - real estate securities | 394,359 | — | 394,359 | 454,813 | 1,657 | — | ||||||||||||||||||
Derivative instruments, at fair value | 1,581 | — | 1,581 | — | 3,679 | — | ||||||||||||||||||
(1) These cash collateral amounts are recorded within the Restricted cash balance on the consolidated balance sheets.
49
BENEFIT STREET PARTNERS REALTY TRUST, INC.
NOTES TO CONSOLIDATED FINANCIAL STATEMENTS
September 30, 2020
(Unaudited)
Note 15 - Segment Reporting
The Company conducts its business through the following reporting segments:
• | The real estate debt business focuses on originating, acquiring and asset managing commercial real estate debt investments, including first mortgage loans, subordinate mortgages, mezzanine loans and participations in such loans. |
• | The real estate securities business focuses on investing in and asset managing commercial real estate securities primarily consisting of CMBS and may include unsecured REIT debt, CDO notes and other securities. |
• | The commercial real estate conduit business operated through the Company's TRS, which is focused on generating risk-adjusted returns by originating and subsequently selling fixed-rate commercial real estate loans into the CMBS securitization market at a profit. |
• | The real estate owned business represents real estate acquired by the Company through foreclosure, deed in lieu of foreclosure, or purchase. |
The following table represents the Company's operations by segment for the three and nine months ended September 30, 2020 and September 30, 2019 (dollars in thousands):
Three Months Ended September 30, 2020 | Total | Real Estate Debt and Other Real Estate Investments | Real Estate Securities | TRS | Real Estate Owned | |||||||||||||||
Interest income | $ | 44,414 | $ | 39,944 | $ | 3,996 | $ | 474 | $ | — | ||||||||||
Revenue from real estate owned | 1,017 | — | — | — | 1,017 | |||||||||||||||
Interest expense | 15,113 | 10,194 | 3,393 | 494 | 1,032 | |||||||||||||||
Net income/(loss) | 21,497 | 25,158 | (3,797 | ) | (162 | ) | 298 | |||||||||||||
Total assets as of September 30, 2020 | 3,110,968 | 2,791,762 | 170,720 | 66,750 | 81,736 | |||||||||||||||
Three Months Ended September 30, 2019 | ||||||||||||||||||||
Interest income | $ | 50,445 | $ | 47,068 | $ | 1,791 | $ | 1,586 | $ | — | ||||||||||
Revenue from real estate owned | 1,064 | — | — | — | 1,064 | |||||||||||||||
Interest expense | 22,160 | 20,108 | 1,466 | 586 | — | |||||||||||||||
Net income/(loss) | 25,913 | 17,734 | 325 | 7,854 | — | |||||||||||||||
Total assets as of December 31, 2019 | 3,540,620 | 2,964,233 | 388,170 | 131,193 | 57,024 | |||||||||||||||
Nine Months Ended September 30, 2020 | Total | Real Estate Debt and Other Real Estate Investments | Real Estate Securities | TRS | Real Estate Owned | |||||||||||||||
Interest income | $ | 135,509 | $ | 123,284 | $ | 9,870 | $ | 2,355 | $ | — | ||||||||||
Revenue from real estate owned | 3,474 | — | — | — | 3,474 | |||||||||||||||
Interest expense | 54,740 | 43,735 | 7,670 | 1,735 | 1,600 | |||||||||||||||
Net income/(loss) | 21,911 | 40,273 | (7,947 | ) | (8,290 | ) | (2,125 | ) | ||||||||||||
Total assets as of September 30, 2020 | 3,110,968 | 2,791,762 | 170,720 | 66,750 | 81,736 | |||||||||||||||
Nine Months Ended September 30, 2019 | ||||||||||||||||||||
Interest income | $ | 145,181 | $ | 136,451 | $ | 3,332 | $ | 5,398 | $ | — | ||||||||||
Revenue from real estate owned | 1,064 | — | — | — | 1,064 | |||||||||||||||
Interest expense | 68,395 | 63,411 | 2,714 | 2,270 | — | |||||||||||||||
Net income/(loss) | 60,329 | 44,963 | 618 | 14,748 | — | |||||||||||||||
Total assets as of December 31, 2019 | 3,540,620 | 2,964,233 | 388,170 | 131,193 | 57,024 | |||||||||||||||
For the purposes of the table above, any expenses not associated with a specific segment have been allocated to the business segments using a percentage derived by using the sum of commercial mortgage loans originated during the year as the denominator and commercial mortgage loans, held for investment, net of allowance and commercial mortgage loans, held-for-sale, measured at fair value as numerator.
50
BENEFIT STREET PARTNERS REALTY TRUST, INC.
NOTES TO CONSOLIDATED FINANCIAL STATEMENTS
September 30, 2020
(Unaudited)
Note 16 - Subsequent Events
The Company has evaluated subsequent events through the filing of this Quarterly Report on Form 10-Q.
Determination of Net Asset Value per Share
On November 2, 2020, the Company’s board of directors, on the recommendation of the Audit Committee of the board, unanimously determined an estimated NAV per share of the Company’s common stock of $17.88 as of September 30, 2020. The estimated NAV per share is based upon the estimated value of the Company’s assets less the Company’s liabilities as of September 30, 2020. The valuation was performed in accordance with the provisions of Practice Guideline 2013-01, Valuations of Publicly Registered Non-Listed REITs, issued by the Investment Program Association in April 2013. Independent third-party valuation firms were engaged to value the Company’s investment portfolio, including the loan portfolio, the securities portfolio and the real estate owned portfolio, and provided a range of estimated valuations for these assets. The Advisor proposed the estimated NAV per share based on the midpoint of these valuation ranges.
As a result of the approval by the board of directors of the estimated NAV per share as of September 30, 2020, and pursuant to the terms of the DRIP and SRP, the Company (i) will offer shares pursuant to the DRIP at a purchase price of $17.53, representing the lower of the company’s GAAP book value per share of common stock and the estimated per share NAV, beginning with fourth quarter 2020 distributions which are reinvested in January 2021; and (ii) will also repurchase shares pursuant to the SRP at a repurchase price of $17.53, subject to discounts in certain circumstances and subject to the terms and conditions of the SRP. These prices are subject to change upon future changes to the Company’s estimated NAV per share and GAAP book value per share in accordance with the terms of the DRIP and SRP.
51
Item 2. Management's Discussion and Analysis of Financial Condition and Results of Operations
The following discussion and analysis should be read in conjunction with the accompanying financial statements of Benefit Street Partners Realty Trust, Inc. the notes thereto and other financial information included elsewhere in this Quarterly Report on Form 10-Q, as well as our Annual Report on Form 10-K/A for the fiscal year ended December 31, 2019 filed with the U.S. Securities and Exchange Commission (the "SEC") on March 19, 2020.
As used herein, the terms "we," "our" and "us" refer to Benefit Street Partners Realty Trust, Inc., a Maryland corporation, and, as required by context, to Benefit Street Partners Realty Operating Partnership, L.P., a Delaware limited partnership, which we refer to as the "OP," and to its subsidiaries. We are externally managed by Benefit Street Partners L.L.C. (our "Advisor").
The forward-looking statements contained in this Quarterly Report on Form 10-Q may include, but are not limited to, statements as to:
• | our business and investment strategy; |
• | our ability to make investments in a timely manner or on acceptable terms; |
• | the impact of the COVID-19 pandemic; |
• | current credit market conditions and our ability to obtain long-term financing for our investments in a timely manner and on terms that are consistent with what we project when we invest; |
• | the effect of general market, real estate market, economic and political conditions, including the recent economic slowdown and dislocation in the global credit markets; |
• | our ability to make scheduled payments on our debt obligations; |
• | our ability to generate sufficient cash flows to make distributions to our stockholders; |
• | our ability to generate sufficient debt and equity capital to fund additional investments; |
• | our ability to refinance our existing financing arrangements; |
• | the degree and nature of our competition; |
• | the availability of qualified personnel; |
• | the requirement for us to register as an investment company under the Investment Company Act of 1940, as amended (the "Investment Company Act"); and |
• | our ability to maintain our qualification as a real estate investment trust ("REIT"); and |
• | other factors set forth under the caption "Risk Factors" in our Annual Report on Form 10-K/A for the year ended December 31, 2019 and this Quarterly Report on Form 10-Q. |
In addition, words such as "anticipate," "believe," "expect" and "intend" indicate a forward-looking statement, although not all forward-looking statements include these words. The forward-looking statements contained in this Quarterly Report on Form 10-Q involve risks and uncertainties. Our actual results could differ materially from those implied or expressed in the forward-looking statements for any reason.
Currently, one of the most significant factors that could cause actual outcomes to differ materially from our forward-looking statements is the continuing adverse effect of the current pandemic of the novel coronavirus, or COVID-19, on the financial condition, operating results and cash flows of the Company, its borrowers, the real estate market, the global economy and the financial markets. The extent to which the COVID-19 pandemic continues to impact us and our borrowers will depend on future developments, which are highly uncertain and cannot be predicted with confidence, including the scope, severity and duration of the pandemic, including any resurgences, the speed and effectiveness of vaccine and treatment developments and the direct and indirect economic effects of the pandemic and containment measures, among others.
Our investors should not place undue reliance on these forward-looking statements. The forward-looking statements made in this Quarterly Report on Form 10-Q relate only to events as of the date on which the statements are made. We undertake no obligation to update any forward-looking statement to reflect events or circumstances occurring after the date of this Quarterly Report on Form 10-Q.
52
Overview
We were incorporated in Maryland on November 15, 2012 and have conducted our operations to qualify as a REIT for U.S. federal income tax purposes beginning with our taxable year ended December 31, 2013. The Company, through a subsidiary which is treated as a TRS, is indirectly subject to U.S. federal, state and local income taxes. We commenced business in May 2013. We primarily originate, acquire and manage a diversified portfolio of commercial real estate debt investments secured by properties located within and outside of the United States. Commercial real estate debt investments may include first mortgage loans, subordinated mortgage loans, mezzanine loans and participations in such loans. Substantially all of our business is conducted through the OP, a Delaware limited partnership. We are the sole general partner and directly or indirectly hold all of the units of limited partner interests in the OP.
The Company has no direct employees. We are managed by our Advisor pursuant to an Amended and Restated Advisory Agreement, dated January 19, 2018 (the "Advisory Agreement"). Our Advisor manages our affairs on a day-to-day basis. The Advisor receives compensation and fees for services related to the investment and management of our assets and our operations.
The Advisor, an SEC-registered investment adviser, is a credit-focused alternative asset management firm. The Advisor manages funds for institutions and high-net-worth investors across various credit funds and complementary strategies including high yield, levered loans, private / opportunistic debt, liquid credit, structured credit and commercial real estate debt. These strategies complement each other as they all leverage the sourcing, analytical, compliance, and operational capabilities that encompass the Advisor’s robust platform. On February 1, 2019, Franklin Resources, Inc. and Templeton International, Inc. (collectively, “Franklin Templeton”) acquired the Advisor (the “Transaction”). The Transaction did not impact the terms of the Advisory Agreement and the Transaction did not result in any changes to the executive officers of the Company.
The Company invests in commercial real estate debt investments, which may include first mortgage loans, subordinated mortgage loans, mezzanine loans and participations in such loans. The Company also originates conduit loans which the Company intends to sell through its TRS into CMBS securitization transactions at a profit. The Company also owns real estate, which represents real estate acquired by the Company through foreclosure, deed in lieu of foreclosure, or purchase.
The Company also invests in commercial real estate securities. Real estate securities may include CMBS, senior unsecured debt of publicly traded REITs, debt or equity securities of other publicly traded real estate companies and CDOs.
COVID-19 Pandemic
Since December 2019, COVID-19 has spread globally, including to every state in the United States. In March 2020, the World Health Organization declared COVID-19 a pandemic, and subsequently, the United States declared a national emergency. The COVID-19 pandemic has had significant repercussions across domestic and global economies and financial markets, including the industries in which our borrowers operate. The global impact of the COVID-19 outbreak evolved rapidly and many governmental authorities, including state and local governments in regions in which our borrowers own properties, have reacted by instituting government restrictions, border closings, quarantines, “shelter-in-place” orders and “social distancing” guidelines which have forced many of our borrowers to suspend or significantly restrict their business activities. The effects of the pandemic have resulted in a dramatic increase in national unemployment and numerous corporate bankruptcies.
The COVID-19 pandemic has had and is continuing to have a material impact on our operations:
Impact on Operating Results. With respect to our operating results in the nine months ended September 30, 2020, the COVID-19 pandemic drove a significant increase in our allowance for credit loss provision on our loan portfolio and an increase in the realized loss on our securities portfolio. Specifically, for the nine months ended September 30, 2020, we experienced an increase in our provision for anticipated credit losses on our loan portfolio by approximately $14.9 million, primarily driven by the decline in the overall economic outlook as a result of the COVID-19 pandemic. During the three months ended September 30, 2020 we experienced a decrease in our provision for anticipated credit losses of $3.5 million, primarily driven by the relative stabilization of market conditions beginning in the third quarter of 2020. Additionally, we had realized losses of $10.1 million on our real estate securities portfolio during the nine months ended September 30, 2020. This was a result of deterioration in the broader capital markets and uncertainty due to COVID-19 and its expected impact on values of properties underlying our real-estate debt assets. Due primarily to changes in market conditions associated with the COVID-19 pandemic, the weighted average risk rating of our loan portfolio increased from 2.1 as of December 31, 2019 to 2.2 as of September 30, 2020, and the amortized cost basis of our loans past due increased by $12.5 million to $69.6 million over this period. Additionally, we have had minimal conduit loan activity since the onset of the pandemic and expect little conduit loan activity in the near term.
In the second and third quarters, we made limited modifications to certain loans to assist borrowers during the COVID-19 pandemic, but none of these modifications qualify as troubled debt restructurings ("TDRs").
53
Impact on Liquidity. During the nine months ended September 30, 2020, there were significant disruptions in the financial markets that impacted our real estate securities portfolio. This resulted in decreases in market value for these assets due to volatility and lack of liquidity. During the second quarter, we received margin calls from certain of our lenders due to the decline in pricing, which we satisfied through the contribution of additional cash, thereby reducing our liquidity position and substantially reducing our levered returns on this portfolio of assets. In addition, many of our lenders have reduced the advance rates on our repurchase agreements, which has further adversely impacted our liquidity and reduced anticipated returns. Although the markets for these assets stabilized beginning in the second quarter of 2020, if they were to suffer similar disruptions as a result of the ongoing economic impacts of COVID-19 or otherwise, we could receive additional margin calls which would strain our liquidity. As of September 30, 2020 the Company has significantly reduced its real estate securities portfolio, further reducing mark to market exposure and the associated liquidity risk from counterparty margin calls on real estate securities repurchase agreements compared to prior quarters. In addition, the financial market dislocations created by the COVID-19 pandemic have currently made financing through CDO or CLO securitizations more difficult.
The extent to which the COVID-19 pandemic impacts our future operating results and liquidity will depend on future developments which are highly uncertain and cannot be predicted with confidence, including the scope, severity and duration of the pandemic, including any resurgences, and the direct and indirect economic effects of the pandemic and containment measures. The inability of our borrowers to meet their loan obligations and/or borrowers filing for bankruptcy protection would reduce our cash flows, which would impact our ability to pay dividends to our stockholders. As a result of the adverse effects of the COVID-19 pandemic, starting the second quarter of 2020 our board of directors reduced the amount of our regular common stock dividend. The board may reduce or eliminate the dividend in the future in the event of further economic deterioration or dislocations in the capital markets. For further discussion of the potential impacts from the COVID-19 pandemic on our business, financial condition, results of operations, liquidity and our ability to make distributions to our stockholders, refer to “Risk Factors” in Part II, Item 1A of this Quarterly Report on Form 10-Q.
Estimated Per Share NAV
On November 2, 2020, our board of directors, upon the recommendation of the Audit Committee of the board, unanimously approved and established the estimated net asset value ("NAV") per share of the Company’s common stock proposed by the Advisor of $17.88. The estimated per share NAV was based upon the estimated value of the Company’s assets less the Company’s liabilities as of September 30, 2020 (the “Valuation Date”). The valuation was performed in accordance with the provisions of Practice Guideline 2013-01, Valuations of Publicly Registered Non-Listed REITs, issued by the Investment Program Association in April 2013, including the use of independent third-party valuation firms to estimate the fair value of our loan portfolio, securities portfolio and real estate owned portfolio.
These valuation firms estimated the value of our loan portfolio using customary valuation methods, including a discounted cash flow analysis with respect to our loan portfolio, available market pricing information with respect to our securities portfolio, and real estate appraisals with respect to our real estate owned portfolio. Based on these methodologies these firms determined a range of estimated valuations. To estimate the Company’s NAV, the Advisor added the amounts of cash and other tangible assets reflected on our balance sheet (as computed in accordance with GAAP) and subtracted our liabilities as reflected on our balance sheet (computed in accordance with GAAP). Based on this the Advisor estimated that the Company’s NAV as of September 30, 2020 is $17.88 which is the midpoint of the valuation range of $17.14 to $18.62.
The Advisor recommended our board of directors approve the estimated per share NAV of $17.88. As with any methodology used to estimate value, the methodologies employed to estimate the NAV were based upon a number of estimates and assumptions that may not be accurate or complete. If different judgments, assumptions or opinions were used, a different estimate would likely result.
We believe that the method used to determine the estimated per share NAV of the Company’s common stock is the methodology most commonly used by public, non-listed REITs to estimate per share NAV. The estimated per share NAV does not represent the per share amount a third party would pay to acquire us, or the price at which our common stock would trade in the event we were listed on a national securities exchange. For example, the estimated per share NAV of the Company’s common stock does not reflect a liquidity discount for the fact that the shares are not currently traded on a national securities exchange and other costs that may be incurred in connection with a liquidity event. Our estimated per share NAV does not reflect the conversion of any of our Series A convertible preferred stock ("Series A Preferred Stock") or Series C convertible preferred stock (“Series C Preferred Stock,” and with the Series A Preferred Stock, the “Preferred Stock”).
The estimated per share NAV was determined at a moment in time and as of the Valuation Date and the values of our assets and liabilities will change over time as a result of changes relating to the individual loans in our portfolio as well as changes and developments in the real estate and capital markets generally, including changes in interest rates. For example, material adverse developments in the real estate or credit markets related to the COVID-19 pandemic after September 30, 2020 would have a significant impact on our estimated per share NAV. Therefore, stockholders should not rely on the estimated per share NAV in making a decision to buy or sell shares of our common stock.
54
Significant Accounting Policies and Use of Estimates
A summary of our significant accounting policies is set forth in Note 2 - Summary of Significant Accounting Policies to our consolidated financial statements included in this Quarterly Report on Form 10-Q. A full disclosure of our significant accounting polices is disclosed in our Annual Report on Form 10-K/A for the year ended December 31, 2019.
Portfolio
As of September 30, 2020 and December 31, 2019, our portfolio consisted of 124 and 122 commercial mortgage loans, respectively, excluding commercial mortgage loans accounted for under the fair value option. The commercial mortgage loans held for investment as of September 30, 2020 and December 31, 2019 had a total carrying value, net of allowance for credit losses, of $2,598.9 million and $2,762.0 million, respectively. As of September 30, 2020 and December 31, 2019, our total commercial mortgage loans, held-for-sale, measured at fair value comprised of 1 loan with total fair value of $0.1 million and 7 loans with total fair value of $112.6 million, respectively. As of September 30, 2020 and December 31, 2019, our real estate securities, available-for-sale, at fair value were comprised of 9 CMBS investments with total fair value of $169.8 million and 21 CMBS investments with total fair value of $386.3 million, respectively. As of September 30, 2020 and December 31, 2019, our other real estate investments, measured at fair value, were comprised of one investment with a total fair value of $2.5 million and $2.6 million, respectively. As of September 30, 2020, our real estate owned portfolio comprised of 3 investments with a carrying value of $58.1 million. As of December 31, 2019, our real estate owned portfolio was comprised of 2 investments with a carrying value of $35.3 million.
For our commercial mortgage loans, excluding commercial mortgage loans accounted for under the fair value option, we currently estimate loss rates based on historical realized losses experienced in the industry and take into account current collateral and economic conditions affecting the probability or severity of losses when establishing the allowance for credit losses. We recorded allowance for credit loss as of September 30, 2020 and December 31, 2019 in the amount of $22.8 million and $0.9 million, respectively.
During the three months ended September 30, 2020 the Company sold a real estate owned investment for a realized gain of $1.4 million within the consolidated statements of operations. During three months ended March 31 2020, the Company wrote off this commercial mortgage loan, held for investment, with a carrying value of $14.4 million in exchange for the possession of a real estate owned investment at a fair value of $14.0 million at the time of the transfer. The transfer occurred when we took possession of the property by completing a foreclosure transaction which resulted in a $0.4 million loss at the time of transfer.
As of September 30, 2020, the Company reached an agreement with a borrower to take possession of certain collateral. At the time of transfer, the carrying value of the commercial mortgage loan, held for investment was $21.1 million, which was exchanged for possession of the REO asset at a purchase price of $21.4 million.
As of September 30, 2020, we had 2 loans with unpaid contractual principal balance for a total carrying value of $69.6 million that had interest past due for greater than 90 days. We did not take any asset specific reserves for these loans. As of December 31, 2019, we had one loan with unpaid contractual principal balance and carrying value of $57.1 million that had interest past due for greater than 90 days.
As of September 30, 2020 and December 31, 2019, our commercial mortgage loans, excluding commercial mortgage loans accounted for under the fair value option, had a weighted average coupon of 5.5% and 5.6%, and a weighted average remaining life of 1.6 years and 1.8 years, respectively. As of September 30, 2020 and December 31, 2019, our CMBS investments had a weighted average coupon of 2.2% and 3.7%, and a remaining life of 13.1 years and 15.8 years, respectively.
For the three and nine months ended September 30, 2020 our real estate securities, available for sale, measured at fair value had an unrecognized unrealized gain/(loss) of $18.7 million and $(8.6) million, respectively, included within the consolidated statements of comprehensive income. The overall deterioration in fair value of real estate securities as of September 30, 2020 can be attributed mainly to the significant market down-turn and volatility, particularly in the CMBS markets, in March and April 2020, as a result of high unemployment and credit uncertainties related to the outbreak of COVID-19, offset to some degree by the relative stabilization of CMBS markets during the third quarter.
55
The following charts summarize our commercial mortgage loans, held for investment, by the collateral type, geographical region and coupon rate type as of September 30, 2020 and December 31, 2019:
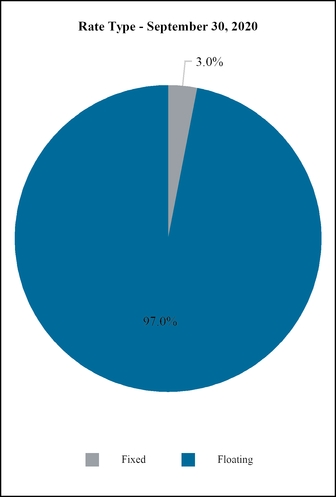
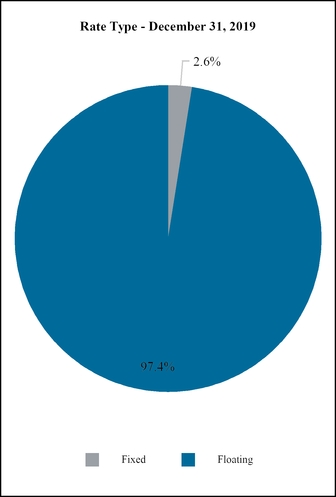
56
57
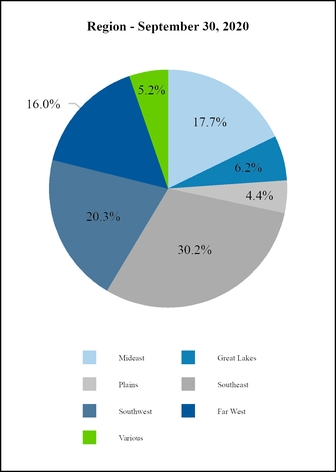
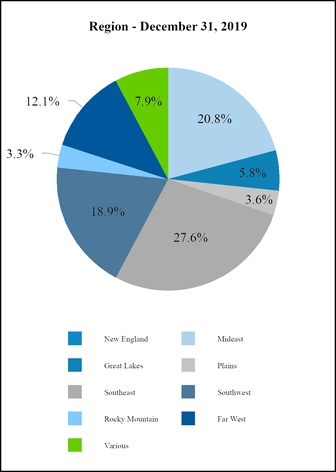
An investments region classification is defined according to the below map based on the location of investments secured property.
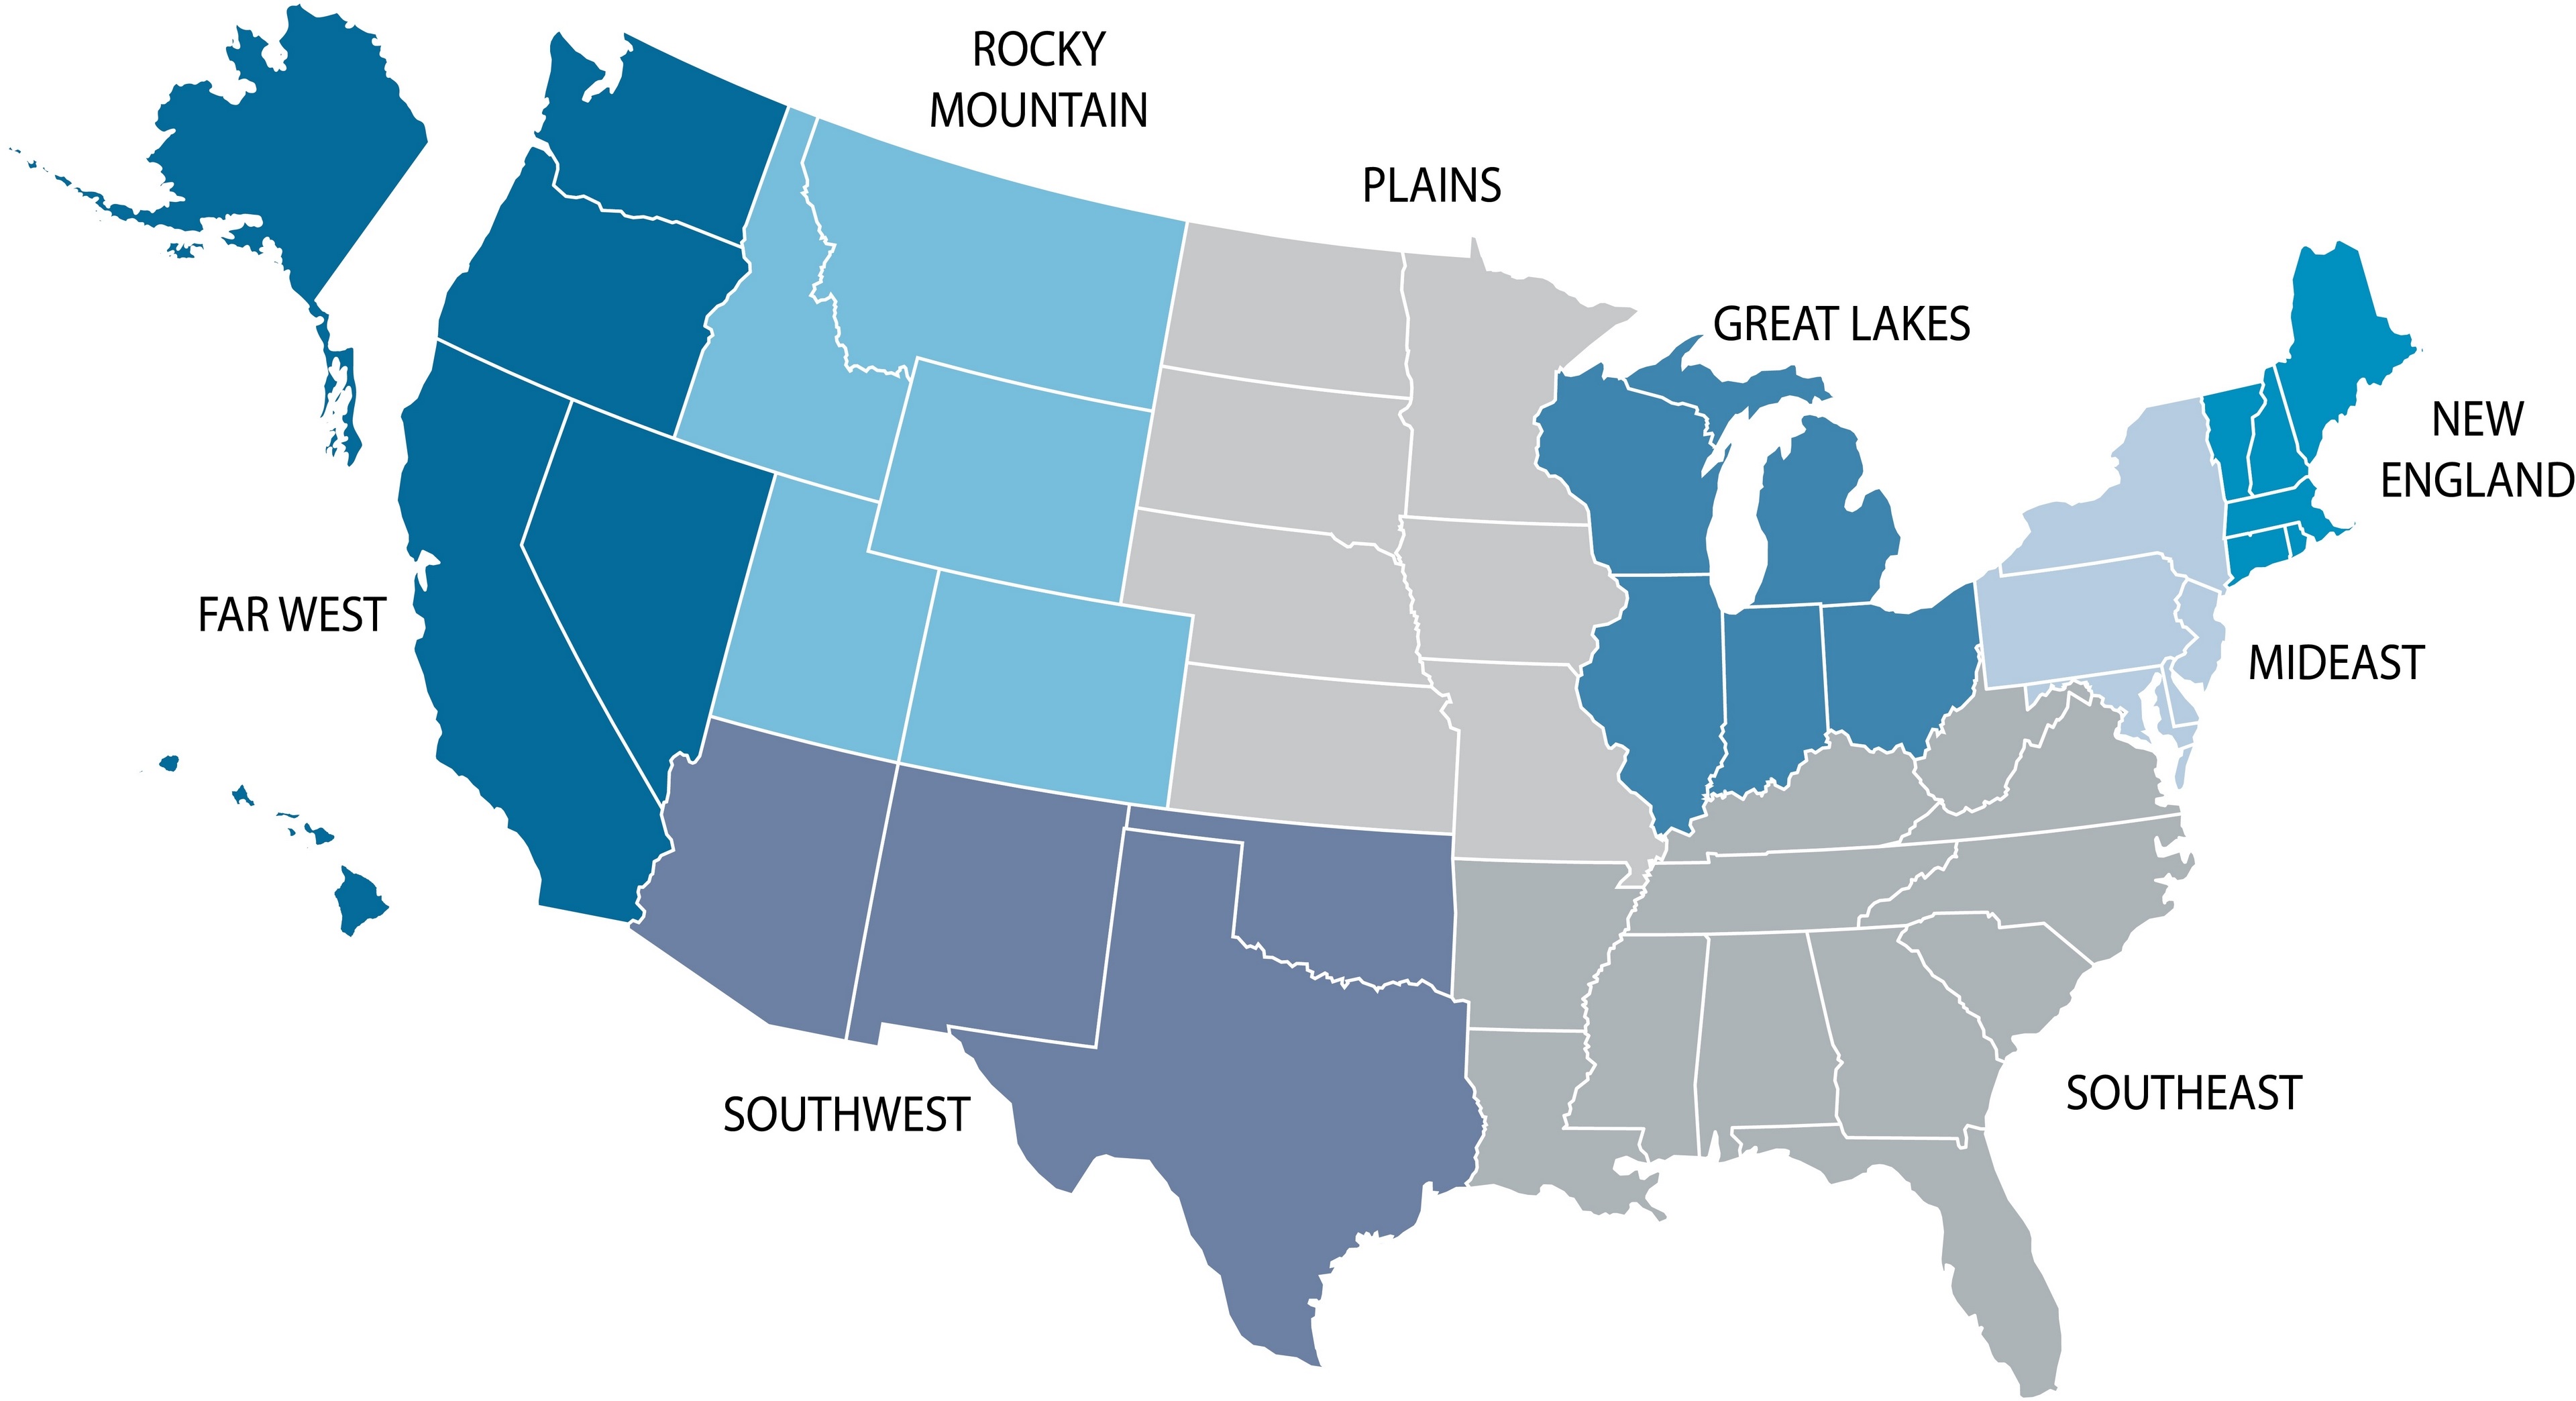
58
The following charts show the par value by contractual maturity year for the commercial mortgage loans held for investments in our portfolio as of September 30, 2020 and December 31, 2019:
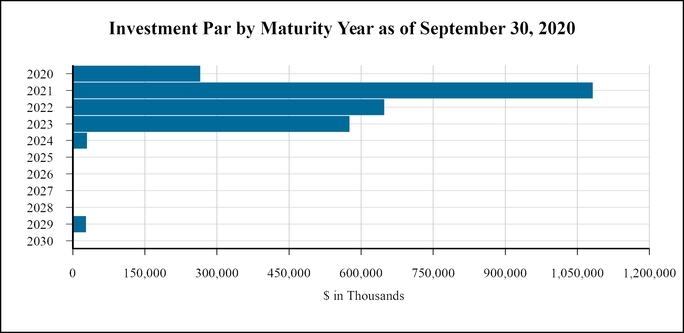
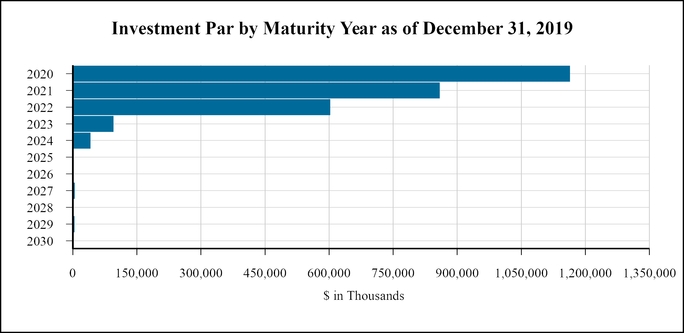
59
The following table shows selected data from our commercial mortgage loans, held for investment in our portfolio as of September 30, 2020 (dollars in thousands):
Loan Type | Property Type | Par Value | Interest Rate (1) | Effective Yield | Loan to Value (2) |
Senior Debt 1 | Industrial | $33,655 | 1 month LIBOR + 4.00% | 4.2% | 65.0% |
Senior Debt 2 | Mixed Use | 12,882 | 1 month LIBOR + 5.00% | 5.8% | 73.3% |
Senior Debt 3 | Office | 14,080 | 1 month LIBOR + 4.45% | 5.5% | 64.2% |
Senior Debt 4 | Office | 10,454 | 1 month LIBOR + 6.00% | 7.0% | 74.0% |
Senior Debt 5 | Multifamily | 37,812 | 1 month LIBOR + 3.35% | 5.6% | 76.0% |
Senior Debt 6 | Office | 27,399 | 1 month LIBOR + 4.15% | 5.4% | 69.5% |
Senior Debt 7 | Multifamily | 34,875 | 1 month LIBOR + 3.75% | 5.0% | 71.2% |
Senior Debt 8 | Hospitality | 10,600 | 1 month LIBOR + 5.00% | 6.1% | 61.6% |
Senior Debt 9 | Hospitality | 5,903 | 1 month LIBOR + 3.50% | 4.5% | 77.0% |
Senior Debt 10 | Hospitality | 57,075 | 1 month LIBOR + 5.19% | 6.2% | 51.8% |
Senior Debt 11 | Multifamily | 71,577 | 1 month LIBOR + 4.50% | 5.5% | 22.4% |
Senior Debt 12 | Hospitality | 10,250 | 1 month LIBOR + 5.25% | 6.3% | 60.7% |
Senior Debt 13 | Hospitality | 23,000 | 1 month LIBOR + 4.66% | 5.7% | 48.1% |
Senior Debt 14 | Multifamily | 19,385 | 1 month LIBOR + 3.60% | 4.5% | 80.5% |
Senior Debt 15 | Office | 23,726 | 1 month LIBOR + 5.15% | 6.6% | 56.4% |
Senior Debt 16 | Multifamily | 41,950 | 1 month LIBOR + 3.70% | 4.5% | 63.7% |
Senior Debt 17 | Hospitality | 28,272 | 1 month LIBOR + 4.00% | 5.3% | 68.0% |
Senior Debt 18 | Hospitality | 22,700 | 1 month LIBOR + 4.40% | 5.0% | 72.7% |
Senior Debt 19 | Multifamily | 35,578 | 1 month LIBOR + 3.00% | 4.5% | 83.6% |
Senior Debt 20 | Self Storage | 4,120 | 1 month LIBOR + 4.05% | 5.0% | 45.5% |
Senior Debt 21 | Self Storage | 6,496 | 1 month LIBOR + 4.05% | 5.0% | 55.8% |
Senior Debt 22 | Self Storage | 7,606 | 1 month LIBOR + 4.05% | 5.0% | 57.6% |
Senior Debt 23 | Self Storage | 2,400 | 1 month LIBOR + 4.05% | 5.0% | 37.6% |
Senior Debt 24 | Self Storage | 6,310 | 1 month LIBOR + 5.05% | 5.2% | 59.1% |
Senior Debt 25 | Multifamily | 22,775 | 1 month LIBOR + 3.15% | 4.9% | 79.7% |
Senior Debt 26 | Hospitality | 22,355 | 1 month LIBOR + 3.50% | 4.8% | 68.8% |
Senior Debt 27 | Mixed Use | 56,697 | 1 month LIBOR + 4.87% | 5.3% | 49.0% |
Senior Debt 28 | Multifamily | 12,007 | 1 month LIBOR + 3.50% | 5.3% | 74.6% |
Senior Debt 29 | Office | 21,100 | 1 month LIBOR + 3.75% | 5.8% | 70.0% |
Senior Debt 30 | Self Storage | 6,299 | 1 month LIBOR + 6.00% | 7.8% | 58.9% |
Senior Debt 31 | Office | 16,395 | 1 month LIBOR + 3.40% | 5.3% | 67.5% |
Senior Debt 32 | Retail | 29,500 | 6.25% | 6.3% | 68.5% |
Senior Debt 33 | Self Storage | 11,966 | 1 month LIBOR + 5.50% | 7.3% | 68.1% |
Senior Debt 34 | Multifamily | 15,613 | 1 month LIBOR + 3.15% | 5.0% | 80.3% |
Senior Debt 35 | Multifamily | 22,325 | 1 month LIBOR + 3.40% | 5.0% | 80.5% |
Senior Debt 36 | Multifamily | 29,900 | 1 month LIBOR + 3.35% | 5.3% | 73.0% |
Senior Debt 37 | Multifamily | 39,776 | 1 month LIBOR + 3.10% | 5.0% | 75.5% |
Senior Debt 38 | Self Storage | 17,400 | 1 month LIBOR + 4.00% | 5.3% | 69.5% |
Senior Debt 39 | Multifamily | 10,020 | 1 month LIBOR + 3.45% | 5.5% | 76.8% |
Senior Debt 40 | Land | 16,400 | 1 month LIBOR + 6.00% | 8.3% | 45.7% |
Senior Debt 41 | Hospitality | 8,573 | 1 month LIBOR + 4.80% | 6.8% | 62.5% |
Senior Debt 42 | Retail | 12,495 | 1 month LIBOR + 4.75% | 6.9% | 53.5% |
Senior Debt 43 | Industrial | 14,160 | 1 month LIBOR + 3.95% | 6.0% | 66.4% |
Senior Debt 44 | Multifamily | 48,500 | 1 month LIBOR + 3.75% | 6.2% | 69.5% |
Senior Debt 45 | Multifamily | 34,296 | 1 month LIBOR + 3.25% | 5.3% | 73.8% |
Senior Debt 46 | Multifamily | 38,906 | 1 month LIBOR + 5.70% | 7.5% | 70.7% |
Senior Debt 47 | Office | 7,200 | 1 month LIBOR + 3.90% | 6.0% | 67.6% |
Senior Debt 48 | Manufactured Housing | 8,893 | 1 month LIBOR + 4.40% | 6.5% | 60.3% |
Senior Debt 49 | Hospitality | 14,000 | 1 month LIBOR + 3.94% | 6.2% | 44.8% |
Senior Debt 50 | Retail | 14,250 | 1 month LIBOR + 3.95% | 6.5% | 61.2% |
Senior Debt 51 | Hospitality | 21,000 | 1 month LIBOR + 4.14% | 6.6% | 56.0% |
Senior Debt 52 | Multifamily | 24,244 | 1 month LIBOR + 3.10% | 5.4% | 73.1% |
Senior Debt 53 | Multifamily | 37,643 | 1 month LIBOR + 3.10% | 5.4% | 73.4% |
Senior Debt 54 | Retail | 13,400 | 1 month LIBOR + 4.00% | 6.1% | 84.0% |
60
Loan Type | Property Type | Par Value | Interest Rate (1) | Effective Yield | Loan to Value (2) |
Senior Debt 55 | Office | 42,631 | 1 month LIBOR + 3.50% | 5.8% | 71.0% |
Senior Debt 56 | Retail | 8,500 | 1 month LIBOR + 5.00% | 7.2% | 51.6% |
Senior Debt 57 | Hospitality | 10,580 | 1 month LIBOR + 4.50% | 6.8% | 68.7% |
Senior Debt 58 | Multifamily | 18,100 | 1 month LIBOR + 3.40% | 5.4% | 76.4% |
Senior Debt 59 | Multifamily | 28,250 | 1 month LIBOR + 3.40% | 5.4% | 77.2% |
Senior Debt 60 | Hospitality | 19,900 | 1 month LIBOR + 4.15% | 6.5% | 61.8% |
Senior Debt 61 | Multifamily | 18,656 | 1 month LIBOR + 3.10% | 5.5% | 67.4% |
Senior Debt 62 | Office | 27,783 | 1 month LIBOR + 3.77% | 6.0% | 68.2% |
Senior Debt 63 | Hospitality | 20,930 | 1 month LIBOR + 3.75% | 6.1% | 62.6% |
Senior Debt 64 | Hospitality | 15,500 | 1 month LIBOR + 4.00% | 6.5% | 56.4% |
Senior Debt 65 | Hospitality | 5,250 | 1 month LIBOR + 4.25% | 6.5% | 47.7% |
Senior Debt 66 | Hospitality | 12,750 | 1 month LIBOR + 4.45% | 6.9% | 62.9% |
Senior Debt 67 | Hospitality | 9,000 | 1 month LIBOR + 4.50% | 6.9% | 64.0% |
Senior Debt 68 | Retail | 9,400 | 1 month LIBOR + 4.20% | 6.3% | 77.1% |
Senior Debt 69 | Manufactured Housing | 12,200 | 1 month LIBOR + 3.65% | 5.9% | 48.4% |
Senior Debt 70 | Manufactured Housing | 24,100 | 1 month LIBOR + 3.65% | 5.9% | 53.8% |
Senior Debt 71 | Multifamily | 23,149 | 1 month LIBOR + 2.65% | 4.8% | 75.8% |
Senior Debt 72 | Office | 29,750 | 1 month LIBOR + 3.35% | 5.4% | 54.3% |
Senior Debt 73 | Hospitality | 34,591 | 1 month LIBOR + 3.99% | 5.7% | 31.0% |
Senior Debt 74 | Multifamily | 12,708 | 1 month LIBOR + 2.65% | 4.5% | 71.6% |
Senior Debt 75 | Multifamily | 36,162 | 1 month LIBOR + 2.75% | 4.5% | 79.3% |
Senior Debt 76 | Industrial | 53,000 | 1 month LIBOR + 3.75% | 5.5% | 59.7% |
Senior Debt 77 | Office | 21,825 | 1 month LIBOR + 3.50% | 5.4% | 70.9% |
Senior Debt 78 | Hospitality | 7,100 | 1 month LIBOR + 4.00% | 5.8% | 70.3% |
Senior Debt 79 | Industrial | 22,230 | 1 month LIBOR + 3.55% | 5.3% | 69.7% |
Senior Debt 80 | Multifamily | 20,061 | 1 month LIBOR + 2.75% | 4.3% | 71.7% |
Senior Debt 81 | Multifamily | 26,815 | 1 month LIBOR + 3.15% | 5.0% | 71.6% |
Senior Debt 82 | Multifamily | 25,767 | 1 month LIBOR + 2.70% | 2.9% | 76.0% |
Senior Debt 83 | Multifamily | 7,150 | 1 month LIBOR + 4.75% | 5.8% | 75.3% |
Senior Debt 84 | Multifamily | 25,000 | 1 month LIBOR + 3.00% | 4.5% | 75.5% |
Senior Debt 85 | Multifamily | 9,058 | 1 month LIBOR + 2.80% | 4.5% | 69.2% |
Senior Debt 86 | Office | 26,000 | 1 month LIBOR + 5.18% | 6.9% | 64.9% |
Senior Debt 87 | Multifamily | 13,509 | 1 month LIBOR + 3.10% | 4.5% | 63.7% |
Senior Debt 88 | Multifamily | 35,100 | 1 month LIBOR + 1.99% | 3.6% | 70.2% |
Senior Debt 89 | Office | 35,387 | 1 month LIBOR + 3.70% | 5.0% | 65.7% |
Senior Debt 90 | Industrial | 25,350 | 1 month LIBOR + 3.50% | 5.2% | 58.1% |
Senior Debt 91 | Multifamily | 11,800 | 1 month LIBOR + 3.15% | 4.8% | 72.4% |
Senior Debt 92 | Office | 27,462 | 1 month LIBOR + 2.70% | 2.9% | 71.4% |
Senior Debt 93 | Multifamily | 75,100 | 1 month LIBOR + 4.35% | 6.0% | 64.7% |
Senior Debt 94 | Manufactured Housing | 1,392 | 5.50% | 5.5% | 62.8% |
Senior Debt 95 | Industrial | 14,650 | 1 month LIBOR + 6.00% | 6.8% | 59.9% |
Senior Debt 96 | Multifamily | 7,171 | 1 month LIBOR + 4.75% | 5.8% | 62.6% |
Senior Debt 97 | Multifamily | 6,482 | 1 month LIBOR + 4.90% | 5.7% | 53.2% |
Senior Debt 98 | Multifamily | 46,000 | 1 month LIBOR + 4.75% | 5.8% | 69.4% |
Senior Debt 99 | Multifamily | 5,550 | 1 month LIBOR + 6.87% | 7.9% | 75.0% |
Senior Debt 100 | Industrial | 16,400 | 1 month LIBOR + 6.25% | 6.4% | 61.0% |
Senior Debt 101 | Multifamily | 14,292 | 1 month LIBOR + 4.75% | 5.5% | 65.3% |
Senior Debt 102 | Multifamily | 23,475 | 1 month LIBOR + 4.65% | 4.8% | 52.7% |
Senior Debt 103 | Multifamily | 4,300 | 1 month LIBOR + 5.50% | 5.7% | 87.4% |
Senior Debt 104 | Manufactured Housing | 7,680 | 1 month LIBOR + 4.50% | 4.7% | 66.7% |
Senior Debt 105 | Office | 30,465 | 1 month LIBOR + 5.15% | 5.3% | 67.0% |
Senior Debt 106 | Multifamily | 3,140 | 1 month LIBOR + 6.25% | 6.4% | 73.5% |
Senior Debt 107 | Industrial | 18,390 | 1 month LIBOR + 4.60% | 4.8% | 20.7% |
Senior Debt 108 | Multifamily | — | 1 month LIBOR + 5.25% | 5.4% | —% |
Senior Debt 109 | Hospitality | 27,000 | 1 month LIBOR + 6.50% | 6.7% | 62.7% |
Senior Debt 110 | Multifamily | 2,465 | 1 month LIBOR + 5.75% | 5.9% | 66.6% |
61
Loan Type | Property Type | Par Value | Interest Rate (1) | Effective Yield | Loan to Value (2) |
Senior Debt 111 | Multifamily | 50,000 | 1 month LIBOR + 6.69% | 6.8% | 80.0% |
Senior Debt 112 | Self Storage | 29,895 | 1 month LIBOR + 5.00% | 5.2% | 58.8% |
Senior Debt 113 | Multifamily | 11,100 | 1 month LIBOR + 4.75% | 4.9% | 70.0% |
Senior Debt 114 | Manufactured Housing | 3,400 | 1 month LIBOR + 5.00% | 5.2% | 58.6% |
Senior Debt 115 | Multifamily | 27,550 | 1 month LIBOR + 5.75% | 5.9% | 69.8% |
Senior Debt 116 | Multifamily | 76,000 | 1 month LIBOR + 4.10% | 4.3% | 67.9% |
Senior Debt 117 | Multifamily | 58,000 | 1 month LIBOR + 5.25% | 5.4% | 74.7% |
Senior Debt 118 | Manufactured Housing | 5,020 | 1 month LIBOR + 5.25% | 5.4% | 65.9% |
Senior Debt 119 | Hospitality | 17,401 | 5.75% | 5.8% | 52.9% |
Senior Debt 120 | Industrial | 23,625 | 4.70% | 4.7% | 74.1% |
Mezzanine Loan 1 | Multifamily | 3,480 | 9.50% | 9.5% | 84.3% |
Mezzanine Loan 2 | Retail | 3,500 | 10.00% | 10.0% | 59.7% |
Mezzanine Loan 3 | Multifamily | 6,500 | 1 month LIBOR + 10.25% | 10.4% | 90.4% |
Mezzanine Loan 4 | Multifamily | 1,000 | 11.00% | 11.0% | 68.9% |
$2,629,120 | 5.5% | 65.3% | |||
(1) Our floating rate loan agreements contain the contractual obligation for the borrower to maintain an interest rate cap to protect against rising interest rates. In a simple interest rate cap, the borrower pays a premium for a notional principal amount based on a capped interest rate (the “cap rate”). When the floating rate exceeds the cap rate, the borrower receives a payment from the cap counterparty equal to the difference between the floating rate and the cap rate on the same notional principal amount for a specified period of time. When interest rates rise, the value of an interest rate cap will increase, thereby reducing the borrower's exposure to rising interest rates.
(2) Loan to value percentage is from metrics at origination.
The following table shows selected data from our commercial mortgage loans, held-for-sale, measured at fair value as of September 30, 2020 (dollars in thousands):
________________________
Loan Type | Property Type | Par Value | Interest Rate | Effective Yield | Loan to Value (1) |
TRS Mezzanine Loan 1 | Multifamily | $100 | 1 month LIBOR + 14.00% | 15.0% | 76.4% |
$100 | 15.0% | 76.4% | |||
(1) Loan to value percentage is from metrics at origination.
The following table shows selected data from our real estate securities, available for sale, measured at fair value as of September 30, 2020 (dollars in thousands):
Type | Par Value | Interest Rate | Effective Yield |
CMBS 1 | $13,250 | 1 month LIBOR + 2.95% | 3.1% |
CMBS 2 | 10,800 | 1 month LIBOR + 2.10% | 2.3% |
CMBS 3 | 40,000 | 1 month LIBOR + 2.35% | 2.5% |
CMBS 4 | 8,000 | 1 month LIBOR + 1.85% | 2.0% |
CMBS 5 | 24,000 | 1 month LIBOR + 2.00% | 2.2% |
CMBS 6 | 12,000 | 1 month LIBOR + 2.15% | 2.3% |
CMBS 7 | 20,000 | 1 month LIBOR + 1.33% | 1.5% |
CMBS 8 | 25,000 | 1 month LIBOR + 1.63% | 1.8% |
CMBS 9 | 25,665 | 1 month LIBOR + 2.15% | 2.3% |
$178,715 | 2.2% | ||
The following table shows selected data from our other real estate investments, measured at fair value as of September 30, 2020 (dollars in thousands):
Loan Type | Property Type | Par Value | Preferred Return | ||
Preferred Equity 1 | Retail | $ | 2,500 | 12.50% | |
$ | 2,500 | ||||
62
The following table shows selected data from our real estate owned assets in our portfolio as of September 30, 2020 (dollars in thousands):
Type | Property Type | Carrying Value | ||
Real Estate Owned 1 | Hospitality | $ | 9,974 | |
Real Estate Owned 2 | Office | 26,709 | ||
Real Estate Owned 3 | Hospitality | 21,411 | ||
$ | 58,094 | |||
Results of Operations
Comparison of the Three Months Ended September 30, 2020 to the Three Months Ended September 30, 2019
We conduct our business through the following segments:
• | The real estate debt business focuses on originating, acquiring and asset managing commercial real estate debt investments, including first mortgage loans, subordinate mortgages, mezzanine loans and participations in such loans. |
• | The real estate securities business focuses on investing in and asset managing commercial real estate securities primarily consisting of CMBS and may include unsecured REIT debt, CDO notes and other securities. |
• | The Conduit business operated through the Company's TRS, which is focused on generating superior risk-adjusted returns by originating and subsequently selling fixed-rate commercial real estate loans into the CMBS securitization market at a profit. |
• | The real estate owned business represents real estate acquired by the Company through foreclosure, deed in lieu of foreclosure, or purchase. |
63
Net Interest Income
Net interest income is generated on our interest-earning assets less related interest-bearing liabilities and is recorded as part of our real estate debt, real estate securities and TRS segments.
The following table presents the average balance of interest-earning assets less related interest-bearing liabilities, associated interest income and expense and corresponding yield earned and incurred for the three months ended September 30, 2020 and September 30, 2019 (dollars in thousands):
________________________
Three Months Ended September 30, | ||||||||||||||||||||||
2020 | 2019 | |||||||||||||||||||||
Average Carrying Value (1) | Interest Income/Expense (2) | WA Yield/Financing Cost (3)(4) | Average Carrying Value (1) | Interest Income/Expense (2) | WA Yield/Financing Cost (3)(4) | |||||||||||||||||
Interest-earning assets: | ||||||||||||||||||||||
Real estate debt | $ | 2,500,671 | $ | 39,944 | 6.4 | % | $ | 2,546,713 | $ | 47,068 | 7.4 | % | ||||||||||
Real estate conduit | 44,907 | 474 | 4.2 | % | 122,576 | 1,586 | 5.2 | % | ||||||||||||||
Real estate securities | 373,529 | 3,996 | 4.3 | % | 169,281 | 1,791 | 4.2 | % | ||||||||||||||
Total | $ | 2,919,107 | $ | 44,414 | 6.1 | % | $ | 2,838,570 | $ | 50,445 | 7.1 | % | ||||||||||
Interest-bearing liabilities: | ||||||||||||||||||||||
Repurchase Agreements - commercial mortgage loans | $ | 197,633 | $ | 2,537 | 5.1 | % | $ | 132,126 | $ | 2,726 | 8.3 | % | ||||||||||
Other financing and loan participation - commercial mortgage loans | 21,348 | 328 | 6.1 | % | — | — | — | % | ||||||||||||||
Repurchase Agreements - real estate securities | 316,230 | 4,913 | 6.2 | % | 181,198 | 1,467 | 3.2 | % | ||||||||||||||
Collateralized loan obligations | 1,683,626 | 7,335 | 1.7 | % | 1,861,036 | 17,967 | 3.9 | % | ||||||||||||||
Total | $ | 2,218,837 | $ | 15,113 | 2.7 | % | $ | 2,174,360 | $ | 22,160 | 4.1 | % | ||||||||||
Net interest income/spread | $ | 29,301 | 3.4 | % | $ | 28,285 | 3.0 | % | ||||||||||||||
Average leverage % (5) | 76.0 | % | 76.6 | % | ||||||||||||||||||
Weighted average levered yield (6) | 16.7 | % | 17.0 | % | ||||||||||||||||||
(1) Based on amortized cost for real estate debt and real estate securities and principal amount for repurchase agreements. Amounts are calculated based on daily averages for the three months ended September 30, 2020 and September 30, 2019, respectively.
(2) Includes the effect of amortization of premium or accretion of discount and deferred fees.
(3) Calculated as interest income or expense divided by average carrying value.
(4) Annualized.
(5) Calculated by dividing total average interest-bearing liabilities by total average interest-earning assets.
(6) Calculated by dividing net interest income/spread by the net average interest-earning assets and average interest-bearing liabilities.
Interest income
Interest income for the three months ended September 30, 2020 and September 30, 2019 totaled $44.4 million and $50.4 million, respectively. As of September 30, 2020, our portfolio consisted of 124 commercial mortgage loans, held for investment, 1 commercial mortgage loan, held-for-sale, measured at fair value, 9 investments in CMBS and one other real estate investment, measured at fair value. The decrease in interest income was primarily due to a decrease in the 1 Month LIBOR, the benchmark index for our loans.
Interest expense
Interest expense for the three months ended September 30, 2020 decreased to $15.1 million compared to interest expense for three months ended September 30, 2019 of $22.2 million. The decrease in interest expense was due to a decrease in the 1 Month LIBOR, the benchmark index for our financing lines.
64
Realized Gain/Loss on Commercial Mortgage Loans Held-for-Sale
Realized gain on commercial mortgage loans held-for-sale, measured at fair value at the TRS for the three months ended September 30, 2020 was $1.9 million compared to a realized gain of $14.2 million for the three months ended September 30, 2019. The $12.2 million decrease in realized gain was due to the fact that there had been one sale of fixed-rate commercial real estate loans into the CMBS securitization market during the three months ended September 30, 2020 compared to three CMBS securitizations during the three months ended September 30, 2019. Proceeds were $74.5 million for the three months ended September 30, 2020, compared to $360.8 million for the three months ended September 30, 2019.
Realized Gain/Loss on Real Estate Securities Available for Sale
For the three months ended September 30, 2020 our real estate securities, available for sale, measured at fair value had a realized loss of $4.4 million included within the consolidated statements of operations. The loss is attributable to 15 CMBS sales during the three months ended September 30, 2020. There had been no sales of CMBS securities during the three months ended September 30, 2019.
Unrealized Gain/Loss on Real Estate Securities Available for Sale
For the three months ended September 30, 2020 our real estate securities, available for sale, measured at fair value had an unrecognized unrealized gain of $18.7 million included within the consolidated statements of comprehensive income. The increase in fair value of real estate securities for the three months ended September 30, 2020 can be attributed mainly to the reversal of the unrealized losses on the 15 CMBS sales that occurred in the quarter in addition to recovery in CMBS markets following the significant market volatility and credit uncertainties related to the outbreak of COVID-19.
Expenses from operations
Expenses from operations for the three months ended September 30, 2020 and September 30, 2019 were made up of the following (dollars in thousands):
Three Months Ended September 30, | ||||||||
2020 | 2019 | |||||||
Asset management and subordinated performance fee | $ | 3,749 | $ | 4,468 | ||||
Administrative services expenses | 3,128 | 4,564 | ||||||
Acquisition expenses | 166 | 180 | ||||||
Professional fees | 2,470 | 3,427 | ||||||
Real estate owned operating expenses | 509 | 1,366 | ||||||
Depreciation and amortization | 591 | — | ||||||
Other expenses | 571 | 1,100 | ||||||
Total expenses from operations | $ | 11,184 | $ | 15,105 | ||||
The decrease in our expenses from operations was primarily related to asset management and subordinated performance fee and administrative service expenses during the three months ended September 30, 2020. This decrease in asset management and subordinated performance fee was attributable to the $0.8 million in incentive fees during the three months ended September 30, 2019, compared to no incentive fees paid during the three months ended September 30, 2020. The decrease in administrative services expenses, professional fees and other expenses are due to fewer conduit activities.
65
Comparison of the Nine Months Ended September 30, 2020 to the Nine Months Ended September 30, 2019
Net Interest Income
Net interest income is generated on our interest-earning assets less related interest-bearing liabilities and is recorded as part of our real estate debt, real estate securities and TRS segments.
The following table presents the average balance of interest-earning assets less related interest-bearing liabilities, associated interest income and expense and corresponding yield earned and incurred for the nine months ended September 30, 2020 and September 30, 2019 (dollars in thousands):
________________________
Nine Months Ended September 30, | ||||||||||||||||||||||
2020 | 2019 | |||||||||||||||||||||
Average Carrying Value (1) | Interest Income/Expense (2) | WA Yield/Financing Cost (3)(4) | Average Carrying Value (1) | Interest Income/Expense (2) | WA Yield/Financing Cost (3)(4) | |||||||||||||||||
Interest-earning assets: | ||||||||||||||||||||||
Real estate debt | $ | 2,604,209 | $ | 123,284 | 6.3 | % | $ | 2,444,681 | $ | 136,451 | 7.4 | % | ||||||||||
Real estate conduit | 63,769 | 2,355 | 4.9 | % | 117,427 | 5,398 | 6.1 | % | ||||||||||||||
Real estate securities | 409,765 | 9,870 | 3.2 | % | 100,048 | 3,332 | 4.4 | % | ||||||||||||||
Total | $ | 3,077,743 | $ | 135,509 | 5.9 | % | $ | 2,662,156 | $ | 145,181 | 7.3 | % | ||||||||||
Interest-bearing liabilities: | ||||||||||||||||||||||
Repurchase Agreements - commercial mortgage loans | $ | 239,246 | $ | 8,538 | 4.8 | % | $ | 275,155 | $ | 13,238 | 6.4 | % | ||||||||||
Other financing and loan participation - commercial mortgage loans | 13,396 | 588 | 5.9 | % | 3,592 | 225 | 8.4 | % | ||||||||||||||
Repurchase Agreements - real estate securities | 356,740 | 11,647 | 4.4 | % | 106,500 | 2,714 | 3.4 | % | ||||||||||||||
Collateralized loan obligations | 1,726,726 | 33,967 | 2.6 | % | 1,581,313 | 52,218 | 4.4 | % | ||||||||||||||
Total | $ | 2,336,108 | $ | 54,740 | 3.1 | % | $ | 1,966,560 | $ | 68,395 | 4.6 | % | ||||||||||
Net interest income/spread | $ | 80,769 | 2.8 | % | $ | 76,786 | 2.6 | % | ||||||||||||||
Average leverage % (5) | 75.9 | % | 73.9 | % | ||||||||||||||||||
Weighted average levered yield (6) | 14.5 | % | 14.7 | % | ||||||||||||||||||
(1) Based on amortized cost for real estate debt and real estate securities and principal amount for repurchase agreements. Amounts are calculated based on daily averages for the nine months ended September 30, 2020 and September 30, 2019, respectively.
(2) Includes the effect of amortization of premium or accretion of discount and deferred fees.
(3) Calculated as interest income or expense divided by average carrying value.
(4) Annualized.
(5) Calculated by dividing total average interest-bearing liabilities by total average interest-earning assets.
(6) Calculated by dividing net interest income/spread by the net average interest-earning assets and average interest-bearing liabilities.
Interest income
Interest income for the nine months ended September 30, 2020 and September 30, 2019 totaled $135.5 million and $145.2 million, respectively. As of September 30, 2020, our portfolio consisted of 124 commercial mortgage loans, held for investment, 1 commercial mortgage loans, held-for-sale, measured at fair value, 9 investments in CMBS and one other real estate investment, measured at fair value. The decrease in interest income was primarily due to a decrease in the 1 Month LIBOR, the benchmark index for our loans.
Interest expense
Interest expense for the nine months ended September 30, 2020 decreased to $54.7 million compared to interest expense for nine months ended September 30, 2019 of $68.4 million. The decrease in interest expense was due to a decrease in the 1 Month LIBOR, the benchmark index for our financing lines slightly offset by an increase of $369.5 million in the average carrying value of our interest-bearing liabilities.
66
Realized Gain/Loss on Commercial Mortgage Loans Held-for-Sale
Realized gain on commercial mortgage loans, held-for-sale for the nine months ended September 30, 2020 was $0.3 million on the sale of three commercial mortgage loans, held-for-sale for proceeds of $55.8 million, compared to a loss of $25.0 thousand for the nine months ended September 30, 2019 on the sale of one commercial mortgage loan, held-for-sale.
Realized gain on commercial mortgage loans held-for-sale, measured at fair value at the TRS for the nine months ended September 30, 2020 was $11.1 million, compared to a realized gain of $32.6 million for the nine months ended September 30, 2019. The $21.5 million decrease in realized gain was due to fewer sales of fixed-rate commercial real estate loans into the CMBS securitization market during the nine months ended September 30, 2020, compared to the nine months ended September 30, 2019. Total proceeds were $147.6 million for the nine months ended September 30, 2020, compared to $671.6 million for the nine months ended September 30, 2019.
Realized Gain/Loss on Real Estate Securities Available for Sale
For the nine months ended September 30, 2020 our real estate securities, available for sale, measured at fair value had a realized loss of $10.1 million included within the consolidated statements of operations. The loss is attributable to 20 CMBS sales during the nine months ended September 30, 2020. There had been no sales of CMBS securities during the nine months ended September 30, 2019.
Unrealized Gain/Loss on Real Estate Securities Available for Sale
For the nine months ended September 30, 2020 our real estate securities, available for sale, measured at fair value had an unrecognized unrealized loss of $8.6 million included within the consolidated statements of comprehensive income. The deterioration in fair value of real estate securities for the nine months ended September 30, 2020 can be attributed to CMBS sales in addition to some recovery in CMBS markets following the significant market volatility and credit uncertainties related to the outbreak of COVID-19.
Expenses from operations
Expenses from operations for the nine months ended September 30, 2020 and September 30, 2019 were made up of the following (dollars in thousands):
Nine Months Ended September 30, | ||||||||
2020 | 2019 | |||||||
Asset management and subordinated performance fee | $ | 11,399 | $ | 11,917 | ||||
Administrative services expenses | 10,180 | 12,083 | ||||||
Acquisition expenses | 483 | 698 | ||||||
Professional fees | 8,476 | 8,090 | ||||||
Real estate owned operating expenses | 3,250 | 1,366 | ||||||
Depreciation and amortization | 1,765 | — | ||||||
Other expenses | 3,213 | 2,832 | ||||||
Total expenses from operations | $ | 38,766 | $ | 36,986 | ||||
The increase in our expenses from operations was primarily related to the 3 real estate owned assets during the nine months ended September 30, 2020, compared to one real estate owned asset during the nine months ended September 30, 2019. For the nine months ended September 30, 2020, we incurred approximately $3.3 million of real estate owned operating expenses, compared to $1.4 million for the nine months ended September 30, 2019. Additionally, during the nine months ended September 30, 2020, we incurred $1.8 million of depreciation and amortization expenses related to real estate owned assets, compared to no depreciation and amortization expenses incurred during the nine months ended September 30, 2019. The decrease in administrative services expenses are due to fewer conduit activities during the nine months ended September 30, 2020, compared to the nine months ended September 30, 2019.
Liquidity and Capital Resources
Our principal demands for cash will be funding our loan investments, continuing debt service obligations, distributions to our stockholders and the payment of our operating and administrative expenses.
We expect to use additional debt and equity financing as a source of capital. Our board of directors currently intends to operate at a leverage level of between one to three times book value of equity. However, our board of directors may change this target without shareholder approval. In addition, for the nine months ended September 30, 2020, we raised an additional $10.9 million through sales of common and preferred equity to institutional and individual investors. We anticipate that our debt and equity financing sources and our anticipated cash generated from operations will be adequate to fund our anticipated uses of capital.
67
In addition to our current mix of financing sources, we may also access additional forms of financings, including credit facilities, securitizations, public and private, secured and unsecured debt issuances by us or our subsidiaries, or through capital recycling initiatives whereby we sell certain assets in our portfolio and reinvest the proceeds in assets with more attractive risk-adjusted returns.
Refer to “COVID-19 Pandemic” above for information on the impact of the COVID-19 pandemic on our liquidity.
Collateralized Loan Obligations
On January 15, 2020, the Company called all of the outstanding notes issued by BSPRT 2017-FL2 Issuer, Ltd., a wholly owned indirect subsidiary of the Company. The outstanding principal of the notes on the date of the call was $21.0 million. The Company recognized all the remaining unamortized deferred financing costs of $4.5 million recorded within the Interest expense line of the consolidated statements of operations, which was a non-cash charge.
As of September 30, 2020 and December 31, 2019 the notes issued by BSPRT 2018-FL3 Issuer, Ltd. and BSPRT 2018-FL3 Co-Issuer, LLC, each wholly owned indirect subsidiaries of the Company, are collateralized by interests in a pool of 34 and 41 mortgage assets having a principal balance of $501.2 million and $523.2 million, respectively (the "2018-FL3 Mortgage Assets"). The sale of the 2018-FL3 Mortgage Assets to BSPRT 2018-FL3 Issuer is governed by a Mortgage Asset Purchase Agreement dated as of April 5, 2018, between the Company and BSPRT 2018-FL3 Issuer, Ltd.
As of September 30, 2020 and December 31, 2019 the notes issued by BSPRT 2018-FL4 Issuer, Ltd. and BSPRT 2018-FL4 Co-Issuer, LLC, each wholly owned indirect subsidiaries of the Company, collateralized by interests in a pool of 58 and 49 mortgage assets having a principal balance of $821.5 million and $867.9 million, respectively (the "2018-FL4 Mortgage Assets"). The sale of the 2018-FL4 Mortgage Assets to BSPRT 2018-FL4 Issuer is governed by a Mortgage Asset Purchase Agreement dated as of October12, 2018, between the Company and BSPRT 2018-FL4 Issuer, Ltd.
As of September 30, 2020 and December 31, 2019, the notes issued by BSPRT 2019-FL5 Issuer, Ltd. and BSPRT 2019-FL5 Co-Issuer, LLC, each wholly owned indirect subsidiaries of the Company, are collateralized by interests in a pool of 52 and 48 mortgage assets having a principal balance of $744.3 million and $809.4 million respectively (the "2019-FL5 Mortgage Assets"). The sale of the 2019-FL5 Mortgage Assets to BSPRT 2019-FL5 Issuer is governed by a Mortgage Asset Purchase Agreement dated as of May 30, 2019, between the Company and BSPRT 2019-FL5 Issuer.
Repurchase Agreements, Commercial Mortgage Loans
As of September 30, 2020, we have repurchase facilities with JPMorgan Chase Bank, National Association (the "JPM Repo Facility"), U.S Bank National Association (the "USB Repo Facility"), Barclays Bank PLC (the "Barclays Revolver Facility" and the "Barclays Repo Facility"), Wells Fargo Bank, National Association (the "WF Repo Facility"), and Credit Suisse AG (the "CS Repo Facility" and together with JPM Repo Facility, USB Repo Facility, WF Repo Facility, Barclays Revolver Facility and Barclays Repo Facility, the "Repo Facilities").
The Repo Facilities are financing sources through which the Company may pledge one or more mortgage loans to the financing entity in exchange for funds typically at an advance rate of between 65% to 80% of the principal amount of the mortgage loan being pledged.
We expect to use the advances from these Repo Facilities to finance the acquisition or origination of eligible loans, including first mortgage loans, subordinated mortgage loans, mezzanine loans and participation interests therein.
The Repo Facilities generally provide that in the event of a decrease in the value of our collateral, the lenders can demand additional collateral. Should the value of our collateral decrease as a result of deteriorating credit quality, resulting margin calls may cause an adverse change in our liquidity position.
68
The details of our Repo Facilities at September 30, 2020 and December 31, 2019 are as follows (dollars in thousands):
________________________
As of September 30, 2020 | |||||||||||||||||
Repurchase Facility | Committed Financing | Amount Outstanding | Interest Expense (1) | Ending Weighted Average Interest Rate | Maturity | ||||||||||||
JPM Repo Facility (2) | $ | 300,000 | $ | 129,697 | $ | 3,722 | 2.52 | % | 1/30/2021 | ||||||||
USB Repo Facility (3) | 100,000 | — | 374 | N/A | 6/15/2021 | ||||||||||||
CS Repo Facility (4) | 200,000 | 34,546 | 2,602 | 3.19 | % | 8/19/2021 | |||||||||||
WF Repo Facility (5) | 175,000 | — | 801 | N/A | 11/21/2020 | ||||||||||||
Barclays Revolver Facility (6) | 100,000 | 20,000 | 257 | 5.00 | % | 9/20/2021 | |||||||||||
Barclays Repo Facility (7) | 300,000 | — | 847 | N/A | 3/15/2022 | ||||||||||||
Total | $ | 1,175,000 | $ | 184,243 | $ | 8,603 | |||||||||||
(1) For the nine months ended September 30, 2020. Includes amortization of deferred financing costs.
(2) On September 3, 2019, the committed financing amount was downsized from $520.0 million to $300.0 million and on October 6, 2020 the Company amended the maturity to October 6, 2022.
(3) On June 9, 2020, the Company exercised the extension option upon the satisfaction of certain conditions, and extended the term maturity to June 15, 2021.
(4) On August 28, 2020, the Company exercised the extension option upon the satisfaction of certain conditions, and extended the term maturity to August 19, 2021.
(5) Includes three one-year extensions at the Company’s option, which may be exercised upon the satisfaction of certain conditions.
(6) On September 13, 2019, the Company exercised the extension option, and extended the term maturity to September 20, 2021. There is one more one-year extension option available at the Company's discretion.
(7) Includes two one-year extensions at the Company's option.
As of December 31, 2019 | |||||||||||||||||
Repurchase Facility | Committed Financing | Amount Outstanding | Interest Expense (1) | Ending Weighted Average Interest Rate | Maturity | ||||||||||||
JPM Repo Facility (2) | $ | 300,000 | $ | 107,526 | $ | 6,862 | 4.51 | % | 1/30/2021 | ||||||||
USB Repo Facility (3) | 100,000 | — | 622 | N/A | 6/15/2020 | ||||||||||||
CS Repo Facility (4) | 300,000 | 87,375 | 5,563 | 4.84 | % | 3/27/2020 | |||||||||||
WF Repo Facility (5) | 175,000 | 24,942 | 1,333 | 3.65 | % | 11/21/2020 | |||||||||||
Barclays Revolver Facility (6) | 100,000 | — | 976 | N/A | 9/20/2021 | ||||||||||||
Barclays Repo Facility (7) | 300,000 | 32,700 | 1,260 | 3.80 | % | 3/15/2022 | |||||||||||
Total | $ | 1,275,000 | $ | 252,543 | $ | 16,616 | |||||||||||
(1) For the twelve months ended December 31, 2019. Includes amortization of deferred financing costs.
(2) On September 3, 2019, the committed financing amount was downsized from $520.0 million to $300.0 million and the maturity date was amended to January 30, 2021.
(3) Includes two one-year extensions at the option of an indirect wholly-owned subsidiary of the Company, which may be exercised upon the satisfaction of certain conditions.
(4) On March 26, 2019, the Company exercised the extension option upon the satisfaction of certain conditions, and extended the term maturity to March 27, 2020.
(5) Includes three one-year extensions at the Company’s option, which may be exercised upon the satisfaction of certain conditions.
(6) On September 13, 2019, the Company exercised the extension option, and extended the term maturity to September 20, 2021. There is one more one-year extension option available at the Company's discretion.
(7) Includes two one-year extensions at the Company's option.
69
Other financing and loan participation - Commercial Mortgage Loans
On March 23, 2020, the Company transferred $15.2 million of its interest in a term loan to Sterling National Bank ("SNB") via a participation agreement. The Company incurred $0.14 million and $0.29 million of interest expense on SNB for the three and nine months ended September 30, 2020. As of September 30, 2020 there was an outstanding balance of $23.0 million.
Mortgage Note Payable
On October 15, 2019, the Company obtained a commercial mortgage loan for $29.2 million related to the real estate owned portfolio. As of September 30, 2020 the loan accrued interest at an annual rate of 3.85%. The Company incurred $0.3 million and $0.9 million of interest expense for this loan for the three and nine months ended September 30, 2020, respectively. Additionally, on January 6, 2020, the Company obtained a commercial mortgage loan for $11.0 million related to the real estate owned portfolio. As of September 30, 2020 the loan accrued interest at an annual rate of 9.00%. The Company incurred $0.3 million and $0.7 million of interest expense for this loan for the three and nine months ended September 30, 2020, respectively.
Unsecured Debt
On March 26, 2020, the Company and certain of its subsidiaries entered into a material amendment to an existing lending agreement with Security Benefit Life Insurance Company ("SBL"), secured by a pledge of equity interests in certain of the Company’s subsidiaries, for a total commitment of $100 million with a maturity of February 10, 2023 and a rate of one-month LIBOR + 4.5%. The amendment revised the terms of the existing SBL lending agreement, entered into in February 2020, to permit the Company to borrow under the agreement. The Company incurred $0.1 million and $0.2 million of interest expense on the lending agreement with SBL for the three and nine months ended September 30, 2020, respectively. As of September 30, 2020 there was no outstanding balance, under the lending agreement.
Repurchase Agreements - Real Estate Securities
The Company has entered into various Master Repurchase Agreements (the "MRAs") that allow the Company to sell real estate securities while providing a fixed repurchase price for the same real estate securities in the future. The repurchase contracts on each security under an MRA generally mature in 30-90 days and terms are adjusted for current market rates as necessary.
Below is a summary of the Company's MRAs as of September 30, 2020 and December 31, 2019 (dollars in thousands):
________________________
Weighted Average | ||||||||||||||||
Counterparty | Amount Outstanding | Accrued Interest | Collateral Pledged (1) | Interest Rate | Days to Maturity | |||||||||||
As of September 30, 2020 | ||||||||||||||||
JP Morgan Securities LLC | $ | 17,733 | $ | 1,511 | $ | 23,128 | 2.02 | % | 59 | |||||||
Wells Fargo Securities, LLC | — | 1,057 | — | N/A | N/A | |||||||||||
Goldman Sachs International | 35,275 | 278 | 50,359 | 2.66 | % | 15 | ||||||||||
Barclays Capital Inc. | 70,877 | 1,730 | 96,068 | 2.41 | % | 34 | ||||||||||
Credit Suisse AG | — | 905 | — | N/A | N/A | |||||||||||
Citigroup Global Markets, Inc. | 53,660 | 2,216 | 71,134 | 1.95 | % | 30 | ||||||||||
Total/Weighted Average | $ | 177,545 | $ | 7,697 | $ | 240,689 | 2.29 | % | 31 | |||||||
As of December 31, 2019 | ||||||||||||||||
JP Morgan Securities LLC | $ | 83,353 | $ | 124 | $ | 93,500 | 2.53 | % | 20 | |||||||
Wells Fargo Securities, LLC | 178,304 | 1,199 | 209,873 | 2.94 | % | 11 | ||||||||||
Barclays Capital Inc. | 40,720 | 221 | 47,475 | 2.81 | % | 23 | ||||||||||
Citigroup Global Markets, Inc. | 91,982 | 413 | 103,453 | 2.69 | % | 19 | ||||||||||
Total/Weighted Average | $ | 394,359 | $ | 1,957 | $ | 454,301 | 2.79 | % | 16 | |||||||
(1) Includes $70.9 million and $68.5 million of CLO notes, held by the Company, which are eliminated within the real estate securities, at fair value line in the consolidated balance sheets as of September 30, 2020 and December 31, 2019, respectively.
70
The following tables summarize our Repurchase Agreements, Commercial Mortgage Loans and our MRAs for the nine months ended September 30, 2020, 2019 and 2018, respectively:
As of September 30, 2020 | |||||||||||||||||||||
Amount Outstanding | Average Outstanding Balance | ||||||||||||||||||||
Q1 | Q2 | Q3 | Q1 | Q2 | Q3 | ||||||||||||||||
Repurchase Agreements, Commercial Mortgage Loans | $ | 234,524 | $ | 226,224 | $ | 183,033 | $ | 282,282 | $ | 238,280 | $ | 197.632 | |||||||||
Repurchase Agreements, Real Estate Securities | $ | 496,880 | $ | 335,256 | $ | 177,541 | $ | 412,809 | $ | 351,202 | $ | 316.229 | |||||||||
As of September 30, 2019 | |||||||||||||||||||||
Amount Outstanding | Average Outstanding Balance | ||||||||||||||||||||
Q1 | Q2 | Q3 | Q1 | Q2 | Q3 | ||||||||||||||||
Repurchase Agreements, Commercial Mortgage Loans | $ | 370,889 | $ | 132,870 | $ | 111,937 | $ | 357,850 | $ | 337,970 | $ | 132,126 | |||||||||
Repurchase Agreements, Real Estate Securities | $ | 22,078 | $ | 85,022 | $ | 244,308 | $ | 52,711 | $ | 84,179 | $ | 181,198 | |||||||||
As of September 30, 2018 | |||||||||||||||||||||
Amount Outstanding | Average Outstanding Balance | ||||||||||||||||||||
Q1 | Q2 | Q3 | Q1 | Q2 | Q3 | ||||||||||||||||
Repurchase Agreements, Commercial Mortgage Loans | $ | 501,310 | $ | 304,975 | $ | 565,329 | $ | 313,509 | $ | 222,339 | $ | 456,636 | |||||||||
Repurchase Agreements, Real Estate Securities | $ | — | $ | 10,600 | $ | 22,272 | $ | 19,542 | $ | 3,029 | $ | 23,056 | |||||||||
The use of our warehouse lines is dependent upon a number of factors including but not limited to: origination volume, loan repayments and prepayments, our use of other financing sources such as collateralized loan obligations, our liquidity needs and types of loan assets and underlying collateral that we hold.
During the nine months ended September 30, 2020, the maximum average outstanding balance was $721.0 million, of which $268.2 million was related to repurchase agreements on our commercial mortgage loans and $452.8 million for repurchase agreements on our real estate securities.
During the nine months ended September 30, 2019, the maximum average outstanding balance was $565.1 million, of which $483.2 million was related to repurchase agreements on our commercial mortgage loans and $81.9 million for repurchase agreements on our real estate securities.
During the nine months ended September 30, 2018, the maximum average outstanding balance was $560.6 million, of which $538.3 million was related to repurchase agreements on our commercial mortgage loans and $22.3 million for repurchase agreements on our real estate securities.
71
Private Placements
Since February 2018, we have been conducting offerings of our common stock, Series A Preferred Stock, and Series C Preferred Stock in offerings exempt from the registration requirements of the Securities Act. The following table summarizes the issuance of common stock in these offerings (dollars in thousands, except share amounts):
Total | ||||||
Shares Issued | Proceeds | |||||
Balance, December 31, 2019 | 12,136,262 | $ | 201,225 | |||
January 2020 | 284,983 | 4,762 | ||||
February 2020 | 365,051 | 6,100 | ||||
March 2020 | — | — | ||||
April 2020 | — | — | ||||
May 2020 | — | — | ||||
June 2020 | — | — | ||||
July 2020 | — | — | ||||
August 2020 | — | — | ||||
September 2020 | — | — | ||||
Balance, September 30, 2020 | 12,786,296 | $ | 212,087 | |||
As of September 30, 2020, we had no outstanding of binding purchase commitments for common stock.
The following table summarizes the sales of Series A Preferred Stock in these offerings (dollars in thousands, except share amounts):
Total | ||||||
Shares Issued | Proceeds | |||||
Balance, December 31, 2019 | 40,496 | $ | 202,549 | |||
January 2020 | — | — | ||||
February 2020 | 14 | 70 | ||||
March 2020 | — | — | ||||
April 2020 | — | — | ||||
May 2020 | — | — | ||||
June 2020 | — | — | ||||
July 2020 | — | — | ||||
August 2020 | — | — | ||||
September 2020 | — | — | ||||
Balance, September 30, 2020 | 40,510 | $ | 202,619 | |||
As of September 30, 2020, we had no outstanding of binding purchase commitments for Series A Preferred Stock.
72
The following table summarizes the sales of Series C Preferred Stock in these offerings (dollars in thousands, except share amounts):
Total | ||||||
Shares Issued | Proceeds | |||||
Balance, December 31, 2019 | 1,400 | $ | 7,000 | |||
January 2020 | — | — | ||||
February 2020 | — | — | ||||
March 2020 | — | — | ||||
April 2020 | — | — | ||||
May 2020 | — | — | ||||
June 2020 | — | — | ||||
July 2020 | — | — | ||||
August 2020 | — | — | ||||
September 2020 | — | — | ||||
Balance, September 31, 2020 | 1,400 | $ | 7,000 | |||
As of September 30, 2020, we had no outstanding of binding purchase commitments for Series C Preferred Stock.
The following tables present the activity in the Company's Series A Preferred Stock for the periods ended September 30, 2020 and September 30, 2019, respectively (dollars in thousands, except share amounts):
Shares | Amount | ||||||
Balance, December 31, 2019 | 40,500 | $ | 202,144 | ||||
Issuance of Preferred Stock | 14 | 70 | |||||
Dividends paid in Preferred Stock | 1 | 4 | |||||
Offering Costs | — | (9 | ) | ||||
Amortization of offering costs | — | 71 | |||||
Ending Balance, September 30, 2020 | 40,515 | $ | 202,280 | ||||
Shares | Amount | ||||||
Balance, December 31, 2018 | 29,249 | $ | 145,786 | ||||
Issuance of Preferred Stock | 9,249 | 46,245 | |||||
Dividends paid in Preferred Stock | 3 | 18 | |||||
Amortization of offering costs | — | 76 | |||||
Ending Balance, September 30, 2019 | 38,501 | $ | 192,125 | ||||
The following table presents the activity in the Company's Series C Preferred Stock for the period ended September 30, 2020. For the period ended September 30, 2019, the Company's Series C Preferred Stock did not have any activity (dollars in thousands, except share amounts):
Shares | Amount | ||||||
Balance, December 31, 2019 | 1,400 | $ | 6,966 | ||||
Issuance of Preferred Stock, net of offering cost | — | — | |||||
Dividends paid in Preferred Stock | — | — | |||||
Offering Costs | (11 | ) | |||||
Amortization of offering costs | — | 6 | |||||
Ending Balance, September 30, 2020 | 1,400 | $ | 6,961 | ||||
73
Distributions
In order to maintain its election to qualify as a REIT, the Company must currently distribute, at a minimum, an amount equal to 90% of its taxable income, without regard to the deduction for distributions paid and excluding net capital gains. The Company must distribute 100% of its taxable income (including net capital gains) to avoid paying corporate U.S. federal income taxes.
Distributions on our common stock are payable when authorized and declared by our Board of Directors. Distribution payments are dependent on the availability of funds. Our Board of Directors may reduce the amount of distributions paid or suspend distribution payments at any time, and therefore, distributions payments are not assured.
Dividends payable on each share of Series A and Series C Preferred Stock are generally equal to the monthly dividend that would have been paid had such share of Preferred Stock been converted to a share of common stock, except to the extent common stock dividends have been reduced below certain specified levels. To the extent dividends on Preferred Shares are not authorized and declared by our Board of Directors and paid by the Company monthly, the dividend amounts will accrue.
In April 2020, the Company’s Board of Directors unanimously approved a transition in the timing of its dividend payments, if any, to holders of the Company’s common stock from a monthly payment with daily accruals to a quarterly accrual and payment basis. Similarly, the Company began paying accrued and unpaid dividends on Preferred Stock on a quarterly basis.
In September 2020 the Company’s board of directors declared the following third quarter 2020 dividends: (i) a quarterly cash dividend of $0.275 per common share (equivalent to $1.10 per annum) which was paid in October 2020 to holders of record on September 30, 2020, and (ii) a quarterly cash dividend per share of Preferred Stock equivalent to the amount of distributions that would have been paid upon a conversion of such share of Preferred Stock into common stock, which was paid in October 2020 to holders of record on September 30, 2020.
The below table shows the distributions paid on shares outstanding of common stock during the nine months ended September 30, 2020 and September 30, 2019 (dollars in thousands):
Nine Months Ended September 30, 2020 | ||||||||
Payment Date | Amount Paid in Cash | Amount Issued under DRIP | ||||||
January 2, 2020 | $ | 4,154 | $ | 1,211 | ||||
February 5, 2020 | 4,177 | 1,210 | ||||||
March 2, 2020 | 3,919 | 1,130 | ||||||
April 1, 2020 | 5,413 | — | ||||||
May 1, 2020 | — | — | ||||||
June 1, 2020 | — | — | ||||||
July 1, 2020 | 9,463 | 2,679 | ||||||
August 1, 2020 | — | — | ||||||
September 1, 2020 | — | — | ||||||
Total | $ | 27,126 | $ | 6,230 | ||||
Nine Months Ended September 30, 2019 | ||||||||
Payment Date | Amount Paid in Cash | Amount Issued under DRIP | ||||||
January 4, 2019 | $ | 3,576 | $ | 1,171 | ||||
February 1, 2019 | 3,657 | 1,168 | ||||||
March 1, 2019 | 3,333 | 1,053 | ||||||
April 1, 2019 | 3,749 | 1,167 | ||||||
May 1, 2019 | 3,678 | 1,143 | ||||||
June 3, 2019 | 3,870 | 1,182 | ||||||
July 2, 2019 | 3,796 | 1,141 | ||||||
August 1, 2019 | 4,033 | 1,181 | ||||||
September 2, 2019 | 4,051 | 1,181 | ||||||
Total | $ | 33,743 | $ | 10,387 | ||||
74
The following table shows the sources for the payment of distributions to common stockholders for the periods presented (dollars in thousands):
Three Months Ended September 30, | Nine Months Ended September 30, | ||||||||||||||||||||||||||
2020 | 2019 | 2020 | 2019 | ||||||||||||||||||||||||
Distributions: | |||||||||||||||||||||||||||
Distributions paid in Cash | $ | 9,463 | $ | 11,880 | $ | 27,126 | $ | 33,743 | |||||||||||||||||||
Distributions Reinvested | 2,679 | 3,503 | 6,230 | 10,387 | |||||||||||||||||||||||
Total Distributions | $ | 12,142 | $ | 15,383 | $ | 33,356 | $ | 44,130 | |||||||||||||||||||
Source of Distribution Coverage: | |||||||||||||||||||||||||||
Net Income | $ | 9,463 | 77.9 | % | $ | 11,880 | 77.2 | % | $ | 10,466 | 31.4 | % | $ | 33,743 | 76.5 | % | |||||||||||
Available Cash on hand | — | — | % | — | — | % | 16,660 | 49.9 | % | — | — | % | |||||||||||||||
Common Stock Issued Under DRIP | 2,679 | 22.1 | % | 3,503 | 22.8 | % | 6,230 | 18.7 | % | 10,387 | 23.5 | % | |||||||||||||||
Total Sources of Distributions | $ | 12,142 | 100.0 | % | $ | 15,383 | 100.0 | % | $ | 33,356 | 100.0 | % | $ | 44,130 | 100.0 | % | |||||||||||
Net Income applicable to common stock (GAAP) | $ | 16,739 | $ | 20,460 | $ | 10,466 | $ | 48,409 | |||||||||||||||||||
Cash Flows
Cash Flows for the Nine Months Ended September 30, 2020
Net cash provided by operating activities for the nine months ended September 30, 2020 was $195.4 million. Cash inflows were primarily driven by net proceeds from originations of and proceeds from sales of commercial mortgage loans, measured at fair value for $148.4 million and net interest proceeds related to interest income and interest expense for $88.5 million. Inflows were partially offset by the payment of $37.0 million of operating expenses.
Net cash provided by investing activities for the nine months ended September 30, 2020 was $237.9 million. Cash inflows were primarily driven by proceeds from principal repayments of $880.1 million received on commercial mortgage loans and proceeds from the sale of real estate securities of $346.2 million. Inflows were partially offset by the origination and acquisition of $851.5 million of commercial mortgage loans and the purchase of real estate securities of $148.6 million.
Net cash used in financing activities for the nine months ended September 30, 2020 was $437.9 million. Cash outflows were primarily driven by net repayment on our Repo Facilities, CMBS MRAs, and CLOs of $68.3 million, $216.8 million and $150.8 million respectively. Additionally, $36.7 million was used in cash distributions to stockholders and $10.3 million was used for stock repurchases. Outflows were partially offset by proceeds from issuances of common stock for $10.9 million and borrowing on the other financing and loan participation and the mortgage note payable for $34.5 million.
Cash Flows for the Nine Months Ended September 30, 2019
Net cash used in operating activities for the nine months ended September 30, 2019 was $35.8 million. Cash inflows were primarily driven by an increase in net income to $60.3 million, offset by net cash outflows of $102.3 million related to originations of and proceeds from sales of commercial mortgage loans, measured at fair value.
Net cash used in investing activities for the nine months ended September 30, 2019 was $621.9 million. Cash outflows were primarily driven by the origination and acquisition of $892.4 million of commercial mortgage loans and purchase of real estate securities of $206.7 million. Outflows were offset by proceeds from principal repayments of $482.4 million received on commercial mortgage loans.
Net cash provided by financing activities for the nine months ended September 30, 2019 was $506.1 million. Cash inflows were primarily driven by proceeds from the borrowings under collateralized loan obligations of $639.9 million and proceeds from net borrowings on our CMBS MRAs of $199.8 million. Inflows were partially offset by the payment of $44.4 million in cash distributions to stockholders and $13.8 million of stock repurchases and repayments on CLOs of $333.7 million.
Election as a REIT
We elected to be taxed as a REIT under Sections 856 through 860 of the Internal Revenue Code commencing with the taxable year ended December 31, 2013. As a REIT, if we meet certain organizational and operational requirements and distribute at least 90% of our "REIT taxable income" (determined before the deduction of dividends paid and excluding net capital gains) to our stockholders in a year, we will not be subject to U.S. federal income tax to the extent of the income that we distribute. Even if we qualify for taxation as a REIT, we may be subject to certain state and local taxes on our income and property, and U.S. federal income and excise taxes on our undistributed income.
75
Contractual Obligations and Commitments
Our contractual obligations, excluding interest obligations (as amounts are not fixed or determinable), as of September 30, 2020 are summarized as follows (dollars in thousands):
________________________
Less than 1 year | 1 to 3 years | 3 to 5 years | More than 5 years | Total | |||||||||||||||
Unfunded loan commitments (1) | $ | 79,694 | $ | 173,422 | $ | 5,450 | $ | — | $ | 258,566 | |||||||||
Maturities of lease liabilities for operating lease | 511 | 857 | 448 | 39,438 | 41,254 | ||||||||||||||
Repurchase agreements - commercial mortgage loans | 184,243 | — | — | — | 184,243 | ||||||||||||||
Repurchase agreements - real estate securities | 177,545 | — | — | — | 177,545 | ||||||||||||||
CLOs (2) | — | — | — | 1,671,579 | 1,671,579 | ||||||||||||||
Mortgage Note Payable | — | 11,456 | — | 29,167 | 40,623 | ||||||||||||||
Total | 441,993 | 185,735 | 5,898 | 1,740,184 | 2,373,810 | ||||||||||||||
(1) The allocation of our unfunded loan commitments is based on the earlier of the commitment expiration date or the loan maturity date.
(2) Excludes $267.1 million and $261.4 million of CLO notes, held by the Company, which are eliminated within the collateralized loan obligation line of the consolidated balance sheets as of September 30, 2020 and December 31, 2019.
Related Party Arrangements
Benefit Street Partners L.L.C.
Amended Advisory Agreement
Refer to “Note 11 - Related Party Transactions and Arrangements” for a summary of the Company’s Advisory Agreement with the Advisor and amounts paid to the Advisor pursuant to the Advisory Agreement for the three and nine months ended September 30, 2020 and 2019.
Loan Acquisitions
On February 22, 2018, the Company purchased commercial mortgage loans from an entity that is an affiliate of our Advisor, for an aggregate purchase price of $27.8 million. The purchase of the commercial mortgage loans and the $27.8 million purchase price were approved by the Company’s board of directors. On April 18, 2018, the Company sold $23.3 million of these commercial mortgage loans into a CMBS securitization. The remaining $4.5 million of these commercial mortgage loans, recorded as held for investment, were fully paid down during the nine months ended September 30, 2020.
Lending Agreement with Stockholder
On March 26, 2020, the Company and certain of its subsidiaries entered into a material amendment to an existing lending agreement with SBL, an entity that also holds 14,950 of the Company’s outstanding shares of Series A Preferred Stock, secured by a pledge of equity interests in certain of the Company’s subsidiaries, for a total commitment of $100.0 million with a maturity of February 10, 2023 and a rate of one-month LIBOR + 4.5%. The amendment revised the terms of the existing SBL lending agreement, entered into in February 2020, to permit the Company to borrow under the agreement. The Company incurred $0.1 million and $0.2 million of interest expense on the lending agreement with SBL for the three and nine months ended September 30, 2020, respectively. As of September 30, 2020 there was an outstanding balance of $0.0 million, under the lending agreement.
Off Balance Sheet Arrangements
We currently have no off balance sheet arrangements as of September 30, 2020 and through the date of the filing of this Form 10-Q.
76
Non-GAAP Financial Measures
Funds from Operations and Modified Funds from Operations
Due to certain unique operating characteristics of real estate companies, as discussed below, the National Association of Real Estate Investment Trusts ("NAREIT") and the Investment Program Association ("IPA") industry trade groups, have each promulgated measures respectively known as funds from operations ("FFO") and modified funds from operations ("MFFO"), which we believe to be appropriate supplemental measures to reflect the operating performance of a REIT. The use of FFO and MFFO is recommended by the REIT industry as supplemental performance measures. However, FFO and MFFO are not substitutes to generally accepted accounting principles ("GAAP") net income or loss. We believe our presentations of FFO and MFFO assist investors in analyzing and comparing our operating and financial performance between reporting periods.
We define FFO, a non-GAAP measure, consistent with the standards established by NAREIT defines FFO as net income or loss computed in accordance with GAAP, excluding gains or losses from sales of depreciable property, property and asset impairment write-downs, real estate depreciation and amortization, and after adjustments for unconsolidated partnerships and joint ventures on the same basis. Our business plan is to operate as a mortgage REIT with our portfolio consisting of commercial mortgage loan investments and investments in real estate securities.
We define MFFO, a non-GAAP measure, consistent with the IPA's Guideline 2010 - 01, Supplemental Performance Measure for Publicly Registered, Non-Listed REITs: Modified Funds from Operations (the "Practice Guideline") issued by the IPA in November 2010. We define MFFO as FFO further adjusted for the following items, as applicable: acquisition fees; accretion of discounts and amortization of premiums and other loan expenses on debt investments; fair value adjustments on real estate related investments such as commercial real estate securities or derivative investments included in net income; impairments of real estate related investments, gains or losses included in net income from the extinguishment or sale of debt, hedges, foreign exchange, derivatives or securities holdings where trading of such holdings is not a fundamental attribute of the business plan, unrealized gains or losses from fair value adjustments on real estate securities, including commercial mortgage backed securities and other securities, interest rate swaps and other derivatives not deemed to be hedges and foreign exchanges holdings; unrealized gains or losses resulting from consolidation from, or deconsolidation to, equity accounting, and after adjustments for consolidated and unconsolidated partnerships and joint ventures, with such adjustments calculated to reflect MFFO on the same basis. The accretion of discounts and amortization of premiums and other loan expenses on debt investments, gains and losses on hedges, foreign exchange, derivatives or securities holdings, unrealized gains and losses resulting from consolidations, as well as other listed cash flow adjustments are adjustments made to net income in calculating the cash flows provided by operating activities and, in some cases, reflect gains or losses which are unrealized and may not ultimately be realized. Inasmuch as interest rate hedges are not a fundamental part of our operations, we believe it is appropriate to exclude such gains and losses in calculating MFFO, as such gains and losses are not reflective of our core operations.
Our MFFO calculation excludes impairments of real estate related investments, including loans. We assess the credit quality of our investments and adequacy of credit loss reserves on a quarterly basis, or more frequently as necessary. For loans classified as held-for-investment, we establish and maintain a general allowance for credit losses inherent in our portfolio at the reporting date and, where appropriate, a specific allowance for credit losses for loans we have determined to be impaired at the reporting date. An individual loan is considered impaired when it is deemed probable that we will not be able to collect all amounts due according to the contractual terms of the loan. Real estate securities which have experienced a decline in the fair value below their amortized cost basis (i.e., impairment) are evaluated each reporting period to determine whether the decline in fair value is due to credit-related factors. Credit-related impairment is recognized as an allowance on the consolidated balance sheets with a corresponding adjustment on the consolidated statements of operations. Significant judgment is required in this analysis. We consider the estimated net recoverable value of the loan or security as well as other factors, including but not limited to the fair value of any collateral, the amount and the status of any senior debt, the prospects for the borrower and the competitive situation of the region where the borrower does business. Fair value is typically estimated based upon discounting the expected future cash flows of the underlying collateral taking into consideration the discount rate, capitalization rate, occupancy, creditworthiness of major tenants and many other factors. This requires significant judgment and because it is based upon projections of future economic events, which are inherently subjective, the amounts ultimately realized may differ materially from the carrying value as of the balance sheet date. If upon completion of the assessment, the estimated fair value of the underlying collateral is less than the net carrying value of the loan, a specific allowance for credit losses is recorded. In the case of real estate securities, all or a portion of a deemed impairment may be recorded. Due to our limited life, any allowance for credit losses or impairment of real estate securities recorded may be difficult to recover.
77
The table below reflects the items deducted or added to net income or loss in our calculation of FFO and MFFO for the three and nine months ended September 30, 2020 and September 30, 2019 (dollars in thousands):
________________________
Three Months Ended September 30, | Nine Months Ended September 30, | ||||||||||||||
2020 | 2019 | 2020 | 2019 | ||||||||||||
Funds From Operations: | |||||||||||||||
Net income/(loss) | $ | 21,497 | $ | 25,913 | $ | 21,911 | $ | 60,329 | |||||||
Impairment losses on real estate owned assets | — | — | 398 | — | |||||||||||
Depreciation and amortization | 591 | — | 1,765 | — | |||||||||||
Funds from operations | $ | 22,088 | $ | 25,913 | $ | 24,074 | $ | 60,329 | |||||||
Modified Funds From Operations: | |||||||||||||||
Funds from operations | $ | 22,088 | $ | 25,913 | $ | 24,074 | $ | 60,329 | |||||||
Amortization of premiums, discounts and fees on investments, net | (2,825 | ) | (1,571 | ) | (4,535 | ) | (4,756 | ) | |||||||
Acquisition fees and acquisition expenses | 166 | 180 | 483 | 698 | |||||||||||
Unrealized (gain)/loss on financial instruments | (4,579 | ) | (4,549 | ) | 738 | (1,711 | ) | ||||||||
Increase/(decrease) in provision for credit losses | (3,710 | ) | (245 | ) | 14,929 | 2,823 | |||||||||
Modified funds from operations (1) | $ | 11,140 | $ | 19,728 | $ | 35,689 | $ | 57,383 | |||||||
(1) Modified funds from operations for the nine months ended September 30, 2020 includes a non-cash charge of $4.5 million related to the call of BSPRT 2017 - FL2 CLO on January 15, 2020. Excluding the non-cash charge modified funds from operations would be $40.1 million. For three months ended September 30, 2020 there was no such non-cash adjustment. Modified funds from operations for the nine months ended September 30, 2019 includes a non-cash charge of $4.5 million related to the call of BSPRT 2017 - FL1 CLO on April 15, 2019. Excluding the non-cash charge modified funds from operations would be $61.9 million for the nine months ended September 30, 2019. For three months ended September 30, 2019 there was no such non-cash adjustment.
Item 3. Quantitative and Qualitative Disclosures about Market Risk.
Credit Risk
Our investments are subject to a high degree of credit risk. Credit risk is the exposure to loss from loan defaults. Default rates are subject to a wide variety of factors, including, but not limited to, borrower financial condition, property performance, property management, supply/demand factors, construction trends, consumer behavior, regional economics, interest rates, the strength of the U.S. economy, and other factors beyond our control. All loans are subject to a certain probability of default. We manage credit risk through the underwriting process, acquiring our investments at the appropriate discount to face value, if any, and establishing loss assumptions. We also carefully monitor the performance of the loans, as well as external factors that may affect their value.
Capital Market Risk
We are exposed to risks related to the debt capital markets, and our related ability to finance our business through borrowings under repurchase obligations or other debt instruments. As a REIT, we are required to distribute a significant portion of our taxable income annually, which constrains our ability to accumulate operating cash flow and therefore requires us to utilize debt or equity capital to finance our business. We seek to mitigate these risks by monitoring the debt capital markets to inform our decisions on the amount, timing and terms of capital we raise.
The COVID-19 pandemic has resulted in extreme volatility in a variety of global markets, including the real estate-related debt markets. We have and may continue to receive margin calls from our lenders as a result of the decline in the market value of the assets pledged by us to our lenders under our repurchase agreements and warehouse credit facilities, and if we fail to resolve such margin calls when due by payment of cash or delivery of additional collateral, the lenders may exercise remedies including demanding payment by us of our aggregate outstanding financing obligations and/or taking ownership of the loans or other assets securing the applicable obligations and liquidating them at inopportune prices.
78
Interest Rate Risk
Our market risk arises primarily from interest rate risk relating to interest rate fluctuations. Many factors including governmental monetary and tax policies, domestic and international economic and political considerations and other factors that are beyond our control contribute to interest rate risk. To meet our short and long-term liquidity requirements, we may borrow funds at fixed and variable rates. Our interest rate risk management objectives are to limit the impact of interest rate changes in earnings and cash flows and to lower our overall borrowing costs. To achieve these objectives, from time to time, we may enter into interest rate hedge contracts such as swaps, collars and treasury lock agreements in order to mitigate our interest rate risk with respect to various debt instruments. While hedging activities may insulate us against adverse changes in interest rates, they may also limit our ability to participate in benefits of lower interest rates with respect to our portfolio of investments with fixed interest rates. We do not have any foreign denominated investments, and thus, we are not exposed to foreign currency fluctuations.
As of September 30, 2020 and December 31, 2019, our portfolio included 127 and 135 variable rate investments, respectively, based on LIBOR for various terms. Borrowings under our repurchase agreements are also based on LIBOR. The following table quantifies the potential changes in interest income net of interest expense should interest rates increase by 50 or 100 basis points or decrease by 25 basis points, assuming that our current balance sheet was to remain constant and no actions were taken to alter our existing interest rate sensitivity.
For the LIBOR sensitivity range, a reduction in LIBOR results in an increase in our portfolio return. This is driven by the LIBOR floor in place for majority of our commercial mortgage loans, held for investment. In contrast, the majority of our financing instruments do not have LIBOR floors. The present of a LIBOR floor on interest-bearing assets coupled with lack of LIBOR floor on interest bearing liabilities allows the portfolio to generate a higher return for a decrease in LIBOR rate compared to increase in LIBOR rate for the LIBOR range presented:
Estimated Percentage Change in Interest Income Net of Interest Expense | ||||||
Change in Interest Rates | September 30, 2020 | December 31, 2019 | ||||
(-) 25 Basis Points | 1.87 | % | 3.22 | % | ||
Base Interest Rate | — | % | — | % | ||
(+) 50 Basis Points | (6.17 | )% | (2.20 | )% | ||
(+) 100 Basis Points | (11.39 | )% | (0.26 | )% | ||
Real Estate Risk
The market values of commercial mortgage assets are subject to volatility and may be affected adversely by a number of factors, including, but not limited to, the impacts of the COVID-19 pandemic discussed above, national, regional and local economic conditions (which may be adversely affected by industry slowdowns and other factors); local real estate conditions; changes or continued weakness in specific industry segments; and demographic factors. In addition, decreases in property values reduce the value of the collateral and the potential proceeds available to a borrower to repay the underlying loans, which could also cause us to suffer losses.
Item 4. Controls and Procedures.
Disclosure Controls and Procedures
In accordance with Rules 13a-15(b) and 15d-15(b) of the Securities Exchange Act of 1934, as amended (the "Exchange Act"), management, with the participation of our Chief Executive Officer and Chief Financial Officer, has evaluated the effectiveness of our disclosure controls and procedures (as defined in Rules 13a-15(e) and 15d-15(e) of the Exchange Act) as of the end of the period covered by this Quarterly Report on Form 10-Q. Based on such evaluation, our Chief Executive Officer and Chief Financial Officer have concluded, as of the end of such period, that our disclosure controls and procedures are effective in recording, processing, summarizing and reporting, on a timely basis, information required to be disclosed by us in our reports that we file or submit under the Exchange Act.
Changes in Internal Control Over Financial Reporting
During the quarter ended September 30, 2020, there were no changes in our internal control over financial reporting that have materially affected, or are reasonably likely to materially affect, our internal control over financial reporting.
79
PART II
Item 1. Legal Proceedings.
The Company is not presently involved in any material litigation arising outside the ordinary course of business. However, the Company is involved in routine litigation arising in the ordinary course of business, none of which the Company believes, individually or in the aggregate, will have a material impact on the Company’s financial condition, operating results or cash flows.
Item 1A. Risk Factors.
Except as described below, there have been no material changes to the risk factors relating to the Company disclosed in our Form 10-K/A for the year ended December 31, 2019.
The COVID-19 pandemic is materially and adversely affecting our financial condition, operating results and cash flows and the operations and financial performance of many of the borrowers underlying our real estate-related assets, and we expect the adverse impacts will continue in the future.
Since December 2019, COVID-19 has spread globally, including to every state in the United States. In March 2020, the World Health Organization declared COVID-19 a pandemic, and subsequently, the United States declared a national emergency. The COVID-19 pandemic has had, and another pandemic or public health crisis in the future could have, repercussions across domestic and global economies and financial markets. The global impact of the COVID-19 outbreak evolved rapidly and many governmental authorities, including state and local governments in regions in which our borrowers own properties, have reacted by instituting government restrictions, border closings, quarantines, “shelter-in-place” orders and “social distancing” guidelines which have forced many of our borrowers to suspend or significantly restrict their business activities, and has resulted in a dramatic increase in national unemployment and corporate bankruptcies, with particularly adverse impacts on the retail, including restaurants, and hospitality sectors.
The COVID-19 pandemic is materially and adversely affecting our financial condition, operating results and cash flows and the operations and financial performance of many of the borrowers underlying our real estate-related assets, and we expect the adverse impacts will continue in the future. Specifically, the COVID-19 pandemic has:
• | significantly disrupted the financial markets for the assets in our real estate securities portfolio, resulting in significant decreases in market values for these assets and significant market volatility. This has resulted in margin calls from our lenders, which we have thus far satisfied, and could result in future margin calls which, if not satisfied, could result in the liquidation of some of our assets at significant losses. |
• | resulted in a decline in the value of commercial real estate generally, and significant declines in certain assets classes, including hospitality and retail, which has negatively impacted the value of our commercial mortgage loan portfolio, and could continue to negatively impact the value in the future, potentially materially. |
• | negatively impacted the financial stability of many of our borrowers, which has and is expected to continue to result in an increase in the number of our borrowers who become delinquent or default on their loans, or who seek to defer payment on or to amend the terms of their loans. Borrowers in the hospitality and retail sector have been particularly adversely impacted. |
• | increased the cost and decreased the availability of debt capital, including as a result of dislocations in the commercial mortgage-backed securities market, which has currently made raising capital through CDO or CLO securitizations impracticable, and as a result of lenders permitting significantly lower advance rates on our repurchase agreements. |
• | as a result of the decline in the market value of the loans in our CDOs and CLOs, we may not meet certain interest coverage tests, overcollateralization coverage tests or other tests that could result in a change in the priority of distributions, which could result in the reduction or elimination of distributions to the subordinate debt and equity tranches we own until the tests have been met or certain senior classes of securities have been paid in full. Accordingly, we may experience a reduction in our cash flow from those interests which may adversely affect our liquidity and therefore our ability to fund our operations or address maturing liabilities on a timely basis. |
• | resulted in a general decline in business activity which if continued will result in a decline in demand for mortgage financing, which could adversely affect our ability to make new investments or to redeploy the proceeds from repayments of our existing investments. |
• | created valuation uncertainties that make it difficult to estimate provisions for credit losses. |
• | resulted in an extended period of remote working by our Advisor’s employees which could strain technology resources and introduce operational risks, including heightened cybersecurity risk. |
80
The extent to which the COVID-19 pandemic impacts our or our borrowers’ operations will depend on future developments which are highly uncertain and cannot be predicted with confidence, including the scope, severity and duration of the pandemic, including any resurgences, the speed and effectiveness of vaccine and treatment developments and the direct and indirect economic effects of the pandemic and containment measures. The inability of our borrowers to meet their loan obligations and/or borrowers filing for bankruptcy protection would reduce our cash flows, which would impact our ability to pay dividends to our stockholders. The rapid development and fluidity of this situation precludes any prediction as to the full adverse impact of the COVID-19 pandemic. Moreover, many risk factors set forth in our Annual Report on Form 10-K/A for the year ended December 31, 2019 should be interpreted as heightened risks as a result of the impact of the COVID-19 pandemic.
Item 2. Unregistered Sales of Equity Securities and Use of Proceeds.
Issuer Purchases of Equity Securities
Share repurchase activity under the SRP during nine months ended September 30, 2020 was as follows:
________________________
Number of Requests | Number of Shares Repurchased | Average Price per Share | |||||||
Cumulative as of December 31, 2019 | 5,878 | 3,542,267 | $ | 20.23 | |||||
January 1 - January 31, 2020 (1) | 1,170 | 373,135 | 18.56 | ||||||
February 1 - February 28, 2020 | — | — | N/A | ||||||
March 1 - March 31, 2020 | — | — | N/A | ||||||
April 1 - April 30, 2020 (1) | — | — | N/A | ||||||
May 1 - May 31, 2020 | — | — | N/A | ||||||
June 1 - June 30, 2020 | — | — | N/A | ||||||
July 1 - July 31, 2020 (2) | 1,046 | 206,332 | 16.25 | ||||||
August 1 - August 31, 2020 | — | — | N/A | ||||||
September 1 - September 30, 2020 (2) | — | — | N/A | ||||||
Cumulative as of September 30, 2020 | 8,094 | 4,121,734 | $ | 19.88 | |||||
(1) Reflects shares repurchased pursuant to repurchase requests submitted for the second semester of 2019, including 11,306 shares which for administrative reasons were processed in April 2020. The number of requests for January is inclusive of shares processed in April. Pursuant to the terms of the SRP, the Company is only authorized to repurchase up to the amount of proceeds reinvested through our DRIP during the applicable semester. As a result, redemption requests in the amount of 1,986,803 shares were not fulfilled for the second semester of 2019. See "Note 9 - Stock Transactions" to our consolidated financial statements included in this Quarterly Report on Form 10-Q for further discussion of our SRP.
(2) Reflects shares repurchased pursuant to repurchase requests submitted for the first semester of 2020, including 771 shares which for administrative reasons were processed in September 2020. The number of requests for July is inclusive of shares processed in September. Pursuant to the terms of the SRP, the Company is only authorized to repurchase up to the amount of proceeds reinvested through our DRIP during the applicable semester. As a result, redemption requests in the amount of 1,677,268 shares were not fulfilled for the first semester of 2020. See "Note 9 - Stock Transactions" to our consolidated financial statements included in this Quarterly Report on Form 10-Q for further discussion of our SRP.
Item 3. Defaults upon Senior Securities.
Not applicable.
Item 4. Mine Safety Disclosures.
Not applicable.
Item 5. Other Information.
None.
81
Item 6. Exhibits.
EXHIBITS INDEX
The following exhibits are included in this Quarterly Report on Form 10-Q for the quarter ended September 30, 2020 (and are numbered in accordance with Item 601 of Regulation S-K).
Exhibit No. | Description | |
31.1* | ||
31.2* | ||
32* | ||
101* | ||
*Filed herewith.
82
SIGNATURES
Pursuant to the requirements of Section 13 or 15(d) of the Securities Exchange Act of 1934, as amended, the registrant has duly caused this report to be signed on its behalf by the undersigned, thereunto duly authorized.
Benefit Street Partners Realty Trust, Inc. | |||
Dated: | November 6, 2020 | By | /s/ Richard J. Byrne |
Name: Richard J. Byrne | |||
Title: Chief Executive Officer and President | |||
(Principal Executive Officer) | |||
Dated: | November 6, 2020 | By | /s/ Jerome S. Baglien |
Name: Jerome S. Baglien | |||
Title: Chief Financial Officer and Treasurer | |||
(Principal Financial and Accounting Officer) | |||
83