Attached files
| file | filename |
|---|---|
| EX-99.1 - EXHIBIT 99.1 - XO GROUP INC. | v466539_ex99-1.htm |
| 8-K - FORM 8-K - XO GROUP INC. | v466539_8-k.htm |
Exhibit 99.2

INVESTOR RELATIONS PRESENTATION MAY 9, 2017
This presentation may contain projections or other forward - looking statements regarding future events or our future financial performance or estimates regarding third parties. These statements are only estimates or predictions and reflect our current beliefs and expectations. Actual events or results may differ materially from those contained in the estimates, projections or forward - looking statements. It is routine for internal projections and expectations to change as the quarter progresses, and therefore it should be clearly understood that the internal projections and beliefs upon which we base our expectations may change prior to the end of the quarter. Although these expectations may change, we will not necessarily inform you if they do. Our policy is to provide expectations not more than once per quarter, and not to update that information until the next quarter. Some of the factors that could cause actual results to differ materially from the forward - looking statements contained herein include, without limitation, (i) our operating results may fluctuate, are difficult to predict and could fall below expectations, (ii) our transactions business is dependent on third party participants, whose lack of performance could adversely affect our results of operations, (iii) our ongoing investment in new businesses and new products, services, and technologies is inherently risky, and could disrupt our ongoing SAFE HARBOR © 2017 XO Group Inc. All Rights Reserved. 3 business and/or fail to generate the results we are expecting, (iv) we may be unable to develop solutions that generate revenue from advertising and other services delivered to mobile phones and wireless devices, (v) our businesses could be negatively affected by changes in Internet search engine algorithms, (vi) intense competition in our markets may adversely affect revenue and results of operations, (vii) we may be subject to legal liability associated with providing online services or content, (viii) fraudulent or unlawful activities on our marketplace could harm our business and consumer confidence in our marketplace, (ix) we are subject to payments - related risks, (x) we cannot assure you that our publications will be profitable, and (xi) other factors detailed in documents we file from time to time with the Securities and Exchange Commission. Forward - looking statements in this release are made pursuant to the safe harbor provisions contained in the Private Securities Litigation Reform Act of 1995. This presentation includes certain “Non - GAAP financial information”. A reconciliation of such information to the most directly comparable GAAP financial measure can be found at the end of this presentation.

© 2017 XO Group Inc. All Rights Reserved. 4 Our mission is to help people navigate and truly enjoy life’s biggest moments, together. Our family of multi - platform brands guide couples through transformative life stages, from getting married, to moving in together and having a baby.
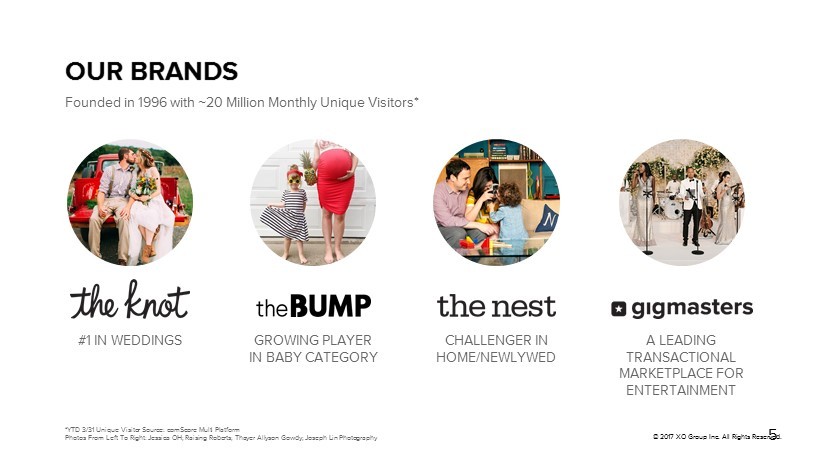
#1 IN WEDDINGS OUR BRANDS GROWING PLAYER IN BABY CATEGORY CHALLENGER IN HOME/NEWLYWED © 2017 XO Group Inc. All Rights Reserved. 5 Founded in 1996 with ~ 20 Million Monthly Unique Visitors* *YTD 3/31 Unique Visitor Source: comScore Multi Platform Photos From Left To Right: Jessica OH; Raising Roberts; Thayer Allyson Gowdy; Joseph Lin Photography A LEADING TRANSACTIONAL MARKETPLACE FOR ENTERTAINMENT
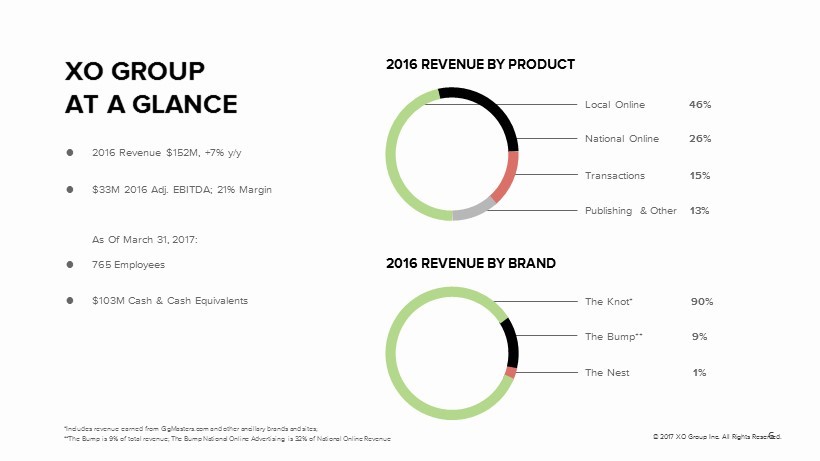
© 2017 XO Group Inc. All Rights Reserved. 6 XO GROUP AT A GLANCE ● 2016 Revenue $152M, +7% y/y ● $33M 2016 Adj. EBITDA; 21% Margin As Of March 31, 2017: ● 765 Employees ● $103M Cash & Cash Equivalents Local Online 46% National Online 26% Transactions 15% Publishing & Other 13% 2016 REVENUE BY PRODUCT The Knot* 90% The Bump** 9% The Nest 1% 2016 REVENUE BY BRAND *Includes revenue earned from GigMasters.com and other ancillary brands and sites; **The Bump is 9% of total revenue; The Bump National Online Advertising is 32% of National Online Revenue
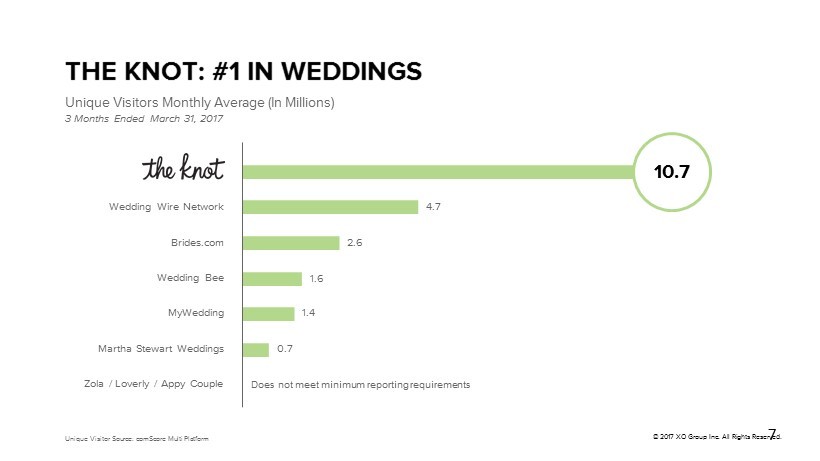
THE KNOT: #1 IN WEDDINGS © 2017 XO Group Inc. All Rights Reserved. 7 Unique Visitors Monthly Average (In Millions) 3 Months Ended March 31, 2017 Wedding Wire Network Brides.com Wedding Bee MyWedding Martha Stewart Weddings Zola / Loverly / Appy Couple Does not meet minimum reporting requirements 4.7 2.6 1.6 1.4 0.7 10.7 Unique Visitor Source: comScore Multi Platform
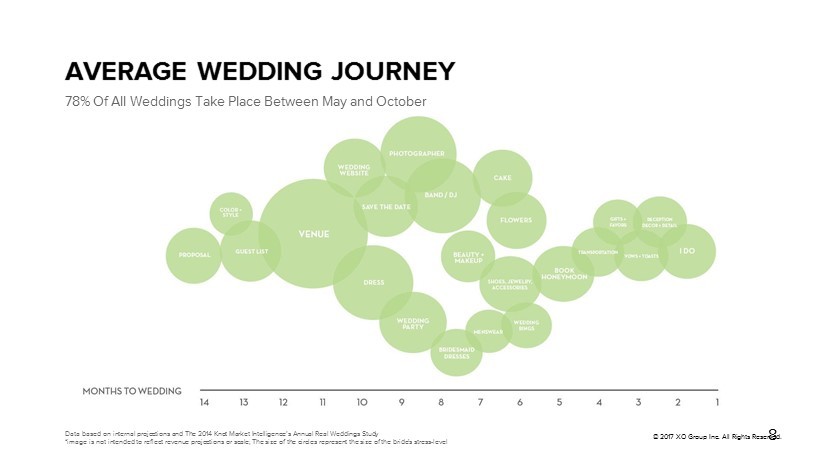
AVERAGE WEDDING JOURNEY © 2017 XO Group Inc. All Rights Reserved. 8 78% Of All Weddings Take Place Between May and October Data based on internal projections and The 2014 Knot Market Intelligence’s Annual Real Weddings Study *image is not intended to reflect revenue projections or scale; The size of the circles represent the size of the bride's str ess - level
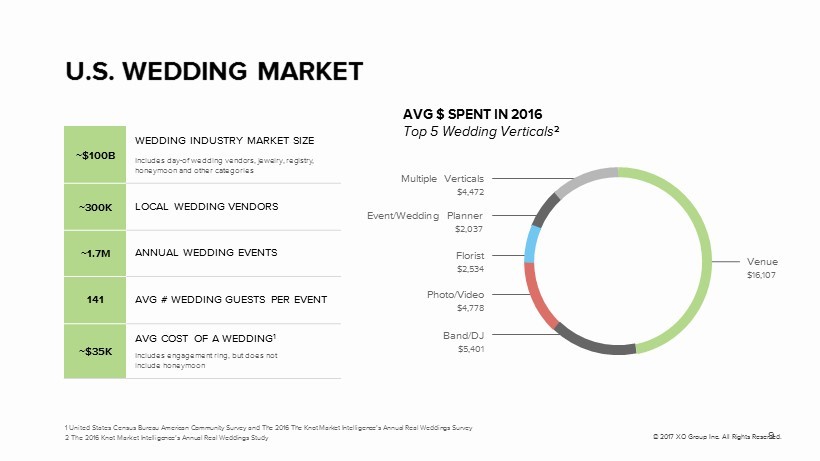
Multiple Verticals $4,472 Event/Wedding Planner $2,037 Florist $2,534 Photo/Video $4,778 Band/DJ $5,401 © 2017 XO Group Inc. All Rights Reserved. 9 U.S. WEDDING MARKET Venue $16,107 AVG $ SPENT IN 2016 Top 5 Wedding Verticals 2 1 United States Census Bureau American Community Survey and The 2016 The Knot Market Intelligence’s Annual Real Weddings Surv ey 2 The 2016 Knot Market Intelligence’s Annual Real Weddings Study ~ $100B WEDDING INDUSTRY MARKET SIZE Includes day - of wedding vendors, jewelry, registry, honeymoon and other categories ~ 300K LOCAL WEDDING VENDORS ~ 1.7M ANNUAL WEDDING EVENTS 141 AVG # WEDDING GUESTS PER EVENT ~ $35K AVG COST OF A WEDDING 1 Includes engagement ring, but does not include honeymoon
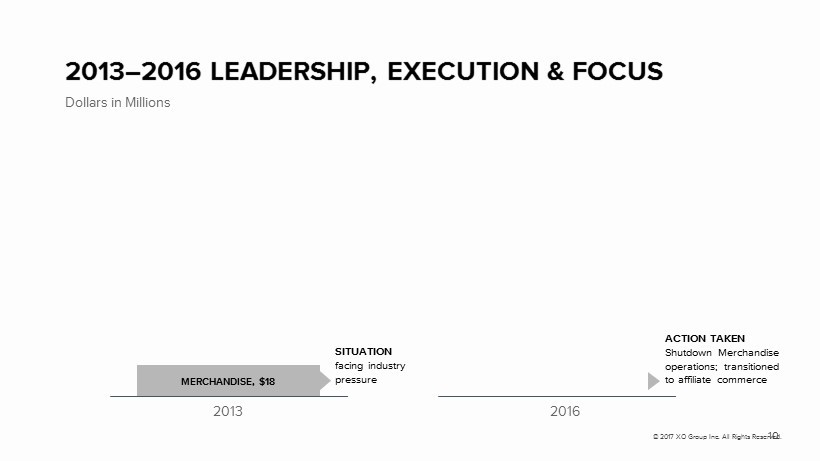
© 2017 XO Group Inc. All Rights Reserved. 10 2013 – 2016 LEADERSHIP, EXECUTION & FOCUS Dollars in Millions MERCHANDISE, $18 SITUATION facing industry pressure ACTION TAKEN Shutdown Merchandise operations; transitioned to affiliate commerce 2013 2016
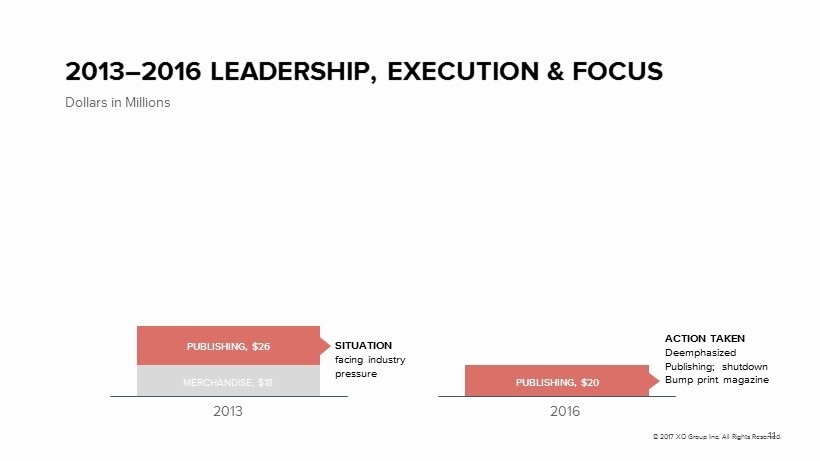
© 2017 XO Group Inc. All Rights Reserved. 11 2013 – 2016 LEADERSHIP, EXECUTION & FOCUS Dollars in Millions MERCHANDISE, $18 PUBLISHING, $26 PUBLISHING, $20 SITUATION facing industry pressure ACTION TAKEN Deemphasized Publishing; shutdown Bump print magazine 2013 2016
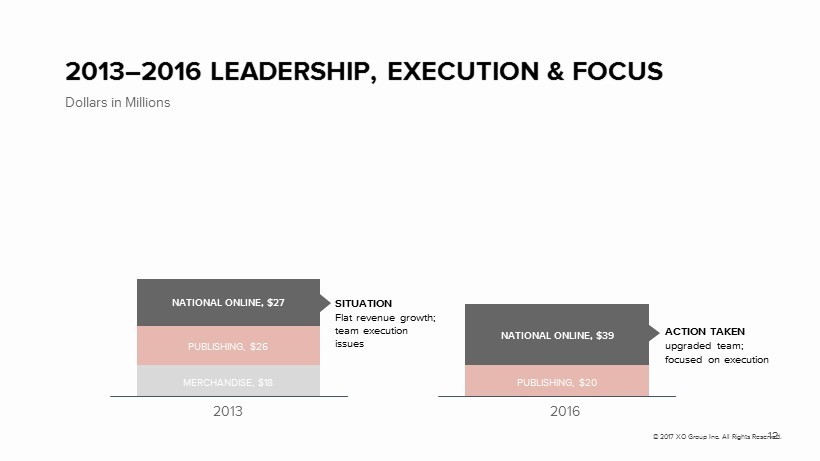
© 2017 XO Group Inc. All Rights Reserved. 12 2013 – 2016 LEADERSHIP, EXECUTION & FOCUS Dollars in Millions MERCHANDISE, $18 PUBLISHING, $26 NATIONAL ONLINE, $27 PUBLISHING, $20 NATIONAL ONLINE, $39 SITUATION Flat revenue growth; team execution issues ACTION TAKEN upgraded team; focused on execution 2013 2016
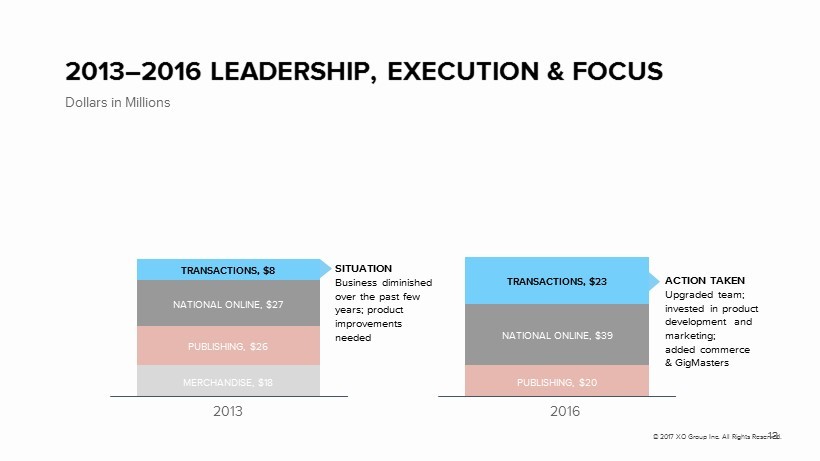
© 2017 XO Group Inc. All Rights Reserved. 13 2013 – 2016 LEADERSHIP, EXECUTION & FOCUS Dollars in Millions MERCHANDISE, $18 PUBLISHING, $26 NATIONAL ONLINE, $27 TRANSACTIONS, $8 PUBLISHING, $20 NATIONAL ONLINE, $39 TRANSACTIONS, $23 SITUATION Business diminished over the past few years; product improvements needed ACTION TAKEN Upgraded team; invested in product development and marketing; added commerce & GigMasters 2013 2016
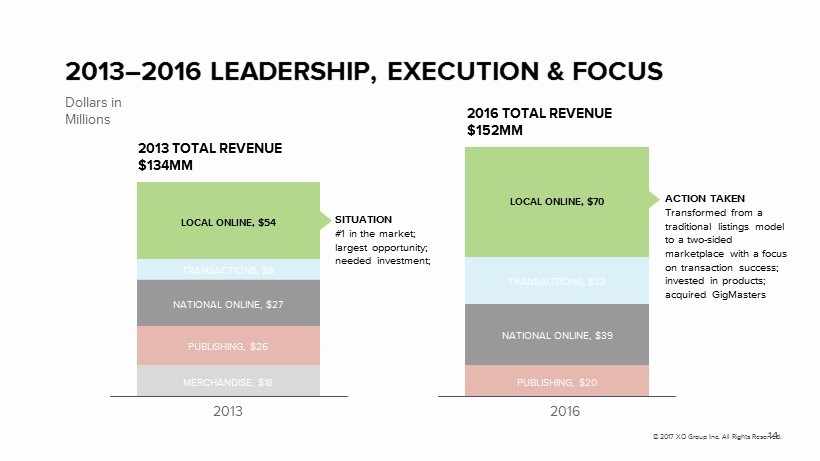
© 2017 XO Group Inc. All Rights Reserved. 14 2013 – 2016 LEADERSHIP, EXECUTION & FOCUS 2013 TOTAL REVENUE $134MM Dollars in Millions MERCHANDISE, $18 PUBLISHING, $26 NATIONAL ONLINE, $27 TRANSACTIONS, $8 LOCAL ONLINE, $54 2016 TOTAL REVENUE $152MM PUBLISHING, $20 NATIONAL ONLINE, $39 TRANSACTIONS, $23 LOCAL ONLINE, $70 SITUATION #1 in the market; largest opportunity; needed investment; ACTION TAKEN Transformed from a traditional listings model to a two - sided marketplace with a focus on transaction success; invested in products; acquired GigMasters 2013 2016

© 2017 XO Group Inc. All Rights Reserved. 15 2013 – 2016 LEADERSHIP, EXECUTION & FOCUS 2013 TOTAL REVENUE $134MM Dollars in Millions 2013 REVENUE 20% Adj. EBITDA Margin MERCHANDISE, $18 PUBLISHING, $26 NATIONAL ONLINE, $27 TRANSACTIONS, $8 LOCAL ONLINE, $54 2016 TOTAL REVENUE $152MM 2016 REVENUE 21% Adj. EBITDA Margin PUBLISHING, $20 NATIONAL ONLINE, $39 TRANSACTIONS, $23 LOCAL ONLINE, $70 13% 32% Reduction in % of business facing challenges:
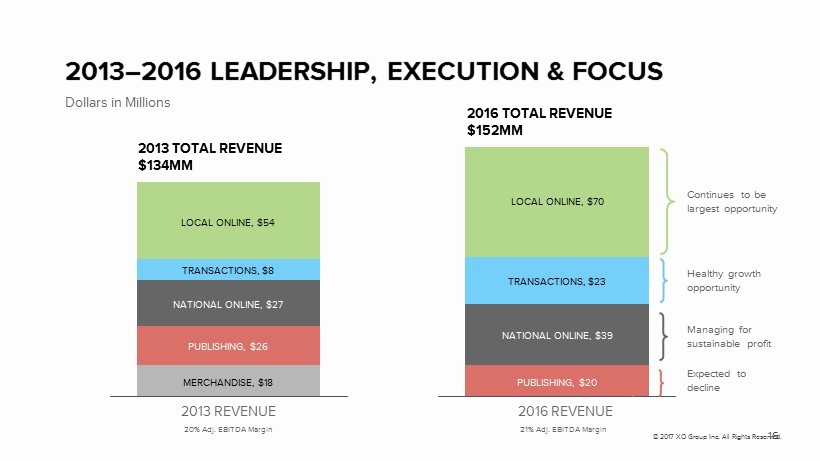
© 2017 XO Group Inc. All Rights Reserved. 16 2013 – 2016 LEADERSHIP, EXECUTION & FOCUS 2013 TOTAL REVENUE $134MM Dollars in Millions 2013 REVENUE 20% Adj. EBITDA Margin MERCHANDISE, $18 PUBLISHING, $26 NATIONAL ONLINE, $27 TRANSACTIONS, $8 LOCAL ONLINE, $54 2016 TOTAL REVENUE $152MM 2016 REVENUE 21% Adj. EBITDA Margin PUBLISHING, $20 NATIONAL ONLINE, $39 LOCAL ONLINE, $70 Continues to be largest opportunity Healthy growth opportunity Managing for sustainable profit Expected to decline TRANSACTIONS, $23
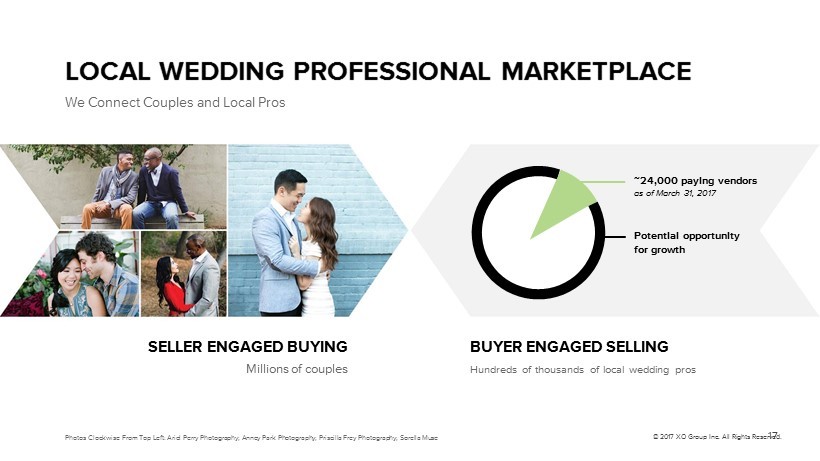
© 2017 XO Group Inc. All Rights Reserved. 17 LOCAL WEDDING PROFESSIONAL MARKETPLACE ~24,000 paying vendors as of March 31, 2017 SELLER ENGAGED BUYING Millions of couples BUYER ENGAGED SELLING Hundreds of thousands of local wedding pros Potential opportunity for growth © 2017 XO Group Inc. All Rights Reserved. 17 We Connect Couples and Local Pros Photos Clockwise From Top Left: Ariel Perry Photography; Anney Park Photography; Priscilla Frey Photography; Sorella Muse
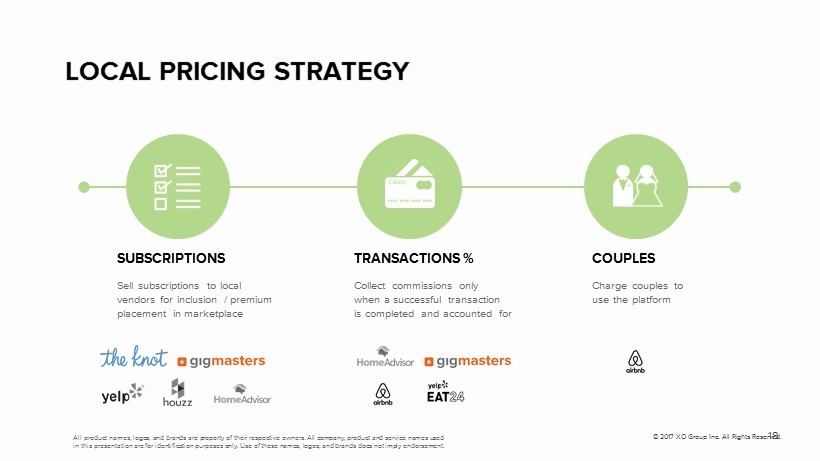
© 2017 XO Group Inc. All Rights Reserved. 18 LOCAL PRICING STRATEGY SUBSCRIPTIONS Sell subscriptions to local vendors for inclusion / premium placement in marketplace Collect commissions only when a successful transaction is completed and accounted for Charge couples to use the platform TRANSACTIONS % COUPLES All product names, logos, and brands are property of their respective owners. All company, product and service names used in this presentation are for identification purposes only. Use of these names, logos, and brands does not imply endorsement.
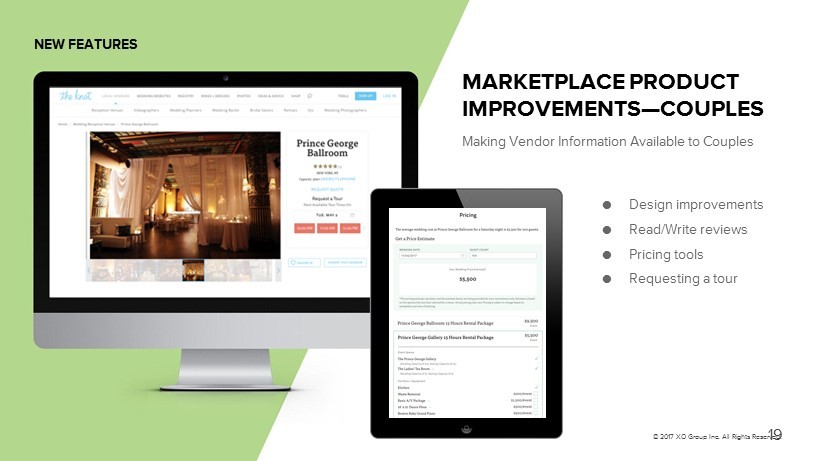
MARKETPLACE PRODUCT IMPROVEMENTS — COUPLES © 2017 XO Group Inc. All Rights Reserved. 19 NEW FEATURES Making Vendor Information Available to Couples ● Design improvements ● Read/Write reviews ● Pricing tools ● Requesting a tour
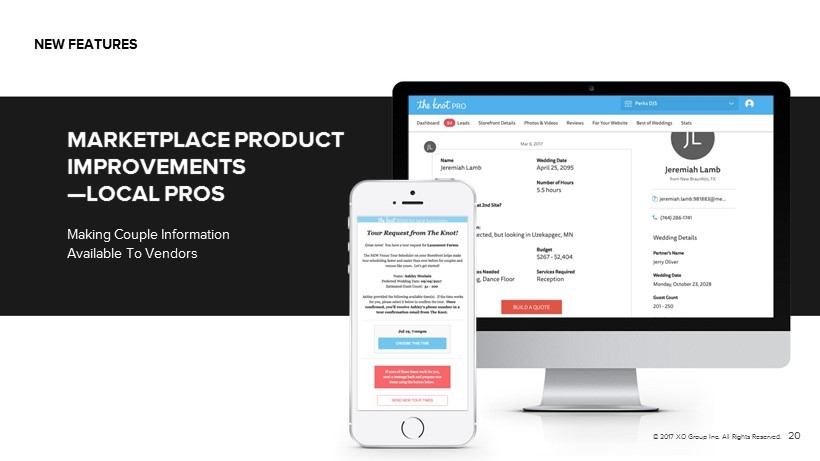
MARKETPLACE PRODUCT IMPROVEMENTS — LOCAL PROS Making Couple Information Available To Vendors © 2017 XO Group Inc. All Rights Reserved. 20 NEW FEATURES
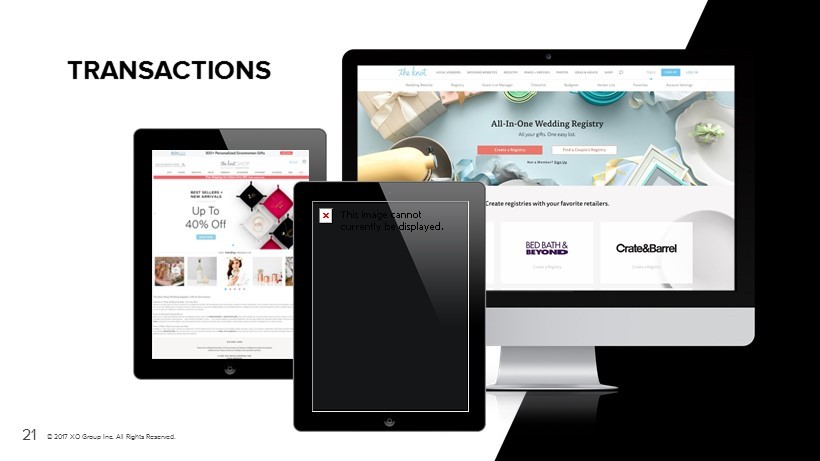
© 2017 XO Group Inc. All Rights Reserved. 21 TRANSACTIONS This image cannot currently be displayed.
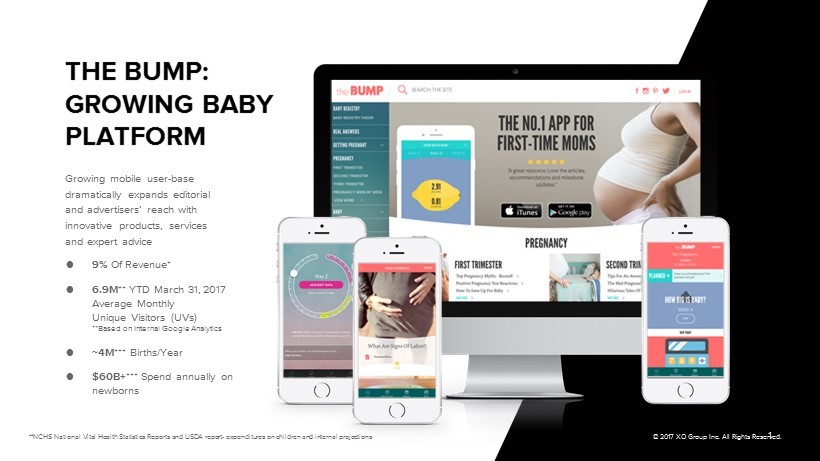
© 2017 XO Group Inc. All Rights Reserved. 22 THE BUMP: GROWING BABY PLATFORM Growing mobile user - base dramatically expands editorial and advertisers’ reach with innovative products, services and expert advice ● 9% Of Revenue* ● 6.9M ** YTD March 31, 2017 Average Monthly Unique Visitors (UVs) **Based on Internal Google Analytics ● ~ 4M *** Births/Year ● $60B+ *** Spend annually on newborns *For the full year of 2016 **NCHS National Vital Health Statistics Reports and USDA report- expenditures on children and internal projections
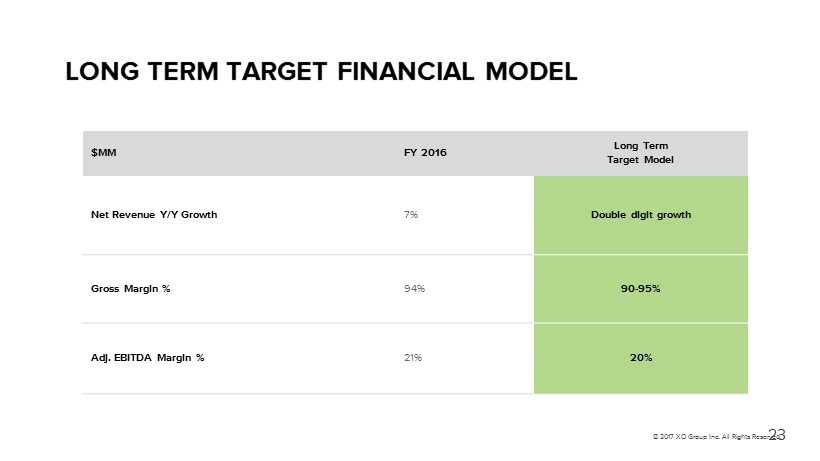
$MM FY 2016 Long Term Target Model Net Revenue Y/Y Growth 7% Double digit growth Gross Margin % 94% 90 - 95% Adj. EBITDA Margin % 21% 20% © 2017 XO Group Inc. All Rights Reserved. 23 LONG TERM TARGET FINANCIAL MODEL
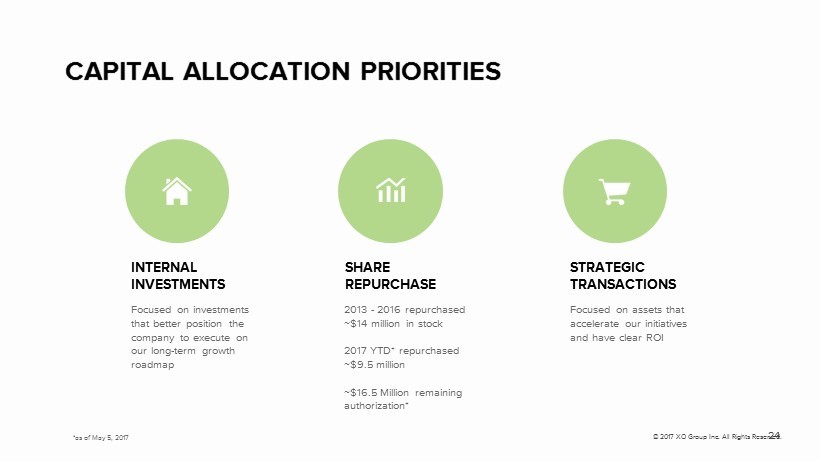
© 2017 XO Group Inc. All Rights Reserved. 24 CAPITAL ALLOCATION PRIORITIES INTERNAL INVESTMENTS Focused on investments that better position the company to execute on our long - term growth roadmap 2013 - 2016 repurchased ~ $14 million in stock 2017 YTD* repurchased ~ $9.5 million ~ $16.5 Million remaining authorization* Focused on assets that accelerate our initiatives and have clear ROI SHARE REPURCHASE STRATEGIC TRANSACTIONS *as of May 5, 2017
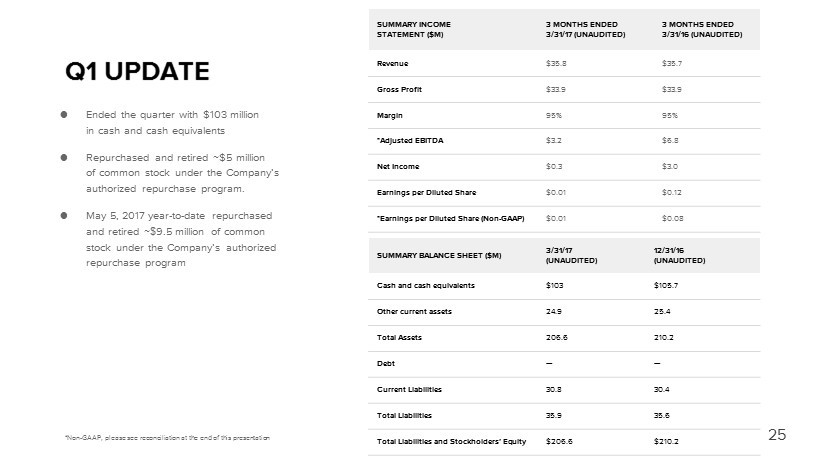
SUMMARY INCOME STATEMENT ($M) 3 MONTHS ENDED 3/31/17 (UNAUDITED) 3 MONTHS ENDED 3/31/16 (UNAUDITED) Revenue $35.8 $35.7 Gross Profit $33.9 $33.9 Margin 95% 95% *Adjusted EBITDA $3.2 $6.8 Net Income $0.3 $3.0 Earnings per Diluted Share $0.01 $0.12 *Earnings per Diluted Share (Non - GAAP) $0.01 $0.08 25 Q1 UPDATE *Non - GAAP, please see reconciliation at the end of this presentation SUMMARY BALANCE SHEET ($M) 3/31/17 (UNAUDITED) 12/31/16 (UNAUDITED) Cash and cash equivalents $103 $105.7 Other current assets 24.9 25.4 Total Assets 206.6 210.2 Debt --- --- Current Liabilities 30.8 30.4 Total Liabilities 35.9 35.6 Total Liabilities and Stockholders’ Equity $206.6 $210.2 ● Ended the quarter with $103 million in cash and cash equivalents ● Repurchased and retired ~ $5 million of common stock under the Company’s authorized repurchase program. ● May 5, 2017 year - to - date repurchased and retired ~$ 9.5 million of common stock under the Company’s authorized repurchase program

© 2017 XO Group Inc. All Rights Reserved. 26 QUESTIONS? Contact ir@xogrp.com
© 2017 XO Group Inc. All Rights Reserved. 27 RECONCILIATION OF GAAP TO NON - GAAP FINANCIAL MEASURES (UNAUDITED)
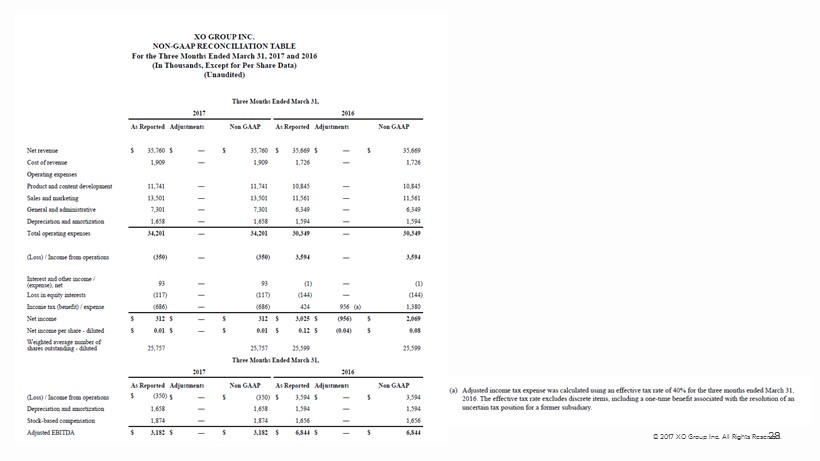
© 2017 XO Group Inc. All Rights Reserved. 28
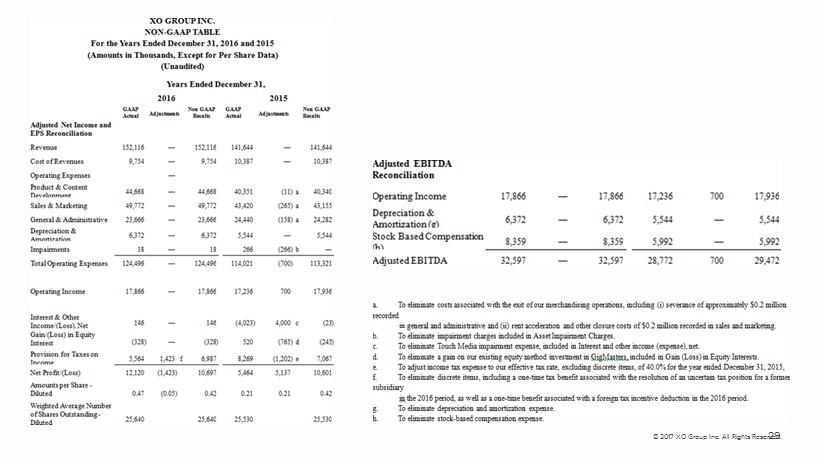
© 2017 XO Group Inc. All Rights Reserved. 29